UNITED STATES
SECURITIES AND EXCHANGE COMMISSION
Washington, D.C. 20549
FORM N-CSR
CERTIFIED SHAREHOLDER REPORT OF REGISTERED
MANAGEMENT INVESTMENT COMPANIES
Investment Company Act file number | 811-21852 |
|
Columbia Funds Series Trust II |
(Exact name of registrant as specified in charter) |
|
225 Franklin Street, Boston, Massachusetts | | 02110 |
(Address of principal executive offices) | | (Zip code) |
|
Ryan Larrenaga
c/o Columbia Management Investment Advisers, LLC
225 Franklin Street
Boston, MA 02110 |
(Name and address of agent for service) |
|
Registrant’s telephone number, including area code: | (800) 345-6611 | |
|
Date of fiscal year end: | May 31 | |
|
Date of reporting period: | November 30, 2016 | |
| | | | | | | | |
Form N-CSR is to be used by management investment companies to file reports with the Commission not later than 10 days after the transmission to stockholders of any report that is required to be transmitted to stockholders under Rule 30e-1 under the Investment Company Act of 1940 (17 CFR 270.30e-1). The Commission may use the information provided on Form N-CSR in its regulatory, disclosure review, inspection, and policymaking roles.
A registrant is required to disclose the information specified by Form N-CSR, and the Commission will make this information public. A registrant is not required to respond to the collection of information contained in Form N-CSR unless the Form displays a currently valid Office of Management and Budget (“OMB”) control number. Please direct comments concerning the accuracy of the information collection burden estimate and any suggestions for reducing the burden to Secretary, Securities and Exchange Commission, 450 Fifth Street, NW, Washington, DC 20549-0609. The OMB has reviewed this collection of information under the clearance requirements of 44 U.S.C. § 3507.
Item 1. Reports to Stockholders.

SEMIANNUAL REPORT
November 30, 2016

COLUMBIA DIVERSIFIED EQUITY INCOME FUND

 Dear Shareholders,
While emotions have run high following the outcome of the U.S. Presidential election, it remains unclear how the Trump presidency will unfold in terms of policy. We have a sense of the priorities espoused by the president-elect over the past eighteen months, but campaign priorities are not always realized and are often never pursued. What seems certain is that, while some investors have already priced expectations into the market, others have retreated, preferring instead a wait and see approach. The outcome of such behaviors appears to have created conditions ripe for ongoing market volatility.
While volatility in the financial markets can be stressful, volatility itself is not a new phenomenon. Other factors that have been at the root cause of recent volatility include uncertainty following the United Kingdom's vote to exit the European Union (Brexit), speculation around the Federal Reserve's decision to increase interest rates, divergent central bank policy and geopolitical unrest. The point is, financial markets have fluctuated for years and may be expected to continue to fluctuate — sometimes wildly. If anything, such volatility seems to be the new normal, perhaps exacerbated by access to information and development of technological tools which have enabled investors to react rapidly to real and perceived change. So what can you do?
Position your portfolio for the reality of market volatility
That there is a historical precedent for market volatility, or even an acceptance that it may persist, offers little comfort. A measured and strategic approach remains the best strategy for investors to stay on track in achieving their investment goals.
Step 1: Review your investment goals
Take this opportunity to review your investment goals and the strategies you are pursuing to achieve those goals in order to remain focused on what's important to you. It is entirely possible that your goals have changed in response either to your life situation or to changes in the market. Accept what you can't control — volatility, and focus on what you can — your investment goals and strategies.
Step 2: Reassess your risk tolerance
Sit down with your financial advisor to discuss your investment goals and strategies, as well as any changes to your tolerance for risk. Consider your investment horizon. Increased market volatility and a new investment horizon may impact the strategies that can best help you achieve your investment goals. Remember, achieving your investment goals may require a certain amount of risk. Ultimately, you must maintain vigilance in reassessing your risk tolerance and the strategies you have selected in pursuit of your investment goals, and awareness of how those strategies may react to market volatility.
Step 3: Remain calm and focus on your long-term plan
Remember, investing is about the long game. Short term events are not necessarily evidence of a longer term reality. Investors who attempt to time the market too often end up reacting to a down turn by selling low and then compounding the problem by waiting on the sidelines, ultimately missing the right opportunity to reinvest.
As long as there is a market, there will be volatility. How you respond to that volatility can make a big difference in the measure of your success as an investor. Talk to your financial advisor about how working with Columbia Threadneedle Investments may help you position your portfolio for the reality of ongoing volatility and, perhaps, even turn such volatility into investment opportunity.
Best regards,

Christopher O. Petersen
President, Columbia Funds
Investors should consider the investment objectives, risks, charges and expenses of a mutual fund carefully before investing. For a free prospectus and summary prospectus, which contains this and other important information about a fund, visit investor.columbiathreadneedleus.com. The prospectus should be read carefully before investing.
Columbia Funds are distributed by Columbia Management Investment Distributors, Inc., member FINRA, and managed by Columbia Management Investment Advisers, LLC.
© 2017 Columbia Management Investment Advisers, LLC. All rights reserved.
COLUMBIA DIVERSIFIED EQUITY INCOME FUND
Performance Overview | | | 2 | | |
Portfolio Overview | | | 3 | | |
Understanding Your Fund's Expenses | | | 4 | | |
Portfolio of Investments | | | 5 | | |
Statement of Assets and Liabilities | | | 10 | | |
Statement of Operations | | | 12 | | |
Statement of Changes in Net Assets | | | 13 | | |
Financial Highlights | | | 16 | | |
Notes to Financial Statements | | | 27 | | |
Approval of Management Agreement | | | 34 | | |
Important Information About This Report | | | 37 | | |
Fund Investment Manager
Columbia Management Investment
Advisers, LLC
225 Franklin Street
Boston, MA 02110
Fund Distributor
Columbia Management Investment
Distributors, Inc.
225 Franklin Street
Boston, MA 02110
Fund Transfer Agent
Columbia Management Investment
Services Corp.
P.O. Box 8081
Boston, MA 02266-8081
For more information about any of the funds, please visit investor.columbiathreadneedleus.com or call 800.345.6611. Customer Service Representatives are available to answer your questions Monday through Friday from 8 a.m. to 7 p.m. Eastern time.
The views expressed in this report reflect the current views of the respective parties. These views are not guarantees of future performance and involve certain risks, uncertainties and assumptions that are difficult to predict, so actual outcomes and results may differ significantly from the views expressed. These views are subject to change at any time based upon economic, market or other conditions and the respective parties disclaim any responsibility to update such views. These views may not be relied on as investment advice and, because investment decisions for a Columbia fund are based on numerous factors, may not be relied on as an indication of trading intent on behalf of any particular Columbia fund. References to specific securities should not be construed as a recommendation or investment advice.
COLUMBIA DIVERSIFIED EQUITY INCOME FUND
PERFORMANCE OVERVIEW
(Unaudited)
Performance Summary
n Columbia Diversified Equity Income Fund (the Fund) Class A shares returned 8.19% excluding sales charges for the six-month period that ended November 30, 2016.
n The Fund underperformed its benchmark, the Russell 1000 Value Index, which returned 8.63% during the same time period.
Average Annual Total Returns (%) (for period ended November 30, 2016)
| | | Inception | | 6 Months
Cumulative | | 1 Year | | 5 Years | | 10 Years | |
Class A | | 10/15/90 | | | | | | | | | | | | | | | | | |
Excluding sales charges | | | | | | | 8.19 | | | | 9.24 | | | | 12.95 | | | | 5.25 | | |
Including sales charges | | | | | | | 1.99 | | | | 2.97 | | | | 11.63 | | | | 4.63 | | |
Class B | | 03/20/95 | | | | | | | | | | | | | | | | | |
Excluding sales charges | | | | | | | 7.76 | | | | 8.40 | | | | 12.11 | | | | 4.45 | | |
Including sales charges | | | | | | | 2.76 | | | | 3.59 | | | | 11.85 | | | | 4.45 | | |
Class C | | 06/26/00 | | | | | | | | | | | | | | | | | |
Excluding sales charges | | | | | | | 7.72 | | | | 8.36 | | | | 12.11 | | | | 4.46 | | |
Including sales charges | | | | | | | 6.72 | | | | 7.40 | | | | 12.11 | | | | 4.46 | | |
Class I | | 03/04/04 | | | 8.34 | | | | 9.54 | | | | 13.41 | | | | 5.70 | | |
Class K | | 03/20/95 | | | 8.14 | | | | 9.25 | | | | 13.06 | | | | 5.39 | | |
Class R* | | 12/11/06 | | | 7.94 | | | | 8.86 | | | | 12.65 | | | | 4.94 | | |
Class R4* | | 12/11/06 | | | 8.24 | | | | 9.44 | | | | 13.15 | | | | 5.29 | | |
Class R5* | | 12/11/06 | | | 8.27 | | | | 9.53 | | | | 13.35 | | | | 5.64 | | |
Class W* | | 12/01/06 | | | 8.16 | | | | 9.12 | | | | 12.92 | | | | 5.25 | | |
Class Y* | | 11/08/12 | | | 8.39 | | | | 9.57 | | | | 13.34 | | | | 5.43 | | |
Class Z* | | 09/27/10 | | | 8.24 | | | | 9.45 | | | | 13.21 | | | | 5.42 | | |
Russell 1000 Value Index | | | | | | | 8.63 | | | | 12.02 | | | | 14.69 | | | | 5.70 | | |
Returns for Class A are shown with and without the maximum initial sales charge of 5.75%. Returns for Class B are shown with and without the applicable contingent deferred sales charge (CDSC) of 5.00% in the first year, declining to 1.00% in the sixth year and eliminated thereafter. Returns for Class C are shown with and without the 1.00% CDSC for the first year only. The Fund's other classes are not subject to sales charges and have limited eligibility. Please see the Fund's prospectus for details. Performance for different share classes will vary based on differences in sales charges and fees associated with each class. All results shown assume reinvestment of distributions during the period. Returns do not reflect the deduction of taxes that a shareholder may pay on Fund distributions or on the redemption of Fund shares. Performance results reflect the effect of any fee waivers or reimbursements of Fund expenses by Columbia Management Investment Advisers, LLC and/or any of its affiliates. Absent these fee waivers or expense reimbursement arrangements, performance results would have been lower.
The performance information shown represents past performance and is not a guarantee of future results. The investment return and principal value of your investment will fluctuate so that your shares, when redeemed, may be worth more or less than their original cost. Current performance may be lower or higher than the performance information shown. You may obtain performance information current to the most recent month-end by contacting your financial intermediary, visiting investor.columbiathreadneedleus.com or calling 800.345.6611.
*The returns shown for periods prior to the share class inception date (including returns for the Life of the Fund, if shown, which are since Fund inception) include the returns of the Fund's oldest share class. These returns are adjusted to reflect any higher class-related operating expenses of the newer share classes, as applicable. Please visit investor.columbiathreadneedleus.com/investment-products/mutual-funds/appended-performance for more information.
The Russell 1000 Value Index, an unmanaged index, measures the performance of those stocks in the Russell 1000 Index with lower price-to-book ratios and lower forecasted growth values.
Indices are not available for investment, are not professionally managed and do not reflect sales charges, fees, brokerage commissions, taxes or other expenses of investing. Securities in the Fund may not match those in an index.
Semiannual Report 2016
2
COLUMBIA DIVERSIFIED EQUITY INCOME FUND
PORTFOLIO OVERVIEW
(Unaudited)
Top Ten Holdings (%)
(at November 30, 2016) | |
Exxon Mobil Corp. | | | 4.4 | | |
JPMorgan Chase & Co. | | | 3.9 | | |
Berkshire Hathaway, Inc., Class B | | | 3.6 | | |
Wells Fargo & Co. | | | 3.5 | | |
Johnson & Johnson | | | 3.0 | | |
Citigroup, Inc. | | | 2.8 | | |
Cisco Systems, Inc. | | | 2.3 | | |
Merck & Co., Inc. | | | 2.2 | | |
Philip Morris International, Inc. | | | 2.2 | | |
Medtronic PLC | | | 1.9 | | |
Percentages indicated are based upon total investments (excluding Money Market Funds).
For further detail about these holdings, please refer to the section entitled "Portfolio of Investments."
Fund holdings are as of the date given, are subject to change at any time, and are not recommendations to buy or sell any security.
Portfolio Breakdown (%)
(at November 30, 2016) | |
Common Stocks | | | 97.9 | | |
Convertible Bonds | | | 0.5 | | |
Money Market Funds | | | 1.6 | | |
Total | | | 100.0 | | |
Percentages indicated are based upon total investments. The Fund's portfolio composition is subject to change.
Equity Sector Breakdown (%)
(at November 30, 2016) | |
Consumer Discretionary | | | 6.7 | | |
Consumer Staples | | | 8.0 | | |
Energy | | | 14.4 | | |
Financials | | | 27.8 | | |
Health Care | | | 10.6 | | |
Industrials | | | 8.8 | | |
Information Technology | | | 11.0 | | |
Materials | | | 2.0 | | |
Real Estate | | | 4.6 | | |
Telecommunication Services | | | 1.5 | | |
Utilities | | | 4.6 | | |
Total | | | 100.0 | | |
Percentages indicated are based upon total equity investments. The Fund's portfolio composition is subject to change.
Portfolio Management
Hugh Mullin, CFA
Russell Bloomfield, CFA, CAIA
Morningstar Style BoxTM

The Morningstar Style BoxTM is based on a fund's portfolio holdings. For equity funds, the vertical axis shows the market capitalization of the stocks owned, and the horizontal axis shows investment style (value, blend, or growth). Information shown is based on the most recent data provided by Morningstar.
©2017 Morningstar, Inc. All rights reserved. The Morningstar information contained herein: (1) is proprietary to Morningstar and/or its content providers; (2) may not be copied or distributed; and (3) is not warranted to be accurate, complete or timely. Neither Morningstar nor its content providers are responsible for any damages or losses arising from any use of this information.
Semiannual Report 2016
3
COLUMBIA DIVERSIFIED EQUITY INCOME FUND
UNDERSTANDING YOUR FUND'S EXPENSES
(Unaudited)
As an investor, you incur two types of costs. There are transaction costs, which generally include sales charges on purchases and may include redemption fees. There are also ongoing costs, which generally include management fees, distribution and/or service fees, and other fund expenses. The following information is intended to help you understand your ongoing costs (in dollars) of investing in the Fund and to help you compare these costs with the ongoing costs of investing in other mutual funds.
Analyzing Your Fund's Expenses
To illustrate these ongoing costs, we have provided examples and calculated the expenses paid by investors in each share class of the Fund during the period. The actual and hypothetical information in the table is based on an initial investment of $1,000 at the beginning of the period indicated and held for the entire period. Expense information is calculated two ways and each method provides you with different information. The amount listed in the "Actual" column is calculated using the Fund's actual operating expenses and total return for the period. You may use the Actual information, together with the amount invested, to estimate the expenses that you paid over the period. Simply divide your account value by $1,000 (for example, an $8,600 account value divided by $1,000 = 8.6), then multiply the results by the expenses paid during the period under the "Actual" column. The amount listed in the "Hypothetical" column assumes a 5% annual rate of return before expenses (which is not the Fund's actual return) and then applies the Fund's actual expense ratio for the period to the hypothetical return. You should not use the hypothetical account values and expenses to estimate either your actual account balance at the end of the period or the expenses you paid during the period. See "Compare With Other Funds" below for details on how to use the hypothetical data.
Compare With Other Funds
Since all mutual funds are required to include the same hypothetical calculations about expenses in shareholder reports, you can use this information to compare the ongoing cost of investing in the Fund with other funds. To do so, compare the hypothetical example with the 5% hypothetical examples that appear in the shareholder reports of other funds. As you compare hypothetical examples of other funds, it is important to note that hypothetical examples are meant to highlight the ongoing costs of investing in a fund only and do not reflect any transaction costs, such as sales charges, or redemption or exchange fees. Therefore, the hypothetical calculations are useful in comparing ongoing costs only, and will not help you determine the relative total costs of owning different funds. If transaction costs were included in these calculations, your costs would be higher.
June 1, 2016 – November 30, 2016
| | | Account Value at the Beginning
of the Period ($) | | Account Value at the End of the
Period ($) | | Expenses Paid During the
Period ($) | | Fund's Annualized
Expense Ratio (%) | |
| | | Actual | | Hypothetical | | Actual | | Hypothetical | | Actual | | Hypothetical | | Actual | |
Class A | | | 1,000.00 | | | | 1,000.00 | | | | 1,081.90 | | | | 1,019.90 | | | | 5.38 | | | | 5.22 | | | | 1.03 | | |
Class B | | | 1,000.00 | | | | 1,000.00 | | | | 1,077.60 | | | | 1,016.14 | | | | 9.27 | | | | 9.00 | | | | 1.78 | | |
Class C | | | 1,000.00 | | | | 1,000.00 | | | | 1,077.20 | | | | 1,016.14 | | | | 9.27 | | | | 9.00 | | | | 1.78 | | |
Class I | | | 1,000.00 | | | | 1,000.00 | | | | 1,083.40 | | | | 1,021.86 | | | | 3.34 | | | | 3.24 | | | | 0.64 | | |
Class K | | | 1,000.00 | | | | 1,000.00 | | | | 1,081.40 | | | | 1,020.26 | | | | 5.01 | | | | 4.86 | | | | 0.96 | | |
Class R | | | 1,000.00 | | | | 1,000.00 | | | | 1,079.40 | | | | 1,018.65 | | | | 6.67 | | | | 6.48 | | | | 1.28 | | |
Class R4 | | | 1,000.00 | | | | 1,000.00 | | | | 1,082.40 | | | | 1,021.11 | | | | 4.12 | | | | 4.00 | | | | 0.79 | | |
Class R5 | | | 1,000.00 | | | | 1,000.00 | | | | 1,082.70 | | | | 1,021.51 | | | | 3.71 | | | | 3.60 | | | | 0.71 | | |
Class W | | | 1,000.00 | | | | 1,000.00 | | | | 1,081.60 | | | | 1,019.85 | | | | 5.43 | | | | 5.27 | | | | 1.04 | | |
Class Y | | | 1,000.00 | | | | 1,000.00 | | | | 1,083.90 | | | | 1,021.76 | | | | 3.45 | | | | 3.35 | | | | 0.66 | | |
Class Z | | | 1,000.00 | | | | 1,000.00 | | | | 1,082.40 | | | | 1,021.11 | | | | 4.12 | | | | 4.00 | | | | 0.79 | | |
Expenses paid during the period are equal to the annualized expense ratio for each class as indicated above, multiplied by the average account value over the period and then multiplied by the number of days in the Fund's most recent fiscal half year and divided by 365.
Expenses do not include fees and expenses incurred indirectly by the Fund from its investment in underlying funds, including affiliated and non-affiliated pooled investment vehicles, such as mutual funds and exchange-traded funds.
Semiannual Report 2016
4
COLUMBIA DIVERSIFIED EQUITY INCOME FUND
PORTFOLIO OF INVESTMENTS
November 30, 2016 (Unaudited)
(Percentages represent value of investments compared to net assets)
Common Stocks 97.7%
Issuer | | Shares | | Value ($) | |
CONSUMER DISCRETIONARY 6.6% | |
Auto Components 1.0% | |
Magna International, Inc. | | | 570,448 | | | | 23,074,622 | | |
Household Durables 0.8% | |
Toll Brothers, Inc.(a) | | | 667,821 | | | | 19,807,571 | | |
Media 2.3% | |
Comcast Corp., Class A | | | 394,141 | | | | 27,396,741 | | |
DISH Network Corp., Class A(a) | | | 443,822 | | | | 25,497,574 | | |
Total | | | | | 52,894,315 | | |
Multiline Retail 0.8% | |
Macy's, Inc. | | | 459,100 | | | | 19,374,020 | | |
Specialty Retail 1.7% | |
Foot Locker, Inc. | | | 306,880 | | | | 21,994,089 | | |
Home Depot, Inc. (The) | | | 130,207 | | | | 16,848,786 | | |
Total | | | | | 38,842,875 | | |
Total Consumer Discretionary | | | | | 153,993,403 | | |
CONSUMER STAPLES 7.8% | |
Beverages 1.2% | |
PepsiCo, Inc. | | | 282,059 | | | | 28,234,106 | | |
Food & Staples Retailing 1.2% | |
SYSCO Corp. | | | 509,553 | | | | 27,133,697 | | |
Food Products 2.1% | |
Mondelez International, Inc., Class A | | | 651,074 | | | | 26,850,291 | | |
Tyson Foods, Inc., Class A | | | 396,506 | | | | 22,525,506 | | |
Total | | | | | 49,375,797 | | |
Tobacco 3.3% | |
Altria Group, Inc. | | | 419,384 | | | | 26,811,219 | | |
Philip Morris International, Inc. | | | 573,602 | | | | 50,637,585 | | |
Total | | | | | 77,448,804 | | |
Total Consumer Staples | | | | | 182,192,404 | | |
ENERGY 14.1% | |
Energy Equipment & Services 1.2% | |
Halliburton Co. | | | 538,411 | | | | 28,584,240 | | |
Oil, Gas & Consumable Fuels 12.9% | |
| BP PLC, ADR | | | 713,034 | | | | 24,963,320 | | |
Cimarex Energy Co. | | | 167,745 | | | | 23,128,681 | | |
ConocoPhillips | | | 597,415 | | | | 28,986,576 | | |
Devon Energy Corp. | | | 572,353 | | | | 27,661,821 | | |
Common Stocks (continued)
Issuer | | Shares | | Value ($) | |
EOG Resources, Inc. | | | 316,922 | | | | 32,490,843 | | |
Exxon Mobil Corp. | | | 1,147,143 | | | | 100,145,584 | | |
Hess Corp. | | | 550,521 | | | | 30,807,155 | | |
Valero Energy Corp. | | | 541,396 | | | | 33,328,338 | | |
Total | | | | | 301,512,318 | | |
Total Energy | | | | | 330,096,558 | | |
FINANCIALS 27.1% | |
Banks 14.3% | |
Citigroup, Inc. | | | 1,154,869 | | | | 65,123,063 | | |
Fifth Third Bancorp | | | 1,243,056 | | | | 32,344,317 | | |
JPMorgan Chase & Co. | | | 1,109,143 | | | | 88,919,994 | | |
PNC Financial Services Group, Inc. (The) | | | 360,281 | | | | 39,825,462 | | |
SunTrust Banks, Inc. | | | 537,710 | | | | 27,934,034 | | |
Wells Fargo & Co. | | | 1,533,092 | | | | 81,131,229 | | |
Total | | | | | 335,278,099 | | |
Capital Markets 5.5% | |
Charles Schwab Corp. (The) | | | 757,849 | | | | 29,298,442 | | |
Intercontinental Exchange, Inc. | | | 490,825 | | | | 27,191,705 | | |
Invesco Ltd. | | | 1,009,950 | | | | 31,621,535 | | |
Morgan Stanley | | | 968,981 | | | | 40,077,054 | | |
Total | | | | | 128,188,736 | | |
Diversified Financial Services 3.5% | |
Berkshire Hathaway, Inc., Class B(a) | | | 527,998 | | | | 83,128,005 | | |
Insurance 3.8% | |
Aon PLC | | | 202,180 | | | | 23,068,738 | | |
Chubb Ltd. | | | 294,858 | | | | 37,741,824 | | |
MetLife, Inc. | | | 511,454 | | | | 28,135,085 | | |
Total | | | | | 88,945,647 | | |
Total Financials | | | | | 635,540,487 | | |
HEALTH CARE 10.4% | |
Biotechnology 1.0% | |
AbbVie, Inc. | | | 381,323 | | | | 23,184,439 | | |
Health Care Equipment & Supplies 1.8% | |
Medtronic PLC | | | 584,239 | | | | 42,655,289 | | |
Health Care Providers & Services 1.9% | |
Aetna, Inc. | | | 227,358 | | | | 29,747,521 | | |
Cardinal Health, Inc. | | | 213,880 | | | | 15,187,619 | | |
Total | | | | | 44,935,140 | | |
The accompanying Notes to Financial Statements are an integral part of this statement.
Semiannual Report 2016
5
COLUMBIA DIVERSIFIED EQUITY INCOME FUND
PORTFOLIO OF INVESTMENTS (continued)
November 30, 2016 (Unaudited)
Common Stocks (continued)
Issuer | | Shares | | Value ($) | |
Pharmaceuticals 5.7% | |
Jazz Pharmaceuticals PLC(a) | | | 102,357 | | | | 10,607,256 | | |
Johnson & Johnson | | | 628,686 | | | | 69,972,752 | | |
Merck & Co., Inc. | | | 834,682 | | | | 51,074,191 | | |
Total | | | | | 131,654,199 | | |
Total Health Care | | | | | 242,429,067 | | |
INDUSTRIALS 8.6% | |
Aerospace & Defense 1.2% | |
Northrop Grumman Corp. | | | 106,366 | | | | 26,554,272 | | |
Air Freight & Logistics 1.0% | |
United Parcel Service, Inc., Class B | | | 207,027 | | | | 23,998,570 | | |
Airlines 1.5% | |
United Continental Holdings, Inc.(a) | | | 506,496 | | | | 34,922,899 | | |
Industrial Conglomerates 1.1% | |
Carlisle Companies, Inc. | | | 225,530 | | | | 25,297,700 | | |
Machinery 2.6% | |
Cummins, Inc. | | | 204,059 | | | | 28,931,485 | | |
Ingersoll-Rand PLC | | | 439,207 | | | | 32,738,490 | | |
Total | | | | | 61,669,975 | | |
Road & Rail 1.2% | |
Norfolk Southern Corp. | | | 265,616 | | | | 28,277,479 | | |
Total Industrials | | | | | 200,720,895 | | |
INFORMATION TECHNOLOGY 10.7% | |
Communications Equipment 2.2% | |
Cisco Systems, Inc. | | | 1,766,325 | | | | 52,671,811 | | |
IT Services 1.4% | |
Leidos Holdings, Inc. | | | 323,598 | | | | 16,568,218 | | |
MasterCard, Inc., Class A | | | 165,241 | | | | 16,887,630 | | |
Total | | | | | 33,455,848 | | |
Semiconductors & Semiconductor Equipment 3.6% | |
Intel Corp. | | | 931,165 | | | | 32,311,425 | | |
Lam Research Corp. | | | 183,783 | | | | 19,484,674 | | |
ON Semiconductor Corp.(a) | | | 1,500,729 | | | | 17,678,588 | | |
Skyworks Solutions, Inc. | | | 180,899 | | | | 13,902,088 | | |
Total | | | | | 83,376,775 | | |
Software 1.5% | |
Activision Blizzard, Inc. | | | 460,054 | | | | 16,842,577 | | |
Microsoft Corp. | | | 313,082 | | | | 18,866,321 | | |
Total | | | | | 35,708,898 | | |
Common Stocks (continued)
Issuer | | Shares | | Value ($) | |
Technology Hardware, Storage & Peripherals 2.0% | |
Apple, Inc. | | | 268,857 | | | | 29,714,076 | | |
Western Digital Corp. | | | 263,788 | | | | 16,792,744 | | |
Total | | | | | 46,506,820 | | |
Total Information Technology | | | | | 251,720,152 | | |
MATERIALS 2.0% | |
Chemicals 1.1% | |
Eastman Chemical Co. | | | 346,056 | | | | 25,995,727 | | |
Metals & Mining 0.9% | |
Freeport-McMoRan, Inc.(a) | | | 1,329,218 | | | | 20,403,496 | | |
Total Materials | | | | | 46,399,223 | | |
REAL ESTATE 4.5% | |
Equity Real Estate Investment Trusts (REITs) 4.5% | |
Alexandria Real Estate Equities, Inc. | | | 261,331 | | | | 28,639,264 | | |
American Tower Corp. | | | 242,101 | | | | 24,759,669 | | |
AvalonBay Communities, Inc. | | | 128,620 | | | | 21,156,704 | | |
Duke Realty Corp. | | | 1,178,249 | | | | 29,962,872 | | |
Total | | | | | 104,518,509 | | |
Total Real Estate | | | | | 104,518,509 | | |
TELECOMMUNICATION SERVICES 1.5% | |
Diversified Telecommunication Services 1.5% | |
Verizon Communications, Inc. | | | 697,296 | | | | 34,795,070 | | |
Total Telecommunication Services | | | | | 34,795,070 | | |
UTILITIES 4.4% | |
Electric Utilities 3.1% | |
Edison International | | | 414,429 | | | | 28,500,283 | | |
NextEra Energy, Inc. | | | 199,901 | | | | 22,834,691 | | |
Xcel Energy, Inc. | | | 576,618 | | | | 22,493,868 | | |
Total | | | | | 73,828,842 | | |
Multi-Utilities 1.3% | |
Ameren Corp. | | | 610,792 | | | | 30,002,103 | | |
Total Utilities | | | | | 103,830,945 | | |
Total Common Stocks
(Cost: $1,862,447,212) | | | | | 2,286,236,713 | | |
The accompanying Notes to Financial Statements are an integral part of this statement.
Semiannual Report 2016
6
COLUMBIA DIVERSIFIED EQUITY INCOME FUND
PORTFOLIO OF INVESTMENTS (continued)
November 30, 2016 (Unaudited)
Convertible Bonds 0.5%
Issuer | | Coupon
Rate | | Principal
Amount ($) | | Value ($) | |
Cable and Satellite 0.5% | |
DISH Network Corp.(b)
08/15/26 | | | 3.375 | % | | | | | | | 9,732,000 | | | | 10,893,125 | | |
Total Convertible Bonds
(Cost: $9,732,000) | | | | | | | | | 10,893,125 | | |
Money Market Funds 1.6%
| | | Shares | | Value ($) | |
Columbia Short-Term Cash Fund,
0.480%(c)(d) | | | 38,584,257 | | | | 38,587,861 | | |
Total Money Market Funds
(Cost: $38,584,257) | | | | | 38,587,861 | | |
Total Investments
(Cost: $1,910,763,469) | | | | | 2,335,717,699 | | |
Other Assets & Liabilities, Net | | | | | 5,681,549 | | |
Net Assets | | | | | 2,341,399,248 | | |
Notes to Portfolio of Investments
(a) Non-income producing investment.
(b) Represents privately placed and other securities and instruments exempt from SEC registration (collectively, private placements), such as Section 4(a)(2) and Rule 144A eligible securities, which are often sold only to qualified institutional buyers. The Fund may invest in private placements determined to be liquid as well as those determined to be illiquid. Private placements may be determined to be liquid under guidelines established by the Fund's Board of Trustees. At November 30, 2016, the value of these securities amounted to $10,893,125 or 0.47% of net assets.
(c) The rate shown is the seven-day current annualized yield at November 30, 2016.
(d) As defined in the Investment Company Act of 1940, an affiliated company is one in which the Fund owns 5% or more of the company's outstanding voting securities, or a company which is under common ownership or control with the Fund. Holdings and transactions in these affiliated companies during the period ended November 30, 2016 are as follows:
Issuer | | Beginning
Cost ($) | | Purchase
Cost ($) | | Proceeds
From Sales ($) | | Realized
Gain (Loss) ($) | | Ending
Cost ($) | | Dividends —
Affiliated
Issuers ($) | | Value ($) | |
Columbia Short-Term
Cash Fund | | | 34,470,263 | | | | 157,351,529 | | | | (153,236,263 | ) | | | (1,272 | ) | | | 38,584,257 | | | | 85,980 | | | | 38,587,861 | | |
Abbreviation Legend
ADR American Depositary Receipt
Fair Value Measurements
The Fund categorizes its fair value measurements according to a three-level hierarchy that maximizes the use of observable inputs and minimizes the use of unobservable inputs by prioritizing that the most observable input be used when available. Observable inputs are those that market participants would use in pricing an investment based on market data obtained from sources independent of the reporting entity. Unobservable inputs are those that reflect the Fund's assumptions about the information market participants would use in pricing an investment. An investment's level within the fair value hierarchy is based on the lowest level of any input that is deemed significant to the asset's or liability's fair value measurement. The input levels are not necessarily an indication of the risk or liquidity associated with investments at that level. For example, certain U.S. government securities are generally high quality and liquid, however, they are reflected as Level 2 because the inputs used to determine fair value may not always be quoted prices in an active market.
Fair value inputs are summarized in the three broad levels listed below:
> Level 1 — Valuations based on quoted prices for investments in active markets that the Fund has the ability to access at the measurement date (including NAV for open-end mutual funds). Valuation adjustments are not applied to Level 1 investments.
> Level 2 — Valuations based on other significant observable inputs (including quoted prices for similar securities, interest rates, prepayment speeds, credit risks, etc.).
> Level 3 — Valuations based on significant unobservable inputs (including the Fund's own assumptions and judgment in determining the fair value of investments).
The accompanying Notes to Financial Statements are an integral part of this statement.
Semiannual Report 2016
7
COLUMBIA DIVERSIFIED EQUITY INCOME FUND
PORTFOLIO OF INVESTMENTS (continued)
November 30, 2016 (Unaudited)
Fair Value Measurements (continued)
Inputs that are used in determining fair value of an investment may include price information, credit data, volatility statistics, and other factors. These inputs can be either observable or unobservable. The availability of observable inputs can vary between investments, and is affected by various factors such as the type of investment, and the volume and level of activity for that investment or similar investments in the marketplace. The inputs will be considered by the Investment Manager, along with any other relevant factors in the calculation of an investment's fair value. The Fund uses prices and inputs that are current as of the measurement date, which may include periods of market dislocations. During these periods, the availability of prices and inputs may be reduced for many investments. This condition could cause an investment to be reclassified between the various levels within the hierarchy.
Certain investments that have been measured at fair value using the net asset value (NAV) per share (or its equivalent) are not categorized in the fair value hierarchy. The fair value amounts presented in the table are intended to reconcile the fair value hierarchy to the amounts presented in the Portfolio of Investments. The Columbia Short-Term Cash Fund seeks to provide shareholders with maximum current income consistent with liquidity and stability of principal. Columbia Short-Term Cash Fund prices its shares with a floating NAV and no longer seeks to maintain a stable NAV.
Investments falling into the Level 3 category are primarily supported by quoted prices from brokers and dealers participating in the market for those investments. However, these may be classified as Level 3 investments due to lack of market transparency and corroboration to support these quoted prices. Additionally, valuation models may be used as the pricing source for any remaining investments classified as Level 3. These models may rely on one or more significant unobservable inputs and/or significant assumptions by the Investment Manager. Inputs used in valuations may include, but are not limited to, financial statement analysis, capital account balances, discount rates and estimated cash flows, and comparable company data.
Under the direction of the Fund's Board of Trustees (the Board), the Investment Manager's Valuation Committee (the Committee) is responsible for overseeing the valuation procedures approved by the Board. The Committee consists of voting and non-voting members from various groups within the Investment Manager's organization, including operations and accounting, trading and investments, compliance, risk management and legal.
The Committee meets at least monthly to review and approve valuation matters, which may include a description of specific valuation determinations, data regarding pricing information received from approved pricing vendors and brokers and the results of Board-approved valuation control policies and procedures (the Policies). The Policies address, among other things, instances when market quotations are or are not readily available, including recommendations of third party pricing vendors and a determination of appropriate pricing methodologies; events that require specific valuation determinations and assessment of fair value techniques; securities with a potential for stale pricing, including those that are illiquid, restricted, or in default; and the effectiveness of third party pricing vendors, including periodic reviews of vendors. The Committee meets more frequently, as needed, to discuss additional valuation matters, which may include the need to review back-testing results, review time-sensitive information or approve related valuation actions. The Committee reports to the Board, with members of the Committee meeting with the Board at each of its regularly scheduled meetings to discuss valuation matters and actions during the period, similar to those described earlier.
For investments categorized as Level 3, the Committee monitors information similar to that described above, which may include: (i) data specific to the issuer or comparable issuers, (ii) general market or specific sector news and (iii) quoted prices and specific or similar security transactions. The Committee considers this data and any changes from prior periods in order to assess the reasonableness of observable and unobservable inputs, any assumptions or internal models used to value those securities and changes in fair value. This data is also used to corroborate, when available, information received from approved pricing vendors and brokers. Various factors impact the frequency of monitoring this information (which may occur as often as daily). However, the Committee may determine that changes to inputs, assumptions and models are not required as a result of the monitoring procedures performed.
The accompanying Notes to Financial Statements are an integral part of this statement.
Semiannual Report 2016
8
COLUMBIA DIVERSIFIED EQUITY INCOME FUND
PORTFOLIO OF INVESTMENTS (continued)
November 30, 2016 (Unaudited)
Fair Value Measurements (continued)
The following table is a summary of the inputs used to value the Fund's investments at November 30, 2016:
| | | Level 1
Quoted Prices in Active
Markets for Identical
Assets ($) | | Level 2
Other Significant
Observable Inputs ($) | | Level 3
Significant
Unobservable Inputs ($) | | Total ($) | |
Investments | |
Common Stocks | |
Consumer Discretionary | | | 153,993,403 | | | | — | | | | — | | | | 153,993,403 | | |
Consumer Staples | | | 182,192,404 | | | | — | | | | — | | | | 182,192,404 | | |
Energy | | | 330,096,558 | | | | — | | | | — | | | | 330,096,558 | | |
Financials | | | 635,540,487 | | | | — | | | | — | | | | 635,540,487 | | |
Health Care | | | 242,429,067 | | | | — | | | | — | | | | 242,429,067 | | |
Industrials | | | 200,720,895 | | | | — | | | | — | | | | 200,720,895 | | |
Information Technology | | | 251,720,152 | | | | — | | | | — | | | | 251,720,152 | | |
Materials | | | 46,399,223 | | | | — | | | | — | | | | 46,399,223 | | |
Real Estate | | | 104,518,509 | | | | — | | | | — | | | | 104,518,509 | | |
Telecommunication Services | | | 34,795,070 | | | | — | | | | — | | | | 34,795,070 | | |
Utilities | | | 103,830,945 | | | | — | | | | — | | | | 103,830,945 | | |
Total Common Stocks | | | 2,286,236,713 | | | | — | | | | — | | | | 2,286,236,713 | | |
Convertible Bonds | | | — | | | | 10,893,125 | | | | — | | | | 10,893,125 | | |
Investments measured at net asset value | |
Money Market Funds | | | — | | | | — | | | | — | | | | 38,587,861 | | |
Total Investments | | | 2,286,236,713 | | | | 10,893,125 | | | | — | | | | 2,335,717,699 | | |
See the Portfolio of Investments for all investment classifications not indicated in the table.
The Fund's assets assigned to the Level 2 input category are generally valued using the market approach, in which a security's value is determined through reference to prices and information from market transactions for similar or identical assets.
There were no transfers of financial assets between levels during the period.
The accompanying Notes to Financial Statements are an integral part of this statement.
Semiannual Report 2016
9
COLUMBIA DIVERSIFIED EQUITY INCOME FUND
STATEMENT OF ASSETS AND LIABILITIES
November 30, 2016 (Unaudited)
Assets | |
Investments, at value | |
Unaffiliated issuers (identified cost $1,872,179,212) | | $ | 2,297,129,838 | | |
Affiliated issuers (identified cost $38,584,257) | | | 38,587,861 | | |
Total investments (identified cost $1,910,763,469) | | | 2,335,717,699 | | |
Receivable for: | |
Investments sold | | | 19,959,301 | | |
Capital shares sold | | | 493,200 | | |
Dividends | | | 5,107,349 | | |
Interest | | | 103,098 | | |
Foreign tax reclaims | | | 14,261 | | |
Prepaid expenses | | | 7,671 | | |
Other assets | | | 26,785 | | |
Total assets | | | 2,361,429,364 | | |
Liabilities | |
Payable for: | |
Investments purchased | | | 16,536,225 | | |
Capital shares purchased | | | 2,855,025 | | |
Management services fees | | | 40,446 | | |
Distribution and/or service fees | | | 16,949 | | |
Transfer agent fees | | | 215,086 | | |
Plan administration fees | | | 8,026 | | |
Compensation of board members | | | 219,212 | | |
Chief compliance officer expenses | | | 168 | | |
Other expenses | | | 138,979 | | |
Total liabilities | | | 20,030,116 | | |
Net assets applicable to outstanding capital stock | | $ | 2,341,399,248 | | |
Represented by | |
Paid-in capital | | $ | 1,865,962,011 | | |
Undistributed net investment income | | | 7,499,790 | | |
Accumulated net realized gain | | | 42,983,217 | | |
Unrealized appreciation (depreciation) on: | |
Investments — unaffiliated issuers | | | 424,950,626 | | |
Investments — affiliated issuers | | | 3,604 | | |
Total — representing net assets applicable to outstanding capital stock | | $ | 2,341,399,248 | | |
The accompanying Notes to Financial Statements are an integral part of this statement.
Semiannual Report 2016
10
COLUMBIA DIVERSIFIED EQUITY INCOME FUND
STATEMENT OF ASSETS AND LIABILITIES (continued)
November 30, 2016 (Unaudited)
Class A | |
Net assets | | $ | 2,151,834,889 | | |
Shares outstanding | | | 162,095,695 | | |
Net asset value per share | | $ | 13.28 | | |
Maximum offering price per share(a) | | $ | 14.09 | | |
Class B | |
Net assets | | $ | 15,716,322 | | |
Shares outstanding | | | 1,180,202 | | |
Net asset value per share | | $ | 13.32 | | |
Class C | |
Net assets | | $ | 65,879,905 | | |
Shares outstanding | | | 4,976,971 | | |
Net asset value per share | | $ | 13.24 | | |
Class I | |
Net assets | | $ | 2,722 | | |
Shares outstanding | | | 205 | | |
Net asset value per share(b) | | $ | 13.25 | | |
Class K | |
Net assets | | $ | 36,190,272 | | |
Shares outstanding | | | 2,724,648 | | |
Net asset value per share | | $ | 13.28 | | |
Class R | |
Net assets | | $ | 5,666,650 | | |
Shares outstanding | | | 429,456 | | |
Net asset value per share | | $ | 13.19 | | |
Class R4 | |
Net assets | | $ | 7,379,451 | | |
Shares outstanding | | | 555,992 | | |
Net asset value per share | | $ | 13.27 | | |
Class R5 | |
Net assets | | $ | 33,532,213 | | |
Shares outstanding | | | 2,524,739 | | |
Net asset value per share | | $ | 13.28 | | |
Class W | |
Net assets | | $ | 2,542 | | |
Shares outstanding | | | 191 | | |
Net asset value per share(b) | | $ | 13.30 | | |
Class Y | |
Net assets | | $ | 436,441 | | |
Shares outstanding | | | 32,550 | | |
Net asset value per share | | $ | 13.41 | | |
Class Z | |
Net assets | | $ | 24,757,841 | | |
Shares outstanding | | | 1,867,024 | | |
Net asset value per share | | $ | 13.26 | | |
(a) The maximum offering price per share is calculated by dividing the net asset value per share by 1.0 minus the maximum sales charge of 5.75%.
(b) Net asset value per share rounds to this amount due to fractional shares outstanding.
The accompanying Notes to Financial Statements are an integral part of this statement.
Semiannual Report 2016
11
COLUMBIA DIVERSIFIED EQUITY INCOME FUND
STATEMENT OF OPERATIONS
Six Months Ended November 30, 2016 (Unaudited)
Net investment income | |
Income: | |
Dividends — unaffiliated issuers | | $ | 32,512,476 | | |
Dividends — affiliated issuers | | | 85,980 | | |
Interest | | | 103,098 | | |
Foreign taxes withheld | | | (42,784 | ) | |
Total income | | | 32,658,770 | | |
Expenses: | |
Management services fees | | | 7,383,172 | | |
Distribution and/or service fees | |
Class A | | | 2,674,488 | | |
Class B | | | 91,259 | | |
Class C | | | 322,288 | | |
Class R | | | 14,194 | | |
Class W | | | 3 | | |
Transfer agent fees | |
Class A | | | 1,342,697 | | |
Class B | | | 11,455 | | |
Class C | | | 40,450 | | |
Class K | | | 9,335 | | |
Class R | | | 3,563 | | |
Class R4 | | | 4,576 | | |
Class R5 | | | 7,977 | | |
Class W | | | 2 | | |
Class Z | | | 14,250 | | |
Plan administration fees | |
Class K | | | 46,547 | | |
Compensation of board members | | | 29,065 | | |
Custodian fees | | | 9,131 | | |
Printing and postage fees | | | 144,589 | | |
Registration fees | | | 69,215 | | |
Audit fees | | | 15,282 | | |
Legal fees | | | 15,635 | | |
Chief compliance officer expenses | | | 168 | | |
Other | | | 40,483 | | |
Total expenses | | | 12,289,824 | | |
Expense reductions | | | (100 | ) | |
Total net expenses | | | 12,289,724 | | |
Net investment income | | | 20,369,046 | | |
Realized and unrealized gain (loss) — net | |
Net realized gain (loss) on: | |
Investments — unaffiliated issuers | | | 65,812,754 | | |
Investments — affiliated issuers | | | (1,272 | ) | |
Net realized gain | | | 65,811,482 | | |
Net change in unrealized appreciation (depreciation) on: | |
Investments — unaffiliated issuers | | | 95,149,221 | | |
Investments — affiliated issuers | | | 3,604 | | |
Net change in unrealized appreciation | | | 95,152,825 | | |
Net realized and unrealized gain | | | 160,964,307 | | |
Net increase in net assets resulting from operations | | $ | 181,333,353 | | |
The accompanying Notes to Financial Statements are an integral part of this statement.
Semiannual Report 2016
12
COLUMBIA DIVERSIFIED EQUITY INCOME FUND
STATEMENT OF CHANGES IN NET ASSETS
| | | Six Months Ended
November 30, 2016
(Unaudited) | | Year Ended
May 31,
2016 | |
Operations | |
Net investment income | | $ | 20,369,046 | | | $ | 31,235,632 | | |
Net realized gain | | | 65,811,482 | | | | 47,102,801 | | |
Net change in unrealized appreciation (depreciation) | | | 95,152,825 | | | | (123,241,674 | ) | |
Net increase (decrease) in net assets resulting from operations | | | 181,333,353 | | | | (44,903,241 | ) | |
Distributions to shareholders | |
Net investment income | |
Class A | | | (13,091,919 | ) | | | (42,828,996 | ) | |
Class B | | | (46,105 | ) | | | (359,903 | ) | |
Class C | | | (155,173 | ) | | | (775,943 | ) | |
Class I | | | (21 | ) | | | (63 | ) | |
Class K | | | (245,563 | ) | | | (958,207 | ) | |
Class R | | | (27,869 | ) | | | (103,819 | ) | |
Class R4 | | | (52,824 | ) | | | (182,217 | ) | |
Class R5 | | | (246,081 | ) | | | (673,644 | ) | |
Class W | | | (14 | ) | | | (48 | ) | |
Class Y | | | (3,373 | ) | | | (8,161 | ) | |
Class Z | | | (164,974 | ) | | | (405,344 | ) | |
Net realized gains | |
Class A | | | — | | | | (226,187,014 | ) | |
Class B | | | — | | | | (2,895,297 | ) | |
Class C | | | — | | | | (6,760,372 | ) | |
Class I | | | — | | | | (285 | ) | |
Class K | | | — | | | | (4,452,412 | ) | |
Class R | | | — | | | | (631,570 | ) | |
Class R4 | | | — | | | | (749,241 | ) | |
Class R5 | | | — | | | | (3,103,883 | ) | |
Class W | | | — | | | | (265 | ) | |
Class Y | | | — | | | | (35,518 | ) | |
Class Z | | | — | | | | (1,898,379 | ) | |
Total distributions to shareholders | | | (14,033,916 | ) | | | (293,010,581 | ) | |
Increase (decrease) in net assets from capital stock activity | | | (171,549,632 | ) | | | 5,143,312 | | |
Total decrease in net assets | | | (4,250,195 | ) | | | (332,770,510 | ) | |
Net assets at beginning of period | | | 2,345,649,443 | | | | 2,678,419,953 | | |
Net assets at end of period | | $ | 2,341,399,248 | | | $ | 2,345,649,443 | | |
Undistributed net investment income | | $ | 7,499,790 | | | $ | 1,164,660 | | |
The accompanying Notes to Financial Statements are an integral part of this statement.
Semiannual Report 2016
13
COLUMBIA DIVERSIFIED EQUITY INCOME FUND
STATEMENT OF CHANGES IN NET ASSETS (continued)
| | | Six Months Ended November 30, 2016
(Unaudited) | | Year Ended May 31, 2016 | |
| | | Shares | | Dollars ($) | | Shares | | Dollars ($) | |
Capital stock activity | |
Class A shares | |
Subscriptions(a) | | | 3,140,116 | | | | 39,753,499 | | | | 9,672,641 | | | | 120,428,010 | | |
Distributions reinvested | | | 1,016,934 | | | | 12,833,059 | | | | 22,145,402 | | | | 264,453,403 | | |
Redemptions | | | (16,867,622 | ) | | | (213,641,698 | ) | | | (27,780,236 | ) | | | (351,776,878 | ) | |
Net increase (decrease) | | | (12,710,572 | ) | | | (161,055,140 | ) | | | 4,037,807 | | | | 33,104,535 | | |
Class B shares | |
Subscriptions | | | 3,084 | | | | 39,680 | | | | 13,038 | | | | 171,679 | | |
Distributions reinvested | | | 3,619 | | | | 45,739 | | | | 268,622 | | | | 3,213,674 | | |
Redemptions(a) | | | (486,794 | ) | | | (6,202,557 | ) | | | (1,708,113 | ) | | | (22,267,855 | ) | |
Net decrease | | | (480,091 | ) | | | (6,117,138 | ) | | | (1,426,453 | ) | | | (18,882,502 | ) | |
Class C shares | |
Subscriptions | | | 175,733 | | | | 2,222,282 | | | | 475,802 | | | | 5,975,209 | | |
Distributions reinvested | | | 12,081 | | | | 151,826 | | | | 622,517 | | | | 7,389,450 | | |
Redemptions | | | (472,661 | ) | | | (5,968,927 | ) | | | (900,515 | ) | | | (11,437,591 | ) | |
Net increase (decrease) | | | (284,847 | ) | | | (3,594,819 | ) | | | 197,804 | | | | 1,927,068 | | |
Class K shares | |
Subscriptions | | | 158,563 | | | | 1,998,206 | | | | 425,762 | | | | 5,350,619 | | |
Distributions reinvested | | | 19,453 | | | | 245,563 | | | | 451,758 | | | | 5,410,619 | | |
Redemptions | | | (550,691 | ) | | | (6,967,898 | ) | | | (1,922,119 | ) | | | (24,698,432 | ) | |
Net decrease | | | (372,675 | ) | | | (4,724,129 | ) | | | (1,044,599 | ) | | | (13,937,194 | ) | |
Class R shares | |
Subscriptions | | | 21,167 | | | | 265,454 | | | | 61,832 | | | | 777,717 | | |
Distributions reinvested | | | 2,177 | | | | 27,313 | | | | 60,556 | | | | 718,018 | | |
Redemptions | | | (57,171 | ) | | | (717,275 | ) | | | (201,171 | ) | | | (2,615,271 | ) | |
Net decrease | | | (33,827 | ) | | | (424,508 | ) | | | (78,783 | ) | | | (1,119,536 | ) | |
Class R4 shares | |
Subscriptions | | | 86,926 | | | | 1,098,736 | | | | 150,464 | | | | 1,890,414 | | |
Distributions reinvested | | | 4,184 | | | | 52,789 | | | | 77,663 | | | | 930,873 | | |
Redemptions | | | (106,188 | ) | | | (1,353,541 | ) | | | (394,928 | ) | | | (5,188,243 | ) | |
Net decrease | | | (15,078 | ) | | | (202,016 | ) | | | (166,801 | ) | | | (2,366,956 | ) | |
Class R5 shares | |
Subscriptions | | | 166,402 | | | | 2,116,875 | | | | 633,730 | | | | 8,022,571 | | |
Distributions reinvested | | | 19,500 | | | | 246,081 | | | | 316,270 | | | | 3,777,327 | | |
Redemptions | | | (242,522 | ) | | | (3,036,143 | ) | | | (459,671 | ) | | | (5,768,259 | ) | |
Net increase (decrease) | | | (56,620 | ) | | | (673,187 | ) | | | 490,329 | | | | 6,031,639 | | |
The accompanying Notes to Financial Statements are an integral part of this statement.
Semiannual Report 2016
14
COLUMBIA DIVERSIFIED EQUITY INCOME FUND
STATEMENT OF CHANGES IN NET ASSETS (continued)
| | | Six Months Ended November 30, 2016
(Unaudited) | | Year Ended May 31, 2016 | |
| | | Shares | | Dollars ($) | | Shares | | Dollars ($) | |
Capital stock activity (continued) | |
Class Y shares | |
Subscriptions | | | 4,933 | | | | 63,360 | | | | 8,356 | | | | 107,905 | | |
Distributions reinvested | | | 263 | | | | 3,354 | | | | 3,594 | | | | 43,364 | | |
Redemptions | | | (4,976 | ) | | | (63,951 | ) | | | (4,787 | ) | | | (63,708 | ) | |
Net increase | | | 220 | | | | 2,763 | | | | 7,163 | | | | 87,561 | | |
Class Z shares | |
Subscriptions | | | 1,131,179 | | | | 14,211,873 | | | | 336,053 | | | | 4,292,802 | | |
Distributions reinvested | | | 12,324 | | | | 155,355 | | | | 178,071 | | | | 2,126,116 | | |
Redemptions | | | (718,090 | ) | | | (9,128,686 | ) | | | (487,016 | ) | | | (6,120,221 | ) | |
Net increase | | | 425,413 | | | | 5,238,542 | | | | 27,108 | | | | 298,697 | | |
Total net increase (decrease) | | | (13,528,077 | ) | | | (171,549,632 | ) | | | 2,043,575 | | | | 5,143,312 | | |
(a) Includes conversions of Class B shares to Class A shares, if any.
The accompanying Notes to Financial Statements are an integral part of this statement.
Semiannual Report 2016
15
COLUMBIA DIVERSIFIED EQUITY INCOME FUND
The following tables are intended to help you understand the Fund's financial performance. Certain information reflects financial results for a single share of a class held for the periods shown. Per share net investment income (loss) amounts are calculated based on average shares outstanding during the period. Total return assumes reinvestment of all dividends and distributions, if any. Total return does not reflect payment of sales charges, if any. Total return and portfolio turnover are not annualized for periods of less than one year. The portfolio turnover rate is calculated without regard to purchase and sales transactions of short-term instruments and certain derivatives, if any. If such transactions were included, the Fund's portfolio turnover rate may be higher.
| | | Six Months Ended
November 30, 2016 | | Year Ended May 31, | | Year Ended
September 30, | |
Class A | | (Unaudited) | | 2016 | | 2015 | | 2014 | | 2013 | | 2012(a) | | 2011 | |
Per share data | |
Net asset value,
beginning of period | | $ | 12.35 | | | $ | 14.26 | | | $ | 14.25 | | | $ | 12.29 | | | $ | 9.76 | | | $ | 8.53 | | | $ | 9.03 | | |
Income from
investment
operations: | |
Net investment
income | | | 0.11 | | | | 0.17 | | | | 0.23 | | | | 0.15 | | | | 0.19 | | | | 0.11 | | | | 0.12 | | |
Net realized and
unrealized
gain (loss) | | | 0.90 | | | | (0.44 | ) | | | 1.05 | | | | 1.97 | | | | 2.55 | | | | 1.20 | | | | (0.49 | ) | |
Total from
investment
operations | | | 1.01 | | | | (0.27 | ) | | | 1.28 | | | | 2.12 | | | | 2.74 | | | | 1.31 | | | | (0.37 | ) | |
Less distributions
to shareholders: | |
Net investment
income | | | (0.08 | ) | | | (0.25 | ) | | | (0.17 | ) | | | (0.16 | ) | | | (0.21 | ) | | | (0.08 | ) | | | (0.13 | ) | |
Net realized gains | | | — | | | | (1.39 | ) | | | (1.10 | ) | | | — | | | | — | | | | — | | | | — | | |
Total distributions
to shareholders | | | (0.08 | ) | | | (1.64 | ) | | | (1.27 | ) | | | (0.16 | ) | | | (0.21 | ) | | | (0.08 | ) | | | (0.13 | ) | |
Net asset value,
end of period | | $ | 13.28 | | | $ | 12.35 | | | $ | 14.26 | | | $ | 14.25 | | | $ | 12.29 | | | $ | 9.76 | | | $ | 8.53 | | |
Total return | | | 8.19 | % | | | (1.34 | %) | | | 9.34 | % | | | 17.45 | % | | | 28.46 | % | | | 15.31 | % | | | (4.32 | %) | |
Ratios to average
net assets(b) | |
Total gross
expenses | | | 1.03 | %(c) | | | 1.04 | % | | | 1.05 | % | | | 1.09 | % | | | 1.14 | %(d) | | | 1.10 | %(c) | | | 1.13 | % | |
Total net expenses(e) | | | 1.03 | %(c)(f) | | | 1.04 | %(f) | | | 1.05 | %(f) | | | 1.08 | %(f) | | | 1.08 | %(d)(f) | | | 1.10 | %(c) | | | 1.13 | %(f) | |
Net investment
income | | | 1.76 | %(c) | | | 1.31 | % | | | 1.61 | % | | | 1.16 | % | | | 1.77 | % | | | 1.66 | %(c) | | | 1.20 | % | |
Supplemental data | |
Net assets, end of
period (in thousands) | | $ | 2,151,835 | | | $ | 2,159,152 | | | $ | 2,434,631 | | | $ | 2,454,495 | | | $ | 2,480,865 | | | $ | 2,320,419 | | | $ | 3,197,508 | | |
Portfolio turnover | | | 15 | % | | | 43 | % | | | 48 | % | | | 74 | % | | | 43 | % | | | 16 | % | | | 36 | % | |
Notes to Financial Highlights
(a) For the period from October 1, 2011 to May 31, 2012. During the period, the Fund's fiscal year end was changed from September 30 to May 31.
(b) In addition to the fees and expenses that the Fund bears directly, the Fund indirectly bears a pro rata share of the fees and expenses of any other funds in which it invests. Such indirect expenses are not included in the Fund's reported expense ratios.
(c) Annualized.
(d) Ratios include line of credit interest expense which is less than 0.01%.
(e) Total net expenses include the impact of certain fee waivers/expense reimbursements made by the Investment Manager and certain of its affiliates, if applicable.
(f) The benefits derived from expense reductions had an impact of less than 0.01%.
The accompanying Notes to Financial Statements are an integral part of this statement.
Semiannual Report 2016
16
COLUMBIA DIVERSIFIED EQUITY INCOME FUND
FINANCIAL HIGHLIGHTS (continued)
| | | Six Months Ended
November 30, 2016 | | Year Ended May 31, | | Year Ended
September 30, | |
Class B | | (Unaudited) | | 2016 | | 2015 | | 2014 | | 2013 | | 2012(a) | | 2011 | |
Per share data | |
Net asset value, beginning of
period | | $ | 12.39 | | | $ | 14.30 | | | $ | 14.28 | | | $ | 12.32 | | | $ | 9.79 | | | $ | 8.56 | | | $ | 9.05 | | |
Income from investment
operations: | |
Net investment income | | | 0.07 | | | | 0.08 | | | | 0.11 | | | | 0.05 | | | | 0.11 | | | | 0.06 | | | | 0.04 | | |
Net realized and unrealized
gain (loss) | | | 0.89 | | | | (0.45 | ) | | | 1.07 | | | | 1.98 | | | | 2.55 | | | | 1.21 | | | | (0.49 | ) | |
Total from investment
operations | | | 0.96 | | | | (0.37 | ) | | | 1.18 | | | | 2.03 | | | | 2.66 | | | | 1.27 | | | | (0.45 | ) | |
Less distributions to
shareholders: | |
Net investment income | | | (0.03 | ) | | | (0.15 | ) | | | (0.06 | ) | | | (0.07 | ) | | | (0.13 | ) | | | (0.04 | ) | | | (0.04 | ) | |
Net realized gains | | | — | | | | (1.39 | ) | | | (1.10 | ) | | | — | | | | — | | | | — | | | | — | | |
Total distributions to
shareholders | | | (0.03 | ) | | | (1.54 | ) | | | (1.16 | ) | | | (0.07 | ) | | | (0.13 | ) | | | (0.04 | ) | | | (0.04 | ) | |
Net asset value, end of
period | | $ | 13.32 | | | $ | 12.39 | | | $ | 14.30 | | | $ | 14.28 | | | $ | 12.32 | | | $ | 9.79 | | | $ | 8.56 | | |
Total return | | | 7.76 | % | | | (2.08 | %) | | | 8.58 | % | | | 16.54 | % | | | 27.38 | % | | | 14.82 | % | | | (5.01 | %) | |
Ratios to average
net assets(b) | |
Total gross expenses | | | 1.78 | %(c) | | | 1.79 | % | | | 1.80 | % | | | 1.84 | % | | | 1.88 | %(d) | | | 1.87 | %(c) | | | 1.88 | % | |
Total net expenses(e) | | | 1.78 | %(c)(f) | | | 1.79 | %(f) | | | 1.80 | %(f) | | | 1.83 | %(f) | | | 1.83 | %(d)(f) | | | 1.87 | %(c) | | | 1.88 | %(f) | |
Net investment income | | | 1.03 | %(c) | | | 0.58 | % | | | 0.74 | % | | | 0.39 | % | | | 1.03 | % | | | 0.93 | %(c) | | | 0.43 | % | |
Supplemental data | |
Net assets, end of period
(in thousands) | | $ | 15,716 | | | $ | 20,574 | | | $ | 44,132 | | | $ | 69,741 | | | $ | 108,589 | | | $ | 138,560 | | | $ | 142,429 | | |
Portfolio turnover | | | 15 | % | | | 43 | % | | | 48 | % | | | 74 | % | | | 43 | % | | | 16 | % | | | 36 | % | |
Notes to Financial Highlights
(a) For the period from October 1, 2011 to May 31, 2012. During the period, the Fund's fiscal year end was changed from September 30 to May 31.
(b) In addition to the fees and expenses that the Fund bears directly, the Fund indirectly bears a pro rata share of the fees and expenses of any other funds in which it invests. Such indirect expenses are not included in the Fund's reported expense ratios.
(c) Annualized.
(d) Ratios include line of credit interest expense which is less than 0.01%.
(e) Total net expenses include the impact of certain fee waivers/expense reimbursements made by the Investment Manager and certain of its affiliates, if applicable.
(f) The benefits derived from expense reductions had an impact of less than 0.01%.
The accompanying Notes to Financial Statements are an integral part of this statement.
Semiannual Report 2016
17
COLUMBIA DIVERSIFIED EQUITY INCOME FUND
FINANCIAL HIGHLIGHTS (continued)
| | | Six Months Ended
November 30, 2016 | | Year Ended May 31, | | Year Ended
September 30, | |
Class C | | (Unaudited) | | 2016 | | 2015 | | 2014 | | 2013 | | 2012(a) | | 2011 | |
Per share data | |
Net asset value, beginning of
period | | $ | 12.32 | | | $ | 14.22 | | | $ | 14.21 | | | $ | 12.26 | | | $ | 9.74 | | | $ | 8.52 | | | $ | 9.02 | | |
Income from investment
operations: | |
Net investment income | | | 0.06 | | | | 0.07 | | | | 0.12 | | | | 0.05 | | | | 0.11 | | | | 0.06 | | | | 0.04 | | |
Net realized and unrealized
gain (loss) | | | 0.89 | | | | (0.43 | ) | | | 1.05 | | | | 1.97 | | | | 2.54 | | | | 1.20 | | | | (0.49 | ) | |
Total from investment
operations | | | 0.95 | | | | (0.36 | ) | | | 1.17 | | | | 2.02 | | | | 2.65 | | | | 1.26 | | | | (0.45 | ) | |
Less distributions to
shareholders: | |
Net investment income | | | (0.03 | ) | | | (0.15 | ) | | | (0.06 | ) | | | (0.07 | ) | | | (0.13 | ) | | | (0.04 | ) | | | (0.05 | ) | |
Net realized gains | | | — | | | | (1.39 | ) | | | (1.10 | ) | | | — | | | | — | | | | — | | | | — | | |
Total distributions to
shareholders | | | (0.03 | ) | | | (1.54 | ) | | | (1.16 | ) | | | (0.07 | ) | | | (0.13 | ) | | | (0.04 | ) | | | (0.05 | ) | |
Net asset value, end of period | | $ | 13.24 | | | $ | 12.32 | | | $ | 14.22 | | | $ | 14.21 | | | $ | 12.26 | | | $ | 9.74 | | | $ | 8.52 | | |
Total return | | | 7.72 | % | | | (2.02 | %) | | | 8.55 | % | | | 16.54 | % | | | 27.46 | % | | | 14.80 | % | | | (5.07 | %) | |
Ratios to average net assets(b) | |
Total gross expenses | | | 1.78 | %(c) | | | 1.79 | % | | | 1.80 | % | | | 1.84 | % | | | 1.89 | %(d) | | | 1.85 | %(c) | | | 1.88 | % | |
Total net expenses(e) | | | 1.78 | %(c)(f) | | | 1.79 | %(f) | | | 1.80 | %(f) | | | 1.83 | %(f) | | | 1.83 | %(d)(f) | | | 1.85 | %(c) | | | 1.88 | %(f) | |
Net investment income | | | 1.01 | %(c) | | | 0.56 | % | | | 0.87 | % | | | 0.41 | % | | | 1.02 | % | | | 0.95 | %(c) | | | 0.44 | % | |
Supplemental data | |
Net assets, end of period
(in thousands) | | $ | 65,880 | | | $ | 64,809 | | | $ | 72,010 | | | $ | 69,633 | | | $ | 61,178 | | | $ | 55,775 | | | $ | 54,238 | | |
Portfolio turnover | | | 15 | % | | | 43 | % | | | 48 | % | | | 74 | % | | | 43 | % | | | 16 | % | | | 36 | % | |
Notes to Financial Highlights
(a) For the period from October 1, 2011 to May 31, 2012. During the period, the Fund's fiscal year end was changed from September 30 to May 31.
(b) In addition to the fees and expenses that the Fund bears directly, the Fund indirectly bears a pro rata share of the fees and expenses of any other funds in which it invests. Such indirect expenses are not included in the Fund's reported expense ratios.
(c) Annualized.
(d) Ratios include line of credit interest expense which is less than 0.01%.
(e) Total net expenses include the impact of certain fee waivers/expense reimbursements made by the Investment Manager and certain of its affiliates, if applicable.
(f) The benefits derived from expense reductions had an impact of less than 0.01%.
The accompanying Notes to Financial Statements are an integral part of this statement.
Semiannual Report 2016
18
COLUMBIA DIVERSIFIED EQUITY INCOME FUND
FINANCIAL HIGHLIGHTS (continued)
| | | Six Months Ended
November 30, 2016 | | Year Ended May 31, | | Year Ended
September 30, | |
Class I | | (Unaudited) | | 2016 | | 2015 | | 2014 | | 2013 | | 2012(a) | | 2011 | |
Per share data | |
Net asset value, beginning of period | | $ | 12.33 | | | $ | 14.24 | | | $ | 14.23 | | | $ | 12.28 | | | $ | 9.76 | | | $ | 8.52 | | | $ | 9.02 | | |
Income from investment operations: | |
Net investment income | | | 0.14 | | | | 0.22 | | | | 0.29 | | | | 0.19 | | | | 0.24 | | | | 0.14 | | | | 0.16 | | |
Net realized and unrealized gain (loss) | | | 0.88 | | | | (0.43 | ) | | | 1.05 | | | | 1.98 | | | | 2.54 | | | | 1.20 | | | | (0.49 | ) | |
Total from investment operations | | | 1.02 | | | | (0.21 | ) | | | 1.34 | | | | 2.17 | | | | 2.78 | | | | 1.34 | | | | (0.33 | ) | |
Less distributions to shareholders: | |
Net investment income | | | (0.10 | ) | | | (0.31 | ) | | | (0.23 | ) | | | (0.22 | ) | | | (0.26 | ) | | | (0.10 | ) | | | (0.17 | ) | |
Net realized gains | | | — | | | | (1.39 | ) | | | (1.10 | ) | | | — | | | | — | | | | — | | | | — | | |
Total distributions to shareholders | | | (0.10 | ) | | | (1.70 | ) | | | (1.33 | ) | | | (0.22 | ) | | | (0.26 | ) | | | (0.10 | ) | | | (0.17 | ) | |
Net asset value, end of period | | $ | 13.25 | | | $ | 12.33 | | | $ | 14.24 | | | $ | 14.23 | | | $ | 12.28 | | | $ | 9.76 | | | $ | 8.52 | | |
Total return | | | 8.34 | % | | | (0.93 | %) | | | 9.84 | % | | | 17.90 | % | | | 28.92 | % | | | 15.76 | % | | | (3.88 | %) | |
Ratios to average net assets(b) | |
Total gross expenses | | | 0.64 | %(c) | | | 0.63 | % | | | 0.62 | % | | | 0.63 | % | | | 0.66 | %(d) | | | 0.63 | %(c) | | | 0.67 | % | |
Total net expenses(e) | | | 0.64 | %(c) | | | 0.63 | % | | | 0.62 | % | | | 0.63 | % | | | 0.66 | %(d) | | | 0.63 | %(c) | | | 0.67 | % | |
Net investment income | | | 2.14 | %(c) | | | 1.72 | % | | | 2.04 | % | | | 1.46 | % | | | 2.19 | % | | | 2.13 | %(c) | | | 1.63 | % | |
Supplemental data | |
Net assets, end of period (in thousands) | | $ | 3 | | | $ | 3 | | | $ | 3 | | | $ | 3 | | | $ | 45,330 | | | $ | 39,849 | | | $ | 79,024 | | |
Portfolio turnover | | | 15 | % | | | 43 | % | | | 48 | % | | | 74 | % | | | 43 | % | | | 16 | % | | | 36 | % | |
Notes to Financial Highlights
(a) For the period from October 1, 2011 to May 31, 2012. During the period, the Fund's fiscal year end was changed from September 30 to May 31.
(b) In addition to the fees and expenses that the Fund bears directly, the Fund indirectly bears a pro rata share of the fees and expenses of any other funds in which it invests. Such indirect expenses are not included in the Fund's reported expense ratios.
(c) Annualized.
(d) Ratios include line of credit interest expense which is less than 0.01%.
(e) Total net expenses include the impact of certain fee waivers/expense reimbursements made by the Investment Manager and certain of its affiliates, if applicable.
The accompanying Notes to Financial Statements are an integral part of this statement.
Semiannual Report 2016
19
COLUMBIA DIVERSIFIED EQUITY INCOME FUND
FINANCIAL HIGHLIGHTS (continued)
| | | Six Months Ended
November 30, 2016 | | Year Ended May 31, | | Year Ended
September 30, | |
Class K | | (Unaudited) | | 2016 | | 2015 | | 2014 | | 2013 | | 2012(a) | | 2011 | |
Per share data | |
Net asset value, beginning of period | | $ | 12.36 | | | $ | 14.27 | | | $ | 14.26 | | | $ | 12.30 | | | $ | 9.77 | | | $ | 8.53 | | | $ | 9.04 | | |
Income from investment operations: | |
Net investment income | | | 0.12 | | | | 0.18 | | | | 0.24 | | | | 0.16 | | | | 0.20 | | | | 0.12 | | | | 0.14 | | |
Net realized and unrealized gain (loss) | | | 0.88 | | | | (0.44 | ) | | | 1.06 | | | | 1.98 | | | | 2.56 | | | | 1.20 | | | | (0.50 | ) | |
Total from investment operations | | | 1.00 | | | | (0.26 | ) | | | 1.30 | | | | 2.14 | | | | 2.76 | | | | 1.32 | | | | (0.36 | ) | |
Less distributions to shareholders: | |
Net investment income | | | (0.08 | ) | | | (0.26 | ) | | | (0.19 | ) | | | (0.18 | ) | | | (0.23 | ) | | | (0.08 | ) | | | (0.15 | ) | |
Net realized gains | | | — | | | | (1.39 | ) | | | (1.10 | ) | | | — | | | | — | | | | — | | | | — | | |
Total distributions to shareholders | | | (0.08 | ) | | | (1.65 | ) | | | (1.29 | ) | | | (0.18 | ) | | | (0.23 | ) | | | (0.08 | ) | | | (0.15 | ) | |
Net asset value, end of period | | $ | 13.28 | | | $ | 12.36 | | | $ | 14.27 | | | $ | 14.26 | | | $ | 12.30 | | | $ | 9.77 | | | $ | 8.53 | | |
Total return | | | 8.14 | % | | | (1.24 | %) | | | 9.46 | % | | | 17.60 | % | | | 28.61 | % | | | 15.51 | % | | | (4.23 | %) | |
Ratios to average net assets(b) | |
Total gross expenses | | | 0.96 | %(c) | | | 0.96 | % | | | 0.95 | % | | | 0.94 | % | | | 0.94 | %(d) | | | 0.93 | %(c) | | | 0.97 | % | |
Total net expenses(e) | | | 0.96 | %(c) | | | 0.96 | % | | | 0.95 | % | | | 0.94 | % | | | 0.94 | %(d) | | | 0.93 | %(c) | | | 0.97 | % | |
Net investment income | | | 1.85 | %(c) | | | 1.39 | % | | | 1.68 | % | | | 1.24 | % | | | 1.88 | % | | | 1.87 | %(c) | | | 1.36 | % | |
Supplemental data | |
Net assets, end of period
(in thousands) | | $ | 36,190 | | | $ | 38,278 | | | $ | 59,092 | | | $ | 72,165 | | | $ | 168,438 | | | $ | 202,741 | | | $ | 189,510 | | |
Portfolio turnover | | | 15 | % | | | 43 | % | | | 48 | % | | | 74 | % | | | 43 | % | | | 16 | % | | | 36 | % | |
Notes to Financial Highlights
(a) For the period from October 1, 2011 to May 31, 2012. During the period, the Fund's fiscal year end was changed from September 30 to May 31.
(b) In addition to the fees and expenses that the Fund bears directly, the Fund indirectly bears a pro rata share of the fees and expenses of any other funds in which it invests. Such indirect expenses are not included in the Fund's reported expense ratios.
(c) Annualized.
(d) Ratios include line of credit interest expense which is less than 0.01%.
(e) Total net expenses include the impact of certain fee waivers/expense reimbursements made by the Investment Manager and certain of its affiliates, if applicable.
The accompanying Notes to Financial Statements are an integral part of this statement.
Semiannual Report 2016
20
COLUMBIA DIVERSIFIED EQUITY INCOME FUND
FINANCIAL HIGHLIGHTS (continued)
| | | Six Months Ended
November 30, 2016 | | Year Ended May 31, | | Year Ended
September 30, | |
Class R | | (Unaudited) | | 2016 | | 2015 | | 2014 | | 2013 | | 2012(a) | | 2011 | |
Per share data | |
Net asset value, beginning of period | | $ | 12.28 | | | $ | 14.18 | | | $ | 14.18 | | | $ | 12.23 | | | $ | 9.72 | | | $ | 8.50 | | | $ | 8.99 | | |
Income from investment operations: | |
Net investment income | | | 0.10 | | | | 0.14 | | | | 0.19 | | | | 0.12 | | | | 0.17 | | | | 0.09 | | | | 0.09 | | |
Net realized and unrealized gain (loss) | | | 0.87 | | | | (0.43 | ) | | | 1.04 | | | | 1.96 | | | | 2.53 | | | | 1.20 | | | | (0.48 | ) | |
Total from investment operations | | | 0.97 | | | | (0.29 | ) | | | 1.23 | | | | 2.08 | | | | 2.70 | | | | 1.29 | | | | (0.39 | ) | |
Less distributions to shareholders: | |
Net investment income | | | (0.06 | ) | | | (0.22 | ) | | | (0.13 | ) | | | (0.13 | ) | | | (0.19 | ) | | | (0.07 | ) | | | (0.10 | ) | |
Net realized gains | | | — | | | | (1.39 | ) | | | (1.10 | ) | | | — | | | | — | | | | — | | | | — | | |
Total distributions to shareholders | | | (0.06 | ) | | | (1.61 | ) | | | (1.23 | ) | | | (0.13 | ) | | | (0.19 | ) | | | (0.07 | ) | | | (0.10 | ) | |
Net asset value, end of period | | $ | 13.19 | | | $ | 12.28 | | | $ | 14.18 | | | $ | 14.18 | | | $ | 12.23 | | | $ | 9.72 | | | $ | 8.50 | | |
Total return | | | 7.94 | % | | | (1.52 | %) | | | 9.04 | % | | | 17.16 | % | | | 28.05 | % | | | 15.14 | % | | | (4.46 | %) | |
Ratios to average net assets(b) | |
Total gross expenses | | | 1.28 | %(c) | | | 1.29 | % | | | 1.30 | % | | | 1.34 | % | | | 1.39 | %(d) | | | 1.35 | %(c) | | | 1.38 | % | |
Total net expenses(e) | | | 1.28 | %(c)(f) | | | 1.29 | %(f) | | | 1.30 | %(f) | | | 1.33 | %(f) | | | 1.33 | %(d)(f) | | | 1.35 | %(c) | | | 1.38 | %(f) | |
Net investment income | | | 1.51 | %(c) | | | 1.07 | % | | | 1.36 | % | | | 0.90 | % | | | 1.53 | % | | | 1.46 | %(c) | | | 0.95 | % | |
Supplemental data | |
Net assets, end of period
(in thousands) | | $ | 5,667 | | | $ | 5,688 | | | $ | 7,687 | | | $ | 8,004 | | | $ | 9,859 | | | $ | 10,976 | | | $ | 10,114 | | |
Portfolio turnover | | | 15 | % | | | 43 | % | | | 48 | % | | | 74 | % | | | 43 | % | | | 16 | % | | | 36 | % | |
Notes to Financial Highlights
(a) For the period from October 1, 2011 to May 31, 2012. During the period, the Fund's fiscal year end was changed from September 30 to May 31.
(b) In addition to the fees and expenses that the Fund bears directly, the Fund indirectly bears a pro rata share of the fees and expenses of any other funds in which it invests. Such indirect expenses are not included in the Fund's reported expense ratios.
(c) Annualized.
(d) Ratios include line of credit interest expense which is less than 0.01%.
(e) Total net expenses include the impact of certain fee waivers/expense reimbursements made by the Investment Manager and certain of its affiliates, if applicable.
(f) The benefits derived from expense reductions had an impact of less than 0.01%.
The accompanying Notes to Financial Statements are an integral part of this statement.
Semiannual Report 2016
21
COLUMBIA DIVERSIFIED EQUITY INCOME FUND
FINANCIAL HIGHLIGHTS (continued)
| | | Six Months Ended
November 30, 2016 | | Year Ended May 31, | | Year Ended
September 30, | |
Class R4 | | (Unaudited) | | 2016 | | 2015 | | 2014 | | 2013 | | 2012(a) | | 2011 | |
Per share data | |
Net asset value, beginning of
period | | $ | 12.35 | | | $ | 14.26 | | | $ | 14.24 | | | $ | 12.28 | | | $ | 9.75 | | | $ | 8.51 | | | $ | 9.02 | | |
Income from investment
operations: | |
Net investment income | | | 0.13 | | | | 0.20 | | | | 0.26 | | | | 0.18 | | | | 0.20 | | | | 0.11 | | | | 0.11 | | |
Net realized and unrealized
gain (loss) | | | 0.88 | | | | (0.43 | ) | | | 1.06 | | | | 1.97 | | | | 2.54 | | | | 1.20 | | | | (0.50 | ) | |
Total from investment operations | | | 1.01 | | | | (0.23 | ) | | | 1.32 | | | | 2.15 | | | | 2.74 | | | | 1.31 | | | | (0.39 | ) | |
Less distributions to shareholders: | |
Net investment income | | | (0.09 | ) | | | (0.29 | ) | | | (0.20 | ) | | | (0.19 | ) | | | (0.21 | ) | | | (0.07 | ) | | | (0.12 | ) | |
Net realized gains | | | — | | | | (1.39 | ) | | | (1.10 | ) | | | — | | | | — | | | | — | | | | — | | |
Total distributions to shareholders | | | (0.09 | ) | | | (1.68 | ) | | | (1.30 | ) | | | (0.19 | ) | | | (0.21 | ) | | | (0.07 | ) | | | (0.12 | ) | |
Net asset value, end of period | | $ | 13.27 | | | $ | 12.35 | | | $ | 14.26 | | | $ | 14.24 | | | $ | 12.28 | | | $ | 9.75 | | | $ | 8.51 | | |
Total return | | | 8.24 | % | | | (1.07 | %) | | | 9.69 | % | | | 17.71 | % | | | 28.46 | % | | | 15.37 | % | | | (4.52 | %) | |
Ratios to average net assets(b) | |
Total gross expenses | | | 0.79 | %(c) | | | 0.79 | % | | | 0.80 | % | | | 0.84 | % | | | 1.02 | %(d) | | | 1.18 | %(c) | | | 1.21 | % | |
Total net expenses(e) | | | 0.79 | %(c)(f) | | | 0.79 | %(f) | | | 0.80 | %(f) | | | 0.83 | %(f) | | | 0.99 | %(d) | | | 1.18 | %(c) | | | 1.21 | % | |
Net investment income | | | 2.01 | %(c) | | | 1.56 | % | | | 1.81 | % | | | 1.37 | % | | | 1.91 | % | | | 1.63 | %(c) | | | 1.06 | % | |
Supplemental data | |
Net assets, end of period
(in thousands) | | $ | 7,379 | | | $ | 7,052 | | | $ | 10,520 | | | $ | 13,093 | | | $ | 22,154 | | | $ | 53,739 | | | $ | 53,617 | | |
Portfolio turnover | | | 15 | % | | | 43 | % | | | 48 | % | | | 74 | % | | | 43 | % | | | 16 | % | | | 36 | % | |
Notes to Financial Highlights
(a) For the period from October 1, 2011 to May 31, 2012. During the period, the Fund's fiscal year end was changed from September 30 to May 31.
(b) In addition to the fees and expenses that the Fund bears directly, the Fund indirectly bears a pro rata share of the fees and expenses of any other funds in which it invests. Such indirect expenses are not included in the Fund's reported expense ratios.
(c) Annualized.
(d) Ratios include line of credit interest expense which is less than 0.01%.
(e) Total net expenses include the impact of certain fee waivers/expense reimbursements made by the Investment Manager and certain of its affiliates, if applicable.
(f) The benefits derived from expense reductions had an impact of less than 0.01%.
The accompanying Notes to Financial Statements are an integral part of this statement.
Semiannual Report 2016
22
COLUMBIA DIVERSIFIED EQUITY INCOME FUND
FINANCIAL HIGHLIGHTS (continued)
| | | Six Months Ended
November 30, 2016 | | Year Ended May 31, | | Year Ended
September 30, | |
Class R5 | | (Unaudited) | | 2016 | | 2015 | | 2014 | | 2013 | | 2012(a) | | 2011 | |
Per share data | |
Net asset value, beginning of period | | $ | 12.36 | | | $ | 14.27 | | | $ | 14.26 | | | $ | 12.30 | | | $ | 9.77 | | | $ | 8.53 | | | $ | 9.03 | | |
Income from investment operations: | |
Net investment income | | | 0.13 | | | | 0.21 | | | | 0.29 | | | | 0.19 | | | | 0.23 | | | | 0.14 | | | | 0.16 | | |
Net realized and unrealized gain (loss) | | | 0.89 | | | | (0.43 | ) | | | 1.04 | | | | 1.98 | | | | 2.55 | | | | 1.20 | | | | (0.49 | ) | |
Total from investment operations | | | 1.02 | | | | (0.22 | ) | | | 1.33 | | | | 2.17 | | | | 2.78 | | | | 1.34 | | | | (0.33 | ) | |
Less distributions to shareholders: | |
Net investment income | | | (0.10 | ) | | | (0.30 | ) | | | (0.22 | ) | | | (0.21 | ) | | | (0.25 | ) | | | (0.10 | ) | | | (0.17 | ) | |
Net realized gains | | | — | | | | (1.39 | ) | | | (1.10 | ) | | | — | | | | — | | | | — | | | | — | | |
Total distributions to shareholders | | | (0.10 | ) | | | (1.69 | ) | | | (1.32 | ) | | | (0.21 | ) | | | (0.25 | ) | | | (0.10 | ) | | | (0.17 | ) | |
Net asset value, end of period | | $ | 13.28 | | | $ | 12.36 | | | $ | 14.27 | | | $ | 14.26 | | | $ | 12.30 | | | $ | 9.77 | | | $ | 8.53 | | |
Total return | | | 8.27 | % | | | (0.98 | %) | | | 9.73 | % | | | 17.89 | % | | | 28.95 | % | | | 15.65 | % | | | (3.87 | %) | |
Ratios to average net assets(b) | |
Total gross expenses | | | 0.71 | %(c) | | | 0.71 | % | | | 0.70 | % | | | 0.69 | % | | | 0.70 | %(d) | | | 0.68 | %(c) | | | 0.72 | % | |
Total net expenses(e) | | | 0.71 | %(c) | | | 0.71 | % | | | 0.70 | % | | | 0.69 | % | | | 0.70 | %(d) | | | 0.68 | %(c) | | | 0.72 | % | |
Net investment income | | | 2.08 | %(c) | | | 1.64 | % | | | 2.00 | % | | | 1.48 | % | | | 2.14 | % | | | 2.11 | %(c) | | | 1.62 | % | |
Supplemental data | |
Net assets, end of period (in thousands) | | $ | 33,532 | | | $ | 31,899 | | | $ | 29,830 | | | $ | 26,434 | | | $ | 83,244 | | | $ | 57,805 | | | $ | 57,903 | | |
Portfolio turnover | | | 15 | % | | | 43 | % | | | 48 | % | | | 74 | % | | | 43 | % | | | 16 | % | | | 36 | % | |
Notes to Financial Highlights
(a) For the period from October 1, 2011 to May 31, 2012. During the period, the Fund's fiscal year end was changed from September 30 to May 31.
(b) In addition to the fees and expenses that the Fund bears directly, the Fund indirectly bears a pro rata share of the fees and expenses of any other funds in which it invests. Such indirect expenses are not included in the Fund's reported expense ratios.
(c) Annualized.
(d) Ratios include line of credit interest expense which is less than 0.01%.
(e) Total net expenses include the impact of certain fee waivers/expense reimbursements made by the Investment Manager and certain of its affiliates, if applicable.
The accompanying Notes to Financial Statements are an integral part of this statement.
Semiannual Report 2016
23
COLUMBIA DIVERSIFIED EQUITY INCOME FUND
FINANCIAL HIGHLIGHTS (continued)
| | | Six Months Ended
November 30, 2016 | | Year Ended May 31, | | Year Ended
September 30, | |
Class W | | (Unaudited) | | 2016 | | 2015 | | 2014 | | 2013 | | 2012(a) | | 2011 | |
Per share data | |
Net asset value, beginning of period | | $ | 12.37 | | | $ | 14.28 | | | $ | 14.27 | | | $ | 12.31 | | | $ | 9.78 | | | $ | 8.55 | | | $ | 9.04 | | |
Income from investment operations: | |
Net investment income | | | 0.11 | | | | 0.17 | | | | 0.23 | | | | 0.16 | | | | 0.19 | | | | 0.11 | | | | 0.12 | | |
Net realized and unrealized gain (loss) | | | 0.89 | | | | (0.44 | ) | | | 1.05 | | | | 1.97 | | | | 2.55 | | | | 1.20 | | | | (0.48 | ) | |
Total from investment operations | | | 1.00 | | | | (0.27 | ) | | | 1.28 | | | | 2.13 | | | | 2.74 | | | | 1.31 | | | | (0.36 | ) | |
Less distributions to shareholders: | |
Net investment income | | | (0.07 | ) | | | (0.25 | ) | | | (0.17 | ) | | | (0.17 | ) | | | (0.21 | ) | | | (0.08 | ) | | | (0.13 | ) | |
Net realized gains | | | — | | | | (1.39 | ) | | | (1.10 | ) | | | — | | | | — | | | | — | | | | — | | |
Total distributions to shareholders | | | (0.07 | ) | | | (1.64 | ) | | | (1.27 | ) | | | (0.17 | ) | | | (0.21 | ) | | | (0.08 | ) | | | (0.13 | ) | |
Net asset value, end of period | | $ | 13.30 | | | $ | 12.37 | | | $ | 14.28 | | | $ | 14.27 | | | $ | 12.31 | | | $ | 9.78 | | | $ | 8.55 | | |
Total return | | | 8.16 | % | | | (1.37 | %) | | | 9.31 | % | | | 17.44 | % | | | 28.38 | % | | | 15.32 | % | | | (4.20 | %) | |
Ratios to average net assets(b) | |
Total gross expenses | | | 1.04 | %(c) | | | 1.07 | % | | | 1.10 | % | | | 1.07 | % | | | 1.11 | %(d) | | | 1.08 | %(c) | | | 1.10 | % | |
Total net expenses(e) | | | 1.04 | %(c)(f) | | | 1.07 | %(f) | | | 1.08 | %(f) | | | 1.07 | %(f) | | | 1.08 | %(d)(f) | | | 1.08 | %(c) | | | 1.10 | %(f) | |
Net investment income | | | 1.75 | %(c) | | | 1.28 | % | | | 1.59 | % | | | 1.19 | % | | | 1.77 | % | | | 1.73 | %(c) | | | 1.23 | % | |
Supplemental data | |
Net assets, end of period (in thousands) | | $ | 3 | | | $ | 2 | | | $ | 3 | | | $ | 3 | | | $ | 4 | | | $ | 4 | | | $ | 3 | | |
Portfolio turnover | | | 15 | % | | | 43 | % | | | 48 | % | | | 74 | % | | | 43 | % | | | 16 | % | | | 36 | % | |
Notes to Financial Highlights
(a) For the period from October 1, 2011 to May 31, 2012. During the period, the Fund's fiscal year end was changed from September 30 to May 31.
(b) In addition to the fees and expenses that the Fund bears directly, the Fund indirectly bears a pro rata share of the fees and expenses of any other funds in which it invests. Such indirect expenses are not included in the Fund's reported expense ratios.
(c) Annualized.
(d) Ratios include line of credit interest expense which is less than 0.01%.
(e) Total net expenses include the impact of certain fee waivers/expense reimbursements made by the Investment Manager and certain of its affiliates, if applicable.
(f) The benefits derived from expense reductions had an impact of less than 0.01%.
The accompanying Notes to Financial Statements are an integral part of this statement.
Semiannual Report 2016
24
COLUMBIA DIVERSIFIED EQUITY INCOME FUND
FINANCIAL HIGHLIGHTS (continued)
| | | Six Months Ended
November 30, 2016 | | Year Ended May 31, | |
Class Y | | (Unaudited) | | 2016 | | 2015 | | 2014 | | 2013(a) | |
Per share data | |
Net asset value, beginning of period | | $ | 12.47 | | | $ | 14.38 | | | $ | 14.36 | | | $ | 12.38 | | | $ | 10.33 | | |
Income from investment operations: | |
Net investment income | | | 0.14 | | | | 0.22 | | | | 0.21 | | | | 0.22 | | | | 0.14 | | |
Net realized and unrealized gain (loss) | | | 0.90 | | | | (0.44 | ) | | | 1.14 | | | | 1.98 | | | | 2.04 | | |
Total from investment operations | | | 1.04 | | | | (0.22 | ) | | | 1.35 | | | | 2.20 | | | | 2.18 | | |
Less distributions to shareholders: | |
Net investment income | | | (0.10 | ) | | | (0.30 | ) | | | (0.23 | ) | | | (0.22 | ) | | | (0.13 | ) | |
Net realized gains | | | — | | | | (1.39 | ) | | | (1.10 | ) | | | — | | | | — | | |
Total distributions to shareholders | | | (0.10 | ) | | | (1.69 | ) | | | (1.33 | ) | | | (0.22 | ) | | | (0.13 | ) | |
Net asset value, end of period | | $ | 13.41 | | | $ | 12.47 | | | $ | 14.38 | | | $ | 14.36 | | | $ | 12.38 | | |
Total return | | | 8.39 | % | | | (0.93 | %) | | | 9.79 | % | | | 17.99 | % | | | 21.23 | % | |
Ratios to average net assets(b) | |
Total gross expenses | | | 0.66 | %(c) | | | 0.66 | % | | | 0.64 | % | | | 0.64 | % | | | 0.64 | %(c)(d) | |
Total net expenses(e) | | | 0.66 | %(c) | | | 0.66 | % | | | 0.64 | % | | | 0.64 | % | | | 0.64 | %(c)(d) | |
Net investment income | | | 2.14 | %(c) | | | 1.68 | % | | | 1.42 | % | | | 1.63 | % | | | 2.24 | %(c) | |
Supplemental data | |
Net assets, end of period (in thousands) | | $ | 436 | | | $ | 403 | | | $ | 362 | | | $ | 20,127 | | | $ | 3 | | |
Portfolio turnover | | | 15 | % | | | 43 | % | | | 48 | % | | | 74 | % | | | 43 | % | |
Notes to Financial Highlights
(a) Based on operations from November 8, 2012 (commencement of operations) through the stated period end.
(b) In addition to the fees and expenses that the Fund bears directly, the Fund indirectly bears a pro rata share of the fees and expenses of any other funds in which it invests. Such indirect expenses are not included in the Fund's reported expense ratios.
(c) Annualized.
(d) Ratios include line of credit interest expense which is less than 0.01%.
(e) Total net expenses include the impact of certain fee waivers/expense reimbursements made by the Investment Manager and certain of its affiliates, if applicable.
The accompanying Notes to Financial Statements are an integral part of this statement.
Semiannual Report 2016
25
COLUMBIA DIVERSIFIED EQUITY INCOME FUND
FINANCIAL HIGHLIGHTS (continued)
| | | Six Months Ended
November 30, 2016 | | Year Ended May 31, | | Year Ended
September 30, | |
Class Z | | (Unaudited) | | 2016 | | 2015 | | 2014 | | 2013 | | 2012(a) | | 2011 | |
Per share data | |
Net asset value, beginning of
period | | $ | 12.34 | | | $ | 14.25 | | | $ | 14.24 | | | $ | 12.28 | | | $ | 9.76 | | | $ | 8.52 | | | $ | 9.03 | | |
Income from investment
operations: | |
Net investment income | | | 0.13 | | | | 0.20 | | | | 0.27 | | | | 0.18 | | | | 0.22 | | | | 0.13 | | | | 0.17 | | |
Net realized and unrealized
gain (loss) | | | 0.88 | | | | (0.43 | ) | | | 1.04 | | | | 1.98 | | | | 2.54 | | | | 1.20 | | | | (0.52 | ) | |
Total from investment
operations | | | 1.01 | | | | (0.23 | ) | | | 1.31 | | | | 2.16 | | | | 2.76 | | | | 1.33 | | | | (0.35 | ) | |
Less distributions to
shareholders: | |
Net investment income | | | (0.09 | ) | | | (0.29 | ) | | | (0.20 | ) | | | (0.20 | ) | | | (0.24 | ) | | | (0.09 | ) | | | (0.16 | ) | |
Net realized gains | | | — | | | | (1.39 | ) | | | (1.10 | ) | | | — | | | | — | | | | — | | | | — | | |
Total distributions to
shareholders | | | (0.09 | ) | | | (1.68 | ) | | | (1.30 | ) | | | (0.20 | ) | | | (0.24 | ) | | | (0.09 | ) | | | (0.16 | ) | |
Net asset value, end of period | | $ | 13.26 | | | $ | 12.34 | | | $ | 14.25 | | | $ | 14.24 | | | $ | 12.28 | | | $ | 9.76 | | | $ | 8.52 | | |
Total return | | | 8.24 | % | | | (1.08 | %) | | | 9.62 | % | | | 17.76 | % | | | 28.69 | % | | | 15.62 | % | | | (4.06 | %) | |
Ratios to average net assets(b) | |
Total gross expenses | | | 0.79 | %(c) | | | 0.79 | % | | | 0.80 | % | | | 0.84 | % | | | 0.89 | %(d) | | | 0.82 | %(c) | | | 0.87 | % | |
Total net expenses(e) | | | 0.79 | %(c)(f) | | | 0.79 | %(f) | | | 0.80 | %(f) | | | 0.83 | %(f) | | | 0.83 | %(d)(f) | | | 0.82 | %(c) | | | 0.87 | %(f) | |
Net investment income | | | 2.00 | %(c) | | | 1.57 | % | | | 1.90 | % | | | 1.37 | % | | | 2.03 | % | | | 2.00 | %(c) | | | 1.77 | % | |
Supplemental data | |
Net assets, end of period
(in thousands) | | $ | 24,758 | | | $ | 17,788 | | | $ | 20,150 | | | $ | 15,733 | | | $ | 54,418 | | | $ | 69,694 | | | $ | 58,213 | | |
Portfolio turnover | | | 15 | % | | | 43 | % | | | 48 | % | | | 74 | % | | | 43 | % | | | 16 | % | | | 36 | % | |
Notes to Financial Highlights
(a) For the period from October 1, 2011 to May 31, 2012. During the period, the Fund's fiscal year end was changed from September 30 to May 31.
(b) In addition to the fees and expenses that the Fund bears directly, the Fund indirectly bears a pro rata share of the fees and expenses of any other funds in which it invests. Such indirect expenses are not included in the Fund's reported expense ratios.
(c) Annualized.
(d) Ratios include line of credit interest expense which is less than 0.01%.
(e) Total net expenses include the impact of certain fee waivers/expense reimbursements made by the Investment Manager and certain of its affiliates, if applicable.
(f) The benefits derived from expense reductions had an impact of less than 0.01%.
The accompanying Notes to Financial Statements are an integral part of this statement.
Semiannual Report 2016
26
COLUMBIA DIVERSIFIED EQUITY INCOME FUND
NOTES TO FINANCIAL STATEMENTS
November 30, 2016 (Unaudited)
Note 1. Organization
Columbia Diversified Equity Income Fund (the Fund), a series of Columbia Funds Series Trust II (the Trust), is a diversified fund. The Trust is registered under the Investment Company Act of 1940, as amended (the 1940 Act), as an open-end management investment company organized as a Massachusetts business trust.
Fund Shares
The Trust may issue an unlimited number of shares (without par value). The Fund offers Class A, Class B, Class C, Class I, Class K, Class R, Class R4, Class R5, Class W, Class Y and Class Z shares. Although all share classes generally have identical voting, dividend and liquidation rights, each share class votes separately when required by the Trust's organizational documents or by law. Different share classes pay different distribution amounts to the extent the expenses of such share classes differ, and distributions in liquidation will be proportional to the net asset value of each share class. Each share class has its own expense and sales charge structure.
Class A shares are subject to a maximum front-end sales charge of 5.75% based on the initial investment amount. Class A shares purchased without an initial sales charge in accounts aggregating $1 million to $50 million at the time of purchase are subject to a contingent deferred sales charge (CDSC) if the shares are sold within 18 months after purchase, charged as follows: 1.00% CDSC if redeemed within 12 months after purchase, and 0.50% CDSC if redeemed more than 12, but less than 18, months after purchase.
Class B shares may be subject to a maximum CDSC of 5.00% based upon the holding period after purchase. Class B shares will generally convert to Class A shares eight years after purchase. The Fund no longer accepts investments by new or existing investors in the Fund's Class B shares, except in connection with the reinvestment of any dividend and/or capital gain distributions in Class B shares of the Fund and exchanges by existing Class B shareholders of certain other funds within the Columbia Family of Funds.
Class C shares are subject to a 1.00% CDSC on shares redeemed within 12 months after purchase.
Class I shares are not subject to sales charges and are available only to the Columbia Family of Funds.
Class K shares are not subject to sales charges, however this share class is closed to new investors.
Class R shares are not subject to sales charges and are generally available only to certain retirement plans and other investors as described in the Fund's prospectus.
Class R4 shares are not subject to sales charges and are generally available only to omnibus retirement plans and certain investors as described in the Fund's prospectus.
Class R5 shares are not subject to sales charges and are generally available only to investors purchasing through authorized investment professionals and omnibus retirement plans.
Class W shares are not subject to sales charges and are generally available only to investors purchasing through authorized investment programs managed by investment professionals, including discretionary managed account programs.
Class Y shares are not subject to sales charges and are generally available only to certain retirement plans as described in the Fund's prospectus.
Class Z shares are not subject to sales charges and are generally available only to eligible investors, which are subject to different investment minimums as described in the Fund's prospectus.
Note 2. Summary of Significant Accounting Policies
Basis of Preparation
The Fund is an investment company that applies the accounting and reporting guidance in the Financial Accounting Standards Board (FASB) Accounting Standards Codification Topic 946, Financial Services — Investment Companies (ASC 946). The financial statements are prepared in accordance with U.S. generally accepted accounting principles (GAAP), which requires management to make certain estimates and assumptions that affect the reported amounts of assets and liabilities, the disclosure of contingent assets and liabilities at the date of the financial statements and the reported amounts of income and expenses during the reporting period. Actual results could differ from those estimates.
The following is a summary of significant accounting policies followed by the Fund in the preparation of its financial statements.
Security Valuation
All equity securities are valued at the close of business of the New York Stock Exchange (NYSE). Equity securities
Semiannual Report 2016
27
COLUMBIA DIVERSIFIED EQUITY INCOME FUND
NOTES TO FINANCIAL STATEMENTS (continued)
November 30, 2016 (Unaudited)
are valued at the last quoted sales price on the principal exchange or market on which they trade, except for securities traded on the NASDAQ Stock Market, which are valued at the NASDAQ official close price. Unlisted securities or listed securities for which there were no sales during the day are valued at the mean of the latest quoted bid and ask prices on such exchanges or markets.
Debt securities generally are valued by pricing services approved by the Board of Trustees (the Board) based upon market transactions for normal, institutional-size trading units of similar securities. The services may use various pricing techniques that take into account, as applicable, factors such as yield, quality, coupon rate, maturity, type of issue, trading characteristics and other data, as well as approved independent broker-dealer quotes. Debt securities for which quotations are not readily available or not believed to be reflective of market value may also be valued based upon a bid quote from an approved independent broker-dealer. Debt securities maturing in 60 days or less are valued primarily at amortized cost value, unless this method results in a valuation that management believes does not approximate market value.
Foreign equity securities are valued based on the closing price on the foreign exchange in which such securities are primarily traded. If any foreign equity security closing prices are not readily available, the securities are valued at the mean of the latest quoted bid and ask prices on such exchanges or markets. Foreign currency exchange rates are generally determined at 4:00 p.m. Eastern (U.S.) time. Many securities markets and exchanges outside the U.S. close prior to the close of the NYSE; therefore, the closing prices for securities in such markets or on such exchanges may not fully reflect events that occur after such close but before the close of the NYSE. In those situations, foreign securities will be fair valued pursuant to a policy adopted by the Board, including, if available, utilizing a third party pricing service to determine these fair values. The third party pricing service takes into account multiple factors, including, but not limited to, movements in the U.S. securities markets, certain depositary receipts, futures contracts and foreign exchange rates that have occurred subsequent to the close of the foreign exchange or market, to determine a good faith estimate that reasonably reflects the current market conditions as of the close of the NYSE. The fair value of a security is likely to be different from the quoted or published price, if available.
Investments in open-end investment companies, including money market funds, are valued at their latest net asset value.
Investments for which market quotations are not readily available, or that have quotations which management believes are not reflective of market value or reliable, are valued at fair value as determined in good faith under procedures approved by and under the general supervision of the Board. If a security or class of securities (such as foreign securities) is valued at fair value, such value is likely to be different from the quoted or published price for the security.
The determination of fair value often requires significant judgment. To determine fair value, management may use assumptions including but not limited to future cash flows and estimated risk premiums. Multiple inputs from various sources may be used to determine fair value.
GAAP requires disclosure regarding the inputs and valuation techniques used to measure fair value and any changes in valuation inputs or techniques. In addition, investments shall be disclosed by major category. This information is disclosed following the Fund's Portfolio of Investments.
Security Transactions
Security transactions are accounted for on the trade date. Cost is determined and gains (losses) are based upon the specific identification method for both financial statement and federal income tax purposes.
Income Recognition
Corporate actions and dividend income are generally recorded net of any non-reclaimable tax withholdings, on the ex-dividend date or upon receipt of ex-dividend notification in the case of certain foreign securities.
Interest income is recorded on an accrual basis. Market premiums and discounts, including original issue discounts, are amortized and accreted, respectively, over the expected life of the security on all debt securities, unless otherwise noted.
The Fund may place a debt security on non-accrual status and reduce related interest income when it becomes probable that the interest will not be collected and the amount of uncollectible interest can be reasonably estimated. A defaulted debt security is removed from non-accrual status when the issuer resumes interest payments or when collectibility of interest is reasonably assured.
Semiannual Report 2016
28
COLUMBIA DIVERSIFIED EQUITY INCOME FUND
NOTES TO FINANCIAL STATEMENTS (continued)
November 30, 2016 (Unaudited)
The Fund may receive distributions from holdings in equity securities, business development companies (BDCs), exchange-traded funds, other regulated investment companies (RICs), and real estate investment trusts (REITs), which report information on the tax character of their distributions annually. These distributions are allocated to dividend income, capital gain and return of capital based on actual information reported. Return of capital is recorded as a reduction of the cost basis of securities held. If the Fund no longer owns the applicable securities, return of capital is recorded as a realized gain. With respect to REITs, to the extent actual information has not yet been reported, estimates for return of capital are made by the Fund's management. Management's estimates are subsequently adjusted when the actual character of the distributions is disclosed by the REITs, which could result in a proportionate change in return of capital to shareholders.
Awards from class action litigation are recorded as a reduction of cost basis if the Fund still owns the applicable securities on the payment date. If the Fund no longer owns the applicable securities, the proceeds are recorded as realized gains.
Expenses
General expenses of the Trust are allocated to the Fund and other funds of the Trust based upon relative net assets or other expense allocation methodologies determined by the nature of the expense. Expenses directly attributable to the Fund are charged to the Fund. Expenses directly attributable to a specific class of shares are charged to that share class.
Determination of Class Net Asset Value
All income, expenses (other than class-specific expenses, which are charged to that share class, as shown in the Statement of Operations) and realized and unrealized gains (losses) are allocated to each class of the Fund on a daily basis, based on the relative net assets of each class, for purposes of determining the net asset value of each class.
Federal Income Tax Status
The Fund intends to qualify each year as a regulated investment company under Subchapter M of the Internal Revenue Code, as amended, and will distribute substantially all of its taxable income (including net short-term capital gains), if any, for its tax year, and as such will not be subject to federal income taxes. In addition, the Fund intends to distribute in each calendar
year substantially all of its net investment income, capital gains and certain other amounts, if any, such that the Fund should not be subject to federal excise tax. Therefore, no federal income or excise tax provision is recorded.
Foreign Taxes
The Fund may be subject to foreign taxes on income, gains on investments or currency repatriation, a portion of which may be recoverable. The Fund will accrue such taxes and recoveries, as applicable, based upon its current interpretation of tax rules and regulations that exist in the markets in which it invests.
Realized gains in certain countries may be subject to foreign taxes at the Fund level, based on statutory rates. The Fund accrues for such foreign taxes on realized and unrealized gains at the appropriate rate for each jurisdiction, as applicable. The amount, if any, is disclosed as a liability on the Statement of Assets and Liabilities.
Distributions to Shareholders
Distributions from net investment income, if any, are declared and paid each calendar quarter. Net realized capital gains, if any, are distributed at least annually. Income distributions and capital gain distributions are determined in accordance with federal income tax regulations, which may differ from GAAP.
Guarantees and Indemnifications
Under the Trust's organizational documents and, in some cases, by contract, its officers and trustees are indemnified against certain liabilities arising out of the performance of their duties to the Trust or its funds. In addition, certain of the Fund's contracts with its service providers contain general indemnification clauses. The Fund's maximum exposure under these arrangements is unknown since the amount of any future claims that may be made against the Fund cannot be determined, and the Fund has no historical basis for predicting the likelihood of any such claims.
Investment Company Reporting Modernization
In October 2016, the U.S. Securities and Exchange Commission adopted new rules and forms, and amendments to certain current rules and forms, to modernize reporting and disclosure of information by registered investment companies. The amendments to Regulation S-X will require standardized, enhanced disclosure about derivatives in investment company financial statements, and will also change the rules
Semiannual Report 2016
29
COLUMBIA DIVERSIFIED EQUITY INCOME FUND
NOTES TO FINANCIAL STATEMENTS (continued)
November 30, 2016 (Unaudited)
governing the form and content of such financial statements. The amendments to Regulation S-X take effect on August 1, 2017. At this time, management is assessing the anticipated impact of these regulatory developments.
Note 3. Fees and Other Transactions with Affiliates
Management Services Fees
The Fund entered into a Management Agreement with Columbia Management Investment Advisers, LLC (the Investment Manager), a wholly-owned subsidiary of Ameriprise Financial, Inc. (Ameriprise Financial). Under the Management Agreement, the Investment Manager provides the Fund with investment research and advice, as well as administrative and accounting services. The management services fee is an annual fee that is equal to a percentage of the Fund's average daily net assets that declines from 0.72% to 0.52% as the Fund's net assets increase. The annualized effective management services fee rate for the six months ended November 30, 2016 was 0.63% of the Fund's average daily net assets.
Other Expenses
Other expenses are for, among other things, miscellaneous expenses of the Fund or the Board, including payments to Board Services Corp., a company providing limited administrative services to the Fund and the Board. That company's expenses include boardroom and office expense, employee compensation, employee health and retirement benefits, and certain other expenses
Compensation of Board Members
Board members, who are not officers or employees of the Investment Manager or Ameriprise Financial, are compensated for their services to the Fund as disclosed in the Statement of Operations. Under a Deferred Compensation Plan (the Plan), these Board members may elect to defer payment of up to 100% of their compensation. Deferred amounts are treated as though equivalent dollar amounts had been invested in shares of certain funds managed by the Investment Manager. The Fund's liability for these amounts is adjusted for market value changes and remains in the Fund until distributed in accordance with the Plan. All amounts payable under the Plan constitute a general unsecured obligation of the Fund.
Compensation of Chief Compliance Officer
The Board has appointed a Chief Compliance Officer to the Fund in accordance with federal securities regulations. The Fund is allocated a portion of the expenses associated with the Chief Compliance Officer based on relative net assets of the Trust.
Transfer Agency Fees
Under a Transfer and Dividend Disbursing Agent Agreement, Columbia Management Investment Services Corp. (the Transfer Agent), an affiliate of the Investment Manager and a wholly-owned subsidiary of Ameriprise Financial, is responsible for providing transfer agency services to the Fund. The Transfer Agent has contracted with Boston Financial Data Services (BFDS) to serve as sub-transfer agent. The Transfer Agent pays the fees of BFDS for services as sub-transfer agent and BFDS is not entitled to reimbursement for such fees from the Fund (with the exception of out-of-pocket fees).
The Fund pays the Transfer Agent a monthly transfer agency fee based on the number or the average value of accounts, depending on the type of account. In addition, prior to October 1, 2016, the Transfer Agent also received sub-transfer agency fees based on a percentage of the average aggregate value of the Fund's shares maintained in omnibus accounts (other than omnibus accounts for which American Enterprise Investment Services Inc. is the broker of record or accounts where the beneficial shareholder is a customer of Ameriprise Financial Services, Inc., for which the Transfer Agent receives a per account fee). Effective October 1, 2016, the Fund pays the Transfer Agent a fee for shareholder services based on the number of accounts or on a percentage of the average aggregate value of the Fund's shares maintained in omnibus accounts up to the lesser of the amount charged by the servicing agent or a cap established by the Board from time to time.
The Transfer Agent also receives compensation from the Fund for various shareholder services and reimbursements for certain out-of-pocket fees. Effective January 1, 2017, total transfer agency fees for Class K and Class R5 shares are subject to an annual limitation of not more than 0.075% of the average daily net assets attributable to each share class. Total transfer agency fees for Class I and Class Y shares are subject to an annual limitation of not more than 0.025% of the average daily net assets attributable to each share class. Prior to January 1, 2017, total transfer agency fees for Class K and Class R5 shares were subject to an annual limitation of not more than 0.05% of the average daily net assets
Semiannual Report 2016
30
COLUMBIA DIVERSIFIED EQUITY INCOME FUND
NOTES TO FINANCIAL STATEMENTS (continued)
November 30, 2016 (Unaudited)
attributable to each share class. Class I and Class Y shares did not pay transfer agency fees.
For the six months ended November 30, 2016, the Fund's annualized effective transfer agency fee rates as a percentage of average daily net assets of each class were as follows:
Class A | | | 0.13 | % | |
Class B | | | 0.13 | | |
Class C | | | 0.13 | | |
Class K | | | 0.05 | | |
Class R | | | 0.13 | | |
Class R4 | | | 0.13 | | |
Class R5 | | | 0.05 | | |
Class W | | | 0.13 | | |
Class Z | | | 0.13 | | |
An annual minimum account balance fee of $20 may apply to certain accounts with a value below the applicable share class's initial minimum investment requirements to reduce the impact of small accounts on transfer agency fees. These minimum account balance fees are remitted to the Fund and recorded as part of expense reductions in the Statement of Operations. For the six months ended November 30, 2016, these minimum account balance fees reduced total expenses of the Fund by $100.
Plan Administration Fees
Under a Plan Administration Services Agreement with the Transfer Agent, the Fund pays an annual fee at a rate of 0.25% of the Fund's average daily net assets attributable to Class K shares for the provision of various administrative, recordkeeping, communication and educational services.
Distribution and Service Fees
The Fund has an agreement with Columbia Management Investment Distributors, Inc. (the Distributor), an affiliate of the Investment Manager and a wholly-owned subsidiary of Ameriprise Financial, for distribution and shareholder services. Under a Plan and Agreement of Distribution, the Fund pays a fee at an annual rate of up to 0.25% of the Fund's average daily net assets attributable to Class A and Class W shares, a fee at an annual rate of up to 0.50% of the Fund's average daily net assets attributable to Class R shares (of which up to 0.25% may be used for shareholder services) and a fee at an annual rate of up to 1.00% of the Fund's average daily net assets attributable to Class B and Class C
shares. For Class B and Class C shares, of the 1.00% fee, up to 0.75% is reimbursed for distribution expenses.
The amount of distribution and shareholder services expenses incurred by the Distributor and not yet reimbursed (unreimbursed expense) was approximately $7,523,000 and $625,000 for Class B and Class C shares, respectively. These amounts are based on the most recent information available as of September 30, 2016, and may be recovered from future payments under the distribution plan or CDSCs. To the extent the unreimbursed expense has been fully recovered, the distribution and/or shareholder services fee is reduced.
Sales Charges
Sales charges, including front-end charges and CDSCs, received by the Distributor for distributing Fund shares were $348,211 for Class A, $65 for Class B and $2,291 for Class C shares for the six months ended November 30, 2016.
Expenses Waived/Reimbursed by the Investment Manager and its Affiliates
The Investment Manager and certain of its affiliates have contractually agreed to waive fees and/or reimburse expenses (excluding certain fees and expenses described below) for the period disclosed below, unless sooner terminated at the sole discretion of the Board, so that the Fund's net operating expenses, after giving effect to fees waived/expenses reimbursed and any balance credits and/or overdraft charges from the Fund's custodian, do not exceed the following annual rates as a percentage of the class' average daily net assets:
| | | Fee Rates Contractual
Through
September 30, 2017 | |
Class A | | | 1.15 | % | |
Class B | | | 1.90 | | |
Class C | | | 1.90 | | |
Class I | | | 0.80 | | |
Class K | | | 1.10 | | |
Class R | | | 1.40 | | |
Class R4 | | | 0.90 | | |
Class R5 | | | 0.85 | | |
Class W | | | 1.15 | | |
Class Y | | | 0.80 | | |
Class Z | | | 0.90 | | |
Under the agreement, the following fees and expenses are excluded from the waiver/reimbursement
Semiannual Report 2016
31
COLUMBIA DIVERSIFIED EQUITY INCOME FUND
NOTES TO FINANCIAL STATEMENTS (continued)
November 30, 2016 (Unaudited)
commitment, and therefore will be paid by the Fund, if applicable: taxes (including foreign transaction taxes), expenses associated with investments in affiliated and non-affiliated pooled investment vehicles (including mutual funds and exchange-traded funds), transaction costs and brokerage commissions, costs related to any securities lending program, dividend and interest expenses associated with securities sold short, inverse floater program fees and expenses, transaction charges and interest on borrowed money, interest, infrequent and/or unusual expenses and any other expenses the exclusion of which is specifically approved by the Board. This agreement may be modified or amended only with approval from the Investment Manager, certain of its affiliates and the Fund. Any fees waived and/or expenses reimbursed under the expense reimbursement arrangements described above are not recoverable by the Investment Manager or its affiliates in future periods.
Note 4. Federal Tax Information
The timing and character of income and capital gain distributions are determined in accordance with income tax regulations, which may differ from GAAP because of temporary or permanent book to tax differences.
At November 30, 2016, the cost of investments for federal income tax purposes was approximately $1,910,763,000 and the aggregate gross approximate unrealized appreciation and depreciation based on that cost was:
Unrealized appreciation | | $ | 480,400,000 | | |
Unrealized depreciation | | | (55,445,000 | ) | |
Net unrealized appreciation | | $ | 424,955,000 | | |
Under current tax rules, regulated investment companies can elect to treat certain late-year ordinary losses incurred and post-October capital losses (capital losses realized after October 31) as arising on the first day of the following taxable year. The Fund has elected to treat post-October capital losses of $19,584,565 as arising on June 1, 2016.
Management of the Fund has concluded that there are no significant uncertain tax positions in the Fund that would require recognition in the financial statements. However, management's conclusion may be subject to review and adjustment at a later date based on factors including, but not limited to, new tax laws, regulations, and administrative interpretations (including relevant court decisions). Generally, the Fund's federal tax returns
for the prior three fiscal years remain subject to examination by the Internal Revenue Service.
Note 5. Portfolio Information
The cost of purchases and proceeds from sales of securities, excluding short-term investments and derivatives, if any, aggregated to $340,962,014 and $505,691,377, respectively, for the six months ended November 30, 2016. The amount of purchase and sale activity impacts the portfolio turnover rate reported in the Financial Highlights.
Note 6. Affiliated Money Market Fund
The Fund invests in Columbia Short-Term Cash Fund, an affiliated money market fund established for the exclusive use by the Fund and other affiliated funds (the Affiliated MMF). The income earned by the Fund from such investments is included as Dividends — affiliated issuers in the Statement of Operations. As an investing fund, the Fund indirectly bears its proportionate share of the expenses of the Affiliated MMF. Effective October 1, 2016, the Affiliated MMF prices its shares with a floating net asset value (NAV) and no longer seeks to maintain a stable NAV. In addition, the Board of the Affiliated MMF may impose a fee on redemptions (sometimes referred to as a liquidity fee) or temporarily suspend redemptions (sometimes referred to as imposing a redemption gate) in the event its liquidity falls below regulatory limits.
Note 7. Line of Credit
The Fund has access to a revolving credit facility with a syndicate of banks led by Citibank, N.A., HSBC Bank USA, N.A. and JPMorgan Chase Bank, N.A. whereby the Fund may borrow for the temporary funding of shareholder redemptions or for other temporary or emergency purposes. The credit facility agreement, which is a collective agreement between the Fund and certain other funds managed by the Investment Manager, severally and not jointly, that permits collective borrowings up to $1 billion. Interest is charged to each participating fund based on its borrowings at a rate equal to the higher of (i) the overnight federal funds rate plus 1.00% or (ii) the one-month LIBOR rate plus 1.00%. Each borrowing under the credit facility matures no later than 60 days after the date of borrowing. The Fund also pays a commitment fee equal to its pro rata share of the amount of the credit facility at a rate of 0.15% per annum. The commitment fee is included in other expenses in the Statement of Operations.
Semiannual Report 2016
32
COLUMBIA DIVERSIFIED EQUITY INCOME FUND
NOTES TO FINANCIAL STATEMENTS (continued)
November 30, 2016 (Unaudited)
The Fund had no borrowings during the six months ended November 30, 2016.
Note 8. Significant Risks
Shareholder Concentration Risk
At November 30, 2016, affiliated shareholders of record owned 85.7% of the outstanding shares of the Fund in one or more accounts. Subscription and redemption activity by concentrated accounts may have a significant effect on the operations of the Fund. In the case of a large redemption, the Fund may be forced to sell investments at inopportune times, including its liquid or more liquid positions, resulting in Fund losses and the Fund holding a higher percentage of less liquid or illiquid securities. Large redemptions could result in decreased economies of scale and increased operating expenses for non-redeeming Fund shareholders.
Financial Sector Risk
The Fund may be more susceptible to the particular risks that may affect companies in the financial services sector than if it were invested in a wider variety of companies in unrelated sectors. Companies in the financial services sector are subject to certain risks, including the risk of regulatory change, decreased liquidity in credit markets and unstable interest rates. Such companies may have concentrated portfolios, such as a high level of loans to real estate developers, which makes them vulnerable to economic conditions that affect that industry. Performance of such companies may be affected by competitive pressures and exposure to investments or agreements that, under certain circumstances, may lead to losses (e.g., subprime loans). Companies in the financial services sector are subject to extensive governmental regulation that may limit the amount and types of loans and other financial commitments they can make, and interest rates and fees that they may charge. In addition, profitability of such companies is largely dependent upon the availability and the cost of capital.
Note 9. Subsequent Events
Management has evaluated the events and transactions that have occurred through the date the financial statements were issued and noted no items requiring adjustment of the financial statements or additional disclosure.
Note 10. Information Regarding Pending and Settled Legal Proceedings
Ameriprise Financial and certain of its affiliates have historically been involved in a number of legal, arbitration and regulatory proceedings, including routine litigation, class actions, and governmental actions, concerning matters arising in connection with the conduct of their business activities. Ameriprise Financial believes that the Funds are not currently the subject of, and that neither Ameriprise Financial nor any of its affiliates are the subject of, any pending legal, arbitration or regulatory proceedings that are likely to have a material adverse effect on the Funds or the ability of Ameriprise Financial or its affiliates to perform under their contracts with the Funds. Ameriprise Financial is required to make quarterly (10-Q), annual (10-K) and, as necessary, 8-K filings with the Securities and Exchange Commission (SEC) on legal and regulatory matters that relate to Ameriprise Financial and its affiliates. Copies of these filings may be obtained by accessing the SEC website at www.sec.gov.
There can be no assurance that these matters, or the adverse publicity associated with them, will not result in increased fund redemptions, reduced sale of fund shares or other adverse consequences to the Funds. Further, although we believe proceedings are not likely to have a material adverse effect on the Funds or the ability of Ameriprise Financial or its affiliates to perform under their contracts with the Funds, these proceedings are subject to uncertainties and, as such, we are unable to estimate the possible loss or range of loss that may result. An adverse outcome in one or more of these proceedings could result in adverse judgments, settlements, fines, penalties or other relief that could have a material adverse effect on the consolidated financial condition or results of operations of Ameriprise Financial.
Semiannual Report 2016
33
COLUMBIA DIVERSIFIED EQUITY INCOME FUND
APPROVAL OF MANAGEMENT AGREEMENT
Columbia Management Investment Advisers, LLC (Columbia Threadneedle or the Investment Manager, and together with its domestic and global affiliates, Columbia Threadneedle Investments), a wholly-owned subsidiary of Ameriprise Financial, Inc. (Ameriprise Financial), serves as the investment manager to Columbia Diversified Equity Income Fund (the Fund). Under a management agreement (the Management Agreement), Columbia Threadneedle provides investment advice and other services to the Fund and other funds distributed by Columbia Management Investment Distributors, Inc. (collectively, the Funds).
On an annual basis, the Fund's Board of Trustees (the Board), including the independent Board members (the Independent Trustees), considers renewal of the Management Agreement. Columbia Threadneedle prepared detailed reports for the Board and its Contracts Committee in February, March and April 2016, including reports providing the results of analyses performed by an independent organization, Broadridge Financial Solutions, Inc. (Broadridge), and a comprehensive response to items of information requested by independent legal counsel to the Independent Trustees (Independent Legal Counsel) in a letter to the Investment Manager, to assist the Board in making this determination. Many of the materials presented in February, March and April were first supplied in draft form to designated independent Board representatives, i.e., Independent Legal Counsel, the Chair of the Board and/or the Chair of the Contracts Committee, and the final materials were revised to contain information reflective of discussion and subsequent requests made by the Contracts Committee. In addition, throughout the year, the Board (or its committees) regularly meets with portfolio management teams and senior management personnel and reviews information prepared by Columbia Threadneedle addressing the services Columbia Threadneedle provides and Fund performance. The Board also accords appropriate weight to the work, deliberations and conclusions of the various committees, such as the Contracts Committee, the Investment Review Committee and the Compliance Committee in determining whether to continue the Management Agreement.
The Board, at its June 13-15, 2016 in-person Board meeting (the June Meeting), considered the renewal of the Management Agreement for an additional one-year term. At the June Meeting, Independent Legal Counsel reviewed with the Independent Trustees various factors relevant to the Board's consideration of management agreements and the Board's legal responsibilities related to such consideration. Following an analysis and discussion of the factors identified below, the Board, including all of the Independent Trustees, approved the renewal of the Management Agreement.
Nature, Extent and Quality of Services Provided by Columbia Threadneedle
The Independent Trustees analyzed various reports and presentations they had received detailing the services performed by Columbia Threadneedle, as well as its organization, expertise, resources and capabilities.
The Independent Trustees specifically considered many developments during the past year concerning the services provided by Columbia Threadneedle, including, in particular, the relatively recent change in the leadership of equity department oversight, improvements in technology research and the use of research analysts' model portfolios to highlight best ideas and improve implementation. The Independent Trustees further noted the restructured investment risk management department and its additional resources, including the new head of multi-asset investment risk. They also observed the relatively recent 5P leadership transition, and the additional staff and resources dedicated to the 5P team. The Board also noted the broad scope of services provided by Columbia Threadneedle to each Fund, including, among other services, investment, risk and compliance oversight. The Board also took into account the information it received concerning Columbia Threadneedle's ability to attract and retain key portfolio management personnel.
In connection with the Board's evaluation of the overall package of services provided by Columbia Threadneedle, the Board also considered the nature, quality and range of administrative services provided to the Fund by Columbia Threadneedle, as well as the achievements in 2015 in the performance of administrative services, and noted the various enhancements anticipated for 2016. In evaluating the quality of services provided under the Management Agreement, the Independent Trustees also took into account the organization and strength of the Fund's and its service providers' compliance programs. In addition, the Board reviewed the financial condition of Columbia Threadneedle and its affiliates and each entity's ability to carry out its responsibilities under the
Semiannual Report 2016
34
COLUMBIA DIVERSIFIED EQUITY INCOME FUND
APPROVAL OF MANAGEMENT AGREEMENT (continued)
Management Agreement and the Fund's other service agreements with affiliates of Ameriprise Financial, observing the financial strength of Ameriprise Financial, with its solid balance sheet.
The Board also discussed the acceptability of the terms of the Management Agreement (including the relatively broad scope of services required to be performed by Columbia Threadneedle), noting that no material changes are proposed from the form of agreement previously approved. They also noted the wide array of legal and compliance services provided to the Funds. It was also observed that the services being performed under the Management Agreement were of a reasonably high quality.
Based on the foregoing, and based on other information received (both oral and written, including the information on investment performance referenced below) and other considerations, the Board concluded that Columbia Threadneedle and its affiliates are in a position to continue to provide a high quality and level of services to the Fund.
Investment Performance
For purposes of evaluating the nature, extent and quality of services provided under the Management Agreement, the Board carefully reviewed the investment performance of the Fund. In this regard, the Board considered detailed reports providing the results of analyses performed by an independent organization showing, for various periods, the performance of the Fund, the performance of a benchmark index, the percentage ranking of the Fund among its comparison group and the net assets of the Fund. The Board observed that the Fund's investment performance met expectations.
Comparative Fees, Costs of Services Provided and the Profits Realized by Columbia Threadneedle and its Affiliates from their Relationships with the Fund
The Board reviewed comparative fees and the costs of services provided under the Management Agreement. The Board members considered detailed comparative information set forth in an annual report on fees and expenses, including, among other things, data (based on analyses conducted by an independent organization) showing a comparison of the Fund's expenses with median expenses paid by funds in its comparative peer universe, as well as data showing the Fund's contribution to Columbia Threadneedle's profitability. The Board reviewed the fees charged to comparable institutional or other accounts/vehicles managed by Columbia Threadneedle and discussed differences in how the products are managed and operated, noting no unreasonable differences in the levels of contractual fees.
The Board considered the reports of its independent fee consultant, JDL Consultants, LLC (JDL), which assisted in its analysis of the Funds' performance and expenses, the reasonableness of the Funds' fee rates, the reasonableness of Columbia Threadneedle's profitability, and JDL's conclusion that the management fees being charged to the Fund are reasonable. The Board accorded particular weight to the notion that the level of fees should generally reflect a rational pricing model applied consistently across the various product lines in the Fund family, while assuring that the overall fees for each Fund (with certain defined exceptions) are generally in line with the "pricing philosophy" currently in effect (i.e., that the total expense ratio of the Fund is generally no higher than the median expense ratio of funds in the comparison universe of the Fund). The Board took into account that the Fund's total expense ratio (after considering proposed expense caps/waivers) was below the peer universe's median expense ratio shown in the reports. Based on its review, the Board concluded that the Fund's management fee was fair and reasonable in light of the extent and quality of services that the Fund receives.
The Board also considered the expected profitability of Columbia Threadneedle and its affiliates in connection with Columbia Threadneedle providing management services to the Fund. In this regard, the Independent Trustees referred to their detailed analysis of the Profitability Report, discussing the profitability to Columbia Threadneedle and Ameriprise Financial from managing, operating and distributing the Funds. The Board took into account JDL's conclusion that 2015 Columbia Threadneedle profitability, relative to industry competitors, was reasonable. It also considered that in 2015 the Board had concluded that 2014 profitability was reasonable and that Columbia Threadneedle generated 2015 profitability that only slightly exceeded 2014 levels. It also took into account the indirect economic benefits flowing to Columbia Threadneedle or its affiliates in connection with managing or distributing the Funds, such as the enhanced ability to offer various other financial products to
Semiannual Report 2016
35
COLUMBIA DIVERSIFIED EQUITY INCOME FUND
APPROVAL OF MANAGEMENT AGREEMENT (continued)
Ameriprise Financial customers, soft dollar benefits and overall reputational advantages. The Board noted that the fees paid by the Fund should permit the Investment Manager to offer competitive compensation to its personnel, make necessary investments in its business and earn an appropriate profit. The Board concluded that profitability levels were reasonable.
Economies of Scale to be Realized
The Board also considered the economies of scale that might be realized by Columbia Threadneedle as the Fund grows and took note of the extent to which Fund shareholders might also benefit from such growth. In this regard, the Board took into account that management fees decline as Fund assets exceed various breakpoints, all of which have not been surpassed. The Board concluded that the breakpoints in the management fee rate schedule satisfactorily provides for the sharing of economies of scale, as they allow for adequate opportunity for shareholders to realize benefits (fee breaks) as Fund assets grow.
Based on the foregoing, the Board, including all of the Independent Trustees, concluded that the management fees were fair and reasonable in light of the extent and quality of services provided. In reaching this conclusion, no single factor was determinative. On June 15, 2016, the Board, including all of the Independent Trustees, approved the renewal of the Management Agreement.
Semiannual Report 2016
36
COLUMBIA DIVERSIFIED EQUITY INCOME FUND
IMPORTANT INFORMATION ABOUT THIS REPORT
Each fund mails one shareholder report to each shareholder address. If you would like more than one report, please call shareholder services at 800.345.6611 and additional reports will be sent to you.
The policy of the Board is to vote the proxies of the companies in which each fund holds investments consistent with the procedures as stated in the Statement of Additional Information (SAI). You may obtain a copy of the SAI without charge by calling 800.345.6611; contacting your financial intermediary; visiting investor.columbiathreadneedleus.com; or searching the website of the Securities and Exchange Commission (SEC) at sec.gov. Information regarding how each fund voted proxies relating to portfolio securities is filed with the SEC by August 31st for the most recent 12-month period ending June 30th of that year, and is available without charge by visiting investor.columbiathreadneedleus.com, or searching the website of the SEC at sec.gov.
Each fund files a complete schedule of portfolio holdings with the SEC for the first and third quarters of each fiscal year on Form N-Q. Each fund's Form N-Q is available on the SEC's website at sec.gov and may be reviewed and copied at the SEC's Public Reference Room in Washington, D.C. Information on the operation of the Public Reference Room may be obtained by calling 800.SEC.0330. Each fund's complete schedule of portfolio holdings, as filed on Form N-Q, can also be obtained without charge, upon request, by calling 800.345.6611.
Semiannual Report 2016
37
Columbia Diversified Equity Income Fund
P.O. Box 8081
Boston, MA 02266-8081

Please read and consider the investment objectives, risks, charges and expenses for any fund carefully before investing. For a prospectus and summary prospectus, which contains this and other important information about the Fund, go to investor.columbiathreadneedleus.com. The Fund is distributed by Columbia Management Investment Distributors, Inc., member FINRA, and managed by Columbia Management Investment Advisers, LLC.
Columbia Threadneedle Investments (Columbia Threadneedle) is the global brand name of the Columbia and Threadneedle group of companies.
All rights reserved. Columbia Management Investment Distributors, Inc., 225 Franklin Street, Boston, MA 02110-2804
© 2017 Columbia Management Investment Advisers, LLC.
investor.columbiathreadneedleus.com
SAR138_05_G01_(01/17)

SEMIANNUAL REPORT
November 30, 2016

COLUMBIA DIVIDEND OPPORTUNITY FUND


ABOUT COLUMBIA THREADNEEDLE INVESTMENTS
Columbia Threadneedle Investments is a leading global asset management group that provides a broad range of investment strategies and solutions for individual, institutional and corporate clients around the world.
With more than 2,000 people, including over 450 investment professionals based in North America, Europe and Asia, we manage $460 billion* of assets across developed and emerging market equities, fixed income, asset allocation solutions and alternatives. We are the 13th largest manager of long-term mutual fund assets in the U.S.** and the 4th largest manager of retail funds in the U.K.***
Our priority is the investment success of our clients. We aim to deliver the investment outcomes they expect through an investment approach that is team-based, performance-driven and risk-aware. Our culture is dynamic and interactive. By sharing our insights across asset classes and geographies, we generate richer perspectives on global, regional and local investment landscapes. The ability to exchange and debate investment ideas in a collaborative environment enriches our teams' investment processes. More importantly, it results in better informed investment decisions for our clients.
Columbia funds are distributed by Columbia Management Investment Distributors, Inc., member FINRA, and managed by Columbia Management Investment Advisers, LLC.
Columbia Threadneedle Investments (Columbia Threadneedle) is the global brand name of the Columbia and Threadneedle group of companies.
* In U.S. dollars as of June 30, 2016. Source: Ameriprise Q2 Earnings Release. Includes all assets managed by entities in the Columbia and Threadneedle group of companies. Contact us for more current data.
** Source: ICI as of June 30, 2016 for Columbia Management Investment Advisers, LLC.
*** Source: Investment Association as of March 2016 for Threadneedle Asset Management Limited.
© 2016 Columbia Management Investment Advisers, LLC. All rights reserved.
Not part of the shareholder report
 Dear Shareholders,
While emotions have run high following the outcome of the U.S. Presidential election, it remains unclear how the Trump presidency will unfold in terms of policy. We have a sense of the priorities espoused by the president-elect over the past eighteen months, but campaign priorities are not always realized and are often never pursued. What seems certain is that, while some investors have already priced expectations into the market, others have retreated, preferring instead a wait and see approach. The outcome of such behaviors appears to have created conditions ripe for ongoing market volatility.
While volatility in the financial markets can be stressful, volatility itself is not a new phenomenon. Other factors that have been at the root cause of recent volatility include uncertainty following the United Kingdom's vote to exit the European Union (Brexit), speculation around the Federal Reserve's decision to increase interest rates, divergent central bank policy and geopolitical unrest. The point is, financial markets have fluctuated for years and may be expected to continue to fluctuate — sometimes wildly. If anything, such volatility seems to be the new normal, perhaps exacerbated by access to information and development of technological tools which have enabled investors to react rapidly to real and perceived change. So what can you do?
Position your portfolio for the reality of market volatility
That there is a historical precedent for market volatility, or even an acceptance that it may persist, offers little comfort. A measured and strategic approach remains the best strategy for investors to stay on track in achieving their investment goals.
Step 1: Review your investment goals
Take this opportunity to review your investment goals and the strategies you are pursuing to achieve those goals in order to remain focused on what's important to you. It is entirely possible that your goals have changed in response either to your life situation or to changes in the market. Accept what you can't control — volatility, and focus on what you can — your investment goals and strategies.
Step 2: Reassess your risk tolerance
Sit down with your financial advisor to discuss your investment goals and strategies, as well as any changes to your tolerance for risk. Consider your investment horizon. Increased market volatility and a new investment horizon may impact the strategies that can best help you achieve your investment goals. Remember, achieving your investment goals may require a certain amount of risk. Ultimately, you must maintain vigilance in reassessing your risk tolerance and the strategies you have selected in pursuit of your investment goals, and awareness of how those strategies may react to market volatility.
Step 3: Remain calm and focus on your long-term plan
Remember, investing is about the long game. Short term events are not necessarily evidence of a longer term reality. Investors who attempt to time the market too often end up reacting to a down turn by selling low and then compounding the problem by waiting on the sidelines, ultimately missing the right opportunity to reinvest.
As long as there is a market, there will be volatility. How you respond to that volatility can make a big difference in the measure of your success as an investor. Talk to your financial advisor about how working with Columbia Threadneedle Investments may help you position your portfolio for the reality of ongoing volatility and, perhaps, even turn such volatility into investment opportunity.
Best regards,

Christopher O. Petersen
President, Columbia Funds
Investors should consider the investment objectives, risks, charges and expenses of a mutual fund carefully before investing. For a free prospectus and summary prospectus, which contains this and other important information about a fund, visit investor.columbiathreadneedleus.com. The prospectus should be read carefully before investing.
Columbia Funds are distributed by Columbia Management Investment Distributors, Inc., member FINRA, and managed by Columbia Management Investment Advisers, LLC.
© 2017 Columbia Management Investment Advisers, LLC. All rights reserved.
COLUMBIA DIVIDEND OPPORTUNITY FUND
Fund Investment Manager
Columbia Management Investment
Advisers, LLC
225 Franklin Street
Boston, MA 02110
Fund Distributor
Columbia Management Investment
Distributors, Inc.
225 Franklin Street
Boston, MA 02110
Fund Transfer Agent
Columbia Management Investment
Services Corp.
P.O. Box 8081
Boston, MA 02266-8081
For more information about any of the funds, please visit investor.columbiathreadneedleus.com or call 800.345.6611. Customer Service Representatives are available to answer your questions Monday through Friday from 8 a.m. to 7 p.m. Eastern time.
The views expressed in this report reflect the current views of the respective parties. These views are not guarantees of future performance and involve certain risks, uncertainties and assumptions that are difficult to predict, so actual outcomes and results may differ significantly from the views expressed. These views are subject to change at any time based upon economic, market or other conditions and the respective parties disclaim any responsibility to update such views. These views may not be relied on as investment advice and, because investment decisions for a Columbia fund are based on numerous factors, may not be relied on as an indication of trading intent on behalf of any particular Columbia fund. References to specific securities should not be construed as a recommendation or investment advice.
Performance Overview | | | 3 | | |
Portfolio Overview | | | 4 | | |
Understanding Your Fund's Expenses | | | 5 | | |
Portfolio of Investments | | | 6 | | |
Statement of Assets and Liabilities | | | 11 | | |
Statement of Operations | | | 14 | | |
Statement of Changes in Net Assets | | | 15 | | |
Financial Highlights | | | 18 | | |
Notes to Financial Statements | | | 29 | | |
Approval of Management Agreement | | | 38 | | |
Important Information About This Report | | | 41 | | |
COLUMBIA DIVIDEND OPPORTUNITY FUND
PERFORMANCE OVERVIEW
(Unaudited)
Performance Summary
n Columbia Dividend Opportunity Fund (the Fund) Class A shares returned 2.94% excluding sales charges for the six-month period that ended November 30, 2016.
n During the same time period, the Fund underperformed both the MSCI USA High Dividend Yield Index (Net), which returned 5.07%, and the Russell 1000 Value Index, which returned 8.63%.
Average Annual Total Returns (%) (for period ended November 30, 2016)
| | Inception | | 6 Months
Cumulative | | 1 Year | | 5 Years | | 10 Years | |
Class A | | 08/01/88 | | | | | | | | | | | | | | | | | |
Excluding sales charges | | | | | | | 2.94 | | | | 8.32 | | | | 11.20 | | | | 6.37 | | |
Including sales charges | | | | | | | -2.95 | | | | 2.06 | | | | 9.90 | | | | 5.74 | | |
Class B | | 03/20/95 | | | | | | | | | | | | | | | | | |
Excluding sales charges | | | | | | | 2.58 | | | | 7.59 | | | | 10.39 | | | | 5.57 | | |
Including sales charges | | | | | | | -2.42 | | | | 2.59 | | | | 10.12 | | | | 5.57 | | |
Class C | | 06/26/00 | | | | | | | | | | | | | | | | | |
Excluding sales charges | | | | | | | 2.50 | | | | 7.55 | | | | 10.38 | | | | 5.57 | | |
Including sales charges | | | | | | | 1.50 | | | | 6.55 | | | | 10.38 | | | | 5.57 | | |
Class I | | 03/04/04 | | | 3.12 | | | | 8.82 | | | | 11.68 | | | | 6.81 | | |
Class K | | 03/20/95 | | | 2.97 | | | | 8.49 | | | | 11.35 | | | | 6.56 | | |
Class R* | | 08/01/08 | | | 2.70 | | | | 8.06 | | | | 10.91 | | | | 6.08 | | |
Class R4* | | 11/08/12 | | | 3.02 | | | | 8.57 | | | | 11.42 | | | | 6.47 | | |
Class R5* | | 08/01/08 | | | 2.98 | | | | 8.64 | | | | 11.60 | | | | 6.70 | | |
Class W | | 12/01/06 | | | 2.82 | | | | 8.31 | | | | 11.19 | | | | 6.34 | | |
Class Y* | | 11/08/12 | | | 3.08 | | | | 8.82 | | | | 11.56 | | | | 6.54 | | |
Class Z* | | 09/27/10 | | | 3.05 | | | | 8.68 | | | | 11.49 | | | | 6.54 | | |
MSCI USA High Dividend Yield Index (Net) | | | | | | | 5.07 | | | | 11.80 | | | | 12.96 | | | | 7.00 | | |
Russell 1000 Value Index | | | | | | | 8.63 | | | | 12.02 | | | | 14.69 | | | | 5.70 | | |
Returns for Class A are shown with and without the maximum initial sales charge of 5.75%. Returns for Class B are shown with and without the applicable contingent deferred sales charge (CDSC) of 5.00% in the first year, declining to 1.00% in the sixth year and eliminated thereafter. Returns for Class C are shown with and without the 1.00% CDSC for the first year only. The Fund's other classes are not subject to sales charges and have limited eligibility. Please see the Fund's prospectus for details. Performance for different share classes will vary based on differences in sales charges and fees associated with each class. All results shown assume reinvestment of distributions during the period. Returns do not reflect the deduction of taxes that a shareholder may pay on Fund distributions or on the redemption of Fund shares. Performance results reflect the effect of any fee waivers or reimbursements of Fund expenses by Columbia Management Investment Advisers, LLC and/or any of its affiliates. Absent these fee waivers or expense reimbursement arrangements, performance results would have been lower.
The performance information shown represents past performance and is not a guarantee of future results. The investment return and principal value of your investment will fluctuate so that your shares, when redeemed, may be worth more or less than their original cost. Current performance may be lower or higher than the performance information shown. You may obtain performance information current to the most recent month-end by contacting your financial intermediary, visiting investor.columbiathreadneedleus.com or calling 800.345.6611.
*The returns shown for periods prior to the share class inception date (including returns for the Life of the Fund, if shown, which are since Fund inception) include the returns of the Fund's oldest share class. These returns are adjusted to reflect any higher class-related operating expenses of the newer share classes, as applicable. Please visit investor.columbiathreadneedleus.com/investment-products/mutual-funds/appended-performance for more information.
The MSCI USA High Dividend Yield Index (Net) is composed of those securities in the MSCI USA Index that have higher-than-average dividend yield (e.g. 30% higher than that of the MSCI USA Index), a track record of consistent dividend payments and the capacity to sustain future dividend payments. The MSCI USA Index is a free float adjusted market capitalization index that is designed to measure large- and mid-cap U.S. equity market performance.
The Russell 1000 Value Index, an unmanaged index, measures the performance of those stocks in the Russell 1000 Index with lower price-to-book ratios and lower forecasted growth values.
Indices are not available for investment, are not professionally managed and do not reflect sales charges, fees, brokerage commissions, taxes (except the MSCI USA High Dividend Yield Index (Net), which reflects reinvested dividends net of withholding taxes) or other expenses of investing. Securities in the Fund may not match those in an index.
Semiannual Report 2016
3
COLUMBIA DIVIDEND OPPORTUNITY FUND
PORTFOLIO OVERVIEW
(Unaudited)
Portfolio Management
Steve Schroll
Paul Stocking
Dean Ramos, CFA
Morningstar Style BoxTM
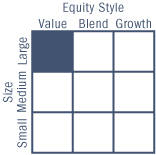
The Morningstar Style BoxTM is based on a fund's portfolio holdings. For equity funds, the vertical axis shows the market capitalization of the stocks owned, and the horizontal axis shows investment style (value, blend, or growth). Information shown is based on the most recent data provided by Morningstar.
© 2017 Morningstar, Inc. All rights reserved. The Morningstar information contained herein: (1) is proprietary to Morningstar and/or its content providers; (2) may not be copied or distributed; and (3) is not warranted to be accurate, complete or timely. Neither Morningstar nor its content providers are responsible for any damages or losses arising from any use of this information.
Top Ten Holdings (%)
(at November 30, 2016) | |
Chevron Corp. | | | 5.8 | | |
AT&T, Inc. | | | 5.8 | | |
Philip Morris International, Inc. | | | 5.5 | | |
Pfizer, Inc. | | | 4.1 | | |
Altria Group, Inc. | | | 3.9 | | |
Intel Corp. | | | 3.4 | | |
Cisco Systems, Inc. | | | 3.3 | | |
Microsoft Corp. | | | 3.3 | | |
Johnson & Johnson | | | 3.1 | | |
Occidental Petroleum Corp. | | | 2.8 | | |
Percentages indicated are based upon total investments (excluding Money Market Funds).
For further detail about these holdings, please refer to the section entitled "Portfolio of Investments."
Fund holdings are as of the date given, are subject to change at any time, and are not recommendations to buy or sell any security.
Portfolio Breakdown (%)
(at November 30, 2016) | |
Common Stocks | | | 93.5 | | |
Equity-Linked Notes | | | 5.0 | | |
Money Market Funds | | | 1.5 | | |
Total | | | 100.0 | | |
Percentages indicated are based upon total investments. The Fund's portfolio composition is subject to change.
Equity Sector Breakdown (%)
(at November 30, 2016) | |
Consumer Discretionary | | | 3.8 | | |
Consumer Staples | | | 17.2 | | |
Energy | | | 20.0 | | |
Financials | | | 6.4 | | |
Health Care | | | 11.8 | | |
Industrials | | | 3.0 | | |
Information Technology | | | 15.3 | | |
Materials | | | 4.0 | | |
Telecommunication Services | | | 9.8 | | |
Utilities | | | 8.7 | | |
Total | | | 100.0 | | |
Percentages indicated are based upon total equity investments. The Fund's portfolio composition is subject to change.
Semiannual Report 2016
4
COLUMBIA DIVIDEND OPPORTUNITY FUND
UNDERSTANDING YOUR FUND'S EXPENSES
(Unaudited)
As an investor, you incur two types of costs. There are transaction costs, which generally include sales charges on purchases and may include redemption fees. There are also ongoing costs, which generally include management fees, distribution and/or service fees, and other fund expenses. The following information is intended to help you understand your ongoing costs (in dollars) of investing in the Fund and to help you compare these costs with the ongoing costs of investing in other mutual funds.
Analyzing Your Fund's Expenses
To illustrate these ongoing costs, we have provided examples and calculated the expenses paid by investors in each share class of the Fund during the period. The actual and hypothetical information in the table is based on an initial investment of $1,000 at the beginning of the period indicated and held for the entire period. Expense information is calculated two ways and each method provides you with different information. The amount listed in the "Actual" column is calculated using the Fund's actual operating expenses and total return for the period. You may use the Actual information, together with the amount invested, to estimate the expenses that you paid over the period. Simply divide your account value by $1,000 (for example, an $8,600 account value divided by $1,000 = 8.6), then multiply the results by the expenses paid during the period under the "Actual" column. The amount listed in the "Hypothetical" column assumes a 5% annual rate of return before expenses (which is not the Fund's actual return) and then applies the Fund's actual expense ratio for the period to the hypothetical return. You should not use the hypothetical account values and expenses to estimate either your actual account balance at the end of the period or the expenses you paid during the period. See "Compare With Other Funds" below for details on how to use the hypothetical data.
Compare With Other Funds
Since all mutual funds are required to include the same hypothetical calculations about expenses in shareholder reports, you can use this information to compare the ongoing cost of investing in the Fund with other funds. To do so, compare the hypothetical example with the 5% hypothetical examples that appear in the shareholder reports of other funds. As you compare hypothetical examples of other funds, it is important to note that hypothetical examples are meant to highlight the ongoing costs of investing in a fund only and do not reflect any transaction costs, such as sales charges, or redemption or exchange fees. Therefore, the hypothetical calculations are useful in comparing ongoing costs only, and will not help you determine the relative total costs of owning different funds. If transaction costs were included in these calculations, your costs would be higher.
June 1, 2016 – November 30, 2016
| | | Account Value at the Beginning
of the Period ($) | | Account Value at the End of the
Period ($) | | Expenses Paid During the
Period ($) | | Fund's Annualized
Expense Ratio (%) | |
| | | Actual | | Hypothetical | | Actual | | Hypothetical | | Actual | | Hypothetical | | Actual | |
Class A | | | 1,000.00 | | | | 1,000.00 | | | | 1,029.40 | | | | 1,020.10 | | | | 5.04 | | | | 5.01 | | | | 0.99 | | |
Class B | | | 1,000.00 | | | | 1,000.00 | | | | 1,025.80 | | | | 1,016.34 | | | | 8.84 | | | | 8.80 | | | | 1.74 | | |
Class C | | | 1,000.00 | | | | 1,000.00 | | | | 1,025.00 | | | | 1,016.34 | | | | 8.83 | | | | 8.80 | | | | 1.74 | | |
Class I | | | 1,000.00 | | | | 1,000.00 | | | | 1,031.20 | | | | 1,021.96 | | | | 3.16 | | | | 3.14 | | | | 0.62 | | |
Class K | | | 1,000.00 | | | | 1,000.00 | | | | 1,029.70 | | | | 1,020.46 | | | | 4.68 | | | | 4.66 | | | | 0.92 | | |
Class R | | | 1,000.00 | | | | 1,000.00 | | | | 1,027.00 | | | | 1,018.85 | | | | 6.30 | | | | 6.28 | | | | 1.24 | | |
Class R4 | | | 1,000.00 | | | | 1,000.00 | | | | 1,030.20 | | | | 1,021.31 | | | | 3.82 | | | | 3.80 | | | | 0.75 | | |
Class R5 | | | 1,000.00 | | | | 1,000.00 | | | | 1,029.80 | | | | 1,021.71 | | | | 3.41 | | | | 3.40 | | | | 0.67 | | |
Class W | | | 1,000.00 | | | | 1,000.00 | | | | 1,028.20 | | | | 1,020.10 | | | | 5.03 | | | | 5.01 | | | | 0.99 | | |
Class Y | | | 1,000.00 | | | | 1,000.00 | | | | 1,030.80 | | | | 1,021.96 | | | | 3.16 | | | | 3.14 | | | | 0.62 | | |
Class Z | | | 1,000.00 | | | | 1,000.00 | | | | 1,030.50 | | | | 1,021.31 | | | | 3.82 | | | | 3.80 | | | | 0.75 | | |
Expenses paid during the period are equal to the annualized expense ratio for each class as indicated above, multiplied by the average account value over the period and then multiplied by the number of days in the Fund's most recent fiscal half year and divided by 365.
Expenses do not include fees and expenses incurred indirectly by the Fund from its investment in underlying funds, including affiliated and non-affiliated pooled investment vehicles, such as mutual funds and exchange-traded funds.
Semiannual Report 2016
5
COLUMBIA DIVIDEND OPPORTUNITY FUND
PORTFOLIO OF INVESTMENTS
November 30, 2016 (Unaudited)
(Percentages represent value of investments compared to net assets)
Common Stocks 93.5%
Issuer | | Shares | | Value ($) | |
CONSUMER DISCRETIONARY 3.5% | |
Automobiles 0.2% | |
Ford Motor Co. | | | 862,802 | | | | 10,319,112 | | |
Leisure Products 1.2% | |
Mattel, Inc. | | | 1,660,251 | | | | 52,414,124 | | |
Multiline Retail 1.7% | |
Kohl's Corp. | | | 530,951 | | | | 28,581,092 | | |
Macy's, Inc. | | | 519,172 | | | | 21,909,059 | | |
Nordstrom, Inc. | | | 351,284 | | | | 19,643,801 | | |
Total | | | | | 70,133,952 | | |
Specialty Retail 0.4% | |
Staples, Inc. | | | 1,761,430 | | | | 17,033,028 | | |
Total Consumer Discretionary | | | | | 149,900,216 | | |
CONSUMER STAPLES 16.1% | |
Food & Staples Retailing 0.6% | |
Wesfarmers Ltd. | | | 799,271 | | | | 24,610,149 | | |
Food Products 0.4% | |
Archer-Daniels-Midland Co. | | | 349,923 | | | | 15,127,171 | | |
Household Products 1.9% | |
Procter & Gamble Co. (The) | | | 978,451 | | | | 80,683,070 | | |
Tobacco 13.2% | |
Altria Group, Inc. | | | 2,533,202 | | | | 161,947,604 | | |
British American Tobacco PLC | | | 1,242,604 | | | | 68,307,749 | | |
Imperial Brands PLC | | | 1,944,698 | | | | 83,531,939 | | |
Philip Morris International, Inc. | | | 2,582,560 | | | | 227,988,397 | | |
Reynolds American, Inc. | | | 383,442 | | | | 20,744,212 | | |
Total | | | | | 562,519,901 | | |
Total Consumer Staples | | | | | 682,940,291 | | |
ENERGY 18.7% | |
Oil, Gas & Consumable Fuels 18.7% | |
| BP PLC, ADR | | | 2,665,910 | | | | 93,333,544 | | |
Chevron Corp. | | | 2,186,960 | | | | 243,977,257 | | |
Enbridge Energy Management LLC(a) | | | 1 | | | | 30 | | |
ENI SpA | | | 1,479,648 | | | | 20,606,207 | | |
Exxon Mobil Corp. | | | 1,195,221 | | | | 104,342,793 | | |
Hess Corp. | | | 89,758 | | | | 5,022,858 | | |
Occidental Petroleum Corp. | | | 1,649,266 | | | | 117,691,622 | | |
Royal Dutch Shell PLC, Class A | | | 2,326,253 | | | | 58,968,894 | | |
Common Stocks (continued)
Issuer | | Shares | | Value ($) | |
Spectra Energy Corp. | | | 781,461 | | | | 32,000,828 | | |
Suncor Energy, Inc. | | | 503,015 | | | | 16,026,058 | | |
Total SA | | | 972,285 | | | | 46,325,048 | | |
Valero Energy Corp. | | | 905,524 | | | | 55,744,057 | | |
Total | | | | | 794,039,196 | | |
Total Energy | | | | | 794,039,196 | | |
FINANCIALS 6.0% | |
Banks 3.5% | |
Bank of America Corp. | | | 1,594,911 | | | | 33,684,520 | | |
Bank of Montreal | | | 727,600 | | | | 47,919,736 | | |
JPMorgan Chase & Co. | | | 304,303 | | | | 24,395,972 | | |
PacWest Bancorp | | | 374,524 | | | | 19,194,355 | | |
Toronto-Dominion Bank (The) | | | 472,331 | | | | 22,383,766 | | |
Total | | | | | 147,578,349 | | |
Capital Markets 1.4% | |
Invesco Ltd. | | | 819,579 | | | | 25,661,019 | | |
Morgan Stanley | | | 829,909 | | | | 34,325,036 | | |
Total | | | | | 59,986,055 | | |
Insurance 1.1% | |
Principal Financial Group, Inc. | | | 779,377 | | | | 44,962,259 | | |
Total Financials | | | | | 252,526,663 | | |
HEALTH CARE 11.0% | |
Biotechnology 0.6% | |
AbbVie, Inc. | | | 433,436 | | | | 26,352,909 | | |
Pharmaceuticals 10.4% | |
GlaxoSmithKline PLC | | | 1,887,057 | | | | 35,310,025 | | |
Johnson & Johnson | | | 1,167,571 | | | | 129,950,652 | | |
Merck & Co., Inc. | | | 1,703,646 | | | | 104,246,099 | | |
Pfizer, Inc. | | | 5,347,496 | | | | 171,868,521 | | |
Total | | | | | 441,375,297 | | |
Total Health Care | | | | | 467,728,206 | | |
INDUSTRIALS 2.8% | |
Aerospace & Defense 2.2% | |
BAE Systems PLC | | | 3,502,574 | | | | 26,316,427 | | |
Lockheed Martin Corp. | | | 259,472 | | | | 68,824,948 | | |
Total | | | | | 95,141,375 | | |
The accompanying Notes to Financial Statements are an integral part of this statement.
Semiannual Report 2016
6
COLUMBIA DIVIDEND OPPORTUNITY FUND
PORTFOLIO OF INVESTMENTS (continued)
November 30, 2016 (Unaudited)
Common Stocks (continued)
Issuer | | Shares | | Value ($) | |
Road & Rail 0.6% | |
Kansas City Southern | | | 262,738 | | | | 23,307,488 | | |
Total Industrials | | | | | 118,448,863 | | |
INFORMATION TECHNOLOGY 14.4% | |
Communications Equipment 3.7% | |
Cisco Systems, Inc. | | | 4,684,740 | | | | 139,698,947 | | |
Telefonaktiebolaget LM Ericsson,
Class B | | | 3,584,722 | | | | 18,458,434 | | |
Total | | | | | 158,157,381 | | |
IT Services 1.8% | |
International Business Machines Corp. | | | 456,401 | | | | 74,037,370 | | |
Semiconductors & Semiconductor Equipment 4.2% | |
Intel Corp. | | | 4,149,882 | | | | 144,000,905 | | |
QUALCOMM, Inc. | | | 482,977 | | | | 32,905,223 | | |
Total | | | | | 176,906,128 | | |
Software 3.2% | |
Microsoft Corp. | | | 2,273,376 | | | | 136,993,638 | | |
Technology Hardware, Storage & Peripherals 1.5% | |
Seagate Technology PLC | | | 1,558,899 | | | | 62,511,850 | | |
Total Information Technology | | | | | 608,606,367 | | |
MATERIALS 3.7% | |
Chemicals 2.8% | |
Dow Chemical Co. (The) | | | 1,644,013 | | | | 91,604,404 | | |
LyondellBasell Industries NV, Class A | | | 309,311 | | | | 27,936,970 | | |
Total | | | | | 119,541,374 | | |
Containers & Packaging 0.9% | |
Graphic Packaging Holding Co. | | | 1,549,496 | | | | 19,477,165 | | |
International Paper Co. | | | 285,562 | | | | 13,912,580 | | |
WestRock Co. | | | 107,774 | | | | 5,518,029 | | |
Total | | | | | 38,907,774 | | |
Total Materials | | | | | 158,449,148 | | |
TELECOMMUNICATION SERVICES 9.2% | |
Diversified Telecommunication Services 8.4% | |
AT&T, Inc. | | | 6,240,365 | | | | 241,065,300 | | |
BCE, Inc. | | | 851,110 | | | | 36,665,819 | | |
CenturyLink, Inc. | | | 2,159,205 | | | | 50,784,501 | | |
Orange SA | | | 1,725,040 | | | | 25,148,035 | | |
Total | | | | | 353,663,655 | | |
Common Stocks (continued)
Issuer | | Shares | | Value ($) | |
Wireless Telecommunication Services 0.8% | |
Vodafone Group PLC | | | 4,596,937 | | | | 11,152,518 | | |
Vodafone Group PLC, ADR | | | 946,627 | | | | 23,135,564 | | |
Total | | | | | 34,288,082 | | |
Total Telecommunication Services | | | | | 387,951,737 | | |
UTILITIES 8.1% | |
Electric Utilities 6.3% | |
American Electric Power Co., Inc. | | | 680,618 | | | | 40,190,493 | | |
Duke Energy Corp. | | | 789,857 | | | | 58,267,751 | | |
Exelon Corp. | | | 728,003 | | | | 23,667,378 | | |
PG&E Corp. | | | 606,550 | | | | 35,665,140 | | |
PPL Corp. | | | 1,300,164 | | | | 43,503,487 | | |
Scottish & Southern Energy PLC | | | 802,555 | | | | 14,811,308 | | |
Xcel Energy, Inc. | | | 1,297,427 | | | | 50,612,627 | | |
Total | | | | | 266,718,184 | | |
Multi-Utilities 1.8% | |
Ameren Corp. | | | 880,945 | | | | 43,272,019 | | |
DTE Energy Co. | | | 378,493 | | | | 35,233,913 | | |
Total | | | | | 78,505,932 | | |
Total Utilities | | | | | 345,224,116 | | |
Total Common Stocks
(Cost: $3,437,831,270) | | | | | 3,965,814,803 | | |
Equity-Linked Notes 5.0%
Issuer | | Coupon
Rate | | Shares | | Value ($) | |
Barclays Bank PLC
(linked to common stock of Leidos Holdings, Inc.)(b)
02/08/17 | | | 11.880 | % | | | 540,132 | | | | 24,835,269 | | |
Credit Suisse AG
(linked to common stock of United Continental Holdings, Inc.)(b)
02/22/17 | | | 12.250 | % | | | 304,137 | | | | 19,218,417 | | |
Deutsche Bank AG(b)
(linked to common stock of American Airlines Group, Inc.)
02/10/17 | | | 12.500 | % | | | 430,020 | | | | 18,901,099 | | |
(linked to common stock of Anadarko Petroleum Corp.)
02/01/17 | | | 13.090 | % | | | 348,243 | | | | 22,659,476 | | |
(linked to common stock of Delta Air Lines, Inc.)
02/22/17 | | | 11.360 | % | | | 407,636 | | | | 18,743,919 | | |
(linked to common stock of Devon Energy Corp.)
02/01/17 | | | 18.410 | % | | | 535,157 | | | | 23,085,603 | | |
(linked to common stock of Eastman Chemical Co.)
02/10/17 | | | 9.800 | % | | | 197,602 | | | | 14,596,069 | | |
The accompanying Notes to Financial Statements are an integral part of this statement.
Semiannual Report 2016
7
COLUMBIA DIVIDEND OPPORTUNITY FUND
PORTFOLIO OF INVESTMENTS (continued)
November 30, 2016 (Unaudited)
Equity-Linked Notes (continued)
Issuer | | Coupon
Rate | | Shares | | Value ($) | |
JPMorgan Chase Bank NA
(linked to common stock of WestRock Co.)(b)
02/21/17 | | | 15.930 | % | | | 533,635 | | | | 26,639,059 | | |
Royal Bank of Canada
(linked to common stock of Amerada Hess Corp.)(b)
02/02/17 | | | 14.670 | % | | | 417,895 | | | | 22,662,446 | | |
Societe Generale SA
(linked to common stock of CF Industries Holdings, Inc.)(b)
02/03/17 | | | 18.760 | % | | | 690,345 | | | | 19,315,715 | | |
Total Equity-Linked Notes
(Cost: $195,386,784) | | | | | | | 210,657,072 | | |
Money Market Funds 1.5%
| | | Shares | | Value ($) | |
Columbia Short-Term Cash Fund,
0.480%(c)(d) | | | 65,264,468 | | | | 65,270,994 | | |
Total Money Market Funds
(Cost: $65,264,468) | | | | | 65,270,994 | | |
Total Investments
(Cost: $3,698,482,522) | | | | | 4,241,742,869 | | |
Other Assets & Liabilities, Net | | | | | 2,060,329 | | |
Net Assets | | | | | 4,243,803,198 | | |
Notes to Portfolio of Investments
(a) Non-income producing investment.
(b) Represents privately placed and other securities and instruments exempt from SEC registration (collectively, private placements), such as Section 4(a)(2) and Rule 144A eligible securities, which are often sold only to qualified institutional buyers. The Fund may invest in private placements determined to be liquid as well as those determined to be illiquid. Private placements may be determined to be liquid under guidelines established by the Fund's Board of Trustees. At November 30, 2016, the value of these securities amounted to $210,657,072 or 4.96% of net assets.
(c) The rate shown is the seven-day current annualized yield at November 30, 2016.
(d) As defined in the Investment Company Act of 1940, an affiliated company is one in which the Fund owns 5% or more of the company's outstanding voting securities, or a company which is under common ownership or control with the Fund. Holdings and transactions in these affiliated companies during the period ended November 30, 2016 are as follows:
Issuer | | Beginning
Cost ($) | | Purchase
Cost ($) | | Proceeds
From Sales ($) | | Realized
Gain (Loss) ($) | | Ending
Cost ($) | | Dividends —
Affiliated
Issuers ($) | | Value ($) | |
Columbia Short-Term
Cash Fund | | | 48,622,017 | | | | 1,041,946,051 | | | | (1,025,303,564 | ) | | | (36 | ) | | | 65,264,468 | | | | 179,582 | | | | 65,270,994 | | |
Abbreviation Legend
ADR American Depositary Receipt
Fair Value Measurements
The Fund categorizes its fair value measurements according to a three-level hierarchy that maximizes the use of observable inputs and minimizes the use of unobservable inputs by prioritizing that the most observable input be used when available. Observable inputs are those that market participants would use in pricing an investment based on market data obtained from sources independent of the reporting entity. Unobservable inputs are those that reflect the Fund's assumptions about the information market participants would use in pricing an investment. An investment's level within the fair value hierarchy is based on the lowest level of any input that is deemed significant to the asset's or liability's fair value measurement. The input levels are not necessarily an indication of the risk or liquidity associated with investments at that level. For example, certain U.S. government securities are generally high quality and liquid, however, they are reflected as Level 2 because the inputs used to determine fair value may not always be quoted prices in an active market.
The accompanying Notes to Financial Statements are an integral part of this statement.
Semiannual Report 2016
8
COLUMBIA DIVIDEND OPPORTUNITY FUND
PORTFOLIO OF INVESTMENTS (continued)
November 30, 2016 (Unaudited)
Fair Value Measurements (continued)
Fair value inputs are summarized in the three broad levels listed below:
> Level 1 — Valuations based on quoted prices for investments in active markets that the Fund has the ability to access at the measurement date (including NAV for open-end mutual funds). Valuation adjustments are not applied to Level 1 investments.
> Level 2 — Valuations based on other significant observable inputs (including quoted prices for similar securities, interest rates, prepayment speeds, credit risks, etc.).
> Level 3 — Valuations based on significant unobservable inputs (including the Fund's own assumptions and judgment in determining the fair value of investments).
Inputs that are used in determining fair value of an investment may include price information, credit data, volatility statistics, and other factors. These inputs can be either observable or unobservable. The availability of observable inputs can vary between investments, and is affected by various factors such as the type of investment, and the volume and level of activity for that investment or similar investments in the marketplace. The inputs will be considered by the Investment Manager, along with any other relevant factors in the calculation of an investment's fair value. The Fund uses prices and inputs that are current as of the measurement date, which may include periods of market dislocations. During these periods, the availability of prices and inputs may be reduced for many investments. This condition could cause an investment to be reclassified between the various levels within the hierarchy.
Foreign equity securities actively traded in markets where there is a significant delay in the local close relative to the New York Stock Exchange (NYSE) are classified as Level 2. The values of these securities may include an adjustment to reflect the impact of significant market movements following the close of local trading, as described in Note 2 to the financial statements — Security Valuation.
Certain investments that have been measured at fair value using the net asset value (NAV) per share (or its equivalent) are not categorized in the fair value hierarchy. The fair value amounts presented in the table are intended to reconcile the fair value hierarchy to the amounts presented in the Portfolio of Investments. The Columbia Short-Term Cash Fund seeks to provide shareholders with maximum current income consistent with liquidity and stability of principal. Columbia Short-Term Cash Fund prices its shares with a floating NAV and no longer seeks to maintain a stable NAV.
Investments falling into the Level 3 category are primarily supported by quoted prices from brokers and dealers participating in the market for those investments. However, these may be classified as Level 3 investments due to lack of market transparency and corroboration to support these quoted prices. Additionally, valuation models may be used as the pricing source for any remaining investments classified as Level 3. These models may rely on one or more significant unobservable inputs and/or significant assumptions by the Investment Manager. Inputs used in valuations may include, but are not limited to, financial statement analysis, capital account balances, discount rates and estimated cash flows, and comparable company data.
Under the direction of the Fund's Board of Trustees (the Board), the Investment Manager's Valuation Committee (the Committee) is responsible for overseeing the valuation procedures approved by the Board. The Committee consists of voting and non-voting members from various groups within the Investment Manager's organization, including operations and accounting, trading and investments, compliance, risk management and legal.
The Committee meets at least monthly to review and approve valuation matters, which may include a description of specific valuation determinations, data regarding pricing information received from approved pricing vendors and brokers and the results of Board-approved valuation control policies and procedures (the Policies). The Policies address, among other things, instances when market quotations are or are not readily available, including recommendations of third party pricing vendors and a determination of appropriate pricing methodologies; events that require specific valuation determinations and assessment of fair value techniques; securities with a potential for stale pricing, including those that are illiquid, restricted, or in default; and the effectiveness of third party pricing vendors, including periodic reviews of vendors. The Committee meets more frequently, as needed, to discuss additional valuation matters, which may include the need to review back-testing results, review time-sensitive information or approve related valuation actions. The Committee reports to the Board, with members of the Committee meeting with the Board at each of its regularly scheduled meetings to discuss valuation matters and actions during the period, similar to those described earlier.
For investments categorized as Level 3, the Committee monitors information similar to that described above, which may include: (i) data specific to the issuer or comparable issuers, (ii) general market or specific sector news and (iii) quoted prices and specific or similar security transactions. The Committee considers this data and any changes from prior periods in order to assess the reasonableness of observable and unobservable inputs, any assumptions or internal models used to value those securities and changes in fair value. This data is also used to corroborate, when available, information received from approved pricing vendors and brokers. Various factors impact the frequency of monitoring this information (which may occur as often as daily). However, the Committee may determine that changes to inputs, assumptions and models are not required as a result of the monitoring procedures performed.
The accompanying Notes to Financial Statements are an integral part of this statement.
Semiannual Report 2016
9
COLUMBIA DIVIDEND OPPORTUNITY FUND
PORTFOLIO OF INVESTMENTS (continued)
November 30, 2016 (Unaudited)
Fair Value Measurements (continued)
The following table is a summary of the inputs used to value the Fund's investments at November 30, 2016:
| | | Level 1
Quoted Prices in Active
Markets for Identical
Assets ($) | | Level 2
Other Significant
Observable Inputs ($) | | Level 3
Significant
Unobservable Inputs ($) | | Total ($) | |
Investments | |
Common Stocks | |
Consumer Discretionary | | | 149,900,216 | | | | — | | | | — | | | | 149,900,216 | | |
Consumer Staples | | | 506,490,454 | | | | 176,449,837 | | | | — | | | | 682,940,291 | | |
Energy | | | 668,139,017 | | | | 125,900,179 | | | | — | | | | 794,039,196 | | |
Financials | | | 252,526,663 | | | | — | | | | — | | | | 252,526,663 | | |
Health Care | | | 432,418,181 | | | | 35,310,025 | | | | — | | | | 467,728,206 | | |
Industrials | | | 92,132,436 | | | | 26,316,427 | | | | — | | | | 118,448,863 | | |
Information Technology | | | 590,147,933 | | | | 18,458,434 | | | | — | | | | 608,606,367 | | |
Materials | | | 158,449,148 | | | | — | | | | — | | | | 158,449,148 | | |
Telecommunication Services | | | 351,651,184 | | | | 36,300,553 | | | | — | | | | 387,951,737 | | |
Utilities | | | 330,412,808 | | | | 14,811,308 | | | | — | | | | 345,224,116 | | |
Total Common Stocks | | | 3,532,268,040 | | | | 433,546,763 | | | | — | | | | 3,965,814,803 | | |
Equity-Linked Notes | | | — | | | | 210,657,072 | | | | — | | | | 210,657,072 | | |
Investments measured at net asset value | |
Money Market Funds | | | — | | | | — | | | | — | | | | 65,270,994 | | |
Total Investments | | | 3,532,268,040 | | | | 644,203,835 | | | | — | | | | 4,241,742,869 | | |
See the Portfolio of Investments for all investment classifications not indicated in the table.
The Fund's assets assigned to the Level 2 input category are generally valued using the market approach, in which a security's value is determined through reference to prices and information from market transactions for similar or identical assets. These assets include certain foreign securities for which a third party statistical pricing service may be employed for purposes of fair market valuation. The model utilized by such third party statistical pricing service takes into account a security's correlation to available market data including, but not limited to, intraday index, ADR, and exchange-traded fund movements.
There were no transfers of financial assets between levels during the period.
The accompanying Notes to Financial Statements are an integral part of this statement.
Semiannual Report 2016
10
COLUMBIA DIVIDEND OPPORTUNITY FUND
STATEMENT OF ASSETS AND LIABILITIES
November 30, 2016 (Unaudited)
Assets | |
Investments, at value | |
Unaffiliated issuers (identified cost $3,633,218,054) | | $ | 4,176,471,875 | | |
Affiliated issuers (identified cost $65,264,468) | | | 65,270,994 | | |
Total investments (identified cost $3,698,482,522) | | | 4,241,742,869 | | |
Receivable for: | |
Investments sold | | | 15,288 | | |
Capital shares sold | | | 2,615,501 | | |
Dividends | | | 19,462,417 | | |
Foreign tax reclaims | | | 1,774,702 | | |
Prepaid expenses | | | 12,779 | | |
Other assets | | | 35,839 | | |
Total assets | | | 4,265,659,395 | | |
Liabilities | |
Payable for: | |
Investments purchased | | | 15,066,882 | | |
Capital shares purchased | | | 5,879,715 | | |
Management services fees | | | 69,652 | | |
Distribution and/or service fees | | | 30,300 | | |
Transfer agent fees | | | 451,569 | | |
Plan administration fees | | | 790 | | |
Compensation of board members | | | 192,000 | | |
Chief compliance officer expenses | | | 315 | | |
Other expenses | | | 164,974 | | |
Total liabilities | | | 21,856,197 | | |
Net assets applicable to outstanding capital stock | | $ | 4,243,803,198 | | |
Represented by | |
Paid-in capital | | $ | 3,658,869,274 | | |
Undistributed net investment income | | | 31,807,741 | | |
Accumulated net realized gain | | | 9,995,652 | | |
Unrealized appreciation (depreciation) on: | |
Investments — unaffiliated issuers | | | 543,253,821 | | |
Investments — affiliated issuers | | | 6,526 | | |
Foreign currency translations | | | (129,816 | ) | |
Total — representing net assets applicable to outstanding capital stock | | $ | 4,243,803,198 | | |
The accompanying Notes to Financial Statements are an integral part of this statement.
Semiannual Report 2016
11
COLUMBIA DIVIDEND OPPORTUNITY FUND
STATEMENT OF ASSETS AND LIABILITIES (continued)
November 30, 2016 (Unaudited)
Class A | |
Net assets | | $ | 2,686,054,088 | | |
Shares outstanding | | | 287,879,696 | | |
Net asset value per share | | $ | 9.33 | | |
Maximum offering price per share(a) | | $ | 9.90 | | |
Class B | |
Net assets | | $ | 8,287,264 | | |
Shares outstanding | | | 897,345 | | |
Net asset value per share | | $ | 9.24 | | |
Class C | |
Net assets | | $ | 405,228,514 | | |
Shares outstanding | | | 44,322,825 | | |
Net asset value per share | | $ | 9.14 | | |
Class I | |
Net assets | | $ | 49,129,145 | | |
Shares outstanding | | | 5,237,381 | | |
Net asset value per share | | $ | 9.38 | | |
Class K | |
Net assets | | $ | 3,550,161 | | |
Shares outstanding | | | 378,637 | | |
Net asset value per share | | $ | 9.38 | | |
Class R | |
Net assets | | $ | 41,976,446 | | |
Shares outstanding | | | 4,502,536 | | |
Net asset value per share | | $ | 9.32 | | |
Class R4 | |
Net assets | | $ | 105,967,773 | | |
Shares outstanding | | | 11,180,252 | | |
Net asset value per share | | $ | 9.48 | | |
Class R5 | |
Net assets | | $ | 239,749,091 | | |
Shares outstanding | | | 25,547,959 | | |
Net asset value per share | | $ | 9.38 | | |
Class W | |
Net assets | | $ | 72,015 | | |
Shares outstanding | | | 7,706 | | |
Net asset value per share(b) | | $ | 9.34 | | |
The accompanying Notes to Financial Statements are an integral part of this statement.
Semiannual Report 2016
12
COLUMBIA DIVIDEND OPPORTUNITY FUND
STATEMENT OF ASSETS AND LIABILITIES (continued)
November 30, 2016 (Unaudited)
Class Y | |
Net assets | | $ | 71,534,306 | | |
Shares outstanding | | | 7,530,982 | | |
Net asset value per share | | $ | 9.50 | | |
Class Z | |
Net assets | | $ | 632,254,395 | | |
Shares outstanding | | | 67,499,568 | | |
Net asset value per share | | $ | 9.37 | | |
(a) The maximum offering price per share is calculated by dividing the net asset value per share by 1.0 minus the maximum sales charge of 5.75%.
(b) Net asset value per share rounds to this amount due to fractional shares outstanding.
The accompanying Notes to Financial Statements are an integral part of this statement.
Semiannual Report 2016
13
COLUMBIA DIVIDEND OPPORTUNITY FUND
STATEMENT OF OPERATIONS
Six Months Ended November 30, 2016 (Unaudited)
Net investment income | |
Income: | |
Dividends — unaffiliated issuers | | $ | 86,395,170 | | |
Dividends — affiliated issuers | | | 179,582 | | |
Interest | | | 14,002,251 | | |
Foreign taxes withheld | | | (1,294,067 | ) | |
Total income | | | 99,282,936 | | |
Expenses: | |
Management services fees | | | 13,049,810 | | |
Distribution and/or service fees | |
Class A | | | 3,486,742 | | |
Class B | | | 48,447 | | |
Class C | | | 2,085,486 | | |
Class R | | | 100,974 | | |
Class W | | | 95 | | |
Transfer agent fees | |
Class A | | | 1,773,028 | | |
Class B | | | 6,174 | | |
Class C | | | 265,122 | | |
Class K | | | 966 | | |
Class R | | | 25,630 | | |
Class R4 | | | 68,724 | | |
Class R5 | | | 59,286 | | |
Class W | | | 49 | | |
Class Z | | | 401,510 | | |
Plan administration fees | |
Class K | | | 4,819 | | |
Compensation of board members | | | 40,827 | | |
Custodian fees | | | 41,547 | | |
Printing and postage fees | | | 180,231 | | |
Registration fees | | | 92,182 | | |
Audit fees | | | 30,655 | | |
Legal fees | | | 25,883 | | |
Chief compliance officer expenses | | | 315 | | |
Other | | | 74,032 | | |
Total expenses | | | 21,862,534 | | |
Expense reductions | | | (40 | ) | |
Total net expenses | | | 21,862,494 | | |
Net investment income | | | 77,420,442 | | |
Realized and unrealized gain (loss) — net | |
Net realized gain (loss) on: | |
Investments — unaffiliated issuers | | | 83,464,131 | | |
Investments — affiliated issuers | | | (36 | ) | |
Foreign currency translations | | | 70,525 | | |
Forward foreign currency exchange contracts | | | 10,874,177 | | |
Net realized gain | | | 94,408,797 | | |
Net change in unrealized appreciation (depreciation) on: | |
Investments — unaffiliated issuers | | | (45,377,242 | ) | |
Investments — affiliated issuers | | | 6,526 | | |
Foreign currency translations | | | (41,351 | ) | |
Net change in unrealized depreciation | | | (45,412,067 | ) | |
Net realized and unrealized gain | | | 48,996,730 | | |
Net increase in net assets resulting from operations | | $ | 126,417,172 | | |
The accompanying Notes to Financial Statements are an integral part of this statement.
Semiannual Report 2016
14
COLUMBIA DIVIDEND OPPORTUNITY FUND
STATEMENT OF CHANGES IN NET ASSETS
| | | Six Months Ended
November 30, 2016
(Unaudited) | | Year Ended
May 31,
2016 | |
Operations | |
Net investment income | | $ | 77,420,442 | | | $ | 169,756,491 | | |
Net realized gain (loss) | | | 94,408,797 | | | | (75,291,863 | ) | |
Net change in unrealized depreciation | | | (45,412,067 | ) | | | (60,757,890 | ) | |
Net increase in net assets resulting from operations | | | 126,417,172 | | | | 33,706,738 | | |
Distributions to shareholders | |
Net investment income | |
Class A | | | (51,190,348 | ) | | | (113,581,447 | ) | |
Class B | | | (145,769 | ) | | | (459,219 | ) | |
Class C | | | (6,208,004 | ) | | | (12,054,620 | ) | |
Class I | | | (1,146,666 | ) | | | (5,144,509 | ) | |
Class K | | | (78,558 | ) | | | (166,963 | ) | |
Class R | | | (684,095 | ) | | | (1,174,947 | ) | |
Class R4 | | | (2,065,332 | ) | | | (4,912,593 | ) | |
Class R5 | | | (4,776,746 | ) | | | (8,532,895 | ) | |
Class W | | | (1,401 | ) | | | (3,240 | ) | |
Class Y | | | (1,362,906 | ) | | | (2,327,437 | ) | |
Class Z | | | (12,278,265 | ) | | | (26,691,508 | ) | |
Net realized gains | |
Class A | | | — | | | | (63,099,606 | ) | |
Class B | | | — | | | | (301,813 | ) | |
Class C | | | — | | | | (8,673,788 | ) | |
Class I | | | — | | | | (2,635,664 | ) | |
Class K | | | — | | | | (94,657 | ) | |
Class R | | | — | | | | (743,037 | ) | |
Class R4 | | | — | | | | (2,407,644 | ) | |
Class R5 | | | — | | | | (4,345,419 | ) | |
Class W | | | — | | | | (1,798 | ) | |
Class Y | | | — | | | | (1,211,237 | ) | |
Class Z | | | — | | | | (13,724,645 | ) | |
Total distributions to shareholders | | | (79,938,090 | ) | | | (272,288,686 | ) | |
Decrease in net assets from capital stock activity | | | (171,885,678 | ) | | | (1,217,185,284 | ) | |
Total decrease in net assets | | | (125,406,596 | ) | | | (1,455,767,232 | ) | |
Net assets at beginning of period | | | 4,369,209,794 | | | | 5,824,977,026 | | |
Net assets at end of period | | $ | 4,243,803,198 | | | $ | 4,369,209,794 | | |
Undistributed net investment income | | $ | 31,807,741 | | | $ | 34,325,389 | | |
The accompanying Notes to Financial Statements are an integral part of this statement.
Semiannual Report 2016
15
COLUMBIA DIVIDEND OPPORTUNITY FUND
STATEMENT OF CHANGES IN NET ASSETS (continued)
| | | Six Months Ended November 30, 2016
(Unaudited) | | Year Ended May 31, 2016 | |
| | | Shares | | Dollars ($) | | Shares | | Dollars ($) | |
Capital stock activity | |
Class A shares | |
Subscriptions(a) | | | 16,888,344 | | | | 158,576,868 | | | | 35,381,035 | | | | 316,281,842 | | |
Distributions reinvested | | | 5,294,768 | | | | 49,901,909 | | | | 19,767,411 | | | | 173,008,932 | | |
Redemptions | | | (38,125,999 | ) | | | (357,743,282 | ) | | | (143,038,034 | ) | | | (1,286,334,788 | ) | |
Net decrease | | | (15,942,887 | ) | | | (149,264,505 | ) | | | (87,889,588 | ) | | | (797,044,014 | ) | |
Class B shares | |
Subscriptions | | | 22,342 | | | | 208,563 | | | | 30,638 | | | | 271,917 | | |
Distributions reinvested | | | 15,426 | | | | 144,160 | | | | 86,387 | | | | 750,960 | | |
Redemptions(a) | | | (302,559 | ) | | | (2,805,283 | ) | | | (1,594,517 | ) | | | (14,281,436 | ) | |
Net decrease | | | (264,791 | ) | | | (2,452,560 | ) | | | (1,477,492 | ) | | | (13,258,559 | ) | |
Class C shares | |
Subscriptions | | | 2,850,419 | | | | 26,246,378 | | | | 4,838,991 | | | | 42,351,346 | | |
Distributions reinvested | | | 613,416 | | | | 5,670,807 | | | | 2,193,518 | | | | 18,805,247 | | |
Redemptions | | | (4,584,428 | ) | | | (42,078,408 | ) | | | (11,430,489 | ) | | | (100,009,183 | ) | |
Net decrease | | | (1,120,593 | ) | | | (10,161,223 | ) | | | (4,397,980 | ) | | | (38,852,590 | ) | |
Class I shares | |
Subscriptions | | | — | | | | — | | | | 3,519,358 | | | | 30,761,095 | | |
Distributions reinvested | | | 121,132 | | | | 1,146,614 | | | | 882,787 | | | | 7,780,024 | | |
Redemptions | | | (4,204,093 | ) | | | (39,368,000 | ) | | | (13,308,655 | ) | | | (121,727,603 | ) | |
Net decrease | | | (4,082,961 | ) | | | (38,221,386 | ) | | | (8,906,510 | ) | | | (83,186,484 | ) | |
Class K shares | |
Subscriptions | | | 20,438 | | | | 192,469 | | | | 119,974 | | | | 1,068,348 | | |
Distributions reinvested | | | 8,298 | | | | 78,558 | | | | 29,569 | | | | 259,691 | | |
Redemptions | | | (161,740 | ) | | | (1,536,007 | ) | | | (125,526 | ) | | | (1,111,521 | ) | |
Net increase (decrease) | | | (133,004 | ) | | | (1,264,980 | ) | | | 24,017 | | | | 216,518 | | |
Class R shares | |
Subscriptions | | | 1,031,103 | | | | 9,630,748 | | | | 1,554,021 | | | | 13,914,534 | | |
Distributions reinvested | | | 67,586 | | | | 636,974 | | | | 195,163 | | | | 1,704,171 | | |
Redemptions | | | (777,835 | ) | | | (7,318,245 | ) | | | (1,377,117 | ) | | | (12,259,278 | ) | |
Net increase | | | 320,854 | | | | 2,949,477 | | | | 372,067 | | | | 3,359,427 | | |
Class R4 shares | |
Subscriptions | | | 1,519,106 | | | | 14,512,880 | | | | 10,475,241 | | | | 98,280,747 | | |
Distributions reinvested | | | 186,768 | | | | 1,786,317 | | | | 686,800 | | | | 6,103,769 | | |
Redemptions | | | (1,837,437 | ) | | | (17,473,357 | ) | | | (11,797,984 | ) | | | (106,940,651 | ) | |
Net decrease | | | (131,563 | ) | | | (1,174,160 | ) | | | (635,943 | ) | | | (2,556,135 | ) | |
The accompanying Notes to Financial Statements are an integral part of this statement.
Semiannual Report 2016
16
COLUMBIA DIVIDEND OPPORTUNITY FUND
STATEMENT OF CHANGES IN NET ASSETS (continued)
| | | Six Months Ended November 30, 2016
(Unaudited) | | Year Ended May 31, 2016 | |
| | | Shares | | Dollars ($) | | Shares | | Dollars ($) | |
Capital stock activity (continued) | |
Class R5 shares | |
Subscriptions | | | 6,114,928 | | | | 58,234,978 | | | | 12,392,645 | | | | 112,294,308 | | |
Distributions reinvested | | | 457,709 | | | | 4,336,668 | | | | 1,351,561 | | | | 11,873,715 | | |
Redemptions | | | (6,610,395 | ) | | | (62,784,959 | ) | | | (14,735,221 | ) | | | (131,295,575 | ) | |
Net decrease | | | (37,758 | ) | | | (213,313 | ) | | | (991,015 | ) | | | (7,127,552 | ) | |
Class W shares | |
Distributions reinvested | | | 144 | | | | 1,358 | | | | 560 | | | | 4,910 | | |
Redemptions | | | (690 | ) | | | (6,400 | ) | | | (4,110 | ) | | | (36,628 | ) | |
Net decrease | | | (546 | ) | | | (5,042 | ) | | | (3,550 | ) | | | (31,718 | ) | |
Class Y shares | |
Subscriptions | | | 1,106,426 | | | | 10,546,135 | | | | 2,593,530 | | | | 23,120,567 | | |
Distributions reinvested | | | 142,199 | | | | 1,362,906 | | | | 398,089 | | | | 3,538,674 | | |
Redemptions | | | (719,308 | ) | | | (6,872,933 | ) | | | (2,175,824 | ) | | | (19,894,303 | ) | |
Net increase | | | 529,317 | | | | 5,036,108 | | | | 815,795 | | | | 6,764,938 | | |
Class Z shares | |
Subscriptions | | | 13,994,761 | | | | 131,533,363 | | | | 15,249,835 | | | | 136,726,901 | | |
Distributions reinvested | | | 1,131,722 | | | | 10,699,331 | | | | 3,859,423 | | | | 33,933,358 | | |
Redemptions | | | (12,668,721 | ) | | | (119,346,788 | ) | | | (50,529,246 | ) | | | (456,129,374 | ) | |
Net increase (decrease) | | | 2,457,762 | | | | 22,885,906 | | | | (31,419,988 | ) | | | (285,469,115 | ) | |
Total net decrease | | | (18,406,170 | ) | | | (171,885,678 | ) | | | (134,510,187 | ) | | | (1,217,185,284 | ) | |
(a) Includes conversions of Class B shares to Class A shares, if any.
The accompanying Notes to Financial Statements are an integral part of this statement.
Semiannual Report 2016
17
COLUMBIA DIVIDEND OPPORTUNITY FUND
The following tables are intended to help you understand the Fund's financial performance. Certain information reflects financial results for a single share of a class held for the periods shown. Per share net investment income (loss) amounts are calculated based on average shares outstanding during the period. Total return assumes reinvestment of all dividends and distributions, if any. Total return does not reflect payment of sales charges, if any. Total return and portfolio turnover are not annualized for periods of less than one year. The portfolio turnover rate is calculated without regard to purchase and sales transactions of short-term instruments and certain derivatives, if any. If such transactions were included, the Fund's portfolio turnover rate may be higher.
| | | Six Months Ended
November 30, 2016 | | Year Ended May 31, | | Year Ended
June 30, | |
Class A | | (Unaudited) | | 2016 | | 2015 | | 2014 | | 2013 | | 2012(a) | | 2011 | |
Per share data | |
Net asset value,
beginning of period | | $ | 9.23 | | | $ | 9.58 | | | $ | 10.67 | | | $ | 9.83 | | | $ | 8.14 | | | $ | 8.31 | | | $ | 6.31 | | |
Income from
investment
operations: | |
Net investment
income | | | 0.17 | | | | 0.32 | | | | 0.31 | | | | 0.28 | | | | 0.30 | | | | 0.26 | | | | 0.31 | | |
Net realized and
unrealized
gain (loss) | | | 0.10 | | | | (0.16 | ) | | | 0.23 | | | | 1.34 | | | | 1.69 | | | | (0.22 | ) | | | 1.98 | | |
Total from
investment
operations | | | 0.27 | | | | 0.16 | | | | 0.54 | | | | 1.62 | | | | 1.99 | | | | 0.04 | | | | 2.29 | | |
Less distributions
to shareholders: | |
Net investment
income | | | (0.17 | ) | | | (0.32 | ) | | | (0.29 | ) | | | (0.28 | ) | | | (0.30 | ) | | | (0.21 | ) | | | (0.29 | ) | |
Net realized
gains | | | — | | | | (0.19 | ) | | | (1.34 | ) | | | (0.50 | ) | | | — | | | | — | | | | — | | |
Total distributions
to shareholders | | | (0.17 | ) | | | (0.51 | ) | | | (1.63 | ) | | | (0.78 | ) | | | (0.30 | ) | | | (0.21 | ) | | | (0.29 | ) | |
Net asset value,
end of period | | $ | 9.33 | | | $ | 9.23 | | | $ | 9.58 | | | $ | 10.67 | | | $ | 9.83 | | | $ | 8.14 | | | $ | 8.31 | | |
Total return | | | 2.94 | % | | | 2.08 | % | | | 5.82 | % | | | 17.30 | % | | | 25.05 | % | | | 0.58 | % | | | 36.74 | % | |
Ratios to average
net assets(b) | |
Total gross
expenses | | | 0.99 | %(c) | | | 1.01 | %(d) | | | 1.00 | % | | | 1.01 | % | | | 1.05 | % | | | 1.08 | %(c) | | | 1.16 | % | |
Total net expenses(e) | | | 0.99 | %(c)(f) | | | 1.01 | %(d)(f) | | | 1.00 | %(f) | | | 1.01 | %(f) | | | 1.05 | %(f) | | | 1.08 | %(c)(f) | | | 1.16 | % | |
Net investment
income | | | 3.54 | %(c) | | | 3.53 | % | | | 3.08 | % | | | 2.75 | % | | | 3.32 | % | | | 3.49 | %(c) | | | 4.01 | % | |
Supplemental data | |
Net assets, end of
period (in thousands) | | $ | 2,686,054 | | | $ | 2,805,177 | | | $ | 3,754,040 | | | $ | 4,011,117 | | | $ | 3,705,617 | | | $ | 2,660,013 | | | $ | 1,630,280 | | |
Portfolio turnover | | | 32 | % | | | 85 | % | | | 78 | % | | | 73 | % | | | 62 | % | | | 28 | % | | | 105 | % | |
Notes to Financial Highlights
(a) For the period from July 1, 2011 to May 31, 2012. During the period, the Fund's fiscal year end was changed from June 30 to May 31.
(b) In addition to the fees and expenses that the Fund bears directly, the Fund indirectly bears a pro rata share of the fees and expenses of any other funds in which it invests. Such indirect expenses are not included in the Fund's reported expense ratios.
(c) Annualized.
(d) Ratios include line of credit interest expense which is less than 0.01%.
(e) Total net expenses include the impact of certain fee waivers/expense reimbursements made by the Investment Manager and certain of its affiliates, if applicable.
(f) The benefits derived from expense reductions had an impact of less than 0.01%.
The accompanying Notes to Financial Statements are an integral part of this statement.
Semiannual Report 2016
18
COLUMBIA DIVIDEND OPPORTUNITY FUND
FINANCIAL HIGHLIGHTS (continued)
| | | Six Months Ended
November 30, 2016 | | Year Ended May 31, | | Year Ended
June 30, | |
Class B | | (Unaudited) | | 2016 | | 2015 | | 2014 | | 2013 | | 2012(a) | | 2011 | |
Per share data | |
Net asset value, beginning of period | | $ | 9.14 | | | $ | 9.49 | | | $ | 10.58 | | | $ | 9.76 | | | $ | 8.08 | | | $ | 8.26 | | | $ | 6.27 | | |
Income from investment operations: | |
Net investment income | | | 0.13 | | | | 0.24 | | | | 0.23 | | | | 0.20 | | | | 0.23 | | | | 0.20 | | | | 0.27 | | |
Net realized and unrealized gain (loss) | | | 0.11 | | | | (0.15 | ) | | | 0.23 | | | | 1.32 | | | | 1.69 | | | | (0.22 | ) | | | 1.95 | | |
Total from investment operations | | | 0.24 | | | | 0.09 | | | | 0.46 | | | | 1.52 | | | | 1.92 | | | | (0.02 | ) | | | 2.22 | | |
Less distributions to shareholders: | |
Net investment income | | | (0.14 | ) | | | (0.25 | ) | | | (0.21 | ) | | | (0.20 | ) | | | (0.24 | ) | | | (0.16 | ) | | | (0.23 | ) | |
Net realized gains | | | — | | | | (0.19 | ) | | | (1.34 | ) | | | (0.50 | ) | | | — | | | | — | | | | — | | |
Total distributions to shareholders | | | (0.14 | ) | | | (0.44 | ) | | | (1.55 | ) | | | (0.70 | ) | | | (0.24 | ) | | | (0.16 | ) | | | (0.23 | ) | |
Net asset value, end of period | | $ | 9.24 | | | $ | 9.14 | | | $ | 9.49 | | | $ | 10.58 | | | $ | 9.76 | | | $ | 8.08 | | | $ | 8.26 | | |
Total return | | | 2.58 | % | | | 1.32 | % | | | 5.05 | % | | | 16.33 | % | | | 24.21 | % | | | (0.14 | %) | | | 35.72 | % | |
Ratios to average net assets(b) | |
Total gross expenses | | | 1.74 | %(c) | | | 1.76 | %(d) | | | 1.75 | % | | | 1.76 | % | | | 1.80 | % | | | 1.83 | %(c) | | | 1.92 | % | |
Total net expenses(e) | | | 1.74 | %(c)(f) | | | 1.76 | %(d)(f) | | | 1.75 | %(f) | | | 1.76 | %(f) | | | 1.80 | %(f) | | | 1.83 | %(c)(f) | | | 1.91 | % | |
Net investment income | | | 2.78 | %(c) | | | 2.73 | % | | | 2.29 | % | | | 1.98 | % | | | 2.58 | % | | | 2.68 | %(c) | | | 3.50 | % | |
Supplemental data | |
Net assets, end of period (in thousands) | | $ | 8,287 | | | $ | 10,622 | | | $ | 25,055 | | | $ | 39,217 | | | $ | 53,428 | | | $ | 56,776 | | | $ | 65,777 | | |
Portfolio turnover | | | 32 | % | | | 85 | % | | | 78 | % | | | 73 | % | | | 62 | % | | | 28 | % | | | 105 | % | |
Notes to Financial Highlights
(a) For the period from July 1, 2011 to May 31, 2012. During the period, the Fund's fiscal year end was changed from June 30 to May 31.
(b) In addition to the fees and expenses that the Fund bears directly, the Fund indirectly bears a pro rata share of the fees and expenses of any other funds in which it invests. Such indirect expenses are not included in the Fund's reported expense ratios.
(c) Annualized.
(d) Ratios include line of credit interest expense which is less than 0.01%.
(e) Total net expenses include the impact of certain fee waivers/expense reimbursements made by the Investment Manager and certain of its affiliates, if applicable.
(f) The benefits derived from expense reductions had an impact of less than 0.01%.
The accompanying Notes to Financial Statements are an integral part of this statement.
Semiannual Report 2016
19
COLUMBIA DIVIDEND OPPORTUNITY FUND
FINANCIAL HIGHLIGHTS (continued)
| | | Six Months Ended
November 30, 2016 | | Year Ended May 31, | | Year Ended
June 30, | |
Class C | | (Unaudited) | | 2016 | | 2015 | | 2014 | | 2013 | | 2012(a) | | 2011 | |
Per share data | |
Net asset value, beginning of period | | $ | 9.05 | | | $ | 9.40 | | | $ | 10.50 | | | $ | 9.68 | | | $ | 8.02 | | | $ | 8.22 | | | $ | 6.25 | | |
Income from investment operations: | |
Net investment income | | | 0.13 | | | | 0.25 | | | | 0.23 | | | | 0.20 | | | | 0.23 | | | | 0.20 | | | | 0.25 | | |
Net realized and unrealized gain (loss) | | | 0.10 | | | | (0.16 | ) | | | 0.22 | | | | 1.32 | | | | 1.68 | | | | (0.23 | ) | | | 1.96 | | |
Total from investment operations | | | 0.23 | | | | 0.09 | | | | 0.45 | | | | 1.52 | | | | 1.91 | | | | (0.03 | ) | | | 2.21 | | |
Less distributions to shareholders: | |
Net investment income | | | (0.14 | ) | | | (0.25 | ) | | | (0.21 | ) | | | (0.20 | ) | | | (0.25 | ) | | | (0.17 | ) | | | (0.24 | ) | |
Net realized gains | | | — | | | | (0.19 | ) | | | (1.34 | ) | | | (0.50 | ) | | | — | | | | — | | | | — | | |
Total distributions to shareholders | | | (0.14 | ) | | | (0.44 | ) | | | (1.55 | ) | | | (0.70 | ) | | | (0.25 | ) | | | (0.17 | ) | | | (0.24 | ) | |
Net asset value, end of period | | $ | 9.14 | | | $ | 9.05 | | | $ | 9.40 | | | $ | 10.50 | | | $ | 9.68 | | | $ | 8.02 | | | $ | 8.22 | | |
Total return | | | 2.50 | % | | | 1.33 | % | | | 5.00 | % | | | 16.46 | % | | | 24.25 | % | | | (0.25 | %) | | | 35.71 | % | |
Ratios to average net assets(b) | |
Total gross expenses | | | 1.74 | %(c) | | | 1.76 | %(d) | | | 1.75 | % | | | 1.76 | % | | | 1.80 | % | | | 1.84 | %(c) | | | 1.91 | % | |
Total net expenses(e) | | | 1.74 | %(c)(f) | | | 1.76 | %(d)(f) | | | 1.75 | %(f) | | | 1.76 | %(f) | | | 1.80 | %(f) | | | 1.84 | %(c)(f) | | | 1.90 | % | |
Net investment income | | | 2.79 | %(c) | | | 2.79 | % | | | 2.35 | % | | | 2.06 | % | | | 2.56 | % | | | 2.76 | %(c) | | | 3.26 | % | |
Supplemental data | |
Net assets, end of period (in thousands) | | $ | 405,229 | | | $ | 411,269 | | | $ | 468,629 | | | $ | 445,402 | | | $ | 313,275 | | | $ | 143,150 | | | $ | 52,281 | | |
Portfolio turnover | | | 32 | % | | | 85 | % | | | 78 | % | | | 73 | % | | | 62 | % | | | 28 | % | | | 105 | % | |
Notes to Financial Highlights
(a) For the period from July 1, 2011 to May 31, 2012. During the period, the Fund's fiscal year end was changed from June 30 to May 31.
(b) In addition to the fees and expenses that the Fund bears directly, the Fund indirectly bears a pro rata share of the fees and expenses of any other funds in which it invests. Such indirect expenses are not included in the Fund's reported expense ratios.
(c) Annualized.
(d) Ratios include line of credit interest expense which is less than 0.01%.
(e) Total net expenses include the impact of certain fee waivers/expense reimbursements made by the Investment Manager and certain of its affiliates, if applicable.
(f) The benefits derived from expense reductions had an impact of less than 0.01%.
The accompanying Notes to Financial Statements are an integral part of this statement.
Semiannual Report 2016
20
COLUMBIA DIVIDEND OPPORTUNITY FUND
FINANCIAL HIGHLIGHTS (continued)
| | | Six Months Ended
November 30, 2016 | | Year Ended May 31, | | Year Ended
June 30, | |
Class I | | (Unaudited) | | 2016 | | 2015 | | 2014 | | 2013 | | 2012(a) | | 2011 | |
Per share data | |
Net asset value, beginning of period | | $ | 9.28 | | | $ | 9.63 | | | $ | 10.72 | | | $ | 9.87 | | | $ | 8.17 | | | $ | 8.34 | | | $ | 6.32 | | |
Income from investment operations: | |
Net investment income | | | 0.19 | | | | 0.35 | | | | 0.35 | | | | 0.31 | | | | 0.34 | | | | 0.29 | | | | 0.35 | | |
Net realized and unrealized gain (loss) | | | 0.10 | | | | (0.15 | ) | | | 0.23 | | | | 1.36 | | | | 1.70 | | | | (0.23 | ) | | | 1.99 | | |
Total from investment operations | | | 0.29 | | | | 0.20 | | | | 0.58 | | | | 1.67 | | | | 2.04 | | | | 0.06 | | | | 2.34 | | |
Less distributions to shareholders: | |
Net investment income | | | (0.19 | ) | | | (0.36 | ) | | | (0.33 | ) | | | (0.32 | ) | | | (0.34 | ) | | | (0.23 | ) | | | (0.32 | ) | |
Net realized gains | | | — | | | | (0.19 | ) | | | (1.34 | ) | | | (0.50 | ) | | | — | | | | — | | | | — | | |
Total distributions to shareholders | | | (0.19 | ) | | | (0.55 | ) | | | (1.67 | ) | | | (0.82 | ) | | | (0.34 | ) | | | (0.23 | ) | | | (0.32 | ) | |
Net asset value, end of period | | $ | 9.38 | | | $ | 9.28 | | | $ | 9.63 | | | $ | 10.72 | | | $ | 9.87 | | | $ | 8.17 | | | $ | 8.34 | | |
Total return | | | 3.12 | % | | | 2.49 | % | | | 6.23 | % | | | 17.83 | % | | | 25.59 | % | | | 0.90 | % | | | 37.51 | % | |
Ratios to average net assets(b) | |
Total gross expenses | | | 0.62 | %(c) | | | 0.61 | %(d) | | | 0.60 | % | | | 0.60 | % | | | 0.62 | % | | | 0.66 | %(c) | | | 0.75 | % | |
Total net expenses(e) | | | 0.62 | %(c) | | | 0.61 | %(d) | | | 0.60 | % | | | 0.60 | % | | | 0.62 | % | | | 0.66 | %(c) | | | 0.75 | % | |
Net investment income | | | 3.96 | %(c) | | | 3.89 | % | | | 3.46 | % | | | 3.08 | % | | | 3.76 | % | | | 3.90 | %(c) | | | 4.58 | % | |
Supplemental data | |
Net assets, end of period (in thousands) | | $ | 49,129 | | | $ | 86,500 | | | $ | 175,535 | | | $ | 205,817 | | | $ | 311,786 | | | $ | 306,301 | | | $ | 232,481 | | |
Portfolio turnover | | | 32 | % | | | 85 | % | | | 78 | % | | | 73 | % | | | 62 | % | | | 28 | % | | | 105 | % | |
Notes to Financial Highlights
(a) For the period from July 1, 2011 to May 31, 2012. During the period, the Fund's fiscal year end was changed from June 30 to May 31.
(b) In addition to the fees and expenses that the Fund bears directly, the Fund indirectly bears a pro rata share of the fees and expenses of any other funds in which it invests. Such indirect expenses are not included in the Fund's reported expense ratios.
(c) Annualized.
(d) Ratios include line of credit interest expense which is less than 0.01%.
(e) Total net expenses include the impact of certain fee waivers/expense reimbursements made by the Investment Manager and certain of its affiliates, if applicable.
The accompanying Notes to Financial Statements are an integral part of this statement.
Semiannual Report 2016
21
COLUMBIA DIVIDEND OPPORTUNITY FUND
FINANCIAL HIGHLIGHTS (continued)
| | | Six Months Ended
November 30, 2016 | | Year Ended May 31, | | Year Ended
June 30, | |
Class K | | (Unaudited) | | 2016 | | 2015 | | 2014 | | 2013 | | 2012(a) | | 2011 | |
Per share data | |
Net asset value,
beginning of period | | $ | 9.28 | | | $ | 9.63 | | | $ | 10.71 | | | $ | 9.87 | | | $ | 8.17 | | | $ | 8.34 | | | $ | 6.33 | | |
Income from
investment
operations: | |
Net investment
income | | | 0.17 | | | | 0.33 | | | | 0.33 | | | | 0.29 | | | | 0.31 | | | | 0.27 | | | | 0.32 | | |
Net realized and
unrealized gain (loss) | | | 0.11 | | | | (0.16 | ) | | | 0.23 | | | | 1.34 | | | | 1.71 | | | | (0.23 | ) | | | 1.99 | | |
Total from investment
operations | | | 0.28 | | | | 0.17 | | | | 0.56 | | | | 1.63 | | | | 2.02 | | | | 0.04 | | | | 2.31 | | |
Less distributions to
shareholders: | |
Net investment
income | | | (0.18 | ) | | | (0.33 | ) | | | (0.30 | ) | | | (0.29 | ) | | | (0.32 | ) | | | (0.21 | ) | | | (0.30 | ) | |
Net realized gains | | | — | | | | (0.19 | ) | | | (1.34 | ) | | | (0.50 | ) | | | — | | | | — | | | | — | | |
Total distributions to
shareholders | | | (0.18 | ) | | | (0.52 | ) | | | (1.64 | ) | | | (0.79 | ) | | | (0.32 | ) | | | (0.21 | ) | | | (0.30 | ) | |
Net asset value, end
of period | | $ | 9.38 | | | $ | 9.28 | | | $ | 9.63 | | | $ | 10.71 | | | $ | 9.87 | | | $ | 8.17 | | | $ | 8.34 | | |
Total return | | | 2.97 | % | | | 2.17 | % | | | 6.01 | % | | | 17.37 | % | | | 25.25 | % | | | 0.68 | % | | | 36.95 | % | |
Ratios to average
net assets(b) | |
Total gross expenses | | | 0.92 | %(c) | | | 0.92 | %(d) | | | 0.90 | % | | | 0.91 | % | | | 0.90 | % | | | 0.94 | %(c) | | | 1.01 | % | |
Total net expenses(e) | | | 0.92 | %(c) | | | 0.92 | %(d) | | | 0.90 | % | | | 0.91 | % | | | 0.90 | % | | | 0.94 | %(c) | | | 1.01 | % | |
Net investment
income | | | 3.66 | %(c) | | | 3.66 | % | | | 3.21 | % | | | 2.88 | % | | | 3.47 | % | | | 3.60 | %(c) | | | 4.05 | % | |
Supplemental data | |
Net assets, end of
period (in thousands) | | $ | 3,550 | | | $ | 4,746 | | | $ | 4,694 | | | $ | 4,352 | | | $ | 3,972 | | | $ | 3,656 | | | $ | 3,795 | | |
Portfolio turnover | | | 32 | % | | | 85 | % | | | 78 | % | | | 73 | % | | | 62 | % | | | 28 | % | | | 105 | % | |
Notes to Financial Highlights
(a) For the period from July 1, 2011 to May 31, 2012. During the period, the Fund's fiscal year end was changed from June 30 to May 31.
(b) In addition to the fees and expenses that the Fund bears directly, the Fund indirectly bears a pro rata share of the fees and expenses of any other funds in which it invests. Such indirect expenses are not included in the Fund's reported expense ratios.
(c) Annualized.
(d) Ratios include line of credit interest expense which is less than 0.01%.
(e) Total net expenses include the impact of certain fee waivers/expense reimbursements made by the Investment Manager and certain of its affiliates, if applicable.
The accompanying Notes to Financial Statements are an integral part of this statement.
Semiannual Report 2016
22
COLUMBIA DIVIDEND OPPORTUNITY FUND
FINANCIAL HIGHLIGHTS (continued)
| | | Six Months Ended
November 30, 2016 | | Year Ended May 31, | | Year Ended
June 30, | |
Class R | | (Unaudited) | | 2016 | | 2015 | | 2014 | | 2013 | | 2012(a) | | 2011 | |
Per share data | |
Net asset value, beginning of period | | $ | 9.23 | | | $ | 9.58 | | | $ | 10.66 | | | $ | 9.83 | | | $ | 8.14 | | | $ | 8.33 | | | $ | 6.32 | | |
Income from investment operations: | |
Net investment income | | | 0.15 | | | | 0.30 | | | | 0.29 | | | | 0.26 | | | | 0.28 | | | | 0.25 | | | | 0.29 | | |
Net realized and unrealized gain (loss) | | | 0.10 | | | | (0.16 | ) | | | 0.23 | | | | 1.32 | | | | 1.70 | | | | (0.24 | ) | | | 1.99 | | |
Total from investment operations | | | 0.25 | | | | 0.14 | | | | 0.52 | | | | 1.58 | | | | 1.98 | | | | 0.01 | | | | 2.28 | | |
Less distributions to shareholders: | |
Net investment income | | | (0.16 | ) | | | (0.30 | ) | | | (0.26 | ) | | | (0.25 | ) | | | (0.29 | ) | | | (0.20 | ) | | | (0.27 | ) | |
Net realized gains | | | — | | | | (0.19 | ) | | | (1.34 | ) | | | (0.50 | ) | | | — | | | | — | | | | — | | |
Total distributions to shareholders | | | (0.16 | ) | | | (0.49 | ) | | | (1.60 | ) | | | (0.75 | ) | | | (0.29 | ) | | | (0.20 | ) | | | (0.27 | ) | |
Net asset value, end of period | | $ | 9.32 | | | $ | 9.23 | | | $ | 9.58 | | | $ | 10.66 | | | $ | 9.83 | | | $ | 8.14 | | | $ | 8.33 | | |
Total return | | | 2.70 | % | | | 1.83 | % | | | 5.65 | % | | | 16.89 | % | | | 24.84 | % | | | 0.31 | % | | | 36.53 | % | |
Ratios to average net assets(b) | |
Total gross expenses | | | 1.24 | %(c) | | | 1.26 | %(d) | | | 1.25 | % | | | 1.26 | % | | | 1.30 | % | | | 1.32 | %(c) | | | 1.42 | % | |
Total net expenses(e) | | | 1.24 | %(c)(f) | | | 1.26 | %(d)(f) | | | 1.25 | %(f) | | | 1.26 | %(f) | | | 1.30 | %(f) | | | 1.32 | %(c)(f) | | | 1.42 | % | |
Net investment income | | | 3.29 | %(c) | | | 3.31 | % | | | 2.87 | % | | | 2.61 | % | | | 3.05 | % | | | 3.36 | %(c) | | | 3.79 | % | |
Supplemental data | |
Net assets, end of period (in thousands) | | $ | 41,976 | | | $ | 38,578 | | | $ | 36,480 | | | $ | 31,544 | | | $ | 17,375 | | | $ | 5,365 | | | $ | 464 | | |
Portfolio turnover | | | 32 | % | | | 85 | % | | | 78 | % | | | 73 | % | | | 62 | % | | | 28 | % | | | 105 | % | |
Notes to Financial Highlights
(a) For the period from July 1, 2011 to May 31, 2012. During the period, the Fund's fiscal year end was changed from June 30 to May 31.
(b) In addition to the fees and expenses that the Fund bears directly, the Fund indirectly bears a pro rata share of the fees and expenses of any other funds in which it invests. Such indirect expenses are not included in the Fund's reported expense ratios.
(c) Annualized.
(d) Ratios include line of credit interest expense which is less than 0.01%.
(e) Total net expenses include the impact of certain fee waivers/expense reimbursements made by the Investment Manager and certain of its affiliates, if applicable.
(f) The benefits derived from expense reductions had an impact of less than 0.01%.
The accompanying Notes to Financial Statements are an integral part of this statement.
Semiannual Report 2016
23
COLUMBIA DIVIDEND OPPORTUNITY FUND
FINANCIAL HIGHLIGHTS (continued)
| | | Six Months Ended
November 30, 2016 | | Year Ended May 31, | |
Class R4 | | (Unaudited) | | 2016 | | 2015 | | 2014 | | 2013(a) | |
Per share data | |
Net asset value, beginning of period | | $ | 9.38 | | | $ | 9.73 | | | $ | 10.81 | | | $ | 9.95 | | | $ | 8.62 | | |
Income from investment operations: | |
Net investment income | | | 0.18 | | | | 0.35 | | | | 0.35 | | | | 0.33 | | | | 0.20 | | |
Net realized and unrealized gain (loss) | | | 0.10 | | | | (0.17 | ) | | | 0.23 | | | | 1.33 | | | | 1.31 | | |
Total from investment operations | | | 0.28 | | | | 0.18 | | | | 0.58 | | | | 1.66 | | | | 1.51 | | |
Less distributions to shareholders: | |
Net investment income | | | (0.18 | ) | | | (0.34 | ) | | | (0.32 | ) | | | (0.30 | ) | | | (0.18 | ) | |
Net realized gains | | | — | | | | (0.19 | ) | | | (1.34 | ) | | | (0.50 | ) | | | — | | |
Total distributions to shareholders | | | (0.18 | ) | | | (0.53 | ) | | | (1.66 | ) | | | (0.80 | ) | | | (0.18 | ) | |
Net asset value, end of period | | $ | 9.48 | | | $ | 9.38 | | | $ | 9.73 | | | $ | 10.81 | | | $ | 9.95 | | |
Total return | | | 3.02 | % | | | 2.31 | % | | | 6.11 | % | | | 17.57 | % | | | 17.71 | % | |
Ratios to average net assets(b) | |
Total gross expenses | | | 0.75 | %(c) | | | 0.76 | %(d) | | | 0.75 | % | | | 0.77 | % | | | 0.83 | %(c) | |
Total net expenses(e) | | | 0.75 | %(c)(f) | | | 0.76 | %(d)(f) | | | 0.75 | %(f) | | | 0.77 | %(f) | | | 0.83 | %(c) | |
Net investment income | | | 3.79 | %(c) | | | 3.78 | % | | | 3.39 | % | | | 3.23 | % | | | 3.64 | %(c) | |
Supplemental data | |
Net assets, end of period (in thousands) | | $ | 105,968 | | | $ | 106,063 | | | $ | 116,211 | | | $ | 79,510 | | | $ | 12,222 | | |
Portfolio turnover | | | 32 | % | | | 85 | % | | | 78 | % | | | 73 | % | | | 62 | % | |
Notes to Financial Highlights
(a) Based on operations from November 8, 2012 (commencement of operations) through the stated period end.
(b) In addition to the fees and expenses that the Fund bears directly, the Fund indirectly bears a pro rata share of the fees and expenses of any other funds in which it invests. Such indirect expenses are not included in the Fund's reported expense ratios.
(c) Annualized.
(d) Ratios include line of credit interest expense which is less than 0.01%.
(e) Total net expenses include the impact of certain fee waivers/expense reimbursements made by the Investment Manager and certain of its affiliates, if applicable.
(f) The benefits derived from expense reductions had an impact of less than 0.01%.
The accompanying Notes to Financial Statements are an integral part of this statement.
Semiannual Report 2016
24
COLUMBIA DIVIDEND OPPORTUNITY FUND
FINANCIAL HIGHLIGHTS (continued)
| | | Six Months Ended
November 30, 2016 | | Year Ended May 31, | | Year Ended
June 30, | |
Class R5 | | (Unaudited) | | 2016 | | 2015 | | 2014 | | 2013 | | 2012(a) | | 2011 | |
Per share data | |
Net asset value, beginning of period | | $ | 9.29 | | | $ | 9.64 | | | $ | 10.72 | | | $ | 9.88 | | | $ | 8.17 | | | $ | 8.34 | | | $ | 6.33 | | |
Income from investment operations: | |
Net investment income | | | 0.18 | | | | 0.35 | | | | 0.35 | | | | 0.32 | | | | 0.33 | | | | 0.29 | | | | 0.32 | | |
Net realized and unrealized gain (loss) | | | 0.10 | | | | (0.16 | ) | | | 0.24 | | | | 1.34 | | | | 1.72 | | | | (0.23 | ) | | | 2.01 | | |
Total from investment operations | | | 0.28 | | | | 0.19 | | | | 0.59 | | | | 1.66 | | | | 2.05 | | | | 0.06 | | | | 2.33 | | |
Less distributions to shareholders: | |
Net investment income | | | (0.19 | ) | | | (0.35 | ) | | | (0.33 | ) | | | (0.32 | ) | | | (0.34 | ) | | | (0.23 | ) | | | (0.32 | ) | |
Net realized gains | | | — | | | | (0.19 | ) | | | (1.34 | ) | | | (0.50 | ) | | | — | | | | — | | | | — | | |
Total distributions to shareholders | | | (0.19 | ) | | | (0.54 | ) | | | (1.67 | ) | | | (0.82 | ) | | | (0.34 | ) | | | (0.23 | ) | | | (0.32 | ) | |
Net asset value, end of period | | $ | 9.38 | | | $ | 9.29 | | | $ | 9.64 | | | $ | 10.72 | | | $ | 9.88 | | | $ | 8.17 | | | $ | 8.34 | | |
Total return | | | 2.98 | % | | | 2.44 | % | | | 6.29 | % | | | 17.65 | % | | | 25.68 | % | | | 0.89 | % | | | 37.27 | % | |
Ratios to average net assets(b) | |
Total gross expenses | | | 0.67 | %(c) | | | 0.67 | %(d) | | | 0.65 | % | | | 0.65 | % | | | 0.66 | % | | | 0.67 | %(c) | | | 0.75 | % | |
Total net expenses(e) | | | 0.67 | %(c) | | | 0.67 | %(d) | | | 0.65 | % | | | 0.65 | % | | | 0.66 | % | | | 0.67 | %(c) | | | 0.75 | % | |
Net investment income | | | 3.89 | %(c) | | | 3.89 | % | | | 3.41 | % | | | 3.19 | % | | | 3.52 | % | | | 3.88 | %(c) | | | 3.95 | % | |
Supplemental data | |
Net assets, end of period (in thousands) | | $ | 239,749 | | | $ | 237,565 | | | $ | 256,079 | | | $ | 310,352 | | | $ | 191,577 | | | $ | 30,819 | | | $ | 21,589 | | |
Portfolio turnover | | | 32 | % | | | 85 | % | | | 78 | % | | | 73 | % | | | 62 | % | | | 28 | % | | | 105 | % | |
Notes to Financial Highlights
(a) For the period from July 1, 2011 to May 31, 2012. During the period, the Fund's fiscal year end was changed from June 30 to May 31.
(b) In addition to the fees and expenses that the Fund bears directly, the Fund indirectly bears a pro rata share of the fees and expenses of any other funds in which it invests. Such indirect expenses are not included in the Fund's reported expense ratios.
(c) Annualized.
(d) Ratios include line of credit interest expense which is less than 0.01%.
(e) Total net expenses include the impact of certain fee waivers/expense reimbursements made by the Investment Manager and certain of its affiliates, if applicable.
The accompanying Notes to Financial Statements are an integral part of this statement.
Semiannual Report 2016
25
COLUMBIA DIVIDEND OPPORTUNITY FUND
FINANCIAL HIGHLIGHTS (continued)
| | | Six Months Ended
November 30, 2016 | | Year Ended May 31, | | Year Ended
June 30, | |
Class W | | (Unaudited) | | 2016 | | 2015 | | 2014 | | 2013 | | 2012(a) | | 2011 | |
Per share data | |
Net asset value, beginning of
period | | $ | 9.25 | | | $ | 9.60 | | | $ | 10.69 | | | $ | 9.85 | | | $ | 8.15 | | | $ | 8.33 | | | $ | 6.32 | | |
Income from investment
operations: | |
Net investment income | | | 0.17 | | | | 0.32 | | | | 0.31 | | | | 0.24 | | | | 0.30 | | | | 0.25 | | | | 0.27 | | |
Net realized and unrealized
gain (loss) | | | 0.09 | | | | (0.16 | ) | | | 0.23 | | | | 1.38 | | | | 1.71 | | | | (0.23 | ) | | | 2.04 | | |
Total from investment operations | | | 0.26 | | | | 0.16 | | | | 0.54 | | | | 1.62 | | | | 2.01 | | | | 0.02 | | | | 2.31 | | |
Less distributions to
shareholders: | |
Net investment income | | | (0.17 | ) | | | (0.32 | ) | | | (0.29 | ) | | | (0.28 | ) | | | (0.31 | ) | | | (0.20 | ) | | | (0.30 | ) | |
Net realized gains | | | — | | | | (0.19 | ) | | | (1.34 | ) | | | (0.50 | ) | | | — | | | | — | | | | — | | |
Total distributions to
shareholders | | | (0.17 | ) | | | (0.51 | ) | | | (1.63 | ) | | | (0.78 | ) | | | (0.31 | ) | | | (0.20 | ) | | | (0.30 | ) | |
Net asset value, end of period | | $ | 9.34 | | | $ | 9.25 | | | $ | 9.60 | | | $ | 10.69 | | | $ | 9.85 | | | $ | 8.15 | | | $ | 8.33 | | |
Total return | | | 2.82 | % | | | 2.08 | % | | | 5.82 | % | | | 17.28 | % | | | 25.19 | % | | | 0.38 | % | | | 36.95 | % | |
Ratios to average net assets(b) | |
Total gross expenses | | | 0.99 | %(c) | | | 1.01 | %(d) | | | 1.00 | % | | | 1.01 | % | | | 1.05 | % | | | 1.11 | %(c) | | | 1.14 | % | |
Total net expenses(e) | | | 0.99 | %(c)(f) | | | 1.01 | %(d)(f) | | | 1.00 | %(f) | | | 1.01 | %(f) | | | 1.05 | %(f) | | | 1.11 | %(c)(f) | | | 1.14 | % | |
Net investment income | | | 3.55 | %(c) | | | 3.51 | % | | | 2.99 | % | | | 2.32 | % | | | 3.27 | % | | | 3.42 | %(c) | | | 3.36 | % | |
Supplemental data | |
Net assets, end of period
(in thousands) | | $ | 72 | | | $ | 76 | | | $ | 113 | | | $ | 201 | | | $ | 128,328 | | | $ | 18,330 | | | $ | 21,260 | | |
Portfolio turnover | | | 32 | % | | | 85 | % | | | 78 | % | | | 73 | % | | | 62 | % | | | 28 | % | | | 105 | % | |
Notes to Financial Highlights
(a) For the period from July 1, 2011 to May 31, 2012. During the period, the Fund's fiscal year end was changed from June 30 to May 31.
(b) In addition to the fees and expenses that the Fund bears directly, the Fund indirectly bears a pro rata share of the fees and expenses of any other funds in which it invests. Such indirect expenses are not included in the Fund's reported expense ratios.
(c) Annualized.
(d) Ratios include line of credit interest expense which is less than 0.01%.
(e) Total net expenses include the impact of certain fee waivers/expense reimbursements made by the Investment Manager and certain of its affiliates, if applicable.
(f) The benefits derived from expense reductions had an impact of less than 0.01%.
The accompanying Notes to Financial Statements are an integral part of this statement.
Semiannual Report 2016
26
COLUMBIA DIVIDEND OPPORTUNITY FUND
FINANCIAL HIGHLIGHTS (continued)
| | | Six Months Ended
November 30, 2016 | | Year Ended May 31, | |
Class Y | | (Unaudited) | | 2016 | | 2015 | | 2014 | | 2013(a) | |
Per share data | |
Net asset value, beginning of period | | $ | 9.40 | | | $ | 9.74 | | | $ | 10.83 | | | $ | 9.96 | | | $ | 8.63 | | |
Income from investment operations: | |
Net investment income | | | 0.19 | | | | 0.36 | | | | 0.36 | | | | 0.34 | | | | 0.22 | | |
Net realized and unrealized gain (loss) | | | 0.10 | | | | (0.15 | ) | | | 0.22 | | | | 1.35 | | | | 1.29 | | |
Total from investment operations | | | 0.29 | | | | 0.21 | | | | 0.58 | | | | 1.69 | | | | 1.51 | | |
Less distributions to shareholders: | |
Net investment income | | | (0.19 | ) | | | (0.36 | ) | | | (0.33 | ) | | | (0.32 | ) | | | (0.18 | ) | |
Net realized gains | | | — | | | | (0.19 | ) | | | (1.34 | ) | | | (0.50 | ) | | | — | | |
Total distributions to shareholders | | | (0.19 | ) | | | (0.55 | ) | | | (1.67 | ) | | | (0.82 | ) | | | (0.18 | ) | |
Net asset value, end of period | | $ | 9.50 | | | $ | 9.40 | | | $ | 9.74 | | | $ | 10.83 | | | $ | 9.96 | | |
Total return | | | 3.08 | % | | | 2.56 | % | | | 6.17 | % | | | 17.84 | % | | | 17.73 | % | |
Ratios to average net assets(b) | |
Total gross expenses | | | 0.62 | %(c) | | | 0.62 | %(d) | | | 0.60 | % | | | 0.61 | % | | | 0.71 | %(c) | |
Total net expenses(e) | | | 0.62 | %(c) | | | 0.62 | %(d) | | | 0.60 | % | | | 0.61 | % | | | 0.71 | %(c) | |
Net investment income | | | 3.92 | %(c) | | | 3.97 | % | | | 3.54 | % | | | 3.29 | % | | | 4.13 | %(c) | |
Supplemental data | |
Net assets, end of period (in thousands) | | $ | 71,534 | | | $ | 65,791 | | | $ | 60,275 | | | $ | 38,342 | | | $ | 4,064 | | |
Portfolio turnover | | | 32 | % | | | 85 | % | | | 78 | % | | | 73 | % | | | 62 | % | |
Notes to Financial Highlights
(a) Based on operations from November 8, 2012 (commencement of operations) through the stated period end.
(b) In addition to the fees and expenses that the Fund bears directly, the Fund indirectly bears a pro rata share of the fees and expenses of any other funds in which it invests. Such indirect expenses are not included in the Fund's reported expense ratios.
(c) Annualized.
(d) Ratios include line of credit interest expense which is less than 0.01%.
(e) Total net expenses include the impact of certain fee waivers/expense reimbursements made by the Investment Manager and certain of its affiliates, if applicable.
The accompanying Notes to Financial Statements are an integral part of this statement.
Semiannual Report 2016
27
COLUMBIA DIVIDEND OPPORTUNITY FUND
FINANCIAL HIGHLIGHTS (continued)
| | | Six Months Ended
November 30, 2016 | | Year Ended May 31, | | Year Ended
June 30, | |
Class Z | | (Unaudited) | | 2016 | | 2015 | | 2014 | | 2013 | | 2012(a) | | 2011(b) | |
Per share data | |
Net asset value, beginning of
period | | $ | 9.27 | | | $ | 9.62 | | | $ | 10.71 | | | $ | 9.86 | | | $ | 8.16 | | | $ | 8.34 | | | $ | 7.20 | | |
Income from investment
operations: | |
Net investment income | | | 0.18 | | | | 0.34 | | | | 0.34 | | | | 0.30 | | | | 0.32 | | | | 0.28 | | | | 0.24 | | |
Net realized and unrealized
gain (loss) | | | 0.10 | | | | (0.16 | ) | | | 0.23 | | | | 1.35 | | | | 1.71 | | | | (0.24 | ) | | | 1.14 | | |
Total from investment operations | | | 0.28 | | | | 0.18 | | | | 0.57 | | | | 1.65 | | | | 2.03 | | | | 0.04 | | | | 1.38 | | |
Less distributions to
shareholders: | |
Net investment income | | | (0.18 | ) | | | (0.34 | ) | | | (0.32 | ) | | | (0.30 | ) | | | (0.33 | ) | | | (0.22 | ) | | | (0.24 | ) | |
Net realized gains | | | — | | | | (0.19 | ) | | | (1.34 | ) | | | (0.50 | ) | | | — | | | | — | | | | — | | |
Total distributions to
shareholders | | | (0.18 | ) | | | (0.53 | ) | | | (1.66 | ) | | | (0.80 | ) | | | (0.33 | ) | | | (0.22 | ) | | | (0.24 | ) | |
Net asset value, end of period | | $ | 9.37 | | | $ | 9.27 | | | $ | 9.62 | | | $ | 10.71 | | | $ | 9.86 | | | $ | 8.16 | | | $ | 8.34 | | |
Total return | | | 3.05 | % | | | 2.34 | % | | | 6.07 | % | | | 17.65 | % | | | 25.42 | % | | | 0.65 | % | | | 19.28 | % | |
Ratios to average net assets(c) | |
Total gross expenses | | | 0.75 | %(d) | | | 0.76 | %(e) | | | 0.75 | % | | | 0.76 | % | | | 0.80 | % | | | 0.84 | %(d) | | | 0.87 | %(d) | |
Total net expenses(f) | | | 0.75 | %(d)(g) | | | 0.76 | %(e)(g) | | | 0.75 | %(g) | | | 0.76 | %(g) | | | 0.80 | %(g) | | | 0.84 | %(d)(g) | | | 0.87 | %(d) | |
Net investment income | | | 3.79 | %(d) | | | 3.76 | % | | | 3.33 | % | | | 3.00 | % | | | 3.58 | % | | | 3.79 | %(d) | | | 3.98 | %(d) | |
Supplemental data | |
Net assets, end of period
(in thousands) | | $ | 632,254 | | | $ | 602,822 | | | $ | 927,865 | | | $ | 1,022,666 | | | $ | 1,069,240 | | | $ | 671,036 | | | $ | 138,659 | | |
Portfolio turnover | | | 32 | % | | | 85 | % | | | 78 | % | | | 73 | % | | | 62 | % | | | 28 | % | | | 105 | % | |
Notes to Financial Highlights
(a) For the period from July 1, 2011 to May 31, 2012. During the period, the Fund's fiscal year end was changed from June 30 to May 31.
(b) Based on operations from September 27, 2010 (commencement of operations) through the stated period end.
(c) In addition to the fees and expenses that the Fund bears directly, the Fund indirectly bears a pro rata share of the fees and expenses of any other funds in which it invests. Such indirect expenses are not included in the Fund's reported expense ratios.
(d) Annualized.
(e) Ratios include line of credit interest expense which is less than 0.01%.
(f) Total net expenses include the impact of certain fee waivers/expense reimbursements made by the Investment Manager and certain of its affiliates, if applicable.
(g) The benefits derived from expense reductions had an impact of less than 0.01%.
The accompanying Notes to Financial Statements are an integral part of this statement.
Semiannual Report 2016
28
COLUMBIA DIVIDEND OPPORTUNITY FUND
NOTES TO FINANCIAL STATEMENTS
November 30, 2016 (Unaudited)
Note 1. Organization
Columbia Dividend Opportunity Fund (the Fund), a series of Columbia Funds Series Trust II (the Trust), is a diversified fund. The Trust is registered under the Investment Company Act of 1940, as amended (the 1940 Act), as an open-end management investment company organized as a Massachusetts business trust.
Fund Shares
The Trust may issue an unlimited number of shares (without par value). The Fund offers Class A, Class B, Class C, Class I, Class K, Class R, Class R4, Class R5, Class W, Class Y and Class Z shares. Although all share classes generally have identical voting, dividend and liquidation rights, each share class votes separately when required by the Trust's organizational documents or by law. Different share classes pay different distribution amounts to the extent the expenses of such share classes differ, and distributions in liquidation will be proportional to the net asset value of each share class. Each share class has its own expense and sales charge structure.
Class A shares are subject to a maximum front-end sales charge of 5.75% based on the initial investment amount. Class A shares purchased without an initial sales charge in accounts aggregating $1 million to $50 million at the time of purchase are subject to a contingent deferred sales charge (CDSC) if the shares are sold within 18 months after purchase, charged as follows: 1.00% CDSC if redeemed within 12 months after purchase, and 0.50% CDSC if redeemed more than 12, but less than 18, months after purchase.
Class B shares may be subject to a maximum CDSC of 5.00% based upon the holding period after purchase. Class B shares will generally convert to Class A shares eight years after purchase. The Fund no longer accepts investments by new or existing investors in the Fund's Class B shares, except in connection with the reinvestment of any dividend and/or capital gain distributions in Class B shares of the Fund and exchanges by existing Class B shareholders of certain other funds within the Columbia Family of Funds.
Class C shares are subject to a 1.00% CDSC on shares redeemed within 12 months after purchase.
Class I shares are not subject to sales charges and are available only to the Columbia Family of Funds.
Class K shares are not subject to sales charges, however this share class is closed to new investors.
Class R shares are not subject to sales charges and are generally available only to certain retirement plans and other investors as described in the Fund's prospectus.
Class R4 shares are not subject to sales charges and are generally available only to omnibus retirement plans and certain investors as described in the Fund's prospectus.
Class R5 shares are not subject to sales charges and are generally available only to investors purchasing through authorized investment professionals and omnibus retirement plans.
Class W shares are not subject to sales charges and are generally available only to investors purchasing through authorized investment programs managed by investment professionals, including discretionary managed account programs.
Class Y shares are not subject to sales charges and are generally available only to certain retirement plans as described in the Fund's prospectus.
Class Z shares are not subject to sales charges and are generally available only to eligible investors, which are subject to different investment minimums as described in the Fund's prospectus.
Note 2. Summary of Significant Accounting Policies
Basis of Preparation
The Fund is an investment company that applies the accounting and reporting guidance in the Financial Accounting Standards Board (FASB) Accounting Standards Codification Topic 946, Financial Services — Investment Companies (ASC 946). The financial statements are prepared in accordance with U.S. generally accepted accounting principles (GAAP), which requires management to make certain estimates and assumptions that affect the reported amounts of assets and liabilities, the disclosure of contingent assets and liabilities at the date of the financial statements and the reported amounts of income and expenses during the reporting period. Actual results could differ from those estimates.
The following is a summary of significant accounting policies followed by the Fund in the preparation of its financial statements.
Security Valuation
All equity securities are valued at the close of business of the New York Stock Exchange (NYSE). Equity securities
Semiannual Report 2016
29
COLUMBIA DIVIDEND OPPORTUNITY FUND
NOTES TO FINANCIAL STATEMENTS (continued)
November 30, 2016 (Unaudited)
are valued at the last quoted sales price on the principal exchange or market on which they trade, except for securities traded on the NASDAQ Stock Market, which are valued at the NASDAQ official close price. Unlisted securities or listed securities for which there were no sales during the day are valued at the mean of the latest quoted bid and ask prices on such exchanges or markets.
Debt securities generally are valued by pricing services approved by the Board of Trustees (the Board) based upon market transactions for normal, institutional-size trading units of similar securities. The services may use various pricing techniques that take into account, as applicable, factors such as yield, quality, coupon rate, maturity, type of issue, trading characteristics and other data, as well as approved independent broker-dealer quotes. Debt securities for which quotations are not readily available or not believed to be reflective of market value may also be valued based upon a bid quote from an approved independent broker-dealer. Debt securities maturing in 60 days or less are valued primarily at amortized cost value, unless this method results in a valuation that management believes does not approximate market value.
Foreign equity securities are valued based on the closing price on the foreign exchange in which such securities are primarily traded. If any foreign equity security closing prices are not readily available, the securities are valued at the mean of the latest quoted bid and ask prices on such exchanges or markets. Foreign currency exchange rates are generally determined at 4:00 p.m. Eastern (U.S.) time. Many securities markets and exchanges outside the U.S. close prior to the close of the NYSE; therefore, the closing prices for securities in such markets or on such exchanges may not fully reflect events that occur after such close but before the close of the NYSE. In those situations, foreign securities will be fair valued pursuant to a policy adopted by the Board, including, if available, utilizing a third party pricing service to determine these fair values. The third party pricing service takes into account multiple factors, including, but not limited to, movements in the U.S. securities markets, certain depositary receipts, futures contracts and foreign exchange rates that have occurred subsequent to the close of the foreign exchange or market, to determine a good faith estimate that reasonably reflects the current market conditions as of the close of the NYSE. The fair value of a security is likely to be different from the quoted or published price, if available.
Investments in open-end investment companies, including money market funds, are valued at their latest net asset value.
Investments for which market quotations are not readily available, or that have quotations which management believes are not reflective of market value or reliable, are valued at fair value as determined in good faith under procedures approved by and under the general supervision of the Board. If a security or class of securities (such as foreign securities) is valued at fair value, such value is likely to be different from the quoted or published price for the security.
The determination of fair value often requires significant judgment. To determine fair value, management may use assumptions including but not limited to future cash flows and estimated risk premiums. Multiple inputs from various sources may be used to determine fair value.
GAAP requires disclosure regarding the inputs and valuation techniques used to measure fair value and any changes in valuation inputs or techniques. In addition, investments shall be disclosed by major category. This information is disclosed following the Fund's Portfolio of Investments.
Foreign Currency Transactions and Translations
The values of all assets and liabilities denominated in foreign currencies are generally translated into U.S. dollars at exchange rates determined at the close of regular trading on the NYSE. Net realized and unrealized gains (losses) on foreign currency transactions and translations include gains (losses) arising from the fluctuation in exchange rates between trade and settlement dates on securities transactions, gains (losses) arising from the disposition of foreign currency and currency gains (losses) between the accrual and payment dates on dividends, interest income and foreign withholding taxes.
For financial statement purposes, the Fund does not distinguish that portion of gains (losses) on investments which is due to changes in foreign exchange rates from that which is due to changes in market prices of the investments. Such fluctuations are included with the net realized and unrealized gains (losses) on investments in the Statement of Operations.
Derivative Instruments
The Fund invests in certain derivative instruments, as detailed below, to meet its investment objectives. Derivatives are instruments whose values depend on, or are derived from, in whole or in part, the value of one or
Semiannual Report 2016
30
COLUMBIA DIVIDEND OPPORTUNITY FUND
NOTES TO FINANCIAL STATEMENTS (continued)
November 30, 2016 (Unaudited)
more securities, currencies, commodities, indices, or other assets or instruments. Derivatives may be used to increase investment flexibility (including to maintain cash reserves while maintaining desired exposure to certain assets), for risk management (hedging) purposes, to facilitate trading, to reduce transaction costs and to pursue higher investment returns. The Fund may also use derivative instruments to mitigate certain investment risks, such as foreign currency exchange rate risk, interest rate risk and credit risk. Derivatives may involve various risks, including the potential inability of the counterparty to fulfill its obligations under the terms of the contract, the potential for an illiquid secondary market (making it difficult for the Fund to sell or terminate, including at favorable prices) and the potential for market movements which may expose the Fund to gains or losses in excess of the amount shown in the Statement of Assets and Liabilities. The notional amounts of derivative instruments, if applicable, are not recorded in the financial statements.
A derivative instrument may suffer a marked-to-market loss if the value of the contract decreases due to an unfavorable change in the market rates or values of the underlying instrument. Losses can also occur if the counterparty does not perform its obligations under the contract. The Fund's risk of loss from counterparty credit risk on over-the-counter derivatives is generally limited to the aggregate unrealized gain netted against any collateral held by the Fund and the amount of any variation margin held by the counterparty, plus any replacement costs or related amounts. With exchange-traded or centrally cleared derivatives, there is reduced counterparty credit risk to the Fund since the clearinghouse or central counterparty (CCP) provides some protection in the case of clearing member default. The clearinghouse or CCP stands between the buyer and the seller of the contract; therefore, additional counterparty credit risk is failure of the clearinghouse or CCP. However, credit risk still exists in exchange-traded or centrally cleared derivatives with respect to initial and variation margin that is held in a broker's customer account. While brokers are required to segregate customer margin from their own assets, in the event that a broker becomes insolvent or goes into bankruptcy and at that time there is a shortfall in the aggregate amount of margin held by the broker for all its clients, U.S. bankruptcy laws will typically allocate that shortfall on a pro-rata basis across all the broker's customers (including the Fund), potentially resulting in losses to the Fund.
In order to better define its contractual rights and to secure rights that will help the Fund mitigate its counterparty risk, the Fund may enter into an International Swaps and Derivatives Association, Inc. Master Agreement (ISDA Master Agreement) or similar agreement with its derivatives contract counterparties. An ISDA Master Agreement is an agreement between the Fund and a counterparty that governs over-the-counter derivatives and typically contains, among other things, collateral posting terms and netting provisions in the event of a default and/or termination event. Under an ISDA Master Agreement, the Fund may, under certain circumstances, offset with the counterparty certain derivative instrument's payables and/or receivables with collateral held and/or posted and create one single net payment. The provisions of the ISDA Master Agreement typically permit a single net payment in the event of default (close-out netting), including the bankruptcy or insolvency of the counterparty. Note, however, that bankruptcy or insolvency laws of a particular jurisdiction may impose restrictions on or prohibitions against the right of offset or netting in bankruptcy, insolvency or other events.
Collateral (margin) requirements differ by type of derivative. Margin requirements are established by the clearinghouse or CCP for exchange-traded and centrally cleared derivatives. Brokers can ask for margin in excess of the minimum in certain circumstances. Collateral terms are contract specific for over-the-counter derivatives. For over-the-counter derivatives traded under an ISDA Master Agreement, the collateral requirements are typically calculated by netting the marked-to-market amount for each transaction under such agreement and comparing that amount to the value of any variation margin currently pledged by the Fund and/or the counterparty. Generally, the amount of collateral due from or to a party has to exceed a minimum transfer amount threshold (e.g., $250,000) before a transfer has to be made. To the extent amounts due to the Fund from its counterparties are not fully collateralized, contractually or otherwise, the Fund bears the risk of loss from counterparty nonperformance. The Fund attempts to mitigate counterparty risk by only entering into agreements with counterparties that it believes have the financial resources to honor their obligations and by monitoring the financial stability of those counterparties.
Certain ISDA Master Agreements allow counterparties of over-the-counter derivatives transactions to terminate derivatives contracts prior to maturity in the event the Fund's net asset value declines by a stated percentage
Semiannual Report 2016
31
COLUMBIA DIVIDEND OPPORTUNITY FUND
NOTES TO FINANCIAL STATEMENTS (continued)
November 30, 2016 (Unaudited)
over a specified time period or if the Fund fails to meet certain terms of the ISDA Master Agreement, which would cause the Fund to accelerate payment of any net liability owed to the counterparty. The Fund also has termination rights if the counterparty fails to meet certain terms of the ISDA Master Agreement. In addition to considering counterparty credit risk, the Fund would consider terminating the derivatives contracts based on whether termination would result in a net liability owed from the counterparty.
For financial reporting purposes, the Fund does not offset derivative assets and derivative liabilities that are subject to netting arrangements in the Statement of Assets and Liabilities.
Forward Foreign Currency Exchange Contracts
Forward foreign currency exchange contracts are over-the-counter agreements between two parties to buy and sell a currency at a set price on a future date. The Fund utilized forward foreign currency exchange contracts to hedge the currency exposure associated with some or all of the Fund's securities and to shift foreign currency exposure back to U.S. dollars. These instruments may be used for other purposes in future periods.
The values of forward foreign currency exchange contracts fluctuate daily with changes in foreign currency exchange rates. Changes in the value of these contracts are recorded as unrealized appreciation or depreciation until the contract is exercised or has expired. The Fund will realize a gain or loss when the forward foreign currency exchange contract is closed or expires.
The use of forward foreign currency exchange contracts does not eliminate fluctuations in the prices of the Fund's portfolio securities. The risks of forward foreign currency exchange contracts include movement in the values of the foreign currencies relative to the U.S. dollar (or other foreign currencies) and the possibility that counterparties will not complete their contractual obligations, which may be in excess of the amount reflected, if any, in the Statement of Assets and Liabilities.
Effects of Derivative Transactions in the Financial Statements
The following tables are intended to provide additional information about the effect of derivatives on the financial statements of the Fund, including: the fair value of derivatives by risk category and the location of those fair values in the Statement of Assets and Liabilities; and the impact of derivative transactions over the period
in the Statement of Operations, including realized and unrealized gains (losses). The derivative instrument schedules following the Portfolio of Investments present additional information regarding derivative instruments outstanding at the end of the period, if any.
The following table indicates the effect of derivative instruments (not considered to be hedging instruments for accounting disclosure purposes) in the Statement of Operations for the six months ended November 30, 2016:
Amount of Realized Gain (Loss) on Derivatives Recognized in Income | |
Risk Exposure Category | | Forward Foreign
Currency Exchange
Contracts ($) | |
Foreign exchange risk | | | 10,874,177 | | |
The following table provides a summary of the average outstanding volume by derivative instrument for the six months ended November 30, 2016:
Derivative Instrument | | Average unrealized
Appreciation ($)* | | Average Unrealized
Depreciation ($)* | |
Forward foreign currency
exchange contracts | | | 3,390,460 | | | | (79,216 | ) | |
*Based on the monthly outstanding amounts for the six months ended November 30, 2016.
Equity-Linked Notes
The Fund may invest in equity-linked notes (ELNs). An ELN is a debt instrument, generally valued based on a quotation received from a counterparty, which is based on the value of a single equity security, basket of equity securities or an index of equity securities (each, an Underlying Equity). An ELN typically provides interest income, thereby offering a yield advantage over investing directly in an Underlying Equity. However, the holder of an ELN may have limited or no benefit from any appreciation in the Underlying Equity, but is exposed to various risks, including, without limitation, volatility, issuer and market risk. The Fund may purchase ELNs that trade on a securities exchange or those that trade on the over-the-counter markets, including securities offered and sold under Rule 144A of the Securities Act of 1933, as amended. The Fund may also purchase an ELN in a privately negotiated transaction with the issuer of the ELN (or its broker-dealer affiliate).
Security Transactions
Security transactions are accounted for on the trade date. Cost is determined and gains (losses) are based upon the specific identification method for both financial statement and federal income tax purposes.
Semiannual Report 2016
32
COLUMBIA DIVIDEND OPPORTUNITY FUND
NOTES TO FINANCIAL STATEMENTS (continued)
November 30, 2016 (Unaudited)
Income Recognition
Interest income is recorded on an accrual basis. Market premiums and discounts, including original issue discounts, are amortized and accreted, respectively, over the expected life of the security on all debt securities, unless otherwise noted.
The Fund may place a debt security on non-accrual status and reduce related interest income when it becomes probable that the interest will not be collected and the amount of uncollectible interest can be reasonably estimated. A defaulted debt security is removed from non-accrual status when the issuer resumes interest payments or when collectibility of interest is reasonably assured.
Corporate actions and dividend income are generally recorded net of any non-reclaimable tax withholdings, on the ex-dividend date or upon receipt of ex-dividend notification in the case of certain foreign securities.
The Fund may receive distributions from holdings in equity securities, business development companies (BDCs), exchange-traded funds, other regulated investment companies (RICs), and real estate investment trusts (REITs), which report information on the tax character of their distributions annually. These distributions are allocated to dividend income, capital gain and return of capital based on actual information reported. Return of capital is recorded as a reduction of the cost basis of securities held. If the Fund no longer owns the applicable securities, return of capital is recorded as a realized gain. With respect to REITs, to the extent actual information has not yet been reported, estimates for return of capital are made by the Fund's management. Management's estimates are subsequently adjusted when the actual character of the distributions is disclosed by the REITs, which could result in a proportionate change in return of capital to shareholders.
Awards from class action litigation are recorded as a reduction of cost basis if the Fund still owns the applicable securities on the payment date. If the Fund no longer owns the applicable securities, the proceeds are recorded as realized gains.
Expenses
General expenses of the Trust are allocated to the Fund and other funds of the Trust based upon relative net assets or other expense allocation methodologies determined by the nature of the expense. Expenses directly attributable to the Fund are charged to the Fund. Expenses directly attributable to a specific class of shares are charged to that share class.
Determination of Class Net Asset Value
All income, expenses (other than class-specific expenses, which are charged to that share class, as shown in the Statement of Operations) and realized and unrealized gains (losses) are allocated to each class of the Fund on a daily basis, based on the relative net assets of each class, for purposes of determining the net asset value of each class.
Federal Income Tax Status
The Fund intends to qualify each year as a regulated investment company under Subchapter M of the Internal Revenue Code, as amended, and will distribute substantially all of its taxable income (including net short-term capital gains), if any, for its tax year, and as such will not be subject to federal income taxes. In addition, the Fund intends to distribute in each calendar year substantially all of its net investment income, capital gains and certain other amounts, if any, such that the Fund should not be subject to federal excise tax. Therefore, no federal income or excise tax provision is recorded.
Foreign Taxes
The Fund may be subject to foreign taxes on income, gains on investments or currency repatriation, a portion of which may be recoverable. The Fund will accrue such taxes and recoveries, as applicable, based upon its current interpretation of tax rules and regulations that exist in the markets in which it invests.
Realized gains in certain countries may be subject to foreign taxes at the Fund level, based on statutory rates. The Fund accrues for such foreign taxes on realized and unrealized gains at the appropriate rate for each jurisdiction, as applicable. The amount, if any, is disclosed as a liability on the Statement of Assets and Liabilities.
Distributions to Shareholders
Distributions from net investment income, if any, are declared and paid each calendar quarter. Net realized capital gains, if any, are distributed at least annually. Income distributions and capital gain distributions are determined in accordance with federal income tax regulations, which may differ from GAAP.
Guarantees and Indemnifications
Under the Trust's organizational documents and, in some cases, by contract, its officers and trustees are indemnified against certain liabilities arising out of the performance of their duties to the Trust or its funds. In
Semiannual Report 2016
33
COLUMBIA DIVIDEND OPPORTUNITY FUND
NOTES TO FINANCIAL STATEMENTS (continued)
November 30, 2016 (Unaudited)
addition, certain of the Fund's contracts with its service providers contain general indemnification clauses. The Fund's maximum exposure under these arrangements is unknown since the amount of any future claims that may be made against the Fund cannot be determined, and the Fund has no historical basis for predicting the likelihood of any such claims.
Investment Company Reporting Modernization
In October 2016, the U.S. Securities and Exchange Commission adopted new rules and forms, and amendments to certain current rules and forms, to modernize reporting and disclosure of information by registered investment companies. The amendments to Regulation S-X will require standardized, enhanced disclosure about derivatives in investment company financial statements, and will also change the rules governing the form and content of such financial statements. The amendments to Regulation S-X take effect on August 1, 2017. At this time, management is assessing the anticipated impact of these regulatory developments.
Note 3. Fees and Other Transactions with Affiliates
Management Services Fees
The Fund entered into a Management Agreement with Columbia Management Investment Advisers, LLC (the Investment Manager), a wholly-owned subsidiary of Ameriprise Financial, Inc. (Ameriprise Financial). Under the Management Agreement, the Investment Manager provides the Fund with investment research and advice, as well as administrative and accounting services. The management services fee is an annual fee that is equal to a percentage of the Fund's average daily net assets that declines from 0.72% to 0.52% as the Fund's net assets increase. The annualized effective management services fee rate for the six months ended November 30, 2016 was 0.60% of the Fund's average daily net assets.
Other Expenses
Other expenses are for, among other things, miscellaneous expenses of the Fund or the Board, including payments to Board Services Corp., a company providing limited administrative services to the Fund and the Board. That company's expenses include boardroom and office expense, employee compensation, employee health and retirement benefits, and certain other expenses.
Compensation of Board Members
Board members, who are not officers or employees of the Investment Manager or Ameriprise Financial, are compensated for their services to the Fund as disclosed in the Statement of Operations. Under a Deferred Compensation Plan (the Plan), these Board members may elect to defer payment of up to 100% of their compensation. Deferred amounts are treated as though equivalent dollar amounts had been invested in shares of certain funds managed by the Investment Manager. The Fund's liability for these amounts is adjusted for market value changes and remains in the Fund until distributed in accordance with the Plan. All amounts payable under the Plan constitute a general unsecured obligation of the Fund.
Compensation of Chief Compliance Officer
The Board has appointed a Chief Compliance Officer to the Fund in accordance with federal securities regulations. The Fund is allocated a portion of the expenses associated with the Chief Compliance Officer based on relative net assets of the Trust.
Transfer Agency Fees
Under a Transfer and Dividend Disbursing Agent Agreement, Columbia Management Investment Services Corp. (the Transfer Agent), an affiliate of the Investment Manager and a wholly-owned subsidiary of Ameriprise Financial, is responsible for providing transfer agency services to the Fund. The Transfer Agent has contracted with Boston Financial Data Services (BFDS) to serve as sub-transfer agent. The Transfer Agent pays the fees of BFDS for services as sub-transfer agent and BFDS is not entitled to reimbursement for such fees from the Fund (with the exception of out-of-pocket fees).
The Fund pays the Transfer Agent a monthly transfer agency fee based on the number or the average value of accounts, depending on the type of account. In addition, prior to October 1, 2016, the Transfer Agent also received sub-transfer agency fees based on a percentage of the average aggregate value of the Fund's shares maintained in omnibus accounts (other than omnibus accounts for which American Enterprise Investment Services Inc. is the broker of record or accounts where the beneficial shareholder is a customer of Ameriprise Financial Services, Inc., for which the Transfer Agent receives a per account fee). Effective October 1, 2016, the Fund pays the Transfer Agent a fee for shareholder services based on the number of accounts or on a percentage of the average aggregate value of the Fund's
Semiannual Report 2016
34
COLUMBIA DIVIDEND OPPORTUNITY FUND
NOTES TO FINANCIAL STATEMENTS (continued)
November 30, 2016 (Unaudited)
shares maintained in omnibus accounts up to the lesser of the amount charged by the servicing agent or a cap established by the Board from time to time.
The Transfer Agent also receives compensation from the Fund for various shareholder services and reimbursements for certain out-of-pocket fees. Effective January 1, 2017, total transfer agency fees for Class K and Class R5 shares are subject to an annual limitation of not more than 0.075% of the average daily net assets attributable to each share class. Total transfer agency fees for Class I and Class Y shares are subject to an annual limitation of not more than 0.025% of the average daily net assets attributable to each share class. Prior to January 1, 2017, total transfer agency fees for Class K and Class R5 shares were subject to an annual limitation of not more than 0.05% of the average daily net assets attributable to each share class. Class I and Class Y shares did not pay transfer agency fees.
For the six months ended November 30, 2016, the Fund's annualized effective transfer agency fee rates as a percentage of average daily net assets of each class were as follows:
Class A | | | 0.13 | % | |
Class B | | | 0.13 | | |
Class C | | | 0.13 | | |
Class K | | | 0.05 | | |
Class R | | | 0.13 | | |
Class R4 | | | 0.13 | | |
Class R5 | | | 0.05 | | |
Class W | | | 0.13 | | |
Class Z | | | 0.13 | | |
An annual minimum account balance fee of $20 may apply to certain accounts with a value below the applicable share class's initial minimum investment requirements to reduce the impact of small accounts on transfer agency fees. These minimum account balance fees are remitted to the Fund and recorded as part of expense reductions in the Statement of Operations. For the six months ended November 30, 2016, these minimum account balance fees reduced total expenses of the Fund by $40.
Plan Administration Fees
Under a Plan Administration Services Agreement with the Transfer Agent, the Fund pays an annual fee at a rate of 0.25% of the Fund's average daily net assets attributable
to Class K shares for the provision of various administrative, recordkeeping, communication and educational services.
Distribution and Service Fees
The Fund has an agreement with Columbia Management Investment Distributors, Inc. (the Distributor), an affiliate of the Investment Manager and a wholly-owned subsidiary of Ameriprise Financial, for distribution and shareholder services. Under a Plan and Agreement of Distribution, the Fund pays a fee at an annual rate of up to 0.25% of the Fund's average daily net assets attributable to Class A and Class W shares, a fee at an annual rate of up to 0.50% of the Fund's average daily net assets attributable to Class R shares (of which up to 0.25% may be used for shareholder services) and a fee at an annual rate of up to 1.00% of the Fund's average daily net assets attributable to Class B and Class C shares. For Class B and Class C shares, of the 1.00% fee, up to 0.75% is reimbursed for distribution expenses.
The amount of distribution and shareholder services expenses incurred by the Distributor and not yet reimbursed (unreimbursed expense) was approximately $3,279,000 and $1,050,000 for Class B and Class C shares, respectively. These amounts are based on the most recent information available as of September 30, 2016, and may be recovered from future payments under the distribution plan or CDSCs. To the extent the unreimbursed expense has been fully recovered, the distribution and/or shareholder services fee is reduced.
Sales Charges
Sales charges, including front-end charges and CDSCs, received by the Distributor for distributing Fund shares were $986,765 for Class A, $815 for Class B and $6,626 for Class C shares for the six months ended November 30, 2016.
Expenses Waived/Reimbursed by the Investment Manager and its Affiliates
The Investment Manager and certain of its affiliates have contractually agreed to waive fees and/or reimburse expenses (excluding certain fees and expenses described below) for the periods disclosed below, unless sooner terminated at the sole discretion of the Board, so that the Fund's net operating expenses, after giving effect to fees waived/expenses reimbursed and any balance credits and/or overdraft charges from the Fund's
Semiannual Report 2016
35
COLUMBIA DIVIDEND OPPORTUNITY FUND
NOTES TO FINANCIAL STATEMENTS (continued)
November 30, 2016 (Unaudited)
custodian, do not exceed the following annual rates as a percentage of the class' average daily net assets:
| | | October 1, 2016
Through
September 30, 2017 | | Prior to
October 1, 2016 | |
Class A | | | 1.16 | % | | | 1.15 | % | |
Class B | | | 1.91 | | | | 1.90 | | |
Class C | | | 1.91 | | | | 1.90 | | |
Class I | | | 0.81 | | | | 0.79 | | |
Class K | | | 1.11 | | | | 1.09 | | |
Class R | | | 1.41 | | | | 1.40 | | |
Class R4 | | | 0.91 | | | | 0.90 | | |
Class R5 | | | 0.86 | | | | 0.84 | | |
Class W | | | 1.16 | | | | 1.15 | | |
Class Y | | | 0.81 | | | | 0.79 | | |
Class Z | | | 0.91 | | | | 0.90 | | |
Under the agreement governing these fee waivers and/or expense reimbursement arrangements, the following fees and expenses are excluded from the waiver/reimbursement commitment, and therefore will be paid by the Fund, if applicable: taxes (including foreign transaction taxes), expenses associated with investments in affiliated and non-affiliated pooled investment vehicles (including mutual funds and exchange-traded funds), transaction costs and brokerage commissions, costs related to any securities lending program, dividend and interest expenses associated with securities sold short, inverse floater program fees and expenses, transaction charges and interest on borrowed money, interest, infrequent and/or unusual expenses and any other expenses the exclusion of which is specifically approved by the Board. This agreement may be modified or amended only with approval from the Investment Manager, certain of its affiliates and the Fund. Any fees waived and/or expenses reimbursed under the expense reimbursement arrangements described above are not recoverable by the Investment Manager or its affiliates in future periods.
Note 4. Federal Tax Information
The timing and character of income and capital gain distributions are determined in accordance with income tax regulations, which may differ from GAAP because of temporary or permanent book to tax differences.
At November 30, 2016, the cost of investments for federal income tax purposes was approximately $3,698,483,000 and the aggregate gross approximate
unrealized appreciation and depreciation based on that cost was:
Unrealized appreciation | | $ | 656,768,000 | | |
Unrealized depreciation | | | (113,508,000 | ) | |
Net unrealized appreciation | | $ | 543,260,000 | | |
The following capital loss carryforwards, determined as of May 31, 2016, may be available to reduce taxable income arising from future net realized gains on investments, if any, to the extent permitted by the Internal Revenue Code:
Year of Expiration | | Amount ($) | |
No expiration — short-term | | | 71,653,262 | | |
Management of the Fund has concluded that there are no significant uncertain tax positions in the Fund that would require recognition in the financial statements. However, management's conclusion may be subject to review and adjustment at a later date based on factors including, but not limited to, new tax laws, regulations, and administrative interpretations (including relevant court decisions). Generally, the Fund's federal tax returns for the prior three fiscal years remain subject to examination by the Internal Revenue Service.
Note 5. Portfolio Information
The cost of purchases and proceeds from sales of securities, excluding short-term investments and derivatives, if any, aggregated to $1,382,924,093 and $1,537,331,429, respectively, for the six months ended November 30, 2016. The amount of purchase and sale activity impacts the portfolio turnover rate reported in the Financial Highlights.
Note 6. Affiliated Money Market Fund
The Fund invests in Columbia Short-Term Cash Fund, an affiliated money market fund established for the exclusive use by the Fund and other affiliated funds (the Affiliated MMF). The income earned by the Fund from such investments is included as Dividends — affiliated issuers in the Statement of Operations. As an investing fund, the Fund indirectly bears its proportionate share of the expenses of the Affiliated MMF. Effective October 1, 2016, the Affiliated MMF prices its shares with a floating net asset value (NAV) and no longer seeks to maintain a stable NAV. In addition, the Board of the Affiliated MMF may impose a fee on redemptions (sometimes referred to as a liquidity fee) or temporarily suspend redemptions (sometimes referred to as imposing a redemption gate) in the event its liquidity falls below regulatory limits.
Semiannual Report 2016
36
COLUMBIA DIVIDEND OPPORTUNITY FUND
NOTES TO FINANCIAL STATEMENTS (continued)
November 30, 2016 (Unaudited)
Note 7. Line of Credit
The Fund has access to a revolving credit facility with a syndicate of banks led by Citibank, N.A., HSBC Bank USA, N.A. and JPMorgan Chase Bank, N.A. whereby the Fund may borrow for the temporary funding of shareholder redemptions or for other temporary or emergency purposes. The credit facility agreement, which is a collective agreement between the Fund and certain other funds managed by the Investment Manager, severally and not jointly, that permits collective borrowings up to $1 billion. Interest is charged to each participating fund based on its borrowings at a rate equal to the higher of (i) the overnight federal funds rate plus 1.00% or (ii) the one-month LIBOR rate plus 1.00%. Each borrowing under the credit facility matures no later than 60 days after the date of borrowing. The Fund also pays a commitment fee equal to its pro rata share of the amount of the credit facility at a rate of 0.15% per annum. The commitment fee is included in other expenses in the Statement of Operations.
The Fund had no borrowings during the six months ended November 30, 2016.
Note 8. Significant Risks
Shareholder Concentration Risk
At November 30, 2016, one unaffiliated shareholder of record owned 12.5% of the outstanding shares of the Fund in one or more accounts. The Fund has no knowledge about whether any portion of those shares was owned beneficially. Affiliated shareholders of record owned 52.8% of the outstanding shares of the Fund in one or more accounts. Subscription and redemption activity by concentrated accounts may have a significant effect on the operations of the Fund. In the case of a large redemption, the Fund may be forced to sell investments at inopportune times, including its liquid or more liquid positions, resulting in Fund losses and the Fund holding a higher percentage of less liquid or illiquid securities. Large redemptions could result in decreased economies of scale and increased operating expenses for non-redeeming Fund shareholders.
Note 9. Subsequent Events
Management has evaluated the events and transactions that have occurred through the date the financial statements were issued and noted no items requiring adjustment of the financial statements or additional disclosure.
Note 10. Information Regarding Pending and Settled Legal Proceedings
Ameriprise Financial and certain of its affiliates have historically been involved in a number of legal, arbitration and regulatory proceedings, including routine litigation, class actions, and governmental actions, concerning matters arising in connection with the conduct of their business activities. Ameriprise Financial believes that the Funds are not currently the subject of, and that neither Ameriprise Financial nor any of its affiliates are the subject of, any pending legal, arbitration or regulatory proceedings that are likely to have a material adverse effect on the Funds or the ability of Ameriprise Financial or its affiliates to perform under their contracts with the Funds. Ameriprise Financial is required to make quarterly (10-Q), annual (10-K) and, as necessary, 8-K filings with the Securities and Exchange Commission (SEC) on legal and regulatory matters that relate to Ameriprise Financial and its affiliates. Copies of these filings may be obtained by accessing the SEC website at www.sec.gov.
There can be no assurance that these matters, or the adverse publicity associated with them, will not result in increased fund redemptions, reduced sale of fund shares or other adverse consequences to the Funds. Further, although we believe proceedings are not likely to have a material adverse effect on the Funds or the ability of Ameriprise Financial or its affiliates to perform under their contracts with the Funds, these proceedings are subject to uncertainties and, as such, we are unable to estimate the possible loss or range of loss that may result. An adverse outcome in one or more of these proceedings could result in adverse judgments, settlements, fines, penalties or other relief that could have a material adverse effect on the consolidated financial condition or results of operations of Ameriprise Financial.
Semiannual Report 2016
37
COLUMBIA DIVIDEND OPPORTUNITY FUND
APPROVAL OF MANAGEMENT AGREEMENT
Columbia Management Investment Advisers, LLC (Columbia Threadneedle or the Investment Manager, and together with its domestic and global affiliates, Columbia Threadneedle Investments), a wholly-owned subsidiary of Ameriprise Financial, Inc. (Ameriprise Financial), serves as the investment manager to Columbia Dividend Opportunity Fund (the Fund). Under a management agreement (the Management Agreement), Columbia Threadneedle provides investment advice and other services to the Fund and other funds distributed by Columbia Management Investment Distributors, Inc. (collectively, the Funds).
On an annual basis, the Fund's Board of Trustees (the Board), including the independent Board members (the Independent Trustees), considers renewal of the Management Agreement. Columbia Threadneedle prepared detailed reports for the Board and its Contracts Committee in February, March and April 2016, including reports providing the results of analyses performed by an independent organization, Broadridge Financial Solutions, Inc. (Broadridge), and a comprehensive response to items of information requested by independent legal counsel to the Independent Trustees (Independent Legal Counsel) in a letter to the Investment Manager, to assist the Board in making this determination. Many of the materials presented in February, March and April were first supplied in draft form to designated independent Board representatives, i.e., Independent Legal Counsel, the Chair of the Board and/or the Chair of the Contracts Committee, and the final materials were revised to contain information reflective of discussion and subsequent requests made by the Contracts Committee. In addition, throughout the year, the Board (or its committees) regularly meets with portfolio management teams and senior management personnel and reviews information prepared by Columbia Threadneedle addressing the services Columbia Threadneedle provides and Fund performance. The Board also accords appropriate weight to the work, deliberations and conclusions of the various committees, such as the Contracts Committee, the Investment Review Committee and the Compliance Committee in determining whether to continue the Management Agreement.
The Board, at its June 13-15, 2016 in-person Board meeting (the June Meeting), considered the renewal of the Management Agreement for an additional one-year term. At the June Meeting, Independent Legal Counsel reviewed with the Independent Trustees various factors relevant to the Board's consideration of management agreements and the Board's legal responsibilities related to such consideration. Following an analysis and discussion of the factors identified below, the Board, including all of the Independent Trustees, approved the renewal of the Management Agreement.
Nature, Extent and Quality of Services Provided by Columbia Threadneedle
The Independent Trustees analyzed various reports and presentations they had received detailing the services performed by Columbia Threadneedle, as well as its organization, expertise, resources and capabilities.
The Independent Trustees specifically considered many developments during the past year concerning the services provided by Columbia Threadneedle, including, in particular, the relatively recent change in the leadership of equity department oversight, improvements in technology research and the use of research analysts' model portfolios to highlight best ideas and improve implementation. The Independent Trustees further noted the restructured investment risk management department and its additional resources, including the new head of multi-asset investment risk. They also observed the relatively recent 5P leadership transition, and the additional staff and resources dedicated to the 5P team. The Board also noted the broad scope of services provided by Columbia Threadneedle to each Fund, including, among other services, investment, risk and compliance oversight. The Board also took into account the information it received concerning Columbia Threadneedle's ability to attract and retain key portfolio management personnel.
In connection with the Board's evaluation of the overall package of services provided by Columbia Threadneedle, the Board also considered the nature, quality and range of administrative services provided to the Fund by Columbia Threadneedle, as well as the achievements in 2015 in the performance of administrative services, and noted the various enhancements anticipated for 2016. In evaluating the quality of services provided under the Management Agreement, the Independent Trustees also took into account the organization and strength of the Fund's and its service providers' compliance programs. In addition, the Board reviewed the financial condition of Columbia Threadneedle and its affiliates and each entity's ability to carry out its responsibilities under the
Semiannual Report 2016
38
COLUMBIA DIVIDEND OPPORTUNITY FUND
APPROVAL OF MANAGEMENT AGREEMENT (continued)
Management Agreement and the Fund's other service agreements with affiliates of Ameriprise Financial, observing the financial strength of Ameriprise Financial, with its solid balance sheet.
The Board also discussed the acceptability of the terms of the Management Agreement (including the relatively broad scope of services required to be performed by Columbia Threadneedle), noting that no material changes are proposed from the form of agreement previously approved. They also noted the wide array of legal and compliance services provided to the Funds. It was also observed that the services being performed under the Management Agreement were of a reasonably high quality.
Based on the foregoing, and based on other information received (both oral and written, including the information on investment performance referenced below) and other considerations, the Board concluded that Columbia Threadneedle and its affiliates are in a position to continue to provide a high quality and level of services to the Fund.
Investment Performance
For purposes of evaluating the nature, extent and quality of services provided under the Management Agreement, the Board carefully reviewed the investment performance of the Fund. In this regard, the Board considered detailed reports providing the results of analyses performed by an independent organization showing, for various periods, the performance of the Fund, the performance of a benchmark index, the percentage ranking of the Fund among its comparison group and the net assets of the Fund. The Board observed that the Fund's investment performance met expectations.
Comparative Fees, Costs of Services Provided and the Profits Realized by Columbia Threadneedle and its Affiliates from their Relationships with the Fund
The Board reviewed comparative fees and the costs of services provided under the Management Agreement. The Board members considered detailed comparative information set forth in an annual report on fees and expenses, including, among other things, data (based on analyses conducted by an independent organization) showing a comparison of the Fund's expenses with median expenses paid by funds in its comparative peer universe, as well as data showing the Fund's contribution to Columbia Threadneedle's profitability. The Board reviewed the fees charged to comparable institutional or other accounts/vehicles managed by Columbia Threadneedle and discussed differences in how the products are managed and operated, noting no unreasonable differences in the levels of contractual fees.
The Board considered the reports of its independent fee consultant, JDL Consultants, LLC (JDL), which assisted in its analysis of the Funds' performance and expenses, the reasonableness of the Funds' fee rates, the reasonableness of Columbia Threadneedle's profitability, and JDL's conclusion that the management fees being charged to the Fund are reasonable. The Board accorded particular weight to the notion that the level of fees should generally reflect a rational pricing model applied consistently across the various product lines in the Fund family, while assuring that the overall fees for each Fund (with certain defined exceptions) are generally in line with the "pricing philosophy" currently in effect (i.e., that the total expense ratio of the Fund is generally no higher than the median expense ratio of funds in the comparison universe of the Fund). The Board took into account that the Fund's total expense ratio (after considering proposed expense caps/waivers) was below the peer universe's median expense ratio shown in the reports. Based on its review, the Board concluded that the Fund's management fee was fair and reasonable in light of the extent and quality of services that the Fund receives.
The Board also considered the expected profitability of Columbia Threadneedle and its affiliates in connection with Columbia Threadneedle providing management services to the Fund. In this regard, the Independent Trustees referred to their detailed analysis of the Profitability Report, discussing the profitability to Columbia Threadneedle and Ameriprise Financial from managing, operating and distributing the Funds. The Board took into account JDL's conclusion that 2015 Columbia Threadneedle profitability, relative to industry competitors, was reasonable. It also considered that in 2015 the Board had concluded that 2014 profitability was reasonable and that Columbia Threadneedle generated 2015 profitability that only slightly exceeded 2014 levels. It also took into account the indirect economic benefits flowing to Columbia Threadneedle or its affiliates in connection with
Semiannual Report 2016
39
COLUMBIA DIVIDEND OPPORTUNITY FUND
APPROVAL OF MANAGEMENT AGREEMENT (continued)
managing or distributing the Funds, such as the enhanced ability to offer various other financial products to Ameriprise Financial customers, soft dollar benefits and overall reputational advantages. The Board noted that the fees paid by the Fund should permit the Investment Manager to offer competitive compensation to its personnel, make necessary investments in its business and earn an appropriate profit. The Board concluded that profitability levels were reasonable.
Economies of Scale to be Realized
The Board also considered the economies of scale that might be realized by Columbia Threadneedle as the Fund grows and took note of the extent to which Fund shareholders might also benefit from such growth. In this regard, the Board took into account that management fees decline as Fund assets exceed various breakpoints, all of which have not been surpassed. The Board concluded that the breakpoints in the management fee rate schedule satisfactorily provides for the sharing of economies of scale, as they allow for adequate opportunity for shareholders to realize benefits (fee breaks) as Fund assets grow.
Based on the foregoing, the Board, including all of the Independent Trustees, concluded that the management fees were fair and reasonable in light of the extent and quality of services provided. In reaching this conclusion, no single factor was determinative. On June 15, 2016, the Board, including all of the Independent Trustees, approved the renewal of the Management Agreement.
Semiannual Report 2016
40
COLUMBIA DIVIDEND OPPORTUNITY FUND
IMPORTANT INFORMATION ABOUT THIS REPORT
Each fund mails one shareholder report to each shareholder address. If you would like more than one report, please call shareholder services at 800.345.6611 and additional reports will be sent to you.
The policy of the Board is to vote the proxies of the companies in which each fund holds investments consistent with the procedures as stated in the Statement of Additional Information (SAI). You may obtain a copy of the SAI without charge by calling 800.345.6611; contacting your financial intermediary; visiting investor.columbiathreadneedleus.com; or searching the website of the Securities and Exchange Commission (SEC) at sec.gov. Information regarding how each fund voted proxies relating to portfolio securities is filed with the SEC by August 31st for the most recent 12-month period ending June 30th of that year, and is available without charge by visiting investor.columbiathreadneedleus.com, or searching the website of the SEC at sec.gov.
Each fund files a complete schedule of portfolio holdings with the SEC for the first and third quarters of each fiscal year on Form N-Q. Each fund's Form N-Q is available on the SEC's website at sec.gov and may be reviewed and copied at the SEC's Public Reference Room in Washington, D.C. Information on the operation of the Public Reference Room may be obtained by calling 800.SEC.0330. Each fund's complete schedule of portfolio holdings, as filed on Form N-Q, can also be obtained without charge, upon request, by calling 800.345.6611.
Semiannual Report 2016
41
Columbia Dividend Opportunity Fund
P.O. Box 8081
Boston, MA 02266-8081

Please read and consider the investment objectives, risks, charges and expenses for any fund carefully before investing. For a prospectus and summary prospectus, which contains this and other important information about the Fund, go to investor.columbiathreadneedleus.com. The Fund is distributed by Columbia Management Investment Distributors, Inc., member FINRA, and managed by Columbia Management Investment Advisers, LLC.
Columbia Threadneedle Investments (Columbia Threadneedle) is the global brand name of the Columbia and Threadneedle group of companies.
All rights reserved. Columbia Management Investment Distributors, Inc., 225 Franklin Street, Boston, MA 02110-2804
© 2017 Columbia Management Investment Advisers, LLC.
investor.columbiathreadneedleus.com
SAR140_05_G01_(01/17)

SEMIANNUAL REPORT
November 30, 2016

COLUMBIA SELECT LARGE-CAP VALUE FUND

 Dear Shareholders,
While emotions have run high following the outcome of the U.S. Presidential election, it remains unclear how the Trump presidency will unfold in terms of policy. We have a sense of the priorities espoused by the president-elect over the past eighteen months, but campaign priorities are not always realized and are often never pursued. What seems certain is that, while some investors have already priced expectations into the market, others have retreated, preferring instead a wait and see approach. The outcome of such behaviors appears to have created conditions ripe for ongoing market volatility.
While volatility in the financial markets can be stressful, volatility itself is not a new phenomenon. Other factors that have been at the root cause of recent volatility include uncertainty following the United Kingdom's vote to exit the European Union (Brexit), speculation around the Federal Reserve's decision to increase interest rates, divergent central bank policy and geopolitical unrest. The point is, financial markets have fluctuated for years and may be expected to continue to fluctuate — sometimes wildly. If anything, such volatility seems to be the new normal, perhaps exacerbated by access to information and development of technological tools which have enabled investors to react rapidly to real and perceived change. So what can you do?
Position your portfolio for the reality of market volatility
That there is a historical precedent for market volatility, or even an acceptance that it may persist, offers little comfort. A measured and strategic approach remains the best strategy for investors to stay on track in achieving their investment goals.
Step 1: Review your investment goals
Take this opportunity to review your investment goals and the strategies you are pursuing to achieve those goals in order to remain focused on what's important to you. It is entirely possible that your goals have changed in response either to your life situation or to changes in the market. Accept what you can't control — volatility, and focus on what you can — your investment goals and strategies.
Step 2: Reassess your risk tolerance
Sit down with your financial advisor to discuss your investment goals and strategies, as well as any changes to your tolerance for risk. Consider your investment horizon. Increased market volatility and a new investment horizon may impact the strategies that can best help you achieve your investment goals. Remember, achieving your investment goals may require a certain amount of risk. Ultimately, you must maintain vigilance in reassessing your risk tolerance and the strategies you have selected in pursuit of your investment goals, and awareness of how those strategies may react to market volatility.
Step 3: Remain calm and focus on your long-term plan
Remember, investing is about the long game. Short term events are not necessarily evidence of a longer term reality. Investors who attempt to time the market too often end up reacting to a down turn by selling low and then compounding the problem by waiting on the sidelines, ultimately missing the right opportunity to reinvest.
As long as there is a market, there will be volatility. How you respond to that volatility can make a big difference in the measure of your success as an investor. Talk to your financial advisor about how working with Columbia Threadneedle Investments may help you position your portfolio for the reality of ongoing volatility and, perhaps, even turn such volatility into investment opportunity.
Best regards,

Christopher O. Petersen
President, Columbia Funds
Investors should consider the investment objectives, risks, charges and expenses of a mutual fund carefully before investing. For a free prospectus and summary prospectus, which contains this and other important information about a fund, visit investor.columbiathreadneedleus.com. The prospectus should be read carefully before investing.
Columbia Funds are distributed by Columbia Management Investment Distributors, Inc., member FINRA, and managed by Columbia Management Investment Advisers, LLC.
© 2017 Columbia Management Investment Advisers, LLC. All rights reserved.
COLUMBIA SELECT LARGE-CAP VALUE FUND
Performance Overview | | | 2 | | |
Portfolio Overview | | | 3 | | |
Understanding Your Fund's Expenses | | | 4 | | |
Portfolio of Investments | | | 5 | | |
Statement of Assets and Liabilities | | | 9 | | |
Statement of Operations | | | 12 | | |
Statement of Changes in Net Assets | | | 13 | | |
Financial Highlights | | | 16 | | |
Notes to Financial Statements | | | 27 | | |
Approval of Management Agreement | | | 34 | | |
Important Information About This Report | | | 37 | | |
Fund Investment Manager
Columbia Management Investment
Advisers, LLC
225 Franklin Street
Boston, MA 02110
Fund Distributor
Columbia Management Investment
Distributors, Inc.
225 Franklin Street
Boston, MA 02110
Fund Transfer Agent
Columbia Management Investment
Services Corp.
P.O. Box 8081
Boston, MA 02266-8081
For more information about any of the funds, please visit investor.columbiathreadneedleus.com or call 800.345.6611. Customer Service Representatives are available to answer your questions Monday through Friday from 8 a.m. to 7 p.m. Eastern time.
The views expressed in this report reflect the current views of the respective parties. These views are not guarantees of future performance and involve certain risks, uncertainties and assumptions that are difficult to predict, so actual outcomes and results may differ significantly from the views expressed. These views are subject to change at any time based upon economic, market or other conditions and the respective parties disclaim any responsibility to update such views. These views may not be relied on as investment advice and, because investment decisions for a Columbia fund are based on numerous factors, may not be relied on as an indication of trading intent on behalf of any particular Columbia fund. References to specific securities should not be construed as a recommendation or investment advice.
COLUMBIA SELECT LARGE-CAP VALUE FUND
PERFORMANCE OVERVIEW
(Unaudited)
Performance Summary
n Columbia Select Large-Cap Value Fund (the Fund) Class A shares returned 12.83% excluding sales charges for the six-month period that ended November 30, 2016.
n During the same time period, the Fund outperformed the Russell 1000 Value Index, which returned 8.63%, as well as the S&P 500 Index, a measure of the broader equity market, which returned 6.01%.
Average Annual Total Returns (%) (for period ended November 30, 2016)
| | | Inception | | 6 Months
Cumulative | | 1 Year | | 5 Years | | 10 Years | |
Class A | | 04/25/97 | | | | | | | | | | | | | | | | | |
Excluding sales charges | | | | | | | 12.83 | | | | 13.88 | | | | 14.94 | | | | 7.47 | | |
Including sales charges | | | | | | | 6.33 | | | | 7.35 | | | | 13.58 | | | | 6.84 | | |
Class B | | 04/25/97 | | | | | | | | | | | | | | | | | |
Excluding sales charges | | | | | | | 12.39 | | | | 13.02 | | | | 14.08 | | | | 6.66 | | |
Including sales charges | | | | | | | 7.39 | | | | 8.02 | | | | 13.84 | | | | 6.66 | | |
Class C | | 05/27/99 | | | | | | | | | | | | | | | | | |
Excluding sales charges | | | | | | | 12.46 | | | | 13.08 | | | | 14.08 | | | | 6.68 | | |
Including sales charges | | | | | | | 11.46 | | | | 12.08 | | | | 14.08 | | | | 6.68 | | |
Class I* | | 08/03/09 | | | 13.02 | | | | 14.32 | | | | 15.41 | | | | 7.79 | | |
Class K* | | 08/03/09 | | | 12.93 | | | | 14.01 | | | | 15.06 | | | | 7.56 | | |
Class R | | 04/30/03 | | | 12.68 | | | | 13.59 | | | | 14.65 | | | | 7.18 | | |
Class R4* | | 11/08/12 | | | 13.00 | | | | 14.21 | | | | 15.18 | | | | 7.58 | | |
Class R5 | | 11/30/01 | | | 13.05 | | | | 14.28 | | | | 15.34 | | | | 7.92 | | |
Class W* | | 09/27/10 | | | 12.86 | | | | 13.91 | | | | 14.93 | | | | 7.08 | | |
Class Y* | | 10/01/14 | | | 13.06 | | | | 14.35 | | | | 15.15 | | | | 7.57 | | |
Class Z* | | 09/27/10 | | | 12.97 | | | | 14.14 | | | | 15.23 | | | | 7.64 | | |
Russell 1000 Value Index | | | | | | | 8.63 | | | | 12.02 | | | | 14.69 | | | | 5.70 | | |
S&P 500 Index | | | | | | | 6.01 | | | | 8.06 | | | | 14.45 | | | | 6.89 | | |
Returns for Class A are shown with and without the maximum initial sales charge of 5.75%. Returns for Class B are shown with and without the applicable contingent deferred sales charge (CDSC) of 5.00% in the first year, declining to 1.00% in the sixth year and eliminated thereafter. Returns for Class C are shown with and without the 1.00% CDSC for the first year only. The Fund's other classes are not subject to sales charges and have limited eligibility. Please see the Fund's prospectus for details. Performance for different share classes will vary based on differences in sales charges and fees associated with each class. All results shown assume reinvestment of distributions during the period. Returns do not reflect the deduction of taxes that a shareholder may pay on Fund distributions or on the redemption of Fund shares. Performance results reflect the effect of any fee waivers or reimbursements of Fund expenses by Columbia Management Investment Advisers, LLC and/or any of its affiliates. Absent these fee waivers or expense reimbursement arrangements, performance results would have been lower.
The performance information shown represents past performance and is not a guarantee of future results. The investment return and principal value of your investment will fluctuate so that your shares, when redeemed, may be worth more or less than their original cost. Current performance may be lower or higher than the performance information shown. You may obtain performance information current to the most recent month-end by contacting your financial intermediary, visiting investor.columbiathreadneedleus.com or calling 800.345.6611.
*The returns shown for periods prior to the share class inception date (including returns for the Life of the Fund, if shown, which are since Fund inception) include the returns of the Fund's oldest share class. Since the Fund launched more than one share class at its inception, Class A shares were used. These returns are adjusted to reflect any higher class-related operating expenses of the newer share classes, as applicable. Please visit investor.columbiathreadneedleus.com/investment-products/mutual-funds/appended-performance for more information.
The Russell 1000 Value Index, an unmanaged index, measures the performance of those stocks in the Russell 1000 Index with lower price-to-book ratios and lower forecasted growth values.
The S&P 500 Index, an unmanaged index, measures the performance of 500 widely held, large-capitalization U.S. stocks and is frequently used as a general measure of market performance.
Indices are not available for investment, are not professionally managed and do not reflect sales charges, fees, brokerage commissions, taxes or other expenses of investing. Securities in the Fund may not match those in an index.
Semiannual Report 2016
2
COLUMBIA SELECT LARGE-CAP VALUE FUND
PORTFOLIO OVERVIEW
(Unaudited)
Top Ten Holdings (%)
(at November 30, 2016) | |
NextEra Energy, Inc. | | | 4.4 | | |
Verizon Communications, Inc. | | | 4.4 | | |
Corning, Inc. | | | 4.4 | | |
Bank of America Corp. | | | 4.3 | | |
Humana, Inc. | | | 3.9 | | |
Applied Materials, Inc. | | | 3.8 | | |
Citigroup, Inc. | | | 3.7 | | |
JPMorgan Chase & Co. | | | 3.5 | | |
Morgan Stanley | | | 3.4 | | |
Wells Fargo & Co. | | | 3.3 | | |
Percentages indicated are based upon total investments (excluding Money Market Funds).
For further detail about these holdings, please refer to the section entitled "Portfolio of Investments."
Fund holdings are as of the date given, are subject to change at any time, and are not recommendations to buy or sell any security.
Portfolio Breakdown (%)
(at November 30, 2016) | |
Common Stocks | | | 100.0 | | |
Money Market Funds | | | 0.0 | (a) | |
Total | | | 100.0 | | |
Percentages indicated are based upon total investments. The Fund's portfolio composition is subject to change.
(a) Rounds to zero.
Equity Sector Breakdown (%)
(at November 30, 2016) | |
Consumer Discretionary | | | 2.7 | | |
Consumer Staples | | | 10.0 | | |
Energy | | | 14.9 | | |
Financials | | | 24.6 | | |
Health Care | | | 9.6 | | |
Industrials | | | 8.1 | | |
Information Technology | | | 16.4 | | |
Materials | | | 2.6 | | |
Telecommunication Services | | | 4.4 | | |
Utilities | | | 6.7 | | |
Total | | | 100.0 | | |
Percentages indicated are based upon total equity investments. The Fund's portfolio composition is subject to change.
Portfolio Management
Richard Rosen
Kari Montanus
Richard Taft*
*Effective October 2016, Mr. Taft was named a Portfolio Manager of the Fund.
Morningstar Style BoxTM

The Morningstar Style BoxTM is based on a fund's portfolio holdings. For equity funds, the vertical axis shows the market capitalization of the stocks owned, and the horizontal axis shows investment style (value, blend, or growth). Information shown is based on the most recent data provided by Morningstar.
© 2017 Morningstar, Inc. All rights reserved. The Morningstar information contained herein: (1) is proprietary to Morningstar and/or its content providers; (2) may not be copied or distributed; and (3) is not warranted to be accurate, complete or timely. Neither Morningstar nor its content providers are responsible for any damages or losses arising from any use of this information.
Semiannual Report 2016
3
COLUMBIA SELECT LARGE-CAP VALUE FUND
UNDERSTANDING YOUR FUND'S EXPENSES
(Unaudited)
As an investor, you incur two types of costs. There are transaction costs, which generally include sales charges on purchases and may include redemption fees. There are also ongoing costs, which generally include management fees, distribution and/or service fees, and other fund expenses. The following information is intended to help you understand your ongoing costs (in dollars) of investing in the Fund and to help you compare these costs with the ongoing costs of investing in other mutual funds.
Analyzing Your Fund's Expenses
To illustrate these ongoing costs, we have provided examples and calculated the expenses paid by investors in each share class of the Fund during the period. The actual and hypothetical information in the table is based on an initial investment of $1,000 at the beginning of the period indicated and held for the entire period. Expense information is calculated two ways and each method provides you with different information. The amount listed in the "Actual" column is calculated using the Fund's actual operating expenses and total return for the period. You may use the Actual information, together with the amount invested, to estimate the expenses that you paid over the period. Simply divide your account value by $1,000 (for example, an $8,600 account value divided by $1,000 = 8.6), then multiply the results by the expenses paid during the period under the "Actual" column. The amount listed in the "Hypothetical" column assumes a 5% annual rate of return before expenses (which is not the Fund's actual return) and then applies the Fund's actual expense ratio for the period to the hypothetical return. You should not use the hypothetical account values and expenses to estimate either your actual account balance at the end of the period or the expenses you paid during the period. See "Compare With Other Funds" below for details on how to use the hypothetical data.
Compare With Other Funds
Since all mutual funds are required to include the same hypothetical calculations about expenses in shareholder reports, you can use this information to compare the ongoing cost of investing in the Fund with other funds. To do so, compare the hypothetical example with the 5% hypothetical examples that appear in the shareholder reports of other funds. As you compare hypothetical examples of other funds, it is important to note that hypothetical examples are meant to highlight the ongoing costs of investing in a fund only and do not reflect any transaction costs, such as sales charges, or redemption or exchange fees. Therefore, the hypothetical calculations are useful in comparing ongoing costs only, and will not help you determine the relative total costs of owning different funds. If transaction costs were included in these calculations, your costs would be higher.
June 1, 2016 – November 30, 2016
| | | Account Value at the Beginning
of the Period ($) | | Account Value at the End of the
Period ($) | | Expenses Paid During the
Period ($) | | Fund's Annualized
Expense Ratio (%) | |
| | | Actual | | Hypothetical | | Actual | | Hypothetical | | Actual | | Hypothetical | | Actual | |
Class A | | | 1,000.00 | | | | 1,000.00 | | | | 1,128.30 | | | | 1,019.15 | | | | 6.30 | | | | 5.97 | | | | 1.18 | | |
Class B | | | 1,000.00 | | | | 1,000.00 | | | | 1,123.90 | | | | 1,015.39 | | | | 10.28 | | | | 9.75 | | | | 1.93 | | |
Class C | | | 1,000.00 | | | | 1,000.00 | | | | 1,124.60 | | | | 1,015.39 | | | | 10.28 | | | | 9.75 | | | | 1.93 | | |
Class I | | | 1,000.00 | | | | 1,000.00 | | | | 1,130.20 | | | | 1,021.11 | | | | 4.22 | | | | 4.00 | | | | 0.79 | | |
Class K | | | 1,000.00 | | | | 1,000.00 | | | | 1,129.30 | | | | 1,019.65 | | | | 5.76 | | | | 5.47 | | | | 1.08 | | |
Class R | | | 1,000.00 | | | | 1,000.00 | | | | 1,126.80 | | | | 1,017.90 | | | | 7.62 | | | | 7.23 | | | | 1.43 | | |
Class R4 | | | 1,000.00 | | | | 1,000.00 | | | | 1,130.00 | | | | 1,020.41 | | | | 4.97 | | | | 4.71 | | | | 0.93 | | |
Class R5 | | | 1,000.00 | | | | 1,000.00 | | | | 1,130.50 | | | | 1,020.86 | | | | 4.49 | | | | 4.26 | | | | 0.84 | | |
Class W | | | 1,000.00 | | | | 1,000.00 | | | | 1,128.60 | | | | 1,019.15 | | | | 6.30 | | | | 5.97 | | | | 1.18 | | |
Class Y | | | 1,000.00 | | | | 1,000.00 | | | | 1,130.60 | | | | 1,021.11 | | | | 4.22 | | | | 4.00 | | | | 0.79 | | |
Class Z | | | 1,000.00 | | | | 1,000.00 | | | | 1,129.70 | | | | 1,020.41 | | | | 4.97 | | | | 4.71 | | | | 0.93 | | |
Expenses paid during the period are equal to the annualized expense ratio for each class as indicated above, multiplied by the average account value over the period and then multiplied by the number of days in the Fund's most recent fiscal half year and divided by 365.
Expenses do not include fees and expenses incurred indirectly by the Fund from its investment in underlying funds, including affiliated and non-affiliated pooled investment vehicles, such as mutual funds and exchange-traded funds.
Had Columbia Management Investment Advisers, LLC and/or certain of its affiliates not waived/reimbursed certain fees and expenses, account value at the end of the period would have been reduced.
Semiannual Report 2016
4
COLUMBIA SELECT LARGE-CAP VALUE FUND
PORTFOLIO OF INVESTMENTS
November 30, 2016 (Unaudited)
(Percentages represent value of investments compared to net assets)
Common Stocks 99.6%
Issuer | | Shares | | Value ($) | |
CONSUMER DISCRETIONARY 2.7% | |
Specialty Retail 2.7% | |
Lowe's Companies, Inc. | | | 290,000 | | | | 20,459,500 | | |
Total Consumer Discretionary | | | | | 20,459,500 | | |
CONSUMER STAPLES 10.0% | |
Food & Staples Retailing 2.0% | |
Costco Wholesale Corp. | | | 100,000 | | | | 15,011,000 | | |
Food Products 2.6% | |
Tyson Foods, Inc., Class A | | | 353,018 | | | | 20,054,953 | | |
Tobacco 5.4% | |
Altria Group, Inc. | | | 375,000 | | | | 23,973,750 | | |
Philip Morris International, Inc. | | | 200,000 | | | | 17,656,000 | | |
Total | | | | | 41,629,750 | | |
Total Consumer Staples | | | | | 76,695,703 | | |
ENERGY 14.8% | |
Energy Equipment & Services 3.3% | |
Halliburton Co. | | | 477,000 | | | | 25,323,930 | | |
Oil, Gas & Consumable Fuels 11.5% | |
Anadarko Petroleum Corp. | | | 340,000 | | | | 23,511,000 | | |
Chevron Corp. | | | 163,212 | | | | 18,207,931 | | |
Marathon Oil Corp. | | | 450,000 | | | | 8,127,000 | | |
Marathon Petroleum Corp. | | | 290,000 | | | | 13,635,800 | | |
Valero Energy Corp. | | | 225,000 | | | | 13,851,000 | | |
Williams Companies, Inc. (The) | | | 350,000 | | | | 10,745,000 | | |
Total | | | | | 88,077,731 | | |
Total Energy | | | | | 113,401,661 | | |
FINANCIALS 24.5% | |
Banks 14.7% | |
Bank of America Corp. | | | 1,550,000 | | | | 32,736,000 | | |
Citigroup, Inc. | | | 500,000 | | | | 28,195,000 | | |
JPMorgan Chase & Co. | | | 330,000 | | | | 26,456,100 | | |
Wells Fargo & Co. | | | 480,000 | | | | 25,401,600 | | |
Total | | | | | 112,788,700 | | |
Capital Markets 3.4% | |
Morgan Stanley | | | 625,000 | | | | 25,850,000 | | |
Common Stocks (continued)
Issuer | | Shares | | Value ($) | |
Insurance 6.4% | |
MetLife, Inc. | | | 450,000 | | | | 24,754,500 | | |
Unum Group | | | 575,000 | | | | 24,305,250 | | |
Total | | | | | 49,059,750 | | |
Total Financials | | | | | 187,698,450 | | |
HEALTH CARE 9.6% | |
Health Care Equipment & Supplies 1.5% | |
Baxter International, Inc. | | | 250,000 | | | | 11,092,500 | | |
Health Care Providers & Services 5.6% | |
Express Scripts Holding Co.(a) | | | 175,000 | | | | 13,279,000 | | |
Humana, Inc. | | | 140,000 | | | | 29,769,600 | | |
Total | | | | | 43,048,600 | | |
Pharmaceuticals 2.5% | |
Bristol-Myers Squibb Co. | | | 340,000 | | | | 19,189,600 | | |
Total Health Care | | | | | 73,330,700 | | |
INDUSTRIALS 8.1% | |
Aerospace & Defense 1.8% | |
United Technologies Corp. | | | 125,000 | | | | 13,465,000 | | |
Industrial Conglomerates 2.7% | |
Honeywell International, Inc. | | | 185,000 | | | | 21,078,900 | | |
Road & Rail 3.6% | |
CSX Corp. | | | 480,000 | | | | 17,188,800 | | |
Union Pacific Corp. | | | 100,000 | | | | 10,133,000 | | |
Total | | | | | 27,321,800 | | |
Total Industrials | | | | | 61,865,700 | | |
INFORMATION TECHNOLOGY 16.3% | |
Communications Equipment 2.1% | |
Juniper Networks, Inc. | | | 600,000 | | | | 16,524,000 | | |
Electronic Equipment, Instruments & Components 4.4% | |
Corning, Inc. | | | 1,400,000 | | | | 33,642,000 | | |
IT Services 2.8% | |
Teradata Corp.(a) | | | 800,000 | | | | 21,480,000 | | |
Semiconductors & Semiconductor Equipment 7.0% | |
Applied Materials, Inc. | | | 900,000 | | | | 28,980,000 | | |
QUALCOMM, Inc. | | | 359,017 | | | | 24,459,828 | | |
Total | | | | | 53,439,828 | | |
Total Information Technology | | | | | 125,085,828 | | |
The accompanying Notes to Financial Statements are an integral part of this statement.
Semiannual Report 2016
5
COLUMBIA SELECT LARGE-CAP VALUE FUND
PORTFOLIO OF INVESTMENTS (continued)
November 30, 2016 (Unaudited)
Common Stocks (continued)
Issuer | | Shares | | Value ($) | |
MATERIALS 2.6% | |
Chemicals 2.6% | |
FMC Corp. | | | 350,000 | | | | 19,642,000 | | |
Total Materials | | | | | 19,642,000 | | |
TELECOMMUNICATION SERVICES 4.4% | |
Diversified Telecommunication Services 4.4% | |
Verizon Communications, Inc. | | | 675,000 | | | | 33,682,500 | | |
Total Telecommunication Services | | | | | 33,682,500 | | |
UTILITIES 6.6% | |
Electric Utilities 4.4% | |
NextEra Energy, Inc. | | | 295,000 | | | | 33,697,850 | | |
Independent Power and Renewable Electricity Producers 2.2% | |
AES Corp. (The) | | | 1,500,000 | | | | 17,175,000 | | |
Total Utilities | | | | | 50,872,850 | | |
Total Common Stocks
(Cost: $457,149,059) | | | | | 762,734,892 | | |
Money Market Funds —%
| | | Shares | | Value ($) | |
Columbia Short-Term Cash Fund,
0.480%(b)(c) | | | 329,218 | | | | 329,251 | | |
Total Money Market Funds
(Cost: $329,218) | | | | | 329,251 | | |
Total Investments
(Cost: $457,478,277) | | | | | 763,064,143 | | |
Other Assets & Liabilities, Net | | | | | 2,981,697 | | |
Net Assets | | | | | 766,045,840 | | |
Notes to Portfolio of Investments
(a) Non-income producing investment.
(b) The rate shown is the seven-day current annualized yield at November 30, 2016.
(c) As defined in the Investment Company Act of 1940, an affiliated company is one in which the Fund owns 5% or more of the company's outstanding voting securities, or a company which is under common ownership or control with the Fund. Holdings and transactions in these affiliated companies during the period ended November 30, 2016 are as follows:
Issuer | | Beginning
Cost ($) | | Purchase
Cost ($) | | Proceeds
From Sales ($) | | Realized
Gain (Loss) ($) | | Ending
Cost ($) | | Dividends —
Affiliated
Issuers ($) | | Value ($) | |
Columbia Short-Term
Cash Fund | | | — | | | | 74,073,164 | | | | (73,744,001 | ) | | | 55 | | | | 329,218 | | | | 9,963 | | | | 329,251 | | |
The accompanying Notes to Financial Statements are an integral part of this statement.
Semiannual Report 2016
6
COLUMBIA SELECT LARGE-CAP VALUE FUND
PORTFOLIO OF INVESTMENTS (continued)
November 30, 2016 (Unaudited)
The Fund categorizes its fair value measurements according to a three-level hierarchy that maximizes the use of observable inputs and minimizes the use of unobservable inputs by prioritizing that the most observable input be used when available. Observable inputs are those that market participants would use in pricing an investment based on market data obtained from sources independent of the reporting entity. Unobservable inputs are those that reflect the Fund's assumptions about the information market participants would use in pricing an investment. An investment's level within the fair value hierarchy is based on the lowest level of any input that is deemed significant to the asset's or liability's fair value measurement. The input levels are not necessarily an indication of the risk or liquidity associated with investments at that level. For example, certain U.S. government securities are generally high quality and liquid, however, they are reflected as Level 2 because the inputs used to determine fair value may not always be quoted prices in an active market.
Fair value inputs are summarized in the three broad levels listed below:
> Level 1 — Valuations based on quoted prices for investments in active markets that the Fund has the ability to access at the measurement date (including NAV for open-end mutual funds). Valuation adjustments are not applied to Level 1 investments.
> Level 2 — Valuations based on other significant observable inputs (including quoted prices for similar securities, interest rates, prepayment speeds, credit risks, etc.).
> Level 3 — Valuations based on significant unobservable inputs (including the Fund's own assumptions and judgment in determining the fair value of investments).
Inputs that are used in determining fair value of an investment may include price information, credit data, volatility statistics, and other factors. These inputs can be either observable or unobservable. The availability of observable inputs can vary between investments, and is affected by various factors such as the type of investment, and the volume and level of activity for that investment or similar investments in the marketplace. The inputs will be considered by the Investment Manager, along with any other relevant factors in the calculation of an investment's fair value. The Fund uses prices and inputs that are current as of the measurement date, which may include periods of market dislocations. During these periods, the availability of prices and inputs may be reduced for many investments. This condition could cause an investment to be reclassified between the various levels within the hierarchy.
Certain investments that have been measured at fair value using the net asset value (NAV) per share (or its equivalent) are not categorized in the fair value hierarchy. The fair value amounts presented in the table are intended to reconcile the fair value hierarchy to the amounts presented in the Portfolio of Investments. The Columbia Short-Term Cash Fund seeks to provide shareholders with maximum current income consistent with liquidity and stability of principal. Columbia Short-Term Cash Fund prices its shares with a floating NAV and no longer seeks to maintain a stable NAV.
Investments falling into the Level 3 category are primarily supported by quoted prices from brokers and dealers participating in the market for those investments. However, these may be classified as Level 3 investments due to lack of market transparency and corroboration to support these quoted prices. Additionally, valuation models may be used as the pricing source for any remaining investments classified as Level 3. These models may rely on one or more significant unobservable inputs and/or significant assumptions by the Investment Manager. Inputs used in valuations may include, but are not limited to, financial statement analysis, capital account balances, discount rates and estimated cash flows, and comparable company data.
Under the direction of the Fund's Board of Trustees (the Board), the Investment Manager's Valuation Committee (the Committee) is responsible for overseeing the valuation procedures approved by the Board. The Committee consists of voting and non-voting members from various groups within the Investment Manager's organization, including operations and accounting, trading and investments, compliance, risk management and legal.
The Committee meets at least monthly to review and approve valuation matters, which may include a description of specific valuation determinations, data regarding pricing information received from approved pricing vendors and brokers and the results of Board-approved valuation control policies and procedures (the Policies). The Policies address, among other things, instances when market quotations are or are not readily available, including recommendations of third party pricing vendors and a determination of appropriate pricing methodologies; events that require specific valuation determinations and assessment of fair value techniques; securities with a potential for stale pricing, including those that are illiquid, restricted, or in default; and the effectiveness of third party pricing vendors, including periodic reviews of vendors. The Committee meets more frequently, as needed, to discuss additional valuation matters, which may include the need to review back-testing results, review time-sensitive information or approve related valuation actions. The Committee reports to the Board, with members of the Committee meeting with the Board at each of its regularly scheduled meetings to discuss valuation matters and actions during the period, similar to those described earlier.
The accompanying Notes to Financial Statements are an integral part of this statement.
Semiannual Report 2016
7
COLUMBIA SELECT LARGE-CAP VALUE FUND
PORTFOLIO OF INVESTMENTS (continued)
November 30, 2016 (Unaudited)
Fair Value Measurements (continued)
For investments categorized as Level 3, the Committee monitors information similar to that described above, which may include: (i) data specific to the issuer or comparable issuers, (ii) general market or specific sector news and (iii) quoted prices and specific or similar security transactions. The Committee considers this data and any changes from prior periods in order to assess the reasonableness of observable and unobservable inputs, any assumptions or internal models used to value those securities and changes in fair value. This data is also used to corroborate, when available, information received from approved pricing vendors and brokers. Various factors impact the frequency of monitoring this information (which may occur as often as daily). However, the Committee may determine that changes to inputs, assumptions and models are not required as a result of the monitoring procedures performed.
The following table is a summary of the inputs used to value the Fund's investments at November 30, 2016:
| | | Level 1
Quoted Prices in Active
Markets for Identical
Assets ($) | | Level 2
Other Significant
Observable Inputs ($) | | Level 3
Significant
Unobservable Inputs ($) | | Total ($) | |
Investments | |
Common Stocks | |
Consumer Discretionary | | | 20,459,500 | | | | — | | | | — | | | | 20,459,500 | | |
Consumer Staples | | | 76,695,703 | | | | — | | | | — | | | | 76,695,703 | | |
Energy | | | 113,401,661 | | | | — | | | | — | | | | 113,401,661 | | |
Financials | | | 187,698,450 | | | | — | | | | — | | | | 187,698,450 | | |
Health Care | | | 73,330,700 | | | | — | | | | — | | | | 73,330,700 | | |
Industrials | | | 61,865,700 | | | | — | | | | — | | | | 61,865,700 | | |
Information Technology | | | 125,085,828 | | | | — | | | | — | | | | 125,085,828 | | |
Materials | | | 19,642,000 | | | | — | | | | — | | | | 19,642,000 | | |
Telecommunication Services | | | 33,682,500 | | | | — | | | | — | | | | 33,682,500 | | |
Utilities | | | 50,872,850 | | | | — | | | | — | | | | 50,872,850 | | |
Total Common Stocks | | | 762,734,892 | | | | — | | | | — | | | | 762,734,892 | | |
Investments measured at net asset value | |
Money Market Funds | | | — | | | | — | | | | — | | | | 329,251 | | |
Total Investments | | | 762,734,892 | | | | — | | | | — | | | | 763,064,143 | | |
See the Portfolio of Investments for all investment classifications not indicated in the table.
There were no transfers of financial assets between levels during the period.
The accompanying Notes to Financial Statements are an integral part of this statement.
Semiannual Report 2016
8
COLUMBIA SELECT LARGE-CAP VALUE FUND
STATEMENT OF ASSETS AND LIABILITIES
November 30, 2016 (Unaudited)
Assets | |
Investments, at value | |
Unaffiliated issuers (identified cost $457,149,059) | | $ | 762,734,892 | | |
Affiliated issuers (identified cost $329,218) | | | 329,251 | | |
Total investments (identified cost $457,478,277) | | | 763,064,143 | | |
Receivable for: | |
Investments sold | | | 1,397,546 | | |
Capital shares sold | | | 1,142,564 | | |
Dividends | | | 2,179,698 | | |
Expense reimbursement due from Investment Manager | | | 721 | | |
Prepaid expenses | | | 3,803 | | |
Other assets | | | 16,317 | | |
Total assets | | | 767,804,792 | | |
Liabilities | |
Payable for: | |
Capital shares purchased | | | 1,506,544 | | |
Management services fees | | | 15,543 | | |
Distribution and/or service fees | | | 3,895 | | |
Transfer agent fees | | | 98,132 | | |
Plan administration fees | | | 5 | | |
Compensation of board members | | | 40,477 | | |
Chief compliance officer expenses | | | 54 | | |
Other expenses | | | 94,302 | | |
Total liabilities | | | 1,758,952 | | |
Net assets applicable to outstanding capital stock | | $ | 766,045,840 | | |
Represented by | |
Paid-in capital | | $ | 405,167,642 | | |
Undistributed net investment income | | | 8,600,936 | | |
Accumulated net realized gain | | | 46,691,396 | | |
Unrealized appreciation (depreciation) on: | |
Investments — unaffiliated issuers | | | 305,585,833 | | |
Investments — affiliated issuers | | | 33 | | |
Total — representing net assets applicable to outstanding capital stock | | $ | 766,045,840 | | |
The accompanying Notes to Financial Statements are an integral part of this statement.
Semiannual Report 2016
9
COLUMBIA SELECT LARGE-CAP VALUE FUND
STATEMENT OF ASSETS AND LIABILITIES (continued)
November 30, 2016 (Unaudited)
Class A | |
Net assets | | $ | 223,077,516 | | |
Shares outstanding | | | 9,226,643 | | |
Net asset value per share | | $ | 24.18 | | |
Maximum offering price per share(a) | | $ | 25.66 | | |
Class B | |
Net assets | | $ | 732,437 | | |
Shares outstanding | | | 32,832 | | |
Net asset value per share | | $ | 22.31 | | |
Class C | |
Net assets | | $ | 69,339,523 | | |
Shares outstanding | | | 3,109,928 | | |
Net asset value per share | | $ | 22.30 | | |
Class I | |
Net assets | | $ | 126,307,761 | | |
Shares outstanding | | | 5,051,521 | | |
Net asset value per share | | $ | 25.00 | | |
Class K | |
Net assets | | $ | 21,200 | | |
Shares outstanding | | | 852 | | |
Net asset value per share(b) | | $ | 24.89 | | |
Class R | |
Net assets | | $ | 24,924,893 | | |
Shares outstanding | | | 1,046,652 | | |
Net asset value per share | | $ | 23.81 | | |
Class R4 | |
Net assets | | $ | 26,152,373 | | |
Shares outstanding | | | 1,034,234 | | |
Net asset value per share | | $ | 25.29 | | |
Class R5 | |
Net assets | | $ | 24,835,914 | | |
Shares outstanding | | | 992,382 | | |
Net asset value per share | | $ | 25.03 | | |
Class W | |
Net assets | | $ | 24,132,616 | | |
Shares outstanding | | | 1,003,568 | | |
Net asset value per share | | $ | 24.05 | | |
The accompanying Notes to Financial Statements are an integral part of this statement.
Semiannual Report 2016
10
COLUMBIA SELECT LARGE-CAP VALUE FUND
STATEMENT OF ASSETS AND LIABILITIES (continued)
November 30, 2016 (Unaudited)
Class Y | |
Net assets | | $ | 791,948 | | |
Shares outstanding | | | 31,226 | | |
Net asset value per share | | $ | 25.36 | | |
Class Z | |
Net assets | | $ | 245,729,659 | | |
Shares outstanding | | | 9,827,670 | | |
Net asset value per share | | $ | 25.00 | | |
(a) The maximum offering price per share is calculated by dividing the net asset value per share by 1.0 minus the maximum sales charge of 5.75%.
(b) Net asset value per share rounds to this amount due to fractional shares outstanding.
The accompanying Notes to Financial Statements are an integral part of this statement.
Semiannual Report 2016
11
COLUMBIA SELECT LARGE-CAP VALUE FUND
STATEMENT OF OPERATIONS
Six Months Ended November 30, 2016 (Unaudited)
Net investment income | |
Income: | |
Dividends — unaffiliated issuers | | $ | 8,796,272 | | |
Dividends — affiliated issuers | | | 9,963 | | |
Total income | | | 8,806,235 | | |
Expenses: | |
Management services fees | | | 2,826,885 | | |
Distribution and/or service fees | |
Class A | | | 272,803 | | |
Class B | | | 3,834 | | |
Class C | | | 339,719 | | |
Class R | | | 59,812 | | |
Class W | | | 31,582 | | |
Transfer agent fees | |
Class A | | | 176,922 | | |
Class B | | | 622 | | |
Class C | | | 55,077 | | |
Class K | | | 5 | | |
Class R | | | 19,382 | | |
Class R4 | | | 23,125 | | |
Class R5 | | | 5,819 | | |
Class W | | | 20,497 | | |
Class Z | | | 193,502 | | |
Plan administration fees | |
Class K | | | 24 | | |
Compensation of board members | | | 11,445 | | |
Custodian fees | | | 4,214 | | |
Printing and postage fees | | | 44,705 | | |
Registration fees | | | 67,352 | | |
Audit fees | | | 14,221 | | |
Legal fees | | | 7,832 | | |
Chief compliance officer expenses | | | 54 | | |
Other | | | 13,663 | | |
Total expenses | | | 4,193,096 | | |
Fees waived or expenses reimbursed by Investment Manager and its affiliates | | | (86,312 | ) | |
Expense reductions | | | (852 | ) | |
Total net expenses | | | 4,105,932 | | |
Net investment income | | | 4,700,303 | | |
Realized and unrealized gain (loss) — net | |
Net realized gain (loss) on: | |
Investments — unaffiliated issuers | | | 31,371,267 | | |
Investments — affiliated issuers | | | 55 | | |
Net realized gain | | | 31,371,322 | | |
Net change in unrealized appreciation (depreciation) on: | |
Investments — unaffiliated issuers | | | 54,791,212 | | |
Investments — affiliated issuers | | | 33 | | |
Net change in unrealized appreciation | | | 54,791,245 | | |
Net realized and unrealized gain | | | 86,162,567 | | |
Net increase in net assets resulting from operations | | $ | 90,862,870 | | |
The accompanying Notes to Financial Statements are an integral part of this statement.
Semiannual Report 2016
12
COLUMBIA SELECT LARGE-CAP VALUE FUND
STATEMENT OF CHANGES IN NET ASSETS
| | | Six Months Ended
November 30, 2016
(Unaudited) | | Year Ended
May 31,
2016 | |
Operations | |
Net investment income | | $ | 4,700,303 | | | $ | 11,707,404 | | |
Net realized gain | | | 31,371,322 | | | | 39,681,645 | | |
Net change in unrealized appreciation (depreciation) | | | 54,791,245 | | | | (97,585,038 | ) | |
Net increase (decrease) in net assets resulting from operations | | | 90,862,870 | | | | (46,195,989 | ) | |
Distributions to shareholders | |
Net investment income | |
Class A | | | — | | | | (3,675,703 | ) | |
Class B | | | — | | | | (7,544 | ) | |
Class C | | | — | | | | (529,501 | ) | |
Class I | | | — | | | | (2,329,298 | ) | |
Class K | | | — | | | | (269 | ) | |
Class R | | | — | | | | (258,421 | ) | |
Class R4 | | | — | | | | (390,019 | ) | |
Class R5 | | | — | | | | (408,110 | ) | |
Class W | | | — | | | | (390,546 | ) | |
Class Y | | | — | | | | (310 | ) | |
Class Z | | | — | | | | (4,943,094 | ) | |
Net realized gains | |
Class A | | | — | | | | (7,389,742 | ) | |
Class B | | | — | | | | (33,910 | ) | |
Class C | | | — | | | | (2,380,229 | ) | |
Class I | | | — | | | | (3,616,709 | ) | |
Class K | | | — | | | | (506 | ) | |
Class R | | | — | | | | (636,876 | ) | |
Class R4 | | | — | | | | (662,113 | ) | |
Class R5 | | | — | | | | (654,490 | ) | |
Class W | | | — | | | | (785,164 | ) | |
Class Y | | | — | | | | (470 | ) | |
Class Z | | | — | | | | (8,391,619 | ) | |
Total distributions to shareholders | | | — | | | | (37,484,643 | ) | |
Decrease in net assets from capital stock activity | | | (97,805,195 | ) | | | (171,986,601 | ) | |
Total decrease in net assets | | | (6,942,325 | ) | | | (255,667,233 | ) | |
Net assets at beginning of period | | | 772,988,165 | | | | 1,028,655,398 | | |
Net assets at end of period | | $ | 766,045,840 | | | $ | 772,988,165 | | |
Undistributed net investment income | | $ | 8,600,936 | | | $ | 3,900,633 | | |
The accompanying Notes to Financial Statements are an integral part of this statement.
Semiannual Report 2016
13
COLUMBIA SELECT LARGE-CAP VALUE FUND
STATEMENT OF CHANGES IN NET ASSETS (continued)
| | | Six Months Ended November 30, 2016
(Unaudited) | | Year Ended May 31, 2016 | |
| | | Shares | | Dollars ($) | | Shares | | Dollars ($) | |
Capital stock activity | |
Class A shares | |
Subscriptions(a) | | | 632,874 | | | | 14,334,128 | | | | 1,937,587 | | | | 40,857,940 | | |
Distributions reinvested | | | — | | | | — | | | | 444,319 | | | | 9,010,782 | | |
Redemptions | | | (1,948,709 | ) | | | (43,366,060 | ) | | | (5,958,479 | ) | | | (125,457,410 | ) | |
Net decrease | | | (1,315,835 | ) | | | (29,031,932 | ) | | | (3,576,573 | ) | | | (75,588,688 | ) | |
Class B shares | |
Subscriptions | | | — | | | | — | | | | 2,629 | | | | 52,850 | | |
Distributions reinvested | | | — | | | | — | | | | 1,558 | | | | 29,361 | | |
Redemptions(a) | | | (8,157 | ) | | | (169,466 | ) | | | (34,399 | ) | | | (681,164 | ) | |
Net decrease | | | (8,157 | ) | | | (169,466 | ) | | | (30,212 | ) | | | (598,953 | ) | |
Class C shares | |
Subscriptions | | | 118,510 | | | | 2,419,789 | | | | 443,511 | | | | 8,643,214 | | |
Distributions reinvested | | | — | | | | — | | | | 105,470 | | | | 1,987,060 | | |
Redemptions | | | (508,111 | ) | | | (10,422,315 | ) | | | (1,347,004 | ) | | | (25,910,580 | ) | |
Net decrease | | | (389,601 | ) | | | (8,002,526 | ) | | | (798,023 | ) | | | (15,280,306 | ) | |
Class I shares | |
Subscriptions | | | 232 | | | | 5,045 | | | | 53,582 | | | | 1,151,332 | | |
Distributions reinvested | | | — | | | | — | | | | 284,492 | | | | 5,945,875 | | |
Redemptions | | | (687,468 | ) | | | (15,959,375 | ) | | | (497,043 | ) | | | (10,734,746 | ) | |
Net decrease | | | (687,236 | ) | | | (15,954,330 | ) | | | (158,969 | ) | | | (3,637,539 | ) | |
Class K shares | |
Distributions reinvested | | | — | | | | — | | | | 31 | | | | 654 | | |
Net increase | | | — | | | | — | | | | 31 | | | | 654 | | |
Class R shares | |
Subscriptions | | | 88,312 | | | | 1,937,617 | | | | 481,440 | | | | 9,819,480 | | |
Distributions reinvested | | | — | | | | — | | | | 16,199 | | | | 324,472 | | |
Redemptions | | | (173,237 | ) | | | (3,826,038 | ) | | | (318,917 | ) | | | (6,642,641 | ) | |
Net increase (decrease) | | | (84,925 | ) | | | (1,888,421 | ) | | | 178,722 | | | | 3,501,311 | | |
Class R4 shares | |
Subscriptions | | | 95,958 | | | | 2,242,253 | | | | 400,587 | | | | 8,813,110 | | |
Distributions reinvested | | | — | | | | — | | | | 34,860 | | | | 737,648 | | |
Redemptions | | | (439,430 | ) | | | (10,200,079 | ) | | | (315,472 | ) | | | (7,140,265 | ) | |
Net increase (decrease) | | | (343,472 | ) | | | (7,957,826 | ) | | | 119,975 | | | | 2,410,493 | | |
Class R5 shares | |
Subscriptions | | | 119,491 | | | | 2,715,974 | | | | 399,306 | | | | 8,750,173 | | |
Distributions reinvested | | | — | | | | — | | | | 50,626 | | | | 1,059,594 | | |
Redemptions | | | (172,889 | ) | | | (3,862,027 | ) | | | (396,089 | ) | | | (8,684,084 | ) | |
Net increase (decrease) | | | (53,398 | ) | | | (1,146,053 | ) | | | 53,843 | | | | 1,125,683 | | |
The accompanying Notes to Financial Statements are an integral part of this statement.
Semiannual Report 2016
14
COLUMBIA SELECT LARGE-CAP VALUE FUND
STATEMENT OF CHANGES IN NET ASSETS (continued)
| | | Six Months Ended November 30, 2016
(Unaudited) | | Year Ended May 31, 2016 | |
| | | Shares | | Dollars ($) | | Shares | | Dollars ($) | |
Capital stock activity (continued) | |
Class W shares | |
Subscriptions | | | 33,497 | | | | 739,986 | | | | 174,991 | | | | 3,711,960 | | |
Distributions reinvested | | | — | | | | — | | | | 58,284 | | | | 1,175,597 | | |
Redemptions | | | (264,419 | ) | | | (5,913,774 | ) | | | (796,084 | ) | | | (16,677,311 | ) | |
Net decrease | | | (230,922 | ) | | | (5,173,788 | ) | | | (562,809 | ) | | | (11,789,754 | ) | |
Class Y shares | |
Subscriptions | | | 2,006 | | | | 46,711 | | | | 35,296 | | | | 738,369 | | |
Distributions reinvested | | | — | | | | — | | | | 32 | | | | 672 | | |
Redemptions | | | (3,531 | ) | | | (82,183 | ) | | | (2,684 | ) | | | (55,161 | ) | |
Net increase (decrease) | | | (1,525 | ) | | | (35,472 | ) | | | 32,644 | | | | 683,880 | | |
Class Z shares | |
Subscriptions | | | 711,665 | | | | 16,355,417 | | | | 2,459,430 | | | | 53,517,584 | | |
Distributions reinvested | | | — | | | | — | | | | 545,369 | | | | 11,414,567 | | |
Redemptions | | | (1,954,069 | ) | | | (44,800,798 | ) | | | (6,528,298 | ) | | | (137,745,533 | ) | |
Net decrease | | | (1,242,404 | ) | | | (28,445,381 | ) | | | (3,523,499 | ) | | | (72,813,382 | ) | |
Total net decrease | | | (4,357,475 | ) | | | (97,805,195 | ) | | | (8,264,870 | ) | | | (171,986,601 | ) | |
(a) Includes conversions of Class B shares to Class A shares, if any.
The accompanying Notes to Financial Statements are an integral part of this statement.
Semiannual Report 2016
15
COLUMBIA SELECT LARGE-CAP VALUE FUND
The following tables are intended to help you understand the Fund's financial performance. Certain information reflects financial results for a single share of a class held for the periods shown. Per share net investment income (loss) amounts are calculated based on average shares outstanding during the period. Total return assumes reinvestment of all dividends and distributions, if any. Total return does not reflect payment of sales charges, if any. Total return and portfolio turnover are not annualized for periods of less than one year. The portfolio turnover rate is calculated without regard to purchase and sales transactions of short-term instruments and certain derivatives, if any. If such transactions were included, the Fund's portfolio turnover rate may be higher.
| | | Six Months Ended
November 30, 2016 | | Year Ended May 31, | | Year Ended
December 31, | |
Class A | | (Unaudited) | | 2016 | | 2015 | | 2014 | | 2013 | | 2012(a) | | 2011 | |
Per share data | |
Net asset value,
beginning of period | | $ | 21.43 | | | $ | 23.18 | | | $ | 22.18 | | | $ | 19.05 | | | $ | 14.31 | | | $ | 14.12 | | | $ | 14.70 | | |
Income from investment
operations: | |
Net investment income | | | 0.13 | | | | 0.27 | | | | 0.23 | | | | 0.19 | | | | 0.19 | | | | 0.06 | | | | 0.12 | | |
Net realized and unrealized
gain (loss) | | | 2.62 | | | | (1.10 | ) | | | 1.33 | | | | 3.61 | | | | 5.31 | | | | 0.13 | | | | (0.28 | ) | |
Total from investment
operations | | | 2.75 | | | | (0.83 | ) | | | 1.56 | | | | 3.80 | | | | 5.50 | | | | 0.19 | | | | (0.16 | ) | |
Less distributions to
shareholders: | |
Net investment income | | | — | | | | (0.30 | ) | | | (0.19 | ) | | | (0.26 | ) | | | (0.21 | ) | | | — | | | | (0.09 | ) | |
Net realized gains | | | — | | | | (0.62 | ) | | | (0.37 | ) | | | (0.41 | ) | | | (0.55 | ) | | | — | | | | (0.33 | ) | |
Total distributions to
shareholders | | | — | | | | (0.92 | ) | | | (0.56 | ) | | | (0.67 | ) | | | (0.76 | ) | | | — | | | | (0.42 | ) | |
Net asset value,
end of period | | $ | 24.18 | | | $ | 21.43 | | | $ | 23.18 | | | $ | 22.18 | | | $ | 19.05 | | | $ | 14.31 | | | $ | 14.12 | | |
Total return | | | 12.83 | % | | | (3.34 | %) | | | 7.08 | % | | | 20.20 | % | | | 39.43 | % | | | 1.35 | % | | | (1.01 | %) | |
Ratios to average
net assets(b) | |
Total gross expenses | | | 1.20 | %(c) | | | 1.21 | %(d) | | | 1.20 | % | | | 1.25 | %(d) | | | 1.34 | % | | | 1.35 | %(c) | | | 1.28 | % | |
Total net expenses(e) | | | 1.18 | %(c)(f) | | | 1.19 | %(d)(f) | | | 1.18 | %(f) | | | 1.18 | %(d)(f) | | | 1.24 | %(f) | | | 1.25 | %(c) | | | 1.26 | %(f) | |
Net investment income | | | 1.16 | %(c) | | | 1.25 | % | | | 1.02 | % | | | 0.92 | % | | | 1.17 | % | | | 0.89 | %(c) | | | 0.81 | % | |
Supplemental data | |
Net assets, end of period
(in thousands) | | $ | 223,078 | | | $ | 225,892 | | | $ | 327,326 | | | $ | 447,665 | | | $ | 300,415 | | | $ | 232,859 | | | $ | 243,514 | | |
Portfolio turnover | | | 2 | % | | | 13 | % | | | 4 | % | | | 8 | % | | | 18 | % | | | 5 | % | | | 14 | % | |
Notes to Financial Highlights
(a) For the period from January 1, 2012 to May 31, 2012. During the period, the Fund's fiscal year end was changed from December 31 to May 31.
(b) In addition to the fees and expenses that the Fund bears directly, the Fund indirectly bears a pro rata share of the fees and expenses of any other funds in which it invests. Such indirect expenses are not included in the Fund's reported expense ratios.
(c) Annualized.
(d) Ratios include line of credit interest expense which is less than 0.01%.
(e) Total net expenses include the impact of certain fee waivers/expense reimbursements made by the Investment Manager and certain of its affiliates, if applicable.
(f) The benefits derived from expense reductions had an impact of less than 0.01%.
The accompanying Notes to Financial Statements are an integral part of this statement.
Semiannual Report 2016
16
COLUMBIA SELECT LARGE-CAP VALUE FUND
FINANCIAL HIGHLIGHTS (continued)
| | | Six Months Ended
November 30, 2016 | | Year Ended May 31, | | Year Ended
December 31, | |
Class B | | (Unaudited) | | 2016 | | 2015 | | 2014 | | 2013 | | 2012(a) | | 2011 | |
Per share data | |
Net asset value, beginning of period | | $ | 19.85 | | | $ | 21.52 | | | $ | 20.62 | | | $ | 17.76 | | | $ | 13.36 | | | $ | 13.23 | | | $ | 13.81 | | |
Income from investment
operations: | |
Net investment income | | | 0.04 | | | | 0.10 | | | | 0.05 | | | | 0.03 | | | | 0.06 | | | | 0.01 | | | | 0.00 | (b) | |
Net realized and unrealized
gain (loss) | | | 2.42 | | | | (1.02 | ) | | | 1.24 | | | | 3.35 | | | | 4.96 | | | | 0.12 | | | | (0.25 | ) | |
Total from investment operations | | | 2.46 | | | | (0.92 | ) | | | 1.29 | | | | 3.38 | | | | 5.02 | | | | 0.13 | | | | (0.25 | ) | |
Less distributions to shareholders: | |
Net investment income | | | — | | | | (0.13 | ) | | | (0.02 | ) | | | (0.11 | ) | | | (0.07 | ) | | | — | | | | — | | |
Net realized gains | | | — | | | | (0.62 | ) | | | (0.37 | ) | | | (0.41 | ) | | | (0.55 | ) | | | — | | | | (0.33 | ) | |
Total distributions to shareholders | | | — | | | | (0.75 | ) | | | (0.39 | ) | | | (0.52 | ) | | | (0.62 | ) | | | — | | | | (0.33 | ) | |
Net asset value, end of period | | $ | 22.31 | | | $ | 19.85 | | | $ | 21.52 | | | $ | 20.62 | | | $ | 17.76 | | | $ | 13.36 | | | $ | 13.23 | | |
Total return | | | 12.39 | % | | | (4.07 | %) | | | 6.30 | % | | | 19.27 | % | | | 38.42 | % | | | 0.98 | % | | | (1.72 | %) | |
Ratios to average net assets(c) | |
Total gross expenses | | | 1.95 | %(d) | | | 1.96 | %(e) | | | 1.96 | % | | | 2.00 | %(e) | | | 2.09 | % | | | 2.10 | %(d) | | | 2.03 | % | |
Total net expenses(f) | | | 1.93 | %(d)(g) | | | 1.94 | %(e)(g) | | | 1.93 | %(g) | | | 1.93 | %(e)(g) | | | 1.99 | %(g) | | | 2.00 | %(d) | | | 2.01 | %(g) | |
Net investment income | | | 0.40 | %(d) | | | 0.49 | % | | | 0.25 | % | | | 0.17 | % | | | 0.42 | % | | | 0.13 | %(d) | | | 0.02 | % | |
Supplemental data | |
Net assets, end of period
(in thousands) | | $ | 732 | | | $ | 813 | | | $ | 1,532 | | | $ | 2,393 | | | $ | 2,472 | | | $ | 2,635 | | | $ | 3,083 | | |
Portfolio turnover | | | 2 | % | | | 13 | % | | | 4 | % | | | 8 | % | | | 18 | % | | | 5 | % | | | 14 | % | |
Notes to Financial Highlights
(a) For the period from January 1, 2012 to May 31, 2012. During the period, the Fund's fiscal year end was changed from December 31 to May 31.
(b) Rounds to zero.
(c) In addition to the fees and expenses that the Fund bears directly, the Fund indirectly bears a pro rata share of the fees and expenses of any other funds in which it invests. Such indirect expenses are not included in the Fund's reported expense ratios.
(d) Annualized.
(e) Ratios include line of credit interest expense which is less than 0.01%.
(f) Total net expenses include the impact of certain fee waivers/expense reimbursements made by the Investment Manager and certain of its affiliates, if applicable.
(g) The benefits derived from expense reductions had an impact of less than 0.01%.
The accompanying Notes to Financial Statements are an integral part of this statement.
Semiannual Report 2016
17
COLUMBIA SELECT LARGE-CAP VALUE FUND
FINANCIAL HIGHLIGHTS (continued)
| | | Six Months Ended
November 30, 2016 | | Year Ended May 31, | | Year Ended
December 31, | |
Class C | | (Unaudited) | | 2016 | | 2015 | | 2014 | | 2013 | | 2012(a) | | 2011 | |
Per share data | |
Net asset value, beginning of
period | | $ | 19.83 | | | $ | 21.51 | | | $ | 20.61 | | | $ | 17.75 | | | $ | 13.37 | | | $ | 13.24 | | | $ | 13.83 | | |
Income from investment
operations: | |
Net investment income | | | 0.04 | | | | 0.10 | | | | 0.06 | | | | 0.03 | | | | 0.06 | | | | 0.01 | | | | 0.01 | | |
Net realized and unrealized
gain (loss) | | | 2.43 | | | | (1.03 | ) | | | 1.23 | | | | 3.35 | | | | 4.97 | | | | 0.12 | | | | (0.27 | ) | |
Total from investment operations | | | 2.47 | | | | (0.93 | ) | | | 1.29 | | | | 3.38 | | | | 5.03 | | | | 0.13 | | | | (0.26 | ) | |
Less distributions to
shareholders: | |
Net investment income | | | — | | | | (0.13 | ) | | | (0.02 | ) | | | (0.11 | ) | | | (0.10 | ) | | | — | | | | — | | |
Net realized gains | | | — | | | | (0.62 | ) | | | (0.37 | ) | | | (0.41 | ) | | | (0.55 | ) | | | — | | | | (0.33 | ) | |
Total distributions to
shareholders | | | — | | | | (0.75 | ) | | | (0.39 | ) | | | (0.52 | ) | | | (0.65 | ) | | | — | | | | (0.33 | ) | |
Net asset value, end of period | | $ | 22.30 | | | $ | 19.83 | | | $ | 21.51 | | | $ | 20.61 | | | $ | 17.75 | | | $ | 13.37 | | | $ | 13.24 | | |
Total return | | | 12.46 | % | | | (4.12 | %) | | | 6.30 | % | | | 19.28 | % | | | 38.51 | % | | | 0.98 | % | | | (1.80 | %) | |
Ratios to average net assets(b) | |
Total gross expenses | | | 1.95 | %(c) | | | 1.96 | %(d) | | | 1.95 | % | | | 2.00 | %(d) | | | 2.09 | % | | | 2.10 | %(c) | | | 2.03 | % | |
Total net expenses(e) | | | 1.93 | %(c)(f) | | | 1.94 | %(d)(f) | | | 1.93 | %(f) | | | 1.93 | %(d)(f) | | | 1.99 | %(f) | | | 2.00 | %(c) | | | 2.01 | %(f) | |
Net investment income | | | 0.41 | %(c) | | | 0.51 | % | | | 0.30 | % | | | 0.17 | % | | | 0.42 | % | | | 0.15 | %(c) | | | 0.06 | % | |
Supplemental data | |
Net assets, end of period
(in thousands) | | $ | 69,340 | | | $ | 69,410 | | | $ | 92,432 | | | $ | 79,365 | | | $ | 53,515 | | | $ | 43,840 | | | $ | 44,484 | | |
Portfolio turnover | | | 2 | % | | | 13 | % | | | 4 | % | | | 8 | % | | | 18 | % | | | 5 | % | | | 14 | % | |
Notes to Financial Highlights
(a) For the period from January 1, 2012 to May 31, 2012. During the period, the Fund's fiscal year end was changed from December 31 to May 31.
(b) In addition to the fees and expenses that the Fund bears directly, the Fund indirectly bears a pro rata share of the fees and expenses of any other funds in which it invests. Such indirect expenses are not included in the Fund's reported expense ratios.
(c) Annualized.
(d) Ratios include line of credit interest expense which is less than 0.01%.
(e) Total net expenses include the impact of certain fee waivers/expense reimbursements made by the Investment Manager and certain of its affiliates, if applicable.
(f) The benefits derived from expense reductions had an impact of less than 0.01%.
The accompanying Notes to Financial Statements are an integral part of this statement.
Semiannual Report 2016
18
COLUMBIA SELECT LARGE-CAP VALUE FUND
FINANCIAL HIGHLIGHTS (continued)
| | | Six Months Ended
November 30, 2016 | | Year Ended May 31, | | Year Ended
December 31, | |
Class I | | (Unaudited) | | 2016 | | 2015 | | 2014 | | 2013 | | 2012(a) | | 2011 | |
Per share data | |
Net asset value, beginning of
period | | $ | 22.12 | | | $ | 23.90 | | | $ | 22.84 | | | $ | 19.60 | | | $ | 14.69 | | | $ | 14.48 | | | $ | 15.07 | | |
Income from investment
operations: | |
Net investment income | | | 0.18 | | | | 0.37 | | | | 0.34 | | | | 0.28 | | | | 0.27 | | | | 0.09 | | | | 0.19 | | |
Net realized and unrealized
gain (loss) | | | 2.70 | | | | (1.14 | ) | | | 1.37 | | | | 3.71 | | | | 5.47 | | | | 0.12 | | | | (0.29 | ) | |
Total from investment operations | | | 2.88 | | | | (0.77 | ) | | | 1.71 | | | | 3.99 | | | | 5.74 | | | | 0.21 | | | | (0.10 | ) | |
Less distributions to shareholders: | |
Net investment income | | | — | | | | (0.39 | ) | | | (0.28 | ) | | | (0.34 | ) | | | (0.28 | ) | | | — | | | | (0.16 | ) | |
Net realized gains | | | — | | | | (0.62 | ) | | | (0.37 | ) | | | (0.41 | ) | | | (0.55 | ) | | | — | | | | (0.33 | ) | |
Total distributions to shareholders | | | — | | | | (1.01 | ) | | | (0.65 | ) | | | (0.75 | ) | | | (0.83 | ) | | | — | | | | (0.49 | ) | |
Net asset value, end of period | | $ | 25.00 | | | $ | 22.12 | | | $ | 23.90 | | | $ | 22.84 | | | $ | 19.60 | | | $ | 14.69 | | | $ | 14.48 | | |
Total return | | | 13.02 | % | | | (2.96 | %) | | | 7.55 | % | | | 20.62 | % | | | 40.13 | % | | | 1.45 | % | | | (0.59 | %) | |
Ratios to average net assets(b) | |
Total gross expenses | | | 0.79 | %(c) | | | 0.79 | %(d) | | | 0.78 | % | | | 0.80 | %(d) | | | 0.83 | % | | | 0.86 | %(c) | | | 0.84 | % | |
Total net expenses(e) | | | 0.79 | %(c) | | | 0.79 | %(d) | | | 0.78 | % | | | 0.78 | %(d) | | | 0.83 | % | | | 0.85 | %(c) | | | 0.84 | % | |
Net investment income | | | 1.55 | %(c) | | | 1.68 | % | | | 1.44 | % | | | 1.32 | % | | | 1.58 | % | | | 1.29 | %(c) | | | 1.29 | % | |
Supplemental data | |
Net assets, end of period
(in thousands) | | $ | 126,308 | | | $ | 126,916 | | | $ | 140,960 | | | $ | 146,724 | | | $ | 135,066 | | | $ | 91,542 | | | $ | 107,682 | | |
Portfolio turnover | | | 2 | % | | | 13 | % | | | 4 | % | | | 8 | % | | | 18 | % | | | 5 | % | | | 14 | % | |
Notes to Financial Highlights
(a) For the period from January 1, 2012 to May 31, 2012. During the period, the Fund's fiscal year end was changed from December 31 to May 31.
(b) In addition to the fees and expenses that the Fund bears directly, the Fund indirectly bears a pro rata share of the fees and expenses of any other funds in which it invests. Such indirect expenses are not included in the Fund's reported expense ratios.
(c) Annualized.
(d) Ratios include line of credit interest expense which is less than 0.01%.
(e) Total net expenses include the impact of certain fee waivers/expense reimbursements made by the Investment Manager and certain of its affiliates, if applicable.
The accompanying Notes to Financial Statements are an integral part of this statement.
Semiannual Report 2016
19
COLUMBIA SELECT LARGE-CAP VALUE FUND
FINANCIAL HIGHLIGHTS (continued)
| | | Six Months Ended
November 30, 2016 | | Year Ended May 31, | | Year Ended
December 31, | |
Class K | | (Unaudited) | | 2016 | | 2015 | | 2014 | | 2013 | | 2012(a) | | 2011 | |
Per share data | |
Net asset value, beginning of period | | $ | 22.04 | | | $ | 23.82 | | | $ | 22.78 | | | $ | 19.55 | | | $ | 14.66 | | | $ | 14.47 | | | $ | 15.06 | | |
Income from investment operations: | |
Net investment income | | | 0.15 | | | | 0.30 | | | | 0.27 | | | | 0.21 | | | | 0.22 | | | | 0.07 | | | | 0.14 | | |
Net realized and unrealized
gain (loss) | | | 2.70 | | | | (1.13 | ) | | | 1.35 | | | | 3.71 | | | | 5.45 | | | | 0.12 | | | | (0.29 | ) | |
Total from investment operations | | | 2.85 | | | | (0.83 | ) | | | 1.62 | | | | 3.92 | | | | 5.67 | | | | 0.19 | | | | (0.15 | ) | |
Less distributions to shareholders: | |
Net investment income | | | — | | | | (0.33 | ) | | | (0.21 | ) | | | (0.28 | ) | | | (0.23 | ) | | | — | | | | (0.11 | ) | |
Net realized gains | | | — | | | | (0.62 | ) | | | (0.37 | ) | | | (0.41 | ) | | | (0.55 | ) | | | — | | | | (0.33 | ) | |
Total distributions to shareholders | | | — | | | | (0.95 | ) | | | (0.58 | ) | | | (0.69 | ) | | | (0.78 | ) | | | — | | | | (0.44 | ) | |
Net asset value, end of period | | $ | 24.89 | | | $ | 22.04 | | | $ | 23.82 | | | $ | 22.78 | | | $ | 19.55 | | | $ | 14.66 | | | $ | 14.47 | | |
Total return | | | 12.93 | % | | | (3.28 | %) | | | 7.17 | % | | | 20.31 | % | | | 39.69 | % | | | 1.31 | % | | | (0.90 | %) | |
Ratios to average net assets(b) | |
Total gross expenses | | | 1.09 | %(c) | | | 1.09 | %(d) | | | 1.08 | % | | | 1.09 | %(d) | | | 1.13 | % | | | 1.14 | %(c) | | | 1.14 | % | |
Total net expenses(e) | | | 1.08 | %(c) | | | 1.09 | %(d) | | | 1.08 | % | | | 1.07 | %(d) | | | 1.13 | % | | | 1.13 | %(c) | | | 1.14 | % | |
Net investment income | | | 1.27 | %(c) | | | 1.38 | % | | | 1.14 | % | | | 1.02 | % | | | 1.28 | % | | | 1.02 | %(c) | | | 0.94 | % | |
Supplemental data | |
Net assets, end of period
(in thousands) | | $ | 21 | | | $ | 19 | | | $ | 20 | | | $ | 18 | | | $ | 31 | | | $ | 22 | | | $ | 22 | | |
Portfolio turnover | | | 2 | % | | | 13 | % | | | 4 | % | | | 8 | % | | | 18 | % | | | 5 | % | | | 14 | % | |
Notes to Financial Highlights
(a) For the period from January 1, 2012 to May 31, 2012. During the period, the Fund's fiscal year end was changed from December 31 to May 31.
(b) In addition to the fees and expenses that the Fund bears directly, the Fund indirectly bears a pro rata share of the fees and expenses of any other funds in which it invests. Such indirect expenses are not included in the Fund's reported expense ratios.
(c) Annualized.
(d) Ratios include line of credit interest expense which is less than 0.01%.
(e) Total net expenses include the impact of certain fee waivers/expense reimbursements made by the Investment Manager and certain of its affiliates, if applicable.
The accompanying Notes to Financial Statements are an integral part of this statement.
Semiannual Report 2016
20
COLUMBIA SELECT LARGE-CAP VALUE FUND
FINANCIAL HIGHLIGHTS (continued)
| | | Six Months Ended
November 30, 2016 | | Year Ended May 31, | | Year Ended
December 31, | |
Class R | | (Unaudited) | | 2016 | | 2015 | | 2014 | | 2013 | | 2012(a) | | 2011 | |
Per share data | |
Net asset value, beginning of
period | | $ | 21.13 | | | $ | 22.87 | | | $ | 21.89 | | | $ | 18.81 | | | $ | 14.15 | | | $ | 13.98 | | | $ | 14.55 | | |
Income from investment
operations: | |
Net investment income | | | 0.10 | | | | 0.22 | | | | 0.18 | | | | 0.14 | | | | 0.15 | | | | 0.04 | | | | 0.08 | | |
Net realized and unrealized
gain (loss) | | | 2.58 | | | | (1.09 | ) | | | 1.30 | | | | 3.56 | | | | 5.24 | | | | 0.13 | | | | (0.27 | ) | |
Total from investment operations | | | 2.68 | | | | (0.87 | ) | | | 1.48 | | | | 3.70 | | | | 5.39 | | | | 0.17 | | | | (0.19 | ) | |
Less distributions to
shareholders: | |
Net investment income | | | — | | | | (0.25 | ) | | | (0.13 | ) | | | (0.21 | ) | | | (0.18 | ) | | | — | | | | (0.05 | ) | |
Net realized gains | | | — | | | | (0.62 | ) | | | (0.37 | ) | | | (0.41 | ) | | | (0.55 | ) | | | — | | | | (0.33 | ) | |
Total distributions to shareholders | | | — | | | | (0.87 | ) | | | (0.50 | ) | | | (0.62 | ) | | | (0.73 | ) | | | — | | | | (0.38 | ) | |
Net asset value, end of period | | $ | 23.81 | | | $ | 21.13 | | | $ | 22.87 | | | $ | 21.89 | | | $ | 18.81 | | | $ | 14.15 | | | $ | 13.98 | | |
Total return | | | 12.68 | % | | | (3.61 | %) | | | 6.82 | % | | | 19.91 | % | | | 39.09 | % | | | 1.22 | % | | | (1.23 | %) | |
Ratios to average net assets(b) | |
Total gross expenses | | | 1.45 | %(c) | | | 1.46 | %(d) | | | 1.45 | % | | | 1.50 | %(d) | | | 1.59 | % | | | 1.60 | %(c) | | | 1.53 | % | |
Total net expenses(e) | | | 1.43 | %(c)(f) | | | 1.44 | %(d)(f) | | | 1.43 | %(f) | | | 1.43 | %(d)(f) | | | 1.49 | %(f) | | | 1.50 | %(c) | | | 1.51 | %(f) | |
Net investment income | | | 0.92 | %(c) | | | 1.05 | % | | | 0.80 | % | | | 0.67 | % | | | 0.95 | % | | | 0.67 | %(c) | | | 0.55 | % | |
Supplemental data | |
Net assets, end of period
(in thousands) | | $ | 24,925 | | | $ | 23,911 | | | $ | 21,793 | | | $ | 19,835 | | | $ | 15,443 | | | $ | 10,773 | | | $ | 9,720 | | |
Portfolio turnover | | | 2 | % | | | 13 | % | | | 4 | % | | | 8 | % | | | 18 | % | | | 5 | % | | | 14 | % | |
Notes to Financial Highlights
(a) For the period from January 1, 2012 to May 31, 2012. During the period, the Fund's fiscal year end was changed from December 31 to May 31.
(b) In addition to the fees and expenses that the Fund bears directly, the Fund indirectly bears a pro rata share of the fees and expenses of any other funds in which it invests. Such indirect expenses are not included in the Fund's reported expense ratios.
(c) Annualized.
(d) Ratios include line of credit interest expense which is less than 0.01%.
(e) Total net expenses include the impact of certain fee waivers/expense reimbursements made by the Investment Manager and certain of its affiliates, if applicable.
(f) The benefits derived from expense reductions had an impact of less than 0.01%.
The accompanying Notes to Financial Statements are an integral part of this statement.
Semiannual Report 2016
21
COLUMBIA SELECT LARGE-CAP VALUE FUND
FINANCIAL HIGHLIGHTS (continued)
| | | Six Months Ended
November 30, 2016 | | Year Ended May 31, | |
Class R4 | | (Unaudited) | | 2016 | | 2015 | | 2014 | | 2013(a) | |
Per share data | |
Net asset value, beginning of period | | $ | 22.38 | | | $ | 24.17 | | | $ | 23.10 | | | $ | 19.81 | | | $ | 16.22 | | |
Income from investment operations: | |
Net investment income | | | 0.16 | | | | 0.34 | | | | 0.35 | | | | 0.25 | | | | 0.17 | | |
Net realized and unrealized gain (loss) | | | 2.75 | | | | (1.15 | ) | | | 1.33 | | | | 3.76 | | | | 4.24 | | |
Total from investment operations | | | 2.91 | | | | (0.81 | ) | | | 1.68 | | | | 4.01 | | | | 4.41 | | |
Less distributions to shareholders: | |
Net investment income | | | — | | | | (0.36 | ) | | | (0.24 | ) | | | (0.31 | ) | | | (0.27 | ) | |
Net realized gains | | | — | | | | (0.62 | ) | | | (0.37 | ) | | | (0.41 | ) | | | (0.55 | ) | |
Total distributions to shareholders | | | — | | | | (0.98 | ) | | | (0.61 | ) | | | (0.72 | ) | | | (0.82 | ) | |
Net asset value, end of period | | $ | 25.29 | | | $ | 22.38 | | | $ | 24.17 | | | $ | 23.10 | | | $ | 19.81 | | |
Total return | | | 13.00 | % | | | (3.11 | %) | | | 7.35 | % | | | 20.51 | % | | | 28.18 | % | |
Ratios to average net assets(b) | |
Total gross expenses | | | 0.95 | %(c) | | | 0.96 | %(d) | | | 0.94 | % | | | 1.00 | %(d) | | | 1.06 | %(c) | |
Total net expenses(e) | | | 0.93 | %(c)(f) | | | 0.94 | %(d)(f) | | | 0.93 | %(f) | | | 0.93 | %(d)(f) | | | 0.95 | %(c) | |
Net investment income | | | 1.36 | %(c) | | | 1.53 | % | | | 1.46 | % | | | 1.15 | % | | | 1.62 | %(c) | |
Supplemental data | |
Net assets, end of period (in thousands) | | $ | 26,152 | | | $ | 30,836 | | | $ | 30,403 | | | $ | 8,237 | | | $ | 1,469 | | |
Portfolio turnover | | | 2 | % | | | 13 | % | | | 4 | % | | | 8 | % | | | 18 | % | |
Notes to Financial Highlights
(a) Based on operations from November 8, 2012 (commencement of operations) through the stated period end.
(b) In addition to the fees and expenses that the Fund bears directly, the Fund indirectly bears a pro rata share of the fees and expenses of any other funds in which it invests. Such indirect expenses are not included in the Fund's reported expense ratios.
(c) Annualized.
(d) Ratios include line of credit interest expense which is less than 0.01%.
(e) Total net expenses include the impact of certain fee waivers/expense reimbursements made by the Investment Manager and certain of its affiliates, if applicable.
(f) The benefits derived from expense reductions had an impact of less than 0.01%.
The accompanying Notes to Financial Statements are an integral part of this statement.
Semiannual Report 2016
22
COLUMBIA SELECT LARGE-CAP VALUE FUND
FINANCIAL HIGHLIGHTS (continued)
| | | Six Months Ended
November 30, 2016 | | Year Ended May 31, | | Year Ended
December 31, | |
Class R5 | | (Unaudited) | | 2016 | | 2015 | | 2014 | | 2013 | | 2012(a) | | 2011 | |
Per share data | |
Net asset value, beginning of
period | | $ | 22.14 | | | $ | 23.92 | | | $ | 22.87 | | | $ | 19.62 | | | $ | 14.71 | | | $ | 14.50 | | | $ | 15.09 | | |
Income from investment
operations: | |
Net investment income | | | 0.17 | | | | 0.36 | | | | 0.37 | | | | 0.25 | | | | 0.28 | | | | 0.09 | | | | 0.18 | | |
Net realized and unrealized
gain (loss) | | | 2.72 | | | | (1.14 | ) | | | 1.32 | | | | 3.74 | | | | 5.44 | | | | 0.12 | | | | (0.28 | ) | |
Total from investment operations | | | 2.89 | | | | (0.78 | ) | | | 1.69 | | | | 3.99 | | | | 5.72 | | | | 0.21 | | | | (0.10 | ) | |
Less distributions to shareholders: | |
Net investment income | | | — | | | | (0.38 | ) | | | (0.27 | ) | | | (0.33 | ) | | | (0.26 | ) | | | — | | | | (0.16 | ) | |
Net realized gains | | | — | | | | (0.62 | ) | | | (0.37 | ) | | | (0.41 | ) | | | (0.55 | ) | | | — | | | | (0.33 | ) | |
Total distributions to shareholders | | | — | | | | (1.00 | ) | | | (0.64 | ) | | | (0.74 | ) | | | (0.81 | ) | | | — | | | | (0.49 | ) | |
Net asset value, end of period | | $ | 25.03 | | | $ | 22.14 | | | $ | 23.92 | | | $ | 22.87 | | | $ | 19.62 | | | $ | 14.71 | | | $ | 14.50 | | |
Total return | | | 13.05 | % | | | (3.01 | %) | | | 7.45 | % | | | 20.61 | % | | | 39.96 | % | | | 1.45 | % | | | (0.62 | %) | |
Ratios to average net assets(b) | |
Total gross expenses | | | 0.84 | %(c) | | | 0.84 | %(d) | | | 0.83 | % | | | 0.85 | %(d) | | | 0.87 | % | | | 0.89 | %(c) | | | 0.87 | % | |
Total net expenses(e) | | | 0.84 | %(c) | | | 0.84 | %(d) | | | 0.83 | % | | | 0.81 | %(d) | | | 0.87 | % | | | 0.88 | %(c) | | | 0.87 | % | |
Net investment income | | | 1.51 | %(c) | | | 1.64 | % | | | 1.58 | % | | | 1.20 | % | | | 1.64 | % | | | 1.31 | %(c) | | | 1.21 | % | |
Supplemental data | |
Net assets, end of period
(in thousands) | | $ | 24,836 | | | $ | 23,155 | | | $ | 23,731 | | | $ | 2,230 | | | $ | 4,014 | | | $ | 1,065 | | | $ | 1,731 | | |
Portfolio turnover | | | 2 | % | | | 13 | % | | | 4 | % | | | 8 | % | | | 18 | % | | | 5 | % | | | 14 | % | |
Notes to Financial Highlights
(a) For the period from January 1, 2012 to May 31, 2012. During the period, the Fund's fiscal year end was changed from December 31 to May 31.
(b) In addition to the fees and expenses that the Fund bears directly, the Fund indirectly bears a pro rata share of the fees and expenses of any other funds in which it invests. Such indirect expenses are not included in the Fund's reported expense ratios.
(c) Annualized.
(d) Ratios include line of credit interest expense which is less than 0.01%.
(e) Total net expenses include the impact of certain fee waivers/expense reimbursements made by the Investment Manager and certain of its affiliates, if applicable.
The accompanying Notes to Financial Statements are an integral part of this statement.
Semiannual Report 2016
23
COLUMBIA SELECT LARGE-CAP VALUE FUND
FINANCIAL HIGHLIGHTS (continued)
| | | Six Months Ended
November 30, 2016 | | Year Ended May 31, | | Year Ended
December 31, | |
Class W | | (Unaudited) | | 2016 | | 2015 | | 2014 | | 2013 | | 2012(a) | | 2011 | |
Per share data | |
Net asset value, beginning of
period | | $ | 21.31 | | | $ | 23.07 | | | $ | 22.07 | | | $ | 18.96 | | | $ | 14.24 | | | $ | 14.06 | | | $ | 14.66 | | |
Income from investment
operations: | |
Net investment income | | | 0.13 | | | | 0.26 | | | | 0.24 | | | | 0.19 | | | | 0.19 | | | | 0.06 | | | | 0.14 | | |
Net realized and unrealized
gain (loss) | | | 2.61 | | | | (1.10 | ) | | | 1.32 | | | | 3.59 | | | | 5.28 | | | | 0.12 | | | | (0.29 | ) | |
Total from investment operations | | | 2.74 | | | | (0.84 | ) | | | 1.56 | | | | 3.78 | | | | 5.47 | | | | 0.18 | | | | (0.15 | ) | |
Less distributions to
shareholders: | |
Net investment income | | | — | | | | (0.30 | ) | | | (0.19 | ) | | | (0.26 | ) | | | (0.20 | ) | | | — | | | | (0.12 | ) | |
Net realized gains | | | — | | | | (0.62 | ) | | | (0.37 | ) | | | (0.41 | ) | | | (0.55 | ) | | | — | | | | (0.33 | ) | |
Total distributions to shareholders | | | — | | | | (0.92 | ) | | | (0.56 | ) | | | (0.67 | ) | | | (0.75 | ) | | | — | | | | (0.45 | ) | |
Net asset value, end of period | | $ | 24.05 | | | $ | 21.31 | | | $ | 23.07 | | | $ | 22.07 | | | $ | 18.96 | | | $ | 14.24 | | | $ | 14.06 | | |
Total return | | | 12.86 | % | | | (3.40 | %) | | | 7.12 | % | | | 20.18 | % | | | 39.38 | % | | | 1.28 | % | | | (0.95 | %) | |
Ratios to average net assets(b) | |
Total gross expenses | | | 1.20 | %(c) | | | 1.21 | %(d) | | | 1.20 | % | | | 1.26 | %(d) | | | 1.35 | % | | | 1.35 | %(c) | | | 1.27 | % | |
Total net expenses(e) | | | 1.18 | %(c)(f) | | | 1.19 | %(d)(f) | | | 1.18 | %(f) | | | 1.18 | %(d)(f) | | | 1.25 | %(f) | | | 1.25 | %(c) | | | 1.25 | %(f) | |
Net investment income | | | 1.15 | %(c) | | | 1.22 | % | | | 1.04 | % | | | 0.92 | % | | | 1.19 | % | | | 0.89 | %(c) | | | 0.97 | % | |
Supplemental data | |
Net assets, end of period
(in thousands) | | $ | 24,133 | | | $ | 26,308 | | | $ | 41,455 | | | $ | 40,475 | | | $ | 144 | | | $ | 30,250 | | | $ | 29,913 | | |
Portfolio turnover | | | 2 | % | | | 13 | % | | | 4 | % | | | 8 | % | | | 18 | % | | | 5 | % | | | 14 | % | |
Notes to Financial Highlights
(a) For the period from January 1, 2012 to May 31, 2012. During the period, the Fund's fiscal year end was changed from December 31 to May 31.
(b) In addition to the fees and expenses that the Fund bears directly, the Fund indirectly bears a pro rata share of the fees and expenses of any other funds in which it invests. Such indirect expenses are not included in the Fund's reported expense ratios.
(c) Annualized.
(d) Ratios include line of credit interest expense which is less than 0.01%.
(e) Total net expenses include the impact of certain fee waivers/expense reimbursements made by the Investment Manager and certain of its affiliates, if applicable.
(f) The benefits derived from expense reductions had an impact of less than 0.01%.
The accompanying Notes to Financial Statements are an integral part of this statement.
Semiannual Report 2016
24
COLUMBIA SELECT LARGE-CAP VALUE FUND
FINANCIAL HIGHLIGHTS (continued)
| | | Six Months Ended
November 30, 2016 | | Year Ended May 31, | |
Class Y | | (Unaudited) | | 2016 | | 2015(a) | |
Per share data | |
Net asset value, beginning of period | | $ | 22.43 | | | $ | 24.23 | | | $ | 23.47 | | |
Income from investment operations: | |
Net investment income | | | 0.18 | | | | 0.41 | | | | 0.26 | | |
Net realized and unrealized gain (loss) | | | 2.75 | | | | (1.19 | ) | | | 1.15 | | |
Total from investment operations | | | 2.93 | | | | (0.78 | ) | | | 1.41 | | |
Less distributions to shareholders: | |
Net investment income | | | — | | | | (0.40 | ) | | | (0.28 | ) | |
Net realized gains | | | — | | | | (0.62 | ) | | | (0.37 | ) | |
Total distributions to shareholders | | | — | | | | (1.02 | ) | | | (0.65 | ) | |
Net asset value, end of period | | $ | 25.36 | | | $ | 22.43 | | | $ | 24.23 | | |
Total return | | | 13.06 | % | | | (2.96 | %) | | | 6.09 | % | |
Ratios to average net assets(b) | |
Total gross expenses | | | 0.79 | %(c) | | | 0.80 | %(d) | | | 0.72 | %(c) | |
Total net expenses(e) | | | 0.79 | %(c) | | | 0.80 | %(d) | | | 0.72 | %(c) | |
Net investment income | | | 1.56 | %(c) | | | 1.93 | % | | | 1.64 | %(c) | |
Supplemental data | |
Net assets, end of period (in thousands) | | $ | 792 | | | $ | 735 | | | $ | 3 | | |
Portfolio turnover | | | 2 | % | | | 13 | % | | | 4 | % | |
Notes to Financial Highlights
(a) Based on operations from October 1, 2014 (commencement of operations) through the stated period end.
(b) In addition to the fees and expenses that the Fund bears directly, the Fund indirectly bears a pro rata share of the fees and expenses of any other funds in which it invests. Such indirect expenses are not included in the Fund's reported expense ratios.
(c) Annualized.
(d) Ratios include line of credit interest expense which is less than 0.01%.
(e) Total net expenses include the impact of certain fee waivers/expense reimbursements made by the Investment Manager and certain of its affiliates, if applicable.
The accompanying Notes to Financial Statements are an integral part of this statement.
Semiannual Report 2016
25
COLUMBIA SELECT LARGE-CAP VALUE FUND
FINANCIAL HIGHLIGHTS (continued)
| | | Six Months Ended
November 30, 2016 | | Year Ended May 31, | | Year Ended
December 31, | |
Class Z | | (Unaudited) | | 2016 | | 2015 | | 2014 | | 2013 | | 2012(a) | | 2011 | |
Per share data | |
Net asset value, beginning
of period | | $ | 22.13 | | | $ | 23.91 | | | $ | 22.86 | | | $ | 19.61 | | | $ | 14.68 | | | $ | 14.48 | | | $ | 15.07 | | |
Income from investment
operations: | |
Net investment income | | | 0.16 | | | | 0.33 | | | | 0.31 | | | | 0.25 | | | | 0.22 | | | | 0.07 | | | | 0.19 | | |
Net realized and unrealized
gain (loss) | | | 2.71 | | | | (1.13 | ) | | | 1.35 | | | | 3.71 | | | | 5.48 | | | | 0.13 | | | | (0.30 | ) | |
Total from investment
operations | | | 2.87 | | | | (0.80 | ) | | | 1.66 | | | | 3.96 | | | | 5.70 | | | | 0.20 | | | | (0.11 | ) | |
Less distributions to
shareholders: | |
Net investment income | | | — | | | | (0.36 | ) | | | (0.24 | ) | | | (0.30 | ) | | | (0.22 | ) | | | — | | | | (0.15 | ) | |
Net realized gains | | | — | | | | (0.62 | ) | | | (0.37 | ) | | | (0.41 | ) | | | (0.55 | ) | | | — | | | | (0.33 | ) | |
Total distributions to
shareholders | | | — | | | | (0.98 | ) | | | (0.61 | ) | | | (0.71 | ) | | | (0.77 | ) | | | — | | | | (0.48 | ) | |
Net asset value, end of
period | | $ | 25.00 | | | $ | 22.13 | | | $ | 23.91 | | | $ | 22.86 | | | $ | 19.61 | | | $ | 14.68 | | | $ | 14.48 | | |
Total return | | | 12.97 | % | | | (3.11 | %) | | | 7.34 | % | | | 20.50 | % | | | 39.84 | % | | | 1.38 | % | | | (0.68 | %) | |
Ratios to average
net assets(b) | |
Total gross expenses | | | 0.95 | %(c) | | | 0.96 | %(d) | | | 0.95 | % | | | 1.00 | %(d) | | | 1.09 | % | | | 1.10 | %(c) | | | 1.02 | % | |
Total net expenses(e) | | | 0.93 | %(c)(f) | | | 0.94 | %(d)(f) | | | 0.93 | %(f) | | | 0.93 | %(d)(f) | | | 0.99 | %(f) | | | 1.00 | %(c) | | | 1.01 | %(f) | |
Net investment income | | | 1.41 | %(c) | | | 1.50 | % | | | 1.33 | % | | | 1.17 | % | | | 1.33 | % | | | 1.12 | %(c) | | | 1.32 | % | |
Supplemental data | |
Net assets, end of period
(in thousands) | | $ | 245,730 | | | $ | 244,994 | | | $ | 348,999 | | | $ | 141,264 | | | $ | 51,667 | | | $ | 55,909 | | | $ | 63,277 | | |
Portfolio turnover | | | 2 | % | | | 13 | % | | | 4 | % | | | 8 | % | | | 18 | % | | | 5 | % | | | 14 | % | |
Notes to Financial Highlights
(a) For the period from January 1, 2012 to May 31, 2012. During the period, the Fund's fiscal year end was changed from December 31 to May 31.
(b) In addition to the fees and expenses that the Fund bears directly, the Fund indirectly bears a pro rata share of the fees and expenses of any other funds in which it invests. Such indirect expenses are not included in the Fund's reported expense ratios.
(c) Annualized.
(d) Ratios include line of credit interest expense which is less than 0.01%.
(e) Total net expenses include the impact of certain fee waivers/expense reimbursements made by the Investment Manager and certain of its affiliates, if applicable.
(f) The benefits derived from expense reductions had an impact of less than 0.01%.
The accompanying Notes to Financial Statements are an integral part of this statement.
Semiannual Report 2016
26
COLUMBIA SELECT LARGE-CAP VALUE FUND
NOTES TO FINANCIAL STATEMENTS
November 30, 2016 (Unaudited)
Note 1. Organization
Columbia Select Large-Cap Value Fund (the Fund), a series of Columbia Funds Series Trust II (the Trust), is a diversified fund. The Trust is registered under the Investment Company Act of 1940, as amended (the 1940 Act), as an open-end management investment company organized as a Massachusetts business trust.
Fund Shares
The Trust may issue an unlimited number of shares (without par value). The Fund offers Class A, Class B, Class C, Class I, Class K, Class R, Class R4, Class R5, Class W, Class Y and Class Z shares. Although all share classes generally have identical voting, dividend and liquidation rights, each share class votes separately when required by the Trust's organizational documents or by law. Different share classes pay different distribution amounts to the extent the expenses of such share classes differ, and distributions in liquidation will be proportional to the net asset value of each share class. Each share class has its own expense and sales charge structure.
Class A shares are subject to a maximum front-end sales charge of 5.75% based on the initial investment amount. Class A shares purchased without an initial sales charge in accounts aggregating $1 million to $50 million at the time of purchase are subject to a contingent deferred sales charge (CDSC) if the shares are sold within 18 months after purchase, charged as follows: 1.00% CDSC if redeemed within 12 months after purchase, and 0.50% CDSC if redeemed more than 12, but less than 18, months after purchase.
Class B shares may be subject to a maximum CDSC of 5.00% based upon the holding period after purchase. Class B shares will generally convert to Class A shares eight years after purchase. The Fund no longer accepts investments by new or existing investors in the Fund's Class B shares, except in connection with the reinvestment of any dividend and/or capital gain distributions in Class B shares of the Fund and exchanges by existing Class B shareholders of certain other funds within the Columbia Family of Funds.
Class C shares are subject to a 1.00% CDSC on shares redeemed within 12 months after purchase.
Class I shares are not subject to sales charges and are available only to the Columbia Family of Funds.
Class K shares are not subject to sales charges, however this share class is closed to new investors.
Class R shares are not subject to sales charges and are generally available only to certain retirement plans and other investors as described in the Fund's prospectus.
Class R4 shares are not subject to sales charges and are generally available only to omnibus retirement plans and certain investors as described in the Fund's prospectus.
Class R5 shares are not subject to sales charges and are generally available only to investors purchasing through authorized investment professionals and omnibus retirement plans.
Class W shares are not subject to sales charges and are generally available only to investors purchasing through authorized investment programs managed by investment professionals, including discretionary managed account programs.
Class Y shares are not subject to sales charges and are generally available only to certain retirement plans as described in the Fund's prospectus.
Class Z shares are not subject to sales charges and are generally available only to eligible investors, which are subject to different investment minimums as described in the Fund's prospectus.
Note 2. Summary of Significant Accounting Policies
Basis of Preparation
The Fund is an investment company that applies the accounting and reporting guidance in the Financial Accounting Standards Board (FASB) Accounting Standards Codification Topic 946, Financial Services — Investment Companies (ASC 946). The financial statements are prepared in accordance with U.S. generally accepted accounting principles (GAAP), which requires management to make certain estimates and assumptions that affect the reported amounts of assets and liabilities, the disclosure of contingent assets and liabilities at the date of the financial statements and the reported amounts of income and expenses during the reporting period. Actual results could differ from those estimates.
The following is a summary of significant accounting policies followed by the Fund in the preparation of its financial statements.
Security Valuation
All equity securities are valued at the close of business of the New York Stock Exchange (NYSE). Equity securities
Semiannual Report 2016
27
COLUMBIA SELECT LARGE-CAP VALUE FUND
NOTES TO FINANCIAL STATEMENTS (continued)
November 30, 2016 (Unaudited)
are valued at the last quoted sales price on the principal exchange or market on which they trade, except for securities traded on the NASDAQ Stock Market, which are valued at the NASDAQ official close price. Unlisted securities or listed securities for which there were no sales during the day are valued at the mean of the latest quoted bid and ask prices on such exchanges or markets.
Investments in open-end investment companies, including money market funds, are valued at their latest net asset value.
Investments for which market quotations are not readily available, or that have quotations which management believes are not reflective of market value or reliable, are valued at fair value as determined in good faith under procedures approved by and under the general supervision of the Board of Trustees (the Board). If a security or class of securities (such as foreign securities) is valued at fair value, such value is likely to be different from the quoted or published price for the security.
The determination of fair value often requires significant judgment. To determine fair value, management may use assumptions including but not limited to future cash flows and estimated risk premiums. Multiple inputs from various sources may be used to determine fair value.
GAAP requires disclosure regarding the inputs and valuation techniques used to measure fair value and any changes in valuation inputs or techniques. In addition, investments shall be disclosed by major category. This information is disclosed following the Fund's Portfolio of Investments.
Security Transactions
Security transactions are accounted for on the trade date. Cost is determined and gains (losses) are based upon the specific identification method for both financial statement and federal income tax purposes.
Income Recognition
Corporate actions and dividend income are recorded on the ex-dividend date.
The Fund may receive distributions from holdings in equity securities, business development companies (BDCs), exchange-traded funds, other regulated investment companies (RICs), and real estate investment trusts (REITs), which report information on the tax character of their distributions annually. These distributions are allocated to dividend income, capital gain and return of capital based on actual information
reported. Return of capital is recorded as a reduction of the cost basis of securities held. If the Fund no longer owns the applicable securities, return of capital is recorded as a realized gain. With respect to REITs, to the extent actual information has not yet been reported, estimates for return of capital are made by the Fund's management. Management's estimates are subsequently adjusted when the actual character of the distributions is disclosed by the REITs, which could result in a proportionate change in return of capital to shareholders.
Awards from class action litigation are recorded as a reduction of cost basis if the Fund still owns the applicable securities on the payment date. If the Fund no longer owns the applicable securities, the proceeds are recorded as realized gains.
Expenses
General expenses of the Trust are allocated to the Fund and other funds of the Trust based upon relative net assets or other expense allocation methodologies determined by the nature of the expense. Expenses directly attributable to the Fund are charged to the Fund. Expenses directly attributable to a specific class of shares are charged to that share class.
Determination of Class Net Asset Value
All income, expenses (other than class-specific expenses, which are charged to that share class, as shown in the Statement of Operations) and realized and unrealized gains (losses) are allocated to each class of the Fund on a daily basis, based on the relative net assets of each class, for purposes of determining the net asset value of each class.
Federal Income Tax Status
The Fund intends to qualify each year as a regulated investment company under Subchapter M of the Internal Revenue Code, as amended, and will distribute substantially all of its taxable income (including net short-term capital gains), if any, for its tax year, and as such will not be subject to federal income taxes. In addition, the Fund intends to distribute in each calendar year substantially all of its net investment income, capital gains and certain other amounts, if any, such that the Fund should not be subject to federal excise tax. Therefore, no federal income or excise tax provision is recorded.
Semiannual Report 2016
28
COLUMBIA SELECT LARGE-CAP VALUE FUND
NOTES TO FINANCIAL STATEMENTS (continued)
November 30, 2016 (Unaudited)
Distributions to Shareholders
Distributions from net investment income, if any, are declared and paid annually. Net realized capital gains, if any, are distributed along with the income distribution. Income distributions and capital gain distributions are determined in accordance with federal income tax regulations, which may differ from GAAP.
Guarantees and Indemnifications
Under the Trust's organizational documents and, in some cases, by contract, its officers and trustees are indemnified against certain liabilities arising out of the performance of their duties to the Trust or its funds. In addition, certain of the Fund's contracts with its service providers contain general indemnification clauses. The Fund's maximum exposure under these arrangements is unknown since the amount of any future claims that may be made against the Fund cannot be determined, and the Fund has no historical basis for predicting the likelihood of any such claims.
Investment Company Reporting Modernization
In October 2016, the U.S. Securities and Exchange Commission adopted new rules and forms, and amendments to certain current rules and forms, to modernize reporting and disclosure of information by registered investment companies. The amendments to Regulation S-X will require standardized, enhanced disclosure about derivatives in investment company financial statements, and will also change the rules governing the form and content of such financial statements. The amendments to Regulation S-X take effect on August 1, 2017. At this time, management is assessing the anticipated impact of these regulatory developments.
Note 3. Fees and Other Transactions with Affiliates
Management Services Fees
The Fund entered into a Management Agreement with Columbia Management Investment Advisers, LLC (the Investment Manager), a wholly-owned subsidiary of Ameriprise Financial, Inc. (Ameriprise Financial). Under the Management Agreement, the Investment Manager provides the Fund with investment research and advice, as well as administrative and accounting services. The management services fee is an annual fee that is equal to a percentage of the Fund's average daily net assets that declines from 0.77% to 0.57% as the Fund's net assets increase. The annualized effective management
services fee rate for the six months ended November 30, 2016 was 0.75% of the Fund's average daily net assets.
Other Expenses
Other expenses are for, among other things, miscellaneous expenses of the Fund or the Board, including payments to Board Services Corp., a company providing limited administrative services to the Fund and the Board. That company's expenses include boardroom and office expense, employee compensation, employee health and retirement benefits, and certain other expenses.
Compensation of Board Members
Board members, who are not officers or employees of the Investment Manager or Ameriprise Financial, are compensated for their services to the Fund as disclosed in the Statement of Operations. Under a Deferred Compensation Plan (the Plan), these Board members may elect to defer payment of up to 100% of their compensation. Deferred amounts are treated as though equivalent dollar amounts had been invested in shares of certain funds managed by the Investment Manager. The Fund's liability for these amounts is adjusted for market value changes and remains in the Fund until distributed in accordance with the Plan. All amounts payable under the Plan constitute a general unsecured obligation of the Fund.
Compensation of Chief Compliance Officer
The Board has appointed a Chief Compliance Officer to the Fund in accordance with federal securities regulations. The Fund is allocated a portion of the expenses associated with the Chief Compliance Officer based on relative net assets of the Trust.
Transfer Agency Fees
Under a Transfer and Dividend Disbursing Agent Agreement, Columbia Management Investment Services Corp. (the Transfer Agent), an affiliate of the Investment Manager and a wholly-owned subsidiary of Ameriprise Financial, is responsible for providing transfer agency services to the Fund. The Transfer Agent has contracted with Boston Financial Data Services (BFDS) to serve as sub-transfer agent. The Transfer Agent pays the fees of BFDS for services as sub-transfer agent and BFDS is not entitled to reimbursement for such fees from the Fund (with the exception of out-of-pocket fees).
The Fund pays the Transfer Agent a monthly transfer agency fee based on the number or the average value of accounts, depending on the type of account. In addition,
Semiannual Report 2016
29
COLUMBIA SELECT LARGE-CAP VALUE FUND
NOTES TO FINANCIAL STATEMENTS (continued)
November 30, 2016 (Unaudited)
prior to October 1, 2016, the Transfer Agent also received sub-transfer agency fees based on a percentage of the average aggregate value of the Fund's shares maintained in omnibus accounts (other than omnibus accounts for which American Enterprise Investment Services Inc. is the broker of record or accounts where the beneficial shareholder is a customer of Ameriprise Financial Services, Inc., for which the Transfer Agent receives a per account fee). Effective October 1, 2016, the Fund pays the Transfer Agent a fee for shareholder services based on the number of accounts or on a percentage of the average aggregate value of the Fund's shares maintained in omnibus accounts up to the lesser of the amount charged by the servicing agent or a cap established by the Board from time to time.
The Transfer Agent also receives compensation from the Fund for various shareholder services and reimbursements for certain out-of-pocket fees. Effective January 1, 2017, total transfer agency fees for Class K and Class R5 shares are subject to an annual limitation of not more than 0.075% of the average daily net assets attributable to each share class. Total transfer agency fees for Class I and Class Y shares are subject to an annual limitation of not more than 0.025% of the average daily net assets attributable to each share class. Prior to January 1, 2017, total transfer agency fees for Class K and Class R5 shares were subject to an annual limitation of not more than 0.05% of the average daily net assets attributable to each share class. Class I and Class Y shares did not pay transfer agency fees.
For the six months ended November 30, 2016, the Fund's annualized effective transfer agency fee rates as a percentage of average daily net assets of each class were as follows:
Class A | | | 0.16 | % | |
Class B | | | 0.16 | | |
Class C | | | 0.16 | | |
Class K | | | 0.05 | | |
Class R | | | 0.16 | | |
Class R4 | | | 0.16 | | |
Class R5 | | | 0.05 | | |
Class W | | | 0.16 | | |
Class Z | | | 0.16 | | |
The Fund and certain other associated investment companies have severally, but not jointly, guaranteed the performance and observance of all the terms and conditions of a lease entered into by Seligman Data Corp. (SDC), the former transfer agent, including the
payment of rent by SDC (the Guaranty). SDC was the legacy Seligman funds' former transfer agent.
The lease and the Guaranty expire in January 2019. At November 30, 2016, the Fund's total potential future obligation over the life of the Guaranty is $57,017. The liability remaining at November 30, 2016 for non-recurring charges associated with the lease amounted to $32,359 and is recorded as a part of the payable for other expenses in the Statement of Assets and Liabilities.
An annual minimum account balance fee of $20 may apply to certain accounts with a value below the applicable share class's initial minimum investment requirements to reduce the impact of small accounts on transfer agency fees. These minimum account balance fees are remitted to the Fund and recorded as part of expense reductions in the Statement of Operations. For the six months ended November 30, 2016, these minimum account balance fees reduced total expenses of the Fund by $852.
Plan Administration Fees
Under a Plan Administration Services Agreement with the Transfer Agent, the Fund pays an annual fee at a rate of 0.25% of the Fund's average daily net assets attributable to Class K shares for the provision of various administrative, recordkeeping, communication and educational services.
Distribution and Service Fees
The Fund has an agreement with Columbia Management Investment Distributors, Inc. (the Distributor), an affiliate of the Investment Manager and a wholly-owned subsidiary of Ameriprise Financial, for distribution and shareholder services. Under a Plan and Agreement of Distribution, the Fund pays a fee at an annual rate of up to 0.25% of the Fund's average daily net assets attributable to Class A and Class W shares, a fee at an annual rate of up to 0.50% of the Fund's average daily net assets attributable to Class R shares (of which up to 0.25% may be used for shareholder services) and a fee at an annual rate of up to 1.00% of the Fund's average daily net assets attributable to Class B and Class C shares. For Class B and Class C shares, of the 1.00% fee, up to 0.75% is reimbursed for distribution expenses.
The amount of distribution and shareholder services expenses incurred by the Distributor and not yet reimbursed (unreimbursed expense) was approximately $17,000 and $2,917,000 for Class B and Class C shares, respectively. These amounts are based on the
Semiannual Report 2016
30
COLUMBIA SELECT LARGE-CAP VALUE FUND
NOTES TO FINANCIAL STATEMENTS (continued)
November 30, 2016 (Unaudited)
most recent information available as of September 30, 2016, and may be recovered from future payments under the distribution plan or CDSCs. To the extent the unreimbursed expense has been fully recovered, the distribution and/or shareholder services fee is reduced.
Sales Charges
Sales charges, including front-end charges and CDSCs, received by the Distributor for distributing Fund shares were $39,757 for Class A, $696 for Class B and $539 for Class C shares for the six months ended November 30, 2016.
Expenses Waived/Reimbursed by the Investment Manager and its Affiliates
The Investment Manager and certain of its affiliates have contractually agreed to waive fees and/or reimburse expenses (excluding certain fees and expenses described below) for the periods disclosed below, unless sooner terminated at the sole discretion of the Board, so that the Fund's net operating expenses, after giving effect to fees waived/expenses reimbursed and any balance credits and/or overdraft charges from the Fund's custodian, do not exceed the following annual rates as a percentage of the class' average daily net assets:
| | | October 1, 2016
Through
September 30, 2017 | | Prior to
October 1, 2016 | |
Class A | | | 1.15 | % | | | 1.19 | % | |
Class B | | | 1.90 | | | | 1.94 | | |
Class C | | | 1.90 | | | | 1.94 | | |
Class I | | | 0.77 | | | | 0.81 | | |
Class K | | | 1.07 | | | | 1.11 | | |
Class R | | | 1.40 | | | | 1.44 | | |
Class R4 | | | 0.90 | | | | 0.94 | | |
Class R5 | | | 0.82 | | | | 0.86 | | |
Class W | | | 1.15 | | | | 1.19 | | |
Class Y | | | 0.77 | | | | 0.81 | | |
Class Z | | | 0.90 | | | | 0.94 | | |
Under the agreement governing these fee waivers and/or expense reimbursement arrangements, the following fees and expenses are excluded from the waiver/reimbursement commitment, and therefore will be paid by the Fund, if applicable: taxes (including foreign transaction taxes), expenses associated with investments in affiliated and non-affiliated pooled investment vehicles (including mutual funds and exchange-traded funds), transaction costs and brokerage commissions, costs related to any securities lending
program, dividend and interest expenses associated with securities sold short, inverse floater program fees and expenses, transaction charges and interest on borrowed money, interest, infrequent and/or unusual expenses and any other expenses the exclusion of which is specifically approved by the Board. This agreement may be modified or amended only with approval from the Investment Manager, certain of its affiliates and the Fund. Any fees waived and/or expenses reimbursed under the expense reimbursement arrangements described above are not recoverable by the Investment Manager or its affiliates in future periods.
Note 4. Federal Tax Information
The timing and character of income and capital gain distributions are determined in accordance with income tax regulations, which may differ from GAAP because of temporary or permanent book to tax differences.
At November 30, 2016, the cost of investments for federal income tax purposes was approximately $457,478,000 and the aggregate gross approximate unrealized appreciation and depreciation based on that cost was:
Unrealized appreciation | | $ | 319,143,000 | | |
Unrealized depreciation | | | (13,557,000 | ) | |
Net unrealized appreciation | | $ | 305,586,000 | | |
Management of the Fund has concluded that there are no significant uncertain tax positions in the Fund that would require recognition in the financial statements. However, management's conclusion may be subject to review and adjustment at a later date based on factors including, but not limited to, new tax laws, regulations, and administrative interpretations (including relevant court decisions). Generally, the Fund's federal tax returns for the prior three fiscal years remain subject to examination by the Internal Revenue Service.
Note 5. Portfolio Information
The cost of purchases and proceeds from sales of securities, excluding short-term investments and derivatives, if any, aggregated to $12,482,332 and $108,460,715, respectively, for the six months ended November 30, 2016. The amount of purchase and sale activity impacts the portfolio turnover rate reported in the Financial Highlights.
Note 6. Affiliated Money Market Fund
The Fund invests in Columbia Short-Term Cash Fund, an affiliated money market fund established for the
Semiannual Report 2016
31
COLUMBIA SELECT LARGE-CAP VALUE FUND
NOTES TO FINANCIAL STATEMENTS (continued)
November 30, 2016 (Unaudited)
exclusive use by the Fund and other affiliated funds (the Affiliated MMF). The income earned by the Fund from such investments is included as Dividends — affiliated issuers in the Statement of Operations. As an investing fund, the Fund indirectly bears its proportionate share of the expenses of the Affiliated MMF. Effective October 1, 2016, the Affiliated MMF prices its shares with a floating net asset value (NAV) and no longer seeks to maintain a stable NAV. In addition, the Board of the Affiliated MMF may impose a fee on redemptions (sometimes referred to as a liquidity fee) or temporarily suspend redemptions (sometimes referred to as imposing a redemption gate) in the event its liquidity falls below regulatory limits.
Note 7. Line of Credit
The Fund has access to a revolving credit facility with a syndicate of banks led by Citibank, N.A., HSBC Bank USA, N.A. and JPMorgan Chase Bank, N.A. whereby the Fund may borrow for the temporary funding of shareholder redemptions or for other temporary or emergency purposes. The credit facility agreement, which is a collective agreement between the Fund and certain other funds managed by the Investment Manager, severally and not jointly, that permits collective borrowings up to $1 billion. Interest is charged to each participating fund based on its borrowings at a rate equal to the higher of (i) the overnight federal funds rate plus 1.00% or (ii) the one-month LIBOR rate plus 1.00%. Each borrowing under the credit facility matures no later than 60 days after the date of borrowing. The Fund also pays a commitment fee equal to its pro rata share of the amount of the credit facility at a rate of 0.15% per annum. The commitment fee is included in other expenses in the Statement of Operations.
The Fund had no borrowings during the six months ended November 30, 2016.
Note 8. Significant Risks
Shareholder Concentration Risk
At November 30, 2016, two unaffiliated shareholders of record owned 35.7% of the outstanding shares of the Fund in one or more accounts. The Fund has no knowledge about whether any portion of those shares was owned beneficially. Affiliated shareholders of record owned 26.1% of the outstanding shares of the Fund in one or more accounts. Subscription and redemption activity by concentrated accounts may have a significant effect on the operations of the Fund. In the case of a large redemption, the Fund may be forced to sell investments at inopportune times, including its liquid or
more liquid positions, resulting in Fund losses and the Fund holding a higher percentage of less liquid or illiquid securities. Large redemptions could result in decreased economies of scale and increased operating expenses for non-redeeming Fund shareholders.
Financial Sector Risk
The Fund may be more susceptible to the particular risks that may affect companies in the financial services sector than if it were invested in a wider variety of companies in unrelated sectors. Companies in the financial services sector are subject to certain risks, including the risk of regulatory change, decreased liquidity in credit markets and unstable interest rates. Such companies may have concentrated portfolios, such as a high level of loans to real estate developers, which makes them vulnerable to economic conditions that affect that industry. Performance of such companies may be affected by competitive pressures and exposure to investments or agreements that, under certain circumstances, may lead to losses (e.g., subprime loans). Companies in the financial services sector are subject to extensive governmental regulation that may limit the amount and types of loans and other financial commitments they can make, and interest rates and fees that they may charge. In addition, profitability of such companies is largely dependent upon the availability and the cost of capital.
Note 9. Subsequent Events
Management has evaluated the events and transactions that have occurred through the date the financial statements were issued and noted no items requiring adjustment of the financial statements or additional disclosure.
Note 10. Information Regarding Pending and Settled Legal Proceedings
Ameriprise Financial and certain of its affiliates have historically been involved in a number of legal, arbitration and regulatory proceedings, including routine litigation, class actions, and governmental actions, concerning matters arising in connection with the conduct of their business activities. Ameriprise Financial believes that the Funds are not currently the subject of, and that neither Ameriprise Financial nor any of its affiliates are the subject of, any pending legal, arbitration or regulatory proceedings that are likely to have a material adverse effect on the Funds or the ability of Ameriprise Financial or its affiliates to perform under their contracts with the Funds. Ameriprise Financial is required to make
Semiannual Report 2016
32
COLUMBIA SELECT LARGE-CAP VALUE FUND
NOTES TO FINANCIAL STATEMENTS (continued)
November 30, 2016 (Unaudited)
quarterly (10-Q), annual (10-K) and, as necessary, 8-K filings with the Securities and Exchange Commission (SEC) on legal and regulatory matters that relate to Ameriprise Financial and its affiliates. Copies of these filings may be obtained by accessing the SEC website at www.sec.gov.
There can be no assurance that these matters, or the adverse publicity associated with them, will not result in increased fund redemptions, reduced sale of fund shares or other adverse consequences to the Funds. Further, although we believe proceedings are not likely to have a material adverse effect on the Funds or the ability of Ameriprise Financial or its affiliates to perform under their contracts with the Funds, these proceedings are subject to uncertainties and, as such, we are unable to estimate the possible loss or range of loss that may result. An adverse outcome in one or more of these proceedings could result in adverse judgments, settlements, fines, penalties or other relief that could have a material adverse effect on the consolidated financial condition or results of operations of Ameriprise Financial.
Semiannual Report 2016
33
COLUMBIA SELECT LARGE-CAP VALUE FUND
APPROVAL OF MANAGEMENT AGREEMENT
Columbia Management Investment Advisers, LLC (Columbia Threadneedle or the Investment Manager, and together with its domestic and global affiliates, Columbia Threadneedle Investments), a wholly-owned subsidiary of Ameriprise Financial, Inc. (Ameriprise Financial), serves as the investment manager to Columbia Select Large-Cap Value Fund (the Fund). Under a management agreement (the Management Agreement), Columbia Threadneedle provides investment advice and other services to the Fund and other funds distributed by Columbia Management Investment Distributors, Inc. (collectively, the Funds).
On an annual basis, the Fund's Board of Trustees (the Board), including the independent Board members (the Independent Trustees), considers renewal of the Management Agreement. Columbia Threadneedle prepared detailed reports for the Board and its Contracts Committee in February, March and April 2016, including reports providing the results of analyses performed by an independent organization, Broadridge Financial Solutions, Inc. (Broadridge), and a comprehensive response to items of information requested by independent legal counsel to the Independent Trustees (Independent Legal Counsel) in a letter to the Investment Manager, to assist the Board in making this determination. Many of the materials presented in February, March and April were first supplied in draft form to designated independent Board representatives, i.e., Independent Legal Counsel, the Chair of the Board and/or the Chair of the Contracts Committee, and the final materials were revised to contain information reflective of discussion and subsequent requests made by the Contracts Committee. In addition, throughout the year, the Board (or its committees) regularly meets with portfolio management teams and senior management personnel and reviews information prepared by Columbia Threadneedle addressing the services Columbia Threadneedle provides and Fund performance. The Board also accords appropriate weight to the work, deliberations and conclusions of the various committees, such as the Contracts Committee, the Investment Review Committee and the Compliance Committee in determining whether to continue the Management Agreement.
The Board, at its June 13-15, 2016 in-person Board meeting (the June Meeting), considered the renewal of the Management Agreement for an additional one-year term. At the June Meeting, Independent Legal Counsel reviewed with the Independent Trustees various factors relevant to the Board's consideration of management agreements and the Board's legal responsibilities related to such consideration. Following an analysis and discussion of the factors identified below, the Board, including all of the Independent Trustees, approved the renewal of the Management Agreement.
Nature, Extent and Quality of Services Provided by Columbia Threadneedle
The Independent Trustees analyzed various reports and presentations they had received detailing the services performed by Columbia Threadneedle, as well as its organization, expertise, resources and capabilities.
The Independent Trustees specifically considered many developments during the past year concerning the services provided by Columbia Threadneedle, including, in particular, the relatively recent change in the leadership of equity department oversight, improvements in technology research and the use of research analysts' model portfolios to highlight best ideas and improve implementation. The Independent Trustees further noted the restructured investment risk management department and its additional resources, including the new head of multi-asset investment risk. They also observed the relatively recent 5P leadership transition, and the additional staff and resources dedicated to the 5P team. The Board also noted the broad scope of services provided by Columbia Threadneedle to each Fund, including, among other services, investment, risk and compliance oversight. The Board also took into account the information it received concerning Columbia Threadneedle's ability to attract and retain key portfolio management personnel.
In connection with the Board's evaluation of the overall package of services provided by Columbia Threadneedle, the Board also considered the nature, quality and range of administrative services provided to the Fund by Columbia Threadneedle, as well as the achievements in 2015 in the performance of administrative services, and noted the various enhancements anticipated for 2016. In evaluating the quality of services provided under the Management Agreement, the Independent Trustees also took into account the organization and strength of the Fund's and its service providers' compliance programs. In addition, the Board reviewed the financial condition of Columbia Threadneedle and its affiliates and each entity's ability to carry out its responsibilities under the Management Agreement and the Fund's other service agreements with affiliates of Ameriprise Financial, observing the financial strength of Ameriprise Financial, with its solid balance sheet.
Semiannual Report 2016
34
COLUMBIA SELECT LARGE-CAP VALUE FUND
APPROVAL OF MANAGEMENT AGREEMENT (continued)
The Board also discussed the acceptability of the terms of the Management Agreement (including the relatively broad scope of services required to be performed by Columbia Threadneedle), noting that no material changes are proposed from the form of agreement previously approved. They also noted the wide array of legal and compliance services provided to the Funds. It was also observed that the services being performed under the Management Agreement were of a reasonably high quality.
Based on the foregoing, and based on other information received (both oral and written, including the information on investment performance referenced below) and other considerations, the Board concluded that Columbia Threadneedle and its affiliates are in a position to continue to provide a high quality and level of services to the Fund.
Investment Performance
For purposes of evaluating the nature, extent and quality of services provided under the Management Agreement, the Board carefully reviewed the investment performance of the Fund. In this regard, the Board considered detailed reports providing the results of analyses performed by an independent organization showing, for various periods, the performance of the Fund, the performance of a benchmark index, the percentage ranking of the Fund among its comparison group and the net assets of the Fund. The Board observed the that the Fund's investment performance was appropriate in light of the particular management style involved and the particular market environment.
Comparative Fees, Costs of Services Provided and the Profits Realized by Columbia Threadneedle and its Affiliates from their Relationships with the Fund
The Board reviewed comparative fees and the costs of services provided under the Management Agreement. The Board members considered detailed comparative information set forth in an annual report on fees and expenses, including, among other things, data (based on analyses conducted by an independent organization) showing a comparison of the Fund's expenses with median expenses paid by funds in its comparative peer universe, as well as data showing the Fund's contribution to Columbia Threadneedle's profitability. The Board reviewed the fees charged to comparable institutional or other accounts/vehicles managed by Columbia Threadneedle and discussed differences in how the products are managed and operated, noting no unreasonable differences in the levels of contractual fees.
The Board considered the reports of its independent fee consultant, JDL Consultants, LLC (JDL), which assisted in its analysis of the Funds' performance and expenses, the reasonableness of the Funds' fee rates, the reasonableness of Columbia Threadneedle's profitability, and JDL's conclusion that the management fees being charged to the Fund are reasonable. The Board accorded particular weight to the notion that the level of fees should generally reflect a rational pricing model applied consistently across the various product lines in the Fund family, while assuring that the overall fees for each Fund (with certain defined exceptions) are generally in line with the "pricing philosophy" currently in effect (i.e., that the total expense ratio of the Fund is generally no higher than the median expense ratio of funds in the comparison universe of the Fund). The Board took into account that the Fund's total expense ratio (after considering proposed expense caps/waivers) approximated the peer universe's median expense ratio. Based on its review, the Board concluded that the Fund's management fee was fair and reasonable in light of the extent and quality of services that the Fund receives.
The Board also considered the expected profitability of Columbia Threadneedle and its affiliates in connection with Columbia Threadneedle providing management services to the Fund. In this regard, the Independent Trustees referred to their detailed analysis of the Profitability Report, discussing the profitability to Columbia Threadneedle and Ameriprise Financial from managing, operating and distributing the Funds. The Board took into account JDL's conclusion that 2015 Columbia Threadneedle profitability, relative to industry competitors, was reasonable. It also considered that in 2015 the Board had concluded that 2014 profitability was reasonable and that Columbia Threadneedle generated 2015 profitability that only slightly exceeded 2014 levels. It also took into account the indirect economic benefits flowing to Columbia Threadneedle or its affiliates in connection with managing or distributing the Funds, such as the enhanced ability to offer various other financial products to
Semiannual Report 2016
35
COLUMBIA SELECT LARGE-CAP VALUE FUND
APPROVAL OF MANAGEMENT AGREEMENT (continued)
Ameriprise Financial customers, soft dollar benefits and overall reputational advantages. The Board noted that the fees paid by the Fund should permit the Investment Manager to offer competitive compensation to its personnel, make necessary investments in its business and earn an appropriate profit. The Board concluded that profitability levels were reasonable.
Economies of Scale to be Realized
The Board also considered the economies of scale that might be realized by Columbia Threadneedle as the Fund grows and took note of the extent to which Fund shareholders might also benefit from such growth. In this regard, the Board took into account that management fees decline as Fund assets exceed various breakpoints, all of which have not been surpassed. The Board concluded that the breakpoints in the management fee rate schedule satisfactorily provides for the sharing of economies of scale, as they allow for adequate opportunity for shareholders to realize benefits (fee breaks) as Fund assets grow.
Based on the foregoing, the Board, including all of the Independent Trustees, concluded that the management fees were fair and reasonable in light of the extent and quality of services provided. In reaching this conclusion, no single factor was determinative. On June 15, 2016, the Board, including all of the Independent Trustees, approved the renewal of the Management Agreement.
Semiannual Report 2016
36
COLUMBIA SELECT LARGE-CAP VALUE FUND
IMPORTANT INFORMATION ABOUT THIS REPORT
Each fund mails one shareholder report to each shareholder address. If you would like more than one report, please call shareholder services at 800.345.6611 and additional reports will be sent to you.
The policy of the Board is to vote the proxies of the companies in which each fund holds investments consistent with the procedures as stated in the Statement of Additional Information (SAI). You may obtain a copy of the SAI without charge by calling 800.345.6611; contacting your financial intermediary; visiting investor.columbiathreadneedleus.com; or searching the website of the Securities and Exchange Commission (SEC) at sec.gov. Information regarding how each fund voted proxies relating to portfolio securities is filed with the SEC by August 31st for the most recent 12-month period ending June 30th of that year, and is available without charge by visiting investor.columbiathreadneedleus.com, or searching the website of the SEC at sec.gov.
Each fund files a complete schedule of portfolio holdings with the SEC for the first and third quarters of each fiscal year on Form N-Q. Each fund's Form N-Q is available on the SEC's website at sec.gov and may be reviewed and copied at the SEC's Public Reference Room in Washington, D.C. Information on the operation of the Public Reference Room may be obtained by calling 800.SEC.0330. Each fund's complete schedule of portfolio holdings, as filed on Form N-Q, can also be obtained without charge, upon request, by calling 800.345.6611.
Semiannual Report 2016
37
Columbia Select Large-Cap Value Fund
P.O. Box 8081
Boston, MA 02266-8081

Please read and consider the investment objectives, risks, charges and expenses for any fund carefully before investing. For a prospectus and summary prospectus, which contains this and other important information about the Fund, go to investor.columbiathreadneedleus.com. The Fund is distributed by Columbia Management Investment Distributors, Inc., member FINRA, and managed by Columbia Management Investment Advisers, LLC.
Columbia Threadneedle Investments (Columbia Threadneedle) is the global brand name of the Columbia and Threadneedle group of companies.
All rights reserved. Columbia Management Investment Distributors, Inc., 225 Franklin Street, Boston, MA 02110-2804
© 2017 Columbia Management Investment Advisers, LLC.
investor.columbiathreadneedleus.com
SAR216_05_G01_(01/17)

SEMIANNUAL REPORT
November 30, 2016

ACTIVE PORTFOLIOS® MULTI-MANAGER VALUE FUND

ABOUT COLUMBIA THREADNEEDLE INVESTMENTS
Columbia Threadneedle Investments is a leading global asset management group that provides a broad range of investment strategies and solutions for individual, institutional and corporate clients around the world.
With more than 2,000 people, including over 450 investment professionals based in North America, Europe and Asia, we manage $460 billion* of assets across developed and emerging market equities, fixed income, asset allocation solutions and alternatives. We are the 13th largest manager of long-term mutual fund assets in the U.S.** and the 4th largest manager of retail funds in the U.K.***
Our priority is the investment success of our clients. We aim to deliver the investment outcomes they expect through an investment approach that is team-based, performance-driven and risk-aware. Our culture is dynamic and interactive. By sharing our insights across asset classes and geographies, we generate richer perspectives on global, regional and local investment landscapes. The ability to exchange and debate investment ideas in a collaborative environment enriches our teams' investment processes. More importantly, it results in better informed investment decisions for our clients.
Columbia funds are distributed by Columbia Management Investment Distributors, Inc., member FINRA, and managed by Columbia Management Investment Advisers, LLC.
Columbia Threadneedle Investments (Columbia Threadneedle) is the global brand name of the Columbia and Threadneedle group of companies.
* In U.S. dollars as of June 30, 2016. Source: Ameriprise Q2 Earnings Release. Includes all assets managed by entities in the Columbia and Threadneedle group of companies. Contact us for more current data.
** Source: ICI as of June 30, 2016 for Columbia Management Investment Advisers, LLC.
*** Source: Investment Association as of March 2016 for Threadneedle Asset Management Limited.
© 2016 Columbia Management Investment Advisers, LLC. All rights reserved.
Not part of the shareholder report
 Dear Shareholders,
While emotions have run high following the outcome of the U.S. Presidential election, it remains unclear how the Trump presidency will unfold in terms of policy. We have a sense of the priorities espoused by the president-elect over the past eighteen months, but campaign priorities are not always realized and are often never pursued. What seems certain is that, while some investors have already priced expectations into the market, others have retreated, preferring instead a wait and see approach. The outcome of such behaviors appears to have created conditions ripe for ongoing market volatility.
While volatility in the financial markets can be stressful, volatility itself is not a new phenomenon. Other factors that have been at the root cause of recent volatility include uncertainty following the United Kingdom's vote to exit the European Union (Brexit), speculation around the Federal Reserve's decision to increase interest rates, divergent central bank policy and geopolitical unrest. The point is, financial markets have fluctuated for years and may be expected to continue to fluctuate — sometimes wildly. If anything, such volatility seems to be the new normal, perhaps exacerbated by access to information and development of technological tools which have enabled investors to react rapidly to real and perceived change. So what can you do?
Position your portfolio for the reality of market volatility
That there is a historical precedent for market volatility, or even an acceptance that it may persist, offers little comfort. A measured and strategic approach remains the best strategy for investors to stay on track in achieving their investment goals.
Step 1: Review your investment goals
Take this opportunity to review your investment goals and the strategies you are pursuing to achieve those goals in order to remain focused on what's important to you. It is entirely possible that your goals have changed in response either to your life situation or to changes in the market. Accept what you can't control — volatility, and focus on what you can — your investment goals and strategies.
Step 2: Reassess your risk tolerance
Sit down with your financial advisor to discuss your investment goals and strategies, as well as any changes to your tolerance for risk. Consider your investment horizon. Increased market volatility and a new investment horizon may impact the strategies that can best help you achieve your investment goals. Remember, achieving your investment goals may require a certain amount of risk. Ultimately, you must maintain vigilance in reassessing your risk tolerance and the strategies you have selected in pursuit of your investment goals, and awareness of how those strategies may react to market volatility.
Step 3: Remain calm and focus on your long-term plan
Remember, investing is about the long game. Short term events are not necessarily evidence of a longer term reality. Investors who attempt to time the market too often end up reacting to a down turn by selling low and then compounding the problem by waiting on the sidelines, ultimately missing the right opportunity to reinvest.
As long as there is a market, there will be volatility. How you respond to that volatility can make a big difference in the measure of your success as an investor. Talk to your financial advisor about how working with Columbia Threadneedle Investments may help you position your portfolio for the reality of ongoing volatility and, perhaps, even turn such volatility into investment opportunity.
Best regards,

Christopher O. Petersen
President, Columbia Funds
Investors should consider the investment objectives, risks, charges and expenses of a mutual fund carefully before investing. For a free prospectus and summary prospectus, which contains this and other important information about a fund, visit investor.columbiathreadneedleus.com. The prospectus should be read carefully before investing.
Columbia Funds are distributed by Columbia Management Investment Distributors, Inc., member FINRA, and managed by Columbia Management Investment Advisers, LLC.
© 2017 Columbia Management Investment Advisers, LLC. All rights reserved.
ACTIVE PORTFOLIOS® MULTI-MANAGER VALUE FUND
Fund Investment Manager
Columbia Management Investment
Advisers, LLC
225 Franklin Street
Boston, MA 02110
Fund Distributor
Columbia Management Investment
Distributors, Inc.
225 Franklin Street
Boston, MA 02110
Fund Transfer Agent
Columbia Management Investment
Services Corp.
P.O. Box 8081
Boston, MA 02266-8081
For more information about any of the funds, please visit investor.columbiathreadneedleus.com or call 800.345.6611. Customer Service Representatives are available to answer your questions Monday through Friday from 8 a.m. to 7 p.m. Eastern time.
The views expressed in this report reflect the current views of the respective parties. These views are not guarantees of future performance and involve certain risks, uncertainties and assumptions that are difficult to predict, so actual outcomes and results may differ significantly from the views expressed. These views are subject to change at any time based upon economic, market or other conditions and the respective parties disclaim any responsibility to update such views. These views may not be relied on as investment advice and, because investment decisions for a Columbia fund are based on numerous factors, may not be relied on as an indication of trading intent on behalf of any particular Columbia fund. References to specific securities should not be construed as a recommendation or investment advice.
Performance Overview | | | 3 | | |
Portfolio Overview | | | 4 | | |
Understanding Your Fund's Expenses | | | 5 | | |
Portfolio of Investments | | | 6 | | |
Statement of Assets and Liabilities | | | 16 | | |
Statement of Operations | | | 17 | | |
Statement of Changes in Net Assets | | | 18 | | |
Financial Highlights | | | 19 | | |
Notes to Financial Statements | | | 20 | | |
Approval of Management Agreement and Subadvisory
Agreement with Dimensional Fund Advisors LP | | | 28 | | |
Approval of the Subadvisory Agreement with
Diamond Hill Capital Management, Inc. | | | 31 | | |
Important Information About This Report | | | 33 | | |
ACTIVE PORTFOLIOS® MULTI-MANAGER VALUE FUND
PERFORMANCE OVERVIEW
(Unaudited)
Performance Summary
n Active Portfolios® Multi-Manager Value Fund (the Fund) Class A shares returned 8.77% for the six-month period that ended November 30, 2016.
n The Fund outperformed its benchmark, the Russell 1000 Value Index, which returned 8.63% for the same time period.
Average Annual Total Returns (%) (for period ended November 30, 2016)
| | | Inception | | 6 Months
Cumulative | | 1 Year | | Life | |
Class A | | 04/20/12 | | | 8.77 | | | | 11.89 | | | | 11.31 | | |
Russell 1000 Value Index | | | | | 8.63 | | | | 12.02 | | | | 13.48 | | |
All results shown assume reinvestment of distributions during the period. Returns do not reflect the deduction of taxes that a shareholder may pay on Fund distributions or on the redemption of Fund shares. Performance results reflect the effect of any fee waivers or reimbursements of Fund expenses by Columbia Management Investment Advisers, LLC and/or any of its affiliates. Absent these fee waivers or expense reimbursement arrangements, performance results would have been lower.
The performance information shown represents past performance and is not a guarantee of future results. The investment return and principal value of your investment will fluctuate so that your shares, when redeemed, may be worth more or less than their original cost. Current performance may be lower or higher than the performance information shown. You may obtain performance information current to the most recent month-end by contacting your financial intermediary, visiting investor.columbiathreadneedleus.com or calling 800.345.6611.
The Russell 1000 Value Index, an unmanaged index, measures the performance of those stocks in the Russell 1000 Index with lower price-to-book ratios and lower forecasted growth values.
Indices are not available for investment, are not professionally managed and do not reflect sales charges, fees, brokerage commissions, taxes or other expenses of investing. Securities in the Fund may not match those in an index.
Semiannual Report 2016
3
ACTIVE PORTFOLIOS® MULTI-MANAGER VALUE FUND
PORTFOLIO OVERVIEW
(Unaudited)
Portfolio Management
Columbia Management Investment Advisers, LLC
Scott Davis
Michael Barclay, CFA
Peter Santoro, CFA
Diamond Hill Capital Management, Inc.*
Charles Bath, CFA
Austin Hawley, CFA
Christopher Welch, CFA
*Effective October 2016, Diamond Hill Capital Management, Inc. was added as a subadvisor to the Fund.
Dimensional Fund Advisors LP
Joseph Chi, CFA
Jed Fogdall
Henry Gray
Lukas Smart, CFA
Morningstar Style BoxTM

The Morningstar Style BoxTM is based on a fund's portfolio holdings. For equity funds, the vertical axis shows the market capitalization of the stocks owned, and the horizontal axis shows investment style (value, blend, or growth). Information shown is based on the most recent data provided by Morningstar.
©2017 Morningstar, Inc. All rights reserved. The Morningstar information contained herein: (1) is proprietary to Morningstar and/or its content providers; (2) may not be copied or distributed; and (3) is not warranted to be accurate, complete or timely. Neither Morningstar nor its content providers are responsible for any damages or losses arising from any use of this information.
Top Ten Holdings (%)
(at November 30, 2016) | |
JPMorgan Chase & Co. | | | 3.7 | | |
Cisco Systems, Inc. | | | 2.5 | | |
Pfizer, Inc. | | | 2.5 | | |
Comcast Corp., Class A | | | 2.4 | | |
Exxon Mobil Corp. | | | 2.3 | | |
Citigroup, Inc. | | | 2.2 | | |
Microsoft Corp. | | | 2.0 | | |
Morgan Stanley | | | 1.5 | | |
Apple, Inc. | | | 1.5 | | |
Intel Corp. | | | 1.4 | | |
Percentages indicated are based upon total investments (excluding Money Market Funds).
For further detail about these holdings, please refer to the section entitled "Portfolio of Investments."
Fund holdings are as of the date given, are subject to change at any time, and are not recommendations to buy or sell any security.
Portfolio Breakdown (%)
(at November 30, 2016) | |
Common Stocks | | | 98.6 | | |
Convertible Preferred Stocks | | | 0.1 | | |
Exchange-Traded Funds | | | 0.6 | | |
Money Market Funds | | | 0.7 | | |
Total | | | 100.0 | | |
Percentages indicated are based upon total investments. The Fund's portfolio composition is subject to change.
Equity Sector Breakdown (%)
(at November 30, 2016) | |
Consumer Discretionary | | | 15.0 | | |
Consumer Staples | | | 8.1 | | |
Energy | | | 8.5 | | |
Financials | | | 23.5 | | |
Health Care | | | 12.2 | | |
Industrials | | | 10.3 | | |
Information Technology | | | 14.0 | | |
Materials | | | 3.6 | | |
Real Estate | | | 1.0 | | |
Telecommunication Services | | | 2.4 | | |
Utilities | | | 1.4 | | |
Total | | | 100.0 | | |
Percentages indicated are based upon total equity investments. The Fund's portfolio composition is subject to change.
Semiannual Report 2016
4
ACTIVE PORTFOLIOS® MULTI-MANAGER VALUE FUND
UNDERSTANDING YOUR FUND'S EXPENSES
(Unaudited)
As an investor, you incur two types of costs. There are transaction costs, which generally include sales charges on purchases and may include redemption fees. There are also ongoing costs, which generally include management fees, distribution and/or service fees, and other fund expenses. The following information is intended to help you understand your ongoing costs (in dollars) of investing in the Fund and to help you compare these costs with the ongoing costs of investing in other mutual funds.
Analyzing Your Fund's Expenses
To illustrate these ongoing costs, we have provided examples and calculated the expenses paid by investors in each share class of the Fund during the period. The actual and hypothetical information in the table is based on an initial investment of $1,000 at the beginning of the period indicated and held for the entire period. Expense information is calculated two ways and each method provides you with different information. The amount listed in the "Actual" column is calculated using the Fund's actual operating expenses and total return for the period. You may use the Actual information, together with the amount invested, to estimate the expenses that you paid over the period. Simply divide your account value by $1,000 (for example, an $8,600 account value divided by $1,000 = 8.6), then multiply the results by the expenses paid during the period under the "Actual" column. The amount listed in the "Hypothetical" column assumes a 5% annual rate of return before expenses (which is not the Fund's actual return) and then applies the Fund's actual expense ratio for the period to the hypothetical return. You should not use the hypothetical account values and expenses to estimate either your actual account balance at the end of the period or the expenses you paid during the period. See "Compare With Other Funds" below for details on how to use the hypothetical data.
Compare With Other Funds
Since all mutual funds are required to include the same hypothetical calculations about expenses in shareholder reports, you can use this information to compare the ongoing cost of investing in the Fund with other funds. To do so, compare the hypothetical example with the 5% hypothetical examples that appear in the shareholder reports of other funds. As you compare hypothetical examples of other funds, it is important to note that hypothetical examples are meant to highlight the ongoing costs of investing in a fund only and do not reflect any transaction costs, such as sales charges, or redemption or exchange fees. Therefore, the hypothetical calculations are useful in comparing ongoing costs only, and will not help you determine the relative total costs of owning different funds. If transaction costs were included in these calculations, your costs would be higher.
June 1, 2016 – November 30, 2016
| | | Account Value at the Beginning
of the Period ($) | | Account Value at the End of the
Period ($) | | Expenses Paid During the
Period ($) | | Fund's Annualized
Expense Ratio (%) | |
| | | Actual | | Hypothetical | | Actual | | Hypothetical | | Actual | | Hypothetical | | Actual | |
Class A | | | 1,000.00 | | | | 1,000.00 | | | | 1,087.70 | | | | 1,019.65 | | | | 5.65 | | | | 5.47 | | | | 1.08 | | |
Expenses paid during the period are equal to the annualized expense ratio for each class as indicated above, multiplied by the average account value over the period and then multiplied by the number of days in the Fund's most recent fiscal half year and divided by 365.
Expenses do not include fees and expenses incurred indirectly by the Fund from its investment in underlying funds, including affiliated and non-affiliated pooled investment vehicles, such as mutual funds and exchange-traded funds.
Class A shares of the Fund are available only to certain eligible investors through certain wrap fee programs sponsored and/or managed by Ameriprise Financial, Inc. or its affiliates. Participants in wrap fee programs pay other fees that are not included in the above table. Please refer to the wrap program documents for information about the fees charged.
Semiannual Report 2016
5
ACTIVE PORTFOLIOS® MULTI-MANAGER VALUE FUND
PORTFOLIO OF INVESTMENTS
November 30, 2016 (Unaudited)
(Percentages represent value of investments compared to net assets)
Common Stocks 98.5%
Issuer | | Shares | | Value ($) | |
CONSUMER DISCRETIONARY 14.8% | |
Auto Components 1.2% | |
Adient PLC(a) | | | 1,166 | | | | 62,451 | | |
BorgWarner, Inc. | | | 438,085 | | | | 15,595,826 | | |
Gentex Corp. | | | 21,948 | | | | 405,819 | | |
Goodyear Tire & Rubber Co. (The) | | | 422,206 | | | | 12,957,502 | | |
Lear Corp. | | | 7,251 | | | | 939,077 | | |
Total | | | | | 29,960,675 | | |
Automobiles 1.3% | |
Ford Motor Co. | | | 2,024,744 | | | | 24,215,938 | | |
General Motors Co. | | | 229,075 | | | | 7,909,960 | | |
Total | | | | | 32,125,898 | | |
Distributors 0.2% | |
Genuine Parts Co. | | | 43,580 | | | | 4,193,703 | | |
LKQ Corp.(a) | | | 10,344 | | | | 339,594 | | |
Total | | | | | 4,533,297 | | |
Hotels, Restaurants & Leisure 0.8% | |
Carnival Corp. | | | 56,747 | | | | 2,917,363 | | |
Hyatt Hotels Corp., Class A(a) | | | 6,821 | | | | 350,190 | | |
McDonald's Corp. | | | 50,940 | | | | 6,075,614 | | |
MGM Resorts International(a) | | | 170,994 | | | | 4,909,238 | | |
Norwegian Cruise Line Holdings Ltd.(a) | | | 20,924 | | | | 832,984 | | |
Royal Caribbean Cruises Ltd. | | | 61,006 | | | | 4,939,656 | | |
Total | | | | | 20,025,045 | | |
Household Durables 1.5% | |
CalAtlantic Group, Inc. | | | 26,536 | | | | 886,037 | | |
D.R. Horton, Inc. | | | 129,927 | | | | 3,601,577 | | |
Garmin Ltd. | | | 31,702 | | | | 1,653,576 | | |
Harman International Industries, Inc. | | | 19,647 | | | | 2,148,792 | | |
Lennar Corp., Class A | | | 59,016 | | | | 2,510,541 | | |
Lennar Corp., Class B | | | 1,697 | | | | 57,511 | | |
Mohawk Industries, Inc.(a) | | | 15,221 | | | | 3,005,234 | | |
Newell Brands, Inc. | | | 20,427 | | | | 960,273 | | |
PulteGroup, Inc. | | | 111,051 | | | | 2,094,422 | | |
Toll Brothers, Inc.(a) | | | 16,989 | | | | 503,894 | | |
Whirlpool Corp. | | | 116,704 | | | | 18,957,398 | | |
Total | | | | | 36,379,255 | | |
Common Stocks (continued)
Issuer | | Shares | | Value ($) | |
Internet & Direct Marketing Retail 0.1% | |
Liberty Interactive Corp., Class A(a) | | | 116,948 | | | | 2,421,993 | | |
Media 6.2% | |
21st Century Fox, Inc., Class B | | | 336,270 | | | | 9,435,736 | | |
Charter Communications, Inc.,
Class A(a) | | | 86,344 | | | | 23,771,367 | | |
Comcast Corp., Class A | | | 831,007 | | | | 57,763,297 | | |
Interpublic Group of
Companies, Inc. (The) | | | 150,240 | | | | 3,616,277 | | |
Liberty Braves Group, Class A(a) | | | 1,225 | | | | 24,684 | | |
Liberty Braves Group, Class C(a) | | | 2,489 | | | | 49,456 | | |
Liberty Broadband Corp. Class A(a) | | | 3,332 | | | | 231,674 | | |
Liberty Broadband Corp. Class C(a) | | | 17,711 | | | | 1,262,971 | | |
Liberty Media Group LLC, Class A(a) | | | 3,064 | | | | 95,873 | | |
Liberty Media Group LLC, Class C(a) | | | 6,222 | | | | 193,815 | | |
Liberty SiriusXM Group, Class A(a) | | | 10,543 | | | | 382,711 | | |
Liberty SiriusXM Group, Class C(a) | | | 18,026 | | | | 644,610 | | |
Madison Square Garden Co. (The),
Class A(a) | | | 2,539 | | | | 440,872 | | |
News Corp., Class A | | | 33,401 | | | | 386,115 | | |
News Corp., Class B | | | 22,496 | | | | 268,827 | | |
TEGNA, Inc. | | | 422,557 | | | | 9,477,953 | | |
Time Warner, Inc. | | | 246,401 | | | | 22,624,540 | | |
Walt Disney Co. (The) | | | 222,025 | | | | 22,007,118 | | |
Total | | | | | 152,677,896 | | |
Multiline Retail 0.2% | |
Kohl's Corp. | | | 54,352 | | | | 2,925,768 | | |
Macy's, Inc. | | | 44,146 | | | | 1,862,962 | | |
Total | | | | | 4,788,730 | | |
Specialty Retail 2.0% | |
AutoNation, Inc.(a) | | | 29,085 | | | | 1,298,936 | | |
Bed Bath & Beyond, Inc. | | | 6,652 | | | | 298,076 | | |
Best Buy Co., Inc. | | | 97,652 | | | | 4,462,696 | | |
Home Depot, Inc. (The) | | | 125,745 | | | | 16,271,403 | | |
Penske Automotive Group, Inc. | | | 5,514 | | | | 275,204 | | |
Staples, Inc. | | | 83,866 | | | | 810,984 | | |
TJX Companies, Inc. (The) | | | 335,960 | | | | 26,319,107 | | |
Total | | | | | 49,736,406 | | |
The accompanying Notes to Financial Statements are an integral part of this statement.
Semiannual Report 2016
6
ACTIVE PORTFOLIOS® MULTI-MANAGER VALUE FUND
PORTFOLIO OF INVESTMENTS (continued)
November 30, 2016 (Unaudited)
Common Stocks (continued)
Issuer | | Shares | | Value ($) | |
Textiles, Apparel & Luxury Goods 1.3% | |
Hanesbrands, Inc. | | | 468,400 | | | | 10,880,932 | | |
PVH Corp. | | | 23,614 | | | | 2,501,667 | | |
Ralph Lauren Corp. | | | 17,711 | | | | 1,852,748 | | |
VF Corp. | | | 281,430 | | | | 15,340,749 | | |
Total | | | | | 30,576,096 | | |
Total Consumer Discretionary | | | | | 363,225,291 | | |
CONSUMER STAPLES 8.0% | |
Beverages 1.0% | |
Coca-Cola European Partners PLC | | | 92,185 | | | | 2,992,325 | | |
Molson Coors Brewing Co., Class B | | | 22,821 | | | | 2,237,142 | | |
PepsiCo, Inc. | | | 197,827 | | | | 19,802,483 | | |
Total | | | | | 25,031,950 | | |
Food & Staples Retailing 1.3% | |
CVS Health Corp. | | | 261,162 | | | | 20,080,746 | | |
Safeway, Inc. Casa Ley CVR(a)(b) | | | 60,717 | | | | 61,622 | | |
Safeway, Inc. PDC CVR(a)(b) | | | 60,717 | | | | 2,963 | | |
Wal-Mart Stores, Inc. | | | 147,246 | | | | 10,370,536 | | |
Walgreens Boots Alliance, Inc. | | | 1,371 | | | | 116,165 | | |
Whole Foods Market, Inc. | | | 40,434 | | | | 1,228,789 | | |
Total | | | | | 31,860,821 | | |
Food Products 1.3% | |
Archer-Daniels-Midland Co. | | | 94,973 | | | | 4,105,683 | | |
Bunge Ltd. | | | 45,343 | | | | 3,096,020 | | |
General Mills, Inc. | | | 118,390 | | | | 7,214,687 | | |
Ingredion, Inc. | | | 1,574 | | | | 184,756 | | |
JM Smucker Co. (The) | | | 28,672 | | | | 3,611,238 | | |
Kraft Heinz Co. (The) | | | 29,579 | | | | 2,415,125 | | |
Mondelez International, Inc., Class A | | | 148,320 | | | | 6,116,717 | | |
Pinnacle Foods, Inc. | | | 14,551 | | | | 721,148 | | |
Post Holdings, Inc.(a) | | | 14,121 | | | | 1,077,856 | | |
Seaboard Corp.(a) | | | 3 | | | | 12,279 | | |
TreeHouse Foods, Inc.(a) | | | 6,134 | | | | 425,209 | | |
Tyson Foods, Inc., Class A | | | 33,992 | | | | 1,931,085 | | |
Total | | | | | 30,911,803 | | |
Household Products 2.4% | |
Energizer Holdings, Inc. | | | 1,679 | | | | 75,336 | | |
Kimberly-Clark Corp. | | | 228,575 | | | | 26,425,556 | | |
Procter & Gamble Co. (The) | | | 389,665 | | | | 32,131,776 | | |
Total | | | | | 58,632,668 | | |
Common Stocks (continued)
Issuer | | Shares | | Value ($) | |
Personal Products 0.4% | |
Coty, Inc. Class A | | | 505,875 | | | | 9,464,921 | | |
Edgewell Personal Care Co.(a) | | | 4,574 | | | | 361,987 | | |
Total | | | | | 9,826,908 | | |
Tobacco 1.6% | |
Altria Group, Inc. | | | 217,750 | | | | 13,920,757 | | |
Philip Morris International, Inc. | | | 299,635 | | | | 26,451,778 | | |
Total | | | | | 40,372,535 | | |
Total Consumer Staples | | | | | 196,636,685 | | |
ENERGY 8.3% | |
Energy Equipment & Services 1.0% | |
Baker Hughes, Inc. | | | 37,375 | | | | 2,404,334 | | |
FMC Technologies, Inc.(a) | | | 31,101 | | | | 1,065,520 | | |
Helmerich & Payne, Inc. | | | 25,143 | | | | 1,902,068 | | |
National Oilwell Varco, Inc. | | | 63,705 | | | | 2,380,019 | | |
Schlumberger Ltd. | | | 181,675 | | | | 15,269,784 | | |
Transocean Ltd.(a) | | | 107,624 | | | | 1,388,349 | | |
Weatherford International PLC(a) | | | 113,697 | | | | 580,992 | | |
Total | | | | | 24,991,066 | | |
Oil, Gas & Consumable Fuels 7.3% | |
Anadarko Petroleum Corp. | | | 43,772 | | | | 3,026,834 | | |
Antero Resources Corp.(a) | | | 46,804 | | | | 1,146,230 | | |
Apache Corp. | | | 8,978 | | | | 592,099 | | |
Chevron Corp. | | | 234,180 | | | | 26,125,121 | | |
Cimarex Energy Co. | | | 133,290 | | | | 18,378,025 | | |
Concho Resources, Inc.(a) | | | 11,077 | | | | 1,584,233 | | |
ConocoPhillips | | | 121,048 | | | | 5,873,249 | | |
Continental Resources, Inc.(a) | | | 1,548 | | | | 89,799 | | |
EOG Resources, Inc. | | | 112,048 | | | | 11,487,161 | | |
Exxon Mobil Corp. | | | 631,913 | | | | 55,166,005 | | |
Hess Corp. | | | 39,424 | | | | 2,206,167 | | |
HollyFrontier Corp. | | | 24,891 | | | | 716,114 | | |
Kinder Morgan, Inc. | | | 90,165 | | | | 2,001,663 | | |
Marathon Oil Corp. | | | 126,197 | | | | 2,279,118 | | |
Marathon Petroleum Corp. | | | 92,268 | | | | 4,338,441 | | |
Murphy Oil Corp. | | | 18,032 | | | | 611,465 | | |
Noble Energy, Inc. | | | 44,996 | | | | 1,717,047 | | |
Occidental Petroleum Corp. | | | 148,568 | | | | 10,601,812 | | |
Phillips 66 | | | 82,112 | | | | 6,821,865 | | |
The accompanying Notes to Financial Statements are an integral part of this statement.
Semiannual Report 2016
7
ACTIVE PORTFOLIOS® MULTI-MANAGER VALUE FUND
PORTFOLIO OF INVESTMENTS (continued)
November 30, 2016 (Unaudited)
Common Stocks (continued)
Issuer | | Shares | | Value ($) | |
Pioneer Natural Resources Co. | | | 8,467 | | | | 1,617,536 | | |
Southwestern Energy Co.(a) | | | 34,586 | | | | 392,551 | | |
Suncor Energy, Inc. | | | 128,175 | | | | 4,083,656 | | |
Targa Resources Corp. | | | 73,837 | | | | 3,934,774 | | |
Tesoro Corp. | | | 38,796 | | | | 3,156,055 | | |
Valero Energy Corp. | | | 169,415 | | | | 10,429,187 | | |
WPX Energy, Inc.(a) | | | 38,510 | | | | 598,445 | | |
Total | | | | | 178,974,652 | | |
Total Energy | | | | | 203,965,718 | | |
FINANCIALS 23.2% | |
Banks 11.0% | |
Bank of America Corp. | | | 1,009,437 | | | | 21,319,309 | | |
BB&T Corp. | | | 203,420 | | | | 9,204,755 | | |
BOK Financial Corp. | | | 6,972 | | | | 559,991 | | |
CIT Group, Inc. | | | 23,827 | | | | 973,333 | | |
Citigroup, Inc. | | | 936,035 | | | | 52,783,014 | | |
Citizens Financial Group, Inc. | | | 50,472 | | | | 1,691,317 | | |
Comerica, Inc. | | | 19,853 | | | | 1,265,629 | | |
Fifth Third Bancorp | | | 224,292 | | | | 5,836,078 | | |
Huntington Bancshares, Inc. | | | 228,516 | | | | 2,847,309 | | |
JPMorgan Chase & Co. | | | 1,133,116 | | | | 90,841,910 | | |
KeyCorp | | | 146,351 | | | | 2,533,336 | | |
M&T Bank Corp. | | | 11,900 | | | | 1,712,886 | | |
PacWest Bancorp | | | 25,001 | | | | 1,281,301 | | |
People's United Financial, Inc. | | | 32,144 | | | | 601,736 | | |
PNC Financial Services Group, Inc. (The) | | | 249,514 | | | | 27,581,277 | | |
Regions Financial Corp. | | | 278,477 | | | | 3,770,578 | | |
SunTrust Banks, Inc. | | | 52,344 | | | | 2,719,271 | | |
U.S. Bancorp | | | 162,330 | | | | 8,054,815 | | |
Wells Fargo & Co. | | | 611,863 | | | | 32,379,790 | | |
Zions Bancorporation | | | 27,858 | | | | 1,108,470 | | |
Total | | | | | 269,066,105 | | |
Capital Markets 3.8% | |
Bank of New York Mellon Corp. (The) | | | 121,362 | | | | 5,754,986 | | |
BlackRock, Inc. | | | 23,985 | | | | 8,893,398 | | |
CME Group, Inc. | | | 90,308 | | | | 10,196,676 | | |
Franklin Resources, Inc. | | | 295,165 | | | | 11,588,178 | | |
Goldman Sachs Group, Inc. (The) | | | 38,417 | | | | 8,424,464 | | |
Legg Mason, Inc. | | | 10,118 | | | | 322,764 | | |
Common Stocks (continued)
Issuer | | Shares | | Value ($) | |
Morgan Stanley | | | 884,245 | | | | 36,572,373 | | |
Nasdaq, Inc. | | | 984 | | | | 63,065 | | |
Northern Trust Corp. | | | 77,440 | | | | 6,361,696 | | |
State Street Corp. | | | 14,358 | | | | 1,131,410 | | |
T. Rowe Price Group, Inc. | | | 53,510 | | | | 3,962,951 | | |
Total | | | | | 93,271,961 | | |
Consumer Finance 1.5% | |
Ally Financial, Inc. | | | 134,660 | | | | 2,615,097 | | |
Capital One Financial Corp. | | | 402,728 | | | | 33,845,261 | | |
Navient Corp. | | | 81,170 | | | | 1,398,559 | | |
Total | | | | | 37,858,917 | | |
Diversified Financial Services 0.1% | |
Leucadia National Corp. | | | 36,036 | | | | 793,513 | | |
Voya Financial, Inc. | | | 13,907 | | | | 540,565 | | |
Total | | | | | 1,334,078 | | |
Insurance 6.8% | |
Aflac, Inc. | | | 38,683 | | | | 2,761,193 | | |
Alleghany Corp.(a) | | | 1,796 | | | | 1,020,038 | | |
Allied World Assurance Co. Holdings AG | | | 5,412 | | | | 253,336 | | |
Allstate Corp. (The) | | | 27,466 | | | | 1,920,423 | | |
American Financial Group, Inc. | | | 16,517 | | | | 1,358,193 | | |
American International Group, Inc. | | | 103,157 | | | | 6,532,933 | | |
Assurant, Inc. | | | 14,049 | | | | 1,212,991 | | |
Assured Guaranty Ltd. | | | 11,725 | | | | 419,286 | | |
Axis Capital Holdings Ltd. | | | 13,673 | | | | 834,190 | | |
Chubb Ltd. | | | 106,338 | | | | 13,611,264 | | |
CNA Financial Corp. | | | 3,492 | | | | 133,639 | | |
Endurance Specialty Holdings Ltd. | | | 9,980 | | | | 920,156 | | |
Everest Re Group Ltd. | | | 8,315 | | | | 1,750,723 | | |
First American Financial Corp. | | | 1,483 | | | | 55,968 | | |
Hartford Financial Services
Group, Inc. (The) | | | 510,738 | | | | 24,065,975 | | |
Lincoln National Corp. | | | 40,775 | | | | 2,613,677 | | |
Loews Corp. | | | 339,972 | | | | 15,179,750 | | |
Marsh & McLennan Companies, Inc. | | | 475,665 | | | | 32,968,341 | | |
MetLife, Inc. | | | 413,482 | | | | 22,745,645 | | |
Old Republic International Corp. | | | 48,789 | | | | 871,859 | | |
Principal Financial Group, Inc. | | | 75,542 | | | | 4,358,018 | | |
Progressive Corp. (The) | | | 527,775 | | | | 17,574,907 | | |
Prudential Financial, Inc. | | | 44,933 | | | | 4,520,260 | | |
The accompanying Notes to Financial Statements are an integral part of this statement.
Semiannual Report 2016
8
ACTIVE PORTFOLIOS® MULTI-MANAGER VALUE FUND
PORTFOLIO OF INVESTMENTS (continued)
November 30, 2016 (Unaudited)
Common Stocks (continued)
Issuer | | Shares | | Value ($) | |
Reinsurance Group of America, Inc. | | | 9,990 | | | | 1,219,279 | | |
RenaissanceRe Holdings Ltd. | | | 8,512 | | | | 1,111,327 | | |
Travelers Companies, Inc. (The) | | | 23,453 | | | | 2,658,398 | | |
Unum Group | | | 47,616 | | | | 2,012,728 | | |
Validus Holdings Ltd. | | | 6,795 | | | | 369,240 | | |
WR Berkley Corp. | | | 4,792 | | | | 296,098 | | |
Xl Group Ltd. | | | 47,550 | | | | 1,717,981 | | |
Total | | | | | 167,067,816 | | |
Thrifts & Mortgage Finance —% | |
New York Community Bancorp, Inc. | | | 47,604 | | | | 760,712 | | |
Total Financials | | | | | 569,359,589 | | |
HEALTH CARE 12.0% | |
Biotechnology 0.4% | |
AbbVie, Inc. | | | 138,690 | | | | 8,432,352 | | |
United Therapeutics Corp.(a) | | | 2,100 | | | | 263,781 | | |
Total | | | | | 8,696,133 | | |
Health Care Equipment & Supplies 3.2% | |
Abbott Laboratories | | | 853,547 | | | | 32,494,534 | | |
Alere, Inc.(a) | | | 850 | | | | 33,762 | | |
Boston Scientific Corp.(a) | | | 6,872 | | | | 140,601 | | |
Danaher Corp. | | | 53,154 | | | | 4,155,048 | | |
Dentsply Sirona, Inc. | | | 13,803 | | | | 803,059 | | |
Medtronic PLC | | | 416,227 | | | | 30,388,733 | | |
STERIS PLC | | | 8,304 | | | | 544,825 | | |
Stryker Corp. | | | 92,315 | | | | 10,492,523 | | |
Teleflex, Inc. | | | 2,236 | | | | 330,772 | | |
Zimmer Biomet Holdings, Inc. | | | 1,879 | | | | 191,395 | | |
Total | | | | | 79,575,252 | | |
Health Care Providers & Services 3.1% | |
Acadia Healthcare Co., Inc.(a) | | | 16,232 | | | | 616,978 | | |
Aetna, Inc. | | | 243,460 | | | | 31,854,306 | | |
Amsurg Corp.(a) | | | 3,846 | | | | 261,990 | | |
Anthem, Inc. | | | 54,503 | | | | 7,768,313 | | |
Centene Corp.(a) | | | 18,486 | | | | 1,065,348 | | |
CIGNA Corp. | | | 13,350 | | | | 1,798,779 | | |
DaVita, Inc.(a) | | | 4,463 | | | | 282,731 | | |
Express Scripts Holding Co.(a) | | | 105,804 | | | | 8,028,408 | | |
Humana, Inc. | | | 60,671 | | | | 12,901,081 | | |
Laboratory Corp. of America Holdings(a) | | | 21,011 | | | | 2,644,234 | | |
Common Stocks (continued)
Issuer | | Shares | | Value ($) | |
Mednax, Inc.(a) | | | 8,104 | | | | 530,569 | | |
Quest Diagnostics, Inc. | | | 42,808 | | | | 3,743,988 | | |
UnitedHealth Group, Inc. | | | 25,180 | | | | 3,986,498 | | |
Universal Health Services, Inc., Class B | | | 1,099 | | | | 135,199 | | |
WellCare Health Plans, Inc.(a) | | | 473 | | | | 64,810 | | |
Total | | | | | 75,683,232 | | |
Life Sciences Tools & Services 0.6% | |
Bio-Rad Laboratories, Inc., Class A(a) | | | 3,195 | | | | 554,333 | | |
PerkinElmer, Inc. | | | 19,774 | | | | 1,002,937 | | |
Quintiles IMS Holdings, Inc.(a) | | | 14,394 | | | | 1,105,891 | | |
Thermo Fisher Scientific, Inc. | | | 92,136 | | | | 12,909,175 | | |
Total | | | | | 15,572,336 | | |
Pharmaceuticals 4.7% | |
Allergan PLC(a) | | | 19,198 | | | | 3,730,171 | | |
Bristol-Myers Squibb Co. | | | 56,495 | | | | 3,188,578 | | |
Eli Lilly & Co. | | | 43,080 | | | | 2,891,530 | | |
Johnson & Johnson | | | 195,430 | | | | 21,751,359 | | |
Mallinckrodt PLC(a) | | | 35,532 | | | | 1,872,536 | | |
Merck & Co., Inc. | | | 284,145 | | | | 17,386,833 | | |
Mylan NV(a) | | | 71,420 | | | | 2,614,686 | | |
Perrigo Co. PLC | | | 2,410 | | | | 208,079 | | |
Pfizer, Inc. | | | 1,915,784 | | | | 61,573,298 | | |
Total | | | | | 115,217,070 | | |
Total Health Care | | | | | 294,744,023 | | |
INDUSTRIALS 10.2% | |
Aerospace & Defense 3.0% | |
Arconic, Inc. | | | 100,556 | | | | 1,938,720 | | |
Boeing Co. (The) | | | 25,840 | | | | 3,890,470 | | |
General Dynamics Corp. | | | 81,890 | | | | 14,359,412 | | |
L-3 Communications Holdings, Inc. | | | 14,729 | | | | 2,323,794 | | |
Lockheed Martin Corp. | | | 51,920 | | | | 13,771,780 | | |
Orbital ATK, Inc. | | | 5,868 | | | | 500,716 | | |
Textron, Inc. | | | 83,638 | | | | 3,849,857 | | |
United Technologies Corp. | | | 312,415 | | | | 33,653,344 | | |
Total | | | | | 74,288,093 | | |
Air Freight & Logistics 1.1% | |
FedEx Corp. | | | 14,245 | | | | 2,730,339 | | |
United Parcel Service, Inc., Class B | | | 212,035 | | | | 24,579,097 | | |
Total | | | | | 27,309,436 | | |
The accompanying Notes to Financial Statements are an integral part of this statement.
Semiannual Report 2016
9
ACTIVE PORTFOLIOS® MULTI-MANAGER VALUE FUND
PORTFOLIO OF INVESTMENTS (continued)
November 30, 2016 (Unaudited)
Common Stocks (continued)
Issuer | | Shares | | Value ($) | |
Airlines 0.5% | |
JetBlue Airways Corp.(a) | | | 87,816 | | | | 1,764,224 | | |
Southwest Airlines Co. | | | 64,302 | | | | 2,997,116 | | |
United Continental Holdings, Inc.(a) | | | 88,001 | | | | 6,067,669 | | |
Total | | | | | 10,829,009 | | |
Building Products 0.1% | |
Johnson Controls International PLC | | | 11,663 | | | | 524,602 | | |
Owens Corning | | | 34,848 | | | | 1,790,490 | | |
Total | | | | | 2,315,092 | | |
Commercial Services & Supplies 0.5% | |
Republic Services, Inc. | | | 77,274 | | | | 4,287,935 | | |
Waste Management, Inc. | | | 101,860 | | | | 7,081,307 | | |
Total | | | | | 11,369,242 | | |
Construction & Engineering 0.2% | |
AECOM(a) | | | 53,639 | | | | 1,949,777 | | |
Fluor Corp. | | | 44,917 | | | | 2,403,509 | | |
Jacobs Engineering Group, Inc.(a) | | | 14,126 | | | | 875,953 | | |
Quanta Services, Inc.(a) | | | 11,094 | | | | 374,090 | | |
Total | | | | | 5,603,329 | | |
Electrical Equipment 0.2% | |
Eaton Corp. PLC | | | 79,344 | | | | 5,277,169 | | |
Industrial Conglomerates 1.1% | |
3M Co. | | | 53,180 | | | | 9,133,133 | | |
Carlisle Companies, Inc. | | | 10,800 | | | | 1,211,436 | | |
General Electric Co. | | | 97,148 | | | | 2,988,272 | | |
Honeywell International, Inc. | | | 122,975 | | | | 14,011,772 | | |
Total | | | | | 27,344,613 | | |
Machinery 2.7% | |
AGCO Corp. | | | 17,365 | | | | 968,967 | | |
Caterpillar, Inc. | | | 12,392 | | | | 1,184,180 | | |
Cummins, Inc. | | | 6,308 | | | | 894,348 | | |
Dover Corp. | | | 34,493 | | | | 2,504,537 | | |
Illinois Tool Works, Inc. | | | 146,680 | | | | 18,361,402 | | |
Ingersoll-Rand PLC | | | 80,943 | | | | 6,033,491 | | |
PACCAR, Inc. | | | 10,026 | | | | 623,116 | | |
Parker-Hannifin Corp. | | | 177,215 | | | | 24,620,480 | | |
Pentair PLC | | | 41,750 | | | | 2,398,955 | | |
Stanley Black & Decker, Inc. | | | 64,307 | | | | 7,628,739 | | |
Total | | | | | 65,218,215 | | |
Common Stocks (continued)
Issuer | | Shares | | Value ($) | |
Professional Services 0.1% | |
ManpowerGroup, Inc. | | | 21,309 | | | | 1,820,002 | | |
Road & Rail 0.7% | |
AMERCO | | | 282 | | | | 96,292 | | |
CSX Corp. | | | 202,239 | | | | 7,242,179 | | |
Hertz Global Holdings, Inc.(a) | | | 16,046 | | | | 404,038 | | |
Kansas City Southern | | | 25,564 | | | | 2,267,782 | | |
Norfolk Southern Corp. | | | 59,169 | | | | 6,299,132 | | |
Ryder System, Inc. | | | 3,039 | | | | 237,954 | | |
Union Pacific Corp. | | | 10,916 | | | | 1,106,118 | | |
Total | | | | | 17,653,495 | | |
Trading Companies & Distributors —% | |
United Rentals, Inc.(a) | | | 5,734 | | | | 579,765 | | |
Transportation Infrastructure —% | |
Macquarie Infrastructure Corp. | | | 9,161 | | | | 750,652 | | |
Total Industrials | | | | | 250,358,112 | | |
INFORMATION TECHNOLOGY 13.8% | |
Communications Equipment 3.1% | |
Arris International PLC(a) | | | 36,640 | | | | 1,051,202 | | |
Brocade Communications Systems, Inc. | | | 62,994 | | | | 777,346 | | |
Cisco Systems, Inc. | | | 2,080,537 | | | | 62,041,613 | | |
EchoStar Corp., Class A(a) | | | 1,194 | | | | 60,894 | | |
Juniper Networks, Inc. | | | 432,120 | | | | 11,900,585 | | |
Total | | | | | 75,831,640 | | |
Electronic Equipment, Instruments & Components 0.5% | |
Arrow Electronics, Inc.(a) | | | 26,736 | | | | 1,825,266 | | |
Avnet, Inc. | | | 38,920 | | | | 1,786,039 | | |
Corning, Inc. | | | 142,031 | | | | 3,413,005 | | |
Dolby Laboratories, Inc., Class A | | | 13,366 | | | | 616,841 | | |
Flex Ltd.(a) | | | 27,166 | | | | 386,844 | | |
Ingram Micro, Inc., Class A | | | 25,858 | | | | 968,123 | | |
Jabil Circuit, Inc. | | | 18,846 | | | | 398,593 | | |
TE Connectivity Ltd. | | | 35,967 | | | | 2,432,808 | | |
Total | | | | | 11,827,519 | | |
Internet Software & Services 0.9% | |
Alphabet, Inc., Class A(a) | | | 25,555 | | | | 19,827,614 | | |
CommerceHub, Inc., Class A(a) | | | 2,217 | | | | 33,521 | | |
CommerceHub, Inc., Class C(a) | | | 4,435 | | | | 65,416 | | |
Yahoo!, Inc.(a) | | | 50,975 | | | | 2,090,995 | | |
The accompanying Notes to Financial Statements are an integral part of this statement.
Semiannual Report 2016
10
ACTIVE PORTFOLIOS® MULTI-MANAGER VALUE FUND
PORTFOLIO OF INVESTMENTS (continued)
November 30, 2016 (Unaudited)
Common Stocks (continued)
Issuer | | Shares | | Value ($) | |
Zillow Group, Inc., Class A(a) | | | 6,756 | | | | 237,473 | | |
Zillow Group, Inc., Class C(a) | | | 14,521 | | | | 521,594 | | |
Total | | | | | 22,776,613 | | |
IT Services 1.3% | |
Amdocs Ltd. | | | 27,184 | | | | 1,603,041 | | |
Automatic Data Processing, Inc. | | | 91,770 | | | | 8,811,755 | | |
Computer Sciences Corp. | | | 29,967 | | | | 1,816,899 | | |
Dell Technologies, Inc. — VMware, Inc.,
Class V(a) | | | 2,749 | | | | 147,236 | | |
Fidelity National Information Services, Inc. | | | 48,331 | | | | 3,730,670 | | |
Leidos Holdings, Inc. | | | 8,706 | | | | 445,747 | | |
Vantiv, Inc., Class A(a) | | | 222,720 | | | | 12,568,090 | | |
Xerox Corp. | | | 235,760 | | | | 2,204,356 | | |
Total | | | | | 31,327,794 | | |
Semiconductors & Semiconductor Equipment 3.6% | |
First Solar, Inc.(a) | | | 11,763 | | | | 356,654 | | |
Intel Corp. | | | 1,018,227 | | | | 35,332,477 | | |
Lam Research Corp. | | | 101,535 | | | | 10,764,741 | | |
Marvell Technology Group Ltd. | | | 49,025 | | | | 703,019 | | |
Micron Technology, Inc.(a) | | | 492,210 | | | | 9,612,861 | | |
Microsemi Corp.(a) | | | 4,263 | | | | 233,399 | | |
NVIDIA Corp. | | | 104,434 | | | | 9,628,815 | | |
ON Semiconductor Corp.(a) | | | 17,138 | | | | 201,886 | | |
Qorvo, Inc.(a) | | | 13,652 | | | | 729,153 | | |
QUALCOMM, Inc. | | | 169,718 | | | | 11,562,887 | | |
Teradyne, Inc. | | | 15,493 | | | | 377,719 | | |
Texas Instruments, Inc. | | | 123,650 | | | | 9,141,445 | | |
Total | | | | | 88,645,056 | | |
Software 2.3% | |
Activision Blizzard, Inc. | | | 97,080 | | | | 3,554,099 | | |
CA, Inc. | | | 104,357 | | | | 3,335,250 | | |
Microsoft Corp. | | | 796,120 | | | | 47,974,191 | | |
Nuance Communications, Inc.(a) | | | 27,923 | | | | 452,632 | | |
SS&C Technologies Holdings, Inc. | | | 10,903 | | | | 327,199 | | |
Symantec Corp. | | | 69,995 | | | | 1,707,178 | | |
Synopsys, Inc.(a) | | | 5,399 | | | | 326,531 | | |
Total | | | | | 57,677,080 | | |
Technology Hardware, Storage & Peripherals 2.1% | |
Apple, Inc. | | | 330,035 | | | | 36,475,468 | | |
Hewlett Packard Enterprise Co. | | | 313,920 | | | | 7,471,296 | | |
Common Stocks (continued)
Issuer | | Shares | | Value ($) | |
HP, Inc. | | | 43,949 | | | | 676,815 | | |
NetApp, Inc. | | | 79,541 | | | | 2,908,019 | | |
Western Digital Corp. | | | 66,138 | | | | 4,210,345 | | |
Total | | | | | 51,741,943 | | |
Total Information Technology | | | | | 339,827,645 | | |
MATERIALS 3.5% | |
Chemicals 2.4% | |
Albemarle Corp. | | | 25,020 | | | | 2,196,256 | | |
Ashland Global Holdings, Inc. | | | 14,856 | | | | 1,674,271 | | |
Axalta Coating Systems Ltd.(a) | | | 404,580 | | | | 10,689,004 | | |
CF Industries Holdings, Inc. | | | 73,240 | | | | 2,119,566 | | |
Dow Chemical Co. (The) | | | 123,607 | | | | 6,887,382 | | |
Eastman Chemical Co. | | | 172,969 | | | | 12,993,431 | | |
Ingevity Corp.(a) | | | 5,467 | | | | 286,307 | | |
LyondellBasell Industries NV, Class A | | | 35,525 | | | | 3,208,618 | | |
Mosaic Co. (The) | | | 81,971 | | | | 2,327,976 | | |
Praxair, Inc. | | | 106,750 | | | | 12,842,025 | | |
Sherwin-Williams Co. (The) | | | 9,530 | | | | 2,560,425 | | |
Westlake Chemical Corp. | | | 8,702 | | | | 514,897 | | |
Total | | | | | 58,300,158 | | |
Construction Materials 0.1% | |
Martin Marietta Materials, Inc. | | | 3,202 | | | | 702,679 | | |
Vulcan Materials Co. | | | 17,984 | | | | 2,259,689 | | |
Total | | | | | 2,962,368 | | |
Containers & Packaging 0.3% | |
International Paper Co. | | | 7,957 | | | | 387,665 | | |
Sonoco Products Co. | | | 85,475 | | | | 4,626,762 | | |
WestRock Co. | | | 60,816 | | | | 3,113,779 | | |
Total | | | | | 8,128,206 | | |
Metals & Mining 0.7% | |
Alcoa Corp. | | | 33,518 | | | | 971,017 | | |
Freeport-McMoRan, Inc.(a) | | | 227,347 | | | | 3,489,777 | | |
Newmont Mining Corp. | | | 122,132 | | | | 3,961,962 | | |
Nucor Corp. | | | 98,596 | | | | 6,131,685 | | |
Reliance Steel & Aluminum Co. | | | 17,863 | | | | 1,448,689 | | |
Royal Gold, Inc. | | | 7,592 | | | | 528,707 | | |
Steel Dynamics, Inc. | | | 34,253 | | | | 1,215,296 | | |
Total | | | | | 17,747,133 | | |
Total Materials | | | | | 87,137,865 | | |
The accompanying Notes to Financial Statements are an integral part of this statement.
Semiannual Report 2016
11
ACTIVE PORTFOLIOS® MULTI-MANAGER VALUE FUND
PORTFOLIO OF INVESTMENTS (continued)
November 30, 2016 (Unaudited)
Common Stocks (continued)
Issuer | | Shares | | Value ($) | |
REAL ESTATE 1.0% | |
Equity Real Estate Investment Trusts (REITs) 1.0% | |
American Tower Corp. | | | 18,585 | | | | 1,900,688 | | |
AvalonBay Communities, Inc. | | | 8,440 | | | | 1,388,296 | | |
Communications Sales & Leasing, Inc. | | | 3,853 | | | | 96,055 | | |
Crown Castle International Corp. | | | 28,705 | | | | 2,395,719 | | |
Digital Realty Trust, Inc. | | | 31,816 | | | | 2,937,571 | | |
Duke Realty Corp. | | | 89,405 | | | | 2,273,569 | | |
Equity LifeStyle Properties, Inc. | | | 10,699 | | | | 742,832 | | |
Essex Property Trust, Inc. | | | 11,015 | | | | 2,378,359 | | |
Public Storage | | | 32,555 | | | | 6,813,762 | | |
Simon Property Group, Inc. | | | 22,325 | | | | 4,010,686 | | |
Total | | | | | 24,937,537 | | |
Real Estate Management & Development —% | |
Howard Hughes Corporation(a) | | | 2,160 | | | | 245,808 | | |
Total Real Estate | | | | | 25,183,345 | | |
TELECOMMUNICATION SERVICES 2.3% | |
Diversified Telecommunication Services 2.2% | |
AT&T, Inc. | | | 817,572 | | | | 31,582,806 | | |
CenturyLink, Inc. | | | 165,936 | | | | 3,902,815 | | |
Frontier Communications Corp. | | | 254,123 | | | | 927,549 | | |
Level 3 Communications, Inc.(a) | | | 45,536 | | | | 2,507,668 | | |
Verizon Communications, Inc. | | | 304,255 | | | | 15,182,324 | | |
Total | | | | | 54,103,162 | | |
Wireless Telecommunication Services 0.1% | |
Sprint Corp.(a) | | | 125,862 | | | | 986,758 | | |
T-Mobile USA, Inc.(a) | | | 42,708 | | | | 2,315,201 | | |
Total | | | | | 3,301,959 | | |
Total Telecommunication Services | | | | | 57,405,121 | | |
UTILITIES 1.4% | |
Electric Utilities 0.6% | |
American Electric Power Co., Inc. | | | 67,005 | | | | 3,956,645 | | |
Eversource Energy | | | 78,610 | | | | 4,057,848 | | |
NextEra Energy, Inc. | | | 39,580 | | | | 4,521,224 | | |
PG&E Corp. | | | 63,805 | | | | 3,751,734 | | |
Total | | | | | 16,287,451 | | |
Common Stocks (continued)
Issuer | | Shares | | Value ($) | |
Independent Power and Renewable Electricity Producers 0.1% | |
Calpine Corp.(a) | | | 104,660 | | | | 1,166,959 | | |
NRG Energy, Inc. | | | 66,231 | | | | 751,060 | | |
Total | | | | | 1,918,019 | | |
Multi-Utilities 0.7% | |
CMS Energy Corp. | | | 120,765 | | | | 4,857,168 | | |
Dominion Resources, Inc. | | | 52,540 | | | | 3,850,657 | | |
Sempra Energy | | | 32,950 | | | | 3,288,410 | | |
WEC Energy Group, Inc. | | | 77,825 | | | | 4,358,978 | | |
Total | | | | | 16,355,213 | | |
Total Utilities | | | | | 34,560,683 | | |
Total Common Stocks
(Cost: $2,249,417,936) | | | | | 2,422,404,077 | | |
Convertible Preferred Stocks 0.1%
ENERGY 0.1% | |
Oil, Gas & Consumable Fuels 0.1% | |
Hess Corp., 8.000% | | | 22,605 | | | | 1,516,117 | | |
Total Energy | | | | | 1,516,117 | | |
Total Convertible Preferred Stocks
(Cost: $1,590,066) | | | | | 1,516,117 | | |
Exchange-Traded Funds 0.5%
| | | Shares | | Value ($) | |
SPDR S&P 500 ETF Trust | | | 62,460 | | | | 13,764,935 | | |
Total Exchange-Traded Funds
(Cost: $13,292,912) | | | | | 13,764,935 | | |
Money Market Funds 0.8%
Columbia Short-Term Cash Fund,
0.480%(c)(d) | | | 18,526,170 | | | | 18,528,023 | | |
Total Money Market Funds
(Cost: $18,526,170) | | | | | 18,528,023 | | |
Total Investments
(Cost: $2,282,827,084) | | | | | 2,456,213,152 | | |
Other Assets & Liabilities, Net | | | | | 2,373,374 | | |
Net Assets | | | | | 2,458,586,526 | | |
The accompanying Notes to Financial Statements are an integral part of this statement.
Semiannual Report 2016
12
ACTIVE PORTFOLIOS® MULTI-MANAGER VALUE FUND
PORTFOLIO OF INVESTMENTS (continued)
November 30, 2016 (Unaudited)
Notes to Portfolio of Investments
(a) Non-income producing investment.
(b) Represents fair value as determined in good faith under procedures approved by the Board of Trustees. At November 30, 2016, the value of these securities amounted to $64,585, which represents less than 0.01% of net assets.
(c) The rate shown is the seven-day current annualized yield at November 30, 2016.
(d) As defined in the Investment Company Act of 1940, an affiliated company is one in which the Fund owns 5% or more of the company's outstanding voting securities, or a company which is under common ownership or control with the Fund. Holdings and transactions in these affiliated companies during the period ended November 30, 2016 are as follows:
Issuer | | Beginning
Cost ($) | | Purchase
Cost ($) | | Proceeds
From Sales ($) | | Realized
Gain
(Loss) ($) | | Ending
Cost ($) | | Dividends —
Affiliated
Issuers ($) | | Value ($) | |
Columbia Short-Term
Cash Fund | | | 14,467,464 | | | | 1,709,746,234 | | | | (1,705,687,408 | ) | | | (120 | ) | | | 18,526,170 | | | | 125,491 | | | | 18,528,023 | | |
Fair Value Measurements
The Fund categorizes its fair value measurements according to a three-level hierarchy that maximizes the use of observable inputs and minimizes the use of unobservable inputs by prioritizing that the most observable input be used when available. Observable inputs are those that market participants would use in pricing an investment based on market data obtained from sources independent of the reporting entity. Unobservable inputs are those that reflect the Fund's assumptions about the information market participants would use in pricing an investment. An investment's level within the fair value hierarchy is based on the lowest level of any input that is deemed significant to the asset's or liability's fair value measurement. The input levels are not necessarily an indication of the risk or liquidity associated with investments at that level. For example, certain U.S. government securities are generally high quality and liquid, however, they are reflected as Level 2 because the inputs used to determine fair value may not always be quoted prices in an active market.
Fair value inputs are summarized in the three broad levels listed below:
> Level 1 — Valuations based on quoted prices for investments in active markets that the Fund has the ability to access at the measurement date (including NAV for open-end mutual funds). Valuation adjustments are not applied to Level 1 investments.
> Level 2 — Valuations based on other significant observable inputs (including quoted prices for similar securities, interest rates, prepayment speeds, credit risks, etc.).
> Level 3 — Valuations based on significant unobservable inputs (including the Fund's own assumptions and judgment in determining the fair value of investments).
Inputs that are used in determining fair value of an investment may include price information, credit data, volatility statistics, and other factors. These inputs can be either observable or unobservable. The availability of observable inputs can vary between investments, and is affected by various factors such as the type of investment, and the volume and level of activity for that investment or similar investments in the marketplace. The inputs will be considered by the Investment Manager, along with any other relevant factors in the calculation of an investment's fair value. The Fund uses prices and inputs that are current as of the measurement date, which may include periods of market dislocations. During these periods, the availability of prices and inputs may be reduced for many investments. This condition could cause an investment to be reclassified between the various levels within the hierarchy.
Certain investments that have been measured at fair value using the net asset value (NAV) per share (or its equivalent) are not categorized in the fair value hierarchy. The fair value amounts presented in the table are intended to reconcile the fair value hierarchy to the amounts presented in the Portfolio of Investments. The Columbia Short-Term Cash Fund seeks to provide shareholders with maximum current income consistent with liquidity and stability of principal. Columbia Short-Term Cash Fund prices its shares with a floating NAV and no longer seeks to maintain a stable NAV.
Investments falling into the Level 3 category are primarily supported by quoted prices from brokers and dealers participating in the market for those investments. However, these may be classified as Level 3 investments due to lack of market transparency and corroboration to support these quoted prices. Additionally, valuation models may be used as the pricing source for any remaining investments classified as Level 3. These models may rely on one or more significant unobservable inputs and/or significant assumptions by the Investment Manager. Inputs used in valuations may include, but are not limited to, financial statement analysis, capital account balances, discount rates and estimated cash flows, and comparable company data.
Under the direction of the Fund's Board of Trustees (the Board), the Investment Manager's Valuation Committee (the Committee) is responsible for overseeing the valuation procedures approved by the Board. The Committee consists of voting and non-voting members from various groups within the Investment Manager's organization, including operations and accounting, trading and investments, compliance, risk management and legal.
The accompanying Notes to Financial Statements are an integral part of this statement.
Semiannual Report 2016
13
ACTIVE PORTFOLIOS® MULTI-MANAGER VALUE FUND
PORTFOLIO OF INVESTMENTS (continued)
November 30, 2016 (Unaudited)
Fair Value Measurements (continued)
The Committee meets at least monthly to review and approve valuation matters, which may include a description of specific valuation determinations, data regarding pricing information received from approved pricing vendors and brokers and the results of Board-approved valuation control policies and procedures (the Policies). The Policies address, among other things, instances when market quotations are or are not readily available, including recommendations of third party pricing vendors and a determination of appropriate pricing methodologies; events that require specific valuation determinations and assessment of fair value techniques; securities with a potential for stale pricing, including those that are illiquid, restricted, or in default; and the effectiveness of third party pricing vendors, including periodic reviews of vendors. The Committee meets more frequently, as needed, to discuss additional valuation matters, which may include the need to review back-testing results, review time-sensitive information or approve related valuation actions. The Committee reports to the Board, with members of the Committee meeting with the Board at each of its regularly scheduled meetings to discuss valuation matters and actions during the period, similar to those described earlier.
For investments categorized as Level 3, the Committee monitors information similar to that described above, which may include: (i) data specific to the issuer or comparable issuers, (ii) general market or specific sector news and (iii) quoted prices and specific or similar security transactions. The Committee considers this data and any changes from prior periods in order to assess the reasonableness of observable and unobservable inputs, any assumptions or internal models used to value those securities and changes in fair value. This data is also used to corroborate, when available, information received from approved pricing vendors and brokers. Various factors impact the frequency of monitoring this information (which may occur as often as daily). However, the Committee may determine that changes to inputs, assumptions and models are not required as a result of the monitoring procedures performed.
The following table is a summary of the inputs used to value the Fund's investments at November 30, 2016:
| | | Level 1
Quoted Prices in Active
Markets for Identical
Assets ($) | | Level 2
Other Significant
Observable Inputs ($) | | Level 3
Significant
Unobservable Inputs ($) | | Total ($) | |
Investments | |
Common Stocks | |
Consumer Discretionary | | | 363,225,291 | | | | — | | | | — | | | | 363,225,291 | | |
Consumer Staples | | | 196,572,100 | | | | — | | | | 64,585 | | | | 196,636,685 | | |
Energy | | | 203,965,718 | | | | — | | | | — | | | | 203,965,718 | | |
Financials | | | 569,359,589 | | | | — | | | | — | | | | 569,359,589 | | |
Health Care | | | 294,744,023 | | | | — | | | | — | | | | 294,744,023 | | |
Industrials | | | 250,358,112 | | | | — | | | | — | | | | 250,358,112 | | |
Information Technology | | | 339,827,645 | | | | — | | | | — | | | | 339,827,645 | | |
Materials | | | 87,137,865 | | | | — | | | | — | | | | 87,137,865 | | |
Real Estate | | | 25,183,345 | | | | — | | | | — | | | | 25,183,345 | | |
Telecommunication Services | | | 57,405,121 | | | | — | | | | — | | | | 57,405,121 | | |
Utilities | | | 34,560,683 | | | | — | | | | — | | | | 34,560,683 | | |
Total Common Stocks | | | 2,422,339,492 | | | | — | | | | 64,585 | | | | 2,422,404,077 | | |
Convertible Preferred Stocks | |
Energy | | | 1,516,117 | | | | — | | | | — | | | | 1,516,117 | | |
Exchange-Traded Funds | | | 13,764,935 | | | | — | | | | — | | | | 13,764,935 | | |
Investments measured at net asset value | |
Money Market Funds | | | — | | | | — | | | | — | | | | 18,528,023 | | |
Total Investments | | | 2,437,620,544 | | | | — | | | | 64,585 | | | | 2,456,213,152 | | |
See the Portfolio of Investments for all investment classifications not indicated in the table.
There were no transfers of financial assets between levels during the period.
The Fund does not hold any significant investments (greater than one percent of net assets) categorized as Level 3.
The accompanying Notes to Financial Statements are an integral part of this statement.
Semiannual Report 2016
14
ACTIVE PORTFOLIOS® MULTI-MANAGER VALUE FUND
PORTFOLIO OF INVESTMENTS (continued)
November 30, 2016 (Unaudited)
Fair Value Measurements (continued)
The Fund's assets assigned to the Level 3 category are valued utilizing the valuation technique deemed the most appropriate in the circumstances. Certain common stocks classified as Level 3 are valued using an income approach. To determine fair value for these securities, management considered estimates of future distributions from the company assets or potential actions related to the respective company's restructuring. Significant increases (decreases) to any of these inputs would result in a significantly lower (higher) fair value measurement.
The accompanying Notes to Financial Statements are an integral part of this statement.
Semiannual Report 2016
15
ACTIVE PORTFOLIOS® MULTI-MANAGER VALUE FUND
STATEMENT OF ASSETS AND LIABILITIES
November 30, 2016 (Unaudited)
Assets | |
Investments, at value | |
Unaffiliated issuers (identified cost $2,264,300,914) | | $ | 2,437,685,129 | | |
Affiliated issuers (identified cost $18,526,170) | | | 18,528,023 | | |
Total investments (identified cost $2,282,827,084) | | | 2,456,213,152 | | |
Receivable for: | |
Investments sold | | | 3,782,441 | | |
Capital shares sold | | | 5,210,589 | | |
Dividends | | | 5,916,486 | | |
Foreign tax reclaims | | | 265,882 | | |
Prepaid expenses | | | 6,711 | | |
Other assets | | | 30,249 | | |
Total assets | | | 2,471,425,510 | | |
Liabilities | |
Payable for: | |
Investments purchased | | | 5,334,169 | | |
Capital shares purchased | | | 6,941,780 | | |
Management services fees | | | 42,332 | | |
Distribution and/or service fees | | | 16,769 | | |
Transfer agent fees | | | 346,562 | | |
Compensation of board members | | | 46,634 | | |
Chief compliance officer expenses | | | 176 | | |
Other expenses | | | 110,562 | | |
Total liabilities | | | 12,838,984 | | |
Net assets applicable to outstanding capital stock | | $ | 2,458,586,526 | | |
Represented by | |
Paid-in capital | | $ | 2,186,625,906 | | |
Undistributed net investment income | | | 4,644,156 | | |
Accumulated net realized gain | | | 93,949,648 | | |
Unrealized appreciation (depreciation) on: | |
Investments — unaffiliated issuers | | | 173,384,215 | | |
Investments — affiliated issuers | | | 1,853 | | |
Foreign currency translations | | | (19,252 | ) | |
Total — representing net assets applicable to outstanding capital stock | | $ | 2,458,586,526 | | |
Class A | |
Net assets | | $ | 2,458,586,526 | | |
Shares outstanding | | | 195,318,424 | | |
Net asset value per share | | $ | 12.59 | | |
The accompanying Notes to Financial Statements are an integral part of this statement.
Semiannual Report 2016
16
ACTIVE PORTFOLIOS® MULTI-MANAGER VALUE FUND
STATEMENT OF OPERATIONS
Six Months Ended November 30, 2016 (Unaudited)
Net investment income | |
Income: | |
Dividends — unaffiliated issuers | | $ | 30,008,891 | | |
Dividends — affiliated issuers | | | 125,491 | | |
Interest | | | 571,306 | | |
Foreign taxes withheld | | | (105,547 | ) | |
Total income | | | 30,600,141 | | |
Expenses: | |
Management services fees | | | 7,309,997 | | |
Distribution and/or service fees | |
Class A | | | 2,877,192 | | |
Transfer agent fees | |
Class A | | | 1,909,860 | | |
Compensation of board members | | | 20,580 | | |
Custodian fees | | | 25,124 | | |
Printing and postage fees | | | 156,845 | | |
Registration fees | | | 77,413 | | |
Audit fees | | | 12,342 | | |
Legal fees | | | 14,800 | | |
Chief compliance officer expenses | | | 176 | | |
Other | | | 23,057 | | |
Total expenses | | | 12,427,386 | | |
Net investment income | | | 18,172,755 | | |
Realized and unrealized gain (loss) — net | |
Net realized gain (loss) on: | |
Investments — unaffiliated issuers | | | 111,014,622 | | |
Investments — affiliated issuers | | | (120 | ) | |
Foreign currency translations | | | (21,922 | ) | |
Forward foreign currency exchange contracts | | | 2,093,580 | | |
Futures contracts | | | (47,898 | ) | |
Net realized gain | | | 113,038,262 | | |
Net change in unrealized appreciation (depreciation) on: | |
Investments — unaffiliated issuers | | | 51,645,206 | | |
Investments — affiliated issuers | | | 1,853 | | |
Foreign currency translations | | | (714 | ) | |
Net change in unrealized appreciation | | | 51,646,345 | | |
Net realized and unrealized gain | | | 164,684,607 | | |
Net increase in net assets resulting from operations | | $ | 182,857,362 | | |
The accompanying Notes to Financial Statements are an integral part of this statement.
Semiannual Report 2016
17
ACTIVE PORTFOLIOS® MULTI-MANAGER VALUE FUND
STATEMENT OF CHANGES IN NET ASSETS
| | | Six Months Ended
November 30, 2016
(Unaudited) | | Year Ended
May 31, 2016 | |
Operations | |
Net investment income | | $ | 18,172,755 | | | $ | 43,056,843 | | |
Net realized gain (loss) | | | 113,038,262 | | | | (4,193,642 | ) | |
Net change in unrealized appreciation (depreciation) | | | 51,646,345 | | | | (42,134,539 | ) | |
Net increase (decrease) in net assets resulting from operations | | | 182,857,362 | | | | (3,271,338 | ) | |
Distributions to shareholders | |
Net investment income | |
Class A | | | (22,842,955 | ) | | | (40,728,639 | ) | |
Net realized gains | |
Class A | | | — | | | | (47,135,192 | ) | |
Total distributions to shareholders | | | (22,842,955 | ) | | | (87,863,831 | ) | |
Increase in net assets from capital stock activity | | | 354,660,817 | | | | 107,728,688 | | |
Total increase in net assets | | | 514,675,224 | | | | 16,593,519 | | |
Net assets at beginning of period | | | 1,943,911,302 | | | | 1,927,317,783 | | |
Net assets at end of period | | $ | 2,458,586,526 | | | $ | 1,943,911,302 | | |
Undistributed net investment income | | $ | 4,644,156 | | | $ | 9,314,356 | | |
| | | Six Months Ended
November 30, 2016
(Unaudited) | | Year Ended May 31, 2016 | |
| | | Shares | | Dollars ($) | | Shares | | Dollars ($) | |
Capital stock activity | |
Class A shares | |
Subscriptions | | | 57,334,070 | | | | 694,776,284 | | | | 49,969,580 | | | | 568,784,722 | | |
Distributions reinvested | | | 1,945,530 | | | | 22,842,922 | | | | 7,751,688 | | | | 87,863,681 | | |
Redemptions | | | (30,159,957 | ) | | | (362,958,389 | ) | | | (47,256,089 | ) | | | (548,919,715 | ) | |
Net increase | | | 29,119,643 | | | | 354,660,817 | | | | 10,465,179 | | | | 107,728,688 | | |
Total net increase | | | 29,119,643 | | | | 354,660,817 | | | | 10,465,179 | | | | 107,728,688 | | |
The accompanying Notes to Financial Statements are an integral part of this statement.
Semiannual Report 2016
18
ACTIVE PORTFOLIOS® MULTI-MANAGER VALUE FUND
The following table is intended to help you understand the Fund's financial performance. Certain information reflects financial results for a single share of a class held for the periods shown. Per share net investment income (loss) amounts are calculated based on average shares outstanding during the period. Total return assumes reinvestment of all dividends and distributions, if any. Total return does not reflect payment of sales charges, if any. Total return and portfolio turnover are not annualized for periods of less than one year. The portfolio turnover rate is calculated without regard to purchase and sales transactions of short-term instruments and certain derivatives, if any. If such transactions were included, the Fund's portfolio turnover rate may be higher.
| | | Six Months Ended
November 30, 2016 | | Year Ended May 31, | |
Class A | | (Unaudited) | | 2016 | | 2015 | | 2014 | | 2013 | | 2012(a) | |
Per share data | |
Net asset value, beginning of period | | $ | 11.70 | | | $ | 12.38 | | | $ | 12.53 | | | $ | 11.99 | | | $ | 9.49 | | | $ | 10.00 | | |
Income from investment operations: | |
Net investment income | | | 0.12 | | | | 0.28 | | | | 0.27 | | | | 0.25 | | | | 0.18 | | | | 0.02 | | |
Net realized and unrealized gain (loss) | | | 0.90 | | | | (0.38 | ) | | | 0.47 | | | | 1.67 | | | | 2.50 | | | | (0.53 | ) | |
Total from investment operations | | | 1.02 | | | | (0.10 | ) | | | 0.74 | | | | 1.92 | | | | 2.68 | | | | (0.51 | ) | |
Less distributions to shareholders: | |
Net investment income | | | (0.13 | ) | | | (0.27 | ) | | | (0.27 | ) | | | (0.20 | ) | | | (0.18 | ) | | | — | | |
Net realized gains | | | — | | | | (0.31 | ) | | | (0.62 | ) | | | (1.18 | ) | | | — | | | | — | | |
Total distributions to shareholders | | | (0.13 | ) | | | (0.58 | ) | | | (0.89 | ) | | | (1.38 | ) | | | (0.18 | ) | | | — | | |
Net asset value, end of period | | $ | 12.59 | | | $ | 11.70 | | | $ | 12.38 | | | $ | 12.53 | | | $ | 11.99 | | | $ | 9.49 | | |
Total return | | | 8.77 | % | | | (0.61 | %) | | | 6.16 | % | | | 17.18 | % | | | 28.49 | % | | | (5.10 | %) | |
Ratios to average net assets(b) | |
Total gross expenses | | | 1.08 | %(c) | | | 1.15 | % | | | 1.13 | % | | | 1.20 | %(d) | | | 1.24 | % | | | 1.38 | %(c) | |
Total net expenses(e) | | | 1.08 | %(c) | | | 1.13 | % | | | 1.11 | % | | | 1.08 | %(d) | | | 1.08 | % | | | 1.08 | %(c) | |
Net investment income | | | 1.57 | %(c) | | | 2.43 | % | | | 2.18 | % | | | 2.05 | % | | | 1.70 | % | | | 2.46 | %(c) | |
Supplemental data | |
Net assets, end of period (in thousands) | | $ | 2,458,587 | | | $ | 1,943,911 | | | $ | 1,927,318 | | | $ | 1,752,951 | | | $ | 750,935 | | | $ | 576,769 | | |
Portfolio turnover | | | 82 | % | | | 67 | % | | | 55 | % | | | 99 | % | | | 55 | % | | | 3 | % | |
Notes to Financial Highlights
(a) Based on operations from April 20, 2012 (commencement of operations) through the stated period end.
(b) In addition to the fees and expenses that the Fund bears directly, the Fund indirectly bears a pro rata share of the fees and expenses of any other funds in which it invests. Such indirect expenses are not included in the Fund's reported expense ratios.
(c) Annualized.
(d) Ratios include line of credit interest expense which is less than 0.01%.
(e) Total net expenses include the impact of certain fee waivers/expense reimbursements made by the Investment Manager and certain of its affiliates, if applicable.
The accompanying Notes to Financial Statements are an integral part of this statement.
Semiannual Report 2016
19
ACTIVE PORTFOLIOS® MULTI-MANAGER VALUE FUND
NOTES TO FINANCIAL STATEMENTS
November 30, 2016 (Unaudited)
Note 1. Organization
Active Portfolios® Multi-Manager Value Fund (the Fund), a series of Columbia Funds Series Trust II (the Trust), is a diversified fund. The Trust is registered under the Investment Company Act of 1940, as amended (the 1940 Act), as an open-end management investment company organized as a Massachusetts business trust.
Fund Shares
The Trust may issue an unlimited number of shares (without par value). The Fund offers Class A shares to certain eligible investors through certain wrap fee programs sponsored and/or managed by Ameriprise Financial, Inc. (Ameriprise Financial) or its affiliates.
Class A shares are not subject to any front-end sales charge or contingent deferred sales charge.
The Fund also offers Class Z shares to certain eligible investors through certain wrap fee programs sponsored and/or managed by Ameriprise Financial or its affiliates. Class Z shares commenced operations on January 3, 2017.
Note 2. Summary of Significant Accounting Policies
Basis of Preparation
The Fund is an investment company that applies the accounting and reporting guidance in the Financial Accounting Standards Board (FASB) Accounting Standards Codification Topic 946, Financial Services — Investment Companies (ASC 946). The financial statements are prepared in accordance with U.S. generally accepted accounting principles (GAAP), which requires management to make certain estimates and assumptions that affect the reported amounts of assets and liabilities, the disclosure of contingent assets and liabilities at the date of the financial statements and the reported amounts of income and expenses during the reporting period. Actual results could differ from those estimates.
The following is a summary of significant accounting policies followed by the Fund in the preparation of its financial statements.
Security Valuation
All equity securities and exchange-traded funds are valued at the close of business of the New York Stock Exchange (NYSE). Equity securities and exchange-traded funds are valued at the last quoted sales price on the principal exchange or market on which they trade, except
for securities traded on the NASDAQ Stock Market, which are valued at the NASDAQ official close price. Unlisted securities or listed securities for which there were no sales during the day are valued at the mean of the latest quoted bid and ask prices on such exchanges or markets.
Foreign equity securities are valued based on the closing price on the foreign exchange in which such securities are primarily traded. If any foreign equity security closing prices are not readily available, the securities are valued at the mean of the latest quoted bid and ask prices on such exchanges or markets. Foreign currency exchange rates are generally determined at 4:00 p.m. Eastern (U.S.) time. Many securities markets and exchanges outside the U.S. close prior to the close of the NYSE; therefore, the closing prices for securities in such markets or on such exchanges may not fully reflect events that occur after such close but before the close of the NYSE. In those situations, foreign securities will be fair valued pursuant to a policy adopted by the Board of Trustees (the Board), including, if available, utilizing a third party pricing service to determine these fair values. The third party pricing service takes into account multiple factors, including, but not limited to, movements in the U.S. securities markets, certain depositary receipts, futures contracts and foreign exchange rates that have occurred subsequent to the close of the foreign exchange or market, to determine a good faith estimate that reasonably reflects the current market conditions as of the close of the NYSE. The fair value of a security is likely to be different from the quoted or published price, if available.
Investments in open-end investment companies, including money market funds, are valued at their latest net asset value.
Investments for which market quotations are not readily available, or that have quotations which management believes are not reflective of market value or reliable, are valued at fair value as determined in good faith under procedures approved by and under the general supervision of the Board. If a security or class of securities (such as foreign securities) is valued at fair value, such value is likely to be different from the quoted or published price for the security.
The determination of fair value often requires significant judgment. To determine fair value, management may use assumptions including but not limited to future cash flows and estimated risk premiums. Multiple inputs from various sources may be used to determine fair value.
Semiannual Report 2016
20
ACTIVE PORTFOLIOS® MULTI-MANAGER VALUE FUND
NOTES TO FINANCIAL STATEMENTS (continued)
November 30, 2016 (Unaudited)
GAAP requires disclosure regarding the inputs and valuation techniques used to measure fair value and any changes in valuation inputs or techniques. In addition, investments shall be disclosed by major category. This information is disclosed following the Fund's Portfolio of Investments.
Foreign Currency Transactions and Translations
The values of all assets and liabilities denominated in foreign currencies are generally translated into U.S. dollars at exchange rates determined at the close of regular trading on the NYSE. Net realized and unrealized gains (losses) on foreign currency transactions and translations include gains (losses) arising from the fluctuation in exchange rates between trade and settlement dates on securities transactions, gains (losses) arising from the disposition of foreign currency and currency gains (losses) between the accrual and payment dates on dividends, interest income and foreign withholding taxes.
For financial statement purposes, the Fund does not distinguish that portion of gains (losses) on investments which is due to changes in foreign exchange rates from that which is due to changes in market prices of the investments. Such fluctuations are included with the net realized and unrealized gains (losses) on investments in the Statement of Operations.
Derivative Instruments
The Fund invests in certain derivative instruments, as detailed below, to meet its investment objectives. Derivatives are instruments whose values depend on, or are derived from, in whole or in part, the value of one or more securities, currencies, commodities, indices, or other assets or instruments. Derivatives may be used to increase investment flexibility (including to maintain cash reserves while maintaining desired exposure to certain assets), for risk management (hedging) purposes, to facilitate trading, to reduce transaction costs and to pursue higher investment returns. The Fund may also use derivative instruments to mitigate certain investment risks, such as foreign currency exchange rate risk, interest rate risk and credit risk. Derivatives may involve various risks, including the potential inability of the counterparty to fulfill its obligations under the terms of the contract, the potential for an illiquid secondary market (making it difficult for the Fund to sell or terminate, including at favorable prices) and the potential for market movements which may expose the Fund to gains or losses in excess of the amount shown in the Statement of Assets and Liabilities. The notional
amounts of derivative instruments, if applicable, are not recorded in the financial statements.
A derivative instrument may suffer a marked-to-market loss if the value of the contract decreases due to an unfavorable change in the market rates or values of the underlying instrument. Losses can also occur if the counterparty does not perform its obligations under the contract. The Fund's risk of loss from counterparty credit risk on over-the-counter derivatives is generally limited to the aggregate unrealized gain netted against any collateral held by the Fund and the amount of any variation margin held by the counterparty, plus any replacement costs or related amounts. With exchange-traded or centrally cleared derivatives, there is reduced counterparty credit risk to the Fund since the clearinghouse or central counterparty (CCP) provides some protection in the case of clearing member default. The clearinghouse or CCP stands between the buyer and the seller of the contract; therefore, additional counterparty credit risk is failure of the clearinghouse or CCP. However, credit risk still exists in exchange-traded or centrally cleared derivatives with respect to initial and variation margin that is held in a broker's customer account. While brokers are required to segregate customer margin from their own assets, in the event that a broker becomes insolvent or goes into bankruptcy and at that time there is a shortfall in the aggregate amount of margin held by the broker for all its clients, U.S. bankruptcy laws will typically allocate that shortfall on a pro-rata basis across all the broker's customers (including the Fund), potentially resulting in losses to the Fund.
In order to better define its contractual rights and to secure rights that will help the Fund mitigate its counterparty risk, the Fund may enter into an International Swaps and Derivatives Association, Inc. Master Agreement (ISDA Master Agreement) or similar agreement with its derivatives contract counterparties. An ISDA Master Agreement is an agreement between the Fund and a counterparty that governs over-the-counter derivatives and typically contains, among other things, collateral posting terms and netting provisions in the event of a default and/or termination event. Under an ISDA Master Agreement, the Fund may, under certain circumstances, offset with the counterparty certain derivative instrument's payables and/or receivables with collateral held and/or posted and create one single net payment. The provisions of the ISDA Master Agreement typically permit a single net payment in the event of default (close-out netting), including the bankruptcy or
Semiannual Report 2016
21
ACTIVE PORTFOLIOS® MULTI-MANAGER VALUE FUND
NOTES TO FINANCIAL STATEMENTS (continued)
November 30, 2016 (Unaudited)
insolvency of the counterparty. Note, however, that bankruptcy or insolvency laws of a particular jurisdiction may impose restrictions on or prohibitions against the right of offset or netting in bankruptcy, insolvency or other events.
Collateral (margin) requirements differ by type of derivative. Margin requirements are established by the clearinghouse or CCP for exchange-traded and centrally cleared derivatives. Brokers can ask for margin in excess of the minimum in certain circumstances. Collateral terms are contract specific for over-the-counter derivatives. For over-the-counter derivatives traded under an ISDA Master Agreement, the collateral requirements are typically calculated by netting the marked-to-market amount for each transaction under such agreement and comparing that amount to the value of any variation margin currently pledged by the Fund and/or the counterparty. Generally, the amount of collateral due from or to a party has to exceed a minimum transfer amount threshold (e.g., $250,000) before a transfer has to be made. To the extent amounts due to the Fund from its counterparties are not fully collateralized, contractually or otherwise, the Fund bears the risk of loss from counterparty nonperformance. The Fund attempts to mitigate counterparty risk by only entering into agreements with counterparties that it believes have the financial resources to honor their obligations and by monitoring the financial stability of those counterparties.
Certain ISDA Master Agreements allow counterparties of over-the-counter derivatives transactions to terminate derivatives contracts prior to maturity in the event the Fund's net asset value declines by a stated percentage over a specified time period or if the Fund fails to meet certain terms of the ISDA Master Agreement, which would cause the Fund to accelerate payment of any net liability owed to the counterparty. The Fund also has termination rights if the counterparty fails to meet certain terms of the ISDA Master Agreement. In addition to considering counterparty credit risk, the Fund would consider terminating the derivatives contracts based on whether termination would result in a net liability owed from the counterparty.
For financial reporting purposes, the Fund does not offset derivative assets and derivative liabilities that are subject to netting arrangements in the Statement of Assets and Liabilities.
Forward Foreign Currency Exchange Contracts
Forward foreign currency exchange contracts are over-the-counter agreements between two parties to buy and sell
a currency at a set price on a future date. The Fund utilized forward foreign currency exchange contracts to provide a hedge against the unknown outcome of the Brexit vote and its potential impact on the British Pound. These instruments may be used for other purposes in future periods.
Futures Contracts
Futures contracts are exchange-traded and represent commitments for the future purchase or sale of an asset at a specified price on a specified date. The Fund bought and sold futures contracts to maintain appropriate equity market exposure while keeping sufficient cash to accommodate daily redemptions. These instruments may be used for other purposes in future periods. Upon entering into futures contracts, the Fund bears risks that it may not achieve the anticipated benefits of the futures contracts and may realize a loss. Additional risks include counterparty credit risk, the possibility of an illiquid market, and that a change in the value of the contract or option may not correlate with changes in the value of the underlying asset.
Upon entering into a futures contract, the Fund deposits cash or securities with the broker, known as a futures commissions merchant (FCM), in an amount sufficient to meet the initial margin requirement. The initial margin deposit must be maintained at an established level over the life of the contract. Cash deposited as initial margin is recorded in the Statement of Assets and Liabilities as margin deposits. Securities deposited as initial margin are designated in the Portfolio of Investments. Subsequent payments (variation margin) are made or received by the Fund each day. The variation margin payments are equal to the daily change in the contract value and are recorded as variation margin receivable or payable and are offset in unrealized gains or losses. The Fund recognizes a realized gain or loss when the contract is closed or expires. Futures contracts involve, to varying degrees, risk of loss in excess of the variation margin disclosed in the Statement of Assets and Liabilities.
Effects of Derivative Transactions in the Financial Statements
The following tables are intended to provide additional information about the effect of derivatives on the financial statements of the Fund, including: the fair value of derivatives by risk category and the location of those fair values in the Statement of Assets and Liabilities; and the impact of derivative transactions over the period in the Statement of Operations, including realized and unrealized gains (losses). The derivative instrument
Semiannual Report 2016
22
ACTIVE PORTFOLIOS® MULTI-MANAGER VALUE FUND
NOTES TO FINANCIAL STATEMENTS (continued)
November 30, 2016 (Unaudited)
schedules following the Portfolio of Investments present additional information regarding derivative instruments outstanding at the end of the period, if any.
The following table indicates the effect of derivative instruments (not considered to be hedging instruments for accounting disclosure purposes) in the Statement of Operations for the six months ended November 30, 2016:
Amount of Realized Gain (Loss) on Derivatives Recognized in Income | |
Risk Exposure
Category | | Forward Foreign
Currency Exchange
Contracts ($) | | Futures
Contracts ($) | | Total ($) | |
Equity risk | | | — | | | | (47,898 | ) | | | (47,898 | ) | |
Foreign exchange risk | | | 2,093,580 | | | | — | | | | 2,093,580 | | |
Total | | | 2,093,580 | | | | (47,898 | ) | | | 2,045,682 | | |
The following table provides a summary of the average outstanding volume by derivative instrument for the six months ended November 30, 2016:
Derivative Instrument | | Average Notional Amounts ($)* | |
Futures contracts — Long | | | 14,030,655 | | |
Derivative Instrument | | Average Unrealized
Appreciation ($)* | | Average Unrealized
Depreciation ($)* | |
Forward foreign currency
exchange contracts | | | 41,780 | | | | (1,822 | ) | |
*Based on the daily outstanding amounts for the six months ended November 30, 2016.
Security Transactions
Security transactions are accounted for on the trade date. Cost is determined and gains (losses) are based upon the specific identification method for both financial statement and federal income tax purposes.
Income Recognition
Corporate actions and dividend income are generally recorded net of any non-reclaimable tax withholdings, on the ex-dividend date or upon receipt of ex-dividend notification in the case of certain foreign securities.
Interest income is recorded on an accrual basis. Market premiums and discounts, including original issue discounts, are amortized and accreted, respectively, over the expected life of the security on all debt securities, unless otherwise noted.
The Fund may place a debt security on non-accrual status and reduce related interest income when it becomes probable that the interest will not be collected and the amount of uncollectible interest can be reasonably estimated. A defaulted debt security is
removed from non-accrual status when the issuer resumes interest payments or when collectibility of interest is reasonably assured.
The Fund may receive distributions from holdings in equity securities, business development companies (BDCs), exchange-traded funds, other regulated investment companies (RICs), and real estate investment trusts (REITs), which report information on the tax character of their distributions annually. These distributions are allocated to dividend income, capital gain and return of capital based on actual information reported. Return of capital is recorded as a reduction of the cost basis of securities held. If the Fund no longer owns the applicable securities, return of capital is recorded as a realized gain. With respect to REITs, to the extent actual information has not yet been reported, estimates for return of capital are made by the Fund's management. Management's estimates are subsequently adjusted when the actual character of the distributions is disclosed by the REITs, which could result in a proportionate change in return of capital to shareholders.
Awards from class action litigation are recorded as a reduction of cost basis if the Fund still owns the applicable securities on the payment date. If the Fund no longer owns the applicable securities, the proceeds are recorded as realized gains.
Expenses
General expenses of the Trust are allocated to the Fund and other funds of the Trust based upon relative net assets or other expense allocation methodologies determined by the nature of the expense. Expenses directly attributable to the Fund are charged to the Fund.
Federal Income Tax Status
The Fund intends to qualify each year as a regulated investment company under Subchapter M of the Internal Revenue Code, as amended, and will distribute substantially all of its taxable income (including net short-term capital gains), if any, for its tax year, and as such will not be subject to federal income taxes. In addition, the Fund intends to distribute in each calendar year substantially all of its net investment income, capital gains and certain other amounts, if any, such that the Fund should not be subject to federal excise tax. Therefore, no federal income or excise tax provision is recorded.
Semiannual Report 2016
23
ACTIVE PORTFOLIOS® MULTI-MANAGER VALUE FUND
NOTES TO FINANCIAL STATEMENTS (continued)
November 30, 2016 (Unaudited)
Foreign Taxes
The Fund may be subject to foreign taxes on income, gains on investments or currency repatriation, a portion of which may be recoverable. The Fund will accrue such taxes and recoveries, as applicable, based upon its current interpretation of tax rules and regulations that exist in the markets in which it invests.
Realized gains in certain countries may be subject to foreign taxes at the Fund level, based on statutory rates. The Fund accrues for such foreign taxes on realized and unrealized gains at the appropriate rate for each jurisdiction, as applicable. The amount, if any, is disclosed as a liability on the Statement of Assets and Liabilities.
Distributions to Shareholders
Distributions from net investment income, if any, are declared and paid each calendar quarter. Net realized capital gains, if any, are distributed at least annually. Income distributions and capital gain distributions are determined in accordance with federal income tax regulations, which may differ from GAAP.
Guarantees and Indemnifications
Under the Trust's organizational documents and, in some cases, by contract, its officers and trustees are indemnified against certain liabilities arising out of the performance of their duties to the Trust or its funds. In addition, certain of the Fund's contracts with its service providers contain general indemnification clauses. The Fund's maximum exposure under these arrangements is unknown since the amount of any future claims that may be made against the Fund cannot be determined, and the Fund has no historical basis for predicting the likelihood of any such claims.
Investment Company Reporting Modernization
In October 2016, the U.S. Securities and Exchange Commission adopted new rules and forms, and amendments to certain current rules and forms, to modernize reporting and disclosure of information by registered investment companies. The amendments to Regulation S-X will require standardized, enhanced disclosure about derivatives in investment company financial statements, and will also change the rules governing the form and content of such financial statements. The amendments to Regulation S-X take effect on August 1, 2017. At this time, management is assessing the anticipated impact of these regulatory developments.
Note 3. Fees and Other Transactions with Affiliates
Management Services Fees
The Fund entered into a Management Agreement with Columbia Management Investment Advisers, LLC (the Investment Manager), a wholly-owned subsidiary of Ameriprise Financial, Inc. (Ameriprise Financial). Under the Management Agreement, the Investment Manager provides the Fund with investment research and advice, as well as administrative and accounting services. The Investment Manager is responsible for the ultimate oversight of investments made by the Fund. The Fund's subadvisers (see Subadvisory Agreement below) have the primary responsibility for the day-to-day portfolio management of their portion of the Fund. The management services fee is an annual fee that is equal to a percentage of the Fund's average daily net assets that declines from 0.72% to 0.52% as the Fund's net assets increase. The annualized effective management services fee rate for the six months ended November 30, 2016 was 0.63% of the Fund's average daily net assets.
Subadvisory Agreement
The Investment Manager has entered into a Subadvisory Agreement with Dimensional Fund Advisors LP (DFA), to subadvise a portion of the Fund. The Investment Manager compensates DFA to manage the investments of a portion of the Fund's assets. Effective October 3, 2016, the Investment Manager entered into a Subadvisory Agreement with Diamond Hill Capital Management, Inc. (Diamond Hill), to subadvise a portion of the Fund. The Investment Manager compensates Diamond Hill to manage the investments of a portion of the Fund's assets.
Other Expenses
Other expenses are for, among other things, miscellaneous expenses of the Fund or the Board, including payments to Board Services Corp., a company providing limited administrative services to the Fund and the Board. That company's expenses include boardroom and office expense, employee compensation, employee health and retirement benefits, and certain other expenses.
Compensation of Board Members
Board members, who are not officers or employees of the Investment Manager or Ameriprise Financial, are compensated for their services to the Fund as disclosed in the Statement of Operations. Under a Deferred
Semiannual Report 2016
24
ACTIVE PORTFOLIOS® MULTI-MANAGER VALUE FUND
NOTES TO FINANCIAL STATEMENTS (continued)
November 30, 2016 (Unaudited)
Compensation Plan (the Plan), these Board members may elect to defer payment of up to 100% of their compensation. Deferred amounts are treated as though equivalent dollar amounts had been invested in shares of certain funds managed by the Investment Manager. The Fund's liability for these amounts is adjusted for market value changes and remains in the Fund until distributed in accordance with the Plan. All amounts payable under the Plan constitute a general unsecured obligation of the Fund.
Compensation of Chief Compliance Officer
The Board has appointed a Chief Compliance Officer to the Fund in accordance with federal securities regulations. The Fund is allocated a portion of the expenses associated with the Chief Compliance Officer based on relative net assets of the Trust.
Transfer Agency Fees
Under a Transfer and Dividend Disbursing Agent Agreement, Columbia Management Investment Services Corp. (the Transfer Agent), an affiliate of the Investment Manager and a wholly-owned subsidiary of Ameriprise Financial, is responsible for providing transfer agency services to the Fund. The Transfer Agent has contracted with Boston Financial Data Services (BFDS) to serve as sub-transfer agent. The Transfer Agent pays the fees of BFDS for services as sub-transfer agent and BFDS is not entitled to reimbursement for such fees from the Fund (with the exception of out-of-pocket fees).
The Fund pays the Transfer Agent a monthly transfer agency fee based on the number or the average value of accounts, depending on the type of account. In addition, prior to October 1, 2016, the Transfer Agent also received sub-transfer agency fees based on a percentage of the average aggregate value of the Fund's shares maintained in omnibus accounts (other than omnibus accounts for which American Enterprise Investment Services Inc. is the broker of record or accounts where the beneficial shareholder is a customer of Ameriprise Financial Services, Inc., for which the Transfer Agent receives a per account fee). Effective October 1, 2016, the Fund pays the Transfer Agent a fee for shareholder services based on the number of accounts or on a percentage of the average aggregate value of the Fund's shares maintained in omnibus accounts up to the lesser of the amount charged by the servicing agent or a cap established by the Board from time to time.
The Transfer Agent also receives compensation from the Fund for various shareholder services and reimbursements for certain out-of-pocket fees.
For the six months ended November 30, 2016, the Fund's annualized effective transfer agency fee rate as a percentage of average daily net assets for Class A shares was 0.17%.
Distribution and Service Fees
The Fund has an agreement with Columbia Management Investment Distributors, Inc. (the Distributor), an affiliate of the Investment Manager and a wholly-owned subsidiary of Ameriprise Financial, for distribution and shareholder services. The Board has approved, and the Fund has adopted, distribution and shareholder service plans (the Plans) applicable to certain share classes, which set the distribution and service fees for the Fund. These fees are calculated daily and are intended to compensate the Distributor and/or eligible selling and/or servicing agents for selling shares of the Fund and providing services to investors.
The Fund may pay distribution and service fees up to a maximum annual rate of 0.25% of the Fund's average daily net assets attributable to Class A shares (comprised of up to 0.25% for distribution services and up to 0.25% for shareholder liaison services).
Expenses Waived/Reimbursed by the Investment Manager and its Affiliates
The Investment Manager and certain of its affiliates have contractually agreed to waive fees and/or reimburse expenses (excluding certain fees and expenses described below) for the period disclosed below, unless sooner terminated at the sole discretion of the Board, so that the Fund's net operating expenses, after giving effect to fees waived/expenses reimbursed and any balance credits and/or overdraft charges from the Fund's custodian, do not exceed the following annual rates as a percentage of the class' average daily net assets:
| | | Fee Rates Contractual
Through
September 30, 2017 | |
Class A | | | 1.13 | % | |
Under the agreement governing these fee waivers and/or expense reimbursement arrangements, the following fees and expenses are excluded from the waiver/reimbursement commitment, and therefore will be paid by the Fund, if applicable: taxes (including foreign transaction taxes), expenses associated with
Semiannual Report 2016
25
ACTIVE PORTFOLIOS® MULTI-MANAGER VALUE FUND
NOTES TO FINANCIAL STATEMENTS (continued)
November 30, 2016 (Unaudited)
investments in affiliated and non-affiliated pooled investment vehicles (including mutual funds and exchange-traded funds), transaction costs and brokerage commissions, costs related to any securities lending program, dividend and interest expenses associated with securities sold short, inverse floater program fees and expenses, transaction charges and interest on borrowed money, interest, infrequent and/or unusual expenses and any other expenses the exclusion of which is specifically approved by the Board. This agreement may be modified or amended only with approval from the Investment Manager, certain of its affiliates and the Fund. Any fees waived and/or expenses reimbursed under the expense reimbursement arrangements described above are not recoverable by the Investment Manager or its affiliates in future periods.
Note 4. Federal Tax Information
The timing and character of income and capital gain distributions are determined in accordance with income tax regulations, which may differ from GAAP because of temporary or permanent book to tax differences.
At November 30, 2016, the cost of investments for federal income tax purposes was approximately $2,282,827,000 and the aggregate gross approximate unrealized appreciation and depreciation based on that cost was:
Unrealized appreciation | | $ | 233,177,000 | | |
Unrealized depreciation | | | (59,791,000 | ) | |
Net unrealized appreciation | | $ | 173,386,000 | | |
Under current tax rules, regulated investment companies can elect to treat certain late-year ordinary losses incurred and post-October capital losses (capital losses realized after October 31) as arising on the first day of the following taxable year. The Fund has elected to treat post-October capital losses of $15,304,200 at May 31, 2016 as arising on June 1, 2016.
Management of the Fund has concluded that there are no significant uncertain tax positions in the Fund that would require recognition in the financial statements. However, management's conclusion may be subject to review and adjustment at a later date based on factors including, but not limited to, new tax laws, regulations, and administrative interpretations (including relevant court decisions). Generally, the Fund's federal tax returns for the prior three fiscal years remain subject to examination by the Internal Revenue Service.
Note 5. Portfolio Information
The cost of purchases and proceeds from sales of securities, excluding short-term investments and derivatives, if any, aggregated to $2,201,594,966 and $1,846,901,863, respectively, for the six months ended November 30, 2016. The amount of purchase and sale activity impacts the portfolio turnover rate reported in the Financial Highlights.
Note 6. Affiliated Money Market Fund
The Fund invests in Columbia Short-Term Cash Fund, an affiliated money market fund established for the exclusive use by the Fund and other affiliated funds (the Affiliated MMF). The income earned by the Fund from such investments is included as Dividends — affiliated issuers in the Statement of Operations. As an investing fund, the Fund indirectly bears its proportionate share of the expenses of the Affiliated MMF. Effective October 1, 2016, the Affiliated MMF prices its shares with a floating net asset value (NAV) and no longer seeks to maintain a stable NAV. In addition, the Board of the Affiliated MMF may impose a fee on redemptions (sometimes referred to as a liquidity fee) or temporarily suspend redemptions (sometimes referred to as imposing a redemption gate) in the event its liquidity falls below regulatory limits.
Note 7. Line of Credit
The Fund has access to a revolving credit facility with a syndicate of banks led by Citibank, N.A., HSBC Bank USA, N.A. and JPMorgan Chase Bank, N.A. whereby the Fund may borrow for the temporary funding of shareholder redemptions or for other temporary or emergency purposes. The credit facility agreement, which is a collective agreement between the Fund and certain other funds managed by the Investment Manager, severally and not jointly, that permits collective borrowings up to $1 billion. Interest is charged to each participating fund based on its borrowings at a rate equal to the higher of (i) the overnight federal funds rate plus 1.00% or (ii) the one-month LIBOR rate plus 1.00%. Each borrowing under the credit facility matures no later than 60 days after the date of borrowing. The Fund also pays a commitment fee equal to its pro rata share of the amount of the credit facility at a rate of 0.15% per annum. The commitment fee is included in other expenses in the Statement of Operations.
The Fund had no borrowings during the six months ended November 30, 2016.
Semiannual Report 2016
26
ACTIVE PORTFOLIOS® MULTI-MANAGER VALUE FUND
NOTES TO FINANCIAL STATEMENTS (continued)
November 30, 2016 (Unaudited)
Note 8. Significant Risks
Shareholder Concentration Risk
At November 30, 2016, affiliated shareholders of record owned 100.0% of the outstanding shares of the Fund in one or more accounts. Subscription and redemption activity by concentrated accounts may have a significant effect on the operations of the Fund. In the case of a large redemption, the Fund may be forced to sell investments at inopportune times, including its liquid or more liquid positions, resulting in Fund losses and the Fund holding a higher percentage of less liquid or illiquid securities. Large redemptions could result in decreased economies of scale and increased operating expenses for non-redeeming Fund shareholders.
Financial Sector Risk
The Fund may be more susceptible to the particular risks that may affect companies in the financial services sector than if it were invested in a wider variety of companies in unrelated sectors. Companies in the financial services sector are subject to certain risks, including the risk of regulatory change, decreased liquidity in credit markets and unstable interest rates. Such companies may have concentrated portfolios, such as a high level of loans to real estate developers, which makes them vulnerable to economic conditions that affect that industry. Performance of such companies may be affected by competitive pressures and exposure to investments or agreements that, under certain circumstances, may lead to losses (e.g., subprime loans). Companies in the financial services sector are subject to extensive governmental regulation that may limit the amount and types of loans and other financial commitments they can make, and interest rates and fees that they may charge. In addition, profitability of such companies is largely dependent upon the availability and the cost of capital.
Note 9. Subsequent Events
Management has evaluated the events and transactions that have occurred through the date the financial statements were issued and noted no items requiring adjustment of the financial statements or additional disclosure.
Note 10. Information Regarding Pending and Settled Legal Proceedings
Ameriprise Financial and certain of its affiliates have historically been involved in a number of legal, arbitration and regulatory proceedings, including routine
litigation, class actions, and governmental actions, concerning matters arising in connection with the conduct of their business activities. Ameriprise Financial believes that the Funds are not currently the subject of, and that neither Ameriprise Financial nor any of its affiliates are the subject of, any pending legal, arbitration or regulatory proceedings that are likely to have a material adverse effect on the Funds or the ability of Ameriprise Financial or its affiliates to perform under their contracts with the Funds. Ameriprise Financial is required to make quarterly (10-Q), annual (10-K) and, as necessary, 8-K filings with the Securities and Exchange Commission (SEC) on legal and regulatory matters that relate to Ameriprise Financial and its affiliates. Copies of these filings may be obtained by accessing the SEC website at www.sec.gov.
There can be no assurance that these matters, or the adverse publicity associated with them, will not result in increased fund redemptions, reduced sale of fund shares or other adverse consequences to the Funds. Further, although we believe proceedings are not likely to have a material adverse effect on the Funds or the ability of Ameriprise Financial or its affiliates to perform under their contracts with the Funds, these proceedings are subject to uncertainties and, as such, we are unable to estimate the possible loss or range of loss that may result. An adverse outcome in one or more of these proceedings could result in adverse judgments, settlements, fines, penalties or other relief that could have a material adverse effect on the consolidated financial condition or results of operations of Ameriprise Financial.
Semiannual Report 2016
27
ACTIVE PORTFOLIOS® MULTI-MANAGER VALUE FUND
APPROVAL OF MANAGEMENT AGREEMENT AND SUBADVISORY AGREEMENT WITH DIMENSIONAL FUND ADVISORS LP
Columbia Management Investment Advisers, LLC (Columbia Threadneedle or the Investment Manager, and together with its domestic and global affiliates, Columbia Threadneedle Investments), a wholly-owned subsidiary of Ameriprise Financial, Inc. (Ameriprise Financial), serves as the investment manager to Active Portfolios® Multi-Manager Value Fund (the Fund). Under a management agreement (the Management Agreement), Columbia Threadneedle provides investment advice and other services to the Fund and other funds distributed by Columbia Management Investment Distributors, Inc. (collectively, the Funds). In addition, under a Subadvisory Agreement (the Subadvisory Agreement) between Columbia Threadneedle and Dimensional Fund Advisors LP (the Subadviser), the Subadviser has provided portfolio management and related services for the Fund.
On an annual basis, the Fund's Board of Trustees (the Board), including the independent Board members (the Independent Trustees), considers renewal of the Management Agreement and the Subadvisory Agreement (together, the Advisory Agreements). Columbia Threadneedle prepared detailed reports for the Board and its Contracts Committee in February, March and April 2016, including reports providing the results of analyses performed by an independent organization, Broadridge Financial Solutions, Inc. (Broadridge) and a comprehensive response to items of information requested by independent legal counsel to the Independent Trustees (Independent Legal Counsel) in a letter to the Investment Manager, to assist the Board in making this determination. Many of the materials presented in February, March and April were first supplied in draft form to designated independent Board representatives, i.e., Independent Legal Counsel, the Chair of the Board and/or the Chair of the Contracts Committee, and the final materials were revised to include information reflective of discussion and subsequent requests made by the Contracts Committee. In addition, throughout the year, the Board (or its committees) regularly meets with portfolio management teams and senior management personnel and reviews information prepared by Columbia Threadneedle addressing the services Columbia Threadneedle provides and Fund performance. The Board also accords appropriate weight to the work, deliberations and conclusions of the various committees, such as the Contracts Committee, the Investment Review Committee and the Compliance Committee in determining whether to continue the Advisory Agreements.
The Board, at its June 13-15, 2016 in-person Board meeting (the June Meeting), considered the renewal of the Advisory Agreements for an additional one-year term. At the June Meeting, Independent Legal Counsel reviewed with the Independent Trustees various factors relevant to the Board's consideration of advisory and subadvisory agreements and the Board's legal responsibilities related to such consideration. Following an analysis and discussion of the factors identified below, the Board, including all of the Independent Trustees, approved the renewal of each of the Advisory Agreements.
Nature, Extent and Quality of Services Provided by Columbia Threadneedle and the Subadviser
The Board analyzed various reports and presentations it had received detailing the services performed by Columbia Threadneedle and the Subadviser, as well as their history, reputation, expertise, resources and relative capabilities, and the qualifications of their personnel.
The Board specifically considered many developments during the past year concerning the services provided by Columbia Threadneedle, including, in particular, detailed information regarding the process employed for selecting and overseeing affiliated and unaffiliated Subadvisers and the enhancements made to the Subadviser investment oversight program, the Subadviser research, monitoring and termination processes and a restructuring of the team. The Board also noted the relatively recent change in the leadership of equity department oversight, improvements in technology research and the use of research analysts' model portfolios to highlight best ideas and improve implementation. The Board further observed the restructured investment risk management department and its additional resources, including the new head of multi-asset investment risk, the relatively recent 5P leadership transition, and the additional staff and resources dedicated to the 5P team. The Board also took into account the broad scope of services provided by Columbia Threadneedle to each subadvised Fund, including, among other services, investment, risk and compliance oversight. The Board also took into account the information it received concerning Columbia Threadneedle's ability to attract and retain key portfolio management personnel.
In connection with the Board's evaluation of the overall package of services provided by Columbia Threadneedle, the Board also considered the nature, quality and range of administrative services provided to the Fund by
Semiannual Report 2016
28
ACTIVE PORTFOLIOS® MULTI-MANAGER VALUE FUND
APPROVAL OF MANAGEMENT AGREEMENT AND SUBADVISORY AGREEMENT WITH DIMENSIONAL FUND ADVISORS LP (continued)
Columbia Threadneedle, as well as the achievements in 2015 in the performance of administrative services, and noted the various enhancements anticipated for 2016. In evaluating the quality of services provided under the Advisory Agreements, the Board also took into account the organization and strength of the Fund's and its service providers' compliance programs. The Board also reviewed the financial condition of Columbia Threadneedle and its affiliates and each entity's ability to carry out its responsibilities under the Management Agreement and the Fund's other service agreements with affiliates of Ameriprise Financial, observing the financial strength of Ameriprise Financial, with its solid balance sheet.
In addition, the Board discussed the acceptability of the terms of the Advisory Agreements (including the relatively broad scope of services required to be performed by Columbia Threadneedle and each Subadviser), noting that no material changes are proposed from the form of agreements previously approved. The Board also noted the wide array of legal and compliance services provided to the Funds. It was also observed that the services being performed under the Advisory Agreements were of a reasonably high quality.
With respect to the Subadviser, the Board observed that it had previously approved the Subadviser's code of ethics and compliance program, that the Chief Compliance Officer of the Fund continues to monitor the code and the program, and that no material concerns have been reported. The Board also considered the Subadviser's organizational strength and resources, portfolio management team depth and capabilities and investment process. The Board also considered the Subadviser's capability and wherewithal to carry out its responsibilities under the Subadvisory Agreement. In addition, the Board discussed the acceptability of the terms of the Subadvisory Agreement, including the scope of services required to be performed. The Board noted that the terms of the Subadvisory Agreement are generally consistent with the terms of other subadviser agreements for subadvisers who manage other funds managed by the Investment Manager. It was observed that no material changes were recommended to the Subadvisory Agreement. The Board took into account Columbia Threadneedle's representation that each Subadviser was in a position to provide quality services to the relevant Fund, noting those Subadvisers requiring heightened surveillance in light of their underperformance. In this regard, the Board further observed the recent bolstering of the subadvisory oversight team (under new leadership with added resources) intended to help improve performance.
Based on the foregoing, and based on other information received (both oral and written, including the information on investment performance referenced below) and other considerations, the Board concluded that the Subadviser is in a position to continue to provide a high quality and level of services to the Fund.
Investment Performance
For purposes of evaluating the nature, extent and quality of services provided under the Advisory Agreements, the Board carefully reviewed the investment performance of the Fund. In this regard, the Board considered detailed reports providing the results of analyses performed by an independent organization showing, for various periods, the performance of the Fund, the performance of a benchmark index, the percentage ranking of the Fund among its comparison group and the net assets of the Fund. The Board observed that the Fund's investment performance was appropriate in light of the particular management style involved and the particular market environment.
Additionally, the Board reviewed the performance of the Subadviser and Columbia Threadneedle's process for selecting and monitoring the Subadviser and the enhancements being implemented in the program. The Board considered, in particular, management's rationale for recommending the continued retention of the Subadviser and management's representations that their profitability is not a key factor in their recommendation to select, renew or terminate a Subadviser.
Comparative Fees, Costs of Services Provided and the Profits Realized by Columbia Threadneedle, its Affiliates and the Subadviser from their Relationships with the Fund
The Board reviewed comparative fees and the costs of services provided under each of the Advisory Agreements. The Board members considered detailed comparative information set forth in an annual report on fees and
Semiannual Report 2016
29
ACTIVE PORTFOLIOS® MULTI-MANAGER VALUE FUND
APPROVAL OF MANAGEMENT AGREEMENT AND SUBADVISORY AGREEMENT WITH DIMENSIONAL FUND ADVISORS LP (continued)
expenses, including, among other things, data (based on analyses conducted by an independent organization) showing a comparison of the Fund's expenses with median expenses paid by funds in its comparative peer universe, as well as data showing the Fund's contribution to Columbia Threadneedle's profitability.
The Board considered the reports of its independent fee consultant, JDL Consultants, LLC (JDL), which assisted in the Board's analysis of the Funds' performance and expenses, the reasonableness of the Funds' fee rates, the reasonableness of Columbia Threadneedle's profitability, and JDL's conclusion that the management fees being charged to the Fund are reasonable. The Board accorded particular weight to the notion that the level of fees should generally reflect a rational pricing model applied consistently across the various product lines in the Fund family, while assuring that the overall fees for each Fund (with certain defined exceptions) are generally in line with the "pricing philosophy" currently in effect (i.e., that the total expense ratio of the Fund is generally no higher than the median expense ratio of funds in the comparison universe of the Fund). The Board took into account that the Fund's total expense ratio (after considering proposed expense caps/waivers) was slightly below the peer universe's median expense ratio shown in the reports.
Additionally, the Board reviewed the level of subadvisory fees paid to the Subadviser, noting that the fees are paid by the Investment Manager and do not impact the fees paid by the Fund. The Board also reviewed the fees charged by the Subadviser to other mutual funds employing similar investment strategies where the Subadviser serves as investment adviser or subadviser. The Board also reviewed fee rates charged by other comparable mutual funds employing the Subadviser to provide subadvisory services. Based on its reviews, including recommendations from JDL, the Board concluded that the Fund's investment management and subadvisory fees were fair and reasonable in light of the extent and quality of services that the Fund receives.
The Board also considered the expected profitability of Columbia Threadneedle and its affiliates in connection with Columbia Threadneedle providing management services to the Fund. In this regard, the Independent Trustees referred to their detailed analysis of the Profitability Report, discussing the profitability to Columbia Threadneedle and Ameriprise Financial from managing, operating and distributing the Funds. The Board took into account JDL's conclusion that 2015 Columbia Threadneedle profitability, relative to industry competitors, was reasonable. It also considered that in 2015 the Board had concluded that 2014 profitability was reasonable and that Columbia Threadneedle generated 2015 profitability that only slightly exceeded 2014 levels. It also took into account the indirect economic benefits flowing to Columbia Threadneedle or its affiliates in connection with managing or distributing the Funds, such as the enhanced ability to offer various other financial products to Ameriprise Financial customers, soft dollar benefits and overall reputational advantages. The Board noted that the fees paid by the Fund should permit the Investment Manager to offer competitive compensation to its personnel, make necessary investments in its business and earn an appropriate profit. The Board concluded that profitability levels were reasonable.
Economies of Scale to be Realized
The Board also considered the economies of scale that might be realized by Columbia Threadneedle as the Fund grows and took note of the extent to which Fund shareholders might also benefit from such growth. In this regard, the Board took into account that management fees decline as Fund assets exceed various breakpoints, all of which have not been surpassed. The Board concluded that the breakpoints in the management fee rate schedule satisfactorily provides for the sharing of economies of scale, as they allow for adequate opportunity for shareholders to realize benefits (fee breaks) as Fund assets grow.
Based on the foregoing, the Board, including all of the Independent Trustees, concluded that fees payable under the Advisory Agreements were fair and reasonable in light of the extent and quality of services provided. In reaching this conclusion, no single factor was determinative. On June 15, 2016, the Board, including all of the Independent Trustees, approved the renewal of the Advisory Agreements.
Semiannual Report 2016
30
ACTIVE PORTFOLIOS® MULTI-MANAGER VALUE FUND
APPROVAL OF THE SUBADVISORY AGREEMENT WITH DIAMOND HILL CAPITAL MANAGEMENT, INC.
Columbia Management Investment Advisers, LLC (Columbia Threadneedle or the Investment Manager, and together with its domestic and global affiliates, Columbia Threadneedle Investments), a wholly-owned subsidiary of Ameriprise Financial, Inc. (Ameriprise Financial), serves as the investment manager to Active Portfolios® Multi-Manager Value Fund (the Fund). Under a management agreement (the Management Agreement), Columbia Threadneedle provides investment advice and other services to the Fund and other funds distributed by Columbia Management Investment Distributors, Inc. (collectively, the Funds). In addition, under a Subadvisory Agreement (the Subadvisory Agreement) between Columbia Threadneedle and Diamond Hill Capital Management, Inc. (Diamond Hill), Diamond Hill has provided portfolio management and related services for the Fund since October 1, 2016.
At a meeting of the Board on September 12-14, 2016 (the "September Meeting"), the Board, including all of the Independent Trustees, unanimously approved the proposed Subadvisory Agreement between Columbia Threadneedle and Diamond Hill for the Fund. Independent legal counsel to the Independent Trustees reminded the Board of the legal standards for consideration by directors/trustees of advisory and subadvisory agreements. The Board also recalled its most recent consideration and approval of advisory and subadvisory agreements for annual renewal purposes at its June 13-15, 2016 in-person Board meeting (the June Meeting) and, in that connection, independent legal counsel's discussion of the Board's responsibilities pursuant to Sections 15(c) and 36(b) of the Investment Company Act of 1940, and the SEC-enumerated factors that should be considered in determining whether to approve a new subadvisory agreement, in this case, with Diamond Hill. The Board, including the Contracts and Investment Review Committees, held discussions with Columbia Threadneedle and reviewed and considered various written materials and oral presentations in connection with the evaluation of Diamond Hill's proposed services, including the reports from the Compliance Committee, with respect to the code of ethics and compliance program of Diamond Hill. Following an analysis and discussion of the factors identified below, the Board, including all of the Independent Trustees, approved the Subadvisory Agreement with Diamond Hill.
Nature, Extent and Quality of Services to be Provided by Diamond Hill
The Board considered its analysis of the reports and presentations received by it, detailing the services proposed to be performed by Diamond Hill as subadviser for the Fund, as well as its history, reputation, expertise, resources and capabilities, and the qualifications of its personnel.
The Board observed that Diamond Hill's compliance program had been reviewed by the Fund's Chief Compliance Officer and was determined to be reasonably designed to prevent violations of the federal securities laws by the Fund. The Board also observed that information had been presented regarding the capabilities and organization of Diamond Hill and its ability to carry out its responsibilities under the proposed Subadvisory Agreement. The Board noted, in particular, that Diamond Hill's investment process was reviewed by the Investment Review Committee. The Board also recalled the information provided by Columbia Threadneedle and Diamond Hill regarding Diamond Hill's personnel, its risk controls, philosophy, and investment process.
The Board also discussed the acceptability of the terms of the proposed Subadvisory Agreement, including that the relatively broad scope of services required to be performed by Diamond Hill was generally similar in scope to subadvisory agreements applicable to other subadvised funds.
The Board recalled information about Diamond Hill's experience managing registered mutual funds. In that regard, the Board recalled the reports of Columbia Threadneedle regarding its search to identify an additional subadviser to complement the styles of DFA and Columbia Threadneedle. The Board reviewed the investment strategy and style of Diamond Hill and observed how they align with the goals of the Fund's shareholders.
Investment Performance of Diamond Hill
The Board noted that a review of investment performance is a key factor in evaluating the nature, extent and quality of services provided under investment advisory and subadvisory agreements. The Board considered Diamond Hill's investment performance, noting that Diamond Hill delivered relatively strong performance results versus the relevant benchmark over the 3-, 5- and 10-year periods for a strategy proposed to be utilized to subadvise the Fund.
Semiannual Report 2016
31
ACTIVE PORTFOLIOS® MULTI-MANAGER VALUE FUND
APPROVAL OF THE SUBADVISORY AGREEMENT WITH DIAMOND HILL CAPITAL MANAGEMENT, INC. (continued)
Based on the foregoing, and based on other information received (both oral and written) and other considerations, the Board concluded that Diamond Hill was in a position to provide a high quality level of service to the Fund.
Comparative Fees, Costs of Services Provided and Profitability
The Board reviewed the proposed level of subadvisory fees under the proposed Subadvisory Agreement, noting that the proposed subadvisory fees payable to Diamond Hill would be paid by Columbia Threadneedle and would not impact the fees paid by the Fund. The Board also reviewed data regarding fees charged by Diamond Hill to other clients. The Board observed that Diamond Hill also serves as an adviser to another mutual fund using a similar strategy proposed to be utilized by the Fund, and that the proposed subadvisory fees are lower than the management fees charged by Diamond Hill for the other mutual fund it advises. The Board also observed that the proposed subadvisory fees are generally in line with the range of subadvisory fees paid by Columbia Threadneedle to subadvisers of other large cap funds managed by Columbia Threadneedle. The Board also considered the expected modest decrease in total profitability of Columbia Threadneedle and its affiliates in connection with the hiring of Diamond Hill and concluded that the profitability levels remained within the reasonable ranges of profitability levels reported at the Fund's June Meeting.
Economies of Scale
The Board also considered economies of scale that may be realized by Columbia Threadneedle and its affiliates as the Fund grows and took note of the extent to which shareholders might also benefit from such growth. The Board considered that the proposed subadvisory fees are paid by Columbia Threadneedle rather than by the Fund. The Board observed that the Management Agreement would be unaffected by the subadviser change and continues to provide for sharing of economies of scale as investment management fees decline as assets increase at pre-established breakpoints. The Board further considered that the proposed Subadvisory Agreement with Diamond Hill provides for lower fees as assets increase at pre-established breakpoints.
Based on all of the foregoing, including all of the information received and presented, the Board, including all of the Independent Trustees, concluded that the proposed subadvisory fees to be paid under the Subadvisory Agreement were fair and reasonable in light of the extent and quality of services proposed to be provided. In reaching this conclusion, no single factor was determinative.
On September 14, 2016, the Board, including all of the Independent Trustees, approved the Subadvisory Agreement.
Semiannual Report 2016
32
ACTIVE PORTFOLIOS® MULTI-MANAGER VALUE FUND
IMPORTANT INFORMATION ABOUT THIS REPORT
Each fund mails one shareholder report to each shareholder address. If you would like more than one report, please call shareholder services at 800.345.6611 and additional reports will be sent to you.
The policy of the Board is to vote the proxies of the companies in which each fund holds investments consistent with the procedures as stated in the Statement of Additional Information (SAI). You may obtain a copy of the SAI without charge by calling 800.345.6611; contacting your financial intermediary; visiting investor.columbiathreadneedleus.com; or searching the website of the Securities and Exchange Commission (SEC) at sec.gov. Information regarding how each fund voted proxies relating to portfolio securities is filed with the SEC by August 31st for the most recent 12-month period ending June 30th of that year, and is available without charge by visiting investor.columbiathreadneedleus.com, or searching the website of the SEC at sec.gov.
Each fund files a complete schedule of portfolio holdings with the SEC for the first and third quarters of each fiscal year on Form N-Q. Each fund's Form N-Q is available on the SEC's website at sec.gov and may be reviewed and copied at the SEC's Public Reference Room in Washington, D.C. Information on the operation of the Public Reference Room may be obtained by calling 800.SEC.0330. Each fund's complete schedule of portfolio holdings, as filed on Form N-Q, can also be obtained without charge, upon request, by calling 800.345.6611.
Semiannual Report 2016
33
Active Portfolios® Multi-Manager Value Fund
P.O. Box 8081
Boston, MA 02266-8081

Please read and consider the investment objectives, risks, charges and expenses for any fund carefully before investing. For a prospectus and summary prospectus, which contains this and other important information about the Fund, go to investor.columbiathreadneedleus.com. The Fund is distributed by Columbia Management Investment Distributors, Inc., member FINRA, and managed by Columbia Management Investment Advisers, LLC.
Columbia Threadneedle Investments (Columbia Threadneedle) is the global brand name of the Columbia and Threadneedle group of companies.
All rights reserved. Columbia Management Investment Distributors, Inc., 225 Franklin Street, Boston, MA 02110-2804
© 2017 Columbia Management Investment Advisers, LLC.
investor.columbiathreadneedleus.com
SAR116_05_G01_(01/17)

SEMIANNUAL REPORT
November 30, 2016

COLUMBIA MORTGAGE OPPORTUNITIES FUND

ABOUT COLUMBIA THREADNEEDLE INVESTMENTS
Columbia Threadneedle Investments is a leading global asset management group that provides a broad range of investment strategies and solutions for individual, institutional and corporate clients around the world.
With more than 2,000 people, including over 450 investment professionals based in North America, Europe and Asia, we manage $460 billion* of assets across developed and emerging market equities, fixed income, asset allocation solutions and alternatives. We are the 13th largest manager of long-term mutual fund assets in the U.S.** and the 4th largest manager of retail funds in the U.K.***
Our priority is the investment success of our clients. We aim to deliver the investment outcomes they expect through an investment approach that is team-based, performance-driven and risk-aware. Our culture is dynamic and interactive. By sharing our insights across asset classes and geographies, we generate richer perspectives on global, regional and local investment landscapes. The ability to exchange and debate investment ideas in a collaborative environment enriches our teams' investment processes. More importantly, it results in better informed investment decisions for our clients.
Columbia funds are distributed by Columbia Management Investment Distributors, Inc., member FINRA, and managed by Columbia Management Investment Advisers, LLC.
Columbia Threadneedle Investments (Columbia Threadneedle) is the global brand name of the Columbia and Threadneedle group of companies.
* In U.S. dollars as of June 30, 2016. Source: Ameriprise Q2 Earnings Release. Includes all assets managed by entities in the Columbia and Threadneedle group of companies. Contact us for more current data.
** Source: ICI as of June 30, 2016 for Columbia Management Investment Advisers, LLC.
*** Source: Investment Association as of March 2016 for Threadneedle Asset Management Limited.
© 2016 Columbia Management Investment Advisers, LLC. All rights reserved.
Not part of the shareholder report
Investment strategies to help meet investor needs
We are committed to helping investors navigate financial challenges to reach their desired outcomes. The possibilities are endless.
Your success is our priority.
 Retire comfortably
 Fund college or higher education
 Leave a legacy

Generate an appropriate stream of income in retirement
Traditional approaches to income may no longer be adequate — and they may no longer provide the diversification benefits they once did. Investors need to rethink how they generate retirement income.
Worried about running out of income? You are not alone.

Navigate a changing interest rate environment
Even in today's challenging interest rate environment, it's still possible to navigate markets and achieve your goals.
Make investment choices designed specifically for this market environment.

Maximize after-tax returns
In an environment where what you keep is more important than what you earn, municipal bonds can help mitigate higher taxes while providing attractive yields compared to other investment options.
You've worked too hard building your wealth to lose it to taxes.

Grow assets to achieve financial goals
Finding growth opportunities in today's complex market environment requires strong research capabilities, creative thinking and a disciplined approach.
Do your investments deliver the portfolio growth you need?

Ease the impact of volatile markets
With increasing concerns about market volatility, investors should consider diversifying their portfolios with non-traditional holdings.
Interested in turning volatility into opportunity?
To find out more, contact your financial professional, call 800.426.3750 or visit investor.columbiathreadneedleus.com
Not part of the shareholder report
 Dear Shareholders,
While emotions have run high following the outcome of the U.S. Presidential election, it remains unclear how the Trump presidency will unfold in terms of policy. We have a sense of the priorities espoused by the president-elect over the past eighteen months, but campaign priorities are not always realized and are often never pursued. What seems certain is that, while some investors have already priced expectations into the market, others have retreated, preferring instead a wait and see approach. The outcome of such behaviors appears to have created conditions ripe for ongoing market volatility.
While volatility in the financial markets can be stressful, volatility itself is not a new phenomenon. Other factors that have been at the root cause of recent volatility include uncertainty following the United Kingdom's vote to exit the European Union (Brexit), speculation around the Federal Reserve's decision to increase interest rates, divergent central bank policy and geopolitical unrest. The point is, financial markets have fluctuated for years and may be expected to continue to fluctuate — sometimes wildly. If anything, such volatility seems to be the new normal, perhaps exacerbated by access to information and development of technological tools which have enabled investors to react rapidly to real and perceived change. So what can you do?
Position your portfolio for the reality of market volatility
That there is a historical precedent for market volatility, or even an acceptance that it may persist, offers little comfort. A measured and strategic approach remains the best strategy for investors to stay on track in achieving their investment goals.
Step 1: Review your investment goals
Take this opportunity to review your investment goals and the strategies you are pursuing to achieve those goals in order to remain focused on what's important to you. It is entirely possible that your goals have changed in response either to your life situation or to changes in the market. Accept what you can't control — volatility, and focus on what you can — your investment goals and strategies.
Step 2: Reassess your risk tolerance
Sit down with your financial advisor to discuss your investment goals and strategies, as well as any changes to your tolerance for risk. Consider your investment horizon. Increased market volatility and a new investment horizon may impact the strategies that can best help you achieve your investment goals. Remember, achieving your investment goals may require a certain amount of risk. Ultimately, you must maintain vigilance in reassessing your risk tolerance and the strategies you have selected in pursuit of your investment goals, and awareness of how those strategies may react to market volatility.
Step 3: Remain calm and focus on your long-term plan
Remember, investing is about the long game. Short term events are not necessarily evidence of a longer term reality. Investors who attempt to time the market too often end up reacting to a down turn by selling low and then compounding the problem by waiting on the sidelines, ultimately missing the right opportunity to reinvest.
As long as there is a market, there will be volatility. How you respond to that volatility can make a big difference in the measure of your success as an investor. Talk to your financial advisor about how working with Columbia Threadneedle Investments may help you position your portfolio for the reality of ongoing volatility and, perhaps, even turn such volatility into investment opportunity.
Best regards,

Christopher O. Petersen
President, Columbia Funds
Investors should consider the investment objectives, risks, charges and expenses of a mutual fund carefully before investing. For a free prospectus and summary prospectus, which contains this and other important information about a fund, visit investor.columbiathreadneedleus.com. The prospectus should be read carefully before investing.
Columbia Funds are distributed by Columbia Management Investment Distributors, Inc., member FINRA, and managed by Columbia Management Investment Advisers, LLC.
© 2017 Columbia Management Investment Advisers, LLC. All rights reserved.
COLUMBIA MORTGAGE OPPORTUNITIES FUND
Performance Overview | | | 2 | | |
Portfolio Overview | | | 3 | | |
Understanding Your Fund's Expenses | | | 4 | | |
Portfolio of Investments | | | 5 | | |
Statement of Assets and Liabilities | | | 14 | | |
Statement of Operations | | | 16 | | |
Statement of Changes in Net Assets | | | 17 | | |
Financial Highlights | | | 19 | | |
Notes to Financial Statements | | | 26 | | |
Approval of Management Agreement | | | 40 | | |
Important Information About This Report | | | 43 | | |
Fund Investment Manager
Columbia Management Investment
Advisers, LLC
225 Franklin Street
Boston, MA 02110
Fund Distributor
Columbia Management Investment
Distributors, Inc.
225 Franklin Street
Boston, MA 02110
Fund Transfer Agent
Columbia Management Investment
Services Corp.
P.O. Box 8081
Boston, MA 02266-8081
For more information about any of the funds, please visit investor.columbiathreadneedleus.com or call 800.345.6611. Customer Service Representatives are available to answer your questions Monday through Friday from 8 a.m. to 7 p.m. Eastern time.
The views expressed in this report reflect the current views of the respective parties. These views are not guarantees of future performance and involve certain risks, uncertainties and assumptions that are difficult to predict, so actual outcomes and results may differ significantly from the views expressed. These views are subject to change at any time based upon economic, market or other conditions and the respective parties disclaim any responsibility to update such views. These views may not be relied on as investment advice and, because investment decisions for a Columbia fund are based on numerous factors, may not be relied on as an indication of trading intent on behalf of any particular Columbia fund. References to specific securities should not be construed as a recommendation or investment advice.
COLUMBIA MORTGAGE OPPORTUNITIES FUND
PERFORMANCE OVERVIEW
(Unaudited)
Performance Summary
n Columbia Mortgage Opportunities Fund (the Fund) Class A shares returned 4.24% excluding sales charges for the six-month period that ended November 30, 2016.
n The Fund outperformed its benchmark, the Citi One-Month U.S. Treasury Bill Index, which returned 0.10% for the same time period.
Average Annual Total Returns (%) (for period ended November 30, 2016)
| | | Inception | | 6 Months
Cumulative | | 1 Year | | Life | |
Class A | | 04/30/14 | | | | | | | | | | | | | |
Excluding sales charges | | | | | | | 4.24 | | | | 6.17 | | | | 3.95 | | |
Including sales charges | | | | | | | 1.11 | | | | 3.00 | | | | 2.74 | | |
Class C | | 04/30/14 | | | | | | | | | | | | | |
Excluding sales charges | | | | | | | 3.86 | | | | 5.37 | | | | 3.18 | | |
Including sales charges | | | | | | | 2.86 | | | | 4.37 | | | | 3.18 | | |
Class I | | 04/30/14 | | | 4.45 | | | | 6.59 | | | | 4.37 | | |
Class R4 | | 04/30/14 | | | 4.37 | | | | 6.43 | | | | 4.21 | | |
Class R5 | | 04/30/14 | | | 4.42 | | | | 6.53 | | | | 4.31 | | |
Class W | | 04/30/14 | | | 4.25 | | | | 6.17 | | | | 3.96 | | |
Class Z | | 04/30/14 | | | 4.37 | | | | 6.43 | | | | 4.21 | | |
Citi One-Month U.S. Treasury Bill Index | | | | | | | 0.10 | | | | 0.19 | | | | 0.08 | | |
Returns for Class A are shown with and without the maximum initial sales charge of 3.00%. Returns for Class C are shown with and without the 1.00% contingent deferred sales charge for the first year only. The Fund's other classes are not subject to sales charges and have limited eligibility. Please see the Fund's prospectus for details. Performance for different share classes will vary based on differences in sales charges and fees associated with each class. All results shown assume reinvestment of distributions during the period. Returns do not reflect the deduction of taxes that a shareholder may pay on Fund distributions or on the redemption of Fund shares. Performance results reflect the effect of any fee waivers or reimbursements of Fund expenses by Columbia Management Investment Advisers, LLC and/or any of its affiliates. Absent these fee waivers or expense reimbursement arrangements, performance results would have been lower.
The performance information shown represents past performance and is not a guarantee of future results. The investment return and principal value of your investment will fluctuate so that your shares, when redeemed, may be worth more or less than their original cost. Current performance may be lower or higher than the performance information shown. You may obtain performance information current to the most recent month-end by contacting your financial intermediary, visiting investor.columbiathreadneedleus.com or calling 800.345.6611.
The Citi One-Month U.S. Treasury Bill Index is an unmanaged index that measures the rate of return for 30-day U.S. Treasury Bills.
Indices are not available for investment, are not professionally managed and do not reflect sales charges, fees, brokerage commissions, taxes or other expenses of investing. Securities in the Fund may not match those in an index.
Semiannual Report 2016
2
COLUMBIA MORTGAGE OPPORTUNITIES FUND
PORTFOLIO OVERVIEW
(Unaudited)
Portfolio Breakdown (%)
(at November 30, 2016) | |
Asset-Backed Securities — Non-Agency | | | 7.7 | | |
Commercial Mortgage-Backed Securities — Non-Agency | | | 12.7 | | |
Money Market Funds | | | 2.6 | | |
Options Purchased Puts | | | 2.3 | | |
Residential Mortgage-Backed Securities — Agency | | | 50.2 | | |
Residential Mortgage-Backed Securities — Non-Agency | | | 24.5 | | |
Total | | | 100.0 | | |
Percentages indicated are based upon total investments. The Fund's portfolio composition is subject to change.
Quality Breakdown (%)
(at November 30, 2016) | |
AAA rating | | | 53.1 | | |
A rating | | | 0.7 | | |
BBB rating | | | 1.3 | | |
BB rating | | | 8.0 | | |
B rating | | | 2.5 | | |
Not rated | | | 34.4 | | |
Total | | | 100.0 | | |
Percentages indicated are based upon total fixed income investments (excluding Money Market Funds).
Bond ratings apply to the underlying holdings of the Fund and not the Fund itself and are divided into categories ranging from highest to lowest credit quality, determined by using the middle rating of Moody's, S&P and Fitch, after dropping the highest and lowest available ratings. When ratings are available from only two rating agencies, the lower rating is used. When a rating is available from only one rating agency, that rating is used. When a bond is not rated by any rating agency, it is designated as "Not rated." Credit quality ratings assigned by a rating agency are subjective opinions, not statements of fact, and are subject to change, including daily. The ratings assigned by credit rating agencies are but one of the considerations that the Investment Manager and/or Fund's subadviser incorporates into its credit analysis process, along with such other issuer-specific factors as cash flows, capital structure and leverage ratios, ability to de-leverage (repay) through free cash flow, quality of management, market positioning and access to capital, as well as such security-specific factors as the terms of the security (e.g., interest rate and time to maturity) and the amount and type of any collateral.
Portfolio Management
Jason Callan
Tom Heuer, CFA
Semiannual Report 2016
3
COLUMBIA MORTGAGE OPPORTUNITIES FUND
UNDERSTANDING YOUR FUND'S EXPENSES
(Unaudited)
As an investor, you incur two types of costs. There are transaction costs, which generally include sales charges on purchases and may include redemption fees. There are also ongoing costs, which generally include management fees, distribution and/or service fees, and other fund expenses. The following information is intended to help you understand your ongoing costs (in dollars) of investing in the Fund and to help you compare these costs with the ongoing costs of investing in other mutual funds.
Analyzing Your Fund's Expenses
To illustrate these ongoing costs, we have provided examples and calculated the expenses paid by investors in each share class of the Fund during the period. The actual and hypothetical information in the table is based on an initial investment of $1,000 at the beginning of the period indicated and held for the entire period. Expense information is calculated two ways and each method provides you with different information. The amount listed in the "Actual" column is calculated using the Fund's actual operating expenses and total return for the period. You may use the Actual information, together with the amount invested, to estimate the expenses that you paid over the period. Simply divide your account value by $1,000 (for example, an $8,600 account value divided by $1,000 = 8.6), then multiply the results by the expenses paid during the period under the "Actual" column. The amount listed in the "Hypothetical" column assumes a 5% annual rate of return before expenses (which is not the Fund's actual return) and then applies the Fund's actual expense ratio for the period to the hypothetical return. You should not use the hypothetical account values and expenses to estimate either your actual account balance at the end of the period or the expenses you paid during the period. See "Compare With Other Funds" below for details on how to use the hypothetical data.
Compare With Other Funds
Since all mutual funds are required to include the same hypothetical calculations about expenses in shareholder reports, you can use this information to compare the ongoing cost of investing in the Fund with other funds. To do so, compare the hypothetical example with the 5% hypothetical examples that appear in the shareholder reports of other funds. As you compare hypothetical examples of other funds, it is important to note that hypothetical examples are meant to highlight the ongoing costs of investing in a fund only and do not reflect any transaction costs, such as sales charges, or redemption or exchange fees. Therefore, the hypothetical calculations are useful in comparing ongoing costs only, and will not help you determine the relative total costs of owning different funds. If transaction costs were included in these calculations, your costs would be higher.
June 1, 2016 – November 30, 2016
| | | Account Value at the Beginning
of the Period ($) | | Account Value at the End of the
Period ($) | | Expenses Paid During the
Period ($) | | Fund's Annualized
Expense Ratio (%) | |
| | | Actual | | Hypothetical | | Actual | | Hypothetical | | Actual | | Hypothetical | | Actual | |
Class A | | | 1,000.00 | | | | 1,000.00 | | | | 1,042.40 | | | | 1,020.10 | | | | 5.07 | | | | 5.01 | | | | 0.99 | | |
Class C | | | 1,000.00 | | | | 1,000.00 | | | | 1,038.60 | | | | 1,016.34 | | | | 8.89 | | | | 8.80 | | | | 1.74 | | |
Class I | | | 1,000.00 | | | | 1,000.00 | | | | 1,044.50 | | | | 1,021.96 | | | | 3.18 | | | | 3.14 | | | | 0.62 | | |
Class R4 | | | 1,000.00 | | | | 1,000.00 | | | | 1,043.70 | | | | 1,021.36 | | | | 3.79 | | | | 3.75 | | | | 0.74 | | |
Class R5 | | | 1,000.00 | | | | 1,000.00 | | | | 1,044.20 | | | | 1,021.71 | | | | 3.43 | | | | 3.40 | | | | 0.67 | | |
Class W | | | 1,000.00 | | | | 1,000.00 | | | | 1,042.50 | | | | 1,020.16 | | | | 5.02 | | | | 4.96 | | | | 0.98 | | |
Class Z | | | 1,000.00 | | | | 1,000.00 | | | | 1,043.70 | | | | 1,021.36 | | | | 3.79 | | | | 3.75 | | | | 0.74 | | |
Expenses paid during the period are equal to the annualized expense ratio for each class as indicated above, multiplied by the average account value over the period and then multiplied by the number of days in the Fund's most recent fiscal half year and divided by 365.
Expenses do not include fees and expenses incurred indirectly by the Fund from its investment in underlying funds, including affiliated and non-affiliated pooled investment vehicles, such as mutual funds and exchange-traded funds.
Had Columbia Management Investment Advisers, LLC and/or certain of its affiliates not waived/reimbursed certain fees and expenses, account value at the end of the period would have been reduced.
Semiannual Report 2016
4
COLUMBIA MORTGAGE OPPORTUNITIES FUND
PORTFOLIO OF INVESTMENTS
November 30, 2016 (Unaudited)
(Percentages represent value of investments compared to net assets)
Residential Mortgage-Backed Securities — Agency 72.7%
Issuer | | Coupon
Rate | | Principal
Amount ($) | | Value ($) | |
Federal Home Loan Mortgage Corp.(a)
CMO IO STRIPS Series 304 Class C67
12/15/42 | | | 4.500 | % | | | 10,581,247 | | | | 2,991,689 | | |
CMO IO Series 329 Class C5
06/15/43 | | | 3.500 | % | | | 1,324,248 | | | | 236,642 | | |
CMO IO Series 4098 Class AI
05/15/39 | | | 3.500 | % | | | 14,203,886 | | | | 1,472,352 | | |
CMO IO Series 4120 Class IA
10/15/42 | | | 3.500 | % | | | 1,935,888 | | | | 377,802 | | |
CMO IO Series 4121 Class IA
01/15/41 | | | 3.500 | % | | | 2,075,769 | | | | 278,957 | | |
CMO IO Series 4213 Class DI
06/15/38 | | | 3.500 | % | | | 10,452,073 | | | | 1,112,399 | | |
CMO IO Series 4215 Class IL
07/15/41 | | | 3.500 | % | | | 11,080,089 | | | | 1,290,832 | | |
Federal Home Loan Mortgage Corp.(a)(b)
CMO IO STRIPS Series 280 Class S1
09/15/42 | | | 5.462 | % | | | 3,535,050 | | | | 738,203 | | |
CMO IO STRIPS Series 309 Class S4
08/15/43 | | | 5.432 | % | | | 7,958,354 | | | | 1,752,196 | | |
CMO IO STRIPS Series 312 Class S1
09/15/43 | | | 5.412 | % | | | 7,105,098 | | | | 1,577,936 | | |
CMO IO Series 311 Class S1
08/15/43 | | | 5.412 | % | | | 13,599,213 | | | | 2,847,648 | | |
CMO IO Series 326 Class S2
03/15/44 | | | 5.412 | % | | | 9,384,054 | | | | 1,984,973 | | |
CMO IO Series 3922 Class SH
09/15/41 | | | 5.362 | % | | | 15,211,129 | | | | 2,221,531 | | |
CMO IO Series 3957 Class WS
11/15/41 | | | 6.012 | % | | | 7,487,534 | | | | 1,145,382 | | |
CMO IO Series 4097 Class ST
08/15/42 | | | 5.512 | % | | | 4,069,080 | | | | 784,819 | | |
CMO IO Series 4223 Class DS
12/15/38 | | | 5.562 | % | | | 2,800,419 | | | | 375,597 | | |
CMO IO Series 4286 Class NS
12/15/43 | | | 5.362 | % | | | 3,215,298 | | | | 736,124 | | |
CMO IO Series 4559 Class AS
03/15/42 | | | 1.919 | % | | | 94,053,277 | | | | 5,949,585 | | |
CMO IO Series 4620 Class AS
11/15/42 | | | 1.851 | % | | | 9,768,799 | | | | 625,372 | | |
Federal National Mortgage Association(a)
CMO IO STRIPS Series 413 Class C39
04/25/41 | | | 4.500 | % | | | 4,385,360 | | | | 944,857 | | |
CMO IO Series 2012-121 Class GI
08/25/39 | | | 3.500 | % | | | 6,255,533 | | | | 791,594 | | |
CMO IO Series 2012-152 Class EI
07/25/31 | | | 3.000 | % | | | 14,232,053 | | | | 1,619,699 | | |
CMO IO Series 2012-96 Class CI
04/25/39 | | | 3.500 | % | | | 6,560,278 | | | | 607,001 | | |
CMO IO Series 2013-117 Class AI
04/25/36 | | | 3.500 | % | | | 5,104,079 | | | | 366,937 | | |
CMO IO Series 2013-118 Class AI
09/25/38 | | | 4.000 | % | | | 5,373,822 | | | | 490,534 | | |
CMO IO Series 2013-31 Class IH
02/25/43 | | | 3.500 | % | | | 11,159,692 | | | | 1,513,744 | | |
Residential Mortgage-Backed Securities — Agency (continued)
Issuer | | Coupon
Rate | | Principal
Amount ($) | | Value ($) | |
Federal National Mortgage Association(a)(b)
CMO IO Series 2013-101 Class CS
10/25/43 | | | 5.316 | % | | | 5,612,339 | | | | 1,298,687 | | |
CMO IO Series 2013-107 Class SB
02/25/43 | | | 5.366 | % | | | 6,809,426 | | | | 1,608,689 | | |
CMO IO Series 2013-124 Class SB
12/25/43 | | | 5.366 | % | | | 8,189,694 | | | | 1,737,886 | | |
CMO IO Series 2013-54 Class BS
06/25/43 | | | 5.566 | % | | | 7,541,810 | | | | 1,878,279 | | |
CMO IO Series 2013-97 Class SB
06/25/32 | | | 5.516 | % | | | 3,147,153 | | | | 373,835 | | |
CMO IO Series 2014-93 Class ES
01/25/45 | | | 5.566 | % | | | 3,815,625 | | | | 915,099 | | |
CMO IO Series 2015-18 Class IO
04/25/45 | | | 1.995 | % | | | 57,999,746 | | | | 4,093,013 | | |
CMO IO Series 2016-31 Class VS
06/25/46 | | | 5.416 | % | | | 5,702,627 | | | | 1,005,452 | | |
CMO IO Series 2016-37 Class SA
06/25/46 | | | 5.266 | % | | | 18,151,500 | | | | 4,167,158 | | |
CMO IO Series 2016-39 Class LS
07/25/46 | | | 5.416 | % | | | 9,522,866 | | | | 2,285,438 | | |
CMO IO Series 2016-4 Class BS
02/25/46 | | | 5.516 | % | | | 9,269,806 | | | | 2,173,413 | | |
CMO IO Series 2016-45 Class AS
07/25/46 | | | 5.416 | % | | | 4,853,061 | | | | 1,128,097 | | |
CMO IO Series 2016-49 Class LS
08/25/46 | | | 5.366 | % | | | 9,721,905 | | | | 2,216,012 | | |
CMO IO Series 2016-50 Class GS
08/25/46 | | | 5.366 | % | | | 14,303,280 | | | | 3,206,911 | | |
CMO IO Series 2016-54 Class SD
08/25/46 | | | 5.416 | % | | | 9,775,131 | | | | 2,201,022 | | |
CMO IO Series 2016-62 Class AS
09/25/46 | | | 1.901 | % | | | 37,165,634 | | | | 2,369,265 | | |
CMO IO Series 416 Class S1
11/25/42 | | | 5.516 | % | | | 3,398,724 | | | | 710,406 | | |
Federal National Mortgage Association(c)
12/13/46 | | | 3.000 | % | | | 60,000,000 | | | | 59,765,628 | | |
12/13/46 | | | 3.500 | % | | | 57,500,000 | | | | 59,052,051 | | |
Government National Mortgage Association(a)
CMO IO Series 2012-38 Class MI
03/20/42 | | | 4.000 | % | | | 11,094,008 | | | | 2,116,294 | | |
CMO IO Series 2014-184 Class CI
11/16/41 | | | 3.500 | % | | | 12,684,387 | | | | 1,945,087 | | |
CMO IO Series 2015-53 Class EI
04/16/45 | | | 3.500 | % | | | 12,021,815 | | | | 2,055,489 | | |
Government National Mortgage Association(a)(b)
CMO IO Series 2015-144 Class SA
10/20/45 | | | 5.638 | % | | | 2,801,277 | | | | 686,378 | | |
Total Residential Mortgage-Backed
Securities — Agency
(Cost: $199,116,025) | | | | | | | 193,823,994 | | |
The accompanying Notes to Financial Statements are an integral part of this statement.
Semiannual Report 2016
5
COLUMBIA MORTGAGE OPPORTUNITIES FUND
PORTFOLIO OF INVESTMENTS (continued)
November 30, 2016 (Unaudited)
Residential Mortgage-Backed Securities — Non-Agency 35.6%
Issuer | | Coupon
Rate | | Principal
Amount ($) | | Value ($) | |
Ajax Mortgage Loan Trust
CMO Series 2016-C Class A(d)
10/25/57 | | | 4.000 | % | | | 3,186,926 | | | | 3,190,469 | | |
Angel Oak Mortgage Trust I LLC
Series 2016-1 Class A2(d)
07/25/46 | | | 5.000 | % | | | 2,624,162 | | | | 2,590,962 | | |
Angel Oak Mortgage Trust LLC(d)
Series 2015-1
11/25/45 | | | 4.500 | % | | | 1,005,133 | | | | 1,011,373 | | |
11/25/45 | | | 5.500 | % | | | 3,500,000 | | | | 3,498,382 | | |
BCAP LLC Trust(b)(d)
CMO Series 2014-RR3 Class 3A1
07/26/36 | | | 0.675 | % | | | 407,168 | | | | 396,158 | | |
Series 2010-RR11 Class 8A1
05/27/37 | | | 5.391 | % | | | 1,743,019 | | | | 1,747,091 | | |
Series 2011-RR5 Class 11A4
05/28/36 | | | 0.684 | % | | | 3,066,287 | | | | 2,923,935 | | |
Bayview Opportunity Master Fund IIIa Trust
CMO Series 2016-RN3 Class A1(d)
09/28/31 | | | 3.598 | % | | | 4,761,946 | | | | 4,762,187 | | |
Bayview Opportunity Master Fund IVA Trust
Subordinated, CMO Series 2016-SPL1 Class B3(d)(e)
04/28/55 | | | 5.500 | % | | | 2,500,000 | | | | 2,576,433 | | |
Bayview Opportunity Master Fund Trust
CMO Series 2016-LT1 Class A1(d)
10/28/31 | | | 3.475 | % | | | 1,964,029 | | | | 1,959,191 | | |
Bellemeade Re II Ltd.(b)(d)
CMO Series 2016-1A Class M2A
04/25/26 | | | 5.092 | % | | | 4,000,000 | | | | 4,026,156 | | |
Series 2016-1A Class M2B
04/25/26 | | | 7.092 | % | | | 5,761,000 | | | | 5,846,647 | | |
CAM Mortgage Trust(b)(d)
Series 2015-1 Class A
07/15/64 | | | 3.500 | % | | | 152,793 | | | | 152,701 | | |
CAM Mortgage Trust(d) | |
CMO Series 2016-1 Class A
01/15/56 | | | 4.000 | % | | | 2,026,048 | | | | 2,023,161 | | |
CMO Series 2016-2 Class A2
06/15/57 | | | 5.000 | % | | | 5,000,000 | | | | 4,935,494 | | |
COLT LLC
CMO Series 15-1 Class A2(b)(d)
12/26/45 | | | 4.342 | % | | | 1,611,721 | | | | 1,610,210 | | |
CSMC Trust
CMO Series 2015-RPL1 Class A2(b)(d)
02/25/57 | | | 4.682 | % | | | 1,845,000 | | | | 1,799,386 | | |
Citigroup Mortgage Loan Trust, Inc.(a)(d)
CMO IO Series 2015-A Class A1IO
06/25/58 | | | 1.000 | % | | | 88,928,470 | | | | 2,304,964 | | |
CMO IO Series 2015-A Class A4IO
06/25/58 | | | 0.250 | % | | | 13,749,097 | | | | 89,091 | | |
Residential Mortgage-Backed Securities — Non-Agency (continued)
Issuer | | Coupon
Rate | | Principal
Amount ($) | | Value ($) | |
Citigroup Mortgage Loan Trust, Inc.(b)(d)
CMO Series 2014-11 Class 5A2
11/25/36 | | | 16.777 | % | | | 1,589,159 | | | | 1,738,132 | | |
CMO Series 2014-2 Class 3A3
08/25/37 | | | 0.674 | % | | | 2,845,269 | | | | 2,775,561 | | |
CMO Series 2014-C Class A
02/25/54 | | | 3.250 | % | | | 4,262,368 | | | | 4,090,144 | | |
CMO Series 2015-A Class B3
06/25/58 | | | 4.500 | % | | | 4,139,647 | | | | 3,871,586 | | |
Series 2013-11 Class 3A3
09/25/34 | | | 3.082 | % | | | 824,534 | | | | 763,152 | | |
Credit Suisse Mortgage Capital Certificates(b)(d)
CMO Series 2014-RPL4 Class A1
08/25/62 | | | 3.625 | % | | | 2,474,032 | | | | 2,507,746 | | |
CMO Series 2014-RPL4 Class A2
08/25/62 | | | 4.788 | % | | | 4,500,000 | | | | 4,360,051 | | |
Credit Suisse Mortgage Capital Certificates(d)
CMO Series 2010-9R Class 10A5
04/27/37 | | | 4.000 | % | | | 598,728 | | | | 595,586 | | |
CMO Series 2010-9R Class 1A5
08/27/37 | | | 4.000 | % | | | 4,000,000 | | | | 3,927,054 | | |
CMO Series 2010-9R Class 2A5
02/27/38 | | | 4.000 | % | | | 2,040,554 | | | | 1,976,809 | | |
CMO Series 2010-9R Class 7A5
05/27/37 | | | 4.000 | % | | | 333,279 | | | | 332,203 | | |
Credit Suisse Securities (USA) LLC(d)
CMO Series 2014-5R Class 5A2
07/27/37 | | | 3.250 | % | | | 2,512,215 | | | | 2,392,665 | | |
CMO Series 2014-RPL1 Class A3
02/25/54 | | | 4.158 | % | | | 2,500,000 | | | | 2,481,616 | | |
Deephaven Residential Mortgage Trust
Series 2016-1A Class A2(d)
07/25/46 | | | 5.500 | % | | | 3,778,753 | | | | 3,755,658 | | |
Jefferies Resecuritization Trust
CMO Series 2014-R1 Class 1A1(d)
12/27/37 | | | 4.000 | % | | | 1,034,470 | | | | 1,034,095 | | |
NRZ Excess Spread-Collateralized Notes
CMO Series 2016-PLS2 Class A(d)
07/25/21 | | | 5.683 | % | | | 1,919,018 | | | | 1,917,099 | | |
New Residential Mortgage Loan Trust
CMO IO Series 2014-1A Class AIO(a)(b)(d)
01/25/54 | | | 2.279 | % | | | 20,492,057 | | | | 1,169,803 | | |
SGR Residential Mortgage Trust
CMO Series 2016-1 Class A1(d)
11/25/46 | | | 3.750 | % | | | 2,787,888 | | | | 2,786,265 | | |
VML LLC
CMO Series 2014-NPL1 Class A1(d)
04/27/54 | | | 3.875 | % | | | 874,201 | | | | 870,391 | | |
Vericrest Opportunity Loan Transferee XXXV LLC
CMO Series 2016-NPL9 Class A1(d)
09/25/46 | | | 3.500 | % | | | 1,953,464 | | | | 1,951,928 | | |
The accompanying Notes to Financial Statements are an integral part of this statement.
Semiannual Report 2016
6
COLUMBIA MORTGAGE OPPORTUNITIES FUND
PORTFOLIO OF INVESTMENTS (continued)
November 30, 2016 (Unaudited)
Residential Mortgage-Backed Securities — Non-Agency (continued)
Issuer | | Coupon
Rate | | Principal
Amount ($) | | Value ($) | |
Wedgewood Real Estate Trust
CMO Series 2016-1 Class A2(d)
07/15/46 | | | 5.000 | % | | | 2,000,000 | | | | 1,992,291 | | |
Total Residential Mortgage-Backed
Securities — Non-Agency
(Cost: $94,881,821) | | | | | | | 94,733,826 | | |
Commercial Mortgage-Backed Securities — Non-Agency 18.4%
American Homes 4 Rent(b)(d)
Series 2014-SFR1 Class E
06/17/31 | | | 3.039 | % | | | 3,500,000 | | | | 3,465,859 | | |
Series 2014-SFR1 Class F
06/17/31 | | | 3.789 | % | | | 3,250,000 | | | | 3,190,940 | | |
American Homes 4 Rent(d)
Series 2015-SFR1 Class F
04/17/52 | | | 5.885 | % | | | 2,000,000 | | | | 1,956,272 | | |
B2R Mortgage Trust
Series 2015-2 Class E(b)(d)
11/15/48 | | | 5.667 | % | | | 1,500,000 | | | | 1,290,768 | | |
BHMS Mortgage Trust
Series 2014-ATLS Class DFX(b)(d)
07/05/33 | | | 4.847 | % | | | 3,000,000 | | | | 2,951,198 | | |
Hilton USA Trust(b)(d)
Series 2016-HHV Class F
11/05/38 | | | 4.194 | % | | | 12,000,000 | | | | 9,290,435 | | |
Hilton USA Trust(d) | |
Subordinated, Series 2016-SFP Class E
11/05/35 | | | 5.519 | % | | | 4,000,000 | | | | 3,857,189 | | |
Invitation Homes Trust(b)(d)
Series 2015-SFR3 Class E
08/17/32 | | | 4.289 | % | | | 1,000,000 | | | | 1,003,427 | | |
Series 2015-SFR3 Class F
08/17/32 | | | 5.289 | % | | | 1,000,000 | | | | 1,006,737 | | |
Subordinated, Series 2014-SFR3 Class F
12/17/31 | | | 5.539 | % | | | 2,500,000 | | | | 2,503,513 | | |
Subordinated, Series 2015-SFR1 Class E
03/17/32 | | | 4.739 | % | | | 3,000,000 | | | | 3,018,442 | | |
JPMCC Re-REMIC Trust
Series 2016-GG10 Class AMB(b)(d)
08/15/45 | | | 5.988 | % | | | 5,000,000 | | | | 4,976,192 | | |
Rialto Capital Management LLC
Series 2014-LT5 Class B(d)
05/15/24 | | | 5.000 | % | | | 3,000,000 | | | | 2,997,926 | | |
Rialto Real Estate Fund LLC
Subordinated, Series 2015-LT7 Class B(d)
12/25/32 | | | 5.071 | % | | | 1,000,000 | | | | 999,494 | | |
Commercial Mortgage-Backed Securities — Non-Agency (continued)
Issuer | | Coupon
Rate | | Principal
Amount ($) | | Value ($) | |
Rialto Real Estate Fund LP
Series 2014-LT6 Class B(d)
09/15/24 | | | 5.486 | % | | | 876,505 | | | | 875,549 | | |
VFC LLC(d)
Series 2014-2 Class B
07/20/30 | | | 5.500 | % | | | 1,144,197 | | | | 1,141,343 | | |
Subordinated, Series 2015-3 Class B
12/20/31 | | | 4.750 | % | | | 4,624,910 | | | | 4,624,910 | | |
Total Commercial Mortgage-Backed
Securities — Non-Agency
(Cost: $48,900,453) | | | | | | | 49,150,194 | | |
Asset-Backed Securities — Non-Agency 11.2%
A Voce CLO Ltd.
Series 2014-1A Class C(b)(d)
07/15/26 | | | 4.380 | % | | | 1,000,000 | | | | 941,612 | | |
Apidos CLO XXII
Series 2015-22A Class D(b)(d)
10/20/27 | | | 6.881 | % | | | 2,000,000 | | | | 1,840,948 | | |
Avery Point VII CLO Ltd.(b)(d)
01/15/28 | | | 7.480 | % | | | 3,500,000 | | | | 3,339,409 | | |
Conn's Receivables Funding LLC(d)
Series 2015-A Class A
09/15/20 | | | 4.565 | % | | | 1,999,713 | | | | 2,001,093 | | |
Series 2016-A Class A
04/16/18 | | | 4.680 | % | | | 1,382,736 | | | | 1,385,915 | | |
Series 2016-B Class B
03/15/19 | | | 7.340 | % | | | 7,000,000 | | | | 7,043,792 | | |
Subordinated, Series 2016-A Class B
08/15/18 | | | 8.960 | % | | | 2,000,000 | | | | 2,025,699 | | |
Dryden 33 Senior Loan Fund
Series 2014-33A Class ER(b)(d)(e)
10/15/28 | | | 8.420 | % | | | 3,000,000 | | | | 2,857,500 | | |
Octagon Investment Partners XXII Ltd.
Series 2014-1A Class E1(b)(d)
11/25/25 | | | 6.132 | % | | | 1,750,000 | | | | 1,556,784 | | |
SoFi Professional Loan Program LLC(d)(e)(f)
Series 2015-D Class RC
10/26/37 | | | 0.000 | % | | | 3 | | | | 2,194,330 | | |
SoFi Professional Loan Program LLC(d)(f) | |
Series 2016-A Class RPO
01/25/38 | | | 0.000 | % | | | 4 | | | | 2,788,422 | | |
Series 2016-B Class RC
04/25/37 | | | 0.000 | % | | | 3 | | | | 1,762,155 | | |
Total Asset-Backed Securities — Non-Agency
(Cost: $28,564,300) | | | | | | | 29,737,659 | | |
The accompanying Notes to Financial Statements are an integral part of this statement.
Semiannual Report 2016
7
COLUMBIA MORTGAGE OPPORTUNITIES FUND
PORTFOLIO OF INVESTMENTS (continued)
November 30, 2016 (Unaudited)
Options Purchased Puts 3.4%
Issuer | | Notional ($)/
Contracts | | Exercise
Price | | Expiration
Date | | Value ($) | |
Put — OTC
5-Year
Interest
Rate Swap(g) | | | 73,000,000 | | | | 1.50 | | | 08/25/17 | | | 2,177,875 | | |
Put — OTC
5-Year
Interest
Rate Swap(g) | | | 50,000,000 | | | | 2.00 | | | 12/12/16 | | | 29,310 | | |
Put — OTC
5-Year
Interest
Rate Swap(g) | | | 250,000,000 | | | | 2.00 | | | 07/16/18 | | | 6,720,875 | | |
Put — OTC
5-Year
Interest
Rate Swap(g) | | | 70,000,000 | | | | 3.25 | | | 08/18/17 | | | 96,145 | | |
Total Options Purchased Puts
(Cost: $5,812,625) | | | | | | | | | 9,024,205 | | |
Money Market Funds 3.8%
| | | Shares | | Value ($) | |
Columbia Short-Term Cash Fund,
0.480%(h)(i) | | | 10,016,423 | | | | 10,017,424 | | |
Total Money Market Funds
(Cost: $10,016,422) | | | | | 10,017,424 | | |
Total Investments
(Cost: $387,291,646) | | | | | 386,487,302 | | |
Other Assets & Liabilities, Net | | | | | (120,045,941 | ) | |
Net Assets | | | | | 266,441,361 | | |
At November 30, 2016, cash totaling $4,401,983 was pledged as collateral.
Investments in Derivatives
Futures Contracts Outstanding at November 30, 2016
Long Futures Contracts Outstanding
Contract Description | | Number of
Contracts | | Trading
Currency | | Notional
Market
Value ($) | | Expiration
Date | | Unrealized
Appreciation ($) | | Unrealized
(Depreciation) ($) | |
U.S. Long Bond | | | 26 | | | USD | | | | | 3,933,312 | | | 03/2017 | | | — | | | | (14,283 | ) | |
U.S. Treasury 10-Year Note | | | 364 | | | USD | | | | | 45,323,688 | | | 03/2017 | | | — | | | | (187,738 | ) | |
U.S. Treasury 5-Year Note | | | 52 | | | USD | | | | | 6,127,875 | | | 03/2017 | | | — | | | | (11,787 | ) | |
Total | | | | | | | 55,384,875 | | | | | | — | | | | (213,808 | ) | |
Short Futures Contracts Outstanding
Contract Description | | Number of
Contracts | | Trading
Currency | | Notional
Market
Value ($) | | Expiration
Date | | Unrealized
Appreciation ($) | | Unrealized
(Depreciation) ($) | |
U.S. Treasury 2-Year Note | | | (89 | ) | | USD | | | | | (19,296,312 | ) | | 03/2017 | | | 6,752 | | | | — | | |
The accompanying Notes to Financial Statements are an integral part of this statement.
Semiannual Report 2016
8
COLUMBIA MORTGAGE OPPORTUNITIES FUND
PORTFOLIO OF INVESTMENTS (continued)
November 30, 2016 (Unaudited)
Open Options Contracts Written at November 30, 2016
Issuer | | Puts/Calls | | Trading
Currency | | Number of
Contracts | | Exercise
Price | | Premium
Received ($) | | Expiration
Date | | Value ($) | |
Put — OTC 5-Year
Interest Rate Swap(j) | | Put
| | USD |
| | | | (50,000,000
| ) | | | 2.00
| | | | (280,000
| ) | | 02/21/2017
| | | (273,480
| ) | |
Cleared Credit Default Swap Contracts Outstanding at November 30, 2016
Buy Protection
Counterparty | | Reference
Entity | | Expiration
Date | | Pay Fixed
Rate (%) | | Notional
Currency | | Notional
Amount ($) | | Unrealized
Appreciation ($) | | Unrealized
Depreciation ($) | |
Morgan Stanley
| | Markit CDX North America
High Yield Index, Series 27 | |
12/20/2021 | | |
5.000 | | |
USD | | |
10,000,000 | | | |
— | | | | (209,763 | ) | |
Credit Default Swap Contracts Outstanding at November 30, 2016
Sell Protection
Counterparty | | Reference
Entity | | Expiration
Date | | Receive
Fixed
Rate
(%) | | Implied
Credit
Spread
(%)* | | Notional
Currency | | Notional
Amount
($) | | Market
Value
($) | | Premium
Paid
($) | | Premium
Received
($) | | Periodic
Payments
Receivable
(Payable)
($) | | Unrealized
Appreciation
($) | | Unrealized
Depreciation
($) | |
Goldman Sachs
International
| | Markit CMBX
North America
Index, Series 6
BBB- | | 05/11/2063
| | | 3.000
| | | | 4.514
| | | USD |
| | | | (2,300,000
| ) | | | (169,266
| ) | | | —
| | | | (167,140
| ) | | | 1,150
| | | | —
| | | | (976
| ) | |
Goldman Sachs
International
| | Markit CMBX
North America
Index, Series 6
BBB- | | 05/11/2063
| | | 3.000
| | | | 4.514
| | | USD |
| | | | (2,700,000
| ) | | | (198,703
| ) | | | —
| | | | (195,986
| ) | | | 1,350
| | | | —
| | | | (1,367
| ) | |
JPMorgan
| | Markit CMBX
North America
Index, Series 7
BBB- | | 01/17/2047
| | | 3.000
| | | | 4.390
| | | USD |
| | | | (2,000,000
| ) | | | (157,110
| ) | | | —
| | | | (177,574
| ) | | | 1,000
| | | | 21,464
| | | | —
| | |
Morgan Stanley
| | Markit CMBX
North America
Index, Series 6
BBB- | | 05/11/2063
| | | 3.000
| | | | 4.514
| | | USD |
| | | | (5,000,000
| ) | | | (367,969
| ) | | | —
| | | | (401,416
| ) | | | 2,500
| | | | 35,947
| | | | —
| | |
Morgan Stanley
| | Markit CMBX
North America
Index, Series 7
BBB- | | 01/17/2047
| | | 3.000
| | | | 4.390
| | | USD |
| | | | (6,000,000
| ) | | | (471,329
| ) | | | —
| | | | (707,876
| ) | | | 3,000
| | | | 239,547
| | | | —
| | |
Morgan Stanley
| | Markit CMBX
North America
Index, Series 7
BBB- | | 01/17/2047
| | | 3.000
| | | | 4.390
| | | USD |
| | | | (2,550,000
| ) | | | (200,315
| ) | | | —
| | | | (260,140
| ) | | | 1,275
| | | | 61,100
| | | | —
| | |
Total | | | | | | | | | | | | | | | | | — | | | | (1,910,132 | ) | | | | | 358,058 | | | | (2,343 | ) | |
*Implied credit spreads, represented in absolute terms, utilized in determining the market value of credit default swap agreements on corporate or sovereign issues as of period end serve as an indicator of the current status of the payment/performance risk and represent the likelihood or risk of default for the credit derivative. The implied credit spread of a particular referenced entity reflects the cost of buying/selling protection and may include upfront payments required to be made to enter into the agreement. Wider credit spreads represent a deterioration of the referenced entity's credit soundness and a greater likelihood or risk of default or other credit event occurring as defined under the terms of the agreement.
The accompanying Notes to Financial Statements are an integral part of this statement.
Semiannual Report 2016
9
COLUMBIA MORTGAGE OPPORTUNITIES FUND
PORTFOLIO OF INVESTMENTS (continued)
November 30, 2016 (Unaudited)
Notes to Portfolio of Investments
(a) Interest Only (IO) represents the right to receive the monthly interest payments on an underlying pool of mortgage loans.
(b) Variable rate security.
(c) Security, or a portion thereof, has been purchased on a when-issued or delayed delivery basis.
(d) Represents privately placed and other securities and instruments exempt from SEC registration (collectively, private placements), such as Section 4(a)(2) and Rule 144A eligible securities, which are often sold only to qualified institutional buyers. The Fund may invest in private placements determined to be liquid as well as those determined to be illiquid. Private placements may be determined to be liquid under guidelines established by the Fund's Board of Trustees. At November 30, 2016, the value of these securities amounted to $173,621,679 or 65.16% of net assets.
(e) Represents fair value as determined in good faith under procedures approved by the Board of Trustees. At November 30, 2016, the value of these securities amounted to $7,628,263, which represents 2.86% of net assets.
(f) Zero coupon bond.
(g) Purchased swaption contracts outstanding at November 30, 2016:
Description | | Counterparty | | Fund
Receives | | Fund Pays | | Exercise
Rate (%) | | Expiration
Date | | Notional
Amount ($) | | Premium
Paid ($) | | Market
Value ($) | |
Put — OTC
5-Year Interest
Rate Swap | | Barclays | | 3-Month USD
LIBOR BBA | | Fixed rate of
3.250% | | | 3.250 | | | 08/22/2022 | | | 70,000,000 | | | | 1,851,500 | | | | 96,145 | | |
Put — OTC
5-Year Interest
Rate Swap | | Citi | | 3-Month USD
LIBOR BBA | | Fixed rate of
2.000% | | | 2.000 | | | 12/14/2021 | | | 50,000,000 | | | | 678,750 | | | | 29,310 | | |
Put — OTC
5-Year Interest
Rate Swap | | Citi | | 3-Month USD
LIBOR BBA | | Fixed rate of
2.000% | | | 2.000 | | | 07/18/2023 | | | 250,000,000 | | | | 2,525,000 | | | | 6,720,875 | | |
Put — OTC
5-Year Interest
Rate Swap | | Citi | | 3-Month USD
LIBOR BBA | | Fixed rate of
1.500% | | | 1.500 | | | 08/25/2023 | | | 73,000,000 | | | | 757,375 | | | | 2,177,875 | | |
Total | | | | | | | | | | | | | | | 5,812,625 | | | | 9,024,205 | | |
(h) As defined in the Investment Company Act of 1940 (the 1940 Act), an affiliated company is one in which the Fund owns 5% or more of the company's outstanding voting securities, or a company which is under common ownership or control with the Fund. Although the Fund is not subject to the requirements of the 1940 Act, the Fund generally complies with the same definition as set forth in the rule. Holdings and transactions in these affiliated companies during the period ended November 30, 2016 are as follows:
Issuer | | Beginning
Cost ($) | | Purchase
Cost ($) | | Proceeds
From Sales ($) | | Realized
Gain (Loss) ($) | | Ending
Cost ($) | | Dividends —
Affiliated
Issuers ($) | | Value ($) | |
Columbia
Short-Term
Cash Fund | | | 6,647,464 | | | | 134,652,674 | | | | (131,284,076 | ) | | | 360 | | | | 10,016,422 | | | | 16,536 | | | | 10,017,424 | | |
(i) The rate shown is the seven-day current annualized yield at November 30, 2016.
(j) Written Swaption Contracts Outstanding at November 30, 2016:
Description | | Counterparty | | Fund
Receives | | Fund Pays | | Exercise
Rate (%) | | Expiration
Date | | Notional
Amount ($) | | Premium
Received ($) | | Market
Value ($) | |
Put — OTC
5-Year Interest
Rate Swap | | Morgan
Stanley | | Fixed rate of
2.000% | | 3-Month USD
LIBOR BBA | | | 2.000 | | | 02/23/2022 | | | (50,000,000 | ) | | | (280,000 | ) | | | (273,480 | ) | |
The accompanying Notes to Financial Statements are an integral part of this statement.
Semiannual Report 2016
10
COLUMBIA MORTGAGE OPPORTUNITIES FUND
PORTFOLIO OF INVESTMENTS (continued)
November 30, 2016 (Unaudited)
CMO Collateralized Mortgage Obligation
STRIPS Separate Trading of Registered Interest and Principal Securities
Currency Legend
USD US Dollar
Fair Value Measurements
The Fund categorizes its fair value measurements according to a three-level hierarchy that maximizes the use of observable inputs and minimizes the use of unobservable inputs by prioritizing that the most observable input be used when available. Observable inputs are those that market participants would use in pricing an investment based on market data obtained from sources independent of the reporting entity. Unobservable inputs are those that reflect the Fund's assumptions about the information market participants would use in pricing an investment. An investment's level within the fair value hierarchy is based on the lowest level of any input that is deemed significant to the asset's or liability's fair value measurement. The input levels are not necessarily an indication of the risk or liquidity associated with investments at that level. For example, certain U.S. government securities are generally high quality and liquid, however, they are reflected as Level 2 because the inputs used to determine fair value may not always be quoted prices in an active market.
Fair value inputs are summarized in the three broad levels listed below:
> Level 1 — Valuations based on quoted prices for investments in active markets that the Fund has the ability to access at the measurement date (including NAV for open-end mutual funds). Valuation adjustments are not applied to Level 1 investments.
> Level 2 — Valuations based on other significant observable inputs (including quoted prices for similar securities, interest rates, prepayment speeds, credit risks, etc.).
> Level 3 — Valuations based on significant unobservable inputs (including the Fund's own assumptions and judgment in determining the fair value of investments).
Inputs that are used in determining fair value of an investment may include price information, credit data, volatility statistics, and other factors. These inputs can be either observable or unobservable. The availability of observable inputs can vary between investments, and is affected by various factors such as the type of investment, and the volume and level of activity for that investment or similar investments in the marketplace. The inputs will be considered by the Investment Manager, along with any other relevant factors in the calculation of an investment's fair value. The Fund uses prices and inputs that are current as of the measurement date, which may include periods of market dislocations. During these periods, the availability of prices and inputs may be reduced for many investments. This condition could cause an investment to be reclassified between the various levels within the hierarchy.
Certain investments that have been measured at fair value using the net asset value (NAV) per share (or its equivalent) are not categorized in the fair value hierarchy. The fair value amounts presented in the table are intended to reconcile the fair value hierarchy to the amounts presented in the Portfolio of Investments. The Columbia Short-Term Cash Fund seeks to provide shareholders with maximum current income consistent with liquidity and stability of principal. Columbia Short-Term Cash Fund prices its shares with a floating NAV and no longer seeks to maintain a stable NAV.
Investments falling into the Level 3 category are primarily supported by quoted prices from brokers and dealers participating in the market for those investments. However, these may be classified as Level 3 investments due to lack of market transparency and corroboration to support these quoted prices. Additionally, valuation models may be used as the pricing source for any remaining investments classified as Level 3. These models may rely on one or more significant unobservable inputs and/or significant assumptions by the Investment Manager. Inputs used in valuations may include, but are not limited to, financial statement analysis, capital account balances, discount rates and estimated cash flows, and comparable company data.
Under the direction of the Fund's Board of Trustees (the Board), the Investment Manager's Valuation Committee (the Committee) is responsible for overseeing the valuation procedures approved by the Board. The Committee consists of voting and non-voting members from various groups within the Investment Manager's organization, including operations and accounting, trading and investments, compliance, risk management and legal.
The Committee meets at least monthly to review and approve valuation matters, which may include a description of specific valuation determinations, data regarding pricing information received from approved pricing vendors and brokers and the results of Board-approved valuation control policies and procedures (the Policies). The Policies address, among other things, instances when market quotations are or are not readily available, including recommendations of third party pricing vendors and a determination of appropriate pricing methodologies; events that require specific valuation determinations and assessment of fair value techniques; securities with a potential for stale pricing, including those that are illiquid, restricted, or in default; and the effectiveness of third party pricing vendors, including periodic reviews of vendors. The Committee meets more frequently, as needed, to discuss additional valuation matters, which may include the need to review
The accompanying Notes to Financial Statements are an integral part of this statement.
Semiannual Report 2016
11
COLUMBIA MORTGAGE OPPORTUNITIES FUND
PORTFOLIO OF INVESTMENTS (continued)
November 30, 2016 (Unaudited)
Fair Value Measurements (continued)
back-testing results, review time-sensitive information or approve related valuation actions. The Committee reports to the Board, with members of the Committee meeting with the Board at each of its regularly scheduled meetings to discuss valuation matters and actions during the period, similar to those described earlier.
For investments categorized as Level 3, the Committee monitors information similar to that described above, which may include: (i) data specific to the issuer or comparable issuers, (ii) general market or specific sector news and (iii) quoted prices and specific or similar security transactions. The Committee considers this data and any changes from prior periods in order to assess the reasonableness of observable and unobservable inputs, any assumptions or internal models used to value those securities and changes in fair value. This data is also used to corroborate, when available, information received from approved pricing vendors and brokers. Various factors impact the frequency of monitoring this information (which may occur as often as daily). However, the Committee may determine that changes to inputs, assumptions and models are not required as a result of the monitoring procedures performed.
The following table is a summary of the inputs used to value the Fund's investments at November 30, 2016:
| | | Level 1
Quoted Prices in Active
Markets for Identical
Assets ($) | | Level 2
Other Significant
Observable Inputs ($) | | Level 3
Significant
Unobservable Inputs ($) | | Total ($) | |
Investments | |
Residential Mortgage-Backed
Securities — Agency | | | — | | | | 193,823,994 | | | | — | | | | 193,823,994 | | |
Residential Mortgage-Backed
Securities — Non-Agency | | | — | | | | 82,088,161 | | | | 12,645,665 | | | | 94,733,826 | | |
Commercial Mortgage-Backed
Securities — Non-Agency | | | — | | | | 49,150,194 | | | | — | | | | 49,150,194 | | |
Asset-Backed Securities —
Non-Agency | | | — | | | | 20,135,252 | | | | 9,602,407 | | | | 29,737,659 | | |
Options Purchased Puts | | | — | | | | 9,024,205 | | | | — | | | | 9,024,205 | | |
Investments measured at net asset value | |
Money Market Funds | | | — | | | | — | | | | — | | | | 10,017,424 | | |
Total Investments | | | — | | | | 354,221,806 | | | | 22,248,072 | | | | 386,487,302 | | |
Derivatives | |
Assets | |
Futures Contracts | | | 6,752 | | | | — | | | | — | | | | 6,752 | | |
Swap Contracts | | | — | | | | 358,058 | | | | — | | | | 358,058 | | |
Liabilities | |
Futures Contracts | | | (213,808 | ) | | | — | | | | — | | | | (213,808 | ) | |
Options Contracts Written | | | — | | | | (273,480 | ) | | | — | | | | (273,480 | ) | |
Swap Contracts | | | — | | | | (212,106 | ) | | | — | | | | (212,106 | ) | |
Total | | | (207,056 | ) | | | 354,094,278 | | | | 22,248,072 | | | | 386,152,718 | | |
See the Portfolio of Investments for all investment classifications not indicated in the table.
The Fund's assets assigned to the Level 2 input category are generally valued using the market approach, in which a security's value is determined through reference to prices and information from market transactions for similar or identical assets.
Futures contracts and swap contracts are valued at unrealized appreciation (depreciation).
There were no transfers of financial assets between Levels 1 and 2 during the period.
The accompanying Notes to Financial Statements are an integral part of this statement.
Semiannual Report 2016
12
COLUMBIA MORTGAGE OPPORTUNITIES FUND
PORTFOLIO OF INVESTMENTS (continued)
November 30, 2016 (Unaudited)
Fair Value Measurements (continued)
The following table is a reconciliation of Level 3 assets for which significant observable and unobservable inputs were used to determine fair value:
| | | Residential
Mortgage-Backed
Securities —
Non-Agency ($) | | Asset-Backed
Securities —
Non-Agency ($) | | Total ($) | |
Balance as of May 31, 2016 | | | 20,053,786 | | | | 7,445,081 | | | | 27,498,867 | | |
Increase (decrease) in accrued discounts/premiums | | | 5,443 | | | | 521 | | | | 5,964 | | |
Realized gain (loss) | | | 265,458 | | | | 64,479 | | | | 329,937 | | |
Change in unrealized appreciation (depreciation)(a) | | | 346,625 | | | | 1,164,413 | | | | 1,511,038 | | |
Sales | | | (12,752,240 | ) | | | (1,950,000 | ) | | | (14,702,240 | ) | |
Purchases | | | 11,923,930 | | | | 2,877,913 | | | | 14,801,843 | | |
Transfers into Level 3 | | | — | | | | — | | | | — | | |
Transfers out of Level 3 | | | (7,197,337 | ) | | | — | | | | (7,197,337 | ) | |
Balance as of November 30, 2016 | | | 12,645,665 | | | | 9,602,407 | | | | 22,248,072 | | |
(a) Change in unrealized appreciation (depreciation) relating to securities held at November 30, 2016 was $1,204,013, which is comprised of Residential Mortgage-Backed Securities — Non-Agency of $39,600 and Asset-Backed Securities — Non-Agency of $1,164,413.
The Fund's assets assigned to the Level 3 category are valued utilizing the valuation technique deemed the most appropriate in the circumstances. Certain residential and asset backed securities classified as Level 3 securities are valued using the market approach and utilize single market quotations from broker dealers which may have included, but were not limited to, observable transactions for identical or similar assets in the market and the distressed nature of the security. The appropriateness of fair values for these securities is monitored on an ongoing basis which may include results of back testing, manual price reviews and other control procedures. Significant increases (decreases) to any of these inputs would result in a significantly lower (higher) valuation measurement.
Financial assets were transferred from Level 3 to Level 2 as observable market inputs were utilized and management determined that there was sufficient, reliable and observable market data to value these assets as of period end.
Transfers into and/or out of Level 3 are determined based on the fair value at the beginning of the period for security positions held throughout the period.
The accompanying Notes to Financial Statements are an integral part of this statement.
Semiannual Report 2016
13
COLUMBIA MORTGAGE OPPORTUNITIES FUND
STATEMENT OF ASSETS AND LIABILITIES
November 30, 2016 (Unaudited)
Assets | |
Investments, at value | |
Unaffiliated issuers (identified cost $371,462,599) | | $ | 367,445,673 | | |
Affiliated issuers (identified cost $10,016,422) | | | 10,017,424 | | |
Options purchased (identified cost $5,812,625) | | | 9,024,205 | | |
Total investments (identified cost $387,291,646) | | | 386,487,302 | | |
Cash | | | 33,091 | | |
Cash collateral held at broker | | | 3,303,000 | | |
Margin deposits | | | 1,098,983 | | |
Unrealized appreciation on swap contracts | | | 358,058 | | |
Receivable for: | |
Investments sold | | | 282,008 | | |
Investments sold on a delayed delivery basis | | | 65,247,813 | | |
Capital shares sold | | | 45,588 | | |
Dividends | | | 1,717 | | |
Interest | | | 1,878,534 | | |
Variation margin | | | 6,953 | | |
Expense reimbursement due from Investment Manager | | | 563 | | |
Prepaid expenses | | | 2,524 | | |
Other assets | | | 1,416 | | |
Total assets | | | 458,747,550 | | |
Liabilities | |
Option contracts written, at value (premiums received $280,000) | | | 273,480 | | |
Unrealized depreciation on swap contracts | | | 2,343 | | |
Premiums received on outstanding swap contracts | | | 1,910,132 | | |
Payable for: | |
Investments purchased | | | 2,632,013 | | |
Investments purchased on a delayed delivery basis | | | 187,049,896 | | |
Capital shares purchased | | | 65,720 | | |
Variation margin | | | 299,264 | | |
Management services fees | | | 4,740 | | |
Distribution and/or service fees | | | 99 | | |
Transfer agent fees | | | 1,512 | | |
Compensation of board members | | | 10,508 | | |
Chief compliance officer expenses | | | 19 | | |
Other expenses | | | 56,463 | | |
Total liabilities | | | 192,306,189 | | |
Net assets applicable to outstanding capital stock | | $ | 266,441,361 | | |
The accompanying Notes to Financial Statements are an integral part of this statement.
Semiannual Report 2016
14
COLUMBIA MORTGAGE OPPORTUNITIES FUND
STATEMENT OF ASSETS AND LIABILITIES (continued)
November 30, 2016 (Unaudited)
Represented by | |
Paid-in capital | | $ | 267,013,784 | | |
Undistributed net investment income | | | 611,307 | | |
Accumulated net realized loss | | | (324,802 | ) | |
Unrealized appreciation (depreciation) on: | |
Investments — unaffiliated issuers | | | (4,016,926 | ) | |
Investments — affiliated issuers | | | 1,002 | | |
Futures contracts | | | (207,056 | ) | |
Options purchased | | | 3,211,580 | | |
Options contracts written | | | 6,520 | | |
Swap contracts | | | 145,952 | | |
Total — representing net assets applicable to outstanding capital stock | | $ | 266,441,361 | | |
Class A | |
Net assets | | $ | 9,063,499 | | |
Shares outstanding | | | 911,889 | | |
Net asset value per share | | $ | 9.94 | | |
Maximum offering price per share(a) | | $ | 10.25 | | |
Class C | |
Net assets | | $ | 1,413,757 | | |
Shares outstanding | | | 142,260 | | |
Net asset value per share | | $ | 9.94 | | |
Class I | |
Net assets | | $ | 245,684,332 | | |
Shares outstanding | | | 24,725,595 | | |
Net asset value per share | | $ | 9.94 | | |
Class R4 | |
Net assets | | $ | 4,621,482 | | |
Shares outstanding | | | 465,051 | | |
Net asset value per share | | $ | 9.94 | | |
Class R5 | |
Net assets | | $ | 47,024 | | |
Shares outstanding | | | 4,732 | | |
Net asset value per share | | $ | 9.94 | | |
Class W | |
Net assets | | $ | 9,938 | | |
Shares outstanding | | | 1,000 | | |
Net asset value per share | | $ | 9.94 | | |
Class Z | |
Net assets | | $ | 5,601,329 | | |
Shares outstanding | | | 563,571 | | |
Net asset value per share | | $ | 9.94 | | |
(a) The maximum offering price per share is calculated by dividing the net asset value per share by 1.0 minus the maximum sales charge of 3.00%.
The accompanying Notes to Financial Statements are an integral part of this statement.
Semiannual Report 2016
15
COLUMBIA MORTGAGE OPPORTUNITIES FUND
STATEMENT OF OPERATIONS
Six Months Ended November 30, 2016 (Unaudited)
Net investment income | |
Income: | |
Dividends — affiliated issuers | | $ | 16,536 | | |
Interest | | | 5,349,606 | | |
Total income | | | 5,366,142 | | |
Expenses: | |
Management services fees | | | 837,103 | | |
Distribution and/or service fees | |
Class A | | | 9,818 | | |
Class C | | | 6,130 | | |
Class W | | | 13 | | |
Transfer agent fees | |
Class A | | | 5,071 | | |
Class C | | | 787 | | |
Class R4 | | | 1,487 | | |
Class R5 | | | 12 | | |
Class W | | | 6 | | |
Class Z | | | 2,838 | | |
Compensation of board members | | | 7,037 | | |
Custodian fees | | | 13,547 | | |
Printing and postage fees | | | 11,858 | | |
Registration fees | | | 40,300 | | |
Audit fees | | | 20,156 | | |
Legal fees | | | 5,315 | | |
Chief compliance officer expenses | | | 19 | | |
Other | | | 6,822 | | |
Total expenses | | | 968,319 | | |
Fees waived or expenses reimbursed by Investment Manager and its affiliates | | | (145,353 | ) | |
Total net expenses | | | 822,966 | | |
Net investment income | | | 4,543,176 | | |
Realized and unrealized gain (loss) — net | |
Net realized gain (loss) on: | |
Investments — unaffiliated issuers | | | 1,952,625 | | |
Investments — affiliated issuers | | | 360 | | |
Futures contracts | | | (2,150,063 | ) | |
Options purchased | | | (712,500 | ) | |
Options contracts written | | | 548,700 | | |
Swap contracts | | | (2,111,868 | ) | |
Net realized loss | | | (2,472,746 | ) | |
Net change in unrealized appreciation (depreciation) on: | |
Investments — unaffiliated issuers | | | 2,195,516 | | |
Investments — affiliated issuers | | | 1,002 | | |
Futures contracts | | | (223,460 | ) | |
Options purchased | | | 6,258,546 | | |
Options contracts written | | | (394,092 | ) | |
Swap contracts | | | 1,184,244 | | |
Net change in unrealized appreciation | | | 9,021,756 | | |
Net realized and unrealized gain | | | 6,549,010 | | |
Net increase in net assets resulting from operations | | $ | 11,092,186 | | |
The accompanying Notes to Financial Statements are an integral part of this statement.
Semiannual Report 2016
16
COLUMBIA MORTGAGE OPPORTUNITIES FUND
STATEMENT OF CHANGES IN NET ASSETS
| | | Six Months Ended
November 30, 2016
(Unaudited) | | Year Ended
May 31, 2016 | |
Operations | |
Net investment income | | $ | 4,543,176 | | | $ | 9,729,717 | | |
Net realized gain (loss) | | | (2,472,746 | ) | | | 2,041,175 | | |
Net change in unrealized appreciation (depreciation) | | | 9,021,756 | | | | (8,403,651 | ) | |
Net increase in net assets resulting from operations | | | 11,092,186 | | | | 3,367,241 | | |
Distributions to shareholders | |
Net investment income | | | | | |
Class A | | | (127,752 | ) | | | (200,587 | ) | |
Class C | | | (15,417 | ) | | | (14,907 | ) | |
Class I | | | (4,356,307 | ) | | | (8,104,406 | ) | |
Class R4 | | | (38,256 | ) | | | (152,649 | ) | |
Class R5 | | | (822 | ) | | | (677 | ) | |
Class W | | | (159 | ) | | | (333 | ) | |
Class Z | | | (77,904 | ) | | | (45,777 | ) | |
Net realized gains | | | | | |
Class A | | | — | | | | (83,879 | ) | |
Class C | | | — | | | | (5,878 | ) | |
Class I | | | — | | | | (2,206,957 | ) | |
Class R4 | | | — | | | | (66,952 | ) | |
Class R5 | | | — | | | | (104 | ) | |
Class W | | | — | | | | (104 | ) | |
Class Z | | | — | | | | (6,800 | ) | |
Total distributions to shareholders | | | (4,616,617 | ) | | | (10,890,010 | ) | |
Increase in net assets from capital stock activity | | | 9,755,536 | | | | 22,791,731 | | |
Total increase in net assets | | | 16,231,105 | | | | 15,268,962 | | |
Net assets at beginning of period | | | 250,210,256 | | | | 234,941,294 | | |
Net assets at end of period | | $ | 266,441,361 | | | $ | 250,210,256 | | |
Undistributed net investment income | | $ | 611,307 | | | $ | 684,748 | | |
The accompanying Notes to Financial Statements are an integral part of this statement.
Semiannual Report 2016
17
COLUMBIA MORTGAGE OPPORTUNITIES FUND
STATEMENT OF CHANGES IN NET ASSETS (continued)
| | | Six Months Ended November 30, 2016
(Unaudited) | | Year Ended May 31, 2016 | |
| | | Shares | | Dollars ($) | | Shares | | Dollars ($) | |
Capital stock activity | |
Class A shares | |
Subscriptions | | | 272,420 | | | | 2,692,114 | | | | 1,057,440 | | | | 10,401,383 | | |
Distributions reinvested | | | 12,973 | | | | 127,593 | | | | 29,306 | | | | 284,029 | | |
Redemptions | | | (98,298 | ) | | | (970,379 | ) | | | (532,856 | ) | | | (5,145,937 | ) | |
Net increase | | | 187,095 | | | | 1,849,328 | | | | 553,890 | | | | 5,539,475 | | |
Class C shares | |
Subscriptions | | | 55,146 | | | | 546,581 | | | | 148,662 | �� | | | 1,451,064 | | |
Distributions reinvested | | | 1,555 | | | | 15,295 | | | | 2,112 | | | | 20,421 | | |
Redemptions | | | (24,875 | ) | | | (246,693 | ) | | | (45,319 | ) | | | (440,598 | ) | |
Net increase | | | 31,826 | | | | 315,183 | | | | 105,455 | | | | 1,030,887 | | |
Class I shares | |
Subscriptions | | | 1,192,635 | | | | 11,711,653 | | | | 4,670,330 | | | | 45,252,849 | | |
Distributions reinvested | | | 443,088 | | | | 4,356,129 | | | | 1,059,236 | | | | 10,310,887 | | |
Redemptions | | | (1,241,838 | ) | | | (12,194,977 | ) | | | (4,279,231 | ) | | | (42,814,126 | ) | |
Net increase | | | 393,885 | | | | 3,872,805 | | | | 1,450,335 | | | | 12,749,610 | | |
Class R4 shares | |
Subscriptions | | | 351,394 | | | | 3,490,349 | | | | 433,320 | | | | 4,277,485 | | |
Distributions reinvested | | | 3,878 | | | | 38,085 | | | | 22,517 | | | | 219,139 | | |
Redemptions | | | (184,127 | ) | | | (1,813,090 | ) | | | (467,279 | ) | | | (4,473,861 | ) | |
Net increase (decrease) | | | 171,145 | | | | 1,715,344 | | | | (11,442 | ) | | | 22,763 | | |
Class R5 shares | |
Subscriptions | | | — | | | | — | | | | 3,635 | | | | 35,000 | | |
Distributions reinvested | | | 65 | | | | 647 | | | | 32 | | | | 309 | | |
Net increase | | | 65 | | | | 647 | | | | 3,667 | | | | 35,309 | | |
Class Z shares | |
Subscriptions | | | 249,700 | | | | 2,461,147 | | | | 390,804 | | | | 3,746,559 | | |
Distributions reinvested | | | 5,935 | | | | 58,427 | | | | 4,782 | | | | 45,906 | | |
Redemptions | | | (52,622 | ) | | | (517,345 | ) | | | (39,152 | ) | | | (378,778 | ) | |
Net increase | | | 203,013 | | | | 2,002,229 | | | | 356,434 | | | | 3,413,687 | | |
Total net increase | | | 987,029 | | | | 9,755,536 | | | | 2,458,339 | | | | 22,791,731 | | |
The accompanying Notes to Financial Statements are an integral part of this statement.
Semiannual Report 2016
18
COLUMBIA MORTGAGE OPPORTUNITIES FUND
The following tables are intended to help you understand the Fund's financial performance. Certain information reflects financial results for a single share of a class held for the periods shown. Per share net investment income (loss) amounts are calculated based on average shares outstanding during the period. Total return assumes reinvestment of all dividends and distributions, if any. Total return does not reflect payment of sales charges, if any. Total return and portfolio turnover are not annualized for periods of less than one year. The portfolio turnover rate is calculated without regard to purchase and sales transactions of short-term instruments and certain derivatives, if any. If such transactions were included, the Fund's portfolio turnover rate may be higher.
| | | Six Months Ended
November 30, 2016 | | Year Ended May 31, | |
Class A | | (Unaudited) | | 2016 | | 2015 | | 2014(a) | |
Per share data | |
Net asset value, beginning of period | | $ | 9.69 | | | $ | 10.05 | | | $ | 10.02 | | | $ | 10.00 | | |
Income from investment operations: | |
Net investment income | | | 0.16 | | | | 0.38 | | | | 0.39 | | | | 0.02 | | |
Net realized and unrealized gain (loss) | | | 0.25 | | | | (0.30 | ) | | | 0.09 | | | | 0.01 | | |
Total from investment operations | | | 0.41 | | | | 0.08 | | | | 0.48 | | | | 0.03 | | |
Less distributions to shareholders: | |
Net investment income | | | (0.16 | ) | | | (0.34 | ) | | | (0.35 | ) | | | (0.01 | ) | |
Net realized gains | | | — | | | | (0.10 | ) | | | (0.10 | ) | | | — | | |
Total distributions to shareholders | | | (0.16 | ) | | | (0.44 | ) | | | (0.45 | ) | | | (0.01 | ) | |
Net asset value, end of period | | $ | 9.94 | | | $ | 9.69 | | | $ | 10.05 | | | $ | 10.02 | | |
Total return | | | 4.24 | % | | | 0.83 | % | | | 4.88 | % | | | 0.29 | % | |
Ratios to average net assets(b) | |
Total gross expenses | | | 1.11 | %(c) | | | 1.16 | % | | | 1.21 | % | | | 1.24 | %(c) | |
Total net expenses(d) | | | 0.99 | %(c) | | | 1.00 | % | | | 1.00 | % | | | 1.00 | %(c) | |
Net investment income | | | 3.17 | %(c) | | | 3.95 | % | | | 4.08 | % | | | 1.79 | %(c) | |
Supplemental data | |
Net assets, end of period (in thousands) | | $ | 9,063 | | | $ | 7,023 | | | $ | 1,718 | | | $ | 10 | | |
Portfolio turnover | | | 314 | % | | | 743 | % | | | 829 | % | | | 56 | % | |
Notes to Financial Highlights
(a) Based on operations from April 30, 2014 (commencement of operations) through the stated period end.
(b) In addition to the fees and expenses that the Fund bears directly, the Fund indirectly bears a pro rata share of the fees and expenses of any other funds in which it invests. Such indirect expenses are not included in the Fund's reported expense ratios.
(c) Annualized.
(d) Total net expenses include the impact of certain fee waivers/expense reimbursements made by the Investment Manager and certain of its affiliates, if applicable.
The accompanying Notes to Financial Statements are an integral part of this statement.
Semiannual Report 2016
19
COLUMBIA MORTGAGE OPPORTUNITIES FUND
FINANCIAL HIGHLIGHTS (continued)
| | | Six Months Ended
November 30, 2016 | | Year Ended May 31, | |
Class C | | (Unaudited) | | 2016 | | 2015 | | 2014(a) | |
Per share data | |
Net asset value, beginning of period | | $ | 9.69 | | | $ | 10.05 | | | $ | 10.02 | | | $ | 10.00 | | |
Income from investment operations: | |
Net investment income | | | 0.12 | | | | 0.30 | | | | 0.31 | | | | 0.01 | | |
Net realized and unrealized gain (loss) | | | 0.25 | | | | (0.30 | ) | | | 0.09 | | | | 0.01 | | |
Total from investment operations | | | 0.37 | | | | — | | | | 0.40 | | | | 0.02 | | |
Less distributions to shareholders: | |
Net investment income | | | (0.12 | ) | | | (0.26 | ) | | | (0.27 | ) | | | (0.00 | )(b) | |
Net realized gains | | | — | | | | (0.10 | ) | | | (0.10 | ) | | | — | | |
Total distributions to shareholders | | | (0.12 | ) | | | (0.36 | ) | | | (0.37 | ) | | | (0.00 | )(b) | |
Net asset value, end of period | | $ | 9.94 | | | $ | 9.69 | | | $ | 10.05 | | | $ | 10.02 | | |
Total return | | | 3.86 | % | | | 0.07 | % | | | 4.09 | % | | | 0.24 | % | |
Ratios to average net assets(c) | |
Total gross expenses | | | 1.86 | %(d) | | | 1.91 | % | | | 1.98 | % | | | 2.05 | %(d) | |
Total net expenses(e) | | | 1.74 | %(d) | | | 1.75 | % | | | 1.75 | % | | | 1.75 | %(d) | |
Net investment income | | | 2.42 | %(d) | | | 3.17 | % | | | 3.16 | % | | | 1.05 | %(d) | |
Supplemental data | |
Net assets, end of period (in thousands) | | $ | 1,414 | | | $ | 1,070 | | | $ | 50 | | | $ | 10 | | |
Portfolio turnover | | | 314 | % | | | 743 | % | | | 829 | % | | | 56 | % | |
Notes to Financial Highlights
(a) Based on operations from April 30, 2014 (commencement of operations) through the stated period end.
(b) Rounds to zero.
(c) In addition to the fees and expenses that the Fund bears directly, the Fund indirectly bears a pro rata share of the fees and expenses of any other funds in which it invests. Such indirect expenses are not included in the Fund's reported expense ratios.
(d) Annualized.
(e) Total net expenses include the impact of certain fee waivers/expense reimbursements made by the Investment Manager and certain of its affiliates, if applicable.
The accompanying Notes to Financial Statements are an integral part of this statement.
Semiannual Report 2016
20
COLUMBIA MORTGAGE OPPORTUNITIES FUND
FINANCIAL HIGHLIGHTS (continued)
| | | Six Months Ended
November 30, 2016 | | Year Ended May 31, | |
Class I | | (Unaudited) | | 2016 | | 2015 | | 2014(a) | |
Per share data | |
Net asset value, beginning of period | | $ | 9.69 | | | $ | 10.05 | | | $ | 10.02 | | | $ | 10.00 | | |
Income from investment operations: | |
Net investment income | | | 0.17 | | | | 0.43 | | | | 0.41 | | | | 0.02 | | |
Net realized and unrealized gain (loss) | | | 0.26 | | | | (0.31 | ) | | | 0.11 | | | | 0.01 | | |
Total from investment operations | | | 0.43 | | | | 0.12 | | | | 0.52 | | | | 0.03 | | |
Less distributions to shareholders: | |
Net investment income | | | (0.18 | ) | | | (0.38 | ) | | | (0.39 | ) | | | (0.01 | ) | |
Net realized gains | | | — | | | | (0.10 | ) | | | (0.10 | ) | | | — | | |
Total distributions to shareholders | | | (0.18 | ) | | | (0.48 | ) | | | (0.49 | ) | | | (0.01 | ) | |
Net asset value, end of period | | $ | 9.94 | | | $ | 9.69 | | | $ | 10.05 | | | $ | 10.02 | | |
Total return | | | 4.45 | % | | | 1.24 | % | | | 5.29 | % | | | 0.31 | % | |
Ratios to average net assets(b) | |
Total gross expenses | | | 0.73 | %(c) | | | 0.74 | % | | | 0.82 | % | | | 0.87 | %(c) | |
Total net expenses(d) | | | 0.62 | %(c) | | | 0.60 | % | | | 0.60 | % | | | 0.60 | %(c) | |
Net investment income | | | 3.54 | %(c) | | | 4.33 | % | | | 4.12 | % | | | 2.38 | %(c) | |
Supplemental data | |
Net assets, end of period (in thousands) | | $ | 245,684 | | | $ | 235,721 | | | $ | 230,041 | | | $ | 95,325 | | |
Portfolio turnover | | | 314 | % | | | 743 | % | | | 829 | % | | | 56 | % | |
Notes to Financial Highlights
(a) Based on operations from April 30, 2014 (commencement of operations) through the stated period end.
(b) In addition to the fees and expenses that the Fund bears directly, the Fund indirectly bears a pro rata share of the fees and expenses of any other funds in which it invests. Such indirect expenses are not included in the Fund's reported expense ratios.
(c) Annualized.
(d) Total net expenses include the impact of certain fee waivers/expense reimbursements made by the Investment Manager and certain of its affiliates, if applicable.
The accompanying Notes to Financial Statements are an integral part of this statement.
Semiannual Report 2016
21
COLUMBIA MORTGAGE OPPORTUNITIES FUND
FINANCIAL HIGHLIGHTS (continued)
| | | Six Months Ended
November 30, 2016 | | Year Ended May 31, | |
Class R4 | | (Unaudited) | | 2016 | | 2015 | | 2014(a) | |
Per share data | |
Net asset value, beginning of period | | $ | 9.69 | | | $ | 10.06 | | | $ | 10.02 | | | $ | 10.00 | | |
Income from investment operations: | |
Net investment income | | | 0.17 | | | | 0.41 | | | | 0.44 | | | | 0.02 | | |
Net realized and unrealized gain (loss) | | | 0.25 | | | | (0.32 | ) | | | 0.07 | | | | 0.01 | | |
Total from investment operations | | | 0.42 | | | | 0.09 | | | | 0.51 | | | | 0.03 | | |
Less distributions to shareholders: | |
Net investment income | | | (0.17 | ) | | | (0.36 | ) | | | (0.37 | ) | | | (0.01 | ) | |
Net realized gains | | | — | | | | (0.10 | ) | | | (0.10 | ) | | | — | | |
Total distributions to shareholders | | | (0.17 | ) | | | (0.46 | ) | | | (0.47 | ) | | | (0.01 | ) | |
Net asset value, end of period | | $ | 9.94 | | | $ | 9.69 | | | $ | 10.06 | | | $ | 10.02 | | |
Total return | | | 4.37 | % | | | 0.98 | % | | | 5.24 | % | | | 0.30 | % | |
Ratios to average net assets(b) | |
Total gross expenses | | | 0.87 | %(c) | | | 0.92 | % | | | 0.94 | % | | | 1.05 | %(c) | |
Total net expenses(d) | | | 0.74 | %(c) | | | 0.75 | % | | | 0.75 | % | | | 0.75 | %(c) | |
Net investment income | | | 3.54 | %(c) | | | 4.22 | % | | | 4.44 | % | | | 2.04 | %(c) | |
Supplemental data | |
Net assets, end of period (in thousands) | | $ | 4,621 | | | $ | 2,848 | | | $ | 3,071 | | | $ | 10 | | |
Portfolio turnover | | | 314 | % | | | 743 | % | | | 829 | % | | | 56 | % | |
Notes to Financial Highlights
(a) Based on operations from April 30, 2014 (commencement of operations) through the stated period end.
(b) In addition to the fees and expenses that the Fund bears directly, the Fund indirectly bears a pro rata share of the fees and expenses of any other funds in which it invests. Such indirect expenses are not included in the Fund's reported expense ratios.
(c) Annualized.
(d) Total net expenses include the impact of certain fee waivers/expense reimbursements made by the Investment Manager and certain of its affiliates, if applicable.
The accompanying Notes to Financial Statements are an integral part of this statement.
Semiannual Report 2016
22
COLUMBIA MORTGAGE OPPORTUNITIES FUND
FINANCIAL HIGHLIGHTS (continued)
| | | Six Months Ended
November 30, 2016 | | Year Ended May 31, | |
Class R5 | | (Unaudited) | | 2016 | | 2015 | | 2014(a) | |
Per share data | |
Net asset value, beginning of period | | $ | 9.69 | | | $ | 10.06 | | | $ | 10.02 | | | $ | 10.00 | | |
Income from investment operations: | |
Net investment income | | | 0.17 | | | | 0.40 | | | | 0.39 | | | | 0.02 | | |
Net realized and unrealized gain (loss) | | | 0.26 | | | | (0.30 | ) | | | 0.13 | | | | 0.01 | | |
Total from investment operations | | | 0.43 | | | | 0.10 | | | | 0.52 | | | | 0.03 | | |
Less distributions to shareholders: | |
Net investment income | | | (0.18 | ) | | | (0.37 | ) | | | (0.38 | ) | | | (0.01 | ) | |
Net realized gains | | | — | | | | (0.10 | ) | | | (0.10 | ) | | | — | | |
Total distributions to shareholders | | | (0.18 | ) | | | (0.47 | ) | | | (0.48 | ) | | | (0.01 | ) | |
Net asset value, end of period | | $ | 9.94 | | | $ | 9.69 | | | $ | 10.06 | | | $ | 10.02 | | |
Total return | | | 4.42 | % | | | 1.09 | % | | | 5.34 | % | | | 0.31 | % | |
Ratios to average net assets(b) | |
Total gross expenses | | | 0.78 | %(c) | | | 0.79 | % | | | 0.90 | % | | | 0.89 | %(c) | |
Total net expenses(d) | | | 0.67 | %(c) | | | 0.65 | % | | | 0.65 | % | | | 0.65 | %(c) | |
Net investment income | | | 3.49 | %(c) | | | 4.09 | % | | | 3.91 | % | | | 2.14 | %(c) | |
Supplemental data | |
Net assets, end of period (in thousands) | | $ | 47 | | | $ | 45 | | | $ | 10 | | | $ | 10 | | |
Portfolio turnover | | | 314 | % | | | 743 | % | | | 829 | % | | | 56 | % | |
Notes to Financial Highlights
(a) Based on operations from April 30, 2014 (commencement of operations) through the stated period end.
(b) In addition to the fees and expenses that the Fund bears directly, the Fund indirectly bears a pro rata share of the fees and expenses of any other funds in which it invests. Such indirect expenses are not included in the Fund's reported expense ratios.
(c) Annualized.
(d) Total net expenses include the impact of certain fee waivers/expense reimbursements made by the Investment Manager and certain of its affiliates, if applicable.
The accompanying Notes to Financial Statements are an integral part of this statement.
Semiannual Report 2016
23
COLUMBIA MORTGAGE OPPORTUNITIES FUND
FINANCIAL HIGHLIGHTS (continued)
| | | Six Months Ended
November 30, 2016 | | Year Ended May 31, | |
Class W | | (Unaudited) | | 2016 | | 2015 | | 2014(a) | |
Per share data | |
Net asset value, beginning of period | | $ | 9.69 | | | $ | 10.05 | | | $ | 10.02 | | | $ | 10.00 | | |
Income from investment operations: | |
Net investment income | | | 0.16 | | | | 0.39 | | | | 0.36 | | | | 0.02 | | |
Net realized and unrealized gain (loss) | | | 0.25 | | | | (0.31 | ) | | | 0.12 | | | | 0.01 | | |
Total from investment operations | | | 0.41 | | | | 0.08 | | | | 0.48 | | | | 0.03 | | |
Less distributions to shareholders: | |
Net investment income | | | (0.16 | ) | | | (0.34 | ) | | | (0.35 | ) | | | (0.01 | ) | |
Net realized gains | | | — | | | | (0.10 | ) | | | (0.10 | ) | | | — | | |
Total distributions to shareholders | | | (0.16 | ) | | | (0.44 | ) | | | (0.45 | ) | | | (0.01 | ) | |
Net asset value, end of period | | $ | 9.94 | | | $ | 9.69 | | | $ | 10.05 | | | $ | 10.02 | | |
Total return | | | 4.25 | % | | | 0.83 | % | | | 4.87 | % | | | 0.29 | % | |
Ratios to average net assets(b) | |
Total gross expenses | | | 1.09 | %(c) | | | 1.16 | % | | | 1.30 | % | | | 1.30 | %(c) | |
Total net expenses(d) | | | 0.98 | %(c) | | | 1.00 | % | | | 1.00 | % | | | 1.00 | %(c) | |
Net investment income | | | 3.18 | %(c) | | | 3.94 | % | | | 3.56 | % | | | 1.79 | %(c) | |
Supplemental data | |
Net assets, end of period (in thousands) | | $ | 10 | | | $ | 10 | | | $ | 10 | | | $ | 10 | | |
Portfolio turnover | | | 314 | % | | | 743 | % | | | 829 | % | | | 56 | % | |
Notes to Financial Highlights
(a) Based on operations from April 30, 2014 (commencement of operations) through the stated period end.
(b) In addition to the fees and expenses that the Fund bears directly, the Fund indirectly bears a pro rata share of the fees and expenses of any other funds in which it invests. Such indirect expenses are not included in the Fund's reported expense ratios.
(c) Annualized.
(d) Total net expenses include the impact of certain fee waivers/expense reimbursements made by the Investment Manager and certain of its affiliates, if applicable.
The accompanying Notes to Financial Statements are an integral part of this statement.
Semiannual Report 2016
24
COLUMBIA MORTGAGE OPPORTUNITIES FUND
FINANCIAL HIGHLIGHTS (continued)
| | | Six Months Ended
November 30, 2016 | | Year Ended May 31, | |
Class Z | | (Unaudited) | | 2016 | | 2015 | | 2014(a) | |
Per share data | |
Net asset value, beginning of period | | $ | 9.69 | | | $ | 10.06 | | | $ | 10.02 | | | $ | 10.00 | | |
Income from investment operations: | |
Net investment income | | | 0.17 | | | | 0.39 | | | | 0.39 | | | | 0.02 | | |
Net realized and unrealized gain (loss) | | | 0.25 | | | | (0.30 | ) | | | 0.12 | | | | 0.01 | | |
Total from investment operations | | | 0.42 | | | | 0.09 | | | | 0.51 | | | | 0.03 | | |
Less distributions to shareholders: | |
Net investment income | | | (0.17 | ) | | | (0.36 | ) | | | (0.37 | ) | | | (0.01 | ) | |
Net realized gains | | | — | | | | (0.10 | ) | | | (0.10 | ) | | | — | | |
Total distributions to shareholders | | | (0.17 | ) | | | (0.46 | ) | | | (0.47 | ) | | | (0.01 | ) | |
Net asset value, end of period | | $ | 9.94 | | | $ | 9.69 | | | $ | 10.06 | | | $ | 10.02 | | |
Total return | | | 4.37 | % | | | 0.98 | % | | | 5.24 | % | | | 0.30 | % | |
Ratios to average net assets(b) | |
Total gross expenses | | | 0.86 | %(c) | | | 0.90 | % | | | 1.03 | % | | | 1.08 | %(c) | |
Total net expenses(d) | | | 0.74 | %(c) | | | 0.75 | % | | | 0.75 | % | | | 0.75 | %(c) | |
Net investment income | | | 3.43 | %(c) | | | 4.07 | % | | | 3.96 | % | | | 2.21 | %(c) | |
Supplemental data | |
Net assets, end of period (in thousands) | | $ | 5,601 | | | $ | 3,494 | | | $ | 41 | | | $ | 12 | | |
Portfolio turnover | | | 314 | % | | | 743 | % | | | 829 | % | | | 56 | % | |
Notes to Financial Highlights
(a) Based on operations from April 30, 2014 (commencement of operations) through the stated period end.
(b) In addition to the fees and expenses that the Fund bears directly, the Fund indirectly bears a pro rata share of the fees and expenses of any other funds in which it invests. Such indirect expenses are not included in the Fund's reported expense ratios.
(c) Annualized.
(d) Total net expenses include the impact of certain fee waivers/expense reimbursements made by the Investment Manager and certain of its affiliates, if applicable.
The accompanying Notes to Financial Statements are an integral part of this statement.
Semiannual Report 2016
25
COLUMBIA MORTGAGE OPPORTUNITIES FUND
NOTES TO FINANCIAL STATEMENTS
November 30, 2016 (Unaudited)
Note 1. Organization
Columbia Mortgage Opportunities Fund (the Fund), a series of Columbia Funds Series Trust II (the Trust), is a non-diversified fund. The Trust is registered under the Investment Company Act of 1940, as amended (the 1940 Act), as an open-end management investment company organized as a Massachusetts business trust.
Fund Shares
The Trust may issue an unlimited number of shares (without par value). The Fund offers Class A, Class C, Class I, Class R4, Class R5, Class W and Class Z shares. Although all share classes generally have identical voting, dividend and liquidation rights, each share class votes separately when required by the Trust's organizational documents or by law. Different share classes pay different distribution amounts to the extent the expenses of such share classes differ, and distributions in liquidation will be proportional to the net asset value of each share class. Each share class has its own expense and sales charge structure.
Class A shares are subject to a maximum front-end sales charge of 3.00% based on the initial investment amount. Class A shares purchased without an initial sales charge in accounts aggregating $1 million to $50 million at the time of purchase are subject to a contingent deferred sales charge (CDSC) if the shares are sold within 18 months after purchase, charged as follows: 1.00% CDSC if redeemed within 12 months after purchase, and 0.50% CDSC if redeemed more than 12, but less than 18, months after purchase.
Class C shares are subject to a 1.00% CDSC on shares redeemed within 12 months after purchase.
Class I shares are not subject to sales charges and are available only to the Columbia Family of Funds.
Class R4 shares are not subject to sales charges and are generally available only to omnibus retirement plans and certain investors as described in the Fund's prospectus.
Class R5 shares are not subject to sales charges and are generally available only to investors purchasing through authorized investment professionals and omnibus retirement plans.
Class W shares are not subject to sales charges and are generally available only to investors purchasing through authorized investment programs managed by investment professionals, including discretionary managed account programs.
Class Z shares are not subject to sales charges and are generally available only to eligible investors, which are subject to different investment minimums as described in the Fund's prospectus.
Note 2. Summary of Significant Accounting Policies
Basis of Preparation
The Fund is an investment company that applies the accounting and reporting guidance in the Financial Accounting Standards Board (FASB) Accounting Standards Codification Topic 946, Financial Services — Investment Companies (ASC 946). The financial statements are prepared in accordance with U.S. generally accepted accounting principles (GAAP), which requires management to make certain estimates and assumptions that affect the reported amounts of assets and liabilities, the disclosure of contingent assets and liabilities at the date of the financial statements and the reported amounts of income and expenses during the reporting period. Actual results could differ from those estimates.
The following is a summary of significant accounting policies followed by the Fund in the preparation of its financial statements.
Security Valuation
Debt securities generally are valued by pricing services approved by the Board of Trustees (the Board) based upon market transactions for normal, institutional-size trading units of similar securities. The services may use various pricing techniques that take into account, as applicable, factors such as yield, quality, coupon rate, maturity, type of issue, trading characteristics and other data, as well as approved independent broker-dealer quotes. Debt securities for which quotations are not readily available or not believed to be reflective of market value may also be valued based upon a bid quote from an approved independent broker-dealer. Debt securities maturing in 60 days or less are valued primarily at amortized cost value, unless this method results in a valuation that management believes does not approximate market value.
Asset- and mortgage-backed securities are generally valued by pricing services, which utilize pricing models that incorporate the securities' cash flow and loan performance data. These models also take into account available market data, including trades, market quotations, and benchmark yield curves for identical or similar securities. Factors used to identify similar
Semiannual Report 2016
26
COLUMBIA MORTGAGE OPPORTUNITIES FUND
NOTES TO FINANCIAL STATEMENTS (continued)
November 30, 2016 (Unaudited)
securities may include, but are not limited to, issuer, collateral type, vintage, prepayment speeds, collateral performance, credit ratings, credit enhancement and expected life. Asset-backed securities for which quotations are readily available may also be valued based upon an over-the-counter or exchange bid quote from an approved independent broker-dealer.
Investments in open-end investment companies, including money market funds, are valued at their latest net asset value.
Futures and options on futures contracts are valued based upon the settlement price at the close of regular trading on their principal exchanges or, in the absence of transactions, at the mean of the latest quoted bid and ask prices.
Option contracts are valued at the mean of the latest quoted bid and ask prices on their primary exchanges. Option contracts, including over-the-counter option contracts, with no readily available market quotations are valued using quotes obtained from independent brokers as of the close of the New York Stock Exchange (NYSE).
Swap transactions are valued through an independent pricing service or broker, or if neither is available, through an internal model based upon observable inputs.
Investments for which market quotations are not readily available, or that have quotations which management believes are not reflective of market value or reliable, are valued at fair value as determined in good faith under procedures approved by and under the general supervision of the Board. If a security or class of securities (such as foreign securities) is valued at fair value, such value is likely to be different from the quoted or published price for the security.
The determination of fair value often requires significant judgment. To determine fair value, management may use assumptions including but not limited to future cash flows and estimated risk premiums. Multiple inputs from various sources may be used to determine fair value.
GAAP requires disclosure regarding the inputs and valuation techniques used to measure fair value and any changes in valuation inputs or techniques. In addition, investments shall be disclosed by major category. This information is disclosed following the Fund's Portfolio of Investments.
Derivative Instruments
The Fund invests in certain derivative instruments, as detailed below, to meet its investment objectives. Derivatives are instruments whose values depend on, or
are derived from, in whole or in part, the value of one or more securities, currencies, commodities, indices, or other assets or instruments. Derivatives may be used to increase investment flexibility (including to maintain cash reserves while maintaining desired exposure to certain assets), for risk management (hedging) purposes, to facilitate trading, to reduce transaction costs and to pursue higher investment returns. The Fund may also use derivative instruments to mitigate certain investment risks, such as foreign currency exchange rate risk, interest rate risk and credit risk. Derivatives may involve various risks, including the potential inability of the counterparty to fulfill its obligations under the terms of the contract, the potential for an illiquid secondary market (making it difficult for the Fund to sell or terminate, including at favorable prices) and the potential for market movements which may expose the Fund to gains or losses in excess of the amount shown in the Statement of Assets and Liabilities. The notional amounts of derivative instruments, if applicable, are not recorded in the financial statements.
A derivative instrument may suffer a marked-to-market loss if the value of the contract decreases due to an unfavorable change in the market rates or values of the underlying instrument. Losses can also occur if the counterparty does not perform its obligations under the contract. The Fund's risk of loss from counterparty credit risk on over-the-counter derivatives is generally limited to the aggregate unrealized gain netted against any collateral held by the Fund and the amount of any variation margin held by the counterparty, plus any replacement costs or related amounts. With exchange-traded or centrally cleared derivatives, there is reduced counterparty credit risk to the Fund since the clearinghouse or central counterparty (CCP) provides some protection in the case of clearing member default. The clearinghouse or CCP stands between the buyer and the seller of the contract; therefore, additional counterparty credit risk is failure of the clearinghouse or CCP. However, credit risk still exists in exchange-traded or centrally cleared derivatives with respect to initial and variation margin that is held in a broker's customer account. While brokers are required to segregate customer margin from their own assets, in the event that a broker becomes insolvent or goes into bankruptcy and at that time there is a shortfall in the aggregate amount of margin held by the broker for all its clients, U.S. bankruptcy laws will typically allocate that shortfall on a pro-rata basis across all the broker's customers (including the Fund), potentially resulting in losses to the Fund.
Semiannual Report 2016
27
COLUMBIA MORTGAGE OPPORTUNITIES FUND
NOTES TO FINANCIAL STATEMENTS (continued)
November 30, 2016 (Unaudited)
In order to better define its contractual rights and to secure rights that will help the Fund mitigate its counterparty risk, the Fund may enter into an International Swaps and Derivatives Association, Inc. Master Agreement (ISDA Master Agreement) or similar agreement with its derivatives contract counterparties. An ISDA Master Agreement is an agreement between the Fund and a counterparty that governs over-the-counter derivatives and typically contains, among other things, collateral posting terms and netting provisions in the event of a default and/or termination event. Under an ISDA Master Agreement, the Fund may, under certain circumstances, offset with the counterparty certain derivative instrument's payables and/or receivables with collateral held and/or posted and create one single net payment. The provisions of the ISDA Master Agreement typically permit a single net payment in the event of default (close-out netting), including the bankruptcy or insolvency of the counterparty. Note, however, that bankruptcy or insolvency laws of a particular jurisdiction may impose restrictions on or prohibitions against the right of offset or netting in bankruptcy, insolvency or other events.
Collateral (margin) requirements differ by type of derivative. Margin requirements are established by the clearinghouse or CCP for exchange-traded and centrally cleared derivatives. Brokers can ask for margin in excess of the minimum in certain circumstances. Collateral terms are contract specific for over-the-counter derivatives. For over-the-counter derivatives traded under an ISDA Master Agreement, the collateral requirements are typically calculated by netting the marked-to-market amount for each transaction under such agreement and comparing that amount to the value of any variation margin currently pledged by the Fund and/or the counterparty. Generally, the amount of collateral due from or to a party has to exceed a minimum transfer amount threshold (e.g., $250,000) before a transfer has to be made. To the extent amounts due to the Fund from its counterparties are not fully collateralized, contractually or otherwise, the Fund bears the risk of loss from counterparty nonperformance. The Fund attempts to mitigate counterparty risk by only entering into agreements with counterparties that it believes have the financial resources to honor their obligations and by monitoring the financial stability of those counterparties.
Certain ISDA Master Agreements allow counterparties of over-the-counter derivatives transactions to terminate derivatives contracts prior to maturity in the event the Fund's net asset value declines by a stated percentage over a specified time period or if the Fund fails to meet
certain terms of the ISDA Master Agreement, which would cause the Fund to accelerate payment of any net liability owed to the counterparty. The Fund also has termination rights if the counterparty fails to meet certain terms of the ISDA Master Agreement. In addition to considering counterparty credit risk, the Fund would consider terminating the derivatives contracts based on whether termination would result in a net liability owed from the counterparty.
For financial reporting purposes, the Fund does not offset derivative assets and derivative liabilities that are subject to netting arrangements in the Statement of Assets and Liabilities.
Futures Contracts
Futures contracts are exchange-traded and represent commitments for the future purchase or sale of an asset at a specified price on a specified date. The Fund bought and sold futures contracts to manage the duration and yield curve exposure of the Fund versus the benchmark and to manage exposure to movements in interest rates. These instruments may be used for other purposes in future periods. Upon entering into futures contracts, the Fund bears risks that it may not achieve the anticipated benefits of the futures contracts and may realize a loss. Additional risks include counterparty credit risk, the possibility of an illiquid market, and that a change in the value of the contract or option may not correlate with changes in the value of the underlying asset.
Upon entering into a futures contract, the Fund deposits cash or securities with the broker, known as a futures commissions merchant (FCM), in an amount sufficient to meet the initial margin requirement. The initial margin deposit must be maintained at an established level over the life of the contract. Cash deposited as initial margin is recorded in the Statement of Assets and Liabilities as margin deposits. Securities deposited as initial margin are designated in the Portfolio of Investments. Subsequent payments (variation margin) are made or received by the Fund each day. The variation margin payments are equal to the daily change in the contract value and are recorded as variation margin receivable or payable and are offset in unrealized gains or losses. The Fund recognizes a realized gain or loss when the contract is closed or expires. Futures contracts involve, to varying degrees, risk of loss in excess of the variation margin disclosed in the Statement of Assets and Liabilities.
Options Contracts
Options are contracts which entitle the holder to purchase or sell securities or other identified assets at a
Semiannual Report 2016
28
COLUMBIA MORTGAGE OPPORTUNITIES FUND
NOTES TO FINANCIAL STATEMENTS (continued)
November 30, 2016 (Unaudited)
specified price, or in the case of index option contracts, to receive or pay the difference between the index value and the strike price of the index option contract. Option contracts can be either exchange-traded or over-the-counter. The Fund purchased and/or wrote option contracts to manage interest rate and volatility exposure. These instruments may be used for other purposes in future periods. Completion of transactions for option contracts traded in the over-the-counter market depends upon the performance of the other party. Cash collateral may be collected or posted by the Fund to secure certain over-the-counter option contract trades. Cash collateral held or posted by the Fund for such option contract trades must be returned to the broker or the Fund upon closure, exercise or expiration of the contract.
Options contracts purchased are recorded as investments. When the Fund writes an options contract, the premium received is recorded as an asset and an amount equivalent to the premium is recorded as a liability in the Statement of Assets and Liabilities and is subsequently adjusted to reflect the current fair value of the option written. Changes in the fair value of the written option are recorded as unrealized appreciation or depreciation until the contract is exercised or has expired. The Fund will realize a gain or loss when the option contract is closed or expires. When option contracts are exercised, the proceeds on sales for a
written call or purchased put option contract, or the purchase cost for a written put or purchased call option contract, is adjusted by the amount of premium received or paid.
For over-the-counter options purchased, the Fund bears the risk of loss of the amount of the premiums paid plus the positive change in market values net of any collateral held by the Fund should the counterparty fail to perform under the contracts. Option contracts written by the Fund do not typically give rise to significant counterparty credit risk, as options written generally obligate the Fund and not the counterparty to perform. The risk in writing a call option contract is that the Fund gives up the opportunity for profit if the market price of the security increases above the strike price and the option contract is exercised. The risk in writing a put option contract is that the Fund may incur a loss if the market price of the security decreases below the strike price and the option contract is exercised. Exercise of a written option could result in the Fund purchasing or selling a security or foreign currency when it otherwise would not, or at a price different from the current market value. In purchasing and writing options, the Fund bears the risk of an unfavorable change in the value of the underlying instrument or the risk that the Fund may not be able to enter into a closing transaction due to an illiquid market.
Contracts and premiums associated with options contracts written for the six months ended November 30, 2016 are as follows:
| | | Calls | | Puts | |
| | | Contracts | | Premiums ($) | | Contracts | | Premiums ($) | |
Balance at May 31, 2016 | | | (40,000,000.00 | ) | | | (240,000.00 | ) | | | (60,000,000.00 | ) | | | (499,500.00 | ) | |
Opened | | | — | | | | — | | | | (50,000,000.00 | ) | | | (280,000.00 | ) | |
Closed | | | 40,000,000.00 | | | | 240,000.00 | | | | — | | | | — | | |
Expired | | | — | | | | — | | | | 60,000,000.00 | | | | 499,500.00 | | |
Balance at November 30, 2016 | | | — | | | | — | | | | (50,000,000.00 | ) | | | (280,000.00 | ) | |
Interest Rate Swaption Contracts
Interest rate swaption contracts entered into by the Fund typically represent an option that gives the purchaser the right, but not the obligation, to enter into an interest rate swap contract on a future date. Each interest rate swaption agreement will specify if the buyer is entitled to receive the fixed or floating rate if the interest rate is exercised. Changes in the value of a purchased interest rate swaption contracts are reported as unrealized appreciation or depreciation on options in the Statement of Assets and Liabilities. Gain or loss is recognized in
the Statement of Operations when the interest rate swaption contract is closed or expires.
When the Fund writes an interest rate swaption contract, the premium received is recorded as an asset and an amount equivalent to the premium is recorded as a liability in the Statement of Assets and Liabilities and is subsequently adjusted to reflect the current fair value of the interest rate swaption contract written. Premiums received from writing interest rate swaption contracts that expire unexercised are recorded by the Fund on the expiration date as realized gains from options written in the Statement of Operations. The difference between the
Semiannual Report 2016
29
COLUMBIA MORTGAGE OPPORTUNITIES FUND
NOTES TO FINANCIAL STATEMENTS (continued)
November 30, 2016 (Unaudited)
premium and the amount paid on effecting a closing purchase transaction, including brokerage commissions, is also recorded as realized gain, or if the premium is less than the amount paid for the closing purchase, as realized loss. These amounts are reflected as net realized gain (loss) on options written in the Statement of Operations.
Swap Contracts
Swap contracts are negotiated in the over-the-counter market and may be entered into as a bilateral contract or centrally cleared (centrally cleared swap contract). In a centrally cleared swap contract, immediately following execution of the swap contract with a broker, the swap contract is novated to a central counterparty (the CCP) and the CCP becomes the Fund's counterparty to the centrally cleared swap contract. The Fund is required to deposit initial margin with the FCM, which pledges it through to the CCP in the form of cash or securities in an amount that varies depending on the size and risk profile of the particular swap contract. Securities deposited as initial margin are designated in the Portfolio of Investments and cash deposited is recorded in the Statement of Assets and Liabilities as margin deposits. Unlike a bilateral swap contract, for centrally cleared swap contracts, the Fund has less credit exposure to the FCM because the CCP stands between the Fund and the relevant buyer/seller on the other side of the contract. Swap contracts are marked-to-market daily and changes in value are recorded as unrealized appreciation (depreciation). The daily change in valuation of centrally cleared swap contracts, if any, is recorded as a receivable or payable for variation margin in the Statement of Assets and Liabilities.
Entering into these contracts involves, to varying degrees, elements of interest, liquidity and counterparty credit risk in excess of the amounts recognized in the Statement of Assets and Liabilities. Such risks involve the possibility that there may be unfavorable changes in interest rates, market conditions or other conditions, it may be difficult to initiate a swap transaction or liquidate a position at an advantageous time or price which may result in significant losses, and that the FCM or CCP may not fulfill its obligation under the contract.
Credit Default Swap Contracts
The Fund entered into credit default swap contracts to increase or decrease its credit exposure to an index and to manage credit risk exposure. These instruments may be used for other purposes in future periods. Credit default swap contracts are agreements in which one party pays fixed periodic payments to a counterparty in consideration
for an agreement from the counterparty to make a specific payment should a specified credit event(s) take place. Although specified credit events are contract specific, credit events are generally defined as bankruptcy, failure to pay, restructuring, obligation acceleration, obligation default, or repudiation/moratorium.
As the purchaser of a credit default swap contract, the Fund purchases protection by paying a periodic interest rate on a notional amount to the counterparty. The interest amount is accrued daily as a component of unrealized appreciation (depreciation) and is recorded as a realized loss upon payment. If a credit event as specified in the contract occurs, the Fund may have the option either to deliver the reference obligation to the seller in exchange for a cash payment of its par amount, or to receive a net cash settlement equal to the par amount less an agreed-upon value of the reference obligation as of the date of the credit event. The difference between the value of the obligation or cash delivered and the notional amount received will be recorded as a realized gain (loss).
As the seller of a credit default swap contract, the Fund sells protection to a buyer and will generally receive a periodic interest rate on a notional amount. The interest amount is accrued daily as a component of unrealized appreciation (depreciation) and is recorded as a realized gain upon receipt of the payment. If a credit event as specified in the contract with the counterparty occurs, the Fund may either be required to accept the reference obligation from the buyer in exchange for a cash payment of its notional amount, or to pay the buyer a net cash settlement equal to the notional amount less an agreed-upon value of the reference obligation (recovery value) as of the date of the credit event. The difference between the value of the obligation or cash received and the notional amount paid will be recorded as a realized gain (loss). The maximum potential amount of undiscounted future payments the Fund could be required to make as the seller of protection under a credit default swap contract is equal to the notional amount of the reference obligation. These potential amounts may be partially offset by any recovery values of the respective reference obligations or premiums received upon entering into the agreement. The notional amounts and market values of all credit default swap contracts in which the Fund is the seller of protection, if any, are disclosed in the Credit Default Swap Contracts Outstanding schedule following the Portfolio of Investments.
As a protection seller, the Fund bears the risk of loss from the credit events specified in the contract with the counterparty. For credit default swap contracts on credit
Semiannual Report 2016
30
COLUMBIA MORTGAGE OPPORTUNITIES FUND
NOTES TO FINANCIAL STATEMENTS (continued)
November 30, 2016 (Unaudited)
indices, quoted market prices and resulting market values serve as an indicator of the current status of the payment/performance risk. Increasing market values, in absolute terms when compared to the notional amount of the swap, represent a deterioration of the reference entity's credit soundness and a greater likelihood or risk of default or other credit event occurring as defined under the terms of the contract.
Any premium paid or received by the Fund upon entering into a credit default swap contract is recorded as an asset or liability, respectively, and amortized daily as a component of realized gain (loss) in the Statement of Operations. Credit default swap contracts are valued daily, and the change in value is recorded as unrealized appreciation (depreciation) until the termination of the swap, at which time a realized gain (loss) is recorded.
Credit default swap contracts can involve greater risks than if a fund had invested in the reference obligation directly since, in addition to general market risks, credit default swaps are subject to counterparty credit risk, leverage risk, hedging risk, correlation risk and liquidity risk.
Interest Rate Swap Contracts
The Fund entered into interest rate swap transactions which may include inflation rate swap contracts to manage interest rate and market risk exposure to produce incremental earnings. These instruments may be used for other purposes in future periods. An interest rate swap is an agreement between two parties where there are two flows and payments are made between the two counterparties and the payments are dependent upon changes in an interest rate, inflation rate or inflation index calculated on a nominal amount. Interest rate swaps are agreements between two parties that involve the exchange of one type of interest rate for another type of interest rate cash flow on specified dates in the future, based on a predetermined, specified notional amount. Certain interest rate swaps are considered forward-starting, whereby the accrual for the exchange of cash flows does not begin until a specified date in the future. The net cash flow for a standard interest rate swap transaction is generally the difference between a floating market interest rate versus a fixed interest rate.
Interest rate swaps are valued daily and unrealized appreciation (depreciation) is recorded. Certain interest rate swaps may accrue periodic interest on a daily basis as a component of unrealized appreciation (depreciation); the Fund will realize a gain or loss upon the payment or
receipt of accrued interest. The Fund will realize a gain or a loss when the interest rate swap is terminated.
Effects of Derivative Transactions in the Financial Statements
The following tables are intended to provide additional information about the effect of derivatives on the financial statements of the Fund, including: the fair value of derivatives by risk category and the location of those fair values in the Statement of Assets and Liabilities; and the impact of derivative transactions over the period in the Statement of Operations, including realized and unrealized gains (losses). The derivative instrument schedules following the Portfolio of Investments present additional information regarding derivative instruments outstanding at the end of the period, if any.
The following table is a summary of the fair value of derivative instruments (not considered to be hedging instruments for accounting disclosure purposes) at November 30, 2016:
Asset Derivatives | |
Risk Exposure
Category | | Statement of Assets and
Liabilities Location | | Fair Value ($) | |
Credit risk | | Net assets — unrealized
appreciation on swap
contracts | | | 358,058 | * | |
Interest rate risk | | Net assets — unrealized
appreciation on futures
contracts | | | 6,752 | * | |
Interest rate risk | | Investments, at value —
Options purchased | | | 9,024,205 | | |
Total | | | | | 9,389,015 | | |
Liability Derivatives | |
Risk Exposure
Category | | Statement of Assets and
Liabilities Location | | Fair Value ($) | |
Credit risk | | Net assets — unrealized
depreciation on swap
contracts | | | 212,106 | * | |
Credit risk | | Premiums received on
outstanding swap
contracts | | | 1,910,132 | | |
Interest rate risk | | Net assets — unrealized
depreciation on futures
contracts | | | 213,808 | * | |
Interest rate risk | | Options contracts written,
at value | | | 273,480 | | |
Total | | | | | 2,609,526 | | |
*Includes cumulative appreciation (depreciation) as reported in the tables following the Portfolio of Investments. Only the current day's variation margin is reported in receivables or payables in the Statement of Assets and Liabilities.
Semiannual Report 2016
31
COLUMBIA MORTGAGE OPPORTUNITIES FUND
NOTES TO FINANCIAL STATEMENTS (continued)
November 30, 2016 (Unaudited)
The following table indicates the effect of derivative instruments (not considered to be hedging instruments for accounting disclosure purposes) in the Statement of Operations for the six months ended November 30, 2016:
Amount of Realized Gain (Loss) on Derivatives Recognized in Income | |
Risk Exposure Category | | Futures
Contracts ($) | | Options Contracts
Written ($) | | Options Contracts
Purchased ($) | | Swap
Contracts ($) | | Total ($) | |
Credit risk | | | — | | | | — | | | | — | | | | 78,152 | | | | 78,152 | | |
Interest rate risk | | | (2,150,063 | ) | | | 548,700 | | | | (712,500 | ) | | | (2,190,020 | ) | | | (4,503,883 | ) | |
Total | | | (2,150,063 | ) | | | 548,700 | | | | (712,500 | ) | | | (2,111,868 | ) | | | (4,425,731 | ) | |
Change in Unrealized Appreciation (Depreciation) on Derivatives Recognized in Income | |
Risk Exposure Category | | Futures
Contracts ($) | | Options Contracts
Written ($) | | Options Contracts
Purchased ($) | | Swap
Contracts ($) | | Total ($) | |
Credit risk | | | — | | | | — | | | | — | | | | 151,680 | | | | 151,680 | | |
Interest rate risk | | | (223,460 | ) | | | (394,092 | ) | | | 6,258,546 | | | | 1,032,564 | | | | 6,673,558 | | |
Total | | | (223,460 | ) | | | (394,092 | ) | | | 6,258,546 | | | | 1,184,244 | | | | 6,825,238 | | |
The following table provides a summary of the average outstanding volume by derivative instrument for the six months ended November 30, 2016:
Derivative Instrument | | Average Notional
Amounts ($)* | |
Futures contracts — Long | | | 65,428,992 | | |
Futures contracts — Short | | | 38,028,781 | | |
Credit default swap contracts — buy protection | | | 24,500,000 | | |
Credit default swap contracts — sell protection | | | 20,550,000 | | |
Derivative Instrument | | Average Market
Value ($)* | |
Options contracts — Written | | | (136,740 | ) | |
Derivative Instrument | | Average Unrealized
Appreciation ($)** | | Average Unrealized
Depreciation ($)** | |
Interest rate swap contracts | | | — | | | | (367,689 | ) | |
*Based on the ending quarterly outstanding amounts for the six months ended November 30, 2016.
**Based on the monthly outstanding amounts for the six months ended November 30, 2016.
Asset- and Mortgage-Backed Securities
The Fund may invest in asset-backed and mortgage-backed securities. The maturity dates shown represent the original maturity of the underlying obligation. Actual maturity may vary based upon prepayment activity on these obligations. All, or a portion, of the obligation may be prepaid at any time because the underlying asset may be prepaid. As a result, decreasing market interest rates could result in an increased level of prepayment. An increased prepayment rate will have the effect of shortening the maturity of the security. Unless otherwise noted, the coupon rates presented are fixed rates.
Delayed Delivery Securities
The Fund may trade securities on other than normal settlement terms, including securities purchased or sold on a "when-issued" basis. This may increase risk to the Fund since the other party to the transaction may fail to deliver, which could cause the Fund to subsequently invest at less advantageous prices. The Fund designates cash or liquid securities in an amount equal to the delayed delivery commitment.
To Be Announced Securities
The Fund may trade securities on a To Be Announced (TBA) basis. As with other delayed-delivery transactions, a seller agrees to issue a TBA security at a future date. However, the seller does not specify the particular securities to be delivered. Instead, the Fund agrees to accept any security that meets specified terms.
In some cases, Master Securities Forward Transaction Agreements (MSFTAs) may be used to govern transactions of certain forward-settling agency mortgage-backed securities, such as delayed-delivery and TBAs, between the Fund and counterparty. The MSFTA maintains provisions for, among other things, initiation and confirmation, payment and transfer, events of default, termination, and maintenance of collateral relating to such transactions.
Mortgage Dollar Roll Transactions
The Fund may enter into mortgage "dollar rolls" in which the Fund sells securities for delivery in the current month and simultaneously contracts with the same counterparty to repurchase similar but not identical securities (same type, coupon and maturity) on a specified future date. During the roll period, the Fund loses the right to receive principal and interest paid on the securities sold.
Semiannual Report 2016
32
COLUMBIA MORTGAGE OPPORTUNITIES FUND
NOTES TO FINANCIAL STATEMENTS (continued)
November 30, 2016 (Unaudited)
However, the Fund will benefit because it receives negotiated amounts in the form of reductions of the purchase price for the future purchase plus the interest earned on the cash proceeds of the securities sold until the settlement date of the forward purchase. The Fund records the incremental difference between the forward purchase and sale of each forward roll as a realized gain or loss. Unless any realized gains exceed the income, capital appreciation, and gain or loss due to mortgage prepayments that would have been realized on the securities sold as part of the mortgage dollar roll, the use of this technique will diminish the investment performance of the Fund compared to what the performance would have been without the use of mortgage dollar rolls. All cash proceeds will be invested in instruments that are permissible investments for the Fund. The Fund identifies cash or liquid securities in an amount equal to the forward purchase price.
For financial reporting and tax purposes, the Fund treats "to be announced" mortgage dollar rolls as two separate transactions, one involving the purchase of a security and a separate transaction involving a sale. These transactions may increase the Fund's portfolio turnover rate. The Fund does not currently enter into mortgage dollar rolls that are accounted for as financing transactions.
Mortgage dollar rolls involve the risk that the market value of the securities the Fund is obligated to
repurchase may decline below the repurchase price, or that the counterparty may default on its obligations.
Interest Only and Principal Only Securities
The Fund may invest in Interest Only (IO) or Principal Only (PO) securities. IOs are stripped securities entitled to receive all of the security's interest, but none of its principal. IOs are particularly sensitive to changes in interest rates and therefore subject to greater fluctuations in price than typical interest bearing debt securities. IOs are also subject to credit risk because the Fund may not receive all or part of the interest payments if the issuer, obligor, guarantor or counterparty defaults on its obligation. Payments received for IOs are included in interest income on the Statement of Operations. Because no principal will be received at the maturity of an IO, adjustments are made to the cost of the security on a monthly basis until maturity. POs are stripped securities entitled to receive the principal from the underlying obligation, but not the interest. POs are particularly sensitive to changes in interest rates and therefore are subject to fluctuations in price. POs are also subject to credit risk because the Fund may not receive all or part of its principal if the issuer, obligor, guarantor or counterparty defaults on its obligation. The Fund may also invest in IO or PO stripped mortgage-backed securities. Payments received for POs are treated as reductions to the cost and par value of the securities.
Offsetting of Assets and Liabilities
The following table presents the Fund's gross and net amount of assets and liabilities available for offset under netting arrangements as well as any related collateral received or pledged by the Fund as of November 30, 2016:
| | Barclays ($) | | Citi ($) | | Goldman Sachs
International
($) | | JPMorgan ($) | | Morgan
Stanley
($)(e) | | Morgan
Stanley
($)(e) | | Total ($) | |
Assets | |
Options purchased puts | | | 96,145 | | | | 8,928,060 | | | | — | | | | — | | | | — | | | | — | | | | 9,024,205 | | |
Total Assets | | | 96,145 | | | | 8,928,060 | | | | — | | | | — | | | | — | | | | — | | | | 9,024,205 | | |
Liabilities | |
Centrally cleared credit default
swap contracts(a) | | | — | | | | — | | | | — | | | | — | | | | — | | | | 29,514 | | | | 29,514 | | |
Options contracts written | | | — | | | | — | | | | — | | | | — | | | | 273,480 | | | | — | | | | 273,480 | | |
OTC credit default swap contracts(b) | | | — | | | | — | | | | 365,469 | | | | 156,110 | | | | 1,032,838 | | | | — | | | | 1,554,417 | | |
Total Liabilities | | | — | | | | — | | | | 365,469 | | | | 156,110 | | | | 1,306,318 | | | | 29,514 | | | | 1,857,411 | | |
Semiannual Report 2016
33
COLUMBIA MORTGAGE OPPORTUNITIES FUND
NOTES TO FINANCIAL STATEMENTS (continued)
November 30, 2016 (Unaudited)
| | | Barclays ($) | | Citi ($) | | Goldman Sachs
International
($) | | JPMorgan ($) | | Morgan
Stanley
($)(e) | | Morgan
Stanley
($)(e) | | Total ($) | |
Total Financial and Derivative
Net Assets | | | 96,145 | | | | 8,928,060 | | | | (365,469 | ) | | | (156,110 | ) | | | (1,306,318 | ) | | | (29,514 | ) | | | 7,166,794 | | |
Total collateral received (pledged)(c) | | | 96,145 | | | | 8,789,000 | | | | (340,000 | ) | | | — | | | | (1,223,000 | ) | | | (29,514 | ) | | | 7,292,631 | | |
Net Amount(d) | | | — | | | | 139,060 | | | | (25,469 | ) | | | (156,110 | ) | | | (83,318 | ) | | | — | | | | (125,837 | ) | |
(a) Centrally cleared swaps are included within payable/receivable for variation margin on the Statement of Assets and Liabilities.
(b) Over-the-Counter Swap Contracts are presented at market value plus periodic payments receivable (payable), which is comprised of unrealized appreciation, unrealized depreciation, premiums paid and premiums received.
(c) In some instances, the actual collateral received and/or pledged may be more than the amount shown due to overcollateralization.
(d) Represents the net amount due from/(to) counterparties in the event of default.
(e) Exposure can only be netted across transactions governed under the same master agreement with the same legal entity.
Security Transactions
Security transactions are accounted for on the trade date. Cost is determined and gains (losses) are based upon the specific identification method for both financial statement and federal income tax purposes.
Income Recognition
Interest income is recorded on an accrual basis. Market premiums and discounts, including original issue discounts, are amortized and accreted, respectively, over the expected life of the security on all debt securities, unless otherwise noted. The Fund classifies gains and losses realized on prepayments received on mortgage-backed securities as adjustments to interest income.
The Fund may place a debt security on non-accrual status and reduce related interest income when it becomes probable that the interest will not be collected and the amount of uncollectible interest can be reasonably estimated. A defaulted debt security is removed from non-accrual status when the issuer resumes interest payments or when collectibility of interest is reasonably assured.
Dividend income is recorded on the ex-dividend date.
Expenses
General expenses of the Trust are allocated to the Fund and other funds of the Trust based upon relative net assets or other expense allocation methodologies determined by the nature of the expense. Expenses directly attributable to the Fund are charged to the Fund. Expenses directly attributable to a specific class of shares are charged to that share class.
Determination of Class Net Asset Value
All income, expenses (other than class-specific expenses, which are charged to that share class, as shown in the Statement of Operations) and realized and
unrealized gains (losses) are allocated to each class of the Fund on a daily basis, based on the relative net assets of each class, for purposes of determining the net asset value of each class.
Federal Income Tax Status
The Fund intends to qualify each year as a regulated investment company under Subchapter M of the Internal Revenue Code, as amended, and will distribute substantially all of its taxable income (including net short-term capital gains), if any, for its tax year, and as such will not be subject to federal income taxes. In addition, the Fund intends to distribute in each calendar year substantially all of its net investment income, capital gains and certain other amounts, if any, such that the Fund should not be subject to federal excise tax. Therefore, no federal income or excise tax provision is recorded.
Distributions to Shareholders
Distributions from net investment income, if any, are declared and paid monthly. Net realized capital gains, if any, are distributed at least annually. Income distributions and capital gain distributions are determined in accordance with federal income tax regulations, which may differ from GAAP.
Guarantees and Indemnifications
Under the Trust's organizational documents and, in some cases, by contract, its officers and trustees are indemnified against certain liabilities arising out of the performance of their duties to the Trust or its funds. In addition, certain of the Fund's contracts with its service providers contain general indemnification clauses. The Fund's maximum exposure under these arrangements is unknown since the amount of any future claims that may be made against the Fund cannot be determined, and
Semiannual Report 2016
34
COLUMBIA MORTGAGE OPPORTUNITIES FUND
NOTES TO FINANCIAL STATEMENTS (continued)
November 30, 2016 (Unaudited)
the Fund has no historical basis for predicting the likelihood of any such claims.
Investment Company Reporting Modernization
In October 2016, the U.S. Securities and Exchange Commission adopted new rules and forms, and amendments to certain current rules and forms, to modernize reporting and disclosure of information by registered investment companies. The amendments to Regulation S-X will require standardized, enhanced disclosure about derivatives in investment company financial statements, and will also change the rules governing the form and content of such financial statements. The amendments to Regulation S-X take effect on August 1, 2017. At this time, management is assessing the anticipated impact of these regulatory developments.
Note 3. Fees and Other Transactions with Affiliates
Management Services Fees
The Fund entered into a Management Agreement with Columbia Management Investment Advisers, LLC (the Investment Manager), a wholly-owned subsidiary of Ameriprise Financial, Inc. (Ameriprise Financial). Under the Management Agreement, the Investment Manager provides the Fund with investment research and advice, as well as administrative and accounting services. The management services fee is an annual fee that is equal to a percentage of the Fund's average daily net assets that declines from 0.650% to 0.535% as the Fund's net assets increase. The annualized effective management services fee rate for the six months ended November 30, 2016 was 0.648% of the Fund's average daily net assets.
Other Expenses
Other expenses are for, among other things, miscellaneous expenses of the Fund or the Board, including payments to Board Services Corp., a company providing limited administrative services to the Fund and the Board. That company's expenses include boardroom and office expense, employee compensation, employee health and retirement benefits, and certain other expenses.
Compensation of Board Members
Board members, who are not officers or employees of the Investment Manager or Ameriprise Financial, are compensated for their services to the Fund as disclosed in the Statement of Operations. Under a Deferred
Compensation Plan (the Plan), these Board members may elect to defer payment of up to 100% of their compensation. Deferred amounts are treated as though equivalent dollar amounts had been invested in shares of certain funds managed by the Investment Manager. The Fund's liability for these amounts is adjusted for market value changes and remains in the Fund until distributed in accordance with the Plan. All amounts payable under the Plan constitute a general unsecured obligation of the Fund.
Compensation of Chief Compliance Officer
The Board has appointed a Chief Compliance Officer to the Fund in accordance with federal securities regulations. The Fund is allocated a portion of the expenses associated with the Chief Compliance Officer based on relative net assets of the Trust.
Transfer Agency Fees
Under a Transfer and Dividend Disbursing Agent Agreement, Columbia Management Investment Services Corp. (the Transfer Agent), an affiliate of the Investment Manager and a wholly-owned subsidiary of Ameriprise Financial, is responsible for providing transfer agency services to the Fund. The Transfer Agent has contracted with Boston Financial Data Services (BFDS) to serve as sub-transfer agent. The Transfer Agent pays the fees of BFDS for services as sub-transfer agent and BFDS is not entitled to reimbursement for such fees from the Fund (with the exception of out-of-pocket fees).
The Fund pays the Transfer Agent a monthly transfer agency fee based on the number or the average value of accounts, depending on the type of account. In addition, prior to October 1, 2016, the Transfer Agent also received sub-transfer agency fees based on a percentage of the average aggregate value of the Fund's shares maintained in omnibus accounts (other than omnibus accounts for which American Enterprise Investment Services Inc. is the broker of record or accounts where the beneficial shareholder is a customer of Ameriprise Financial Services, Inc., for which the Transfer Agent receives a per account fee). Effective October 1, 2016, the Fund pays the Transfer Agent a fee for shareholder services based on the number of accounts or on a percentage of the average aggregate value of the Fund's shares maintained in omnibus accounts up to the lesser of the amount charged by the servicing agent or a cap established by the Board from time to time.
The Transfer Agent also receives compensation from the Fund for various shareholder services and
Semiannual Report 2016
35
COLUMBIA MORTGAGE OPPORTUNITIES FUND
NOTES TO FINANCIAL STATEMENTS (continued)
November 30, 2016 (Unaudited)
reimbursements for certain out-of-pocket fees. Effective January 1, 2017, total transfer agency fees for Class R5 shares are subject to an annual limitation of not more than 0.075% of the average daily net assets attributable to Class R5 shares. Total transfer agency fees for Class I shares are subject to an annual limitation of not more than 0.025% of the average daily net assets attributable to Class I shares. Prior to January 1, 2017, total transfer agency fees for Class R5 shares were subject to an annual limitation of not more than 0.05% of the average daily net assets attributable to Class R5 shares. Class I shares did not pay transfer agency fees.
For the six months ended November 30, 2016, the Fund's annualized effective transfer agency fee rates as a percentage of average daily net assets of each class were as follows:
Class A | | | 0.13 | % | |
Class C | | | 0.13 | | |
Class R4 | | | 0.13 | | |
Class R5 | | | 0.05 | | |
Class W | | | 0.12 | | |
Class Z | | | 0.13 | | |
An annual minimum account balance fee of $20 may apply to certain accounts with a value below the applicable share class's initial minimum investment requirements to reduce the impact of small accounts on transfer agency fees. These minimum account balance fees are remitted to the Fund and recorded as part of expense reductions in the Statement of Operations. For the six months ended November 30, 2016, no minimum account balance fees were charged by the Fund.
Distribution and Service Fees
The Fund has an agreement with Columbia Management Investment Distributors, Inc. (the Distributor), an affiliate of the Investment Manager and a wholly-owned subsidiary of Ameriprise Financial, for distribution and shareholder services. Under a Plan and Agreement of Distribution, the Fund pays a fee at an annual rate of up to 0.25% of the Fund's average daily net assets attributable to Class A and Class W shares and a fee at an annual rate of up to 1.00% of the Fund's average daily net assets attributable to Class C shares. For Class C shares, of the 1.00% fee, up to 0.75% is reimbursed for distribution expenses.
The amount of distribution and shareholder services expenses incurred by the Distributor and not yet
reimbursed (unreimbursed expense) was approximately $11,000 for Class C shares. These amounts are based on the most recent information available as of September 30, 2016, and may be recovered from future payments under the distribution plan or CDSCs. To the extent the unreimbursed expense has been fully recovered, the distribution and/or shareholder services fee is reduced.
Sales Charges
Sales charges, including front-end charges and CDSCs, received by the Distributor for distributing Fund shares were $7,895 for Class A and $250 for Class C shares for the six months ended November 30, 2016.
Expenses Waived/Reimbursed by the Investment Manager and its Affiliates
The Investment Manager and certain of its affiliates have contractually agreed to waive fees and/or reimburse expenses (excluding certain fees and expenses described below) for the periods disclosed below, unless sooner terminated at the sole discretion of the Board, so that the Fund's net operating expenses, after giving effect to fees waived/expenses reimbursed and any balance credits and/or overdraft charges from the Fund's custodian, do not exceed the following annual rates as a percentage of the class' average daily net assets:
| | | October 1, 2016
Through
September 30, 2017 | | Prior to
October 1, 2016 | |
Class A | | | 1.00 | % | | | 1.00 | % | |
Class C | | | 1.75 | | | | 1.75 | | |
Class I | | | 0.65 | | | | 0.60 | | |
Class R4 | | | 0.75 | | | | 0.75 | | |
Class R5 | | | 0.70 | | | | 0.65 | | |
Class W | | | 1.00 | | | | 1.00 | | |
Class Z | | | 0.75 | | | | 0.75 | | |
Under the agreement governing these fee waivers and/or expense reimbursement arrangements, the following fees and expenses are excluded from the waiver/reimbursement commitment, and therefore will be paid by the Fund, if applicable: taxes (including foreign transaction taxes), expenses associated with investments in affiliated and non-affiliated pooled investment vehicles (including mutual funds and exchange-traded funds), transaction costs and brokerage commissions, costs related to any securities lending program, dividend and interest expenses associated with securities sold short, inverse floater program fees and
Semiannual Report 2016
36
COLUMBIA MORTGAGE OPPORTUNITIES FUND
NOTES TO FINANCIAL STATEMENTS (continued)
November 30, 2016 (Unaudited)
expenses, transaction charges and interest on borrowed money, interest, infrequent and/or unusual expenses and any other expenses the exclusion of which is specifically approved by the Board. This agreement may be modified or amended only with approval from the Investment Manager, certain of its affiliates and the Fund. Any fees waived and/or expenses reimbursed under the expense reimbursement arrangements described above are not recoverable by the Investment Manager or its affiliates in future periods.
Note 4. Federal Tax Information
The timing and character of income and capital gain distributions are determined in accordance with income tax regulations, which may differ from GAAP because of temporary or permanent book to tax differences.
At November 30, 2016, the cost of investments for federal income tax purposes was approximately $387,292,000 and the aggregate gross approximate unrealized appreciation and depreciation based on that cost was:
Unrealized appreciation | | $ | 8,057,000 | | |
Unrealized depreciation | | | (8,862,000 | ) | |
Net unrealized depreciation | | $ | (805,000 | ) | |
Management of the Fund has concluded that there are no significant uncertain tax positions in the Fund that would require recognition in the financial statements. However, management's conclusion may be subject to review and adjustment at a later date based on factors including, but not limited to, new tax laws, regulations, and administrative interpretations (including relevant court decisions). Generally, the Fund's federal tax returns for the prior three fiscal years remain subject to examination by the Internal Revenue Service.
Note 5. Portfolio Information
The cost of purchases and proceeds from sales of securities, excluding short-term investments and derivatives, if any, aggregated to $1,274,352,423 and $1,315,110,610, respectively, for the six months ended November 30, 2016, of which $1,145,928,516 and $1,186,517,070, respectively, were U.S. government securities. The amount of purchase and sale activity impacts the portfolio turnover rate reported in the Financial Highlights.
Note 6. Affiliated Money Market Fund
The Fund invests in Columbia Short-Term Cash Fund, an affiliated money market fund established for the
exclusive use by the Fund and other affiliated funds (the Affiliated MMF). The income earned by the Fund from such investments is included as Dividends — affiliated issuers in the Statement of Operations. As an investing fund, the Fund indirectly bears its proportionate share of the expenses of the Affiliated MMF. Effective October 1, 2016, the Affiliated MMF prices its shares with a floating net asset value (NAV) and no longer seeks to maintain a stable NAV. In addition, the Board of the Affiliated MMF may impose a fee on redemptions (sometimes referred to as a liquidity fee) or temporarily suspend redemptions (sometimes referred to as imposing a redemption gate) in the event its liquidity falls below regulatory limits.
Note 7. Line of Credit
The Fund has access to a revolving credit facility with a syndicate of banks led by Citibank, N.A., HSBC Bank USA, N.A. and JPMorgan Chase Bank, N.A. whereby the Fund may borrow for the temporary funding of shareholder redemptions or for other temporary or emergency purposes. The credit facility agreement, which is a collective agreement between the Fund and certain other funds managed by the Investment Manager, severally and not jointly, that permits collective borrowings up to $1 billion. Interest is charged to each participating fund based on its borrowings at a rate equal to the higher of (i) the overnight federal funds rate plus 1.00% or (ii) the one-month LIBOR rate plus 1.00%. Each borrowing under the credit facility matures no later than 60 days after the date of borrowing. The Fund also pays a commitment fee equal to its pro rata share of the amount of the credit facility at a rate of 0.15% per annum. The commitment fee is included in other expenses in the Statement of Operations.
The Fund had no borrowings during the six months ended November 30, 2016.
Note 8. Significant Risks
Shareholder Concentration Risk
At November 30, 2016, affiliated shareholders of record owned 95.4% of the outstanding shares of the Fund in one or more accounts. Subscription and redemption activity by concentrated accounts may have a significant effect on the operations of the Fund. In the case of a large redemption, the Fund may be forced to sell investments at inopportune times, including its liquid or more liquid positions, resulting in Fund losses and the Fund holding a higher percentage of less liquid or illiquid securities. Large redemptions could result in decreased
Semiannual Report 2016
37
COLUMBIA MORTGAGE OPPORTUNITIES FUND
NOTES TO FINANCIAL STATEMENTS (continued)
November 30, 2016 (Unaudited)
economies of scale and increased operating expenses for non-redeeming Fund shareholders.
Derivatives Risk
Losses involving derivative instruments may be substantial, because a relatively small price movement in the underlying security(ies), commodity, currency or index or other instrument or asset may result in a substantial loss for the Fund. In addition to the potential for increased losses, the use of derivative instruments may lead to increased volatility within the Fund. Derivatives will typically increase the Fund's exposure to principal risks to which it is otherwise exposed, and may expose the Fund to additional risks, including correlation risk, counterparty risk, hedging risk, leverage risk and liquidity risk.
Credit Risk
Credit risk is the risk that the value of debt securities in the Fund's portfolio may decline because the issuer may default and fail to pay interest or repay principal when due. Rating agencies assign credit ratings to debt securities to indicate their credit risk. Lower rated or unrated debt securities held by the Fund may present increased credit risk as compared to higher-rated debt securities.
Interest Rate Risk
Interest rate risk is the risk of losses attributable to changes in interest rates. In general, if prevailing interest rates rise, the values of debt securities tend to fall, and if interest rates fall, the values of debt securities tend to rise. Actions by governments and central banking authorities can result in increases in interest rates. Increasing interest rates may negatively affect the value of debt securities held by the Fund, resulting in a negative impact on the Fund's performance and net asset value per share. In general, the longer the maturity or duration of a debt security, the greater its sensitivity to changes in interest rates.
Liquidity Risk
Liquidity risk is the risk associated with a lack of marketability of investments which may make it difficult to sell the investment at a desirable time or price. Changing regulatory, market or other conditions or environments (for example, the interest rate or credit environments) may adversely affect the liquidity of the Fund's investments. The Fund may have to accept a lower selling price for the holding, sell other investments, or forego another, more appealing investment opportunity. Generally, the less liquid the market at the time the Fund sells a portfolio investment, the greater the risk of loss or
decline of value to the Fund. A less liquid market can lead to an increase in Fund redemptions, which may negatively impact Fund performance and net asset value per share, including, for example, if the Fund is forced to sell securities in a down market.
High-Yield Investments Risk
Securities and other debt instruments held by the Fund that are rated below investment grade (commonly called "high-yield" or "junk" bonds) and unrated debt instruments of comparable quality expose the Fund to a greater risk of loss of principal and income than a fund that invests solely or primarily in investment grade securities. In addition, these investments have greater price fluctuations, are less liquid and are more likely to experience a default than higher-rated debt instruments. High-yield debt instruments are considered to be predominantly speculative with respect to the issuer's capacity to pay interest and repay principal.
Mortgage- and Other Asset-Backed Securities Risk
The value of any mortgage-backed and other asset-backed securities held by the Fund may be affected by, among other things, changes or perceived changes in: interest rates; factors concerning the interests in and structure of the issuer or the originator of the mortgages or other assets; the creditworthiness of the entities that provide any supporting letters of credit, surety bonds or other credit enhancements; or the market's assessment of the quality of underlying assets. Payment of principal and interest on some mortgage-backed securities (but not the market value of the securities themselves) may be guaranteed by the full faith and credit of a particular U.S. Government agency, authority, enterprise or instrumentality, and some, but not all, are also insured or guaranteed by the U.S. Government. Mortgage-backed securities issued by non-governmental issuers (such as commercial banks, savings and loan institutions, private mortgage insurance companies, mortgage bankers and other secondary market issuers) may entail greater risk than obligations guaranteed by the U.S. Government. Mortgage- and other asset-backed securities are subject to prepayment risk, which is the possibility that the underlying mortgage or other asset may be refinanced or prepaid prior to maturity during periods of declining or low interest rates, causing the Fund to have to reinvest the money received in securities that have lower yields. Rising or high interest rates tend to extend the duration of mortgage- and other asset-backed securities, making their prices more volatile and more sensitive to changes in interest rates.
Semiannual Report 2016
38
COLUMBIA MORTGAGE OPPORTUNITIES FUND
NOTES TO FINANCIAL STATEMENTS (continued)
November 30, 2016 (Unaudited)
Non-Diversification Risk
A non-diversified fund is permitted to invest a greater percentage of its total assets in fewer issuers than a diversified fund. The Fund may, therefore, have a greater risk of loss from a few issuers than a similar fund that invests more broadly.
Note 9. Subsequent Events
Management has evaluated the events and transactions that have occurred through the date the financial statements were issued and noted no items requiring adjustment of the financial statements or additional disclosure.
Note 10. Information Regarding Pending and Settled Legal Proceedings
Ameriprise Financial and certain of its affiliates have historically been involved in a number of legal, arbitration and regulatory proceedings, including routine litigation, class actions, and governmental actions, concerning matters arising in connection with the conduct of their business activities. Ameriprise Financial believes that the Funds are not currently the subject of, and that neither Ameriprise Financial nor any of its affiliates are the subject of, any pending legal, arbitration or regulatory proceedings that are likely to have a material adverse effect on the Funds or the ability of Ameriprise Financial or its affiliates to perform under their contracts with the Funds. Ameriprise Financial is required to make quarterly (10-Q), annual (10-K) and, as necessary, 8-K filings with the Securities and Exchange Commission (SEC) on legal and regulatory matters that relate to Ameriprise Financial and its affiliates. Copies of these filings may be obtained by accessing the SEC website at www.sec.gov.
There can be no assurance that these matters, or the adverse publicity associated with them, will not result in increased fund redemptions, reduced sale of fund shares or other adverse consequences to the Funds. Further, although we believe proceedings are not likely to have a material adverse effect on the Funds or the ability of Ameriprise Financial or its affiliates to perform under their contracts with the Funds, these proceedings are subject to uncertainties and, as such, we are unable to estimate the possible loss or range of loss that may result. An adverse outcome in one or more of these proceedings could result in adverse judgments, settlements, fines, penalties or other relief that could have a material adverse effect on the consolidated financial condition or results of operations of Ameriprise Financial.
Semiannual Report 2016
39
COLUMBIA MORTGAGE OPPORTUNITIES FUND
APPROVAL OF MANAGEMENT AGREEMENT
Columbia Management Investment Advisers, LLC (Columbia Threadneedle or the Investment Manager, and together with its domestic and global affiliates, Columbia Threadneedle Investments), a wholly-owned subsidiary of Ameriprise Financial, Inc. (Ameriprise Financial), serves as the investment manager to Columbia Mortgage Opportunities Fund (the Fund). Under a management agreement (the Management Agreement), Columbia Threadneedle provides investment advice and other services to the Fund and other funds distributed by Columbia Management Investment Distributors, Inc. (collectively, the Funds).
On an annual basis, the Fund's Board of Trustees (the Board), including the independent Board members (the Independent Trustees), considers renewal of the Management Agreement. Columbia Threadneedle prepared detailed reports for the Board and its Contracts Committee in February, March and April 2016, including reports providing the results of analyses performed by an independent organization, Broadridge Financial Solutions, Inc. (Broadridge), and a comprehensive response to items of information requested by independent legal counsel to the Independent Trustees (Independent Legal Counsel) in a letter to the Investment Manager, to assist the Board in making this determination. Many of the materials presented in February, March and April were first supplied in draft form to designated independent Board representatives, i.e., Independent Legal Counsel, the Chair of the Board and/or the Chair of the Contracts Committee, and the final materials were revised to contain information reflective of discussion and subsequent requests made by the Contracts Committee. In addition, throughout the year, the Board (or its committees) regularly meets with portfolio management teams and senior management personnel and reviews information prepared by Columbia Threadneedle addressing the services Columbia Threadneedle provides and Fund performance. The Board also accords appropriate weight to the work, deliberations and conclusions of the various committees, such as the Contracts Committee, the Investment Review Committee and the Compliance Committee in determining whether to continue the Management Agreement.
The Board, at its June 13-15, 2016 in-person Board meeting (the June Meeting), considered the renewal of the Management Agreement for an additional one-year term. At the June Meeting, Independent Legal Counsel reviewed with the Independent Trustees various factors relevant to the Board's consideration of management agreements and the Board's legal responsibilities related to such consideration. Following an analysis and discussion of the factors identified below, the Board, including all of the Independent Trustees, approved the renewal of the Management Agreement.
Nature, Extent and Quality of Services Provided by Columbia Threadneedle
The Independent Trustees analyzed various reports and presentations they had received detailing the services performed by Columbia Threadneedle, as well as its organization, expertise, resources and capabilities.
The Independent Trustees specifically considered many developments during the past year concerning the services provided by Columbia Threadneedle, including, in particular, the relatively recent change in the leadership of equity department oversight, improvements in technology research and the use of research analysts' model portfolios to highlight best ideas and improve implementation. The Independent Trustees further noted the restructured investment risk management department and its additional resources, including the new head of multi-asset investment risk. They also observed the relatively recent 5P leadership transition, and the additional staff and resources dedicated to the 5P team. The Board also noted the broad scope of services provided by Columbia Threadneedle to each Fund, including, among other services, investment, risk and compliance oversight. The Board also took into account the information it received concerning Columbia Threadneedle's ability to attract and retain key portfolio management personnel.
In connection with the Board's evaluation of the overall package of services provided by Columbia Threadneedle, the Board also considered the nature, quality and range of administrative services provided to the Fund by Columbia Threadneedle, as well as the achievements in 2015 in the performance of administrative services, and noted the various enhancements anticipated for 2016. In evaluating the quality of services provided under the Management Agreement, the Independent Trustees also took into account the organization and strength of the Fund's and its service providers' compliance programs. In addition, the Board reviewed the financial condition of Columbia Threadneedle and its affiliates and each entity's ability to carry out its responsibilities under the
Semiannual Report 2016
40
COLUMBIA MORTGAGE OPPORTUNITIES FUND
APPROVAL OF MANAGEMENT AGREEMENT (continued)
Management Agreement and the Fund's other service agreements with affiliates of Ameriprise Financial, observing the financial strength of Ameriprise Financial, with its solid balance sheet.
The Board also discussed the acceptability of the terms of the Management Agreement (including the relatively broad scope of services required to be performed by Columbia Threadneedle), noting that no material changes are proposed from the form of agreement previously approved. They also noted the wide array of legal and compliance services provided to the Funds. It was also observed that the services being performed under the Management Agreement were of a reasonably high quality.
Based on the foregoing, and based on other information received (both oral and written, including the information on investment performance referenced below) and other considerations, the Board concluded that Columbia Threadneedle and its affiliates are in a position to continue to provide a high quality and level of services to the Fund.
Investment Performance
For purposes of evaluating the nature, extent and quality of services provided under the Management Agreement, the Board carefully reviewed the investment performance of the Fund. In this regard, the Board considered detailed reports providing the results of analyses performed by an independent organization showing, for various periods, the performance of the Fund, the performance of a benchmark index, the percentage ranking of the Fund among its comparison group and the net assets of the Fund. The Board observed that the Fund's investment performance met expectations.
Comparative Fees, Costs of Services Provided and the Profits Realized by Columbia Threadneedle and its Affiliates from their Relationships with the Fund
The Board reviewed comparative fees and the costs of services provided under the Management Agreement. The Board members considered detailed comparative information set forth in an annual report on fees and expenses, including, among other things, data (based on analyses conducted by an independent organization) showing a comparison of the Fund's expenses with median expenses paid by funds in its comparative peer universe, as well as data showing the Fund's contribution to Columbia Threadneedle's profitability.
The Board considered the reports of its independent fee consultant, JDL Consultants, LLC (JDL), which assisted in its analysis of the Funds' performance and expenses, the reasonableness of the Funds' fee rates, the reasonableness of Columbia Threadneedle's profitability, and JDL's conclusion that the management fees being charged to the Fund are reasonable. The Board accorded particular weight to the notion that the level of fees should generally reflect a rational pricing model applied consistently across the various product lines in the Fund family, while assuring that the overall fees for each Fund (with certain defined exceptions) are generally in line with the "pricing philosophy" currently in effect (i.e., that the total expense ratio of the Fund is generally no higher than the median expense ratio of funds in the comparison universe of the Fund). The Board took into account that the Fund's total expense ratio (after considering proposed expense caps/waivers) was below the peer universe's median expense ratio shown in the reports. Based on its review, the Board concluded that the Fund's management fee was fair and reasonable in light of the extent and quality of services that the Fund receives.
The Board also considered the expected profitability of Columbia Threadneedle and its affiliates in connection with Columbia Threadneedle providing management services to the Fund. In this regard, the Independent Trustees referred to their detailed analysis of the Profitability Report, discussing the profitability to Columbia Threadneedle and Ameriprise Financial from managing, operating and distributing the Funds. The Board took into account JDL's conclusion that 2015 Columbia Threadneedle profitability, relative to industry competitors, was reasonable. It also considered that in 2015 the Board had concluded that 2014 profitability was reasonable and that Columbia Threadneedle generated 2015 profitability that only slightly exceeded 2014 levels. It also took into account the indirect economic benefits flowing to Columbia Threadneedle or its affiliates in connection with managing or distributing the Funds, such as the enhanced ability to offer various other financial products to Ameriprise Financial customers, soft dollar benefits and overall reputational advantages. The Board noted that the fees paid by the Fund should permit the Investment Manager to offer competitive compensation to its
Semiannual Report 2016
41
COLUMBIA MORTGAGE OPPORTUNITIES FUND
APPROVAL OF MANAGEMENT AGREEMENT (continued)
personnel, make necessary investments in its business and earn an appropriate profit. The Board concluded that profitability levels were reasonable.
Economies of Scale to be Realized
The Board also considered the economies of scale that might be realized by Columbia Threadneedle as the Fund grows and took note of the extent to which Fund shareholders might also benefit from such growth. In this regard, the Board took into account that management fees decline as Fund assets exceed various breakpoints, all of which have not been surpassed. The Board concluded that the breakpoints in the management fee rate schedule satisfactorily provides for the sharing of economies of scale, as they allow for adequate opportunity for shareholders to realize benefits (fee breaks) as Fund assets grow.
Based on the foregoing, the Board, including all of the Independent Trustees, concluded that the management fees were fair and reasonable in light of the extent and quality of services provided. In reaching this conclusion, no single factor was determinative. On June 15, 2016, the Board, including all of the Independent Trustees, approved the renewal of the Management Agreement.
Semiannual Report 2016
42
COLUMBIA MORTGAGE OPPORTUNITIES FUND
IMPORTANT INFORMATION ABOUT THIS REPORT
Each fund mails one shareholder report to each shareholder address. If you would like more than one report, please call shareholder services at 800.345.6611 and additional reports will be sent to you.
The policy of the Board is to vote the proxies of the companies in which each fund holds investments consistent with the procedures as stated in the Statement of Additional Information (SAI). You may obtain a copy of the SAI without charge by calling 800.345.6611; contacting your financial intermediary; visiting investor.columbiathreadneedleus.com; or searching the website of the Securities and Exchange Commission (SEC) at sec.gov. Information regarding how each fund voted proxies relating to portfolio securities is filed with the SEC by August 31st for the most recent 12-month period ending June 30th of that year, and is available without charge by visiting investor.columbiathreadneedleus.com, or searching the website of the SEC at sec.gov.
Each fund files a complete schedule of portfolio holdings with the SEC for the first and third quarters of each fiscal year on Form N-Q. Each fund's Form N-Q is available on the SEC's website at sec.gov and may be reviewed and copied at the SEC's Public Reference Room in Washington, D.C. Information on the operation of the Public Reference Room may be obtained by calling 800.SEC.0330. Each fund's complete schedule of portfolio holdings, as filed on Form N-Q, can also be obtained without charge, upon request, by calling 800.345.6611.
Semiannual Report 2016
43
Columbia Mortgage Opportunities Fund
P.O. Box 8081
Boston, MA 02266-8081

Please read and consider the investment objectives, risks, charges and expenses for any fund carefully before investing. For a prospectus and summary prospectus, which contains this and other important information about the Fund, go to investor.columbiathreadneedleus.com. The Fund is distributed by Columbia Management Investment Distributors, Inc., member FINRA, and managed by Columbia Management Investment Advisers, LLC.
Columbia Threadneedle Investments (Columbia Threadneedle) is the global brand name of the Columbia and Threadneedle group of companies.
All rights reserved. Columbia Management Investment Distributors, Inc., 225 Franklin Street, Boston, MA 02110-2804
© 2017 Columbia Management Investment Advisers, LLC.
investor.columbiathreadneedleus.com
SAR251_05_G01_(01/17)

SEMIANNUAL REPORT
November 30, 2016

COLUMBIA SELECT SMALLER-CAP VALUE FUND

ABOUT COLUMBIA THREADNEEDLE INVESTMENTS
Columbia Threadneedle Investments is a leading global asset management group that provides a broad range of investment strategies and solutions for individual, institutional and corporate clients around the world.
With more than 2,000 people, including over 450 investment professionals based in North America, Europe and Asia, we manage $460 billion* of assets across developed and emerging market equities, fixed income, asset allocation solutions and alternatives. We are the 13th largest manager of long-term mutual fund assets in the U.S.** and the 4th largest manager of retail funds in the U.K.***
Our priority is the investment success of our clients. We aim to deliver the investment outcomes they expect through an investment approach that is team-based, performance-driven and risk-aware. Our culture is dynamic and interactive. By sharing our insights across asset classes and geographies, we generate richer perspectives on global, regional and local investment landscapes. The ability to exchange and debate investment ideas in a collaborative environment enriches our teams' investment processes. More importantly, it results in better informed investment decisions for our clients.
Columbia funds are distributed by Columbia Management Investment Distributors, Inc., member FINRA, and managed by Columbia Management Investment Advisers, LLC.
Columbia Threadneedle Investments (Columbia Threadneedle) is the global brand name of the Columbia and Threadneedle group of companies.
* In U.S. dollars as of June 30, 2016. Source: Ameriprise Q2 Earnings Release. Includes all assets managed by entities in the Columbia and Threadneedle group of companies. Contact us for more current data.
** Source: ICI as of June 30, 2016 for Columbia Management Investment Advisers, LLC.
*** Source: Investment Association as of March 2016 for Threadneedle Asset Management Limited.
© 2016 Columbia Management Investment Advisers, LLC. All rights reserved.
Not part of the shareholder report
 Dear Shareholders,
While emotions have run high following the outcome of the U.S. Presidential election, it remains unclear how the Trump presidency will unfold in terms of policy. We have a sense of the priorities espoused by the president-elect over the past eighteen months, but campaign priorities are not always realized and are often never pursued. What seems certain is that, while some investors have already priced expectations into the market, others have retreated, preferring instead a wait and see approach. The outcome of such behaviors appears to have created conditions ripe for ongoing market volatility.
While volatility in the financial markets can be stressful, volatility itself is not a new phenomenon. Other factors that have been at the root cause of recent volatility include uncertainty following the United Kingdom's vote to exit the European Union (Brexit), speculation around the Federal Reserve's decision to increase interest rates, divergent central bank policy and geopolitical unrest. The point is, financial markets have fluctuated for years and may be expected to continue to fluctuate — sometimes wildly. If anything, such volatility seems to be the new normal, perhaps exacerbated by access to information and development of technological tools which have enabled investors to react rapidly to real and perceived change. So what can you do?
Position your portfolio for the reality of market volatility
That there is a historical precedent for market volatility, or even an acceptance that it may persist, offers little comfort. A measured and strategic approach remains the best strategy for investors to stay on track in achieving their investment goals.
Step 1: Review your investment goals
Take this opportunity to review your investment goals and the strategies you are pursuing to achieve those goals in order to remain focused on what's important to you. It is entirely possible that your goals have changed in response either to your life situation or to changes in the market. Accept what you can't control — volatility, and focus on what you can — your investment goals and strategies.
Step 2: Reassess your risk tolerance
Sit down with your financial advisor to discuss your investment goals and strategies, as well as any changes to your tolerance for risk. Consider your investment horizon. Increased market volatility and a new investment horizon may impact the strategies that can best help you achieve your investment goals. Remember, achieving your investment goals may require a certain amount of risk. Ultimately, you must maintain vigilance in reassessing your risk tolerance and the strategies you have selected in pursuit of your investment goals, and awareness of how those strategies may react to market volatility.
Step 3: Remain calm and focus on your long-term plan
Remember, investing is about the long game. Short term events are not necessarily evidence of a longer term reality. Investors who attempt to time the market too often end up reacting to a down turn by selling low and then compounding the problem by waiting on the sidelines, ultimately missing the right opportunity to reinvest.
As long as there is a market, there will be volatility. How you respond to that volatility can make a big difference in the measure of your success as an investor. Talk to your financial advisor about how working with Columbia Threadneedle Investments may help you position your portfolio for the reality of ongoing volatility and, perhaps, even turn such volatility into investment opportunity.
Best regards,

Christopher O. Petersen
President, Columbia Funds
Investors should consider the investment objectives, risks, charges and expenses of a mutual fund carefully before investing. For a free prospectus and summary prospectus, which contains this and other important information about a fund, visit investor.columbiathreadneedleus.com. The prospectus should be read carefully before investing.
Columbia Funds are distributed by Columbia Management Investment Distributors, Inc., member FINRA, and managed by Columbia Management Investment Advisers, LLC.
© 2017 Columbia Management Investment Advisers, LLC. All rights reserved.
COLUMBIA SELECT SMALLER-CAP VALUE FUND
Fund Investment Manager
Columbia Management Investment
Advisers, LLC
225 Franklin Street
Boston, MA 02110
Fund Distributor
Columbia Management Investment
Distributors, Inc.
225 Franklin Street
Boston, MA 02110
Fund Transfer Agent
Columbia Management Investment
Services Corp.
P.O. Box 8081
Boston, MA 02266-8081
For more information about any of the funds, please visit investor.columbiathreadneedleus.com or call 800.345.6611. Customer Service Representatives are available to answer your questions Monday through Friday from 8 a.m. to 7 p.m. Eastern time.
The views expressed in this report reflect the current views of the respective parties. These views are not guarantees of future performance and involve certain risks, uncertainties and assumptions that are difficult to predict, so actual outcomes and results may differ significantly from the views expressed. These views are subject to change at any time based upon economic, market or other conditions and the respective parties disclaim any responsibility to update such views. These views may not be relied on as investment advice and, because investment decisions for a Columbia fund are based on numerous factors, may not be relied on as an indication of trading intent on behalf of any particular Columbia fund. References to specific securities should not be construed as a recommendation or investment advice.
Performance Overview | | | 3 | | |
Portfolio Overview | | | 4 | | |
Understanding Your Fund's Expenses | | | 5 | | |
Portfolio of Investments | | | 6 | | |
Statement of Assets and Liabilities | | | 10 | | |
Statement of Operations | | | 12 | | |
Statement of Changes in Net Assets | | | 13 | | |
Financial Highlights | | | 16 | | |
Notes to Financial Statements | | | 26 | | |
Approval of Management Agreement | | | 34 | | |
Important Information About This Report | | | 37 | | |
COLUMBIA SELECT SMALLER-CAP VALUE FUND
PERFORMANCE OVERVIEW
(Unaudited)
Performance Summary
n Columbia Select Smaller-Cap Value Fund (the Fund) Class A shares returned 6.52% excluding sales charges for the six-month period that ended November 30, 2016.
n The Fund underperformed its benchmark, the Russell 2000 Value Index, which returned 19.62% for the same time period.
Average Annual Total Returns (%) (for period ended November 30, 2016)
| | | Inception | | 6 Months
Cumulative | | 1 Year | | 5 Years | | 10 Years | |
Class A | | 04/25/97 | | | | | | | | | | | | | | | | | |
Excluding sales charges | | | | | | | 6.52 | | | | 1.95 | | | | 13.64 | | | | 6.56 | | |
Including sales charges | | | | | | | 0.38 | | | | -3.91 | | | | 12.30 | | | | 5.94 | | |
Class B | | 04/25/97 | | | | | | | | | | | | | | | | | |
Excluding sales charges | | | | | | | 6.17 | | | | 1.23 | | | | 12.78 | | | | 5.76 | | |
Including sales charges | | | | | | | 1.17 | | | | -3.15 | | | | 12.54 | | | | 5.76 | | |
Class C | | 05/27/99 | | | | | | | | | | | | | | | | | |
Excluding sales charges | | | | | | | 6.16 | | | | 1.23 | | | | 12.80 | | | | 5.77 | | |
Including sales charges | | | | | | | 5.16 | | | | 0.35 | | | | 12.80 | | | | 5.77 | | |
Class I* | | 08/03/09 | | | 6.73 | | | | 2.40 | | | | 14.16 | | | | 6.93 | | |
Class K* | | 08/03/09 | | | 6.59 | | | | 2.11 | | | | 13.81 | | | | 6.70 | | |
Class R | | 04/30/03 | | | 6.38 | | | | 1.71 | | | | 13.36 | | | | 6.27 | | |
Class R4* | | 11/08/12 | | | 6.64 | | | | 2.21 | | | | 13.87 | | | | 6.67 | | |
Class R5 | | 11/30/01 | | | 6.77 | | | | 2.37 | | | | 14.08 | | | | 7.06 | | |
Class Y* | | 10/01/14 | | | 6.73 | | | | 2.40 | | | | 13.84 | | | | 6.66 | | |
Class Z* | | 09/27/10 | | | 6.62 | | | | 2.19 | | | | 13.93 | | | | 6.73 | | |
Russell 2000 Value Index | | | | | | | 19.62 | | | | 19.85 | | | | 14.50 | | | | 5.92 | | |
Returns for Class A are shown with and without the maximum initial sales charge of 5.75%. Returns for Class B are shown with and without the applicable contingent deferred sales charge (CDSC) of 5.00% in the first year, declining to 1.00% in the sixth year and eliminated thereafter. Returns for Class C are shown with and without the 1.00% CDSC for the first year only. The Fund's other classes are not subject to sales charges and have limited eligibility. Please see the Fund's prospectus for details. Performance for different share classes will vary based on differences in sales charges and fees associated with each class. All results shown assume reinvestment of distributions during the period. Returns do not reflect the deduction of taxes that a shareholder may pay on Fund distributions or on the redemption of Fund shares. Performance results reflect the effect of any fee waivers or reimbursements of Fund expenses by Columbia Management Investment Advisers, LLC and/or any of its affiliates. Absent these fee waivers or expense reimbursement arrangements, performance results would have been lower.
The performance information shown represents past performance and is not a guarantee of future results. The investment return and principal value of your investment will fluctuate so that your shares, when redeemed, may be worth more or less than their original cost. Current performance may be lower or higher than the performance information shown. You may obtain performance information current to the most recent month-end by contacting your financial intermediary, visiting investor.columbiathreadneedleus.com or calling 800.345.6611.
*The returns shown for periods prior to the share class inception date (including returns for the Life of the Fund, if shown, which are since Fund inception) include the returns of the Fund's oldest share class. Since the Fund launched more than one share class at its inception, Class A shares were used. These returns are adjusted to reflect any higher class-related operating expenses of the newer share classes, as applicable. Please visit investor.columbiathreadneedleus.com/investment-products/mutual-funds/appended-performance for more information.
The Russell 2000 Value Index, an unmanaged index, measures the performance of those stocks in the Russell 2000 Index with lower price-to-book ratios and lower forecasted growth values.
Indices are not available for investment, are not professionally managed and do not reflect sales charges, fees, brokerage commissions, taxes or other expenses of investing. Securities in the Fund may not match those in an index.
Semiannual Report 2016
3
COLUMBIA SELECT SMALLER-CAP VALUE FUND
PORTFOLIO OVERVIEW
(Unaudited)
Portfolio Management
Richard Rosen
Kari Montanus
Richard Taft*
*Effective October 2016, Mr. Taft was named a Portfolio Manager of the Fund.
Morningstar Style BoxTM

The Morningstar Style BoxTM is based on a fund's portfolio holdings. For equity funds, the vertical axis shows the market capitalization of the stocks owned, and the horizontal axis shows investment style (value, blend, or growth). Information shown is based on the most recent data provided by Morningstar.
© 2017 Morningstar, Inc. All rights reserved. The Morningstar information contained herein: (1) is proprietary to Morningstar and/or its content providers; (2) may not be copied or distributed; and (3) is not warranted to be accurate, complete or timely. Neither Morningstar nor its content providers are responsible for any damages or losses arising from any use of this information.
Top Ten Holdings (%)
(at November 30, 2016) | |
Dean Foods Co. | | | 4.0 | | |
Telephone & Data Systems, Inc. | | | 3.8 | | |
United Continental Holdings, Inc. | | | 3.7 | | |
BofI Holding, Inc. | | | 3.4 | | |
CACI International, Inc., Class A | | | 3.2 | | |
Hanover Insurance Group, Inc. (The) | | | 3.1 | | |
WellCare Health Plans, Inc. | | | 3.1 | | |
Ultratech, Inc. | | | 3.0 | | |
Extreme Networks, Inc. | | | 2.9 | | |
Minerals Technologies, Inc. | | | 2.9 | | |
Percentages indicated are based upon total investments (excluding Money Market Funds).
For further detail about these holdings, please refer to the section entitled "Portfolio of Investments."
Fund holdings are as of the date given, are subject to change at any time, and are not recommendations to buy or sell any security.
Portfolio Breakdown (%)
(at November 30, 2016) | |
Common Stocks | | | 99.3 | | |
Money Market Funds | | | 0.7 | | |
Warrants | | | 0.0 | (a) | |
Total | | | 100.0 | | |
Percentages indicated are based upon total investments. The Fund's portfolio composition is subject to change.
(a) Rounds to zero.
Equity Sector Breakdown (%)
(at November 30, 2016) | |
Consumer Discretionary | | | 13.2 | | |
Consumer Staples | | | 6.5 | | |
Energy | | | 4.5 | | |
Financials | | | 20.3 | | |
Health Care | | | 12.9 | | |
Industrials | | | 11.5 | | |
Information Technology | | | 19.8 | | |
Materials | | | 5.2 | | |
Real Estate | | | 1.8 | | |
Telecommunication Services | | | 4.3 | | |
Total | | | 100.0 | | |
Percentages indicated are based upon total equity investments. The Fund's portfolio composition is subject to change.
Semiannual Report 2016
4
COLUMBIA SELECT SMALLER-CAP VALUE FUND
UNDERSTANDING YOUR FUND'S EXPENSES
(Unaudited)
As an investor, you incur two types of costs. There are transaction costs, which generally include sales charges on purchases and may include redemption fees. There are also ongoing costs, which generally include management fees, distribution and/or service fees, and other fund expenses. The following information is intended to help you understand your ongoing costs (in dollars) of investing in the Fund and to help you compare these costs with the ongoing costs of investing in other mutual funds.
Analyzing Your Fund's Expenses
To illustrate these ongoing costs, we have provided examples and calculated the expenses paid by investors in each share class of the Fund during the period. The actual and hypothetical information in the table is based on an initial investment of $1,000 at the beginning of the period indicated and held for the entire period. Expense information is calculated two ways and each method provides you with different information. The amount listed in the "Actual" column is calculated using the Fund's actual operating expenses and total return for the period. You may use the Actual information, together with the amount invested, to estimate the expenses that you paid over the period. Simply divide your account value by $1,000 (for example, an $8,600 account value divided by $1,000 = 8.6), then multiply the results by the expenses paid during the period under the "Actual" column. The amount listed in the "Hypothetical" column assumes a 5% annual rate of return before expenses (which is not the Fund's actual return) and then applies the Fund's actual expense ratio for the period to the hypothetical return. You should not use the hypothetical account values and expenses to estimate either your actual account balance at the end of the period or the expenses you paid during the period. See "Compare With Other Funds" below for details on how to use the hypothetical data.
Compare With Other Funds
Since all mutual funds are required to include the same hypothetical calculations about expenses in shareholder reports, you can use this information to compare the ongoing cost of investing in the Fund with other funds. To do so, compare the hypothetical example with the 5% hypothetical examples that appear in the shareholder reports of other funds. As you compare hypothetical examples of other funds, it is important to note that hypothetical examples are meant to highlight the ongoing costs of investing in a fund only and do not reflect any transaction costs, such as sales charges, or redemption or exchange fees. Therefore, the hypothetical calculations are useful in comparing ongoing costs only, and will not help you determine the relative total costs of owning different funds. If transaction costs were included in these calculations, your costs would be higher.
June 1, 2016 – November 30, 2016
| | | Account Value at the Beginning
of the Period ($) | | Account Value at the End of the
Period ($) | | Expenses Paid During the
Period ($) | | Fund's Annualized
Expense Ratio (%) | |
| | | Actual | | Hypothetical | | Actual | | Hypothetical | | Actual | | Hypothetical | | Actual | |
Class A | | | 1,000.00 | | | | 1,000.00 | | | | 1,065.20 | | | | 1,018.45 | | | | 6.83 | | | | 6.68 | | | | 1.32 | | |
Class B | | | 1,000.00 | | | | 1,000.00 | | | | 1,061.70 | | | | 1,014.74 | | | | 10.65 | | | | 10.40 | | | | 2.06 | | |
Class C | | | 1,000.00 | | | | 1,000.00 | | | | 1,061.60 | | | | 1,014.74 | | | | 10.65 | | | | 10.40 | | | | 2.06 | | |
Class I | | | 1,000.00 | | | | 1,000.00 | | | | 1,067.30 | | | | 1,020.56 | | | | 4.66 | | | | 4.56 | | | | 0.90 | | |
Class K | | | 1,000.00 | | | | 1,000.00 | | | | 1,065.90 | | | | 1,019.05 | | | | 6.21 | | | | 6.07 | | | | 1.20 | | |
Class R | | | 1,000.00 | | | | 1,000.00 | | | | 1,063.80 | | | | 1,017.20 | | | | 8.12 | | | | 7.94 | | | | 1.57 | | |
Class R4 | | | 1,000.00 | | | | 1,000.00 | | | | 1,066.40 | | | | 1,019.70 | | | | 5.54 | | | | 5.42 | | | | 1.07 | | |
Class R5 | | | 1,000.00 | | | | 1,000.00 | | | | 1,067.70 | | | | 1,020.31 | | | | 4.92 | | | | 4.81 | | | | 0.95 | | |
Class Y | | | 1,000.00 | | | | 1,000.00 | | | | 1,067.30 | | | | 1,020.36 | | | | 4.87 | | | | 4.76 | | | | 0.94 | | |
Class Z | | | 1,000.00 | | | | 1,000.00 | | | | 1,066.20 | | | | 1,019.70 | | | | 5.54 | | | | 5.42 | | | | 1.07 | | |
Expenses paid during the period are equal to the annualized expense ratio for each class as indicated above, multiplied by the average account value over the period and then multiplied by the number of days in the Fund's most recent fiscal half year and divided by 365.
Expenses do not include fees and expenses incurred indirectly by the Fund from its investment in underlying funds, including affiliated and non-affiliated pooled investment vehicles, such as mutual funds and exchange-traded funds.
Semiannual Report 2016
5
COLUMBIA SELECT SMALLER-CAP VALUE FUND
PORTFOLIO OF INVESTMENTS
November 30, 2016 (Unaudited)
(Percentages represent value of investments compared to net assets)
Common Stocks 99.5%
Issuer | | Shares | | Value ($) | |
CONSUMER DISCRETIONARY 13.1% | |
Auto Components 3.8% | |
American Axle & Manufacturing
Holdings, Inc.(a) | | | 650,000 | | | | 10,179,000 | | |
Motorcar Parts of America, Inc.(a) | | | 700,000 | | | | 17,122,000 | | |
Total | | | | | 27,301,000 | | |
Hotels, Restaurants & Leisure 1.8% | |
Texas Roadhouse, Inc. | | | 270,000 | | | | 12,660,300 | | |
Household Durables 5.0% | |
Beazer Homes USA, Inc.(a) | | | 585,148 | | | | 7,887,795 | | |
Lennar Corp., Class A | | | 315,000 | | | | 13,400,100 | | |
William Lyon Homes, Inc. Class A(a) | | | 700,000 | | | | 13,860,000 | | |
Total | | | | | 35,147,895 | | |
Specialty Retail 0.9% | |
Vitamin Shoppe, Inc.(a) | | | 260,000 | | | | 6,461,000 | | |
Textiles, Apparel & Luxury Goods 1.6% | |
Hanesbrands, Inc. | | | 475,000 | | | | 11,034,250 | | |
Total Consumer Discretionary | | | | �� | 92,604,445 | | |
CONSUMER STAPLES 6.4% | |
Food Products 5.7% | |
Dean Foods Co. | | | 1,400,000 | | | | 27,804,000 | | |
Snyders-Lance, Inc. | | | 2,048 | | | | 76,309 | | |
WhiteWave Foods Co. (The)(a) | | | 225,000 | | | | 12,395,250 | | |
Total | | | | | 40,275,559 | | |
Personal Products 0.7% | |
Herbalife Ltd.(a) | | | 106,000 | | | | 5,197,180 | | |
Total Consumer Staples | | | | | 45,472,739 | | |
ENERGY 4.4% | |
Energy Equipment & Services 4.4% | |
Exterran Corp.(a) | | | 460,000 | | | | 9,246,000 | | |
Superior Energy Services, Inc. | | | 725,000 | | | | 12,499,000 | | |
Tetra Technologies, Inc.(a) | | | 1,760,000 | | | | 9,556,800 | | |
Total | | | | | 31,301,800 | | |
Total Energy | | | | | 31,301,800 | | |
FINANCIALS 20.2% | |
Banks 2.2% | |
Opus Bank | | | 615,439 | | | | 15,570,607 | | |
Common Stocks (continued)
Issuer | | Shares | | Value ($) | |
Insurance 12.3% | |
Aspen Insurance Holdings Ltd. | | | 148,500 | | | | 7,566,075 | | |
Hanover Insurance Group, Inc. (The) | | | 255,000 | | | | 22,080,450 | | |
Lincoln National Corp. | | | 310,000 | | | | 19,871,000 | | |
National General Holdings Corp. | | | 750,000 | | | | 16,942,500 | | |
State National Companies, Inc. | | | 1,500,000 | | | | 20,145,000 | | |
Total | | | | | 86,605,025 | | |
Mortgage Real Estate Investment Trusts (REITs) 2.3% | |
Ladder Capital Corp., Class A | | | 1,125,099 | | | | 16,145,170 | | |
Thrifts & Mortgage Finance 3.4% | |
BofI Holding, Inc.(a) | | | 1,025,000 | | | | 24,220,750 | | |
Total Financials | | | | | 142,541,552 | | |
HEALTH CARE 12.9% | |
Biotechnology 1.9% | |
Ligand Pharmaceuticals, Inc.(a) | | | 131,500 | | | | 13,728,600 | | |
Health Care Equipment & Supplies 3.7% | |
Analogic Corp. | | | 170,000 | | | | 15,665,500 | | |
Dentsply Sirona, Inc. | | | 175,000 | | | | 10,181,500 | | |
Total | | | | | 25,847,000 | | |
Health Care Providers & Services 5.6% | |
PharMerica Corp.(a) | | | 725,000 | | | | 17,436,250 | | |
WellCare Health Plans, Inc.(a) | | | 159,000 | | | | 21,786,180 | | |
Total | | | | | 39,222,430 | | |
Pharmaceuticals 1.7% | |
Impax Laboratories, Inc.(a) | | | 835,000 | | | | 12,065,750 | | |
Total Health Care | | | | | 90,863,780 | | |
INDUSTRIALS 11.5% | |
Aerospace & Defense 2.6% | |
Cubic Corp. | | | 390,000 | | | | 18,057,000 | | |
Airlines 3.7% | |
United Continental Holdings, Inc.(a) | | | 377,213 | | | | 26,008,836 | | |
Commercial Services & Supplies 2.4% | |
Waste Connections, Inc. | | | 225,000 | | | | 17,199,000 | | |
Road & Rail 2.8% | |
Swift Transportation Co.(a) | | | 800,000 | | | | 19,976,000 | | |
Total Industrials | | | | | 81,240,836 | | |
The accompanying Notes to Financial Statements are an integral part of this statement.
Semiannual Report 2016
6
COLUMBIA SELECT SMALLER-CAP VALUE FUND
PORTFOLIO OF INVESTMENTS (continued)
November 30, 2016 (Unaudited)
Common Stocks (continued)
Issuer | | Shares | | Value ($) | |
INFORMATION TECHNOLOGY 19.7% | |
Communications Equipment 6.7% | |
Calix, Inc.(a)(b) | | | 2,629,041 | | | | 19,849,260 | | |
Extreme Networks, Inc.(a) | | | 4,800,000 | | | | 20,304,000 | | |
Viavi Solutions, Inc.(a) | | | 950,000 | | | | 7,457,500 | | |
Total | | | | | 47,610,760 | | |
Electronic Equipment, Instruments & Components 1.5% | |
Belden, Inc. | | | 145,000 | | | | 10,715,500 | | |
IT Services 6.1% | |
CACI International, Inc., Class A(a) | | | 175,441 | | | | 22,702,065 | | |
EPAM Systems, Inc.(a) | | | 306,715 | | | | 20,212,519 | | |
Total | | | | | 42,914,584 | | |
Semiconductors & Semiconductor Equipment 2.9% | |
Ultratech, Inc.(a) | | | 905,549 | | | | 20,755,183 | | |
Software 2.5% | |
BroadSoft, Inc.(a) | | | 415,000 | | | | 17,222,500 | | |
Total Information Technology | | | | | 139,218,527 | | |
MATERIALS 5.2% | |
Chemicals 2.9% | |
Minerals Technologies, Inc. | | | 250,000 | | | | 20,250,000 | | |
Containers & Packaging 2.3% | |
Owens-Illinois, Inc.(a) | | | 900,000 | | | | 16,533,000 | | |
Total Materials | | | | | 36,783,000 | | |
REAL ESTATE 1.8% | |
Equity Real Estate Investment Trusts (REITs) 1.8% | |
Gaming and Leisure Properties, Inc. | | | 425,000 | | | | 12,966,750 | | |
Total Real Estate | | | | | 12,966,750 | | |
Common Stocks (continued)
Issuer | | Shares | | Value ($) | |
TELECOMMUNICATION SERVICES 4.3% | |
Diversified Telecommunication Services 0.5% | |
Globalstar, Inc.(a) | | | 4,600,000 | | | | 3,634,000 | | |
Wireless Telecommunication Services 3.8% | |
Telephone & Data Systems, Inc. | | | 1,000,000 | | | | 26,930,000 | | |
Total Telecommunication Services | | | | | 30,564,000 | | |
Total Common Stocks
(Cost: $586,908,121) | | | | | 703,557,429 | | |
Warrants —%
INDUSTRIALS —% | |
Airlines —% | |
American Airlines Escrow(a)(c)(d) | | | 52,560 | | | | — | | |
Total Industrials | | | | | — | | |
Total Warrants
(Cost: $—) | | | | | — | | |
Money Market Funds 0.7%
| | | Shares | | Value ($) | |
Columbia Short-Term Cash Fund,
0.480%(b)(e) | | | 5,095,903 | | | | 5,096,412 | | |
Total Money Market Funds
(Cost: $5,095,903) | | | | | 5,096,412 | | |
Total Investments
(Cost: $592,004,024) | | | | | 708,653,841 | | |
Other Assets & Liabilities, Net | | | | | (1,149,435 | ) | |
Net Assets | | | | | 707,504,406 | | |
Notes to Portfolio of Investments
(a) Non-income producing investment.
(b) As defined in the Investment Company Act of 1940, an affiliated company is one in which the Fund owns 5% or more of the company's outstanding voting securities, or a company which is under common ownership or control with the Fund. Holdings and transactions in these affiliated companies during the period ended November 30, 2016 are as follows:
Issuer | | Beginning
Cost ($) | | Purchase
Cost ($) | | Proceeds
From Sales ($) | | Realized
Gain (Loss) ($) | | Ending
Cost ($) | | Dividends —
Affiliated
Issuers ($) | | Value ($) | |
Columbia
Short-Term
Cash Fund | | | 18,408,562 | | | | 79,913,707 | | | | (93,225,918 | ) | | | (448 | ) | | | 5,095,903 | | | | 39,538 | | | | 5,096,412 | | |
Calix, Inc. | | | 19,971,899 | | | | — | | | | (316,873 | ) | | | (9,665 | ) | | | 19,645,361 | | | | — | | | | 19,849,260 | | |
Total | | | 38,380,461 | | | | 79,913,707 | | | | (93,542,791 | ) | | | (10,113 | ) | | | 24,741,264 | | | | 39,538 | | | | 24,945,672 | | |
The accompanying Notes to Financial Statements are an integral part of this statement.
Semiannual Report 2016
7
COLUMBIA SELECT SMALLER-CAP VALUE FUND
PORTFOLIO OF INVESTMENTS (continued)
November 30, 2016 (Unaudited)
Notes to Portfolio of Investments (continued)
(c) Negligible market value.
(d) Represents fair value as determined in good faith under procedures approved by the Board of Trustees. At November 30, 2016, the value of these securities rounds to zero, which represents less than 0.01% of net assets.
(e) The rate shown is the seven-day current annualized yield at November 30, 2016.
Fair Value Measurements
The Fund categorizes its fair value measurements according to a three-level hierarchy that maximizes the use of observable inputs and minimizes the use of unobservable inputs by prioritizing that the most observable input be used when available. Observable inputs are those that market participants would use in pricing an investment based on market data obtained from sources independent of the reporting entity. Unobservable inputs are those that reflect the Fund's assumptions about the information market participants would use in pricing an investment. An investment's level within the fair value hierarchy is based on the lowest level of any input that is deemed significant to the asset's or liability's fair value measurement. The input levels are not necessarily an indication of the risk or liquidity associated with investments at that level. For example, certain U.S. government securities are generally high quality and liquid, however, they are reflected as Level 2 because the inputs used to determine fair value may not always be quoted prices in an active market.
Fair value inputs are summarized in the three broad levels listed below:
> Level 1 — Valuations based on quoted prices for investments in active markets that the Fund has the ability to access at the measurement date (including NAV for open-end mutual funds). Valuation adjustments are not applied to Level 1 investments.
> Level 2 — Valuations based on other significant observable inputs (including quoted prices for similar securities, interest rates, prepayment speeds, credit risks, etc.).
> Level 3 — Valuations based on significant unobservable inputs (including the Fund's own assumptions and judgment in determining the fair value of investments).
Inputs that are used in determining fair value of an investment may include price information, credit data, volatility statistics, and other factors. These inputs can be either observable or unobservable. The availability of observable inputs can vary between investments, and is affected by various factors such as the type of investment, and the volume and level of activity for that investment or similar investments in the marketplace. The inputs will be considered by the Investment Manager, along with any other relevant factors in the calculation of an investment's fair value. The Fund uses prices and inputs that are current as of the measurement date, which may include periods of market dislocations. During these periods, the availability of prices and inputs may be reduced for many investments. This condition could cause an investment to be reclassified between the various levels within the hierarchy.
Certain investments that have been measured at fair value using the net asset value per share (NAV) (or its equivalent) are not categorized in the fair value hierarchy. The fair value amounts presented in the table are intended to reconcile the fair value hierarchy to the amounts presented in the Portfolio of Investments. The Columbia Short-Term Cash Fund seeks to provide shareholders with maximum current income consistent with liquidity and stability of principal. Columbia Short-Term Cash Fund prices its shares with a floating NAV and no longer seeks to maintain a stable NAV.
Investments falling into the Level 3 category are primarily supported by quoted prices from brokers and dealers participating in the market for those investments. However, these may be classified as Level 3 investments due to lack of market transparency and corroboration to support these quoted prices. Additionally, valuation models may be used as the pricing source for any remaining investments classified as Level 3. These models may rely on one or more significant unobservable inputs and/or significant assumptions by the Investment Manager. Inputs used in valuations may include, but are not limited to, financial statement analysis, capital account balances, discount rates and estimated cash flows, and comparable company data.
Under the direction of the Fund's Board of Trustees (the Board), the Investment Manager's Valuation Committee (the Committee) is responsible for overseeing the valuation procedures approved by the Board. The Committee consists of voting and non-voting members from various groups within the Investment Manager's organization, including operations and accounting, trading and investments, compliance, risk management and legal.
The Committee meets at least monthly to review and approve valuation matters, which may include a description of specific valuation determinations, data regarding pricing information received from approved pricing vendors and brokers and the results of Board-approved valuation control policies and procedures (the Policies). The Policies address, among other things, instances when market quotations are or are not readily available, including recommendations of third party pricing vendors and a determination of appropriate pricing methodologies; events that require specific valuation determinations and assessment of fair value techniques; securities with a potential for stale pricing, including those that are illiquid, restricted, or in default; and the effectiveness of third party pricing vendors, including periodic reviews of vendors. The Committee meets more frequently, as needed, to discuss additional valuation matters, which may include the need to review back-testing results, review time-sensitive information or approve related valuation actions. The Committee reports to the Board, with members of the Committee meeting with the Board at each of its regularly scheduled meetings to discuss valuation matters and actions during the period, similar to those described earlier.
The accompanying Notes to Financial Statements are an integral part of this statement.
Semiannual Report 2016
8
COLUMBIA SELECT SMALLER-CAP VALUE FUND
PORTFOLIO OF INVESTMENTS (continued)
November 30, 2016 (Unaudited)
Fair Value Measurements (continued)
For investments categorized as Level 3, the Committee monitors information similar to that described above, which may include: (i) data specific to the issuer or comparable issuers, (ii) general market or specific sector news and (iii) quoted prices and specific or similar security transactions. The Committee considers this data and any changes from prior periods in order to assess the reasonableness of observable and unobservable inputs, any assumptions or internal models used to value those securities and changes in fair value. This data is also used to corroborate, when available, information received from approved pricing vendors and brokers. Various factors impact the frequency of monitoring this information (which may occur as often as daily). However, the Committee may determine that changes to inputs, assumptions and models are not required as a result of the monitoring procedures performed.
The following table is a summary of the inputs used to value the Fund's investments at November 30, 2016:
| | | Level 1
Quoted Prices in Active
Markets for Identical
Assets ($) | | Level 2
Other Significant
Observable Inputs ($) | | Level 3
Significant
Unobservable Inputs ($) | | Total ($) | |
Investments | |
Common Stocks | |
Consumer Discretionary | | | 92,604,445 | | | | — | | | | — | | | | 92,604,445 | | |
Consumer Staples | | | 45,472,739 | | | | — | | | | — | | | | 45,472,739 | | |
Energy | | | 31,301,800 | | | | — | | | | — | | | | 31,301,800 | | |
Financials | | | 142,541,552 | | | | — | | | | — | | | | 142,541,552 | | |
Health Care | | | 90,863,780 | | | | — | | | | — | | | | 90,863,780 | | |
Industrials | | | 81,240,836 | | | | — | | | | — | | | | 81,240,836 | | |
Information Technology | | | 139,218,527 | | | | — | | | | — | | | | 139,218,527 | | |
Materials | | | 36,783,000 | | | | — | | | | — | | | | 36,783,000 | | |
Real Estate | | | 12,966,750 | | | | — | | | | — | | | | 12,966,750 | | |
Telecommunication Services | | | 30,564,000 | | | | — | | | | — | | | | 30,564,000 | | |
Total Common Stocks | | | 703,557,429 | | | | — | | | | — | | | | 703,557,429 | | |
Warrants | |
Industrials | | | — | | | | — | | | | 0 | (a) | | | 0 | (a) | |
Investments measured at net asset value | |
Money Market Funds | | | — | | | | — | | | | — | | | | 5,096,412 | | |
Total Investments | | | 703,557,429 | | | | — | | | | 0 | (a) | | | 708,653,841 | | |
(a) Rounds to zero.
See the Portfolio of Investments for all investment classifications not indicated in the table.
There were no transfers of financial assets between levels during the period.
The Fund does not hold any significant investments (greater than one percent of net assets) categorized as Level 3.
The Fund's assets assigned to the Level 3 category are valued utilizing the valuation technique deemed the most appropriate in the circumstances. Certain rights classified as Level 3 are valued using an income approach. To determine fair value for these securities, management considered estimates of future distributions related to the potential actions of the respective company's restructuring. Significant increases (decreases) to any of these inputs would result in a significantly lower (higher) fair value measurement.
The accompanying Notes to Financial Statements are an integral part of this statement.
Semiannual Report 2016
9
COLUMBIA SELECT SMALLER-CAP VALUE FUND
STATEMENT OF ASSETS AND LIABILITIES
November 30, 2016 (Unaudited)
Assets | |
Investments, at value | |
Unaffiliated issuers (identified cost $567,262,760) | | $ | 683,708,169 | | |
Affiliated issuers (identified cost $24,741,264) | | | 24,945,672 | | |
Total investments (identified cost $592,004,024) | | | 708,653,841 | | |
Receivable for: | |
Capital shares sold | | | 524,868 | | |
Dividends | | | 195,205 | | |
Foreign tax reclaims | | | 4,035 | | |
Prepaid expenses | | | 3,696 | | |
Other assets | | | 3,997 | | |
Total assets | | | 709,385,642 | | |
Liabilities | |
Payable for: | |
Investments purchased | | | 262,844 | | |
Capital shares purchased | | | 1,336,047 | | |
Management services fees | | | 16,675 | | |
Distribution and/or service fees | | | 5,044 | | |
Transfer agent fees | | | 96,402 | | |
Plan administration fees | | | 1,592 | | |
Compensation of board members | | | 71,976 | | |
Chief compliance officer expenses | | | 51 | | |
Other expenses | | | 90,605 | | |
Total liabilities | | | 1,881,236 | | |
Net assets applicable to outstanding capital stock | | $ | 707,504,406 | | |
Represented by | |
Paid-in capital | | $ | 548,671,924 | | |
Excess of distributions over net investment income | | | (3,535,917 | ) | |
Accumulated net realized gain | | | 45,718,588 | | |
Unrealized appreciation (depreciation) on: | |
Investments — unaffiliated issuers | | | 116,445,409 | | |
Investments — affiliated issuers | | | 204,408 | | |
Foreign currency translations | | | (6 | ) | |
Total — representing net assets applicable to outstanding capital stock | | $ | 707,504,406 | | |
The accompanying Notes to Financial Statements are an integral part of this statement.
Semiannual Report 2016
10
COLUMBIA SELECT SMALLER-CAP VALUE FUND
STATEMENT OF ASSETS AND LIABILITIES (continued)
November 30, 2016 (Unaudited)
Class A | |
Net assets | | $ | 534,530,541 | | |
Shares outstanding | | | 28,705,223 | | |
Net asset value per share | | $ | 18.62 | | |
Maximum offering price per share(a) | | $ | 19.76 | | |
Class B | |
Net assets | | $ | 2,921,665 | | |
Shares outstanding | | | 202,208 | | |
Net asset value per share | | $ | 14.45 | | |
Class C | |
Net assets | | $ | 40,015,651 | | |
Shares outstanding | | | 2,763,730 | | |
Net asset value per share | | $ | 14.48 | | |
Class I | |
Net assets | | $ | 14,246,921 | | |
Shares outstanding | | | 675,219 | | |
Net asset value per share | | $ | 21.10 | | |
Class K | |
Net assets | | $ | 7,322,248 | | |
Shares outstanding | | | 356,696 | | |
Net asset value per share | | $ | 20.53 | | |
Class R | |
Net assets | | $ | 12,746,870 | | |
Shares outstanding | | | 721,033 | | |
Net asset value per share | | $ | 17.68 | | |
Class R4 | |
Net assets | | $ | 4,297,549 | | |
Shares outstanding | | | 204,125 | | |
Net asset value per share | | $ | 21.05 | | |
Class R5 | |
Net assets | | $ | 9,758,897 | | |
Shares outstanding | | | 464,987 | | |
Net asset value per share | | $ | 20.99 | | |
Class Y | |
Net assets | | $ | 4,850 | | |
Shares outstanding | | | 225 | | |
Net asset value per share | | $ | 21.56 | | |
Class Z | |
Net assets | | $ | 81,659,214 | | |
Shares outstanding | | | 3,930,761 | | |
Net asset value per share | | $ | 20.77 | | |
(a) The maximum offering price per share is calculated by dividing the net asset value per share by 1.0 minus the maximum sales charge of 5.75%.
The accompanying Notes to Financial Statements are an integral part of this statement.
Semiannual Report 2016
11
COLUMBIA SELECT SMALLER-CAP VALUE FUND
STATEMENT OF OPERATIONS
Six Months Ended November 30, 2016 (Unaudited)
Net investment income | |
Income: | |
Dividends — unaffiliated issuers | | $ | 2,701,644 | | |
Dividends — affiliated issuers | | | 39,538 | | |
Foreign taxes withheld | | | (14,282 | ) | |
Total income | | | 2,726,900 | | |
Expenses: | |
Management services fees | | | 2,998,811 | | |
Distribution and/or service fees | |
Class A | | | 665,888 | | |
Class B | | | 17,311 | | |
Class C | | | 201,889 | | |
Class R | | | 31,036 | | |
Transfer agent fees | |
Class A | | | 444,873 | | |
Class B | | | 2,904 | | |
Class C | | | 33,736 | | |
Class K | | | 1,824 | | |
Class R | | | 10,359 | | |
Class R4 | | | 3,432 | | |
Class R5 | | | 2,395 | | |
Class Z | | | 64,036 | | |
Plan administration fees | |
Class K | | | 9,094 | | |
Compensation of board members | | | 12,175 | | |
Custodian fees | | | 2,800 | | |
Printing and postage fees | | | 59,184 | | |
Registration fees | | | 60,989 | | |
Audit fees | | | 14,118 | | |
Legal fees | | | 7,199 | | |
Chief compliance officer expenses | | | 51 | | |
Other | | | 13,754 | | |
Total expenses | | | 4,657,858 | | |
Expense reductions | | | (960 | ) | |
Total net expenses | | | 4,656,898 | | |
Net investment loss | | | (1,929,998 | ) | |
Realized and unrealized gain (loss) — net | |
Net realized gain (loss) on: | |
Investments — unaffiliated issuers | | | 45,784,585 | | |
Investments — affiliated issuers | | | (10,113 | ) | |
Foreign currency translations | | | (138 | ) | |
Net realized gain | | | 45,774,334 | | |
Net change in unrealized appreciation (depreciation) on: | |
Investments — unaffiliated issuers | | | (2,323,833 | ) | |
Investments — affiliated issuers | | | 2,138,835 | | |
Foreign currency translations | | | (6 | ) | |
Net change in unrealized depreciation | | | (185,004 | ) | |
Net realized and unrealized gain | | | 45,589,330 | | |
Net increase in net assets resulting from operations | | $ | 43,659,332 | | |
The accompanying Notes to Financial Statements are an integral part of this statement.
Semiannual Report 2016
12
COLUMBIA SELECT SMALLER-CAP VALUE FUND
STATEMENT OF CHANGES IN NET ASSETS
| | | Six Months Ended
November 30, 2016
(Unaudited) | | Year Ended
May 31,
2016 | |
Operations | |
Net investment loss | | $ | (1,929,998 | ) | | $ | (1,420,071 | ) | |
Net realized gain | | | 45,774,334 | | | | 38,738,396 | | |
Net change in unrealized depreciation | | | (185,004 | ) | | | (70,742,255 | ) | |
Net increase (decrease) in net assets resulting from operations | | | 43,659,332 | | | | (33,423,930 | ) | |
Distributions to shareholders | |
Net investment income | | | | | |
Net realized gains | | | | | |
Class A | | | — | | | | (38,686,955 | ) | |
Class B | | | — | | | | (374,209 | ) | |
Class C | | | — | | | | (5,180,102 | ) | |
Class I | | | — | | | | (1,797,671 | ) | |
Class K | | | — | | | | (671,669 | ) | |
Class R | | | — | | | | (1,192,424 | ) | |
Class R4 | | | — | | | | (148,808 | ) | |
Class R5 | | | — | | | | (352,009 | ) | |
Class Y | | | — | | | | (231 | ) | |
Class Z | | | — | | | | (1,981,142 | ) | |
Total distributions to shareholders | | | — | | | | (50,385,220 | ) | |
Increase (decrease) in net assets from capital stock activity | | | (54,989,796 | ) | | | 294,071,608 | | |
Total increase (decrease) in net assets | | | (11,330,464 | ) | | | 210,262,458 | | |
Net assets at beginning of period | | | 718,834,870 | | | | 508,572,412 | | |
Net assets at end of period | | $ | 707,504,406 | | | $ | 718,834,870 | | |
Excess of distributions over net investment income | | $ | (3,535,917 | ) | | $ | (1,605,919 | ) | |
The accompanying Notes to Financial Statements are an integral part of this statement.
Semiannual Report 2016
13
COLUMBIA SELECT SMALLER-CAP VALUE FUND
STATEMENT OF CHANGES IN NET ASSETS (continued)
| | | Six Months Ended November 30, 2016
(Unaudited) | | Year Ended May 31, 2016 | |
| | | Shares | | Dollars ($) | | Shares | | Dollars ($) | |
Capital stock activity | |
Class A shares | |
Subscriptions(a) | | | 504,790 | | | | 8,905,276 | | | | 1,755,651 | | | | 32,875,134 | | |
Fund reorganization | | | — | | | | — | | | | 12,043,498 | | | | 205,510,234 | | |
Distributions reinvested | | | — | | | | — | | | | 2,139,137 | | | | 37,413,500 | | |
Redemptions | | | (3,099,078 | ) | | | (54,815,983 | ) | | | (3,267,799 | ) | | | (59,435,238 | ) | |
Net increase (decrease) | | | (2,594,288 | ) | | | (45,910,707 | ) | | | 12,670,487 | | | | 216,363,630 | | |
Class B shares | |
Subscriptions | | | 830 | | | | 11,536 | | | | 6,334 | | | | 88,529 | | |
Fund reorganization | | | — | | | | — | | | | 152,198 | | | | 2,021,857 | | |
Distributions reinvested | | | — | | | | — | | �� | | 27,295 | | | | 373,116 | | |
Redemptions(a) | | | (97,032 | ) | | | (1,338,013 | ) | | | (112,896 | ) | | | (1,639,308 | ) | |
Net increase (decrease) | | | (96,202 | ) | | | (1,326,477 | ) | | | 72,931 | | | | 844,194 | | |
Class C shares | |
Subscriptions | | | 53,054 | | | | 731,142 | | | | 311,446 | | | | 4,606,907 | | |
Fund reorganization | | | — | | | | — | | | | 600,175 | | | | 7,994,231 | | |
Distributions reinvested | | | — | | | | — | | | | 324,509 | | | | 4,445,775 | | |
Redemptions | | | (382,602 | ) | | | (5,282,890 | ) | | | (684,855 | ) | | | (9,725,429 | ) | |
Net increase (decrease) | | | (329,548 | ) | | | (4,551,748 | ) | | | 551,275 | | | | 7,321,484 | | |
Class I shares | |
Subscriptions | | | 183 | | | | 3,633 | | | | 28,276 | | | | 556,252 | | |
Fund reorganization | | | — | | | | — | | | | 707,392 | | | | 13,648,001 | | |
Distributions reinvested | | | — | | | | — | | | | 91,053 | | | | 1,797,384 | | |
Redemptions | | | (70,806 | ) | | | (1,436,182 | ) | | | (1,027,365 | ) | | | (19,415,252 | ) | |
Net decrease | | | (70,623 | ) | | | (1,432,549 | ) | | | (200,644 | ) | | | (3,413,615 | ) | |
Class K shares | |
Subscriptions | | | 16,236 | | | | 316,824 | | | | 56,832 | | | | 1,135,521 | | |
Fund reorganization | | | — | | | | — | | | | 51,189 | | | | 962,788 | | |
Distributions reinvested | | | — | | | | — | | | | 34,860 | | | | 671,391 | | |
Redemptions | | | (64,682 | ) | | | (1,260,851 | ) | | | (52,508 | ) | | | (1,058,568 | ) | |
Net increase (decrease) | | | (48,446 | ) | | | (944,027 | ) | | | 90,373 | | | | 1,711,132 | | |
Class R shares | |
Subscriptions | | | 68,023 | | | | 1,143,875 | | | | 271,194 | | | | 4,718,515 | | |
Fund reorganization | | | — | | | | — | | | | 165,788 | | | | 2,691,341 | | |
Distributions reinvested | | | — | | | | — | | | | 35,263 | | | | 586,776 | | |
Redemptions | | | (92,459 | ) | | | (1,550,091 | ) | | | (302,027 | ) | | | (5,292,023 | ) | |
Net increase (decrease) | | | (24,436 | ) | | | (406,216 | ) | | | 170,218 | | | | 2,704,609 | | |
The accompanying Notes to Financial Statements are an integral part of this statement.
Semiannual Report 2016
14
COLUMBIA SELECT SMALLER-CAP VALUE FUND
STATEMENT OF CHANGES IN NET ASSETS (continued)
| | | Six Months Ended November 30, 2016
(Unaudited) | | Year Ended May 31, 2016 | |
| | | Shares | | Dollars ($) | | Shares | | Dollars ($) | |
Capital stock activity (continued) | |
Class R4 shares | |
Subscriptions | | | 52,844 | | | | 1,052,975 | | | | 92,634 | | | | 1,899,826 | | |
Fund reorganization | | | — | | | | — | | | | 103,705 | | | | 1,997,612 | | |
Distributions reinvested | | | — | | | | — | | | | 7,535 | | | | 148,582 | | |
Redemptions | | | (58,810 | ) | | | (1,170,618 | ) | | | (14,258 | ) | | | (291,189 | ) | |
Net increase (decrease) | | | (5,966 | ) | | | (117,643 | ) | | | 189,616 | | | | 3,754,831 | | |
Class R5 shares | |
Subscriptions | | | 67,444 | | | | 1,374,559 | | | | 303,692 | | | | 5,710,601 | | |
Fund reorganization | | | — | | | | — | | | | 214,989 | | | | 4,122,745 | | |
Distributions reinvested | | | — | | | | — | | | | 17,573 | | | | 345,129 | | |
Redemptions | | | (135,194 | ) | | | (2,715,774 | ) | | | (96,023 | ) | | | (1,812,377 | ) | |
Net increase (decrease) | | | (67,750 | ) | | | (1,341,215 | ) | | | 440,231 | | | | 8,366,098 | | |
Class Y shares | |
Fund reorganization | | | — | | | | — | | | | 117 | | | | 2,304 | | |
Net increase | | | — | | | | — | | | | 117 | | | | 2,304 | | |
Class Z shares | |
Subscriptions | | | 1,082,199 | | | | 21,477,068 | | | | 4,032,601 | | | | 73,991,169 | | |
Fund reorganization | | | — | | | | — | | | | 376,355 | | | | 7,152,263 | | |
Distributions reinvested | | | — | | | | — | | | | 94,344 | | | | 1,835,931 | | |
Redemptions | | | (1,048,816 | ) | | | (20,436,282 | ) | | | (1,398,554 | ) | | | (26,562,422 | ) | |
Net increase | | | 33,383 | | | | 1,040,786 | | | | 3,104,746 | | | | 56,416,941 | | |
Total net increase (decrease) | | | (3,203,876 | ) | | | (54,989,796 | ) | | | 17,089,350 | | | | 294,071,608 | | |
(a) Includes conversions of Class B shares to Class A shares, if any. The line items from the prior year have been combined to conform to the current year presentation.
The accompanying Notes to Financial Statements are an integral part of this statement.
Semiannual Report 2016
15
COLUMBIA SELECT SMALLER-CAP VALUE FUND
The following tables are intended to help you understand the Fund's financial performance. Certain information reflects financial results for a single share of a class held for the periods shown. Per share net investment income (loss) amounts are calculated based on average shares outstanding during the period. Total return assumes reinvestment of all dividends and distributions, if any. Total return does not reflect payment of sales charges, if any. Total return and portfolio turnover are not annualized for periods of less than one year. The portfolio turnover rate is calculated without regard to purchase and sales transactions of short-term instruments and certain derivatives, if any. If such transactions were included, the Fund's portfolio turnover rate may be higher.
| | | Six Months Ended
November 30, 2016 | | Year Ended May 31, | | Year Ended
December 31, | |
Class A | | (Unaudited) | | 2016 | | 2015 | | 2014 | | 2013 | | 2012(a) | | 2011 | |
Per share data | |
Net asset value,
beginning of period | | $ | 17.48 | | | $ | 21.36 | | | $ | 21.52 | | | $ | 18.82 | | | $ | 14.31 | | | $ | 13.69 | | | $ | 15.97 | | |
Income from investment
operations: | |
Net investment loss | | | (0.05 | ) | | | (0.05 | ) | | | (0.14 | ) | | | (0.03 | ) | | | (0.11 | ) | | | (0.06 | ) | | | (0.12 | ) | |
Net realized and
unrealized gain (loss) | | | 1.19 | | | | (1.70 | ) | | | 2.28 | | | | 4.17 | | | | 5.06 | | | | 0.68 | | | | (1.40 | ) | |
Total from investment
operations | | | 1.14 | | | | (1.75 | ) | | | 2.14 | | | | 4.14 | | | | 4.95 | | | | 0.62 | | | | (1.52 | ) | |
Less distributions to
shareholders: | |
Net realized gains | | | — | | | | (2.13 | ) | | | (2.30 | ) | | | (1.44 | ) | | | (0.44 | ) | | | — | | | | (0.76 | ) | |
Total distributions to
shareholders | | | — | | | | (2.13 | ) | | | (2.30 | ) | | | (1.44 | ) | | | (0.44 | ) | | | — | | | | (0.76 | ) | |
Net asset value, end of
period | | $ | 18.62 | | | $ | 17.48 | | | $ | 21.36 | | | $ | 21.52 | | | $ | 18.82 | | | $ | 14.31 | | | $ | 13.69 | | |
Total return | | | 6.52 | % | | | (8.19 | %) | | | 11.21 | % | | | 22.30 | % | | | 35.23 | % | | | 4.53 | % | | | (9.42 | %) | |
Ratios to average
net assets(b) | |
Total gross expenses | | | 1.32 | %(c) | | | 1.36 | % | | | 1.38 | % | | | 1.41 | % | | | 1.51 | % | | | 1.48 | %(c) | | | 1.48 | % | |
Total net expenses(d) | | | 1.32 | %(c)(e) | | | 1.36 | %(e) | | | 1.38 | %(e) | | | 1.40 | %(e) | | | 1.39 | %(e) | | | 1.41 | %(c) | | | 1.42 | %(e) | |
Net investment loss | | | (0.54 | %)(c) | | | (0.26 | %) | | | (0.67 | %) | | | (0.14 | %) | | | (0.67 | %) | | | (0.87 | %)(c) | | | (0.77 | %) | |
Supplemental data | |
Net assets, end of period
(in thousands) | | $ | 534,531 | | | $ | 547,110 | | | $ | 397,847 | | | $ | 387,317 | | | $ | 325,677 | | | $ | 283,740 | | | $ | 295,973 | | |
Portfolio turnover | | | 14 | % | | | 27 | % | | | 26 | % | | | 22 | % | | | 9 | % | | | 3 | % | | | 18 | % | |
Notes to Financial Highlights
(a) For the period from January 1, 2012 to May 31, 2012. During the period, the Fund's fiscal year end was changed from December 31 to May 31.
(b) In addition to the fees and expenses that the Fund bears directly, the Fund indirectly bears a pro rata share of the fees and expenses of any other funds in which it invests. Such indirect expenses are not included in the Fund's reported expense ratios.
(c) Annualized.
(d) Total net expenses include the impact of certain fee waivers/expense reimbursements made by the Investment Manager and certain of its affiliates, if applicable.
(e) The benefits derived from expense reductions had an impact of less than 0.01%.
The accompanying Notes to Financial Statements are an integral part of this statement.
Semiannual Report 2016
16
COLUMBIA SELECT SMALLER-CAP VALUE FUND
FINANCIAL HIGHLIGHTS (continued)
| | | Six Months Ended
November 30, 2016 | | Year Ended May 31, | | Year Ended
December 31, | |
Class B | | (Unaudited) | | 2016 | | 2015 | | 2014 | | 2013 | | 2012(a) | | 2011 | |
Per share data | |
Net asset value,
beginning of period | | $ | 13.61 | | | $ | 17.27 | | | $ | 17.97 | | | $ | 16.04 | | | $ | 12.34 | | | $ | 11.84 | | | $ | 14.04 | | |
Income from investment
operations: | |
Net investment loss | | | (0.09 | ) | | | (0.15 | ) | | | (0.25 | ) | | | (0.16 | ) | | | (0.19 | ) | | | (0.09 | ) | | | (0.21 | ) | |
Net realized and
unrealized gain (loss) | | | 0.93 | | | | (1.38 | ) | | | 1.85 | | | | 3.53 | | | | 4.33 | | | | 0.59 | | | | (1.23 | ) | |
Total from investment
operations | | | 0.84 | | | | (1.53 | ) | | | 1.60 | | | | 3.37 | | | | 4.14 | | | | 0.50 | | | | (1.44 | ) | |
Less distributions to
shareholders: | |
Net realized gains | | | — | | | | (2.13 | ) | | | (2.30 | ) | | | (1.44 | ) | | | (0.44 | ) | | | — | | | | (0.76 | ) | |
Total distributions to
shareholders | | | — | | | | (2.13 | ) | | | (2.30 | ) | | | (1.44 | ) | | | (0.44 | ) | | | — | | | | (0.76 | ) | |
Net asset value, end of
period | | $ | 14.45 | | | $ | 13.61 | | | $ | 17.27 | | | $ | 17.97 | | | $ | 16.04 | | | $ | 12.34 | | | $ | 11.84 | | |
Total return | | | 6.17 | % | | | (8.90 | %) | | | 10.36 | % | | | 21.33 | % | | | 34.28 | % | | | 4.22 | % | | | (10.15 | %) | |
Ratios to average
net assets(b) | |
Total gross expenses | | | 2.06 | %(c) | | | 2.11 | % | | | 2.13 | % | | | 2.16 | % | | | 2.26 | % | | | 2.23 | %(c) | | | 2.23 | % | |
Total net expenses(d) | | | 2.06 | %(c)(e) | | | 2.11 | %(e) | | | 2.13 | %(e) | | | 2.15 | %(e) | | | 2.14 | %(e) | | | 2.16 | %(c) | | | 2.16 | %(e) | |
Net investment loss | | | (1.26 | %)(c) | | | (1.01 | %) | | | (1.41 | %) | | | (0.92 | %) | | | (1.41 | %) | | | (1.62 | %)(c) | | | (1.52 | %) | |
Supplemental data | |
Net assets, end of period
(in thousands) | | $ | 2,922 | | | $ | 4,063 | | | $ | 3,894 | | | $ | 5,782 | | | $ | 8,356 | | | $ | 12,565 | | | $ | 13,501 | | |
Portfolio turnover | | | 14 | % | | | 27 | % | | | 26 | % | | | 22 | % | | | 9 | % | | | 3 | % | | | 18 | % | |
Notes to Financial Highlights
(a) For the period from January 1, 2012 to May 31, 2012. During the period, the Fund's fiscal year end was changed from December 31 to May 31.
(b) In addition to the fees and expenses that the Fund bears directly, the Fund indirectly bears a pro rata share of the fees and expenses of any other funds in which it invests. Such indirect expenses are not included in the Fund's reported expense ratios.
(c) Annualized.
(d) Total net expenses include the impact of certain fee waivers/expense reimbursements made by the Investment Manager and certain of its affiliates, if applicable.
(e) The benefits derived from expense reductions had an impact of less than 0.01%.
The accompanying Notes to Financial Statements are an integral part of this statement.
Semiannual Report 2016
17
COLUMBIA SELECT SMALLER-CAP VALUE FUND
FINANCIAL HIGHLIGHTS (continued)
| | | Six Months Ended
November 30, 2016 | | Year Ended May 31, | | Year Ended
December 31, | |
Class C | | (Unaudited) | | 2016 | | 2015 | | 2014 | | 2013 | | 2012(a) | | 2011 | |
Per share data | |
Net asset value,
beginning of period | | $ | 13.64 | | | $ | 17.30 | | | $ | 18.00 | | | $ | 16.06 | | | $ | 12.36 | | | $ | 11.86 | | | $ | 14.06 | | |
Income from investment
operations: | |
Net investment loss | | | (0.09 | ) | | | (0.15 | ) | | | (0.25 | ) | | | (0.16 | ) | | | (0.19 | ) | | | (0.09 | ) | | | (0.21 | ) | |
Net realized and
unrealized gain (loss) | | | 0.93 | | | | (1.38 | ) | | | 1.85 | | | | 3.54 | | | | 4.33 | | | | 0.59 | | | | (1.23 | ) | |
Total from investment
operations | | | 0.84 | | | | (1.53 | ) | | | 1.60 | | | | 3.38 | | | | 4.14 | | | | 0.50 | | | | (1.44 | ) | |
Less distributions to
shareholders: | |
Net realized gains | | | — | | | | (2.13 | ) | | | (2.30 | ) | | | (1.44 | ) | | | (0.44 | ) | | | — | | | | (0.76 | ) | |
Total distributions to
shareholders | | | — | | | | (2.13 | ) | | | (2.30 | ) | | | (1.44 | ) | | | (0.44 | ) | | | — | | | | (0.76 | ) | |
Net asset value, end of
period | | $ | 14.48 | | | $ | 13.64 | | | $ | 17.30 | | | $ | 18.00 | | | $ | 16.06 | | | $ | 12.36 | | | $ | 11.86 | | |
Total return | | | 6.16 | % | | | (8.89 | %) | | | 10.35 | % | | | 21.37 | % | | | 34.23 | % | | | 4.22 | % | | | (10.13 | %) | |
Ratios to average
net assets(b) | |
Total gross expenses | | | 2.06 | %(c) | | | 2.11 | % | | | 2.13 | % | | | 2.16 | % | | | 2.26 | % | | | 2.23 | %(c) | | | 2.23 | % | |
Total net expenses(d) | | | 2.06 | %(c)(e) | | | 2.11 | %(e) | | | 2.13 | %(e) | | | 2.15 | %(e) | | | 2.14 | %(e) | | | 2.16 | %(c) | | | 2.17 | %(e) | |
Net investment loss | | | (1.29 | %)(c) | | | (1.02 | %) | | | (1.42 | %) | | | (0.91 | %) | | | (1.42 | %) | | | (1.63 | %)(c) | | | (1.52 | %) | |
Supplemental data | |
Net assets, end of period
(in thousands) | | $ | 40,016 | | | $ | 42,200 | | | $ | 43,974 | | | $ | 43,354 | | | $ | 38,785 | | | $ | 33,327 | | | $ | 37,511 | | |
Portfolio turnover | | | 14 | % | | | 27 | % | | | 26 | % | | | 22 | % | | | 9 | % | | | 3 | % | | | 18 | % | |
Notes to Financial Highlights
(a) For the period from January 1, 2012 to May 31, 2012. During the period, the Fund's fiscal year end was changed from December 31 to May 31.
(b) In addition to the fees and expenses that the Fund bears directly, the Fund indirectly bears a pro rata share of the fees and expenses of any other funds in which it invests. Such indirect expenses are not included in the Fund's reported expense ratios.
(c) Annualized.
(d) Total net expenses include the impact of certain fee waivers/expense reimbursements made by the Investment Manager and certain of its affiliates, if applicable.
(e) The benefits derived from expense reductions had an impact of less than 0.01%.
The accompanying Notes to Financial Statements are an integral part of this statement.
Semiannual Report 2016
18
COLUMBIA SELECT SMALLER-CAP VALUE FUND
FINANCIAL HIGHLIGHTS (continued)
| | | Six Months Ended
November 30, 2016 | | Year Ended May 31, | | Year Ended
December 31, | |
Class I | | (Unaudited) | | 2016 | | 2015 | | 2014 | | 2013 | | 2012(a) | | 2011 | |
Per share data | |
Net asset value,
beginning of period | | $ | 19.77 | | | $ | 23.75 | | | $ | 23.57 | | | $ | 20.41 | | | $ | 15.41 | | | $ | 14.71 | | | $ | 17.02 | | |
Income from investment
operations: | |
Net investment
income (loss) | | | (0.01 | ) | | | 0.04 | | | | (0.05 | ) | | | 0.07 | | | | (0.04 | ) | | | (0.03 | ) | | | (0.04 | ) | |
Net realized and
unrealized gain (loss) | | | 1.34 | | | | (1.89 | ) | | | 2.53 | | | | 4.53 | | | | 5.48 | | | | 0.73 | | | | (1.51 | ) | |
Total from investment
operations | | | 1.33 | | | | (1.85 | ) | | | 2.48 | | | | 4.60 | | | | 5.44 | | | | 0.70 | | | | (1.55 | ) | |
Less distributions to
shareholders: | |
Net realized gains | | | — | | | | (2.13 | ) | | | (2.30 | ) | | | (1.44 | ) | | | (0.44 | ) | | | — | | | | (0.76 | ) | |
Total distributions to
shareholders | | | — | | | | (2.13 | ) | | | (2.30 | ) | | | (1.44 | ) | | | (0.44 | ) | | | — | | | | (0.76 | ) | |
Net asset value, end of
period | | $ | 21.10 | | | $ | 19.77 | | | $ | 23.75 | | | $ | 23.57 | | | $ | 20.41 | | | $ | 15.41 | | | $ | 14.71 | | |
Total return | | | 6.73 | % | | | (7.77 | %) | | | 11.70 | % | | | 22.83 | % | | | 35.91 | % | | | 4.76 | % | | | (9.01 | %) | |
Ratios to average
net assets(b) | |
Total gross expenses | | | 0.90 | %(c) | | | 0.93 | % | | | 0.93 | % | | | 0.93 | % | | | 0.96 | % | | | 0.98 | %(c) | | | 0.94 | % | |
Total net expenses(d) | | | 0.90 | %(c) | | | 0.93 | % | | | 0.93 | % | | | 0.93 | % | | | 0.93 | % | | | 0.94 | %(c) | | | 0.91 | % | |
Net investment
income (loss) | | | (0.13 | %)(c) | | | 0.19 | % | | | (0.22 | %) | | | 0.32 | % | | | (0.21 | %) | | | (0.38 | %)(c) | | | (0.24 | %) | |
Supplemental data | |
Net assets, end of period
(in thousands) | | $ | 14,247 | | | $ | 14,742 | | | $ | 22,479 | | | $ | 22,829 | | | $ | 26,109 | | | $ | 20,764 | | | $ | 14,419 | | |
Portfolio turnover | | | 14 | % | | | 27 | % | | | 26 | % | | | 22 | % | | | 9 | % | | | 3 | % | | | 18 | % | |
Notes to Financial Highlights
(a) For the period from January 1, 2012 to May 31, 2012. During the period, the Fund's fiscal year end was changed from December 31 to May 31.
(b) In addition to the fees and expenses that the Fund bears directly, the Fund indirectly bears a pro rata share of the fees and expenses of any other funds in which it invests. Such indirect expenses are not included in the Fund's reported expense ratios.
(c) Annualized.
(d) Total net expenses include the impact of certain fee waivers/expense reimbursements made by the Investment Manager and certain of its affiliates, if applicable.
The accompanying Notes to Financial Statements are an integral part of this statement.
Semiannual Report 2016
19
COLUMBIA SELECT SMALLER-CAP VALUE FUND
FINANCIAL HIGHLIGHTS (continued)
| | | Six Months Ended
November 30, 2016 | | Year Ended May 31, | | Year Ended
December 31, | |
Class K | | (Unaudited) | | 2016 | | 2015 | | 2014 | | 2013 | | 2012(a) | | 2011 | |
Per share data | |
Net asset value,
beginning of period | | $ | 19.26 | | | $ | 23.27 | | | $ | 23.20 | | | $ | 20.17 | | | $ | 15.28 | | | $ | 14.60 | | | $ | 16.94 | | |
Income from investment
operations: | |
Net investment
income (loss) | | | (0.04 | ) | | | (0.03 | ) | | | (0.12 | ) | | | 0.01 | | | | (0.09 | ) | | | (0.04 | ) | | | (0.09 | ) | |
Net realized and
unrealized gain (loss) | | | 1.31 | | | | (1.85 | ) | | | 2.49 | | | | 4.46 | | | | 5.42 | | | | 0.72 | | | | (1.49 | ) | |
Total from investment
operations | | | 1.27 | | | | (1.88 | ) | | | 2.37 | | | | 4.47 | | | | 5.33 | | | | 0.68 | | | | (1.58 | ) | |
Less distributions to
shareholders: | |
Net realized gains | | | — | | | | (2.13 | ) | | | (2.30 | ) | | | (1.44 | ) | | | (0.44 | ) | | | — | | | | (0.76 | ) | |
Total distributions to
shareholders | | | — | | | | (2.13 | ) | | | (2.30 | ) | | | (1.44 | ) | | | (0.44 | ) | | | — | | | | (0.76 | ) | |
Net asset value, end of
period | | $ | 20.53 | | | $ | 19.26 | | | $ | 23.27 | | | $ | 23.20 | | | $ | 20.17 | | | $ | 15.28 | | | $ | 14.60 | | |
Total return | | | 6.59 | % | | | (8.07 | %) | | | 11.39 | % | | | 22.45 | % | | | 35.49 | % | | | 4.66 | % | | | (9.23 | %) | |
Ratios to average
net assets(b) | |
Total gross expenses | | | 1.20 | %(c) | | | 1.24 | % | | | 1.23 | % | | | 1.23 | % | | | 1.26 | % | | | 1.23 | %(c) | | | 1.22 | % | |
Total net expenses(d) | | | 1.20 | %(c) | | | 1.24 | % | | | 1.23 | % | | | 1.23 | % | | | 1.23 | % | | | 1.20 | %(c) | | | 1.18 | % | |
Net investment
income (loss) | | | (0.42 | %)(c) | | | (0.14 | %) | | | (0.52 | %) | | | 0.05 | % | | | (0.51 | %) | | | (0.65 | %)(c) | | | (0.53 | %) | |
Supplemental data | |
Net assets, end of period
(in thousands) | | $ | 7,322 | | | $ | 7,803 | | | $ | 7,323 | | | $ | 6,809 | | | $ | 5,083 | | | $ | 3,812 | | | $ | 3,642 | | |
Portfolio turnover | | | 14 | % | | | 27 | % | | | 26 | % | | | 22 | % | | | 9 | % | | | 3 | % | | | 18 | % | |
Notes to Financial Highlights
(a) For the period from January 1, 2012 to May 31, 2012. During the period, the Fund's fiscal year end was changed from December 31 to May 31.
(b) In addition to the fees and expenses that the Fund bears directly, the Fund indirectly bears a pro rata share of the fees and expenses of any other funds in which it invests. Such indirect expenses are not included in the Fund's reported expense ratios.
(c) Annualized.
(d) Total net expenses include the impact of certain fee waivers/expense reimbursements made by the Investment Manager and certain of its affiliates, if applicable.
The accompanying Notes to Financial Statements are an integral part of this statement.
Semiannual Report 2016
20
COLUMBIA SELECT SMALLER-CAP VALUE FUND
FINANCIAL HIGHLIGHTS (continued)
| | | Six Months Ended
November 30, 2016 | | Year Ended May 31, | | Year Ended
December 31, | |
Class R | | (Unaudited) | | 2016 | | 2015 | | 2014 | | 2013 | | 2012(a) | | 2011 | |
Per share data | |
Net asset value,
beginning of period | | $ | 16.62 | | | $ | 20.46 | | | $ | 20.77 | | | $ | 18.25 | | | $ | 13.92 | | | $ | 13.33 | | | $ | 15.62 | | |
Income from investment
operations: | |
Net investment loss | | | (0.07 | ) | | | (0.09 | ) | | | (0.19 | ) | | | (0.08 | ) | | | (0.14 | ) | | | (0.07 | ) | | | (0.16 | ) | |
Net realized and
unrealized gain (loss) | | | 1.13 | | | | (1.62 | ) | | | 2.18 | | | | 4.04 | | | | 4.91 | | | | 0.66 | | | | (1.37 | ) | |
Total from investment
operations | | | 1.06 | | | | (1.71 | ) | | | 1.99 | | | | 3.96 | | | | 4.77 | | | | 0.59 | | | | (1.53 | ) | |
Less distributions to
shareholders: | |
Net realized gains | | | — | | | | (2.13 | ) | | | (2.30 | ) | | | (1.44 | ) | | | (0.44 | ) | | | — | | | | (0.76 | ) | |
Total distributions to
shareholders | | | — | | | | (2.13 | ) | | | (2.30 | ) | | | (1.44 | ) | | | (0.44 | ) | | | — | | | | (0.76 | ) | |
Net asset value, end of
period | | $ | 17.68 | | | $ | 16.62 | | | $ | 20.46 | | | $ | 20.77 | | | $ | 18.25 | | | $ | 13.92 | | | $ | 13.33 | | |
Total return | | | 6.38 | % | | | (8.36 | %) | | | 10.87 | % | | | 22.01 | % | | | 34.92 | % | | | 4.43 | % | | | (9.69 | %) | |
Ratios to average
net assets(b) | |
Total gross expenses | | | 1.57 | %(c) | | | 1.61 | % | | | 1.63 | % | | | 1.66 | % | | | 1.76 | % | | | 1.73 | %(c) | | | 1.73 | % | |
Total net expenses(d) | | | 1.57 | %(c)(e) | | | 1.61 | %(e) | | | 1.63 | %(e) | | | 1.65 | %(e) | | | 1.64 | %(e) | | | 1.67 | %(c) | | | 1.67 | %(e) | |
Net investment loss | | | (0.79 | %)(c) | | | (0.52 | %) | | | (0.92 | %) | | | (0.40 | %) | | | (0.92 | %) | | | (1.14 | %)(c) | | | (1.02 | %) | |
Supplemental data | |
Net assets, end of period
(in thousands) | | $ | 12,747 | | | $ | 12,386 | | | $ | 11,772 | | | $ | 11,933 | | | $ | 10,684 | | | $ | 9,248 | | | $ | 11,156 | | |
Portfolio turnover | | | 14 | % | | | 27 | % | | | 26 | % | | | 22 | % | | | 9 | % | | | 3 | % | | | 18 | % | |
Notes to Financial Highlights
(a) For the period from January 1, 2012 to May 31, 2012. During the period, the Fund's fiscal year end was changed from December 31 to May 31.
(b) In addition to the fees and expenses that the Fund bears directly, the Fund indirectly bears a pro rata share of the fees and expenses of any other funds in which it invests. Such indirect expenses are not included in the Fund's reported expense ratios.
(c) Annualized.
(d) Total net expenses include the impact of certain fee waivers/expense reimbursements made by the Investment Manager and certain of its affiliates, if applicable.
(e) The benefits derived from expense reductions had an impact of less than 0.01%.
The accompanying Notes to Financial Statements are an integral part of this statement.
Semiannual Report 2016
21
COLUMBIA SELECT SMALLER-CAP VALUE FUND
FINANCIAL HIGHLIGHTS (continued)
| | | Six Months Ended
November 30, 2016 | | Year Ended May 31, | |
Class R4 | | (Unaudited) | | 2016 | | 2015 | | 2014 | | 2013(a) | |
Per share data | |
Net asset value, beginning of period | | $ | 19.74 | | | $ | 23.76 | | | $ | 23.63 | | | $ | 20.49 | | | $ | 15.99 | | |
Income from investment operations: | |
Net investment income (loss) | | | (0.03 | ) | | | 0.01 | | | | (0.10 | ) | | | 0.02 | | | | (0.04 | ) | |
Net realized and unrealized gain (loss) | | | 1.34 | | | | (1.90 | ) | | | 2.53 | | | | 4.56 | | | | 4.98 | | |
Total from investment operations | | | 1.31 | | | | (1.89 | ) | | | 2.43 | | | | 4.58 | | | | 4.94 | | |
Less distributions to shareholders: | |
Net realized gains | | | — | | | | (2.13 | ) | | | (2.30 | ) | | | (1.44 | ) | | | (0.44 | ) | |
Total distributions to shareholders | | | — | | | | (2.13 | ) | | | (2.30 | ) | | | (1.44 | ) | | | (0.44 | ) | |
Net asset value, end of period | | $ | 21.05 | | | $ | 19.74 | | | $ | 23.76 | | | $ | 23.63 | | | $ | 20.49 | | |
Total return | | | 6.64 | % | | | (7.94 | %) | | | 11.45 | % | | | 22.64 | % | | | 31.47 | % | |
Ratios to average net assets(b) | |
Total gross expenses | | | 1.07 | %(c) | | | 1.12 | % | | | 1.13 | % | | | 1.16 | % | | | 1.27 | %(c) | |
Total net expenses(d) | | | 1.07 | %(c)(e) | | | 1.12 | %(e) | | | 1.13 | %(e) | | | 1.15 | %(e) | | | 1.14 | %(c) | |
Net investment income (loss) | | | (0.30 | %)(c) | | | 0.03 | % | | | (0.44 | %) | | | 0.07 | % | | | (0.37 | %)(c) | |
Supplemental data | |
Net assets, end of period (in thousands) | | $ | 4,298 | | | $ | 4,147 | | | $ | 486 | | | $ | 123 | | | $ | 3 | | |
Portfolio turnover | | | 14 | % | | | 27 | % | | | 26 | % | | | 22 | % | | | 9 | % | |
Notes to Financial Highlights
(a) Based on operations from November 8, 2012 (commencement of operations) through the stated period end.
(b) In addition to the fees and expenses that the Fund bears directly, the Fund indirectly bears a pro rata share of the fees and expenses of any other funds in which it invests. Such indirect expenses are not included in the Fund's reported expense ratios.
(c) Annualized.
(d) Total net expenses include the impact of certain fee waivers/expense reimbursements made by the Investment Manager and certain of its affiliates, if applicable.
(e) The benefits derived from expense reductions had an impact of less than 0.01%.
The accompanying Notes to Financial Statements are an integral part of this statement.
Semiannual Report 2016
22
COLUMBIA SELECT SMALLER-CAP VALUE FUND
FINANCIAL HIGHLIGHTS (continued)
| | | Six Months Ended
November 30, 2016 | | Year Ended May 31, | | Year Ended
December 31, | |
Class R5 | | (Unaudited) | | 2016 | | 2015 | | 2014 | | 2013 | | 2012(a) | | 2011 | |
Per share data | |
Net asset value,
beginning of period | | $ | 19.66 | | | $ | 23.65 | | | $ | 23.49 | | | $ | 20.35 | | | $ | 15.40 | | | $ | 14.70 | | | $ | 17.01 | | |
Income from investment
operations: | |
Net investment
income (loss) | | | (0.02 | ) | | | 0.02 | | | | (0.07 | ) | | | 0.07 | | | | (0.05 | ) | | | (0.03 | ) | | | (0.05 | ) | |
Net realized and
unrealized gain (loss) | | | 1.35 | | | | (1.88 | ) | | | 2.53 | | | | 4.51 | | | | 5.44 | | | | 0.73 | | | | (1.50 | ) | |
Total from investment
operations | | | 1.33 | | | | (1.86 | ) | | | 2.46 | | | | 4.58 | | | | 5.39 | | | | 0.70 | | | | (1.55 | ) | |
Less distributions to
shareholders: | |
Net realized gains | | | — | | | | (2.13 | ) | | | (2.30 | ) | | | (1.44 | ) | | | (0.44 | ) | | | — | | | | (0.76 | ) | |
Total distributions to
shareholders | | | — | | | | (2.13 | ) | | | (2.30 | ) | | | (1.44 | ) | | | (0.44 | ) | | | — | | | | (0.76 | ) | |
Net asset value, end of
period | | $ | 20.99 | | | $ | 19.66 | | | $ | 23.65 | | | $ | 23.49 | | | $ | 20.35 | | | $ | 15.40 | | | $ | 14.70 | | |
Total return | | | 6.77 | % | | | (7.85 | %) | | | 11.65 | % | | | 22.80 | % | | | 35.60 | % | | | 4.76 | % | | | (9.02 | %) | |
Ratios to average
net assets(b) | |
Total gross expenses | | | 0.95 | %(c) | | | 0.99 | % | | | 0.98 | % | | | 0.98 | % | | | 0.98 | % | | | 0.98 | %(c) | | | 0.97 | % | |
Total net expenses(d) | | | 0.95 | %(c) | | | 0.99 | % | | | 0.98 | % | | | 0.98 | % | | | 0.98 | % | | | 0.95 | %(c) | | | 0.93 | % | |
Net investment
income (loss) | | | (0.18 | %)(c) | | | 0.10 | % | | | (0.29 | %) | | | 0.32 | % | | | (0.31 | %) | | | (0.41 | %)(c) | | | (0.28 | %) | |
Supplemental data | |
Net assets, end of period
(in thousands) | | $ | 9,759 | | | $ | 10,476 | | | $ | 2,188 | | | $ | 630 | | | $ | 352 | | | $ | 2,145 | | | $ | 2,046 | | |
Portfolio turnover | | | 14 | % | | | 27 | % | | | 26 | % | | | 22 | % | | | 9 | % | | | 3 | % | | | 18 | % | |
Notes to Financial Highlights
(a) For the period from January 1, 2012 to May 31, 2012. During the period, the Fund's fiscal year end was changed from December 31 to May 31.
(b) In addition to the fees and expenses that the Fund bears directly, the Fund indirectly bears a pro rata share of the fees and expenses of any other funds in which it invests. Such indirect expenses are not included in the Fund's reported expense ratios.
(c) Annualized.
(d) Total net expenses include the impact of certain fee waivers/expense reimbursements made by the Investment Manager and certain of its affiliates, if applicable.
The accompanying Notes to Financial Statements are an integral part of this statement.
Semiannual Report 2016
23
COLUMBIA SELECT SMALLER-CAP VALUE FUND
FINANCIAL HIGHLIGHTS (continued)
| | | Six Months Ended
November 30, 2016 | | Year Ended May 31, | |
Class Y | | (Unaudited) | | 2016 | | 2015(a) | |
Per share data | |
Net asset value, beginning of period | | $ | 20.20 | | | $ | 24.21 | | | $ | 23.11 | | |
Income from investment operations: | |
Net investment income (loss) | | | (0.02 | ) | | | 0.04 | | | | (0.02 | ) | |
Net realized and unrealized gain (loss) | | | 1.38 | | | | (1.92 | ) | | | 3.42 | | |
Total from investment operations | | | 1.36 | | | | (1.88 | ) | | | 3.40 | | |
Less distributions to shareholders: | |
Net realized gains | | | — | | | | (2.13 | ) | | | (2.30 | ) | |
Total distributions to shareholders | | | — | | | | (2.13 | ) | | | (2.30 | ) | |
Net asset value, end of period | | $ | 21.56 | | | $ | 20.20 | | | $ | 24.21 | | |
Total return | | | 6.73 | % | | | (7.74 | %) | | | 15.90 | % | |
Ratios to average net assets(b) | |
Total gross expenses | | | 0.94 | %(c) | | | 0.94 | % | | | 0.88 | %(c) | |
Total net expenses(d) | | | 0.94 | %(c) | | | 0.94 | % | | | 0.88 | %(c) | |
Net investment income (loss) | | | (0.18 | %)(c) | | | 0.16 | % | | | (0.15 | %)(c) | |
Supplemental data | |
Net assets, end of period (in thousands) | | $ | 5 | | | $ | 5 | | | $ | 3 | | |
Portfolio turnover | | | 14 | % | | | 27 | % | | | 26 | % | |
Notes to Financial Highlights
(a) Based on operations from October 1, 2014 (commencement of operations) through the stated period end.
(b) In addition to the fees and expenses that the Fund bears directly, the Fund indirectly bears a pro rata share of the fees and expenses of any other funds in which it invests. Such indirect expenses are not included in the Fund's reported expense ratios.
(c) Annualized.
(d) Total net expenses include the impact of certain fee waivers/expense reimbursements made by the Investment Manager and certain of its affiliates, if applicable.
The accompanying Notes to Financial Statements are an integral part of this statement.
Semiannual Report 2016
24
COLUMBIA SELECT SMALLER-CAP VALUE FUND
FINANCIAL HIGHLIGHTS (continued)
| | | Six Months Ended
November 30, 2016 | | Year Ended May 31, | | Year Ended
December 31, | |
Class Z | | (Unaudited) | | 2016 | | 2015 | | 2014 | | 2013 | | 2012(a) | | 2011 | |
Per share data | |
Net asset value,
beginning of period | | $ | 19.48 | | | $ | 23.47 | | | $ | 23.37 | | | $ | 20.28 | | | $ | 15.35 | | | $ | 14.67 | | | $ | 17.01 | | |
Income from investment
operations: | |
Net investment
income (loss) | | | (0.03 | ) | | | (0.01 | ) | | | (0.10 | ) | | | 0.05 | | | | (0.07 | ) | | | (0.04 | ) | | | (0.08 | ) | |
Net realized and
unrealized gain (loss) | | | 1.32 | | | | (1.85 | ) | | | 2.50 | | | | 4.48 | | | | 5.44 | | | | 0.72 | | | | (1.50 | ) | |
Total from investment
operations | | | 1.29 | | | | (1.86 | ) | | | 2.40 | | | | 4.53 | | | | 5.37 | | | | 0.68 | | | | (1.58 | ) | |
Less distributions to
shareholders: | |
Net realized gains | | | — | | | | (2.13 | ) | | | (2.30 | ) | | | (1.44 | ) | | | (0.44 | ) | | | — | | | | (0.76 | ) | |
Total distributions to
shareholders | | | — | | | | (2.13 | ) | | | (2.30 | ) | | | (1.44 | ) | | | (0.44 | ) | | | — | | | | (0.76 | ) | |
Net asset value, end of
period | | $ | 20.77 | | | $ | 19.48 | | | $ | 23.47 | | | $ | 23.37 | | | $ | 20.28 | | | $ | 15.35 | | | $ | 14.67 | | |
Total return | | | 6.62 | % | | | (7.91 | %) | | | 11.44 | % | | | 22.63 | % | | | 35.59 | % | | | 4.63 | % | | | (9.19 | %) | |
Ratios to average
net assets(b) | |
Total gross expenses | | | 1.07 | %(c) | | | 1.12 | % | | | 1.13 | % | | | 1.16 | % | | | 1.26 | % | | | 1.23 | %(c) | | | 1.20 | % | |
Total net expenses(d) | | | 1.07 | %(c)(e) | | | 1.12 | %(e) | | | 1.13 | %(e) | | | 1.15 | %(e) | | | 1.14 | %(e) | | | 1.16 | %(c) | | | 1.19 | %(e) | |
Net investment
income (loss) | | | (0.29 | %)(c) | | | (0.05 | %) | | | (0.44 | %) | | | 0.22 | % | | | (0.42 | %) | | | (0.62 | %)(c) | | | (0.50 | %) | |
Supplemental data | |
Net assets, end of period
(in thousands) | | $ | 81,659 | | | $ | 75,905 | | | $ | 18,605 | | | $ | 7,019 | | | $ | 3,467 | | | $ | 2,417 | | | $ | 1,892 | | |
Portfolio turnover | | | 14 | % | | | 27 | % | | | 26 | % | | | 22 | % | | | 9 | % | | | 3 | % | | | 18 | % | |
Notes to Financial Highlights
(a) For the period from January 1, 2012 to May 31, 2012. During the period, the Fund's fiscal year end was changed from December 31 to May 31.
(b) In addition to the fees and expenses that the Fund bears directly, the Fund indirectly bears a pro rata share of the fees and expenses of any other funds in which it invests. Such indirect expenses are not included in the Fund's reported expense ratios.
(c) Annualized.
(d) Total net expenses include the impact of certain fee waivers/expense reimbursements made by the Investment Manager and certain of its affiliates, if applicable.
(e) The benefits derived from expense reductions had an impact of less than 0.01%.
The accompanying Notes to Financial Statements are an integral part of this statement.
Semiannual Report 2016
25
COLUMBIA SELECT SMALLER-CAP VALUE FUND
NOTES TO FINANCIAL STATEMENTS
November 30, 2016 (Unaudited)
Note 1. Organization
Columbia Select Smaller-Cap Value Fund (the Fund), a series of Columbia Funds Series Trust II (the Trust), is a diversified fund. The Trust is registered under the Investment Company Act of 1940, as amended (the 1940 Act), as an open-end management investment company organized as a Massachusetts business trust.
Fund Shares
The Trust may issue an unlimited number of shares (without par value). The Fund offers Class A, Class B, Class C, Class I, Class K, Class R, Class R4, Class R5, Class Y and Class Z shares. Although all share classes generally have identical voting, dividend and liquidation rights, each share class votes separately when required by the Trust's organizational documents or by law. Different share classes pay different distribution amounts to the extent the expenses of such share classes differ, and distributions in liquidation will be proportional to the net asset value of each share class. Each share class has its own expense and sales charge structure.
Class A shares are subject to a maximum front-end sales charge of 5.75% based on the initial investment amount. Class A shares purchased without an initial sales charge in accounts aggregating $1 million to $50 million at the time of purchase are subject to a contingent deferred sales charge (CDSC) if the shares are sold within 18 months after purchase, charged as follows: 1.00% CDSC if redeemed within 12 months after purchase, and 0.50% CDSC if redeemed more than 12, but less than 18, months after purchase.
Class B shares may be subject to a maximum CDSC of 5.00% based upon the holding period after purchase. Class B shares will generally convert to Class A shares eight years after purchase. The Fund no longer accepts investments by new or existing investors in the Fund's Class B shares, except in connection with the reinvestment of any dividend and/or capital gain distributions in Class B shares of the Fund and exchanges by existing Class B shareholders of certain other funds within the Columbia Family of Funds.
Class C shares are subject to a 1.00% CDSC on shares redeemed within 12 months after purchase.
Class I shares are not subject to sales charges and are available only to the Columbia Family of Funds.
Class K shares are not subject to sales charges, however this share class is closed to new investors.
Class R shares are not subject to sales charges and are generally available only to certain retirement plans and other investors as described in the Fund's prospectus.
Class R4 shares are not subject to sales charges and are generally available only to omnibus retirement plans and certain investors as described in the Fund's prospectus.
Class R5 shares are not subject to sales charges and are generally available only to investors purchasing through authorized investment professionals and omnibus retirement plans.
Class Y shares are not subject to sales charges and are generally available only to certain retirement plans as described in the Fund's prospectus.
Class Z shares are not subject to sales charges and are generally available only to eligible investors, which are subject to different investment minimums as described in the Fund's prospectus.
Note 2. Summary of Significant Accounting Policies
Basis of Preparation
The Fund is an investment company that applies the accounting and reporting guidance in the Financial Accounting Standards Board (FASB) Accounting Standards Codification Topic 946, Financial Services — Investment Companies (ASC 946). The financial statements are prepared in accordance with U.S. generally accepted accounting principles (GAAP), which requires management to make certain estimates and assumptions that affect the reported amounts of assets and liabilities, the disclosure of contingent assets and liabilities at the date of the financial statements and the reported amounts of income and expenses during the reporting period. Actual results could differ from those estimates.
The following is a summary of significant accounting policies followed by the Fund in the preparation of its financial statements.
Security Valuation
All equity securities are valued at the close of business of the New York Stock Exchange (NYSE). Equity securities are valued at the last quoted sales price on the principal exchange or market on which they trade, except for securities traded on the NASDAQ Stock Market, which are valued at the NASDAQ official close price. Unlisted securities or listed securities for which there were no
Semiannual Report 2016
26
COLUMBIA SELECT SMALLER-CAP VALUE FUND
NOTES TO FINANCIAL STATEMENTS (continued)
November 30, 2016 (Unaudited)
sales during the day are valued at the mean of the latest quoted bid and ask prices on such exchanges or markets.
Foreign equity securities are valued based on the closing price on the foreign exchange in which such securities are primarily traded. If any foreign equity security closing prices are not readily available, the securities are valued at the mean of the latest quoted bid and ask prices on such exchanges or markets. Foreign currency exchange rates are generally determined at 4:00 p.m. Eastern (U.S.) time. Many securities markets and exchanges outside the U.S. close prior to the close of the NYSE; therefore, the closing prices for securities in such markets or on such exchanges may not fully reflect events that occur after such close but before the close of the NYSE. In those situations, foreign securities will be fair valued pursuant to a policy adopted by the Board of Trustees (the Board), including, if available, utilizing a third party pricing service to determine these fair values. The third party pricing service takes into account multiple factors, including, but not limited to, movements in the U.S. securities markets, certain depositary receipts, futures contracts and foreign exchange rates that have occurred subsequent to the close of the foreign exchange or market, to determine a good faith estimate that reasonably reflects the current market conditions as of the close of the NYSE. The fair value of a security is likely to be different from the quoted or published price, if available.
Investments in open-end investment companies, including money market funds, are valued at their latest net asset value.
Investments for which market quotations are not readily available, or that have quotations which management believes are not reflective of market value or reliable, are valued at fair value as determined in good faith under procedures approved by and under the general supervision of the Board. If a security or class of securities (such as foreign securities) is valued at fair value, such value is likely to be different from the quoted or published price for the security.
The determination of fair value often requires significant judgment. To determine fair value, management may use assumptions including but not limited to future cash flows and estimated risk premiums. Multiple inputs from various sources may be used to determine fair value.
GAAP requires disclosure regarding the inputs and valuation techniques used to measure fair value and any changes in valuation inputs or techniques. In addition,
investments shall be disclosed by major category. This information is disclosed following the Fund's Portfolio of Investments.
Foreign Currency Transactions and Translations
The values of all assets and liabilities denominated in foreign currencies are generally translated into U.S. dollars at exchange rates determined at the close of regular trading on the NYSE. Net realized and unrealized gains (losses) on foreign currency transactions and translations include gains (losses) arising from the fluctuation in exchange rates between trade and settlement dates on securities transactions, gains (losses) arising from the disposition of foreign currency and currency gains (losses) between the accrual and payment dates on dividends, interest income and foreign withholding taxes.
For financial statement purposes, the Fund does not distinguish that portion of gains (losses) on investments which is due to changes in foreign exchange rates from that which is due to changes in market prices of the investments. Such fluctuations are included with the net realized and unrealized gains (losses) on investments in the Statement of Operations.
Security Transactions
Security transactions are accounted for on the trade date. Cost is determined and gains (losses) are based upon the specific identification method for both financial statement and federal income tax purposes.
Income Recognition
Corporate actions and dividend income are generally recorded net of any non-reclaimable tax withholdings, on the ex-dividend date or upon receipt of ex-dividend notification in the case of certain foreign securities.
The Fund may receive distributions from holdings in equity securities, business development companies (BDCs), exchange-traded funds, other regulated investment companies (RICs), and real estate investment trusts (REITs), which report information on the tax character of their distributions annually. These distributions are allocated to dividend income, capital gain and return of capital based on actual information reported. Return of capital is recorded as a reduction of the cost basis of securities held. If the Fund no longer owns the applicable securities, return of capital is recorded as a realized gain. With respect to REITs, to the extent actual information has not yet been reported, estimates for return of capital are made by the Fund's management. Management's estimates are
Semiannual Report 2016
27
COLUMBIA SELECT SMALLER-CAP VALUE FUND
NOTES TO FINANCIAL STATEMENTS (continued)
November 30, 2016 (Unaudited)
subsequently adjusted when the actual character of the distributions is disclosed by the REITs, which could result in a proportionate change in return of capital to shareholders.
Awards from class action litigation are recorded as a reduction of cost basis if the Fund still owns the applicable securities on the payment date. If the Fund no longer owns the applicable securities, the proceeds are recorded as realized gains.
Expenses
General expenses of the Trust are allocated to the Fund and other funds of the Trust based upon relative net assets or other expense allocation methodologies determined by the nature of the expense. Expenses directly attributable to the Fund are charged to the Fund. Expenses directly attributable to a specific class of shares are charged to that share class.
Determination of Class Net Asset Value
All income, expenses (other than class-specific expenses, which are charged to that share class, as shown in the Statement of Operations) and realized and unrealized gains (losses) are allocated to each class of the Fund on a daily basis, based on the relative net assets of each class, for purposes of determining the net asset value of each class.
Federal Income Tax Status
The Fund intends to qualify each year as a regulated investment company under Subchapter M of the Internal Revenue Code, as amended, and will distribute substantially all of its taxable income (including net short-term capital gains), if any, for its tax year, and as such will not be subject to federal income taxes. In addition, the Fund intends to distribute in each calendar year substantially all of its net investment income, capital gains and certain other amounts, if any, such that the Fund should not be subject to federal excise tax. Therefore, no federal income or excise tax provision is recorded.
Foreign Taxes
The Fund may be subject to foreign taxes on income, gains on investments or currency repatriation, a portion of which may be recoverable. The Fund will accrue such taxes and recoveries, as applicable, based upon its current interpretation of tax rules and regulations that exist in the markets in which it invests.
Realized gains in certain countries may be subject to foreign taxes at the Fund level, based on statutory rates. The Fund accrues for such foreign taxes on realized and unrealized gains at the appropriate rate for each jurisdiction, as applicable. The amount, if any, is disclosed as a liability on the Statement of Assets and Liabilities.
Distributions to Shareholders
Distributions from net investment income, if any, are declared and paid annually. Net realized capital gains, if any, are distributed along with the income distribution. Income distributions and capital gain distributions are determined in accordance with federal income tax regulations, which may differ from GAAP.
Guarantees and Indemnifications
Under the Trust's organizational documents and, in some cases, by contract, its officers and trustees are indemnified against certain liabilities arising out of the performance of their duties to the Trust or its funds. In addition, certain of the Fund's contracts with its service providers contain general indemnification clauses. The Fund's maximum exposure under these arrangements is unknown since the amount of any future claims that may be made against the Fund cannot be determined, and the Fund has no historical basis for predicting the likelihood of any such claims.
Investment Company Reporting Modernization
In October 2016, the U.S. Securities and Exchange Commission adopted new rules and forms, and amendments to certain current rules and forms, to modernize reporting and disclosure of information by registered investment companies. The amendments to Regulation S-X will require standardized, enhanced disclosure about derivatives in investment company financial statements, and will also change the rules governing the form and content of such financial statements. The amendments to Regulation S-X take effect on August 1, 2017. At this time, management is assessing the anticipated impact of these regulatory developments.
Note 3. Fees and Other Transactions with Affiliates
Management Services Fees
The Fund entered into a Management Agreement with Columbia Management Investment Advisers, LLC (the Investment Manager), a wholly-owned subsidiary of
Semiannual Report 2016
28
COLUMBIA SELECT SMALLER-CAP VALUE FUND
NOTES TO FINANCIAL STATEMENTS (continued)
November 30, 2016 (Unaudited)
Ameriprise Financial, Inc. (Ameriprise Financial). Under the Management Agreement, the Investment Manager provides the Fund with investment research and advice, as well as administrative and accounting services. The management services fee is an annual fee that is equal to a percentage of the Fund's average daily net assets that declines from 0.87% to 0.75% as the Fund's net assets increase. The annualized effective management services fee rate for the six months ended November 30, 2016 was 0.85% of the Fund's average daily net assets.
Other Expenses
Other expenses are for, among other things, miscellaneous expenses of the Fund or the Board, including payments to Board Services Corp., a company providing limited administrative services to the Fund and the Board. That company's expenses include boardroom and office expense, employee compensation, employee health and retirement benefits, and certain other expenses.
Compensation of Board Members
Board members, who are not officers or employees of the Investment Manager or Ameriprise Financial, are compensated for their services to the Fund as disclosed in the Statement of Operations. Under a Deferred Compensation Plan (the Plan), these Board members may elect to defer payment of up to 100% of their compensation. Deferred amounts are treated as though equivalent dollar amounts had been invested in shares of certain funds managed by the Investment Manager. The Fund's liability for these amounts is adjusted for market value changes and remains in the Fund until distributed in accordance with the Plan. All amounts payable under the Plan constitute a general unsecured obligation of the Fund.
Compensation of Chief Compliance Officer
The Board has appointed a Chief Compliance Officer to the Fund in accordance with federal securities regulations. The Fund is allocated a portion of the expenses associated with the Chief Compliance Officer based on relative net assets of the Trust.
Transfer Agency Fees
Under a Transfer and Dividend Disbursing Agent Agreement, Columbia Management Investment Services Corp. (the Transfer Agent), an affiliate of the Investment Manager and a wholly-owned subsidiary of Ameriprise Financial, is responsible for providing transfer agency services to the Fund. The Transfer Agent has contracted with Boston Financial Data Services (BFDS) to serve as
sub-transfer agent. The Transfer Agent pays the fees of BFDS for services as sub-transfer agent and BFDS is not entitled to reimbursement for such fees from the Fund (with the exception of out-of-pocket fees).
The Fund pays the Transfer Agent a monthly transfer agency fee based on the number or the average value of accounts, depending on the type of account. In addition, prior to October 1, 2016, the Transfer Agent also received sub-transfer agency fees based on a percentage of the average aggregate value of the Fund's shares maintained in omnibus accounts (other than omnibus accounts for which American Enterprise Investment Services Inc. is the broker of record or accounts where the beneficial shareholder is a customer of Ameriprise Financial Services, Inc., for which the Transfer Agent receives a per account fee). Effective October 1, 2016, the Fund pays the Transfer Agent a fee for shareholder services based on the number of accounts or on a percentage of the average aggregate value of the Fund's shares maintained in omnibus accounts up to the lesser of the amount charged by the servicing agent or a cap established by the Board from time to time.
The Transfer Agent also receives compensation from the Fund for various shareholder services and reimbursements for certain out-of-pocket fees. Effective January 1, 2017, total transfer agency fees for Class K and Class R5 shares are subject to an annual limitation of not more than 0.075% of the average daily net assets attributable to each share class. Total transfer agency fees for Class I and Class Y shares are subject to an annual limitation of not more than 0.025% of the average daily net assets attributable to each share class. Prior to January 1, 2017, total transfer agency fees for Class K and Class R5 shares were subject to an annual limitation of not more than 0.05% of the average daily net assets attributable to each share class. Class I and Class Y shares did not pay transfer agency fees.
For the six months ended November 30, 2016, the Fund's annualized effective transfer agency fee rates as a percentage of average daily net assets of each class were as follows:
Class A | | | 0.17 | % | |
Class B | | | 0.17 | | |
Class C | | | 0.17 | | |
Class K | | | 0.05 | | |
Class R | | | 0.17 | | |
Class R4 | | | 0.17 | | |
Class R5 | | | 0.05 | | |
Class Z | | | 0.17 | | |
Semiannual Report 2016
29
COLUMBIA SELECT SMALLER-CAP VALUE FUND
NOTES TO FINANCIAL STATEMENTS (continued)
November 30, 2016 (Unaudited)
The Fund and certain other associated investment companies have severally, but not jointly, guaranteed the performance and observance of all the terms and conditions of a lease entered into by Seligman Data Corp. (SDC), the former transfer agent, including the payment of rent by SDC (the Guaranty). SDC was the legacy Seligman funds' former transfer agent.
The lease and the Guaranty expire in January 2019. At November 30, 2016, the Fund's total potential future obligation over the life of the Guaranty is $49,937. The liability remaining at November 30, 2016 for non-recurring charges associated with the lease amounted to $28,336 and is recorded as a part of the payable for other expenses in the Statement of Assets and Liabilities.
An annual minimum account balance fee of $20 may apply to certain accounts with a value below the applicable share class's initial minimum investment requirements to reduce the impact of small accounts on transfer agency fees. These minimum account balance fees are remitted to the Fund and recorded as part of expense reductions in the Statement of Operations. For the six months ended November 30, 2016, these minimum account balance fees reduced total expenses of the Fund by $960.
Plan Administration Fees
Under a Plan Administration Services Agreement with the Transfer Agent, the Fund pays an annual fee at a rate of 0.25% of the Fund's average daily net assets attributable to Class K shares for the provision of various administrative, recordkeeping, communication and educational services.
Distribution and Service Fees
The Fund has an agreement with Columbia Management Investment Distributors, Inc. (the Distributor), an affiliate of the Investment Manager and a wholly-owned subsidiary of Ameriprise Financial, for distribution and shareholder services. Under a Plan and Agreement of Distribution, the Fund pays a fee at an annual rate of up to 0.25% of the Fund's average daily net assets attributable to Class A shares, a fee at an annual rate of up to 0.50% of the Fund's average daily net assets attributable to Class R shares (of which up to 0.25% may be used for shareholder services) and a fee at an annual rate of up to 1.00% of the Fund's average daily net assets attributable to Class B and Class C shares. For Class B and Class C shares, of the 1.00% fee, up to 0.75% is reimbursed for distribution expenses.
The amount of distribution and shareholder services expenses incurred by the Distributor and not yet reimbursed (unreimbursed expense) was approximately $592,000 and $2,433,000 for Class B and Class C shares, respectively. These amounts are based on the most recent information available as of September 30, 2016, and may be recovered from future payments under the distribution plan or CDSCs. To the extent the unreimbursed expense has been fully recovered, the distribution and/or shareholder services fee is reduced.
Sales Charges
Sales charges, including front-end charges and CDSCs, received by the Distributor for distributing Fund shares were $78,225 for Class A, $7 for Class B and $1,346 for Class C shares for the six months ended November 30, 2016.
Expenses Waived/Reimbursed by the Investment Manager and its Affiliates
The Investment Manager and certain of its affiliates have contractually agreed to waive fees and/or reimburse expenses (excluding certain fees and expenses described below) for the period disclosed below, unless sooner terminated at the sole discretion of the Board, so that the Fund's net operating expenses, after giving effect to fees waived/expenses reimbursed and any balance credits and/or overdraft charges from the Fund's custodian, do not exceed the following annual rates as a percentage of the class' average daily net assets:
| | | Fee Rates Contractual
Through
September 30, 2017 | |
Class A | | | 1.38 | % | |
Class B | | | 2.13 | | |
Class C | | | 2.13 | | |
Class I | | | 1.00 | | |
Class K | | | 1.30 | | |
Class R | | | 1.63 | | |
Class R4 | | | 1.13 | | |
Class R5 | | | 1.05 | | |
Class Y | | | 1.00 | | |
Class Z | | | 1.13 | | |
Under the agreement, the following fees and expenses are excluded from the waiver/reimbursement commitment, and therefore will be paid by the Fund, if applicable: taxes (including foreign transaction taxes), expenses associated with investments in affiliated and non-affiliated pooled investment vehicles (including
Semiannual Report 2016
30
COLUMBIA SELECT SMALLER-CAP VALUE FUND
NOTES TO FINANCIAL STATEMENTS (continued)
November 30, 2016 (Unaudited)
mutual funds and exchange-traded funds), transaction costs and brokerage commissions, costs related to any securities lending program, dividend and interest expenses associated with securities sold short, inverse floater program fees and expenses, transaction charges and interest on borrowed money, interest, infrequent and/or unusual expenses and any other expenses the exclusion of which is specifically approved by the Board. This agreement may be modified or amended only with approval from the Investment Manager, certain of its affiliates and the Fund. Any fees waived and/or expenses reimbursed under the expense reimbursement arrangements described above are not recoverable by the Investment Manager or its affiliates in future periods.
Note 4. Federal Tax Information
The timing and character of income and capital gain distributions are determined in accordance with income tax regulations, which may differ from GAAP because of temporary or permanent book to tax differences.
At November 30, 2016, the cost of investments for federal income tax purposes was approximately $592,004,000 and the aggregate gross approximate unrealized appreciation and depreciation based on that cost was:
Unrealized appreciation | | $ | 152,343,000 | | |
Unrealized depreciation | | | (35,693,000 | ) | |
Net unrealized appreciation | | $ | 116,650,000 | | |
The following capital loss carryforwards, determined at May 31, 2016, may be available to reduce taxable income arising from future net realized gains on investments, if any, to the extent permitted by the Internal Revenue Code:
Year of Expiration | | Amount ($) | |
2017 | | | 4,093,908 | | |
Under current tax rules, regulated investment companies can elect to treat certain late-year ordinary losses incurred and post-October capital losses (capital losses realized after October 31) as arising on the first day of the following taxable year. As of May 31, 2016, the Fund will elect to treat late-year ordinary losses of $2,002,873 as arising on June 1, 2016.
Management of the Fund has concluded that there are no significant uncertain tax positions in the Fund that would require recognition in the financial statements. However, management's conclusion may be subject to review and adjustment at a later date based on factors
including, but not limited to, new tax laws, regulations, and administrative interpretations (including relevant court decisions). Generally, the Fund's federal tax returns for the prior three fiscal years remain subject to examination by the Internal Revenue Service.
Note 5. Portfolio Information
The cost of purchases and proceeds from sales of securities, excluding short-term investments and derivatives, if any, aggregated to $96,550,908 and $139,576,497, respectively, for the six months ended November 30, 2016. The amount of purchase and sale activity impacts the portfolio turnover rate reported in the Financial Highlights.
Note 6. Affiliated Money Market Fund
The Fund invests in Columbia Short-Term Cash Fund, an affiliated money market fund established for the exclusive use by the Fund and other affiliated funds (the Affiliated MMF). The income earned by the Fund from such investments is included as Dividends — affiliated issuers in the Statement of Operations. As an investing fund, the Fund indirectly bears its proportionate share of the expenses of the Affiliated MMF. Effective October 1, 2016, the Affiliated MMF prices its shares with a floating net asset value (NAV) and no longer seeks to maintain a stable NAV. In addition, the Board of the Affiliated MMF may impose a fee on redemptions (sometimes referred to as a liquidity fee) or temporarily suspend redemptions (sometimes referred to as imposing a redemption gate) in the event its liquidity falls below regulatory limits.
Note 7. Line of Credit
The Fund has access to a revolving credit facility with a syndicate of banks led by Citibank, N.A., HSBC Bank USA, N.A. and JPMorgan Chase Bank, N.A. whereby the Fund may borrow for the temporary funding of shareholder redemptions or for other temporary or emergency purposes. The credit facility agreement, which is a collective agreement between the Fund and certain other funds managed by the Investment Manager, severally and not jointly, that permits collective borrowings up to $1 billion. Interest is charged to each participating fund based on its borrowings at a rate equal to the higher of (i) the overnight federal funds rate plus 1.00% or (ii) the one-month LIBOR rate plus 1.00%. Each borrowing under the credit facility matures no later than 60 days after the date of borrowing. The Fund also pays a commitment fee equal to its pro rata share of the amount of the credit facility at a rate of 0.15% per
Semiannual Report 2016
31
COLUMBIA SELECT SMALLER-CAP VALUE FUND
NOTES TO FINANCIAL STATEMENTS (continued)
November 30, 2016 (Unaudited)
annum. The commitment fee is included in other expenses in the Statement of Operations.
The Fund had no borrowings during the six months ended November 30, 2016.
Note 8. Fund Reorganization
At the close of business on May 20, 2016, the Fund acquired the assets and assumed the identified liabilities of Columbia Multi-Advisor Small Cap Value Fund, a series of Columbia Funds Series Trust II (the acquired fund). The reorganization was completed after shareholders of the acquired fund approved a plan of reorganization on April 15, 2016. The purpose of the transaction was to combine two funds managed by the Investment Manager with comparable investment objectives and strategies.
The aggregate net assets of the Fund immediately before the reorganization were $462,589,977 and the combined net assets immediately after the reorganization were $708,693,354.
The reorganization was accomplished by a tax-free exchange of 43,781,097 shares of the acquired fund valued at $246,103,376 (including $21,893,545 of unrealized appreciation).
In exchange for the acquired fund's shares, the Fund issued the following number of shares:
| | | Shares | |
Class A | | | 12,043,498 | | |
Class B | | | 152,198 | | |
Class C | | | 600,175 | | |
Class I | | | 707,392 | | |
Class K | | | 51,189 | | |
Class R | | | 165,788 | | |
Class R4 | | | 103,705 | | |
Class R5 | | | 214,989 | | |
Class Y | | | 117 | | |
Class Z | | | 376,355 | | |
For financial reporting purposes, net assets received and shares issued by the Fund were recorded at fair value; however, the acquired fund's cost of investments was carried forward.
The financial statements reflect the operations of the Fund for the period prior to the reorganization and the combined fund for the period subsequent to the reorganization. Because the combined investment portfolios have been managed as a single integrated portfolio since the reorganization was completed, it is not
practicable to separate the amounts of revenue and earnings of the acquired fund that have been included in the combined Fund's Statement of Operations since the reorganization was completed.
Assuming the reorganization had been completed on June 1, 2015), the Fund's pro-forma net investment income, net gain on investments, net change in unrealized appreciation (depreciation) and net decrease in net assets from operations for the year ended May 31, 2016 would have been approximately $0.1 million, $38.2 million, $(113.3) million and $(75.0) million, respectively.
Note 9. Significant Risks
Shareholder Concentration Risk
At November 30, 2016, Affiliated shareholders of record owned 61.0% of the outstanding shares of the Fund in one or more accounts. Subscription and redemption activity by concentrated accounts may have a significant effect on the operations of the Fund. In the case of a large redemption, the Fund may be forced to sell investments at inopportune times, including its liquid or more liquid positions, resulting in Fund losses and the Fund holding a higher percentage of less liquid or illiquid securities. Large redemptions could result in decreased economies of scale and increased operating expenses for non-redeeming Fund shareholders.
Financial Sector Risk
The Fund may be more susceptible to the particular risks that may affect companies in the financial services sector than if it were invested in a wider variety of companies in unrelated sectors. Companies in the financial services sector are subject to certain risks, including the risk of regulatory change, decreased liquidity in credit markets and unstable interest rates. Such companies may have concentrated portfolios, such as a high level of loans to real estate developers, which makes them vulnerable to economic conditions that affect that industry. Performance of such companies may be affected by competitive pressures and exposure to investments or agreements that, under certain circumstances, may lead to losses (e.g., subprime loans). Companies in the financial services sector are subject to extensive governmental regulation that may limit the amount and types of loans and other financial commitments they can make, and interest rates and fees that they may charge. In addition, profitability of such companies is largely dependent upon the availability and the cost of capital.
Semiannual Report 2016
32
COLUMBIA SELECT SMALLER-CAP VALUE FUND
NOTES TO FINANCIAL STATEMENTS (continued)
November 30, 2016 (Unaudited)
Note 10. Subsequent Events
Management has evaluated the events and transactions that have occurred through the date the financial statements were issued and noted no items requiring adjustment of the financial statements or additional disclosure.
Note 11. Information Regarding Pending and Settled Legal Proceedings
Ameriprise Financial and certain of its affiliates have historically been involved in a number of legal, arbitration and regulatory proceedings, including routine litigation, class actions, and governmental actions, concerning matters arising in connection with the conduct of their business activities. Ameriprise Financial believes that the Funds are not currently the subject of, and that neither Ameriprise Financial nor any of its affiliates are the subject of, any pending legal, arbitration or regulatory proceedings that are likely to have a material adverse effect on the Funds or the ability of Ameriprise Financial or its affiliates to perform under their contracts with the Funds. Ameriprise Financial is required to make quarterly (10-Q), annual (10-K) and, as necessary, 8-K filings with the Securities and Exchange Commission (SEC) on legal and regulatory matters that relate to Ameriprise Financial and its affiliates. Copies of these filings may be obtained by accessing the SEC website at www.sec.gov.
There can be no assurance that these matters, or the adverse publicity associated with them, will not result in increased fund redemptions, reduced sale of fund shares or other adverse consequences to the Funds. Further, although we believe proceedings are not likely to have a material adverse effect on the Funds or the ability of Ameriprise Financial or its affiliates to perform under their contracts with the Funds, these proceedings are subject to uncertainties and, as such, we are unable to estimate the possible loss or range of loss that may result. An adverse outcome in one or more of these proceedings could result in adverse judgments, settlements, fines, penalties or other relief that could have a material adverse effect on the consolidated financial condition or results of operations of Ameriprise Financial.
Semiannual Report 2016
33
COLUMBIA SELECT SMALLER-CAP VALUE FUND
APPROVAL OF MANAGEMENT AGREEMENT
Columbia Management Investment Advisers, LLC (Columbia Threadneedle or the Investment Manager, and together with its domestic and global affiliates, Columbia Threadneedle Investments), a wholly-owned subsidiary of Ameriprise Financial, Inc. (Ameriprise Financial), serves as the investment manager to Columbia Select Smaller-Cap Value Fund (the Fund). Under a management agreement (the Management Agreement), Columbia Threadneedle provides investment advice and other services to the Fund and other funds distributed by Columbia Management Investment Distributors, Inc. (collectively, the Funds).
On an annual basis, the Fund's Board of Trustees (the Board), including the independent Board members (the Independent Trustees), considers renewal of the Management Agreement. Columbia Threadneedle prepared detailed reports for the Board and its Contracts Committee in February, March and April 2016, including reports providing the results of analyses performed by an independent organization, Broadridge Financial Solutions, Inc. (Broadridge), and a comprehensive response to items of information requested by independent legal counsel to the Independent Trustees (Independent Legal Counsel) in a letter to the Investment Manager, to assist the Board in making this determination. Many of the materials presented in February, March and April were first supplied in draft form to designated independent Board representatives, i.e., Independent Legal Counsel, the Chair of the Board and/or the Chair of the Contracts Committee, and the final materials were revised to contain information reflective of discussion and subsequent requests made by the Contracts Committee. In addition, throughout the year, the Board (or its committees) regularly meets with portfolio management teams and senior management personnel and reviews information prepared by Columbia Threadneedle addressing the services Columbia Threadneedle provides and Fund performance. The Board also accords appropriate weight to the work, deliberations and conclusions of the various committees, such as the Contracts Committee, the Investment Review Committee and the Compliance Committee in determining whether to continue the Management Agreement.
The Board, at its June 13-15, 2016 in-person Board meeting (the June Meeting), considered the renewal of the Management Agreement for an additional one-year term. At the June Meeting, Independent Legal Counsel reviewed with the Independent Trustees various factors relevant to the Board's consideration of management agreements and the Board's legal responsibilities related to such consideration. Following an analysis and discussion of the factors identified below, the Board, including all of the Independent Trustees, approved the renewal of the Management Agreement.
Nature, Extent and Quality of Services Provided by Columbia Threadneedle
The Independent Trustees analyzed various reports and presentations they had received detailing the services performed by Columbia Threadneedle, as well as its organization, expertise, resources and capabilities.
The Independent Trustees specifically considered many developments during the past year concerning the services provided by Columbia Threadneedle, including, in particular, the relatively recent change in the leadership of equity department oversight, improvements in technology research and the use of research analysts' model portfolios to highlight best ideas and improve implementation. The Independent Trustees further noted the restructured investment risk management department and its additional resources, including the new head of multi-asset investment risk. They also observed the relatively recent 5P leadership transition, and the additional staff and resources dedicated to the 5P team. The Board also noted the broad scope of services provided by Columbia Threadneedle to each Fund, including, among other services, investment, risk and compliance oversight. The Board also took into account the information it received concerning Columbia Threadneedle's ability to attract and retain key portfolio management personnel.
In connection with the Board's evaluation of the overall package of services provided by Columbia Threadneedle, the Board also considered the nature, quality and range of administrative services provided to the Fund by Columbia Threadneedle, as well as the achievements in 2015 in the performance of administrative services, and noted the various enhancements anticipated for 2016. In evaluating the quality of services provided under the Management Agreement, the Independent Trustees also took into account the organization and strength of the Fund's and its service providers' compliance programs. In addition, the Board reviewed the financial condition of Columbia Threadneedle and its affiliates and each entity's ability to carry out its responsibilities under the Management Agreement and the Fund's other service agreements with affiliates of Ameriprise Financial, observing the financial strength of Ameriprise Financial, with its solid balance sheet.
Semiannual Report 2016
34
COLUMBIA SELECT SMALLER-CAP VALUE FUND
APPROVAL OF MANAGEMENT AGREEMENT (continued)
The Board also discussed the acceptability of the terms of the Management Agreement (including the relatively broad scope of services required to be performed by Columbia Threadneedle), noting that no material changes are proposed from the form of agreement previously approved. They also noted the wide array of legal and compliance services provided to the Funds. It was also observed that the services being performed under the Management Agreement were of a reasonably high quality.
Based on the foregoing, and based on other information received (both oral and written, including the information on investment performance referenced below) and other considerations, the Board concluded that Columbia Threadneedle and its affiliates are in a position to continue to provide a high quality and level of services to the Fund.
Investment Performance
For purposes of evaluating the nature, extent and quality of services provided under the Management Agreement, the Board carefully reviewed the investment performance of the Fund. In this regard, the Board considered detailed reports providing the results of analyses performed by an independent organization showing, for various periods, the performance of the Fund, the performance of a benchmark index, the percentage ranking of the Fund among its comparison group and the net assets of the Fund. The Board observed that the Fund's investment performance met expectations.
Comparative Fees, Costs of Services Provided and the Profits Realized by Columbia Threadneedle and its Affiliates from their Relationships with the Fund
The Board reviewed comparative fees and the costs of services provided under the Management Agreement. The Board members considered detailed comparative information set forth in an annual report on fees and expenses, including, among other things, data (based on analyses conducted by an independent organization) showing a comparison of the Fund's expenses with median expenses paid by funds in its comparative peer universe, as well as data showing the Fund's contribution to Columbia Threadneedle's profitability. The Board reviewed the fees charged to comparable institutional or other accounts/vehicles managed by Columbia Threadneedle and discussed differences in how the products are managed and operated, noting no unreasonable differences in the levels of contractual fees.
The Board considered the reports of its independent fee consultant, JDL Consultants, LLC (JDL), which assisted in its analysis of the Funds' performance and expenses, the reasonableness of the Funds' fee rates, the reasonableness of Columbia Threadneedle's profitability, and JDL's conclusion that the management fees being charged to the Fund are reasonable. The Board accorded particular weight to the notion that the level of fees should generally reflect a rational pricing model applied consistently across the various product lines in the Fund family, while assuring that the overall fees for each Fund (with certain defined exceptions) are generally in line with the "pricing philosophy" currently in effect (i.e., that the total expense ratio of the Fund is generally no higher than the median expense ratio of funds in the comparison universe of the Fund). The Board took into account that the Fund's total expense ratio (after considering proposed expense caps/waivers) was slightly below the peer universe's median expense ratio shown in the reports. Based on its review, the Board concluded that the Fund's management fee was fair and reasonable in light of the extent and quality of services that the Fund receives.
The Board also considered the expected profitability of Columbia Threadneedle and its affiliates in connection with Columbia Threadneedle providing management services to the Fund. In this regard, the Independent Trustees referred to their detailed analysis of the Profitability Report, discussing the profitability to Columbia Threadneedle and Ameriprise Financial from managing, operating and distributing the Funds. The Board took into account JDL's conclusion that 2015 Columbia Threadneedle profitability, relative to industry competitors, was reasonable. It also considered that in 2015 the Board had concluded that 2014 profitability was reasonable and that Columbia Threadneedle generated 2015 profitability that only slightly exceeded 2014 levels. It also took into account the indirect economic benefits flowing to Columbia Threadneedle or its affiliates in connection with managing or distributing the Funds, such as the enhanced ability to offer various other financial products to Ameriprise Financial customers, soft dollar benefits and overall reputational advantages. The Board noted that
Semiannual Report 2016
35
COLUMBIA SELECT SMALLER-CAP VALUE FUND
APPROVAL OF MANAGEMENT AGREEMENT (continued)
the fees paid by the Fund should permit the Investment Manager to offer competitive compensation to its personnel, make necessary investments in its business and earn an appropriate profit. The Board concluded that profitability levels were reasonable.
Economies of Scale to be Realized
The Board also considered the economies of scale that might be realized by Columbia Threadneedle as the Fund grows and took note of the extent to which Fund shareholders might also benefit from such growth. In this regard, the Board took into account that management fees decline as Fund assets exceed various breakpoints, all of which have not been surpassed. The Board concluded that the breakpoints in the management fee rate schedule satisfactorily provides for the sharing of economies of scale, as they allow for adequate opportunity for shareholders to realize benefits (fee breaks) as Fund assets grow.
Based on the foregoing, the Board, including all of the Independent Trustees, concluded that the management fees were fair and reasonable in light of the extent and quality of services provided. In reaching this conclusion, no single factor was determinative. On June 15, 2016, the Board, including all of the Independent Trustees, approved the renewal of the Management Agreement.
Semiannual Report 2016
36
COLUMBIA SELECT SMALLER-CAP VALUE FUND
IMPORTANT INFORMATION ABOUT THIS REPORT
Each fund mails one shareholder report to each shareholder address. If you would like more than one report, please call shareholder services at 800.345.6611 and additional reports will be sent to you.
The policy of the Board is to vote the proxies of the companies in which each fund holds investments consistent with the procedures as stated in the Statement of Additional Information (SAI). You may obtain a copy of the SAI without charge by calling 800.345.6611; contacting your financial intermediary; visiting investor.columbiathreadneedleus.com; or searching the website of the Securities and Exchange Commission (SEC) at sec.gov. Information regarding how each fund voted proxies relating to portfolio securities is filed with the SEC by August 31st for the most recent 12-month period ending June 30th of that year, and is available without charge by visiting investor.columbiathreadneedleus.com, or searching the website of the SEC at sec.gov.
Each fund files a complete schedule of portfolio holdings with the SEC for the first and third quarters of each fiscal year on Form N-Q. Each fund's Form N-Q is available on the SEC's website at sec.gov and may be reviewed and copied at the SEC's Public Reference Room in Washington, D.C. Information on the operation of the Public Reference Room may be obtained by calling 800.SEC.0330. Each fund's complete schedule of portfolio holdings, as filed on Form N-Q, can also be obtained without charge, upon request, by calling 800.345.6611.
Semiannual Report 2016
37
Columbia Select Smaller-Cap Value Fund
P.O. Box 8081
Boston, MA 02266-8081

Please read and consider the investment objectives, risks, charges and expenses for any fund carefully before investing. For a prospectus and summary prospectus, which contains this and other important information about the Fund, go to investor.columbiathreadneedleus.com. The Fund is distributed by Columbia Management Investment Distributors, Inc., member FINRA, and managed by Columbia Management Investment Advisers, LLC.
Columbia Threadneedle Investments (Columbia Threadneedle) is the global brand name of the Columbia and Threadneedle group of companies.
All rights reserved. Columbia Management Investment Distributors, Inc., 225 Franklin Street, Boston, MA 02110-2804
© 2017 Columbia Management Investment Advisers, LLC.
investor.columbiathreadneedleus.com
SAR218_05_G01_(01/17)

SEMIANNUAL REPORT
November 30, 2016

COLUMBIA HIGH YIELD BOND FUND

ABOUT COLUMBIA THREADNEEDLE INVESTMENTS
Columbia Threadneedle Investments is a leading global asset management group that provides a broad range of investment strategies and solutions for individual, institutional and corporate clients around the world.
With more than 2,000 people, including over 450 investment professionals based in North America, Europe and Asia, we manage $460 billion* of assets across developed and emerging market equities, fixed income, asset allocation solutions and alternatives. We are the 13th largest manager of long-term mutual fund assets in the U.S.** and the 4th largest manager of retail funds in the U.K.***
Our priority is the investment success of our clients. We aim to deliver the investment outcomes they expect through an investment approach that is team-based, performance-driven and risk-aware. Our culture is dynamic and interactive. By sharing our insights across asset classes and geographies, we generate richer perspectives on global, regional and local investment landscapes. The ability to exchange and debate investment ideas in a collaborative environment enriches our teams' investment processes. More importantly, it results in better informed investment decisions for our clients.
Columbia funds are distributed by Columbia Management Investment Distributors, Inc., member FINRA, and managed by Columbia Management Investment Advisers, LLC.
Columbia Threadneedle Investments (Columbia Threadneedle) is the global brand name of the Columbia and Threadneedle group of companies.
* In U.S. dollars as of June 30, 2016. Source: Ameriprise Q2 Earnings Release. Includes all assets managed by entities in the Columbia and Threadneedle group of companies. Contact us for more current data.
** Source: ICI as of June 30, 2016 for Columbia Management Investment Advisers, LLC.
*** Source: Investment Association as of March 2016 for Threadneedle Asset Management Limited.
© 2016 Columbia Management Investment Advisers, LLC. All rights reserved.
Not part of the shareholder report
Investment strategies to help meet investor needs
We are committed to helping investors navigate financial challenges to reach their desired outcomes. The possibilities are endless.
Your success is our priority.
Retire comfortably
Fund college or higher education
Leave a legacy
Generate an appropriate stream of income in retirement
Traditional approaches to income may no longer be adequate — and they may no longer provide the diversification benefits they once did. Investors need to rethink how they generate retirement income.
Worried about running out of income? You are not alone.
Navigate a changing interest rate environment
Even in today's challenging interest rate environment, it's still possible to navigate markets and achieve your goals.
Make investment choices designed specifically for this market environment.
Maximize after-tax returns
In an environment where what you keep is more important than what you earn, municipal bonds can help mitigate higher taxes while providing attractive yields compared to other investment options.
You've worked too hard building your wealth to lose it to taxes.
Grow assets to achieve financial goals
Finding growth opportunities in today's complex market environment requires strong research capabilities, creative thinking and a disciplined approach.
Do your investments deliver the portfolio growth you need?
Ease the impact of volatile markets
With increasing concerns about market volatility, investors should consider diversifying their portfolios with non-traditional holdings.
Interested in turning volatility into opportunity?
To find out more, contact your financial professional, call 800.426.3750 or visit investor.columbiathreadneedleus.com
Not part of the shareholder report
Get the market insight you need from our investment experts and subscribe to our latest publications


Stay informed with Columbia Threadneedle Investments
Investor insight
Find economic and market commentary, investment videos, white papers, mutual fund commentary and more at investor.columbiathreadneedleus.com.
Subscribe to the latest information from Columbia Threadneedle. Register your information online at investor.columbiathreadneedleus.com/subscribe and select the publications you would like to receive, including:
n Columbia Threadneedle Investor Newsletter, highlighting the latest macro- and micro-economic trends, investment themes, products, service changes and other items of interest to our investors
n Investment Strategy Outlook, showcasing the Columbia Threadneedle Asset Allocation Team's perspective on global economic investment conditions and markets
n MarketTrack, featuring straightforward insight on current investment opportunities
n White papers that delve deep into a variety of investment topics
n Quarterly portfolio manager commentary and fund fact sheets
Update your subscriptions at any time by accessing the email subscription center.
Social media 
We offer you multiple ways to access our market commentary and investment insights.
n Perspectives blog at investor.columbiathreadneedleus.com
Read timely posts by our investment team, including our chief investment officer, chief economist and portfolio managers.
n Twitter.com/CTinvest_US
Follow us on Twitter for quick, up-to-the-minute comments on market news and more.
n Youtube.com/CTInvestUS
View our commentaries on the economy, markets and current investment opportunities.
n Linkedin.com/company/Columbia-Threadneedle-Investments-US
Connect with us on LinkedIn for updates from our thought leaders.
Not part of the shareholder report
 Dear Shareholders,
While emotions have run high following the outcome of the U.S. Presidential election, it remains unclear how the Trump presidency will unfold in terms of policy. We have a sense of the priorities espoused by the president-elect over the past eighteen months, but campaign priorities are not always realized and are often never pursued. What seems certain is that, while some investors have already priced expectations into the market, others have retreated, preferring instead a wait and see approach. The outcome of such behaviors appears to have created conditions ripe for ongoing market volatility.
While volatility in the financial markets can be stressful, volatility itself is not a new phenomenon. Other factors that have been at the root cause of recent volatility include uncertainty following the United Kingdom's vote to exit the European Union (Brexit), speculation around the Federal Reserve's decision to increase interest rates, divergent central bank policy and geopolitical unrest. The point is, financial markets have fluctuated for years and may be expected to continue to fluctuate — sometimes wildly. If anything, such volatility seems to be the new normal, perhaps exacerbated by access to information and development of technological tools which have enabled investors to react rapidly to real and perceived change. So what can you do?
Position your portfolio for the reality of market volatility
That there is a historical precedent for market volatility, or even an acceptance that it may persist, offers little comfort. A measured and strategic approach remains the best strategy for investors to stay on track in achieving their investment goals.
Step 1: Review your investment goals
Take this opportunity to review your investment goals and the strategies you are pursuing to achieve those goals in order to remain focused on what's important to you. It is entirely possible that your goals have changed in response either to your life situation or to changes in the market. Accept what you can't control — volatility, and focus on what you can — your investment goals and strategies.
Step 2: Reassess your risk tolerance
Sit down with your financial advisor to discuss your investment goals and strategies, as well as any changes to your tolerance for risk. Consider your investment horizon. Increased market volatility and a new investment horizon may impact the strategies that can best help you achieve your investment goals. Remember, achieving your investment goals may require a certain amount of risk. Ultimately, you must maintain vigilance in reassessing your risk tolerance and the strategies you have selected in pursuit of your investment goals, and awareness of how those strategies may react to market volatility.
Step 3: Remain calm and focus on your long-term plan
Remember, investing is about the long game. Short term events are not necessarily evidence of a longer term reality. Investors who attempt to time the market too often end up reacting to a down turn by selling low and then compounding the problem by waiting on the sidelines, ultimately missing the right opportunity to reinvest.
As long as there is a market, there will be volatility. How you respond to that volatility can make a big difference in the measure of your success as an investor. Talk to your financial advisor about how working with Columbia Threadneedle Investments may help you position your portfolio for the reality of ongoing volatility and, perhaps, even turn such volatility into investment opportunity.
Best regards,

Christopher O. Petersen
President, Columbia Funds
Investors should consider the investment objectives, risks, charges and expenses of a mutual fund carefully before investing. For a free prospectus and summary prospectus, which contains this and other important information about a fund, visit investor.columbiathreadneedleus.com. The prospectus should be read carefully before investing.
Columbia Funds are distributed by Columbia Management Investment Distributors, Inc., member FINRA, and managed by Columbia Management Investment Advisers, LLC.
© 2017 Columbia Management Investment Advisers, LLC. All rights reserved.
COLUMBIA HIGH YIELD BOND FUND
Fund Investment Manager
Columbia Management Investment
Advisers, LLC
225 Franklin Street
Boston, MA 02110
Fund Distributor
Columbia Management Investment
Distributors, Inc.
225 Franklin Street
Boston, MA 02110
Fund Transfer Agent
Columbia Management Investment
Services Corp.
P.O. Box 8081
Boston, MA 02266-8081
For more information about any of the funds, please visit investor.columbiathreadneedleus.com or call 800.345.6611. Customer Service Representatives are available to answer your questions Monday through Friday from 8 a.m. to 7 p.m. Eastern time.
The views expressed in this report reflect the current views of the respective parties. These views are not guarantees of future performance and involve certain risks, uncertainties and assumptions that are difficult to predict, so actual outcomes and results may differ significantly from the views expressed. These views are subject to change at any time based upon economic, market or other conditions and the respective parties disclaim any responsibility to update such views. These views may not be relied on as investment advice and, because investment decisions for a Columbia fund are based on numerous factors, may not be relied on as an indication of trading intent on behalf of any particular Columbia fund. References to specific securities should not be construed as a recommendation or investment advice.
Performance Overview | | | 3 | | |
Portfolio Overview | | | 4 | | |
Understanding Your Fund's Expenses | | | 5 | | |
Portfolio of Investments | | | 6 | | |
Statement of Assets and Liabilities | | | 17 | | |
Statement of Operations | | | 19 | | |
Statement of Changes in Net Assets | | | 20 | | |
Financial Highlights | | | 23 | | |
Notes to Financial Statements | | | 34 | | |
Approval of Management Agreement | | | 44 | | |
Important Information About This Report | | | 47 | | |
COLUMBIA HIGH YIELD BOND FUND
PERFORMANCE OVERVIEW
(Unaudited)
Performance Summary
n Columbia High Yield Bond Fund (the Fund) Class A shares returned 4.29% excluding sales charges for the six-month period that ended November 30, 2016.
n The Fund underperformed its benchmark, the BofAML U.S. Cash Pay High Yield Constrained Index, which returned 6.53% during the same time frame.
Average Annual Total Returns (%) (for period ended November 30, 2016)
| | | Inception | | 6 Months
Cumulative | | 1 Year | | 5 Years | | 10 Years | |
Class A | | 12/08/83 | | | | | | | | | | | | | | | | | |
Excluding sales charges | | | | | | | 4.29 | | | | 7.67 | | | | 7.08 | | | | 6.65 | | |
Including sales charges | | | | | | | -0.61 | | | | 2.57 | | | | 6.06 | | | | 6.12 | | |
Class B | | 03/20/95 | | | | | | | | | | | | | | | | | |
Excluding sales charges | | | | | | | 3.91 | | | | 6.86 | | | | 6.36 | | | | 5.88 | | |
Including sales charges | | | | | | | -1.09 | | | | 1.86 | | | | 6.04 | | | | 5.88 | | |
Class C | | 06/26/00 | | | | | | | | | | | | | | | | | |
Excluding sales charges | | | | | | | 3.55 | | | | 6.88 | | | | 6.33 | | | | 5.87 | | |
Including sales charges | | | | | | | 2.55 | | | | 5.88 | | | | 6.33 | | | | 5.87 | | |
Class I | | 03/04/04 | | | 4.13 | | | | 7.71 | | | | 7.51 | | | | 7.07 | | |
Class K | | 03/20/95 | | | 3.98 | | | | 7.77 | | | | 7.19 | | | | 6.82 | | |
Class R* | | 12/11/06 | | | 4.16 | | | | 7.39 | | | | 6.88 | | | | 6.36 | | |
Class R4* | | 12/11/06 | | | 4.41 | | | | 7.91 | | | | 7.33 | | | | 6.74 | | |
Class R5* | | 12/11/06 | | | 4.11 | | | | 8.04 | | | | 7.46 | | | | 6.97 | | |
Class W | | 12/01/06 | | | 3.94 | | | | 7.47 | | | | 7.12 | | | | 6.56 | | |
Class Y* | | 11/08/12 | | | 4.13 | | | | 7.71 | | | | 7.42 | | | | 6.82 | | |
Class Z* | | 09/27/10 | | | 4.06 | | | | 7.56 | | | | 7.27 | | | | 6.77 | | |
BofAML U.S. Cash Pay High Yield Constrained Index | | | | | | | 6.53 | | | | 12.16 | | | | 7.41 | | | | 7.27 | | |
Returns for Class A are shown with and without the maximum initial sales charge of 4.75%. Returns for Class B are shown with and without the applicable contingent deferred sales charge (CDSC) of 5.00% in the first year, declining to 1.00% in the sixth year and eliminated thereafter. Returns for Class C are shown with and without the 1.00% CDSC for the first year only. The Fund's other classes are not subject to sales charges and have limited eligibility. Please see the Fund's prospectus for details. Performance for different share classes will vary based on differences in sales charges and fees associated with each class. All results shown assume reinvestment of distributions during the period. Returns do not reflect the deduction of taxes that a shareholder may pay on Fund distributions or on the redemption of Fund shares. Performance results reflect the effect of any fee waivers or reimbursements of Fund expenses by Columbia Management Investment Advisers, LLC and/or any of its affiliates. Absent these fee waivers or expense reimbursement arrangements, performance results would have been lower.
The performance information shown represents past performance and is not a guarantee of future results. The investment return and principal value of your investment will fluctuate so that your shares, when redeemed, may be worth more or less than their original cost. Current performance may be lower or higher than the performance information shown. You may obtain performance information current to the most recent month-end by contacting your financial intermediary, visiting investor.columbiathreadneedleus.com or calling 800.345.6611.
*The returns shown for periods prior to the share class inception date (including returns for the Life of the Fund, if shown, which are since Fund inception) include the returns of the Fund's oldest share class. These returns are adjusted to reflect any higher class-related operating expenses of the newer share classes, as applicable. Please visit investor.columbiathreadneedleus.com/investment-products/mutual-funds/appended-performance for more information.
The BofAML U.S. Cash Pay High Yield Constrained Index tracks the performance of U.S. dollar-denominated below investment grade corporate debt, currently in a coupon paying period that is publicly issued in the U.S. domestic market.
Indices are not available for investment, are not professionally managed and do not reflect sales charges, fees, brokerage commissions, taxes or other expenses of investing. Securities in the Fund may not match those in an index.
Semiannual Report 2016
3
COLUMBIA HIGH YIELD BOND FUND
PORTFOLIO OVERVIEW
(Unaudited)
Portfolio Management
Jennifer Ponce de Leon
Brian Lavin, CFA
Portfolio Breakdown (%)
(at November 30, 2016) | |
Common Stocks | | | 0.0 | (a) | |
Corporate Bonds & Notes | | | 94.6 | | |
Limited Partnerships | | | 0.0 | (a) | |
Money Market Funds | | | 3.8 | | |
Senior Loans | | | 1.6 | | |
Total | | | 100.0 | | |
Percentages indicated are based upon total investments. The Fund's portfolio composition is subject to change.
(a) Rounds to zero.
Quality Breakdown (%)
(at November 30, 2016) | |
BBB rating | | | 2.6 | | |
BB rating | | | 42.0 | | |
B rating | | | 42.4 | | |
CCC rating | | | 12.5 | | |
CC rating | | | 0.2 | | |
Not rated | | | 0.3 | | |
Total | | | 100.0 | | |
Percentages indicated are based upon total fixed income investments (excluding Money Market Funds).
Bond ratings apply to the underlying holdings of the Fund and not the Fund itself and are divided into categories ranging from highest to lowest credit quality, determined by using the average rating of Moody's, S&P and Fitch. When ratings are available from only two rating agencies, the average of the two rating is used. When a rating is available from only one rating agency, that rating is used. When a bond is not rated by any rating agency, it is designated as "Not rated." Credit quality ratings assigned by a rating agency are subjective opinions, not statements of fact, and are subject to change, including daily. The ratings assigned by credit rating agencies are but one of the considerations that the Investment Manager and/or Fund's subadviser incorporates into its credit analysis process, along with such other issuer-specific factors as cash flows, capital structure and leverage ratios, ability to de-leverage (repay) through free cash flow, quality of management, market positioning and access to capital, as well as such security-specific factors as the terms of the security (e.g., interest rate and time to maturity) and the amount and type of any collateral.
Semiannual Report 2016
4
COLUMBIA HIGH YIELD BOND FUND
UNDERSTANDING YOUR FUND'S EXPENSES
(Unaudited)
As an investor, you incur two types of costs. There are transaction costs, which generally include sales charges on purchases and may include redemption fees. There are also ongoing costs, which generally include management fees, distribution and/or service fees, and other fund expenses. The following information is intended to help you understand your ongoing costs (in dollars) of investing in the Fund and to help you compare these costs with the ongoing costs of investing in other mutual funds.
Analyzing Your Fund's Expenses
To illustrate these ongoing costs, we have provided examples and calculated the expenses paid by investors in each share class of the Fund during the period. The actual and hypothetical information in the table is based on an initial investment of $1,000 at the beginning of the period indicated and held for the entire period. Expense information is calculated two ways and each method provides you with different information. The amount listed in the "Actual" column is calculated using the Fund's actual operating expenses and total return for the period. You may use the Actual information, together with the amount invested, to estimate the expenses that you paid over the period. Simply divide your account value by $1,000 (for example, an $8,600 account value divided by $1,000 = 8.6), then multiply the results by the expenses paid during the period under the "Actual" column. The amount listed in the "Hypothetical" column assumes a 5% annual rate of return before expenses (which is not the Fund's actual return) and then applies the Fund's actual expense ratio for the period to the hypothetical return. You should not use the hypothetical account values and expenses to estimate either your actual account balance at the end of the period or the expenses you paid during the period. See "Compare With Other Funds" below for details on how to use the hypothetical data.
Compare With Other Funds
Since all mutual funds are required to include the same hypothetical calculations about expenses in shareholder reports, you can use this information to compare the ongoing cost of investing in the Fund with other funds. To do so, compare the hypothetical example with the 5% hypothetical examples that appear in the shareholder reports of other funds. As you compare hypothetical examples of other funds, it is important to note that hypothetical examples are meant to highlight the ongoing costs of investing in a fund only and do not reflect any transaction costs, such as sales charges, or redemption or exchange fees. Therefore, the hypothetical calculations are useful in comparing ongoing costs only, and will not help you determine the relative total costs of owning different funds. If transaction costs were included in these calculations, your costs would be higher.
June 1, 2016 – November 30, 2016
| | | Account Value at the Beginning
of the Period ($) | | Account Value at the End of the
Period ($) | | Expenses Paid During the
Period ($) | | Fund's Annualized
Expense Ratio (%) | |
| | | Actual | | Hypothetical | | Actual | | Hypothetical | | Actual | | Hypothetical | | Actual | |
Class A | | | 1,000.00 | | | | 1,000.00 | | | | 1,042.90 | | | | 1,019.85 | | | | 5.33 | | | | 5.27 | | | | 1.04 | | |
Class B | | | 1,000.00 | | | | 1,000.00 | | | | 1,039.10 | | | | 1,016.14 | | | | 9.10 | | | | 9.00 | | | | 1.78 | | |
Class C | | | 1,000.00 | | | | 1,000.00 | | | | 1,035.50 | | | | 1,016.14 | | | | 9.08 | | | | 9.00 | | | | 1.78 | | |
Class I | | | 1,000.00 | | | | 1,000.00 | | | | 1,041.30 | | | | 1,021.81 | | | | 3.33 | | | | 3.29 | | | | 0.65 | | |
Class K | | | 1,000.00 | | | | 1,000.00 | | | | 1,039.80 | | | | 1,020.36 | | | | 4.81 | | | | 4.76 | | | | 0.94 | | |
Class R | | | 1,000.00 | | | | 1,000.00 | | | | 1,041.60 | | | | 1,018.60 | | | | 6.60 | | | | 6.53 | | | | 1.29 | | |
Class R4 | | | 1,000.00 | | | | 1,000.00 | | | | 1,044.10 | | | | 1,021.11 | | | | 4.05 | | | | 4.00 | | | | 0.79 | | |
Class R5 | | | 1,000.00 | | | | 1,000.00 | | | | 1,041.10 | | | | 1,021.61 | | | | 3.53 | | | | 3.50 | | | | 0.69 | | |
Class W | | | 1,000.00 | | | | 1,000.00 | | | | 1,039.40 | | | | 1,019.85 | | | | 5.32 | | | | 5.27 | | | | 1.04 | | |
Class Y | | | 1,000.00 | | | | 1,000.00 | | | | 1,041.30 | | | | 1,021.81 | | | | 3.33 | | | | 3.29 | | | | 0.65 | | |
Class Z | | | 1,000.00 | | | | 1,000.00 | | | | 1,040.60 | | | | 1,021.11 | | | | 4.04 | | | | 4.00 | | | | 0.79 | | |
Expenses paid during the period are equal to the annualized expense ratio for each class as indicated above, multiplied by the average account value over the period and then multiplied by the number of days in the Fund's most recent fiscal half year and divided by 365.
Expenses do not include fees and expenses incurred indirectly by the Fund from its investment in underlying funds, including affiliated and non-affiliated pooled investment vehicles, such as mutual funds and exchange-traded funds.
Semiannual Report 2016
5
COLUMBIA HIGH YIELD BOND FUND
PORTFOLIO OF INVESTMENTS
November 30, 2016 (Unaudited)
(Percentages represent value of investments compared to net assets)
Corporate Bonds & Notes 94.0%
Issuer | | Coupon
Rate | | Principal
Amount ($) | |
Value ($) | |
AEROSPACE & DEFENSE 1.3% | |
Bombardier, Inc.(a)
12/01/21 | | | 8.750 | % | | | 4,392,000 | | | | 4,359,060 | | |
TransDigm, Inc.
07/15/24 | | | 6.500 | % | | | 3,538,000 | | | | 3,666,253 | | |
05/15/25 | | | 6.500 | % | | | 3,866,000 | | | | 3,981,980 | | |
TransDigm, Inc.(a)
06/15/26 | | | 6.375 | % | | | 14,337,000 | | | | 14,587,897 | | |
Total | | | | | | | 26,595,190 | | |
AUTOMOTIVE 0.8% | |
Gates Global LLC/Co.(a)
07/15/22 | | | 6.000 | % | | | 5,971,000 | | | | 5,702,305 | | |
IHO Verwaltungs GmbH PIK(a)
09/15/23 | | | 4.500 | % | | | 1,089,000 | | | | 1,060,414 | | |
09/15/26 | | | 4.750 | % | | | 2,599,000 | | | | 2,475,548 | | |
ZF North America Capital, Inc.(a) | |
04/29/22 | | | 4.500 | % | | | 3,321,000 | | | | 3,428,932 | | |
04/29/25 | | | 4.750 | % | | | 2,940,000 | | | | 2,945,512 | | |
Total | | | | | | | 15,612,711 | | |
BANKING 1.4% | |
Ally Financial, Inc.
02/13/22 | | | 4.125 | % | | | 7,200,000 | | | | 7,038,000 | | |
05/19/22 | | | 4.625 | % | | | 10,106,000 | | | | 10,070,629 | | |
09/30/24 | | | 5.125 | % | | | 3,851,000 | | | | 3,851,000 | | |
03/30/25 | | | 4.625 | % | | | 2,260,000 | | | | 2,192,200 | | |
Subordinated
11/20/25 | | | 5.750 | % | | | 4,964,000 | | | | 4,914,360 | | |
Synovus Financial Corp.
Subordinated
06/15/17 | | | 5.125 | % | | | 489,000 | | | | 495,724 | | |
Total | | | | | | | 28,561,913 | | |
BROKERAGE/ASSET MANAGERS/EXCHANGES 0.3% | |
E*TRADE Financial Corp.
09/15/23 | | | 4.625 | % | | | 3,749,000 | | | | 3,807,252 | | |
NPF Corp.(a) | |
07/15/21 | | | 9.000 | % | | | 1,429,000 | | | | 1,479,015 | | |
Total | | | | | | | 5,286,267 | | |
BUILDING MATERIALS 1.3% | |
Allegion PLC
09/15/23 | | | 5.875 | % | | | 4,557,000 | | | | 4,836,116 | | |
Allegion US Holding Co., Inc.
10/01/21 | | | 5.750 | % | | | 1,688,000 | | | | 1,755,520 | | |
American Builders & Contractors Supply Co., Inc.(a)
04/15/21 | | | 5.625 | % | | | 6,753,000 | | | | 6,972,472 | | |
12/15/23 | | | 5.750 | % | | | 1,459,000 | | | | 1,499,123 | | |
Corporate Bonds & Notes (continued)
Issuer | | Coupon
Rate | | Principal
Amount ($) | |
Value ($) | |
Beacon Roofing Supply, Inc.
10/01/23 | | | 6.375 | % | | | 3,751,000 | | | | 3,985,437 | | |
Eagle Materials, Inc.
08/01/26 | | | 4.500 | % | | | 1,085,000 | | | | 1,066,013 | | |
Gibraltar Industries, Inc.
02/01/21 | | | 6.250 | % | | | 1,557,000 | | | | 1,599,818 | | |
HD Supply, Inc.(a)
04/15/24 | | | 5.750 | % | | | 2,579,000 | | | | 2,637,027 | | |
NCI Building Systems, Inc.(a) | |
01/15/23 | | | 8.250 | % | | | 1,950,000 | | | | 2,110,875 | | |
Total | | | | | | | 26,462,401 | | |
CABLE AND SATELLITE 9.0% | |
Altice US Finance I Corp.(a)
07/15/23 | | | 5.375 | % | | | 3,297,000 | | | | 3,334,091 | | |
05/15/26 | | | 5.500 | % | | | 8,861,000 | | | | 8,772,390 | | |
CCO Holdings LLC/Capital Corp.
09/30/22 | | | 5.250 | % | | | 267,000 | | | | 277,013 | | |
CCO Holdings LLC/Capital Corp.(a)
05/01/23 | | | 5.125 | % | | | 618,000 | | | | 633,064 | | |
04/01/24 | | | 5.875 | % | | | 8,833,000 | | | | 9,351,939 | | |
05/01/25 | | | 5.375 | % | | | 8,876,000 | | | | 9,020,235 | | |
02/15/26 | | | 5.750 | % | | | 3,324,000 | | | | 3,415,410 | | |
05/01/26 | | | 5.500 | % | | | 3,194,000 | | | | 3,225,940 | | |
05/01/27 | | | 5.875 | % | | | 1,954,000 | | | | 1,993,080 | | |
CSC Holdings LLC
02/15/19 | | | 8.625 | % | | | 1,688,000 | | | | 1,861,020 | | |
CSC Holdings LLC(a)
01/15/23 | | | 10.125 | % | | | 2,507,000 | | | | 2,889,318 | | |
10/15/25 | | | 6.625 | % | | | 8,693,000 | | | | 9,366,707 | | |
10/15/25 | | | 10.875 | % | | | 14,784,000 | | | | 17,186,400 | | |
04/15/27 | | | 5.500 | % | | | 1,856,000 | | | | 1,831,640 | | |
Cequel Communications Holdings I LLC/Capital Corp.(a)
09/15/20 | | | 6.375 | % | | | 4,568,000 | | | | 4,659,360 | | |
12/15/21 | | | 5.125 | % | | | 2,020,000 | | | | 1,989,700 | | |
12/15/21 | | | 5.125 | % | | | 3,721,000 | | | | 3,669,836 | | |
07/15/25 | | | 7.750 | % | | | 4,726,000 | | | | 5,056,820 | | |
DISH DBS Corp.
06/01/21 | | | 6.750 | % | | | 2,576,000 | | | | 2,769,200 | | |
07/15/22 | | | 5.875 | % | | | 3,458,000 | | | | 3,579,030 | | |
11/15/24 | | | 5.875 | % | | | 6,100,000 | | | | 6,183,875 | | |
07/01/26 | | | 7.750 | % | | | 12,045,000 | | | | 13,294,669 | | |
Hughes Satellite Systems Corp.(a)
08/01/26 | | | 5.250 | % | | | 3,477,000 | | | | 3,290,111 | | |
Sirius XM Radio, Inc.(a)
05/15/23 | | | 4.625 | % | | | 1,825,000 | | | | 1,793,063 | | |
04/15/25 | | | 5.375 | % | | | 4,890,000 | | | | 4,902,225 | | |
Unitymedia GmbH(a)
01/15/25 | | | 6.125 | % | | | 5,625,000 | | | | 5,723,437 | | |
The accompanying Notes to Financial Statements are an integral part of this statement.
Semiannual Report 2016
6
COLUMBIA HIGH YIELD BOND FUND
PORTFOLIO OF INVESTMENTS (continued)
November 30, 2016 (Unaudited)
Corporate Bonds & Notes (continued)
Issuer | | Coupon
Rate | | Principal
Amount ($) | |
Value ($) | |
Unitymedia Hessen GmbH & Co. KG NRW(a)
01/15/23 | | | 5.500 | % | | | 1,972,000 | | | | 2,018,835 | | |
01/15/25 | | | 5.000 | % | | | 6,157,000 | | | | 6,049,252 | | |
Videotron Ltd.
07/15/22 | | | 5.000 | % | | | 3,578,000 | | | | 3,649,560 | | |
Videotron Ltd.(a)
06/15/24 | | | 5.375 | % | | | 2,137,000 | | | | 2,180,595 | | |
Virgin Media Finance PLC(a)
10/15/24 | | | 6.000 | % | | | 1,618,000 | | | | 1,626,090 | | |
01/15/25 | | | 5.750 | % | | | 10,643,000 | | | | 10,536,570 | | |
Virgin Media Secured Finance PLC(a)
01/15/26 | | | 5.250 | % | | | 6,495,000 | | | | 6,283,912 | | |
08/15/26 | | | 5.500 | % | | | 4,077,000 | | | | 3,995,460 | | |
Ziggo Bond Finance BV(a)
01/15/27 | | | 6.000 | % | | | 4,224,000 | | | | 4,055,040 | | |
Ziggo Secured Finance BV(a)
01/15/27 | | | 5.500 | % | | | 10,835,000 | | | | 10,401,600 | | |
Total | | | | | | | 180,866,487 | | |
CHEMICALS 2.6% | |
Angus Chemical Co.(a)
02/15/23 | | | 8.750 | % | | | 4,470,000 | | | | 4,548,225 | | |
Axalta Coating Systems LLC(a)
08/15/24 | | | 4.875 | % | | | 3,649,000 | | | | 3,630,755 | | |
Chemours Co. (The)
05/15/23 | | | 6.625 | % | | | 5,213,000 | | | | 5,147,838 | | |
05/15/25 | | | 7.000 | % | | | 5,481,000 | | | | 5,398,785 | | |
Eco Services Operations LLC/Finance Corp.(a)
11/01/22 | | | 8.500 | % | | | 4,348,000 | | | | 4,587,140 | | |
Huntsman International LLC
11/15/20 | | | 4.875 | % | | | 3,300,000 | | | | 3,390,750 | | |
11/15/22 | | | 5.125 | % | | | 2,948,000 | | | | 2,992,220 | | |
INEOS Group Holdings SA(a)
08/01/24 | | | 5.625 | % | | | 6,598,000 | | | | 6,448,225 | | |
PQ Corp.(a)
11/15/22 | | | 6.750 | % | | | 7,780,000 | | | | 8,217,625 | | |
Platform Specialty Products Corp.(a)
05/01/21 | | | 10.375 | % | | | 4,762,000 | | | | 5,202,485 | | |
02/01/22 | | | 6.500 | % | | | 2,322,000 | | | | 2,287,170 | | |
Total | | | | | | | 51,851,218 | | |
CONSTRUCTION MACHINERY 0.7% | |
Herc Rentals, Inc.(a)
06/01/24 | | | 7.750 | % | | | 1,050,000 | | | | 1,078,875 | | |
United Rentals North America, Inc.
06/15/23 | | | 6.125 | % | | | 3,581,000 | | | | 3,777,955 | | |
09/15/26 | | | 5.875 | % | | | 7,365,000 | | | | 7,512,300 | | |
05/15/27 | | | 5.500 | % | | | 2,267,000 | | | | 2,266,547 | | |
Total | | | | | | | 14,635,677 | | |
Corporate Bonds & Notes (continued)
Issuer | | Coupon
Rate | | Principal
Amount ($) | |
Value ($) | |
CONSUMER CYCLICAL SERVICES 1.8% | |
APX Group, Inc.
12/01/19 | | | 6.375 | % | | | 3,817,000 | | | | 3,912,425 | | |
12/01/20 | | | 8.750 | % | | | 6,746,000 | | | | 6,611,080 | | |
12/01/22 | | | 7.875 | % | | | 6,800,000 | | | | 7,267,500 | | |
IHS Markit Ltd.(a)
11/01/22 | | | 5.000 | % | | | 8,979,000 | | | | 9,205,450 | | |
Interval Acquisition Corp.
04/15/23 | | | 5.625 | % | | | 9,558,000 | | | | 9,796,950 | | |
Total | | | | | | | 36,793,405 | | |
CONSUMER PRODUCTS 1.9% | |
NBTY, Inc.(a)
05/15/21 | | | 7.625 | % | | | 3,375,000 | | | | 3,328,594 | | |
Prestige Brands, Inc.(a)
03/01/24 | | | 6.375 | % | | | 6,413,000 | | | | 6,701,585 | | |
Scotts Miracle-Gro Co. (The)(a)
10/15/23 | | | 6.000 | % | | | 6,237,000 | | | | 6,595,627 | | |
Spectrum Brands, Inc.
07/15/25 | | | 5.750 | % | | | 6,458,000 | | | | 6,700,175 | | |
Springs Industries, Inc.
06/01/21 | | | 6.250 | % | | | 6,532,000 | | | | 6,719,795 | | |
Tempur Sealy International, Inc.
10/15/23 | | | 5.625 | % | | | 2,887,000 | | | | 2,944,740 | | |
06/15/26 | | | 5.500 | % | | | 3,742,000 | | | | 3,723,290 | | |
Valvoline, Inc.(a)
07/15/24 | | | 5.500 | % | | | 686,000 | | | | 710,868 | | |
Total | | | | | | | 37,424,674 | | |
DIVERSIFIED MANUFACTURING 0.8% | |
Entegris, Inc.(a)
04/01/22 | | | 6.000 | % | | | 5,733,000 | | | | 5,962,320 | | |
Manitowoc Foodservice, Inc.
02/15/24 | | | 9.500 | % | | | 1,206,000 | | | | 1,374,840 | | |
SPX FLOW, Inc.(a)
08/15/24 | | | 5.625 | % | | | 1,294,000 | | | | 1,271,355 | | |
08/15/26 | | | 5.875 | % | | | 4,783,000 | | | | 4,675,382 | | |
Zekelman Industries, Inc.(a)
06/15/23 | | | 9.875 | % | | | 1,817,000 | | | | 1,948,733 | | |
Total | | | | | | | 15,232,630 | | |
ELECTRIC 2.6% | |
AES Corp. (The)
05/15/26 | | | 6.000 | % | | | 4,759,000 | | | | 4,675,718 | | |
Calpine Corp.
01/15/23 | | | 5.375 | % | | | 9,900,000 | | | | 9,557,559 | | |
02/01/24 | | | 5.500 | % | | | 3,320,000 | | | | 3,170,600 | | |
The accompanying Notes to Financial Statements are an integral part of this statement.
Semiannual Report 2016
7
COLUMBIA HIGH YIELD BOND FUND
PORTFOLIO OF INVESTMENTS (continued)
November 30, 2016 (Unaudited)
Corporate Bonds & Notes (continued)
Issuer | | Coupon
Rate | | Principal
Amount ($) | |
Value ($) | |
Dynegy, Inc.
11/01/24 | | | 7.625 | % | | | 2,000,000 | | | | 1,840,000 | | |
NRG Energy, Inc. | |
07/15/22 | | | 6.250 | % | | | 4,446,000 | | | | 4,457,115 | | |
05/01/24 | | | 6.250 | % | | | 3,784,000 | | | | 3,661,020 | | |
NRG Energy, Inc.(a) | |
05/15/26 | | | 7.250 | % | | | 7,729,000 | | | | 7,555,097 | | |
01/15/27 | | | 6.625 | % | | | 5,409,000 | | | | 5,003,325 | | |
NRG Yield Operating LLC | |
08/15/24 | | | 5.375 | % | | | 11,163,000 | | | | 11,079,277 | | |
NRG Yield Operating LLC(a)
09/15/26 | | | 5.000 | % | | | 1,000,000 | | | | 947,500 | | |
Total | | | | | | | 51,947,211 | | |
FINANCE COMPANIES 3.6% | |
Aircastle Ltd.
02/15/22 | | | 5.500 | % | | | 6,107,000 | | | | 6,412,350 | | |
04/01/23 | | | 5.000 | % | | | 767,000 | | | | 771,794 | | |
CIT Group, Inc.
02/19/19 | | | 3.875 | % | | | 4,850,000 | | | | 4,934,875 | | |
05/15/20 | | | 5.375 | % | | | 8,915,000 | | | | 9,427,612 | | |
CIT Group, Inc.(a)
02/15/19 | | | 5.500 | % | | | 7,665,000 | | | | 8,076,994 | | |
Navient Corp.
03/25/20 | | | 8.000 | % | | | 681,000 | | | | 748,249 | | |
10/26/20 | | | 5.000 | % | | | 2,877,000 | | | | 2,909,366 | | |
07/26/21 | | | 6.625 | % | | | 4,022,000 | | | | 4,197,963 | | |
01/25/22 | | | 7.250 | % | | | 2,868,000 | | | | 2,968,380 | | |
10/25/24 | | | 5.875 | % | | | 3,168,000 | | | | 2,930,400 | | |
OneMain Financial Holdings LLC(a)
12/15/19 | | | 6.750 | % | | | 3,018,000 | | | | 3,070,815 | | |
12/15/21 | | | 7.250 | % | | | 4,938,000 | | | | 4,950,345 | | |
Provident Funding Associates LP/Finance Corp.(a)
06/15/21 | | | 6.750 | % | | | 15,021,000 | | | | 15,133,657 | | |
Quicken Loans, Inc.(a)
05/01/25 | | | 5.750 | % | | | 3,757,000 | | | | 3,606,720 | | |
Springleaf Finance Corp.
12/15/20 | | | 8.250 | % | | | 1,511,000 | | | | 1,573,329 | | |
10/01/23 | | | 8.250 | % | | | 871,000 | | | | 867,189 | | |
Total | | | | | | | 72,580,038 | | |
FOOD AND BEVERAGE 1.5% | |
FAGE International SA/USA Dairy Industry, Inc.(a)
08/15/26 | | | 5.625 | % | | | 3,923,000 | | | | 3,923,000 | | |
Lamb Weston Holdings, Inc.(a)
11/01/24 | | | 4.625 | % | | | 2,055,000 | | | | 2,046,009 | | |
Pinnacle Foods Finance LLC/Corp.
01/15/24 | | | 5.875 | % | | | 663,000 | | | | 697,808 | | |
Corporate Bonds & Notes (continued)
Issuer | | Coupon
Rate | | Principal
Amount ($) | |
Value ($) | |
Post Holdings, Inc.(a)
12/15/22 | | | 6.000 | % | | | 5,149,000 | | | | 5,346,722 | | |
03/15/24 | | | 7.750 | % | | | 7,207,000 | | | | 7,945,717 | | |
08/15/26 | | | 5.000 | % | | | 3,900,000 | | | | 3,690,375 | | |
WhiteWave Foods Co. (The)
10/01/22 | | | 5.375 | % | | | 5,270,000 | | | | 5,810,175 | | |
Total | | | | | | | 29,459,806 | | |
GAMING 4.5% | |
Boyd Gaming Corp.
05/15/23 | | | 6.875 | % | | | 5,088,000 | | | | 5,406,000 | | |
Boyd Gaming Corp.(a)
04/01/26 | | | 6.375 | % | | | 5,073,000 | | | | 5,288,603 | | |
International Game Technology PLC(a)
02/15/22 | | | 6.250 | % | | | 5,709,000 | | | | 6,065,812 | | |
02/15/25 | | | 6.500 | % | | | 4,549,000 | | | | 4,833,313 | | |
Jack Ohio Fin Llc/jack Ohio Fin 1(a)
11/15/21 | | | 6.750 | % | | | 6,309,000 | | | | 6,324,772 | | |
MGM Growth Properties Operating Partnership LP/
Finance Co-Issuer, Inc.(a)
09/01/26 | | | 4.500 | % | | | 2,156,000 | | | | 2,064,370 | | |
MGM Growth Properties Operating Partnership LP/
MGP Finance Co-Issuer, Inc.(a)
05/01/24 | | | 5.625 | % | | | 2,126,000 | | | | 2,226,985 | | |
MGM Resorts International
10/01/20 | | | 6.750 | % | | | 3,344,000 | | | | 3,661,680 | | |
12/15/21 | | | 6.625 | % | | | 6,129,000 | | | | 6,695,932 | | |
03/15/23 | | | 6.000 | % | | | 4,095,000 | | | | 4,402,125 | | |
09/01/26 | | | 4.625 | % | | | 4,763,000 | | | | 4,536,758 | | |
Rivers Pittsburgh Borrower LP/Finance Corp.(a)
08/15/21 | | | 6.125 | % | | | 1,283,000 | | | | 1,305,453 | | |
Scientific Games International, Inc.
12/01/22 | | | 10.000 | % | | | 12,140,000 | | | | 11,381,250 | | |
Scientific Games International, Inc.(a)
01/01/22 | | | 7.000 | % | | | 10,247,000 | | | | 10,810,585 | | |
Seminole Tribe of Florida, Inc.(a)
10/01/20 | | | 6.535 | % | | | 3,400,000 | | | | 3,417,000 | | |
10/01/20 | | | 7.804 | % | | | 1,735,000 | | | | 1,721,085 | | |
SugarHouse HSP Gaming LP/Finance Corp.(a)
06/01/21 | | | 6.375 | % | | | 5,517,000 | | | | 5,489,415 | | |
Tunica-Biloxi Gaming Authority(a)(b)
11/15/16 | | | 0.000 | % | | | 8,862,000 | | | | 3,611,265 | | |
Total | | | | | | | 89,242,403 | | |
HEALTH CARE 6.2% | |
Acadia Healthcare Co., Inc.
07/01/22 | | | 5.125 | % | | | 1,334,000 | | | | 1,290,645 | | |
02/15/23 | | | 5.625 | % | | | 1,718,000 | | | | 1,692,230 | | |
03/01/24 | | | 6.500 | % | | | 4,887,000 | | | | 4,862,565 | | |
The accompanying Notes to Financial Statements are an integral part of this statement.
Semiannual Report 2016
8
COLUMBIA HIGH YIELD BOND FUND
PORTFOLIO OF INVESTMENTS (continued)
November 30, 2016 (Unaudited)
Corporate Bonds & Notes (continued)
Issuer | | Coupon
Rate | | Principal
Amount ($) | |
Value ($) | |
Alere, Inc.(a)
07/01/23 | | | 6.375 | % | | | 3,520,000 | | | | 3,550,800 | | |
Amsurg Corp.
07/15/22 | | | 5.625 | % | | | 3,850,000 | | | | 3,931,812 | | |
Change Healthcare Holdings, Inc.(a)
02/15/21 | | | 6.000 | % | | | 2,858,000 | | | | 2,979,751 | | |
DaVita, Inc.
08/15/22 | | | 5.750 | % | | | 9,431,000 | | | | 9,784,662 | | |
Envision Healthcare Corporation(a)(c)
12/01/24 | | | 6.250 | % | | | 1,641,000 | | | | 1,698,435 | | |
Fresenius Medical Care U.S. Finance II, Inc.(a)
10/15/24 | | | 4.750 | % | | | 2,883,000 | | | | 2,883,000 | | |
HCA, Inc.
02/15/22 | | | 7.500 | % | | | 7,598,000 | | | | 8,452,775 | | |
02/01/25 | | | 5.375 | % | | | 14,677,000 | | | | 14,365,114 | | |
04/15/25 | | | 5.250 | % | | | 6,176,000 | | | | 6,222,320 | | |
06/15/26 | | | 5.250 | % | | | 6,707,000 | | | | 6,714,244 | | |
02/15/27 | | | 4.500 | % | | | 5,819,000 | | | | 5,484,407 | | |
HealthSouth Corp.
11/01/24 | | | 5.750 | % | | | 1,964,000 | | | | 1,968,910 | | |
09/15/25 | | | 5.750 | % | | | 2,020,000 | | | | 2,014,950 | | |
Kinetic Concepts, Inc./KCI U.S.A., Inc.(a)
02/15/21 | | | 7.875 | % | | | 3,681,000 | | | | 3,883,455 | | |
MEDNAX, Inc.(a)
12/01/23 | | | 5.250 | % | | | 4,223,000 | | | | 4,286,345 | | |
MPH Acquisition Holdings LLC(a)
06/01/24 | | | 7.125 | % | | | 8,657,000 | | | | 9,089,850 | | |
Sterigenics-Nordion Holdings LLC(a)
05/15/23 | | | 6.500 | % | | | 4,921,000 | | | | 4,945,605 | | |
Surgical Care Affiliates, Inc.(a)
04/01/23 | | | 6.000 | % | | | 2,222,000 | | | | 2,266,440 | | |
Teleflex, Inc.
06/01/26 | | | 4.875 | % | | | 1,268,000 | | | | 1,255,320 | | |
Tenet Healthcare Corp.
04/01/21 | | | 4.500 | % | | | 11,975,000 | | | | 11,615,750 | | |
04/01/22 | | | 8.125 | % | | | 6,364,000 | | | | 5,823,060 | | |
Tenet Healthcare Corporation(a)(c)
01/01/22 | | | 7.500 | % | | | 2,461,000 | | | | 2,530,216 | | |
Total | | | | | | | 123,592,661 | | |
HEALTHCARE INSURANCE 0.8% | |
Centene Corp.
05/15/22 | | | 4.750 | % | | | 4,590,000 | | | | 4,521,150 | | |
02/15/24 | | | 6.125 | % | | | 3,161,000 | | | | 3,211,892 | | |
01/15/25 | | | 4.750 | % | | | 2,708,000 | | | | 2,592,910 | | |
Molina Healthcare, Inc. | |
11/15/22 | | | 5.375 | % | | | 4,856,000 | | | | 4,862,070 | | |
Total | | | | | | | 15,188,022 | | |
Corporate Bonds & Notes (continued)
Issuer | | Coupon
Rate | | Principal
Amount ($) | |
Value ($) | |
HOME CONSTRUCTION 0.9% | |
Beazer Homes USA, Inc.(a)
03/15/22 | | | 8.750 | % | | | 1,915,000 | | | | 2,034,688 | | |
CalAtlantic Group, Inc.
12/15/21 | | | 6.250 | % | | | 2,285,000 | | | | 2,444,950 | | |
11/15/24 | | | 5.875 | % | | | 5,630,000 | | | | 5,784,825 | | |
Meritage Homes Corp.
04/01/22 | | | 7.000 | % | | | 3,328,000 | | | | 3,619,200 | | |
06/01/25 | | | 6.000 | % | | | 1,948,000 | | | | 1,996,700 | | |
Taylor Morrison Communities, Inc./Monarch, Inc.(a)
03/01/24 | | | 5.625 | % | | | 2,745,000 | | | | 2,765,587 | | |
Total | | | | | | | 18,645,950 | | |
INDEPENDENT ENERGY 10.2% | |
Antero Resources Corp.
12/01/22 | | | 5.125 | % | | | 8,500,000 | | | | 8,627,500 | | |
Callon Petroleum Co.(a)
10/01/24 | | | 6.125 | % | | | 1,425,000 | | | | 1,460,625 | | |
Carrizo Oil & Gas, Inc.
04/15/23 | | | 6.250 | % | | | 17,807,000 | | | | 18,163,140 | | |
Chesapeake Energy Corp.(a)
12/15/22 | | | 8.000 | % | | | 1,950,000 | | | | 2,018,250 | | |
Concho Resources, Inc.
01/15/22 | | | 6.500 | % | | | 965,000 | | | | 1,001,188 | | |
10/01/22 | | | 5.500 | % | | | 3,987,000 | | | | 4,096,643 | | |
04/01/23 | | | 5.500 | % | | | 14,133,000 | | | | 14,530,844 | | |
Continental Resources, Inc.
04/15/23 | | | 4.500 | % | | | 2,564,000 | | | | 2,493,490 | | |
06/01/24 | | | 3.800 | % | | | 7,287,000 | | | | 6,740,475 | | |
CrownRock LP/Finance, Inc.(a)
04/15/21 | | | 7.125 | % | | | 822,000 | | | | 852,825 | | |
02/15/23 | | | 7.750 | % | | | 8,690,000 | | | | 9,254,850 | | |
Denbury Resources, Inc.(a)
05/15/21 | | | 9.000 | % | | | 5,499,000 | | | | 5,705,212 | | |
Diamondback Energy, Inc.(a)
11/01/24 | | | 4.750 | % | | | 1,501,000 | | | | 1,502,876 | | |
Extraction Oil & Gas Holdings LLC/Finance Corp.(a)
07/15/21 | | | 7.875 | % | | | 10,112,000 | | | | 10,642,880 | | |
Laredo Petroleum, Inc.
01/15/22 | | | 5.625 | % | | | 5,966,000 | | | | 5,951,085 | | |
05/01/22 | | | 7.375 | % | | | 3,662,000 | | | | 3,808,480 | | |
03/15/23 | | | 6.250 | % | | | 15,925,000 | | | | 16,203,687 | | |
Newfield Exploration Co.
01/30/22 | | | 5.750 | % | | | 313,000 | | | | 323,955 | | |
07/01/24 | | | 5.625 | % | | | 7,025,000 | | | | 7,244,531 | | |
Oasis Petroleum, Inc.
03/15/22 | | | 6.875 | % | | | 3,561,000 | | | | 3,667,830 | | |
01/15/23 | | | 6.875 | % | | | 8,207,000 | | | | 8,412,175 | | |
The accompanying Notes to Financial Statements are an integral part of this statement.
Semiannual Report 2016
9
COLUMBIA HIGH YIELD BOND FUND
PORTFOLIO OF INVESTMENTS (continued)
November 30, 2016 (Unaudited)
Corporate Bonds & Notes (continued)
Issuer | | Coupon
Rate | | Principal
Amount ($) | |
Value ($) | |
PDC Energy, Inc.(a)
09/15/24 | | | 6.125 | % | | | 7,187,000 | | | | 7,366,675 | | |
Parsley Energy LLC/Finance Corp.(a)
02/15/22 | | | 7.500 | % | | | 11,460,000 | | | | 12,147,600 | | |
06/01/24 | | | 6.250 | % | | | 6,523,000 | | | | 6,751,305 | | |
QEP Resources, Inc.
05/01/23 | | | 5.250 | % | | | 202,000 | | | | 195,940 | | |
RSP Permian, Inc.
10/01/22 | | | 6.625 | % | | | 6,702,000 | | | | 7,037,100 | | |
Range Resources Corp.(a)
03/15/23 | | | 5.000 | % | | | 3,270,000 | | | | 3,139,200 | | |
SM Energy Co.
06/01/25 | | | 5.625 | % | | | 1,555,000 | | | | 1,492,800 | | |
09/15/26 | | | 6.750 | % | | | 6,000,000 | | | | 6,165,000 | | |
WPX Energy, Inc.
01/15/22 | | | 6.000 | % | | | 18,624,000 | | | | 19,083,827 | | |
Whiting Petroleum Corp.
03/15/21 | | | 5.750 | % | | | 8,245,000 | | | | 8,121,325 | | |
04/01/23 | | | 6.250 | % | | | 279,000 | | | | 272,374 | | |
Total | | | | | | | 204,475,687 | | |
LEISURE 0.5% | |
LTF Merger Sub, Inc.(a)
06/15/23 | | | 8.500 | % | | | 4,934,000 | | | | 5,032,680 | | |
Live Nation Entertainment, Inc.(a)
11/01/24 | | | 4.875 | % | | | 4,602,000 | | | | 4,578,990 | | |
Total | | | | | | | 9,611,670 | | |
LODGING 0.8% | |
Hilton Domestic Operating Co., Inc.(a)
09/01/24 | | | 4.250 | % | | | 2,839,000 | | | | 2,782,220 | | |
Hilton Grand Vacations Borrower(a)
12/01/24 | | | 6.125 | % | | | 2,046,000 | | | | 2,097,150 | | |
Playa Resorts Holding BV(a)
08/15/20 | | | 8.000 | % | | | 10,125,000 | | | | 10,403,438 | | |
Total | | | | | | | 15,282,808 | | |
MEDIA AND ENTERTAINMENT 3.3% | |
AMC Networks, Inc.
04/01/24 | | | 5.000 | % | | | 2,987,000 | | | | 2,994,468 | | |
CBS Radio, Inc.(a)
11/01/24 | | | 7.250 | % | | | 1,049,000 | | | | 1,102,100 | | |
Lamar Media Corp.
02/01/26 | | | 5.750 | % | | | 1,329,000 | | | | 1,403,025 | | |
MDC Partners, Inc.(a)
05/01/24 | | | 6.500 | % | | | 13,614,000 | | | | 11,691,023 | | |
Match Group, Inc.
06/01/24 | | | 6.375 | % | | | 5,138,000 | | | | 5,427,013 | | |
Corporate Bonds & Notes (continued)
Issuer | | Coupon
Rate | | Principal
Amount ($) | |
Value ($) | |
Netflix, Inc.
02/15/22 | | | 5.500 | % | | | 1,351,000 | | | | 1,445,570 | | |
02/15/25 | | | 5.875 | % | | | 12,075,000 | | | | 12,921,578 | | |
Netflix, Inc.(a)
11/15/26 | | | 4.375 | % | | | 13,190,000 | | | | 12,843,894 | | |
Outfront Media Capital LLC/Corp.
03/15/25 | | | 5.875 | % | | | 6,467,000 | | | | 6,661,010 | | |
Univision Communications, Inc.(a)
02/15/25 | | | 5.125 | % | | | 10,510,000 | | | | 9,958,225 | | |
Total | | | | | | | 66,447,906 | | |
METALS 3.0% | |
Alcoa Nederland Holding BV(a)
09/30/24 | | | 6.750 | % | | | 2,114,000 | | | | 2,267,265 | | |
09/30/26 | | | 7.000 | % | | | 1,675,000 | | | | 1,775,500 | | |
ArcelorMittal(d)
02/25/22 | | | 7.250 | % | | | 7,776,000 | | | | 8,748,000 | | |
Constellium NV(a)
05/15/24 | | | 5.750 | % | | | 5,896,000 | | | | 5,483,280 | | |
Freeport-McMoRan, Inc.
03/01/22 | | | 3.550 | % | | | 1,917,000 | | | | 1,814,441 | | |
03/15/23 | | | 3.875 | % | | | 3,807,000 | | | | 3,578,580 | | |
11/14/24 | | | 4.550 | % | | | 12,308,000 | | | | 11,692,600 | | |
Novelis Corp.(a)
08/15/24 | | | 6.250 | % | | | 3,144,000 | | | | 3,254,040 | | |
09/30/26 | | | 5.875 | % | | | 9,483,000 | | | | 9,471,146 | | |
Teck Resources Ltd.
07/15/41 | | | 6.250 | % | | | 7,597,000 | | | | 7,616,372 | | |
Teck Resources Ltd.(a)
06/01/24 | | | 8.500 | % | | | 3,850,000 | | | | 4,494,875 | | |
Total | | | | | | | 60,196,099 | | |
MIDSTREAM 6.2% | |
Cheniere Corpus Christi Holdings LLC(a)
06/30/24 | | | 7.000 | % | | | 3,000,000 | | | | 3,195,000 | | |
Energy Transfer Equity LP
06/01/27 | | | 5.500 | % | | | 10,390,000 | | | | 10,130,250 | | |
MPLX LP
02/15/23 | | | 5.500 | % | | | 7,508,000 | | | | 7,786,464 | | |
07/15/23 | | | 4.500 | % | | | 2,699,000 | | | | 2,702,179 | | |
12/01/24 | | | 4.875 | % | | | 8,994,000 | | | | 9,062,040 | | |
06/01/25 | | | 4.875 | % | | | 936,000 | | | | 941,539 | | |
Sabine Pass Liquefaction LLC
03/01/25 | | | 5.625 | % | | | 11,355,000 | | | | 11,837,587 | | |
Sabine Pass Liquefaction LLC(a)
06/30/26 | | | 5.875 | % | | | 8,777,000 | | | | 9,270,706 | | |
03/15/27 | | | 5.000 | % | | | 3,479,000 | | | | 3,435,513 | | |
Tallgrass Energy Partners LP/Finance Corp.(a)
09/15/24 | | | 5.500 | % | | | 1,809,000 | | | | 1,790,910 | | |
The accompanying Notes to Financial Statements are an integral part of this statement.
Semiannual Report 2016
10
COLUMBIA HIGH YIELD BOND FUND
PORTFOLIO OF INVESTMENTS (continued)
November 30, 2016 (Unaudited)
Corporate Bonds & Notes (continued)
Issuer | | Coupon
Rate | | Principal
Amount ($) | |
Value ($) | |
Targa Resources Partners LP/Finance Corp.
05/01/23 | | | 5.250 | % | | | 256,000 | | | | 254,720 | | |
11/15/23 | | | 4.250 | % | | | 3,192,000 | | | | 3,008,460 | | |
03/15/24 | | | 6.750 | % | | | 6,929,000 | | | | 7,344,740 | | |
Targa Resources Partners LP/Finance Corp.(a)
02/01/27 | | | 5.375 | % | | | 8,635,000 | | | | 8,527,063 | | |
Tesoro Logistics LP/Finance Corp.
10/15/19 | | | 5.500 | % | | | 1,319,000 | | | | 1,399,789 | | |
10/15/22 | | | 6.250 | % | | | 8,221,000 | | | | 8,796,470 | | |
05/01/24 | | | 6.375 | % | | | 2,648,000 | | | | 2,856,530 | | |
Tesoro Logistics Lp / Fin Corp.(c)
01/15/25 | | | 5.250 | % | | | 7,762,000 | | | | 7,859,025 | | |
Williams Companies, Inc. (The)
01/15/23 | | | 3.700 | % | | | 6,746,000 | | | | 6,358,105 | | |
06/24/24 | | | 4.550 | % | | | 18,838,000 | | | | 18,367,050 | | |
Total | | | | | | | 124,924,140 | | |
OIL FIELD SERVICES 0.8% | |
Precision Drilling Corporation(a)
12/15/23 | | | 7.750 | % | | | 511,000 | | | | 518,665 | | |
SESI LLC
05/01/19 | | | 6.375 | % | | | 3,299,000 | | | | 3,257,762 | | |
12/15/21 | | | 7.125 | % | | | 975,000 | | | | 953,063 | | |
Weatherford International Ltd.
06/15/21 | | | 7.750 | % | | | 6,172,000 | | | | 6,033,130 | | |
06/15/23 | | | 8.250 | % | | | 5,072,000 | | | | 4,945,200 | | |
Weatherford Intl Ltd. Bermuda(a)
02/15/24 | | | 9.875 | % | | | 1,314,000 | | | | 1,353,420 | | |
Total | | | | | | | 17,061,240 | | |
PACKAGING 4.2% | |
ARD Finance SA PIK(a)
09/15/23 | | | 7.125 | % | | | 2,992,000 | | | | 2,965,820 | | |
Ardagh Packaging Finance PLC/Holdings USA, Inc.(a)
01/31/21 | | | 6.750 | % | | | 8,113,000 | | | | 8,265,119 | | |
05/15/24 | | | 7.250 | % | | | 8,624,000 | | | | 9,012,080 | | |
Berry Plastics Corp.
05/15/22 | | | 5.500 | % | | | 7,732,000 | | | | 8,041,280 | | |
10/15/22 | | | 6.000 | % | | | 5,392,000 | | | | 5,668,340 | | |
07/15/23 | | | 5.125 | % | | | 7,100,000 | | | | 7,162,125 | | |
Owens-Brockway Glass Container, Inc.(a)
08/15/23 | | | 5.875 | % | | | 1,952,000 | | | | 2,039,840 | | |
08/15/25 | | | 6.375 | % | | | 5,801,000 | | | | 6,127,306 | | |
Plastipak Holdings, Inc.(a)
10/01/21 | | | 6.500 | % | | | 8,609,000 | | | | 8,996,405 | | |
Reynolds Group Issuer, Inc./LLC
10/15/20 | | | 5.750 | % | | | 6,835,000 | | | | 7,031,506 | | |
Reynolds Group Issuer, Inc./LLC(a)
07/15/24 | | | 7.000 | % | | | 14,810,000 | | | | 15,633,806 | | |
Corporate Bonds & Notes (continued)
Issuer | | Coupon
Rate | | Principal
Amount ($) | |
Value ($) | |
Signode Industrial Group Luxembourg SA/US, Inc.(a)
05/01/22 | | | 6.375 | % | | | 2,250,000 | | | | 2,266,875 | | |
Total | | | | | | | 83,210,502 | | |
PHARMACEUTICALS 2.5% | |
Endo Finance LLC/Finco, Inc.(a)(d)
02/01/25 | | | 6.000 | % | | | 5,535,000 | | | | 4,725,506 | | |
Endo Finance LLC/Ltd./Finco, Inc.(a)
07/15/23 | | | 6.000 | % | | | 1,538,000 | | | | 1,368,820 | | |
Grifols Worldwide Operations Ltd.
04/01/22 | | | 5.250 | % | | | 4,858,000 | | | | 5,003,740 | | |
Jaguar Holding Co. II/Pharmaceutical Product Development LLC(a)
08/01/23 | | | 6.375 | % | | | 7,866,000 | | | | 8,102,610 | | |
Mallinckrodt International Finance SA/CB LLC(a)
10/15/23 | | | 5.625 | % | | | 1,605,000 | | | | 1,452,525 | | |
04/15/25 | | | 5.500 | % | | | 1,756,000 | | | | 1,492,600 | | |
Valeant Pharmaceuticals International, Inc.(a)
10/15/20 | | | 6.375 | % | | | 11,546,000 | | | | 9,814,100 | | |
07/15/21 | | | 7.500 | % | | | 1,449,000 | | | | 1,224,405 | | |
12/01/21 | | | 5.625 | % | | | 3,362,000 | | | | 2,605,550 | | |
05/15/23 | | | 5.875 | % | | | 11,003,000 | | | | 8,197,235 | | |
04/15/25 | | | 6.125 | % | | | 8,068,000 | | | | 5,970,320 | | |
Total | | | | | | | 49,957,411 | | |
PROPERTY & CASUALTY 1.0% | |
Alliant Holdings Intermediate LP(a)
08/01/23 | | | 8.250 | % | | | 383,000 | | | | 387,787 | | |
HUB International Ltd.(a)
02/15/21 | | | 9.250 | % | | | 707,000 | | | | 728,210 | | |
10/01/21 | | | 7.875 | % | | | 16,548,000 | | | | 16,899,645 | | |
Hub Holdings LLC/Finance, Inc.
PIK(a)
07/15/19 | | | 8.125 | % | | | 1,245,000 | | | | 1,232,550 | | |
Total | | | | | | | 19,248,192 | | |
RESTAURANTS 0.4% | |
KFC Holding Co./Pizza Hut Holdings LLC/
Taco Bell of America LLC(a)
06/01/26 | | | 5.250 | % | | | 8,536,000 | | | | 8,621,360 | | |
RETAILERS 1.6% | |
Asbury Automotive Group, Inc.
12/15/24 | | | 6.000 | % | | | 4,449,000 | | | | 4,493,490 | | |
Dollar Tree, Inc.
03/01/23 | | | 5.750 | % | | | 5,434,000 | | | | 5,800,795 | | |
Group 1 Automotive, Inc.(a)
12/15/23 | | | 5.250 | % | | | 2,285,000 | | | | 2,233,588 | | |
Penske Automotive Group, Inc.
12/01/24 | | | 5.375 | % | | | 2,719,000 | | | | 2,671,417 | | |
05/15/26 | | | 5.500 | % | | | 1,788,000 | | | | 1,723,328 | | |
The accompanying Notes to Financial Statements are an integral part of this statement.
Semiannual Report 2016
11
COLUMBIA HIGH YIELD BOND FUND
PORTFOLIO OF INVESTMENTS (continued)
November 30, 2016 (Unaudited)
Corporate Bonds & Notes (continued)
Issuer | | Coupon
Rate | | Principal
Amount ($) | |
Value ($) | |
Rite Aid Corp.
Junior Subordinated
02/15/27 | | | 7.700 | % | | | 1,993,000 | | | | 2,461,355 | | |
Rite Aid Corp.(a)
04/01/23 | | | 6.125 | % | | | 6,833,000 | | | | 7,303,794 | | |
Sally Holdings LLC/Capital, Inc.
12/01/25 | | | 5.625 | % | | | 5,993,000 | | | | 6,217,737 | | |
Total | | | | | | | 32,905,504 | | |
TECHNOLOGY 6.1% | |
Alliance Data Systems Corp.(a)
04/01/20 | | | 6.375 | % | | | 216,000 | | | | 216,540 | | |
08/01/22 | | | 5.375 | % | | | 5,129,000 | | | | 4,885,372 | | |
Camelot Finance SA(a)
10/15/24 | | | 7.875 | % | | | 2,748,000 | | | | 2,809,830 | | |
Diamond 1 Finance Corp./Diamond 2 Finance Corp.(a)
06/15/23 | | | 5.450 | % | | | 6,150,000 | | | | 6,414,801 | | |
06/15/26 | | | 6.020 | % | | | 4,060,000 | | | | 4,271,185 | | |
Equinix, Inc.
04/01/23 | | | 5.375 | % | | | 4,307,000 | | | | 4,420,059 | | |
01/15/26 | | | 5.875 | % | | | 6,872,000 | | | | 7,129,769 | | |
First Data Corp.(a)
08/15/23 | | | 5.375 | % | | | 10,503,000 | | | | 10,870,605 | | |
12/01/23 | | | 7.000 | % | | | 7,994,000 | | | | 8,368,759 | | |
01/15/24 | | | 5.000 | % | | | 4,758,000 | | | | 4,799,632 | | |
01/15/24 | | | 5.750 | % | | | 8,200,000 | | | | 8,302,500 | | |
Informatica LLC(a)
07/15/23 | | | 7.125 | % | | | 1,838,000 | | | | 1,736,910 | | |
MSCI, Inc.(a)
08/15/25 | | | 5.750 | % | | | 4,888,000 | | | | 5,132,400 | | |
Microsemi Corp.(a)
04/15/23 | | | 9.125 | % | | | 3,875,000 | | | | 4,485,312 | | |
NXP BV/Funding LLC(a)
06/15/22 | | | 4.625 | % | | | 3,314,000 | | | | 3,504,555 | | |
09/01/22 | | | 3.875 | % | | | 2,250,000 | | | | 2,306,250 | | |
03/15/23 | | | 5.750 | % | | | 2,195,000 | | | | 2,321,213 | | |
PTC, Inc.
05/15/24 | | | 6.000 | % | | | 5,809,000 | | | | 6,113,972 | | |
Qualitytech LP/Finance Corp.
08/01/22 | | | 5.875 | % | | | 3,345,000 | | | | 3,420,263 | | |
Quintiles IMS, Inc.(a)
05/15/23 | | | 4.875 | % | | | 4,158,000 | | | | 4,239,081 | | |
10/15/26 | | | 5.000 | % | | | 6,518,000 | | | | 6,436,525 | | |
Riverbed Technology, Inc.(a)
03/01/23 | | | 8.875 | % | | | 4,213,000 | | | | 4,392,052 | | |
Solera LLC/Finance, Inc.(a)
03/01/24 | | | 10.500 | % | | | 6,743,000 | | | | 7,451,015 | | |
Corporate Bonds & Notes (continued)
Issuer | | Coupon
Rate | | Principal
Amount ($) | |
Value ($) | |
VeriSign, Inc.
05/01/23 | | | 4.625 | % | | | 3,743,000 | | | | 3,803,824 | | |
04/01/25 | | | 5.250 | % | | | 4,834,000 | | | | 4,991,105 | | |
Total | | | | | | | 122,823,529 | | |
TRANSPORTATION SERVICES 0.2% | |
Hertz Corp. (The)
10/15/22 | | | 6.250 | % | | | 579,000 | | | | 545,708 | | |
Hertz Corp. (The)(a)
10/15/24 | | | 5.500 | % | | | 4,237,000 | | | | 3,691,486 | | |
Total | | | | | | | 4,237,194 | | |
WIRELESS 7.2% | |
SBA Communications Corp.(a)
09/01/24 | | | 4.875 | % | | | 16,126,000 | | | | 15,541,432 | | |
SFR Group SA(a)
05/15/22 | | | 6.000 | % | | | 8,271,000 | | | | 8,333,032 | | |
05/01/26 | | | 7.375 | % | | | 18,030,000 | | | | 17,984,925 | | |
Sprint Capital Corp.
05/01/19 | | | 6.900 | % | | | 4,550,000 | | | | 4,743,375 | | |
Sprint Communications, Inc.
08/15/20 | | | 7.000 | % | | | 568,000 | | | | 589,300 | | |
Sprint Communications, Inc.(a)
11/15/18 | | | 9.000 | % | | | 2,627,000 | | | | 2,883,133 | | |
03/01/20 | | | 7.000 | % | | | 2,753,000 | | | | 2,961,182 | | |
Sprint Corp.
09/15/23 | | | 7.875 | % | | | 3,586,000 | | | | 3,702,545 | | |
06/15/24 | | | 7.125 | % | | | 5,202,000 | | | | 5,172,765 | | |
02/15/25 | | | 7.625 | % | | | 22,540,000 | | | | 22,906,275 | | |
T-Mobile USA, Inc.
04/28/21 | | | 6.633 | % | | | 4,108,000 | | | | 4,287,725 | | |
01/15/22 | | | 6.125 | % | | | 2,417,000 | | | | 2,530,792 | | |
04/28/22 | | | 6.731 | % | | | 1,126,000 | | | | 1,176,501 | | |
03/01/23 | | | 6.000 | % | | | 4,091,000 | | | | 4,285,323 | | |
04/01/23 | | | 6.625 | % | | | 2,456,000 | | | | 2,597,220 | | |
01/15/24 | | | 6.500 | % | | | 7,911,000 | | | | 8,452,350 | | |
03/01/25 | | | 6.375 | % | | | 5,074,000 | | | | 5,422,837 | | |
01/15/26 | | | 6.500 | % | | | 14,772,000 | | | | 15,953,760 | | |
Wind Acquisition Finance SA(a)
04/30/20 | | | 6.500 | % | | | 2,948,000 | | | | 3,070,637 | | |
07/15/20 | | | 4.750 | % | | | 8,653,000 | | | | 8,661,653 | | |
04/23/21 | | | 7.375 | % | | | 2,130,000 | | | | 2,172,600 | | |
Total | | | | | | | 143,429,362 | | |
WIRELINES 4.0% | |
CenturyLink, Inc.
04/01/24 | | | 7.500 | % | | | 12,731,000 | | | | 13,143,357 | | |
04/01/25 | | | 5.625 | % | | | 2,598,000 | | | | 2,427,506 | | |
Frontier Communications Corp.
09/15/20 | | | 8.875 | % | | | 6,071,000 | | | | 6,336,606 | | |
The accompanying Notes to Financial Statements are an integral part of this statement.
Semiannual Report 2016
12
COLUMBIA HIGH YIELD BOND FUND
PORTFOLIO OF INVESTMENTS (continued)
November 30, 2016 (Unaudited)
Corporate Bonds & Notes (continued)
Issuer | | Coupon
Rate | | Principal
Amount ($) | |
Value ($) | |
04/15/22 | | | 8.750 | % | | | 2,025,000 | | | | 1,944,000 | | |
09/15/22 | | | 10.500 | % | | | 2,974,000 | | | | 3,070,655 | | |
04/15/24 | | | 7.625 | % | | | 4,048,000 | | | | 3,491,400 | | |
01/15/25 | | | 6.875 | % | | | 9,741,000 | | | | 7,890,210 | | |
09/15/25 | | | 11.000 | % | | | 9,405,000 | | | | 9,428,513 | | |
Level 3 Financing, Inc.
08/15/22 | | | 5.375 | % | | | 3,790,000 | | | | 3,856,325 | | |
01/15/24 | | | 5.375 | % | | | 3,700,000 | | | | 3,713,875 | | |
Level 3 Financing, Inc.(a)
03/15/26 | | | 5.250 | % | | | 4,471,000 | | | | 4,392,758 | | |
Telecom Italia SpA(a)
05/30/24 | | | 5.303 | % | | | 4,859,000 | | | | 4,780,041 | | |
Zayo Group LLC/Capital, Inc.
04/01/23 | | | 6.000 | % | | | 3,034,000 | | | | 3,162,945 | | |
05/15/25 | | | 6.375 | % | | | 11,157,000 | | | | 11,603,280 | | |
Total | | | | | | | 79,241,471 | | |
Total Corporate Bonds & Notes
(Cost: $1,857,387,531) | | | | | | | 1,881,652,739 | | |
Senior Loans 1.6%
Borrower | | Weighted
Average
Coupon | | Principal
Amount ($) | | Value ($) | |
CONSUMER PRODUCTS 0.3% | |
Serta Simmons Holdings, LLC
2nd Lien Term Loan(d)(e)
11/07/24 | | | 9.000 | % | | | 6,597,222 | | | | 6,564,236 | | |
DIVERSIFIED MANUFACTURING 0.6% | |
Accudyne Industries Borrower SCA/LLC
Term Loan(d)(e)
12/13/19 | | | 4.000 | % | | | 4,698,000 | | | | 4,195,314 | | |
Vertiv Co.
Tranche B Term Loan(c)(d)(e)
09/30/23 | | | 6.000 | % | | | 7,390,000 | | | | 7,311,518 | | |
Total | | | | | | | 11,506,832 | | |
INDEPENDENT ENERGY 0.3% | |
Chesapeake Energy Corp.
Tranche A Term Loan(c)(d)(e)
08/23/21 | | | 8.500 | % | | | 5,035,262 | | | | 5,378,314 | | |
MEDIA AND ENTERTAINMENT 0.1% | |
UFC Holdings LLC(d)(e)
1st Lien Term Loan
08/12/23 | | | 5.000 | % | | | 1,414,000 | | | | 1,422,329 | | |
2nd Lien Term Loan
08/12/24 | | | 8.500 | % | | | 440,000 | | | | 448,800 | | |
Total | | | | | | | 1,871,129 | | |
Senior Loans (continued)
Borrower | | Weighted
Average
Coupon | | Principal
Amount ($) | | Value ($) | |
TECHNOLOGY 0.3% | |
Ancestry.com Operations, Inc. | |
2nd Lien Term Loan(d)(e) | |
10/14/24 | | | 9.250 | % | | | 1,891,427 | | | | 1,907,183 | | |
Genesys Telecom Greeneden Tlb 5.25(c)(d)(e) | |
12/01/23 | | | 6.250 | % | | | 1,768,000 | | | | 1,776,840 | | |
Kronos, Inc.
2nd Lien Term Loan(d)(e)
10/18/24 | | | 9.250 | % | | | 2,694,000 | | | | 2,758,413 | | |
Total | | | | | | | 6,442,436 | | |
Total Senior Loans
(Cost: $31,162,138) | | | | | | | 31,762,947 | | |
Common Stocks —%
Issuer | | Shares | | Value ($) | |
FINANCIALS —% | |
Diversified Financial Services —% | |
Fairlane Management Corp.(f)(g)(h) | | | 50,004 | | | | — | | |
Total Financials | | | | | — | | |
Total Common Stocks
(Cost: $—) | | | | | — | | |
Limited Partnerships —%
FINANCIALS —% | |
Diversified Financial Services —% | |
Varde Fund V LP(f)(h) | | | 25,000,000 | | | | 4,403 | | |
Total Financials | | | | | 4,403 | | |
Total Limited Partnerships
(Cost: $—) | | | | | 4,403 | | |
Money Market Funds 3.7%
| | | Shares | | Value ($) | |
Columbia Short-Term Cash Fund,
0.480%(i)(j) | | | 74,861,454 | | | | 74,868,940 | | |
Total Money Market Funds
(Cost: $74,861,454) | | | | | 74,868,940 | | |
Total Investments
(Cost: $1,963,411,123) | | | | | 1,988,289,029 | | |
Other Assets & Liabilities, Net | | | | | 14,521,510 | | |
Net Assets | | | | | 2,002,810,539 | | |
The accompanying Notes to Financial Statements are an integral part of this statement.
Semiannual Report 2016
13
COLUMBIA HIGH YIELD BOND FUND
PORTFOLIO OF INVESTMENTS (continued)
November 30, 2016 (Unaudited)
At November 30, 2016, cash totaling $945,400 was pledged as collateral.
Investments in Derivatives
Short Futures Contracts Outstanding
Contract Description | | Number of
Contracts | | Trading
Currency | | Notional
Market
Value ($) | | Expiration
Date | | Unrealized
Appreciation ($) | | Unrealized
(Depreciation) ($) | |
U.S. Treasury 10-Year Note | | | (652 | ) | | USD | | | | | (81,184,188 | ) | | 03/2017 | | | 207,783 | | | | — | | |
Notes to Portfolio of Investments
(a) Represents privately placed and other securities and instruments exempt from SEC registration (collectively, private placements), such as Section 4(a)(2) and Rule 144A eligible securities, which are often sold only to qualified institutional buyers. The Fund may invest in private placements determined to be liquid as well as those determined to be illiquid. Private placements may be determined to be liquid under guidelines established by the Fund's Board of Trustees. At November 30, 2016, the value of these securities amounted to $923,534,493 or 46.11% of net assets.
(b) Represents securities that have defaulted on payment of interest. The Fund has stopped accruing interest on these securities. At November 30, 2016, the value of these securities amounted to $3,611,265, which represents 0.18% of net assets.
(c) Security, or a portion thereof, has been purchased on a when-issued or delayed delivery basis.
(d) Variable rate security.
(e) Senior loans have interest rates that float periodically based primarily on the London Interbank Offered Rate ("LIBOR") and other short-term rates. The interest rate shown reflects the weighted average coupon as of November 30, 2016. The interest rate shown for senior loans purchased on a when-issued or delayed delivery basis, if any, reflects an estimated average coupon. Remaining maturities of senior loans may be less than the stated maturities shown as a result of contractual or optional prepayments by the borrower. Such prepayments cannot be predicted.
(f) Non-income producing investment.
(g) Negligible market value.
(h) Represents fair value as determined in good faith under procedures approved by the Board of Trustees. At November 30, 2016, the value of these securities amounted to $4,403, which represents less than 0.01% of net assets.
(i) The rate shown is the seven-day current annualized yield at November 30, 2016.
(j) As defined in the Investment Company Act of 1940, an affiliated company is one in which the Fund owns 5% or more of the company's outstanding voting securities, or a company which is under common ownership or control with the Fund. Holdings and transactions in these affiliated companies during the period ended November 30, 2016 are as follows:
Issuer | | Beginning
Cost ($) | | Purchase
Cost ($) | | Proceeds
From Sales ($) | | Realized
Gain
(Loss) ($) | | Ending
Cost ($) | | Dividends —
Affiliated
Issuers ($) | | Value ($) | |
Columbia Short-Term Cash Fund | | | 82,259,523 | | | | 453,845,373 | | | | (461,243,746 | ) | | | 304 | | | | 74,861,454 | | | | 198,043 | | | | 74,868,940 | | |
Abbreviation Legend
PIK Payment-in-Kind
Currency Legend
USD US Dollar
The accompanying Notes to Financial Statements are an integral part of this statement.
Semiannual Report 2016
14
COLUMBIA HIGH YIELD BOND FUND
PORTFOLIO OF INVESTMENTS (continued)
November 30, 2016 (Unaudited)
Fair Value Measurements
The Fund categorizes its fair value measurements according to a three-level hierarchy that maximizes the use of observable inputs and minimizes the use of unobservable inputs by prioritizing that the most observable input be used when available. Observable inputs are those that market participants would use in pricing an investment based on market data obtained from sources independent of the reporting entity. Unobservable inputs are those that reflect the Fund's assumptions about the information market participants would use in pricing an investment. An investment's level within the fair value hierarchy is based on the lowest level of any input that is deemed significant to the asset's or liability's fair value measurement. The input levels are not necessarily an indication of the risk or liquidity associated with investments at that level. For example, certain U.S. government securities are generally high quality and liquid, however, they are reflected as Level 2 because the inputs used to determine fair value may not always be quoted prices in an active market.
Fair value inputs are summarized in the three broad levels listed below:
> Level 1 — Valuations based on quoted prices for investments in active markets that the Fund has the ability to access at the measurement date (including NAV for open-end mutual funds). Valuation adjustments are not applied to Level 1 investments.
> Level 2 — Valuations based on other significant observable inputs (including quoted prices for similar securities, interest rates, prepayment speeds, credit risks, etc.).
> Level 3 — Valuations based on significant unobservable inputs (including the Fund's own assumptions and judgment in determining the fair value of investments).
Inputs that are used in determining fair value of an investment may include price information, credit data, volatility statistics, and other factors. These inputs can be either observable or unobservable. The availability of observable inputs can vary between investments, and is affected by various factors such as the type of investment, and the volume and level of activity for that investment or similar investments in the marketplace. The inputs will be considered by the Investment Manager, along with any other relevant factors in the calculation of an investment's fair value. The Fund uses prices and inputs that are current as of the measurement date, which may include periods of market dislocations. During these periods, the availability of prices and inputs may be reduced for many investments. This condition could cause an investment to be reclassified between the various levels within the hierarchy.
Certain investments that have been measured at fair value using the net asset value (NAV) per share (or its equivalent) are not categorized in the fair value hierarchy. The fair value amounts presented in the table are intended to reconcile the fair value hierarchy to the amounts presented in the Portfolio of Investments. The Columbia Short-Term Cash Fund seeks to provide shareholders with maximum current income consistent with liquidity and stability of principal. Columbia Short-Term Cash Fund prices its shares with a floating NAV and no longer seeks to maintain a stable NAV.
Investments falling into the Level 3 category are primarily supported by quoted prices from brokers and dealers participating in the market for those investments. However, these may be classified as Level 3 investments due to lack of market transparency and corroboration to support these quoted prices. Additionally, valuation models may be used as the pricing source for any remaining investments classified as Level 3. These models may rely on one or more significant unobservable inputs and/or significant assumptions by the Investment Manager. Inputs used in valuations may include, but are not limited to, financial statement analysis, capital account balances, discount rates and estimated cash flows, and comparable company data.
Under the direction of the Fund's Board of Trustees (the Board), the Investment Manager's Valuation Committee (the Committee) is responsible for overseeing the valuation procedures approved by the Board. The Committee consists of voting and non-voting members from various groups within the Investment Manager's organization, including operations and accounting, trading and investments, compliance, risk management and legal.
The Committee meets at least monthly to review and approve valuation matters, which may include a description of specific valuation determinations, data regarding pricing information received from approved pricing vendors and brokers and the results of Board-approved valuation control policies and procedures (the Policies). The Policies address, among other things, instances when market quotations are or are not readily available, including recommendations of third party pricing vendors and a determination of appropriate pricing methodologies; events that require specific valuation determinations and assessment of fair value techniques; securities with a potential for stale pricing, including those that are illiquid, restricted, or in default; and the effectiveness of third party pricing vendors, including periodic reviews of vendors. The Committee meets more frequently, as needed, to discuss additional valuation matters, which may include the need to review back-testing results, review time-sensitive information or approve related valuation actions. The Committee reports to the Board, with members of the Committee meeting with the Board at each of its regularly scheduled meetings to discuss valuation matters and actions during the period, similar to those described earlier.
For investments categorized as Level 3, the Committee monitors information similar to that described above, which may include: (i) data specific to the issuer or comparable issuers, (ii) general market or specific sector news and (iii) quoted prices and specific or similar security transactions. The Committee considers this data and any changes from prior periods in order to assess the reasonableness of observable and unobservable inputs, any assumptions or internal models used to value those securities and changes in fair value. This data is also used to corroborate, when available, information received from approved pricing vendors and brokers. Various factors impact the frequency of monitoring this information (which may occur as often as daily). However, the Committee may determine that changes to inputs, assumptions and models are not required as a result of the monitoring procedures performed.
The accompanying Notes to Financial Statements are an integral part of this statement.
Semiannual Report 2016
15
COLUMBIA HIGH YIELD BOND FUND
PORTFOLIO OF INVESTMENTS (continued)
November 30, 2016 (Unaudited)
Fair Value Measurements (continued)
The following table is a summary of the inputs used to value the Fund's investments at November 30, 2016:
| | | Level 1
Quoted Prices in Active
Markets for Identical
Assets ($) | | Level 2
Other Significant
Observable Inputs ($) | | Level 3
Significant
Unobservable Inputs ($) | | Total ($) | |
Investments | |
Corporate Bonds & Notes | | | — | | | | 1,881,652,739 | | | | — | | | | 1,881,652,739 | | |
Senior Loans | | | — | | | | 31,762,947 | | | | — | | | | 31,762,947 | | |
Common Stocks | |
Financials | | | — | | | | — | | | | 0 | (a) | | | 0 | (a) | |
Limited Partnerships | |
Financials | | | — | | | | — | | | | 4,403 | | | | 4,403 | | |
Investments measured at net asset value | |
Money Market Funds | | | — | | | | — | | | | — | | | | 74,868,940 | | |
Total Investments | | | — | | | | 1,913,415,686 | | | | 4,403 | | | | 1,988,289,029 | | |
Derivatives | |
Assets | |
Futures Contracts | | | 207,783 | | | | — | | | | — | | | | 207,783 | | |
Total | | | 207,783 | | | | 1,913,415,686 | | | | 4,403 | | | | 1,988,496,812 | | |
(a) Rounds to Zero.
See the Portfolio of Investments for all investment classifications not indicated in the table.
The Fund's assets assigned to the Level 2 input category are generally valued using the market approach, in which a security's value is determined through reference to prices and information from market transactions for similar or identical assets.
Derivative instruments are valued at unrealized appreciation (depreciation).
There were no transfers of financial assets between levels during the period.
The Fund does not hold any significant investments (greater than one percent of net assets) categorized as Level 3.
The Fund's assets assigned to the Level 3 category are valued utilizing the valuation technique deemed the most appropriate in the circumstances
Limited partnership securities classified as Level 3 are valued using a market approach. To determine fair value for these securities, management considered various factors which may have included, but were not limited to, the Fund's pro-rata interest in the limited partnership's capital balance, estimated earnings of the respective company, and the position of the security within the respective company's capital structure. Significant increases (decreases) to any of these inputs would result in a significantly lower (higher) fair value measurement. Generally, a change in the fund's pro-rata interest would result in a change to the limited partnership's capital balance.
Common stocks classified as Level 3 are valued using an income approach. To determine fair value for these securities, management considered estimates of future distributions related to the potential actions of the respective company's restructuring. Significant increases (decreases) to any of these inputs would result in a significantly lower (higher) fair value measurement.
The accompanying Notes to Financial Statements are an integral part of this statement.
Semiannual Report 2016
16
COLUMBIA HIGH YIELD BOND FUND
STATEMENT OF ASSETS AND LIABILITIES
November 30, 2016 (Unaudited)
Assets | |
Investments, at value | |
Unaffiliated issuers (identified cost $1,888,549,669) | | $ | 1,913,420,089 | | |
Affiliated issuers (identified cost $74,861,454) | | | 74,868,940 | | |
Total investments (identified cost $1,963,411,123) | | | 1,988,289,029 | | |
Margin deposits | | | 945,400 | | |
Receivable for: | |
Investments sold | | | 14,431,036 | | |
Capital shares sold | | | 10,845,386 | | |
Dividends | | | 32,302 | | |
Interest | | | 31,170,066 | | |
Foreign tax reclaims | | | 125,669 | | |
Variation margin | | | 387,125 | | |
Prepaid expenses | | | 7,035 | | |
Trustees' deferred compensation plan | | | 64,813 | | |
Other assets | | | 27,734 | | |
Total assets | | | 2,046,325,595 | | |
Liabilities | |
Due to custodian | | | 33,497 | | |
Payable for: | |
Investments purchased | | | 5,994,818 | | |
Investments purchased on a delayed delivery basis | | | 22,514,591 | | |
Capital shares purchased | | | 4,664,636 | | |
Dividend distributions to shareholders | | | 9,777,770 | | |
Management services fees | | | 34,094 | | |
Distribution and/or service fees | | | 10,528 | | |
Transfer agent fees | | | 157,125 | | |
Plan administration fees | | | 7,919 | | |
Compensation of board members | | | 115,314 | | |
Chief compliance officer expenses | | | 156 | | |
Other expenses | | | 139,795 | | |
Trustees' deferred compensation plan | | | 64,813 | | |
Total liabilities | | | 43,515,056 | | |
Net assets applicable to outstanding capital stock | | $ | 2,002,810,539 | | |
Represented by | |
Paid-in capital | | $ | 2,183,716,749 | | |
Excess of distributions over net investment income | | | (1,679,875 | ) | |
Accumulated net realized loss | | | (204,312,024 | ) | |
Unrealized appreciation (depreciation) on: | |
Investments — unaffiliated issuers | | | 24,870,420 | | |
Investments — affiliated issuers | | | 7,486 | | |
Futures contracts | | | 207,783 | | |
Total — representing net assets applicable to outstanding capital stock | | $ | 2,002,810,539 | | |
The accompanying Notes to Financial Statements are an integral part of this statement.
Semiannual Report 2016
17
COLUMBIA HIGH YIELD BOND FUND
STATEMENT OF ASSETS AND LIABILITIES (continued)
November 30, 2016 (Unaudited)
Class A | |
Net assets | | $ | 1,133,287,504 | | |
Shares outstanding | | | 392,519,313 | | |
Net asset value per share | | $ | 2.89 | | |
Maximum offering price per share(a) | | $ | 3.03 | | |
Class B | |
Net assets | | $ | 3,767,081 | | |
Shares outstanding | | | 1,305,051 | | |
Net asset value per share | | $ | 2.89 | | |
Class C | |
Net assets | | $ | 87,437,725 | | |
Shares outstanding | | | 30,480,274 | | |
Net asset value per share | | $ | 2.87 | | |
Class I | |
Net assets | | $ | 298,011,531 | | |
Shares outstanding | | | 103,344,857 | | |
Net asset value per share | | $ | 2.88 | | |
Class K | |
Net assets | | $ | 34,918,314 | | |
Shares outstanding | | | 12,087,295 | | |
Net asset value per share | | $ | 2.89 | | |
Class R | |
Net assets | | $ | 24,278,462 | | |
Shares outstanding | | | 8,383,581 | | |
Net asset value per share | | $ | 2.90 | | |
Class R4 | |
Net assets | | $ | 58,728,533 | | |
Shares outstanding | | | 20,214,280 | | |
Net asset value per share | | $ | 2.91 | | |
Class R5 | |
Net assets | | $ | 71,212,474 | | |
Shares outstanding | | | 24,733,236 | | |
Net asset value per share | | $ | 2.88 | | |
Class W | |
Net assets | | $ | 345,650 | | |
Shares outstanding | | | 120,850 | | |
Net asset value per share | | $ | 2.86 | | |
Class Y | |
Net assets | | $ | 41,700,019 | | |
Shares outstanding | | | 14,475,713 | | |
Net asset value per share | | $ | 2.88 | | |
Class Z | |
Net assets | | $ | 249,123,246 | | |
Shares outstanding | | | 86,399,069 | | |
Net asset value per share | | $ | 2.88 | | |
(a) The maximum offering price per share is calculated by dividing the net asset value per share by 1.0 minus the maximum sales charge of 4.75%.
The accompanying Notes to Financial Statements are an integral part of this statement.
Semiannual Report 2016
18
COLUMBIA HIGH YIELD BOND FUND
STATEMENT OF OPERATIONS
Six Months Ended November 30, 2016 (Unaudited)
Net investment income | |
Income: | |
Dividends — affiliated issuers | | $ | 198,043 | | |
Interest | | | 60,918,994 | | |
Total income | | | 61,117,037 | | |
Expenses: | |
Management services fees | | | 6,570,632 | | |
Distribution and/or service fees | |
Class A | | | 1,524,467 | | |
Class B | | | 20,876 | | |
Class C | | | 433,995 | | |
Class R | | | 60,453 | | |
Class W | | | 488 | | |
Transfer agent fees | |
Class A | | | 832,193 | | |
Class B | | | 2,852 | | |
Class C | | | 59,232 | | |
Class K | | | 8,005 | | |
Class R | | | 16,507 | | |
Class R4 | | | 34,008 | | |
Class R5 | | | 18,938 | | |
Class W | | | 267 | | |
Class Z | | | 168,200 | | |
Plan administration fees | |
Class K | | | 46,189 | | |
Compensation of board members | | | 23,019 | | |
Custodian fees | | | 14,323 | | |
Printing and postage fees | | | 91,181 | | |
Registration fees | | | 121,875 | | |
Audit fees | | | 17,889 | | |
Legal fees | | | 14,453 | | |
Chief compliance officer expenses | | | 156 | | |
Other | | | 24,015 | | |
Total expenses | | | 10,104,213 | | |
Expense reductions | | | (2,639 | ) | |
Total net expenses | | | 10,101,574 | | |
Net investment income | | | 51,015,463 | | |
Realized and unrealized gain (loss) — net | |
Net realized gain (loss) on: | |
Investments — unaffiliated issuers | | | 12,463,977 | | |
Investments — affiliated issuers | | | 304 | | |
Futures contracts | | | 808,787 | | |
Net realized gain | | | 13,273,068 | | |
Net change in unrealized appreciation (depreciation) on: | |
Investments — unaffiliated issuers | | | 14,858,531 | | |
Investments — affiliated issuers | | | 7,486 | | |
Futures contracts | | | 242,086 | | |
Net change in unrealized appreciation | | | 15,108,103 | | |
Net realized and unrealized gain | | | 28,381,171 | | |
Net increase in net assets resulting from operations | | $ | 79,396,634 | | |
The accompanying Notes to Financial Statements are an integral part of this statement.
Semiannual Report 2016
19
COLUMBIA HIGH YIELD BOND FUND
STATEMENT OF CHANGES IN NET ASSETS
| | | Six Months Ended
November 30, 2016
(Unaudited) | | Year Ended
May 31,
2016 | |
Operations | |
Net investment income | | $ | 51,015,463 | | | $ | 94,424,170 | | |
Net realized gain (loss) | | | 13,273,068 | | | | (61,935,160 | ) | |
Net change in unrealized appreciation (depreciation) | | | 15,108,103 | | | | (34,082,280 | ) | |
Net increase (decrease) in net assets resulting from operations | | | 79,396,634 | | | | (1,593,270 | ) | |
Distributions to shareholders | |
Net investment income | |
Class A | | | (30,064,702 | ) | | | (55,935,769 | ) | |
Class B | | | (86,800 | ) | | | (252,007 | ) | |
Class C | | | (1,815,371 | ) | | | (3,205,665 | ) | |
Class I | | | (8,569,891 | ) | | | (16,983,123 | ) | |
Class K | | | (925,298 | ) | | | (2,200,113 | ) | |
Class R | | | (566,760 | ) | | | (954,562 | ) | |
Class R4 | | | (1,309,407 | ) | | | (988,430 | ) | |
Class R5 | | | (2,144,523 | ) | | | (3,104,219 | ) | |
Class W | | | (9,595 | ) | | | (697,043 | ) | |
Class Y | | | (848,719 | ) | | | (733,295 | ) | |
Class Z | | | (6,388,903 | ) | | | (9,855,454 | ) | |
Total distributions to shareholders | | | (52,729,969 | ) | | | (94,909,680 | ) | |
Increase (decrease) in net assets from capital stock activity | | | (117,607,052 | ) | | | 133,206,095 | | |
Total increase (decrease) in net assets | | | (90,940,387 | ) | | | 36,703,145 | | |
Net assets at beginning of period | | | 2,093,750,926 | | | | 2,057,047,781 | | |
Net assets at end of period | | $ | 2,002,810,539 | | | $ | 2,093,750,926 | | |
Undistributed (excess of distributions over) net investment income | | $ | (1,679,875 | ) | | $ | 34,631 | | |
The accompanying Notes to Financial Statements are an integral part of this statement.
Semiannual Report 2016
20
COLUMBIA HIGH YIELD BOND FUND
STATEMENT OF CHANGES IN NET ASSETS (continued)
| | | Six Months Ended November 30, 2016
(Unaudited) | | Year Ended May 31, 2016 | |
| | | Shares | | Dollars ($) | | Shares | | Dollars ($) | |
Capital stock activity | |
Class A shares | |
Subscriptions(a) | | | 54,408,335 | | | | 157,977,409 | | | | 102,622,079 | | | | 288,830,440 | | |
Distributions reinvested | | | 9,267,621 | | | | 26,899,741 | | | | 17,323,493 | | | | 49,018,088 | | |
Redemptions | | | (85,463,726 | ) | | | (246,064,853 | ) | | | (125,573,951 | ) | | | (355,740,492 | ) | |
Net decrease | | | (21,787,770 | ) | | | (61,187,703 | ) | | | (5,628,379 | ) | | | (17,891,964 | ) | |
Class B shares | |
Subscriptions | | | 27,302 | | | | 79,112 | | | | 33,379 | | | | 94,910 | | |
Distributions reinvested | | | 28,403 | | | | 82,351 | | | | 83,971 | | | | 238,300 | | |
Redemptions(a) | | | (322,291 | ) | | | (933,753 | ) | | | (1,657,486 | ) | | | (4,738,438 | ) | |
Net decrease | | | (266,586 | ) | | | (772,290 | ) | | | (1,540,136 | ) | | | (4,405,228 | ) | |
Class C shares | |
Subscriptions | | | 3,603,730 | | | | 10,390,733 | | | | 8,352,255 | | | | 23,396,975 | | |
Distributions reinvested | | | 567,896 | | | | 1,637,755 | | | | 999,891 | | | | 2,811,793 | | |
Redemptions | | | (2,905,932 | ) | | | (8,346,982 | ) | | | (9,398,327 | ) | | | (26,603,587 | ) | |
Net increase (decrease) | | | 1,265,694 | | | | 3,681,506 | | | | (46,181 | ) | | | (394,819 | ) | |
Class I shares | |
Subscriptions | | | 220,349 | | | | 642,627 | | | | 18,948,750 | | | | 52,656,197 | | |
Distributions reinvested | | | 2,958,175 | | | | 8,569,632 | | | | 6,010,801 | | | | 16,982,615 | | |
Redemptions | | | (11,654,070 | ) | | | (33,491,813 | ) | | | (18,839,572 | ) | | | (53,105,545 | ) | |
Net increase (decrease) | | | (8,475,546 | ) | | | (24,279,554 | ) | | | 6,119,979 | | | | 16,533,267 | | |
Class K shares | |
Subscriptions | | | 823,735 | | | | 2,381,593 | | | | 1,797,168 | | | | 5,108,702 | | |
Distributions reinvested | | | 318,656 | | | | 925,068 | | | | 774,389 | | | | 2,199,567 | | |
Redemptions | | | (2,425,909 | ) | | | (7,020,536 | ) | | | (8,426,667 | ) | | | (24,069,675 | ) | |
Net decrease | | | (1,283,518 | ) | | | (3,713,875 | ) | | | (5,855,110 | ) | | | (16,761,406 | ) | |
Class R shares | |
Subscriptions | | | 1,726,069 | | | | 4,999,839 | | | | 3,335,676 | | | | 9,476,529 | | |
Distributions reinvested | | | 152,302 | | | | 443,318 | | | | 262,144 | | | | 743,989 | | |
Redemptions | | | (1,312,642 | ) | | | (3,815,194 | ) | | | (2,281,020 | ) | | | (6,443,168 | ) | |
Net increase | | | 565,729 | | | | 1,627,963 | | | | 1,316,800 | | | | 3,777,350 | | |
Class R4 shares | |
Subscriptions | | | 11,787,755 | | | | 34,315,604 | | | | 9,419,215 | | | | 26,365,448 | | |
Distributions reinvested | | | 447,707 | | | | 1,309,327 | | | | 347,274 | | | | 988,184 | | |
Redemptions | | | (2,491,208 | ) | | | (7,267,331 | ) | | | (4,279,016 | ) | | | (12,035,026 | ) | |
Net increase | | | 9,744,254 | | | | 28,357,600 | | | | 5,487,473 | | | | 15,318,606 | | |
The accompanying Notes to Financial Statements are an integral part of this statement.
Semiannual Report 2016
21
COLUMBIA HIGH YIELD BOND FUND
STATEMENT OF CHANGES IN NET ASSETS (continued)
| | | Six Months Ended November 30, 2016
(Unaudited) | | Year Ended May 31, 2016 | |
| | | Shares | | Dollars ($) | | Shares | | Dollars ($) | |
Capital stock activity (continued) | |
Class R5 shares | |
Subscriptions | | | 12,486,763 | | | | 36,095,833 | | | | 80,967,892 | | | | 226,606,830 | | |
Distributions reinvested | | | 731,930 | | | | 2,110,419 | | | | 1,097,367 | | | | 3,100,828 | | |
Redemptions | | | (49,748,156 | ) | | | (140,358,170 | ) | | | (31,942,184 | ) | | | (89,891,372 | ) | |
Net increase (decrease) | | | (36,529,463 | ) | | | (102,151,918 | ) | | | 50,123,075 | | | | 139,816,286 | | |
Class W shares | |
Subscriptions | | | 884 | | | | 2,515 | | | | 514,118 | | | | 1,477,032 | | |
Distributions reinvested | | | 3,255 | | | | 9,356 | | | | 246,358 | | | | 696,561 | | |
Redemptions | | | (30,932 | ) | | | (89,174 | ) | | | (15,261,754 | ) | | | (43,663,681 | ) | |
Net decrease | | | (26,793 | ) | | | (77,303 | ) | | | (14,501,278 | ) | | | (41,490,088 | ) | |
Class Y shares | |
Subscriptions | | | 8,706,935 | | | | 25,158,291 | | | | 3,861,954 | | | | 10,867,913 | | |
Distributions reinvested | | | 290,744 | | | | 842,682 | | | | 259,173 | | | | 730,431 | | |
Redemptions | | | (1,341,382 | ) | | | (3,878,916 | ) | | | (875,193 | ) | | | (2,468,768 | ) | |
Net increase | | | 7,656,297 | | | | 22,122,057 | | | | 3,245,934 | | | | 9,129,576 | | |
Class Z shares | |
Subscriptions | | | 31,774,107 | | | | 92,174,353 | | | | 59,397,498 | | | | 167,060,547 | | |
Distributions reinvested | | | 1,317,881 | | | | 3,818,376 | | | | 1,406,525 | | | | 3,978,358 | | |
Redemptions | | | (26,647,380 | ) | | | (77,206,264 | ) | | | (50,593,735 | ) | | | (141,464,390 | ) | |
Net increase | | | 6,444,608 | | | | 18,786,465 | | | | 10,210,288 | | | | 29,574,515 | | |
Total net increase (decrease) | | | (42,693,094 | ) | | | (117,607,052 | ) | | | 48,932,465 | | | | 133,206,095 | | |
(a) Includes conversions of Class B shares to Class A shares, if any.
The accompanying Notes to Financial Statements are an integral part of this statement.
Semiannual Report 2016
22
COLUMBIA HIGH YIELD BOND FUND
The following tables are intended to help you understand the Fund's financial performance. Certain information reflects financial results for a single share of a class held for the periods shown. Per share net investment income (loss) amounts are calculated based on average shares outstanding during the period. Total return assumes reinvestment of all dividends and distributions, if any. Total return does not reflect payment of sales charges, if any. Total return and portfolio turnover are not annualized for periods of less than one year. The portfolio turnover rate is calculated without regard to purchase and sales transactions of short-term instruments and certain derivatives, if any. If such transactions were included, the Fund's portfolio turnover rate may be higher.
| | | Six Months Ended
November 30, 2016 | | Year Ended May 31, | |
Class A | | (Unaudited) | | 2016 | | 2015 | | 2014 | | 2013 | | 2012 | |
Per share data | |
Net asset value, beginning of period | | $ | 2.84 | | | $ | 2.99 | | | $ | 3.04 | | | $ | 3.01 | | | $ | 2.78 | | | $ | 2.86 | | |
Income from investment operations: | |
Net investment income | | | 0.07 | | | | 0.14 | | | | 0.14 | | | | 0.16 | | | | 0.17 | | | | 0.18 | | |
Net realized and unrealized gain (loss) | | | 0.05 | | | | (0.15 | ) | | | (0.05 | ) | | | 0.03 | | | | 0.23 | | | | (0.07 | ) | |
Total from investment operations | | | 0.12 | | | | (0.01 | ) | | | 0.09 | | | | 0.19 | | | | 0.40 | | | | 0.11 | | |
Less distributions to shareholders: | |
Net investment income | | | (0.07 | ) | | | (0.14 | ) | | | (0.14 | ) | | | (0.16 | ) | | | (0.17 | ) | | | (0.19 | ) | |
Net realized gains | | | — | | | | — | | | | — | | | | — | | | | — | | | | (0.00 | )(a) | |
Total distributions to shareholders | | | (0.07 | ) | | | (0.14 | ) | | | (0.14 | ) | | | (0.16 | ) | | | (0.17 | ) | | | (0.19 | ) | |
Proceeds from regulatory settlements | | | — | | | | — | | | | — | | | | — | | | | — | | | | 0.00 | (a) | |
Net asset value, end of period | | $ | 2.89 | | | $ | 2.84 | | | $ | 2.99 | | | $ | 3.04 | | | $ | 3.01 | | | $ | 2.78 | | |
Total return | | | 4.29 | % | | | (0.21 | %) | | | 3.12 | % | | | 6.55 | % | | | 14.55 | % | | | 3.99 | %(b) | |
Ratios to average net assets(c) | |
Total gross expenses | | | 1.04 | %(d) | | | 1.06 | % | | | 1.08 | % | | | 1.07 | % | | | 1.08 | % | | | 1.08 | % | |
Total net expenses(e) | | | 1.04 | %(d)(f) | | | 1.06 | %(f) | | | 1.07 | %(f) | | | 1.07 | %(f) | | | 1.07 | %(f) | | | 1.04 | %(f) | |
Net investment income | | | 4.75 | %(d) | | | 4.88 | % | | | 4.76 | % | | | 5.36 | % | | | 5.72 | % | | | 6.54 | % | |
Supplemental data | |
Net assets, end of period (in thousands) | | $ | 1,133,288 | | | $ | 1,178,208 | | | $ | 1,256,835 | | | $ | 1,357,909 | | | $ | 1,457,415 | | | $ | 1,170,173 | | |
Portfolio turnover | | | 30 | % | | | 51 | % | | | 64 | % | | | 63 | % | | | 81 | % | | | 76 | % | |
Notes to Financial Highlights
(a) Rounds to zero.
(b) The Fund received proceeds from regulatory settlements. Had the Fund not received these proceeds, the total return would have been lower by 0.08%.
(c) In addition to the fees and expenses that the Fund bears directly, the Fund indirectly bears a pro rata share of the fees and expenses of any other funds in which it invests. Such indirect expenses are not included in the Fund's reported expense ratios.
(d) Annualized.
(e) Total net expenses include the impact of certain fee waivers/expense reimbursements made by the Investment Manager and certain of its affiliates, if applicable.
(f) The benefits derived from expense reductions had an impact of less than 0.01%.
The accompanying Notes to Financial Statements are an integral part of this statement.
Semiannual Report 2016
23
COLUMBIA HIGH YIELD BOND FUND
FINANCIAL HIGHLIGHTS (continued)
| | | Six Months Ended
November 30, 2016 | | Year Ended May 31, | |
Class B | | (Unaudited) | | 2016 | | 2015 | | 2014 | | 2013 | | 2012 | |
Per share data | |
Net asset value, beginning of period | | $ | 2.84 | | | $ | 2.99 | | | $ | 3.04 | | | $ | 3.01 | | | $ | 2.78 | | | $ | 2.86 | | |
Income from investment operations: | |
Net investment income | | | 0.06 | | | | 0.12 | | | | 0.12 | | | | 0.14 | | | | 0.15 | | | | 0.16 | | |
Net realized and unrealized gain (loss) | | | 0.05 | | | | (0.15 | ) | | | (0.05 | ) | | | 0.03 | | | | 0.22 | | | | (0.07 | ) | |
Total from investment operations | | | 0.11 | | | | (0.03 | ) | | | 0.07 | | | | 0.17 | | | | 0.37 | | | | 0.09 | | |
Less distributions to shareholders: | |
Net investment income | | | (0.06 | ) | | | (0.12 | ) | | | (0.12 | ) | | | (0.14 | ) | | | (0.14 | ) | | | (0.17 | ) | |
Net realized gains | | | — | | | | — | | | | — | | | | — | | | | — | | | | (0.00 | )(a) | |
Total distributions to shareholders | | | (0.06 | ) | | | (0.12 | ) | | | (0.12 | ) | | | (0.14 | ) | | | (0.14 | ) | | | (0.17 | ) | |
Proceeds from regulatory settlements | | | — | | | | — | | | | — | | | | — | | | | — | | | | 0.00 | (a) | |
Net asset value, end of period | | $ | 2.89 | | | $ | 2.84 | | | $ | 2.99 | | | $ | 3.04 | | | $ | 3.01 | | | $ | 2.78 | | |
Total return | | | 3.91 | % | | | (0.96 | %) | | | 2.35 | % | | | 5.75 | % | | | 13.69 | % | | | 3.20 | %(b) | |
Ratios to average net assets(c) | |
Total gross expenses | | | 1.78 | %(d) | | | 1.82 | % | | | 1.83 | % | | | 1.82 | % | | | 1.82 | % | | | 1.84 | % | |
Total net expenses(e) | | | 1.78 | %(d)(f) | | | 1.82 | %(f) | | | 1.82 | %(f) | | | 1.82 | %(f) | | | 1.82 | %(f) | | | 1.79 | %(f) | |
Net investment income | | | 4.00 | %(d) | | | 4.12 | % | | | 4.02 | % | | | 4.63 | % | | | 4.99 | % | | | 5.77 | % | |
Supplemental data | |
Net assets, end of period (in thousands) | | $ | 3,767 | | | $ | 4,468 | | | $ | 9,309 | | | $ | 15,652 | | | $ | 27,239 | | | $ | 34,361 | | |
Portfolio turnover | | | 30 | % | | | 51 | % | | | 64 | % | | | 63 | % | | | 81 | % | | | 76 | % | |
Notes to Financial Highlights
(a) Rounds to zero.
(b) The Fund received proceeds from regulatory settlements. Had the Fund not received these proceeds, the total return would have been lower by 0.08%.
(c) In addition to the fees and expenses that the Fund bears directly, the Fund indirectly bears a pro rata share of the fees and expenses of any other funds in which it invests. Such indirect expenses are not included in the Fund's reported expense ratios.
(d) Annualized.
(e) Total net expenses include the impact of certain fee waivers/expense reimbursements made by the Investment Manager and certain of its affiliates, if applicable.
(f) The benefits derived from expense reductions had an impact of less than 0.01%.
The accompanying Notes to Financial Statements are an integral part of this statement.
Semiannual Report 2016
24
COLUMBIA HIGH YIELD BOND FUND
FINANCIAL HIGHLIGHTS (continued)
| | | Six Months Ended
November 30, 2016 | | Year Ended May 31, | |
Class C | | (Unaudited) | | 2016 | | 2015 | | 2014 | | 2013 | | 2012 | |
Per share data | |
Net asset value, beginning of period | | $ | 2.83 | | | $ | 2.97 | | | $ | 3.02 | | | $ | 2.99 | | | $ | 2.76 | | | $ | 2.84 | | |
Income from investment operations: | |
Net investment income | | | 0.06 | | | | 0.12 | | | | 0.12 | | | | 0.14 | | | | 0.15 | | | | 0.16 | | |
Net realized and unrealized gain (loss) | | | 0.04 | | | | (0.14 | ) | | | (0.05 | ) | | | 0.03 | | | | 0.22 | | | | (0.08 | ) | |
Total from investment operations | | | 0.10 | | | | (0.02 | ) | | | 0.07 | | | | 0.17 | | | | 0.37 | | | | 0.08 | | |
Less distributions to shareholders: | |
Net investment income | | | (0.06 | ) | | | (0.12 | ) | | | (0.12 | ) | | | (0.14 | ) | | | (0.14 | ) | | | (0.16 | ) | |
Net realized gains | | | — | | | | — | | | | — | | | | — | | | | — | | | | (0.00 | )(a) | |
Total distributions to shareholders | | | (0.06 | ) | | | (0.12 | ) | | | (0.12 | ) | | | (0.14 | ) | | | (0.14 | ) | | | (0.16 | ) | |
Proceeds from regulatory settlements | | | — | | | | — | | | | — | | | | — | | | | — | | | | 0.00 | (a) | |
Net asset value, end of period | | $ | 2.87 | | | $ | 2.83 | | | $ | 2.97 | | | $ | 3.02 | | | $ | 2.99 | | | $ | 2.76 | | |
Total return | | | 3.55 | % | | | (0.64 | %) | | | 2.38 | % | | | 5.92 | % | | | 13.78 | % | | | 3.20 | %(b) | |
Ratios to average net assets(c) | |
Total gross expenses | | | 1.78 | %(d) | | | 1.82 | % | | | 1.83 | % | | | 1.82 | % | | | 1.83 | % | | | 1.83 | % | |
Total net expenses(e) | | | 1.78 | %(d)(f) | | | 1.82 | %(f) | | | 1.78 | %(f) | | | 1.67 | %(f) | | | 1.80 | %(f) | | | 1.79 | %(f) | |
Net investment income | | | 4.00 | %(d) | | | 4.12 | % | | �� | 4.06 | % | | | 4.76 | % | | | 4.98 | % | | | 5.79 | % | |
Supplemental data | |
Net assets, end of period (in thousands) | | $ | 87,438 | | | $ | 82,543 | | | $ | 87,006 | | | $ | 97,714 | | | $ | 97,487 | | | $ | 75,596 | | |
Portfolio turnover | | | 30 | % | | | 51 | % | | | 64 | % | | | 63 | % | | | 81 | % | | | 76 | % | |
Notes to Financial Highlights
(a) Rounds to zero.
(b) The Fund received proceeds from regulatory settlements. Had the Fund not received these proceeds, the total return would have been lower by 0.08%.
(c) In addition to the fees and expenses that the Fund bears directly, the Fund indirectly bears a pro rata share of the fees and expenses of any other funds in which it invests. Such indirect expenses are not included in the Fund's reported expense ratios.
(d) Annualized.
(e) Total net expenses include the impact of certain fee waivers/expense reimbursements made by the Investment Manager and certain of its affiliates, if applicable.
(f) The benefits derived from expense reductions had an impact of less than 0.01%.
The accompanying Notes to Financial Statements are an integral part of this statement.
Semiannual Report 2016
25
COLUMBIA HIGH YIELD BOND FUND
FINANCIAL HIGHLIGHTS (continued)
| | | Six Months Ended
November 30, 2016 | | Year Ended May 31, | |
Class I | | (Unaudited) | | 2016 | | 2015 | | 2014 | | 2013 | | 2012 | |
Per share data | |
Net asset value, beginning of period | | $ | 2.84 | | | $ | 2.99 | | | $ | 3.03 | | | $ | 3.00 | | | $ | 2.78 | | | $ | 2.86 | | |
Income from investment operations: | |
Net investment income | | | 0.07 | | | | 0.15 | | | | 0.15 | | | | 0.17 | | | | 0.18 | | | | 0.19 | | |
Net realized and unrealized gain (loss) | | | 0.05 | | | | (0.15 | ) | | | (0.04 | ) | | | 0.03 | | | | 0.22 | | | | (0.07 | ) | |
Total from investment operations | | | 0.12 | | | | — | | | | 0.11 | | | | 0.20 | | | | 0.40 | | | | 0.12 | | |
Less distributions to shareholders: | |
Net investment income | | | (0.08 | ) | | | (0.15 | ) | | | (0.15 | ) | | | (0.17 | ) | | | (0.18 | ) | | | (0.20 | ) | |
Net realized gains | | | — | | | | — | | | | — | | | | — | | | | — | | | | (0.00 | )(a) | |
Total distributions to shareholders | | | (0.08 | ) | | | (0.15 | ) | | | (0.15 | ) | | | (0.17 | ) | | | (0.18 | ) | | | (0.20 | ) | |
Proceeds from regulatory settlements | | | — | | | | — | | | | — | | | | — | | | | — | | | | 0.00 | (a) | |
Net asset value, end of period | | $ | 2.88 | | | $ | 2.84 | | | $ | 2.99 | | | $ | 3.03 | | | $ | 3.00 | | | $ | 2.78 | | |
Total return | | | 4.13 | % | | | 0.19 | % | | | 3.88 | % | | | 6.99 | % | | | 14.64 | % | | | 4.38 | %(b) | |
Ratios to average net assets(c) | |
Total gross expenses | | | 0.65 | %(d) | | | 0.66 | % | | | 0.65 | % | | | 0.66 | % | | | 0.66 | % | | | 0.66 | % | |
Total net expenses(e) | | | 0.65 | %(d) | | | 0.66 | % | | | 0.65 | % | | | 0.66 | % | | | 0.66 | % | | | 0.66 | % | |
Net investment income | | | 5.14 | %(d) | | | 5.28 | % | | | 5.18 | % | | | 5.76 | % | | | 6.15 | % | | | 6.91 | % | |
Supplemental data | |
Net assets, end of period (in thousands) | | $ | 298,012 | | | $ | 317,607 | | | $ | 315,944 | | | $ | 192,255 | | | $ | 112,742 | | | $ | 141,388 | | |
Portfolio turnover | | | 30 | % | | | 51 | % | | | 64 | % | | | 63 | % | | | 81 | % | | | 76 | % | |
Notes to Financial Highlights
(a) Rounds to zero.
(b) The Fund received proceeds from regulatory settlements. Had the Fund not received these proceeds, the total return would have been lower by 0.08%.
(c) In addition to the fees and expenses that the Fund bears directly, the Fund indirectly bears a pro rata share of the fees and expenses of any other funds in which it invests. Such indirect expenses are not included in the Fund's reported expense ratios.
(d) Annualized.
(e) Total net expenses include the impact of certain fee waivers/expense reimbursements made by the Investment Manager and certain of its affiliates, if applicable.
The accompanying Notes to Financial Statements are an integral part of this statement.
Semiannual Report 2016
26
COLUMBIA HIGH YIELD BOND FUND
FINANCIAL HIGHLIGHTS (continued)
| | | Six Months Ended
November 30, 2016 | | Year Ended May 31, | |
Class K | | (Unaudited) | | 2016 | | 2015 | | 2014 | | 2013 | | 2012 | |
Per share data | |
Net asset value, beginning of period | | $ | 2.85 | | | $ | 3.00 | | | $ | 3.04 | | | $ | 3.01 | | | $ | 2.79 | | | $ | 2.86 | | |
Income from investment operations: | |
Net investment income | | | 0.07 | | | | 0.14 | | | | 0.15 | | | | 0.16 | | | | 0.17 | | | | 0.18 | | |
Net realized and unrealized gain (loss) | | | 0.04 | | | | (0.15 | ) | | | (0.04 | ) | | | 0.03 | | | | 0.22 | | | | (0.06 | ) | |
Total from investment operations | | | 0.11 | | | | (0.01 | ) | | | 0.11 | | | | 0.19 | | | | 0.39 | | | | 0.12 | | |
Less distributions to shareholders: | |
Net investment income | | | (0.07 | ) | | | (0.14 | ) | | | (0.15 | ) | | | (0.16 | ) | | | (0.17 | ) | | | (0.19 | ) | |
Net realized gains | | | — | | | | — | | | | — | | | | — | | | | — | | | | (0.00 | )(a) | |
Total distributions to shareholders | | | (0.07 | ) | | | (0.14 | ) | | | (0.15 | ) | | | (0.16 | ) | | | (0.17 | ) | | | (0.19 | ) | |
Proceeds from regulatory settlements | | | — | | | | — | | | | — | | | | — | | | | — | | | | 0.00 | (a) | |
Net asset value, end of period | | $ | 2.89 | | | $ | 2.85 | | | $ | 3.00 | | | $ | 3.04 | | | $ | 3.01 | | | $ | 2.79 | | |
Total return | | | 3.98 | % | | | (0.09 | %) | | | 3.58 | % | | | 6.67 | % | | | 14.26 | % | | | 4.44 | %(b) | |
Ratios to average net assets(c) | |
Total gross expenses | | | 0.94 | %(d) | | | 0.96 | % | | | 0.95 | % | | | 0.96 | % | | | 0.96 | % | | | 0.96 | % | |
Total net expenses(e) | | | 0.94 | %(d) | | | 0.96 | % | | | 0.95 | % | | | 0.96 | % | | | 0.96 | % | | | 0.96 | % | |
Net investment income | | | 4.85 | %(d) | | | 4.98 | % | | | 4.88 | % | | | 5.48 | % | | | 5.84 | % | | | 6.62 | % | |
Supplemental data | |
Net assets, end of period (in thousands) | | $ | 34,918 | | | $ | 38,047 | | | $ | 57,594 | | | $ | 54,345 | | | $ | 62,347 | | | $ | 63,276 | | |
Portfolio turnover | | | 30 | % | | | 51 | % | | | 64 | % | | | 63 | % | | | 81 | % | | | 76 | % | |
Notes to Financial Highlights
(a) Rounds to zero.
(b) The Fund received proceeds from regulatory settlements. Had the Fund not received these proceeds, the total return would have been lower by 0.08%.
(c) In addition to the fees and expenses that the Fund bears directly, the Fund indirectly bears a pro rata share of the fees and expenses of any other funds in which it invests. Such indirect expenses are not included in the Fund's reported expense ratios.
(d) Annualized.
(e) Total net expenses include the impact of certain fee waivers/expense reimbursements made by the Investment Manager and certain of its affiliates, if applicable.
The accompanying Notes to Financial Statements are an integral part of this statement.
Semiannual Report 2016
27
COLUMBIA HIGH YIELD BOND FUND
FINANCIAL HIGHLIGHTS (continued)
| | | Six Months Ended
November 30, 2016 | | Year Ended May 31, | |
Class R | | (Unaudited) | | 2016 | | 2015 | | 2014 | | 2013 | | 2012 | |
Per share data | |
Net asset value, beginning of period | | $ | 2.85 | | | $ | 3.00 | | | $ | 3.05 | | | $ | 3.02 | | | $ | 2.79 | | | $ | 2.87 | | |
Income from investment operations: | |
Net investment income | | | 0.07 | | | | 0.13 | | | | 0.13 | | | | 0.15 | | | | 0.16 | | | | 0.17 | | |
Net realized and unrealized gain (loss) | | | 0.05 | | | | (0.15 | ) | | | (0.05 | ) | | | 0.03 | | | | 0.23 | | | | (0.07 | ) | |
Total from investment operations | | | 0.12 | | | | (0.02 | ) | | | 0.08 | | | | 0.18 | | | | 0.39 | | | | 0.10 | | |
Less distributions to shareholders: | |
Net investment income | | | (0.07 | ) | | | (0.13 | ) | | | (0.13 | ) | | | (0.15 | ) | | | (0.16 | ) | | | (0.18 | ) | |
Net realized gains | | | — | | | | — | | | | — | | | | — | | | | — | | | | (0.00 | )(a) | |
Total distributions to shareholders | | | (0.07 | ) | | | (0.13 | ) | | | (0.13 | ) | | | (0.15 | ) | | | (0.16 | ) | | | (0.18 | ) | |
Proceeds from regulatory settlements | | | — | | | | — | | | | — | | | | — | | | | — | | | | 0.00 | (a) | |
Net asset value, end of period | | $ | 2.90 | | | $ | 2.85 | | | $ | 3.00 | | | $ | 3.05 | | | $ | 3.02 | | | $ | 2.79 | | |
Total return | | | 4.16 | % | | | (0.44 | %) | | | 2.87 | % | | | 6.28 | % | | | 14.24 | % | | | 3.75 | %(b) | |
Ratios to average net assets(c) | |
Total gross expenses | | | 1.29 | %(d) | | | 1.32 | % | | | 1.33 | % | | | 1.32 | % | | | 1.33 | % | | | 1.33 | % | |
Total net expenses(e) | | | 1.29 | %(d)(f) | | | 1.32 | %(f) | | | 1.32 | %(f) | | | 1.32 | %(f) | | | 1.32 | %(f) | | | 1.29 | %(f) | |
Net investment income | | | 4.51 | %(d) | | | 4.63 | % | | | 4.51 | % | | | 5.10 | % | | | 5.45 | % | | | 6.29 | % | |
Supplemental data | |
Net assets, end of period (in thousands) | | $ | 24,278 | | | $ | 22,299 | | | $ | 19,516 | | | $ | 18,782 | | | $ | 13,967 | | | $ | 7,582 | | |
Portfolio turnover | | | 30 | % | | | 51 | % | | | 64 | % | | | 63 | % | | | 81 | % | | | 76 | % | |
Notes to Financial Highlights
(a) Rounds to zero.
(b) The Fund received proceeds from regulatory settlements. Had the Fund not received these proceeds, the total return would have been lower by 0.08%.
(c) In addition to the fees and expenses that the Fund bears directly, the Fund indirectly bears a pro rata share of the fees and expenses of any other funds in which it invests. Such indirect expenses are not included in the Fund's reported expense ratios.
(d) Annualized.
(e) Total net expenses include the impact of certain fee waivers/expense reimbursements made by the Investment Manager and certain of its affiliates, if applicable.
(f) The benefits derived from expense reductions had an impact of less than 0.01%.
The accompanying Notes to Financial Statements are an integral part of this statement.
Semiannual Report 2016
28
COLUMBIA HIGH YIELD BOND FUND
FINANCIAL HIGHLIGHTS (continued)
| | | Six Months Ended
November 30, 2016 | | Year Ended May 31, | |
Class R4 | | (Unaudited) | | 2016 | | 2015 | | 2014 | | 2013 | | 2012 | |
Per share data | |
Net asset value, beginning of period | | $ | 2.86 | | | $ | 3.01 | | | $ | 3.06 | | | $ | 3.03 | | | $ | 2.80 | | | $ | 2.88 | | |
Income from investment operations: | |
Net investment income | | | 0.07 | | | | 0.15 | | | | 0.15 | | | | 0.17 | | | | 0.17 | | | | 0.18 | | |
Net realized and unrealized gain (loss) | | | 0.06 | | | | (0.15 | ) | | | (0.05 | ) | | | 0.03 | | | | 0.23 | | | | (0.08 | ) | |
Total from investment operations | | | 0.13 | | | | — | | | | 0.10 | | | | 0.20 | | | | 0.40 | | | | 0.10 | | |
Less distributions to shareholders: | |
Net investment income | | | (0.08 | ) | | | (0.15 | ) | | | (0.15 | ) | | | (0.17 | ) | | | (0.17 | ) | | | (0.18 | ) | |
Net realized gains | | | — | | | | — | | | | — | | | | — | | | | — | | | | (0.00 | )(a) | |
Total distributions to shareholders | | | (0.08 | ) | | | (0.15 | ) | | | (0.15 | ) | | | (0.17 | ) | | | (0.17 | ) | | | (0.18 | ) | |
Proceeds from regulatory settlements | | | — | | | | — | | | | — | | | | — | | | | — | | | | 0.00 | (a) | |
Net asset value, end of period | | $ | 2.91 | | | $ | 2.86 | | | $ | 3.01 | | | $ | 3.06 | | | $ | 3.03 | | | $ | 2.80 | | |
Total return | | | 4.41 | % | | | 0.07 | % | | | 3.38 | % | | | 6.81 | % | | | 14.59 | % | | | 3.83 | %(b) | |
Ratios to average net assets(c) | |
Total gross expenses | | | 0.79 | %(d) | | | 0.81 | % | | | 0.83 | % | | | 0.82 | % | | | 0.97 | % | | | 1.21 | % | |
Total net expenses(e) | | | 0.79 | %(d)(f) | | | 0.81 | %(f) | | | 0.82 | %(f) | | | 0.82 | %(f) | | | 0.97 | % | | | 1.21 | % | |
Net investment income | | | 5.03 | %(d) | | | 5.11 | % | | | 5.01 | % | | | 5.60 | % | | | 5.82 | % | | | 6.37 | % | |
Supplemental data | |
Net assets, end of period (in thousands) | | $ | 58,729 | | | $ | 29,969 | | | $ | 14,992 | | | $ | 10,379 | | | $ | 10,468 | | | $ | 8,176 | | |
Portfolio turnover | | | 30 | % | | | 51 | % | | | 64 | % | | | 63 | % | | | 81 | % | | | 76 | % | |
Notes to Financial Highlights
(a) Rounds to zero.
(b) The Fund received proceeds from regulatory settlements. Had the Fund not received these proceeds, the total return would have been lower by 0.08%.
(c) In addition to the fees and expenses that the Fund bears directly, the Fund indirectly bears a pro rata share of the fees and expenses of any other funds in which it invests. Such indirect expenses are not included in the Fund's reported expense ratios.
(d) Annualized.
(e) Total net expenses include the impact of certain fee waivers/expense reimbursements made by the Investment Manager and certain of its affiliates, if applicable.
(f) The benefits derived from expense reductions had an impact of less than 0.01%.
The accompanying Notes to Financial Statements are an integral part of this statement.
Semiannual Report 2016
29
COLUMBIA HIGH YIELD BOND FUND
FINANCIAL HIGHLIGHTS (continued)
| | | Six Months Ended
November 30, 2016 | | Year Ended May 31, | |
Class R5 | | (Unaudited) | | 2016 | | 2015 | | 2014 | | 2013 | | 2012 | |
Per share data | |
Net asset value, beginning of period | | $ | 2.84 | | | $ | 2.98 | | | $ | 3.04 | | | $ | 3.01 | | | $ | 2.78 | | | $ | 2.86 | | |
Income from investment operations: | |
Net investment income | | | 0.07 | | | | 0.15 | | | | 0.15 | | | | 0.17 | | | | 0.18 | | | | 0.19 | | |
Net realized and unrealized gain (loss) | | | 0.05 | | | | (0.14 | ) | | | (0.06 | ) | | | 0.03 | | | | 0.23 | | | | (0.07 | ) | |
Total from investment operations | | | 0.12 | | | | 0.01 | | | | 0.09 | | | | 0.20 | | | | 0.41 | | | | 0.12 | | |
Less distributions to shareholders: | |
Net investment income | | | (0.08 | ) | | | (0.15 | ) | | | (0.15 | ) | | | (0.17 | ) | | | (0.18 | ) | | | (0.20 | ) | |
Net realized gains | | | — | | | | — | | | | — | | | | — | | | | — | | | | (0.00 | )(a) | |
Total distributions to shareholders | | | (0.08 | ) | | | (0.15 | ) | | | (0.15 | ) | | | (0.17 | ) | | | (0.18 | ) | | | (0.20 | ) | |
Proceeds from regulatory settlements | | | — | | | | — | | | | — | | | | — | | | | — | | | | 0.00 | (a) | |
Net asset value, end of period | | $ | 2.88 | | | $ | 2.84 | | | $ | 2.98 | | | $ | 3.04 | | | $ | 3.01 | | | $ | 2.78 | | |
Total return | | | 4.11 | % | | | 0.48 | % | | | 3.15 | % | | | 6.93 | % | | | 14.96 | % | | | 4.32 | %(b) | |
Ratios to average net assets(c) | |
Total gross expenses | | | 0.69 | %(d) | | | 0.71 | % | | | 0.71 | % | | | 0.71 | % | | | 0.71 | % | | | 0.71 | % | |
Total net expenses(e) | | | 0.69 | %(d) | | | 0.71 | % | | | 0.71 | % | | | 0.71 | % | | | 0.71 | % | | | 0.71 | % | |
Net investment income | | | 5.09 | %(d) | | | 5.18 | % | | | 5.12 | % | | | 5.71 | % | | | 6.06 | % | | | 6.76 | % | |
Supplemental data | |
Net assets, end of period (in thousands) | | $ | 71,212 | | | $ | 173,794 | | | $ | 33,231 | | | $ | 15,564 | | | $ | 15,124 | | | $ | 8,675 | | |
Portfolio turnover | | | 30 | % | | | 51 | % | | | 64 | % | | | 63 | % | | | 81 | % | | | 76 | % | |
Notes to Financial Highlights
(a) Rounds to zero.
(b) The Fund received proceeds from regulatory settlements. Had the Fund not received these proceeds, the total return would have been lower by 0.08%.
(c) In addition to the fees and expenses that the Fund bears directly, the Fund indirectly bears a pro rata share of the fees and expenses of any other funds in which it invests. Such indirect expenses are not included in the Fund's reported expense ratios.
(d) Annualized.
(e) Total net expenses include the impact of certain fee waivers/expense reimbursements made by the Investment Manager and certain of its affiliates, if applicable.
The accompanying Notes to Financial Statements are an integral part of this statement.
Semiannual Report 2016
30
COLUMBIA HIGH YIELD BOND FUND
FINANCIAL HIGHLIGHTS (continued)
| | | Six Months Ended
November 30, 2016 | | Year Ended May 31, | |
Class W | | (Unaudited) | | 2016 | | 2015 | | 2014 | | 2013 | | 2012 | |
Per share data | |
Net asset value, beginning of period | | $ | 2.82 | | | $ | 2.97 | | | $ | 3.02 | | | $ | 2.99 | | | $ | 2.76 | | | $ | 2.84 | | |
Income from investment operations: | |
Net investment income | | | 0.07 | | | | 0.14 | | | | 0.14 | | | | 0.16 | | | | 0.17 | | | | 0.18 | | |
Net realized and unrealized gain (loss) | | | 0.04 | | | | (0.15 | ) | | | (0.05 | ) | | | 0.03 | | | | 0.23 | | | | (0.07 | ) | |
Total from investment operations | | | 0.11 | | | | (0.01 | ) | | | 0.09 | | | | 0.19 | | | | 0.40 | | | | 0.11 | | |
Less distributions to shareholders: | |
Net investment income | | | (0.07 | ) | | | (0.14 | ) | | | (0.14 | ) | | | (0.16 | ) | | | (0.17 | ) | | | (0.19 | ) | |
Net realized gains | | | — | | | | — | | | | — | | | | — | | | | — | | | | (0.00 | )(a) | |
Total distributions to shareholders | | | (0.07 | ) | | | (0.14 | ) | | | (0.14 | ) | | | (0.16 | ) | | | (0.17 | ) | | | (0.19 | ) | |
Proceeds from regulatory settlements | | | — | | | | — | | | | — | | | | — | | | | — | | | | 0.00 | (a) | |
Net asset value, end of period | | $ | 2.86 | | | $ | 2.82 | | | $ | 2.97 | | | $ | 3.02 | | | $ | 2.99 | | | $ | 2.76 | | |
Total return | | | 3.94 | % | | | (0.10 | %) | | | 3.11 | % | | | 6.54 | % | | | 14.61 | % | | | 3.97 | %(b) | |
Ratios to average net assets(c) | |
Total gross expenses | | | 1.04 | %(d) | | | 1.08 | % | | | 1.08 | % | | | 1.07 | % | | | 1.08 | % | | | 1.11 | % | |
Total net expenses(e) | | | 1.04 | %(d)(f) | | | 1.07 | %(f) | | | 1.07 | %(f) | | | 1.07 | %(f) | | | 1.07 | %(f) | | | 1.05 | %(f) | |
Net investment income | | | 4.77 | %(d) | | | 4.98 | % | | | 4.79 | % | | | 5.32 | % | | | 5.72 | % | | | 6.59 | % | |
Supplemental data | |
Net assets, end of period (in thousands) | | $ | 346 | | | $ | 416 | | | $ | 43,487 | | | $ | 75,524 | | | $ | 50,998 | | | $ | 44,832 | | |
Portfolio turnover | | | 30 | % | | | 51 | % | | | 64 | % | | | 63 | % | | | 81 | % | | | 76 | % | |
Notes to Financial Highlights
(a) Rounds to zero.
(b) The Fund received proceeds from regulatory settlements. Had the Fund not received these proceeds, the total return would have been lower by 0.08%.
(c) In addition to the fees and expenses that the Fund bears directly, the Fund indirectly bears a pro rata share of the fees and expenses of any other funds in which it invests. Such indirect expenses are not included in the Fund's reported expense ratios.
(d) Annualized.
(e) Total net expenses include the impact of certain fee waivers/expense reimbursements made by the Investment Manager and certain of its affiliates, if applicable.
(f) The benefits derived from expense reductions had an impact of less than 0.01%.
The accompanying Notes to Financial Statements are an integral part of this statement.
Semiannual Report 2016
31
COLUMBIA HIGH YIELD BOND FUND
FINANCIAL HIGHLIGHTS (continued)
| | | Six Months Ended
November 30, 2016 | | Year Ended May 31, | |
Class Y | | (Unaudited) | | 2016 | | 2015 | | 2014 | | 2013(a) | |
Per share data | |
Net asset value, beginning of period | | $ | 2.84 | | | $ | 2.99 | | | $ | 3.03 | | | $ | 3.00 | | | $ | 2.92 | | |
Income from investment operations: | |
Net investment income | | | 0.07 | | | | 0.15 | | | | 0.15 | | | | 0.17 | | | | 0.10 | | |
Net realized and unrealized gain (loss) | | | 0.05 | | | | (0.15 | ) | | | (0.04 | ) | | | 0.03 | | | | 0.08 | | |
Total from investment operations | | | 0.12 | | | | — | | | | 0.11 | | | | 0.20 | | | | 0.18 | | |
Less distributions to shareholders: | |
Net investment income | | | (0.08 | ) | | | (0.15 | ) | | | (0.15 | ) | | | (0.17 | ) | | | (0.10 | ) | |
Total distributions to shareholders | | | (0.08 | ) | | | (0.15 | ) | | | (0.15 | ) | | | (0.17 | ) | | | (0.10 | ) | |
Net asset value, end of period | | $ | 2.88 | | | $ | 2.84 | | | $ | 2.99 | | | $ | 3.03 | | | $ | 3.00 | | |
Total return | | | 4.13 | % | | | 0.19 | % | | | 3.89 | % | | | 6.98 | % | | | 6.16 | % | |
Ratios to average net assets(b) | |
Total gross expenses | | | 0.65 | %(c) | | | 0.66 | % | | | 0.65 | % | | | 0.66 | % | | | 0.58 | %(c) | |
Total net expenses(d) | | | 0.65 | %(c) | | | 0.66 | % | | | 0.65 | % | | | 0.66 | % | | | 0.58 | %(c) | |
Net investment income | | | 5.16 | %(c) | | | 5.29 | % | | | 5.18 | % | | | 5.71 | % | | | 6.06 | %(c) | |
Supplemental data | |
Net assets, end of period (in thousands) | | $ | 41,700 | | | $ | 19,341 | | | $ | 10,668 | | | $ | 6,091 | | | $ | 3 | | |
Portfolio turnover | | | 30 | % | | | 51 | % | | | 64 | % | | | 63 | % | | | 81 | % | |
Notes to Financial Highlights
(a) Based on operations from November 8, 2012 (commencement of operations) through the stated period end.
(b) In addition to the fees and expenses that the Fund bears directly, the Fund indirectly bears a pro rata share of the fees and expenses of any other funds in which it invests. Such indirect expenses are not included in the Fund's reported expense ratios.
(c) Annualized.
(d) Total net expenses include the impact of certain fee waivers/expense reimbursements made by the Investment Manager and certain of its affiliates, if applicable.
The accompanying Notes to Financial Statements are an integral part of this statement.
Semiannual Report 2016
32
COLUMBIA HIGH YIELD BOND FUND
FINANCIAL HIGHLIGHTS (continued)
| | | Six Months Ended
November 30, 2016 | | Year Ended May 31, | |
Class Z | | (Unaudited) | | 2016 | | 2015 | | 2014 | | 2013 | | 2012 | |
Per share data | |
Net asset value, beginning of period | | $ | 2.84 | | | $ | 2.99 | | | $ | 3.04 | | | $ | 3.01 | | | $ | 2.78 | | | $ | 2.85 | | |
Income from investment operations: | |
Net investment income | | | 0.07 | | | | 0.15 | | | | 0.15 | | | | 0.17 | | | | 0.17 | | | | 0.18 | | |
Net realized and unrealized gain (loss) | | | 0.05 | | | | (0.15 | ) | | | (0.05 | ) | | | 0.03 | | | | 0.23 | | | | (0.06 | ) | |
Total from investment operations | | | 0.12 | | | | — | | | | 0.10 | | | | 0.20 | | | | 0.40 | | | | 0.12 | | |
Less distributions to shareholders: | |
Net investment income | | | (0.08 | ) | | | (0.15 | ) | | | (0.15 | ) | | | (0.17 | ) | | | (0.17 | ) | | | (0.19 | ) | |
Net realized gains | | | — | | | | — | | | | — | | | | — | | | | — | | | | (0.00 | )(a) | |
Total distributions to shareholders | | | (0.08 | ) | | | (0.15 | ) | | | (0.15 | ) | | | (0.17 | ) | | | (0.17 | ) | | | (0.19 | ) | |
Proceeds from regulatory settlements | | | — | | | | — | | | | — | | | | — | | | | — | | | | 0.00 | (a) | |
Net asset value, end of period | | $ | 2.88 | | | $ | 2.84 | | | $ | 2.99 | | | $ | 3.04 | | | $ | 3.01 | | | $ | 2.78 | | |
Total return | | | 4.06 | % | | | 0.04 | % | | | 3.37 | % | | | 6.81 | % | | | 14.84 | % | | | 4.59 | %(b) | |
Ratios to average net assets(c) | |
Total gross expenses | | | 0.79 | %(d) | | | 0.81 | % | | | 0.83 | % | | | 0.82 | % | | | 0.82 | % | | | 0.80 | % | |
Total net expenses(e) | | | 0.79 | %(d)(f) | | | 0.81 | %(f) | | | 0.82 | %(f) | | | 0.82 | %(f) | | | 0.82 | %(f) | | | 0.78 | %(f) | |
Net investment income | | | 5.00 | %(d) | | | 5.12 | % | | | 5.01 | % | | | 5.58 | % | | | 5.86 | % | | | 6.58 | % | |
Supplemental data | |
Net assets, end of period (in thousands) | | $ | 249,123 | | | $ | 227,058 | | | $ | 208,466 | | | $ | 161,293 | | | $ | 153,684 | | | $ | 35,492 | | |
Portfolio turnover | | | 30 | % | | | 51 | % | | | 64 | % | | | 63 | % | | | 81 | % | | | 76 | % | |
Notes to Financial Highlights
(a) Rounds to zero.
(b) The Fund received proceeds from regulatory settlements. Had the Fund not received these proceeds, the total return would have been lower by 0.08%.
(c) In addition to the fees and expenses that the Fund bears directly, the Fund indirectly bears a pro rata share of the fees and expenses of any other funds in which it invests. Such indirect expenses are not included in the Fund's reported expense ratios.
(d) Annualized.
(e) Total net expenses include the impact of certain fee waivers/expense reimbursements made by the Investment Manager and certain of its affiliates, if applicable.
(f) The benefits derived from expense reductions had an impact of less than 0.01%.
The accompanying Notes to Financial Statements are an integral part of this statement.
Semiannual Report 2016
33
COLUMBIA HIGH YIELD BOND FUND
NOTES TO FINANCIAL STATEMENTS
November 30, 2016 (Unaudited)
Note 1. Organization
Columbia High Yield Bond Fund (the Fund), a series of Columbia Funds Series Trust II (the Trust), is a diversified fund. The Trust is registered under the Investment Company Act of 1940, as amended (the 1940 Act), as an open-end management investment company organized as a Massachusetts business trust.
Fund Shares
The Trust may issue an unlimited number of shares (without par value). The Fund offers Class A, Class B, Class C, Class I, Class K, Class R, Class R4, Class R5, Class W, Class Y and Class Z shares. Although all share classes generally have identical voting, dividend and liquidation rights, each share class votes separately when required by the Trust's organizational documents or by law. Different share classes pay different distribution amounts to the extent the expenses of such share classes differ, and distributions in liquidation will be proportional to the net asset value of each share class. Each share class has its own expense and sales charge structure.
Class A shares are subject to a maximum front-end sales charge of 4.75% based on the initial investment amount. Class A shares purchased without an initial sales charge in accounts aggregating $1 million to $50 million at the time of purchase are subject to a contingent deferred sales charge (CDSC) if the shares are sold within 18 months after purchase, charged as follows: 1.00% CDSC if redeemed within 12 months after purchase, and 0.50% CDSC if redeemed more than 12, but less than 18, months after purchase.
Class B shares may be subject to a maximum CDSC of 5.00% based upon the holding period after purchase. Class B shares will generally convert to Class A shares eight years after purchase. The Fund no longer accepts investments by new or existing investors in the Fund's Class B shares, except in connection with the reinvestment of any dividend and/or capital gain distributions in Class B shares of the Fund and exchanges by existing Class B shareholders of certain other funds within the Columbia Family of Funds.
Class C shares are subject to a 1.00% CDSC on shares redeemed within 12 months after purchase.
Class I shares are not subject to sales charges and are available only to the Columbia Family of Funds.
Class K shares are not subject to sales charges, however this share class is closed to new investors.
Class R shares are not subject to sales charges and are generally available only to certain retirement plans and other investors as described in the Fund's prospectus.
Class R4 shares are not subject to sales charges and are generally available only to omnibus retirement plans and certain investors as described in the Fund's prospectus.
Class R5 shares are not subject to sales charges and are generally available only to investors purchasing through authorized investment professionals and omnibus retirement plans.
Class W shares are not subject to sales charges and are generally available only to investors purchasing through authorized investment programs managed by investment professionals, including discretionary managed account programs.
Class Y shares are not subject to sales charges and are generally available only to certain retirement plans as described in the Fund's prospectus.
Class Z shares are not subject to sales charges and are generally available only to eligible investors, which are subject to different investment minimums as described in the Fund's prospectus.
Note 2. Summary of Significant Accounting Policies
Basis of Preparation
The Fund is an investment company that applies the accounting and reporting guidance in the Financial Accounting Standards Board (FASB) Accounting Standards Codification Topic 946, Financial Services — Investment Companies (ASC 946). The financial statements are prepared in accordance with U.S. generally accepted accounting principles (GAAP), which requires management to make certain estimates and assumptions that affect the reported amounts of assets and liabilities, the disclosure of contingent assets and liabilities at the date of the financial statements and the reported amounts of income and expenses during the reporting period. Actual results could differ from those estimates.
The following is a summary of significant accounting policies followed by the Fund in the preparation of its financial statements.
Security Valuation
Debt securities generally are valued by pricing services approved by the Board of Trustees (the Board) based
Semiannual Report 2016
34
COLUMBIA HIGH YIELD BOND FUND
NOTES TO FINANCIAL STATEMENTS (continued)
November 30, 2016 (Unaudited)
upon market transactions for normal, institutional-size trading units of similar securities. The services may use various pricing techniques that take into account, as applicable, factors such as yield, quality, coupon rate, maturity, type of issue, trading characteristics and other data, as well as approved independent broker-dealer quotes. Debt securities for which quotations are not readily available or not believed to be reflective of market value may also be valued based upon a bid quote from an approved independent broker-dealer. Debt securities maturing in 60 days or less are valued primarily at amortized cost value, unless this method results in a valuation that management believes does not approximate market value.
All equity securities are valued at the close of business of the New York Stock Exchange (NYSE). Equity securities are valued at the last quoted sales price on the principal exchange or market on which they trade, except for securities traded on the NASDAQ Stock Market, which are valued at the NASDAQ official close price. Unlisted securities or listed securities for which there were no sales during the day are valued at the mean of the latest quoted bid and ask prices on such exchanges or markets.
Senior loan securities for which reliable market quotations are readily available are generally valued by pricing services at the average of the bids received.
Investments in open-end investment companies, including money market funds, are valued at their latest net asset value.
Futures and options on futures contracts are valued based upon the settlement price at the close of regular trading on their principal exchanges or, in the absence of transactions, at the mean of the latest quoted bid and ask prices.
Investments for which market quotations are not readily available, or that have quotations which management believes are not reflective of market value or reliable, are valued at fair value as determined in good faith under procedures approved by and under the general supervision of the Board. If a security or class of securities (such as foreign securities) is valued at fair value, such value is likely to be different from the quoted or published price for the security.
The determination of fair value often requires significant judgment. To determine fair value, management may use assumptions including but not limited to future cash
flows and estimated risk premiums. Multiple inputs from various sources may be used to determine fair value.
GAAP requires disclosure regarding the inputs and valuation techniques used to measure fair value and any changes in valuation inputs or techniques. In addition, investments shall be disclosed by major category. This information is disclosed following the Fund's Portfolio of Investments.
Derivative Instruments
The Fund invests in certain derivative instruments, as detailed below, to meet its investment objectives. Derivatives are instruments whose values depend on, or are derived from, in whole or in part, the value of one or more securities, currencies, commodities, indices, or other assets or instruments. Derivatives may be used to increase investment flexibility (including to maintain cash reserves while maintaining desired exposure to certain assets), for risk management (hedging) purposes, to facilitate trading, to reduce transaction costs and to pursue higher investment returns. The Fund may also use derivative instruments to mitigate certain investment risks, such as foreign currency exchange rate risk, interest rate risk and credit risk. Derivatives may involve various risks, including the potential inability of the counterparty to fulfill its obligations under the terms of the contract, the potential for an illiquid secondary market (making it difficult for the Fund to sell or terminate, including at favorable prices) and the potential for market movements which may expose the Fund to gains or losses in excess of the amount shown in the Statement of Assets and Liabilities. The notional amounts of derivative instruments, if applicable, are not recorded in the financial statements.
A derivative instrument may suffer a marked-to-market loss if the value of the contract decreases due to an unfavorable change in the market rates or values of the underlying instrument. Losses can also occur if the counterparty does not perform its obligations under the contract. The Fund's risk of loss from counterparty credit risk on over-the-counter derivatives is generally limited to the aggregate unrealized gain netted against any collateral held by the Fund and the amount of any variation margin held by the counterparty, plus any replacement costs or related amounts. With exchange-traded or centrally cleared derivatives, there is reduced counterparty credit risk to the Fund since the clearinghouse or central counterparty (CCP) provides some protection in the case of clearing member default. The clearinghouse or CCP stands between the buyer and
Semiannual Report 2016
35
COLUMBIA HIGH YIELD BOND FUND
NOTES TO FINANCIAL STATEMENTS (continued)
November 30, 2016 (Unaudited)
the seller of the contract; therefore, additional counterparty credit risk is failure of the clearinghouse or CCP. However, credit risk still exists in exchange-traded or centrally cleared derivatives with respect to initial and variation margin that is held in a broker's customer account. While brokers are required to segregate customer margin from their own assets, in the event that a broker becomes insolvent or goes into bankruptcy and at that time there is a shortfall in the aggregate amount of margin held by the broker for all its clients, U.S. bankruptcy laws will typically allocate that shortfall on a pro-rata basis across all the broker's customers (including the Fund), potentially resulting in losses to the Fund.
In order to better define its contractual rights and to secure rights that will help the Fund mitigate its counterparty risk, the Fund may enter into an International Swaps and Derivatives Association, Inc. Master Agreement (ISDA Master Agreement) or similar agreement with its derivatives contract counterparties. An ISDA Master Agreement is an agreement between the Fund and a counterparty that governs over-the-counter derivatives and typically contains, among other things, collateral posting terms and netting provisions in the event of a default and/or termination event. Under an ISDA Master Agreement, the Fund may, under certain circumstances, offset with the counterparty certain derivative instrument's payables and/or receivables with collateral held and/or posted and create one single net payment. The provisions of the ISDA Master Agreement typically permit a single net payment in the event of default (close-out netting), including the bankruptcy or insolvency of the counterparty. Note, however, that bankruptcy or insolvency laws of a particular jurisdiction may impose restrictions on or prohibitions against the right of offset or netting in bankruptcy, insolvency or other events.
Collateral (margin) requirements differ by type of derivative. Margin requirements are established by the clearinghouse or CCP for exchange-traded and centrally cleared derivatives. Brokers can ask for margin in excess of the minimum in certain circumstances. Collateral terms are contract specific for over-the-counter derivatives. For over-the-counter derivatives traded under an ISDA Master Agreement, the collateral requirements are typically calculated by netting the marked-to-market amount for each transaction under such agreement and comparing that amount to the value of any variation margin currently pledged by the Fund and/or the counterparty. Generally, the amount of collateral due from
or to a party has to exceed a minimum transfer amount threshold (e.g., $250,000) before a transfer has to be made. To the extent amounts due to the Fund from its counterparties are not fully collateralized, contractually or otherwise, the Fund bears the risk of loss from counterparty nonperformance. The Fund attempts to mitigate counterparty risk by only entering into agreements with counterparties that it believes have the financial resources to honor their obligations and by monitoring the financial stability of those counterparties.
Certain ISDA Master Agreements allow counterparties of over-the-counter derivatives transactions to terminate derivatives contracts prior to maturity in the event the Fund's net asset value declines by a stated percentage over a specified time period or if the Fund fails to meet certain terms of the ISDA Master Agreement, which would cause the Fund to accelerate payment of any net liability owed to the counterparty. The Fund also has termination rights if the counterparty fails to meet certain terms of the ISDA Master Agreement. In addition to considering counterparty credit risk, the Fund would consider terminating the derivatives contracts based on whether termination would result in a net liability owed from the counterparty.
For financial reporting purposes, the Fund does not offset derivative assets and derivative liabilities that are subject to netting arrangements in the Statement of Assets and Liabilities.
Futures Contracts
Futures contracts are exchange-traded and represent commitments for the future purchase or sale of an asset at a specified price on a specified date. The Fund bought and sold futures contracts to manage the duration and yield curve exposure of the Fund versus the benchmark and to manage exposure to movements in interest rates. These instruments may be used for other purposes in future periods. Upon entering into futures contracts, the Fund bears risks that it may not achieve the anticipated benefits of the futures contracts and may realize a loss. Additional risks include counterparty credit risk, the possibility of an illiquid market, and that a change in the value of the contract or option may not correlate with changes in the value of the underlying asset.
Upon entering into a futures contract, the Fund deposits cash or securities with the broker, known as a futures commissions merchant (FCM), in an amount sufficient to meet the initial margin requirement. The initial margin deposit must be maintained at an established level over the life of the contract. Cash deposited as initial margin
Semiannual Report 2016
36
COLUMBIA HIGH YIELD BOND FUND
NOTES TO FINANCIAL STATEMENTS (continued)
November 30, 2016 (Unaudited)
is recorded in the Statement of Assets and Liabilities as margin deposits. Securities deposited as initial margin are designated in the Portfolio of Investments. Subsequent payments (variation margin) are made or received by the Fund each day. The variation margin payments are equal to the daily change in the contract value and are recorded as variation margin receivable or payable and are offset in unrealized gains or losses. The Fund recognizes a realized gain or loss when the contract is closed or expires. Futures contracts involve, to varying degrees, risk of loss in excess of the variation margin disclosed in the Statement of Assets and Liabilities.
Effects of Derivative Transactions in the Financial Statements
The following tables are intended to provide additional information about the effect of derivatives on the financial statements of the Fund, including: the fair value of derivatives by risk category and the location of those fair values in the Statement of Assets and Liabilities; and the impact of derivative transactions over the period in the Statement of Operations, including realized and unrealized gains (losses). The derivative instrument schedules following the Portfolio of Investments present additional information regarding derivative instruments outstanding at the end of the period, if any.
The following table is a summary of the fair value of derivative instruments (not considered to be hedging instruments for accounting disclosure purposes) at November 30, 2016:
Asset Derivatives | |
Risk Exposure
Category | | Statement of Assets and
Liabilities Location | | Fair Value ($) | |
Interest rate risk | | Net assets — unrealized
appreciation on futures
contracts | | | 207,783 | * | |
*Includes cumulative appreciation (depreciation) as reported in the tables following the Portfolio of Investments. Only the current day's variation margin is reported in receivables or payables in the Statement of Assets and Liabilities.
The following table indicates the effect of derivative instruments (not considered to be hedging instruments for accounting disclosure purposes) in the Statement of Operations for the six months ended November 30, 2016:
Amount of Realized Gain (Loss) on Derivatives Recognized in Income | |
Risk Exposure Category | | Futures Contracts ($) | |
Interest rate risk | | | 808,787 | | |
Change in Unrealized Appreciation (Depreciation) on Derivatives Recognized in Income | |
Risk Exposure Category | | Futures Contracts ($) | |
Interest rate risk | | | 242,086 | | |
The following table provides a summary of the average outstanding volume by derivative instrument for the six months ended November 30, 2016:
Derivative Instrument | | Average Notional Amounts ($)* | |
Futures contracts — Short | | | 62,521,508 | | |
*Based on the ending quarterly outstanding amounts for the six months ended November 30, 2016.
Investments in Senior Loans
The Fund may invest in senior loan assignments. When the Fund purchases an assignment of a senior loan, the Fund typically has direct rights against the borrower; provided, however, that the Fund's rights may be more limited than the lender from which it acquired the assignment and the Fund may be able to enforce its rights only through an administrative agent. Although certain senior loan assignments are secured by collateral, the Fund could experience delays or limitations in realizing such collateral or have its interest subordinated to other indebtedness of the obligor. In the event that the administrator or collateral agent of a loan becomes insolvent, enters into receivership or bankruptcy, the Fund may incur costs and delays in realizing payment or may suffer a loss of principal and/or interest. The risk of loss is greater for unsecured or subordinated loans. In addition, senior loan assignments are vulnerable to market, economic or other conditions or events that may reduce the demand for senior loan assignments and certain senior loan assignments which were liquid, when purchased, may become illiquid.
The Fund may enter into senior loan assignments where all or a portion of the loan may be unfunded. The Fund is obligated to fund these commitments at the borrower's discretion. These commitments are generally traded and priced in the same manner as other senior loan securities and are disclosed as unfunded senior loan commitments in the Fund's Portfolio of Investments with a corresponding payable for investments purchased. The Fund designates cash or liquid securities to cover these commitments.
Delayed Delivery Securities
The Fund may trade securities on other than normal settlement terms, including securities purchased or sold
Semiannual Report 2016
37
COLUMBIA HIGH YIELD BOND FUND
NOTES TO FINANCIAL STATEMENTS (continued)
November 30, 2016 (Unaudited)
on a "when-issued" basis. This may increase risk to the Fund since the other party to the transaction may fail to deliver, which could cause the Fund to subsequently invest at less advantageous prices. The Fund designates cash or liquid securities in an amount equal to the delayed delivery commitment.
Security Transactions
Security transactions are accounted for on the trade date. Cost is determined and gains (losses) are based upon the specific identification method for both financial statement and federal income tax purposes.
Trade date for senior loans purchased in the primary market is the date on which the loan is allocated. Trade date for senior loans purchased in the secondary market is the date on which the transaction is entered into.
Income Recognition
Interest income is recorded on an accrual basis. Market premiums and discounts, including original issue discounts, are amortized and accreted, respectively, over the expected life of the security on all debt securities, unless otherwise noted.
The Fund may place a debt security on non-accrual status and reduce related interest income when it becomes probable that the interest will not be collected and the amount of uncollectible interest can be reasonably estimated. A defaulted debt security is removed from non-accrual status when the issuer resumes interest payments or when collectibility of interest is reasonably assured.
Corporate actions and dividend income are recorded on the ex-dividend date.
The Fund may receive distributions from holdings in equity securities, business development companies (BDCs), exchange-traded funds, other regulated investment companies (RICs), and real estate investment trusts (REITs), which report information on the tax character of their distributions annually. These distributions are allocated to dividend income, capital gain and return of capital based on actual information reported. Return of capital is recorded as a reduction of the cost basis of securities held. If the Fund no longer owns the applicable securities, return of capital is recorded as a realized gain. With respect to REITs, to the extent actual information has not yet been reported, estimates for return of capital are made by the Fund's management. Management's estimates are subsequently adjusted when the actual character of the distributions is disclosed by the REITs, which could result
in a proportionate change in return of capital to shareholders.
Awards from class action litigation are recorded as a reduction of cost basis if the Fund still owns the applicable securities on the payment date. If the Fund no longer owns the applicable securities, the proceeds are recorded as realized gains.
The value of additional securities received as an income payment is recorded as income and increases the cost basis of such securities.
The Fund may receive other income from senior loans, including amendment fees, consent fees and commitment fees. These fees are recorded as income when received by the Fund. These amounts are included in Interest Income in the Statement of Operations.
Expenses
General expenses of the Trust are allocated to the Fund and other funds of the Trust based upon relative net assets or other expense allocation methodologies determined by the nature of the expense. Expenses directly attributable to the Fund are charged to the Fund. Expenses directly attributable to a specific class of shares are charged to that share class.
Determination of Class Net Asset Value
All income, expenses (other than class-specific expenses, which are charged to that share class, as shown in the Statement of Operations) and realized and unrealized gains (losses) are allocated to each class of the Fund on a daily basis, based on the relative net assets of each class, for purposes of determining the net asset value of each class.
Federal Income Tax Status
The Fund intends to qualify each year as a regulated investment company under Subchapter M of the Internal Revenue Code, as amended, and will distribute substantially all of its taxable income (including net short-term capital gains), if any, for its tax year, and as such will not be subject to federal income taxes. In addition, the Fund intends to distribute in each calendar year substantially all of its net investment income, capital gains and certain other amounts, if any, such that the Fund should not be subject to federal excise tax. Therefore, no federal income or excise tax provision is recorded.
Semiannual Report 2016
38
COLUMBIA HIGH YIELD BOND FUND
NOTES TO FINANCIAL STATEMENTS (continued)
November 30, 2016 (Unaudited)
Distributions to Shareholders
Distributions from net investment income, if any, are declared daily and paid monthly. Net realized capital gains, if any, are distributed at least annually. Income distributions and capital gain distributions are determined in accordance with federal income tax regulations, which may differ from GAAP.
Guarantees and Indemnifications
Under the Trust's organizational documents and, in some cases, by contract, its officers and trustees are indemnified against certain liabilities arising out of the performance of their duties to the Trust or its funds. In addition, certain of the Fund's contracts with its service providers contain general indemnification clauses. The Fund's maximum exposure under these arrangements is unknown since the amount of any future claims that may be made against the Fund cannot be determined, and the Fund has no historical basis for predicting the likelihood of any such claims.
Investment Company Reporting Modernization
In October 2016, the U.S. Securities and Exchange Commission adopted new rules and forms, and amendments to certain current rules and forms, to modernize reporting and disclosure of information by registered investment companies. The amendments to Regulation S-X will require standardized, enhanced disclosure about derivatives in investment company financial statements, and will also change the rules governing the form and content of such financial statements. The amendments to Regulation S-X take effect on August 1, 2017. At this time, management is assessing the anticipated impact of these regulatory developments.
Note 3. Fees and Other Transactions with Affiliates
Management Services Fees
The Fund entered into a Management Agreement with Columbia Management Investment Advisers, LLC (the Investment Manager), a wholly-owned subsidiary of Ameriprise Financial, Inc. (Ameriprise Financial). Under the Management Agreement, the Investment Manager provides the Fund with investment research and advice, as well as administrative and accounting services. The management services fee is an annual fee that is equal to a percentage of the Fund's average daily net assets that declines from 0.66% to 0.40% as the Fund's net assets increase. The annualized effective management
services fee rate for the six months ended November 30, 2016 was 0.62% of the Fund's average daily net assets.
Other Expenses
Other expenses are for, among other things, miscellaneous expenses of the Fund or the Board, including payments to Board Services Corp., a company providing limited administrative services to the Fund and the Board. That company's expenses include boardroom and office expense, employee compensation, employee health and retirement benefits, and certain other expenses.
Compensation of Board Members
Board members, who are not officers or employees of the Investment Manager or Ameriprise Financial, are compensated for their services to the Fund as disclosed in the Statement of Operations. Under a Deferred Compensation Plan (the Plan), these Board members may elect to defer payment of up to 100% of their compensation. Deferred amounts are treated as though equivalent dollar amounts had been invested in shares of certain funds managed by the Investment Manager. The Fund's liability for these amounts is adjusted for market value changes and remains in the Fund until distributed in accordance with the Plan. All amounts payable under the Plan constitute a general unsecured obligation of the Fund.
Compensation of Chief Compliance Officer
The Board has appointed a Chief Compliance Officer to the Fund in accordance with federal securities regulations. The Fund is allocated a portion of the expenses associated with the Chief Compliance Officer based on relative net assets of the Trust.
Transfer Agency Fees
Under a Transfer and Dividend Disbursing Agent Agreement, Columbia Management Investment Services Corp. (the Transfer Agent), an affiliate of the Investment Manager and a wholly-owned subsidiary of Ameriprise Financial, is responsible for providing transfer agency services to the Fund. The Transfer Agent has contracted with Boston Financial Data Services (BFDS) to serve as sub-transfer agent. The Transfer Agent pays the fees of BFDS for services as sub-transfer agent and BFDS is not entitled to reimbursement for such fees from the Fund (with the exception of out-of-pocket fees).
The Fund pays the Transfer Agent a monthly transfer agency fee based on the number or the average value of accounts, depending on the type of account. In addition,
Semiannual Report 2016
39
COLUMBIA HIGH YIELD BOND FUND
NOTES TO FINANCIAL STATEMENTS (continued)
November 30, 2016 (Unaudited)
prior to October 1, 2016, the Transfer Agent also received sub-transfer agency fees based on a percentage of the average aggregate value of the Fund's shares maintained in omnibus accounts (other than omnibus accounts for which American Enterprise Investment Services Inc. is the broker of record or accounts where the beneficial shareholder is a customer of Ameriprise Financial Services, Inc., for which the Transfer Agent receives a per account fee). Effective October 1, 2016, the Fund pays the Transfer Agent a fee for shareholder services based on the number of accounts or on a percentage of the average aggregate value of the Fund's shares maintained in omnibus accounts up to the lesser of the amount charged by the servicing agent or a cap established by the Board from time to time.
The Transfer Agent also receives compensation from the Fund for various shareholder services and reimbursements for certain out-of-pocket fees. Effective January 1, 2017, total transfer agency fees for Class K and Class R5 shares are subject to an annual limitation of not more than 0.075% of the average daily net assets attributable to each share class. Total transfer agency fees for Class I and Class Y shares are subject to an annual limitation of not more than 0.025% of the average daily net assets attributable to each share class. Prior to January 1, 2017, total transfer agency fees for Class K and Class R5 shares were subject to an annual limitation of not more than 0.05% of the average daily net assets attributable to each share class. Class I and Class Y shares did not pay transfer agency fees.
For the six months ended November 30, 2016, the Fund's annualized effective transfer agency fee rates as a percentage of average daily net assets of each class were as follows:
Class A | | | 0.14 | % | |
Class B | | | 0.14 | | |
Class C | | | 0.14 | | |
Class K | | | 0.04 | | |
Class R | | | 0.14 | | |
Class R4 | | | 0.14 | | |
Class R5 | | | 0.05 | | |
Class W | | | 0.14 | | |
Class Z | | | 0.14 | | |
The Fund and certain other associated investment companies have severally, but not jointly, guaranteed the performance and observance of all the terms and conditions of a lease entered into by Seligman Data Corp. (SDC), the former transfer agent, including the
payment of rent by SDC (the Guaranty). SDC was the legacy Seligman funds' former transfer agent.
The lease and the Guaranty expire in January 2019. At November 30, 2016, the Fund's total potential future obligation over the life of the Guaranty is $64,498. The liability remaining at November 30, 2016 for non-recurring charges associated with the lease amounted to $31,914 and is recorded as a part of the payable for other expenses in the Statement of Assets and Liabilities.
An annual minimum account balance fee of $20 may apply to certain accounts with a value below the applicable share class's initial minimum investment requirements to reduce the impact of small accounts on transfer agency fees. These minimum account balance fees are remitted to the Fund and recorded as part of expense reductions in the Statement of Operations. For the six months ended November 30, 2016, these minimum account balance fees reduced total expenses of the Fund by $2,639.
Plan Administration Fees
Under a Plan Administration Services Agreement with the Transfer Agent, the Fund pays an annual fee at a rate of 0.25% of the Fund's average daily net assets attributable to Class K shares for the provision of various administrative, recordkeeping, communication and educational services.
Distribution and Service Fees
The Fund has an agreement with Columbia Management Investment Distributors, Inc. (the Distributor), an affiliate of the Investment Manager and a wholly-owned subsidiary of Ameriprise Financial, for distribution and shareholder services. Under a Plan and Agreement of Distribution, the Fund pays a fee at an annual rate of up to 0.25% of the Fund's average daily net assets attributable to Class A and Class W shares, a fee at an annual rate of up to 0.50% of the Fund's average daily net assets attributable to Class R shares (of which up to 0.25% may be used for shareholder services) and a fee at an annual rate of up to 1.00% of the Fund's average daily net assets attributable to Class B and Class C shares. For Class B and Class C shares, of the 1.00% fee, up to 0.75% is reimbursed for distribution expenses.
The amount of distribution and shareholder services expenses incurred by the Distributor and not yet reimbursed (unreimbursed expense) was approximately $2,505,000 and $8,015,000 for Class B and Class C shares, respectively. These amounts are based on the
Semiannual Report 2016
40
COLUMBIA HIGH YIELD BOND FUND
NOTES TO FINANCIAL STATEMENTS (continued)
November 30, 2016 (Unaudited)
most recent information available as of September 30, 2016, and may be recovered from future payments under the distribution plan or CDSCs. To the extent the unreimbursed expense has been fully recovered, the distribution and/or shareholder services fee is reduced.
Sales Charges
Sales charges, including front-end charges and CDSCs, received by the Distributor for distributing Fund shares were $317,339 for Class A, $205 for Class B and $3,238 for Class C shares for the six months ended November 30, 2016.
Expenses Waived/Reimbursed by the Investment Manager and its Affiliates
The Investment Manager and certain of its affiliates have contractually agreed to waive fees and/or reimburse expenses (excluding certain fees and expenses described below) for the periods disclosed below, unless sooner terminated at the sole discretion of the Board, so that the Fund's net operating expenses, after giving effect to fees waived/expenses reimbursed and any balance credits and/or overdraft charges from the Fund's custodian, do not exceed the following annual rates as a percentage of the class' average daily net assets:
| | | October 1, 2016
Through
September 30, 2017 | | Prior to
October 1, 2016 | |
Class A | | | 1.07 | % | | | 1.07 | % | |
Class B | | | 1.82 | | | | 1.82 | | |
Class C | | | 1.82 | | | | 1.82 | | |
Class I | | | 0.72 | | | | 0.70 | | |
Class K | | | 1.02 | | | | 1.00 | | |
Class R | | | 1.32 | | | | 1.32 | | |
Class R4 | | | 0.82 | | | | 0.82 | | |
Class R5 | | | 0.77 | | | | 0.75 | | |
Class W | | | 1.07 | | | | 1.07 | | |
Class Y | | | 0.72 | | | | 0.70 | | |
Class Z | | | 0.82 | | | | 0.82 | | |
Under the agreement governing these fee waivers and/or expense reimbursement arrangements, the following fees and expenses are excluded from the waiver/reimbursement commitment, and therefore will be paid by the Fund, if applicable: taxes (including foreign transaction taxes), expenses associated with investments in affiliated and non-affiliated pooled investment vehicles (including mutual funds and exchange-traded funds), transaction costs and brokerage commissions, costs related to any securities lending
program, dividend and interest expenses associated with securities sold short, inverse floater program fees and expenses, transaction charges and interest on borrowed money, interest, infrequent and/or unusual expenses and any other expenses the exclusion of which is specifically approved by the Board. This agreement may be modified or amended only with approval from the Investment Manager, certain of its affiliates and the Fund. Any fees waived and/or expenses reimbursed under the expense reimbursement arrangements described above are not recoverable by the Investment Manager or its affiliates in future periods.
Note 4. Federal Tax Information
The timing and character of income and capital gain distributions are determined in accordance with income tax regulations, which may differ from GAAP because of temporary or permanent book to tax differences.
At November 30, 2016, the cost of investments for federal income tax purposes was approximately $1,963,411,000 and the aggregate gross approximate unrealized appreciation and depreciation based on that cost was:
Unrealized appreciation | | $ | 56,913,000 | | |
Unrealized depreciation | | | (32,035,000 | ) | |
Net unrealized appreciation | | $ | 24,878,000 | | |
The following capital loss carryforwards, determined as of May 31, 2016, may be available to reduce taxable income arising from future net realized gains on investments, if any, to the extent permitted by the Internal Revenue Code:
Year of Expiration | | Amount ($) | |
2017 | | | 99,997,350 | | |
2018 | | | 55,132,247 | | |
No expiration — short-term | | | 35,225,952 | | |
No expiration — long-term | | | 26,471,353 | | |
Total | | | 216,826,902 | | |
Capital loss carryforwards with no expiration are required to be utilized prior to any capital losses which carry an expiration date. As a result of this ordering rule, capital loss carryforwards which carry an expiration date may be more likely to expire unused.
Management of the Fund has concluded that there are no significant uncertain tax positions in the Fund that would require recognition in the financial statements. However, management's conclusion may be subject to review and adjustment at a later date based on factors
Semiannual Report 2016
41
COLUMBIA HIGH YIELD BOND FUND
NOTES TO FINANCIAL STATEMENTS (continued)
November 30, 2016 (Unaudited)
including, but not limited to, new tax laws, regulations, and administrative interpretations (including relevant court decisions). Generally, the Fund's federal tax returns for the prior three fiscal years remain subject to examination by the Internal Revenue Service.
Note 5. Portfolio Information
The cost of purchases and proceeds from sales of securities, excluding short-term investments and derivatives, if any, aggregated to $604,958,938 and $720,003,437, respectively, for the six months ended November 30, 2016. The amount of purchase and sale activity impacts the portfolio turnover rate reported in the Financial Highlights.
Note 6. Affiliated Money Market Fund
The Fund invests in Columbia Short-Term Cash Fund, an affiliated money market fund established for the exclusive use by the Fund and other affiliated funds (the Affiliated MMF). The income earned by the Fund from such investments is included as Dividends — affiliated issuers in the Statement of Operations. As an investing fund, the Fund indirectly bears its proportionate share of the expenses of the Affiliated MMF. Effective October 1, 2016, the Affiliated MMF prices its shares with a floating net asset value (NAV) and no longer seeks to maintain a stable NAV. In addition, the Board of the Affiliated MMF may impose a fee on redemptions (sometimes referred to as a liquidity fee) or temporarily suspend redemptions (sometimes referred to as imposing a redemption gate) in the event its liquidity falls below regulatory limits.
Note 7. Line of Credit
The Fund has access to a revolving credit facility with a syndicate of banks led by Citibank, N.A., HSBC Bank USA, N.A. and JPMorgan Chase Bank, N.A. whereby the Fund may borrow for the temporary funding of shareholder redemptions or for other temporary or emergency purposes. The credit facility agreement, which is a collective agreement between the Fund and certain other funds managed by the Investment Manager, severally and not jointly, that permits collective borrowings up to $1 billion. Interest is charged to each participating fund based on its borrowings at a rate equal to the higher of (i) the overnight federal funds rate plus 1.00% or (ii) the one-month LIBOR rate plus 1.00%. Each borrowing under the credit facility matures no later than 60 days after the date of borrowing. The Fund also pays a commitment fee equal to its pro rata share of the amount of the credit facility at a rate of 0.15% per annum.
The commitment fee is included in other expenses in the Statement of Operations.
The Fund had no borrowings during the six months ended November 30, 2016.
Note 8. Significant Risks
Shareholder Concentration Risk
At November 30, 2016, affiliated shareholders of record owned 59.6% of the outstanding shares of the Fund in one or more accounts. Subscription and redemption activity by concentrated accounts may have a significant effect on the operations of the Fund. In the case of a large redemption, the Fund may be forced to sell investments at inopportune times, including its liquid or more liquid positions, resulting in Fund losses and the Fund holding a higher percentage of less liquid or illiquid securities. Large redemptions could result in decreased economies of scale and increased operating expenses for non-redeeming Fund shareholders.
Credit Risk
Credit risk is the risk that the value of debt securities in the Fund's portfolio may decline because the issuer may default and fail to pay interest or repay principal when due. Rating agencies assign credit ratings to debt securities to indicate their credit risk. Lower rated or unrated debt securities held by the Fund may present increased credit risk as compared to higher-rated debt securities.
Interest Rate Risk
Interest rate risk is the risk of losses attributable to changes in interest rates. In general, if prevailing interest rates rise, the values of debt securities tend to fall, and if interest rates fall, the values of debt securities tend to rise. Actions by governments and central banking authorities can result in increases in interest rates. Increasing interest rates may negatively affect the value of debt securities held by the Fund, resulting in a negative impact on the Fund's performance and net asset value per share. In general, the longer the maturity or duration of a debt security, the greater its sensitivity to changes in interest rates.
Liquidity Risk
Liquidity risk is the risk associated with a lack of marketability of investments which may make it difficult to sell the investment at a desirable time or price. Changing regulatory, market or other conditions or environments (for example, the interest rate or credit
Semiannual Report 2016
42
COLUMBIA HIGH YIELD BOND FUND
NOTES TO FINANCIAL STATEMENTS (continued)
November 30, 2016 (Unaudited)
environments) may adversely affect the liquidity of the Fund's investments. The Fund may have to accept a lower selling price for the holding, sell other investments, or forego another, more appealing investment opportunity. Generally, the less liquid the market at the time the Fund sells a portfolio investment, the greater the risk of loss or decline of value to the Fund. A less liquid market can lead to an increase in Fund redemptions, which may negatively impact Fund performance and net asset value per share, including, for example, if the Fund is forced to sell securities in a down market.
High-Yield Investments Risk
Securities and other debt instruments held by the Fund that are rated below investment grade (commonly called "high-yield" or "junk" bonds) and unrated debt instruments of comparable quality expose the Fund to a greater risk of loss of principal and income than a fund that invests solely or primarily in investment grade securities. In addition, these investments have greater price fluctuations, are less liquid and are more likely to experience a default than higher-rated debt instruments. High-yield debt instruments are considered to be predominantly speculative with respect to the issuer's capacity to pay interest and repay principal.
Note 9. Subsequent Events
Management has evaluated the events and transactions that have occurred through the date the financial statements were issued and noted no items requiring adjustment of the financial statements or additional disclosure.
Note 10. Information Regarding Pending and Settled Legal Proceedings
Ameriprise Financial and certain of its affiliates have historically been involved in a number of legal, arbitration and regulatory proceedings, including routine litigation, class actions, and governmental actions, concerning matters arising in connection with the conduct of their business activities. Ameriprise Financial believes that the Funds are not currently the subject of, and that neither Ameriprise Financial nor any of its affiliates are the subject of, any pending legal, arbitration or regulatory proceedings that are likely to have a material adverse effect on the Funds or the ability of Ameriprise Financial or its affiliates to perform under their contracts with the Funds. Ameriprise Financial is required to make quarterly (10-Q), annual (10-K) and, as necessary, 8-K filings with the Securities and Exchange Commission
(SEC) on legal and regulatory matters that relate to Ameriprise Financial and its affiliates. Copies of these filings may be obtained by accessing the SEC website at www.sec.gov.
There can be no assurance that these matters, or the adverse publicity associated with them, will not result in increased fund redemptions, reduced sale of fund shares or other adverse consequences to the Funds. Further, although we believe proceedings are not likely to have a material adverse effect on the Funds or the ability of Ameriprise Financial or its affiliates to perform under their contracts with the Funds, these proceedings are subject to uncertainties and, as such, we are unable to estimate the possible loss or range of loss that may result. An adverse outcome in one or more of these proceedings could result in adverse judgments, settlements, fines, penalties or other relief that could have a material adverse effect on the consolidated financial condition or results of operations of Ameriprise Financial.
Semiannual Report 2016
43
COLUMBIA HIGH YIELD BOND FUND
APPROVAL OF MANAGEMENT AGREEMENT
Columbia Management Investment Advisers, LLC (Columbia Threadneedle or the Investment Manager, and together with its domestic and global affiliates, Columbia Threadneedle Investments), a wholly-owned subsidiary of Ameriprise Financial, Inc. (Ameriprise Financial), serves as the investment manager to Columbia High Yield Bond Fund (the Fund). Under a management agreement (the Management Agreement), Columbia Threadneedle provides investment advice and other services to the Fund and other funds distributed by Columbia Management Investment Distributors, Inc. (collectively, the Funds).
On an annual basis, the Fund's Board of Trustees (the Board), including the independent Board members (the Independent Trustees), considers renewal of the Management Agreement. Columbia Threadneedle prepared detailed reports for the Board and its Contracts Committee in February, March and April 2016, including reports providing the results of analyses performed by an independent organization, Broadridge Financial Solutions, Inc. (Broadridge), and a comprehensive response to items of information requested by independent legal counsel to the Independent Trustees (Independent Legal Counsel) in a letter to the Investment Manager, to assist the Board in making this determination. Many of the materials presented in February, March and April were first supplied in draft form to designated independent Board representatives, i.e., Independent Legal Counsel, the Chair of the Board and/or the Chair of the Contracts Committee, and the final materials were revised to contain information reflective of discussion and subsequent requests made by the Contracts Committee. In addition, throughout the year, the Board (or its committees) regularly meets with portfolio management teams and senior management personnel and reviews information prepared by Columbia Threadneedle addressing the services Columbia Threadneedle provides and Fund performance. The Board also accords appropriate weight to the work, deliberations and conclusions of the various committees, such as the Contracts Committee, the Investment Review Committee and the Compliance Committee in determining whether to continue the Management Agreement.
The Board, at its June 13-15, 2016 in-person Board meeting (the June Meeting), considered the renewal of the Management Agreement for an additional one-year term. At the June Meeting, Independent Legal Counsel reviewed with the Independent Trustees various factors relevant to the Board's consideration of management agreements and the Board's legal responsibilities related to such consideration. Following an analysis and discussion of the factors identified below, the Board, including all of the Independent Trustees, approved the renewal of the Management Agreement.
Nature, Extent and Quality of Services Provided by Columbia Threadneedle
The Independent Trustees analyzed various reports and presentations they had received detailing the services performed by Columbia Threadneedle, as well as its organization, expertise, resources and capabilities.
The Independent Trustees specifically considered many developments during the past year concerning the services provided by Columbia Threadneedle, including, in particular, the relatively recent change in the leadership of equity department oversight, improvements in technology research and the use of research analysts' model portfolios to highlight best ideas and improve implementation. The Independent Trustees further noted the restructured investment risk management department and its additional resources, including the new head of multi-asset investment risk. They also observed the relatively recent 5P leadership transition, and the additional staff and resources dedicated to the 5P team. The Board also noted the broad scope of services provided by Columbia Threadneedle to each Fund, including, among other services, investment, risk and compliance oversight. The Board also took into account the information it received concerning Columbia Threadneedle's ability to attract and retain key portfolio management personnel.
In connection with the Board's evaluation of the overall package of services provided by Columbia Threadneedle, the Board also considered the nature, quality and range of administrative services provided to the Fund by Columbia Threadneedle, as well as the achievements in 2015 in the performance of administrative services, and noted the various enhancements anticipated for 2016. In evaluating the quality of services provided under the Management Agreement, the Independent Trustees also took into account the organization and strength of the Fund's and its service providers' compliance programs. In addition, the Board reviewed the financial condition of Columbia Threadneedle and its affiliates and each entity's ability to carry out its responsibilities under the
Semiannual Report 2016
44
COLUMBIA HIGH YIELD BOND FUND
APPROVAL OF MANAGEMENT AGREEMENT (continued)
Management Agreement and the Fund's other service agreements with affiliates of Ameriprise Financial, observing the financial strength of Ameriprise Financial, with its solid balance sheet.
The Board also discussed the acceptability of the terms of the Management Agreement (including the relatively broad scope of services required to be performed by Columbia Threadneedle), noting that no material changes are proposed from the form of agreement previously approved. They also noted the wide array of legal and compliance services provided to the Funds. It was also observed that the services being performed under the Management Agreement were of a reasonably high quality.
Based on the foregoing, and based on other information received (both oral and written, including the information on investment performance referenced below) and other considerations, the Board concluded that Columbia Threadneedle and its affiliates are in a position to continue to provide a high quality and level of services to the Fund.
Investment Performance
For purposes of evaluating the nature, extent and quality of services provided under the Management Agreement, the Board carefully reviewed the investment performance of the Fund. In this regard, the Board considered detailed reports providing the results of analyses performed by an independent organization showing, for various periods, the performance of the Fund, the performance of a benchmark index, the percentage ranking of the Fund among its comparison group and the net assets of the Fund. The Board observed that the Fund's investment performance met expectations.
Comparative Fees, Costs of Services Provided and the Profits Realized by Columbia Threadneedle and its Affiliates from their Relationships with the Fund
The Board reviewed comparative fees and the costs of services provided under the Management Agreement. The Board members considered detailed comparative information set forth in an annual report on fees and expenses, including, among other things, data (based on analyses conducted by an independent organization) showing a comparison of the Fund's expenses with median expenses paid by funds in its comparative peer universe, as well as data showing the Fund's contribution to Columbia Threadneedle's profitability. The Board reviewed the fees charged to comparable institutional or other accounts/vehicles managed by Columbia Threadneedle and discussed differences in how the products are managed and operated, noting no unreasonable differences in the levels of contractual fees.
The Board considered the reports of its independent fee consultant, JDL Consultants, LLC (JDL), which assisted in its analysis of the Funds' performance and expenses, the reasonableness of the Funds' fee rates, the reasonableness of Columbia Threadneedle's profitability, and JDL's conclusion that the management fees being charged to the Fund are reasonable. The Board accorded particular weight to the notion that the level of fees should generally reflect a rational pricing model applied consistently across the various product lines in the Fund family, while assuring that the overall fees for each Fund (with certain defined exceptions) are generally in line with the "pricing philosophy" currently in effect (i.e., that the total expense ratio of the Fund is generally no higher than the median expense ratio of funds in the comparison universe of the Fund). The Board took into account that the Fund's total expense ratio (after considering proposed expense caps/waivers) approximated the peer universe's median expense ratio. Based on its review, the Board concluded that the Fund's management fee was fair and reasonable in light of the extent and quality of services that the Fund receives.
The Board also considered the expected profitability of Columbia Threadneedle and its affiliates in connection with Columbia Threadneedle providing management services to the Fund. In this regard, the Independent Trustees referred to their detailed analysis of the Profitability Report, discussing the profitability to Columbia Threadneedle and Ameriprise Financial from managing, operating and distributing the Funds. The Board took into account JDL's conclusion that 2015 Columbia Threadneedle profitability, relative to industry competitors, was reasonable. It also considered that in 2015 the Board had concluded that 2014 profitability was reasonable and that Columbia Threadneedle generated 2015 profitability that only slightly exceeded 2014 levels. It also took into
Semiannual Report 2016
45
COLUMBIA HIGH YIELD BOND FUND
APPROVAL OF MANAGEMENT AGREEMENT (continued)
account the indirect economic benefits flowing to Columbia Threadneedle or its affiliates in connection with managing or distributing the Funds, such as the enhanced ability to offer various other financial products to Ameriprise Financial customers, soft dollar benefits and overall reputational advantages. The Board noted that the fees paid by the Fund should permit the Investment Manager to offer competitive compensation to its personnel, make necessary investments in its business and earn an appropriate profit. The Board concluded that profitability levels were reasonable.
Economies of Scale to be Realized
The Board also considered the economies of scale that might be realized by Columbia Threadneedle as the Fund grows and took note of the extent to which Fund shareholders might also benefit from such growth. In this regard, the Board took into account that management fees decline as Fund assets exceed various breakpoints, all of which have not been surpassed. The Board concluded that the breakpoints in the management fee rate schedule satisfactorily provides for the sharing of economies of scale, as they allow for adequate opportunity for shareholders to realize benefits (fee breaks) as Fund assets grow.
Based on the foregoing, the Board, including all of the Independent Trustees, concluded that the management fees were fair and reasonable in light of the extent and quality of services provided. In reaching this conclusion, no single factor was determinative. On June 15, 2016, the Board, including all of the Independent Trustees, approved the renewal of the Management Agreement.
Semiannual Report 2016
46
COLUMBIA HIGH YIELD BOND FUND
IMPORTANT INFORMATION ABOUT THIS REPORT
Each fund mails one shareholder report to each shareholder address. If you would like more than one report, please call shareholder services at 800.345.6611 and additional reports will be sent to you.
The policy of the Board is to vote the proxies of the companies in which each fund holds investments consistent with the procedures as stated in the Statement of Additional Information (SAI). You may obtain a copy of the SAI without charge by calling 800.345.6611; contacting your financial intermediary; visiting investor.columbiathreadneedleus.com; or searching the website of the Securities and Exchange Commission (SEC) at sec.gov. Information regarding how each fund voted proxies relating to portfolio securities is filed with the SEC by August 31st for the most recent 12-month period ending June 30th of that year, and is available without charge by visiting investor.columbiathreadneedleus.com, or searching the website of the SEC at sec.gov.
Each fund files a complete schedule of portfolio holdings with the SEC for the first and third quarters of each fiscal year on Form N-Q. Each fund's Form N-Q is available on the SEC's website at sec.gov and may be reviewed and copied at the SEC's Public Reference Room in Washington, D.C. Information on the operation of the Public Reference Room may be obtained by calling 800.SEC.0330. Each fund's complete schedule of portfolio holdings, as filed on Form N-Q, can also be obtained without charge, upon request, by calling 800.345.6611.
Semiannual Report 2016
47
Columbia High Yield Bond Fund
P.O. Box 8081
Boston, MA 02266-8081

Please read and consider the investment objectives, risks, charges and expenses for any fund carefully before investing. For a prospectus and summary prospectus, which contains this and other important information about the Fund, go to investor.columbiathreadneedleus.com. The Fund is distributed by Columbia Management Investment Distributors, Inc., member FINRA, and managed by Columbia Management Investment Advisers, LLC.
Columbia Threadneedle Investments (Columbia Threadneedle) is the global brand name of the Columbia and Threadneedle group of companies.
All rights reserved. Columbia Management Investment Distributors, Inc., 225 Franklin Street, Boston, MA 02110-2804
© 2017 Columbia Management Investment Advisers, LLC.
investor.columbiathreadneedleus.com
SAR160_05_G01_(01/17)

SEMIANNUAL REPORT
November 30, 2016

COLUMBIA SMALL/MID CAP VALUE FUND

ABOUT COLUMBIA THREADNEEDLE INVESTMENTS
Columbia Threadneedle Investments is a leading global asset management group that provides a broad range of investment strategies and solutions for individual, institutional and corporate clients around the world.
With more than 2,000 people, including over 450 investment professionals based in North America, Europe and Asia, we manage $460 billion* of assets across developed and emerging market equities, fixed income, asset allocation solutions and alternatives. We are the 13th largest manager of long-term mutual fund assets in the U.S.** and the 4th largest manager of retail funds in the U.K.***
Our priority is the investment success of our clients. We aim to deliver the investment outcomes they expect through an investment approach that is team-based, performance-driven and risk-aware. Our culture is dynamic and interactive. By sharing our insights across asset classes and geographies, we generate richer perspectives on global, regional and local investment landscapes. The ability to exchange and debate investment ideas in a collaborative environment enriches our teams' investment processes. More importantly, it results in better informed investment decisions for our clients.
Columbia funds are distributed by Columbia Management Investment Distributors, Inc., member FINRA, and managed by Columbia Management Investment Advisers, LLC.
Columbia Threadneedle Investments (Columbia Threadneedle) is the global brand name of the Columbia and Threadneedle group of companies.
* In U.S. dollars as of June 30, 2016. Source: Ameriprise Q2 Earnings Release. Includes all assets managed by entities in the Columbia and Threadneedle group of companies. Contact us for more current data.
** Source: ICI as of June 30, 2016 for Columbia Management Investment Advisers, LLC.
*** Source: Investment Association as of March 2016 for Threadneedle Asset Management Limited.
© 2016 Columbia Management Investment Advisers, LLC. All rights reserved.
Not part of the shareholder report
Investment strategies to help meet investor needs
We are committed to helping investors navigate financial challenges to reach their desired outcomes. The possibilities are endless.
Your success is our priority.
Retire comfortably
Fund college or higher education
Leave a legacy
Generate an appropriate stream of income in retirement
Traditional approaches to income may no longer be adequate — and they may no longer provide the diversification benefits they once did. Investors need to rethink how they generate retirement income.
Worried about running out of income? You are not alone.
Navigate a changing interest rate environment
Even in today's challenging interest rate environment, it's still possible to navigate markets and achieve your goals.
Make investment choices designed specifically for this market environment.
Maximize after-tax returns
In an environment where what you keep is more important than what you earn, municipal bonds can help mitigate higher taxes while providing attractive yields compared to other investment options.
You've worked too hard building your wealth to lose it to taxes.
Grow assets to achieve financial goals
Finding growth opportunities in today's complex market environment requires strong research capabilities, creative thinking and a disciplined approach.
Do your investments deliver the portfolio growth you need?
Ease the impact of volatile markets
With increasing concerns about market volatility, investors should consider diversifying their portfolios with non-traditional holdings.
Interested in turning volatility into opportunity?
To find out more, contact your financial professional, call 800.426.3750 or visit investor.columbiathreadneedleus.com
Not part of the shareholder report
Get the market insight you need from our investment experts and subscribe to our latest publications
Stay informed with Columbia Threadneedle Investments
Investor insight
Find economic and market commentary, investment videos, white papers, mutual fund commentary and more at investor.columbiathreadneedleus.com.
Subscribe to the latest information from Columbia Threadneedle. Register your information online at investor.columbiathreadneedleus.com/subscribe and select the publications you would like to receive, including:
n Columbia Threadneedle Investor Newsletter, highlighting the latest macro- and micro-economic trends, investment themes, products, service changes and other items of interest to our investors
n Investment Strategy Outlook, showcasing the Columbia Threadneedle Asset Allocation Team's perspective on global economic investment conditions and markets
n MarketTrack, featuring straightforward insight on current investment opportunities
n White papers that delve deep into a variety of investment topics
n Quarterly portfolio manager commentary and fund fact sheets
Update your subscriptions at any time by accessing the email subscription center.
Social media
We offer you multiple ways to access our market commentary and investment insights.
n Perspectives blog at investor.columbiathreadneedleus.com
Read timely posts by our investment team, including our chief investment officer, chief economist and portfolio managers.
n Twitter.com/CTinvest_US
Follow us on Twitter for quick, up-to-the-minute comments on market news and more.
n Youtube.com/CTInvestUS
View our commentaries on the economy, markets and current investment opportunities.
n Linkedin.com/company/Columbia-Threadneedle-Investments-US
Connect with us on LinkedIn for updates from our thought leaders.
Not part of the shareholder report
 Dear Shareholders,
While emotions have run high following the outcome of the U.S. Presidential election, it remains unclear how the Trump presidency will unfold in terms of policy. We have a sense of the priorities espoused by the president-elect over the past eighteen months, but campaign priorities are not always realized and are often never pursued. What seems certain is that, while some investors have already priced expectations into the market, others have retreated, preferring instead a wait and see approach. The outcome of such behaviors appears to have created conditions ripe for ongoing market volatility.
While volatility in the financial markets can be stressful, volatility itself is not a new phenomenon. Other factors that have been at the root cause of recent volatility include uncertainty following the United Kingdom's vote to exit the European Union (Brexit), speculation around the Federal Reserve's decision to increase interest rates, divergent central bank policy and geopolitical unrest. The point is, financial markets have fluctuated for years and may be expected to continue to fluctuate — sometimes wildly. If anything, such volatility seems to be the new normal, perhaps exacerbated by access to information and development of technological tools which have enabled investors to react rapidly to real and perceived change. So what can you do?
Position your portfolio for the reality of market volatility
That there is a historical precedent for market volatility, or even an acceptance that it may persist, offers little comfort. A measured and strategic approach remains the best strategy for investors to stay on track in achieving their investment goals.
Step 1: Review your investment goals
Take this opportunity to review your investment goals and the strategies you are pursuing to achieve those goals in order to remain focused on what's important to you. It is entirely possible that your goals have changed in response either to your life situation or to changes in the market. Accept what you can't control — volatility, and focus on what you can — your investment goals and strategies.
Step 2: Reassess your risk tolerance
Sit down with your financial advisor to discuss your investment goals and strategies, as well as any changes to your tolerance for risk. Consider your investment horizon. Increased market volatility and a new investment horizon may impact the strategies that can best help you achieve your investment goals. Remember, achieving your investment goals may require a certain amount of risk. Ultimately, you must maintain vigilance in reassessing your risk tolerance and the strategies you have selected in pursuit of your investment goals, and awareness of how those strategies may react to market volatility.
Step 3: Remain calm and focus on your long-term plan
Remember, investing is about the long game. Short term events are not necessarily evidence of a longer term reality. Investors who attempt to time the market too often end up reacting to a down turn by selling low and then compounding the problem by waiting on the sidelines, ultimately missing the right opportunity to reinvest.
As long as there is a market, there will be volatility. How you respond to that volatility can make a big difference in the measure of your success as an investor. Talk to your financial advisor about how working with Columbia Threadneedle Investments may help you position your portfolio for the reality of ongoing volatility and, perhaps, even turn such volatility into investment opportunity.
Best regards,

Christopher O. Petersen
President, Columbia Funds
Investors should consider the investment objectives, risks, charges and expenses of a mutual fund carefully before investing. For a free prospectus and summary prospectus, which contains this and other important information about a fund, visit investor.columbiathreadneedleus.com. The prospectus should be read carefully before investing.
Columbia Funds are distributed by Columbia Management Investment Distributors, Inc., member FINRA, and managed by Columbia Management Investment Advisers, LLC.
© 2017 Columbia Management Investment Advisers, LLC. All rights reserved.
COLUMBIA SMALL/MID CAP VALUE FUND
Fund Investment Manager
Columbia Management Investment
Advisers, LLC
225 Franklin Street
Boston, MA 02110
Fund Distributor
Columbia Management Investment
Distributors, Inc.
225 Franklin Street
Boston, MA 02110
Fund Transfer Agent
Columbia Management Investment
Services Corp.
P.O. Box 8081
Boston, MA 02266-8081
For more information about any of the funds, please visit investor.columbiathreadneedleus.com or call 800.345.6611. Customer Service Representatives are available to answer your questions Monday through Friday from 8 a.m. to 7 p.m. Eastern time.
The views expressed in this report reflect the current views of the respective parties. These views are not guarantees of future performance and involve certain risks, uncertainties and assumptions that are difficult to predict, so actual outcomes and results may differ significantly from the views expressed. These views are subject to change at any time based upon economic, market or other conditions and the respective parties disclaim any responsibility to update such views. These views may not be relied on as investment advice and, because investment decisions for a Columbia fund are based on numerous factors, may not be relied on as an indication of trading intent on behalf of any particular Columbia fund. References to specific securities should not be construed as a recommendation or investment advice.
Performance Overview | | | 3 | | |
Portfolio Overview | | | 4 | | |
Understanding Your Fund's Expenses | | | 5 | | |
Portfolio of Investments | | | 6 | | |
Statement of Assets and Liabilities | | | 11 | | |
Statement of Operations | | | 14 | | |
Statement of Changes in Net Assets | | | 15 | | |
Financial Highlights | | | 18 | | |
Notes to Financial Statements | | | 29 | | |
Approval of Management Agreement | | | 36 | | |
Important Information About This Report | | | 39 | | |
COLUMBIA SMALL/MID CAP VALUE FUND
PERFORMANCE OVERVIEW
(Unaudited)
Performance Summary
n Columbia Small/Mid Cap Value Fund (the Fund) Class A shares returned 12.37% excluding sales charges for the six-month period that ended November 30, 2016.
n The Fund underperformed its benchmark, the Russell 2500 Value Index, which returned 13.55% for the same period.
Average Annual Total Returns (%) (for period ended November 30, 2016)
| | | Inception | | 6 Months
Cumulative | | 1 Year | | 5 Years | | 10 Years | |
Class A | | 02/14/02 | | | | | | | | | | | | | | | | | |
Excluding sales charges | | | | | | | 12.37 | | | | 8.54 | | | | 12.57 | | | | 5.76 | | |
Including sales charges | | | | | | | 5.94 | | | | 2.26 | | | | 11.26 | | | | 5.14 | | |
Class B | | 02/14/02 | | | | | | | | | | | | | | | | | |
Excluding sales charges | | | | | | | 11.99 | | | | 7.71 | | | | 11.75 | | | | 4.96 | | |
Including sales charges | | | | | | | 6.99 | | | | 2.71 | | | | 11.50 | | | | 4.96 | | |
Class C | | 02/14/02 | | | | | | | | | | | | | | | | | |
Excluding sales charges | | | | | | | 12.01 | | | | 7.72 | | | | 11.73 | | | | 4.97 | | |
Including sales charges | | | | | | | 11.01 | | | | 6.72 | | | | 11.73 | | | | 4.97 | | |
Class I | | 03/04/04 | | | 12.68 | | | | 9.08 | | | | 13.10 | | | | 6.24 | | |
Class K | | 02/14/02 | | | 12.36 | | | | 8.57 | | | | 12.73 | | | | 5.91 | | |
Class R* | | 12/11/06 | | | 12.25 | | | | 8.23 | | | | 12.29 | | | | 5.46 | | |
Class R4* | | 12/11/06 | | | 12.59 | | | | 8.77 | | | | 12.79 | | | | 5.81 | | |
Class R5* | | 12/11/06 | | | 12.51 | | | | 8.87 | | | | 12.98 | | | | 6.17 | | |
Class W | | 12/01/06 | | | 12.37 | | | | 8.58 | | | | 12.60 | | | | 5.79 | | |
Class Y* | | 06/13/13 | | | 12.59 | | | | 8.88 | | | | 12.87 | | | | 5.90 | | |
Class Z* | | 09/27/10 | | | 12.53 | | | | 8.79 | | | | 12.86 | | | | 5.94 | | |
Russell 2500 Value Index | | | | | | | 13.55 | | | | 16.15 | | | | 14.75 | | | | 6.76 | | |
Returns for Class A are shown with and without the maximum initial sales charge of 5.75%. Returns for Class B are shown with and without the applicable contingent deferred sales charge (CDSC) of 5.00% in the first year, declining to 1.00% in the sixth year and eliminated thereafter. Returns for Class C are shown with and without the 1.00% CDSC for the first year only. The Fund's other classes are not subject to sales charges and have limited eligibility. Please see the Fund's prospectus for details. Performance for different share classes will vary based on differences in sales charges and fees associated with each class. All results shown assume reinvestment of distributions during the period. Returns do not reflect the deduction of taxes that a shareholder may pay on Fund distributions or on the redemption of Fund shares. Performance results reflect the effect of any fee waivers or reimbursements of Fund expenses by Columbia Management Investment Advisers, LLC and/or any of its affiliates. Absent these fee waivers or expense reimbursement arrangements, performance results would have been lower.
The performance information shown represents past performance and is not a guarantee of future results. The investment return and principal value of your investment will fluctuate so that your shares, when redeemed, may be worth more or less than their original cost. Current performance may be lower or higher than the performance information shown. You may obtain performance information current to the most recent month-end by contacting your financial intermediary, visiting investor.columbiathreadneedleus.com or calling 800.345.6611.
*The returns shown for periods prior to the share class inception date (including returns for the Life of the Fund, if shown, which are since Fund inception) include the returns of the Fund's oldest share class. Since the Fund launched more than one share class at its inception, Class A shares were used. These returns are adjusted to reflect any higher class-related operating expenses of the newer share classes, as applicable. Please visit investor.columbiathreadneedleus.com/investment-products/mutual-funds/appended-performance for more information.
The Russell 2500 Value Index measures the performance of the small to mid-cap value segment of the U.S. equity universe. It includes those Russell 2500 companies that are considered more value oriented relative to the overall market as defined by Russell's leading style methodology.
Indices are not available for investment, are not professionally managed and do not reflect sales charges, fees, brokerage commissions, taxes or other expenses of investing. Securities in the Fund may not match those in an index.
Semiannual Report 2016
3
COLUMBIA SMALL/MID CAP VALUE FUND
PORTFOLIO OVERVIEW
(Unaudited)
Portfolio Management
Jarl Ginsberg, CFA, CAIA
Christian Stadlinger, Ph.D., CFA
David Hoffman
Morningstar Style BoxTM

The Morningstar Style BoxTM is based on a fund's portfolio holdings. For equity funds, the vertical axis shows the market capitalization of the stocks owned, and the horizontal axis shows investment style (value, blend, or growth). Information shown is based on the most recent data provided by Morningstar.
© 2017 Morningstar, Inc. All rights reserved. The Morningstar information contained herein: (1) is proprietary to Morningstar and/or its content providers; (2) may not be copied or distributed; and (3) is not warranted to be accurate, complete or timely. Neither Morningstar nor its content providers are responsible for any damages or losses arising from any use of this information.
Top Ten Holdings (%)
(at November 30, 2016) | |
East West Bancorp, Inc. | | | 1.5 | | |
Steel Dynamics, Inc. | | | 1.5 | | |
ABM Industries, Inc. | | | 1.4 | | |
Oshkosh Corp. | | | 1.3 | | |
Booz Allen Hamilton Holdings Corp. | | | 1.3 | | |
Zions Bancorporation | | | 1.3 | | |
Alexandria Real Estate Equities, Inc. | | | 1.3 | | |
Assured Guaranty Ltd. | | | 1.3 | | |
Customers Bancorp, Inc. | | | 1.3 | | |
Huntington Bancshares, Inc. | | | 1.3 | | |
Percentages indicated are based upon total investments (excluding Money Market Funds).
For further detail about these holdings, please refer to the section entitled "Portfolio of Investments."
Fund holdings are as of the date given, are subject to change at any time, and are not recommendations to buy or sell any security.
Portfolio Breakdown (%)
(at November 30, 2016) | |
Common Stocks | | | 96.5 | | |
Money Market Funds | | | 3.5 | | |
Total | | | 100.0 | | |
Percentages indicated are based upon total investments. The Fund's portfolio composition is subject to change.
Equity Sector Breakdown (%)
(at November 30, 2016) | |
Consumer Discretionary | | | 7.5 | | |
Consumer Staples | | | 3.3 | | |
Energy | | | 9.2 | | |
Financials | | | 24.4 | | |
Health Care | | | 5.9 | | |
Industrials | | | 13.8 | | |
Information Technology | | | 10.9 | | |
Materials | | | 7.5 | | |
Real Estate | | | 12.7 | | |
Utilities | | | 4.8 | | |
Total | | | 100.0 | | |
Percentages indicated are based upon total equity investments. The Fund's portfolio composition is subject to change.
Semiannual Report 2016
4
COLUMBIA SMALL/MID CAP VALUE FUND
UNDERSTANDING YOUR FUND'S EXPENSES
(Unaudited)
As an investor, you incur two types of costs. There are transaction costs, which generally include sales charges on purchases and may include redemption fees. There are also ongoing costs, which generally include management fees, distribution and/or service fees, and other fund expenses. The following information is intended to help you understand your ongoing costs (in dollars) of investing in the Fund and to help you compare these costs with the ongoing costs of investing in other mutual funds.
Analyzing Your Fund's Expenses
To illustrate these ongoing costs, we have provided examples and calculated the expenses paid by investors in each share class of the Fund during the period. The actual and hypothetical information in the table is based on an initial investment of $1,000 at the beginning of the period indicated and held for the entire period. Expense information is calculated two ways and each method provides you with different information. The amount listed in the "Actual" column is calculated using the Fund's actual operating expenses and total return for the period. You may use the Actual information, together with the amount invested, to estimate the expenses that you paid over the period. Simply divide your account value by $1,000 (for example, an $8,600 account value divided by $1,000 = 8.6), then multiply the results by the expenses paid during the period under the "Actual" column. The amount listed in the "Hypothetical" column assumes a 5% annual rate of return before expenses (which is not the Fund's actual return) and then applies the Fund's actual expense ratio for the period to the hypothetical return. You should not use the hypothetical account values and expenses to estimate either your actual account balance at the end of the period or the expenses you paid during the period. See "Compare With Other Funds" below for details on how to use the hypothetical data.
Compare With Other Funds
Since all mutual funds are required to include the same hypothetical calculations about expenses in shareholder reports, you can use this information to compare the ongoing cost of investing in the Fund with other funds. To do so, compare the hypothetical example with the 5% hypothetical examples that appear in the shareholder reports of other funds. As you compare hypothetical examples of other funds, it is important to note that hypothetical examples are meant to highlight the ongoing costs of investing in a fund only and do not reflect any transaction costs, such as sales charges, or redemption or exchange fees. Therefore, the hypothetical calculations are useful in comparing ongoing costs only, and will not help you determine the relative total costs of owning different funds. If transaction costs were included in these calculations, your costs would be higher.
June 1, 2016 – November 30, 2016
| | | Account Value at the Beginning
of the Period ($) | | Account Value at the End of the
Period ($) | | Expenses Paid During the
Period ($) | | Fund's Annualized
Expense Ratio (%) | |
| | | Actual | | Hypothetical | | Actual | | Hypothetical | | Actual | | Hypothetical | | Actual | |
Class A | | | 1,000.00 | | | | 1,000.00 | | | | 1,123.70 | | | | 1,018.80 | | | | 6.65 | | | | 6.33 | | | | 1.25 | | |
Class B | | | 1,000.00 | | | | 1,000.00 | | | | 1,119.90 | | | | 1,015.04 | | | | 10.63 | | | | 10.10 | | | | 2.00 | | |
Class C | | | 1,000.00 | | | | 1,000.00 | | | | 1,120.10 | | | | 1,015.04 | | | | 10.63 | | | | 10.10 | | | | 2.00 | | |
Class I | | | 1,000.00 | | | | 1,000.00 | | | | 1,126.80 | | | | 1,021.01 | | | | 4.32 | | | | 4.10 | | | | 0.81 | | |
Class K | | | 1,000.00 | | | | 1,000.00 | | | | 1,123.60 | | | | 1,019.35 | | | | 6.07 | | | | 5.77 | | | | 1.14 | | |
Class R | | | 1,000.00 | | | | 1,000.00 | | | | 1,122.50 | | | | 1,017.55 | | | | 7.98 | | | | 7.59 | | | | 1.50 | | |
Class R4 | | | 1,000.00 | | | | 1,000.00 | | | | 1,125.90 | | | | 1,020.00 | | | | 5.38 | | | | 5.11 | | | | 1.01 | | |
Class R5 | | | 1,000.00 | | | | 1,000.00 | | | | 1,125.10 | | | | 1,020.61 | | | | 4.74 | | | | 4.51 | | | | 0.89 | | |
Class W | | | 1,000.00 | | | | 1,000.00 | | | | 1,123.70 | | | | 1,018.75 | | | | 6.71 | | | | 6.38 | | | | 1.26 | | |
Class Y | | | 1,000.00 | | | | 1,000.00 | | | | 1,125.90 | | | | 1,020.81 | | | | 4.53 | | | | 4.31 | | | | 0.85 | | |
Class Z | | | 1,000.00 | | | | 1,000.00 | | | | 1,125.30 | | | | 1,020.00 | | | | 5.38 | | | | 5.11 | | | | 1.01 | | |
Expenses paid during the period are equal to the annualized expense ratio for each class as indicated above, multiplied by the average account value over the period and then multiplied by the number of days in the Fund's most recent fiscal half year and divided by 365.
Expenses do not include fees and expenses incurred indirectly by the Fund from its investment in underlying funds, including affiliated and non-affiliated pooled investment vehicles, such as mutual funds and exchange-traded funds.
Semiannual Report 2016
5
COLUMBIA SMALL/MID CAP VALUE FUND
PORTFOLIO OF INVESTMENTS
November 30, 2016 (Unaudited)
(Percentages represent value of investments compared to net assets)
Common Stocks 96.4%
Issuer | | Shares | | Value ($) | |
CONSUMER DISCRETIONARY 7.2% | |
Auto Components 2.2% | |
Cooper-Standard Holding, Inc.(a) | | | 56,000 | | | | 5,337,920 | | |
Motorcar Parts of America, Inc.(a) | | | 235,000 | | | | 5,748,100 | | |
Tenneco, Inc.(a) | | | 140,000 | | | | 8,253,000 | | |
Total | | | | | 19,339,020 | | |
Diversified Consumer Services 0.7% | |
Nord Anglia Education, Inc.(a) | | | 265,000 | | | | 6,360,000 | | |
Household Durables 1.0% | |
D.R. Horton, Inc. | | | 245,000 | | | | 6,791,400 | | |
William Lyon Homes, Inc., Class A(a) | | | 88,505 | | | | 1,752,399 | | |
Total | | | | | 8,543,799 | | |
Media 1.1% | |
AMC Entertainment Holdings, Inc.,
Class A | | | 270,000 | | | | 9,166,500 | | |
Specialty Retail 1.8% | |
Abercrombie & Fitch Co., Class A | | | 245,000 | | | | 3,520,650 | | |
Children's Place, Inc. (The) | | | 75,000 | | | | 7,788,750 | | |
Finish Line, Inc., Class A (The) | | | 190,000 | | | | 4,263,600 | | |
Total | | | | | 15,573,000 | | |
Textiles, Apparel & Luxury Goods 0.4% | |
Deckers Outdoor Corp.(a) | | | 54,900 | | | | 3,265,452 | | |
Total Consumer Discretionary | | | | | 62,247,771 | | |
CONSUMER STAPLES 3.2% | |
Food & Staples Retailing 0.9% | |
Performance Food Group Co.(a) | | | 160,000 | | | | 3,376,000 | | |
United Natural Foods, Inc.(a) | | | 86,000 | | | | 4,037,700 | | |
Total | | | | | 7,413,700 | | |
Food Products 1.9% | |
AdvancePierre Foods Holdings, Inc. | | | 300,000 | | | | 8,121,000 | | |
Darling Ingredients, Inc.(a) | | | 307,000 | | | | 4,147,570 | | |
Post Holdings, Inc.(a) | | | 52,000 | | | | 3,969,160 | | |
Total | | | | | 16,237,730 | | |
Personal Products 0.4% | |
Avon Products, Inc. | | | 700,000 | | | | 3,759,000 | | |
Total Consumer Staples | | | | | 27,410,430 | | |
ENERGY 8.9% | |
Energy Equipment & Services 0.9% | |
Patterson-UTI Energy, Inc. | | | 295,000 | | | | 7,867,650 | | |
Common Stocks (continued)
Issuer | | Shares | | Value ($) | |
Oil, Gas & Consumable Fuels 8.0% | |
Aegean Marine Petroleum Network, Inc. | | | 560,000 | | | | 6,300,000 | | |
Arch Coal, Inc.(a) | | | 43,000 | | | | 3,355,290 | | |
Carrizo Oil & Gas, Inc.(a) | | | 170,000 | | | | 7,197,800 | | |
Newfield Exploration Co.(a) | | | 155,000 | | | | 7,009,100 | | |
Parsley Energy, Inc., Class A(a) | | | 150,000 | | | | 5,722,500 | | |
PBF Energy, Inc., Class A | | | 125,000 | | | | 2,998,750 | | |
PDC Energy, Inc.(a) | | | 130,000 | | | | 9,678,500 | | |
SM Energy Co. | | | 215,000 | | | | 8,569,900 | | |
Whiting Petroleum Corp.(a) | | | 640,000 | | | | 7,820,800 | | |
WPX Energy, Inc.(a) | | | 620,000 | | | | 9,634,800 | | |
Total | | | | | 68,287,440 | | |
Total Energy | | | | | 76,155,090 | | |
FINANCIALS 23.5% | |
Banks 11.2% | |
Bank of the Ozarks, Inc. | | | 170,000 | | | | 8,248,400 | | |
Customers Bancorp, Inc.(a) | | | 350,000 | | | | 10,675,000 | | |
East West Bancorp, Inc. | | | 265,000 | | | | 12,688,200 | | |
First Republic Bank | | | 115,000 | | | | 9,418,500 | | |
Hancock Holding Co. | | | 170,000 | | | | 7,063,500 | | |
Hope Bancorp, Inc. | | | 475,000 | | | | 9,452,500 | | |
Huntington Bancshares, Inc. | | | 855,000 | | | | 10,653,300 | | |
Popular, Inc. | | | 165,000 | | | | 6,707,250 | | |
Prosperity Bancshares, Inc. | | | 158,000 | | | | 10,448,540 | | |
Zions Bancorporation | | | 280,000 | | | | 11,141,200 | | |
Total | | | | | 96,496,390 | | |
Capital Markets 3.8% | |
E*TRADE Financial Corp.(a) | | | 275,000 | | | | 9,490,250 | | |
Janus Capital Group, Inc. | | | 280,000 | | | | 3,780,000 | | |
Lazard Ltd., Class A | | | 218,000 | | | | 8,469,300 | | |
Stifel Financial Corp.(a) | | | 101,000 | | | | 5,034,850 | | |
Virtu Financial, Inc., Class A | | | 405,000 | | | | 5,609,250 | | |
Total | | | | | 32,383,650 | | |
Consumer Finance 0.4% | |
SLM Corp.(a) | | | 345,000 | | | | 3,474,150 | | |
Insurance 5.1% | |
American Equity Investment Life
Holding Co. | | | 455,000 | | | | 9,432,150 | | |
The accompanying Notes to Financial Statements are an integral part of this statement.
Semiannual Report 2016
6
COLUMBIA SMALL/MID CAP VALUE FUND
PORTFOLIO OF INVESTMENTS (continued)
November 30, 2016 (Unaudited)
Common Stocks (continued)
Issuer | | Shares | | Value ($) | |
AmTrust Financial Services, Inc. | | | 364,000 | | | | 9,267,440 | | |
Assured Guaranty Ltd. | | | 305,000 | | | | 10,906,800 | | |
CNO Financial Group, Inc. | | | 347,200 | | | | 6,214,880 | | |
MBIA, Inc.(a) | | | 410,000 | | | | 4,259,900 | | |
Willis Towers Watson PLC | | | 34,000 | | | | 4,228,580 | | |
Total | | | | | 44,309,750 | | |
Thrifts & Mortgage Finance 3.0% | |
BofI Holding, Inc.(a) | | | 326,500 | | | | 7,715,195 | | |
Flagstar Bancorp, Inc.(a) | | | 320,000 | | | | 9,017,600 | | |
MGIC Investment Corp.(a) | | | 1,020,000 | | | | 9,251,400 | | |
Total | | | | | 25,984,195 | | |
Total Financials | | | | | 202,648,135 | | |
HEALTH CARE 5.7% | |
Biotechnology 0.4% | |
ARIAD Pharmaceuticals, Inc.(a) | | | 245,000 | | | | 3,302,600 | | |
Health Care Equipment & Supplies 3.1% | |
Globus Medical, Inc., Class A(a) | | | 190,000 | | | | 4,111,600 | | |
Merit Medical Systems, Inc.(a) | | | 250,000 | | | | 5,887,500 | | |
Teleflex, Inc. | | | 62,000 | | | | 9,171,660 | | |
Wright Medical Group NV(a) | | | 330,000 | | | | 7,603,200 | | |
Total | | | | | 26,773,960 | | |
Health Care Providers & Services 1.3% | |
Amsurg Corp.(a) | | | 99,000 | | | | 6,743,880 | | |
VCA, Inc.(a) | | | 65,000 | | | | 4,069,000 | | |
Total | | | | | 10,812,880 | | |
Life Sciences Tools & Services 0.6% | |
Patheon NV(a) | | | 190,000 | | | | 5,198,400 | | |
Pharmaceuticals 0.3% | |
Catalent, Inc.(a) | | | 110,000 | | | | 2,632,300 | | |
Total Health Care | | | | | 48,720,140 | | |
INDUSTRIALS 13.3% | |
Air Freight & Logistics 1.0% | |
XPO Logistics, Inc.(a) | | | 200,000 | | | | 8,906,000 | | |
Airlines 0.9% | |
Alaska Air Group, Inc. | | | 97,000 | | | | 7,980,190 | | |
Building Products 0.6% | |
Apogee Enterprises, Inc. | | | 110,000 | | | | 5,247,000 | | |
Common Stocks (continued)
Issuer | | Shares | | Value ($) | |
Commercial Services & Supplies 2.5% | |
ABM Industries, Inc. | | | 257,000 | | | | 11,308,000 | | |
Deluxe Corp. | | | 147,000 | | | | 9,951,900 | | |
Total | | | | | 21,259,900 | | |
Construction & Engineering 3.3% | |
Granite Construction, Inc. | | | 146,000 | | | | 8,612,540 | | |
Jacobs Engineering Group, Inc.(a) | | | 155,000 | | | | 9,611,550 | | |
MasTec, Inc.(a) | | | 265,000 | | | | 10,056,750 | | |
Total | | | | | 28,280,840 | | |
Machinery 2.5% | |
Barnes Group, Inc. | | | 225,000 | | | | 10,395,000 | | |
Oshkosh Corp. | | | 160,000 | | | | 11,200,000 | | |
Total | | | | | 21,595,000 | | |
Road & Rail 0.9% | |
Swift Transportation Co.(a) | | | 325,000 | | | | 8,115,250 | | |
Trading Companies & Distributors 1.6% | |
Beacon Roofing Supply, Inc.(a) | | | 165,000 | | | | 7,654,350 | | |
Neff Corp. Class A(a) | | | 440,000 | | | | 5,786,000 | | |
Total | | | | | 13,440,350 | | |
Total Industrials | | | | | 114,824,530 | | |
INFORMATION TECHNOLOGY 10.5% | |
Communications Equipment 1.8% | |
Finisar Corp.(a) | | | 260,000 | | | | 8,639,800 | | |
Oclaro, Inc.(a) | | | 760,000 | | | | 6,794,400 | | |
Total | | | | | 15,434,200 | | |
Electronic Equipment, Instruments & Components 0.8% | |
Fabrinet(a) | | | 164,000 | | | | 7,019,200 | | |
IT Services 1.3% | |
Booz Allen Hamilton Holdings Corp. | | | 295,000 | | | | 11,153,950 | | |
Semiconductors & Semiconductor Equipment 5.7% | |
Cirrus Logic, Inc.(a) | | | 135,000 | | | | 7,425,000 | | |
Cypress Semiconductor Corp. | | | 630,000 | | | | 7,087,500 | | |
Integrated Device Technology, Inc.(a) | | | 106,457 | | | | 2,491,093 | | |
Kulicke & Soffa Industries, Inc.(a) | | | 585,000 | | | | 9,026,550 | | |
Marvell Technology Group Ltd. | | | 515,000 | | | | 7,385,100 | | |
ON Semiconductor Corp.(a) | | | 670,000 | | | | 7,892,600 | | |
Qorvo, Inc.(a) | | | 141,000 | | | | 7,530,810 | | |
Total | | | | | 48,838,653 | | |
The accompanying Notes to Financial Statements are an integral part of this statement.
Semiannual Report 2016
7
COLUMBIA SMALL/MID CAP VALUE FUND
PORTFOLIO OF INVESTMENTS (continued)
November 30, 2016 (Unaudited)
Common Stocks (continued)
Issuer | | Shares | | Value ($) | |
Software 0.9% | |
Ebix, Inc. | | | 50,000 | | | | 2,980,000 | | |
Take-Two Interactive Software, Inc.(a) | | | 103,000 | | | | 5,070,690 | | |
Total | | | | | 8,050,690 | | |
Total Information Technology | | | | | 90,496,693 | | |
MATERIALS 7.2% | |
Chemicals 4.2% | |
Albemarle Corp. | | | 100,000 | | | | 8,778,000 | | |
Cabot Corp. | | | 160,000 | | | | 8,148,800 | | |
Huntsman Corp. | | | 475,000 | | | | 9,253,000 | | |
Olin Corp. | | | 190,000 | | | | 4,940,000 | | |
Orion Engineered Carbons SA | | | 280,000 | | | | 5,348,000 | | |
Total | | | | | 36,467,800 | | |
Metals & Mining 2.4% | |
Steel Dynamics, Inc. | | | 355,000 | | | | 12,595,400 | | |
United States Steel Corp. | | | 250,000 | | | | 8,085,000 | | |
Total | | | | | 20,680,400 | | |
Paper & Forest Products 0.6% | |
KapStone Paper and Packaging Corp. | | | 255,000 | | | | 5,209,650 | | |
Total Materials | | | | | 62,357,850 | | |
REAL ESTATE 12.3% | |
Equity Real Estate Investment Trusts (REITs) 12.3% | |
Alexandria Real Estate Equities, Inc. | | | 101,000 | | | | 11,068,590 | | |
American Assets Trust, Inc. | | | 235,000 | | | | 9,414,100 | | |
Chesapeake Lodging Trust | | | 292,000 | | | | 6,923,320 | | |
First Industrial Realty Trust, Inc. | | | 320,000 | | | | 8,464,000 | | |
Highwoods Properties, Inc. | | | 200,000 | | | | 9,612,000 | | |
Hospitality Properties Trust | | | 225,000 | | | | 6,523,875 | | |
Hudson Pacific Properties, Inc. | | | 210,000 | | | | 7,322,700 | | |
Mack-Cali Realty Corp. | | | 340,000 | | | | 9,197,000 | | |
Mid-America Apartment Communities, Inc. | | | 71,000 | | | | 6,505,730 | | |
Common Stocks (continued)
Issuer | | Shares | | Value ($) | |
PS Business Parks, Inc. | | | 79,000 | | | | 8,826,670 | | |
QTS Realty Trust Inc., Class A | | | 172,000 | | | | 8,049,600 | | |
Sun Communities, Inc. | | | 86,000 | | | | 6,206,620 | | |
Tanger Factory Outlet Centers, Inc. | | | 220,000 | | | | 7,583,400 | | |
Total | | | | | 105,697,605 | | |
Total Real Estate | | | | | 105,697,605 | | |
UTILITIES 4.6% | |
Electric Utilities 1.2% | |
Pinnacle West Capital Corp. | | | 136,000 | | | | 10,054,480 | | |
Gas Utilities 2.7% | |
New Jersey Resources Corp. | | | 190,000 | | | | 6,545,500 | | |
South Jersey Industries, Inc. | | | 270,000 | | | | 8,910,000 | | |
Southwest Gas Corp. | | | 100,000 | | | | 7,413,000 | | |
Total | | | | | 22,868,500 | | |
Multi-Utilities 0.7% | |
CMS Energy Corp. | | | 160,000 | | | | 6,435,200 | | |
Total Utilities | | | | | 39,358,180 | | |
Total Common Stocks
(Cost: $652,577,617) | | | | | 829,916,424 | | |
Money Market Funds 3.5%
| | | Shares | | Value ($) | |
Columbia Short-Term Cash Fund,
0.480%(b)(c) | | | 30,156,173 | | | | 30,159,189 | | |
Total Money Market Funds
(Cost: $30,156,173) | | | | | 30,159,189 | | |
Total Investments
(Cost: $682,733,790) | | | | | 860,075,613 | | |
Other Assets & Liabilities, Net | | | | | 1,072,458 | | |
Net Assets | | | | | 861,148,071 | | |
The accompanying Notes to Financial Statements are an integral part of this statement.
Semiannual Report 2016
8
COLUMBIA SMALL/MID CAP VALUE FUND
PORTFOLIO OF INVESTMENTS (continued)
November 30, 2016 (Unaudited)
Notes to Portfolio of Investments
(a) Non-income producing investment.
(b) As defined in the Investment Company Act of 1940, an affiliated company is one in which the Fund owns 5% or more of the company's outstanding voting securities, or a company which is under common ownership or control with the Fund. Holdings and transactions in these affiliated companies during the period ended November 30, 2016 are as follows:
Issuer | | Beginning
Cost ($) | | Purchase
Cost ($) | | Proceeds
From Sales ($) | | Realized
Gain (Loss) ($) | | Ending
Cost ($) | | Dividends —
Affiliated
Issuers ($) | | Value ($) | |
Columbia Short-Term
Cash Fund | | | 11,157,656 | | | | 137,552,620 | | | | (118,554,022 | ) | | | (81 | ) | | | 30,156,173 | | | | 44,139 | | | | 30,159,189 | | |
Neff Corp. Class A* | | | 8,108,235 | | | | — | | | | (1,309,182 | ) | | | (199,053 | ) | | | 6,600,000 | | | | — | | | | 5,786,000 | | |
Total | | | 19,265,891 | | | | 137,552,620 | | | | (119,863,204 | ) | | | (199,134 | ) | | | 36,756,173 | | | | 44,139 | | | | 35,945,189 | | |
*Issuer was not an affiliate for the entire period ended November 30, 2016.
(c) The rate shown is the seven-day current annualized yield at November 30, 2016.
Fair Value Measurements
The Fund categorizes its fair value measurements according to a three-level hierarchy that maximizes the use of observable inputs and minimizes the use of unobservable inputs by prioritizing that the most observable input be used when available. Observable inputs are those that market participants would use in pricing an investment based on market data obtained from sources independent of the reporting entity. Unobservable inputs are those that reflect the Fund's assumptions about the information market participants would use in pricing an investment. An investment's level within the fair value hierarchy is based on the lowest level of any input that is deemed significant to the asset's or liability's fair value measurement. The input levels are not necessarily an indication of the risk or liquidity associated with investments at that level. For example, certain U.S. government securities are generally high quality and liquid, however, they are reflected as Level 2 because the inputs used to determine fair value may not always be quoted prices in an active market.
Fair value inputs are summarized in the three broad levels listed below:
> Level 1 — Valuations based on quoted prices for investments in active markets that the Fund has the ability to access at the measurement date (including NAV for open-end mutual funds). Valuation adjustments are not applied to Level 1 investments.
> Level 2 — Valuations based on other significant observable inputs (including quoted prices for similar securities, interest rates, prepayment speeds, credit risks, etc.).
> Level 3 — Valuations based on significant unobservable inputs (including the Fund's own assumptions and judgment in determining the fair value of investments).
Inputs that are used in determining fair value of an investment may include price information, credit data, volatility statistics, and other factors. These inputs can be either observable or unobservable. The availability of observable inputs can vary between investments, and is affected by various factors such as the type of investment, and the volume and level of activity for that investment or similar investments in the marketplace. The inputs will be considered by the Investment Manager, along with any other relevant factors in the calculation of an investment's fair value. The Fund uses prices and inputs that are current as of the measurement date, which may include periods of market dislocations. During these periods, the availability of prices and inputs may be reduced for many investments. This condition could cause an investment to be reclassified between the various levels within the hierarchy.
Certain investments that have been measured at fair value using the net asset value (NAV) per share (or its equivalent) are not categorized in the fair value hierarchy. The fair value amounts presented in the table are intended to reconcile the fair value hierarchy to the amounts presented in the Portfolio of Investments. The Columbia Short-Term Cash Fund seeks to provide shareholders with maximum current income consistent with liquidity and stability of principal. Columbia Short-Term Cash Fund prices its shares with a floating NAV and no longer seeks to maintain a stable NAV.
Investments falling into the Level 3 category are primarily supported by quoted prices from brokers and dealers participating in the market for those investments. However, these may be classified as Level 3 investments due to lack of market transparency and corroboration to support these quoted prices. Additionally, valuation models may be used as the pricing source for any remaining investments classified as Level 3. These models may rely on one or more significant unobservable inputs and/or significant assumptions by the Investment Manager. Inputs used in valuations may include, but are not limited to, financial statement analysis, capital account balances, discount rates and estimated cash flows, and comparable company data.
Under the direction of the Fund's Board of Trustees (the Board), the Investment Manager's Valuation Committee (the Committee) is responsible for overseeing the valuation procedures approved by the Board. The Committee consists of voting and non-voting members from various groups within the Investment Manager's organization, including operations and accounting, trading and investments, compliance, risk management and legal.
The accompanying Notes to Financial Statements are an integral part of this statement.
Semiannual Report 2016
9
COLUMBIA SMALL/MID CAP VALUE FUND
PORTFOLIO OF INVESTMENTS (continued)
November 30, 2016 (Unaudited)
Fair Value Measurements (continued)
The Committee meets at least monthly to review and approve valuation matters, which may include a description of specific valuation determinations, data regarding pricing information received from approved pricing vendors and brokers and the results of Board-approved valuation control policies and procedures (the Policies). The Policies address, among other things, instances when market quotations are or are not readily available, including recommendations of third party pricing vendors and a determination of appropriate pricing methodologies; events that require specific valuation determinations and assessment of fair value techniques; securities with a potential for stale pricing, including those that are illiquid, restricted, or in default; and the effectiveness of third party pricing vendors, including periodic reviews of vendors. The Committee meets more frequently, as needed, to discuss additional valuation matters, which may include the need to review back-testing results, review time-sensitive information or approve related valuation actions. The Committee reports to the Board, with members of the Committee meeting with the Board at each of its regularly scheduled meetings to discuss valuation matters and actions during the period, similar to those described earlier.
For investments categorized as Level 3, the Committee monitors information similar to that described above, which may include: (i) data specific to the issuer or comparable issuers, (ii) general market or specific sector news and (iii) quoted prices and specific or similar security transactions. The Committee considers this data and any changes from prior periods in order to assess the reasonableness of observable and unobservable inputs, any assumptions or internal models used to value those securities and changes in fair value. This data is also used to corroborate, when available, information received from approved pricing vendors and brokers. Various factors impact the frequency of monitoring this information (which may occur as often as daily). However, the Committee may determine that changes to inputs, assumptions and models are not required as a result of the monitoring procedures performed.
The following table is a summary of the inputs used to value the Fund's investments at November 30, 2016:
| | | Level 1
Quoted Prices in Active
Markets for Identical
Assets ($) | | Level 2
Other Significant
Observable Inputs ($) | | Level 3
Significant
Unobservable Inputs ($) | | Total ($) | |
Investments | |
Common Stocks | |
Consumer Discretionary | | | 62,247,771 | | | | — | | | | — | | | | 62,247,771 | | |
Consumer Staples | | | 27,410,430 | | | | — | | | | — | | | | 27,410,430 | | |
Energy | | | 76,155,090 | | | | — | | | | — | | | | 76,155,090 | | |
Financials | | | 202,648,135 | | | | — | | | | — | | | | 202,648,135 | | |
Health Care | | | 48,720,140 | | | | — | | | | — | | | | 48,720,140 | | |
Industrials | | | 114,824,530 | | | | — | | | | — | | | | 114,824,530 | | |
Information Technology | | | 90,496,693 | | | | — | | | | — | | | | 90,496,693 | | |
Materials | | | 62,357,850 | | | | — | | | | — | | | | 62,357,850 | | |
Real Estate | | | 105,697,605 | | | | — | | | | — | | | | 105,697,605 | | |
Utilities | | | 39,358,180 | | | | — | | | | — | | | | 39,358,180 | | |
Total Common Stocks | | | 829,916,424 | | | | — | | | | — | | | | 829,916,424 | | |
Investments measured at net asset value | |
Money Market Funds | | | — | | | | — | | | | — | | | | 30,159,189 | | |
Total Investments | | | 829,916,424 | | | | — | | | | — | | | | 860,075,613 | | |
See the Portfolio of Investments for all investment classifications not indicated in the table.
There were no transfers of financial assets between levels during the period.
The accompanying Notes to Financial Statements are an integral part of this statement.
Semiannual Report 2016
10
COLUMBIA SMALL/MID CAP VALUE FUND
STATEMENT OF ASSETS AND LIABILITIES
November 30, 2016 (Unaudited)
Assets | |
Investments, at value | |
Unaffiliated issuers (identified cost $645,977,617) | | $ | 824,130,424 | | |
Affiliated issuers (identified cost $36,756,173) | | | 35,945,189 | | |
Total investments (identified cost $682,733,790) | | | 860,075,613 | | |
Receivable for: | |
Investments sold | | | 6,847,749 | | |
Capital shares sold | | | 754,083 | | |
Dividends | | | 730,607 | | |
Prepaid expenses | | | 3,995 | | |
Other assets | | | 9,226 | | |
Total assets | | | 868,421,273 | | |
Liabilities | |
Payable for: | |
Investments purchased | | | 1,408,954 | | |
Capital shares purchased | | | 5,540,052 | | |
Management services fees | | | 18,764 | | |
Distribution and/or service fees | | | 5,721 | | |
Transfer agent fees | | | 100,204 | | |
Plan administration fees | | | 9,214 | | |
Compensation of board members | | | 113,283 | | |
Chief compliance officer expenses | | | 60 | | |
Other expenses | | | 76,950 | | |
Total liabilities | | | 7,273,202 | | |
Net assets applicable to outstanding capital stock | | $ | 861,148,071 | | |
Represented by | |
Paid-in capital | | $ | 679,849,613 | | |
Undistributed net investment income | | | 1,353,407 | | |
Accumulated net realized gain | | | 2,603,228 | | |
Unrealized appreciation (depreciation) on: | |
Investments — unaffiliated issuers | | | 178,152,807 | | |
Investments — affiliated issuers | | | (810,984 | ) | |
Total — representing net assets applicable to outstanding capital stock | | $ | 861,148,071 | | |
The accompanying Notes to Financial Statements are an integral part of this statement.
Semiannual Report 2016
11
COLUMBIA SMALL/MID CAP VALUE FUND
STATEMENT OF ASSETS AND LIABILITIES (continued)
November 30, 2016 (Unaudited)
Class A | |
Net assets | | $ | 689,302,621 | | |
Shares outstanding | | | 71,603,176 | | |
Net asset value per share | | $ | 9.63 | | |
Maximum offering price per share(a) | | $ | 10.22 | | |
Class B | |
Net assets | | $ | 4,172,844 | | |
Shares outstanding | | | 475,510 | | |
Net asset value per share | | $ | 8.78 | | |
Class C | |
Net assets | | $ | 30,590,438 | | |
Shares outstanding | | | 3,489,390 | | |
Net asset value per share | | $ | 8.77 | | |
Class I | |
Net assets | | $ | 2,745 | | |
Shares outstanding | | | 276 | | |
Net asset value per share | | $ | 9.95 | | |
Class K | |
Net assets | | $ | 43,111,268 | | |
Shares outstanding | | | 4,428,860 | | |
Net asset value per share | | $ | 9.73 | | |
Class R | |
Net assets | | $ | 7,171,526 | | |
Shares outstanding | | | 759,494 | | |
Net asset value per share | | $ | 9.44 | | |
Class R4 | |
Net assets | | $ | 16,723,535 | | |
Shares outstanding | | | 1,731,206 | | |
Net asset value per share | | $ | 9.66 | | |
Class R5 | |
Net assets | | $ | 41,104,521 | | |
Shares outstanding | | | 4,192,328 | | |
Net asset value per share | | $ | 9.80 | | |
Class W | |
Net assets | | $ | 2,360 | | |
Shares outstanding | | | 243 | | |
Net asset value per share(b) | | $ | 9.72 | | |
The accompanying Notes to Financial Statements are an integral part of this statement.
Semiannual Report 2016
12
COLUMBIA SMALL/MID CAP VALUE FUND
STATEMENT OF ASSETS AND LIABILITIES (continued)
November 30, 2016 (Unaudited)
Class Y | |
Net assets | | $ | 1,907,634 | | |
Shares outstanding | | | 197,395 | | |
Net asset value per share | | $ | 9.66 | | |
Class Z | |
Net assets | | $ | 27,058,579 | | |
Shares outstanding | | | 2,738,785 | | |
Net asset value per share | | $ | 9.88 | | |
(a) The maximum offering price per share is calculated by dividing the net asset value per share by 1.0 minus the maximum sales charge of 5.75%.
(b) Net asset value per share rounds to this amount due to fractional shares outstanding.
The accompanying Notes to Financial Statements are an integral part of this statement.
Semiannual Report 2016
13
COLUMBIA SMALL/MID CAP VALUE FUND
STATEMENT OF OPERATIONS
Six Months Ended November 30, 2016 (Unaudited)
Net investment income | |
Income: | |
Dividends — unaffiliated issuers | | $ | 6,056,204 | | |
Dividends — affiliated issuers | | | 44,139 | | |
Foreign taxes withheld | | | (15,547 | ) | |
Total income | | | 6,084,796 | | |
Expenses: | |
Management services fees | | | 3,339,529 | | |
Distribution and/or service fees | |
Class A | | | 839,696 | | |
Class B | | | 23,428 | | |
Class C | | | 148,959 | | |
Class R | | | 17,397 | | |
Class W | | | 3 | | |
Transfer agent fees | |
Class A | | | 539,205 | | |
Class B | | | 3,762 | | |
Class C | | | 23,913 | | |
Class K | | | 10,892 | | |
Class R | | | 5,587 | | |
Class R4 | | | 12,045 | | |
Class R5 | | | 9,178 | | |
Class W | | | 2 | | |
Class Z | | | 20,333 | | |
Plan administration fees | |
Class K | | | 54,311 | | |
Compensation of board members | | | 15,038 | | |
Custodian fees | | | 11,136 | | |
Printing and postage fees | | | 68,263 | | |
Registration fees | | | 66,515 | | |
Audit fees | | | 14,096 | | |
Legal fees | | | 8,236 | | |
Chief compliance officer expenses | | | 60 | | |
Other | | | 12,001 | | |
Total expenses | | | 5,243,585 | | |
Expense reductions | | | (80 | ) | |
Total net expenses | | | 5,243,505 | | |
Net investment income | | | 841,291 | | |
Realized and unrealized gain (loss) — net | |
Net realized gain (loss) on: | |
Investments — unaffiliated issuers | | | 27,899,475 | | |
Investments — affiliated issuers | | | (199,134 | ) | |
Net realized gain | | | 27,700,341 | | |
Net change in unrealized appreciation (depreciation) on: | |
Investments — unaffiliated issuers | | | 67,024,651 | | |
Investments — affiliated issuers | | | 2,286,362 | | |
Net change in unrealized appreciation | | | 69,311,013 | | |
Net realized and unrealized gain | | | 97,011,354 | | |
Net increase in net assets resulting from operations | | $ | 97,852,645 | | |
The accompanying Notes to Financial Statements are an integral part of this statement.
Semiannual Report 2016
14
COLUMBIA SMALL/MID CAP VALUE FUND
STATEMENT OF CHANGES IN NET ASSETS
| | | Six Months Ended
November 30, 2016
(Unaudited) | | Year Ended
May 31,
2016 | |
Operations | |
Net investment income | | $ | 841,291 | | | $ | 2,126,068 | | |
Net realized gain (loss) | | | 27,700,341 | | | | (5,562,143 | ) | |
Net change in unrealized appreciation (depreciation) | | | 69,311,013 | | | | (102,101,156 | ) | |
Net increase (decrease) in net assets resulting from operations | | | 97,852,645 | | | | (105,537,231 | ) | |
Distributions to shareholders | |
Net investment income | |
Net realized gains | |
Class A | | | — | | | | (43,876,297 | ) | |
Class B | | | — | | | | (504,291 | ) | |
Class C | | | — | | | | (2,029,359 | ) | |
Class I | | | — | | | | (146 | ) | |
Class K | | | — | | | | (4,041,546 | ) | |
Class R | | | — | | | | (519,770 | ) | |
Class R4 | | | — | | | | (712,831 | ) | |
Class R5 | | | — | | | | (2,455,008 | ) | |
Class W | | | — | | | | (128 | ) | |
Class Y | | | — | | | | (3,879 | ) | |
Class Z | | | — | | | | (1,428,685 | ) | |
Total distributions to shareholders | | | — | | | | (55,571,940 | ) | |
Decrease in net assets from capital stock activity | | | (84,767,808 | ) | | | (120,557,469 | ) | |
Total increase (decrease) in net assets | | | 13,084,837 | | | | (281,666,640 | ) | |
Net assets at beginning of period | | | 848,063,234 | | | | 1,129,729,874 | | |
Net assets at end of period | | $ | 861,148,071 | | | $ | 848,063,234 | | |
Undistributed net investment income | | $ | 1,353,407 | | | $ | 512,116 | | |
The accompanying Notes to Financial Statements are an integral part of this statement.
Semiannual Report 2016
15
COLUMBIA SMALL/MID CAP VALUE FUND
STATEMENT OF CHANGES IN NET ASSETS (continued)
| | | Six Months Ended November 30, 2016
(Unaudited) | | Year Ended May 31, 2016 | |
| | | Shares | | Dollars ($) | | Shares | | Dollars ($) | |
Capital stock activity | |
Class A shares | |
Subscriptions(a) | | | 862,030 | | | | 7,680,515 | | | | 4,532,648 | | | | 41,140,535 | | |
Distributions reinvested | | | — | | | | — | | | | 5,260,276 | | | | 43,449,881 | | |
Redemptions | | | (9,422,724 | ) | | | (83,437,522 | ) | | | (18,025,887 | ) | | | (157,939,097 | ) | |
Net decrease | | | (8,560,694 | ) | | | (75,757,007 | ) | | | (8,232,963 | ) | | | (73,348,681 | ) | |
Class B shares | |
Subscriptions | | | 948 | | | | 7,996 | | | | 3,984 | | | | 34,189 | | |
Distributions reinvested | | | — | | | | — | | | | 65,079 | | | | 493,298 | | |
Redemptions(a) | | | (196,017 | ) | | | (1,592,205 | ) | | | (914,433 | ) | | | (7,664,421 | ) | |
Net decrease | | | (195,069 | ) | | | (1,584,209 | ) | | | (845,370 | ) | | | (7,136,934 | ) | |
Class C shares | |
Subscriptions | | | 79,727 | | | | 651,248 | | | | 585,668 | | | | 4,848,140 | | |
Distributions reinvested | | | — | | | | — | | | | 260,145 | | | | 1,969,300 | | |
Redemptions | | | (468,299 | ) | | | (3,791,607 | ) | | | (758,646 | ) | | | (5,996,584 | ) | |
Net increase (decrease) | | | (388,572 | ) | | | (3,140,359 | ) | | | 87,167 | | | | 820,856 | | |
Class K shares | |
Subscriptions | | | 220,723 | | | | 1,977,945 | | | | 740,842 | | | | 6,631,933 | | |
Distributions reinvested | | | — | | | | — | | | | 484,580 | | | | 4,041,397 | | |
Redemptions | | | (1,107,340 | ) | | | (9,905,495 | ) | | | (4,583,547 | ) | | | (39,548,772 | ) | |
Net decrease | | | (886,617 | ) | | | (7,927,550 | ) | | | (3,358,125 | ) | | | (28,875,442 | ) | |
Class R shares | |
Subscriptions | | | 53,529 | | | | 466,927 | | | | 242,524 | | | | 2,142,759 | | |
Distributions reinvested | | | — | | | | — | | | | 58,683 | | | | 476,502 | | |
Redemptions | | | (174,836 | ) | | | (1,507,269 | ) | | | (398,537 | ) | | | (3,301,198 | ) | |
Net decrease | | | (121,307 | ) | | | (1,040,342 | ) | | | (97,330 | ) | | | (681,937 | ) | |
Class R4 shares | |
Subscriptions | | | 416,204 | | | | 3,727,841 | | | | 769,268 | | | | 6,505,857 | | |
Distributions reinvested | | | — | | | | — | | | | 86,299 | | | | 712,831 | | |
Redemptions | | | (290,431 | ) | | | (2,578,700 | ) | | | (701,348 | ) | | | (6,131,063 | ) | |
Net increase | | | 125,773 | | | | 1,149,141 | | | | 154,219 | | | | 1,087,625 | | |
Class R5 shares | |
Subscriptions | | | 839,552 | | | | 7,570,261 | | | | 1,624,751 | | | | 14,412,176 | | |
Distributions reinvested | | | — | | | | — | | | | 223,007 | | | | 1,868,802 | | |
Redemptions | | | (775,127 | ) | | | (6,940,800 | ) | | | (2,952,470 | ) | | | (26,824,333 | ) | |
Net increase (decrease) | | | 64,425 | | | | 629,461 | | | | (1,104,712 | ) | | | (10,543,355 | ) | |
The accompanying Notes to Financial Statements are an integral part of this statement.
Semiannual Report 2016
16
COLUMBIA SMALL/MID CAP VALUE FUND
STATEMENT OF CHANGES IN NET ASSETS (continued)
| | | Six Months Ended November 30, 2016
(Unaudited) | | Year Ended May 31, 2016 | |
| | | Shares | | Dollars ($) | | Shares | | Dollars ($) | |
Capital stock activity (continued) | |
Class Y shares | |
Subscriptions | | | 154,986 | | | | 1,376,280 | | | | 83,934 | | | | 658,967 | | |
Distributions reinvested | | | — | | | | — | | | | 454 | | | | 3,747 | | |
Redemptions | | | (46,173 | ) | | | (413,835 | ) | | | (1,658 | ) | | | (15,086 | ) | |
Net increase | | | 108,813 | | | | 962,445 | | | | 82,730 | | | | 647,628 | | |
Class Z shares | |
Subscriptions | | | 1,391,078 | | | | 12,720,832 | | | | 432,397 | | | | 3,883,599 | | |
Distributions reinvested | | | — | | | | — | | | | 129,971 | | | | 1,098,257 | | |
Redemptions | | | (1,150,106 | ) | | | (10,780,220 | ) | | | (854,574 | ) | | | (7,509,085 | ) | |
Net increase (decrease) | | | 240,972 | | | | 1,940,612 | | | | (292,206 | ) | | | (2,527,229 | ) | |
Total net decrease | | | (9,612,276 | ) | | | (84,767,808 | ) | | | (13,606,590 | ) | | | (120,557,469 | ) | |
(a) Includes conversions of Class B shares to Class A shares, if any.
The accompanying Notes to Financial Statements are an integral part of this statement.
Semiannual Report 2016
17
COLUMBIA SMALL/MID CAP VALUE FUND
The following tables are intended to help you understand the Fund's financial performance. Certain information reflects financial results for a single share of a class held for the periods shown. Per share net investment income (loss) amounts are calculated based on average shares outstanding during the period. Total return assumes reinvestment of all dividends and distributions, if any. Total return does not reflect payment of sales charges, if any. Total return and portfolio turnover are not annualized for periods of less than one year. The portfolio turnover rate is calculated without regard to purchase and sales transactions of short-term instruments and certain derivatives, if any. If such transactions were included, the Fund's portfolio turnover rate may be higher.
| | | Six Months Ended
November 30, 2016 | | Year Ended May 31, | | Year Ended
September 30, | |
Class A | | (Unaudited) | | 2016 | | 2015 | | 2014 | | 2013 | | 2012(a) | | 2011 | |
Per share data | |
Net asset value, beginning of period | | $ | 8.57 | | | $ | 10.03 | | | $ | 10.81 | | | $ | 10.08 | | | $ | 7.59 | | | $ | 6.44 | | | $ | 6.94 | | |
Income from investment
operations: | |
Net investment income (loss) | | | 0.01 | | | | 0.02 | | | | (0.01 | ) | | | 0.01 | | | | 0.07 | | | | 0.03 | | | | 0.02 | | |
Net realized and unrealized gain
(loss) | | | 1.05 | | | | (0.95 | ) | | | 0.84 | | | | 1.62 | | | | 2.46 | | | | 1.12 | | | | (0.48 | ) | |
Total from investment
operations | | | 1.06 | | | | (0.93 | ) | | | 0.83 | | | | 1.63 | | | | 2.53 | | | | 1.15 | | | | (0.46 | ) | |
Less distributions to
shareholders: | |
Net investment income | | | — | | | | — | | | | — | | | | (0.11 | ) | | | (0.04 | ) | | | (0.00 | )(b) | | | (0.04 | ) | |
Net realized gains | | | — | | | | (0.53 | ) | | | (1.61 | ) | | | (0.79 | ) | | | — | | | | — | | | | — | | |
Total distributions to
shareholders | | | — | | | | (0.53 | ) | | | (1.61 | ) | | | (0.90 | ) | | | (0.04 | ) | | | (0.00 | )(b) | | | (0.04 | ) | |
Net asset value, end of period | | $ | 9.63 | | | $ | 8.57 | | | $ | 10.03 | | | $ | 10.81 | | | $ | 10.08 | | | $ | 7.59 | | | $ | 6.44 | | |
Total return | | | 12.37 | % | | | (9.09 | %) | | | 8.58 | % | | | 16.73 | % | | | 33.47 | % | | | 17.93 | % | | | (6.69 | %) | |
Ratios to average net assets(c) | |
Total gross expenses | | | 1.25 | %(d) | | | 1.25 | % | | | 1.25 | % | | | 1.26 | % | | | 1.31 | % | | | 1.29 | %(d) | | | 1.30 | % | |
Total net expenses(e) | | | 1.25 | %(d)(f) | | | 1.25 | %(f) | | | 1.25 | %(f) | | | 1.25 | %(f) | | | 1.23 | %(f) | | | 1.20 | %(d) | | | 1.29 | %(f) | |
Net investment income (loss) | | | 0.20 | %(d) | | | 0.22 | % | | | (0.05 | %) | | | 0.10 | % | | | 0.81 | % | | | 0.55 | %(d) | | | 0.22 | % | |
Supplemental data | |
Net assets, end of period
(in thousands) | | $ | 689,303 | | | $ | 686,606 | | | $ | 886,673 | | | $ | 976,436 | | | $ | 932,556 | | | $ | 850,820 | | | $ | 882,934 | | |
Portfolio turnover | | | 27 | % | | | 69 | % | | | 50 | % | | | 110 | % | | | 40 | % | | | 28 | % | | | 46 | % | |
Notes to Financial Highlights
(a) For the period from October 1, 2011 to May 31, 2012. During the period, the Fund's fiscal year end was changed from September 30 to May 31.
(b) Rounds to zero.
(c) In addition to the fees and expenses that the Fund bears directly, the Fund indirectly bears a pro rata share of the fees and expenses of any other funds in which it invests. Such indirect expenses are not included in the Fund's reported expense ratios.
(d) Annualized.
(e) Total net expenses include the impact of certain fee waivers/expense reimbursements made by the Investment Manager and certain of its affiliates, if applicable.
(f) The benefits derived from expense reductions had an impact of less than 0.01%.
The accompanying Notes to Financial Statements are an integral part of this statement.
Semiannual Report 2016
18
COLUMBIA SMALL/MID CAP VALUE FUND
FINANCIAL HIGHLIGHTS (continued)
| | | Six Months Ended
November 30, 2016 | | Year Ended May 31, | | Year Ended
September 30, | |
Class B | | (Unaudited) | | 2016 | | 2015 | | 2014 | | 2013 | | 2012(a) | | 2011 | |
Per share data | |
Net asset value, beginning of period | | $ | 7.84 | | | $ | 9.30 | | | $ | 10.21 | | | $ | 9.60 | | | $ | 7.24 | | | $ | 6.17 | | | $ | 6.67 | | |
Income from investment operations: | |
Net investment income (loss) | | | (0.02 | ) | | | (0.05 | ) | | | (0.08 | ) | | | (0.06 | ) | | | 0.01 | | | | (0.01 | ) | | | (0.04 | ) | |
Net realized and unrealized gain (loss) | | | 0.96 | | | | (0.88 | ) | | | 0.78 | | | | 1.53 | | | | 2.35 | | | | 1.08 | | | | (0.46 | ) | |
Total from investment operations | | | 0.94 | | | | (0.93 | ) | | | 0.70 | | | | 1.47 | | | | 2.36 | | | | 1.07 | | | | (0.50 | ) | |
Less distributions to shareholders: | |
Net investment income | | | — | | | | — | | | | — | | | | (0.07 | ) | | | — | | | | — | | | | — | | |
Net realized gains | | | — | | | | (0.53 | ) | | | (1.61 | ) | | | (0.79 | ) | | | — | | | | — | | | | — | | |
Total distributions to shareholders | | | — | | | | (0.53 | ) | | | (1.61 | ) | | | (0.86 | ) | | | — | | | | — | | | | — | | |
Net asset value, end of period | | $ | 8.78 | | | $ | 7.84 | | | $ | 9.30 | | | $ | 10.21 | | | $ | 9.60 | | | $ | 7.24 | | | $ | 6.17 | | |
Total return | | | 11.99 | % | | | (9.82 | %) | | | 7.76 | % | | | 15.78 | % | | | 32.60 | % | | | 17.34 | % | | | (7.50 | %) | |
Ratios to average net assets(b) | |
Total gross expenses | | | 2.00 | %(c) | | | 2.00 | % | | | 2.00 | % | | | 2.01 | % | | | 2.05 | % | | | 2.04 | %(c) | | | 2.04 | % | |
Total net expenses(d) | | | 2.00 | %(c)(e) | | | 2.00 | %(e) | | | 2.00 | %(e) | | | 2.00 | %(e) | | | 1.97 | %(e) | | | 1.95 | %(c) | | | 2.03 | %(e) | |
Net investment income (loss) | | | (0.54 | %)(c) | | | (0.56 | %) | | | (0.80 | %) | | | (0.65 | %) | | | 0.11 | % | | | (0.19 | %)(c) | | | (0.54 | %) | |
Supplemental data | |
Net assets, end of period
(in thousands) | | $ | 4,173 | | | $ | 5,255 | | | $ | 14,096 | | | $ | 24,381 | | | $ | 38,621 | | | $ | 49,020 | | | $ | 49,737 | | |
Portfolio turnover | | | 27 | % | | | 69 | % | | | 50 | % | | | 110 | % | | | 40 | % | | | 28 | % | | | 46 | % | |
Notes to Financial Highlights
(a) For the period from October 1, 2011 to May 31, 2012. During the period, the Fund's fiscal year end was changed from September 30 to May 31.
(b) In addition to the fees and expenses that the Fund bears directly, the Fund indirectly bears a pro rata share of the fees and expenses of any other funds in which it invests. Such indirect expenses are not included in the Fund's reported expense ratios.
(c) Annualized.
(d) Total net expenses include the impact of certain fee waivers/expense reimbursements made by the Investment Manager and certain of its affiliates, if applicable.
(e) The benefits derived from expense reductions had an impact of less than 0.01%.
The accompanying Notes to Financial Statements are an integral part of this statement.
Semiannual Report 2016
19
COLUMBIA SMALL/MID CAP VALUE FUND
FINANCIAL HIGHLIGHTS (continued)
| | | Six Months Ended
November 30, 2016 | | Year Ended May 31, | | Year Ended
September 30, | |
Class C | | (Unaudited) | | 2016 | | 2015 | | 2014 | | 2013 | | 2012(a) | | 2011 | |
Per share data | |
Net asset value, beginning of period | | $ | 7.83 | | | $ | 9.29 | | | $ | 10.20 | | | $ | 9.59 | | | $ | 7.24 | | | $ | 6.17 | | | $ | 6.66 | | |
Income from investment operations: | |
Net investment income (loss) | | | (0.02 | ) | | | (0.04 | ) | | | (0.08 | ) | | | (0.07 | ) | | | 0.01 | | | | (0.01 | ) | | | (0.04 | ) | |
Net realized and unrealized gain (loss) | | | 0.96 | | | | (0.89 | ) | | | 0.78 | | | | 1.54 | | | | 2.34 | | | | 1.08 | | | | (0.45 | ) | |
Total from investment operations | | | 0.94 | | | | (0.93 | ) | | | 0.70 | | | | 1.47 | | | | 2.35 | | | | 1.07 | | | | (0.49 | ) | |
Less distributions to shareholders: | |
Net investment income | | | — | | | | — | | | | — | | | | (0.07 | ) | | | — | | | | — | | | | — | | |
Net realized gains | | | — | | | | (0.53 | ) | | | (1.61 | ) | | | (0.79 | ) | | | — | | | | — | | | | — | | |
Total distributions to shareholders | | | — | | | | (0.53 | ) | | | (1.61 | ) | | | (0.86 | ) | | | — | | | | — | | | | — | | |
Net asset value, end of period | | $ | 8.77 | | | $ | 7.83 | | | $ | 9.29 | | | $ | 10.20 | | | $ | 9.59 | | | $ | 7.24 | | | $ | 6.17 | | |
Total return | | | 12.01 | % | | | (9.83 | %) | | | 7.77 | % | | | 15.79 | % | | | 32.46 | % | | | 17.34 | % | | | (7.36 | %) | |
Ratios to average net assets(b) | |
Total gross expenses | | | 2.00 | %(c) | | | 2.00 | % | | | 2.00 | % | | | 2.01 | % | | | 2.06 | % | | | 2.04 | %(c) | | | 2.05 | % | |
Total net expenses(d) | | | 2.00 | %(c)(e) | | | 2.00 | %(e) | | | 2.00 | %(e) | | | 2.00 | %(e) | | | 1.98 | %(e) | | | 1.95 | %(c) | | | 2.04 | %(e) | |
Net investment income (loss) | | | (0.55 | %)(c) | | | (0.52 | %) | | | (0.80 | %) | | | (0.66 | %) | | | 0.07 | % | | | (0.20 | %)(c) | | | (0.52 | %) | |
Supplemental data | |
Net assets, end of period
(in thousands) | | $ | 30,590 | | | $ | 30,361 | | | $ | 35,212 | | | $ | 36,115 | | | $ | 32,119 | | | $ | 31,012 | | | $ | 34,731 | | |
Portfolio turnover | | | 27 | % | | | 69 | % | | | 50 | % | | | 110 | % | | | 40 | % | | | 28 | % | | | 46 | % | |
Notes to Financial Highlights
(a) For the period from October 1, 2011 to May 31, 2012. During the period, the Fund's fiscal year end was changed from September 30 to May 31.
(b) In addition to the fees and expenses that the Fund bears directly, the Fund indirectly bears a pro rata share of the fees and expenses of any other funds in which it invests. Such indirect expenses are not included in the Fund's reported expense ratios.
(c) Annualized.
(d) Total net expenses include the impact of certain fee waivers/expense reimbursements made by the Investment Manager and certain of its affiliates, if applicable.
(e) The benefits derived from expense reductions had an impact of less than 0.01%.
The accompanying Notes to Financial Statements are an integral part of this statement.
Semiannual Report 2016
20
COLUMBIA SMALL/MID CAP VALUE FUND
FINANCIAL HIGHLIGHTS (continued)
| | | Six Months Ended
November 30, 2016 | | Year Ended May 31, | | Year Ended
September 30, | |
Class I | | (Unaudited) | | 2016 | | 2015 | | 2014 | | 2013 | | 2012(a) | | 2011 | |
Per share data | |
Net asset value, beginning of period | | $ | 8.83 | | | $ | 10.28 | | | $ | 11.01 | | | $ | 10.25 | | | $ | 7.72 | | | $ | 6.56 | | | $ | 7.07 | | |
Income from investment operations: | |
Net investment income | | | 0.03 | | | | 0.06 | | | | 0.03 | | | | 0.06 | | | | 0.11 | | | | 0.05 | | | | 0.06 | | |
Net realized and unrealized gain (loss) | | | 1.09 | | | | (0.98 | ) | | | 0.87 | | | | 1.65 | | | | 2.50 | | | | 1.15 | | | | (0.49 | ) | |
Total from investment operations | | | 1.12 | | | | (0.92 | ) | | | 0.90 | | | | 1.71 | | | | 2.61 | | | | 1.20 | | | | (0.43 | ) | |
Less distributions to shareholders: | |
Net investment income | | | — | | | | — | | | | (0.02 | ) | | | (0.16 | ) | | | (0.08 | ) | | | (0.04 | ) | | | (0.08 | ) | |
Net realized gains | | | — | | | | (0.53 | ) | | | (1.61 | ) | | | (0.79 | ) | | | — | | | | — | | | | — | | |
Total distributions to shareholders | | | — | | | | (0.53 | ) | | | (1.63 | ) | | | (0.95 | ) | | | (0.08 | ) | | | (0.04 | ) | | | (0.08 | ) | |
Net asset value, end of period | | $ | 9.95 | | | $ | 8.83 | | | $ | 10.28 | | | $ | 11.01 | | | $ | 10.25 | | | $ | 7.72 | | | $ | 6.56 | | |
Total return | | | 12.68 | % | | | (8.76 | %) | | | 9.13 | % | | | 17.22 | % | | | 33.99 | % | | | 18.30 | % | | | (6.28 | %) | |
Ratios to average net assets(b) | |
Total gross expenses | | | 0.81 | %(c) | | | 0.81 | % | | | 0.80 | % | | | 0.79 | % | | | 0.80 | % | | | 0.79 | %(c) | | | 0.82 | % | |
Total net expenses(d) | | | 0.81 | %(c) | | | 0.81 | % | | | 0.80 | % | | | 0.79 | % | | | 0.78 | % | | | 0.77 | %(c) | | | 0.82 | % | |
Net investment income | | | 0.63 | %(c) | | | 0.67 | % | | | 0.31 | % | | | 0.55 | % | | | 1.25 | % | | | 0.98 | %(c) | | | 0.72 | % | |
Supplemental data | |
Net assets, end of period
(in thousands) | | $ | 3 | | | $ | 2 | | | $ | 3 | | | $ | 80,862 | | | $ | 100,192 | | | $ | 84,959 | | | $ | 100,645 | | |
Portfolio turnover | | | 27 | % | | | 69 | % | | | 50 | % | | | 110 | % | | | 40 | % | | | 28 | % | | | 46 | % | |
Notes to Financial Highlights
(a) For the period from October 1, 2011 to May 31, 2012. During the period, the Fund's fiscal year end was changed from September 30 to May 31.
(b) In addition to the fees and expenses that the Fund bears directly, the Fund indirectly bears a pro rata share of the fees and expenses of any other funds in which it invests. Such indirect expenses are not included in the Fund's reported expense ratios.
(c) Annualized.
(d) Total net expenses include the impact of certain fee waivers/expense reimbursements made by the Investment Manager and certain of its affiliates, if applicable.
The accompanying Notes to Financial Statements are an integral part of this statement.
Semiannual Report 2016
21
COLUMBIA SMALL/MID CAP VALUE FUND
FINANCIAL HIGHLIGHTS (continued)
| | | Six Months Ended
November 30, 2016 | | Year Ended May 31, | | Year Ended
September 30, | |
Class K | | (Unaudited) | | 2016 | | 2015 | | 2014 | | 2013 | | 2012(a) | | 2011 | |
Per share data | |
Net asset value, beginning of period | | $ | 8.66 | | | $ | 10.12 | | | $ | 10.88 | | | $ | 10.14 | | | $ | 7.64 | | | $ | 6.48 | | | $ | 6.99 | | |
Income from investment operations: | |
Net investment income | | | 0.01 | | | | 0.03 | | | | 0.01 | | | | 0.03 | | | | 0.08 | | | | 0.04 | | | | 0.03 | | |
Net realized and unrealized gain (loss) | | | 1.06 | | | | (0.96 | ) | | | 0.84 | | | | 1.63 | | | | 2.47 | | | | 1.13 | | | | (0.48 | ) | |
Total from investment operations | | | 1.07 | | | | (0.93 | ) | | | 0.85 | | | | 1.66 | | | | 2.55 | | | | 1.17 | | | | (0.45 | ) | |
Less distributions to shareholders: | |
Net investment income | | | — | | | | — | | | | (0.00 | )(b) | | | (0.13 | ) | | | (0.05 | ) | | | (0.01 | ) | | | (0.06 | ) | |
Net realized gains | | | — | | | | (0.53 | ) | | | (1.61 | ) | | | (0.79 | ) | | | — | | | | — | | | | — | | |
Total distributions to shareholders | | | — | | | | (0.53 | ) | | | (1.61 | ) | | | (0.92 | ) | | | (0.05 | ) | | | (0.01 | ) | | | (0.06 | ) | |
Net asset value, end of period | | $ | 9.73 | | | $ | 8.66 | | | $ | 10.12 | | | $ | 10.88 | | | $ | 10.14 | | | $ | 7.64 | | | $ | 6.48 | | |
Total return | | | 12.36 | % | | | (9.00 | %) | | | 8.75 | % | | | 16.90 | % | | | 33.53 | % | | | 18.15 | % | | | (6.59 | %) | |
Ratios to average net assets(c) | |
Total gross expenses | | | 1.14 | %(d) | | | 1.14 | % | | | 1.11 | % | | | 1.09 | % | | | 1.10 | % | | | 1.09 | %(d) | | | 1.12 | % | |
Total net expenses(e) | | | 1.14 | %(d) | | | 1.14 | % | | | 1.11 | % | | | 1.09 | % | | | 1.08 | % | | | 1.07 | %(d) | | | 1.12 | % | |
Net investment income | | | 0.31 | %(d) | | | 0.34 | % | | | 0.10 | % | | | 0.28 | % | | | 0.97 | % | | | 0.69 | %(d) | | | 0.38 | % | |
Supplemental data | |
Net assets, end of period
(in thousands) | | $ | 43,111 | | | $ | 46,011 | | | $ | 87,765 | | | $ | 155,551 | | | $ | 202,420 | | | $ | 241,253 | | | $ | 251,200 | | |
Portfolio turnover | | | 27 | % | | | 69 | % | | | 50 | % | | | 110 | % | | | 40 | % | | | 28 | % | | | 46 | % | |
Notes to Financial Highlights
(a) For the period from October 1, 2011 to May 31, 2012. During the period, the Fund's fiscal year end was changed from September 30 to May 31.
(b) Rounds to zero.
(c) In addition to the fees and expenses that the Fund bears directly, the Fund indirectly bears a pro rata share of the fees and expenses of any other funds in which it invests. Such indirect expenses are not included in the Fund's reported expense ratios.
(d) Annualized.
(e) Total net expenses include the impact of certain fee waivers/expense reimbursements made by the Investment Manager and certain of its affiliates, if applicable.
The accompanying Notes to Financial Statements are an integral part of this statement.
Semiannual Report 2016
22
COLUMBIA SMALL/MID CAP VALUE FUND
FINANCIAL HIGHLIGHTS (continued)
| | | Six Months Ended
November 30, 2016 | | Year Ended May 31, | | Year Ended
September 30, | |
Class R | | (Unaudited) | | 2016 | | 2015 | | 2014 | | 2013 | | 2012(a) | | 2011 | |
Per share data | |
Net asset value, beginning of period | | $ | 8.41 | | | $ | 9.89 | | | $ | 10.70 | | | $ | 9.99 | | | $ | 7.52 | | | $ | 6.39 | | | $ | 6.88 | | |
Income from investment operations: | |
Net investment income (loss) | | | (0.00 | )(b) | | | (0.00 | )(b) | | | (0.03 | ) | | | (0.02 | ) | | | 0.05 | | | | 0.02 | | | | (0.00 | )(b) | |
Net realized and unrealized gain (loss) | | | 1.03 | | | | (0.95 | ) | | | 0.83 | | | | 1.61 | | | | 2.43 | | | | 1.11 | | | | (0.46 | ) | |
Total from investment operations | | | 1.03 | | | | (0.95 | ) | | | 0.80 | | | | 1.59 | | | | 2.48 | | | | 1.13 | | | | (0.46 | ) | |
Less distributions to shareholders: | |
Net investment income | | | — | | | | — | | | | — | | | | (0.09 | ) | | | (0.01 | ) | | | — | | | | (0.03 | ) | |
Net realized gains | | | — | | | | (0.53 | ) | | | (1.61 | ) | | | (0.79 | ) | | | — | | | | — | | | | — | | |
Total distributions to shareholders | | | — | | | | (0.53 | ) | | | (1.61 | ) | | | (0.88 | ) | | | (0.01 | ) | | | — | | | | (0.03 | ) | |
Net asset value, end of period | | $ | 9.44 | | | $ | 8.41 | | | $ | 9.89 | | | $ | 10.70 | | | $ | 9.99 | | | $ | 7.52 | | | $ | 6.39 | | |
Total return | | | 12.25 | % | | | (9.43 | %) | | | 8.37 | % | | | 16.42 | % | | | 33.07 | % | | | 17.68 | % | | | (6.81 | %) | |
Ratios to average net assets(c) | |
Total gross expenses | | | 1.50 | %(d) | | | 1.50 | % | | | 1.50 | % | | | 1.51 | % | | | 1.56 | % | | | 1.54 | %(d) | | | 1.55 | % | |
Total net expenses(e) | | | 1.50 | %(d)(f) | | | 1.50 | %(f) | | | 1.50 | %(f) | | | 1.50 | %(f) | | | 1.47 | %(f) | | | 1.45 | %(d) | | | 1.54 | %(f) | |
Net investment income (loss) | | | (0.05 | %)(d) | | | (0.03 | %) | | | (0.30 | %) | | | (0.15 | %) | | | 0.59 | % | | | 0.31 | %(d) | | | (0.01 | %) | |
Supplemental data | |
Net assets, end of period
(in thousands) | | $ | 7,172 | | | $ | 7,409 | | | $ | 9,670 | | | $ | 12,245 | | | $ | 12,641 | | | $ | 13,594 | | | $ | 14,799 | | |
Portfolio turnover | | | 27 | % | | | 69 | % | | | 50 | % | | | 110 | % | | | 40 | % | | | 28 | % | | | 46 | % | |
Notes to Financial Highlights
(a) For the period from October 1, 2011 to May 31, 2012. During the period, the Fund's fiscal year end was changed from September 30 to May 31.
(b) Rounds to zero.
(c) In addition to the fees and expenses that the Fund bears directly, the Fund indirectly bears a pro rata share of the fees and expenses of any other funds in which it invests. Such indirect expenses are not included in the Fund's reported expense ratios.
(d) Annualized.
(e) Total net expenses include the impact of certain fee waivers/expense reimbursements made by the Investment Manager and certain of its affiliates, if applicable.
(f) The benefits derived from expense reductions had an impact of less than 0.01%.
The accompanying Notes to Financial Statements are an integral part of this statement.
Semiannual Report 2016
23
COLUMBIA SMALL/MID CAP VALUE FUND
FINANCIAL HIGHLIGHTS (continued)
| | | Six Months Ended
November 30, 2016 | | Year Ended May 31, | | Year Ended
September 30, | |
Class R4 | | (Unaudited) | | 2016 | | 2015 | | 2014 | | 2013 | | 2012(a) | | 2011 | |
Per share data | |
Net asset value, beginning of period | | $ | 8.58 | | | $ | 10.03 | | | $ | 10.79 | | | $ | 10.06 | | | $ | 7.56 | | | $ | 6.41 | | | $ | 6.92 | | |
Income from investment operations: | |
Net investment income | | | 0.02 | | | | 0.04 | | | | 0.02 | | | | 0.04 | | | | 0.08 | | | | 0.02 | | | | 0.01 | | |
Net realized and unrealized gain (loss) | | | 1.06 | | | | (0.96 | ) | | | 0.84 | | | | 1.61 | | | | 2.45 | | | | 1.13 | | | | (0.48 | ) | |
Total from investment operations | | | 1.08 | | | | (0.92 | ) | | | 0.86 | | | | 1.65 | | | | 2.53 | | | | 1.15 | | | | (0.47 | ) | |
Less distributions to shareholders: | |
Net investment income | | | — | | | | — | | | | (0.01 | ) | | | (0.13 | ) | | | (0.03 | ) | | | — | | | | (0.04 | ) | |
Net realized gains | | | — | | | | (0.53 | ) | | | (1.61 | ) | | | (0.79 | ) | | | — | | | | — | | | | — | | |
Total distributions to shareholders | | | — | | | | (0.53 | ) | | | (1.62 | ) | | | (0.92 | ) | | | (0.03 | ) | | | — | | | | (0.04 | ) | |
Net asset value, end of period | | $ | 9.66 | | | $ | 8.58 | | | $ | 10.03 | | | $ | 10.79 | | | $ | 10.06 | | | $ | 7.56 | | | $ | 6.41 | | |
Total return | | | 12.59 | % | | | (8.98 | %) | | | 8.90 | % | | | 16.95 | % | | | 33.59 | % | | | 17.94 | % | | | (6.84 | %) | |
Ratios to average net assets(b) | |
Total gross expenses | | | 1.01 | %(c) | | | 1.00 | % | | | 1.00 | % | | | 1.01 | % | | | 1.18 | % | | | 1.34 | %(c) | | | 1.37 | % | |
Total net expenses(d) | | | 1.01 | %(c)(e) | | | 1.00 | %(e) | | | 1.00 | %(e) | | | 1.00 | %(e) | | | 1.15 | % | | | 1.32 | %(c) | | | 1.37 | % | |
Net investment income | | | 0.45 | %(c) | | | 0.49 | % | | | 0.22 | % | | | 0.36 | % | | | 0.93 | % | | | 0.44 | %(c) | | | 0.16 | % | |
Supplemental data | |
Net assets, end of period
(in thousands) | | $ | 16,724 | | | $ | 13,780 | | | $ | 14,552 | | | $ | 25,924 | | | $ | 29,093 | | | $ | 46,639 | | | $ | 50,329 | | |
Portfolio turnover | | | 27 | % | | | 69 | % | | | 50 | % | | | 110 | % | | | 40 | % | | | 28 | % | | | 46 | % | |
Notes to Financial Highlights
(a) For the period from October 1, 2011 to May 31, 2012. During the period, the Fund's fiscal year end was changed from September 30 to May 31.
(b) In addition to the fees and expenses that the Fund bears directly, the Fund indirectly bears a pro rata share of the fees and expenses of any other funds in which it invests. Such indirect expenses are not included in the Fund's reported expense ratios.
(c) Annualized.
(d) Total net expenses include the impact of certain fee waivers/expense reimbursements made by the Investment Manager and certain of its affiliates, if applicable.
(e) The benefits derived from expense reductions had an impact of less than 0.01%.
The accompanying Notes to Financial Statements are an integral part of this statement.
Semiannual Report 2016
24
COLUMBIA SMALL/MID CAP VALUE FUND
FINANCIAL HIGHLIGHTS (continued)
| | | Six Months Ended
November 30, 2016 | | Year Ended May 31, | | Year Ended
September 30, | |
Class R5 | | (Unaudited) | | 2016 | | 2015 | | 2014 | | 2013 | | 2012(a) | | 2011 | |
Per share data | |
Net asset value, beginning of period | | $ | 8.71 | | | $ | 10.15 | | | $ | 10.90 | | | $ | 10.16 | | | $ | 7.65 | | | $ | 6.50 | | | $ | 7.01 | | |
Income from investment operations: | |
Net investment income | | | 0.03 | | | | 0.05 | | | | 0.03 | | | | 0.06 | | | | 0.11 | | | | 0.05 | | | | 0.05 | | |
Net realized and unrealized gain (loss) | | | 1.06 | | | | (0.96 | ) | | | 0.85 | | | | 1.62 | | | | 2.47 | | | | 1.13 | | | | (0.48 | ) | |
Total from investment operations | | | 1.09 | | | | (0.91 | ) | | | 0.88 | | | | 1.68 | | | | 2.58 | | | | 1.18 | | | | (0.43 | ) | |
Less distributions to shareholders: | |
Net investment income | | | — | | | | — | | | | (0.02 | ) | | | (0.15 | ) | | | (0.07 | ) | | | (0.03 | ) | | | (0.08 | ) | |
Net realized gains | | | — | | | | (0.53 | ) | | | (1.61 | ) | | | (0.79 | ) | | | — | | | | — | | | | — | | |
Total distributions to shareholders | | | — | | | | (0.53 | ) | | | (1.63 | ) | | | (0.94 | ) | | | (0.07 | ) | | | (0.03 | ) | | | (0.08 | ) | |
Net asset value, end of period | | $ | 9.80 | | | $ | 8.71 | | | $ | 10.15 | | | $ | 10.90 | | | $ | 10.16 | | | $ | 7.65 | | | $ | 6.50 | | |
Total return | | | 12.51 | % | | | (8.77 | %) | | | 8.99 | % | | | 17.12 | % | | | 33.98 | % | | | 18.26 | % | | | (6.38 | %) | |
Ratios to average net assets(b) | |
Total gross expenses | | | 0.89 | %(c) | | | 0.89 | % | | | 0.86 | % | | | 0.84 | % | | | 0.85 | % | | | 0.84 | %(c) | | | 0.87 | % | |
Total net expenses(d) | | | 0.89 | %(c) | | | 0.89 | % | | | 0.86 | % | | | 0.84 | % | | | 0.83 | % | | | 0.82 | %(c) | | | 0.87 | % | |
Net investment income | | | 0.56 | %(c) | | | 0.58 | % | | | 0.33 | % | | | 0.53 | % | | | 1.22 | % | | | 0.94 | %(c) | | | 0.67 | % | |
Supplemental data | |
Net assets, end of period
(in thousands) | | $ | 41,105 | | | $ | 35,946 | | | $ | 53,124 | | | $ | 121,576 | | | $ | 228,714 | | | $ | 142,835 | | | $ | 119,293 | | |
Portfolio turnover | | | 27 | % | | | 69 | % | | | 50 | % | | | 110 | % | | | 40 | % | | | 28 | % | | | 46 | % | |
Notes to Financial Highlights
(a) For the period from October 1, 2011 to May 31, 2012. During the period, the Fund's fiscal year end was changed from September 30 to May 31.
(b) In addition to the fees and expenses that the Fund bears directly, the Fund indirectly bears a pro rata share of the fees and expenses of any other funds in which it invests. Such indirect expenses are not included in the Fund's reported expense ratios.
(c) Annualized.
(d) Total net expenses include the impact of certain fee waivers/expense reimbursements made by the Investment Manager and certain of its affiliates, if applicable.
The accompanying Notes to Financial Statements are an integral part of this statement.
Semiannual Report 2016
25
COLUMBIA SMALL/MID CAP VALUE FUND
FINANCIAL HIGHLIGHTS (continued)
| | | Six Months Ended
November 30, 2016 | | Year Ended May 31, | | Year Ended
September 30, | |
Class W | | (Unaudited) | | 2016 | | 2015 | | 2014 | | 2013 | | 2012(a) | | 2011 | |
Per share data | |
Net asset value, beginning of period | | $ | 8.65 | | | $ | 10.12 | | | $ | 10.89 | | | $ | 10.15 | | | $ | 7.65 | | | $ | 6.49 | | | $ | 7.00 | | |
Income from investment operations: | |
Net investment income | | | 0.01 | | | | 0.02 | | | | (0.00 | )(b) | | | 0.01 | | | | 0.07 | | | | 0.03 | | | | 0.02 | | |
Net realized and unrealized gain (loss) | | | 1.06 | | | | (0.96 | ) | | | 0.84 | | | | 1.63 | | | | 2.47 | | | | 1.14 | | | | (0.48 | ) | |
Total from investment operations | | | 1.07 | | | | (0.94 | ) | | | 0.84 | | | | 1.64 | | | | 2.54 | | | | 1.17 | | | | (0.46 | ) | |
Less distributions to shareholders: | |
Net investment income | | | — | | | | — | | | | — | | | | (0.11 | ) | | | (0.04 | ) | | | (0.01 | ) | | | (0.05 | ) | |
Net realized gains | | | — | | | | (0.53 | ) | | | (1.61 | ) | | | (0.79 | ) | | | — | | | | — | | | | — | | |
Total distributions to shareholders | | | — | | | | (0.53 | ) | | | (1.61 | ) | | | (0.90 | ) | | | (0.04 | ) | | | (0.01 | ) | | | (0.05 | ) | |
Net asset value, end of period | | $ | 9.72 | | | $ | 8.65 | | | $ | 10.12 | | | $ | 10.89 | | | $ | 10.15 | | | $ | 7.65 | | | $ | 6.49 | | |
Total return | | | 12.37 | % | | | (9.10 | %) | | | 8.62 | % | | | 16.73 | % | | | 33.37 | % | | | 18.03 | % | | | (6.69 | %) | |
Ratios to average net assets(c) | |
Total gross expenses | | | 1.26 | %(d) | | | 1.25 | % | | | 1.24 | % | | | 1.24 | % | | | 1.28 | % | | | 1.26 | %(d) | | | 1.28 | % | |
Total net expenses(e) | | | 1.26 | %(d)(f) | | | 1.25 | %(f) | | | 1.24 | %(f) | | | 1.24 | %(f) | | | 1.22 | %(f) | | | 1.18 | %(d) | | | 1.28 | % | |
Net investment income (loss) | | | 0.19 | %(d) | | | 0.24 | % | | | (0.04 | %) | | | 0.14 | % | | | 0.80 | % | | | 0.57 | %(d) | | | 0.26 | % | |
Supplemental data | |
Net assets, end of period
(in thousands) | | $ | 2 | | | $ | 2 | | | $ | 2 | | | $ | 3 | | | $ | 5 | | | $ | 4 | | | $ | 3 | | |
Portfolio turnover | | | 27 | % | | | 69 | % | | | 50 | % | | | 110 | % | | | 40 | % | | | 28 | % | | | 46 | % | |
Notes to Financial Highlights
(a) For the period from October 1, 2011 to May 31, 2012. During the period, the Fund's fiscal year end was changed from September 30 to May 31.
(b) Rounds to zero.
(c) In addition to the fees and expenses that the Fund bears directly, the Fund indirectly bears a pro rata share of the fees and expenses of any other funds in which it invests. Such indirect expenses are not included in the Fund's reported expense ratios.
(d) Annualized.
(e) Total net expenses include the impact of certain fee waivers/expense reimbursements made by the Investment Manager and certain of its affiliates, if applicable.
(f) The benefits derived from expense reductions had an impact of less than 0.01%.
The accompanying Notes to Financial Statements are an integral part of this statement.
Semiannual Report 2016
26
COLUMBIA SMALL/MID CAP VALUE FUND
FINANCIAL HIGHLIGHTS (continued)
| | | Six Months Ended
November 30, 2016 | | Year Ended May 31, | |
Class Y | | (Unaudited) | | 2016 | | 2015 | | 2014(a) | |
Per share data | |
Net asset value, beginning of period | | $ | 8.58 | | | $ | 10.01 | | | $ | 10.77 | | | $ | 10.08 | | |
Income from investment operations: | |
Net investment income | | | 0.03 | | | | 0.06 | | | | 0.04 | | | | 0.04 | | |
Net realized and unrealized gain (loss) | | | 1.05 | | | | (0.96 | ) | | | 0.83 | | | | 1.59 | | |
Total from investment operations | | | 1.08 | | | | (0.90 | ) | | | 0.87 | | | | 1.63 | | |
Less distributions to shareholders: | |
Net investment income | | | — | | | | — | | | | (0.02 | ) | | | (0.15 | ) | |
Net realized gains | | | — | | | | (0.53 | ) | | | (1.61 | ) | | | (0.79 | ) | |
Total distributions to shareholders | | | — | | | | (0.53 | ) | | | (1.63 | ) | | | (0.94 | ) | |
Net asset value, end of period | | $ | 9.66 | | | $ | 8.58 | | | $ | 10.01 | | | $ | 10.77 | | |
Total return | | | 12.59 | % | | | (8.80 | %) | | | 9.04 | % | | | 16.73 | % | |
Ratios to average net assets(b) | |
Total gross expenses | | | 0.85 | %(c) | | | 0.85 | % | | | 0.81 | % | | | 0.79 | %(c) | |
Total net expenses(d) | | | 0.85 | %(c) | | | 0.85 | % | | | 0.81 | % | | | 0.78 | %(c) | |
Net investment income | | | 0.60 | %(c) | | | 0.72 | % | | | 0.35 | % | | | 0.37 | %(c) | |
Supplemental data | |
Net assets, end of period (in thousands) | | $ | 1,908 | | | $ | 760 | | | $ | 59 | | | $ | 7,031 | | |
Portfolio turnover | | | 27 | % | | | 69 | % | | | 50 | % | | | 110 | % | |
Notes to Financial Highlights
(a) Based on operations from June 13, 2013 (commencement of operations) through the stated period end.
(b) In addition to the fees and expenses that the Fund bears directly, the Fund indirectly bears a pro rata share of the fees and expenses of any other funds in which it invests. Such indirect expenses are not included in the Fund's reported expense ratios.
(c) Annualized.
(d) Total net expenses include the impact of certain fee waivers/expense reimbursements made by the Investment Manager and certain of its affiliates, if applicable.
The accompanying Notes to Financial Statements are an integral part of this statement.
Semiannual Report 2016
27
COLUMBIA SMALL/MID CAP VALUE FUND
FINANCIAL HIGHLIGHTS (continued)
| | | Six Months Ended
November 30, 2016 | | Year Ended May 31, | | Year Ended
September 30, | |
Class Z | | (Unaudited) | | 2016 | | 2015 | | 2014 | | 2013 | | 2012(a) | | 2011 | |
Per share data | |
Net asset value, beginning of period | | $ | 8.78 | | | $ | 10.24 | | | $ | 10.99 | | | $ | 10.23 | | | $ | 7.71 | | | $ | 6.55 | | | $ | 7.07 | | |
Income from investment operations: | |
Net investment income | | | 0.02 | | | | 0.04 | | | | 0.02 | | | | 0.04 | | | | 0.09 | | | | 0.04 | | | | 0.06 | | |
Net realized and unrealized gain (loss) | | | 1.08 | | | | (0.97 | ) | | | 0.85 | | | | 1.65 | | | | 2.50 | | | | 1.15 | | | | (0.50 | ) | |
Total from investment operations | | | 1.10 | | | | (0.93 | ) | | | 0.87 | | | | 1.69 | | | | 2.59 | | | | 1.19 | | | | (0.44 | ) | |
Less distributions to shareholders: | |
Net investment income | | | — | | | | — | | | | (0.01 | ) | | | (0.14 | ) | | | (0.07 | ) | | | (0.03 | ) | | | (0.08 | ) | |
Net realized gains | | | — | | | | (0.53 | ) | | | (1.61 | ) | | | (0.79 | ) | | | — | | | | — | | | | — | | |
Total distributions to shareholders | | | — | | | | (0.53 | ) | | | (1.62 | ) | | | (0.93 | ) | | | (0.07 | ) | | | (0.03 | ) | | | (0.08 | ) | |
Net asset value, end of period | | $ | 9.88 | | | $ | 8.78 | | | $ | 10.24 | | | $ | 10.99 | | | $ | 10.23 | | | $ | 7.71 | | | $ | 6.55 | | |
Total return | | | 12.53 | % | | | (8.89 | %) | | | 8.82 | % | | | 17.04 | % | | | 33.70 | % | | | 18.18 | % | | | (6.42 | %) | |
Ratios to average net assets(b) | |
Total gross expenses | | | 1.01 | %(c) | | | 1.00 | % | | | 1.00 | % | | | 1.01 | % | | | 1.06 | % | | | 1.04 | %(c) | | | 1.07 | % | |
Total net expenses(d) | | | 1.01 | %(c)(e) | | | 1.00 | %(e) | | | 1.00 | %(e) | | | 1.00 | %(e) | | | 0.97 | %(e) | | | 0.95 | %(c) | | | 1.06 | %(e) | |
Net investment income | | | 0.44 | %(c) | | | 0.48 | % | | | 0.20 | % | | | 0.36 | % | | | 1.07 | % | | | 0.81 | %(c) | | | 0.80 | % | |
Supplemental data | |
Net assets, end of period
(in thousands) | | $ | 27,059 | | | $ | 21,929 | | | $ | 28,575 | | | $ | 31,909 | | | $ | 97,298 | | | $ | 141,202 | | | $ | 127,642 | | |
Portfolio turnover | | | 27 | % | | | 69 | % | | | 50 | % | | | 110 | % | | | 40 | % | | | 28 | % | | | 46 | % | |
Notes to Financial Highlights
(a) For the period from October 1, 2011 to May 31, 2012. During the period, the Fund's fiscal year end was changed from September 30 to May 31.
(b) In addition to the fees and expenses that the Fund bears directly, the Fund indirectly bears a pro rata share of the fees and expenses of any other funds in which it invests. Such indirect expenses are not included in the Fund's reported expense ratios.
(c) Annualized.
(d) Total net expenses include the impact of certain fee waivers/expense reimbursements made by the Investment Manager and certain of its affiliates, if applicable.
(e) The benefits derived from expense reductions had an impact of less than 0.01%.
The accompanying Notes to Financial Statements are an integral part of this statement.
Semiannual Report 2016
28
COLUMBIA SMALL/MID CAP VALUE FUND
NOTES TO FINANCIAL STATEMENTS
November 30, 2016 (Unaudited)
Note 1. Organization
Columbia Small/Mid Cap Value Fund (the Fund), a series of Columbia Funds Series Trust II (the Trust), is a diversified fund. The Trust is registered under the Investment Company Act of 1940, as amended (the 1940 Act), as an open-end management investment company organized as a Massachusetts business trust.
Fund Shares
The Trust may issue an unlimited number of shares (without par value). The Fund offers Class A, Class B, Class C, Class I, Class K, Class R, Class R4, Class R5, Class W, Class Y and Class Z shares. Although all share classes generally have identical voting, dividend and liquidation rights, each share class votes separately when required by the Trust's organizational documents or by law. Different share classes pay different distribution amounts to the extent the expenses of such share classes differ, and distributions in liquidation will be proportional to the net asset value of each share class. Each share class has its own expense and sales charge structure.
Class A shares are subject to a maximum front-end sales charge of 5.75% based on the initial investment amount. Class A shares purchased without an initial sales charge in accounts aggregating $1 million to $50 million at the time of purchase are subject to a contingent deferred sales charge (CDSC) if the shares are sold within 18 months after purchase, charged as follows: 1.00% CDSC if redeemed within 12 months after purchase, and 0.50% CDSC if redeemed more than 12, but less than 18, months after purchase.
Class B shares may be subject to a maximum CDSC of 5.00% based upon the holding period after purchase. Class B shares will generally convert to Class A shares eight years after purchase. The Fund no longer accepts investments by new or existing investors in the Fund's Class B shares, except in connection with the reinvestment of any dividend and/or capital gain distributions in Class B shares of the Fund and exchanges by existing Class B shareholders of certain other funds within the Columbia Family of Funds.
Class C shares are subject to a 1.00% CDSC on shares redeemed within 12 months after purchase.
Class I shares are not subject to sales charges and are available only to the Columbia Family of Funds.
Class K shares are not subject to sales charges, however this share class is closed to new investors.
Class R shares are not subject to sales charges and are generally available only to certain retirement plans and other investors as described in the Fund's prospectus.
Class R4 shares are not subject to sales charges and are generally available only to omnibus retirement plans and certain investors as described in the Fund's prospectus.
Class R5 shares are not subject to sales charges and are generally available only to investors purchasing through authorized investment professionals and omnibus retirement plans.
Class W shares are not subject to sales charges and are generally available only to investors purchasing through authorized investment programs managed by investment professionals, including discretionary managed account programs.
Class Y shares are not subject to sales charges and are generally available only to certain retirement plans as described in the Fund's prospectus.
Class Z shares are not subject to sales charges and are generally available only to eligible investors, which are subject to different investment minimums as described in the Fund's prospectus.
Note 2. Summary of Significant Accounting Policies
Basis of Preparation
The Fund is an investment company that applies the accounting and reporting guidance in the Financial Accounting Standards Board (FASB) Accounting Standards Codification Topic 946, Financial Services — Investment Companies (ASC 946). The financial statements are prepared in accordance with U.S. generally accepted accounting principles (GAAP), which requires management to make certain estimates and assumptions that affect the reported amounts of assets and liabilities, the disclosure of contingent assets and liabilities at the date of the financial statements and the reported amounts of income and expenses during the reporting period. Actual results could differ from those estimates.
The following is a summary of significant accounting policies followed by the Fund in the preparation of its financial statements.
Security Valuation
All equity securities and exchange-traded funds are valued at the close of business of the New York Stock
Semiannual Report 2016
29
COLUMBIA SMALL/MID CAP VALUE FUND
NOTES TO FINANCIAL STATEMENTS (continued)
November 30, 2016 (Unaudited)
Exchange (NYSE). Equity securities and exchange-traded funds are valued at the last quoted sales price on the principal exchange or market on which they trade, except for securities traded on the NASDAQ Stock Market, which are valued at the NASDAQ official close price. Unlisted securities or listed securities for which there were no sales during the day are valued at the mean of the latest quoted bid and ask prices on such exchanges or markets.
Foreign equity securities are valued based on the closing price on the foreign exchange in which such securities are primarily traded. If any foreign equity security closing prices are not readily available, the securities are valued at the mean of the latest quoted bid and ask prices on such exchanges or markets. Foreign currency exchange rates are generally determined at 4:00 p.m. Eastern (U.S.) time. Many securities markets and exchanges outside the U.S. close prior to the close of the NYSE; therefore, the closing prices for securities in such markets or on such exchanges may not fully reflect events that occur after such close but before the close of the NYSE. In those situations, foreign securities will be fair valued pursuant to a policy adopted by the Board of Trustees (the Board), including, if available, utilizing a third party pricing service to determine these fair values. The third party pricing service takes into account multiple factors, including, but not limited to, movements in the U.S. securities markets, certain depositary receipts, futures contracts and foreign exchange rates that have occurred subsequent to the close of the foreign exchange or market, to determine a good faith estimate that reasonably reflects the current market conditions as of the close of the NYSE. The fair value of a security is likely to be different from the quoted or published price, if available.
Investments in open-end investment companies, including money market funds, are valued at their latest net asset value.
Investments for which market quotations are not readily available, or that have quotations which management believes are not reflective of market value or reliable, are valued at fair value as determined in good faith under procedures approved by and under the general supervision of the Board. If a security or class of securities (such as foreign securities) is valued at fair value, such value is likely to be different from the quoted or published price for the security.
The determination of fair value often requires significant judgment. To determine fair value, management may use
assumptions including but not limited to future cash flows and estimated risk premiums. Multiple inputs from various sources may be used to determine fair value.
GAAP requires disclosure regarding the inputs and valuation techniques used to measure fair value and any changes in valuation inputs or techniques. In addition, investments shall be disclosed by major category. This information is disclosed following the Fund's Portfolio of Investments.
Security Transactions
Security transactions are accounted for on the trade date. Cost is determined and gains (losses) are based upon the specific identification method for both financial statement and federal income tax purposes.
Income Recognition
Corporate actions and dividend income are generally recorded net of any non-reclaimable tax withholdings, on the ex-dividend date or upon receipt of ex-dividend notification in the case of certain foreign securities.
The Fund may receive distributions from holdings in equity securities, business development companies (BDCs), exchange-traded funds, other regulated investment companies (RICs), and real estate investment trusts (REITs), which report information on the tax character of their distributions annually. These distributions are allocated to dividend income, capital gain and return of capital based on actual information reported. Return of capital is recorded as a reduction of the cost basis of securities held. If the Fund no longer owns the applicable securities, return of capital is recorded as a realized gain. With respect to REITs, to the extent actual information has not yet been reported, estimates for return of capital are made by the Fund's management. Management's estimates are subsequently adjusted when the actual character of the distributions is disclosed by the REITs, which could result in a proportionate change in return of capital to shareholders.
Awards from class action litigation are recorded as a reduction of cost basis if the Fund still owns the applicable securities on the payment date. If the Fund no longer owns the applicable securities, the proceeds are recorded as realized gains.
Expenses
General expenses of the Trust are allocated to the Fund and other funds of the Trust based upon relative net assets or other expense allocation methodologies
Semiannual Report 2016
30
COLUMBIA SMALL/MID CAP VALUE FUND
NOTES TO FINANCIAL STATEMENTS (continued)
November 30, 2016 (Unaudited)
determined by the nature of the expense. Expenses directly attributable to the Fund are charged to the Fund. Expenses directly attributable to a specific class of shares are charged to that share class.
Determination of Class Net Asset Value
All income, expenses (other than class-specific expenses, which are charged to that share class, as shown in the Statement of Operations) and realized and unrealized gains (losses) are allocated to each class of the Fund on a daily basis, based on the relative net assets of each class, for purposes of determining the net asset value of each class.
Federal Income Tax Status
The Fund intends to qualify each year as a regulated investment company under Subchapter M of the Internal Revenue Code, as amended, and will distribute substantially all of its taxable income (including net short-term capital gains), if any, for its tax year, and as such will not be subject to federal income taxes. In addition, the Fund intends to distribute in each calendar year substantially all of its net investment income, capital gains and certain other amounts, if any, such that the Fund should not be subject to federal excise tax. Therefore, no federal income or excise tax provision is recorded.
Foreign Taxes
The Fund may be subject to foreign taxes on income, gains on investments or currency repatriation, a portion of which may be recoverable. The Fund will accrue such taxes and recoveries, as applicable, based upon its current interpretation of tax rules and regulations that exist in the markets in which it invests.
Realized gains in certain countries may be subject to foreign taxes at the Fund level, based on statutory rates. The Fund accrues for such foreign taxes on realized and unrealized gains at the appropriate rate for each jurisdiction, as applicable. The amount, if any, is disclosed as a liability on the Statement of Assets and Liabilities.
Distributions to Shareholders
Distributions from net investment income, if any, are declared and paid annually. Net realized capital gains, if any, are distributed along with the income distribution. Income distributions and capital gain distributions are determined in accordance with federal income tax regulations, which may differ from GAAP.
Guarantees and Indemnifications
Under the Trust's organizational documents and, in some cases, by contract, its officers and trustees are indemnified against certain liabilities arising out of the performance of their duties to the Trust or its funds. In addition, certain of the Fund's contracts with its service providers contain general indemnification clauses. The Fund's maximum exposure under these arrangements is unknown since the amount of any future claims that may be made against the Fund cannot be determined, and the Fund has no historical basis for predicting the likelihood of any such claims.
Investment Company Reporting Modernization
In October 2016, the U.S. Securities and Exchange Commission adopted new rules and forms, and amendments to certain current rules and forms, to modernize reporting and disclosure of information by registered investment companies. The amendments to Regulation S-X will require standardized, enhanced disclosure about derivatives in investment company financial statements, and will also change the rules governing the form and content of such financial statements. The amendments to Regulation S-X take effect on August 1, 2017. At this time, management is assessing the anticipated impact of these regulatory developments.
Note 3. Fees and Other Transactions with Affiliates
Management Services Fees
The Fund entered into a Management Agreement with Columbia Management Investment Advisers, LLC (the Investment Manager), a wholly-owned subsidiary of Ameriprise Financial, Inc. (Ameriprise Financial). Under the Management Agreement, the Investment Manager provides the Fund with investment research and advice, as well as administrative and accounting services. The management services fee is an annual fee that is equal to a percentage of the Fund's average daily net assets that declines from 0.82% to 0.65% as the Fund's net assets increase. The annualized effective management services fee rate for the six months ended November 30, 2016 was 0.80% of the Fund's average daily net assets.
Other Expenses
Other expenses are for, among other things, miscellaneous expenses of the Fund or the Board, including payments to Board Services Corp., a company providing limited administrative services to the Fund and the Board. That company's expenses include boardroom and office
Semiannual Report 2016
31
COLUMBIA SMALL/MID CAP VALUE FUND
NOTES TO FINANCIAL STATEMENTS (continued)
November 30, 2016 (Unaudited)
expense, employee compensation, employee health and retirement benefits, and certain other expenses.
Compensation of Board Members
Board members, who are not officers or employees of the Investment Manager or Ameriprise Financial, are compensated for their services to the Fund as disclosed in the Statement of Operations. Under a Deferred Compensation Plan (the Plan), these Board members may elect to defer payment of up to 100% of their compensation. Deferred amounts are treated as though equivalent dollar amounts had been invested in shares of certain funds managed by the Investment Manager. The Fund's liability for these amounts is adjusted for market value changes and remains in the Fund until distributed in accordance with the Plan. All amounts payable under the Plan constitute a general unsecured obligation of the Fund.
Compensation of Chief Compliance Officer
The Board has appointed a Chief Compliance Officer to the Fund in accordance with federal securities regulations. The Fund is allocated a portion of the expenses associated with the Chief Compliance Officer based on relative net assets of the Trust.
Transfer Agency Fees
Under a Transfer and Dividend Disbursing Agent Agreement, Columbia Management Investment Services Corp. (the Transfer Agent), an affiliate of the Investment Manager and a wholly-owned subsidiary of Ameriprise Financial, is responsible for providing transfer agency services to the Fund. The Transfer Agent has contracted with Boston Financial Data Services (BFDS) to serve as sub-transfer agent. The Transfer Agent pays the fees of BFDS for services as sub-transfer agent and BFDS is not entitled to reimbursement for such fees from the Fund (with the exception of out-of-pocket fees).
The Fund pays the Transfer Agent a monthly transfer agency fee based on the number or the average value of accounts, depending on the type of account. In addition, prior to October 1, 2016, the Transfer Agent also received sub-transfer agency fees based on a percentage of the average aggregate value of the Fund's shares maintained in omnibus accounts (other than omnibus accounts for which American Enterprise Investment Services Inc. is the broker of record or accounts where the beneficial shareholder is a customer of Ameriprise Financial Services, Inc., for which the Transfer Agent receives a per account fee). Effective October 1, 2016,
the Fund pays the Transfer Agent a fee for shareholder services based on the number of accounts or on a percentage of the average aggregate value of the Fund's shares maintained in omnibus accounts up to the lesser of the amount charged by the servicing agent or a cap established by the Board from time to time.
The Transfer Agent also receives compensation from the Fund for various shareholder services and reimbursements for certain out-of-pocket fees. Effective January 1, 2017, total transfer agency fees for Class K and Class R5 shares are subject to an annual limitation of not more than 0.075% of the average daily net assets attributable to each share class. Total transfer agency fees for Class I and Class Y shares are subject to an annual limitation of not more than 0.025% of the average daily net assets attributable to each share class. Prior to January 1, 2017, total transfer agency fees for Class K and Class R5 shares were subject to an annual limitation of not more than 0.05% of the average daily net assets attributable to each share class. Class I and Class Y shares did not pay transfer agency fees.
For the six months ended November 30, 2016, the Fund's annualized effective transfer agency fee rates as a percentage of average daily net assets of each class were as follows:
Class A | | | 0.16 | % | |
Class B | | | 0.16 | | |
Class C | | | 0.16 | | |
Class K | | | 0.05 | | |
Class R | | | 0.16 | | |
Class R4 | | | 0.16 | | |
Class R5 | | | 0.05 | | |
Class W | | | 0.17 | | |
Class Z | | | 0.16 | | |
An annual minimum account balance fee of $20 may apply to certain accounts with a value below the applicable share class's initial minimum investment requirements to reduce the impact of small accounts on transfer agency fees. These minimum account balance fees are remitted to the Fund and recorded as part of expense reductions in the Statement of Operations. For the six months ended November 30, 2016, these minimum account balance fees reduced total expenses of the Fund by $80.
Plan Administration Fees
Under a Plan Administration Services Agreement with the Transfer Agent, the Fund pays an annual fee at a rate of
Semiannual Report 2016
32
COLUMBIA SMALL/MID CAP VALUE FUND
NOTES TO FINANCIAL STATEMENTS (continued)
November 30, 2016 (Unaudited)
0.25% of the Fund's average daily net assets attributable to Class K shares for the provision of various administrative, recordkeeping, communication and educational services.
Distribution and Service Fees
The Fund has an agreement with Columbia Management Investment Distributors, Inc. (the Distributor), an affiliate of the Investment Manager and a wholly-owned subsidiary of Ameriprise Financial, for distribution and shareholder services. Under a Plan and Agreement of Distribution, the Fund pays a fee at an annual rate of up to 0.25% of the Fund's average daily net assets attributable to Class A and Class W shares, a fee at an annual rate of up to 0.50% of the Fund's average daily net assets attributable to Class R shares (of which up to 0.25% may be used for shareholder services) and a fee at an annual rate of up to 1.00% of the Fund's average daily net assets attributable to Class B and Class C shares. For Class B and Class C shares, of the 1.00% fee, up to 0.75% is reimbursed for distribution expenses.
The amount of distribution and shareholder services expenses incurred by the Distributor and not yet reimbursed (unreimbursed expense) was approximately $1,563,000 and $309,000 for Class B and Class C shares, respectively. These amounts are based on the most recent information available as of September 30, 2016, and may be recovered from future payments under the distribution plan or CDSCs. To the extent the unreimbursed expense has been fully recovered, the distribution and/or shareholder services fee is reduced.
Sales Charges
Sales charges, including front-end charges and CDSCs, received by the Distributor for distributing Fund shares were $87,650 for Class A, $22 for Class B and $828 for Class C shares for the six months ended November 30, 2016.
Expenses Waived/Reimbursed by the Investment Manager and its Affiliates
The Investment Manager and certain of its affiliates have contractually agreed to waive fees and/or reimburse expenses (excluding certain fees and expenses described below) for the period disclosed below, unless sooner terminated at the sole discretion of the Board, so that the Fund's net operating expenses, after giving effect to fees waived/expenses reimbursed and any balance credits and/or overdraft charges from the Fund's
custodian, do not exceed the following annual rates as a percentage of the class' average daily net assets:
| | | Fee Rates Contractual
Through
September 30, 2017 | |
Class A | | | 1.26 | % | |
Class B | | | 2.01 | | |
Class C | | | 2.01 | | |
Class I | | | 0.89 | | |
Class K | | | 1.19 | | |
Class R | | | 1.51 | | |
Class R4 | | | 1.01 | | |
Class R5 | | | 0.94 | | |
Class W | | | 1.26 | | |
Class Y | | | 0.89 | | |
Class Z | | | 1.01 | | |
Under the agreement governing these fee waivers and/or expense reimbursement arrangements, the following fees and expenses are excluded from the waiver/reimbursement commitment, and therefore will be paid by the Fund, if applicable: taxes (including foreign transaction taxes), expenses associated with investments in affiliated and non-affiliated pooled investment vehicles (including mutual funds and exchange-traded funds), transaction costs and brokerage commissions, costs related to any securities lending program, dividend and interest expenses associated with securities sold short, inverse floater program fees and expenses, transaction charges and interest on borrowed money, interest, infrequent and/or unusual expenses and any other expenses the exclusion of which is specifically approved by the Board. This agreement may be modified or amended only with approval from the Investment Manager, certain of its affiliates and the Fund. Any fees waived and/or expenses reimbursed under the expense reimbursement arrangements described above are not recoverable by the Investment Manager or its affiliates in future periods.
Note 4. Federal Tax Information
The timing and character of income and capital gain distributions are determined in accordance with income tax regulations, which may differ from GAAP because of temporary or permanent book to tax differences.
At November 30, 2016, the cost of investments for federal income tax purposes was approximately $682,734,000 and the aggregate gross approximate
Semiannual Report 2016
33
COLUMBIA SMALL/MID CAP VALUE FUND
NOTES TO FINANCIAL STATEMENTS (continued)
November 30, 2016 (Unaudited)
unrealized appreciation and depreciation based on that cost was:
Unrealized appreciation | | $ | 187,440,000 | | |
Unrealized depreciation | | | (10,098,000 | ) | |
Net unrealized appreciation | | $ | 177,342,000 | | |
Under current tax rules, regulated investment companies can elect to treat certain late-year ordinary losses incurred and post-October capital losses (capital losses realized after October 31) as arising on the first day of the following taxable year. The Fund has elected to treat post-October capital losses of $23,015,061 at May 31, 2016 as arising on June 1, 2016.
Management of the Fund has concluded that there are no significant uncertain tax positions in the Fund that would require recognition in the financial statements. However, management's conclusion may be subject to review and adjustment at a later date based on factors including, but not limited to, new tax laws, regulations, and administrative interpretations (including relevant court decisions). Generally, the Fund's federal tax returns for the prior three fiscal years remain subject to examination by the Internal Revenue Service.
Note 5. Portfolio Information
The cost of purchases and proceeds from sales of securities, excluding short-term investments and derivatives, if any, aggregated to $221,646,454 and $321,150,320, respectively, for the six months ended November 30, 2016. The amount of purchase and sale activity impacts the portfolio turnover rate reported in the Financial Highlights.
Note 6. Affiliated Money Market Fund
The Fund invests in Columbia Short-Term Cash Fund, an affiliated money market fund established for the exclusive use by the Fund and other affiliated funds (the Affiliated MMF). The income earned by the Fund from such investments is included as Dividends — affiliated issuers in the Statement of Operations. As an investing fund, the Fund indirectly bears its proportionate share of the expenses of the Affiliated MMF. Effective October 1, 2016, the Affiliated MMF prices its shares with a floating net asset value (NAV) and no longer seeks to maintain a stable NAV. In addition, the Board of the Affiliated MMF may impose a fee on redemptions (sometimes referred to as a liquidity fee) or temporarily suspend redemptions (sometimes referred to as imposing a redemption gate) in the event its liquidity falls below regulatory limits.
Note 7. Line of Credit
The Fund has access to a revolving credit facility with a syndicate of banks led by Citibank, N.A., HSBC Bank USA, N.A. and JPMorgan Chase Bank, N.A. whereby the Fund may borrow for the temporary funding of shareholder redemptions or for other temporary or emergency purposes. The credit facility agreement, which is a collective agreement between the Fund and certain other funds managed by the Investment Manager, severally and not jointly, that permits collective borrowings up to $1 billion. Interest is charged to each participating fund based on its borrowings at a rate equal to the higher of (i) the overnight federal funds rate plus 1.00% or (ii) the one-month LIBOR rate plus 1.00%. Each borrowing under the credit facility matures no later than 60 days after the date of borrowing. The Fund also pays a commitment fee equal to its pro rata share of the amount of the credit facility at a rate of 0.15% per annum. The commitment fee is included in other expenses in the Statement of Operations.
The Fund had no borrowings during the six months ended November 30, 2016.
Note 8. Significant Risks
Shareholder Concentration Risk
At November 30, 2016, affiliated shareholders of record owned 73.8% of the outstanding shares of the Fund in one or more accounts. Subscription and redemption activity by concentrated accounts may have a significant effect on the operations of the Fund. In the case of a large redemption, the Fund may be forced to sell investments at inopportune times, including its liquid or more liquid positions, resulting in Fund losses and the Fund holding a higher percentage of less liquid or illiquid securities. Large redemptions could result in decreased economies of scale and increased operating expenses for non-redeeming Fund shareholders.
Financial Sector Risk
The Fund may be more susceptible to the particular risks that may affect companies in the financial services sector than if it were invested in a wider variety of companies in unrelated sectors. Companies in the financial services sector are subject to certain risks, including the risk of regulatory change, decreased liquidity in credit markets and unstable interest rates. Such companies may have concentrated portfolios, such as a high level of loans to real estate developers, which makes them vulnerable to economic conditions that affect that industry. Performance of such companies may
Semiannual Report 2016
34
COLUMBIA SMALL/MID CAP VALUE FUND
NOTES TO FINANCIAL STATEMENTS (continued)
November 30, 2016 (Unaudited)
be affected by competitive pressures and exposure to investments or agreements that, under certain circumstances, may lead to losses (e.g., subprime loans). Companies in the financial services sector are subject to extensive governmental regulation that may limit the amount and types of loans and other financial commitments they can make, and interest rates and fees that they may charge. In addition, profitability of such companies is largely dependent upon the availability and the cost of capital.
Note 9. Subsequent Events
Management has evaluated the events and transactions that have occurred through the date the financial statements were issued and noted no items requiring adjustment of the financial statements or additional disclosure.
Note 10. Information Regarding Pending and Settled Legal Proceedings
Ameriprise Financial and certain of its affiliates have historically been involved in a number of legal, arbitration and regulatory proceedings, including routine litigation, class actions, and governmental actions, concerning matters arising in connection with the conduct of their business activities. Ameriprise Financial believes that the Funds are not currently the subject of, and that neither Ameriprise Financial nor any of its affiliates are the subject of, any pending legal, arbitration or regulatory proceedings that are likely to have a material adverse effect on the Funds or the ability of Ameriprise Financial or its affiliates to perform under their contracts with the Funds. Ameriprise Financial is required to make quarterly (10-Q), annual (10-K) and, as necessary, 8-K filings with the Securities and Exchange Commission (SEC) on legal and regulatory matters that relate to Ameriprise Financial and its affiliates. Copies of these filings may be obtained by accessing the SEC website at www.sec.gov.
There can be no assurance that these matters, or the adverse publicity associated with them, will not result in increased fund redemptions, reduced sale of fund shares or other adverse consequences to the Funds. Further, although we believe proceedings are not likely to have a material adverse effect on the Funds or the ability of Ameriprise Financial or its affiliates to perform under their contracts with the Funds, these proceedings are subject to uncertainties and, as such, we are unable to estimate the possible loss or range of loss that may result. An adverse outcome in one or more of these
proceedings could result in adverse judgments, settlements, fines, penalties or other relief that could have a material adverse effect on the consolidated financial condition or results of operations of Ameriprise Financial.
Semiannual Report 2016
35
COLUMBIA SMALL/MID CAP VALUE FUND
APPROVAL OF MANAGEMENT AGREEMENT
Columbia Management Investment Advisers, LLC (Columbia Threadneedle or the Investment Manager, and together with its domestic and global affiliates, Columbia Threadneedle Investments), a wholly-owned subsidiary of Ameriprise Financial, Inc. (Ameriprise Financial), serves as the investment manager to Columbia Small/Mid Cap Value Fund (the Fund). Under a management agreement (the Management Agreement), Columbia Threadneedle provides investment advice and other services to the Fund and other funds distributed by Columbia Management Investment Distributors, Inc. (collectively, the Funds).
On an annual basis, the Fund's Board of Trustees (the Board), including the independent Board members (the Independent Trustees), considers renewal of the Management Agreement. Columbia Threadneedle prepared detailed reports for the Board and its Contracts Committee in February, March and April 2016, including reports providing the results of analyses performed by an independent organization, Broadridge Financial Solutions, Inc. (Broadridge), and a comprehensive response to items of information requested by independent legal counsel to the Independent Trustees (Independent Legal Counsel) in a letter to the Investment Manager, to assist the Board in making this determination. Many of the materials presented in February, March and April were first supplied in draft form to designated independent Board representatives, i.e., Independent Legal Counsel, the Chair of the Board and/or the Chair of the Contracts Committee, and the final materials were revised to contain information reflective of discussion and subsequent requests made by the Contracts Committee. In addition, throughout the year, the Board (or its committees) regularly meets with portfolio management teams and senior management personnel and reviews information prepared by Columbia Threadneedle addressing the services Columbia Threadneedle provides and Fund performance. The Board also accords appropriate weight to the work, deliberations and conclusions of the various committees, such as the Contracts Committee, the Investment Review Committee and the Compliance Committee in determining whether to continue the Management Agreement.
The Board, at its June 13-15, 2016 in-person Board meeting (the June Meeting), considered the renewal of the Management Agreement for an additional one-year term. At the June Meeting, Independent Legal Counsel reviewed with the Independent Trustees various factors relevant to the Board's consideration of management agreements and the Board's legal responsibilities related to such consideration. Following an analysis and discussion of the factors identified below, the Board, including all of the Independent Trustees, approved the renewal of the Management Agreement.
Nature, Extent and Quality of Services Provided by Columbia Threadneedle
The Independent Trustees analyzed various reports and presentations they had received detailing the services performed by Columbia Threadneedle, as well as its organization, expertise, resources and capabilities.
The Independent Trustees specifically considered many developments during the past year concerning the services provided by Columbia Threadneedle, including, in particular, the relatively recent change in the leadership of equity department oversight, improvements in technology research and the use of research analysts' model portfolios to highlight best ideas and improve implementation. The Independent Trustees further noted the restructured investment risk management department and its additional resources, including the new head of multi-asset investment risk. They also observed the relatively recent 5P leadership transition, and the additional staff and resources dedicated to the 5P team. The Board also noted the broad scope of services provided by Columbia Threadneedle to each Fund, including, among other services, investment, risk and compliance oversight. The Board also took into account the information it received concerning Columbia Threadneedle's ability to attract and retain key portfolio management personnel.
In connection with the Board's evaluation of the overall package of services provided by Columbia Threadneedle, the Board also considered the nature, quality and range of administrative services provided to the Fund by Columbia Threadneedle, as well as the achievements in 2015 in the performance of administrative services, and noted the various enhancements anticipated for 2016. In evaluating the quality of services provided under the Management Agreement, the Independent Trustees also took into account the organization and strength of the Fund's and its service providers' compliance programs. In addition, the Board reviewed the financial condition of Columbia Threadneedle and its affiliates and each entity's ability to carry out its responsibilities under the
Semiannual Report 2016
36
COLUMBIA SMALL/MID CAP VALUE FUND
APPROVAL OF MANAGEMENT AGREEMENT (continued)
Management Agreement and the Fund's other service agreements with affiliates of Ameriprise Financial, observing the financial strength of Ameriprise Financial, with its solid balance sheet.
The Board also discussed the acceptability of the terms of the Management Agreement (including the relatively broad scope of services required to be performed by Columbia Threadneedle), noting that no material changes are proposed from the form of agreement previously approved. They also noted the wide array of legal and compliance services provided to the Funds. It was also observed that the services being performed under the Management Agreement were of a reasonably high quality.
Based on the foregoing, and based on other information received (both oral and written, including the information on investment performance referenced below) and other considerations, the Board concluded that Columbia Threadneedle and its affiliates are in a position to continue to provide a high quality and level of services to the Fund.
Investment Performance
For purposes of evaluating the nature, extent and quality of services provided under the Management Agreement, the Board carefully reviewed the investment performance of the Fund. In this regard, the Board considered detailed reports providing the results of analyses performed by an independent organization showing, for various periods, the performance of the Fund, the performance of a benchmark index, the percentage ranking of the Fund among its comparison group and the net assets of the Fund. The Board observed the Fund's underperformance for certain periods, noting that appropriate steps (such as changes to the investment strategy) had been taken to help improve the Fund's performance.
Comparative Fees, Costs of Services Provided and the Profits Realized by Columbia Threadneedle and its Affiliates from their Relationships with the Fund
The Board reviewed comparative fees and the costs of services provided under the Management Agreement. The Board members considered detailed comparative information set forth in an annual report on fees and expenses, including, among other things, data (based on analyses conducted by an independent organization) showing a comparison of the Fund's expenses with median expenses paid by funds in its comparative peer universe, as well as data showing the Fund's contribution to Columbia Threadneedle's profitability. The Board reviewed the fees charged to comparable institutional or other accounts/vehicles managed by Columbia Threadneedle and discussed differences in how the products are managed and operated, noting no unreasonable differences in the levels of contractual fees.
The Board considered the reports of its independent fee consultant, JDL Consultants, LLC (JDL), which assisted in its analysis of the Funds' performance and expenses, the reasonableness of the Funds' fee rates, the reasonableness of Columbia Threadneedle's profitability, and JDL's conclusion that the management fees being charged to the Fund are reasonable. The Board accorded particular weight to the notion that the level of fees should generally reflect a rational pricing model applied consistently across the various product lines in the Fund family, while assuring that the overall fees for each Fund (with certain defined exceptions) are generally in line with the "pricing philosophy" currently in effect (i.e., that the total expense ratio of the Fund is generally no higher than the median expense ratio of funds in the comparison universe of the Fund). The Board took into account that the Fund's total expense ratio (after considering proposed expense caps/waivers) approximated the peer universe's median expense ratio. Based on its review, the Board concluded that the Fund's management fee was fair and reasonable in light of the extent and quality of services that the Fund receives.
The Board also considered the expected profitability of Columbia Threadneedle and its affiliates in connection with Columbia Threadneedle providing management services to the Fund. In this regard, the Independent Trustees referred to their detailed analysis of the Profitability Report, discussing the profitability to Columbia Threadneedle and Ameriprise Financial from managing, operating and distributing the Funds. The Board took into account JDL's conclusion that 2015 Columbia Threadneedle profitability, relative to industry competitors, was reasonable. It also considered that in 2015 the Board had concluded that 2014 profitability was reasonable and that Columbia Threadneedle generated 2015 profitability that only slightly exceeded 2014 levels. It also took into account the indirect economic benefits flowing to Columbia Threadneedle or its affiliates in connection with
Semiannual Report 2016
37
COLUMBIA SMALL/MID CAP VALUE FUND
APPROVAL OF MANAGEMENT AGREEMENT (continued)
managing or distributing the Funds, such as the enhanced ability to offer various other financial products to Ameriprise Financial customers, soft dollar benefits and overall reputational advantages. The Board noted that the fees paid by the Fund should permit the Investment Manager to offer competitive compensation to its personnel, make necessary investments in its business and earn an appropriate profit. The Board concluded that profitability levels were reasonable.
Economies of Scale to be Realized
The Board also considered the economies of scale that might be realized by Columbia Threadneedle as the Fund grows and took note of the extent to which Fund shareholders might also benefit from such growth. In this regard, the Board took into account that management fees decline as Fund assets exceed various breakpoints, all of which have not been surpassed. The Board concluded that the breakpoints in the management fee rate schedule satisfactorily provides for the sharing of economies of scale, as they allow for adequate opportunity for shareholders to realize benefits (fee breaks) as Fund assets grow.
Based on the foregoing, the Board, including all of the Independent Trustees, concluded that the management fees were fair and reasonable in light of the extent and quality of services provided. In reaching this conclusion, no single factor was determinative. On June 15, 2016, the Board, including all of the Independent Trustees, approved the renewal of the Management Agreement.
Semiannual Report 2016
38
COLUMBIA SMALL/MID CAP VALUE FUND
IMPORTANT INFORMATION ABOUT THIS REPORT
Each fund mails one shareholder report to each shareholder address. If you would like more than one report, please call shareholder services at 800.345.6611 and additional reports will be sent to you.
The policy of the Board is to vote the proxies of the companies in which each fund holds investments consistent with the procedures as stated in the Statement of Additional Information (SAI). You may obtain a copy of the SAI without charge by calling 800.345.6611; contacting your financial intermediary; visiting investor.columbiathreadneedleus.com; or searching the website of the Securities and Exchange Commission (SEC) at sec.gov. Information regarding how each fund voted proxies relating to portfolio securities is filed with the SEC by August 31st for the most recent 12-month period ending June 30th of that year, and is available without charge by visiting investor.columbiathreadneedleus.com, or searching the website of the SEC at sec.gov.
Each fund files a complete schedule of portfolio holdings with the SEC for the first and third quarters of each fiscal year on Form N-Q. Each fund's Form N-Q is available on the SEC's website at sec.gov and may be reviewed and copied at the SEC's Public Reference Room in Washington, D.C. Information on the operation of the Public Reference Room may be obtained by calling 800.SEC.0330. Each fund's complete schedule of portfolio holdings, as filed on Form N-Q, can also be obtained without charge, upon request, by calling 800.345.6611.
Semiannual Report 2016
39
Columbia Small/Mid Cap Value Fund
P.O. Box 8081
Boston, MA 02266-8081

Please read and consider the investment objectives, risks, charges and expenses for any fund carefully before investing. For a prospectus and summary prospectus, which contains this and other important information about the Fund, go to investor.columbiathreadneedleus.com. The Fund is distributed by Columbia Management Investment Distributors, Inc., member FINRA, and managed by Columbia Management Investment Advisers, LLC.
Columbia Threadneedle Investments (Columbia Threadneedle) is the global brand name of the Columbia and Threadneedle group of companies.
All rights reserved. Columbia Management Investment Distributors, Inc., 225 Franklin Street, Boston, MA 02110-2804
© 2017 Columbia Management Investment Advisers, LLC.
investor.columbiathreadneedleus.com
SAR198_05_G01_(01/17)

SEMIANNUAL REPORT
November 30, 2016

COLUMBIA U.S. GOVERNMENT MORTGAGE FUND

ABOUT COLUMBIA THREADNEEDLE INVESTMENTS
Columbia Threadneedle Investments is a leading global asset management group that provides a broad range of investment strategies and solutions for individual, institutional and corporate clients around the world.
With more than 2,000 people, including over 450 investment professionals based in North America, Europe and Asia, we manage $460 billion* of assets across developed and emerging market equities, fixed income, asset allocation solutions and alternatives. We are the 13th largest manager of long-term mutual fund assets in the U.S.** and the 4th largest manager of retail funds in the U.K.***
Our priority is the investment success of our clients. We aim to deliver the investment outcomes they expect through an investment approach that is team-based, performance-driven and risk-aware. Our culture is dynamic and interactive. By sharing our insights across asset classes and geographies, we generate richer perspectives on global, regional and local investment landscapes. The ability to exchange and debate investment ideas in a collaborative environment enriches our teams' investment processes. More importantly, it results in better informed investment decisions for our clients.
Columbia funds are distributed by Columbia Management Investment Distributors, Inc., member FINRA, and managed by Columbia Management Investment Advisers, LLC.
Columbia Threadneedle Investments (Columbia Threadneedle) is the global brand name of the Columbia and Threadneedle group of companies.
* In U.S. dollars as of June 30, 2016. Source: Ameriprise Q2 Earnings Release. Includes all assets managed by entities in the Columbia and Threadneedle group of companies. Contact us for more current data.
** Source: ICI as of June 30, 2016 for Columbia Management Investment Advisers, LLC.
*** Source: Investment Association as of March 2016 for Threadneedle Asset Management Limited.
© 2016 Columbia Management Investment Advisers, LLC. All rights reserved.
Not part of the shareholder report
 Dear Shareholders,
While emotions have run high following the outcome of the U.S. Presidential election, it remains unclear how the Trump presidency will unfold in terms of policy. We have a sense of the priorities espoused by the president-elect over the past eighteen months, but campaign priorities are not always realized and are often never pursued. What seems certain is that, while some investors have already priced expectations into the market, others have retreated, preferring instead a wait and see approach. The outcome of such behaviors appears to have created conditions ripe for ongoing market volatility.
While volatility in the financial markets can be stressful, volatility itself is not a new phenomenon. Other factors that have been at the root cause of recent volatility include uncertainty following the United Kingdom's vote to exit the European Union (Brexit), speculation around the Federal Reserve's decision to increase interest rates, divergent central bank policy and geopolitical unrest. The point is, financial markets have fluctuated for years and may be expected to continue to fluctuate — sometimes wildly. If anything, such volatility seems to be the new normal, perhaps exacerbated by access to information and development of technological tools which have enabled investors to react rapidly to real and perceived change. So what can you do?
Position your portfolio for the reality of market volatility
That there is a historical precedent for market volatility, or even an acceptance that it may persist, offers little comfort. A measured and strategic approach remains the best strategy for investors to stay on track in achieving their investment goals.
Step 1: Review your investment goals
Take this opportunity to review your investment goals and the strategies you are pursuing to achieve those goals in order to remain focused on what's important to you. It is entirely possible that your goals have changed in response either to your life situation or to changes in the market. Accept what you can't control — volatility, and focus on what you can — your investment goals and strategies.
Step 2: Reassess your risk tolerance
Sit down with your financial advisor to discuss your investment goals and strategies, as well as any changes to your tolerance for risk. Consider your investment horizon. Increased market volatility and a new investment horizon may impact the strategies that can best help you achieve your investment goals. Remember, achieving your investment goals may require a certain amount of risk. Ultimately, you must maintain vigilance in reassessing your risk tolerance and the strategies you have selected in pursuit of your investment goals, and awareness of how those strategies may react to market volatility.
Step 3: Remain calm and focus on your long-term plan
Remember, investing is about the long game. Short term events are not necessarily evidence of a longer term reality. Investors who attempt to time the market too often end up reacting to a down turn by selling low and then compounding the problem by waiting on the sidelines, ultimately missing the right opportunity to reinvest.
As long as there is a market, there will be volatility. How you respond to that volatility can make a big difference in the measure of your success as an investor. Talk to your financial advisor about how working with Columbia Threadneedle Investments may help you position your portfolio for the reality of ongoing volatility and, perhaps, even turn such volatility into investment opportunity.
Best regards,

Christopher O. Petersen
President, Columbia Funds
Investors should consider the investment objectives, risks, charges and expenses of a mutual fund carefully before investing. For a free prospectus and summary prospectus, which contains this and other important information about a fund, visit investor.columbiathreadneedleus.com. The prospectus should be read carefully before investing.
Columbia Funds are distributed by Columbia Management Investment Distributors, Inc., member FINRA, and managed by Columbia Management Investment Advisers, LLC.
© 2017 Columbia Management Investment Advisers, LLC. All rights reserved.
COLUMBIA U.S. GOVERNMENT MORTGAGE FUND
Fund Investment Manager
Columbia Management Investment
Advisers, LLC
225 Franklin Street
Boston, MA 02110
Fund Distributor
Columbia Management Investment
Distributors, Inc.
225 Franklin Street
Boston, MA 02110
Fund Transfer Agent
Columbia Management Investment
Services Corp.
P.O. Box 8081
Boston, MA 02266-8081
For more information about any of the funds, please visit investor.columbiathreadneedleus.com or call 800.345.6611. Customer Service Representatives are available to answer your questions Monday through Friday from 8 a.m. to 7 p.m. Eastern time.
The views expressed in this report reflect the current views of the respective parties. These views are not guarantees of future performance and involve certain risks, uncertainties and assumptions that are difficult to predict, so actual outcomes and results may differ significantly from the views expressed. These views are subject to change at any time based upon economic, market or other conditions and the respective parties disclaim any responsibility to update such views. These views may not be relied on as investment advice and, because investment decisions for a Columbia fund are based on numerous factors, may not be relied on as an indication of trading intent on behalf of any particular Columbia fund. References to specific securities should not be construed as a recommendation or investment advice.
Performance Overview | | | 3 | | |
Portfolio Overview | | | 4 | | |
Understanding Your Fund's Expenses | | | 5 | | |
Portfolio of Investments | | | 6 | | |
Statement of Assets and Liabilities | | | 18 | | |
Statement of Operations | | | 21 | | |
Statement of Changes in Net Assets | | | 22 | | |
Financial Highlights | | | 25 | | |
Notes to Financial Statements | | | 36 | | |
Approval of Management Agreement | | | 50 | | |
Important Information About This Report | | | 53 | | |
COLUMBIA U.S. GOVERNMENT MORTGAGE FUND
PERFORMANCE OVERVIEW
(Unaudited)
Performance Summary
n Columbia U.S. Government Mortgage Fund (the Fund) Class A shares returned -0.01% excluding sales charges for the six-month period that ended November 30, 2016.
n During the same six-month period, the Fund outperformed its benchmark, the Bloomberg Barclays U.S. Mortgage-Backed Securities Index, which returned -0.59%.
Average Annual Total Returns (%) (for period ended November 30, 2016)
| | | Inception | | 6 Months
Cumulative | | 1 Year | | 5 Years | | 10 Years | |
Class A | | 02/14/02 | | | | | | | | | | | | | | | | | |
Excluding sales charges | | | | | | | -0.01 | | | | 2.02 | | | | 2.85 | | | | 4.62 | | |
Including sales charges | | | | | | | -3.02 | | | | -1.07 | | | | 2.22 | | | | 4.29 | | |
Class B | | 02/14/02 | | | | | | | | | | | | | | | | | |
Excluding sales charges | | | | | | | -0.38 | | | | 1.08 | | | | 2.04 | | | | 3.83 | | |
Including sales charges | | | | | | | -5.31 | | | | -3.88 | | | | 1.68 | | | | 3.83 | | |
Class C | | 02/14/02 | | | | | | | | | | | | | | | | | |
Excluding sales charges | | | | | | | -0.38 | | | | 1.27 | | | | 2.08 | | | | 3.85 | | |
Including sales charges | | | | | | | -1.36 | | | | 0.27 | | | | 2.08 | | | | 3.85 | | |
Class I | | 03/04/04 | | | 0.37 | | | | 2.45 | | | | 3.24 | | | | 5.04 | | |
Class K | | 02/14/02 | | | 0.04 | | | | 2.14 | | | | 2.89 | | | | 4.92 | | |
Class R* | | 03/01/16 | | | 0.05 | | | | 1.93 | | | | 2.54 | | | | 4.28 | | |
Class R4* | | 11/08/12 | | | 0.30 | | | | 2.29 | | | | 3.05 | | | | 4.72 | | |
Class R5* | | 11/08/12 | | | 0.16 | | | | 2.39 | | | | 3.13 | | | | 4.76 | | |
Class W* | | 06/18/12 | | | -0.01 | | | | 2.03 | | | | 2.88 | | | | 4.60 | | |
Class Y* | | 10/01/14 | | | 0.19 | | | | 2.45 | | | | 3.02 | | | | 4.70 | | |
Class Z* | | 09/27/10 | | | 0.30 | | | | 2.29 | | | | 3.11 | | | | 4.80 | | |
Bloomberg Barclays U.S. Mortgage-Backed Securities Index | | | | | | | -0.59 | | | | 1.64 | | | | 2.20 | | | | 4.25 | | |
Returns for Class A are shown with and without the maximum initial sales charge of 3.00%. Returns for Class B are shown with and without the applicable contingent deferred sales charge (CDSC) of 5.00% in the first year, declining to 1.00% in the sixth year and eliminated thereafter. Returns for Class C are shown with and without the 1.00% CDSC for the first year only. The Fund's other classes are not subject to sales charges and have limited eligibility. Please see the Fund's prospectus for details. Performance for different share classes will vary based on differences in sales charges and fees associated with each class. All results shown assume reinvestment of distributions during the period. Returns do not reflect the deduction of taxes that a shareholder may pay on Fund distributions or on the redemption of Fund shares. Performance results reflect the effect of any fee waivers or reimbursements of Fund expenses by Columbia Management Investment Advisers, LLC and/or any of its affiliates. Absent these fee waivers or expense reimbursement arrangements, performance results would have been lower.
The performance information shown represents past performance and is not a guarantee of future results. The investment return and principal value of your investment will fluctuate so that your shares, when redeemed, may be worth more or less than their original cost. Current performance may be lower or higher than the performance information shown. You may obtain performance information current to the most recent month-end by contacting your financial intermediary, visiting investor.columbiathreadneedleus.com or calling 800.345.6611.
*The returns shown for periods prior to the share class inception date (including returns for the Life of the Fund, if shown, which are since Fund inception) include the returns of the Fund's oldest share class. Since the Fund launched more than one share class at its inception, Class A shares were used. These returns are adjusted to reflect any higher class-related operating expenses of the newer share classes, as applicable. Please visit investor.columbiathreadneedleus.com/investment-products/mutual-funds/appended-performance for more information.
The Bloomberg Barclays U.S. Mortgage-Backed Securities Index is composed of all mortgage-backed pass-through securities of Ginnie Mae (GNMA), Fannie Mae (FNMA), and Freddie Mac (FHLMC).
Indices are not available for investment, are not professionally managed and do not reflect sales charges, fees, brokerage commissions, taxes or other expenses of investing. Securities in the Fund may not match those in an index.
Semiannual Report 2016
3
COLUMBIA U.S. GOVERNMENT MORTGAGE FUND
PORTFOLIO OVERVIEW
(Unaudited)
Portfolio Management
Jason Callan
Tom Heuer, CFA
Portfolio Breakdown (%)
(at November 30, 2016) | |
Asset-Backed Securities — Non-Agency | | | 5.3 | | |
Commercial Mortgage-Backed Securities — Agency | | | 0.5 | | |
Commercial Mortgage-Backed Securities — Non-Agency | | | 3.4 | | |
Money Market Funds | | | 0.4 | | |
Options Purchased Puts | | | 0.7 | | |
Repurchase Agreements | | | 2.1 | | |
Residential Mortgage-Backed Securities — Agency | | | 78.4 | | |
Residential Mortgage-Backed Securities — Non-Agency | | | 9.2 | | |
Total | | | 100.0 | | |
Percentages indicated are based upon total investments. The Fund's portfolio composition is subject to change.
Quality Breakdown (%)
(at November 30, 2016) | |
AAA rating | | | 82.0 | | |
AA rating | | | 1.5 | | |
A rating | | | 1.9 | | |
BBB rating | | | 2.6 | | |
BB rating | | | 2.4 | | |
B rating | | | 0.7 | | |
CCC rating | | | 0.0 | (a) | |
Not rated | | | 8.9 | | |
Total | | | 100.0 | | |
Percentages indicated are based upon total fixed income investments (excluding Money Market Funds).
(a) Rounds to zero.
Bond ratings apply to the underlying holdings of the Fund and not the Fund itself and are divided into categories ranging from highest to lowest credit quality, determined by using the middle rating of Moody's, S&P and Fitch, after dropping the highest and lowest available ratings. When ratings are available from only two rating agencies, the lower rating is used. When a rating is available from only one rating agency, that rating is used. When a bond is not rated by any rating agency, it is designated as "Not rated." Credit quality ratings assigned by a rating agency are subjective opinions, not statements of fact, and are subject to change, including daily. The ratings assigned by credit rating agencies are but one of the considerations that the Investment Manager and/or Fund's subadviser incorporates into its credit analysis process, along with such other issuer-specific factors as cash flows, capital structure and leverage ratios, ability to de-leverage (repay) through free cash flow, quality of management, market positioning and access to capital, as well as such security-specific factors as the terms of the security (e.g., interest rate and time to maturity) and the amount and type of any collateral.
Semiannual Report 2016
4
COLUMBIA U.S. GOVERNMENT MORTGAGE FUND
UNDERSTANDING YOUR FUND'S EXPENSES
(Unaudited)
As an investor, you incur two types of costs. There are transaction costs, which generally include sales charges on purchases and may include redemption fees. There are also ongoing costs, which generally include management fees, distribution and/or service fees, and other fund expenses. The following information is intended to help you understand your ongoing costs (in dollars) of investing in the Fund and to help you compare these costs with the ongoing costs of investing in other mutual funds.
Analyzing Your Fund's Expenses
To illustrate these ongoing costs, we have provided examples and calculated the expenses paid by investors in each share class of the Fund during the period. The actual and hypothetical information in the table is based on an initial investment of $1,000 at the beginning of the period indicated and held for the entire period. Expense information is calculated two ways and each method provides you with different information. The amount listed in the "Actual" column is calculated using the Fund's actual operating expenses and total return for the period. You may use the Actual information, together with the amount invested, to estimate the expenses that you paid over the period. Simply divide your account value by $1,000 (for example, an $8,600 account value divided by $1,000 = 8.6), then multiply the results by the expenses paid during the period under the "Actual" column. The amount listed in the "Hypothetical" column assumes a 5% annual rate of return before expenses (which is not the Fund's actual return) and then applies the Fund's actual expense ratio for the period to the hypothetical return. You should not use the hypothetical account values and expenses to estimate either your actual account balance at the end of the period or the expenses you paid during the period. See "Compare With Other Funds" below for details on how to use the hypothetical data.
Compare With Other Funds
Since all mutual funds are required to include the same hypothetical calculations about expenses in shareholder reports, you can use this information to compare the ongoing cost of investing in the Fund with other funds. To do so, compare the hypothetical example with the 5% hypothetical examples that appear in the shareholder reports of other funds. As you compare hypothetical examples of other funds, it is important to note that hypothetical examples are meant to highlight the ongoing costs of investing in a fund only and do not reflect any transaction costs, such as sales charges, or redemption or exchange fees. Therefore, the hypothetical calculations are useful in comparing ongoing costs only, and will not help you determine the relative total costs of owning different funds. If transaction costs were included in these calculations, your costs would be higher.
June 1, 2016 – November 30, 2016
| | | Account Value at the Beginning
of the Period ($) | | Account Value at the End of the
Period ($) | | Expenses Paid During the
Period ($) | | Fund's Annualized
Expense Ratio (%) | |
| | | Actual | | Hypothetical | | Actual | | Hypothetical | | Actual | | Hypothetical | | Actual | |
Class A | | | 1,000.00 | | | | 1,000.00 | | | | 999.90 | | | | 1,020.56 | | | | 4.51 | | | | 4.56 | | | | 0.90 | | |
Class B | | | 1,000.00 | | | | 1,000.00 | | | | 996.20 | | | | 1,016.80 | | | | 8.26 | | | | 8.34 | | | | 1.65 | | |
Class C | | | 1,000.00 | | | | 1,000.00 | | | | 996.20 | | | | 1,016.80 | | | | 8.26 | | | | 8.34 | | | | 1.65 | | |
Class I | | | 1,000.00 | | | | 1,000.00 | | | | 1,003.70 | | | | 1,022.56 | | | | 2.51 | | | | 2.54 | | | | 0.50 | | |
Class K | | | 1,000.00 | | | | 1,000.00 | | | | 1,000.40 | | | | 1,021.06 | | | | 4.01 | | | | 4.05 | | | | 0.80 | | |
Class R | | | 1,000.00 | | | | 1,000.00 | | | | 1,000.50 | | | | 1,019.30 | | | | 5.77 | | | | 5.82 | | | | 1.15 | | |
Class R4 | | | 1,000.00 | | | | 1,000.00 | | | | 1,003.00 | | | | 1,021.81 | | | | 3.26 | | | | 3.29 | | | | 0.65 | | |
Class R5 | | | 1,000.00 | | | | 1,000.00 | | | | 1,001.60 | | | | 1,022.31 | | | | 2.76 | | | | 2.79 | | | | 0.55 | | |
Class W | | | 1,000.00 | | | | 1,000.00 | | | | 999.90 | | | | 1,020.56 | | | | 4.51 | | | | 4.56 | | | | 0.90 | | |
Class Y | | | 1,000.00 | | | | 1,000.00 | | | | 1,001.90 | | | | 1,022.56 | | | | 2.51 | | | | 2.54 | | | | 0.50 | | |
Class Z | | | 1,000.00 | | | | 1,000.00 | | | | 1,003.00 | | | | 1,021.81 | | | | 3.26 | | | | 3.29 | | | | 0.65 | | |
Expenses paid during the period are equal to the annualized expense ratio for each class as indicated above, multiplied by the average account value over the period and then multiplied by the number of days in the Fund's most recent fiscal half year and divided by 365.
Expenses do not include fees and expenses incurred indirectly by the Fund from its investment in underlying funds, including affiliated and non-affiliated pooled investment vehicles, such as mutual funds and exchange-traded funds.
Had Columbia Management Investment Advisers, LLC and/or certain of its affiliates not waived/reimbursed certain fees and expenses, account value at the end of the period would have been reduced.
Semiannual Report 2016
5
COLUMBIA U.S. GOVERNMENT MORTGAGE FUND
PORTFOLIO OF INVESTMENTS
November 30, 2016 (Unaudited)
(Percentages represent value of investments compared to net assets)
Residential Mortgage-Backed Securities —
Agency(a) 100.2%
Issuer | | Coupon
Rate | | Principal
Amount ($) | | Value ($) | |
Federal Home Loan Mortgage Corp.
12/01/16 - 04/01/22 | | | 6.500 | % | | | 37,606 | | | | 39,905 | | |
04/01/17 | | | 7.000 | % | | | 2,652 | | | | 2,661 | | |
10/01/17 - 06/01/31 | | | 8.000 | % | | | 137,572 | | | | 157,079 | | |
01/01/20 | | | 10.500 | % | | | 6,938 | | | | 6,990 | | |
10/01/24 - 04/01/40 | | | 5.000 | % | | | 12,538,676 | | | | 13,900,029 | | |
01/01/30 - 06/01/33 | | | 5.500 | % | | | 7,362,172 | | | | 8,200,750 | | |
04/01/33 - 11/01/37 | | | 6.000 | % | | | 3,462,991 | | | | 4,012,796 | | |
07/01/39 - 08/01/46 | | | 4.500 | % | | | 37,018,015 | | | | 40,105,110 | | |
04/01/41 - 06/01/46 | | | 4.000 | % | | | 193,495,456 | | | | 204,218,690 | | |
01/01/42 - 04/01/46 | | | 3.500 | % | | | 327,087,479 | | | | 337,287,985 | | |
Federal Home Loan Mortgage Corp.(b)
CMO Series 4119 Class SP
10/15/42 | | | 2.264 | % | | | 2,173,560 | | | | 2,266,393 | | |
Federal Home Loan Mortgage Corp.(b)(c)
CMO IO STRIPS Series 280 Class S1
09/15/42 | | | 5.462 | % | | | 17,144,993 | | | | 3,580,285 | | |
CMO IO STRIPS Series 309 Class S4
08/15/43 | | | 5.432 | % | | | 18,304,214 | | | | 4,030,052 | | |
CMO IO STRIPS Series 312 Class S1
09/15/43 | | | 5.412 | % | | | 11,052,374 | | | | 2,454,568 | | |
CMO IO STRIPS Series 326 Class S1
03/15/44 | | | 5.462 | % | | | 7,755,416 | | | | 1,655,517 | | |
CMO IO STRIPS Series 337 Class S1
09/15/44 | | | 5.512 | % | | | 14,911,594 | | | | 3,275,035 | | |
CMO IO Series 264 Class S1
07/15/42 | | | 5.412 | % | | | 16,464,242 | | | | 3,304,374 | | |
CMO IO Series 272 Class S1
08/15/42 | | | 5.462 | % | | | 35,200,661 | | | | 7,629,018 | | |
CMO IO Series 2957 Class SW
04/15/35 | | | 5.462 | % | | | 2,167,139 | | | | 343,166 | | |
CMO IO Series 311 Class S1
08/15/43 | | | 5.412 | % | | | 27,328,594 | | | | 5,722,551 | | |
CMO IO Series 318 Class S1
11/15/43 | | | 5.412 | % | | | 14,598,638 | | | | 3,177,586 | | |
CMO IO Series 326 Class S2
03/15/44 | | | 5.412 | % | | | 2,271,562 | | | | 480,495 | | |
CMO IO Series 3280 Class SI
02/15/37 | | | 5.902 | % | | | 1,439,177 | | | | 151,070 | | |
CMO IO Series 336 Class 30
08/15/44 | | | 5.512 | % | | | 11,772,252 | | | | 2,705,248 | | |
CMO IO Series 342 Class S7
02/15/45 | | | 5.572 | % | | | 13,331,291 | | | | 2,914,127 | | |
CMO IO Series 3453 Class W
12/15/32 | | | 6.865 | % | | | 6,604,941 | | | | 1,143,776 | | |
CMO IO Series 3630 Class AI
03/15/17 | | | 1.931 | % | | | 214,374 | | | | 636 | | |
CMO IO Series 3761 Class KS
06/15/40 | | | 5.462 | % | | | 1,758,455 | | | | 144,755 | | |
CMO IO Series 3913 Class SW
09/15/40 | | | 6.062 | % | | | 5,103,288 | | | | 756,005 | | |
CMO IO Series 4068 Class GI
09/15/36 | | | 2.094 | % | | | 16,767,395 | | | | 1,131,932 | | |
CMO IO Series 4094 Class SY
08/15/42 | | | 5.542 | % | | | 17,542,086 | | | | 3,725,111 | | |
Residential Mortgage-Backed Securities — Agency(a) (continued)
Issuer | | Coupon
Rate | | Principal
Amount ($) | | Value ($) | |
CMO IO Series 4107 Class KS
06/15/38 | | | 1.925 | % | | | 12,525,654 | | | | 767,303 | | |
CMO IO Series 4174 Class SB
05/15/39 | | | 5.662 | % | | | 24,507,875 | | | | 3,491,113 | | |
CMO IO Series 4183 Class AS
04/15/39 | | | 5.612 | % | | | 7,815,625 | | | | 1,061,384 | | |
CMO IO Series 4223 Class DS
12/15/38 | | | 5.562 | % | | | 5,075,759 | | | | 680,770 | | |
CMO IO Series 4286 Class NS
12/15/43 | | | 5.362 | % | | | 6,430,597 | | | | 1,472,247 | | |
CMO IO Series 4594 Class SA
06/15/46 | | | 5.412 | % | | | 15,042,730 | | | | 3,363,445 | | |
CMO IO Series 4620 Class AS
11/15/42 | | | 1.851 | % | | | 29,306,398 | | | | 1,876,117 | | |
Federal Home Loan Mortgage Corp.(c)
CMO IO Series 304 Class C69
12/15/42 | | | 4.000 | % | | | 6,952,912 | | | | 1,332,757 | | |
CMO IO Series 329 Class C5
06/15/43 | | | 3.500 | % | | | 9,184,449 | | | | 1,641,254 | | |
CMO IO Series 3786 Class PI
12/15/37 | | | 4.500 | % | | | 3,270,571 | | | | 156,413 | | |
CMO IO Series 3800 Class HI
01/15/40 | | | 4.500 | % | | | 4,441,232 | | | | 522,710 | | |
CMO IO Series 3807 Class NI
11/15/35 | | | 4.500 | % | | | 6,947,787 | | | | 207,098 | | |
CMO IO Series 4098 Class AI
05/15/39 | | | 3.500 | % | | | 9,166,744 | | | | 950,210 | | |
CMO IO Series 4120 Class AI
11/15/39 | | | 3.500 | % | | | 10,204,941 | | | | 1,184,170 | | |
CMO IO Series 4121 Class IA
01/15/41 | | | 3.500 | % | | | 10,059,494 | | | | 1,351,867 | | |
CMO IO Series 4122 Class JI
12/15/40 | | | 4.000 | % | | | 7,968,817 | | | | 921,139 | | |
CMO IO Series 4139 Class CI
05/15/42 | | | 3.500 | % | | | 6,699,143 | | | | 921,897 | | |
CMO IO Series 4147 Class CI
01/15/41 | | | 3.500 | % | | | 11,617,180 | | | | 1,621,268 | | |
CMO IO Series 4148 Class BI
02/15/41 | | | 4.000 | % | | | 8,087,702 | | | | 1,004,594 | | |
CMO IO Series 4177 Class IY
03/15/43 | | | 4.000 | % | | | 15,061,693 | | | | 3,221,190 | | |
CMO IO Series 4182 Class DI
05/15/39 | | | 3.500 | % | | | 19,971,715 | | | | 2,314,061 | | |
CMO IO Series 4213 Class DI
06/15/38 | | | 3.500 | % | | | 14,311,299 | | | | 1,523,132 | | |
CMO IO Series 4215 Class IL
07/15/41 | | | 3.500 | % | | | 12,959,747 | | | | 1,509,812 | | |
Federal Home Loan Mortgage Corp.(d) | |
12/13/46 | | | 3.000 | % | | | 64,000,000 | | | | 63,715,002 | | |
12/13/46 | | | 4.000 | % | | | 9,500,000 | | | | 9,995,966 | | |
Federal National Mortgage Association
03/01/17 - 10/01/37 | | | 6.500 | % | | | 6,236,089 | | | | 7,144,759 | | |
02/01/18 | | | 7.500 | % | | | 297 | | | | 299 | | |
11/01/22 - 09/01/36 | | | 6.000 | % | | | 1,345,938 | | | | 1,539,228 | | |
03/01/23 - 04/01/41 | | | 5.500 | % | | | 9,255,686 | | | | 10,615,123 | | |
The accompanying Notes to Financial Statements are an integral part of this statement.
Semiannual Report 2016
6
COLUMBIA U.S. GOVERNMENT MORTGAGE FUND
PORTFOLIO OF INVESTMENTS (continued)
November 30, 2016 (Unaudited)
Residential Mortgage-Backed Securities — Agency(a) (continued)
Issuer | | Coupon
Rate | | Principal
Amount ($) | | Value ($) | |
06/01/25 - 06/01/44 | | | 4.500 | % | | | 144,560,820 | | | | 157,520,648 | | |
02/01/27 - 05/01/43 | | | 3.000 | % | | | 113,575,463 | | | | 114,510,800 | | |
05/01/27 | | | 2.500 | % | | | 14,372,167 | | | | 14,471,766 | | |
04/01/29 - 09/01/41 | | | 5.000 | % | | | 55,601,842 | | | | 61,659,642 | | |
10/01/31 | | | 9.500 | % | | | 82,040 | | | | 86,620 | | |
11/01/37 | | | 8.500 | % | | | 34,259 | | | | 39,051 | | |
11/01/40 - 08/01/45 | | | 4.000 | % | | | 113,080,299 | | | | 119,679,123 | | |
03/01/42 - 10/01/46 | | | 3.500 | % | | | 246,128,374 | | | | 253,668,829 | | |
Federal National Mortgage Association(b)(c) | |
CMO IO Series 2003-117 Class KS
08/25/33 | | | 6.516 | % | | | 1,594,376 | | | | 58,903 | | |
CMO IO Series 2005-74 Class NI
05/25/35 | | | 5.496 | % | | | 21,006,779 | | | | 2,928,641 | | |
CMO IO Series 2006-5 Class N1
08/25/34 | | | 0.000 | % | | | 13,238,681 | | | | 891 | | |
CMO IO Series 2006-5 Class N2
02/25/35 | | | 2.026 | % | | | 52,660,642 | | | | 1,458,452 | | |
CMO IO Series 2007-54 Class DI
06/25/37 | | | 5.516 | % | | | 15,955,734 | | | | 2,971,502 | | |
CMO IO Series 2011-94 Class GS
10/25/41 | | | 5.916 | % | | | 27,175,865 | | | | 4,730,054 | | |
CMO IO Series 2012-80 Class DS
06/25/39 | | | 6.066 | % | | | 7,364,768 | | | | 1,102,096 | | |
CMO IO Series 2013-107 Class SB
02/25/43 | | | 5.366 | % | | | 30,210,373 | | | | 7,137,031 | | |
CMO IO Series 2013-13 Class SA
03/25/43 | | | 5.566 | % | | | 17,719,066 | | | | 4,009,398 | | |
CMO IO Series 2013-97 Class SB
06/25/32 | | | 5.516 | % | | | 11,459,232 | | | | 1,361,185 | | |
CMO IO Series 2014-93 Class ES
01/25/45 | | | 5.566 | % | | | 22,893,751 | | | | 5,490,594 | | |
CMO IO Series 2016-25 Class SL
05/25/46 | | | 5.416 | % | | | 32,930,768 | | | | 8,031,920 | | |
CMO IO Series 2016-39 Class LS
07/25/46 | | | 5.416 | % | | | 35,234,603 | | | | 8,456,122 | | |
CMO IO Series 2016-4 Class BS
02/25/46 | | | 5.516 | % | | | 15,309,974 | | | | 3,589,601 | | |
CMO IO Series 2016-40 Class JS
07/25/46 | | | 5.416 | % | | | 21,082,839 | | | | 5,230,815 | | |
CMO IO Series 2016-42 Class SB
07/25/46 | | | 5.416 | % | | | 41,028,355 | | | | 9,910,567 | | |
CMO IO Series 2016-45 Class AS
07/25/46 | | | 5.416 | % | | | 24,484,124 | | | | 5,691,352 | | |
CMO IO Series 2016-49 Class LS
08/25/46 | | | 5.366 | % | | | 14,723,697 | | | | 3,356,121 | | |
CMO IO Series 2016-50 Class GS
08/25/46 | | | 5.366 | % | | | 22,679,443 | | | | 5,084,915 | | |
CMO IO Series 2016-53 Class KS
08/25/46 | | | 5.416 | % | | | 32,522,554 | | | | 7,798,310 | | |
CMO IO Series 2016-62 Class AS
09/25/46 | | | 1.901 | % | | | 51,102,747 | | | | 3,257,739 | | |
CMO IO Series 416 Class S1
11/25/42 | | | 5.516 | % | | | 10,196,172 | | | | 2,131,218 | | |
Residential Mortgage-Backed Securities — Agency(a) (continued)
Issuer | | Coupon
Rate | | Principal
Amount ($) | | Value ($) | |
Federal National Mortgage Association(c)
CMO IO STRIPS Series 413 Class C39
04/25/41 | | | 4.500 | % | | | 8,770,721 | | | | 1,889,714 | | |
CMO IO STRIPS Series 417 Class C5
02/25/43 | | | 3.500 | % | | | 7,673,941 | | | | 1,511,377 | | |
CMO IO Series 2012-118 Class BI
12/25/39 | | | 3.500 | % | | | 32,388,156 | | | | 4,483,518 | | |
CMO IO Series 2012-121 Class GI
08/25/39 | | | 3.500 | % | | | 9,986,660 | | | | 1,263,742 | | |
CMO IO Series 2012-129 Class IC
01/25/41 | | | 3.500 | % | | | 14,474,145 | | | | 2,222,640 | | |
CMO IO Series 2012-133 Class EI
07/25/31 | | | 3.500 | % | | | 6,186,199 | | | | 728,421 | | |
CMO IO Series 2012-134 Class AI
07/25/40 | | | 3.500 | % | | | 24,329,854 | | | | 3,502,020 | | |
CMO IO Series 2012-144 Class HI
07/25/42 | | | 3.500 | % | | | 6,004,242 | | | | 783,934 | | |
CMO IO Series 2012-96 Class CI
04/25/39 | | | 3.500 | % | | | 12,512,442 | | | | 1,157,735 | | |
CMO IO Series 2013-1 Class AI
02/25/43 | | | 3.500 | % | | | 6,499,662 | | | | 1,255,206 | | |
CMO IO Series 2013-1 Class BI
02/25/40 | | | 3.500 | % | | | 4,902,235 | | | | 490,132 | | |
CMO IO Series 2013-16 Class IO
01/25/40 | | | 3.500 | % | | | 16,158,049 | | | | 2,129,744 | | |
CMO IO Series 2013-41 Class IY
05/25/40 | | | 3.500 | % | | | 18,721,406 | | | | 2,001,906 | | |
CMO IO Series 2013-6 Class MI
02/25/40 | | | 3.500 | % | | | 14,412,347 | | | | 2,024,007 | | |
CMO IO Series 417 Class C4
02/25/43 | | | 3.500 | % | | | 21,320,436 | | | | 4,635,813 | | |
Federal National Mortgage Association(d)
12/19/31 | | | 2.500 | % | | | 115,000,000 | | | | 115,503,125 | | |
12/19/31 - 12/13/46 | | | 3.000 | % | | | 226,500,000 | | | | 226,779,619 | | |
12/01/46 | | | 3.500 | % | | | 21,151,858 | | | | 21,826,733 | | |
12/13/46 | | | 4.000 | % | | | 69,000,000 | | | | 72,687,187 | | |
Federal National Mortgage Association(e)
09/01/40 | | | 4.000 | % | | | 14,313,847 | | | | 15,173,098 | | |
Government National Mortgage Association
03/15/30 | | | 7.000 | % | | | 22,712 | | | | 22,882 | | |
12/15/31 - 02/15/32 | | | 6.500 | % | | | 216,779 | | | | 247,584 | | |
12/15/32 | | | 6.000 | % | | | 86,726 | | | | 103,078 | | |
09/15/33 - 08/20/40 | | | 5.000 | % | | | 18,586,136 | | | | 20,600,872 | | |
Government National Mortgage Association(b)(c)
CMO IO Series 2014-131 Class BS
09/16/44 | | | 5.658 | % | | | 19,890,265 | | | | 5,132,580 | | |
CMO IO Series 2015-144 Class SA | |
10/20/45 | | | 5.638 | % | | | 19,920,195 | | | | 4,880,912 | | |
CMO IO Series 2016-108 Class SN | |
08/20/46 | | | 5.518 | % | | | 10,928,264 | | | | 2,848,749 | | |
CMO IO Series 2016-146 Class NS | |
10/20/46 | | | 5.538 | % | | | 12,826,452 | | | | 3,371,474 | | |
The accompanying Notes to Financial Statements are an integral part of this statement.
Semiannual Report 2016
7
COLUMBIA U.S. GOVERNMENT MORTGAGE FUND
PORTFOLIO OF INVESTMENTS (continued)
November 30, 2016 (Unaudited)
Residential Mortgage-Backed Securities — Agency(a) (continued)
Issuer | | Coupon
Rate | | Principal
Amount ($) | | Value ($) | |
Government National Mortgage Association(c)
CMO IO Series 2012-121 Class PI
09/16/42 | | | 4.500 | % | | | 9,828,541 | | | | 1,847,487 | | |
CMO IO Series 2012-129 Class AI
08/20/37 | | | 3.000 | % | | | 12,914,142 | | | | 1,091,932 | | |
CMO IO Series 2012-38 Class MI
03/20/42 | | | 4.000 | % | | | 22,188,016 | | | | 4,232,588 | | |
CMO IO Series 2014-131 Class EI
09/16/39 | | | 4.000 | % | | | 16,952,977 | | | | 2,709,942 | | |
CMO IO Series 2015-175 Class AI
10/16/38 | | | 3.500 | % | | | 33,725,103 | | | | 4,956,211 | | |
Government National Mortgage Association(d) | |
12/21/46 | | | 3.000 | % | | | 47,000,000 | | | | 47,727,034 | | |
12/21/46 | | | 3.500 | % | | | 61,500,000 | | | | 64,032,072 | | |
Vendee Mortgage Trust(b)(c)
CMO IO Series 1998-1 Class 2IO
03/15/28 | | | 0.330 | % | | | 1,769,206 | | | | 13,340 | | |
CMO IO Series 1998-3 Class IO
03/15/29 | | | 0.136 | % | | | 2,141,293 | | | | 2,575 | | |
Total Residential Mortgage-Backed
Securities — Agency
(Cost: $2,275,980,693) | | | | | | | 2,245,924,912 | | |
Residential Mortgage-Backed Securities —
Non-Agency 11.8%
ASG Resecuritization Trust(b)(f)
CMO Series 2013-2 Class 1A60
12/28/35 | | | 2.755 | % | | | 1,410,294 | | | | 1,407,085 | | |
CMO Series 2013-2 Class 2A70
11/28/35 | | | 2.859 | % | | | 2,014,778 | | | | 2,021,160 | | |
Angel Oak Mortgage Trust I LLC
Series 2016-1 Class A1(f)
07/25/46 | | | 3.500 | % | | | 19,243,851 | | | | 19,004,963 | | |
Angel Oak Mortgage Trust LLC
Series 2015-1(f)
11/25/45 | | | 4.500 | % | | | 2,010,266 | | | | 2,022,746 | | |
BCAP LLC Trust(b)(f)
07/26/36 | | | 3.080 | % | | | 2,672,558 | | | | 2,641,751 | | |
CMO Series 2014-RR3 Class 3A1
07/26/36 | | | 0.675 | % | | | 1,497,158 | | | | 1,456,674 | | |
Series 2012-RR10 Class 2A1
09/26/36 | | | 3.024 | % | | | 3,580,508 | | | | 3,586,032 | | |
BCAP LLC Trust(f)
CMO Series 2010-RR12 Class 3A7
08/26/37 | | | 5.000 | % | | | 457,425 | | | | 458,288 | | |
Series 2013-RR1 Class 10A1
10/26/36 | | | 3.000 | % | | | 2,712,835 | | | | 2,720,406 | | |
Residential Mortgage-Backed Securities —
Non-Agency (continued)
Issuer | | Coupon
Rate | | Principal
Amount ($) | | Value ($) | |
Bayview Opportunity Master Fund IIA Trust
Series 2016-RPL3 Class A1(f)
07/28/31 | | | 3.475 | % | | | 8,139,808 | | | | 8,110,569 | | |
Bayview Opportunity Master Fund IIIa Trust
CMO Series 2016-RN3 Class A1(f) | |
09/28/31 | | | 3.598 | % | | | 9,523,892 | | | | 9,524,375 | | |
Bayview Opportunity Master Fund Trust
CMO Series 2016-LT1 Class A1(f)
10/28/31 | | | 3.475 | % | | | 4,910,071 | | | | 4,897,977 | | |
Bellemeade Re II Ltd.
CMO Series 2016-1A Class M2A(b)(f)
04/25/26 | | | 5.092 | % | | | 5,000,000 | | | | 5,032,696 | | |
CIM Trust
CMO Series 2015-3AG Class A2(b)(f) | |
10/25/57 | | | 4.117 | % | | | 5,000,000 | | | | 5,152,038 | | |
COLT LLC
CMO Series 15-1 Class A1V(b)(f)
12/26/45 | | | 3.592 | % | | | 2,630,325 | | | | 2,610,921 | | |
COLT Mortgage Loan Trust(b)(f)
CMO Series 2016-2 Class A2
09/25/46 | | | 3.250 | % | | | 8,770,239 | | | | 8,817,824 | | |
COLT Mortgage Loan Trust(f)
CMO Series 2016-1 Class A2
05/25/46 | | | 3.500 | % | | | 9,614,780 | | | | 9,698,910 | | |
CSMC Trust
CMO Series 2015-RPL1 Class A2(b)(f)
02/25/57 | | | 4.682 | % | | | 7,000,000 | | | | 6,826,938 | | |
Citigroup Mortgage Loan Trust, Inc.(b)(f)
CMO Series 2009-11 Class 1A2
02/25/37 | | | 2.999 | % | | | 710,201 | | | | 593,727 | | |
CMO Series 2009-9 Class 1A3
04/25/34 | | | 3.183 | % | | | 2,489,441 | | | | 2,242,599 | | |
CMO Series 2010-7 Class 3A4
12/25/35 | | | 5.542 | % | | | 3,000,000 | | | | 3,025,253 | | |
CMO Series 2014-A Class B2
01/25/35 | | | 5.457 | % | | | 2,386,282 | | | | 2,441,936 | | |
CMO Series 2014-C Class A
02/25/54 | | | 3.250 | % | | | 1,293,643 | | | | 1,241,372 | | |
CMO Series 2015-A Class B3
06/25/58 | | | 4.500 | % | | | 3,415,595 | | | | 3,194,420 | | |
Citigroup Mortgage Loan Trust, Inc.(f)
CMO Series 2015-RP2 Class B2
01/25/53 | | | 4.250 | % | | | 5,772,451 | | | | 5,571,004 | | |
Credit Suisse Mortgage Capital Certificates(b)(f)
04/27/37 | | | 5.941 | % | | | 2,410,476 | | | | 2,403,620 | | |
CMO Series 2012-6R Class 1A1
11/26/37 | | | 3.157 | % | | | 6,366,272 | | | | 6,377,934 | | |
CMO Series 2013-2R Class 1A5
05/27/36 | | | 3.035 | % | | | 5,818,000 | | | | 5,688,324 | | |
The accompanying Notes to Financial Statements are an integral part of this statement.
Semiannual Report 2016
8
COLUMBIA U.S. GOVERNMENT MORTGAGE FUND
PORTFOLIO OF INVESTMENTS (continued)
November 30, 2016 (Unaudited)
Residential Mortgage-Backed Securities —
Non-Agency (continued)
Issuer | | Coupon
Rate | | Principal
Amount ($) | | Value ($) | |
CMO Series 2014-RPL4 Class A1
08/25/62 | | | 3.625 | % | | | 5,772,741 | | | | 5,851,407 | | |
CMO Series 2014-RPL4 Class A2
08/25/62 | | | 4.788 | % | | | 8,250,000 | | | | 7,993,427 | | |
Credit Suisse Mortgage Capital Certificates(b)(f)(g)
Series 2012-11 Class 3A2
06/29/47 | | | 1.617 | % | | | 5,830,335 | | | | 5,287,682 | | |
Credit Suisse Mortgage Capital Certificates(f)
CMO Series 2010-9R Class 10A5
04/27/37 | | | 4.000 | % | | | 4,490,461 | | | | 4,466,892 | | |
CMO Series 2010-9R Class 2A5
02/27/38 | | | 4.000 | % | | | 1,506,500 | | | | 1,459,439 | | |
CMO Series 2010-9R Class 7A5
05/27/37 | | | 4.000 | % | | | 1,666,396 | | | | 1,661,016 | | |
Credit Suisse Securities (USA) LLC(b)(f)
CMO Series 2014-RPL1 Class A1
02/25/54 | | | 3.250 | % | | | 13,272,700 | | | | 13,197,904 | | |
Credit Suisse Securities (USA) LLC(f) | |
CMO Series 2014-5R Class 5A2
07/27/37 | | | 3.250 | % | | | 1,989,046 | | | | 1,894,392 | | |
CMO Series 2014-RPL1 Class A3 | |
02/25/54 | | | 4.158 | % | | | 5,500,000 | | | | 5,459,556 | | |
Deutsche Mortgage Securities, Inc. Mortgage Loan Trust
CMO Series 2003-1 Class 1A7
04/25/33 | | | 5.500 | % | | | 259,495 | | | | 261,765 | | |
Jefferies Resecuritization Trust(f)
CMO Series 2010-R4 Class 2A2
10/26/35 | | | 5.500 | % | | | 688,942 | | | | 689,103 | | |
CMO Series 2014-R1 Class 1A1 | |
12/27/37 | | | 4.000 | % | | | 1,034,470 | | | | 1,034,095 | | |
Mill City Mortgage Trust(b)(f)
CMO Series 2015-1 Class M3
06/25/56 | | | 3.206 | % | | | 10,604,000 | | | | 9,795,236 | | |
Series 2015-1 Class M1
06/25/56 | | | 3.206 | % | | | 10,000,000 | | | | 9,548,587 | | |
Series 2015-2 Class M2
09/25/57 | | | 3.537 | % | | | 5,778,000 | | | | 5,396,024 | | |
NRPL Trust(b)(f)
Series 2014-1A Class A1 | |
04/25/54 | | | 3.250 | % | | | 3,859,029 | | | | 3,910,494 | | |
NRPL Trust(f)
Series 2013-1A Class A
08/25/57 | | | 4.000 | % | | | 7,431,670 | | | | 7,395,255 | | |
New Residential Mortgage Loan Trust
CMO IO Series 2014-1A Class AIO(b)(c)(f)
01/25/54 | | | 2.279 | % | | | 43,161,395 | | | | 2,463,898 | | |
Pretium Mortgage Credit Partners I LLC
CMO Series 2016-NPL6 Class A1(f)
10/27/31 | | | 3.500 | % | | | 5,950,530 | | | | 5,955,080 | | |
Residential Mortgage-Backed Securities —
Non-Agency (continued)
Issuer | | Coupon
Rate | | Principal
Amount ($) | | Value ($) | |
RBSSP Resecuritization Trust(b)(f)
CMO Series 2009-12 Class 9A1
03/25/36 | | | 3.014 | % | | | 826,244 | | | | 821,039 | | |
CMO Series 2012-1 Class 5A2
12/27/35 | | | 3.550 | % | | | 5,534,879 | | | | 4,922,466 | | |
RBSSP Resecuritization Trust(f)
CMO Series 2012-5 Class 2A1
07/26/36 | | | 5.750 | % | | | 3,600,820 | | | | 3,722,564 | | |
SGR Residential Mortgage Trust
CMO Series 2016-1 Class A1(f)
11/25/46 | | | 3.750 | % | | | 9,084,670 | | | | 9,079,382 | | |
VML LLC
CMO Series 2014-NPL1 Class A1(f)
04/27/54 | | | 3.875 | % | | | 1,311,302 | | | | 1,305,586 | | |
Vericrest Opportunity Loan Transferee LI LLC
Series 2016-NP11 Class A1(f)
10/25/46 | | | 3.500 | % | | | 6,952,254 | | | | 6,953,382 | | |
Vericrest Opportunity Loan Transferee XLIV LLC
CMO Series 2016-NPL4 Class A1(b)(f)
04/25/46 | | | 4.250 | % | | | 5,390,577 | | | | 5,450,894 | | |
Vericrest Opportunity Loan Transferee XXXV LLC
CMO Series 2016-NPL9 Class A1(f)
09/25/46 | | | 3.500 | % | | | 9,767,320 | | | | 9,759,638 | | |
Total Residential Mortgage-Backed Securities —
Non-Agency
(Cost: $262,558,737) | | | | | | | 264,507,745 | | |
Commercial Mortgage-Backed Securities —
Agency 0.7%
Federal National Mortgage Association
10/01/19 | | | 4.420 | % | | | 3,953,562 | | | | 4,203,600 | | |
10/01/19 | | | 4.430 | % | | | 4,496,592 | | | | 4,782,387 | | |
01/01/20 | | | 4.570 | % | | | 1,010,647 | | | | 1,083,085 | | |
01/01/20 | | | 4.600 | % | | | 1,666,060 | | | | 1,787,017 | | |
05/01/24 | | | 5.030 | % | | | 3,269,408 | | | | 3,679,316 | | |
Total Commercial Mortgage-Backed
Securities — Agency
(Cost: $14,355,253) | | | | | | | 15,535,405 | | |
Commercial Mortgage-Backed Securities —
Non-Agency 4.4%
1211 Avenue of the Americas Trust
Subordinated, Series 2015-1211 Class C(b)(f)
08/10/35 | | | 4.280 | % | | | 4,400,000 | | | | 4,543,003 | | |
American Homes 4 Rent(b)(f)
Series 2014-SFR1 Class E
06/17/31 | | | 3.039 | % | | | 7,250,000 | | | | 7,179,279 | | |
The accompanying Notes to Financial Statements are an integral part of this statement.
Semiannual Report 2016
9
COLUMBIA U.S. GOVERNMENT MORTGAGE FUND
PORTFOLIO OF INVESTMENTS (continued)
November 30, 2016 (Unaudited)
Commercial Mortgage-Backed Securities —
Non-Agency (continued)
Issuer | | Coupon
Rate | | Principal
Amount ($) | | Value ($) | |
American Homes 4 Rent(f)
Series 2015-SFR1 Class F
04/17/52 | | | 5.885 | % | | | 1,500,000 | | | | 1,467,204 | | |
B2R Mortgage Trust
Series 2015-2 Class D(b)(f)
11/15/48 | | | 5.667 | % | | | 5,000,000 | | | | 4,741,338 | | |
BHMS Mortgage Trust
Series 2014-ATLS Class DFX(b)(f)
07/05/33 | | | 4.847 | % | | | 6,500,000 | | | | 6,394,263 | | |
Banc of America Merrill Lynch Commercial Mortgage Securities Trust
Series 2013-DSNY Class F(b)(f)
09/15/26 | | | 4.038 | % | | | 6,928,000 | | | | 6,933,335 | | |
Hilton USA Trust(b)(f)
Series 2016-HHV Class F
11/05/38 | | | 4.194 | % | | | 23,000,000 | | | | 17,806,667 | | |
Hilton USA Trust(f)
Subordinated, Series 2016-SFP Class E
11/05/35 | | | 5.519 | % | | | 5,000,000 | | | | 4,821,486 | | |
Invitation Homes Trust
Series 2015-SFR3 Class E(b)(f)
08/17/32 | | | 4.289 | % | | | 3,500,000 | | | | 3,511,995 | | |
JPMCC Re-REMIC Trust
Series 2016-GG10 Class AMA(b)(f)
08/15/45 | | | 5.988 | % | | | 20,000,000 | | | | 20,161,940 | | |
Merrill Lynch Mortgage Investors Trust
CMO IO Series 1998-C3 Class IO(b)(c)
12/15/30 | | | 1.083 | % | | | 205,475 | | | | 1,337 | | |
ORES NPL LLC(f)
Series 2014-LV3 Class A
03/27/24 | | | 3.000 | % | | | 23,315 | | | | 23,315 | | |
Series 2014-LV3 Class B
03/27/24 | | | 6.000 | % | | | 4,800,000 | | | | 4,800,000 | | |
Rialto Capital Management LLC
Series 2014-LT5 Class B(f)
05/15/24 | | | 5.000 | % | | | 7,412,000 | | | | 7,406,877 | | |
Rialto Real Estate Fund LP
Series 2014-LT5 Class A(f)
05/15/24 | | | 2.850 | % | | | 528,159 | | | | 527,147 | | |
VFC LLC(f)
Series 2014-2 Class B
07/20/30 | | | 5.500 | % | | | 1,906,994 | | | | 1,902,238 | | |
Subordinated, Series 2015-3 Class B
12/20/31 | | | 4.750 | % | | | 5,167,566 | | | | 5,167,566 | | |
Total Commercial Mortgage-Backed Securities —
Non-Agency
(Cost: $97,632,389) | | | | | | | 97,388,990 | | |
Asset-Backed Securities — Non-Agency 6.7%
Issuer | | Coupon
Rate | | Principal
Amount ($) | | Value ($) | |
A Voce CLO Ltd.
Series 2014-1A Class C(b)(f)
07/15/26 | | | 4.380 | % | | | 3,000,000 | | | | 2,824,836 | | |
ALM XIX Ltd.
Series 2016-19A Class B(b)(f)
07/15/28 | | | 3.634 | % | | | 4,000,000 | | | | 4,045,972 | | |
Apidos CDO XVII
Series 2014-17A Class A2A(b)(f)
04/17/26 | | | 2.930 | % | | | 6,500,000 | | | | 6,499,909 | | |
Apidos CLO XXII
Series 2015-22A Class D(b)(f)
10/20/27 | | | 6.881 | % | | | 4,000,000 | | | | 3,681,896 | | |
Ares CLO Ltd.
Series 2014-1A Class B(b)(f)
04/17/26 | | | 3.680 | % | | | 3,250,000 | | | | 3,250,705 | | |
Ballyrock CLO LLC
Series 2014-1A Class A1(b)(f)
10/20/26 | | | 2.361 | % | | | 10,000,000 | | | | 10,009,650 | | |
Carlyle Global Market Strategies CLO Ltd.
Series 2016-1A Class C(b)(f)
04/20/27 | | | 5.781 | % | | | 3,000,000 | | | | 3,032,694 | | |
Carlyle Global Market Strategies CLO
Series 2013-1A Class B(b)(f)
02/14/25 | | | 4.002 | % | | | 6,300,000 | | | | 6,308,045 | | |
Conn's Receivables Funding LLC(f)
Series 2015-A Class A
09/15/20 | | | 4.565 | % | | | 1,666,427 | | | | 1,667,578 | | |
Series 2016-A Class A
04/16/18 | | | 4.680 | % | | | 5,337,360 | | | | 5,349,631 | | |
Series 2016-B Class A
10/15/18 | | | 3.730 | % | | | 7,813,600 | | | | 7,831,561 | | |
Series 2016-B Class B
03/15/19 | | | 7.340 | % | | | 7,500,000 | | | | 7,546,920 | | |
Subordinated, Series 2016-A Class B
08/15/18 | | | 8.960 | % | | | 4,500,000 | | | | 4,557,823 | | |
Dryden 33 Senior Loan Fund
Series 2014-33A Class ER(b)(f)(g)
10/15/28 | | | 8.420 | % | | | 10,000,000 | | | | 9,525,000 | | |
GoldenTree Loan Opportunities VII Ltd.
Series 2013-7A Class B(b)(f)
04/25/25 | | | 2.632 | % | | | 8,000,000 | | | | 7,971,128 | | |
Madison Park Funding Ltd.(b)(f)
10/21/26 | | | 3.881 | % | | | 7,000,000 | | | | 7,035,462 | | |
Madison Park Funding XVI Ltd.
Series 2015-16A Class A2A(b)(f)
04/20/26 | | | 3.081 | % | | | 13,000,000 | | | | 13,005,447 | | |
Nomad CLO Ltd.
Series 2013-1A Class B(b)(f)
01/15/25 | | | 3.830 | % | | | 10,000,000 | | | | 10,000,000 | | |
The accompanying Notes to Financial Statements are an integral part of this statement.
Semiannual Report 2016
10
COLUMBIA U.S. GOVERNMENT MORTGAGE FUND
PORTFOLIO OF INVESTMENTS (continued)
November 30, 2016 (Unaudited)
Asset-Backed Securities — Non-Agency (continued)
Issuer | | Coupon
Rate | | Principal
Amount ($) | | Value ($) | |
OHA Credit Partners VIII Ltd.
Series 2013-8A Class B(b)(f)
04/20/25 | | | 2.531 | % | | | 4,500,000 | | | | 4,463,883 | | |
OZLM XIV Ltd.
Series 2015-14A Class C(b)(f)
01/15/29 | | | 5.230 | % | | | 6,000,000 | | | | 6,019,404 | | |
Octagon Investment Partners 27 Ltd.
Series 2016-1A Class C(b)(f)
07/15/27 | | | 3.662 | % | | | 7,500,000 | | | | 7,566,195 | | |
Octagon Investment Partners XXVI Ltd.
Series 2016-1A Class D(b)(f)
04/15/27 | | | 5.830 | % | | | 6,000,000 | | | | 6,060,852 | | |
SoFi Professional Loan Program LLC(f)(g)(h)
Series 2015-D Class RC
10/26/37 | | | 0.000 | % | | | 6 | | | | 4,388,659 | | |
SoFi Professional Loan Program LLC(f)(h)
Series 2016-A Class RPO
01/25/38 | | | 0.000 | % | | | 7 | | | | 4,879,738 | | |
Series 2016-B Class RC
04/25/37 | | | 0.000 | % | | | 6 | | | | 3,524,310 | | |
Total Asset-Backed Securities — Non-Agency
(Cost: $147,767,046) | | | | | | | 151,047,298 | | |
Repurchase Agreements 2.7% | |
Issue
Description | | Effective
Yield | | Principal
Amount ($) | | Value ($) | |
Tri-party TD Securities (USA) LLC
dated 11/30/2016 matures
12/1/2016 repurchase price
$60,000,467
(collateralized by U.S. Treasury
Securities — total market
value of $61,200,032)
12/01/16 | | | 0.280 | % | | | 60,000,000 | | | | 60,000,000 | | |
Total Repurchase Agreements
(Cost: $60,000,000) | | | | | | | 60,000,000 | | |
Options Purchased Puts 0.9% | |
Issuer | | Notional ($)/
Contracts | | Exercise
Price ($) | | Expiration
Date | | Value ($) | |
Put — OTC
5-Year Interest
Rate Swap(i) | | | 300,000,000 | | | | 1.50 | | | 08/25/17 | | | 8,950,170 | | |
Put — OTC
5-Year Interest
Rate Swap(i) | | | 50,000,000 | | | | 2.00 | | | 12/02/16 | | | 960 | | |
Options Purchased Puts (continued)
Issuer | | Notional ($)/
Contracts | | Exercise
Price ($) | | Expiration
Date | | Value ($) | |
Put — OTC
5-Year Interest
Rate Swap(i) | | | 100,000,000 | | | | 2.00 | | | 12/12/16 | | | 58,620 | | |
Put — OTC
5-Year Interest
Rate Swap(i) | | | 400,000,000 | | | | 2.00 | | | 07/16/18 | | | 10,753,400 | | |
Put — OTC
5-Year Interest
Rate Swap(i) | | | 100,000,000 | | | | 3.00 | | | 05/17/17 | | | 82,710 | | |
Put — OTC
5-Year Interest
Rate Swap(i) | | | 130,000,000 | | | | 3.25 | | | 08/18/17 | | | 178,555 | | |
Put — OTC
5-Year Interest
Rate Swap(i) | | | 150,000,000 | | | | 2.75 | | | 05/31/17 | | | 287,025 | | |
Put — OTC
5-Year Interest
Rate Swap(i) | | | 50,000,000 | | | | 4.00 | | | 08/17/17 | | | 13,750 | | |
Total Options Purchased Puts
(Cost: $22,155,750) | | | | | | | | | 20,325,190 | | |
Money Market Funds 0.4% | |
| | | Shares | | Value | |
Columbia Short-Term Cash Fund,
0.480%(k)(l) | | | 9,968,151 | | | | 9,969,148 | | |
Total Money Market Funds
(Cost: $9,968,151) | | | | | 9,969,148 | | |
Total Investments
(Cost: $2,890,418,019) | | | | | 2,864,698,688 | | |
Other Assets & Liabilities, Net | | | | | (623,026,833 | ) | |
Net Assets | | | | | 2,241,671,855 | | |
The accompanying Notes to Financial Statements are an integral part of this statement.
Semiannual Report 2016
11
COLUMBIA U.S. GOVERNMENT MORTGAGE FUND
PORTFOLIO OF INVESTMENTS (continued)
November 30, 2016 (Unaudited)
At November 30, 2016, securities and cash totaling $13,747,522 were pledged as collateral.
Investments in Derivatives
Futures Contracts Outstanding at November 30, 2016
Long Futures Contracts Outstanding
Contract Description | | Number of
Contracts | | Trading
Currency | | Notional
Market
Value ($) | | Expiration
Date | | Unrealized
Appreciation ($) | | Unrealized
(Depreciation) ($) | |
U.S. Treasury 10-Year Note | | | 846 | | | USD | | | | | 105,340,219 | | | 03/2017 | | | — | | | | (134,056 | ) | |
U.S. Treasury 5-Year Note | | | 1,315 | | | USD | | | | | 154,964,531 | | | 03/2017 | | | — | | | | (297,073 | ) | |
Total | | | | | | | 260,304,750 | | | | | | — | | | | (431,129 | ) | |
Short Futures Contracts Outstanding
Contract Description | | Number of
Contracts | | Trading
Currency | | Notional
Market
Value ($) | | Expiration
Date | | Unrealized
Appreciation ($) | | Unrealized
(Depreciation) ($) | |
U.S. Long Bond | | | (20 | ) | | USD | | | | | (3,025,625 | ) | | 03/2017 | | | 10,959 | | | | — | | |
Open Options Contracts Written at November 30, 2016
Issuer | | Puts/Calls | | Trading
Currency | | Number of
Contracts | | Exercise
Price | | Premium
Received ($) | | Expiration
Date | | Value ($) | |
Put — OTC 5-Year
Interest Rate Swap(j) | | Put
| | USD |
| | | | (175,000,000
| ) | | | 2.00
| | | | (980,000
| ) | | 02/21/2017
| | | (957,180
| ) | |
Cleared Credit Default Swap Contracts Outstanding at November 30, 2016
Buy Protection
Counterparty | | Reference
Entity | | Expiration
Date | | Pay Fixed
Rate (%) | | Notional
Currency | | Notional
Amount | | Unrealized
Appreciation ($) | | Unrealized
Depreciation ($) | |
Morgan Stanley
| | Markit CDX North America
High Yield Index, Series 27 | |
12/20/2021 | | |
5.000 | | |
USD | | |
22,000,000 | | | |
— | | | | (461,478 | ) | |
Credit Default Swap Contracts Outstanding at November 30, 2016
Sell Protection
Counterparty | | Reference
Entity | | Expiration
Date | | Receive
Fixed
Rate
(%) | | Implied
Credit
Spread
(%)* | | Notional
Currency | | Notional
Amount | | Market
Value
($) | | Premium
Received
($) | | Periodic
Payments
Receivable
(Payable)
($) | | Unrealized
Appreciation
($) | | Unrealized
Depreciation
($) | |
Credit Suisse
| | Markit CMBX
North America
Index, Series 7
BBB- | | 01/17/2047
| | | 3.000
| | | | 4.390
| | | USD |
| | | | (7,500,000
| ) | | | (589,162
| ) | | | (688,739
| ) | | | 3,750
| | | | 103,327
| | | | —
| | |
Goldman Sachs
International
| | Markit CMBX
North America
Index, Series 6
BBB- | | 05/11/2063
| | | 3.000
| | | | 4.514
| | | USD |
| | | | (8,500,000
| ) | | | (625,547
| ) | | | (617,692
| ) | | | 4,250
| | | | —
| | | | (3,605
| ) | |
The accompanying Notes to Financial Statements are an integral part of this statement.
Semiannual Report 2016
12
COLUMBIA U.S. GOVERNMENT MORTGAGE FUND
PORTFOLIO OF INVESTMENTS (continued)
November 30, 2016 (Unaudited)
Credit Default Swap Contracts Outstanding at November 30, 2016
Sell Protection (continued)
Counterparty | | Reference
Entity | | Expiration
Date | | Receive
Fixed
Rate
(%) | | Implied
Credit
Spread
(%)* | | Notional
Currency | | Notional
Amount | | Market
Value
($) | | Premium
Received
($) | | Periodic
Payments
Receivable
(Payable)
($) | | Unrealized
Appreciation
($) | | Unrealized
Depreciation
($) | |
JPMorgan
| | Markit CMBX
North America
Index, Series 7
BBB- | | 01/17/2047
| | | 3.000
| | | | 4.390
| | | USD |
| | | | (9,000,000
| ) | | | (706,994
| ) | | | (830,362
| ) | | | 4,500
| | | | 127,868
| | | | —
| | |
Morgan Stanley
| | Markit CMBX
North America
Index, Series 6
BBB- | | 05/11/2063
| | | 3.000
| | | | 4.514
| | | USD |
| | | | (4,050,000
| ) | | | (298,055
| ) | | | (247,651
| ) | | | 2,025
| | | | —
| | | | (48,379
| ) | |
Morgan Stanley
| | Markit CMBX
North America
Index, Series 7
BBB- | | 01/17/2047
| | | 3.000
| | | | 4.390
| | | USD |
| | | | (6,000,000
| ) | | | (471,329
| ) | | | (707,877
| ) | | | 2,999
| | | | 239,547
| | | | —
| | |
Morgan Stanley
| | Markit CMBX
North America
Index, Series 7
BBB- | | 01/17/2047
| | | 3.000
| | | | 4.390
| | | USD |
| | | | (9,400,000
| ) | | | (738,416
| ) | | | (1,189,045
| ) | | | 4,700
| | | | 455,329
| | | | —
| | |
Total | | | | | | | | | | | | | | | | | (4,281,366 | ) | | | | | 926,071 | | | | (51,984 | ) | |
*Implied credit spreads, represented in absolute terms, utilized in determining the market value of credit default swap agreements on corporate or sovereign issues as of period end serve as an indicator of the current status of the payment/performance risk and represent the likelihood or risk of default for the credit derivative. The implied credit spread of a particular referenced entity reflects the cost of buying/selling protection and may include upfront payments required to be made to enter into the agreement. Wider credit spreads represent a deterioration of the referenced entity's credit soundness and a greater likelihood or risk of default or other credit event occurring as defined under the terms of the agreement.
Notes to Portfolio of Investments
(a) Represents comparable securities held to satisfy future delivery requirements of the following open forward sale commitments at November 30, 2016:
Security Description | | Principal
Amount ($) | | Settlement
Date | | Proceeds
Receivable ($) | | Value ($) | |
Federal National Mortgage Association | |
12/13/46 3.500% | | | 25,000,000 | | | 12/13/16 | | | 25,238,984 | | | | 25,161,309 | | |
(b) Variable rate security.
(c) Interest Only (IO) represents the right to receive the monthly interest payments on an underlying pool of mortgage loans.
(d) Security, or a portion thereof, has been purchased on a when-issued or delayed delivery basis.
(e) This security or a portion of this security has been pledged as collateral in connection with derivative contracts.
(f) Represents privately placed and other securities and instruments exempt from SEC registration (collectively, private placements), such as Section 4(a)(2) and Rule 144A eligible securities, which are often sold only to qualified institutional buyers. The Fund may invest in private placements determined to be liquid as well as those determined to be illiquid. Private placements may be determined to be liquid under guidelines established by the Fund's Board of Trustees. At November 30, 2016, the value of these securities amounted to $512,680,931 or 22.87% of net assets.
(g) Represents fair value as determined in good faith under procedures approved by the Board of Trustees. At November 30, 2016, the value of these securities amounted to $19,201,341, which represents 0.86% of net assets.
(h) Zero coupon bond.
The accompanying Notes to Financial Statements are an integral part of this statement.
Semiannual Report 2016
13
COLUMBIA U.S. GOVERNMENT MORTGAGE FUND
PORTFOLIO OF INVESTMENTS (continued)
November 30, 2016 (Unaudited)
Notes to Portfolio of Investments (continued)
(i) Purchased swaption contracts outstanding at November 30, 2016:
Description | | Counterparty | | Fund
Receives | | Fund Pays | | Exercise
Rate (%) | | Expiration
Date | | Notional
Amount ($) | | Premium
Paid ($) | | Market
Value ($) | |
Put — OTC
5-Year Interest
Rate Swap | | Barclays | | 3-Month USD
LIBOR BBA | | Fixed rate of
2.000% | | | 2.000 | | | 12/06/2021 | | | 50,000,000 | | | | 700,000 | | | | 960 | | |
Put — OTC
5-Year Interest
Rate Swap | | Barclays | | 3-Month USD
LIBOR BBA | | Fixed rate of
3.250% | | | 3.250 | | | 08/22/2022 | | | 130,000,000 | | | | 3,438,500 | | | | 178,555 | | |
Put — OTC
5-Year Interest
Rate Swap | | Citi | | 3-Month USD
LIBOR BBA
| | Fixed rate of
2.000% | | | 2.000 | | | 12/14/2021 | | | 100,000,000 | | | | 1,357,500 | | | | 58,620 | | |
Put — OTC
5-Year Interest
Rate Swap | | Citi | | 3-Month USD
LIBOR BBA | | Fixed rate of
2.000% | | | 2.000 | | | 07/18/2023 | | | 400,000,000 | | | | 4,040,000 | | | | 10,753,400 | | |
Put — OTC
5-Year Interest
Rate Swap | | Citi | | 3-Month USD
LIBOR BBA
| | Fixed rate of
1.500% | | | 1.500 | | | 08/25/2023 | | | 300,000,000 | | | | 3,112,500 | | | | 8,950,170 | | |
Put — OTC
5-Year Interest
Rate Swap | | JPMorgan | | 3-Month USD
LIBOR BBA
| | Fixed rate of
2.750% | | | 2.750 | | | 06/02/2022 | | | 150,000,000 | | | | 4,890,000 | | | | 287,025 | | |
Put — OTC
5-Year Interest
Rate Swap | | JPMorgan | | 3-Month USD
LIBOR BBA | | Fixed rate of
4.000% | | | 4.000 | | | 08/19/2022 | | | 50,000,000 | | | | 1,101,250 | | | | 13,750 | | |
Put — OTC
5-Year Interest
Rate Swap | | Morgan Stanley
International | | 3-Month USD
LIBOR BBA | | Fixed rate of
3.000% | | | 3.000 | | | 05/19/2022 | | | 100,000,000 | | | | 3,516,000 | | | | 82,710 | | |
Total | | | | | | | | | | | | | | | 22,155,750 | | | | 20,325,190 | | |
(j) Written Swaption Contracts Outstanding at November 30, 2016
Description | | Counterparty | | Fund
Receives | | Fund Pays | | Exercise
Rate (%) | | Expiration
Date | | Notional
Amount ($) | | Premium
Received ($) | | Market
Value ($) | |
Put — OTC
5-Year Interest
Rate Swap | | Morgan
Stanley | | Fixed rate of
2.000% | | 3-Month USD
LIBOR BBA | | | 2.000 | | | 02/23/2022 | | | (175,000,000 | ) | | | (980,000 | ) | | | (957,180 | ) | |
(k) The rate shown is the seven-day current annualized yield at November 30, 2016.
(l) As defined in the Investment Company Act of 1940, an affiliated company is one in which the Fund owns 5% or more of the company's outstanding voting securities, or a company which is under common ownership or control with the Fund. Holdings and transactions in these affiliated companies during the period ended November 30, 2016 are as follows:
Issuer | | Beginning
Cost ($) | | Purchase
Cost ($) | | Proceeds
From Sales ($) | | Realized
Gain (Loss) ($) | | Ending
Cost ($) | | Dividends —
Affiliated
Issuers ($) | | Value ($) | |
Columbia
Short-Term
Cash Fund | | | 25,082,052 | | | | 389,495,560 | | | | (404,609,449 | ) | | | (12 | ) | | | 9,968,151 | | | | 31,143 | | | | 9,969,148 | | |
The accompanying Notes to Financial Statements are an integral part of this statement.
Semiannual Report 2016
14
COLUMBIA U.S. GOVERNMENT MORTGAGE FUND
PORTFOLIO OF INVESTMENTS (continued)
November 30, 2016 (Unaudited)
CMO Collateralized Mortgage Obligation
STRIPS Separate Trading of Registered Interest and Principal Securities
Currency Legend
USD US Dollar
Fair Value Measurements
The Fund categorizes its fair value measurements according to a three-level hierarchy that maximizes the use of observable inputs and minimizes the use of unobservable inputs by prioritizing that the most observable input be used when available. Observable inputs are those that market participants would use in pricing an investment based on market data obtained from sources independent of the reporting entity. Unobservable inputs are those that reflect the Fund's assumptions about the information market participants would use in pricing an investment. An investment's level within the fair value hierarchy is based on the lowest level of any input that is deemed significant to the asset's or liability's fair value measurement. The input levels are not necessarily an indication of the risk or liquidity associated with investments at that level. For example, certain U.S. government securities are generally high quality and liquid, however, they are reflected as Level 2 because the inputs used to determine fair value may not always be quoted prices in an active market.
Fair value inputs are summarized in the three broad levels listed below:
> Level 1 — Valuations based on quoted prices for investments in active markets that the Fund has the ability to access at the measurement date (including NAV for open-end mutual funds). Valuation adjustments are not applied to Level 1 investments.
> Level 2 — Valuations based on other significant observable inputs (including quoted prices for similar securities, interest rates, prepayment speeds, credit risks, etc.).
> Level 3 — Valuations based on significant unobservable inputs (including the Fund's own assumptions and judgment in determining the fair value of investments).
Inputs that are used in determining fair value of an investment may include price information, credit data, volatility statistics, and other factors. These inputs can be either observable or unobservable. The availability of observable inputs can vary between investments, and is affected by various factors such as the type of investment, and the volume and level of activity for that investment or similar investments in the marketplace. The inputs will be considered by the Investment Manager, along with any other relevant factors in the calculation of an investment's fair value. The Fund uses prices and inputs that are current as of the measurement date, which may include periods of market dislocations. During these periods, the availability of prices and inputs may be reduced for many investments. This condition could cause an investment to be reclassified between the various levels within the hierarchy.
Certain investments that have been measured at fair value using the net asset value (NAV) per share (or its equivalent) are not categorized in the fair value hierarchy. The fair value amounts presented in the table are intended to reconcile the fair value hierarchy to the amounts presented in the Portfolio of Investments. The Columbia Short-Term Cash Fund seeks to provide shareholders with maximum current income consistent with liquidity and stability of principal. Columbia Short-Term Cash Fund prices its shares with a floating NAV and no longer seeks to maintain a stable NAV.
Investments falling into the Level 3 category are primarily supported by quoted prices from brokers and dealers participating in the market for those investments. However, these may be classified as Level 3 investments due to lack of market transparency and corroboration to support these quoted prices. Additionally, valuation models may be used as the pricing source for any remaining investments classified as Level 3. These models may rely on one or more significant unobservable inputs and/or significant assumptions by the Investment Manager. Inputs used in valuations may include, but are not limited to, financial statement analysis, capital account balances, discount rates and estimated cash flows, and comparable company data.
Under the direction of the Fund's Board of Trustees (the Board), the Investment Manager's Valuation Committee (the Committee) is responsible for overseeing the valuation procedures approved by the Board. The Committee consists of voting and non-voting members from various groups within the Investment Manager's organization, including operations and accounting, trading and investments, compliance, risk management and legal.
The Committee meets at least monthly to review and approve valuation matters, which may include a description of specific valuation determinations, data regarding pricing information received from approved pricing vendors and brokers and the results of Board-approved valuation control policies and procedures (the Policies). The Policies address, among other things, instances when market quotations are or are not readily available, including recommendations of third party pricing vendors and a determination of appropriate pricing methodologies; events that require specific valuation determinations and assessment of fair value techniques; securities with a potential for stale pricing, including those that are illiquid, restricted, or in default; and the effectiveness of third party pricing vendors, including periodic reviews of vendors. The Committee meets more frequently, as needed, to discuss additional valuation matters, which may include the need to review back-testing results, review time-sensitive information or approve related valuation actions. The Committee reports to the Board, with members of the Committee meeting with the Board at each of its regularly scheduled meetings to discuss valuation matters and actions during the period, similar to those described earlier.
The accompanying Notes to Financial Statements are an integral part of this statement.
Semiannual Report 2016
15
COLUMBIA U.S. GOVERNMENT MORTGAGE FUND
PORTFOLIO OF INVESTMENTS (continued)
November 30, 2016 (Unaudited)
Fair Value Measurements (continued)
For investments categorized as Level 3, the Committee monitors information similar to that described above, which may include: (i) data specific to the issuer or comparable issuers, (ii) general market or specific sector news and (iii) quoted prices and specific or similar security transactions. The Committee considers this data and any changes from prior periods in order to assess the reasonableness of observable and unobservable inputs, any assumptions or internal models used to value those securities and changes in fair value. This data is also used to corroborate, when available, information received from approved pricing vendors and brokers. Various factors impact the frequency of monitoring this information (which may occur as often as daily). However, the Committee may determine that changes to inputs, assumptions and models are not required as a result of the monitoring procedures performed.
The following table is a summary of the inputs used to value the Fund's investments at November 30, 2016:
| | | Level 1
Quoted Prices in Active
Markets for Identical
Assets ($) | | Level 2
Other Significant
Observable Inputs ($) | | Level 3
Significant
Unobservable Inputs ($) | | Total ($) | |
Investments | |
Residential Mortgage-Backed
Securities — Agency | | | — | | | | 2,245,924,912 | | | | — | | | | 2,245,924,912 | | |
Residential Mortgage-Backed
Securities — Non-Agency | | | — | | | | 233,046,516 | | | | 31,461,229 | | | | 264,507,745 | | |
Commercial Mortgage-Backed
Securities — Agency | | | — | | | | 15,535,405 | | | | — | | | | 15,535,405 | | |
Commercial Mortgage-Backed
Securities — Non-Agency | | | — | | | | 97,388,990 | | | | — | | | | 97,388,990 | | |
Asset-Backed Securities —
Non-Agency | | | — | | | | 128,729,591 | | | | 22,317,707 | | | | 151,047,298 | | |
Repurchase Agreements | | | — | | | | 60,000,000 | | | | — | | | | 60,000,000 | | |
Options Purchased Puts | | | — | | | | 20,325,190 | | | | — | | | | 20,325,190 | | |
Investments measured at net asset value | |
Money Market Funds | | | — | | | | — | | | | — | | | | 9,969,148 | | |
Total Investments | | | — | | | | 2,800,950,604 | | | | 53,778,936 | | | | 2,864,698,688 | | |
Forward Sale Commitments | | | — | | | | (25,161,309 | ) | | | — | | | | (25,161,309 | ) | |
Derivatives | |
Assets | |
Futures Contracts | | | 10,959 | | | | — | | | | — | | | | 10,959 | | |
Swap Contracts | | | — | | | | 926,071 | | | | — | | | | 926,071 | | |
Liabilities | |
Futures Contracts | | | (431,129 | ) | | | — | | | | — | | | | (431,129 | ) | |
Options Contracts Written | | | (957,180 | ) | | | — | | | | — | | | | (957,180 | ) | |
Swap Contracts | | | — | | | | (513,462 | ) | | | — | | | | (513,462 | ) | |
Total | | | (1,377,350 | ) | | | 2,776,201,904 | | | | 53,778,936 | | | | 2,838,572,638 | | |
See the Portfolio of Investments for all investment classifications not indicated in the table.
The Fund's assets assigned to the Level 2 input category are generally valued using the market approach, in which a security's value is determined through reference to prices and information from market transactions for similar or identical assets.
Futures contracts and swap contracts are valued at unrealized appreciation (depreciation).
There were no transfers of financial assets between Levels 1 and 2 during the period.
The accompanying Notes to Financial Statements are an integral part of this statement.
Semiannual Report 2016
16
COLUMBIA U.S. GOVERNMENT MORTGAGE FUND
PORTFOLIO OF INVESTMENTS (continued)
November 30, 2016 (Unaudited)
Fair Value Measurements (continued)
The following table is a reconciliation of Level 3 assets for which significant observable and unobservable inputs were used to determine fair value:
| | | Residential
Mortgage-Backed
Securities —
Non-Agency ($) | | Asset-Backed
Securities —
Non-Agency ($) | | Total ($) | |
Balance as of May 31, 2016 | | | 48,671,168 | | | | 22,120,002 | | | | 70,791,170 | | |
Increase (decrease) in accrued discounts/premiums | | | 311,166 | | | | 268 | | | | 311,434 | | |
Realized gain (loss) | | | 550,280 | | | | — | | | | 550,280 | | |
Change in unrealized appreciation (depreciation)(a) | | | 112,177 | | | | 2,104,397 | | | | 2,216,574 | | |
Sales | | | (29,752,645 | ) | | | — | | | | (29,752,645 | ) | |
Purchases | | | 21,487,253 | | | | 9,593,040 | | | | 31,080,293 | | |
Transfers out of Level 3 | | | (9,918,170 | ) | | | (11,500,000 | ) | | | (21,418,170 | ) | |
Balance as of November 30, 2016 | | | 31,461,229 | | | | 22,317,707 | | | | 53,778,936 | | |
(a) Change in unrealized appreciation (depreciation) relating to securities held at November 30, 2016 was $2,325,616, which is comprised of Residential Mortgage-Backed Securities — Non-Agency of $221,219 and Asset-Backed Securities — Non-Agency of $2,104,397.
The Fund's assets assigned to the Level 3 category are valued utilizing the valuation technique deemed the most appropriate in the circumstances. Certain Residential Mortgage and Asset Backed Securities classified as Level 3 are valued using the market approach and utilize single market quotations from broker dealers which may have included, but not limited to, the distressed nature of the security and observable transactions for similar assets in the market. Significant increases (decreases) to any of these inputs would result in a significantly lower (higher) fair value measurement.
Financial assets were transferred from Level 3 to Level 2 as observable market inputs were utilized and management determined that there was sufficient, reliable and observable market data to value these assets as of period end.
Transfers In | | Transfers Out | |
| Level 2 ($) | | Level 3 ($) | | Level 2 ($) | | Level 3 ($) | |
| | 21,418,170 | | | | — | | | | — | | | | 21,418,170 | | |
Transfers into and/or out of Level 3 are determined based on the fair value at the beginning of the period for security positions held throughout the period.
The accompanying Notes to Financial Statements are an integral part of this statement.
Semiannual Report 2016
17
COLUMBIA U.S. GOVERNMENT MORTGAGE FUND
STATEMENT OF ASSETS AND LIABILITIES
November 30, 2016 (Unaudited)
Assets | |
Investments, at value | |
Unaffiliated issuers (identified cost $2,798,294,118) | | $ | 2,774,404,350 | | |
Affiliated issuers (identified cost $9,968,151) | | | 9,969,148 | | |
Options purchased (identified cost $22,155,750) | | | 20,325,190 | | |
Repurchase agreements (identified cost $60,000,000) | | | 60,000,000 | | |
Total investments (identified cost $2,890,418,019) | | | 2,864,698,688 | | |
Cash | | | 259,156 | | |
Cash collateral held at broker | | | 10,252,000 | | |
Margin deposits | | | 882,288 | | |
Unrealized appreciation on swap contracts | | | 926,071 | | |
Receivable for: | |
Investments sold | | | 67,511,234 | | |
Investments sold on a delayed delivery basis | | | 26,099,125 | | |
Capital shares sold | | | 14,930,243 | | |
Dividends | | | 2,086 | | |
Interest | | | 9,523,815 | | |
Variation margin | | | 30,000 | | |
Expense reimbursement due from Investment Manager | | | 439 | | |
Prepaid expenses | | | 7,271 | | |
Trustees' deferred compensation plan | | | 70,418 | | |
Other assets | | | 16,998 | | |
Total assets | | | 2,995,209,832 | | |
Liabilities | |
Option contracts written, at value (premiums received $980,000) | | | 957,180 | | |
Forward sale commitments, at value (proceeds receivable $25,238,984) | | | 25,161,309 | | |
Unrealized depreciation on swap contracts | | | 51,984 | | |
Premiums received on outstanding swap contracts | | | 4,281,366 | | |
Payable for: | |
Investments purchased | | | 41,300,510 | | |
Investments purchased on a delayed delivery basis | | | 662,723,875 | | |
Capital shares purchased | | | 2,703,120 | | |
Dividend distributions to shareholders | | | 14,824,473 | | |
Interest on forward sale commitments | | | 75,250 | | |
Variation margin | | | 937,086 | | |
Management services fees | | | 29,850 | | |
Distribution and/or service fees | | | 6,117 | | |
Transfer agent fees | | | 192,345 | | |
Plan administration fees | | | 147 | | |
Compensation of board members | | | 126,509 | | |
Chief compliance officer expenses | | | 167 | | |
Other expenses | | | 96,271 | | |
Trustees' deferred compensation plan | | | 70,418 | | |
Total liabilities | | | 753,537,977 | | |
Net assets applicable to outstanding capital stock | | $ | 2,241,671,855 | | |
The accompanying Notes to Financial Statements are an integral part of this statement.
Semiannual Report 2016
18
COLUMBIA U.S. GOVERNMENT MORTGAGE FUND
STATEMENT OF ASSETS AND LIABILITIES (continued)
November 30, 2016 (Unaudited)
Represented by | |
Paid-in capital | | $ | 2,302,391,727 | | |
Excess of distributions over net investment income | | | (3,321,232 | ) | |
Accumulated net realized loss | | | (31,772,243 | ) | |
Unrealized appreciation (depreciation) on: | |
Investments — unaffiliated issuers | | | (23,889,768 | ) | |
Investments — affiliated issuers | | | 997 | | |
Forward sale commitments | | | 77,675 | | |
Futures contracts | | | (420,170 | ) | |
Options purchased | | | (1,830,560 | ) | |
Options contracts written | | | 22,820 | | |
Swap contracts | | | 412,609 | | |
Total — representing net assets applicable to outstanding capital stock | | $ | 2,241,671,855 | | |
Class A | |
Net assets | | $ | 676,282,798 | | |
Shares outstanding | | | 125,196,630 | | |
Net asset value per share | | $ | 5.40 | | |
Maximum offering price per share(a) | | $ | 5.57 | | |
Class B | |
Net assets | | $ | 720,729 | | |
Shares outstanding | | | 133,361 | | |
Net asset value per share | | $ | 5.40 | | |
Class C | |
Net assets | | $ | 52,533,394 | | |
Shares outstanding | | | 9,710,336 | | |
Net asset value per share | | $ | 5.41 | | |
Class I | |
Net assets | | $ | 795,634,169 | | |
Shares outstanding | | | 147,380,067 | | |
Net asset value per share | | $ | 5.40 | | |
Class K | |
Net assets | | $ | 663,379 | | |
Shares outstanding | | | 123,096 | | |
Net asset value per share | | $ | 5.39 | | |
Class R | |
Net assets | | $ | 44,115 | | |
Shares outstanding | | | 8,176 | | |
Net asset value per share | | $ | 5.40 | | |
Class R4 | |
Net assets | | $ | 65,541,188 | | |
Shares outstanding | | | 12,142,165 | | |
Net asset value per share | | $ | 5.40 | | |
The accompanying Notes to Financial Statements are an integral part of this statement.
Semiannual Report 2016
19
COLUMBIA U.S. GOVERNMENT MORTGAGE FUND
STATEMENT OF ASSETS AND LIABILITIES (continued)
November 30, 2016 (Unaudited)
Class R5 | |
Net assets | | $ | 26,301,945 | | |
Shares outstanding | | | 4,871,748 | | |
Net asset value per share | | $ | 5.40 | | |
Class W | |
Net assets | | $ | 3,003,617 | | |
Shares outstanding | | | 554,843 | | |
Net asset value per share | | $ | 5.41 | | |
Class Y | |
Net assets | | $ | 57,391,717 | | |
Shares outstanding | | | 10,681,799 | | |
Net asset value per share | | $ | 5.37 | | |
Class Z | |
Net assets | | $ | 563,554,804 | | |
Shares outstanding | | | 104,409,866 | | |
Net asset value per share | | $ | 5.40 | | |
(a) The maximum offering price per share is calculated by dividing the net asset value per share by 1.0 minus the maximum sales charge of 3.00%.
The accompanying Notes to Financial Statements are an integral part of this statement.
Semiannual Report 2016
20
COLUMBIA U.S. GOVERNMENT MORTGAGE FUND
STATEMENT OF OPERATIONS
Six Months Ended November 30, 2016 (Unaudited)
Net investment income | |
Income: | |
Dividends — affiliated issuers | | $ | 31,143 | | |
Interest | | | 33,947,455 | | |
Total income | | | 33,978,598 | | |
Expenses: | |
Management services fees | | | 5,505,048 | | |
Distribution and/or service fees | |
Class A | | | 851,050 | | |
Class B | | | 4,054 | | |
Class C | | | 256,217 | | |
Class R | | | 85 | | |
Class W | | | 4,365 | | |
Transfer agent fees | |
Class A | | | 575,202 | | |
Class B | | | 688 | | |
Class C | | | 43,238 | | |
Class K | | | 161 | | |
Class R | | | 28 | | |
Class R4 | | | 52,051 | | |
Class R5 | | | 6,147 | | |
Class W | | | 2,955 | | |
Class Z | | | 493,919 | | |
Plan administration fees | |
Class K | | | 801 | | |
Compensation of board members | | | 23,812 | | |
Custodian fees | | | 23,201 | | |
Printing and postage fees | | | 66,983 | | |
Registration fees | | | 101,277 | | |
Audit fees | | | 20,784 | | |
Legal fees | | | 15,037 | | |
Chief compliance officer expenses | | | 167 | | |
Other | | | 28,442 | | |
Total expenses | | | 8,075,712 | | |
Fees waived or expenses reimbursed by Investment Manager and its affiliates | | | (237,734 | ) | |
Expense reductions | | | (4,493 | ) | |
Total net expenses | | | 7,833,485 | | |
Net investment income | | | 26,145,113 | | |
Realized and unrealized gain (loss) — net | |
Net realized gain (loss) on: | |
Investments — unaffiliated issuers | | | 7,180,635 | | |
Investments — affiliated issuers | | | (12 | ) | |
Futures contracts | | | (4,180,700 | ) | |
Options purchased | | | (3,391,500 | ) | |
Options contracts written | | | 2,805,000 | | |
Swap contracts | | | (5,863,347 | ) | |
Net realized loss | | | (3,449,924 | ) | |
Net change in unrealized appreciation (depreciation) on: | |
Investments — unaffiliated issuers | | | (36,472,366 | ) | |
Investments — affiliated issuers | | | 997 | | |
Forward sale commitments | | | 77,675 | | |
Futures contracts | | | (657,974 | ) | |
Options purchased | | | 15,753,833 | | |
Options contracts written | | | (2,249,720 | ) | |
Swap contracts | | | 3,615,898 | | |
Net change in unrealized depreciation | | | (19,931,657 | ) | |
Net realized and unrealized loss | | | (23,381,581 | ) | |
Net increase in net assets resulting from operations | | $ | 2,763,532 | | |
The accompanying Notes to Financial Statements are an integral part of this statement.
Semiannual Report 2016
21
COLUMBIA U.S. GOVERNMENT MORTGAGE FUND
STATEMENT OF CHANGES IN NET ASSETS
| | | Six Months Ended
November 30, 2016
(Unaudited) | | Year Ended
May 31,
2016(a) | |
Operations | |
Net investment income | | $ | 26,145,113 | | | $ | 51,450,566 | | |
Net realized gain (loss) | | | (3,449,924 | ) | | | 161,607 | | |
Net change in unrealized depreciation | | | (19,931,657 | ) | | | (20,099,568 | ) | |
Net increase in net assets resulting from operations | | | 2,763,532 | | | | 31,512,605 | | |
Distributions to shareholders | |
Net investment income | |
Class A | | | (6,694,759 | ) | | | (15,078,133 | ) | |
Class B | | | (4,914 | ) | | | (20,995 | ) | |
Class C | | | (310,654 | ) | | | (673,592 | ) | |
Class I | | | (9,564,893 | ) | | | (21,322,586 | ) | |
Class K | | | (6,640 | ) | | | (14,305 | ) | |
Class R | | | (293 | ) | | | (46 | ) | |
Class R4 | | | (684,876 | ) | | | (949,842 | ) | |
Class R5 | | | (284,824 | ) | | | (531,698 | ) | |
Class W | | | (34,396 | ) | | | (415,717 | ) | |
Class Y | | | (639,114 | ) | | | (308,995 | ) | |
Class Z | | | (6,483,282 | ) | | | (12,207,516 | ) | |
Net realized gains | |
Class A | | | (3,226,429 | ) | | | (1,897,819 | ) | |
Class B | | | (3,439 | ) | | | (3,612 | ) | |
Class C | | | (250,671 | ) | | | (118,500 | ) | |
Class I | | | (3,791,333 | ) | | | (2,282,246 | ) | |
Class K | | | (3,168 | ) | | | (1,688 | ) | |
Class R | | | (211 | ) | | | — | | |
Class R4 | | | (312,218 | ) | | | (108,362 | ) | |
Class R5 | | | (125,525 | ) | | | (46,988 | ) | |
Class W | | | (14,495 | ) | | | (39,707 | ) | |
Class Y | | | (273,873 | ) | | | (16,822 | ) | |
Class Z | | | (2,694,538 | ) | | | (1,322,277 | ) | |
Total distributions to shareholders | | | (35,404,545 | ) | | | (57,361,446 | ) | |
Increase in net assets from capital stock activity | | | 141,081,653 | | | | 225,118,810 | | |
Total increase in net assets | | | 108,440,640 | | | | 199,269,969 | | |
Net assets at beginning of period | | | 2,133,231,215 | | | | 1,933,961,246 | | |
Net assets at end of period | | $ | 2,241,671,855 | | | $ | 2,133,231,215 | | |
Excess of distributions over net investment income | | $ | (3,321,232 | ) | | $ | (4,757,700 | ) | |
(a) Class R shares are based on operations from March 1, 2016 (commencement of operations) through the stated period end.
The accompanying Notes to Financial Statements are an integral part of this statement.
Semiannual Report 2016
22
COLUMBIA U.S. GOVERNMENT MORTGAGE FUND
STATEMENT OF CHANGES IN NET ASSETS (continued)
| | | Six Months Ended November 30, 2016
(Unaudited) | | Year Ended May 31, 2016(a) | |
| | | Shares | | Dollars ($) | | Shares | | Dollars ($) | |
Capital stock activity | |
Class A shares | |
Subscriptions(b) | | | 22,434,587 | | | | 123,780,735 | | | | 53,299,478 | | | | 291,945,458 | | |
Distributions reinvested | | | 1,489,637 | | | | 8,148,131 | | | | 2,598,437 | | | | 14,209,051 | | |
Redemptions | | | (21,138,617 | ) | | | (116,438,352 | ) | | | (37,141,561 | ) | | | (203,124,678 | ) | |
Net increase | | | 2,785,607 | | | | 15,490,514 | | | | 18,756,354 | | | | 103,029,831 | | |
Class B shares | |
Subscriptions | | | 18,608 | | | | 102,808 | | | | 40,552 | | | | 222,975 | | |
Distributions reinvested | | | 1,259 | | | | 6,878 | | | | 3,369 | | | | 18,452 | | |
Redemptions(b) | | | (50,648 | ) | | | (279,293 | ) | | | (198,392 | ) | | | (1,087,152 | ) | |
Net decrease | | | (30,781 | ) | | | (169,607 | ) | | | (154,471 | ) | | | (845,725 | ) | |
Class C shares | |
Subscriptions | | | 2,022,738 | | | | 11,171,501 | | | | 3,815,848 | | | | 20,908,379 | | |
Distributions reinvested | | | 90,718 | | | | 495,814 | | | | 120,462 | | | | 659,761 | | |
Redemptions | | | (1,048,015 | ) | | | (5,772,447 | ) | | | (1,917,926 | ) | | | (10,525,186 | ) | |
Net increase | | | 1,065,441 | | | | 5,894,868 | | | | 2,018,384 | | | | 11,042,954 | | |
Class I shares | |
Subscriptions | | | 16,901,986 | | | | 93,048,976 | | | | 28,528,711 | | | | 156,566,244 | | |
Distributions reinvested | | | 2,441,203 | | | | 13,356,056 | | | | 4,316,314 | | | | 23,604,514 | | |
Redemptions | | | (7,524,631 | ) | | | (41,568,240 | ) | | | (41,850,603 | ) | | | (229,161,270 | ) | |
Net increase (decrease) | | | 11,818,558 | | | | 64,836,792 | | | | (9,005,578 | ) | | | (48,990,512 | ) | |
Class K shares | |
Subscriptions | | | 8,805 | | | | 48,080 | | | | 16,138 | | | | 88,242 | | |
Distributions reinvested | | | 1,769 | | | | 9,654 | | | | 2,878 | | | | 15,708 | | |
Redemptions | | | (817 | ) | | | (4,442 | ) | | | (2,699 | ) | | | (14,748 | ) | |
Net increase | | | 9,757 | | | | 53,292 | | | | 16,317 | | | | 89,202 | | |
Class R shares | |
Subscriptions | | | 6,893 | | | | 38,034 | | | | 1,842 | | | | 10,000 | | |
Distributions reinvested | | | 68 | | | | 369 | | | | — | | | | — | | |
Redemptions | | | (627 | ) | | | (3,460 | ) | | | — | | | | — | | |
Net increase | | | 6,334 | | | | 34,943 | | | | 1,842 | | | | 10,000 | | |
Class R4 shares | |
Subscriptions | | | 3,861,961 | | | | 21,265,622 | | | | 7,840,409 | | | | 42,873,067 | | |
Distributions reinvested | | | 154,613 | | | | 845,261 | | | | 148,609 | | | | 811,402 | | |
Redemptions | | | (1,347,755 | ) | | | (7,429,662 | ) | | | (2,371,774 | ) | | | (12,952,777 | ) | |
Net increase | | | 2,668,819 | | | | 14,681,221 | | | | 5,617,244 | | | | 30,731,692 | | |
The accompanying Notes to Financial Statements are an integral part of this statement.
Semiannual Report 2016
23
COLUMBIA U.S. GOVERNMENT MORTGAGE FUND
STATEMENT OF CHANGES IN NET ASSETS (continued)
| | | Six Months Ended November 30, 2016
(Unaudited) | | Year Ended May 31, 2016(a) | |
| | | Shares | | Dollars ($) | | Shares | | Dollars ($) | |
Capital stock activity (continued) | |
Class R5 shares | |
Subscriptions | | | 1,261,836 | | | | 6,929,372 | | | | 4,932,556 | | | | 27,050,716 | | |
Distributions reinvested | | | 74,991 | | | | 410,086 | | | | 105,810 | | | | 578,686 | | |
Redemptions | | | (623,726 | ) | | | (3,437,712 | ) | | | (3,028,583 | ) | | | (16,579,758 | ) | |
Net increase | | | 713,101 | | | | 3,901,746 | | | | 2,009,783 | | | | 11,049,644 | | |
Class W shares | |
Subscriptions | | | 44,801 | | | | 247,587 | | | | 551,656 | | | | 3,025,658 | | |
Distributions reinvested | | | 8,889 | | | | 48,743 | | | | 82,851 | | | | 455,149 | | |
Redemptions | | | (151,197 | ) | | | (830,112 | ) | | | (6,153,814 | ) | | | (33,835,293 | ) | |
Net decrease | | | (97,507 | ) | | | (533,782 | ) | | | (5,519,307 | ) | | | (30,354,486 | ) | |
Class Y shares | |
Subscriptions | | | 2,517,142 | | | | 13,821,363 | | | | 8,965,593 | | | | 48,678,632 | | |
Distributions reinvested | | | 167,738 | | | | 912,820 | | | | 59,858 | | | | 325,505 | | |
Redemptions | | | (841,201 | ) | | | (4,616,638 | ) | | | (409,568 | ) | | | (2,229,132 | ) | |
Net increase | | | 1,843,679 | | | | 10,117,545 | | | | 8,615,883 | | | | 46,775,005 | | |
Class Z shares | |
Subscriptions | | | 27,846,950 | | | | 153,470,996 | | | | 52,773,919 | | | | 288,029,897 | | |
Distributions reinvested | | | 945,365 | | | | 5,171,387 | | | | 1,434,875 | | | | 7,842,705 | | |
Redemptions | | | (23,978,882 | ) | | | (131,868,262 | ) | | | (35,344,752 | ) | | | (193,291,397 | ) | |
Net increase | | | 4,813,433 | | | | 26,774,121 | | | | 18,864,042 | | | | 102,581,205 | | |
Total net increase | | | 25,596,441 | | | | 141,081,653 | | | | 41,220,493 | | | | 225,118,810 | | |
(a) Class R shares are based on operations from March 1, 2016 (commencement of operations) through the stated period end.
(b) Includes conversions of Class B shares to Class A shares, if any.
The accompanying Notes to Financial Statements are an integral part of this statement.
Semiannual Report 2016
24
COLUMBIA U.S. GOVERNMENT MORTGAGE FUND
The following tables are intended to help you understand the Fund's financial performance. Certain information reflects financial results for a single share of a class held for the periods shown. Per share net investment income (loss) amounts are calculated based on average shares outstanding during the period. Total return assumes reinvestment of all dividends and distributions, if any. Total return does not reflect payment of sales charges, if any. Total return and portfolio turnover are not annualized for periods of less than one year. The portfolio turnover rate is calculated without regard to purchase and sales transactions of short-term instruments and certain derivatives, if any. If such transactions were included, the Fund's portfolio turnover rate may be higher.
| | | Six Months Ended
November 30, 2016 | | Year Ended May 31, | |
Class A | | (Unaudited) | | 2016 | | 2015 | | 2014 | | 2013 | | 2012 | |
Per share data | |
Net asset value, beginning of period | | $ | 5.48 | | | $ | 5.55 | | | $ | 5.48 | | | $ | 5.56 | | | $ | 5.63 | | | $ | 5.46 | | |
Income from investment operations: | |
Net investment income | | | 0.06 | | | | 0.13 | | | | 0.13 | | | | 0.12 | | | | 0.10 | | | | 0.16 | | |
Net realized and unrealized gain (loss) | | | (0.06 | ) | | | (0.05 | ) | | | 0.08 | | | | (0.01 | ) | | | 0.08 | | | | 0.19 | | |
Total from investment operations | | | — | | | | 0.08 | | | | 0.21 | | | | 0.11 | | | | 0.18 | | | | 0.35 | | |
Less distributions to shareholders: | |
Net investment income | | | (0.05 | ) | | | (0.13 | ) | | | (0.14 | ) | | | (0.17 | ) | | | (0.14 | ) | | | (0.16 | ) | |
Net realized gains | | | (0.03 | ) | | | (0.02 | ) | | | — | | | | (0.02 | ) | | | (0.11 | ) | | | (0.02 | ) | |
Total distributions to shareholders | | | (0.08 | ) | | | (0.15 | ) | | | (0.14 | ) | | | (0.19 | ) | | | (0.25 | ) | | | (0.18 | ) | |
Proceeds from regulatory settlements | | | — | | | | — | | | | — | | | | — | | | | — | | | | 0.00 | (a) | |
Net asset value, end of period | | $ | 5.40 | | | $ | 5.48 | | | $ | 5.55 | | | $ | 5.48 | | | $ | 5.56 | | | $ | 5.63 | | |
Total return | | | (0.01 | %) | | | 1.45 | % | | | 3.80 | % | | | 2.13 | % | | | 3.28 | % | | | 6.55 | % | |
Ratios to average net assets(b) | |
Total gross expenses | | | 0.93 | %(c) | | | 0.97 | % | | | 0.97 | % | | | 0.95 | % | | | 0.94 | % | | | 0.92 | % | |
Total net expenses(d) | | | 0.90 | %(c)(e) | | | 0.89 | %(e) | | | 0.87 | %(e) | | | 0.86 | %(e) | | | 0.86 | %(e) | | | 0.85 | %(e) | |
Net investment income | | | 2.08 | %(c) | | | 2.39 | % | | | 2.34 | % | | | 2.23 | % | | | 1.81 | % | | | 2.83 | % | |
Supplemental data | |
Net assets, end of period (in thousands) | | $ | 676,283 | | | $ | 670,575 | | | $ | 575,613 | | | $ | 560,484 | | | $ | 729,893 | | | $ | 616,112 | | |
Portfolio turnover | | | 165 | % | | | 328 | % | | | 358 | % | | | 413 | % | | | 576 | % | | | 545 | % | |
Notes to Financial Highlights
(a) Rounds to zero.
(b) In addition to the fees and expenses that the Fund bears directly, the Fund indirectly bears a pro rata share of the fees and expenses of any other funds in which it invests. Such indirect expenses are not included in the Fund's reported expense ratios.
(c) Annualized.
(d) Total net expenses include the impact of certain fee waivers/expense reimbursements made by the Investment Manager and certain of its affiliates, if applicable.
(e) The benefits derived from expense reductions had an impact of less than 0.01%.
The accompanying Notes to Financial Statements are an integral part of this statement.
Semiannual Report 2016
25
COLUMBIA U.S. GOVERNMENT MORTGAGE FUND
FINANCIAL HIGHLIGHTS (continued)
| | | Six Months Ended
November 30, 2016 | | Year Ended May 31, | |
Class B | | (Unaudited) | | 2016 | | 2015 | | 2014 | | 2013 | | 2012 | |
Per share data | |
Net asset value, beginning of period | | $ | 5.48 | | | $ | 5.56 | | | $ | 5.48 | | | $ | 5.57 | | | $ | 5.64 | | | $ | 5.47 | | |
Income from investment operations: | |
Net investment income | | | 0.04 | | | | 0.09 | | | | 0.09 | | | | 0.08 | | | | 0.06 | | | | 0.12 | | |
Net realized and unrealized gain (loss) | | | (0.06 | ) | | | (0.06 | ) | | | 0.09 | | | | (0.02 | ) | | | 0.08 | | | | 0.19 | | |
Total from investment operations | | | (0.02 | ) | | | 0.03 | | | | 0.18 | | | | 0.06 | | | | 0.14 | | | | 0.31 | | |
Less distributions to shareholders: | |
Net investment income | | | (0.03 | ) | | | (0.09 | ) | | | (0.10 | ) | | | (0.13 | ) | | | (0.10 | ) | | | (0.12 | ) | |
Net realized gains | | | (0.03 | ) | | | (0.02 | ) | | | — | | | | (0.02 | ) | | | (0.11 | ) | | | (0.02 | ) | |
Total distributions to shareholders | | | (0.06 | ) | | | (0.11 | ) | | | (0.10 | ) | | | (0.15 | ) | | | (0.21 | ) | | | (0.14 | ) | |
Proceeds from regulatory settlements | | | — | | | | — | | | | — | | | | — | | | | — | | | | 0.00 | (a) | |
Net asset value, end of period | | $ | 5.40 | | | $ | 5.48 | | | $ | 5.56 | | | $ | 5.48 | | | $ | 5.57 | | | $ | 5.64 | | |
Total return | | | (0.38 | %) | | | 0.50 | % | | | 3.23 | % | | | 1.19 | % | | | 2.51 | % | | | 5.73 | % | |
Ratios to average net assets(b) | |
Total gross expenses | | | 1.67 | %(c) | | | 1.72 | % | | | 1.71 | % | | | 1.70 | % | | | 1.68 | % | | | 1.68 | % | |
Total net expenses(d) | | | 1.65 | %(c)(e) | | | 1.64 | %(e) | | | 1.62 | %(e) | | | 1.61 | %(e) | | | 1.61 | %(e) | | | 1.60 | %(e) | |
Net investment income | | | 1.32 | %(c) | | | 1.64 | % | | | 1.56 | % | | | 1.47 | % | | | 1.07 | % | | | 2.09 | % | |
Supplemental data | |
Net assets, end of period (in thousands) | | $ | 721 | | | $ | 900 | | | $ | 1,770 | | | $ | 2,806 | | | $ | 5,775 | | | $ | 8,495 | | |
Portfolio turnover | | | 165 | % | | | 328 | % | | | 358 | % | | | 413 | % | | | 576 | % | | | 545 | % | |
Notes to Financial Highlights
(a) Rounds to zero.
(b) In addition to the fees and expenses that the Fund bears directly, the Fund indirectly bears a pro rata share of the fees and expenses of any other funds in which it invests. Such indirect expenses are not included in the Fund's reported expense ratios.
(c) Annualized.
(d) Total net expenses include the impact of certain fee waivers/expense reimbursements made by the Investment Manager and certain of its affiliates, if applicable.
(e) The benefits derived from expense reductions had an impact of less than 0.01%.
The accompanying Notes to Financial Statements are an integral part of this statement.
Semiannual Report 2016
26
COLUMBIA U.S. GOVERNMENT MORTGAGE FUND
FINANCIAL HIGHLIGHTS (continued)
| | | Six Months Ended
November 30, 2016 | | Year Ended May 31, | |
Class C | | (Unaudited) | | 2016 | | 2015 | | 2014 | | 2013 | | 2012 | |
Per share data | |
Net asset value, beginning of period | | $ | 5.49 | | | $ | 5.56 | | | $ | 5.49 | | | $ | 5.57 | | | $ | 5.64 | | | $ | 5.47 | | |
Income from investment operations: | |
Net investment income | | | 0.04 | | | | 0.09 | | | | 0.09 | | | | 0.08 | | | | 0.06 | | | | 0.11 | | |
Net realized and unrealized gain (loss) | | | (0.06 | ) | | | (0.05 | ) | | | 0.08 | | | | (0.01 | ) | | | 0.08 | | | | 0.20 | | |
Total from investment operations | | | (0.02 | ) | | | 0.04 | | | | 0.17 | | | | 0.07 | | | | 0.14 | | | | 0.31 | | |
Less distributions to shareholders: | |
Net investment income | | | (0.03 | ) | | | (0.09 | ) | | | (0.10 | ) | | | (0.13 | ) | | | (0.10 | ) | | | (0.12 | ) | |
Net realized gains | | | (0.03 | ) | | | (0.02 | ) | | | — | | | | (0.02 | ) | | | (0.11 | ) | | | (0.02 | ) | |
Total distributions to shareholders | | | (0.06 | ) | | | (0.11 | ) | | | (0.10 | ) | | | (0.15 | ) | | | (0.21 | ) | | | (0.14 | ) | |
Proceeds from regulatory settlements | | | — | | | | — | | | | — | | | | — | | | | — | | | | 0.00 | (a) | |
Net asset value, end of period | | $ | 5.41 | | | $ | 5.49 | | | $ | 5.56 | | | $ | 5.49 | | | $ | 5.57 | | | $ | 5.64 | | |
Total return | | | (0.38 | %) | | | 0.68 | % | | | 3.04 | % | | | 1.37 | % | | | 2.50 | % | | | 5.73 | % | |
Ratios to average net assets(b) | |
Total gross expenses | | | 1.67 | %(c) | | | 1.72 | % | | | 1.71 | % | | | 1.70 | % | | | 1.69 | % | | | 1.67 | % | |
Total net expenses(d) | | | 1.65 | %(c)(e) | | | 1.64 | %(e) | | | 1.62 | %(e) | | | 1.61 | %(e) | | | 1.61 | %(e) | | | 1.60 | %(e) | |
Net investment income | | | 1.33 | %(c) | | | 1.63 | % | | | 1.58 | % | | | 1.49 | % | | | 1.00 | % | | | 2.03 | % | |
Supplemental data | |
Net assets, end of period (in thousands) | | $ | 52,533 | | | $ | 47,429 | | | $ | 36,855 | | | $ | 38,790 | | | $ | 68,017 | | | $ | 32,691 | | |
Portfolio turnover | | | 165 | % | | | 328 | % | | | 358 | % | | | 413 | % | | | 576 | % | | | 545 | % | |
Notes to Financial Highlights
(a) Rounds to zero.
(b) In addition to the fees and expenses that the Fund bears directly, the Fund indirectly bears a pro rata share of the fees and expenses of any other funds in which it invests. Such indirect expenses are not included in the Fund's reported expense ratios.
(c) Annualized.
(d) Total net expenses include the impact of certain fee waivers/expense reimbursements made by the Investment Manager and certain of its affiliates, if applicable.
(e) The benefits derived from expense reductions had an impact of less than 0.01%.
The accompanying Notes to Financial Statements are an integral part of this statement.
Semiannual Report 2016
27
COLUMBIA U.S. GOVERNMENT MORTGAGE FUND
FINANCIAL HIGHLIGHTS (continued)
| | | Six Months Ended
November 30, 2016 | | Year Ended May 31, | |
Class I | | (Unaudited) | | 2016 | | 2015 | | 2014 | | 2013 | | 2012 | |
Per share data | |
Net asset value, beginning of period | | $ | 5.47 | | | $ | 5.55 | | | $ | 5.48 | | | $ | 5.56 | | | $ | 5.63 | | | $ | 5.46 | | |
Income from investment operations: | |
Net investment income | | | 0.07 | | | | 0.15 | | | | 0.15 | | | | 0.14 | | | | 0.12 | | | | 0.17 | | |
Net realized and unrealized gain (loss) | | | (0.05 | ) | | | (0.06 | ) | | | 0.08 | | | | (0.01 | ) | | | 0.08 | | | | 0.20 | | |
Total from investment operations | | | 0.02 | | | | 0.09 | | | | 0.23 | | | | 0.13 | | | | 0.20 | | | | 0.37 | | |
Less distributions to shareholders: | |
Net investment income | | | (0.06 | ) | | | (0.15 | ) | | | (0.16 | ) | | | (0.19 | ) | | | (0.16 | ) | | | (0.18 | ) | |
Net realized gains | | | (0.03 | ) | | | (0.02 | ) | | | — | | | | (0.02 | ) | | | (0.11 | ) | | | (0.02 | ) | |
Total distributions to shareholders | | | (0.09 | ) | | | (0.17 | ) | | | (0.16 | ) | | | (0.21 | ) | | | (0.27 | ) | | | (0.20 | ) | |
Proceeds from regulatory settlements | | | — | | | | — | | | | — | | | | — | | | | — | | | | 0.00 | (a) | |
Net asset value, end of period | | $ | 5.40 | | | $ | 5.47 | | | $ | 5.55 | | | $ | 5.48 | | | $ | 5.56 | | | $ | 5.63 | | |
Total return | | | 0.37 | % | | | 1.66 | % | | | 4.21 | % | | | 2.52 | % | | | 3.65 | % | | | 6.90 | % | |
Ratios to average net assets(b) | |
Total gross expenses | | | 0.51 | %(c) | | | 0.51 | % | | | 0.51 | % | | | 0.51 | % | | | 0.51 | % | | | 0.52 | % | |
Total net expenses(d) | | | 0.50 | %(c) | | | 0.49 | % | | | 0.49 | % | | | 0.49 | % | | | 0.50 | % | | | 0.52 | % | |
Net investment income | | | 2.50 | %(c) | | | 2.79 | % | | | 2.71 | % | | | 2.60 | % | | | 2.17 | % | | | 3.12 | % | |
Supplemental data | |
Net assets, end of period (in thousands) | | $ | 795,634 | | | $ | 742,193 | | | $ | 802,326 | | | $ | 785,350 | | | $ | 789,766 | | | $ | 739,181 | | |
Portfolio turnover | | | 165 | % | | | 328 | % | | | 358 | % | | | 413 | % | | | 576 | % | | | 545 | % | |
Notes to Financial Highlights
(a) Rounds to zero.
(b) In addition to the fees and expenses that the Fund bears directly, the Fund indirectly bears a pro rata share of the fees and expenses of any other funds in which it invests. Such indirect expenses are not included in the Fund's reported expense ratios.
(c) Annualized.
(d) Total net expenses include the impact of certain fee waivers/expense reimbursements made by the Investment Manager and certain of its affiliates, if applicable.
The accompanying Notes to Financial Statements are an integral part of this statement.
Semiannual Report 2016
28
COLUMBIA U.S. GOVERNMENT MORTGAGE FUND
FINANCIAL HIGHLIGHTS (continued)
| | | Six Months Ended
November 30, 2016 | | Year Ended May 31, | |
Class K | | (Unaudited) | | 2016 | | 2015 | | 2014 | | 2013 | | 2012 | |
Per share data | |
Net asset value, beginning of period | | $ | 5.47 | | | $ | 5.54 | | | $ | 5.47 | | | $ | 5.55 | | | $ | 5.62 | | | $ | 5.46 | | |
Income from investment operations: | |
Net investment income | | | 0.06 | | | | 0.14 | | | | 0.14 | | | | 0.13 | | | | 0.11 | | | | 0.16 | | |
Net realized and unrealized gain (loss) | | | (0.06 | ) | | | (0.06 | ) | | | 0.07 | | | | (0.01 | ) | | | 0.08 | | | | 0.18 | | |
Total from investment operations | | | — | | | | 0.08 | | | | 0.21 | | | | 0.12 | | | | 0.19 | | | | 0.34 | | |
Less distributions to shareholders: | |
Net investment income | | | (0.05 | ) | | | (0.13 | ) | | | (0.14 | ) | | | (0.18 | ) | | | (0.15 | ) | | | (0.16 | ) | |
Net realized gains | | | (0.03 | ) | | | (0.02 | ) | | | — | | | | (0.02 | ) | | | (0.11 | ) | | | (0.02 | ) | |
Total distributions to shareholders | | | (0.08 | ) | | | (0.15 | ) | | | (0.14 | ) | | | (0.20 | ) | | | (0.26 | ) | | | (0.18 | ) | |
Proceeds from regulatory settlements | | | — | | | | — | | | | — | | | | — | | | | — | | | | 0.00 | (a) | |
Net asset value, end of period | | $ | 5.39 | | | $ | 5.47 | | | $ | 5.54 | | | $ | 5.47 | | | $ | 5.55 | | | $ | 5.62 | | |
Total return | | | 0.04 | % | | | 1.55 | % | | | 3.89 | % | | | 2.20 | % | | | 3.33 | % | | | 6.41 | % | |
Ratios to average net assets(b) | |
Total gross expenses | | | 0.81 | %(c) | | | 0.82 | % | | | 0.82 | % | | | 0.81 | % | | | 0.81 | % | | | 0.82 | % | |
Total net expenses(d) | | | 0.80 | %(c) | | | 0.79 | % | | | 0.80 | % | | | 0.79 | % | | | 0.80 | % | | | 0.80 | % | |
Net investment income | | | 2.19 | %(c) | | | 2.49 | % | | | 2.50 | % | | | 2.32 | % | | | 1.88 | % | | | 2.87 | % | |
Supplemental data | |
Net assets, end of period (in thousands) | | $ | 663 | | | $ | 619 | | | $ | 538 | | | $ | 84 | | | $ | 83 | | | $ | 80 | | |
Portfolio turnover | | | 165 | % | | | 328 | % | | | 358 | % | | | 413 | % | | | 576 | % | | | 545 | % | |
Notes to Financial Highlights
(a) Rounds to zero.
(b) In addition to the fees and expenses that the Fund bears directly, the Fund indirectly bears a pro rata share of the fees and expenses of any other funds in which it invests. Such indirect expenses are not included in the Fund's reported expense ratios.
(c) Annualized.
(d) Total net expenses include the impact of certain fee waivers/expense reimbursements made by the Investment Manager and certain of its affiliates, if applicable.
The accompanying Notes to Financial Statements are an integral part of this statement.
Semiannual Report 2016
29
COLUMBIA U.S. GOVERNMENT MORTGAGE FUND
FINANCIAL HIGHLIGHTS (continued)
Class R | | Six Months Ended
November 30, 2016
(Unaudited) | | Year Ended
May 31,
2016(a) | |
Per share data | |
Net asset value, beginning of period | | $ | 5.47 | | | $ | 5.43 | | |
Income from investment operations: | |
Net investment income | | | 0.05 | | | | 0.03 | | |
Net realized and unrealized gain (loss) | | | (0.05 | ) | | | 0.03 | (b) | |
Total from investment operations | | | — | | | | 0.06 | | |
Less distributions to shareholders: | |
Net investment income | | | (0.04 | ) | | | (0.02 | ) | |
Net realized gains | | | (0.03 | ) | | | — | | |
Total distributions to shareholders | | | (0.07 | ) | | | (0.02 | ) | |
Net asset value, end of period | | $ | 5.40 | | | $ | 5.47 | | |
Total return | | | 0.05 | % | | | 1.20 | % | |
Ratios to average net assets(c) | |
Total gross expenses | | | 1.18 | %(d) | | | 1.20 | %(d) | |
Total net expenses(e) | | | 1.15 | %(d)(f) | | | 1.15 | %(d) | |
Net investment income | | | 1.82 | %(d) | | | 1.95 | %(d) | |
Supplemental data | |
Net assets, end of period (in thousands) | | $ | 44 | | | $ | 10 | | |
Portfolio turnover | | | 165 | % | | | 328 | % | |
Notes to Financial Highlights
(a) Based on operations from March 1, 2016 (commencement of operations) through the stated period end.
(b) Calculation of the net gain (loss) per share (both realized and unrealized) does not correlate to the aggregate realized and unrealized gain (loss) presented in the Statement of Operations due to the timing of subscriptions and redemptions of Fund shares in relation to fluctuations in the market value of the portfolio.
(c) In addition to the fees and expenses that the Fund bears directly, the Fund indirectly bears a pro rata share of the fees and expenses of any other funds in which it invests. Such indirect expenses are not included in the Fund's reported expense ratios.
(d) Annualized.
(e) Total net expenses include the impact of certain fee waivers/expense reimbursements made by the Investment Manager and certain of its affiliates, if applicable.
(f) The benefits derived from expense reductions had an impact of less than 0.01%.
The accompanying Notes to Financial Statements are an integral part of this statement.
Semiannual Report 2016
30
COLUMBIA U.S. GOVERNMENT MORTGAGE FUND
FINANCIAL HIGHLIGHTS (continued)
| | | Six Months Ended
November 30, 2016 | | Year Ended May 31, | |
Class R4 | | (Unaudited) | | 2016 | | 2015 | | 2014 | | 2013(a) | |
Per share data | |
Net asset value, beginning of period | | $ | 5.47 | | | $ | 5.55 | | | $ | 5.48 | | | $ | 5.56 | | | $ | 5.76 | | |
Income from investment operations: | |
Net investment income | | | 0.06 | | | | 0.14 | | | | 0.15 | | | | 0.14 | | | | 0.06 | | |
Net realized and unrealized gain (loss) | | | (0.04 | ) | | | (0.06 | ) | | | 0.07 | | | | (0.01 | ) | | | (0.06 | )(b) | |
Total from investment operations | | | 0.02 | | | | 0.08 | | | | 0.22 | | | | 0.13 | | | | — | | |
Less distributions to shareholders: | |
Net investment income | | | (0.06 | ) | | | (0.14 | ) | | | (0.15 | ) | | | (0.19 | ) | | | (0.09 | ) | |
Net realized gains | | | (0.03 | ) | | | (0.02 | ) | | | — | | | | (0.02 | ) | | | (0.11 | ) | |
Total distributions to shareholders | | | (0.09 | ) | | | (0.16 | ) | | | (0.15 | ) | | | (0.21 | ) | | | (0.20 | ) | |
Net asset value, end of period | | $ | 5.40 | | | $ | 5.47 | | | $ | 5.55 | | | $ | 5.48 | | | $ | 5.56 | | |
Total return | | | 0.30 | % | | | 1.51 | % | | | 4.07 | % | | | 2.40 | % | | | (0.01 | %) | |
Ratios to average net assets(c) | |
Total gross expenses | | | 0.68 | %(d) | | | 0.72 | % | | | 0.72 | % | | | 0.70 | % | | | 0.73 | %(d) | |
Total net expenses(e) | | | 0.65 | %(d)(f) | | | 0.65 | %(f) | | | 0.63 | %(f) | | | 0.61 | %(f) | | | 0.61 | %(d) | |
Net investment income | | | 2.34 | %(d) | | | 2.64 | % | | | 2.67 | % | | | 2.54 | % | | | 2.11 | %(d) | |
Supplemental data | |
Net assets, end of period (in thousands) | | $ | 65,541 | | | $ | 51,857 | | | $ | 21,401 | | | $ | 12,510 | | | $ | 181 | | |
Portfolio turnover | | | 165 | % | | | 328 | % | | | 358 | % | | | 413 | % | | | 576 | % | |
Notes to Financial Highlights
(a) Based on operations from November 8, 2012 (commencement of operations) through the stated period end.
(b) Calculation of the net gain (loss) per share (both realized and unrealized) does not correlate to the aggregate realized and unrealized gain (loss) presented in the Statement of Operations due to the timing of subscriptions and redemptions of Fund shares in relation to fluctuations in the market value of the portfolio.
(c) In addition to the fees and expenses that the Fund bears directly, the Fund indirectly bears a pro rata share of the fees and expenses of any other funds in which it invests. Such indirect expenses are not included in the Fund's reported expense ratios.
(d) Annualized.
(e) Total net expenses include the impact of certain fee waivers/expense reimbursements made by the Investment Manager and certain of its affiliates, if applicable.
(f) The benefits derived from expense reductions had an impact of less than 0.01%.
The accompanying Notes to Financial Statements are an integral part of this statement.
Semiannual Report 2016
31
COLUMBIA U.S. GOVERNMENT MORTGAGE FUND
FINANCIAL HIGHLIGHTS (continued)
| | | Six Months Ended
November 30, 2016 | | Year Ended May 31, | |
Class R5 | | (Unaudited) | | 2016 | | 2015 | | 2014 | | 2013(a) | |
Per share data | |
Net asset value, beginning of period | | $ | 5.48 | | | $ | 5.55 | | | $ | 5.48 | | | $ | 5.56 | | | $ | 5.76 | | |
Income from investment operations: | |
Net investment income | | | 0.07 | | | | 0.15 | | | | 0.15 | | | | 0.14 | | | | 0.07 | | |
Net realized and unrealized gain (loss) | | | (0.06 | ) | | | (0.05 | ) | | | 0.07 | | | | (0.01 | ) | | | (0.07 | )(b) | |
Total from investment operations | | | 0.01 | | | | 0.10 | | | | 0.22 | | | | 0.13 | | | | — | | |
Less distributions to shareholders: | |
Net investment income | | | (0.06 | ) | | | (0.15 | ) | | | (0.15 | ) | | | (0.19 | ) | | | (0.09 | ) | |
Net realized gains | | | (0.03 | ) | | | (0.02 | ) | | | — | | | | (0.02 | ) | | | (0.11 | ) | |
Total distributions to shareholders | | | (0.09 | ) | | | (0.17 | ) | | | (0.15 | ) | | | (0.21 | ) | | | (0.20 | ) | |
Net asset value, end of period | | $ | 5.40 | | | $ | 5.48 | | | $ | 5.55 | | | $ | 5.48 | | | $ | 5.56 | | |
Total return | | | 0.16 | % | | | 1.82 | % | | | 4.15 | % | | | 2.47 | % | | | 0.04 | % | |
Ratios to average net assets(c) | |
Total gross expenses | | | 0.56 | %(d) | | | 0.57 | % | | | 0.57 | % | | | 0.57 | % | | | 0.57 | %(d) | |
Total net expenses(e) | | | 0.55 | %(d) | | | 0.54 | % | | | 0.54 | % | | | 0.53 | % | | | 0.55 | %(d) | |
Net investment income | | | 2.44 | %(d) | | | 2.74 | % | | | 2.71 | % | | | 2.62 | % | | | 2.16 | %(d) | |
Supplemental data | |
Net assets, end of period (in thousands) | | $ | 26,302 | | | $ | 22,770 | | | $ | 11,921 | | | $ | 5,539 | | | $ | 506 | | |
Portfolio turnover | | | 165 | % | | | 328 | % | | | 358 | % | | | 413 | % | | | 576 | % | |
Notes to Financial Highlights
(a) Based on operations from November 8, 2012 (commencement of operations) through the stated period end.
(b) Calculation of the net gain (loss) per share (both realized and unrealized) does not correlate to the aggregate realized and unrealized gain (loss) presented in the Statement of Operations due to the timing of subscriptions and redemptions of Fund shares in relation to fluctuations in the market value of the portfolio.
(c) In addition to the fees and expenses that the Fund bears directly, the Fund indirectly bears a pro rata share of the fees and expenses of any other funds in which it invests. Such indirect expenses are not included in the Fund's reported expense ratios.
(d) Annualized.
(e) Total net expenses include the impact of certain fee waivers/expense reimbursements made by the Investment Manager and certain of its affiliates, if applicable.
The accompanying Notes to Financial Statements are an integral part of this statement.
Semiannual Report 2016
32
COLUMBIA U.S. GOVERNMENT MORTGAGE FUND
FINANCIAL HIGHLIGHTS (continued)
| | | Six Months Ended
November 30, 2016 | | Year Ended May 31, | |
Class W | | (Unaudited) | | 2016 | | 2015 | | 2014 | | 2013(a) | |
Per share data | |
Net asset value, beginning of period | | $ | 5.49 | | | $ | 5.56 | | | $ | 5.49 | | | $ | 5.58 | | | $ | 5.65 | | |
Income from investment operations: | |
Net investment income | | | 0.06 | | | | 0.14 | | | | 0.13 | | | | 0.12 | | | | 0.09 | | |
Net realized and unrealized gain (loss) | | | (0.06 | ) | | | (0.06 | ) | | | 0.08 | | | | (0.02 | ) | | | 0.09 | | |
Total from investment operations | | | — | | | | 0.08 | | | | 0.21 | | | | 0.10 | | | | 0.18 | | |
Less distributions to shareholders: | |
Net investment income | | | (0.05 | ) | | | (0.13 | ) | | | (0.14 | ) | | | (0.17 | ) | | | (0.14 | ) | |
Net realized gains | | | (0.03 | ) | | | (0.02 | ) | | | — | | | | (0.02 | ) | | | (0.11 | ) | |
Total distributions to shareholders | | | (0.08 | ) | | | (0.15 | ) | | | (0.14 | ) | | | (0.19 | ) | | | (0.25 | ) | |
Net asset value, end of period | | $ | 5.41 | | | $ | 5.49 | | | $ | 5.56 | | | $ | 5.49 | | | $ | 5.58 | | |
Total return | | | (0.01 | %) | | | 1.46 | % | | | 3.80 | % | | | 1.94 | % | | | 3.15 | % | |
Ratios to average net assets(b) | |
Total gross expenses | | | 0.93 | %(c) | | | 0.98 | % | | | 0.98 | % | | | 0.95 | % | | | 0.94 | %(c) | |
Total net expenses(d) | | | 0.90 | %(c)(e) | | | 0.88 | %(e) | | | 0.88 | %(e) | | | 0.86 | %(e) | | | 0.86 | %(c) | |
Net investment income | | | 2.09 | %(c) | | | 2.50 | % | | | 2.38 | % | | | 2.22 | % | | | 1.75 | %(c) | |
Supplemental data | |
Net assets, end of period (in thousands) | | $ | 3,004 | | | $ | 3,581 | | | $ | 34,319 | | | $ | 7,393 | | | $ | 10,367 | | |
Portfolio turnover | | | 165 | % | | | 328 | % | | | 358 | % | | | 413 | % | | | 576 | % | |
Notes to Financial Highlights
(a) Based on operations from June 18, 2012 (commencement of operations) through the stated period end.
(b) In addition to the fees and expenses that the Fund bears directly, the Fund indirectly bears a pro rata share of the fees and expenses of any other funds in which it invests. Such indirect expenses are not included in the Fund's reported expense ratios.
(c) Annualized.
(d) Total net expenses include the impact of certain fee waivers/expense reimbursements made by the Investment Manager and certain of its affiliates, if applicable.
(e) The benefits derived from expense reductions had an impact of less than 0.01%.
The accompanying Notes to Financial Statements are an integral part of this statement.
Semiannual Report 2016
33
COLUMBIA U.S. GOVERNMENT MORTGAGE FUND
FINANCIAL HIGHLIGHTS (continued)
| | | Six Months Ended
November 30, 2016 | | Year Ended May 31, | |
Class Y | | (Unaudited) | | 2016 | | 2015(a) | |
Per share data | |
Net asset value, beginning of period | | $ | 5.45 | | | $ | 5.52 | | | $ | 5.44 | | |
Income from investment operations: | |
Net investment income | | | 0.07 | | | | 0.15 | | | | 0.10 | | |
Net realized and unrealized gain (loss) | | | (0.06 | ) | | | (0.05 | ) | | | 0.08 | | |
Total from investment operations | | | 0.01 | | | | 0.10 | | | | 0.18 | | |
Less distributions to shareholders: | |
Net investment income | | | (0.06 | ) | | | (0.15 | ) | | | (0.10 | ) | |
Net realized gains | | | (0.03 | ) | | | (0.02 | ) | | | — | | |
Total distributions to shareholders | | | (0.09 | ) | | | (0.17 | ) | | | (0.10 | ) | |
Net asset value, end of period | | $ | 5.37 | | | $ | 5.45 | | | $ | 5.52 | | |
Total return | | | 0.19 | % | | | 1.84 | % | | | 3.41 | % | |
Ratios to average net assets(b) | |
Total gross expenses | | | 0.51 | %(c) | | | 0.52 | % | | | 0.52 | %(c) | |
Total net expenses(d) | | | 0.50 | %(c) | | | 0.49 | % | | | 0.50 | %(c) | |
Net investment income | | | 2.49 | %(c) | | | 2.75 | % | | | 2.81 | %(c) | |
Supplemental data | |
Net assets, end of period (in thousands) | | $ | 57,392 | | | $ | 48,156 | | | $ | 1,228 | | |
Portfolio turnover | | | 165 | % | | | 328 | % | | | 358 | % | |
Notes to Financial Highlights
(a) Based on operations from October 1, 2014 (commencement of operations) through the stated period end.
(b) In addition to the fees and expenses that the Fund bears directly, the Fund indirectly bears a pro rata share of the fees and expenses of any other funds in which it invests. Such indirect expenses are not included in the Fund's reported expense ratios.
(c) Annualized.
(d) Total net expenses include the impact of certain fee waivers/expense reimbursements made by the Investment Manager and certain of its affiliates, if applicable.
The accompanying Notes to Financial Statements are an integral part of this statement.
Semiannual Report 2016
34
COLUMBIA U.S. GOVERNMENT MORTGAGE FUND
FINANCIAL HIGHLIGHTS (continued)
| | | Six Months Ended
November 30, 2016 | | Year Ended May 31, | |
Class Z | | (Unaudited) | | 2016 | | 2015 | | 2014 | | 2013 | | 2012 | |
Per share data | |
Net asset value, beginning of period | | $ | 5.47 | | | $ | 5.55 | | | $ | 5.48 | | | $ | 5.56 | | | $ | 5.63 | | | $ | 5.46 | | |
Income from investment operations: | |
Net investment income | | | 0.06 | | | | 0.14 | | | | 0.14 | | | | 0.13 | | | | 0.11 | | | | 0.16 | | |
Net realized and unrealized gain (loss) | | | (0.04 | ) | | | (0.06 | ) | | | 0.08 | | | | (0.00 | )(a) | | | 0.09 | | | | 0.21 | | |
Total from investment operations | | | 0.02 | | | | 0.08 | | | | 0.22 | | | | 0.13 | | | | 0.20 | | | | 0.37 | | |
Less distributions to shareholders: | |
Net investment income | | | (0.06 | ) | | | (0.14 | ) | | | (0.15 | ) | | | (0.19 | ) | | | (0.16 | ) | | | (0.18 | ) | |
Net realized gains | | | (0.03 | ) | | | (0.02 | ) | | | — | | | | (0.02 | ) | | | (0.11 | ) | | | (0.02 | ) | |
Total distributions to shareholders | | | (0.09 | ) | | | (0.16 | ) | | | (0.15 | ) | | | (0.21 | ) | | | (0.27 | ) | | | (0.20 | ) | |
Proceeds from regulatory settlements | | | — | | | | — | | | | — | | | | — | | | | — | | | | 0.00 | (a) | |
Net asset value, end of period | | $ | 5.40 | | | $ | 5.47 | | | $ | 5.55 | | | $ | 5.48 | | | $ | 5.56 | | | $ | 5.63 | | |
Total return | | | 0.30 | % | | | 1.51 | % | | | 4.07 | % | | | 2.40 | % | | | 3.53 | % | | | 6.82 | % | |
Ratios to average net assets(b) | |
Total gross expenses | | | 0.68 | %(c) | | | 0.72 | % | | | 0.71 | % | | | 0.70 | % | | | 0.69 | % | | | 0.68 | % | |
Total net expenses(d) | | | 0.65 | %(c)(e) | | | 0.64 | %(e) | | | 0.62 | %(e) | | | 0.61 | %(e) | | | 0.61 | %(e) | | | 0.61 | %(e) | |
Net investment income | | | 2.34 | %(c) | | | 2.63 | % | | | 2.58 | % | | | 2.46 | % | | | 2.01 | % | | | 2.96 | % | |
Supplemental data | |
Net assets, end of period (in thousands) | | $ | 563,555 | | | $ | 545,140 | | | $ | 447,990 | | | $ | 452,308 | | | $ | 886,922 | | | $ | 424,251 | | |
Portfolio turnover | | | 165 | % | | | 328 | % | | | 358 | % | | | 413 | % | | | 576 | % | | | 545 | % | |
Notes to Financial Highlights
(a) Rounds to zero.
(b) In addition to the fees and expenses that the Fund bears directly, the Fund indirectly bears a pro rata share of the fees and expenses of any other funds in which it invests. Such indirect expenses are not included in the Fund's reported expense ratios.
(c) Annualized.
(d) Total net expenses include the impact of certain fee waivers/expense reimbursements made by the Investment Manager and certain of its affiliates, if applicable.
(e) The benefits derived from expense reductions had an impact of less than 0.01%.
The accompanying Notes to Financial Statements are an integral part of this statement.
Semiannual Report 2016
35
COLUMBIA U.S. GOVERNMENT MORTGAGE FUND
NOTES TO FINANCIAL STATEMENTS
November 30, 2016 (Unaudited)
Note 1. Organization
Columbia U.S. Government Mortgage Fund (the Fund), a series of Columbia Funds Series Trust II (the Trust), is a diversified fund. The Trust is registered under the Investment Company Act of 1940, as amended (the 1940 Act), as an open-end management investment company organized as a Massachusetts business trust.
Fund Shares
The Trust may issue an unlimited number of shares (without par value). The Fund offers Class A, Class B, Class C, Class I, Class K, Class R, Class R4, Class R5, Class W, Class Y and Class Z shares. Although all share classes generally have identical voting, dividend and liquidation rights, each share class votes separately when required by the Trust's organizational documents or by law. Different share classes pay different distribution amounts to the extent the expenses of such share classes differ, and distributions in liquidation will be proportional to the net asset value of each share class. Each share class has its own expense and sales charge structure.
Class A shares are subject to a maximum front-end sales charge of 3.00% based on the initial investment amount. Class A shares purchased without an initial sales charge in accounts aggregating $1 million to $50 million at the time of purchase are subject to a contingent deferred sales charge (CDSC) if the shares are sold within 18 months after purchase, charged as follows: 1.00% CDSC if redeemed within 12 months after purchase, and 0.50% CDSC if redeemed more than 12, but less than 18, months after purchase.
Class B shares may be subject to a maximum CDSC of 5.00% based upon the holding period after purchase. Class B shares will generally convert to Class A shares eight years after purchase. The Fund no longer accepts investments by new or existing investors in the Fund's Class B shares, except in connection with the reinvestment of any dividend and/or capital gain distributions in Class B shares of the Fund and exchanges by existing Class B shareholders of certain other funds within the Columbia Family of Funds.
Class C shares are subject to a 1.00% CDSC on shares redeemed within 12 months after purchase.
Class I shares are not subject to sales charges and are available only to the Columbia Family of Funds.
Class K shares are not subject to sales charges, however this share class is closed to new investors.
Class R shares are not subject to sales charges and are generally available only to certain retirement plans and
other investors as described in the Fund's prospectus. Class R shares commenced operations on March 1, 2016.
Class R4 shares are not subject to sales charges and are generally available only to omnibus retirement plans and certain investors as described in the Fund's prospectus.
Class R5 shares are not subject to sales charges and are generally available only to investors purchasing through authorized investment professionals and omnibus retirement plans.
Class W shares are not subject to sales charges and are generally available only to investors purchasing through authorized investment programs managed by investment professionals, including discretionary managed account programs.
Class Y shares are not subject to sales charges and are generally available only to certain retirement plans as described in the Fund's prospectus.
Class Z shares are not subject to sales charges and are generally available only to eligible investors, which are subject to different investment minimums as described in the Fund's prospectus.
Note 2. Summary of Significant Accounting Policies
Basis of Preparation
The Fund is an investment company that applies the accounting and reporting guidance in the Financial Accounting Standards Board (FASB) Accounting Standards Codification Topic 946, Financial Services — Investment Companies (ASC 946). The financial statements are prepared in accordance with U.S. generally accepted accounting principles (GAAP), which requires management to make certain estimates and assumptions that affect the reported amounts of assets and liabilities, the disclosure of contingent assets and liabilities at the date of the financial statements and the reported amounts of income and expenses during the reporting period. Actual results could differ from those estimates.
The following is a summary of significant accounting policies followed by the Fund in the preparation of its financial statements.
Security Valuation
Debt securities generally are valued by pricing services approved by the Board of Trustees (the Board) based upon market transactions for normal, institutional-size
Semiannual Report 2016
36
COLUMBIA U.S. GOVERNMENT MORTGAGE FUND
NOTES TO FINANCIAL STATEMENTS (continued)
November 30, 2016 (Unaudited)
trading units of similar securities. The services may use various pricing techniques that take into account, as applicable, factors such as yield, quality, coupon rate, maturity, type of issue, trading characteristics and other data, as well as approved independent broker-dealer quotes. Debt securities for which quotations are not readily available or not believed to be reflective of market value may also be valued based upon a bid quote from an approved independent broker-dealer. Debt securities maturing in 60 days or less are valued primarily at amortized cost value, unless this method results in a valuation that management believes does not approximate market value.
Asset- and mortgage-backed securities are generally valued by pricing services, which utilize pricing models that incorporate the securities' cash flow and loan performance data. These models also take into account available market data, including trades, market quotations, and benchmark yield curves for identical or similar securities. Factors used to identify similar securities may include, but are not limited to, issuer, collateral type, vintage, prepayment speeds, collateral performance, credit ratings, credit enhancement and expected life. Asset-backed securities for which quotations are readily available may also be valued based upon an over-the-counter or exchange bid quote from an approved independent broker-dealer.
Investments in open-end investment companies, including money market funds, are valued at their latest net asset value.
Futures and options on futures contracts are valued based upon the settlement price at the close of regular trading on their principal exchanges or, in the absence of transactions, at the mean of the latest quoted bid and ask prices.
Option contracts are valued at the mean of the latest quoted bid and ask prices on their primary exchanges. Option contracts, including over-the-counter option contracts, with no readily available market quotations are valued using quotes obtained from independent brokers as of the close of the New York Stock Exchange (NYSE).
Swap transactions are valued through an independent pricing service or broker, or if neither is available, through an internal model based upon observable inputs.
Investments for which market quotations are not readily available, or that have quotations which management believes are not reflective of market value or reliable, are valued at fair value as determined in good faith under procedures approved by and under the general
supervision of the Board. If a security or class of securities (such as foreign securities) is valued at fair value, such value is likely to be different from the quoted or published price for the security.
The determination of fair value often requires significant judgment. To determine fair value, management may use assumptions including but not limited to future cash flows and estimated risk premiums. Multiple inputs from various sources may be used to determine fair value.
GAAP requires disclosure regarding the inputs and valuation techniques used to measure fair value and any changes in valuation inputs or techniques. In addition, investments shall be disclosed by major category. This information is disclosed following the Fund's Portfolio of Investments.
Derivative Instruments
The Fund invests in certain derivative instruments, as detailed below, to meet its investment objectives. Derivatives are instruments whose values depend on, or are derived from, in whole or in part, the value of one or more securities, currencies, commodities, indices, or other assets or instruments. Derivatives may be used to increase investment flexibility (including to maintain cash reserves while maintaining desired exposure to certain assets), for risk management (hedging) purposes, to facilitate trading, to reduce transaction costs and to pursue higher investment returns. The Fund may also use derivative instruments to mitigate certain investment risks, such as foreign currency exchange rate risk, interest rate risk and credit risk. Derivatives may involve various risks, including the potential inability of the counterparty to fulfill its obligations under the terms of the contract, the potential for an illiquid secondary market (making it difficult for the Fund to sell or terminate, including at favorable prices) and the potential for market movements which may expose the Fund to gains or losses in excess of the amount shown in the Statement of Assets and Liabilities. The notional amounts of derivative instruments, if applicable, are not recorded in the financial statements.
A derivative instrument may suffer a marked-to-market loss if the value of the contract decreases due to an unfavorable change in the market rates or values of the underlying instrument. Losses can also occur if the counterparty does not perform its obligations under the contract. The Fund's risk of loss from counterparty credit risk on over-the-counter derivatives is generally limited to the aggregate unrealized gain netted against any collateral held by the Fund and the amount of any variation margin held by the counterparty, plus any
Semiannual Report 2016
37
COLUMBIA U.S. GOVERNMENT MORTGAGE FUND
NOTES TO FINANCIAL STATEMENTS (continued)
November 30, 2016 (Unaudited)
replacement costs or related amounts. With exchange-traded or centrally cleared derivatives, there is reduced counterparty credit risk to the Fund since the clearinghouse or central counterparty (CCP) provides some protection in the case of clearing member default. The clearinghouse or CCP stands between the buyer and the seller of the contract; therefore, additional counterparty credit risk is failure of the clearinghouse or CCP. However, credit risk still exists in exchange-traded or centrally cleared derivatives with respect to initial and variation margin that is held in a broker's customer account. While brokers are required to segregate customer margin from their own assets, in the event that a broker becomes insolvent or goes into bankruptcy and at that time there is a shortfall in the aggregate amount of margin held by the broker for all its clients, U.S. bankruptcy laws will typically allocate that shortfall on a pro-rata basis across all the broker's customers (including the Fund), potentially resulting in losses to the Fund.
In order to better define its contractual rights and to secure rights that will help the Fund mitigate its counterparty risk, the Fund may enter into an International Swaps and Derivatives Association, Inc. Master Agreement (ISDA Master Agreement) or similar agreement with its derivatives contract counterparties. An ISDA Master Agreement is an agreement between the Fund and a counterparty that governs over-the-counter derivatives and typically contains, among other things, collateral posting terms and netting provisions in the event of a default and/or termination event. Under an ISDA Master Agreement, the Fund may, under certain circumstances, offset with the counterparty certain derivative instrument's payables and/or receivables with collateral held and/or posted and create one single net payment. The provisions of the ISDA Master Agreement typically permit a single net payment in the event of default (close-out netting), including the bankruptcy or insolvency of the counterparty. Note, however, that bankruptcy or insolvency laws of a particular jurisdiction may impose restrictions on or prohibitions against the right of offset or netting in bankruptcy, insolvency or other events.
Collateral (margin) requirements differ by type of derivative. Margin requirements are established by the clearinghouse or CCP for exchange-traded and centrally cleared derivatives. Brokers can ask for margin in excess of the minimum in certain circumstances. Collateral terms are contract specific for over-the-counter derivatives. For over-the-counter derivatives traded under an ISDA Master Agreement, the collateral requirements
are typically calculated by netting the marked-to-market amount for each transaction under such agreement and comparing that amount to the value of any variation margin currently pledged by the Fund and/or the counterparty. Generally, the amount of collateral due from or to a party has to exceed a minimum transfer amount threshold (e.g., $250,000) before a transfer has to be made. To the extent amounts due to the Fund from its counterparties are not fully collateralized, contractually or otherwise, the Fund bears the risk of loss from counterparty nonperformance. The Fund attempts to mitigate counterparty risk by only entering into agreements with counterparties that it believes have the financial resources to honor their obligations and by monitoring the financial stability of those counterparties.
Certain ISDA Master Agreements allow counterparties of over-the-counter derivatives transactions to terminate derivatives contracts prior to maturity in the event the Fund's net asset value declines by a stated percentage over a specified time period or if the Fund fails to meet certain terms of the ISDA Master Agreement, which would cause the Fund to accelerate payment of any net liability owed to the counterparty. The Fund also has termination rights if the counterparty fails to meet certain terms of the ISDA Master Agreement. In addition to considering counterparty credit risk, the Fund would consider terminating the derivatives contracts based on whether termination would result in a net liability owed from the counterparty.
For financial reporting purposes, the Fund does not offset derivative assets and derivative liabilities that are subject to netting arrangements in the Statement of Assets and Liabilities.
Futures Contracts
Futures contracts are exchange-traded and represent commitments for the future purchase or sale of an asset at a specified price on a specified date. The Fund bought and sold futures contracts to manage the duration and yield curve exposure of the Fund versus the benchmark and to manage exposure to movements in interest rates. These instruments may be used for other purposes in future periods. Upon entering into futures contracts, the Fund bears risks that it may not achieve the anticipated benefits of the futures contracts and may realize a loss. Additional risks include counterparty credit risk, the possibility of an illiquid market, and that a change in the value of the contract or option may not correlate with changes in the value of the underlying asset.
Upon entering into a futures contract, the Fund deposits cash or securities with the broker, known as a futures
Semiannual Report 2016
38
COLUMBIA U.S. GOVERNMENT MORTGAGE FUND
NOTES TO FINANCIAL STATEMENTS (continued)
November 30, 2016 (Unaudited)
commissions merchant (FCM), in an amount sufficient to meet the initial margin requirement. The initial margin deposit must be maintained at an established level over the life of the contract. Cash deposited as initial margin is recorded in the Statement of Assets and Liabilities as margin deposits. Securities deposited as initial margin are designated in the Portfolio of Investments. Subsequent payments (variation margin) are made or received by the Fund each day. The variation margin payments are equal to the daily change in the contract value and are recorded as variation margin receivable or payable and are offset in unrealized gains or losses. The Fund recognizes a realized gain or loss when the contract is closed or expires. Futures contracts involve, to varying degrees, risk of loss in excess of the variation margin disclosed in the Statement of Assets and Liabilities.
Options Contracts
Options are contracts which entitle the holder to purchase or sell securities or other identified assets at a specified price, or in the case of index option contracts, to receive or pay the difference between the index value and the strike price of the index option contract. Option contracts can be either exchange-traded or over-the-counter. The Fund purchased and/or wrote option contracts to manage interest rate and volatility exposure. These instruments may be used for other purposes in future periods. Completion of transactions for option contracts traded in the over-the-counter market depends upon the performance of the other party. Cash collateral may be collected or posted by the Fund to secure certain over-the-counter option contract trades. Cash collateral held or posted by the Fund for such option contract trades must be returned to the broker or the Fund upon closure, exercise or expiration of the contract.
Options contracts purchased are recorded as investments. When the Fund writes an options contract, the premium received is recorded as an asset and an amount equivalent to the premium is recorded as a liability in the Statement of Assets and Liabilities and is subsequently adjusted to reflect the current fair value of the option written. Changes in the fair value of the written option are recorded as unrealized appreciation or depreciation until the contract is exercised or has expired. The Fund will realize a gain or loss when the option contract is closed or expires. When option contracts are exercised, the proceeds on sales for a written call or purchased put option contract, or the purchase cost for a written put or purchased call option contract, is adjusted by the amount of premium received or paid.
For over-the-counter options purchased, the Fund bears the risk of loss of the amount of the premiums paid plus the positive change in market values net of any collateral held by the Fund should the counterparty fail to perform under the contracts. Option contracts written by the Fund do not typically give rise to significant counterparty credit risk, as options written generally obligate the Fund and not the counterparty to perform. The risk in writing a call option contract is that the Fund gives up the opportunity for profit if the market price of the security increases above the strike price and the option contract is exercised. The risk in writing a put option contract is that the Fund may incur a loss if the market price of the security decreases below the strike price and the option contract is exercised. Exercise of a written option could result in the Fund purchasing or selling a security or foreign currency when it otherwise would not, or at a price different from the current market value. In purchasing and writing options, the Fund bears the risk of an unfavorable change in the value of the underlying instrument or the risk that the Fund may not be able to enter into a closing transaction due to an illiquid market.
Swap Contracts
Swap contracts are negotiated in the over-the-counter market and may be entered into as a bilateral contract or centrally cleared (centrally cleared swap contract). In a centrally cleared swap contract, immediately following execution of the swap contract with a broker, the swap contract is novated to a central counterparty (the CCP) and the CCP becomes the Fund's counterparty to the centrally cleared swap contract. The Fund is required to deposit initial margin with the FCM, which pledges it through to the CCP in the form of cash or securities in an amount that varies depending on the size and risk profile of the particular swap contract. Securities deposited as initial margin are designated in the Portfolio of Investments and cash deposited is recorded in the Statement of Assets and Liabilities as margin deposits. Unlike a bilateral swap contract, for centrally cleared swap contracts, the Fund has less credit exposure to the FCM because the CCP stands between the Fund and the relevant buyer/seller on the other side of the contract. Swap contracts are marked-to-market daily and changes in value are recorded as unrealized appreciation (depreciation). The daily change in valuation of centrally cleared swap contracts, if any, is recorded as a receivable or payable for variation margin in the Statement of Assets and Liabilities.
Entering into these contracts involves, to varying degrees, elements of interest, liquidity and counterparty
Semiannual Report 2016
39
COLUMBIA U.S. GOVERNMENT MORTGAGE FUND
NOTES TO FINANCIAL STATEMENTS (continued)
November 30, 2016 (Unaudited)
credit risk in excess of the amounts recognized in the Statement of Assets and Liabilities. Such risks involve the possibility that there may be unfavorable changes in interest rates, market conditions or other conditions, it may be difficult to initiate a swap transaction or liquidate a position at an advantageous time or price which may result in significant losses, and that the FCM or CCP may not fulfill its obligation under the contract.
Interest Rate Swaption Contracts
Interest rate swaption contracts entered into by the Fund typically represent an option that gives the purchaser the right, but not the obligation, to enter into an interest rate swap contract on a future date. Each interest rate swaption agreement will specify if the buyer is entitled to receive the fixed or floating rate if the interest rate is exercised. Changes in the value of a purchased interest rate swaption contracts are reported as unrealized appreciation or depreciation on options in the Statement of Assets and Liabilities. Gain or loss is recognized in
the Statement of Operations when the interest rate swaption contract is closed or expires.
When the Fund writes an interest rate swaption contract, the premium received is recorded as an asset and an amount equivalent to the premium is recorded as a liability in the Statement of Assets and Liabilities and is subsequently adjusted to reflect the current fair value of the interest rate swaption contract written. Premiums received from writing interest rate swaption contracts that expire unexercised are recorded by the Fund on the expiration date as realized gains from options written in the Statement of Operations. The difference between the premium and the amount paid on effecting a closing purchase transaction, including brokerage commissions, is also recorded as realized gain, or if the premium is less than the amount paid for the closing purchase, as realized loss. These amounts are reflected as net realized gain (loss) on options written in the Statement of Operations.
Contracts and premiums associated with options contracts written for the six months ended November 30, 2016 are as follows:
| | | Calls | | Puts | |
| | | Contracts | | Premiums ($) | | Contracts | | Premiums ($) | |
Balance at May 31, 2016 | | | (250,000,000 | ) | | | (1,500,000 | ) | | | (300,000,000 | ) | | | (2,497,500 | ) | |
Opened | | | — | | | | — | | | | (175,000,000 | ) | | | (980,000 | ) | |
Closed | | | 250,000,000 | | | | 1,500,000 | | | | — | | | | — | | |
Expired | | | — | | | | — | | | | 300,000,000 | | | | 2,497,500 | | |
Balance at November 30, 2016 | | | — | | | | — | | | | (175,000,000 | ) | | | (980,000 | ) | |
Credit Default Swap Contracts
The Fund entered into credit default swap contracts to manage credit risk exposure and to increase or decrease its credit exposure to an index. These instruments may be used for other purposes in future periods. Credit default swap contracts are agreements in which one party pays fixed periodic payments to a counterparty in consideration for an agreement from the counterparty to make a specific payment should a specified credit event(s) take place. Although specified credit events are contract specific, credit events are generally defined as bankruptcy, failure to pay, restructuring, obligation acceleration, obligation default, or repudiation/moratorium.
As the purchaser of a credit default swap contract, the Fund purchases protection by paying a periodic interest rate on a notional amount to the counterparty. The interest amount is accrued daily as a component of
unrealized appreciation (depreciation) and is recorded as a realized loss upon payment. If a credit event as specified in the contract occurs, the Fund may have the option either to deliver the reference obligation to the seller in exchange for a cash payment of its par amount, or to receive a net cash settlement equal to the par amount less an agreed-upon value of the reference obligation as of the date of the credit event. The difference between the value of the obligation or cash delivered and the notional amount received will be recorded as a realized gain (loss).
As the seller of a credit default swap contract, the Fund sells protection to a buyer and will generally receive a periodic interest rate on a notional amount. The interest amount is accrued daily as a component of unrealized appreciation (depreciation) and is recorded as a realized gain upon receipt of the payment. If a credit event as specified in the contract with the counterparty occurs,
Semiannual Report 2016
40
COLUMBIA U.S. GOVERNMENT MORTGAGE FUND
NOTES TO FINANCIAL STATEMENTS (continued)
November 30, 2016 (Unaudited)
the Fund may either be required to accept the reference obligation from the buyer in exchange for a cash payment of its notional amount, or to pay the buyer a net cash settlement equal to the notional amount less an agreed-upon value of the reference obligation (recovery value) as of the date of the credit event. The difference between the value of the obligation or cash received and the notional amount paid will be recorded as a realized gain (loss). The maximum potential amount of undiscounted future payments the Fund could be required to make as the seller of protection under a credit default swap contract is equal to the notional amount of the reference obligation. These potential amounts may be partially offset by any recovery values of the respective reference obligations or premiums received upon entering into the agreement. The notional amounts and market values of all credit default swap contracts in which the Fund is the seller of protection, if any, are disclosed in the Credit Default Swap Contracts Outstanding schedule following the Portfolio of Investments.
As a protection seller, the Fund bears the risk of loss from the credit events specified in the contract with the counterparty. For credit default swap contracts on credit indices, quoted market prices and resulting market values serve as an indicator of the current status of the payment/performance risk. Increasing market values, in absolute terms when compared to the notional amount of the swap, represent a deterioration of the reference entity's credit soundness and a greater likelihood or risk of default or other credit event occurring as defined under the terms of the contract.
Any premium paid or received by the Fund upon entering into a credit default swap contract is recorded as an asset or liability, respectively, and amortized daily as a component of realized gain (loss) in the Statement of Operations. Credit default swap contracts are valued daily, and the change in value is recorded as unrealized appreciation (depreciation) until the termination of the swap, at which time a realized gain (loss) is recorded.
Credit default swap contracts can involve greater risks than if a fund had invested in the reference obligation directly since, in addition to general market risks, credit default swaps are subject to counterparty credit risk, leverage risk, hedging risk, correlation risk and liquidity risk.
Effects of Derivative Transactions in the Financial Statements
The following tables are intended to provide additional information about the effect of derivatives on the financial statements of the Fund, including: the fair value of derivatives by risk category and the location of those fair values in the Statement of Assets and Liabilities; and the impact of derivative transactions over the period in the Statement of Operations, including realized and unrealized gains (losses). The derivative instrument schedules following the Portfolio of Investments present additional information regarding derivative instruments outstanding at the end of the period, if any.
The following table is a summary of the fair value of derivative instruments (not considered to be hedging instruments for accounting disclosure purposes) at November 30, 2016:
Asset Derivatives | |
Risk Exposure
Category | | Statement of Assets and
Liabilities Location | | Fair Value ($) | |
Credit risk
| | Net assets — unrealized
appreciation on swap
contracts | | | 926,071 | * | |
Interest rate risk
| | Net assets — unrealized
appreciation on futures
contracts | | | 10,959 | * | |
Interest rate risk
| | Investments, at value —
Options purchased | | | 20,325,190 | | |
Total | | | | | 21,262,220 | | |
Liability Derivatives | |
Risk Exposure
Category | | Statement of Assets and
Liabilities Location | | Fair Value ($) | |
Credit risk
| | Net assets — unrealized
depreciation on swap
contracts | | | 513,462 | * | |
Credit risk
| | Premiums received on
outstanding swap contracts | | | 4,281,366 | | |
Interest rate risk
| | Net assets — unrealized
depreciation on futures
contracts | | | 431,129 | * | |
Interest rate risk
| | Options contracts
written, at value | | | 957,180 | | |
Total | | | | | 6,183,137 | | |
*Includes cumulative appreciation (depreciation) as reported in the tables following the Portfolio of Investments. Only the current day's variation margin is reported in receivables or payables in the Statement of Assets and Liabilities.
Semiannual Report 2016
41
COLUMBIA U.S. GOVERNMENT MORTGAGE FUND
NOTES TO FINANCIAL STATEMENTS (continued)
November 30, 2016 (Unaudited)
The following table indicates the effect of derivative instruments (not considered to be hedging instruments for accounting disclosure purposes) in the Statement of Operations for the six months ended November 30, 2016:
Amount of Realized Gain (Loss) on Derivatives Recognized in Income | |
Risk Exposure Category | | Futures
Contracts ($) | | Options Contracts
Written ($) | | Options Contracts
Purchased ($) | | Swap
Contracts ($) | | Total ($) | |
Credit risk | | | — | | | | — | | | | — | | | | 538,197 | | | | 538,197 | | |
Interest rate risk | | | (4,180,700 | ) | | | 2,805,000 | | | | (3,391,500 | ) | | | (6,401,544 | ) | | | (11,168,744 | ) | |
Total | | | (4,180,700 | ) | | | 2,805,000 | | | | (3,391,500 | ) | | | (5,863,347 | ) | | | (10,630,547 | ) | |
Change in Unrealized Appreciation (Depreciation) on Derivatives Recognized in Income | |
Risk Exposure Category | | Futures
Contracts ($) | | Options Contracts
Written ($) | | Options Contracts
Purchased ($) | | Swap
Contracts ($) | | Total ($) | |
Credit risk | | | — | | | | — | | | | — | | | | 627,039 | | | | 627,039 | | |
Interest rate risk | | | (657,974 | ) | | | (2,249,720 | ) | | | 15,753,833 | | | | 2,988,859 | | | | 15,834,998 | | |
Total | | | (657,974 | ) | | | (2,249,720 | ) | | | 15,753,833 | | | | 3,615,898 | | | | 16,462,037 | | |
The following table provides a summary of the average outstanding volume by derivative instrument for the six months ended November 30, 2016:
Derivative Instrument | | Average Notional
Amounts ($)* | |
Futures contracts — Long | | | 377,658,321 | | |
Futures contracts — Short | | | 60,414,438 | | |
Credit default swap contracts — buy protection | | | 57,000,000 | | |
Credit default swap contracts — sell protection | | | 44,450,000 | | |
Derivative Instrument | | Average Market
Value ($)* | |
Options contracts — Purchased | | | 13,778,997 | | |
Options contracts — Written | | | (478,590 | ) | |
*Based on the ending quarterly outstanding amounts for the six months ended November 30, 2016.
Repurchase Agreements
The Fund may invest in repurchase agreement transactions with institutions that management has determined are creditworthy. The Fund, through the custodian, receives delivery of the underlying securities collateralizing a repurchase agreement. Management is responsible for determining that the collateral is at least equal, at all times, to the value of the repurchase obligation including interest. A repurchase agreement transaction involves certain risks in the event of default or insolvency of the counterparty. These risks include possible delays in or restrictions on the Fund's ability to dispose of the underlying securities and a possible decline in the value of the underlying securities during the period while the Fund seeks to assert its rights.
Asset- and Mortgage-Backed Securities
The Fund may invest in asset-backed and mortgage-backed securities. The maturity dates shown represent the original maturity of the underlying obligation. Actual maturity may vary based upon prepayment activity on these obligations. All, or a portion, of the obligation may be prepaid at any time because the underlying asset may be prepaid. As a result, decreasing market interest rates could result in an increased level of prepayment. An increased prepayment rate will have the effect of shortening the maturity of the security. Unless otherwise noted, the coupon rates presented are fixed rates.
Delayed Delivery Securities
The Fund may trade securities on other than normal settlement terms, including securities purchased or sold on a "when-issued" basis. This may increase risk to the Fund since the other party to the transaction may fail to deliver, which could cause the Fund to subsequently invest at less advantageous prices. The Fund designates cash or liquid securities in an amount equal to the delayed delivery commitment.
To Be Announced Securities
The Fund may trade securities on a To Be Announced (TBA) basis. As with other delayed-delivery transactions, a seller agrees to issue a TBA security at a future date. However, the seller does not specify the particular securities to be delivered. Instead, the Fund agrees to accept any security that meets specified terms.
In some cases, Master Securities Forward Transaction Agreements (MSFTAs) may be used to govern transactions of certain forward-settling agency mortgage-backed securities, such as delayed-delivery and TBAs, between the Fund and counterparty. The MSFTA
Semiannual Report 2016
42
COLUMBIA U.S. GOVERNMENT MORTGAGE FUND
NOTES TO FINANCIAL STATEMENTS (continued)
November 30, 2016 (Unaudited)
maintains provisions for, among other things, initiation and confirmation, payment and transfer, events of default, termination, and maintenance of collateral relating to such transactions.
Forward Sale Commitments
The Fund may enter into forward sale commitments to hedge its portfolio positions or to sell mortgage-backed securities it owns under delayed delivery arrangements. Proceeds of forward sale commitments are not received until the contractual settlement date. While a forward sale commitment is outstanding, equivalent deliverable securities or an offsetting forward purchase commitment deliverable on or before the sale commitment date, are used to satisfy the commitment.
Unsettled forward sale commitments are valued at the current market value of the underlying securities, generally according to the procedures described under "Security Valuation" above. The forward sale commitment is "marked-to-market" daily and the change in market value is recorded by the Fund as an unrealized gain or loss. If the forward sale commitment is closed through the acquisition of an offsetting purchase commitment, the Fund realizes a gain or loss. If the Fund delivers securities under the commitment, the Fund realizes a gain or a loss from the sale of the securities based upon the market price established at the date the commitment was entered into.
Mortgage Dollar Roll Transactions
The Fund may enter into mortgage "dollar rolls" in which the Fund sells securities for delivery in the current month and simultaneously contracts with the same counterparty to repurchase similar but not identical securities (same type, coupon and maturity) on a specified future date. During the roll period, the Fund loses the right to receive principal and interest paid on the securities sold. However, the Fund will benefit because it receives negotiated amounts in the form of reductions of the purchase price for the future purchase plus the interest earned on the cash proceeds of the securities sold until the settlement date of the forward purchase. The Fund records the incremental difference between the forward purchase and sale of each forward roll as a realized gain or loss. Unless any realized gains exceed the income, capital appreciation, and gain or loss due to mortgage prepayments that would have been realized on the securities sold as part of the mortgage dollar roll, the use of this technique will diminish the investment performance of the Fund compared to what the performance would have been without the use of
mortgage dollar rolls. All cash proceeds will be invested in instruments that are permissible investments for the Fund. The Fund identifies cash or liquid securities in an amount equal to the forward purchase price.
For financial reporting and tax purposes, the Fund treats "to be announced" mortgage dollar rolls as two separate transactions, one involving the purchase of a security and a separate transaction involving a sale. These transactions may increase the Fund's portfolio turnover rate. The Fund does not currently enter into mortgage dollar rolls that are accounted for as financing transactions.
Mortgage dollar rolls involve the risk that the market value of the securities the Fund is obligated to repurchase may decline below the repurchase price, or that the counterparty may default on its obligations.
Interest Only and Principal Only Securities
The Fund may invest in Interest Only (IO) or Principal Only (PO) securities. IOs are stripped securities entitled to receive all of the security's interest, but none of its principal. IOs are particularly sensitive to changes in interest rates and therefore subject to greater fluctuations in price than typical interest bearing debt securities. IOs are also subject to credit risk because the Fund may not receive all or part of the interest payments if the issuer, obligor, guarantor or counterparty defaults on its obligation. Payments received for IOs are included in interest income on the Statement of Operations. Because no principal will be received at the maturity of an IO, adjustments are made to the cost of the security on a monthly basis until maturity. POs are stripped securities entitled to receive the principal from the underlying obligation, but not the interest. POs are particularly sensitive to changes in interest rates and therefore are subject to fluctuations in price. POs are also subject to credit risk because the Fund may not receive all or part of its principal if the issuer, obligor, guarantor or counterparty defaults on its obligation. The Fund may also invest in IO or PO stripped mortgage-backed securities. Payments received for POs are treated as reductions to the cost and par value of the securities.
Semiannual Report 2016
43
COLUMBIA U.S. GOVERNMENT MORTGAGE FUND
NOTES TO FINANCIAL STATEMENTS (continued)
November 30, 2016 (Unaudited)
Offsetting of Assets and Liabilities
The following table presents the Fund's gross and net amount of assets and liabilities available for offset under netting arrangements as well as any related collateral received or pledged by the Fund as of November 30, 2016:
| | Barclays
($) | | Citi ($) | | Credit
Suisse
($) | | Goldman
Sachs
International
($) | | JPMorgan
($)(e) | | JPMorgan
($)(e) | | Morgan
Stanley
($)(e) | | Morgan
Stanley
($)(e) | | Morgan
Stanley
International
($) | | TD
Securities
($) | | Total ($) | |
Assets | |
Options
purchased puts | | | 179,515 | | | | 19,762,190 | | | | — | | | | — | | | | 300,775 | | | | — | | | | — | | | | — | | | | 82,710 | | | | — | | | | 20,325,190 | | |
Repurchase
agreements | | | — | | | | — | | | | — | | | | — | | | | — | | | | — | | | | — | | | | — | | | | — | | | | 60,000,000 | | | | 60,000,000 | | |
Total Assets | | | 179,515 | | | | 19,762,190 | | | | — | | | | — | | | | 300,775 | | | | — | | | | — | | | | — | | | | 82,710 | | | | 60,000,000 | | | | 80,325,190 | | |
Liabilities | |
Centrally cleared
credit default
swap contracts(a) | | | — | | | | — | | | | — | | | | — | | | | — | | | | — | | | | — | | | | 64,930 | | | | — | | | | — | | | | 64,930 | | |
Options contracts
written | | | — | | | | — | | | | — | | | | — | | | | — | | | | — | | | | 957,180 | | | | — | | | | — | | | | — | | | | 957,180 | | |
OTC credit default
swap contracts(b) | | | — | | | | — | | | | 585,412 | | | | 621,297 | | | | — | | | | 702,494 | | | | 1,498,076 | | | | — | | | | — | | | | — | | | | 3,407,279 | | |
Total Liabilities | | | — | | | | — | | | | 585,412 | | | | 621,297 | | | | — | | | | 702,494 | | | | 2,455,256 | | | | 64,930 | | | | — | | | | — | | | | 4,429,389 | | |
Total Financial and
Derivative Net
Assets | | | 179,515 | | | | 19,762,190 | | | | (585,412 | ) | | | (621,297 | ) | | | 300,775 | | | | (702,494 | ) | | | (2,455,256 | ) | | | (64,930 | ) | | | 82,710 | | | | 60,000,000 | | | | 75,895,801 | | |
Total collateral
received
(pledged)(c) | | | 68,000 | | | | 19,473,000 | | | | (585,412 | ) | | | (621,297 | ) | | | 257,000 | | | | (702,494 | ) | | | (2,232,000 | ) | | | (64,930 | ) | | | — | | | | 60,000,000 | | | | 75,591,867 | | |
Net Amount(d) | | | 111,515 | | | | 289,190 | | | | — | | | | — | | | | 43,775 | | | | — | | | | (223,256 | ) | | | — | | | | 82,710 | | | | — | | | | 303,934 | | |
(a) Centrally cleared swaps are included within payable/receivable for variation margin on the Statement of Assets and Liabilities.
(b) Over-the-Counter Swap Contracts are presented at market value plus periodic payments receivable (payable), which is comprised of unrealized appreciation, unrealized depreciation, premiums paid and premiums received.
(c) In some instances, the actual collateral received and/or pledged may be more than the amount shown due to overcollateralization.
(d) Represents the net amount due from/(to) counterparties in the event of default.
(e) Exposure can only be netted across transactions governed under the same master agreement with the same legal entity.
Security Transactions
Security transactions are accounted for on the trade date. Cost is determined and gains (losses) are based upon the specific identification method for both financial statement and federal income tax purposes.
Income Recognition
Interest income is recorded on an accrual basis. Market premiums and discounts, including original issue discounts, are amortized and accreted, respectively, over the expected life of the security on all debt securities, unless otherwise noted. The Fund classifies gains and losses realized on prepayments received on mortgage-backed securities as adjustments to interest income.
The Fund may place a debt security on non-accrual status and reduce related interest income when it
becomes probable that the interest will not be collected and the amount of uncollectible interest can be reasonably estimated. A defaulted debt security is removed from non-accrual status when the issuer resumes interest payments or when collectibility of interest is reasonably assured.
Dividend income is recorded on the ex-dividend date.
Expenses
General expenses of the Trust are allocated to the Fund and other funds of the Trust based upon relative net assets or other expense allocation methodologies determined by the nature of the expense. Expenses directly attributable to the Fund are charged to the Fund. Expenses directly attributable to a specific class of shares are charged to that share class.
Semiannual Report 2016
44
COLUMBIA U.S. GOVERNMENT MORTGAGE FUND
NOTES TO FINANCIAL STATEMENTS (continued)
November 30, 2016 (Unaudited)
Determination of Class Net Asset Value
All income, expenses (other than class-specific expenses, which are charged to that share class, as shown in the Statement of Operations) and realized and unrealized gains (losses) are allocated to each class of the Fund on a daily basis, based on the relative net assets of each class, for purposes of determining the net asset value of each class.
Federal Income Tax Status
The Fund intends to qualify each year as a regulated investment company under Subchapter M of the Internal Revenue Code, as amended, and will distribute substantially all of its taxable income (including net short-term capital gains), if any, for its tax year, and as such will not be subject to federal income taxes. In addition, the Fund intends to distribute in each calendar year substantially all of its net investment income, capital gains and certain other amounts, if any, such that the Fund should not be subject to federal excise tax. Therefore, no federal income or excise tax provision is recorded.
Distributions to Shareholders
Distributions from net investment income, if any, are declared daily and paid monthly. Net realized capital gains, if any, are distributed at least annually. Income distributions and capital gain distributions are determined in accordance with federal income tax regulations, which may differ from GAAP.
Guarantees and Indemnifications
Under the Trust's organizational documents and, in some cases, by contract, its officers and trustees are indemnified against certain liabilities arising out of the performance of their duties to the Trust or its funds. In addition, certain of the Fund's contracts with its service providers contain general indemnification clauses. The Fund's maximum exposure under these arrangements is unknown since the amount of any future claims that may be made against the Fund cannot be determined, and the Fund has no historical basis for predicting the likelihood of any such claims.
Investment Company Reporting Modernization
In October 2016, the U.S. Securities and Exchange Commission adopted new rules and forms, and amendments to certain current rules and forms, to modernize reporting and disclosure of information by registered investment companies. The amendments to Regulation S-X will require standardized, enhanced
disclosure about derivatives in investment company financial statements, and will also change the rules governing the form and content of such financial statements. The amendments to Regulation S-X take effect on August 1, 2017. At this time, management is assessing the anticipated impact of these regulatory developments.
Note 3. Fees and Other Transactions with Affiliates
Management Services Fees
The Fund entered into a Management Agreement with Columbia Management Investment Advisers, LLC (the Investment Manager), a wholly-owned subsidiary of Ameriprise Financial, Inc. (Ameriprise Financial). Under the Management Agreement, the Investment Manager provides the Fund with investment research and advice, as well as administrative and accounting services. The management services fee is an annual fee that is equal to a percentage of the Fund's average daily net assets that declines from 0.50% to 0.34% as the Fund's net assets increase. The annualized effective management services fee rate for the six months ended November 30, 2016 was 0.48% of the Fund's average daily net assets.
Other Expenses
Other expenses are for, among other things, miscellaneous expenses of the Fund or the Board, including payments to Board Services Corp., a company providing limited administrative services to the Fund and the Board. That company's expenses include boardroom and office expense, employee compensation, employee health and retirement benefits, and certain other expenses.
Compensation of Board Members
Board members, who are not officers or employees of the Investment Manager or Ameriprise Financial, are compensated for their services to the Fund as disclosed in the Statement of Operations. Under a Deferred Compensation Plan (the Plan), these Board members may elect to defer payment of up to 100% of their compensation. Deferred amounts are treated as though equivalent dollar amounts had been invested in shares of certain funds managed by the Investment Manager. The Fund's liability for these amounts is adjusted for market value changes and remains in the Fund until distributed in accordance with the Plan. All amounts payable under the Plan constitute a general unsecured obligation of the Fund.
Semiannual Report 2016
45
COLUMBIA U.S. GOVERNMENT MORTGAGE FUND
NOTES TO FINANCIAL STATEMENTS (continued)
November 30, 2016 (Unaudited)
Compensation of Chief Compliance Officer
The Board has appointed a Chief Compliance Officer to the Fund in accordance with federal securities regulations. The Fund is allocated a portion of the expenses associated with the Chief Compliance Officer based on relative net assets of the Trust.
Transfer Agency Fees
Under a Transfer and Dividend Disbursing Agent Agreement, Columbia Management Investment Services Corp. (the Transfer Agent), an affiliate of the Investment Manager and a wholly-owned subsidiary of Ameriprise Financial, is responsible for providing transfer agency services to the Fund. The Transfer Agent has contracted with Boston Financial Data Services (BFDS) to serve as sub-transfer agent. The Transfer Agent pays the fees of BFDS for services as sub-transfer agent and BFDS is not entitled to reimbursement for such fees from the Fund (with the exception of out-of-pocket fees).
The Fund pays the Transfer Agent a monthly transfer agency fee based on the number or the average value of accounts, depending on the type of account. In addition, prior to October 1, 2016, the Transfer Agent also received sub-transfer agency fees based on a percentage of the average aggregate value of the Fund's shares maintained in omnibus accounts (other than omnibus accounts for which American Enterprise Investment Services Inc. is the broker of record or accounts where the beneficial shareholder is a customer of Ameriprise Financial Services, Inc., for which the Transfer Agent receives a per account fee). Effective October 1, 2016, the Fund pays the Transfer Agent a fee for shareholder services based on the number of accounts or on a percentage of the average aggregate value of the Fund's shares maintained in omnibus accounts up to the lesser of the amount charged by the servicing agent or a cap established by the Board from time to time.
The Transfer Agent also receives compensation from the Fund for various shareholder services and reimbursements for certain out-of-pocket fees. Effective January 1, 2017, total transfer agency fees for Class K and Class R5 shares are subject to an annual limitation of not more than 0.075% of the average daily net assets attributable to each share class. Total transfer agency fees for Class I and Class Y shares are subject to an annual limitation of not more than 0.025% of the average daily net assets attributable to each share class. Prior to January 1, 2017, total transfer agency fees for Class K and Class R5 shares were subject to an annual limitation of not more than 0.05% of the average daily net assets attributable to each
share class. Class I and Class Y shares did not pay transfer agency fees.
For the six months ended November 30, 2016, the Fund's annualized effective transfer agency fee rates as a percentage of average daily net assets of each class were as follows:
Class A | | | 0.17 | % | |
Class B | | | 0.17 | | |
Class C | | | 0.17 | | |
Class K | | | 0.05 | | |
Class R | | | 0.17 | | |
Class R4 | | | 0.17 | | |
Class R5 | | | 0.05 | | |
Class W | | | 0.17 | | |
Class Z | | | 0.17 | | |
An annual minimum account balance fee of $20 may apply to certain accounts with a value below the applicable share class's initial minimum investment requirements to reduce the impact of small accounts on transfer agency fees. These minimum account balance fees are remitted to the Fund and recorded as part of expense reductions in the Statement of Operations. For the six months ended November 30, 2016, these minimum account balance fees reduced total expenses of the Fund by $4,493.
Plan Administration Fees
Under a Plan Administration Services Agreement with the Transfer Agent, the Fund pays an annual fee at a rate of 0.25% of the Fund's average daily net assets attributable to Class K shares for the provision of various administrative, recordkeeping, communication and educational services.
Distribution and Service Fees
The Fund has an agreement with Columbia Management Investment Distributors, Inc. (the Distributor), an affiliate of the Investment Manager and a wholly-owned subsidiary of Ameriprise Financial, for distribution and shareholder services. Under a Plan and Agreement of Distribution, the Fund pays a fee at an annual rate of up to 0.25% of the Fund's average daily net assets attributable to Class A and Class W shares, a fee at an annual rate of up to 0.50% of the Fund's average daily net assets attributable to Class R shares (of which up to 0.25% may be used for shareholder services) and a fee at an annual rate of up to 1.00% of the Fund's average daily net assets attributable to Class B and Class C
Semiannual Report 2016
46
COLUMBIA U.S. GOVERNMENT MORTGAGE FUND
NOTES TO FINANCIAL STATEMENTS (continued)
November 30, 2016 (Unaudited)
shares. For Class B and Class C shares, of the 1.00% fee, up to 0.75% is reimbursed for distribution expenses.
The amount of distribution and shareholder services expenses incurred by the Distributor and not yet reimbursed (unreimbursed expense) was approximately $692,000 and $312,000 for Class B and Class C shares, respectively. These amounts are based on the most recent information available as of September 30, 2016, and may be recovered from future payments under the distribution plan or CDSCs. To the extent the unreimbursed expense has been fully recovered, the distribution and/or shareholder services fee is reduced.
Sales Charges
Sales charges, including front-end charges and CDSCs, received by the Distributor for distributing Fund shares were $198,370 for Class A, $0 for Class B and $5,277 for Class C shares for the six months ended November 30, 2016.
Expenses Waived/Reimbursed by the Investment Manager and its Affiliates
The Investment Manager and certain of its affiliates have contractually agreed to waive fees and/or reimburse expenses (excluding certain fees and expenses described below) for the periods disclosed below, unless sooner terminated at the sole discretion of the Board, so that the Fund's net operating expenses, after giving effect to fees waived/expenses reimbursed and any balance credits and/or overdraft charges from the Fund's custodian, do not exceed the following annual rates as a percentage of the class' average daily net assets:
| | | October 1, 2016
Through
September 30, 2017 | | Prior to
October 1, 2016 | |
Class A | | | 0.90 | % | | | 0.90 | % | |
Class B | | | 1.65 | | | | 1.65 | | |
Class C | | | 1.65 | | | | 1.65 | | |
Class I | | | 0.52 | | | | 0.49 | | |
Class K | | | 0.82 | | | | 0.79 | | |
Class R | | | 1.15 | | | | 1.15 | | |
Class R4 | | | 0.65 | | | | 0.65 | | |
Class R5 | | | 0.57 | | | | 0.54 | | |
Class W | | | 0.90 | | | | 0.90 | | |
Class Y | | | 0.52 | | | | 0.49 | | |
Class Z | | | 0.65 | | | | 0.65 | | |
Under the agreement governing these fee waivers and/or expense reimbursement arrangements, the following
fees and expenses are excluded from the waiver/reimbursement commitment, and therefore will be paid by the Fund, if applicable: taxes (including foreign transaction taxes), expenses associated with investments in affiliated and non-affiliated pooled investment vehicles (including mutual funds and exchange-traded funds), transaction costs and brokerage commissions, costs related to any securities lending program, dividend and interest expenses associated with securities sold short, inverse floater program fees and expenses, transaction charges and interest on borrowed money, interest, infrequent and/or unusual expenses and any other expenses the exclusion of which is specifically approved by the Board. This agreement may be modified or amended only with approval from the Investment Manager, certain of its affiliates and the Fund. Any fees waived and/or expenses reimbursed under the expense reimbursement arrangements described above are not recoverable by the Investment Manager or its affiliates in future periods.
Note 4. Federal Tax Information
The timing and character of income and capital gain distributions are determined in accordance with income tax regulations, which may differ from GAAP because of temporary or permanent book to tax differences.
At November 30, 2016, the cost of investments for federal income tax purposes was approximately $2,890,418,000 and the aggregate gross approximate unrealized appreciation and depreciation based on that cost was:
Unrealized appreciation | | $ | 29,230,000 | | |
Unrealized depreciation | | | (54,949,000 | ) | |
Net unrealized depreciation | | $ | (25,719,000 | ) | |
Management of the Fund has concluded that there are no significant uncertain tax positions in the Fund that would require recognition in the financial statements. However, management's conclusion may be subject to review and adjustment at a later date based on factors including, but not limited to, new tax laws, regulations, and administrative interpretations (including relevant court decisions). Generally, the Fund's federal tax returns for the prior three fiscal years remain subject to examination by the Internal Revenue Service.
Note 5. Portfolio Information
The cost of purchases and proceeds from sales of securities, excluding short-term investments and derivatives, if any, aggregated to $4,753,253,246 and
Semiannual Report 2016
47
COLUMBIA U.S. GOVERNMENT MORTGAGE FUND
NOTES TO FINANCIAL STATEMENTS (continued)
November 30, 2016 (Unaudited)
$4,567,133,899, respectively, for the six months ended November 30, 2016, of which $4,440,492,350 and $4,309,780,307, respectively, were U.S. government securities. The amount of purchase and sale activity impacts the portfolio turnover rate reported in the Financial Highlights.
Note 6. Affiliated Money Market Fund
The Fund invests in Columbia Short-Term Cash Fund, an affiliated money market fund established for the exclusive use by the Fund and other affiliated funds (the Affiliated MMF). The income earned by the Fund from such investments is included as Dividends — affiliated issuers in the Statement of Operations. As an investing fund, the Fund indirectly bears its proportionate share of the expenses of the Affiliated MMF. Effective October 1, 2016, the Affiliated MMF prices its shares with a floating net asset value (NAV) and no longer seeks to maintain a stable NAV. In addition, the Board of the Affiliated MMF may impose a fee on redemptions (sometimes referred to as a liquidity fee) or temporarily suspend redemptions (sometimes referred to as imposing a redemption gate) in the event its liquidity falls below regulatory limits.
Note 7. Line of Credit
The Fund has access to a revolving credit facility with a syndicate of banks led by Citibank, N.A., HSBC Bank USA, N.A. and JPMorgan Chase Bank, N.A. whereby the Fund may borrow for the temporary funding of shareholder redemptions or for other temporary or emergency purposes. The credit facility agreement, which is a collective agreement between the Fund and certain other funds managed by the Investment Manager, severally and not jointly, that permits collective borrowings up to $1 billion. Interest is charged to each participating fund based on its borrowings at a rate equal to the higher of (i) the overnight federal funds rate plus 1.00% or (ii) the one-month LIBOR rate plus 1.00%. Each borrowing under the credit facility matures no later than 60 days after the date of borrowing. The Fund also pays a commitment fee equal to its pro rata share of the amount of the credit facility at a rate of 0.15% per annum. The commitment fee is included in other expenses in the Statement of Operations.
The Fund had no borrowings during the six months ended November 30, 2016.
Note 8. Significant Risks
Shareholder Concentration Risk
At November 30, 2016, one unaffiliated shareholder of record owned 15.9% of the outstanding shares of the Fund in one or more accounts. The Fund has no knowledge about whether any portion of those shares was owned beneficially. Affiliated shareholders of record owned 49.1% of the outstanding shares of the Fund in one or more accounts. Subscription and redemption activity by concentrated accounts may have a significant effect on the operations of the Fund. In the case of a large redemption, the Fund may be forced to sell investments at inopportune times, including its liquid or more liquid positions, resulting in Fund losses and the Fund holding a higher percentage of less liquid or illiquid securities. Large redemptions could result in decreased economies of scale and increased operating expenses for non-redeeming Fund shareholders.
Credit Risk
Credit risk is the risk that the value of debt securities in the Fund's portfolio may decline because the issuer may default and fail to pay interest or repay principal when due. Rating agencies assign credit ratings to debt securities to indicate their credit risk. Lower rated or unrated debt securities held by the Fund may present increased credit risk as compared to higher-rated debt securities.
Interest Rate Risk
Interest rate risk is the risk of losses attributable to changes in interest rates. In general, if prevailing interest rates rise, the values of debt securities tend to fall, and if interest rates fall, the values of debt securities tend to rise. Actions by governments and central banking authorities can result in increases in interest rates. Increasing interest rates may negatively affect the value of debt securities held by the Fund, resulting in a negative impact on the Fund's performance and net asset value per share. In general, the longer the maturity or duration of a debt security, the greater its sensitivity to changes in interest rates.
Liquidity Risk
Liquidity risk is the risk associated with a lack of marketability of investments which may make it difficult to sell the investment at a desirable time or price. Changing regulatory, market or other conditions or environments (for example, the interest rate or credit environments) may adversely affect the liquidity of the
Semiannual Report 2016
48
COLUMBIA U.S. GOVERNMENT MORTGAGE FUND
NOTES TO FINANCIAL STATEMENTS (continued)
November 30, 2016 (Unaudited)
Fund's investments. The Fund may have to accept a lower selling price for the holding, sell other investments, or forego another, more appealing investment opportunity. Generally, the less liquid the market at the time the Fund sells a portfolio investment, the greater the risk of loss or decline of value to the Fund. A less liquid market can lead to an increase in Fund redemptions, which may negatively impact Fund performance and net asset value per share, including, for example, if the Fund is forced to sell securities in a down market.
Mortgage- and Other Asset-Backed Securities Risk
The value of any mortgage-backed and other asset-backed securities held by the Fund may be affected by, among other things, changes or perceived changes in: interest rates; factors concerning the interests in and structure of the issuer or the originator of the mortgages or other assets; the creditworthiness of the entities that provide any supporting letters of credit, surety bonds or other credit enhancements; or the market's assessment of the quality of underlying assets. Payment of principal and interest on some mortgage-backed securities (but not the market value of the securities themselves) may be guaranteed by the full faith and credit of a particular U.S. Government agency, authority, enterprise or instrumentality, and some, but not all, are also insured or guaranteed by the U.S. Government. Mortgage-backed securities issued by non-governmental issuers (such as commercial banks, savings and loan institutions, private mortgage insurance companies, mortgage bankers and other secondary market issuers) may entail greater risk than obligations guaranteed by the U.S. Government. Mortgage- and other asset-backed securities are subject to prepayment risk, which is the possibility that the underlying mortgage or other asset may be refinanced or prepaid prior to maturity during periods of declining or low interest rates, causing the Fund to have to reinvest the money received in securities that have lower yields. Rising or high interest rates tend to extend the duration of mortgage- and other asset-backed securities, making their prices more volatile and more sensitive to changes in interest rates.
Note 9. Subsequent Events
Management has evaluated the events and transactions that have occurred through the date the financial statements were issued and noted no items requiring adjustment of the financial statements or additional disclosure.
Note 10. Information Regarding Pending and Settled Legal Proceedings
Ameriprise Financial and certain of its affiliates have historically been involved in a number of legal, arbitration and regulatory proceedings, including routine litigation, class actions, and governmental actions, concerning matters arising in connection with the conduct of their business activities. Ameriprise Financial believes that the Funds are not currently the subject of, and that neither Ameriprise Financial nor any of its affiliates are the subject of, any pending legal, arbitration or regulatory proceedings that are likely to have a material adverse effect on the Funds or the ability of Ameriprise Financial or its affiliates to perform under their contracts with the Funds. Ameriprise Financial is required to make quarterly (10-Q), annual (10-K) and, as necessary, 8-K filings with the Securities and Exchange Commission (SEC) on legal and regulatory matters that relate to Ameriprise Financial and its affiliates. Copies of these filings may be obtained by accessing the SEC website at www.sec.gov.
There can be no assurance that these matters, or the adverse publicity associated with them, will not result in increased fund redemptions, reduced sale of fund shares or other adverse consequences to the Funds. Further, although we believe proceedings are not likely to have a material adverse effect on the Funds or the ability of Ameriprise Financial or its affiliates to perform under their contracts with the Funds, these proceedings are subject to uncertainties and, as such, we are unable to estimate the possible loss or range of loss that may result. An adverse outcome in one or more of these proceedings could result in adverse judgments, settlements, fines, penalties or other relief that could have a material adverse effect on the consolidated financial condition or results of operations of Ameriprise Financial.
Semiannual Report 2016
49
COLUMBIA U.S. GOVERNMENT MORTGAGE FUND
APPROVAL OF MANAGEMENT AGREEMENT
Columbia Management Investment Advisers, LLC (Columbia Threadneedle or the Investment Manager, and together with its domestic and global affiliates, Columbia Threadneedle Investments), a wholly-owned subsidiary of Ameriprise Financial, Inc. (Ameriprise Financial), serves as the investment manager to Columbia U.S. Government Mortgage Fund (the Fund). Under a management agreement (the Management Agreement), Columbia Threadneedle provides investment advice and other services to the Fund and other funds distributed by Columbia Management Investment Distributors, Inc. (collectively, the Funds).
On an annual basis, the Fund's Board of Trustees (the Board), including the independent Board members (the Independent Trustees), considers renewal of the Management Agreement. Columbia Threadneedle prepared detailed reports for the Board and its Contracts Committee in February, March and April 2016, including reports providing the results of analyses performed by an independent organization, Broadridge Financial Solutions, Inc. (Broadridge), and a comprehensive response to items of information requested by independent legal counsel to the Independent Trustees (Independent Legal Counsel) in a letter to the Investment Manager, to assist the Board in making this determination. Many of the materials presented in February, March and April were first supplied in draft form to designated independent Board representatives, i.e., Independent Legal Counsel, the Chair of the Board and/or the Chair of the Contracts Committee, and the final materials were revised to contain information reflective of discussion and subsequent requests made by the Contracts Committee. In addition, throughout the year, the Board (or its committees) regularly meets with portfolio management teams and senior management personnel and reviews information prepared by Columbia Threadneedle addressing the services Columbia Threadneedle provides and Fund performance. The Board also accords appropriate weight to the work, deliberations and conclusions of the various committees, such as the Contracts Committee, the Investment Review Committee and the Compliance Committee in determining whether to continue the Management Agreement.
The Board, at its June 13-15, 2016 in-person Board meeting (the June Meeting), considered the renewal of the Management Agreement for an additional one-year term. At the June Meeting, Independent Legal Counsel reviewed with the Independent Trustees various factors relevant to the Board's consideration of management agreements and the Board's legal responsibilities related to such consideration. Following an analysis and discussion of the factors identified below, the Board, including all of the Independent Trustees, approved the renewal of the Management Agreement.
Nature, Extent and Quality of Services Provided by Columbia Threadneedle
The Independent Trustees analyzed various reports and presentations they had received detailing the services performed by Columbia Threadneedle, as well as its organization, expertise, resources and capabilities.
The Independent Trustees specifically considered many developments during the past year concerning the services provided by Columbia Threadneedle, including, in particular, the relatively recent change in the leadership of equity department oversight, improvements in technology research and the use of research analysts' model portfolios to highlight best ideas and improve implementation. The Independent Trustees further noted the restructured investment risk management department and its additional resources, including the new head of multi-asset investment risk. They also observed the relatively recent 5P leadership transition, and the additional staff and resources dedicated to the 5P team. The Board also noted the broad scope of services provided by Columbia Threadneedle to each Fund, including, among other services, investment, risk and compliance oversight. The Board also took into account the information it received concerning Columbia Threadneedle's ability to attract and retain key portfolio management personnel.
In connection with the Board's evaluation of the overall package of services provided by Columbia Threadneedle, the Board also considered the nature, quality and range of administrative services provided to the Fund by Columbia Threadneedle, as well as the achievements in 2015 in the performance of administrative services, and noted the various enhancements anticipated for 2016. In evaluating the quality of services provided under the Management Agreement, the Independent Trustees also took into account the organization and strength of the Fund's and its service providers' compliance programs. In addition, the Board reviewed the financial condition of Columbia Threadneedle and its affiliates and each entity's ability to carry out its responsibilities under the
Semiannual Report 2016
50
COLUMBIA U.S. GOVERNMENT MORTGAGE FUND
APPROVAL OF MANAGEMENT AGREEMENT (continued)
Management Agreement and the Fund's other service agreements with affiliates of Ameriprise Financial, observing the financial strength of Ameriprise Financial, with its solid balance sheet.
The Board also discussed the acceptability of the terms of the Management Agreement (including the relatively broad scope of services required to be performed by Columbia Threadneedle), noting that no material changes are proposed from the form of agreement previously approved. They also noted the wide array of legal and compliance services provided to the Funds. It was also observed that the services being performed under the Management Agreement were of a reasonably high quality.
Based on the foregoing, and based on other information received (both oral and written, including the information on investment performance referenced below) and other considerations, the Board concluded that Columbia Threadneedle and its affiliates are in a position to continue to provide a high quality and level of services to the Fund.
Investment Performance
For purposes of evaluating the nature, extent and quality of services provided under the Management Agreement, the Board carefully reviewed the investment performance of the Fund. In this regard, the Board considered detailed reports providing the results of analyses performed by an independent organization showing, for various periods, the performance of the Fund, the performance of a benchmark index, the percentage ranking of the Fund among its comparison group and the net assets of the Fund. The Board observed that the Fund's investment performance met expectations.
Comparative Fees, Costs of Services Provided and the Profits Realized by Columbia Threadneedle and its Affiliates from their Relationships with the Fund
The Board reviewed comparative fees and the costs of services provided under the Management Agreement. The Board members considered detailed comparative information set forth in an annual report on fees and expenses, including, among other things, data (based on analyses conducted by an independent organization) showing a comparison of the Fund's expenses with median expenses paid by funds in its comparative peer universe, as well as data showing the Fund's contribution to Columbia Threadneedle's profitability. The Board reviewed the fees charged to comparable institutional or other accounts/vehicles managed by Columbia Threadneedle and discussed differences in how the products are managed and operated, noting no unreasonable differences in the levels of contractual fees.
The Board considered the reports of its independent fee consultant, JDL Consultants, LLC (JDL), which assisted in its analysis of the Funds' performance and expenses, the reasonableness of the Funds' fee rates, the reasonableness of Columbia Threadneedle's profitability, and JDL's conclusion that the management fees being charged to the Fund are reasonable. The Board accorded particular weight to the notion that the level of fees should generally reflect a rational pricing model applied consistently across the various product lines in the Fund family, while assuring that the overall fees for each Fund (with certain defined exceptions) are generally in line with the "pricing philosophy" currently in effect (i.e., that the total expense ratio of the Fund is generally no higher than the median expense ratio of funds in the comparison universe of the Fund). The Board took into account that the Fund's total expense ratio (after considering proposed expense caps/waivers) approximated the peer universe's median expense ratio. Based on its review, the Board concluded that the Fund's management fee was fair and reasonable in light of the extent and quality of services that the Fund receives.
The Board also considered the expected profitability of Columbia Threadneedle and its affiliates in connection with Columbia Threadneedle providing management services to the Fund. In this regard, the Independent Trustees referred to their detailed analysis of the Profitability Report, discussing the profitability to Columbia Threadneedle and Ameriprise Financial from managing, operating and distributing the Funds. The Board took into account JDL's conclusion that 2015 Columbia Threadneedle profitability, relative to industry competitors, was reasonable. It also considered that in 2015 the Board had concluded that 2014 profitability was reasonable and that Columbia Threadneedle generated 2015 profitability that only slightly exceeded 2014 levels. It also took into account the indirect economic benefits flowing to Columbia Threadneedle or its affiliates in connection with
Semiannual Report 2016
51
COLUMBIA U.S. GOVERNMENT MORTGAGE FUND
APPROVAL OF MANAGEMENT AGREEMENT (continued)
managing or distributing the Funds, such as the enhanced ability to offer various other financial products to Ameriprise Financial customers, soft dollar benefits and overall reputational advantages. The Board noted that the fees paid by the Fund should permit the Investment Manager to offer competitive compensation to its personnel, make necessary investments in its business and earn an appropriate profit. The Board concluded that profitability levels were reasonable.
Economies of Scale to be Realized
The Board also considered the economies of scale that might be realized by Columbia Threadneedle as the Fund grows and took note of the extent to which Fund shareholders might also benefit from such growth. In this regard, the Board took into account that management fees decline as Fund assets exceed various breakpoints, all of which have not been surpassed. The Board concluded that the breakpoints in the management fee rate schedule satisfactorily provides for the sharing of economies of scale, as they allow for adequate opportunity for shareholders to realize benefits (fee breaks) as Fund assets grow.
Based on the foregoing, the Board, including all of the Independent Trustees, concluded that the management fees were fair and reasonable in light of the extent and quality of services provided. In reaching this conclusion, no single factor was determinative. On June 15, 2016, the Board, including all of the Independent Trustees, approved the renewal of the Management Agreement.
Semiannual Report 2016
52
COLUMBIA U.S. GOVERNMENT MORTGAGE FUND
IMPORTANT INFORMATION ABOUT THIS REPORT
Each fund mails one shareholder report to each shareholder address. If you would like more than one report, please call shareholder services at 800.345.6611 and additional reports will be sent to you.
The policy of the Board is to vote the proxies of the companies in which each fund holds investments consistent with the procedures as stated in the Statement of Additional Information (SAI). You may obtain a copy of the SAI without charge by calling 800.345.6611; contacting your financial intermediary; visiting investor.columbiathreadneedleus.com; or searching the website of the Securities and Exchange Commission (SEC) at sec.gov. Information regarding how each fund voted proxies relating to portfolio securities is filed with the SEC by August 31st for the most recent 12-month period ending June 30th of that year, and is available without charge by visiting investor.columbiathreadneedleus.com, or searching the website of the SEC at sec.gov.
Each fund files a complete schedule of portfolio holdings with the SEC for the first and third quarters of each fiscal year on Form N-Q. Each fund's Form N-Q is available on the SEC's website at sec.gov and may be reviewed and copied at the SEC's Public Reference Room in Washington, D.C. Information on the operation of the Public Reference Room may be obtained by calling 800.SEC.0330. Each fund's complete schedule of portfolio holdings, as filed on Form N-Q, can also be obtained without charge, upon request, by calling 800.345.6611.
Semiannual Report 2016
53
Columbia U.S. Government Mortgage Fund
P.O. Box 8081
Boston, MA 02266-8081

Please read and consider the investment objectives, risks, charges and expenses for any fund carefully before investing. For a prospectus and summary prospectus, which contains this and other important information about the Fund, go to investor.columbiathreadneedleus.com. The Fund is distributed by Columbia Management Investment Distributors, Inc., member FINRA, and managed by Columbia Management Investment Advisers, LLC.
Columbia Threadneedle Investments (Columbia Threadneedle) is the global brand name of the Columbia and Threadneedle group of companies.
All rights reserved. Columbia Management Investment Distributors, Inc., 225 Franklin Street, Boston, MA 02110-2804
© 2017 Columbia Management Investment Advisers, LLC.
investor.columbiathreadneedleus.com
SAR236_05_G01_(01/17)

SEMIANNUAL REPORT
November 30, 2016

COLUMBIA COMMODITY STRATEGY FUND


ABOUT COLUMBIA THREADNEEDLE INVESTMENTS
Columbia Threadneedle Investments is a leading global asset management group that provides a broad range of investment strategies and solutions for individual, institutional and corporate clients around the world.
With more than 2,000 people, including over 450 investment professionals based in North America, Europe and Asia, we manage $460 billion* of assets across developed and emerging market equities, fixed income, asset allocation solutions and alternatives. We are the 13th largest manager of long-term mutual fund assets in the U.S.** and the 4th largest manager of retail funds in the U.K.***
Our priority is the investment success of our clients. We aim to deliver the investment outcomes they expect through an investment approach that is team-based, performance-driven and risk-aware. Our culture is dynamic and interactive. By sharing our insights across asset classes and geographies, we generate richer perspectives on global, regional and local investment landscapes. The ability to exchange and debate investment ideas in a collaborative environment enriches our teams’ investment processes. More importantly, it results in better informed investment decisions for our clients.
Columbia funds are distributed by Columbia Management Investment Distributors, Inc., member FINRA, and managed by Columbia Management Investment Advisers, LLC.
Columbia Threadneedle Investments (Columbia Threadneedle) is the global brand name of the Columbia and Threadneedle group of companies.
| * | | In U.S. dollars as of June 30, 2016. Source: Ameriprise Q2 Earnings Release. Includes all assets managed by entities in the Columbia and Threadneedle group of companies. Contact us for more current data. |
| ** | | Source: ICI as of June 30, 2016 for Columbia Management Investment Advisers, LLC. |
| *** | | Source: Investment Association as of March 2016 for Threadneedle Asset Management Limited. |
© 2016 Columbia Management Investment Advisers, LLC. All rights reserved.
Not part of the shareholder report
| | | | |
| | Investment strategies to help meet investor needs |
| |
| | We are committed to helping investors navigate financial challenges to reach their desired outcomes. The possibilities are endless. |
| | | | |
| | | | |
| | Your success is our priority. |
| | | | |
| | |
| |  | | Retire comfortably |
| | | | |
| | |
| | | | Fund college or higher education |
| | | | |
| | |
| | | | Leave a legacy |
| | | | |
| | | | |
 | | Generate an appropriate stream of income in retirement Traditional approaches to income may no longer be adequate — and they may no longer provide the diversification benefits they once did. Investors need to rethink how they generate retirement income. Worried about running out of income? You are not alone. |
| | | | |
| | | | |
 | | Navigate a changing interest rate environment Even in today’s challenging interest rate environment, it’s still possible to navigate markets and achieve your goals. Make investment choices designed specifically for this market environment. |
| | | | |
| | | | |
| |
 | | Maximize after-tax returns In an environment where what you keep is more important than what you earn, municipal bonds can help mitigate higher taxes while providing attractive yields compared to other investment options. You’ve worked too hard building your wealth to lose it to taxes. |
| | | | |
| | | | |
 | | Grow assets to achieve financial goals Finding growth opportunities in today’s complex market environment requires strong research capabilities, creative thinking and a disciplined approach. Do your investments deliver the portfolio growth you need? |
| | | | |
| | | | |
| |
 | | Ease the impact of volatile markets With increasing concerns about market volatility, investors should consider diversifying their portfolios with non-traditional holdings. Interested in turning volatility into opportunity? |
To find out more, contact your financial professional, call 800.426.3750 or visit investor.columbiathreadneedleus.com
Not part of the shareholder report
PRESIDENT’S MESSAGE

Dear Shareholders,
While emotions have run high following the outcome of the U.S. Presidential election, it remains unclear how the Trump presidency will unfold in terms of policy. We have a sense of the priorities espoused by the president-elect over the past eighteen months, but campaign priorities are not always realized and are often never pursued. What seems certain is that, while some investors have already priced expectations into the market, others have retreated, preferring instead a wait and see approach. The outcome of such behaviors appears to have created conditions ripe for ongoing market volatility.
While volatility in the financial markets can be stressful, volatility itself is not a new phenomenon. Other factors that have been at the root cause of recent volatility include uncertainty following the United Kingdom’s vote to exit the European Union (Brexit), speculation around the Federal Reserve’s decision to increase interest rates, divergent central bank policy and geopolitical unrest. The point is, financial markets have fluctuated for years and may be expected to continue to fluctuate — sometimes wildly. If anything, such volatility seems to be the new normal, perhaps exacerbated by access to information and development of technological tools which have enabled investors to react rapidly to real and perceived change. So what can you do?
Position your portfolio for the reality of market volatility
That there is a historical precedent for market volatility, or even an acceptance that it may persist, offers little comfort. A measured and strategic approach remains the best strategy for investors to stay on track in achieving their investment goals.
Step 1: Review your investment goals
Take this opportunity to review your investment goals and the strategies you are pursuing to achieve those goals in order to remain focused on what’s important to you. It is entirely possible that your goals have changed in response either to your life situation or to changes in the market. Accept what you can’t control — volatility, and focus on what you can — your investment goals and strategies.
Step 2: Reassess your risk tolerance
Sit down with your financial advisor to discuss your investment goals and strategies, as well as any changes to your tolerance for risk. Consider your investment horizon. Increased market volatility and a new investment horizon may impact the strategies that can best help you achieve your investment goals. Remember, achieving your investment goals may require a certain amount of risk. Ultimately, you must maintain vigilance in reassessing your risk tolerance and the strategies you have selected in pursuit of your investment goals, and awareness of how those strategies may react to market volatility.
Step 3: Remain calm and focus on your long-term plan
Remember, investing is about the long game. Short term events are not necessarily evidence of a longer term reality. Investors who attempt to time the market too often end up reacting to a down turn by selling low and then compounding the problem by waiting on the sidelines, ultimately missing the right opportunity to reinvest.
As long as there is a market, there will be volatility. How you respond to that volatility can make a big difference in the measure of your success as an investor. Talk to your financial advisor about how working with Columbia Threadneedle Investments may help you position your portfolio for the reality of ongoing volatility and, perhaps, even turn such volatility into investment opportunity.
Best regards,

Christopher O. Petersen
President, Columbia Funds
Investors should consider the investment objectives, risks, charges and expenses of a mutual fund carefully before investing. For a free prospectus and summary prospectus, which contains this and other important information about a fund, visit investor.columbiathreadneedleus.com. The prospectus should be read carefully before investing.
Columbia Funds are distributed by Columbia Management Investment Distributors, Inc., member FINRA, and managed by Columbia Management Investment Advisers, LLC.
© 2017 Columbia Management Investment Advisers, LLC. All rights reserved.
Semiannual Report 2016
| | | | | | |
| | |
| | | | COLUMBIA COMMODITY STRATEGY FUND | | |
TABLE OF CONTENTS
Fund Investment Manager
Columbia Management Investment
Advisers, LLC
225 Franklin Street
Boston, MA 02110
Fund Distributor
Columbia Management Investment
Distributors, Inc.
225 Franklin Street
Boston, MA 02110
Fund Transfer Agent
Columbia Management Investment
Services Corp.
P.O. Box 8081
Boston, MA 02266-8081
For more information about any of the funds, please visit investor.columbiathreadneedleus.com or call 800.345.6611. Customer Service Representatives are available to answer your questions Monday through Friday from 8 a.m. to 7 p.m. Eastern time.
The views expressed in this report reflect the current views of the respective parties. These views are not guarantees of future performance and involve certain risks, uncertainties and assumptions that are difficult to predict, so actual outcomes and results may differ significantly from the views expressed. These views are subject to change at any time based upon economic, market or other conditions and the respective parties disclaim any responsibility to update such views. These views may not be relied on as investment advice and, because investment decisions for a Columbia fund are based on numerous factors, may not be relied on as an indication of trading intent on behalf of any particular Columbia fund. References to specific securities should not be construed as a recommendation or investment advice.
Semiannual Report 2016
| | | | | | |
| | |
| | | | COLUMBIA COMMODITY STRATEGY FUND | | |
PERFORMANCE OVERVIEW
(Unaudited)
Performance Summary
| ∎ | | Columbia Commodity Strategy Fund (the Fund) Class A shares returned 1.11% excluding sales charges for the six-month period that ended November 30, 2016. |
| ∎ | | The Fund outperformed its benchmark, the Bloomberg Commodity Index Total Return, which returned 0.95% for the same period. |
| | | | | | | | | | | | | | | | | | |
Average Annual Total Returns (%) (for period ended November 30, 2016) | |
| | | Inception | | 6 Months
Cumulative | | | 1 Year | | | 5 Years | | | Life | |
Class A* | | 06/18/12 | | | | | | | | | | | | | | | | |
Excluding sales charges | | | | | 1.11 | | | | 7.50 | | | | -9.82 | | | | -10.74 | |
Including sales charges | | | | | -4.72 | | | | 1.30 | | | | -10.89 | | | | -11.72 | |
Class C* | | 06/18/12 | | | | | | | | | | | | | | | | |
Excluding sales charges | | | | | 0.57 | | | | 6.48 | | | | -10.54 | | | | -11.44 | |
Including sales charges | | | | | -0.43 | | | | 5.48 | | | | -10.54 | | | | -11.44 | |
Class I | | 07/28/11 | | | 1.09 | | | | 7.77 | | | | -9.52 | | | | -10.44 | |
Class R* | | 06/18/12 | | | 0.75 | | | | 6.96 | | | | -10.08 | | | | -10.99 | |
Class R4* | | 03/19/13 | | | 1.09 | | | | 7.78 | | | | -9.67 | | | | -10.59 | |
Class R5* | | 01/08/14 | | | 1.28 | | | | 7.75 | | | | -9.66 | | | | -10.59 | |
Class W | | 07/28/11 | | | 1.12 | | | | 7.30 | | | | -9.86 | | | | -10.77 | |
Class Y* | | 10/01/14 | | | 1.27 | | | | 7.74 | | | | -9.69 | | | | -10.62 | |
Class Z* | | 06/18/12 | | | 1.10 | | | | 7.42 | | | | -9.66 | | | | -10.59 | |
Bloomberg Commodity Index Total Return | | | | | 0.95 | | | | 6.40 | | | | -9.97 | | | | -11.30 | |
Returns for Class A are shown with and without the maximum initial sales charge of 5.75%. Returns for Class C are shown with and without the 1.00% contingent deferred sales charge for the first year only. The Fund’s other classes are not subject to sales charges and have limited eligibility. Please see the Fund’s prospectus for details. Performance for different share classes will vary based on differences in sales charges and fees associated with each class. All results shown assume reinvestment of distributions during the period. Returns do not reflect the deduction of taxes that a shareholder may pay on Fund distributions or on the redemption of Fund shares. Performance results reflect the effect of any fee waivers or reimbursements of Fund expenses by Columbia Management Investment Advisers, LLC and/or any of its affiliates. Absent these fee waivers or expense reimbursement arrangements, performance results would have been lower.
The performance information shown represents past performance and is not a guarantee of future results. The investment return and principal value of your investment will fluctuate so that your shares, when redeemed, may be worth more or less than their original cost. Current performance may be lower or higher than the performance information shown. You may obtain performance information current to the most recent month-end by contacting your financial intermediary, visiting investor.columbiathreadneedleus.com or calling 800.345.6611.
| * | The returns shown for periods prior to the share class inception date (including returns for the Life of the Fund, if shown, which are since Fund inception) include the returns of the Fund’s oldest share class. Since the Fund launched more than one share class at its inception, Class W shares were used. These returns are adjusted to reflect any higher class-related operating expenses of the newer share classes, as applicable. Please visit investor.columbiathreadneedleus.com/investment-products/mutual-funds/appended-performance for more information. |
The Bloomberg Commodity Index Total Return is a total return index based on the Bloomberg Commodity Index, which is a broadly diversified index composed of futures contracts on physical commodities that allows investors to track commodity futures through a single, simple measure.
Indices are not available for investment, are not professionally managed and do not reflect sales charges, fees, brokerage commissions, taxes or other expenses of investing. Securities in the Fund may not match those in an index.
| | | | | | |
| | |
| | | | COLUMBIA COMMODITY STRATEGY FUND | | |
PORTFOLIO OVERVIEW
(Unaudited)
| | | | |
Commodities Market Exposure (%) (at November 30, 2016) | |
Commodities Futures Contracts(a) | | | | |
Agriculture | | | 28.0 | |
Energy | | | 36.0 | |
Industrial Metals | | | 18.3 | |
Livestock | | | 3.8 | |
Precious Metals | | | 13.9 | |
Total Notional Market Value of Commodities Futures Contracts | | | 100 | |
| (a) | Reflects notional market value of commodities futures contracts. The notional exposure of a financial instrument is the nominal or face amount that is used to calculate payments made on that instrument and/or changes in value for the instrument. The notional exposure is a hypothetical underlying quantity upon which payment obligations are computed. Notional exposures provide a gauge for how the Fund may behave given changes in individual markets. Notional amounts for each commodities futures contract are shown in the Consolidated Portfolio of Investments. The notional amount of all outstanding commodities futures contracts is $270,119,040. For a description of the Fund’s investments in derivatives, see Investments in Derivatives following the Consolidated Portfolio of Investments and Note 2 to the Notes to Consolidated Financial Statements. |
| | | | |
Portfolio Holdings (%) (at November 30, 2016) | | | | |
Money Market Funds | | | 62.5 | |
Treasury Bills | | | 27.7 | |
U.S. Government & Agency Obligations | | | 18.5 | |
Other Assets & Liabilities | | | (8.7 | ) |
Total | | | 100.0 | |
Percentages indicated are based upon net assets. At period end, the Fund held investments in an affiliated money market fund, Treasury Bills and U.S. Government & Agency Obligations, which have been segregated to cover obligations relating to the Fund’s investments in open futures contracts which provide exposure to the commodities market. For a description of the Fund’s investment in derivatives, see Investments in Derivatives following the Consolidated Portfolio of Investments and Note 2 to the Notes to Consolidated Financial Statements.
Portfolio Management
Threadneedle International Limited
David Donora
Nicolas Robin
| | | | | | |
| | |
| | | | COLUMBIA COMMODITY STRATEGY FUND | | |
UNDERSTANDING YOUR FUND’S EXPENSES
(Unaudited)
As an investor, you incur two types of costs. There are transaction costs, which generally include sales charges on purchases and may include redemption fees. There are also ongoing costs, which generally include management fees, distribution and/or service fees, and other fund expenses. The following information is intended to help you understand your ongoing costs (in dollars) of investing in the Fund and to help you compare these costs with the ongoing costs of investing in other mutual funds.
Analyzing Your Fund’s Expenses
To illustrate these ongoing costs, we have provided examples and calculated the expenses paid by investors in each share class of the Fund during the period. The actual and hypothetical information in the table is based on an initial investment of $1,000 at the beginning of the period indicated and held for the entire period. Expense information is calculated two ways and each method provides you with different information. The amount listed in the “Actual” column is calculated using the Fund’s actual operating expenses and total return for the period. You may use the Actual information, together with the amount invested, to estimate the expenses that you paid over the period. Simply divide your account value by $1,000 (for example, an $8,600 account value divided by $1,000 = 8.6), then multiply the results by the expenses paid during the period under the “Actual” column. The amount listed in the “Hypothetical” column assumes a 5% annual rate of return before expenses (which is not the Fund’s actual return) and then applies the Fund’s actual expense ratio for the period to the hypothetical return. You should not use the hypothetical account values and expenses to estimate either your actual account balance at the end of the period or the expenses you paid during the period. See “Compare With Other Funds” below for details on how to use the hypothetical data.
Compare With Other Funds
Since all mutual funds are required to include the same hypothetical calculations about expenses in shareholder reports, you can use this information to compare the ongoing cost of investing in the Fund with other funds. To do so, compare the hypothetical example with the 5% hypothetical examples that appear in the shareholder reports of other funds. As you compare hypothetical examples of other funds, it is important to note that hypothetical examples are meant to highlight the ongoing costs of investing in a fund only and do not reflect any transaction costs, such as sales charges, or redemption or exchange fees. Therefore, the hypothetical calculations are useful in comparing ongoing costs only, and will not help you determine the relative total costs of owning different funds. If transaction costs were included in these calculations, your costs would be higher.
June 1, 2016 – November 30, 2016
| | | | | | | | | | | | | | | | | | | | | | | | | | | | |
| | | Account Value at the
Beginning of the
Period ($) | | | Account Value at the
End of the
Period ($) | | | Expenses Paid During
the Period ($) | | | Fund’s Annualized
Expense Ratio (%) | |
| | | | Actual | | | | Hypothetical | | | | Actual | | | | Hypothetical | | | | Actual | | | | Hypothetical | | | | Actual | |
Class A | | | 1,000.00 | | | | 1,000.00 | | | | 1,011.10 | | | | 1,019.25 | | | | 5.85 | | | | 5.87 | | | | 1.16 | |
Class C | | | 1,000.00 | | | | 1,000.00 | | | | 1,005.70 | | | | 1,015.49 | | | | 9.60 | | | | 9.65 | | | | 1.91 | |
Class I | | | 1,000.00 | | | | 1,000.00 | | | | 1,010.90 | | | | 1,021.41 | | | | 3.68 | | | | 3.70 | | | | 0.73 | |
Class R | | | 1,000.00 | | | | 1,000.00 | | | | 1,007.50 | | | | 1,018.00 | | | | 7.10 | | | | 7.13 | | | | 1.41 | |
Class R4 | | | 1,000.00 | | | | 1,000.00 | | | | 1,010.90 | | | | 1,020.51 | | | | 4.59 | | | | 4.61 | | | | 0.91 | |
Class R5 | | | 1,000.00 | | | | 1,000.00 | | | | 1,012.80 | | | | 1,021.06 | | | | 4.04 | | | | 4.05 | | | | 0.80 | |
Class W | | | 1,000.00 | | | | 1,000.00 | | | | 1,011.20 | | | | 1,019.35 | | | | 5.75 | | | | 5.77 | | | | 1.14 | |
Class Y | | | 1,000.00 | | | | 1,000.00 | | | | 1,012.70 | | | | 1,021.41 | | | | 3.68 | | | | 3.70 | | | | 0.73 | |
Class Z | | | 1,000.00 | | | | 1,000.00 | | | | 1,011.00 | | | | 1,020.61 | | | | 4.49 | | | | 4.51 | | | | 0.89 | |
Expenses paid during the period are equal to the annualized expense ratio for each class as indicated above, multiplied by the average account value over the period and then multiplied by the number of days in the Fund’s most recent fiscal half year and divided by 365.
Expenses do not include fees and expenses incurred indirectly by the Fund from its investment in underlying funds, including affiliated and non-affiliated pooled investment vehicles, such as mutual funds and exchange-traded funds.
| | | | | | |
| | |
| | | | COLUMBIA COMMODITY STRATEGY FUND | | |
CONSOLIDATED PORTFOLIO OF INVESTMENTS
November 30, 2016 (Unaudited)
(Percentages represent value of investments compared to net assets)
| | | | | | | | | | | | |
| U.S. Government & Agency Obligations 18.5% | |
| Issuer | | Effective
Yield | | | Principal
Amount ($) | | | Value ($) | |
Federal Home Loan Banks Discount Notes | | | | | |
12/08/16 | | | 0.280% | | | | 10,000,000 | | | | 9,999,388 | |
01/20/17 | | | 0.450% | | | | 10,000,000 | | | | 9,993,696 | |
| |
Federal Home Loan Mortgage Corp. | | | | | |
03/21/17 | | | 0.520% | | | | 20,000,000 | | | | 19,968,220 | |
| |
Federal National Mortgage Association Discount Notes | | | | | |
02/14/17 | | | 0.460% | | | | 10,000,000 | | | | 9,990,420 | |
| | | | | | | | | | | | | |
Total U.S. Government & Agency Obligations | | | | | |
(Cost: $49,954,596) | | | | | | | | | | | 49,951,724 | |
| | | |
| | | | | | | | | | | | |
| Treasury Bills 27.7% | |
UNITED STATES 27.7% | |
U.S. Treasury Bills | | | | | | | | | | | | |
12/29/16 | | | 0.250% | | | | 15,000,000 | | | | 14,996,983 | |
01/19/17 | | | 0.340% | | | | 15,000,000 | | | | 14,992,968 | |
01/26/17 | | | 0.350% | | | | 15,000,000 | | | | 14,991,730 | |
02/09/17 | | | 0.440% | | | | 15,000,000 | | | | 14,987,265 | |
| | | | | | | | | | | | |
| Treasury Bills (continued) | |
| Issuer | | Effective
Yield | | | Principal
Amount ($) | | | Value ($) | |
03/30/17 | | | 0.500% | | | | 15,000,000 | | | | 14,975,550 | |
| | | | | | | | | | | | | |
Total | | | | | | | | | | | 74,944,496 | |
| | | | | | | | | | | | | |
Total Treasury Bills | | | | | | | | | | | | |
(Cost: $74,945,639) | | | | | | | | | | | 74,944,496 | |
| | | |
| | | | | | | | | | | | |
| Money Market Funds 62.5% | |
| | | | | | Shares | | | Value ($) | |
| | |
Columbia Short-Term Cash Fund, 0.480%(a)(b) | | | | 168,913,271 | | | | 168,930,277 | |
| | | | | | | | | | | | | |
Total Money Market Funds | | | | | |
(Cost: $168,913,463) | | | | | | | | | | | 168,930,277 | |
| | | | | | | | | | | | | |
Total Investments | | | | | | | | | | | | |
(Cost: $293,813,698) | | | | | | | | | | | 293,826,497 | |
| | | | | | | | | | | | | |
Other Assets & Liabilities, Net | | | | (23,411,670 | ) |
| | | | | | | | | | | | | |
Net Assets | | | | | | | | | | | 270,414,827 | |
| | | | | | | | | | | | | |
At November 30, 2016, cash totaling $23,169,110 was pledged as collateral.
Investments in Derivatives
Futures Contracts Outstanding at November 30, 2016
Long Futures Contracts Outstanding
| | | | | | | | | | | | | | | | | | | | | | | | |
| Contract Description | | Number of
Contracts | | | Trading
Currency | | | Notional Market
Value ($) | | | Expiration Date | | | Unrealized
Appreciation ($) | | | Unrealized
(Depreciation) ($) | |
Brent Crude | | | 529 | | | | USD | | | | 27,788,370 | | | | 01/2017 | | | | 2,023,966 | | | | — | |
Coffee C | | | 12 | | | | USD | | | | 677,700 | | | | 03/2017 | | | | — | | | | (38,187 | ) |
Coffee C | | | 100 | | | | USD | | | | 5,647,500 | | | | 03/2017 | | | | — | | | | (683,912 | ) |
Copper | | | 135 | | | | USD | | | | 19,639,969 | | | | 01/2017 | | | | 3,106,723 | | | | — | |
Corn | | | 76 | | | | USD | | | | 1,324,300 | | | | 03/2017 | | | | — | | | | (31,808 | ) |
Corn | | | 852 | | | | USD | | | | 14,846,100 | | | | 03/2017 | | | | — | | | | (217,344 | ) |
Cotton | | | 97 | | | | USD | | | | 3,471,630 | | | | 03/2017 | | | | 112,574 | | | | — | |
Cotton | | | 8 | | | | USD | | | | 286,320 | | | | 03/2017 | | | | — | | | | (912 | ) |
Gold 100 oz. | | | 227 | | | | USD | | | | 26,647,530 | | | | 02/2017 | | | | — | | | | (1,929,872 | ) |
HRW Wheat | | | 56 | | | | USD | | | | 1,148,700 | | | | 03/2017 | | | | — | | | | (14,074 | ) |
HRW Wheat | | | 197 | | | | USD | | | | 4,040,962 | | | | 03/2017 | | | | — | | | | (181,208 | ) |
Lean Hogs | | | 158 | | | | USD | | | | 3,490,220 | | | | 02/2017 | | | | 57,928 | | | | — | |
Lean Hogs | | | 11 | | | | USD | | | | 242,990 | | | | 02/2017 | | | | — | | | | (927 | ) |
Live Cattle | | | 75 | | | | USD | | | | 3,358,500 | | | | 02/2017 | | | | 134,505 | | | | — | |
Live Cattle | | | 11 | | | | USD | | | | 492,580 | | | | 02/2017 | | | | 10,113 | | | | — | |
Live Cattle | | | 58 | | | | USD | | | | 2,592,020 | | | | 04/2017 | | | | 166,230 | | | | — | |
Live Cattle | | | 1 | | | | USD | | | | 44,690 | | | | 04/2017 | | | | 2,186 | | | | — | |
NY Harbor ULSD | | | 178 | | | | USD | | | | 11,990,756 | | | | 04/2017 | | | | 826,983 | | | | — | |
Natural Gas | | | 737 | | | | USD | | | | 24,704,240 | | | | 12/2016 | | | | 1,697,495 | | | | — | |
Natural Gas | | | 72 | | | | USD | | | | 2,413,440 | | | | 12/2016 | | | | 268,690 | | | | — | |
Nickel | | | 155 | | | | USD | | | | 10,439,948 | | | | 01/2017 | | | | 614,738 | | | | — | |
Primary Aluminum | | | 259 | | | | USD | | | | 11,195,275 | | | | 01/2017 | | | | 148,689 | | | | — | |
RBOB Gasoline | | | 164 | | | | USD | | | | 10,211,460 | | | | 12/2016 | | | | 190,477 | | | | — | |
Silver | | | 132 | | | | USD | | | | 10,878,120 | | | | 03/2017 | | | | — | | | | (1,133,400 | ) |
Soybean | | | 240 | | | | USD | | | | 12,387,000 | | | | 01/2017 | | | | 245,857 | | | | — | |
Soybean | | | 44 | | | | USD | | | | 2,270,950 | | | | 01/2017 | | | | 54,252 | | | | — | |
Soybean Meal | | | 1 | | | | USD | | | | 31,830 | | | | 01/2017 | | | | 566 | | | | — | |
Soybean Meal | | | 13 | | | | USD | | | | 413,790 | | | | 01/2017 | | | | — | | | | (1,352 | ) |
Soybean Meal | | | 218 | | | | USD | | | | 6,938,940 | | | | 01/2017 | | | | — | | | | (93,451 | ) |
The accompanying Notes to Consolidated Financial Statements are an integral part of this statement.
| | | | | | |
| | |
| | | | COLUMBIA COMMODITY STRATEGY FUND | | |
CONSOLIDATED PORTFOLIO OF INVESTMENTS (continued)
November 30, 2016 (Unaudited)
Futures Contracts Outstanding at November 30, 2016 (continued)
Long Futures Contracts Outstanding (continued)
| | | | | | | | | | | | | | | | | | | | | | | | |
| Contract Description | | Number of
Contracts | | | Trading
Currency | | | Notional Market
Value ($) | | | Expiration Date | | | Unrealized
Appreciation ($) | | | Unrealized
(Depreciation) ($) | |
Soybean Oil | | | 295 | | | | USD | | | | 6,593,250 | | | | 03/2017 | | | | 582,817 | | | | — | |
Soybean Oil | | | 51 | | | | USD | | | | 1,139,850 | | | | 03/2017 | | | | 45,385 | | | | — | |
Sugar #11 | | | 406 | | | | USD | | | | 9,008,003 | | | | 02/2017 | | | | — | | | | (767,136 | ) |
Sugar #11 | | | 86 | | | | USD | | | | 1,908,099 | | | | 02/2017 | | | | — | | | | (140,679 | ) |
WTI Crude | | | 408 | | | | USD | | | | 20,171,520 | | | | 12/2016 | | | | — | | | | (274,273 | ) |
Wheat | | | 26 | | | | USD | | | | 523,575 | | | | 03/2017 | | | | — | | | | (27,197 | ) |
Wheat | | | 149 | | | | USD | | | | 3,000,488 | | | | 03/2017 | | | | — | | | | (146,742 | ) |
Zinc | | | 121 | | | | USD | | | | 8,158,425 | | | | 01/2017 | | | | 1,036,194 | | | | — | |
| | | | | | | | | | | | | | | | | | | | | | | | | |
Total | | | | | | | | | | | 270,119,040 | | | | | | | | 11,326,368 | | | | (5,682,474 | ) |
| | | | | | | | | | | | | | | | | | | | | | | | | |
Notes to Consolidated Portfolio of Investments
| (a) | The rate shown is the seven-day current annualized yield at November 30, 2016. |
| (b) | As defined in the Investment Company Act of 1940, an affiliated company is one in which the Fund owns 5% or more of the company’s outstanding voting securities, or a company which is under common ownership or control with the Fund. Holdings and transactions in these affiliated companies during the period ended November 30, 2016 are as follows: |
| | | | | | | | | | | | | | | | | | | | | | | | |
| Issuer | | Beginning
Cost ($) | | | Purchase
Cost ($) | | | Proceeds
From Sales ($) | | | Ending
Cost ($) | | | Dividends —
Affiliated
Issuers ($) | | | Value ($) | |
Columbia Short-Term Cash Fund | | | 83,957,394 | | | | 316,035,468 | | | | (231,079,399 | ) | | | 168,913,463 | | | | 275,944 | | | | 168,930,277 | |
Currency Legend
Fair Value Measurements
The Fund categorizes its fair value measurements according to a three-level hierarchy that maximizes the use of observable inputs and minimizes the use of unobservable inputs by prioritizing that the most observable input be used when available. Observable inputs are those that market participants would use in pricing an investment based on market data obtained from sources independent of the reporting entity. Unobservable inputs are those that reflect the Fund’s assumptions about the information market participants would use in pricing an investment. An investment’s level within the fair value hierarchy is based on the lowest level of any input that is deemed significant to the asset’s or liability’s fair value measurement. The input levels are not necessarily an indication of the risk or liquidity associated with investments at that level. For example, certain U.S. government securities are generally high quality and liquid, however, they are reflected as Level 2 because the inputs used to determine fair value may not always be quoted prices in an active market.
Fair value inputs are summarized in the three broad levels listed below:
| ∎ | | Level 1 — Valuations based on quoted prices for investments in active markets that the Fund has the ability to access at the measurement date (including NAV for open-end mutual funds). Valuation adjustments are not applied to Level 1 investments. |
| ∎ | | Level 2 — Valuations based on other significant observable inputs (including quoted prices for similar securities, interest rates, prepayment speeds, credit risks, etc.). |
| ∎ | | Level 3 — Valuations based on significant unobservable inputs (including the Fund’s own assumptions and judgment in determining the fair value of investments). |
Inputs that are used in determining fair value of an investment may include price information, credit data, volatility statistics, and other factors. These inputs can be either observable or unobservable. The availability of observable inputs can vary between investments, and is affected by various factors such as the type of investment, and the volume and level of activity for that investment or similar investments in the marketplace. The inputs will be considered by the Investment Manager, along with any other relevant factors in the calculation of an investment’s fair value. The Fund uses prices and inputs that are current as of the measurement date, which may include periods of market dislocations. During these periods, the availability of prices and inputs may be reduced for many investments. This condition could cause an investment to be reclassified between the various levels within the hierarchy.
Certain investments that have been measured at fair value using the net asset value (NAV) per share (or its equivalent) are not categorized in the fair value hierarchy. The fair value amounts presented in the table are intended to reconcile the fair value hierarchy to the amounts presented in the Consolidated Portfolio of Investments. The Columbia Short-Term Cash Fund seeks to provide shareholders with maximum current income consistent with liquidity and stability of principal. Columbia Short-Term Cash Fund prices its shares with a floating NAV and no longer seeks to maintain a stable NAV.
Investments falling into the Level 3 category are primarily supported by quoted prices from brokers and dealers participating in the market for those investments. However, these may be classified as Level 3 investments due to lack of market transparency and corroboration to support these quoted prices. Additionally, valuation models may be used as the pricing source for any remaining investments classified as Level 3. These models
The accompanying Notes to Consolidated Financial Statements are an integral part of this statement.
| | | | | | |
| | |
| | | | COLUMBIA COMMODITY STRATEGY FUND | | |
CONSOLIDATED PORTFOLIO OF INVESTMENTS (continued)
November 30, 2016 (Unaudited)
Fair Value Measurements (continued)
may rely on one or more significant unobservable inputs and/or significant assumptions by the Investment Manager. Inputs used in valuations may include, but are not limited to, financial statement analysis, capital account balances, discount rates and estimated cash flows, and comparable company data.
Under the direction of the Fund’s Board of Trustees (the Board), the Investment Manager’s Valuation Committee (the Committee) is responsible for overseeing the valuation procedures approved by the Board. The Committee consists of voting and non-voting members from various groups within the Investment Manager’s organization, including operations and accounting, trading and investments, compliance, risk management and legal.
The Committee meets at least monthly to review and approve valuation matters, which may include a description of specific valuation determinations, data regarding pricing information received from approved pricing vendors and brokers and the results of Board-approved valuation control policies and procedures (the Policies). The Policies address, among other things, instances when market quotations are or are not readily available, including recommendations of third party pricing vendors and a determination of appropriate pricing methodologies; events that require specific valuation determinations and assessment of fair value techniques; securities with a potential for stale pricing, including those that are illiquid, restricted, or in default; and the effectiveness of third party pricing vendors, including periodic reviews of vendors. The Committee meets more frequently, as needed, to discuss additional valuation matters, which may include the need to review back-testing results, review time-sensitive information or approve related valuation actions. The Committee reports to the Board, with members of the Committee meeting with the Board at each of its regularly scheduled meetings to discuss valuation matters and actions during the period, similar to those described earlier.
For investments categorized as Level 3, the Committee monitors information similar to that described above, which may include: (i) data specific to the issuer or comparable issuers, (ii) general market or specific sector news and (iii) quoted prices and specific or similar security transactions. The Committee considers this data and any changes from prior periods in order to assess the reasonableness of observable and unobservable inputs, any assumptions or internal models used to value those securities and changes in fair value. This data is also used to corroborate, when available, information received from approved pricing vendors and brokers. Various factors impact the frequency of monitoring this information (which may occur as often as daily). However, the Committee may determine that changes to inputs, assumptions and models are not required as a result of the monitoring procedures performed.
The following table is a summary of the inputs used to value the Fund’s investments at November 30, 2016:
| | | | | | | | | | | | | | | | |
| | | Level 1
Quoted Prices in Active
Markets for Identical
Assets ($) | | | Level 2
Other Significant
Observable Inputs ($) | | | Level 3
Significant
Unobservable Inputs ($) | | | Total ($) | |
Investments | | | | | | | | | | | | | | | | |
| | | | |
U.S. Government & Agency Obligations | | | — | | | | 49,951,724 | | | | — | | | | 49,951,724 | |
| | | | |
Treasury Bills | | | 74,944,496 | | | | — | | | | — | | | | 74,944,496 | |
| | | | |
Investments measured at net asset value | | | | | | | | | | | | | | | | |
| | | | |
Money Market Funds | | | — | | | | — | | | | — | | | | 168,930,277 | |
| | | | | | | | | | | | | | | | | |
Total Investments | | | 74,944,496 | | | | 49,951,724 | | | | — | | | | 293,826,497 | |
| | | | | | | | | | | | | | | | | |
Derivatives | | | | | | | | | | | | | | | | |
| | | | |
Assets | | | | | | | | | | | | | | | | |
| | | | |
Futures Contracts | | | 11,326,368 | | | | — | | | | — | | | | 11,326,368 | |
| | | | |
Liabilities | | | | | | | | | | | | | | | | |
| | | | |
Futures Contracts | | | (5,682,474 | ) | | | — | | | | — | | | | (5,682,474 | ) |
| | | | | | | | | | | | | | | | | |
Total | | | 80,588,390 | | | | 49,951,724 | | | | — | | | | 299,470,391 | |
| | | | | | | | | | | | | | | | | |
See the Consolidated Portfolio of Investments for all investment classifications not indicated in the table.
The Fund’s assets assigned to the Level 2 input category are generally valued using the market approach, in which a security’s value is determined through reference to prices and information from market transactions for similar or identical assets.
Derivative instruments are valued at unrealized appreciation (depreciation).
There were no transfers of financial assets between levels during the period.
The accompanying Notes to Consolidated Financial Statements are an integral part of this statement.
| | | | | | |
| | |
| | | | COLUMBIA COMMODITY STRATEGY FUND | | |
CONSOLIDATED STATEMENT OF ASSETS AND LIABILITIES
November 30, 2016 (Unaudited)
| | | | |
Assets | | | | |
| |
Investments, at value | | | | |
| |
Unaffiliated issuers (identified cost $124,900,235) | | | $124,896,220 | |
| |
Affiliated issuers (identified cost $168,913,463) | | | 168,930,277 | |
| |
Total investments (identified cost $293,813,698) | | | 293,826,497 | |
| |
Cash | | | 653 | |
| |
Margin deposits | | | 23,169,110 | |
| |
Receivable for: | | | | |
| |
Capital shares sold | | | 35,601 | |
| |
Dividends | | | 57,172 | |
| |
Variation margin | | | 8,006,760 | |
| |
Prepaid expenses | | | 2,085 | |
| |
Other assets | | | 10,258 | |
| |
Total assets | | | 325,108,136 | |
| |
| |
Liabilities | | | | |
| |
Payable for: | | | | |
| |
Capital shares purchased | | | 53,281,291 | |
| |
Variation margin | | | 1,343,020 | |
| |
Management services fees | | | 5,456 | |
| |
Distribution and/or service fees | | | 30 | |
| |
Transfer agent fees | | | 1,897 | |
| |
Compensation of board members | | | 19,048 | |
| |
Chief compliance officer expenses | | | 15 | |
| |
Other expenses | | | 42,552 | |
| |
Total liabilities | | | 54,693,309 | |
| |
Net assets applicable to outstanding capital stock | | | $270,414,827 | |
| |
| |
Represented by | | | | |
| |
Paid-in capital | | | $293,256,163 | |
| |
Excess of distributions over net investment income | | | (2,149,121 | ) |
| |
Accumulated net realized loss | | | (26,348,908 | ) |
| |
Unrealized appreciation (depreciation) on: | | | | |
| |
Investments — unaffiliated issuers | | | (4,015 | ) |
| |
Investments — affiliated issuers | | | 16,814 | |
| |
Futures contracts | | | 5,643,894 | |
| |
Total — representing net assets applicable to outstanding capital stock | | | $270,414,827 | |
| |
The accompanying Notes to Consolidated Financial Statements are an integral part of this statement.
| | | | | | |
| | |
| | | | COLUMBIA COMMODITY STRATEGY FUND | | |
CONSOLIDATED STATEMENT OF ASSETS AND LIABILITIES (continued)
November 30, 2016 (Unaudited)
| | | | |
Class A | | | | |
| |
Net assets | | | $2,677,491 | |
| |
Shares outstanding | | | 491,654 | |
| |
Net asset value per share | | | $5.45 | |
| |
Maximum offering price per share(a) | | | $5.78 | |
| |
Class C | | | | |
| |
Net assets | | | $368,716 | |
| |
Shares outstanding | | | 70,040 | |
| |
Net asset value per share | | | $5.26 | |
| |
Class I | | | | |
| |
Net assets | | | $251,152,868 | |
| |
Shares outstanding | | | 45,219,051 | |
| |
Net asset value per share | | | $5.55 | |
| |
Class R | | | | |
| |
Net assets | | | $125,062 | |
| |
Shares outstanding | | | 23,230 | |
| |
Net asset value per share | | | $5.38 | |
| |
Class R4 | | | | |
| |
Net assets | | | $13,722,657 | |
| |
Shares outstanding | | | 2,478,280 | |
| |
Net asset value per share | | | $5.54 | |
| |
Class R5 | | | | |
| |
Net assets | | | $892,253 | |
| |
Shares outstanding | | | 160,556 | |
| |
Net asset value per share | | | $5.56 | |
| |
Class W | | | | |
| |
Net assets | | | $1,616 | |
| |
Shares outstanding | | | 297 | |
| |
Net asset value per share | | | $5.44 | |
| |
Class Y | | | | |
| |
Net assets | | | $1,808 | |
| |
Shares outstanding | | | 325 | |
| |
Net asset value per share(b) | | | $5.57 | |
| |
Class Z | | | | |
| |
Net assets | | | $1,472,356 | |
| |
Shares outstanding | | | 267,678 | |
| |
Net asset value per share | | | $5.50 | |
| |
| (a) | The maximum offering price per share is calculated by dividing the net asset value per share by 1.0 minus the maximum sales charge of 5.75%. |
| (b) | Net asset value per share rounds to this amount due to fractional shares outstanding. |
The accompanying Notes to Consolidated Financial Statements are an integral part of this statement.
| | | | | | |
| | |
| | | | COLUMBIA COMMODITY STRATEGY FUND | | |
CONSOLIDATED STATEMENT OF OPERATIONS
Six Months Ended November 30, 2016 (Unaudited)
| | | | |
Net investment income | | | | |
| |
Income: | | | | |
| |
Dividends — affiliated issuers | | | $275,944 | |
| |
Interest | | | 109,654 | |
| |
Total income | | | 385,598 | |
| |
| |
Expenses: | | | | |
| |
Management services fees | | | 617,111 | |
| |
Distribution and/or service fees | | | | |
| |
Class A | | | 3,663 | |
| |
Class C | | | 1,785 | |
| |
Class R | | | 293 | |
| |
Class W | | | 2 | |
| |
Transfer agent fees | | | | |
| |
Class A | | | 2,379 | |
| |
Class C | | | 290 | |
| |
Class R | | | 95 | |
| |
Class R4 | | | 9,909 | |
| |
Class R5 | | | 171 | |
| |
Class W | | | 1 | |
| |
Class Z | | | 1,055 | |
| |
Compensation of board members | | | 6,606 | |
| |
Custodian fees | | | 2,487 | |
| |
Printing and postage fees | | | 11,298 | |
| |
Registration fees | | | 50,476 | |
| |
Audit fees | | | 17,870 | |
| |
Legal fees | | | 4,774 | |
| |
Chief compliance officer expenses | | | 15 | |
| |
Other | | | 5,664 | |
| |
Total expenses | | | 735,944 | |
| |
Net investment loss | | | (350,346 | ) |
| |
| |
Realized and unrealized gain (loss) — net | | | | |
| |
Net realized gain (loss) on: | | | | |
| |
Investments | | | 27 | |
| |
Futures contracts | | | (2,991,331 | ) |
| |
Net realized loss | | | (2,991,304 | ) |
| |
Net change in unrealized appreciation (depreciation) on: | | | | |
| |
Investments — unaffiliated issuers | | | (4,015 | ) |
| |
Investments — affiliated issuers | | | 16,814 | |
| |
Futures contracts | | | 4,236,938 | |
| |
Net change in unrealized appreciation | | | 4,249,737 | |
| |
Net realized and unrealized gain | | | 1,258,433 | |
| |
Net increase in net assets resulting from operations | | | $908,087 | |
| |
The accompanying Notes to Consolidated Financial Statements are an integral part of this statement.
| | |
| 10 | | Semiannual Report 2016 |
| | | | | | |
| | |
| | | | COLUMBIA COMMODITY STRATEGY FUND | | |
CONSOLIDATED STATEMENT OF CHANGES IN NET ASSETS
| | | | | | | | |
| | | Six Months Ended
November 30, 2016
(Unaudited) | | | Year Ended
May 31, 2016 | |
Operations | | | | | | | | |
| | |
Net investment loss | | | $(350,346 | ) | | | $(387,551 | ) |
| | |
Net realized loss | | | (2,991,304 | ) | | | (5,632,193 | ) |
| | |
Net change in unrealized appreciation | | | 4,249,737 | | | | 2,643,361 | |
| |
Net increase (decrease) in net assets resulting from operations | | | 908,087 | | | | (3,376,383 | ) |
| |
Increase in net assets from capital stock activity | | | 204,131,208 | | | | 12,633,965 | |
| |
Total increase in net assets | | | 205,039,295 | | | | 9,257,582 | |
| | |
Net assets at beginning of period | | | 65,375,532 | | | | 56,117,950 | |
| |
Net assets at end of period | | | $270,414,827 | | | | $65,375,532 | |
| |
Excess of distributions over net investment income | | | $(2,149,121 | ) | | | $(1,798,775 | ) |
| |
The accompanying Notes to Consolidated Financial Statements are an integral part of this statement.
| | | | |
| Semiannual Report 2016 | | | 11 | |
| | | | | | |
| | |
| | | | COLUMBIA COMMODITY STRATEGY FUND | | |
CONSOLIDATED STATEMENT OF CHANGES IN NET ASSETS (continued)
| | | | | | | | | | | | | | | | |
| | | Six Months Ended
November 30, 2016 (Unaudited) | | | Year Ended
May 31, 2016 | |
| | | Shares | | | Dollars ($) | | | Shares | | | Dollars ($) | |
Capital stock activity | | | | | | | | | | | | | | | | |
| | | | |
Class A shares | | | | | | | | | | | | | | | | |
| | | | |
Subscriptions | | | 117,585 | | | | 639,862 | | | | 235,504 | | | | 1,239,553 | |
| | | | |
Redemptions | | | (117,677 | ) | | | (633,328 | ) | | | (248,645 | ) | | | (1,318,728 | ) |
| |
Net decrease | | | (92 | ) | | | 6,534 | | | | (13,141 | ) | | | (79,175 | ) |
| |
Class C shares | | | | | | | | | | | | | | | | |
| | | | |
Subscriptions | | | 19,539 | | | | 104,950 | | | | 43,987 | | | | 205,557 | |
| | | | |
Redemptions | | | (7,762 | ) | | | (39,861 | ) | | | (30,205 | ) | | | (152,216 | ) |
| |
Net increase | | | 11,777 | | | | 65,089 | | | | 13,782 | | | | 53,341 | |
| |
Class I shares | | | | | | | | | | | | | | | | |
| | | | |
Subscriptions | | | 53,267,637 | | | | 295,342,711 | | | | 11,169,345 | | | | 61,024,756 | |
| | | | |
Redemptions | | | (17,153,183 | ) | | | (94,868,471 | ) | | | (10,083,347 | ) | | | (58,546,559 | ) |
| |
Net increase | | | 36,114,454 | | | | 200,474,240 | | | | 1,085,998 | | | | 2,478,197 | |
| |
Class R shares | | | | | | | | | | | | | | | | |
| | | | |
Subscriptions | | | 4,023 | | | | 21,850 | | | | 4,173 | | | | 21,833 | |
| | | | |
Redemptions | | | (292 | ) | | | (1,538 | ) | | | (3,333 | ) | | | (20,033 | ) |
| |
Net increase | | | 3,731 | | | | 20,312 | | | | 840 | | | | 1,800 | |
| |
Class R4 shares | | | | | | | | | | | | | | | | |
| | | | |
Subscriptions | | | 677,027 | | | | 3,714,761 | | | | 2,010,831 | | | | 9,835,248 | |
| | | | |
Redemptions | | | (175,604 | ) | | | (969,080 | ) | | | (93,460 | ) | | | (479,923 | ) |
| |
Net increase | | | 501,423 | | | | 2,745,681 | | | | 1,917,371 | | | | 9,355,325 | |
| |
Class R5 shares | | | | | | | | | | | | | | | | |
| | | | |
Subscriptions | | | 41,590 | | | | 225,000 | | | | 143,912 | | | | 737,893 | |
| | | | |
Redemptions | | | — | | | | — | | | | (25,252 | ) | | | (125,000 | ) |
| |
Net increase | | | 41,590 | | | | 225,000 | | | | 118,660 | | | | 612,893 | |
| |
Class Z shares | | | | | | | | | | | | | | | | |
| | | | |
Subscriptions | | | 296,525 | | | | 1,599,556 | | | | 204,214 | | | | 1,127,490 | |
| | | | |
Redemptions | | | (183,624 | ) | | | (1,005,204 | ) | | | (158,115 | ) | | | (915,906 | ) |
| |
Net increase | | | 112,901 | | | | 594,352 | | | | 46,099 | | | | 211,584 | |
| |
Total net increase | | | 36,785,784 | | | | 204,131,208 | | | | 3,169,609 | | | | 12,633,965 | |
| |
The accompanying Notes to Consolidated Financial Statements are an integral part of this statement.
| | |
| 12 | | Semiannual Report 2016 |
| | | | | | |
| | |
| | | | COLUMBIA COMMODITY STRATEGY FUND | | |
CONSOLIDATED FINANCIAL HIGHLIGHTS
The following tables are intended to help you understand the Fund’s financial performance. Certain information reflects financial results for a single share of a class held for the periods shown. Per share net investment income (loss) amounts are calculated based on average shares outstanding during the period. Total return assumes reinvestment of all dividends and distributions, if any. Total return does not reflect payment of sales charges, if any. Total return and portfolio turnover are not annualized for periods of less than one year. The portfolio turnover rate is calculated without regard to purchase and sales transactions of short-term instruments and certain derivatives, if any. If such transactions were included, the Fund’s portfolio turnover rate may be higher.
| | | | | | | | | | | | | | | | | | | | |
| |
| Six Months Ended
November 30, 2016 |
| | | Year Ended May 31, | |
Class A | | | (Unaudited) | | | | 2016 | | | | 2015 | | | | 2014 | | | | 2013(a) | |
Per share data | | | | | | | | | | | | | | | | | | | | |
Net asset value, beginning of period | | | $5.39 | | | | $6.32 | | | | $8.57 | | | | $8.52 | | | | $8.50 | |
| | | | | | | | | | | | | | | | | | | | | |
Income from investment operations: | | | | | | | | | | | | | | | | | | | | |
| | | | | |
Net investment loss | | | (0.02 | ) | | | (0.06 | ) | | | (0.08 | ) | | | (0.09 | ) | | | (0.08 | ) |
| | | | | | | | | | | | | | | | | | | | | |
Net realized and unrealized gain (loss) | | | 0.08 | | | | (0.87 | ) | | | (2.17 | ) | | | 0.14 | (b) | | | 0.10 | (b) |
| | | | | | | | | | | | | | | | | | | | | |
Total from investment operations | | | 0.06 | | | | (0.93 | ) | | | (2.25 | ) | | | 0.05 | | | | 0.02 | |
| | | | | | | | | | | | | | | | | | | | | |
Net asset value, end of period | | | $5.45 | | | | $5.39 | | | | $6.32 | | | | $8.57 | | | | $8.52 | |
| | | | | | | | | | | | | | | | | | | | | |
Total return | | | 1.11 | % | | | (14.72 | %) | | | (26.25 | %) | | | 0.59 | % | | | 0.24 | % |
| | | | | | | | | | | | | | | | | | | | | |
Ratios to average net assets(c) | | | | | | | | | | | | | | | | | | | | |
| | | | | |
Total gross expenses | | | 1.16 | %(d) | | | 1.50 | % | | | 1.51 | % | | | 1.34 | % | | | 1.25 | %(d) |
| | | | | | | | | | | | | | | | | | | | | |
Total net expenses(e) | | | 1.16 | %(d) | | | 1.43 | % | | | 1.27 | % | | | 1.16 | % | | | 1.14 | %(d) |
| | | | | | | | | | | | | | | | | | | | | |
Net investment loss | | | (0.77 | %)(d) | | | (1.20 | %) | | | (1.17 | %) | | | (1.07 | %) | | | (1.02 | %)(d) |
| | | | | | | | | | | | | | | | | | | | | |
Supplemental data | | | | | | | | | | | | | | | | | | | | |
| | | | | |
Net assets, end of period (in thousands) | | | $2,677 | | | | $2,651 | | | | $3,193 | | | | $3,376 | | | | $3,780 | |
| | | | | | | | | | | | | | | | | | | | | |
Portfolio turnover | | | 0 | % | | | 0 | % | | | 0 | % | | | 0 | % | | | 0 | % |
| | | | | | | | | | | | | | | | | | | | | |
Notes to Consolidated Financial Highlights
| (a) | Based on operations from June 18, 2012 (commencement of operations) through the stated period end. |
| (b) | Calculation of the net gain (loss) per share (both realized and unrealized) does not correlate to the aggregate realized and unrealized gain (loss) presented in the Consolidated Statement of Operations due to the timing of subscriptions and redemptions of Fund shares in relation to fluctuations in the market value of the portfolio. |
| (c) | In addition to the fees and expenses that the Fund bears directly, the Fund indirectly bears a pro rata share of the fees and expenses of any other funds in which it invests. Such indirect expenses are not included in the Fund’s reported expense ratios. |
| (e) | Total net expenses include the impact of certain fee waivers/expense reimbursements made by the Investment Manager and certain of its affiliates, if applicable. |
The accompanying Notes to Consolidated Financial Statements are an integral part of this statement.
| | | | |
| Semiannual Report 2016 | | | 13 | |
| | | | | | |
| | |
| | | | COLUMBIA COMMODITY STRATEGY FUND | | |
CONSOLIDATED FINANCIAL HIGHLIGHTS (continued)
| | | | | | | | | | | | | | | | | | | | |
| |
| Six Months Ended
November 30, 2016 |
| | | Year Ended May 31, | |
Class C | | | (Unaudited) | | | | 2016 | | | | 2015 | | | | 2014 | | | | 2013(a) | |
Per share data | | | | | | | | | | | | | | | | | | | | |
Net asset value, beginning of period | | | $5.23 | | | | $6.18 | | | | $8.45 | | | | $8.46 | | | | $8.50 | |
| | | | | | | | | | | | | | | | | | | | | |
Income from investment operations: | | | | | | | | | | | | | | | | | | | | |
| | | | | |
Net investment loss | | | (0.04 | ) | | | (0.10 | ) | | | (0.13 | ) | | | (0.15 | ) | | | (0.15 | ) |
| | | | | | | | | | | | | | | | | | | | | |
Net realized and unrealized gain (loss) | | | 0.07 | | | | (0.85 | ) | | | (2.14 | ) | | | 0.14 | (b) | | | 0.11 | (b) |
| | | | | | | | | | | | | | | | | | | | | |
Total from investment operations | | | 0.03 | | | | (0.95 | ) | | | (2.27 | ) | | | (0.01 | ) | | | (0.04 | ) |
| | | | | | | | | | | | | | | | | | | | | |
Net asset value, end of period | | | $5.26 | | | | $5.23 | | | | $6.18 | | | | $8.45 | | | | $8.46 | |
| | | | | | | | | | | | | | | | | | | | | |
Total return | | | 0.57 | % | | | (15.37 | %) | | | (26.86 | %) | | | (0.12 | %) | | | (0.47 | %) |
| | | | | | | | | | | | | | | | | | | | | |
Ratios to average net assets(c) | | | | | | | | | | | | | | | | | | | | |
| | | | | |
Total gross expenses | | | 1.91 | %(d) | | | 2.25 | % | | | 2.26 | % | | | 2.10 | % | | | 2.01 | %(d) |
| | | | | | | | | | | | | | | | | | | | | |
Total net expenses(e) | | | 1.91 | %(d) | | | 2.18 | % | | | 2.02 | % | | | 1.91 | % | | | 1.90 | %(d) |
| | | | | | | | | | | | | | | | | | | | | |
Net investment loss | | | (1.51 | %)(d) | | | (1.92 | %) | | | (1.93 | %) | | | (1.82 | %) | | | (1.77 | %)(d) |
| | | | | | | | | | | | | | | | | | | | | |
Supplemental data | | | | | | | | | | | | | | | | | | | | |
| | | | | |
Net assets, end of period (in thousands) | | | $369 | | | | $305 | | | | $275 | | | | $226 | | | | $145 | |
| | | | | | | | | | | | | | | | | | | | | |
Portfolio turnover | | | 0 | % | | | 0 | % | | | 0 | % | | | 0 | % | | | 0 | % |
| | | | | | | | | | | | | | | | | | | | | |
Notes to Consolidated Financial Highlights
| (a) | Based on operations from June 18, 2012 (commencement of operations) through the stated period end. |
| (b) | Calculation of the net gain (loss) per share (both realized and unrealized) does not correlate to the aggregate realized and unrealized gain (loss) presented in the Consolidated Statement of Operations due to the timing of subscriptions and redemptions of Fund shares in relation to fluctuations in the market value of the portfolio. |
| (c) | In addition to the fees and expenses that the Fund bears directly, the Fund indirectly bears a pro rata share of the fees and expenses of any other funds in which it invests. Such indirect expenses are not included in the Fund’s reported expense ratios. |
| (e) | Total net expenses include the impact of certain fee waivers/expense reimbursements made by the Investment Manager and certain of its affiliates, if applicable. |
The accompanying Notes to Consolidated Financial Statements are an integral part of this statement.
| | |
| 14 | | Semiannual Report 2016 |
| | | | | | |
| | |
| | | | COLUMBIA COMMODITY STRATEGY FUND | | |
CONSOLIDATED FINANCIAL HIGHLIGHTS (continued)
| | | | | | | | | | | | | | | | | | | | | | | | |
| |
| Six Months Ended
November 30, 2016 |
| | | Year Ended May 31, | |
Class I | | | (Unaudited) | | | | 2016 | | | | 2015 | | | | 2014 | | | | 2013 | | | | 2012(a) | |
Per share data | | | | | | | | | | | | | | | | | | | | | | | | |
Net asset value, beginning of period | | | $5.49 | | | | $6.42 | | | | $8.67 | | | | $8.59 | | | | $8.50 | | | | $10.00 | |
| | | | | | | | | | | | | | | | | | | | | | | | | |
Income from investment operations: | | | | | | | | | | | | | | | | | | | | | | | | |
| | | | | | |
Net investment loss | | | (0.01 | ) | | | (0.04 | ) | | | (0.06 | ) | | | (0.06 | ) | | | (0.05 | ) | | | (0.04 | ) |
| | | | | | | | | | | | | | | | | | | | | | | | | |
Net realized and unrealized gain (loss) | | | 0.07 | | | | (0.89 | ) | | | (2.19 | ) | | | 0.14 | (b) | | | 0.14 | (b) | | | (1.46 | ) |
| | | | | | | | | | | | | | | | | | | | | | | | | |
Total from investment operations | | | 0.06 | | | | (0.93 | ) | | | (2.25 | ) | | | 0.08 | | | | 0.09 | | | | (1.50 | ) |
| | | | | | | | | | | | | | | | | | | | | | | | | |
Net asset value, end of period | | | $5.55 | | | | $5.49 | | | | $6.42 | | | | $8.67 | | | | $8.59 | | | | $8.50 | |
| | | | | | | | | | | | | | | | | | | | | | | | | |
Total return | | | 1.09 | % | | | (14.49 | %) | | | (25.95 | %) | | | 0.93 | % | | | 1.06 | % | | | (15.00 | %) |
| | | | | | | | | | | | | | | | | | | | | | | | | |
Ratios to average net assets(c) | | | | | | | | | | | | | | | | | | | | | | | | |
| | | | | | |
Total gross expenses | | | 0.73 | %(d) | | | 1.05 | % | | | 1.11 | % | | | 0.95 | % | | | 0.95 | % | | | 1.62 | %(d) |
| | | | | | | | | | | | | | | | | | | | | | | | | |
Total net expenses(e) | | | 0.73 | %(d) | | | 1.05 | % | | | 0.91 | % | | | 0.77 | % | | | 0.70 | % | | | 0.70 | %(d) |
| | | | | | | | | | | | | | | | | | | | | | | | | |
Net investment loss | | | (0.33 | %)(d) | | | (0.79 | %) | | | (0.81 | %) | | | (0.68 | %) | | | (0.57 | %) | | | (0.56 | %)(d) |
| | | | | | | | | | | | | | | | | | | | | | | | | |
Supplemental data | | | | | | | | | | | | | | | | | | | | | | | | |
| | | | | | |
Net assets, end of period (in thousands) | | | $251,153 | | | | $49,990 | | | | $51,453 | | | | $63,676 | | | | $83,816 | | | | $24,576 | |
| | | | | | | | | | | | | | | | | | | | | | | | | |
Portfolio turnover | | | 0 | % | | | 0 | % | | | 0 | % | | | 0 | % | | | 0 | % | | | 0 | % |
| | | | | | | | | | | | | | | | | | | | | | | | | |
Notes to Consolidated Financial Highlights
| (a) | Based on operations from July 28, 2011 (commencement of operations) through the stated period end. |
| (b) | Calculation of the net gain (loss) per share (both realized and unrealized) does not correlate to the aggregate realized and unrealized gain (loss) presented in the Consolidated Statement of Operations due to the timing of subscriptions and redemptions of Fund shares in relation to fluctuations in the market value of the portfolio. |
| (c) | In addition to the fees and expenses that the Fund bears directly, the Fund indirectly bears a pro rata share of the fees and expenses of any other funds in which it invests. Such indirect expenses are not included in the Fund’s reported expense ratios. |
| (e) | Total net expenses include the impact of certain fee waivers/expense reimbursements made by the Investment Manager and certain of its affiliates, if applicable. |
The accompanying Notes to Consolidated Financial Statements are an integral part of this statement.
| | | | |
| Semiannual Report 2016 | | | 15 | |
| | | | | | |
| | |
| | | | COLUMBIA COMMODITY STRATEGY FUND | | |
CONSOLIDATED FINANCIAL HIGHLIGHTS (continued)
| | | | | | | | | | | | | | | | | | | | |
| |
| Six Months Ended
November 30, 2016
|
| | | Year Ended May 31, | |
Class R | | | (Unaudited) | | | | 2016 | | | | 2015 | | | | 2014 | | | | 2013(a) | |
Per share data | | | | | | | | | | | | | | | | | | | | |
Net asset value, beginning of period | | | $5.34 | | | | $6.28 | | | | $8.53 | | | | $8.50 | | | | $8.50 | |
| | | | | | | | | | | | | | | | | | | | | |
Income from investment operations: | | | | | | | | | | | | | | | | | | | | |
| | | | | |
Net investment loss | | | (0.03 | ) | | | (0.08 | ) | | | (0.10 | ) | | | (0.11 | ) | | | (0.11 | ) |
| | | | | | | | | | | | | | | | | | | | | |
Net realized and unrealized gain (loss) | | | 0.07 | | | | (0.86 | ) | | | (2.15 | ) | | | 0.14 | (b) | | | 0.11 | (b) |
| | | | | | | | | | | | | | | | | | | | | |
Total from investment operations | | | 0.04 | | | | (0.94 | ) | | | (2.25 | ) | | | 0.03 | | | | — | |
| | | | | | | | | | | | | | | | | | | | | |
Net asset value, end of period | | | $5.38 | | | | $5.34 | | | | $6.28 | | | | $8.53 | | | | $8.50 | |
| | | | | | | | | | | | | | | | | | | | | |
Total return | | | 0.75 | % | | | (14.97 | %) | | | (26.38 | %) | | | 0.35 | % | | | (0.00 | %) |
| | | | | | | | | | | | | | | | | | | | | |
Ratios to average net assets(c) | | | | | | | | | | | | | | | | | | | | |
| | | | | |
Total gross expenses | | | 1.41 | %(d) | | | 1.74 | % | | | 1.76 | % | | | 1.60 | % | | | 1.52 | %(d) |
| | | | | | | | | | | | | | | | | | | | | |
Total net expenses(e) | | | 1.41 | %(d) | | | 1.68 | % | | | 1.52 | % | | | 1.42 | % | | | 1.38 | %(d) |
| | | | | | | | | | | | | | | | | | | | | |
Net investment loss | | | (1.02 | %)(d) | | | (1.44 | %) | | | (1.42 | %) | | | (1.33 | %) | | | (1.25 | %)(d) |
| | | | | | | | | | | | | | | | | | | | | |
Supplemental data | | | | | | | | | | | | | | | | | | | | |
| | | | | |
Net assets, end of period (in thousands) | | | $125 | | | | $104 | | | | $117 | | | | $136 | | | | $120 | |
| | | | | | | | | | | | | | | | | | | | | |
Portfolio turnover | | | 0 | % | | | 0 | % | | | 0 | % | | | 0 | % | | | 0 | % |
| | | | | | | | | | | | | | | | | | | | | |
Notes to Consolidated Financial Highlights
| (a) | Based on operations from June 18, 2012 (commencement of operations) through the stated period end. |
| (b) | Calculation of the net gain (loss) per share (both realized and unrealized) does not correlate to the aggregate realized and unrealized gain (loss) presented in the Consolidated Statement of Operations due to the timing of subscriptions and redemptions of Fund shares in relation to fluctuations in the market value of the portfolio. |
| (c) | In addition to the fees and expenses that the Fund bears directly, the Fund indirectly bears a pro rata share of the fees and expenses of any other funds in which it invests. Such indirect expenses are not included in the Fund’s reported expense ratios. |
| (e) | Total net expenses include the impact of certain fee waivers/expense reimbursements made by the Investment Manager and certain of its affiliates, if applicable. |
The accompanying Notes to Consolidated Financial Statements are an integral part of this statement.
| | |
| 16 | | Semiannual Report 2016 |
| | | | | | |
| | |
| | | | COLUMBIA COMMODITY STRATEGY FUND | | |
CONSOLIDATED FINANCIAL HIGHLIGHTS (continued)
| | | | | | | | | | | | | | | | | | | | |
| |
| Six Months Ended
November 30, 2016 |
| | | Year Ended May 31, | |
Class R4 | | | (Unaudited) | | | | 2016 | | | | 2015 | | | | 2014 | | | | 2013(a) | |
Per share data | | | | | | | | | | | | | | | | | | | | |
Net asset value, beginning of period | | | $5.48 | | | | $6.40 | | | | $8.65 | | | | $8.59 | | | | $9.14 | |
| | | | | | | | | | | | | | | | | | | | | |
Income from investment operations: | | | | | | | | | | | | | | | | | | | | |
| | | | | |
Net investment loss | | | (0.01 | ) | | | (0.04 | ) | | | (0.07 | ) | | | (0.07 | ) | | | (0.01 | ) |
| | | | | | | | | | | | | | | | | | | | | |
Net realized and unrealized gain (loss) | | | 0.07 | | | | (0.88 | ) | | | (2.18 | ) | | | 0.13 | (b) | | | (0.54 | ) |
| | | | | | | | | | | | | | | | | | | | | |
Total from investment operations | | | 0.06 | | | | (0.92 | ) | | | (2.25 | ) | | | 0.06 | | | | (0.55 | ) |
| | | | | | | | | | | | | | | | | | | | | |
Net asset value, end of period | | | $5.54 | | | | $5.48 | | | | $6.40 | | | | $8.65 | | | | $8.59 | |
| | | | | | | | | | | | | | | | | | | | | |
Total return | | | 1.09 | % | | | (14.38 | %) | | | (26.01 | %) | | | 0.70 | % | | | (6.02 | %) |
| | | | | | | | | | | | | | | | | | | | | |
Ratios to average net assets(c) | | | | | | | | | | | | | | | | | | | | |
| | | | | |
Total gross expenses | | | 0.91 | %(d) | | | 1.23 | % | | | 1.26 | % | | | 1.10 | % | | | 0.92 | %(d) |
| | | | | | | | | | | | | | | | | | | | | |
Total net expenses(e) | | | 0.91 | %(d) | | | 1.19 | % | | | 1.02 | % | | | 0.95 | % | | | 0.90 | %(d) |
| | | | | | | | | | | | | | | | | | | | | |
Net investment loss | | | (0.52 | %)(d) | | | (0.83 | %) | | | (1.00 | %) | | | (0.86 | %) | | | (0.78 | %)(d) |
| | | | | | | | | | | | | | | | | | | | | |
Supplemental data | | | | | | | | | | | | | | | | | | | | |
| | | | | |
Net assets, end of period (in thousands) | | | $13,723 | | | | $10,826 | | | | $381 | | | | $3 | | | | $2 | |
| | | | | | | | | | | | | | | | | | | | | |
Portfolio turnover | | | 0 | % | | | 0 | % | | | 0 | % | | | 0 | % | | | 0 | % |
| | | | | | | | | | | | | | | | | | | | | |
Notes to Consolidated Financial Highlights
| (a) | Based on operations from March 19, 2013 (commencement of operations) through the stated period end. |
| (b) | Calculation of the net gain (loss) per share (both realized and unrealized) does not correlate to the aggregate realized and unrealized gain (loss) presented in the Consolidated Statement of Operations due to the timing of subscriptions and redemptions of Fund shares in relation to fluctuations in the market value of the portfolio. |
| (c) | In addition to the fees and expenses that the Fund bears directly, the Fund indirectly bears a pro rata share of the fees and expenses of any other funds in which it invests. Such indirect expenses are not included in the Fund’s reported expense ratios. |
| (e) | Total net expenses include the impact of certain fee waivers/expense reimbursements made by the Investment Manager and certain of its affiliates, if applicable. |
The accompanying Notes to Consolidated Financial Statements are an integral part of this statement.
| | | | |
| Semiannual Report 2016 | | | 17 | |
| | | | | | |
| | |
| | | | COLUMBIA COMMODITY STRATEGY FUND | | |
CONSOLIDATED FINANCIAL HIGHLIGHTS (continued)
| | | | | | | | | | | | | | | | |
| |
| Six Months Ended
November 30, 2016 |
| | | Year Ended May 31, | |
Class R5 | | | (Unaudited) | | | | 2016 | | | | 2015 | | | | 2014(a) | |
Per share data | | | | | | | | | | | | | | | | |
Net asset value, beginning of period | | | $5.49 | | | | $6.42 | | | | $8.68 | | | | $8.16 | |
| | | | | | | | | | | | | | | | | |
Income from investment operations: | | | | | | | | | | | | | | | | |
| | | | |
Net investment loss | | | (0.01 | ) | | | (0.04 | ) | | | (0.06 | ) | | | (0.03 | ) |
| | | | | | | | | | | | | | | | | |
Net realized and unrealized gain (loss) | | | 0.08 | | | | (0.89 | ) | | | (2.20 | ) | | | 0.55 | (b) |
| | | | | | | | | | | | | | | | | |
Total from investment operations | | | 0.07 | | | | (0.93 | ) | | | (2.26 | ) | | | 0.52 | |
| | | | | | | | | | | | | | | | | |
Net asset value, end of period | | | $5.56 | | | | $5.49 | | | | $6.42 | | | | $8.68 | |
| | | | | | | | | | | | | | | | | |
Total return | | | 1.28 | % | | | (14.49 | %) | | | (26.04 | %) | | | 6.37 | % |
| | | | | | | | | | | | | | | | | |
Ratios to average net assets(c) | | | | | | | | | | | | | | | | |
| | | | |
Total gross expenses | | | 0.80 | %(d) | | | 1.10 | % | | | 1.18 | % | | | 1.16 | %(d) |
| | | | | | | | | | | | | | | | | |
Total net expenses(e) | | | 0.80 | %(d) | | | 1.10 | % | | | 0.96 | % | | | 0.87 | %(d) |
| | | | | | | | | | | | | | | | | |
Net investment loss | | | (0.41 | %)(d) | | | (0.74 | %) | | | (0.78 | %) | | | (0.77 | %)(d) |
| | | | | | | | | | | | | | | | | |
Supplemental data | | | | | | | | | | | | | | | | |
| | | | |
Net assets, end of period (in thousands) | | | $892 | | | | $654 | | | | $2 | | | | $608 | |
| | | | | | | | | | | | | | | | | |
Portfolio turnover | | | 0 | % | | | 0 | % | | | 0 | % | | | 0 | % |
| | | | | | | | | | | | | | | | | |
Notes to Consolidated Financial Highlights
| (a) | Based on operations from January 8, 2014 (commencement of operations) through the stated period end. |
| (b) | Calculation of the net gain (loss) per share (both realized and unrealized) does not correlate to the aggregate realized and unrealized gain (loss) presented in the Consolidated Statement of Operations due to the timing of subscriptions and redemptions of Fund shares in relation to fluctuations in the market value of the portfolio. |
| (c) | In addition to the fees and expenses that the Fund bears directly, the Fund indirectly bears a pro rata share of the fees and expenses of any other funds in which it invests. Such indirect expenses are not included in the Fund’s reported expense ratios. |
| (e) | Total net expenses include the impact of certain fee waivers/expense reimbursements made by the Investment Manager and certain of its affiliates, if applicable. |
The accompanying Notes to Consolidated Financial Statements are an integral part of this statement.
| | |
| 18 | | Semiannual Report 2016 |
| | | | | | |
| | |
| | | | COLUMBIA COMMODITY STRATEGY FUND | | |
CONSOLIDATED FINANCIAL HIGHLIGHTS (continued)
| | | | | | | | | | | | | | | | | | | | | | | | |
| |
| Six Months Ended
November 30, 2016 |
| | | Year Ended May 31, | |
Class W | | | (Unaudited) | | | | 2016 | | | | 2015 | | | | 2014 | | | | 2013 | | | | 2012(a) | |
Per share data | | | | | | | | | | | | | | | | | | | | | | | | |
Net asset value, beginning of period | | | $5.38 | | | | $6.32 | | | | $8.57 | | | | $8.53 | | | | $8.47 | | | | $10.00 | |
| | | | | | | | | | | | | | | | | | | | | | | | | |
Income from investment operations: | | | | | | | | | | | | | | | | | | | | | | | | |
| | | | | | |
Net investment loss | | | (0.01 | ) | | | (0.06 | ) | | | (0.08 | ) | | | (0.09 | ) | | | (0.09 | ) | | | (0.08 | ) |
| | | | | | | | | | | | | | | | | | | | | | | | | |
Net realized and unrealized gain (loss) | | | 0.07 | | | | (0.88 | ) | | | (2.17 | ) | | | 0.13 | (b) | | | 0.15 | (b) | | | (1.45 | ) |
| | | | | | | | | | | | | | | | | | | | | | | | | |
Total from investment operations | | | 0.06 | | | | (0.94 | ) | | | (2.25 | ) | | | 0.04 | | | | 0.06 | | | | (1.53 | ) |
| | | | | | | | | | | | | | | | | | | | | | | | | |
Net asset value, end of period | | | $5.44 | | | | $5.38 | | | | $6.32 | | | | $8.57 | | | | $8.53 | | | | $8.47 | |
| | | | | | | | | | | | | | | | | | | | | | | | | |
Total return | | | 1.12 | % | | | (14.87 | %) | | | (26.25 | %) | | | 0.47 | % | | | 0.71 | % | | | (15.30 | %) |
| | | | | | | | | | | | | | | | | | | | | | | | | |
Ratios to average net assets(c) | | | | | | | | | | | | | | | | | | | | | | | | |
| | | | | | |
Total gross expenses | | | 1.14 | %(d) | | | 1.49 | % | | | 1.51 | % | | | 1.32 | % | | | 1.51 | % | | | 2.76 | %(d) |
| | | | | | | | | | | | | | | | | | | | | | | | | |
Total net expenses(e) | | | 1.14 | %(d) | | | 1.43 | % | | | 1.27 | % | | | 1.16 | % | | | 1.15 | % | | | 1.15 | %(d) |
| | | | | | | | | | | | | | | | | | | | | | | | | |
Net investment loss | | | (0.41 | %)(d) | | | (1.16 | %) | | | (1.14 | %) | | | (1.10 | %) | | | (0.98 | %) | | | (0.99 | %)(d) |
| | | | | | | | | | | | | | | | | | | | | | | | | |
Supplemental data | | | | | | | | | | | | | | | | | | | | | | | | |
| | | | | | |
Net assets, end of period (in thousands) | | | $2 | | | | $2 | | | | $2 | | | | $3 | | | | $2 | | | | $2 | |
| | | | | | | | | | | | | | | | | | | | | | | | | |
Portfolio turnover | | | 0 | % | | | 0 | % | | | 0 | % | | | 0 | % | | | 0 | % | | | 0 | % |
| | | | | | | | | | | | | | | | | | | | | | | | | |
Notes to Consolidated Financial Highlights
| (a) | Based on operations from July 28, 2011 (commencement of operations) through the stated period end. |
| (b) | Calculation of the net gain (loss) per share (both realized and unrealized) does not correlate to the aggregate realized and unrealized gain (loss) presented in the Consolidated Statement of Operations due to the timing of subscriptions and redemptions of Fund shares in relation to fluctuations in the market value of the portfolio. |
| (c) | In addition to the fees and expenses that the Fund bears directly, the Fund indirectly bears a pro rata share of the fees and expenses of any other funds in which it invests. Such indirect expenses are not included in the Fund’s reported expense ratios. |
| (e) | Total net expenses include the impact of certain fee waivers/expense reimbursements made by the Investment Manager and certain of its affiliates, if applicable. |
The accompanying Notes to Consolidated Financial Statements are an integral part of this statement.
| | | | |
| Semiannual Report 2016 | | | 19 | |
| | | | | | |
| | |
| | | | COLUMBIA COMMODITY STRATEGY FUND | | |
CONSOLIDATED FINANCIAL HIGHLIGHTS (continued)
| | | | | | | | | | | | |
| |
| Six Months Ended
November 30, 2016 |
| | | Year Ended May 31, | |
Class Y | | | (Unaudited) | | | | 2016 | | | | 2015(a) | |
Per share data | | | | | | | | | | | | |
Net asset value, beginning of period | | | $5.50 | | | | $6.43 | | | | $7.70 | |
| | | | | | | | | | | | | |
Income from investment operations: | | | | | | | | | | | | |
| | | |
Net investment loss | | | (0.01 | ) | | | (0.04 | ) | | | (0.04 | ) |
| | | | | | | | | | | | | |
Net realized and unrealized gain (loss) | | | 0.08 | | | | (0.89 | ) | | | (1.23 | ) |
| | | | | | | | | | | | | |
Total from investment operations | | | 0.07 | | | | (0.93 | ) | | | (1.27 | ) |
| | | | | | | | | | | | | |
Net asset value, end of period | | | $5.57 | | | | $5.50 | | | | $6.43 | |
| | | | | | | | | | | | | |
Total return | | | 1.27 | % | | | (14.46 | %) | | | (16.49 | %) |
| | | | | | | | | | | | | |
Ratios to average net assets(b) | | | | | | | | | | | | |
| | | |
Total gross expenses | | | 0.73 | %(c) | | | 1.01 | % | | | 1.33 | %(c) |
| | | | | | | | | | | | | |
Total net expenses(d) | | | 0.73 | %(c) | | | 1.01 | % | | | 0.97 | %(c) |
| | | | | | | | | | | | | |
Net investment loss | | | (0.30 | %)(c) | | | (0.73 | %) | | | (0.80 | %)(c) |
| | | | | | | | | | | | | |
Supplemental data | | | | | | | | | | | | |
| | | |
Net assets, end of period (in thousands) | | | $2 | | | | $2 | | | | $2 | |
| | | | | | | | | | | | | |
Portfolio turnover | | | 0 | % | | | 0 | % | | | 0 | % |
| | | | | | | | | | | | | |
Notes to Consolidated Financial Highlights
| (a) | Based on operations from October 1, 2014 (commencement of operations) through the stated period end. |
| (b) | In addition to the fees and expenses that the Fund bears directly, the Fund indirectly bears a pro rata share of the fees and expenses of any other funds in which it invests. Such indirect expenses are not included in the Fund’s reported expense ratios. |
| (d) | Total net expenses include the impact of certain fee waivers/expense reimbursements made by the Investment Manager and certain of its affiliates, if applicable. |
The accompanying Notes to Consolidated Financial Statements are an integral part of this statement.
| | |
| 20 | | Semiannual Report 2016 |
| | | | | | |
| | |
| | | | COLUMBIA COMMODITY STRATEGY FUND | | |
CONSOLIDATED FINANCIAL HIGHLIGHTS (continued)
| | | | | | | | | | | | | | | | | | | | |
| |
| Six Months Ended
November 30, 2016 |
| | | Year Ended May 31, | |
Class Z | | | (Unaudited) | | | | 2016 | | | | 2015 | | | | 2014 | | | | 2013(a) | |
Per share data | | | | | | | | | | | | | | | | | | | | |
Net asset value, beginning of period | | | $5.44 | | | | $6.37 | | | | $8.62 | | | | $8.54 | | | | $8.50 | |
| | | | | | | | | | | | | | | | | | | | | |
Income from investment operations: | | | | | | | | | | | | | | | | | | | | |
| | | | | |
Net investment loss | | | (0.01 | ) | | | (0.05 | ) | | | (0.07 | ) | | | (0.07 | ) | | | (0.06 | ) |
| | | | | | | | | | | | | | | | | | | | | |
Net realized and unrealized gain (loss) | | | 0.07 | | | | (0.88 | ) | | | (2.18 | ) | | | 0.15 | (b) | | | 0.10 | (b) |
| | | | | | | | | | | | | | | | | | | | | |
Total from investment operations | | | 0.06 | | | | (0.93 | ) | | | (2.25 | ) | | | 0.08 | | | | 0.04 | |
| | | | | | | | | | | | | | | | | | | | | |
Net asset value, end of period | | | $5.50 | | | | $5.44 | | | | $6.37 | | | | $8.62 | | | | $8.54 | |
| | | | | | | | | | | | | | | | | | | | | |
Total return | | | 1.10 | % | | | (14.60 | %) | | | (26.10 | %) | | | 0.94 | % | | | 0.47 | % |
| | | | | | | | | | | | | | | | | | | | | |
Ratios to average net assets(c) | | | | | | | | | | | | | | | | | | | | |
| | | | | |
Total gross expenses | | | 0.89 | %(d) | | | 1.24 | % | | | 1.26 | % | | | 1.12 | % | | | 1.05 | %(d) |
| | | | | | | | | | | | | | | | | | | | | |
Total net expenses(e) | | | 0.89 | %(d) | | | 1.18 | % | | | 1.02 | % | | | 0.92 | % | | | 0.90 | %(d) |
| | | | | | | | | | | | | | | | | | | | | |
Net investment loss | | | (0.50 | %)(d) | | | (0.92 | %) | | | (0.92 | %) | | | (0.83 | %) | | | (0.77 | %)(d) |
| | | | | | | | | | | | | | | | | | | | | |
Supplemental data | | | | | | | | | | | | | | | | | | | | |
| | | | | |
Net assets, end of period (in thousands) | | | $1,472 | | | | $842 | | | | $693 | | | | $742 | | | | $25 | |
| | | | | | | | | | | | | | | | | | | | | |
Portfolio turnover | | | 0 | % | | | 0 | % | | | 0 | % | | | 0 | % | | | 0 | % |
| | | | | | | | | | | | | | | | | | | | | |
Notes to Consolidated Financial Highlights
| (a) | Based on operations from June 18, 2012 (commencement of operations) through the stated period end. |
| (b) | Calculation of the net gain (loss) per share (both realized and unrealized) does not correlate to the aggregate realized and unrealized gain (loss) presented in the Consolidated Statement of Operations due to the timing of subscriptions and redemptions of Fund shares in relation to fluctuations in the market value of the portfolio. |
| (c) | In addition to the fees and expenses that the Fund bears directly, the Fund indirectly bears a pro rata share of the fees and expenses of any other funds in which it invests. Such indirect expenses are not included in the Fund’s reported expense ratios. |
| (e) | Total net expenses include the impact of certain fee waivers/expense reimbursements made by the Investment Manager and certain of its affiliates, if applicable. |
The accompanying Notes to Consolidated Financial Statements are an integral part of this statement.
| | | | |
| Semiannual Report 2016 | | | 21 | |
| | | | | | |
| | |
| | | | COLUMBIA COMMODITY STRATEGY FUND | | |
NOTES TO CONSOLIDATED FINANCIAL STATEMENTS
November 30, 2016 (Unaudited)
Note 1. Organization
Columbia Commodity Strategy Fund (the Fund), a series of Columbia Funds Series Trust II (the Trust), is a diversified fund. The Trust is registered under the Investment Company Act of 1940, as amended (the 1940 Act), as an open-end management investment company organized as a Massachusetts business trust.
Basis for Consolidation
CCSF Offshore Fund, Ltd. (the Subsidiary) is a Cayman Islands exempted company and wholly-owned subsidiary of the Fund. The Subsidiary acts as an investment vehicle in order to effect certain investment strategies consistent with the Fund’s investment objective and policies as stated in its current prospectus and statement of additional information. In accordance with the Memorandum and Articles of Association of the Subsidiary (the Articles), the Fund owns the sole issued share of the Subsidiary and retains all rights associated with such share, including the right to receive notice of, attend and vote at general meetings of the Subsidiary, rights in a winding-up or repayment of capital and the right to participate in the profits or assets of the Subsidiary. The consolidated financial statements (financial statements) include the accounts of the consolidated Fund and the respective Subsidiary. Subsequent references to the Fund within the Notes to Consolidated Financial Statements collectively refer to the Fund and the Subsidiary. All intercompany transactions and balances have been eliminated in the consolidation process.
At November 30, 2016, the Subsidiary financial statement information is as follows:
| | | | |
% of consolidated fund net assets | | | 15.00 | % |
Net assets | | | $40,568,357 | |
Net investment income (loss) | | | (62,121 | ) |
Net realized gain (loss) | | | (2,991,331 | ) |
Net change in unrealized appreciation (depreciation) | | | 4,239,362 | |
The consolidated financial statements present the portfolio holdings, financial position and results of operations of the Fund and the Subsidiary on a consolidated basis.
Fund Shares
The Trust may issue an unlimited number of shares (without par value). The Fund offers Class A, Class C, Class I, Class R, Class R4, Class R5, Class W, Class Y and Class Z shares. Although all share classes generally
have identical voting, dividend and liquidation rights, each share class votes separately when required by the Trust’s organizational documents or by law. Different share classes pay different distribution amounts to the extent the expenses of such share classes differ, and distributions in liquidation will be proportional to the net asset value of each share class. Each share class has its own expense and sales charge structure.
Class A shares are subject to a maximum front-end sales charge of 5.75% based on the initial investment amount. Class A shares purchased without an initial sales charge in accounts aggregating $1 million to $50 million at the time of purchase are subject to a contingent deferred sales charge (CDSC) if the shares are sold within 18 months after purchase, charged as follows: 1.00% CDSC if redeemed within 12 months after purchase, and 0.50% CDSC if redeemed more than 12, but less than 18, months after purchase.
Class C shares are subject to a 1.00% CDSC on shares redeemed within 12 months after purchase.
Class I shares are not subject to sales charges and are available only to the Columbia Family of Funds.
Class R shares are not subject to sales charges and are generally available only to certain retirement plans and other investors as described in the Fund’s prospectus.
Class R4 shares are not subject to sales charges and are generally available only to omnibus retirement plans and certain investors as described in the Fund’s prospectus.
Class R5 shares are not subject to sales charges and are generally available only to investors purchasing through authorized investment professionals and omnibus retirement plans.
Class W shares are not subject to sales charges and are generally available only to investors purchasing through authorized investment programs managed by investment professionals, including discretionary managed account programs.
Class Y shares are not subject to sales charges and are generally available only to certain retirement plans as described in the Fund’s prospectus.
Class Z shares are not subject to sales charges and are generally available only to eligible investors, which are subject to different investment minimums as described in the Fund’s prospectus.
| | |
| 22 | | Semiannual Report 2016 |
| | | | | | |
| | |
| | | | COLUMBIA COMMODITY STRATEGY FUND | | |
NOTES TO CONSOLIDATED FINANCIAL STATEMENTS (continued)
November 30, 2016 (Unaudited)
Note 2. Summary of Significant Accounting Policies
Basis of Preparation
The Fund is an investment company that applies the accounting and reporting guidance in the Financial Accounting Standards Board (FASB) Accounting Standards Codification Topic 946, Financial Services — Investment Companies (ASC 946). The financial statements are prepared in accordance with U.S. generally accepted accounting principles (GAAP), which requires management to make certain estimates and assumptions that affect the reported amounts of assets and liabilities, the disclosure of contingent assets and liabilities at the date of the financial statements and the reported amounts of income and expenses during the reporting period. Actual results could differ from those estimates.
The following is a summary of significant accounting policies followed by the Fund in the preparation of its financial statements.
Security Valuation
Debt securities generally are valued by pricing services approved by the Board of Trustees (the Board) based upon market transactions for normal, institutional-size trading units of similar securities. The services may use various pricing techniques that take into account, as applicable, factors such as yield, quality, coupon rate, maturity, type of issue, trading characteristics and other data, as well as approved independent broker-dealer quotes. Debt securities for which quotations are not readily available or not believed to be reflective of market value may also be valued based upon a bid quote from an approved independent broker-dealer. Debt securities maturing in 60 days or less are valued primarily at amortized cost value, unless this method results in a valuation that management believes does not approximate market value.
Investments in open-end investment companies, including money market funds, are valued at their latest net asset value.
Futures and options on futures contracts are valued based upon the settlement price at the close of regular trading on their principal exchanges or, in the absence of transactions, at the mean of the latest quoted bid and ask prices.
Investments for which market quotations are not readily available, or that have quotations which management
believes are not reflective of market value or reliable, are valued at fair value as determined in good faith under procedures approved by and under the general supervision of the Board. If a security or class of securities (such as foreign securities) is valued at fair value, such value is likely to be different from the quoted or published price for the security.
The determination of fair value often requires significant judgment. To determine fair value, management may use assumptions including but not limited to future cash flows and estimated risk premiums. Multiple inputs from various sources may be used to determine fair value.
GAAP requires disclosure regarding the inputs and valuation techniques used to measure fair value and any changes in valuation inputs or techniques. In addition, investments shall be disclosed by major category. This information is disclosed following the Fund’s Consolidated Portfolio of Investments.
Derivative Instruments
The Fund invests in certain derivative instruments, as detailed below, to meet its investment objectives. Derivatives are instruments whose values depend on, or are derived from, in whole or in part, the value of one or more securities, currencies, commodities, indices, or other assets or instruments. Derivatives may be used to increase investment flexibility (including to maintain cash reserves while maintaining desired exposure to certain assets), for risk management (hedging) purposes, to facilitate trading, to reduce transaction costs and to pursue higher investment returns. The Fund may also use derivative instruments to mitigate certain investment risks, such as foreign currency exchange rate risk, interest rate risk and credit risk. Derivatives may involve various risks, including the potential inability of the counterparty to fulfill its obligations under the terms of the contract, the potential for an illiquid secondary market (making it difficult for the Fund to sell or terminate, including at favorable prices) and the potential for market movements which may expose the Fund to gains or losses in excess of the amount shown in the Consolidated Statement of Assets and Liabilities. The notional amounts of derivative instruments, if applicable, are not recorded in the financial statements.
A derivative instrument may suffer a marked-to-market loss if the value of the contract decreases due to an unfavorable change in the market rates or values of the underlying instrument. Losses can also occur if the counterparty does not perform its obligations under the contract. The Fund’s risk of loss from counterparty credit
| | | | |
| Semiannual Report 2016 | | | 23 | |
| | | | | | |
| | |
| | | | COLUMBIA COMMODITY STRATEGY FUND | | |
NOTES TO CONSOLIDATED FINANCIAL STATEMENTS (continued)
November 30, 2016 (Unaudited)
risk on over-the-counter derivatives is generally limited to the aggregate unrealized gain netted against any collateral held by the Fund and the amount of any variation margin held by the counterparty, plus any replacement costs or related amounts. With exchange-traded or centrally cleared derivatives, there is reduced counterparty credit risk to the Fund since the clearinghouse or central counterparty (CCP) provides some protection in the case of clearing member default. The clearinghouse or CCP stands between the buyer and the seller of the contract; therefore, additional counterparty credit risk is failure of the clearinghouse or CCP. However, credit risk still exists in exchange-traded or centrally cleared derivatives with respect to initial and variation margin that is held in a broker’s customer account. While brokers are required to segregate customer margin from their own assets, in the event that a broker becomes insolvent or goes into bankruptcy and at that time there is a shortfall in the aggregate amount of margin held by the broker for all its clients, U.S. bankruptcy laws will typically allocate that shortfall on a pro-rata basis across all the broker’s customers (including the Fund), potentially resulting in losses to the Fund.
In order to better define its contractual rights and to secure rights that will help the Fund mitigate its counterparty risk, the Fund may enter into an International Swaps and Derivatives Association, Inc. Master Agreement (ISDA Master Agreement) or similar agreement with its derivatives contract counterparties. An ISDA Master Agreement is an agreement between the Fund and a counterparty that governs over-the-counter derivatives and typically contains, among other things, collateral posting terms and netting provisions in the event of a default and/or termination event. Under an ISDA Master Agreement, the Fund may, under certain circumstances, offset with the counterparty certain derivative instrument’s payables and/or receivables with collateral held and/or posted and create one single net payment. The provisions of the ISDA Master Agreement typically permit a single net payment in the event of default (close-out netting), including the bankruptcy or insolvency of the counterparty. Note, however, that bankruptcy or insolvency laws of a particular jurisdiction may impose restrictions on or prohibitions against the right of offset or netting in bankruptcy, insolvency or other events.
Collateral (margin) requirements differ by type of derivative. Margin requirements are established by the clearinghouse or CCP for exchange-traded and centrally cleared derivatives. Brokers can ask for margin in excess of the minimum in certain circumstances. Collateral terms are contract specific for over-the-counter
derivatives. For over-the-counter derivatives traded under an ISDA Master Agreement, the collateral requirements are typically calculated by netting the marked-to-market amount for each transaction under such agreement and comparing that amount to the value of any variation margin currently pledged by the Fund and/or the counterparty. Generally, the amount of collateral due from or to a party has to exceed a minimum transfer amount threshold (e.g., $250,000) before a transfer has to be made. To the extent amounts due to the Fund from its counterparties are not fully collateralized, contractually or otherwise, the Fund bears the risk of loss from counterparty nonperformance. The Fund attempts to mitigate counterparty risk by only entering into agreements with counterparties that it believes have the financial resources to honor their obligations and by monitoring the financial stability of those counterparties.
Certain ISDA Master Agreements allow counterparties of over-the-counter derivatives transactions to terminate derivatives contracts prior to maturity in the event the Fund’s net asset value declines by a stated percentage over a specified time period or if the Fund fails to meet certain terms of the ISDA Master Agreement, which would cause the Fund to accelerate payment of any net liability owed to the counterparty. The Fund also has termination rights if the counterparty fails to meet certain terms of the ISDA Master Agreement. In addition to considering counterparty credit risk, the Fund would consider terminating the derivatives contracts based on whether termination would result in a net liability owed from the counterparty.
For financial reporting purposes, the Fund does not offset derivative assets and derivative liabilities that are subject to netting arrangements in the Consolidated Statement of Assets and Liabilities.
Futures Contracts
Futures contracts are exchange-traded and represent commitments for the future purchase or sale of an asset at a specified price on a specified date. The Fund bought and sold futures contracts to maintain appropriate commodity market exposure. These instruments may be used for other purposes in future periods. Upon entering into futures contracts, the Fund bears risks that it may not achieve the anticipated benefits of the futures contracts and may realize a loss. Additional risks include counterparty credit risk, the possibility of an illiquid market, and that a change in the value of the contract or option may not correlate with changes in the value of the underlying asset.
| | |
| 24 | | Semiannual Report 2016 |
| | | | | | |
| | |
| | | | COLUMBIA COMMODITY STRATEGY FUND | | |
NOTES TO CONSOLIDATED FINANCIAL STATEMENTS (continued)
November 30, 2016 (Unaudited)
Upon entering into a futures contract, the Fund deposits cash or securities with the broker, known as a futures commissions merchant (FCM), in an amount sufficient to meet the initial margin requirement. The initial margin deposit must be maintained at an established level over the life of the contract. Cash deposited as initial margin is recorded in the Consolidated Statement of Assets and Liabilities as margin deposits. Securities deposited as initial margin are designated in the Consolidated Portfolio of Investments. Subsequent payments (variation margin) are made or received by the Fund each day. The variation margin payments are equal to the daily change in the contract value and are recorded as variation margin receivable or payable and are offset in unrealized gains or losses. The Fund recognizes a realized gain or loss when the contract is closed or expires. Futures contracts involve, to varying degrees, risk of loss in excess of the variation margin disclosed in the Consolidated Statement of Assets and Liabilities.
Effects of Derivative Transactions in the Financial Statements
The following tables are intended to provide additional information about the effect of derivatives on the financial statements of the Fund, including: the fair value of derivatives by risk category and the location of those fair values in the Consolidated Statement of Assets and Liabilities; and the impact of derivative transactions over the period in the Consolidated Statement of Operations, including realized and unrealized gains (losses). The derivative instrument schedules following the Consolidated Portfolio of Investments present additional information regarding derivative instruments outstanding at the end of the period, if any.
The following table is a summary of the fair value of derivative instruments (not considered to be hedging instruments for accounting disclosure purposes) at November 30, 2016:
| | | | | | |
| | | | | | | |
| | Asset Derivatives | |
Risk Exposure
Category | | Statement of Assets and Liabilities Location | | | Fair Value ($) | |
Commodity-related investment risk | | Net assets — unrealized appreciation on futures contracts | | | 11,326,368 | * |
| |
| | Liability Derivatives | |
Risk Exposure
Category | | Statement of Assets and Liabilities Location | | | Fair Value ($) | |
Commodity-related investment risk | | Net assets — unrealized depreciation on futures contracts | | | 5,682,474 | * |
| * | Includes cumulative appreciation (depreciation) as reported in the tables following the Consolidated Portfolio of Investments. Only the current day’s variation margin is reported in receivables or payables in the Consolidated Statement of Assets and Liabilities. |
The following table indicates the effect of derivative instruments (not considered to be hedging instruments for accounting disclosure purposes) in the Consolidated Statement of Operations for the six months ended November 30, 2016:
| | | | |
Amount of Realized Gain (Loss) on Derivatives Recognized in
Income | |
| Risk Exposure Category | | Futures Contracts ($) | |
Commodity-related investment risk | | | (2,991,331 | ) |
Change in Unrealized Appreciation (Depreciation) on Derivatives
Recognized in Income | |
| Risk Exposure Category | | Futures Contracts ($) | |
Commodity-related investment risk | | | 4,236,938 | |
The following table provides a summary of the average outstanding volume by derivative instrument for the six months ended November 30, 2016:
| | | | |
| | | | | |
| Derivative Instrument | | Average Notional Amounts ($)* | |
Futures contracts — Long | | | 247,420,242 | |
| * | Based on the ending quarterly outstanding amounts for the six months ended November 30, 2016. |
Security Transactions
Security transactions are accounted for on the trade date. Cost is determined and gains (losses) are based upon the specific identification method for both financial statement and federal income tax purposes.
Income Recognition
Interest income is recorded on an accrual basis. Market premiums and discounts, including original issue discounts, are amortized and accreted, respectively, over the expected life of the security on all debt securities, unless otherwise noted.
The Fund may place a debt security on non-accrual status and reduce related interest income when it becomes probable that the interest will not be collected and the amount of uncollectible interest can be reasonably estimated. A defaulted debt security is removed from non-accrual status when the issuer resumes interest payments or when collectibility of interest is reasonably assured.
Dividend income is recorded on the ex-dividend date.
Expenses
General expenses of the Trust are allocated to the Fund and other funds of the Trust based upon relative net assets or other expense allocation methodologies determined by the nature of the expense. Expenses directly attributable to the Fund are charged to the Fund.
| | | | |
| Semiannual Report 2016 | | | 25 | |
| | | | | | |
| | |
| | | | COLUMBIA COMMODITY STRATEGY FUND | | |
NOTES TO CONSOLIDATED FINANCIAL STATEMENTS (continued)
November 30, 2016 (Unaudited)
Expenses directly attributable to a specific class of shares are charged to that share class.
Determination of Class Net Asset Value
All income, expenses (other than class-specific expenses, which are charged to that share class, as shown in the Consolidated Statement of Operations) and realized and unrealized gains (losses) are allocated to each class of the Fund on a daily basis, based on the relative net assets of each class, for purposes of determining the net asset value of each class.
Federal Income Tax Status
The Fund intends to qualify each year as a regulated investment company under Subchapter M of the Internal Revenue Code, as amended, and will distribute substantially all of its taxable income (including net short-term capital gains), if any, for its tax year, and as such will not be subject to federal income taxes. In addition, the Fund intends to distribute in each calendar year substantially all of its net investment income, capital gains and certain other amounts, if any, such that the Fund should not be subject to federal excise tax. Therefore, no federal income or excise tax provision is recorded.
Distributions to Shareholders
Distributions from net investment income, if any, are declared and paid annually. Net realized capital gains, if any, are distributed along with the income distribution. Income distributions and capital gain distributions are determined in accordance with federal income tax regulations, which may differ from GAAP.
Guarantees and Indemnifications
Under the Trust’s organizational documents and, in some cases, by contract, its officers and trustees are indemnified against certain liabilities arising out of the performance of their duties to the Trust or its funds. In addition, certain of the Fund’s contracts with its service providers contain general indemnification clauses. The Fund’s maximum exposure under these arrangements is unknown since the amount of any future claims that may be made against the Fund cannot be determined, and the Fund has no historical basis for predicting the likelihood of any such claims.
Investment Company Reporting Modernization
In October 2016, the U.S. Securities and Exchange Commission adopted new rules and forms, and amendments to certain current rules and forms, to
modernize reporting and disclosure of information by registered investment companies. The amendments to Regulation S-X will require standardized, enhanced disclosure about derivatives in investment company financial statements, and will also change the rules governing the form and content of such financial statements. The amendments to Regulation S-X take effect on August 1, 2017. At this time, management is assessing the anticipated impact of these regulatory developments.
Note 3. Fees and Other Transactions with Affiliates
Management Services Fees
The Fund entered into a Management Agreement with Columbia Management Investment Advisers, LLC (the Investment Manager), a wholly-owned subsidiary of Ameriprise Financial, Inc. (Ameriprise Financial). Under the Management Agreement, the Investment Manager provides the Fund with investment research and advice, as well as administrative and accounting services. The Investment Manager is responsible for the ultimate oversight of investments made by the Fund. The Fund’s subadviser (see Subadvisory Agreement below) has the primary responsibility for the day-to-day portfolio management of the Fund. The management services fee is an annual fee that is equal to a percentage of the Fund’s average daily net assets that declines from 0.63% to 0.49% as the Fund’s net assets increase. The annualized effective management services fee rate for the six months ended November 30, 2016 was 0.63% of the Fund’s average daily net assets.
Subadvisory Agreement
The Investment Manager has entered into a Subadvisory Agreement with Threadneedle International Limited (Threadneedle), an affiliate of the Investment Manager and an indirect wholly-owned subsidiary of Ameriprise Financial, to serve as the subadviser to the Fund. The Investment Manager compensates Threadneedle to manage the investment of the Fund’s assets.
Other Expenses
Other expenses are for, among other things, miscellaneous expenses of the Fund or the Board, including payments to Board Services Corp., a company providing limited administrative services to the Fund and the Board. That company’s expenses include boardroom and office expense, employee compensation, employee health and retirement benefits, and certain other expenses.
| | |
| 26 | | Semiannual Report 2016 |
| | | | | | |
| | |
| | | | COLUMBIA COMMODITY STRATEGY FUND | | |
NOTES TO CONSOLIDATED FINANCIAL STATEMENTS (continued)
November 30, 2016 (Unaudited)
Compensation of Board Members
Board members, who are not officers or employees of the Investment Manager or Ameriprise Financial, are compensated for their services to the Fund as disclosed in the Consolidated Statement of Operations. Under a Deferred Compensation Plan (the Plan), these Board members may elect to defer payment of up to 100% of their compensation. Deferred amounts are treated as though equivalent dollar amounts had been invested in shares of certain funds managed by the Investment Manager. The Fund’s liability for these amounts is adjusted for market value changes and remains in the Fund until distributed in accordance with the Plan. All amounts payable under the Plan constitute a general unsecured obligation of the Fund.
Compensation of Chief Compliance Officer
The Board has appointed a Chief Compliance Officer to the Fund in accordance with federal securities regulations. The Fund is allocated a portion of the expenses associated with the Chief Compliance Officer based on relative net assets of the Trust.
Transfer Agency Fees
Under a Transfer and Dividend Disbursing Agent Agreement, Columbia Management Investment Services Corp. (the Transfer Agent), an affiliate of the Investment Manager and a wholly-owned subsidiary of Ameriprise Financial, is responsible for providing transfer agency services to the Fund. The Transfer Agent has contracted with Boston Financial Data Services (BFDS) to serve as sub-transfer agent. The Transfer Agent pays the fees of BFDS for services as sub-transfer agent and BFDS is not entitled to reimbursement for such fees from the Fund (with the exception of out-of-pocket fees).
The Fund pays the Transfer Agent a monthly transfer agency fee based on the number or the average value of accounts, depending on the type of account. In addition, prior to October 1, 2016, the Transfer Agent also received sub-transfer agency fees based on a percentage of the average aggregate value of the Fund’s shares maintained in omnibus accounts (other than omnibus accounts for which American Enterprise Investment Services Inc. is the broker of record or accounts where the beneficial shareholder is a customer of Ameriprise Financial Services, Inc., for which the Transfer Agent receives a per account fee). Effective October 1, 2016, the Fund pays the Transfer Agent a fee for shareholder services based on the number of accounts or on a percentage of the average aggregate value of the Fund’s
shares maintained in omnibus accounts up to the lesser of the amount charged by the servicing agent or a cap established by the Board from time to time.
The Transfer Agent also receives compensation from the Fund for various shareholder services and reimbursements for certain out-of-pocket fees. Effective January 1, 2017, total transfer agency fees for Class R5 shares are subject to an annual limitation of not more than 0.075% of the average daily net assets attributable to Class R5 shares. Total transfer agency fees for Class I and Class Y shares are subject to an annual limitation of not more than 0.025% of the average daily net assets attributable to each share class. Prior to January 1, 2017, total transfer agency fees for Class R5 shares were subject to an annual limitation of not more than 0.05% of the average daily net assets attributable to Class R5 shares. Class I and Class Y shares did not pay transfer agency fees.
For the six months ended November 30, 2016, the Fund’s annualized effective transfer agency fee rates as a percentage of average daily net assets of each class were as follows:
| | | | |
| | | | | |
Class A | | | 0.16 | % |
Class C | | | 0.16 | |
Class R | | | 0.16 | |
Class R4 | | | 0.16 | |
Class R5 | | | 0.05 | |
Class W | | | 0.16 | |
Class Z | | | 0.16 | |
An annual minimum account balance fee of $20 may apply to certain accounts with a value below the applicable share class’s initial minimum investment requirements to reduce the impact of small accounts on transfer agency fees. These minimum account balance fees are remitted to the Fund and recorded as part of expense reductions in the Consolidated Statement of Operations. For the six months ended November 30, 2016, no minimum account balance fees were charged by the Fund.
Distribution and Service Fees
The Fund has an agreement with Columbia Management Investment Distributors, Inc. (the Distributor), an affiliate of the Investment Manager and a wholly-owned subsidiary of Ameriprise Financial, for distribution and shareholder services. Under a Plan and Agreement of Distribution, the Fund pays a fee at an annual rate of up to 0.25% of the Fund’s average daily net assets attributable to Class A and Class W shares, a fee at an
| | | | |
| Semiannual Report 2016 | | | 27 | |
| | | | | | |
| | |
| | | | COLUMBIA COMMODITY STRATEGY FUND | | |
NOTES TO CONSOLIDATED FINANCIAL STATEMENTS (continued)
November 30, 2016 (Unaudited)
annual rate of up to 0.50% of the Fund’s average daily net assets attributable to Class R shares (of which up to 0.25% may be used for shareholder services) and a fee at an annual rate of up to 1.00% of the Fund’s average daily net assets attributable to Class C shares. For Class C shares, of the 1.00% fee, up to 0.75% is reimbursed for distribution expenses.
The amount of distribution and shareholder services expenses incurred by the Distributor and not yet reimbursed (unreimbursed expense) was approximately $4,000 for Class C shares. This amount is based on the most recent information available as of September 30, 2016, and may be recovered from future payments under the distribution plan or CDSCs. To the extent the unreimbursed expense has been fully recovered, the distribution and/or shareholder services fee is reduced.
Sales Charges
Sales charges, including front-end charges and CDSCs, received by the Distributor for distributing Fund shares were $8,291 for Class A and $0 for Class C shares for the six months ended November 30, 2016.
Expenses Waived/Reimbursed by the Investment Manager and its Affiliates
The Investment Manager and certain of its affiliates have contractually agreed to waive fees and/or reimburse expenses (excluding certain fees and expenses described below) for the periods disclosed below, unless sooner terminated at the sole discretion of the Board, so that the Fund’s net operating expenses, after giving effect to fees waived/expenses reimbursed and any balance credits and/or overdraft charges from the Fund’s custodian, do not exceed the following annual rates as a percentage of the class’ average daily net assets:
| | | | | | | | |
| | | October 1, 2016 Through
September 30, 2017 | | | Prior to
October 1, 2016 | |
Class A | | | 1.44 | % | | | 1.44 | % |
Class C | | | 2.19 | | | | 2.19 | |
Class I | | | 1.06 | | | | 1.08 | |
Class R | | | 1.69 | | | | 1.69 | |
Class R4 | | | 1.19 | | | | 1.19 | |
Class R5 | | | 1.11 | | | | 1.13 | |
Class W | | | 1.44 | | | | 1.44 | |
Class Y | | | 1.06 | | | | 1.08 | |
Class Z | | | 1.19 | | | | 1.19 | |
Under the agreement governing these fee waivers and/or expense reimbursement arrangements, the following fees
and expenses are excluded from the waiver/reimbursement commitment, and therefore will be paid by the Fund, if applicable: taxes (including foreign transaction taxes), expenses associated with investments in affiliated and non-affiliated pooled investment vehicles (including mutual funds and exchange-traded funds), transaction costs and brokerage commissions, costs related to any securities lending program, dividend and interest expenses associated with securities sold short, inverse floater program fees and expenses, transaction charges and interest on borrowed money, interest, infrequent and/or unusual expenses and any other expenses the exclusion of which is specifically approved by the Board. This agreement may be modified or amended only with approval from the Investment Manager, certain of its affiliates and the Fund. Any fees waived and/or expenses reimbursed under the expense reimbursement arrangements described above are not recoverable by the Investment Manager or its affiliates in future periods.
Note 4. Federal Tax Information
The timing and character of income and capital gain distributions are determined in accordance with income tax regulations, which may differ from GAAP because of temporary or permanent book to tax differences.
At November 30, 2016, the cost of investments for federal income tax purposes was approximately $293,814,000 and the aggregate gross approximate unrealized appreciation and depreciation based on that cost was:
| | | | |
Unrealized appreciation | | | $19,000 | |
Unrealized depreciation | | | (6,000 | ) |
Net unrealized appreciation | | | $13,000 | |
Under current tax rules, regulated investment companies can elect to treat certain late-year ordinary losses incurred and post-October capital losses (capital losses realized after October 31) as arising on the first day of the following taxable year. The Fund has elected to treat late-year ordinary losses of $147,803 as arising on June 1, 2016.
Management of the Fund has concluded that there are no significant uncertain tax positions in the Fund that would require recognition in the consolidated financial statements. However, management’s conclusion may be subject to review and adjustment at a later date based on factors including, but not limited to, new tax laws, regulations, and administrative interpretations (including relevant court decisions). Generally, the Fund’s federal
| | |
| 28 | | Semiannual Report 2016 |
| | | | | | |
| | |
| | | | COLUMBIA COMMODITY STRATEGY FUND | | |
NOTES TO CONSOLIDATED FINANCIAL STATEMENTS (continued)
November 30, 2016 (Unaudited)
tax returns for the prior three fiscal years remain subject to examination by the Internal Revenue Service.
Note 5. Portfolio Information
For the six months ended November 30, 2016, there were no purchases or proceeds from the sale of securities other than short-term investment transactions and derivative activity, if any. Only the amount of long-term security purchases and sales activity, excluding derivatives, impacts the portfolio turnover reported in the Financial Highlights.
Note 6. Affiliated Money Market Fund
The Fund invests significantly in Columbia Short-Term Cash Fund, an affiliated money market fund established for the exclusive use by the Fund and other affiliated funds (the Affiliated MMF). The income earned by the Fund from such investments is included as Dividends — affiliated issuers in the Consolidated Statement of Operations. As an investing fund, the Fund indirectly bears its proportionate share of the expenses of the Affiliated MMF. Effective October 1, 2016, the Affiliated MMF prices its shares with a floating net asset value (NAV) and no longer seeks to maintain a stable NAV. In addition, the Board of the Affiliated MMF may impose a fee on redemptions (sometimes referred to as a liquidity fee) or temporarily suspend redemptions (sometimes referred to as imposing a redemption gate) in the event its liquidity falls below regulatory limits.
Note 7. Line of Credit
The Fund has access to a revolving credit facility with a syndicate of banks led by Citibank, N.A., HSBC Bank USA, N.A. and JPMorgan Chase Bank, N.A. whereby the Fund may borrow for the temporary funding of shareholder redemptions or for other temporary or emergency purposes. The credit facility agreement, which is a collective agreement between the Fund and certain other funds managed by the Investment Manager, severally and not jointly, that permits collective borrowings up to $1 billion. Interest is charged to each participating fund based on its borrowings at a rate equal to the higher of (i) the overnight federal funds rate plus 1.00% or (ii) the one-month LIBOR rate plus 1.00%. Each borrowing under the credit facility matures no later than 60 days after the date of borrowing. The Fund also pays a commitment fee equal to its pro rata share of the amount of the credit facility at a rate of 0.15% per annum. The commitment fee is included in other expenses in the Consolidated Statement of Operations.
The Fund had no borrowings during the six months ended November 30, 2016.
Note 8. Significant Risks
Shareholder Concentration Risk
At November 30, 2016, affiliated shareholders of record owned 93.9% of the outstanding shares of the Fund in one or more accounts. Subscription and redemption activity by concentrated accounts may have a significant effect on the operations of the Fund. In the case of a large redemption, the Fund may be forced to sell investments at inopportune times, including its liquid or more liquid positions, resulting in Fund losses and the Fund holding a higher percentage of less liquid or illiquid securities. Large redemptions could result in decreased economies of scale and increased operating expenses for non-redeeming Fund shareholders.
Commodity-related Investment Risk
The value of commodities investments will generally be affected by overall market movements and factors specific to a particular industry or commodity, which may include demand for the commodity, weather, embargoes, tariffs, and economic health, political, international, regulatory and other developments. Exposure to commodities and commodities markets may subject the value of the Fund’s investments to greater volatility than other types of investments. Commodities investments may also subject the Fund to counterparty risk and liquidity risk. The Fund may make commodity-related investments through one or more wholly-owned subsidiaries organized outside the U.S. that are generally not subject to U.S. laws (including securities laws) and their protections.
Derivatives Risk
Losses involving derivative instruments may be substantial, because a relatively small price movement in the underlying security(ies), commodity, currency or index or other instrument or asset may result in a substantial loss for the Fund. In addition to the potential for increased losses, the use of derivative instruments may lead to increased volatility within the Fund. Derivatives will typically increase the Fund’s exposure to principal risks to which it is otherwise exposed, and may expose the Fund to additional risks, including correlation risk, counterparty risk, hedging risk, leverage risk and liquidity risk.
| | | | |
| Semiannual Report 2016 | | | 29 | |
| | | | | | |
| | |
| | | | COLUMBIA COMMODITY STRATEGY FUND | | |
NOTES TO CONSOLIDATED FINANCIAL STATEMENTS (continued)
November 30, 2016 (Unaudited)
Credit Risk
Credit risk is the risk that the value of debt securities in the Fund’s portfolio may decline because the issuer may default and fail to pay interest or repay principal when due. Rating agencies assign credit ratings to debt securities to indicate their credit risk. Lower rated or unrated debt securities held by the Fund may present increased credit risk as compared to higher-rated debt securities.
Interest Rate Risk
Interest rate risk is the risk of losses attributable to changes in interest rates. In general, if prevailing interest rates rise, the values of debt securities tend to fall, and if interest rates fall, the values of debt securities tend to rise. Actions by governments and central banking authorities can result in increases in interest rates. Increasing interest rates may negatively affect the value of debt securities held by the Fund, resulting in a negative impact on the Fund’s performance and net asset value per share. In general, the longer the maturity or duration of a debt security, the greater its sensitivity to changes in interest rates.
Liquidity Risk
Liquidity risk is the risk associated with a lack of marketability of investments which may make it difficult to sell the investment at a desirable time or price. Changing regulatory, market or other conditions or environments (for example, the interest rate or credit environments) may adversely affect the liquidity of the Fund’s investments. The Fund may have to accept a lower selling price for the holding, sell other investments, or forego another, more appealing investment opportunity. Generally, the less liquid the market at the time the Fund sells a portfolio investment, the greater the risk of loss or decline of value to the Fund. A less liquid market can lead to an increase in Fund redemptions, which may negatively impact Fund performance and net asset value per share, including, for example, if the Fund is forced to sell securities in a down market.
Leverage Risk
Leverage occurs when the Fund increases its assets available for investment using borrowings, short sales, derivatives, or similar instruments or techniques. The use of leverage may make any change in the Fund’s net asset value even greater and thus result in increased volatility of returns. Because short sales involve borrowing securities and then selling them, the Fund’s short sales effectively leverage the Fund’s assets. The
Fund’s assets that are used as collateral to secure the Fund’s obligations to return the securities sold short may decrease in value while the short positions are outstanding, which may force the Fund to use its other assets to increase the collateral. Leverage can create an interest expense that may lower the Fund’s overall returns. Leverage presents the opportunity for increased net income and capital gains, but also exaggerates the Fund’s risk of loss. There can be no guarantee that a leveraging strategy will be successful.
Money Market Fund Investment Risk
An investment in a money market fund is not a bank deposit and is not insured or guaranteed by any bank, the FDIC or any other government agency. Certain money market funds float their net asset value while others seek to preserve the value of investments at a stable net asset value (typically, $1.00 per share). An investment in a money market fund, even an investment in a fund seeking to maintain a stable net asset value per share, is not guaranteed and it is possible for the Fund to lose money by investing in these and other types of money market funds. If the liquidity of a money market fund’s portfolio deteriorates below certain levels, the money market fund may suspend redemptions (i.e., impose a redemption gate) and thereby prevent the Fund from selling its investment in the money market fund or impose a fee of up to 2% on amounts the Fund redeems from the money market fund (i.e., impose a liquidity fee). These measures may result in an investment loss or prohibit the Fund from redeeming shares when the Investment Manager would otherwise redeem shares. In addition to the fees and expenses that the Fund directly bears, the Fund indirectly bears the fees and expenses of any money market funds in which it invests, including affiliated money market funds. The Fund will also be exposed to the investment risks of the money market fund. To the extent the Fund invests in instruments such as derivatives, the Fund may hold investments, which may be significant, in money market fund shares to cover its obligations resulting from its investments in derivatives. Money market funds and the securities they invest in are subject to comprehensive regulations. The enactment of new legislation or regulations, as well as changes in interpretation and enforcement of current laws, may affect the manner of operation, performance and/or yield of money market funds.
Note 9. Subsequent Events
Management has evaluated the events and transactions that have occurred through the date the consolidated
| | |
| 30 | | Semiannual Report 2016 |
| | | | | | |
| | |
| | | | COLUMBIA COMMODITY STRATEGY FUND | | |
NOTES TO CONSOLIDATED FINANCIAL STATEMENTS (continued)
November 30, 2016 (Unaudited)
financial statements were issued and noted no items requiring adjustment of the consolidated financial statements or additional disclosure.
Note 10. Information Regarding Pending and Settled Legal Proceedings
Ameriprise Financial and certain of its affiliates have historically been involved in a number of legal, arbitration and regulatory proceedings, including routine litigation, class actions, and governmental actions, concerning matters arising in connection with the conduct of their business activities. Ameriprise Financial believes that the Funds are not currently the subject of, and that neither Ameriprise Financial nor any of its affiliates are the subject of, any pending legal, arbitration or regulatory proceedings that are likely to have a material adverse effect on the Funds or the ability of Ameriprise Financial or its affiliates to perform under their contracts with the Funds. Ameriprise Financial is required to make quarterly (10-Q), annual (10-K) and, as necessary, 8-K filings with the Securities and Exchange Commission (SEC) on legal and regulatory matters that relate to Ameriprise Financial and its affiliates. Copies of these filings may be obtained by accessing the SEC website at www.sec.gov.
There can be no assurance that these matters, or the adverse publicity associated with them, will not result in increased fund redemptions, reduced sale of fund shares or other adverse consequences to the Funds. Further, although we believe proceedings are not likely to have a material adverse effect on the Funds or the ability of Ameriprise Financial or its affiliates to perform under their contracts with the Funds, these proceedings are subject to uncertainties and, as such, we are unable to estimate the possible loss or range of loss that may result. An adverse outcome in one or more of these proceedings could result in adverse judgments, settlements, fines, penalties or other relief that could have a material adverse effect on the consolidated financial condition or results of operations of Ameriprise Financial.
| | | | |
| Semiannual Report 2016 | | | 31 | |
| | | | | | |
| | |
| | | | COLUMBIA COMMODITY STRATEGY FUND | | |
APPROVAL OF MANAGEMENT AND SUBADVISORY AGREEMENTS
Columbia Management Investment Advisers, LLC (Columbia Threadneedle or the Investment Manager, and together with its domestic and global affiliates, Columbia Threadneedle Investments), a wholly-owned subsidiary of Ameriprise Financial, Inc. (Ameriprise Financial), serves as the investment manager to Columbia Commodity Strategy Fund (the Fund). Under a management agreement (the Management Agreement), Columbia Threadneedle provides investment advice and other services to the Fund and other funds distributed by Columbia Management Investment Distributors, Inc. (collectively, the Funds). In addition, under a Subadvisory Agreement (the Subadvisory Agreement) between Columbia Threadneedle and Threadneedle International Limited (the Subadviser), an affiliate of Columbia Threadneedle, the Subadviser has provided portfolio management and related services for the Fund
On an annual basis, the Fund’s Board of Trustees (the Board), including the independent Board members (the Independent Trustees), considers renewal of the Management Agreement and the Subadvisory Agreement (together, the Advisory Agreements). Columbia Threadneedle prepared detailed reports for the Board and its Contracts Committee in February, March and April 2016, including reports providing the results of analyses performed by an independent organization, Broadridge Financial Solutions, Inc. (Broadridge) and a comprehensive response to items of information requested by independent legal counsel to the Independent Trustees (Independent Legal Counsel) in a letter to the Investment Manager, to assist the Board in making this determination. Many of the materials presented in February, March and April were first supplied in draft form to designated independent Board representatives, i.e., Independent Legal Counsel, the Chair of the Board and/or the Chair of the Contracts Committee, and the final materials were revised to include information reflective of discussion and subsequent requests made by the Contracts Committee. In addition, throughout the year, the Board (or its committees) regularly meets with portfolio management teams and senior management personnel and reviews information prepared by Columbia Threadneedle addressing the services Columbia Threadneedle provides and Fund performance. The Board also accords appropriate weight to the work, deliberations and conclusions of the various committees, such as the Contracts Committee, the Investment Review Committee and the Compliance Committee in determining whether to continue the Advisory Agreements.
The Board, at its June 13-15, 2016 in-person Board meeting (the June Meeting), considered the renewal of the Advisory Agreements for an additional one-year term. At the June Meeting, Independent Legal Counsel reviewed with the Independent Trustees various factors relevant to the Board’s consideration of advisory and subadvisory agreements and the Board’s legal responsibilities related to such consideration. Following an analysis and discussion of the factors identified below, the Board, including all of the Independent Trustees, approved the renewal of each of the Advisory Agreements.
Nature, Extent and Quality of Services Provided by Columbia Threadneedle and the Subadviser
The Board analyzed various reports and presentations it had received detailing the services performed by Columbia Threadneedle and the Subadviser, as well as their history, reputation, expertise, resources and relative capabilities, and the qualifications of their personnel.
The Board specifically considered many developments during the past year concerning the services provided by Columbia Threadneedle, including, in particular, detailed information regarding the process employed for selecting and overseeing affiliated and unaffiliated Subadvisers. The Board also noted the relatively recent change in the leadership of equity department oversight, improvements in technology research and the use of research analysts’ model portfolios to highlight best ideas and improve implementation. The Board further observed the restructured investment risk management department and its additional resources, including the new head of multi-asset investment risk, the relatively recent 5P leadership transition, and the additional staff and resources dedicated to the 5P team. The Board also took into account the broad scope of services provided by Columbia Threadneedle to each subadvised Fund, including, among other services, investment, risk and compliance oversight. The Board also took into account the information it received concerning Columbia Threadneedle’s ability to attract and retain key portfolio management personnel.
In connection with the Board’s evaluation of the overall package of services provided by Columbia Threadneedle, the Board also considered the nature, quality and range of administrative services provided to the Fund by Columbia Threadneedle, as well as the achievements in 2015 in the performance of administrative services, and noted the various enhancements anticipated for 2016. In evaluating the quality of services provided under the Advisory Agreements, the Board also took into account the organization and strength of the Fund’s and its service providers’
| | |
| 32 | | Semiannual Report 2016 |
| | | | | | |
| | |
| | | | COLUMBIA COMMODITY STRATEGY FUND | | |
APPROVAL OF MANAGEMENT AND SUBADVISORY AGREEMENTS (continued)
compliance programs. The Board also reviewed the financial condition of Columbia Threadneedle and its affiliates and each entity’s ability to carry out its responsibilities under the Management Agreement and the Fund’s other service agreements with affiliates of Ameriprise Financial, observing the financial strength of Ameriprise Financial, with its solid balance sheet.
In addition, the Board discussed the acceptability of the terms of the Advisory Agreements (including the relatively broad scope of services required to be performed by Columbia Threadneedle and each Subadviser), noting that no material changes are proposed from the form of agreements previously approved. The Board also noted the wide array of legal and compliance services provided to the Funds. It was also observed that the services being performed under the Advisory Agreements were of a reasonably high quality.
With respect to the Subadviser, the Board observed that it had previously approved the Subadviser’s code of ethics and compliance program, that the Chief Compliance Officer of the Fund continues to monitor the code and the program, and that no material concerns have been reported. The Board also considered the Subadviser’s organizational strength and resources, portfolio management team depth and capabilities and investment process. The Board also considered the Subadviser’s capability and wherewithal to carry out its responsibilities under the Subadvisory Agreement. In addition, the Board discussed the acceptability of the terms of the Subadvisory Agreement, including the scope of services required to be performed. The Board noted that the terms of the Subadvisory Agreement are generally consistent with the terms of other subadviser agreements for subadvisers who manage other funds managed by the Investment Manager. It was observed that no material changes were recommended to the Subadvisory Agreement. The Board took into account Columbia Threadneedle’s representation that each Subadviser was in a position to provide quality services to the relevant Fund, noting those Subadvisers requiring heightened surveillance in light of their underperformance. In this regard, the Board further observed the recent bolstering of the subadvisory oversight team (under new leadership with added resources) intended to help improve performance.
Based on the foregoing, and based on other information received (both oral and written, including the information on investment performance referenced below) and other considerations, the Board concluded that the Subadviser is in a position to continue to provide a high quality and level of services to the Fund.
Investment Performance
For purposes of evaluating the nature, extent and quality of services provided under the Advisory Agreements, the Board carefully reviewed the investment performance of the Fund. In this regard, the Board considered detailed reports providing the results of analyses performed by an independent organization showing, for various periods, the performance of the Fund, the performance of a benchmark index, the percentage ranking of the Fund among its comparison group and the net assets of the Fund. The Board observed that the Fund’s investment performance met expectations.
Additionally, the Board reviewed the performance of the Subadviser and Columbia Threadneedle’s process for monitoring the Subadviser. The Board considered, in particular, management’s rationale for recommending the continued retention of the Subadviser.
Comparative Fees, Costs of Services Provided and the Profits Realized by Columbia Threadneedle, its Affiliates and the Subadviser from their Relationships with the Fund
The Board reviewed comparative fees and the costs of services provided under each of the Advisory Agreements. The Board members considered detailed comparative information set forth in an annual report on fees and expenses, including, among other things, data (based on analyses conducted by an independent organization) showing a comparison of the Fund’s expenses with median expenses paid by funds in its comparative peer universe, as well as data showing the Fund’s contribution to Columbia Threadneedle’s profitability.
The Board considered the reports of its independent fee consultant, JDL Consultants, LLC (JDL), which assisted in the Board’s analysis of the Funds’ performance and expenses, the reasonableness of the Funds’ fee rates, the reasonableness of Columbia Threadneedle’s profitability, and JDL’s conclusion that the management fees being charged to the Fund are reasonable. The Board accorded particular weight to the notion that the level of fees should generally reflect a rational pricing model applied consistently across the various product lines in the Fund family, while assuring that the overall fees for each Fund (with certain defined exceptions) are generally in line with the “pricing
| | | | |
| Semiannual Report 2016 | | | 33 | |
| | | | | | |
| | |
| | | | COLUMBIA COMMODITY STRATEGY FUND | | |
APPROVAL OF MANAGEMENT AND SUBADVISORY AGREEMENTS (continued)
philosophy” currently in effect (i.e., that the total expense ratio of the Fund is generally no higher than the median expense ratio of funds in the comparison universe of the Fund). The Board took into account that the Fund’s total expense ratio (after considering proposed expense caps/waivers) approximated the peer universe’s median expense ratio.
Additionally, the Board reviewed the level of subadvisory fees paid to the Subadviser, noting that the fees are paid by the Investment Manager and do not impact the fees paid by the Fund. The Board also reviewed the fees charged by the Subadviser to other mutual funds employing similar investment strategies where the Subadviser serves as investment adviser or subadviser. Based on its reviews, including recommendations from JDL, the Board concluded that the Fund’s investment management and subadvisory fees were fair and reasonable in light of the extent and quality of services that the Fund receives.
The Board also considered the expected profitability of Columbia Threadneedle and its affiliates in connection with Columbia Threadneedle providing management services to the Fund. In this regard, the Independent Trustees referred to their detailed analysis of the Profitability Report, discussing the profitability to Columbia Threadneedle and Ameriprise Financial from managing, operating and distributing the Funds. The Board took into account JDL’s conclusion that 2015 Columbia Threadneedle profitability, relative to industry competitors, was reasonable. It also considered that in 2015 the Board had concluded that 2014 profitability was reasonable and that Columbia Threadneedle generated 2015 profitability that only slightly exceeded 2014 levels. It also took into account the indirect economic benefits flowing to Columbia Threadneedle or its affiliates in connection with managing or distributing the Funds, such as the enhanced ability to offer various other financial products to Ameriprise Financial customers, soft dollar benefits and overall reputational advantages. The Board noted that the fees paid by the Fund should permit the Investment Manager to offer competitive compensation to its personnel, make necessary investments in its business and earn an appropriate profit. The Board concluded that profitability levels were reasonable.
Economies of Scale to be Realized
The Board also considered the economies of scale that might be realized by Columbia Threadneedle as the Fund grows and took note of the extent to which Fund shareholders might also benefit from such growth. In this regard, the Board took into account that management fees decline as Fund assets exceed various breakpoints, all of which have not been surpassed. The Board concluded that the breakpoints in the management fee rate schedule satisfactorily provides for the sharing of economies of scale, as they allow for adequate opportunity for shareholders to realize benefits (fee breaks) as Fund assets grow.
Based on the foregoing, the Board, including all of the Independent Trustees, concluded that fees payable under the Advisory Agreements were fair and reasonable in light of the extent and quality of services provided. In reaching this conclusion, no single factor was determinative. On June 15, 2016, the Board, including all of the Independent Trustees, approved the renewal of the Advisory Agreements.
| | |
| 34 | | Semiannual Report 2016 |
| | | | | | |
| | |
| | | | COLUMBIA COMMODITY STRATEGY FUND | | |
IMPORTANT INFORMATION ABOUT THIS REPORT
Each fund mails one shareholder report to each shareholder address. If you would like more than one report, please call shareholder services at 800.345.6611 and additional reports will be sent to you.
The policy of the Board is to vote the proxies of the companies in which each fund holds investments consistent with the procedures as stated in the Statement of Additional Information (SAI). You may obtain a copy of the SAI without charge by calling 800.345.6611; contacting your financial intermediary; visiting investor.columbiathreadneedleus.com; or searching the website of the Securities and Exchange Commission (SEC) at sec.gov. Information regarding how each fund voted proxies relating to portfolio securities is filed with the SEC by August 31st for the most recent 12-month period ending June 30th of that year, and is available without charge by visiting investor.columbiathreadneedleus.com, or searching the website of the SEC at sec.gov.
Each fund files a complete schedule of portfolio holdings with the SEC for the first and third quarters of each fiscal year on Form N-Q. Each fund’s Form N-Q is available on the SEC’s website at sec.gov and may be reviewed and copied at the SEC’s Public Reference Room in Washington, D.C. Information on the operation of the Public Reference Room may be obtained by calling 800.SEC.0330. Each fund’s complete schedule of portfolio holdings, as filed on Form N-Q, can also be obtained without charge, upon request, by calling 800.345.6611.
You may obtain the current net asset value (NAV) of Fund shares at no cost by calling 800.345.6611 or by sending an e-mail to serviceinquiries@columbiathreadneedle.com.
| | | | |
| Semiannual Report 2016 | | | 35 | |
Columbia Commodity Strategy Fund
P.O. Box 8081
Boston, MA 02266-8081
Please read and consider the investment objectives, risks, charges and expenses for any fund carefully before investing. For a prospectus and summary prospectus, which contains this and other important information about the Fund, go to investor.columbiathreadneedleus.com. The Fund is distributed by Columbia Management Investment Distributors, Inc., member FINRA, and managed by Columbia Management Investment Advisers, LLC.
Columbia Threadneedle Investments (Columbia Threadneedle) is the global brand name of the Columbia and Threadneedle group of companies. All rights reserved. Columbia Management Investment Distributors, Inc., 225 Franklin Street, Boston, MA 02110-2804
© 2017 Columbia Management Investment Advisers, LLC.
investor.columbiathreadneedleus.com
SAR129_05_G01_(01/17)

SEMIANNUAL REPORT
November 30, 2016

COLUMBIA FLEXIBLE CAPITAL INCOME FUND


ABOUT COLUMBIA THREADNEEDLE INVESTMENTS
Columbia Threadneedle Investments is a leading global asset management group that provides a broad range of investment strategies and solutions for individual, institutional and corporate clients around the world.
With more than 2,000 people, including over 450 investment professionals based in North America, Europe and Asia, we manage $460 billion* of assets across developed and emerging market equities, fixed income, asset allocation solutions and alternatives. We are the 13th largest manager of long-term mutual fund assets in the U.S.** and the 4th largest manager of retail funds in the U.K.***
Our priority is the investment success of our clients. We aim to deliver the investment outcomes they expect through an investment approach that is team-based, performance-driven and risk-aware. Our culture is dynamic and interactive. By sharing our insights across asset classes and geographies, we generate richer perspectives on global, regional and local investment landscapes. The ability to exchange and debate investment ideas in a collaborative environment enriches our teams’ investment processes. More importantly, it results in better informed investment decisions for our clients.
Columbia funds are distributed by Columbia Management Investment Distributors, Inc., member FINRA, and managed by Columbia Management Investment Advisers, LLC.
Columbia Threadneedle Investments (Columbia Threadneedle) is the global brand name of the Columbia and Threadneedle group of companies.
| * | | In U.S. dollars as of June 30, 2016. Source: Ameriprise Q2 Earnings Release. Includes all assets managed by entities in the Columbia and Threadneedle group of companies. Contact us for more current data. |
| ** | | Source: ICI as of June 30, 2016 for Columbia Management Investment Advisers, LLC. |
| *** | | Source: Investment Association as of March 2016 for Threadneedle Asset Management Limited. |
© 2016 Columbia Management Investment Advisers, LLC. All rights reserved.
Not part of the shareholder report
PRESIDENT’S MESSAGE

Dear Shareholders,
While emotions have run high following the outcome of the U.S. Presidential election, it remains unclear how the Trump presidency will unfold in terms of policy. We have a sense of the priorities espoused by the president-elect over the past eighteen months, but campaign priorities are not always realized and are often never pursued. What seems certain is that, while some investors have already priced expectations into the market, others have retreated, preferring instead a wait and see approach. The outcome of such behaviors appears to have created conditions ripe for ongoing market volatility.
While volatility in the financial markets can be stressful, volatility itself is not a new phenomenon. Other factors that have been at the root cause of recent volatility include uncertainty following the United Kingdom’s vote to exit the European Union (Brexit), speculation around the Federal Reserve’s decision to increase interest rates, divergent central bank policy and geopolitical unrest. The point is, financial markets have fluctuated for years and may be expected to continue to fluctuate — sometimes wildly. If anything, such volatility seems to be the new normal, perhaps exacerbated by access to information and development of technological tools which have enabled investors to react rapidly to real and perceived change. So what can you do?
Position your portfolio for the reality of market volatility
That there is a historical precedent for market volatility, or even an acceptance that it may persist, offers little comfort. A measured and strategic approach remains the best strategy for investors to stay on track in achieving their investment goals.
Step 1: Review your investment goals
Take this opportunity to review your investment goals and the strategies you are pursuing to achieve those goals in order to remain focused on what’s important to you. It is entirely possible that your goals have changed in response either to your life situation or to changes in the market. Accept what you can’t control — volatility, and focus on what you can — your investment goals and strategies.
Step 2: Reassess your risk tolerance
Sit down with your financial advisor to discuss your investment goals and strategies, as well as any changes to your tolerance for risk. Consider your investment horizon. Increased market volatility and a new investment horizon may impact the strategies that can best help you achieve your investment goals. Remember, achieving your investment goals may require a certain amount of risk. Ultimately, you must maintain vigilance in reassessing your risk tolerance and the strategies you have selected in pursuit of your investment goals, and awareness of how those strategies may react to market volatility.
Step 3: Remain calm and focus on your long-term plan
Remember, investing is about the long game. Short term events are not necessarily evidence of a longer term reality. Investors who attempt to time the market too often end up reacting to a down turn by selling low and then compounding the problem by waiting on the sidelines, ultimately missing the right opportunity to reinvest.
As long as there is a market, there will be volatility. How you respond to that volatility can make a big difference in the measure of your success as an investor. Talk to your financial advisor about how working with Columbia Threadneedle Investments may help you position your portfolio for the reality of ongoing volatility and, perhaps, even turn such volatility into investment opportunity.
Best regards,

Christopher O. Petersen
President, Columbia Funds
Investors should consider the investment objectives, risks, charges and expenses of a mutual fund carefully before investing. For a free prospectus and summary prospectus, which contains this and other important information about a fund, visit investor.columbiathreadneedleus.com. The prospectus should be read carefully before investing.
Columbia Funds are distributed by Columbia Management Investment Distributors, Inc., member FINRA, and managed by Columbia Management Investment Advisers, LLC.
© 2017 Columbia Management Investment Advisers, LLC. All rights reserved.
Semiannual Report 2016
| | | | | | |
| | |
| | | | COLUMBIA FLEXIBLE CAPITAL INCOME FUND | | |
TABLE OF CONTENTS
Fund Investment Manager
Columbia Management Investment
Advisers, LLC
225 Franklin Street
Boston, MA 02110
Fund Distributor
Columbia Management Investment
Distributors, Inc.
225 Franklin Street
Boston, MA 02110
Fund Transfer Agent
Columbia Management Investment
Services Corp.
P.O. Box 8081
Boston, MA 02266-8081
For more information about any of the funds, please visit investor.columbiathreadneedleus.com or call 800.345.6611. Customer Service Representatives are available to answer your questions Monday through Friday from 8 a.m. to 7 p.m. Eastern time.
The views expressed in this report reflect the current views of the respective parties. These views are not guarantees of future performance and involve certain risks, uncertainties and assumptions that are difficult to predict, so actual outcomes and results may differ significantly from the views expressed. These views are subject to change at any time based upon economic, market or other conditions and the respective parties disclaim any responsibility to update such views. These views may not be relied on as investment advice and, because investment decisions for a Columbia fund are based on numerous factors, may not be relied on as an indication of trading intent on behalf of any particular Columbia fund. References to specific securities should not be construed as a recommendation or investment advice.
Semiannual Report 2016
| | | | | | |
| | |
| | | | COLUMBIA FLEXIBLE CAPITAL INCOME FUND | | |
PERFORMANCE OVERVIEW
(Unaudited)
Performance Summary
| ∎ | | Columbia Flexible Capital Income Fund (the Fund) Class A shares returned 10.02% excluding sales charges for the six-month period that ended November 30, 2016. |
| ∎ | | During the same time period, the Fund outperformed its Blended Benchmark, which returned 5.85%, as well as the Bloomberg Barclays U.S. Aggregate Bond Index, which returned -0.92%. |
| | | | | | | | | | | | | | | | | | |
Average Annual Total Returns (%) (for period ended November 30, 2016) | | | | | |
| | | Inception | | 6 Months Cumulative | | | 1 Year | | | 5 Years | | | Life | |
Class A | | 07/28/11 | | | | | | | | | | | | | | | | |
Excluding sales charges | | | | | 10.02 | | | | 12.73 | | | | 9.28 | | | | 8.35 | |
Including sales charges | | | | | 3.74 | | | | 6.23 | | | | 7.99 | | | | 7.15 | |
Class C | | 07/28/11 | | | | | | | | | | | | | | | | |
Excluding sales charges | | | | | 9.58 | | | | 11.86 | | | | 8.48 | | | | 7.54 | |
Including sales charges | | | | | 8.58 | | | | 10.86 | | | | 8.48 | | | | 7.54 | |
Class I | | 07/28/11 | | | 10.24 | | | | 13.18 | | | | 9.72 | | | | 8.75 | |
Class R | | 07/28/11 | | | 9.90 | | | | 12.46 | | | | 9.00 | | | | 8.05 | |
Class R4* | | 11/08/12 | | | 10.08 | | | | 12.91 | | | | 9.49 | | | | 8.54 | |
Class R5* | | 11/08/12 | | | 10.12 | | | | 13.00 | | | | 9.55 | | | | 8.60 | |
Class W | | 07/28/11 | | | 9.92 | | | | 12.63 | | | | 9.28 | | | | 8.32 | |
Class Z | | 07/28/11 | | | 10.15 | | | | 13.01 | | | | 9.55 | | | | 8.60 | |
Blended Benchmark | | | | | 5.85 | | | | 8.48 | | | | 10.23 | | | | 8.72 | |
Bloomberg Barclays U.S. Aggregate Bond Index | | | | | -0.92 | | | | 2.17 | | | | 2.43 | | | | 2.81 | |
Returns for Class A are shown with and without the maximum initial sales charge of 5.75%. Returns for Class C are shown with and without the 1.00% contingent deferred sales charge for the first year only. The Fund’s other classes are not subject to sales charges and have limited eligibility. Please see the Fund’s prospectus for details. Performance for different share classes will vary based on differences in sales charges and fees associated with each class. All results shown assume reinvestment of distributions during the period. Returns do not reflect the deduction of taxes that a shareholder may pay on Fund distributions or on the redemption of Fund shares. Performance results reflect the effect of any fee waivers or reimbursements of Fund expenses by Columbia Management Investment Advisers, LLC and/or any of its affiliates. Absent these fee waivers or expense reimbursement arrangements, performance results would have been lower.
The performance information shown represents past performance and is not a guarantee of future results. The investment return and principal value of your investment will fluctuate so that your shares, when redeemed, may be worth more or less than their original cost. Current performance may be lower or higher than the performance information shown. You may obtain performance information current to the most recent month-end by contacting your financial intermediary, visiting investor.columbiathreadneedleus.com or calling 800.345.6611.
| * | The returns shown for periods prior to the share class inception date (including returns for the Life of the Fund, if shown, which are since Fund inception) include the returns of the Fund’s oldest share class. Since the Fund launched more than one share class at its inception, Class A shares were used. These returns are adjusted to reflect any higher class-related operating expenses of the newer share classes, as applicable. Please visit investor.columbiathreadneedleus.com/investment-products/mutual-funds/appended-performance for more information. |
The Blended Benchmark, established by the Investment Manager, is composed of one-third each of the Russell 1000 Value Index, the Bloomberg Barclays U.S. Corporate Investment Grade & High Yield Index and the Bloomberg Barclays U.S. Convertible Composite Index. The Russell 1000 Value Index, an unmanaged index, measures the performance of those stocks in the Russell 1000 Index with lower price-to-book ratios and lower forecasted growth values. The Bloomberg Barclays U.S. Corporate Investment Grade & High Yield Index is a broad-based benchmark that measures the performance of investment-grade and non-investment grade, fixed-rate and taxable corporate bonds. It includes USD-denominated securities publicly issued by U.S. and non U.S. industrial, utility, and financial issuers that meet specified maturity, liquidity, and quality requirements. The Bloomberg Barclays U.S. Convertible Composite Index measures the performance of all four major classes of USD equity-linked securities including: convertible cash coupon bonds, zero-coupon bonds, preferred convertibles with fixed par amounts and mandatory equity-linked securities.
The Bloomberg Barclays U.S. Aggregate Bond Index is a broad-based benchmark that measures the investment-grade, U.S. dollar denominated, fixed-rate taxable bond market, including Treasuries, government-related and corporate securities, mortgage-backed securities (agency fixed-rate and hybrid adjustable-rate mortgage passthroughs), asset-backed securities, and commercial mortgage-backed securities.
Indices are not available for investment, are not professionally managed and do not reflect sales charges, fees, brokerage commissions, taxes or other expenses of investing. Securities in the Fund may not match those in an index.
| | | | | | |
| | |
| | | | COLUMBIA FLEXIBLE CAPITAL INCOME FUND | | |
PORTFOLIO OVERVIEW
(Unaudited)
| | | | |
Top Ten Holdings (%)
(at November 30, 2016) | |
Microsoft Corp. | | | 1.6 | |
Exxon Mobil Corp. | | | 1.5 | |
Navistar International Corp.
04/15/19 4.750% | | | 1.5 | |
ADS Tactical, Inc.
04/01/18 11.000% | | | 1.5 | |
Frontier Communications Corp.
09/15/25 11.000% | | | 1.3 | |
JPMorgan Chase & Co. | | | 1.3 | |
Bank of America Corp. | | | 1.3 | |
Chesapeake Energy Corp.
09/15/26 5.500% | | | 1.2 | |
Automatic Data Processing, Inc. | | | 1.1 | |
Dow Chemical Co. (The) | | | 1.1 | |
Percentages indicated are based upon total investments (excluding Money Market Funds).
For further detail about these holdings, please refer to the section entitled “Portfolio of Investments.”
Fund holdings are as of the date given, are subject to change at any time, and are not recommendations to buy or sell any security.
| | | | |
Portfolio Breakdown (%)
(at November 30, 2016) | |
Common Stocks | | | 36.4 | |
Convertible Bonds | | | 18.9 | |
Convertible Preferred Stocks | | | 13.9 | |
Corporate Bonds & Notes | | | 24.6 | |
Limited Partnerships | | | 1.7 | |
Money Market Funds | | | 2.5 | |
Preferred Debt | | | 2.0 | |
Total | | | 100.0 | |
Percentages indicated are based upon total investments. The Fund’s portfolio composition is subject to change.
Portfolio Management
David King, CFA
Yan Jin
| | | | | | |
| | |
| | | | COLUMBIA FLEXIBLE CAPITAL INCOME FUND | | |
UNDERSTANDING YOUR FUND’S EXPENSES
(Unaudited)
As an investor, you incur two types of costs. There are transaction costs, which generally include sales charges on purchases and may include redemption fees. There are also ongoing costs, which generally include management fees, distribution and/or service fees, and other fund expenses. The following information is intended to help you understand your ongoing costs (in dollars) of investing in the Fund and to help you compare these costs with the ongoing costs of investing in other mutual funds.
Analyzing Your Fund’s Expenses
To illustrate these ongoing costs, we have provided examples and calculated the expenses paid by investors in each share class of the Fund during the period. The actual and hypothetical information in the table is based on an initial investment of $1,000 at the beginning of the period indicated and held for the entire period. Expense information is calculated two ways and each method provides you with different information. The amount listed in the “Actual” column is calculated using the Fund’s actual operating expenses and total return for the period. You may use the Actual information, together with the amount invested, to estimate the expenses that you paid over the period. Simply divide your account value by $1,000 (for example, an $8,600 account value divided by $1,000 = 8.6), then multiply the results by the expenses paid during the period under the “Actual” column. The amount listed in the “Hypothetical” column assumes a 5% annual rate of return before expenses (which is not the Fund’s actual return) and then applies the Fund’s actual expense ratio for the period to the hypothetical return. You should not use the hypothetical account values and expenses to estimate either your actual account balance at the end of the period or the expenses you paid during the period. See “Compare With Other Funds” below for details on how to use the hypothetical data.
Compare With Other Funds
Since all mutual funds are required to include the same hypothetical calculations about expenses in shareholder reports, you can use this information to compare the ongoing cost of investing in the Fund with other funds. To do so, compare the hypothetical example with the 5% hypothetical examples that appear in the shareholder reports of other funds. As you compare hypothetical examples of other funds, it is important to note that hypothetical examples are meant to highlight the ongoing costs of investing in a fund only and do not reflect any transaction costs, such as sales charges, or redemption or exchange fees. Therefore, the hypothetical calculations are useful in comparing ongoing costs only, and will not help you determine the relative total costs of owning different funds. If transaction costs were included in these calculations, your costs would be higher.
June 1, 2016 – November 30, 2016
| | | | | | | | | | | | | | | | | | | | | | | | | | | | |
| | | Account Value at the
Beginning of the
Period ($) | | | Account Value at the
End of the
Period ($) | | | Expenses Paid During
the Period ($) | | | Fund’s Annualized Expense Ratio (%) | |
| | | | Actual | | | | Hypothetical | | | | Actual | | | | Hypothetical | | | | Actual | | | | Hypothetical | | | | Actual | |
Class A | | | 1,000.00 | | | | 1,000.00 | | | | 1,100.20 | | | | 1,019.70 | | | | 5.63 | | | | 5.42 | | | | 1.07 | |
Class C | | | 1,000.00 | | | | 1,000.00 | | | | 1,095.80 | | | | 1,015.94 | | | | 9.56 | | | | 9.20 | | | | 1.82 | |
Class I | | | 1,000.00 | | | | 1,000.00 | | | | 1,102.40 | | | | 1,021.56 | | | | 3.69 | | | | 3.55 | | | | 0.70 | |
Class R | | | 1,000.00 | | | | 1,000.00 | | | | 1,099.00 | | | | 1,018.45 | | | | 6.95 | | | | 6.68 | | | | 1.32 | |
Class R4 | | | 1,000.00 | | | | 1,000.00 | | | | 1,100.80 | | | | 1,020.96 | | | | 4.32 | | | | 4.15 | | | | 0.82 | |
Class R5 | | | 1,000.00 | | | | 1,000.00 | | | | 1,101.20 | | | | 1,021.26 | | | | 4.00 | | | | 3.85 | | | | 0.76 | |
Class W | | | 1,000.00 | | | | 1,000.00 | | | | 1,099.20 | | | | 1,019.75 | | | | 5.58 | | | | 5.37 | | | | 1.06 | |
Class Z | | | 1,000.00 | | | | 1,000.00 | | | | 1,101.50 | | | | 1,020.96 | | | | 4.32 | | | | 4.15 | | | | 0.82 | |
Expenses paid during the period are equal to the annualized expense ratio for each class as indicated above, multiplied by the average account value over the period and then multiplied by the number of days in the Fund’s most recent fiscal half year and divided by 365.
Expenses do not include fees and expenses incurred indirectly by the Fund from its investment in underlying funds, including affiliated and non-affiliated pooled investment vehicles, such as mutual funds and exchange-traded funds.
| | | | | | |
| | |
| | | | COLUMBIA FLEXIBLE CAPITAL INCOME FUND | | |
PORTFOLIO OF INVESTMENTS
November 30, 2016 (Unaudited)
(Percentages represent value of investments compared to net assets)
| | | | | | | | |
| Common Stocks 36.5% | |
| Issuer | | Shares | | | Value ($) | |
CONSUMER DISCRETIONARY 2.4% | |
Hotels, Restaurants & Leisure 1.1% | |
| | |
Extended Stay America, Inc. | | | 320,000 | | | | 4,979,200 | |
|
Multiline Retail 0.5% | |
| | |
Macy’s, Inc. | | | 52,500 | | | | 2,215,500 | |
|
Specialty Retail 0.8% | |
| | |
Staples, Inc. | | | 400,000 | | | | 3,868,000 | |
| | | | | | | | | |
Total Consumer Discretionary | | | | | | | 11,062,700 | |
| | |
| | | | | | | | |
CONSUMER STAPLES 2.7% | |
Food & Staples Retailing 0.9% | |
| | |
SYSCO Corp. | | | 82,500 | | | | 4,393,125 | |
|
Food Products 1.0% | |
| | |
General Mills, Inc. | | | 74,000 | | | | 4,509,560 | |
|
Tobacco 0.8% | |
| | |
Altria Group, Inc. | | | 55,000 | | | | 3,516,150 | |
| | | | | | | | | |
Total Consumer Staples | | | | | | | 12,418,835 | |
| | |
| | | | | | | | |
ENERGY 3.1% | |
Oil, Gas & Consumable Fuels 3.1% | |
| | |
BP PLC, ADR | | | 125,000 | | | | 4,376,250 | |
| | |
Exxon Mobil Corp. | | | 77,500 | | | | 6,765,750 | |
| | |
Suncor Energy, Inc. | | | 87,500 | | | | 2,787,750 | |
| | | | | | | | | |
Total | | | | | | | 13,929,750 | |
| | | | | | | | | |
Total Energy | | | | | | | 13,929,750 | |
| | |
| | | | | | | | |
FINANCIALS 7.7% | |
Banks 4.1% | |
| | |
Bank of America Corp. | | | 265,000 | | | | 5,596,800 | |
| | |
First Hawaiian, Inc. | | | 82,500 | | | | 2,474,175 | |
| | |
JPMorgan Chase & Co. | | | 70,000 | | | | 5,611,900 | |
| | |
PacWest Bancorp | | | 95,000 | | | | 4,868,750 | |
| | | | | | | | | |
Total | | | | | | | 18,551,625 | |
|
Capital Markets 1.1% | |
| | |
Ares Capital Corp. | | | 300,000 | | | | 4,812,000 | |
|
Insurance 1.1% | |
| | |
MetLife, Inc. | | | 47,500 | | | | 2,612,975 | |
| | |
Validus Holdings Ltd. | | | 47,500 | | | | 2,581,150 | |
| | | | | | | | | |
Total | | | | | | | 5,194,125 | |
|
Mortgage Real Estate Investment Trusts (REITs) 1.4% | |
| | |
Blackstone Mortgage Trust, Inc. | | | 60,000 | | | | 1,804,800 | |
| | |
Starwood Property Trust, Inc. | | | 205,000 | | | | 4,606,350 | |
| | | | | | | | | |
Total | | | | | | | 6,411,150 | |
| | | | | | | | | |
Total Financials | | | | | | | 34,968,900 | |
| | | | | | | | |
| Common Stocks (continued) | |
| Issuer | | Shares | | | Value ($) | |
HEALTH CARE 3.6% | |
Health Care Equipment & Supplies 0.9% | |
| | |
Medtronic PLC | | | 52,500 | | | | 3,833,025 | |
|
Health Care Providers & Services 0.9% | |
| | |
Cardinal Health, Inc. | | | 60,000 | | | | 4,260,600 | |
|
Pharmaceuticals 1.8% | |
| | |
Merck & Co., Inc. | | | 55,000 | | | | 3,365,450 | |
| | |
Pfizer, Inc. | | | 147,500 | | | | 4,740,650 | |
| | | | | | | | | |
Total | | | | | | | 8,106,100 | |
| | | | | | | | | |
Total Health Care | | | | | | | 16,199,725 | |
| | |
| | | | | | | | |
INDUSTRIALS 2.5% | |
Aerospace & Defense 1.0% | |
| | |
Lockheed Martin Corp. | | | 17,500 | | | | 4,641,875 | |
|
Air Freight & Logistics 0.5% | |
| | |
United Parcel Service, Inc., Class B | | | 20,000 | | | | 2,318,400 | |
|
Transportation Infrastructure 1.0% | |
| | |
Macquarie Infrastructure Corp. | | | 52,500 | | | | 4,301,850 | |
| | | | | | | | | |
Total Industrials | | | | | | | 11,262,125 | |
| | |
| | | | | | | | |
INFORMATION TECHNOLOGY 8.5% | |
Communications Equipment 0.7% | |
| | |
Cisco Systems, Inc. | | | 110,000 | | | | 3,280,200 | |
|
Electronic Equipment, Instruments & Components 0.8% | |
| | |
Corning, Inc. | | | 142,500 | | | | 3,424,275 | |
|
IT Services 2.4% | |
| | |
Automatic Data Processing, Inc. | | | 52,500 | | | | 5,041,050 | |
| | |
Booz Allen Hamilton Holdings Corp. | | | 70,000 | | | | 2,646,700 | |
| | |
Leidos Holdings, Inc. | | | 57,500 | | | | 2,944,000 | |
| | | | | | | | | |
Total | | | | | | | 10,631,750 | |
|
Semiconductors & Semiconductor Equipment 2.6% | |
| | |
Analog Devices, Inc. | | | 55,000 | | | | 4,083,200 | |
| | |
Broadcom Ltd. | | | 13,000 | | | | 2,216,370 | |
| | |
Lam Research Corp. | | | 31,000 | | | | 3,286,620 | |
| | |
Maxim Integrated Products, Inc. | | | 55,000 | | | | 2,159,850 | |
| | | | | | | | | |
Total | | | | | | | 11,746,040 | |
|
Software 1.5% | |
| | |
Microsoft Corp. | | | 115,000 | | | | 6,929,900 | |
|
Technology Hardware, Storage & Peripherals 0.5% | |
| | |
Western Digital Corp. | | | 37,500 | | | | 2,387,250 | |
| | | | | | | | | |
Total Information Technology | | | | | | | 38,399,415 | |
| | |
| | | | | | | | |
The accompanying Notes to Financial Statements are an integral part of this statement.
| | | | | | |
| | |
| | | | COLUMBIA FLEXIBLE CAPITAL INCOME FUND | | |
PORTFOLIO OF INVESTMENTS (continued)
November 30, 2016 (Unaudited)
| | | | | | | | |
| Common Stocks (continued) | |
| Issuer | | Shares | | | Value ($) | |
MATERIALS 1.1% | |
Chemicals 1.1% | |
| | |
Dow Chemical Co. (The) | | | 90,000 | | | | 5,014,800 | |
| | | | | | | | | |
Total Materials | | | | | | | 5,014,800 | |
| | |
| | | | | | | | |
REAL ESTATE 2.0% | |
Equity Real Estate Investment Trusts (REITs) 2.0% | |
| | |
Alexandria Real Estate Equities, Inc. | | | 14,000 | | | | 1,534,260 | |
| | |
Equinix, Inc. | | | 9,400 | | | | 3,184,344 | |
| | |
Extra Space Storage, Inc. | | | 60,000 | | | | 4,209,600 | |
| | | | | | | | | |
Total | | | | | | | 8,928,204 | |
| | | | | | | | | |
Total Real Estate | | | | | | | 8,928,204 | |
| | |
| | | | | | | | |
TELECOMMUNICATION SERVICES 1.0% | |
Diversified Telecommunication Services 1.0% | |
| | |
AT&T, Inc. | | | 115,000 | | | | 4,442,450 | |
| | | | | | | | | |
Total Telecommunication Services | | | | | | | 4,442,450 | |
| | |
| | | | | | | | |
UTILITIES 1.9% | |
Electric Utilities 1.0% | |
| | |
Xcel Energy, Inc. | | | 115,000 | | | | 4,486,150 | |
|
Independent Power and Renewable Electricity Producers 0.9% | |
| | |
NRG Yield, Inc. Class A | | | 265,000 | | | | 3,866,350 | |
| | |
NRG Yield, Inc. Class C | | | 35,000 | | | | 537,250 | |
| | | | | | | | | |
Total | | | | | | | 4,403,600 | |
| | | | | | | | | |
Total Utilities | | | | | | | 8,889,750 | |
| | | | | | | | | |
Total Common Stocks | | | | | | | | |
(Cost: $149,314,189) | | | | | | | 165,516,654 | |
| | |
| | | | | | | | |
| Convertible Preferred Stocks 14.0% | |
CONSUMER STAPLES 1.1% | |
Food Products 1.1% | |
| | |
Bunge Ltd., 4.875% | | | 47,500 | | | | 4,709,459 | |
| | | | | | | | | |
Total Consumer Staples | | | | | | | 4,709,459 | |
| | |
| | | | | | | | |
ENERGY 1.9% | |
Oil, Gas & Consumable Fuels 1.9% | |
| | |
Anadarko Petroleum Corp., 7.500% | | | 55,000 | | | | 2,262,150 | |
| | |
Hess Corp., 8.000% | | | 55,000 | | | | 3,688,850 | |
| | |
WPX Energy, Inc., 6.250% | | | 35,000 | | | | 2,450,000 | |
| | | | | | | | | |
Total | | | | | | | 8,401,000 | |
| | | | | | | | | |
Total Energy | | | | | | | 8,401,000 | |
| | |
| | | | | | | | |
| | | | | | | | |
| Convertible Preferred Stocks (continued) | |
| Issuer | | Shares | | | Value ($) | |
FINANCIALS 2.3% | |
Banks 1.0% | |
| | |
Bank of America Corp., 7.250% | | | 3,700 | | | | 4,332,700 | |
|
Capital Markets 1.3% | |
| | |
AMG Capital Trust II, 5.150% | | | 65,000 | | | | 3,514,062 | |
| | |
Cowen Group, Inc., 5.625% | | | 3,400 | | | | 2,543,710 | |
| | | | | | | | | |
Total | | | | | | | 6,057,772 | |
| | | | | | | | | |
Total Financials | | | | | | | 10,390,472 | |
| | |
| | | | | | | | |
HEALTH CARE 1.7% | |
Health Care Equipment & Supplies 0.5% | |
| | |
Alere, Inc., 3.000% | | | 7,500 | | | | 2,523,863 | |
|
Health Care Providers & Services 0.3% | |
| | |
AmSurg Corp., 5.250% | | | 10,000 | | | | 1,234,800 | |
|
Pharmaceuticals 0.9% | |
| | |
Allergan PLC, 5.500% | | | 5,700 | | | | 4,086,900 | |
| | | | | | | | | |
Total Health Care | | | | | | | 7,845,563 | |
|
| |
INDUSTRIALS 0.5% | |
Aerospace & Defense 0.5% | |
| | |
Arconic, Inc., 5.375% | | | 72,500 | | | | 2,294,625 | |
| | | | | | | | | |
Total Industrials | | | | | | | 2,294,625 | |
| | |
| | | | | | | | |
INFORMATION TECHNOLOGY 1.5% | |
Electronic Equipment, Instruments & Components 1.0% | |
| | |
Belden, Inc., 6.750% | | | 43,500 | | | | 4,656,675 | |
|
Internet Software & Services 0.5% | |
| | |
Mandatory Exchangeable Trust, 5.750%(a) | | | 20,000 | | | | 2,309,200 | |
| |
Total Information Technology | | | | | | | 6,965,875 | |
| | |
| | | | | | | | |
MATERIALS 0.5% | |
Chemicals 0.5% | |
| | |
A. Schulman, Inc., 6.000% | | | 2,600 | | | | 2,296,996 | |
| |
Total Materials | | | | | | | 2,296,996 | |
| | |
| | | | | | | | |
TELECOMMUNICATION SERVICES 1.2% | |
Diversified Telecommunication Services 0.7% | |
| | |
Frontier Communications Corp., 11.125% | | | 40,000 | | | | 3,072,800 | |
|
Wireless Telecommunication Services 0.5% | |
| | |
T-Mobile USA, Inc., 5.500% | | | 25,000 | | | | 2,229,500 | |
| |
Total Telecommunication Services | | | | 5,302,300 | |
| | |
| | | | | | | | |
UTILITIES 2.0% | |
Electric Utilities 1.0% | |
| | |
Great Plains Energy, Inc., 7.000% | | | 90,000 | | | | 4,432,500 | |
The accompanying Notes to Financial Statements are an integral part of this statement.
| | | | | | |
| | |
| | | | COLUMBIA FLEXIBLE CAPITAL INCOME FUND | | |
PORTFOLIO OF INVESTMENTS (continued)
November 30, 2016 (Unaudited)
| | | | | | | | |
| Convertible Preferred Stocks (continued) | |
| Issuer | | Shares | | | Value ($) | |
Multi-Utilities 1.0% | |
| | |
DTE Energy Co., 6.500% | | | 91,000 | | | | 4,725,530 | |
| |
Total Utilities | | | | | | | 9,158,030 | |
| | |
| | | | | | | | |
REAL ESTATE 1.3% | |
Equity Real Estate Investment Trusts (REITs) 1.3% | |
| | |
Alexandria Real Estate Equities, Inc., 7.000% | | | 53,477 | | | | 1,846,561 | |
| | |
American Tower Corp., 5.500% | | | 40,000 | | | | 4,071,200 | |
| |
Total | | | | | | | 5,917,761 | |
| |
Total Real Estate | | | | | | | 5,917,761 | |
| |
Total Convertible Preferred Stocks | | | | | |
(Cost: $64,243,851) | | | | | | | 63,282,081 | |
| | |
| | | | | | | | |
| Limited Partnerships 1.7% | |
ENERGY 0.5% | |
Oil, Gas & Consumable Fuels 0.5% | |
| | |
Enviva Partners LP | | | 80,000 | | | | 2,256,000 | |
| |
Total Energy | | | | | | | 2,256,000 | |
| | |
| | | | | | | | |
INDUSTRIALS 0.5% | |
Trading Companies & Distributors 0.5% | |
| | |
Fortress Transportation & Infrastructure Investors LLC | | | 180,000 | | | | 2,412,000 | |
| |
Total Industrials | | | | | | | 2,412,000 | |
| | |
| | | | | | | | |
UTILITIES 0.7% | |
Independent Power and Renewable Electricity Producers 0.7% | |
| | |
8Point3 Energy Partners LP | | | 240,000 | | | | 3,067,200 | |
| |
Total Utilities | | | | | | | 3,067,200 | |
| |
Total Limited Partnerships | | | | | | | | |
(Cost: $8,849,205) | | | | | | | 7,735,200 | |
| | | | | | | | | | | | |
| | | |
| | | | | | | | | | | | |
| Corporate Bonds & Notes 24.7% | |
| Issuer | | Coupon
Rate | | | Principal
Amount ($) | | | Value ($) | |
AEROSPACE & DEFENSE 1.4% | |
ADS Tactical, Inc.(a) | |
04/01/18 | | | 11.000% | | | | 6,398,000 | | | | 6,541,955 | |
|
| |
BANKING 1.6% | |
Popular, Inc. | |
07/01/19 | | | 7.000% | | | | 4,500,000 | | | | 4,612,500 | |
|
Synovus Financial Corp.
Subordinated(b) | |
12/15/25 | | | 5.750% | | | | 2,700,000 | | | | 2,787,750 | |
| | | | | | | | | | | | | |
Total | | | | | | | | | | | 7,400,250 | |
| | | | | | | | | | | | |
| Corporate Bonds & Notes (continued) | |
| Issuer | | Coupon
Rate | | | Principal
Amount ($) | | | Value ($) | |
CABLE AND SATELLITE 1.8% | |
Charter Communications Operating LLC/Capital(a) | |
10/23/45 | | | 6.484% | | | | 3,800,000 | | | | 4,269,418 | |
|
Telesat Canada/LLC(a) | |
11/15/24 | | | 8.875% | | | | 3,600,000 | | | | 3,676,500 | |
| | | | | | | | | | | | | |
Total | | | | | | | | | | | 7,945,918 | |
|
| |
CHEMICALS 0.5% | |
A. Schulman, Inc.(a) | |
06/01/23 | | | 6.875% | | | | 2,300,000 | | | | 2,346,000 | |
|
| |
DIVERSIFIED MANUFACTURING 1.9% | |
Gardner Denver, Inc.(a) | |
08/15/21 | | | 6.875% | | | | 4,600,000 | | | | 4,531,000 | |
|
Hamilton Sundstrand Corp.(a) | |
12/15/20 | | | 7.750% | | | | 5,350,000 | | | | 4,186,375 | |
| | | | | | | | | | | | | |
Total | | | | | | | | | | | 8,717,375 | |
|
| |
FOOD AND BEVERAGE 0.5% | |
Lamb Weston Holdings, Inc.(a) | |
11/01/26 | | | 4.875% | | | | 2,250,000 | | | | 2,238,750 | |
|
| |
GAMING 1.0% | |
Scientific Games International, Inc. | |
12/01/22 | | | 10.000% | | | | 5,000,000 | | | | 4,687,500 | |
|
| |
HEALTH CARE 0.7% | |
Envision Healthcare Corp.(a)(c) | |
12/01/24 | | | 6.250% | | | | 1,678,000 | | | | 1,736,730 | |
| | | |
Quotient Ltd.(a)(d) | | | | | | | | | | | | |
10/15/23 | | | 12.000% | | | | 1,330,000 | | | | 1,330,000 | |
| | | | | | | | | | | | | |
Total | | | | | | | | | | | 3,066,730 | |
|
| |
HEALTHCARE INSURANCE 0.5% | |
Centene Corp. | |
01/15/25 | | | 4.750% | | | | 2,523,000 | | | | 2,415,773 | |
|
| |
INDEPENDENT ENERGY 1.7% | |
Goodrich Petroleum Corp.(e) | |
03/15/18 | | | 0.000% | | | | 1,676,000 | | | | 234,640 | |
03/15/19 | | | 0.000% | | | | 3,775,000 | | | | 5,285 | |
|
Stone Energy Corp.(e) | |
11/15/22 | | | 7.500% | | | | 5,800,000 | | | | 3,139,250 | |
|
Whiting Petroleum Corp. | |
10/01/18 | | | 6.500% | | | | 4,100,000 | | | | 4,107,687 | |
| | | | | | | | | | | | | |
Total | | | | | | | | | | | 7,486,862 | |
| | | |
| | | | | | | | | | | | |
MEDIA AND ENTERTAINMENT 1.5% | |
AMC Networks, Inc. | |
04/01/24 | | | 5.000% | | | | 2,123,000 | | | | 2,128,307 | |
The accompanying Notes to Financial Statements are an integral part of this statement.
| | | | | | |
| | |
| | | | COLUMBIA FLEXIBLE CAPITAL INCOME FUND | | |
PORTFOLIO OF INVESTMENTS (continued)
November 30, 2016 (Unaudited)
| | | | | | | | | | | | |
| Corporate Bonds & Notes (continued) | |
| Issuer | | Coupon
Rate | | | Principal
Amount ($) | | | Value ($) | |
Lions Gate Entertainment Corp.(a) | |
11/01/24 | | | 5.875% | | | | 4,450,000 | | | | 4,427,750 | |
| | | | | | | | | | | | | |
Total | | | | | | | | | | | 6,556,057 | |
|
| |
MIDSTREAM 1.0% | |
Blue Racer Midstream LLC/Finance Corp.(a) | | | | | |
11/15/22 | | | 6.125% | | | | 4,594,000 | | | | 4,479,150 | |
|
| |
OIL FIELD SERVICES 0.5% | |
Precision Drilling Corp.(a) | | | | | | | | | | | | |
12/15/23 | | | 7.750% | | | | 2,250,000 | | | | 2,283,750 | |
|
| |
OTHER INDUSTRY 1.0% | |
MasTec, Inc. | | | | | | | | | | | | |
03/15/23 | | | 4.875% | | | | 4,600,000 | | | | 4,496,500 | |
|
| |
PHARMACEUTICALS 1.9% | |
AMAG Pharmaceuticals, Inc.(a) | | | | | | | | | |
09/01/23 | | | 7.875% | | | | 4,800,000 | | | | 4,560,000 | |
|
Valeant Pharmaceuticals International, Inc.(a) | |
03/01/23 | | | 5.500% | | | | 5,400,000 | | | | 3,969,000 | |
| | | | | | | | | | | | | |
Total | | | | | | | | | | | 8,529,000 | |
|
| |
PROPERTY & CASUALTY 0.5% | |
MGIC Investment Corp. | | | | | | | | | | | | |
08/15/23 | | | 5.750% | | | | 2,200,000 | | | | 2,282,500 | |
|
| |
RETAILERS 0.4% | |
Rite Aid Corp.
Junior Subordinated | | | | | | | | | | | | |
02/15/27 | | | 7.700% | | | | 1,613,000 | | | | 1,992,055 | |
|
| |
SUPERMARKETS 1.0% | |
Safeway, Inc. | | | | | | | | | | | | |
02/01/31 | | | 7.250% | | | | 4,588,000 | | | | 4,450,360 | |
|
| |
TECHNOLOGY 4.0% | |
Alliance Data Systems Corp.(a) | | | | | |
11/01/21 | | | 5.875% | | | | 4,550,000 | | | | 4,561,375 | |
|
Diebold, Inc. | |
04/15/24 | | | 8.500% | | | | 4,300,000 | | | | 4,495,650 | |
|
Genesys Telecommunications Laboratories, Inc./Greeneden Lux 3 Sarl/US Holdings I, LLC(a)(c) | |
11/30/24 | | | 10.000% | | | | 2,250,000 | | | | 2,356,875 | |
|
Informatica LLC(a) | |
07/15/23 | | | 7.125% | | | | 2,382,000 | | | | 2,250,990 | |
|
Micron Technology, Inc. | |
02/01/25 | | | 5.500% | | | | 2,300,000 | | | | 2,259,750 | |
|
Western Digital Corp.(a) | |
04/01/24 | | | 10.500% | | | | 2,000,000 | | | | 2,315,000 | |
| | | | | | | | | | | | | |
Total | | | | | | | | | | | 18,239,640 | |
| | | | | | | | | | | | |
| Corporate Bonds & Notes (continued) | |
| Issuer | | Coupon
Rate | | | Principal
Amount ($) | | | Value ($) | |
WIRELINES 1.3% | |
Frontier Communications Corp. | |
09/15/25 | | | 11.000% | | | | 5,640,000 | | | | 5,654,100 | |
| | | | | | | | | | | | | |
Total Corporate Bonds & Notes | |
(Cost: $116,778,282) | | | | | | | | | | | 111,810,225 | |
| | | |
| | | | | | | | | | | | |
| Convertible Bonds 18.9% | |
AUTOMOTIVE 1.5% | |
Navistar International Corp. | | | | | | | | | | | | |
04/15/19 | | | 4.750% | | | | 7,051,000 | | | | 6,764,553 | |
|
| |
CABLE AND SATELLITE 1.0% | |
DISH Network Corp.(a) | | | | | | | | | | | | |
08/15/26 | | | 3.375% | | | | 4,150,000 | | | | 4,645,137 | |
|
| |
CONSUMER PRODUCTS 1.1% | |
Iconix Brand Group, Inc. | | | | | | | | | | | | |
03/15/18 | | | 1.500% | | | | 5,500,000 | | | | 5,005,000 | |
|
| |
ELECTRIC 0.6% | |
SunPower Corp.(a) | | | | | | | | | | | | |
01/15/23 | | | 4.000% | | | | 3,620,000 | | | | 2,586,490 | |
|
| |
HEALTH CARE 1.2% | |
Fluidigm Corp. | | | | | | | | | | | | |
02/01/34 | | | 2.750% | | | | 4,000,000 | | | | 2,414,848 | |
|
Invacare Corp.(a) | |
02/15/21 | | | 5.000% | | | | 2,300,000 | | | | 2,234,450 | |
|
Novavax, Inc.(a) | |
02/01/23 | | | 3.750% | | | | 2,140,000 | | | | 903,508 | |
| | | | | | | | | | | | | |
Total | | | | | | | | | | | 5,552,806 | |
|
| |
INDEPENDENT ENERGY 1.6% | |
Chesapeake Energy Corp. | | | | | | | | | | | | |
12/15/38 | | | 2.250% | | | | 2,350,000 | | | | 2,223,688 | |
|
Chesapeake Energy Corp.(a) | |
09/15/26 | | | 5.500% | | | | 4,900,000 | | | | 5,131,672 | |
| | | | | | | | | | | | | |
Total | | | | | | | | | | | 7,355,360 | |
|
| |
MEDIA AND ENTERTAINMENT 0.4% | |
Liberty Interactive LLC(a) | | | | | | | | | | | | |
09/30/46 | | | 1.750% | | | | 1,855,000 | | | | 1,959,344 | |
|
| |
OIL FIELD SERVICES 0.9% | |
Cobalt International Energy, Inc. | |
12/01/19 | | | 2.625% | | | | 4,000,000 | | | | 1,713,496 | |
|
Weatherford International Ltd. | |
07/01/21 | | | 5.875% | | | | 2,070,000 | | | | 2,240,775 | |
| | | | | | | | | | | | | |
Total | | | | | | | | | | | 3,954,271 | |
The accompanying Notes to Financial Statements are an integral part of this statement.
| | | | | | |
| | |
| | | | COLUMBIA FLEXIBLE CAPITAL INCOME FUND | | |
PORTFOLIO OF INVESTMENTS (continued)
November 30, 2016 (Unaudited)
| | | | | | | | | | | | |
| Convertible Bonds (continued) | | | | | |
| Issuer | | Coupon
Rate | | | Principal
Amount ($) | | | Value ($) | |
OTHER FINANCIAL INSTITUTIONS 0.7% | |
Walter Investment Management Corp. | |
11/01/19 | | | 4.500% | | | | 4,410,000 | | | | 3,001,556 | |
| | | |
| | | | | | | | | | | | |
OTHER INDUSTRY 1.3% | |
General Cable Corp. Subordinated(b) | | | | | | | | | | | | |
11/15/29 | | | 4.500% | | | | 4,550,000 | | | | 3,466,531 | |
| | | |
Green Plains, Inc.(a) | | | | | | | | | | | | |
09/01/22 | | | 4.125% | | | | 2,000,000 | | | | 2,325,000 | |
| | | | | | | | | | | | | |
Total | | | | | | | | | | | 5,791,531 | |
| | | |
| | | | | | | | | | | | |
OTHER REIT 0.6% | |
Blackstone Mortgage Trust, Inc. | |
12/01/18 | | | 5.250% | | | | 2,560,000 | | | | 2,848,486 | |
| | | |
| | | | | | | | | | | | |
PHARMACEUTICALS 2.9% | |
ARIAD Pharmaceuticals, Inc.(a) | | | | | |
06/15/19 | | | 3.625% | | | | 1,400,000 | | | | 2,228,506 | |
| | | |
Acorda Therapeutics, Inc. | | | | | | | | | | | | |
06/15/21 | | | 1.750% | | | | 2,950,000 | | | | 2,313,906 | |
| |
Aegerion Pharmaceuticals, Inc. | | | | | |
08/15/19 | | | 2.000% | | | | 3,350,000 | | | | 2,339,640 | |
| |
Intercept Pharmaceuticals, Inc. | | | | | |
07/01/23 | | | 3.250% | | | | 2,500,000 | | | | 2,235,938 | |
| | | |
Medicines Co. (The)(a) | | | | | | | | | | | | |
07/15/23 | | | 2.750% | | | | 2,300,000 | | | | 2,255,437 | |
| | | |
PTC Therapeutics, Inc. | | | | | | | | | | | | |
08/15/22 | | | 3.000% | | | | 3,000,000 | | | | 1,719,375 | |
| | | | | | | | | | | | | |
Total | | | | | | | | | | | 13,092,802 | |
| | | |
| | | | | | | | | | | | |
PROPERTY & CASUALTY 1.0% | |
MGIC Investment Corp.
Junior Subordinated(a)(b) | | | | | | | | | | | | |
04/01/63 | | | 9.000% | | | | 3,800,000 | | | | 4,683,500 | |
| | | |
| | | | | | | | | | | | |
REFINING 0.5% | |
Clean Energy Fuels Corp.(a) | | | | | | | | | | | | |
10/01/18 | | | 5.250% | | | | 2,750,000 | | | | 2,315,156 | |
| | | |
| | | | | | | | | | | | |
RETAILERS 0.3% | |
GNC Holdings, Inc.(a) | | | | | | | | | | | | |
08/15/20 | | | 1.500% | | | | 1,800,000 | | | | 1,379,250 | |
| | | | | | | | | | | | |
| Convertible Bonds (continued) | | | | | |
| Issuer | | Coupon
Rate | | | Principal
Amount ($) | | | Value ($) | |
TECHNOLOGY 2.0% | |
Cypress Semiconductor Corp.(a) | | | | | |
01/15/22 | | | 4.500% | | | | 2,200,000 | | | | 2,457,125 | |
| | | |
Microchip Technology, Inc. | | | | | | | | | | | | |
02/15/25 | | | 1.625% | | | | 3,100,000 | | | | 4,111,375 | |
| | | |
Micron Technology, Inc. | | | | | | | | | | | | |
02/15/33 | | | 2.125% | | | | 1,200,000 | | | | 2,288,250 | |
| | | | | | | | | | | | | |
Total | | | | | | | | | | | 8,856,750 | |
| | | |
| | | | | | | | | | | | |
TOBACCO 0.8% | |
Vector Group Ltd.(b) | | | | | | | | | | | | |
04/15/20 | | | 1.750% | | | | 3,100,000 | | | | 3,484,121 | |
| | | |
| | | | | | | | | | | | |
TRANSPORTATION SERVICES 0.5% | |
Ship Finance International Ltd. | | | | | |
10/15/21 | | | 5.750% | | | | 2,350,000 | | | | 2,304,469 | |
| | | | | | | | | | | | | |
Total Convertible Bonds | | | | | | | | | | | | |
(Cost: $89,700,686) | | | | | | | | | | | 85,580,582 | |
| | | |
| | | | | | | | | | | | |
| Preferred Debt 2.0% | |
BANKING 2.0% | |
Citigroup Capital XIII(b) | | | | | | | | | | | | |
10/30/40 | | | 6.692% | | | | 175,000 | | | | 4,546,500 | |
| | | |
Wells Fargo & Co. | | | | | | | | | | | | |
12/31/49 | | | 7.500% | | | | 3,700 | | | | 4,448,769 | |
| | | | | | | | | | | | | |
Total | | | | | | | | | | | 8,995,269 | |
| | | | | | | | | | | | | |
Total Preferred Debt | | | | | | | | | | | | |
(Cost: $8,831,135) | | | | | | | | | | | 8,995,269 | |
| | | |
| | | | | | | | | | | | |
| Money Market Funds 2.5% | |
| | | | | | Shares | | | Value ($) | |
JPMorgan U.S. Government Money Market Fund, Agency Shares, 0.183%(f) | | | | | | | 11,371,621 | | | | 11,371,621 | |
| | | | | | | | | | | | | |
Total Money Market Funds | | | | | | | | | | | | |
(Cost: $11,371,621) | | | | | | | | | | | 11,371,621 | |
| | | | | | | | | | | | | |
Total Investments | | | | | | | | | | | | |
(Cost: $449,088,969) | | | | | | | | | | | 454,291,632 | |
| | | | | | | | | | | | | |
Other Assets & Liabilities, Net | | | | | | | | (1,290,641 | ) |
| | | | | | | | | | | | | |
Net Assets | | | | | | | | | | | 453,000,991 | |
| | | | | | | | | | | | | |
Notes to Portfolio of Investments
| (a) | Represents privately placed and other securities and instruments exempt from SEC registration (collectively, private placements), such as Section 4(a)(2) and Rule 144A eligible securities, which are often sold only to qualified institutional buyers. The Fund may invest in private placements determined to be liquid as well as those determined to be illiquid. Private placements may be determined to be liquid under guidelines established by the Fund’s Board of Trustees. At November 30, 2016, the value of these securities amounted to $99,474,393 or 21.96% of net assets. |
| (b) | Variable rate security. |
| (c) | Security, or a portion thereof, has been purchased on a when-issued or delayed delivery basis. |
The accompanying Notes to Financial Statements are an integral part of this statement.
| | |
| 10 | | Semiannual Report 2016 |
| | | | | | |
| | |
| | | | COLUMBIA FLEXIBLE CAPITAL INCOME FUND | | |
PORTFOLIO OF INVESTMENTS (continued)
November 30, 2016 (Unaudited)
Notes to Portfolio of Investments (continued)
| (d) | Represents fair value as determined in good faith under procedures approved by the Board of Trustees. At November 30, 2016, the value of these securities amounted to $1,330,000, which represents 0.29% of net assets. |
| (e) | Represents securities that have defaulted on payment of interest. The Fund has stopped accruing interest on these securities. At November 30, 2016, the value of these securities amounted to $3,379,175, which represents 0.75% of net assets. |
| (f) | The rate shown is the seven-day current annualized yield at November 30, 2016. |
Abbreviation Legend
| | |
| ADR | | American Depositary Receipt |
Fair Value Measurements
The Fund categorizes its fair value measurements according to a three-level hierarchy that maximizes the use of observable inputs and minimizes the use of unobservable inputs by prioritizing that the most observable input be used when available. Observable inputs are those that market participants would use in pricing an investment based on market data obtained from sources independent of the reporting entity. Unobservable inputs are those that reflect the Fund’s assumptions about the information market participants would use in pricing an investment. An investment’s level within the fair value hierarchy is based on the lowest level of any input that is deemed significant to the asset’s or liability’s fair value measurement. The input levels are not necessarily an indication of the risk or liquidity associated with investments at that level. For example, certain U.S. government securities are generally high quality and liquid, however, they are reflected as Level 2 because the inputs used to determine fair value may not always be quoted prices in an active market.
Fair value inputs are summarized in the three broad levels listed below:
| ∎ | | Level 1 — Valuations based on quoted prices for investments in active markets that the Fund has the ability to access at the measurement date (including NAV for open-end mutual funds). Valuation adjustments are not applied to Level 1 investments. |
| ∎ | | Level 2 — Valuations based on other significant observable inputs (including quoted prices for similar securities, interest rates, prepayment speeds, credit risks, etc.). |
| ∎ | | Level 3 — Valuations based on significant unobservable inputs (including the Fund’s own assumptions and judgment in determining the fair value of investments). |
Inputs that are used in determining fair value of an investment may include price information, credit data, volatility statistics, and other factors. These inputs can be either observable or unobservable. The availability of observable inputs can vary between investments, and is affected by various factors such as the type of investment, and the volume and level of activity for that investment or similar investments in the marketplace. The inputs will be considered by the Investment Manager, along with any other relevant factors in the calculation of an investment’s fair value. The Fund uses prices and inputs that are current as of the measurement date, which may include periods of market dislocations. During these periods, the availability of prices and inputs may be reduced for many investments. This condition could cause an investment to be reclassified between the various levels within the hierarchy.
Investments falling into the Level 3 category are primarily supported by quoted prices from brokers and dealers participating in the market for those investments. However, these may be classified as Level 3 investments due to lack of market transparency and corroboration to support these quoted prices. Additionally, valuation models may be used as the pricing source for any remaining investments classified as Level 3. These models may rely on one or more significant unobservable inputs and/or significant assumptions by the Investment Manager. Inputs used in valuations may include, but are not limited to, financial statement analysis, capital account balances, discount rates and estimated cash flows, and comparable company data.
Under the direction of the Fund’s Board of Trustees (the Board), the Investment Manager’s Valuation Committee (the Committee) is responsible for overseeing the valuation procedures approved by the Board. The Committee consists of voting and non-voting members from various groups within the Investment Manager’s organization, including operations and accounting, trading and investments, compliance, risk management and legal.
The Committee meets at least monthly to review and approve valuation matters, which may include a description of specific valuation determinations, data regarding pricing information received from approved pricing vendors and brokers and the results of Board-approved valuation control policies and procedures (the Policies). The Policies address, among other things, instances when market quotations are or are not readily available, including recommendations of third party pricing vendors and a determination of appropriate pricing methodologies; events that require specific valuation determinations and assessment of fair value techniques; securities with a potential for stale pricing, including those that are illiquid, restricted, or in default; and the effectiveness of third party pricing vendors, including periodic reviews of vendors. The Committee meets more frequently, as needed, to discuss additional valuation matters, which may include the need to review back-testing results, review time-sensitive information or approve related valuation actions. The Committee reports to the Board, with members of the Committee meeting with the Board at each of its regularly scheduled meetings to discuss valuation matters and actions during the period, similar to those described earlier.
For investments categorized as Level 3, the Committee monitors information similar to that described above, which may include: (i) data specific to the issuer or comparable issuers, (ii) general market or specific sector news and (iii) quoted prices and specific or similar security transactions. The Committee considers this data and any changes from prior periods in order to assess the reasonableness of observable and unobservable inputs, any assumptions or internal models used to value those securities and changes in fair value. This data is also used to corroborate, when available, information received from approved pricing vendors and brokers. Various factors impact the frequency of monitoring this information (which may occur as often as daily). However, the Committee may determine that changes to inputs, assumptions and models are not required as a result of the monitoring procedures performed.
The accompanying Notes to Financial Statements are an integral part of this statement.
| | | | |
| Semiannual Report 2016 | | | 11 | |
| | | | | | |
| | |
| | | | COLUMBIA FLEXIBLE CAPITAL INCOME FUND | | |
PORTFOLIO OF INVESTMENTS (continued)
November 30, 2016 (Unaudited)
Fair Value Measurements (continued)
The following table is a summary of the inputs used to value the Fund’s investments at November 30, 2016:
| | | | | | | | | | | | | | | | |
| | | Level 1
Quoted Prices in Active
Markets for Identical
Assets ($) | | | Level 2
Other Significant
Observable Inputs ($) | | | Level 3
Significant
Unobservable Inputs ($) | | | Total ($) | |
Investments | | | | | | | | | | | | | | | | |
| | | | |
Common Stocks | | | | | | | | | | | | | | | | |
| | | | |
Consumer Discretionary | | | 11,062,700 | | | | — | | | | — | | | | 11,062,700 | |
| | | | |
Consumer Staples | | | 12,418,835 | | | | — | | | | — | | | | 12,418,835 | |
| | | | |
Energy | | | 13,929,750 | | | | — | | | | — | | | | 13,929,750 | |
| | | | |
Financials | | | 34,968,900 | | | | — | | | | — | | | | 34,968,900 | |
| | | | |
Health Care | | | 16,199,725 | | | | — | | | | — | | | | 16,199,725 | |
| | | | |
Industrials | | | 11,262,125 | | | | — | | | | — | | | | 11,262,125 | |
| | | | |
Information Technology | | | 38,399,415 | | | | — | | | | — | | | | 38,399,415 | |
| | | | |
Materials | | | 5,014,800 | | | | — | | | | — | | | | 5,014,800 | |
| | | | |
Real Estate | | | 8,928,204 | | | | — | | | | — | | | | 8,928,204 | |
| | | | |
Telecommunication Services | | | 4,442,450 | | | | — | | | | — | | | | 4,442,450 | |
| | | | |
Utilities | | | 8,889,750 | | | | — | | | | — | | | | 8,889,750 | |
| | | | | | | | | | | | | | | | | |
Total Common Stocks | | | 165,516,654 | | | | — | | | | — | | | | 165,516,654 | |
| | | | | | | | | | | | | | | | | |
Convertible Preferred Stocks | | | | | | | | | | | | | | | | |
| | | | |
Consumer Staples | | | — | | | | 4,709,459 | | | | — | | | | 4,709,459 | |
| | | | |
Energy | | | 8,401,000 | | | | — | | | | — | | | | 8,401,000 | |
| | | | |
Financials | | | 4,332,700 | | | | 6,057,772 | | | | — | | | | 10,390,472 | |
| | | | |
Health Care | | | 7,845,563 | | | | — | | | | — | | | | 7,845,563 | |
| | | | |
Industrials | | | 2,294,625 | | | | — | | | | — | | | | 2,294,625 | |
| | | | |
Information Technology | | | 4,656,675 | | | | 2,309,200 | | | | — | | | | 6,965,875 | |
| | | | |
Materials | | | — | | | | 2,296,996 | | | | — | | | | 2,296,996 | |
| | | | |
Telecommunication Services | | | 5,302,300 | | | | — | | | | — | | | | 5,302,300 | |
| | | | |
Utilities | | | — | | | | 9,158,030 | | | | — | | | | 9,158,030 | |
| | | | |
Real Estate | | | 5,917,761 | | | | — | | | | — | | | | 5,917,761 | |
| | | | | | | | | | | | | | | | | |
Total Convertible Preferred Stocks | | | 38,750,624 | | | | 24,531,457 | | | | — | | | | 63,282,081 | |
| | | | | | | | | | | | | | | | | |
Limited Partnerships | | | | | | | | | | | | | | | | |
| | | | |
Energy | | | 2,256,000 | | | | — | | | | — | | | | 2,256,000 | |
| | | | |
Industrials | | | 2,412,000 | | | | — | | | | — | | | | 2,412,000 | |
| | | | |
Utilities | | | 3,067,200 | | | | — | | | | — | | | | 3,067,200 | |
| | | | | | | | | | | | | | | | | |
Total Limited Partnerships | | | 7,735,200 | | | | — | | | | — | | | | 7,735,200 | |
| | | | | | | | | | | | | | | | | |
Corporate Bonds & Notes | | | — | | | | 110,480,225 | | | | 1,330,000 | | | | 111,810,225 | |
| | | | |
Convertible Bonds | | | — | | | | 85,580,582 | | | | — | | | | 85,580,582 | |
| | | | |
Preferred Debt | | | 8,995,269 | | | | — | | | | — | | | | 8,995,269 | |
| | | | |
Money Market Funds | | | 11,371,621 | | | | — | | | | — | | | | 11,371,621 | |
| | | | | | | | | | | | | | | | | |
Total Investments | | | 232,369,368 | | | | 220,592,264 | | | | 1,330,000 | | | | 454,291,632 | |
| | | | | | | | | | | | | | | | | |
See the Portfolio of Investments for all investment classifications not indicated in the table.
The Fund’s assets assigned to the Level 2 input category are generally valued using the market approach, in which a security’s value is determined through reference to prices and information from market transactions for similar or identical assets.
Financial assets were transferred from Level 2 to Level 1 as the market for these assets was deemed to be active during the period and fair values were consequently obtained using quoted prices for identical assets rather than being based upon other observable market inputs as of period end.
The accompanying Notes to Financial Statements are an integral part of this statement.
| | |
| 12 | | Semiannual Report 2016 |
| | | | | | |
| | |
| | | | COLUMBIA FLEXIBLE CAPITAL INCOME FUND | | |
PORTFOLIO OF INVESTMENTS (continued)
November 30, 2016 (Unaudited)
Fair Value Measurements (continued)
The following table shows transfers between Level 1 and Level 2 of the fair value hierarchy:
| | | | | | |
| Transfers In | | Transfers Out |
| Level 1 ($) | | Level 2 ($) | | Level 1 ($) | | Level 2 ($) |
| 3,029,375 | | — | | — | | 3,029,375 |
| | | | | | | |
Transfers between Level 1 and Level 2 are determined based on the fair value at the beginning of the period for security positions held throughout the period.
The Fund does not hold any significant investments (greater than one percent of net assets) categorized as Level 3.
The Fund’s assets assigned to the Level 3 category are valued utilizing the valuation technique deemed the most appropriate in the circumstances. Certain Corporate Bonds classified as Level 3 are valued using the market approach and utilize single market quotations from broker dealers which may have included, but not limited to, the distressed nature of the security and observable transactions for similar assets in the market. Significant increases (decreases) to any of these inputs would result in a significantly lower (higher) fair value measurement.
There were no transfers of financial assets between Levels 2 and 3 during the period.
The accompanying Notes to Financial Statements are an integral part of this statement.
| | | | |
| Semiannual Report 2016 | | | 13 | |
| | | | | | |
| | |
| | | | COLUMBIA FLEXIBLE CAPITAL INCOME FUND | | |
STATEMENT OF ASSETS AND LIABILITIES
November 30, 2016 (Unaudited)
| | | | |
Assets | | | | |
| |
Investments, at value (identified cost $449,088,969) | | | $454,291,632 | |
| |
Receivable for: | | | | |
| |
Investments sold | | | 6,397,425 | |
| |
Capital shares sold | | | 590,721 | |
| |
Dividends | | | 928,299 | |
| |
Interest | | | 2,770,232 | |
| |
Foreign tax reclaims | | | 1,889 | |
| |
Prepaid expenses | | | 3,024 | |
| |
Other assets | | | 41,600 | |
| |
Total assets | | | 465,024,822 | |
| |
| |
Liabilities | | | | |
| |
Payable for: | | | | |
| |
Investments purchased | | | 5,819,072 | |
| |
Investments purchased on a delayed delivery basis | | | 3,928,000 | |
| |
Capital shares purchased | | | 2,144,181 | |
| |
Management services fees | | | 8,038 | |
| |
Distribution and/or service fees | | | 4,893 | |
| |
Transfer agent fees | | | 38,365 | |
| |
Compensation of board members | | | 25,789 | |
| |
Chief compliance officer expenses | | | 33 | |
| |
Other expenses | | | 55,460 | |
| |
Total liabilities | | | 12,023,831 | |
| |
Net assets applicable to outstanding capital stock | | | $453,000,991 | |
| |
| |
Represented by | | | | |
| |
Paid-in capital | | | $482,819,923 | |
| |
Excess of distributions over net investment income | | | (1,566,851 | ) |
| |
Accumulated net realized loss | | | (33,454,744 | ) |
| |
Unrealized appreciation (depreciation) on: | | | | |
| |
Investments | | | 5,202,663 | |
| |
Total — representing net assets applicable to outstanding capital stock | | | $453,000,991 | |
| |
The accompanying Notes to Financial Statements are an integral part of this statement.
| | |
| 14 | | Semiannual Report 2016 |
| | | | | | |
| | |
| | | | COLUMBIA FLEXIBLE CAPITAL INCOME FUND | | |
STATEMENT OF ASSETS AND LIABILITIES (continued)
November 30, 2016 (Unaudited)
| | | | |
| |
Class A | | | | |
| |
Net assets | | | $233,242,658 | |
| |
Shares outstanding | | | 19,654,828 | |
| |
Net asset value per share | | | $11.87 | |
| |
Maximum offering price per share(a) | | | $12.59 | |
| |
Class C | | | | |
| |
Net assets | | | $120,601,377 | |
| |
Shares outstanding | | | 10,223,970 | |
| |
Net asset value per share | | | $11.80 | |
| |
Class I | | | | |
| |
Net assets | | | $2,502 | |
| |
Shares outstanding | | | 210 | |
| |
Net asset value per share(b) | | | $11.90 | |
| |
Class R | | | | |
| |
Net assets | | | $328,278 | |
| |
Shares outstanding | | | 27,689 | |
| |
Net asset value per share | | | $11.86 | |
| |
Class R4 | | | | |
| |
Net assets | | | $16,295,806 | |
| |
Shares outstanding | | | 1,363,172 | |
| |
Net asset value per share | | | $11.95 | |
| |
Class R5 | | | | |
| |
Net assets | | | $5,209,224 | |
| |
Shares outstanding | | | 435,443 | |
| |
Net asset value per share | | | $11.96 | |
| |
Class W | | | | |
| |
Net assets | | | $6,293 | |
| |
Shares outstanding | | | 530 | |
| |
Net asset value per share | | | $11.87 | |
| |
Class Z | | | | |
| |
Net assets | | | $77,314,853 | |
| |
Shares outstanding | | | 6,515,057 | |
| |
Net asset value per share | | | $11.87 | |
| |
| (a) | The maximum offering price per share is calculated by dividing the net asset value per share by 1.0 minus the maximum sales charge of 5.75%. |
| (b) | Net asset value per share rounds to this amount due to fractional shares outstanding. |
The accompanying Notes to Financial Statements are an integral part of this statement.
| | | | |
| Semiannual Report 2016 | | | 15 | |
| | | | | | |
| | |
| | | | COLUMBIA FLEXIBLE CAPITAL INCOME FUND | | |
STATEMENT OF OPERATIONS
Six Months Ended November 30, 2016 (Unaudited)
| | | | |
Net investment income | | | | |
| |
Income: | | | | |
| |
Dividends | | | $6,555,399 | |
| |
Interest | | | 7,083,301 | |
| |
Foreign taxes withheld | | | (35,956 | ) |
| |
Total income | | | 13,602,744 | |
| |
| |
Expenses: | | | | |
| |
Management services fees | | | 1,475,248 | |
| |
Distribution and/or service fees | | | | |
| |
Class A | | | 293,192 | |
| |
Class C | | | 596,590 | |
| |
Class R | | | 790 | |
| |
Class W | | | 8 | |
| |
Transfer agent fees | | | | |
| |
Class A | | | 136,486 | |
| |
Class C | | | 69,380 | |
| |
Class R | | | 183 | |
| |
Class R4 | | | 9,074 | |
| |
Class R5 | | | 1,261 | |
| |
Class W | | | 3 | |
| |
Class Z | | | 45,936 | |
| |
Compensation of board members | | | 8,924 | |
| |
Custodian fees | | | 3,799 | |
| |
Printing and postage fees | | | 30,223 | |
| |
Registration fees | | | 53,514 | |
| |
Audit fees | | | 17,513 | |
| |
Legal fees | | | 6,312 | |
| |
Chief compliance officer expenses | | | 33 | |
| |
Other | | | 8,756 | |
| |
Total expenses | | | 2,757,225 | |
| |
Net investment income | | | 10,845,519 | |
| |
| |
Realized and unrealized gain (loss) — net | | | | |
| |
Net realized gain (loss) on: | | | | |
| |
Investments | | | 5,762,102 | |
| |
Foreign currency translations | | | 42 | |
| |
Net realized gain | | | 5,762,144 | |
| |
Net change in unrealized appreciation (depreciation) on: | | | | |
| |
Investments | | | 26,152,913 | |
| |
Net change in unrealized appreciation | | | 26,152,913 | |
| |
Net realized and unrealized gain | | | 31,915,057 | |
| |
Net increase in net assets resulting from operations | | | $42,760,576 | |
| |
The accompanying Notes to Financial Statements are an integral part of this statement.
| | |
| 16 | | Semiannual Report 2016 |
| | | | | | |
| | |
| | | | COLUMBIA FLEXIBLE CAPITAL INCOME FUND | | |
STATEMENT OF CHANGES IN NET ASSETS
| | | | | | | | |
| | | Six Months Ended
November 30, 2016
(Unaudited) | | | Year Ended
May 31, 2016 | |
Operations | | | | | | | | |
| | |
Net investment income | | | $10,845,519 | | | | $24,570,565 | |
| | |
Net realized gain (loss) | | | 5,762,144 | | | | (36,411,464 | ) |
| | |
Net change in unrealized appreciation (depreciation) | | | 26,152,913 | | | | (40,521,616 | ) |
| |
Net increase (decrease) in net assets resulting from operations | | | 42,760,576 | | | | (52,362,515 | ) |
| |
| | |
Distributions to shareholders | | | | | | | | |
| | |
Net investment income | | | | | | | | |
| | |
Class A | | | (5,827,221 | ) | | | (15,726,337 | ) |
| | |
Class C | | | (2,528,831 | ) | | | (6,151,184 | ) |
| | |
Class I | | | (65 | ) | | | (464,801 | ) |
| | |
Class R | | | (7,297 | ) | | | (44,670 | ) |
| | |
Class R4 | | | (397,501 | ) | | | (1,015,210 | ) |
| | |
Class R5 | | | (132,179 | ) | | | (219,450 | ) |
| | |
Class W | | | (150 | ) | | | (381 | ) |
| | |
Class Z | | | (2,059,827 | ) | | | (5,895,224 | ) |
| | |
Net realized gains | | | | | | | | |
| | |
Class A | | | — | | | | (3,942,006 | ) |
| | |
Class C | | | — | | | | (1,811,401 | ) |
| | |
Class I | | | — | | | | (31 | ) |
| | |
Class R | | | — | | | | (13,022 | ) |
| | |
Class R4 | | | — | | | | (235,443 | ) |
| | |
Class R5 | | | — | | | | (52,609 | ) |
| | |
Class W | | | — | | | | (95 | ) |
| | |
Class Z | | | — | | | | (1,362,746 | ) |
| |
Total distributions to shareholders | | | (10,953,071 | ) | | | (36,934,610 | ) |
| |
Decrease in net assets from capital stock activity | | | (29,348,183 | ) | | | (218,231,599 | ) |
| |
Total increase (decrease) in net assets | | | 2,459,322 | | | | (307,528,724 | ) |
| | |
Net assets at beginning of period | | | 450,541,669 | | | | 758,070,393 | |
| |
Net assets at end of period | | | $453,000,991 | | | | $450,541,669 | |
| |
Excess of distributions over net investment income | | | $(1,566,851 | ) | | | $(1,459,299 | ) |
| |
The accompanying Notes to Financial Statements are an integral part of this statement.
| | | | |
| Semiannual Report 2016 | | | 17 | |
| | | | | | |
| | |
| | | | COLUMBIA FLEXIBLE CAPITAL INCOME FUND | | |
STATEMENT OF CHANGES IN NET ASSETS (continued)
| | | | | | | | | | | | | | | | |
| | | Six Months Ended
November 30, 2016
(Unaudited) | | | Year Ended
May 31, 2016 | |
| | | Shares | | | Dollars ($) | | | Shares | | | Dollars ($) | |
Capital stock activity | | | | | | | | | | | | | | | | |
| | | | |
Class A shares | | | | | | | | | | | | | | | | |
| | | | |
Subscriptions | | | 1,742,290 | | | | 20,140,176 | | | | 4,454,773 | | | | 51,116,028 | |
| | | | |
Distributions reinvested | | | 500,761 | | | | 5,711,402 | | | | 1,763,376 | | | | 19,273,774 | |
| | | | |
Redemptions | | | (4,140,330 | ) | | | (47,528,737 | ) | | | (14,482,031 | ) | | | (158,593,508 | ) |
| |
Net decrease | | | (1,897,279 | ) | | | (21,677,159 | ) | | | (8,263,882 | ) | | | (88,203,706 | ) |
| |
Class C shares | | | | | | | | | | | | | | | | |
| | | | |
Subscriptions | | | 809,002 | | | | 9,342,984 | | | | 1,898,200 | | | | 21,648,321 | |
| | | | |
Distributions reinvested | | | 203,460 | | | | 2,309,835 | | | | 662,403 | | | | 7,174,857 | |
| | | | |
Redemptions | | | (1,538,459 | ) | | | (17,628,483 | ) | | | (4,898,765 | ) | | | (53,425,561 | ) |
| |
Net decrease | | | (525,997 | ) | | | (5,975,664 | ) | | | (2,338,162 | ) | | | (24,602,383 | ) |
| |
Class I shares | | | | | | | | | | | | | | | | |
| | | | |
Subscriptions | | | — | | | | — | | | | 1,566 | | | | 18,875 | |
| | | | |
Distributions reinvested | | | — | | | | — | | | | 37,656 | | | | 464,669 | |
| | | | |
Redemptions | | | — | | | | — | | | | (3,932,317 | ) | | | (47,354,841 | ) |
| |
Net increase (decrease) | | | — | | | | — | | | | (3,893,095 | ) | | | (46,871,297 | ) |
| |
Class R shares | | | | | | | | | | | | | | | | |
| | | | |
Subscriptions | | | 3,108 | | | | 36,178 | | | | 17,742 | | | | 206,219 | |
| | | | |
Distributions reinvested | | | 635 | | | | 7,241 | | | | 5,236 | | | | 57,546 | |
| | | | |
Redemptions | | | (3,144 | ) | | | (36,363 | ) | | | (105,463 | ) | | | (1,115,268 | ) |
| |
Net increase (decrease) | | | 599 | | | | 7,056 | | | | (82,485 | ) | | | (851,503 | ) |
| |
Class R4 shares | | | | | | | | | | | | | | | | |
| | | | |
Subscriptions | | | 176,946 | | | | 2,058,413 | | | | 232,875 | | | | 2,691,791 | |
| | | | |
Distributions reinvested | | | 34,572 | | | | 397,440 | | | | 113,454 | | | | 1,250,498 | |
| | | | |
Redemptions | | | (180,581 | ) | | | (2,093,503 | ) | | | (903,168 | ) | | | (10,064,494 | ) |
| |
Net increase (decrease) | | | 30,937 | | | | 362,350 | | | | (556,839 | ) | | | (6,122,205 | ) |
| |
Class R5 shares | | | | | | | | | | | | | | | | |
| | | | |
Subscriptions | | | 35,210 | | | | 412,328 | | | | 138,597 | | | | 1,518,435 | |
| | | | |
Distributions reinvested | | | 11,498 | | | | 132,116 | | | | 24,729 | | | | 271,903 | |
| | | | |
Redemptions | | | (54,943 | ) | | | (636,430 | ) | | | (90,244 | ) | | | (1,002,877 | ) |
| |
Net increase (decrease) | | | (8,235 | ) | | | (91,986 | ) | | | 73,082 | | | | 787,461 | |
| |
Class W shares | | | | | | | | | | | | | | | | |
| | | | |
Distributions reinvested | | | 8 | | | | 91 | | | | 30 | | | | 325 | |
| | | | |
Redemptions | | | (3 | ) | | | (37 | ) | | | (343 | ) | | | (3,816 | ) |
| |
Net increase (decrease) | | | 5 | | | | 54 | | | | (313 | ) | | | (3,491 | ) |
| |
Class Z shares | | | | | | | | | | | | | | | | |
| | | | |
Subscriptions | | | 1,959,549 | | | | 22,566,735 | | | | 3,405,974 | | | | 39,038,968 | |
| | | | |
Distributions reinvested | | | 154,086 | | | | 1,758,213 | | | | 531,575 | | | | 5,838,301 | |
| | | | |
Redemptions | | | (2,279,197 | ) | | | (26,297,782 | ) | | | (8,834,512 | ) | | | (97,241,744 | ) |
| |
Net decrease | | | (165,562 | ) | | | (1,972,834 | ) | | | (4,896,963 | ) | | | (52,364,475 | ) |
| |
Total net decrease | | | (2,565,532 | ) | | | (29,348,183 | ) | | | (19,958,657 | ) | | | (218,231,599 | ) |
| |
The accompanying Notes to Financial Statements are an integral part of this statement.
| | |
| 18 | | Semiannual Report 2016 |
| | | | | | |
| | |
| | | | COLUMBIA FLEXIBLE CAPITAL INCOME FUND | | |
FINANCIAL HIGHLIGHTS
The following tables are intended to help you understand the Fund’s financial performance. Certain information reflects financial results for a single share of a class held for the periods shown. Per share net investment income (loss) amounts are calculated based on average shares outstanding during the period. Total return assumes reinvestment of all dividends and distributions, if any. Total return does not reflect payment of sales charges, if any. Total return and portfolio turnover are not annualized for periods of less than one year. The portfolio turnover rate is calculated without regard to purchase and sales transactions of short-term instruments and certain derivatives, if any. If such transactions were included, the Fund’s portfolio turnover rate may be higher.
| | | | | | | | | | | | | | | | | | | | | | | | |
| |
| Six Months Ended
November 30, 2016 |
| | | Year Ended May 31, | |
Class A | | | (Unaudited) | | | | 2016 | | | | 2015 | | | | 2014 | | | | 2013 | | | | 2012(a) | |
Per share data | | | | | | | | | | | | | | | | | | | | | | | | |
Net asset value, beginning of period | | | $11.06 | | | | $12.49 | | | | $12.59 | | | | $11.98 | | | | $10.32 | | | | $10.00 | |
| | | | | | | | | | | | | | | | | | | | | | | | | |
Income from investment operations: | | | | | | | | | | | | | | | | | | | | | | | | |
| | | | | | |
Net investment income | | | 0.28 | | | | 0.49 | | | | 0.39 | | | | 0.43 | | | | 0.45 | | | | 0.33 | |
| | | | | | | | | | | | | | | | | | | | | | | | | |
Net realized and unrealized gain (loss) | | | 0.81 | | | | (1.20 | ) | | | 0.02 | | | | 0.96 | | | | 1.69 | | | | 0.16 | (b) |
| | | | | | | | | | | | | | | | | | | | | | | | | |
Total from investment operations | | | 1.09 | | | | (0.71 | ) | | | 0.41 | | | | 1.39 | | | | 2.14 | | | | 0.49 | |
| | | | | | | | | | | | | | | | | | | | | | | | | |
Less distributions to shareholders: | | | | | | | | | | | | | | | | | | | | | | | | |
| | | | | | |
Net investment income | | | (0.28 | ) | | | (0.57 | ) | | | (0.43 | ) | | | (0.44 | ) | | | (0.43 | ) | | | (0.17 | ) |
| | | | | | | | | | | | | | | | | | | | | | | | | |
Net realized gains | | | — | | | | (0.15 | ) | | | (0.08 | ) | | | (0.34 | ) | | | (0.05 | ) | | | (0.00 | )(c) |
| | | | | | | | | | | | | | | | | | | | | | | | | |
Total distributions to shareholders | | | (0.28 | ) | | | (0.72 | ) | | | (0.51 | ) | | | (0.78 | ) | | | (0.48 | ) | | | (0.17 | ) |
| | | | | | | | | | | | | | | | | | | | | | | | | |
Net asset value, end of period | | | $11.87 | | | | $11.06 | | | | $12.49 | | | | $12.59 | | | | $11.98 | | | | $10.32 | |
| | | | | | | | | | | | | | | | | | | | | | | | | |
Total return | | | 10.02 | % | | | (5.42 | %) | | | 3.37 | % | | | 12.17 | % | | | 21.18 | % | | | 4.97 | % |
| | | | | | | | | | | | | | | | | | | | | | | | | |
Ratios to average net assets(d) | | | | | | | | | | | | | | | | | | | | | | | | |
| | | | | | |
Total gross expenses | | | 1.07 | %(e) | | | 1.09 | % | | | 1.08 | % | | | 1.17 | % | | | 1.85 | % | | | 2.02 | %(e) |
| | | | | | | | | | | | | | | | | | | | | | | | | |
Total net expenses(f) | | | 1.07 | %(e) | | | 1.09 | % | | | 1.07 | % | | | 1.02 | % | | | 1.10 | % | | | 1.10 | %(e) |
| | | | | | | | | | | | | | | | | | | | | | | | | |
Net investment income | | | 4.92 | %(e) | | | 4.37 | % | | | 3.20 | % | | | 3.52 | % | | | 4.03 | % | | | 3.91 | %(e) |
| | | | | | | | | | | | | | | | | | | | | | | | | |
Supplemental data | | | | | | | | | | | | | | | | | | | | | | | | |
| | | | | | |
Net assets, end of period (in thousands) | | | $233,243 | | | | $238,361 | | | | $372,408 | | | | $168,897 | | | | $15,534 | | | | $5,029 | |
| | | | | | | | | | | | | | | | | | | | | | | | | |
Portfolio turnover | | | 38 | % | | | 63 | % | | | 60 | % | | | 48 | % | | | 63 | % | | | 36 | % |
| | | | | | | | | | | | | | | | | | | | | | | | | |
Notes to Financial Highlights
| (a) | Based on operations from July 28, 2011 (commencement of operations) through the stated period end. |
| (b) | Calculation of the net gain (loss) per share (both realized and unrealized) does not correlate to the aggregate realized and unrealized gain (loss) presented in the Statement of Operations due to the timing of subscriptions and redemptions of Fund shares in relation to fluctuations in the market value of the portfolio. |
| (d) | In addition to the fees and expenses that the Fund bears directly, the Fund indirectly bears a pro rata share of the fees and expenses of any other funds in which it invests. Such indirect expenses are not included in the Fund’s reported expense ratios. |
| (f) | Total net expenses include the impact of certain fee waivers/expense reimbursements made by the Investment Manager and certain of its affiliates, if applicable. |
The accompanying Notes to Financial Statements are an integral part of this statement.
| | | | |
| Semiannual Report 2016 | | | 19 | |
| | | | | | |
| | |
| | | | COLUMBIA FLEXIBLE CAPITAL INCOME FUND | | |
FINANCIAL HIGHLIGHTS (continued)
| | | | | | | | | | | | | | | | | | | | | | | | |
| |
| Six Months Ended
November 30, 2016 |
| | | Year Ended May 31, | |
Class C | | | (Unaudited) | | | | 2016 | | | | 2015 | | | | 2014 | | | | 2013 | | | | 2012(a) | |
Per share data | | | | | | | | | | | | | | | | | | | | | | | | |
Net asset value, beginning of period | | | $11.00 | | | | $12.42 | | | | $12.52 | | | | $11.91 | | | | $10.28 | | | | $10.00 | |
| | | | | | | | | | | | | | | | | | | | | | | | | |
Income from investment operations: | | | | | | | | | | | | | | | | | | | | | | | | |
| | | | | | |
Net investment income | | | 0.24 | | | | 0.41 | | | | 0.30 | | | | 0.33 | | | | 0.37 | | | | 0.27 | |
| | | | | | | | | | | | | | | | | | | | | | | | | |
Net realized and unrealized gain (loss) | | | 0.80 | | | | (1.19 | ) | | | 0.01 | | | | 0.97 | | | | 1.67 | | | | 0.15 | (b) |
| | | | | | | | | | | | | | | | | | | | | | | | | |
Total from investment operations | | | 1.04 | | | | (0.78 | ) | | | 0.31 | | | | 1.30 | | | | 2.04 | | | | 0.42 | |
| | | | | | | | | | | | | | | | | | | | | | | | | |
Less distributions to shareholders: | | | | | | | | | | | | | | | | | | | | | | | | |
| | | | | | |
Net investment income | | | (0.24 | ) | | | (0.49 | ) | | | (0.33 | ) | | | (0.35 | ) | | | (0.36 | ) | | | (0.14 | ) |
| | | | | | | | | | | | | | | | | | | | | | | | | |
Net realized gains | | | — | | | | (0.15 | ) | | | (0.08 | ) | | | (0.34 | ) | | | (0.05 | ) | | | (0.00 | )(c) |
| | | | | | | | | | | | | | | | | | | | | | | | | |
Total distributions to shareholders | | | (0.24 | ) | | | (0.64 | ) | | | (0.41 | ) | | | (0.69 | ) | | | (0.41 | ) | | | (0.14 | ) |
| | | | | | | | | | | | | | | | | | | | | | | | | |
Net asset value, end of period | | | $11.80 | | | | $11.00 | | | | $12.42 | | | | $12.52 | | | | $11.91 | | | | $10.28 | |
| | | | | | | | | | | | | | | | | | | | | | | | | |
Total return | | | 9.58 | % | | | (6.10 | %) | | | 2.61 | % | | | 11.38 | % | | | 20.26 | % | | | 4.27 | % |
| | | | | | | | | | | | | | | | | | | | | | | | | |
Ratios to average net assets(d) | | | | | | | | | | | | | | | | | | | | | | | | |
| | | | | | |
Total gross expenses | | | 1.82 | %(e) | | | 1.84 | % | | | 1.83 | % | | | 1.92 | % | | | 2.63 | % | | | 2.73 | %(e) |
| | | | | | | | | | | | | | | | | | | | | | | | | |
Total net expenses(f) | | | 1.82 | %(e) | | | 1.84 | % | | | 1.82 | % | | | 1.78 | % | | | 1.85 | % | | | 1.85 | %(e) |
| | | | | | | | | | | | | | | | | | | | | | | | | |
Net investment income | | | 4.16 | %(e) | | | 3.64 | % | | | 2.47 | % | | | 2.79 | % | | | 3.26 | % | | | 3.18 | %(e) |
| | | | | | | | | | | | | | | | | | | | | | | | | |
Supplemental data | | | | | | | | | | | | | | | | | | | | | | | | |
| | | | | | |
Net assets, end of period (in thousands) | | | $120,601 | | | | $118,203 | | | | $162,563 | | | | $49,739 | | | | $1,925 | | | | $193 | |
| | | | | | | | | | | | | | | | | | | | | | | | | |
Portfolio turnover | | | 38 | % | | | 63 | % | | | 60 | % | | | 48 | % | | | 63 | % | | | 36 | % |
| | | | | | | | | | | | | | | | | | | | | | | | | |
Notes to Financial Highlights
| (a) | Based on operations from July 28, 2011 (commencement of operations) through the stated period end. |
| (b) | Calculation of the net gain (loss) per share (both realized and unrealized) does not correlate to the aggregate realized and unrealized gain (loss) presented in the Statement of Operations due to the timing of subscriptions and redemptions of Fund shares in relation to fluctuations in the market value of the portfolio. |
| (d) | In addition to the fees and expenses that the Fund bears directly, the Fund indirectly bears a pro rata share of the fees and expenses of any other funds in which it invests. Such indirect expenses are not included in the Fund’s reported expense ratios. |
| (f) | Total net expenses include the impact of certain fee waivers/expense reimbursements made by the Investment Manager and certain of its affiliates, if applicable. |
The accompanying Notes to Financial Statements are an integral part of this statement.
| | |
| 20 | | Semiannual Report 2016 |
| | | | | | |
| | |
| | | | COLUMBIA FLEXIBLE CAPITAL INCOME FUND | | |
FINANCIAL HIGHLIGHTS (continued)
| | | | | | | | | | | | | | | | | | | | | | | | |
| |
| Six Months Ended
November 30, 2016 |
| | | Year Ended May 31, | |
Class I | | | (Unaudited) | | | | 2016 | | | | 2015 | | | | 2014 | | | | 2013 | | | | 2012(a) | |
Per share data | | | | | | | | | | | | | | | | | | | | | | | | |
Net asset value, beginning of period | | | $11.09 | | | | $12.51 | | | | $12.61 | | | | $11.98 | | | | $10.32 | | | | $10.00 | |
| | | | | | | | | | | | | | | | | | | | | | | | | |
Income from investment operations: | | | | | | | | | | | | | | | | | | | | | | | | |
| | | | | | |
Net investment income | | | 0.31 | | | | 0.48 | | | | 0.43 | | | | 0.47 | | | | 0.48 | | | | 0.37 | |
| | | | | | | | | | | | | | | | | | | | | | | | | |
Net realized and unrealized gain (loss) | | | 0.81 | | | | (1.13 | ) | | | 0.02 | | | | 0.98 | | | | 1.69 | | | | 0.14 | (b) |
| | | | | | | | | | | | | | | | | | | | | | | | | |
Total from investment operations | | | 1.12 | | | | (0.65 | ) | | | 0.45 | | | | 1.45 | | | | 2.17 | | | | 0.51 | |
| | | | | | | | | | | | | | | | | | | | | | | | | |
Less distributions to shareholders: | | | | | | | | | | | | | | | | | | | | | | | | |
| | | | | | |
Net investment income | | | (0.31 | ) | | | (0.62 | ) | | | (0.47 | ) | | | (0.48 | ) | | | (0.46 | ) | | | (0.19 | ) |
| | | | | | | | | | | | | | | | | | | | | | | | | |
Net realized gains | | | — | | | | (0.15 | ) | | | (0.08 | ) | | | (0.34 | ) | | | (0.05 | ) | | | (0.00 | )(c) |
| | | | | | | | | | | | | | | | | | | | | | | | | |
Total distributions to shareholders | | | (0.31 | ) | | | (0.77 | ) | | | (0.55 | ) | | | (0.82 | ) | | | (0.51 | ) | | | (0.19 | ) |
| | | | | | | | | | | | | | | | | | | | | | | | | |
Net asset value, end of period | | | $11.90 | | | | $11.09 | | | | $12.51 | | | | $12.61 | | | | $11.98 | | | | $10.32 | |
| | | | | | | | | | | | | | | | | | | | | | | | | |
Total return | | | 10.24 | % | | | (4.93 | %) | | | 3.75 | % | | | 12.69 | % | | | 21.55 | % | | | 5.14 | % |
| | | | | | | | | | | | | | | | | | | | | | | | | |
Ratios to average net assets(d) | | | | | | | | | | | | | | | | | | | | | | | | |
| | | | | | |
Total gross expenses | | | 0.70 | %(e) | | | 0.66 | % | | | 0.69 | % | | | 0.77 | % | | | 0.86 | % | | | 1.12 | %(e) |
| | | | | | | | | | | | | | | | | | | | | | | | | |
Total net expenses(f) | | | 0.70 | %(e) | | | 0.66 | % | | | 0.67 | % | | | 0.69 | % | | | 0.78 | % | | | 0.74 | %(e) |
| | | | | | | | | | | | | | | | | | | | | | | | | |
Net investment income | | | 5.26 | %(e) | | | 3.71 | % | | | 3.44 | % | | | 3.84 | % | | | 4.33 | % | | | 4.19 | %(e) |
| | | | | | | | | | | | | | | | | | | | | | | | | |
Supplemental data | | | | | | | | | | | | | | | | | | | | | | | | |
| | | | | | |
Net assets, end of period (in thousands) | | | $3 | | | | $2 | | | | $48,686 | | | | $87,713 | | | | $84,270 | | | | $81,861 | |
| | | | | | | | | | | | | | | | | | | | | | | | | |
Portfolio turnover | | | 38 | % | | | 63 | % | | | 60 | % | | | 48 | % | | | 63 | % | | | 36 | % |
| | | | | | | | | | | | | | | | | | | | | | | | | |
Notes to Financial Highlights
| (a) | Based on operations from July 28, 2011 (commencement of operations) through the stated period end. |
| (b) | Calculation of the net gain (loss) per share (both realized and unrealized) does not correlate to the aggregate realized and unrealized gain (loss) presented in the Statement of Operations due to the timing of subscriptions and redemptions of Fund shares in relation to fluctuations in the market value of the portfolio. |
| (d) | In addition to the fees and expenses that the Fund bears directly, the Fund indirectly bears a pro rata share of the fees and expenses of any other funds in which it invests. Such indirect expenses are not included in the Fund’s reported expense ratios. |
| (f) | Total net expenses include the impact of certain fee waivers/expense reimbursements made by the Investment Manager and certain of its affiliates, if applicable. |
The accompanying Notes to Financial Statements are an integral part of this statement.
| | | | |
| Semiannual Report 2016 | | | 21 | |
| | | | | | |
| | |
| | | | COLUMBIA FLEXIBLE CAPITAL INCOME FUND | | |
FINANCIAL HIGHLIGHTS (continued)
| | | | | | | | | | | | | | | | | | | | | | | | |
| |
| Six Months Ended
November 30, 2016 |
| | | Year Ended May 31, | |
Class R | | | (Unaudited) | | | | 2016 | | | | 2015 | | | | 2014 | | | | 2013 | | | | 2012(a) | |
Per share data | | | | | | | | | | | | | | | | | | | | | | | | |
Net asset value, beginning of period | | | $11.05 | | | | $12.48 | | | | $12.58 | | | | $11.97 | | | | $10.31 | | | | $10.00 | |
| | | | | | | | | | | | | | | | | | | | | | | | | |
Income from investment operations: | | | | | | | | | | | | | | | | | | | | | | | | |
| | | | | | |
Net investment income | | | 0.27 | | | | 0.45 | | | | 0.36 | | | | 0.41 | | | | 0.42 | | | | 0.30 | |
| | | | | | | | | | | | | | | | | | | | | | | | | |
Net realized and unrealized gain (loss) | | | 0.81 | | | | (1.18 | ) | | | 0.02 | | | | 0.95 | | | | 1.69 | | | | 0.16 | (b) |
| | | | | | | | | | | | | | | | | | | | | | | | | |
Total from investment operations | | | 1.08 | | | | (0.73 | ) | | | 0.38 | | | | 1.36 | | | | 2.11 | | | | 0.46 | |
| | | | | | | | | | | | | | | | | | | | | | | | | |
Less distributions to shareholders: | | | | | | | | | | | | | | | | | | | | | | | | |
| | | | | | |
Net investment income | | | (0.27 | ) | | | (0.55 | ) | | | (0.40 | ) | | | (0.41 | ) | | | (0.40 | ) | | | (0.15 | ) |
| | | | | | | | | | | | | | | | | | | | | | | | | |
Net realized gains | | | — | | | | (0.15 | ) | | | (0.08 | ) | | | (0.34 | ) | | | (0.05 | ) | | | (0.00 | )(c) |
| | | | | | | | | | | | | | | | | | | | | | | | | |
Total distributions to shareholders | | | (0.27 | ) | | | (0.70 | ) | | | (0.48 | ) | | | (0.75 | ) | | | (0.45 | ) | | | (0.15 | ) |
| | | | | | | | | | | | | | | | | | | | | | | | | |
Net asset value, end of period | | | $11.86 | | | | $11.05 | | | | $12.48 | | | | $12.58 | | | | $11.97 | | | | $10.31 | |
| | | | | | | | | | | | | | | | | | | | | | | | | |
Total return | | | 9.90 | % | | | (5.67 | %) | | | 3.11 | % | | | 11.87 | % | | | 20.87 | % | | | 4.64 | % |
| | | | | | | | | | | | | | | | | | | | | | | | | |
Ratios to average net assets(d) | | | | | | | | | | | | | | | | | | | | | | | | |
| | | | | | |
Total gross expenses | | | 1.32 | %(e) | | | 1.33 | % | | | 1.34 | % | | | 1.41 | % | | | 2.12 | % | | | 2.42 | %(e) |
| | | | | | | | | | | | | | | | | | | | | | | | | |
Total net expenses(f) | | | 1.32 | %(e) | | | 1.33 | % | | | 1.33 | % | | | 1.29 | % | | | 1.35 | % | | | 1.35 | %(e) |
| | | | | | | | | | | | | | | | | | | | | | | | | |
Net investment income | | | 4.65 | %(e) | | | 3.98 | % | | | 2.94 | % | | | 3.38 | % | | | 3.79 | % | | | 3.48 | %(e) |
| | | | | | | | | | | | | | | | | | | | | | | | | |
Supplemental data | | | | | | | | | | | | | | | | | | | | | | | | |
| | | | | | |
Net assets, end of period (in thousands) | | | $328 | | | | $299 | | | | $1,368 | | | | $531 | | | | $3 | | | | $3 | |
| | | | | | | | | | | | | | | | | | | | | | | | | |
Portfolio turnover | | | 38 | % | | | 63 | % | | | 60 | % | | | 48 | % | | | 63 | % | | | 36 | % |
| | | | | | | | | | | | | | | | | | | | | | | | | |
Notes to Financial Highlights
| (a) | Based on operations from July 28, 2011 (commencement of operations) through the stated period end. |
| (b) | Calculation of the net gain (loss) per share (both realized and unrealized) does not correlate to the aggregate realized and unrealized gain (loss) presented in the Statement of Operations due to the timing of subscriptions and redemptions of Fund shares in relation to fluctuations in the market value of the portfolio. |
| (d) | In addition to the fees and expenses that the Fund bears directly, the Fund indirectly bears a pro rata share of the fees and expenses of any other funds in which it invests. Such indirect expenses are not included in the Fund’s reported expense ratios. |
| (f) | Total net expenses include the impact of certain fee waivers/expense reimbursements made by the Investment Manager and certain of its affiliates, if applicable. |
The accompanying Notes to Financial Statements are an integral part of this statement.
| | |
| 22 | | Semiannual Report 2016 |
| | | | | | |
| | |
| | | | COLUMBIA FLEXIBLE CAPITAL INCOME FUND | | |
FINANCIAL HIGHLIGHTS (continued)
| | | | | | | | | | | | | | | | | | | | |
| |
| Six Months Ended
November 30, 2016 |
| | | Year Ended May 31, | |
Class R4 | | | (Unaudited) | | | | 2016 | | | | 2015 | | | | 2014 | | | | 2013(a) | |
Per share data | | | | | | | | | | | | | | | | | | | | |
Net asset value, beginning of period | | | $11.14 | | | | $12.58 | | | | $12.68 | | | | $12.05 | | | | $10.93 | |
| | | | | | | | | | | | | | | | | | | | | |
Income from investment operations: | | | | | | | | | | | | | | | | | | | | |
| | | | | |
Net investment income | | | 0.30 | | | | 0.52 | | | | 0.43 | | | | 0.47 | | | | 0.36 | |
| | | | | | | | | | | | | | | | | | | | | |
Net realized and unrealized gain (loss) | | | 0.81 | | | | (1.21 | ) | | | 0.01 | | | | 0.97 | | | | 1.08 | |
| | | | | | | | | | | | | | | | | | | | | |
Total from investment operations | | | 1.11 | | | | (0.69 | ) | | | 0.44 | | | | 1.44 | | | | 1.44 | |
| | | | | | | | | | | | | | | | | | | | | |
Less distributions to shareholders: | | | | | | | | | | | | | | | | | | | | |
| | | | | |
Net investment income | | | (0.30 | ) | | | (0.60 | ) | | | (0.46 | ) | | | (0.47 | ) | | | (0.27 | ) |
| | | | | | | | | | | | | | | | | | | | | |
Net realized gains | | | — | | | | (0.15 | ) | | | (0.08 | ) | | | (0.34 | ) | | | (0.05 | ) |
| | | | | | | | | | | | | | | | | | | | | |
Total distributions to shareholders | | | (0.30 | ) | | | (0.75 | ) | | | (0.54 | ) | | | (0.81 | ) | | | (0.32 | ) |
| | | | | | | | | | | | | | | | | | | | | |
Net asset value, end of period | | | $11.95 | | | | $11.14 | | | | $12.58 | | | | $12.68 | | | | $12.05 | |
| | | | | | | | | | | | | | | | | | | | | |
Total return | | | 10.08 | % | | | (5.22 | %) | | | 3.61 | % | | | 12.55 | % | | | 13.40 | % |
| | | | | | | | | | | | | | | | | | | | | |
Ratios to average net assets(b) | | | | | | | | | | | | | | | | | | | | |
| | | | | |
Total gross expenses | | | 0.82 | %(c) | | | 0.84 | % | | | 0.83 | % | | | 0.92 | % | | | 1.59 | %(c) |
| | | | | | | | | | | | | | | | | | | | | |
Total net expenses(d) | | | 0.82 | %(c) | | | 0.84 | % | | | 0.82 | % | | | 0.77 | % | | | 0.85 | %(c) |
| | | | | | | | | | | | | | | | | | | | | |
Net investment income | | | 5.16 | %(c) | | | 4.62 | % | | | 3.45 | % | | | 3.83 | % | | | 4.28 | %(c) |
| | | | | | | | | | | | | | | | | | | | | |
Supplemental data | | | | | | | | | | | | | | | | | | | | |
| | | | | |
Net assets, end of period (in thousands) | | | $16,296 | | | | $14,839 | | | | $23,755 | | | | $9,087 | | | | $897 | |
| | | | | | | | | | | | | | | | | | | | | |
Portfolio turnover | | | 38 | % | | | 63 | % | | | 60 | % | | | 48 | % | | | 63 | % |
| | | | | | | | | | | | | | | | | | | | | |
Notes to Financial Highlights
| (a) | Based on operations from November 8, 2012 (commencement of operations) through the stated period end. |
| (b) | In addition to the fees and expenses that the Fund bears directly, the Fund indirectly bears a pro rata share of the fees and expenses of any other funds in which it invests. Such indirect expenses are not included in the Fund’s reported expense ratios. |
| (d) | Total net expenses include the impact of certain fee waivers/expense reimbursements made by the Investment Manager and certain of its affiliates, if applicable. |
The accompanying Notes to Financial Statements are an integral part of this statement.
| | | | |
| Semiannual Report 2016 | | | 23 | |
| | | | | | |
| | |
| | | | COLUMBIA FLEXIBLE CAPITAL INCOME FUND | | |
FINANCIAL HIGHLIGHTS (continued)
| | | | | | | | | | | | | | | | | | | | |
| |
| Six Months Ended
November 30, 2016 |
| | | Year Ended May 31, | |
Class R5 | | | (Unaudited) | | | | 2016 | | | | 2015 | | | | 2014 | | | | 2013(a) | |
Per share data | | | | | | | | | | | | | | | | | | | | |
Net asset value, beginning of period | | | $11.15 | | | | $12.58 | | | | $12.68 | | | | $12.05 | | | | $10.93 | |
| | | | | | | | | | | | | | | | | | | | | |
Income from investment operations: | | | | | | | | | | | | | | | | | | | | |
| | | | | |
Net investment income | | | 0.30 | | | | 0.54 | | | | 0.42 | | | | 0.47 | | | | 0.37 | |
| | | | | | | | | | | | | | | | | | | | | |
Net realized and unrealized gain (loss) | | | 0.81 | | | | (1.21 | ) | | | 0.03 | | | | 0.97 | | | | 1.07 | |
| | | | | | | | | | | | | | | | | | | | | |
Total from investment operations | | | 1.11 | | | | (0.67 | ) | | | 0.45 | | | | 1.44 | | | | 1.44 | |
| | | | | | | | | | | | | | | | | | | | | |
Less distributions to shareholders: | | | | | | | | | | | | | | | | | | | | |
| | | | | |
Net investment income | | | (0.30 | ) | | | (0.61 | ) | | | (0.47 | ) | | | (0.47 | ) | | | (0.27 | ) |
| | | | | | | | | | | | | | | | | | | | | |
Net realized gains | | | — | | | | (0.15 | ) | | | (0.08 | ) | | | (0.34 | ) | | | (0.05 | ) |
| | | | | | | | | | | | | | | | | | | | | |
Total distributions to shareholders | | | (0.30 | ) | | | (0.76 | ) | | | (0.55 | ) | | | (0.81 | ) | | | (0.32 | ) |
| | | | | | | | | | | | | | | | | | | | | |
Net asset value, end of period | | | $11.96 | | | | $11.15 | | | | $12.58 | | | | $12.68 | | | | $12.05 | |
| | | | | | | | | | | | | | | | | | | | | |
Total return | | | 10.12 | % | | | (5.06 | %) | | | 3.66 | % | | | 12.55 | % | | | 13.41 | % |
| | | | | | | | | | | | | | | | | | | | | |
Ratios to average net assets(b) | | | | | | | | | | | | | | | | | | | | |
| | | | | |
Total gross expenses | | | 0.76 | %(c) | | | 0.75 | % | | | 0.74 | % | | | 0.82 | % | | | 0.86 | %(c) |
| | | | | | | | | | | | | | | | | | | | | |
Total net expenses(d) | | | 0.76 | %(c) | | | 0.75 | % | | | 0.72 | % | | | 0.76 | % | | | 0.84 | %(c) |
| | | | | | | | | | | | | | | | | | | | | |
Net investment income | | | 5.21 | %(c) | | | 4.76 | % | | | 3.41 | % | | | 3.84 | % | | | 4.29 | %(c) |
| | | | | | | | | | | | | | | | | | | | | |
Supplemental data | | | | | | | | | | | | | | | | | | | | |
| | | | | |
Net assets, end of period (in thousands) | | | $5,209 | | | | $4,946 | | | | $4,663 | | | | $5,695 | | | | $16,569 | |
| | | | | | | | | | | | | | | | | | | | | |
Portfolio turnover | | | 38 | % | | | 63 | % | | | 60 | % | | | 48 | % | | | 63 | % |
| | | | | | | | | | | | | | | | | | | | | |
Notes to Financial Highlights
| (a) | Based on operations from November 8, 2012 (commencement of operations) through the stated period end. |
| (b) | In addition to the fees and expenses that the Fund bears directly, the Fund indirectly bears a pro rata share of the fees and expenses of any other funds in which it invests. Such indirect expenses are not included in the Fund’s reported expense ratios. |
| (d) | Total net expenses include the impact of certain fee waivers/expense reimbursements made by the Investment Manager and certain of its affiliates, if applicable. |
The accompanying Notes to Financial Statements are an integral part of this statement.
| | |
| 24 | | Semiannual Report 2016 |
| | | | | | |
| | |
| | | | COLUMBIA FLEXIBLE CAPITAL INCOME FUND | | |
FINANCIAL HIGHLIGHTS (continued)
| | | | | | | | | | | | | | | | | | | | | | | | |
| |
| Six Months Ended
November 30, 2016 |
| | | Year Ended May 31, | |
Class W | | | (Unaudited) | | | | 2016 | | | | 2015 | | | | 2014 | | | | 2013 | | | | 2012(a) | |
Per share data | | | | | | | | | | | | | | | | | | | | | | | | |
Net asset value, beginning of period | | | $11.07 | | | | $12.50 | | | | $12.60 | | | | $11.98 | | | | $10.32 | | | | $10.00 | |
| | | | | | | | | | | | | | | | | | | | | | | | | |
Income from investment operations: | | | | | | | | | | | | | | | | | | | | | | | | |
| | | | | | |
Net investment income | | | 0.28 | | | | 0.49 | | | | 0.38 | | | | 0.43 | | | | 0.44 | | | | 0.28 | |
| | | | | | | | | | | | | | | | | | | | | | | | | |
Net realized and unrealized gain (loss) | | | 0.81 | | | | (1.19 | ) | | | 0.02 | | | | 0.97 | | | | 1.69 | | | | 0.21 | (b) |
| | | | | | | | | | | | | | | | | | | | | | | | | |
Total from investment operations | | | 1.09 | | | | (0.70 | ) | | | 0.40 | | | | 1.40 | | | | 2.13 | | | | 0.49 | |
| | | | | | | | | | | | | | | | | | | | | | | | | |
Less distributions to shareholders: | | | | | | | | | | | | | | | | | | | | | | | | |
| | | | | | |
Net investment income | | | (0.29 | ) | | | (0.58 | ) | | | (0.42 | ) | | | (0.44 | ) | | | (0.42 | ) | | | (0.17 | ) |
| | | | | | | | | | | | | | | | | | | | | | | | | |
Net realized gains | | | — | | | | (0.15 | ) | | | (0.08 | ) | | | (0.34 | ) | | | (0.05 | ) | | | (0.00 | )(c) |
| | | | | | | | | | | | | | | | | | | | | | | | | |
Total distributions to shareholders | | | (0.29 | ) | | | (0.73 | ) | | | (0.50 | ) | | | (0.78 | ) | | | (0.47 | ) | | | (0.17 | ) |
| | | | | | | | | | | | | | | | | | | | | | | | | |
Net asset value, end of period | | | $11.87 | | | | $11.07 | | | | $12.50 | | | | $12.60 | | | | $11.98 | | | | $10.32 | |
| | | | | | | | | | | | | | | | | | | | | | | | | |
Total return | | | 9.92 | % | | | (5.41 | %) | | | 3.33 | % | | | 12.22 | % | | | 21.13 | % | | | 4.92 | % |
| | | | | | | | | | | | | | | | | | | | | | | | | |
Ratios to average net assets(d) | | | | | | | | | | | | | | | | | | | | | | | | |
| | | | | | |
Total gross expenses | | | 1.06 | %(e) | | | 1.07 | % | | | 1.07 | % | | | 1.17 | % | | | 1.91 | % | | | 1.76 | %(e) |
| | | | | | | | | | | | | | | | | | | | | | | | | |
Total net expenses(f) | | | 1.06 | %(e) | | | 1.07 | % | | | 1.07 | % | | | 1.08 | % | | | 1.10 | % | | | 1.10 | %(e) |
| | | | | | | | | | | | | | | | | | | | | | | | | |
Net investment income | | | 4.91 | %(e) | | | 4.35 | % | | | 3.08 | % | | | 3.52 | % | | | 3.97 | % | | | 3.23 | %(e) |
| | | | | | | | | | | | | | | | | | | | | | | | | |
Supplemental data | | | | | | | | | | | | | | | | | | | | | | | | |
| | | | | | |
Net assets, end of period (in thousands) | | | $6 | | | | $6 | | | | $10 | | | | $16 | | | | $4,875 | | | | $7,979 | |
| | | | | | | | | | | | | | | | | | | | | | | | | |
Portfolio turnover | | | 38 | % | | | 63 | % | | | 60 | % | | | 48 | % | | | 63 | % | | | 36 | % |
| | | | | | | | | | | | | | | | | | | | | | | | | |
Notes to Financial Highlights
| (a) | Based on operations from July 28, 2011 (commencement of operations) through the stated period end. |
| (b) | Calculation of the net gain (loss) per share (both realized and unrealized) does not correlate to the aggregate realized and unrealized gain (loss) presented in the Statement of Operations due to the timing of subscriptions and redemptions of Fund shares in relation to fluctuations in the market value of the portfolio. |
| (d) | In addition to the fees and expenses that the Fund bears directly, the Fund indirectly bears a pro rata share of the fees and expenses of any other funds in which it invests. Such indirect expenses are not included in the Fund’s reported expense ratios. |
| (f) | Total net expenses include the impact of certain fee waivers/expense reimbursements made by the Investment Manager and certain of its affiliates, if applicable. |
The accompanying Notes to Financial Statements are an integral part of this statement.
| | | | |
| Semiannual Report 2016 | | | 25 | |
| | | | | | |
| | |
| | | | COLUMBIA FLEXIBLE CAPITAL INCOME FUND | | |
FINANCIAL HIGHLIGHTS (continued)
| | | | | | | | | | | | | | | | | | | | | | | | |
| |
| Six Months Ended
November 30, 2016 |
| | | Year Ended May 31, | |
Class Z | | | (Unaudited) | | | | 2016 | | | | 2015 | | | | 2014 | | | | 2013 | | | | 2012(a) | |
Per share data | | | | | | | | | | | | | | | | | | | | | | | | |
Net asset value, beginning of period | | | $11.06 | | | | $12.49 | | | | $12.60 | | | | $11.98 | | | | $10.32 | | | | $10.00 | |
| | | | | | | | | | | | | | | | | | | | | | | | | |
Income from investment operations: | | | | | | | | | | | | | | | | | | | | | | | | |
| | | | | | |
Net investment income | | | 0.30 | | | | 0.52 | | | | 0.43 | | | | 0.46 | | | | 0.48 | | | | 0.36 | |
| | | | | | | | | | | | | | | | | | | | | | | | | |
Net realized and unrealized gain (loss) | | | 0.81 | | | | (1.20 | ) | | | 0.00 | (b) | | | 0.97 | | | | 1.68 | | | | 0.14 | (b) |
| | | | | | | | | | | | | | | | | | | | | | | | | |
Total from investment operations | | | 1.11 | | | | (0.68 | ) | | | 0.43 | | | | 1.43 | | | | 2.16 | | | | 0.50 | |
| | | | | | | | | | | | | | | | | | | | | | | | | |
Less distributions to shareholders: | | | | | | | | | | | | | | | | | | | | | | | | |
| | | | | | |
Net investment income | | | (0.30 | ) | | | (0.60 | ) | | | (0.46 | ) | | | (0.47 | ) | | | (0.45 | ) | | | (0.18 | ) |
| | | | | | | | | | | | | | | | | | | | | | | | | |
Net realized gains | | | — | | | | (0.15 | ) | | | (0.08 | ) | | | (0.34 | ) | | | (0.05 | ) | | | (0.00 | )(c) |
| | | | | | | | | | | | | | | | | | | | | | | | | |
Total distributions to shareholders | | | (0.30 | ) | | | (0.75 | ) | | | (0.54 | ) | | | (0.81 | ) | | | (0.50 | ) | | | (0.18 | ) |
| | | | | | | | | | | | | | | | | | | | | | | | | |
Net asset value, end of period | | | $11.87 | | | | $11.06 | | | | $12.49 | | | | $12.60 | | | | $11.98 | | | | $10.32 | |
| | | | | | | | | | | | | | | | | | | | | | | | | |
Total return | | | 10.15 | % | | | (5.18 | %) | | | 3.55 | % | | | 12.54 | % | | | 21.46 | % | | | 5.09 | % |
| | | | | | | | | | | | | | | | | | | | | | | | | |
Ratios to average net assets(d) | | | | | | | | | | | | | | | | | | | | | | | | |
| | | | | | |
Total gross expenses | | | 0.82 | %(e) | | | 0.83 | % | | | 0.83 | % | | | 0.92 | % | | | 1.61 | % | | | 1.82 | %(e) |
| | | | | | | | | | | | | | | | | | | | | | | | | |
Total net expenses(f) | | | 0.82 | %(e) | | | 0.83 | % | | | 0.82 | % | | | 0.75 | % | | | 0.85 | % | | | 0.85 | %(e) |
| | | | | | | | | | | | | | | | | | | | | | | | | |
Net investment income | | | 5.13 | %(e) | | | 4.56 | % | | | 3.49 | % | | | 3.82 | % | | | 4.30 | % | | | 4.16 | %(e) |
| | | | | | | | | | | | | | | | | | | | | | | | | |
Supplemental data | | | | | | | | | | | | | | | | | | | | | | | | |
| | | | | | |
Net assets, end of period (in thousands) | | | $77,315 | | | | $73,885 | | | | $144,617 | | | | $27,600 | | | | $3,716 | | | | $1,126 | |
| | | | | | | | | | | | | | | | | | | | | | | | | |
Portfolio turnover | | | 38 | % | | | 63 | % | | | 60 | % | | | 48 | % | | | 63 | % | | | 36 | % |
| | | | | | | | | | | | | | | | | | | | | | | | | |
Notes to Financial Highlights
| (a) | Based on operations from July 28, 2011 (commencement of operations) through the stated period end. |
| (b) | Calculation of the net gain (loss) per share (both realized and unrealized) does not correlate to the aggregate realized and unrealized gain (loss) presented in the Statement of Operations due to the timing of subscriptions and redemptions of Fund shares in relation to fluctuations in the market value of the portfolio. |
| (d) | In addition to the fees and expenses that the Fund bears directly, the Fund indirectly bears a pro rata share of the fees and expenses of any other funds in which it invests. Such indirect expenses are not included in the Fund’s reported expense ratios. |
| (f) | Total net expenses include the impact of certain fee waivers/expense reimbursements made by the Investment Manager and certain of its affiliates, if applicable. |
The accompanying Notes to Financial Statements are an integral part of this statement.
| | |
| 26 | | Semiannual Report 2016 |
| | | | | | |
| | |
| | | | COLUMBIA FLEXIBLE CAPITAL INCOME FUND | | |
NOTES TO FINANCIAL STATEMENTS
November 30, 2016 (Unaudited)
Note 1. Organization
Columbia Flexible Capital Income Fund (the Fund), a series of Columbia Funds Series Trust II (the Trust), is a diversified fund. The Trust is registered under the Investment Company Act of 1940, as amended (the 1940 Act), as an open-end management investment company organized as a Massachusetts business trust.
Fund Shares
The Trust may issue an unlimited number of shares (without par value). The Fund offers Class A, Class C, Class I, Class R, Class R4, Class R5, Class W and Class Z shares. Although all share classes generally have identical voting, dividend and liquidation rights, each share class votes separately when required by the Trust’s organizational documents or by law. Different share classes pay different distribution amounts to the extent the expenses of such share classes differ, and distributions in liquidation will be proportional to the net asset value of each share class. Each share class has its own expense and sales charge structure.
Class A shares are subject to a maximum front-end sales charge of 5.75% based on the initial investment amount. Class A shares purchased without an initial sales charge in accounts aggregating $1 million to $50 million at the time of purchase are subject to a contingent deferred sales charge (CDSC) if the shares are sold within 18 months after purchase, charged as follows: 1.00% CDSC if redeemed within 12 months after purchase, and 0.50% CDSC if redeemed more than 12, but less than 18, months after purchase.
Class C shares are subject to a 1.00% CDSC on shares redeemed within 12 months after purchase.
Class I shares are not subject to sales charges and are available only to the Columbia Family of Funds.
Class R shares are not subject to sales charges and are generally available only to certain retirement plans and other investors as described in the Fund’s prospectus.
Class R4 shares are not subject to sales charges and are generally available only to omnibus retirement plans and certain investors as described in the Fund’s prospectus.
Class R5 shares are not subject to sales charges and are generally available only to investors purchasing through authorized investment professionals and omnibus retirement plans.
Class W shares are not subject to sales charges and are generally available only to investors purchasing through
authorized investment programs managed by investment professionals, including discretionary managed account programs.
Class Z shares are not subject to sales charges and are generally available only to eligible investors, which are subject to different investment minimums as described in the Fund’s prospectus.
Note 2. Summary of Significant Accounting Policies
Basis of Preparation
The Fund is an investment company that applies the accounting and reporting guidance in the Financial Accounting Standards Board (FASB) Accounting Standards Codification Topic 946, Financial Services —Investment Companies (ASC 946). The financial statements are prepared in accordance with U.S. generally accepted accounting principles (GAAP), which requires management to make certain estimates and assumptions that affect the reported amounts of assets and liabilities, the disclosure of contingent assets and liabilities at the date of the financial statements and the reported amounts of income and expenses during the reporting period. Actual results could differ from those estimates.
The following is a summary of significant accounting policies followed by the Fund in the preparation of its financial statements.
Security Valuation
All equity securities are valued at the close of business of the New York Stock Exchange (NYSE). Equity securities are valued at the last quoted sales price on the principal exchange or market on which they trade, except for securities traded on the NASDAQ Stock Market, which are valued at the NASDAQ official close price. Unlisted securities or listed securities for which there were no sales during the day are valued at the mean of the latest quoted bid and ask prices on such exchanges or markets.
Debt securities generally are valued by pricing services approved by the Board of Trustees (the Board) based upon market transactions for normal, institutional-size trading units of similar securities. The services may use various pricing techniques that take into account, as applicable, factors such as yield, quality, coupon rate, maturity, type of issue, trading characteristics and other data, as well as approved independent broker-dealer quotes. Debt securities for which quotations are not
| | | | |
| Semiannual Report 2016 | | | 27 | |
| | | | | | |
| | |
| | | | COLUMBIA FLEXIBLE CAPITAL INCOME FUND | | |
NOTES TO FINANCIAL STATEMENTS (continued)
November 30, 2016 (Unaudited)
readily available or not believed to be reflective of market value may also be valued based upon a bid quote from an approved independent broker-dealer. Debt securities maturing in 60 days or less are valued primarily at amortized cost value, unless this method results in a valuation that management believes does not approximate market value.
Foreign equity securities are valued based on the closing price on the foreign exchange in which such securities are primarily traded. If any foreign equity security closing prices are not readily available, the securities are valued at the mean of the latest quoted bid and ask prices on such exchanges or markets. Foreign currency exchange rates are generally determined at 4:00 p.m. Eastern (U.S.) time. Many securities markets and exchanges outside the U.S. close prior to the close of the NYSE; therefore, the closing prices for securities in such markets or on such exchanges may not fully reflect events that occur after such close but before the close of the NYSE. In those situations, foreign securities will be fair valued pursuant to a policy adopted by the Board, including, if available, utilizing a third party pricing service to determine these fair values. The third party pricing service takes into account multiple factors, including, but not limited to, movements in the U.S. securities markets, certain depositary receipts, futures contracts and foreign exchange rates that have occurred subsequent to the close of the foreign exchange or market, to determine a good faith estimate that reasonably reflects the current market conditions as of the close of the NYSE. The fair value of a security is likely to be different from the quoted or published price, if available.
Investments in open-end investment companies, including money market funds, are valued at their latest net asset value.
Investments for which market quotations are not readily available, or that have quotations which management believes are not reflective of market value or reliable, are valued at fair value as determined in good faith under procedures approved by and under the general supervision of the Board. If a security or class of securities (such as foreign securities) is valued at fair value, such value is likely to be different from the quoted or published price for the security.
The determination of fair value often requires significant judgment. To determine fair value, management may use assumptions including but not limited to future cash flows and estimated risk premiums. Multiple inputs from various sources may be used to determine fair value.
GAAP requires disclosure regarding the inputs and valuation techniques used to measure fair value and any changes in valuation inputs or techniques. In addition, investments shall be disclosed by major category. This information is disclosed following the Fund’s Portfolio of Investments.
Foreign Currency Transactions and Translations
The values of all assets and liabilities denominated in foreign currencies are generally translated into U.S. dollars at exchange rates determined at the close of regular trading on the NYSE. Net realized and unrealized gains (losses) on foreign currency transactions and translations include gains (losses) arising from the fluctuation in exchange rates between trade and settlement dates on securities transactions, gains (losses) arising from the disposition of foreign currency and currency gains (losses) between the accrual and payment dates on dividends, interest income and foreign withholding taxes.
For financial statement purposes, the Fund does not distinguish that portion of gains (losses) on investments which is due to changes in foreign exchange rates from that which is due to changes in market prices of the investments. Such fluctuations are included with the net realized and unrealized gains (losses) on investments in the Statement of Operations.
Delayed Delivery Securities
The Fund may trade securities on other than normal settlement terms, including securities purchased or sold on a “when-issued” basis. This may increase risk to the Fund since the other party to the transaction may fail to deliver, which could cause the Fund to subsequently invest at less advantageous prices. The Fund designates cash or liquid securities in an amount equal to the delayed delivery commitment.
Security Transactions
Security transactions are accounted for on the trade date. Cost is determined and gains (losses) are based upon the specific identification method for both financial statement and federal income tax purposes.
Income Recognition
Corporate actions and dividend income are generally recorded net of any non-reclaimable tax withholdings, on the ex-dividend date or upon receipt of ex-dividend notification in the case of certain foreign securities.
Interest income is recorded on an accrual basis. Market premiums and discounts, including original issue
| | |
| 28 | | Semiannual Report 2016 |
| | | | | | |
| | |
| | | | COLUMBIA FLEXIBLE CAPITAL INCOME FUND | | |
NOTES TO FINANCIAL STATEMENTS (continued)
November 30, 2016 (Unaudited)
discounts, are amortized and accreted, respectively, over the expected life of the security on all debt securities, unless otherwise noted.
The Fund may place a debt security on non-accrual status and reduce related interest income when it becomes probable that the interest will not be collected and the amount of uncollectible interest can be reasonably estimated. A defaulted debt security is removed from non-accrual status when the issuer resumes interest payments or when collectibility of interest is reasonably assured.
The Fund may receive distributions from holdings in equity securities, business development companies (BDCs), exchange-traded funds, other regulated investment companies (RICs), and real estate investment trusts (REITs), which report information on the tax character of their distributions annually. These distributions are allocated to dividend income, capital gain and return of capital based on actual information reported. Return of capital is recorded as a reduction of the cost basis of securities held. If the Fund no longer owns the applicable securities, return of capital is recorded as a realized gain. With respect to REITs, to the extent actual information has not yet been reported, estimates for return of capital are made by the Fund’s management. Management’s estimates are subsequently adjusted when the actual character of the distributions is disclosed by the REITs, which could result in a proportionate change in return of capital to shareholders.
Awards from class action litigation are recorded as a reduction of cost basis if the Fund still owns the applicable securities on the payment date. If the Fund no longer owns the applicable securities, the proceeds are recorded as realized gains.
The value of additional securities received as an income payment is recorded as income and increases the cost basis of such securities.
Expenses
General expenses of the Trust are allocated to the Fund and other funds of the Trust based upon relative net assets or other expense allocation methodologies determined by the nature of the expense. Expenses directly attributable to the Fund are charged to the Fund. Expenses directly attributable to a specific class of shares are charged to that share class.
Determination of Class Net Asset Value
All income, expenses (other than class-specific expenses, which are charged to that share class, as shown in the Statement of Operations) and realized and unrealized gains (losses) are allocated to each class of the Fund on a daily basis, based on the relative net assets of each class, for purposes of determining the net asset value of each class.
Federal Income Tax Status
The Fund intends to qualify each year as a regulated investment company under Subchapter M of the Internal Revenue Code, as amended, and will distribute substantially all of its taxable income (including net short-term capital gains), if any, for its tax year, and as such will not be subject to federal income taxes. In addition, the Fund intends to distribute in each calendar year substantially all of its net investment income, capital gains and certain other amounts, if any, such that the Fund should not be subject to federal excise tax. Therefore, no federal income or excise tax provision is recorded.
Foreign Taxes
The Fund may be subject to foreign taxes on income, gains on investments or currency repatriation, a portion of which may be recoverable. The Fund will accrue such taxes and recoveries, as applicable, based upon its current interpretation of tax rules and regulations that exist in the markets in which it invests.
Realized gains in certain countries may be subject to foreign taxes at the Fund level, based on statutory rates. The Fund accrues for such foreign taxes on realized and unrealized gains at the appropriate rate for each jurisdiction, as applicable. The amount, if any, is disclosed as a liability on the Statement of Assets and Liabilities.
Distributions to Shareholders
Distributions from net investment income, if any, are declared and paid each calendar quarter. Net realized capital gains, if any, are distributed at least annually. Income distributions and capital gain distributions are determined in accordance with federal income tax regulations, which may differ from GAAP.
Guarantees and Indemnifications
Under the Trust’s organizational documents and, in some cases, by contract, its officers and trustees are indemnified against certain liabilities arising out of the
| | | | |
| Semiannual Report 2016 | | | 29 | |
| | | | | | |
| | |
| | | | COLUMBIA FLEXIBLE CAPITAL INCOME FUND | | |
NOTES TO FINANCIAL STATEMENTS (continued)
November 30, 2016 (Unaudited)
performance of their duties to the Trust or its funds. In addition, certain of the Fund’s contracts with its service providers contain general indemnification clauses. The Fund’s maximum exposure under these arrangements is unknown since the amount of any future claims that may be made against the Fund cannot be determined, and the Fund has no historical basis for predicting the likelihood of any such claims.
Investment Company Reporting Modernization
In October 2016, the U.S. Securities and Exchange Commission adopted new rules and forms, and amendments to certain current rules and forms, to modernize reporting and disclosure of information by registered investment companies. The amendments to Regulation S-X will require standardized, enhanced disclosure about derivatives in investment company financial statements, and will also change the rules governing the form and content of such financial statements. The amendments to Regulation S-X take effect on August 1, 2017. At this time, management is assessing the anticipated impact of these regulatory developments.
Note 3. Fees and Other Transactions with Affiliates
Management Services Fees
The Fund entered into a Management Agreement with Columbia Management Investment Advisers, LLC (the Investment Manager), a wholly-owned subsidiary of Ameriprise Financial, Inc. (Ameriprise Financial). Under the Management Agreement, the Investment Manager provides the Fund with investment research and advice, as well as administrative and accounting services. The management services fee is an annual fee that is equal to a percentage of the Fund’s average daily net assets that declines from 0.65% to 0.54% as the Fund’s net assets increase. The annualized effective management services fee rate for the six months ended November 30, 2016 was 0.65% of the Fund’s average daily net assets.
Other Expenses
Other expenses are for, among other things, miscellaneous expenses of the Fund or the Board, including payments to Board Services Corp., a company providing limited administrative services to the Fund and the Board. That company’s expenses include boardroom and office expense, employee compensation, employee health and retirement benefits, and certain other expenses.
Compensation of Board Members
Board members, who are not officers or employees of the Investment Manager or Ameriprise Financial, are compensated for their services to the Fund as disclosed in the Statement of Operations. Under a Deferred Compensation Plan (the Plan), these Board members may elect to defer payment of up to 100% of their compensation. Deferred amounts are treated as though equivalent dollar amounts had been invested in shares of certain funds managed by the Investment Manager. The Fund’s liability for these amounts is adjusted for market value changes and remains in the Fund until distributed in accordance with the Plan. All amounts payable under the Plan constitute a general unsecured obligation of the Fund.
Compensation of Chief Compliance Officer
The Board has appointed a Chief Compliance Officer to the Fund in accordance with federal securities regulations. The Fund is allocated a portion of the expenses associated with the Chief Compliance Officer based on relative net assets of the Trust.
Transfer Agency Fees
Under a Transfer and Dividend Disbursing Agent Agreement, Columbia Management Investment Services Corp. (the Transfer Agent), an affiliate of the Investment Manager and a wholly-owned subsidiary of Ameriprise Financial, is responsible for providing transfer agency services to the Fund. The Transfer Agent has contracted with Boston Financial Data Services (BFDS) to serve as sub-transfer agent. The Transfer Agent pays the fees of BFDS for services as sub-transfer agent and BFDS is not entitled to reimbursement for such fees from the Fund (with the exception of out-of-pocket fees).
The Fund pays the Transfer Agent a monthly transfer agency fee based on the number or the average value of accounts, depending on the type of account. In addition, prior to October 1, 2016, the Transfer Agent also received sub-transfer agency fees based on a percentage of the average aggregate value of the Fund’s shares maintained in omnibus accounts (other than omnibus accounts for which American Enterprise Investment Services Inc. is the broker of record or accounts where the beneficial shareholder is a customer of Ameriprise Financial Services, Inc., for which the Transfer Agent receives a per account fee). Effective October 1, 2016, the Fund pays the Transfer Agent a fee for shareholder services based on the number of accounts or on a percentage of the average aggregate value of the Fund’s shares maintained in omnibus accounts up to the lesser
| | |
| 30 | | Semiannual Report 2016 |
| | | | | | |
| | |
| | | | COLUMBIA FLEXIBLE CAPITAL INCOME FUND | | |
NOTES TO FINANCIAL STATEMENTS (continued)
November 30, 2016 (Unaudited)
of the amount charged by the servicing agent or a cap established by the Board from time to time.
The Transfer Agent also receives compensation from the Fund for various shareholder services and reimbursements for certain out-of-pocket fees. Effective January 1, 2017, total transfer agency fees for Class R5 shares are subject to an annual limitation of not more than 0.075% of the average daily net assets attributable to Class R5 shares. Total transfer agency fees for Class I shares are subject to an annual limitation of not more than 0.025% of the average daily net assets attributable to Class I shares. Prior to January 1, 2017, total transfer agency fees for Class R5 shares were subject to an annual limitation of not more than 0.05% of the average daily net assets attributable to Class R5 shares. Class I shares did not pay transfer agency fees.
For the six months ended November 30, 2016, the Fund’s annualized effective transfer agency fee rates as a percentage of average daily net assets of each class were as follows:
| | | | |
Class A | | | 0.12 | % |
Class C | | | 0.12 | |
Class R | | | 0.12 | |
Class R4 | | | 0.12 | |
Class R5 | | | 0.05 | |
Class W | | | 0.11 | |
Class Z | | | 0.12 | |
An annual minimum account balance fee of $20 may apply to certain accounts with a value below the applicable share class’s initial minimum investment requirements to reduce the impact of small accounts on transfer agency fees. These minimum account balance fees are remitted to the Fund and recorded as part of expense reductions in the Statement of Operations. For the six months ended November 30, 2016, no minimum account balance fees were charged by the Fund.
Distribution and Service Fees
The Fund has an agreement with Columbia Management Investment Distributors, Inc. (the Distributor), an affiliate of the Investment Manager and a wholly-owned subsidiary of Ameriprise Financial, for distribution and shareholder services. Under a Plan and Agreement of Distribution, the Fund pays a fee at an annual rate of up to 0.25% of the Fund’s average daily net assets attributable to Class A and Class W shares, a fee at an annual rate of up to 0.50% of the Fund’s average daily net assets attributable to Class R shares (of which up to
0.25% may be used for shareholder services) and a fee at an annual rate of up to 1.00% of the Fund’s average daily net assets attributable to Class C shares. For Class C shares, of the 1.00% fee, up to 0.75% is reimbursed for distribution expenses.
The amount of distribution and shareholder services expenses incurred by the Distributor and not yet reimbursed (unreimbursed expense) was approximately $621,000 for Class C shares. These amounts are based on the most recent information available as of September 30, 2016, and may be recovered from future payments under the distribution plan or CDSCs. To the extent the unreimbursed expense has been fully recovered, the distribution and/or shareholder services fee is reduced.
Sales Charges
Sales charges, including front-end charges and CDSCs, received by the Distributor for distributing Fund shares were $130,136 for Class A and $3,840 for Class C shares for the six months ended November 30, 2016.
Expenses Waived/Reimbursed by the Investment Manager and its Affiliates
The Investment Manager and certain of its affiliates have contractually agreed to waive fees and/or reimburse expenses (excluding certain fees and expenses described below) for the periods disclosed below, unless sooner terminated at the sole discretion of the Board, so that the Fund’s net operating expenses, after giving effect to fees waived/expenses reimbursed and any balance credits and/or overdraft charges from the Fund’s custodian, do not exceed the following annual rates as a percentage of the class’ average daily net assets:
| | | | | | | | |
| | | October 1, 2016 through September 30, 2017 | | | Prior to October 1, 2016 | |
Class A | | | 1.26 | % | | | 1.30 | % |
Class C | | | 2.01 | | | | 2.05 | |
Class I | | | 0.91 | | | | 0.95 | |
Class R | | | 1.51 | | | | 1.55 | |
Class R4 | | | 1.01 | | | | 1.05 | |
Class R5 | | | 0.96 | | | | 1.00 | |
Class W | | | 1.26 | | | | 1.30 | |
Class Z | | | 1.01 | | | | 1.05 | |
Under the agreement governing these fee waivers and/or expense reimbursement arrangements, the following fees and expenses are excluded from the waiver/reimbursement commitment, and therefore will be paid
| | | | |
| Semiannual Report 2016 | | | 31 | |
| | | | | | |
| | |
| | | | COLUMBIA FLEXIBLE CAPITAL INCOME FUND | | |
NOTES TO FINANCIAL STATEMENTS (continued)
November 30, 2016 (Unaudited)
by the Fund, if applicable: taxes (including foreign transaction taxes), expenses associated with investments in affiliated and non-affiliated pooled investment vehicles (including mutual funds and exchange-traded funds), transaction costs and brokerage commissions, costs related to any securities lending program, dividend and interest expenses associated with securities sold short, inverse floater program fees and expenses, transaction charges and interest on borrowed money, interest, infrequent and/or unusual expenses and any other expenses the exclusion of which is specifically approved by the Board. This agreement may be modified or amended only with approval from the Investment Manager, certain of its affiliates and the Fund. Any fees waived and/or expenses reimbursed under the expense reimbursement arrangements described above are not recoverable by the Investment Manager or its affiliates in future periods.
Note 4. Federal Tax Information
The timing and character of income and capital gain distributions are determined in accordance with income tax regulations, which may differ from GAAP because of temporary or permanent book to tax differences.
At November 30, 2016, the cost of investments for federal income tax purposes was approximately $449,089,000 and the aggregate gross approximate unrealized appreciation and depreciation based on that cost was:
| | | | |
Unrealized appreciation | | | $35,555,000 | |
Unrealized depreciation | | | (30,352,000 | ) |
Net unrealized appreciation | | | $5,203,000 | |
Under current tax rules, regulated investment companies can elect to treat certain late-year ordinary losses incurred and post-October capital losses (capital losses realized after October 31) as arising on the first day of the following taxable year. The Fund has elected to treat post-October capital losses of $38,572,438 as arising on June 1, 2016.
Management of the Fund has concluded that there are no significant uncertain tax positions in the Fund that would require recognition in the financial statements. However, management’s conclusion may be subject to review and adjustment at a later date based on factors including, but not limited to, new tax laws, regulations, and administrative interpretations (including relevant court decisions). Generally, the Fund’s federal tax returns for the prior three fiscal years remain subject to examination by the Internal Revenue Service.
Note 5. Portfolio Information
The cost of purchases and proceeds from sales of securities, excluding short-term investments and derivatives, if any, aggregated to $168,230,100 and $197,626,128, respectively, for the six months ended November 30, 2016. The amount of purchase and sale activity impacts the portfolio turnover rate reported in the Financial Highlights.
Note 6. Line of Credit
The Fund has access to a revolving credit facility with a syndicate of banks led by Citibank, N.A., HSBC Bank USA, N.A. and JPMorgan Chase Bank, N.A. whereby the Fund may borrow for the temporary funding of shareholder redemptions or for other temporary or emergency purposes. The credit facility agreement, which is a collective agreement between the Fund and certain other funds managed by the Investment Manager, severally and not jointly, that permits collective borrowings up to $1 billion. Interest is charged to each participating fund based on its borrowings at a rate equal to the higher of (i) the overnight federal funds rate plus 1.00% or (ii) the one-month LIBOR rate plus 1.00%. Each borrowing under the credit facility matures no later than 60 days after the date of borrowing. The Fund also pays a commitment fee equal to its pro rata share of the amount of the credit facility at a rate of 0.15% per annum. The commitment fee is included in other expenses in the Statement of Operations.
The Fund had no borrowings during the six months ended November 30, 2016.
Note 7. Significant Risks
Shareholder Concentration Risk
At November 30, 2016, affiliated shareholders of record owned 53.4% of the outstanding shares of the Fund in one or more accounts. Subscription and redemption activity by concentrated accounts may have a significant effect on the operations of the Fund. In the case of a large redemption, the Fund may be forced to sell investments at inopportune times, including its liquid or more liquid positions, resulting in Fund losses and the Fund holding a higher percentage of less liquid or illiquid securities. Large redemptions could result in decreased economies of scale and increased operating expenses for non-redeeming Fund shareholders.
| | |
| 32 | | Semiannual Report 2016 |
| | | | | | |
| | |
| | | | COLUMBIA FLEXIBLE CAPITAL INCOME FUND | | |
NOTES TO FINANCIAL STATEMENTS (continued)
November 30, 2016 (Unaudited)
Credit Risk
Credit risk is the risk that the value of debt securities in the Fund’s portfolio may decline because the issuer may default and fail to pay interest or repay principal when due. Rating agencies assign credit ratings to debt securities to indicate their credit risk. Lower rated or unrated debt securities held by the Fund may present increased credit risk as compared to higher-rated debt securities.
Interest Rate Risk
Interest rate risk is the risk of losses attributable to changes in interest rates. In general, if prevailing interest rates rise, the values of debt securities tend to fall, and if interest rates fall, the values of debt securities tend to rise. Actions by governments and central banking authorities can result in increases in interest rates. Increasing interest rates may negatively affect the value of debt securities held by the Fund, resulting in a negative impact on the Fund’s performance and net asset value per share. In general, the longer the maturity or duration of a debt security, the greater its sensitivity to changes in interest rates.
Liquidity Risk
Liquidity risk is the risk associated with a lack of marketability of investments which may make it difficult to sell the investment at a desirable time or price. Changing regulatory, market or other conditions or environments (for example, the interest rate or credit environments) may adversely affect the liquidity of the Fund’s investments. The Fund may have to accept a lower selling price for the holding, sell other investments, or forego another, more appealing investment opportunity. Generally, the less liquid the market at the time the Fund sells a portfolio investment, the greater the risk of loss or decline of value to the Fund. A less liquid market can lead to an increase in Fund redemptions, which may negatively impact Fund performance and net asset value per share, including, for example, if the Fund is forced to sell securities in a down market.
Note 8. Subsequent Events
Management has evaluated the events and transactions that have occurred through the date the financial statements were issued and noted no items requiring adjustment of the financial statements or additional disclosure.
Note 9. Information Regarding Pending and Settled Legal Proceedings
Ameriprise Financial and certain of its affiliates have historically been involved in a number of legal, arbitration and regulatory proceedings, including routine litigation, class actions, and governmental actions, concerning matters arising in connection with the conduct of their business activities. Ameriprise Financial believes that the Funds are not currently the subject of, and that neither Ameriprise Financial nor any of its affiliates are the subject of, any pending legal, arbitration or regulatory proceedings that are likely to have a material adverse effect on the Funds or the ability of Ameriprise Financial or its affiliates to perform under their contracts with the Funds. Ameriprise Financial is required to make quarterly (10-Q), annual (10-K) and, as necessary, 8-K filings with the Securities and Exchange Commission (SEC) on legal and regulatory matters that relate to Ameriprise Financial and its affiliates. Copies of these filings may be obtained by accessing the SEC website at www.sec.gov.
There can be no assurance that these matters, or the adverse publicity associated with them, will not result in increased fund redemptions, reduced sale of fund shares or other adverse consequences to the Funds. Further, although we believe proceedings are not likely to have a material adverse effect on the Funds or the ability of Ameriprise Financial or its affiliates to perform under their contracts with the Funds, these proceedings are subject to uncertainties and, as such, we are unable to estimate the possible loss or range of loss that may result. An adverse outcome in one or more of these proceedings could result in adverse judgments, settlements, fines, penalties or other relief that could have a material adverse effect on the consolidated financial condition or results of operations of Ameriprise Financial.
| | | | |
| Semiannual Report 2016 | | | 33 | |
| | | | | | |
| | |
| | | | COLUMBIA FLEXIBLE CAPITAL INCOME FUND | | |
APPROVAL OF MANAGEMENT AGREEMENT
Columbia Management Investment Advisers, LLC (Columbia Threadneedle or the Investment Manager, and together with its domestic and global affiliates, Columbia Threadneedle Investments), a wholly-owned subsidiary of Ameriprise Financial, Inc. (Ameriprise Financial), serves as the investment manager to Columbia Flexible Capital Income Fund (the Fund). Under a management agreement (the Management Agreement), Columbia Threadneedle provides investment advice and other services to the Fund and other funds distributed by Columbia Management Investment Distributors, Inc. (collectively, the Funds).
On an annual basis, the Fund’s Board of Trustees (the Board), including the independent Board members (the Independent Trustees), considers renewal of the Management Agreement. Columbia Threadneedle prepared detailed reports for the Board and its Contracts Committee in February, March and April 2016, including reports providing the results of analyses performed by an independent organization, Broadridge Financial Solutions, Inc. (Broadridge), and a comprehensive response to items of information requested by independent legal counsel to the Independent Trustees (Independent Legal Counsel) in a letter to the Investment Manager, to assist the Board in making this determination. Many of the materials presented in February, March and April were first supplied in draft form to designated independent Board representatives, i.e., Independent Legal Counsel, the Chair of the Board and/or the Chair of the Contracts Committee, and the final materials were revised to contain information reflective of discussion and subsequent requests made by the Contracts Committee. In addition, throughout the year, the Board (or its committees) regularly meets with portfolio management teams and senior management personnel and reviews information prepared by Columbia Threadneedle addressing the services Columbia Threadneedle provides and Fund performance. The Board also accords appropriate weight to the work, deliberations and conclusions of the various committees, such as the Contracts Committee, the Investment Review Committee and the Compliance Committee in determining whether to continue the Management Agreement.
The Board, at its June 13-15, 2016 in-person Board meeting (the June Meeting), considered the renewal of the Management Agreement for an additional one-year term. At the June Meeting, Independent Legal Counsel reviewed with the Independent Trustees various factors relevant to the Board’s consideration of management agreements and the Board’s legal responsibilities related to such consideration. Following an analysis and discussion of the factors identified below, the Board, including all of the Independent Trustees, approved the renewal of the Management Agreement.
Nature, Extent and Quality of Services Provided by Columbia Threadneedle
The Independent Trustees analyzed various reports and presentations they had received detailing the services performed by Columbia Threadneedle, as well as its organization, expertise, resources and capabilities.
The Independent Trustees specifically considered many developments during the past year concerning the services provided by Columbia Threadneedle, including, in particular, the relatively recent change in the leadership of equity department oversight, improvements in technology research and the use of research analysts’ model portfolios to highlight best ideas and improve implementation. The Independent Trustees further noted the restructured investment risk management department and its additional resources, including the new head of multi-asset investment risk. They also observed the relatively recent 5P leadership transition, and the additional staff and resources dedicated to the 5P team. The Board also noted the broad scope of services provided by Columbia Threadneedle to each Fund, including, among other services, investment, risk and compliance oversight. The Board also took into account the information it received concerning Columbia Threadneedle’s ability to attract and retain key portfolio management personnel.
In connection with the Board’s evaluation of the overall package of services provided by Columbia Threadneedle, the Board also considered the nature, quality and range of administrative services provided to the Fund by Columbia Threadneedle, as well as the achievements in 2015 in the performance of administrative services, and noted the various enhancements anticipated for 2016. In evaluating the quality of services provided under the Management Agreement, the Independent Trustees also took into account the organization and strength of the Fund’s and its service providers’ compliance programs. In addition, the Board reviewed the financial condition of Columbia Threadneedle and its affiliates and each entity’s ability to carry out its responsibilities under the Management Agreement and the Fund’s other service agreements with affiliates of Ameriprise Financial, observing the financial strength of Ameriprise Financial, with its solid balance sheet.
| | |
| 34 | | Semiannual Report 2016 |
| | | | | | |
| | |
| | | | COLUMBIA FLEXIBLE CAPITAL INCOME FUND | | |
APPROVAL OF MANAGEMENT AGREEMENT (continued)
The Board also discussed the acceptability of the terms of the Management Agreement (including the relatively broad scope of services required to be performed by Columbia Threadneedle), noting that no material changes are proposed from the form of agreement previously approved. They also noted the wide array of legal and compliance services provided to the Funds. It was also observed that the services being performed under the Management Agreement were of a reasonably high quality.
Based on the foregoing, and based on other information received (both oral and written, including the information on investment performance referenced below) and other considerations, the Board concluded that Columbia Threadneedle and its affiliates are in a position to continue to provide a high quality and level of services to the Fund.
Investment Performance
For purposes of evaluating the nature, extent and quality of services provided under the Management Agreement, the Board carefully reviewed the investment performance of the Fund. In this regard, the Board considered detailed reports providing the results of analyses performed by an independent organization showing, for various periods, the performance of the Fund, the performance of a benchmark index, the percentage ranking of the Fund among its comparison group and the net assets of the Fund. The Board observed that the Fund’s investment performance was appropriate in light of the particular management style involved and the particular market environment.
Comparative Fees, Costs of Services Provided and the Profits Realized by Columbia Threadneedle and its Affiliates from their Relationships with the Fund
The Board reviewed comparative fees and the costs of services provided under the Management Agreement. The Board members considered detailed comparative information set forth in an annual report on fees and expenses, including, among other things, data (based on analyses conducted by an independent organization) showing a comparison of the Fund’s expenses with median expenses paid by funds in its comparative peer universe, as well as data showing the Fund’s contribution to Columbia Threadneedle’s profitability.
The Board considered the reports of its independent fee consultant, JDL Consultants, LLC (JDL), which assisted in its analysis of the Funds’ performance and expenses, the reasonableness of the Funds’ fee rates, the reasonableness of Columbia Threadneedle’s profitability, and JDL’s conclusion that the management fees being charged to the Fund are reasonable. The Board accorded particular weight to the notion that the level of fees should generally reflect a rational pricing model applied consistently across the various product lines in the Fund family, while assuring that the overall fees for each Fund (with certain defined exceptions) are generally in line with the “pricing philosophy” currently in effect (i.e., that the total expense ratio of the Fund is generally no higher than the median expense ratio of funds in the comparison universe of the Fund). The Board took into account that the Fund’s total expense ratio (after considering proposed expense caps/waivers) was below the peer universe’s median expense ratio shown in the reports. Based on its review, the Board concluded that the Fund’s management fee was fair and reasonable in light of the extent and quality of services that the Fund receives.
The Board also considered the expected profitability of Columbia Threadneedle and its affiliates in connection with Columbia Threadneedle providing management services to the Fund. In this regard, the Independent Trustees referred to their detailed analysis of the Profitability Report, discussing the profitability to Columbia Threadneedle and Ameriprise Financial from managing, operating and distributing the Funds. The Board took into account JDL’s conclusion that 2015 Columbia Threadneedle profitability, relative to industry competitors, was reasonable. It also considered that in 2015 the Board had concluded that 2014 profitability was reasonable and that Columbia Threadneedle generated 2015 profitability that only slightly exceeded 2014 levels. It also took into account the indirect economic benefits flowing to Columbia Threadneedle or its affiliates in connection with managing or distributing the Funds, such as the enhanced ability to offer various other financial products to Ameriprise Financial customers, soft dollar benefits and overall reputational advantages. The Board noted that the fees paid by the Fund should permit the Investment Manager to offer competitive compensation to its personnel, make necessary investments in its business and earn an appropriate profit. The Board concluded that profitability levels were reasonable.
| | | | |
| Semiannual Report 2016 | | | 35 | |
| | | | | | |
| | |
| | | | COLUMBIA FLEXIBLE CAPITAL INCOME FUND | | |
APPROVAL OF MANAGEMENT AGREEMENT (continued)
Economies of Scale to be Realized
The Board also considered the economies of scale that might be realized by Columbia Threadneedle as the Fund grows and took note of the extent to which Fund shareholders might also benefit from such growth. In this regard, the Board took into account that management fees decline as Fund assets exceed various breakpoints, all of which have not been surpassed. The Board concluded that the breakpoints in the management fee rate schedule satisfactorily provides for the sharing of economies of scale, as they allow for adequate opportunity for shareholders to realize benefits (fee breaks) as Fund assets grow.
Based on the foregoing, the Board, including all of the Independent Trustees, concluded that the management fees were fair and reasonable in light of the extent and quality of services provided. In reaching this conclusion, no single factor was determinative. On June 15, 2016, the Board, including all of the Independent Trustees, approved the renewal of the Management Agreement.
| | |
| 36 | | Semiannual Report 2016 |
| | | | | | |
| | |
| | | | COLUMBIA FLEXIBLE CAPITAL INCOME FUND | | |
IMPORTANT INFORMATION ABOUT THIS REPORT
Each fund mails one shareholder report to each shareholder address. If you would like more than one report, please call shareholder services at 800.345.6611 and additional reports will be sent to you.
The policy of the Board is to vote the proxies of the companies in which each fund holds investments consistent with the procedures as stated in the Statement of Additional Information (SAI). You may obtain a copy of the SAI without charge by calling 800.345.6611; contacting your financial intermediary; visiting investor.columbiathreadneedleus.com; or searching the website of the Securities and Exchange Commission (SEC) at sec.gov. Information regarding how each fund voted proxies relating to portfolio securities is filed with the SEC by August 31st for the most recent 12-month period ending June 30th of that year, and is available without charge by visiting investor.columbiathreadneedleus.com, or searching the website of the SEC at sec.gov.
Each fund files a complete schedule of portfolio holdings with the SEC for the first and third quarters of each fiscal year on Form N-Q. Each fund’s Form N-Q is available on the SEC’s website at sec.gov and may be reviewed and copied at the SEC’s Public Reference Room in Washington, D.C. Information on the operation of the Public Reference Room may be obtained by calling 800.SEC.0330. Each fund’s complete schedule of portfolio holdings, as filed on Form N-Q, can also be obtained without charge, upon request, by calling 800.345.6611.
| | | | |
| Semiannual Report 2016 | | | 37 | |
Columbia Flexible Capital Income Fund
P.O. Box 8081
Boston, MA 02266-8081
Please read and consider the investment objectives, risks, charges and expenses for any fund carefully before investing. For a prospectus and summary prospectus, which contains this and other important information about the Fund, go to investor.columbiathreadneedleus.com. The Fund is distributed by Columbia Management Investment Distributors, Inc., member FINRA, and managed by Columbia Management Investment Advisers, LLC.
Columbia Threadneedle Investments (Columbia Threadneedle) is the global brand name of the Columbia and Threadneedle group of companies. All rights reserved. Columbia Management Investment Distributors, Inc., 225 Franklin Street, Boston, MA 02110-2804
© 2017 Columbia Management Investment Advisers, LLC.
investor.columbiathreadneedleus.com
SAR148_05_G01_(01/17)

SEMIANNUAL REPORT
November 30, 2016

COLUMBIA SELIGMAN COMMUNICATIONS AND INFORMATION FUND

PRESIDENT’S MESSAGE

Dear Shareholders,
While emotions have run high following the outcome of the U.S. Presidential election, it remains unclear how the Trump presidency will unfold in terms of policy. We have a sense of the priorities espoused by the president-elect over the past eighteen months, but campaign priorities are not always realized and are often never pursued. What seems certain is that, while some investors have already priced expectations into the market, others have retreated, preferring instead a wait and see approach. The outcome of such behaviors appears to have created conditions ripe for ongoing market volatility.
While volatility in the financial markets can be stressful, volatility itself is not a new phenomenon. Other factors that have been at the root cause of recent volatility include uncertainty following the United Kingdom’s vote to exit the European Union (Brexit), speculation around the Federal Reserve’s decision to increase interest rates, divergent central bank policy and geopolitical unrest. The point is, financial markets have fluctuated for years and may be expected to continue to fluctuate — sometimes wildly. If anything, such volatility seems to be the new normal, perhaps exacerbated by access to information and development of technological tools which have enabled investors to react rapidly to real and perceived change. So what can you do?
Position your portfolio for the reality of market volatility
That there is a historical precedent for market volatility, or even an acceptance that it may persist, offers little comfort. A measured and strategic approach remains the best strategy for investors to stay on track in achieving their investment goals.
Step 1: Review your investment goals
Take this opportunity to review your investment goals and the strategies you are pursuing to achieve those goals in order to remain focused on what’s important to you. It is entirely possible that your goals have changed in response either to your life situation or to changes in the market. Accept what you can’t control — volatility, and focus on what you can — your investment goals and strategies.
Step 2: Reassess your risk tolerance
Sit down with your financial advisor to discuss your investment goals and strategies, as well as any changes to your tolerance for risk. Consider your investment horizon. Increased market volatility and a new investment horizon may impact the strategies that can best help you achieve your investment goals. Remember, achieving your investment goals may require a certain amount of risk. Ultimately, you must maintain vigilance in reassessing your risk tolerance and the strategies you have selected in pursuit of your investment goals, and awareness of how those strategies may react to market volatility.
Step 3: Remain calm and focus on your long-term plan
Remember, investing is about the long game. Short term events are not necessarily evidence of a longer term reality. Investors who attempt to time the market too often end up reacting to a down turn by selling low and then compounding the problem by waiting on the sidelines, ultimately missing the right opportunity to reinvest.
As long as there is a market, there will be volatility. How you respond to that volatility can make a big difference in the measure of your success as an investor. Talk to your financial advisor about how working with Columbia Threadneedle Investments may help you position your portfolio for the reality of ongoing volatility and, perhaps, even turn such volatility into investment opportunity.
Best regards,

Christopher O. Petersen
President, Columbia Funds
Investors should consider the investment objectives, risks, charges and expenses of a mutual fund carefully before investing. For a free prospectus and summary prospectus, which contains this and other important information about a fund, visit investor.columbiathreadneedleus.com. The prospectus should be read carefully before investing.
Columbia Funds are distributed by Columbia Management Investment Distributors, Inc., member FINRA, and managed by Columbia Management Investment Advisers, LLC.
© 2017 Columbia Management Investment Advisers, LLC. All rights reserved.
Semiannual Report 2016
| | | | | | |
| | |
| | | | COLUMBIA SELIGMAN COMMUNICATIONS AND INFORMATION FUND | | |
TABLE OF CONTENTS
Fund Investment Manager
Columbia Management Investment
Advisers, LLC
225 Franklin Street
Boston, MA 02110
Fund Distributor
Columbia Management Investment
Distributors, Inc.
225 Franklin Street
Boston, MA 02110
Fund Transfer Agent
Columbia Management Investment
Services Corp.
P.O. Box 8081
Boston, MA 02266-8081
For more information about any of the funds, please visit investor.columbiathreadneedleus.com or call 800.345.6611. Customer Service Representatives are available to answer your questions Monday through Friday from 8 a.m. to 7 p.m. Eastern time.
The views expressed in this report reflect the current views of the respective parties. These views are not guarantees of future performance and involve certain risks, uncertainties and assumptions that are difficult to predict, so actual outcomes and results may differ significantly from the views expressed. These views are subject to change at any time based upon economic, market or other conditions and the respective parties disclaim any responsibility to update such views. These views may not be relied on as investment advice and, because investment decisions for a Columbia fund are based on numerous factors, may not be relied on as an indication of trading intent on behalf of any particular Columbia fund. References to specific securities should not be construed as a recommendation or investment advice.
Semiannual Report 2016
| | | | | | |
| | |
| | | | COLUMBIA SELIGMAN COMMUNICATIONS AND INFORMATION FUND | | |
PERFORMANCE OVERVIEW
(Unaudited)
Performance Summary
| ∎ | | Columbia Seligman Communications and Information Fund (the Fund) Class A shares returned 13.21% excluding sales charges for the six-month period that ended November 30, 2016. |
| ∎ | | The Fund outperformed its benchmark, the S&P North American Technology Sector Index, which returned 9.62% during the same time period. |
| | | | | | | | | | | | | | | | | | |
Average Annual Total Returns (%) (for period ended November 30, 2016) | | | | | |
| | | Inception | | 6 Months
Cumulative | | | 1 Year | | | 5 Years | | | 10 Years | |
Class A | | 06/23/83 | | | | | | | | | | | | | | | | |
Excluding sales charges | | | | | 13.21 | | | | 12.14 | | | | 15.44 | | | | 10.22 | |
Including sales charges | | | | | 6.71 | | | | 5.70 | | | | 14.08 | | | | 9.57 | |
Class B | | 04/22/96 | | | | | | | | | | | | | | | | |
Excluding sales charges | | | | | 13.19 | | | | 12.15 | | | | 15.25 | | | | 9.71 | |
Including sales charges | | | | | 8.19 | | | | 7.24 | | | | 15.02 | | | | 9.71 | |
Class C | | 05/27/99 | | | | | | | | | | | | | | | | |
Excluding sales charges | | | | | 12.78 | | | | 11.32 | | | | 14.58 | | | | 9.40 | |
Including sales charges | | | | | 11.78 | | | | 10.34 | | | | 14.58 | | | | 9.40 | |
Class I* | | 08/03/09 | | | 13.44 | | | | 12.61 | | | | 15.94 | | | | 10.56 | |
Class K* | | 08/03/09 | | | 13.25 | | | | 12.27 | | | | 15.59 | | | | 10.32 | |
Class R | | 04/30/03 | | | 13.07 | | | | 11.87 | | | | 15.15 | | | | 9.93 | |
Class R4* | | 08/03/09 | | | 13.34 | | | | 12.42 | | | | 15.65 | | | | 10.24 | |
Class R5 | | 11/30/01 | | | 13.39 | | | | 12.55 | | | | 15.88 | | | | 10.66 | |
Class Z* | | 09/27/10 | | | 13.35 | | | | 12.43 | | | | 15.73 | | | | 10.40 | |
S&P North American Technology Sector Index | | | | | 9.62 | | | | 10.37 | | | | 16.74 | | | | 10.24 | |
Returns for Class A are shown with and without the maximum initial sales charge of 5.75%. Returns for Class B are shown with and without the applicable contingent deferred sales charge (CDSC) of 5.00% in the first year, declining to 1.00% in the sixth year and eliminated thereafter. Returns for Class C are shown with and without the 1.00% CDSC for the first year only. The Fund’s other classes are not subject to sales charges and have limited eligibility. Please see the Fund’s prospectus for details. Performance for different share classes will vary based on differences in sales charges and fees associated with each class. All results shown assume reinvestment of distributions during the period. Returns do not reflect the deduction of taxes that a shareholder may pay on Fund distributions or on the redemption of Fund shares. Performance results reflect the effect of any fee waivers or reimbursements of Fund expenses by Columbia Management Investment Advisers, LLC and/or any of its affiliates. Absent these fee waivers or expense reimbursement arrangements, performance results would have been lower.
The performance information shown represents past performance and is not a guarantee of future results. The investment return and principal value of your investment will fluctuate so that your shares, when redeemed, may be worth more or less than their original cost. Current performance may be lower or higher than the performance information shown. You may obtain performance information current to the most recent month-end by contacting your financial intermediary, visiting investor.columbiathreadneedleus.com or calling 800.345.6611.
| * | The returns shown for periods prior to the share class inception date (including returns for the Life of the Fund, if shown, which are since Fund inception) include the returns of the Fund’s oldest share class. These returns are adjusted to reflect any higher class-related operating expenses of the newer share classes, as applicable. Please visit investor.columbiathreadneedleus.com/investment-products/mutual-funds/appended-performance for more information. |
The S&P North American Technology Sector Index is an unmanaged modified capitalization-weighted index based on a universe of technology-related stocks.
Indices are not available for investment, are not professionally managed and do not reflect sales charges, fees, brokerage commissions, taxes or other expenses of investing. Securities in the Fund may not match those in an index.
| | | | | | |
| | |
| | | | COLUMBIA SELIGMAN COMMUNICATIONS AND INFORMATION FUND | | |
PORTFOLIO OVERVIEW
(Unaudited)
| | | | |
Top Ten Holdings (%) (at November 30, 2016) | |
Lam Research Corp. | | | 9.4 | |
Broadcom Ltd. | | | 7.2 | |
Apple, Inc. | | | 5.6 | |
Qorvo, Inc. | | | 4.9 | |
Teradyne, Inc. | | | 4.4 | |
Synopsys, Inc. | | | 4.0 | |
Alphabet, Inc., Class C | | | 3.3 | |
Visa, Inc., Class A | | | 3.3 | |
NXP Semiconductors NV | | | 3.1 | |
Maxim Integrated Products, Inc. | | | 3.1 | |
Percentages indicated are based upon total investments (excluding Money Market Funds).
For further detail about these holdings, please refer to the section entitled “Portfolio of Investments.”
Fund holdings are as of the date given, are subject to change at any time, and are not recommendations to buy or sell any security.
| | | | |
Portfolio Breakdown (%) (at November 30, 2016) | |
Common Stocks | | | 96.1 | |
Money Market Funds | | | 3.9 | |
Total | | | 100.0 | |
Percentages indicated are based upon total investments. The Fund’s portfolio composition is subject to change.
| | | | |
Equity Sector Breakdown (%) (at November 30, 2016) | |
Consumer Discretionary | | | 0.8 | |
Financials | | | 0.0 | (a) |
Information Technology | | | 99.1 | |
Telecommunication Services | | | 0.1 | |
Total | | | 100.0 | |
Percentages indicated are based upon total equity investments. The Fund’s portfolio composition is subject to change.
| | | | |
Equity Sub-Industry Breakdown (%) (at November 30, 2016) | |
Information Technology | | | | |
Application Software | | | 8.3 | |
Communications Equipment | | | 5.1 | |
Data Processing & Outsourced Services | | | 5.7 | |
Internet Software & Services | | | 8.7 | |
IT Consulting & Other Services | | | 0.5 | |
Semiconductor Equipment | | | 16.6 | |
Semiconductors | | | 34.0 | |
Systems Software | | | 8.4 | |
Technology Hardware, Storage & Peripherals | | | 11.8 | |
Total | | | 99.1 | |
Percentages indicated are based upon total equity investments. The Fund’s portfolio composition is subject to change.
Portfolio Management
Paul Wick
Shekhar Pramanick
Sanjay Devgan
Jeetil Patel
Christopher Boova
Morningstar Style Box™
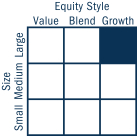
The Morningstar Style Box™ is based on a fund’s portfolio holdings. For equity funds, the vertical axis shows the market capitalization of the stocks owned, and the horizontal axis shows investment style (value, blend, or growth). Information shown is based on the most recent data provided by Morningstar.
© 2017 Morningstar, Inc. All rights reserved. The Morningstar information contained herein: (1) is proprietary to Morningstar and/or its content providers; (2) may not be copied or distributed; and (3) is not warranted to be accurate, complete or timely. Neither Morningstar nor its content providers are responsible for any damages or losses arising from any use of this information.
| | | | | | |
| | |
| | | | COLUMBIA SELIGMAN COMMUNICATIONS AND INFORMATION FUND | | |
UNDERSTANDING YOUR FUND’S EXPENSES
(Unaudited)
As an investor, you incur two types of costs. There are transaction costs, which generally include sales charges on purchases and may include redemption fees. There are also ongoing costs, which generally include management fees, distribution and/or service fees, and other fund expenses. The following information is intended to help you understand your ongoing costs (in dollars) of investing in the Fund and to help you compare these costs with the ongoing costs of investing in other mutual funds.
Analyzing Your Fund’s Expenses
To illustrate these ongoing costs, we have provided examples and calculated the expenses paid by investors in each share class of the Fund during the period. The actual and hypothetical information in the table is based on an initial investment of $1,000 at the beginning of the period indicated and held for the entire period. Expense information is calculated two ways and each method provides you with different information. The amount listed in the “Actual” column is calculated using the Fund’s actual operating expenses and total return for the period. You may use the Actual information, together with the amount invested, to estimate the expenses that you paid over the period. Simply divide your account value by $1,000 (for example, an $8,600 account value divided by $1,000 = 8.6), then multiply the results by the expenses paid during the period under the “Actual” column. The amount listed in the “Hypothetical” column assumes a 5% annual rate of return before expenses (which is not the Fund’s actual return) and then applies the Fund’s actual expense ratio for the period to the hypothetical return. You should not use the hypothetical account values and expenses to estimate either your actual account balance at the end of the period or the expenses you paid during the period. See “Compare With Other Funds” below for details on how to use the hypothetical data.
Compare With Other Funds
Since all mutual funds are required to include the same hypothetical calculations about expenses in shareholder reports, you can use this information to compare the ongoing cost of investing in the Fund with other funds. To do so, compare the hypothetical example with the 5% hypothetical examples that appear in the shareholder reports of other funds. As you compare hypothetical examples of other funds, it is important to note that hypothetical examples are meant to highlight the ongoing costs of investing in a fund only and do not reflect any transaction costs, such as sales charges, or redemption or exchange fees. Therefore, the hypothetical calculations are useful in comparing ongoing costs only, and will not help you determine the relative total costs of owning different funds. If transaction costs were included in these calculations, your costs would be higher.
June 1, 2016 – November 30, 2016
| | | | | | | | | | | | | | | | | | | | | | | | | | | | |
| | | Account Value at the
Beginning of the
Period ($) | | | Account Value at the
End of the
Period ($) | | | Expenses Paid During
the Period ($) | | | Fund’s Annualized
Expense Ratio (%) | |
| | | | Actual | | | | Hypothetical | | | | Actual | | | | Hypothetical | | | | Actual | | | | Hypothetical | | | | Actual | |
Class A | | | 1,000.00 | | | | 1,000.00 | | | | 1,132.10 | | | | 1,018.50 | | | | 7.00 | | | | 6.63 | | | | 1.31 | |
Class B | | | 1,000.00 | | | | 1,000.00 | | | | 1,131.90 | | | | 1,018.50 | | | | 7.00 | | | | 6.63 | | | | 1.31 | |
Class C | | | 1,000.00 | | | | 1,000.00 | | | | 1,127.80 | | | | 1,014.74 | | | | 10.99 | | | | 10.40 | | | | 2.06 | |
Class I | | | 1,000.00 | | | | 1,000.00 | | | | 1,134.40 | | | | 1,020.56 | | | | 4.82 | | | | 4.56 | | | | 0.90 | |
Class K | | | 1,000.00 | | | | 1,000.00 | | | | 1,132.50 | | | | 1,019.00 | | | | 6.47 | | | | 6.12 | | | | 1.21 | |
Class R | | | 1,000.00 | | | | 1,000.00 | | | | 1,130.70 | | | | 1,017.25 | | | | 8.33 | | | | 7.89 | | | | 1.56 | |
Class R4 | | | 1,000.00 | | | | 1,000.00 | | | | 1,133.40 | | | | 1,019.75 | | | | 5.67 | | | | 5.37 | | | | 1.06 | |
Class R5 | | | 1,000.00 | | | | 1,000.00 | | | | 1,133.90 | | | | 1,020.31 | | | | 5.08 | | | | 4.81 | | | | 0.95 | |
Class Z | | | 1,000.00 | | | | 1,000.00 | | | | 1,133.50 | | | | 1,019.70 | | | | 5.72 | | | | 5.42 | | | | 1.07 | |
Expenses paid during the period are equal to the annualized expense ratio for each class as indicated above, multiplied by the average account value over the period and then multiplied by the number of days in the Fund’s most recent fiscal half year and divided by 365.
Expenses do not include fees and expenses incurred indirectly by the Fund from its investment in underlying funds, including affiliated and non-affiliated pooled investment vehicles, such as mutual funds and exchange-traded funds.
| | | | | | |
| | |
| | | | COLUMBIA SELIGMAN COMMUNICATIONS AND INFORMATION FUND | | |
PORTFOLIO OF INVESTMENTS
November 30, 2016 (Unaudited)
(Percentages represent value of investments compared to net assets)
| | | | | | | | |
| Common Stocks 96.3% | |
| Issuer | | Shares | | | Value ($) | |
CONSUMER DISCRETIONARY 0.8% | |
Internet & Direct Marketing Retail 0.8% | |
| | |
Priceline Group, Inc. (The)(a) | | | 23,100 | | | | 34,735,008 | |
| | | | | | | | | |
Total Consumer Discretionary | | | | | | | 34,735,008 | |
| | |
| | | | | | | | |
FINANCIALS —% | |
Diversified Financial Services —% | |
| | |
Hanei Corp.(a)(b)(c) | | | 49,382 | | | | — | |
| | | | | | | | | |
Total Financials | | | | | | | — | |
| | |
| | | | | | | | |
INFORMATION TECHNOLOGY 95.4% | |
Communications Equipment 4.9% | |
| | |
Arista Networks, Inc.(a) | | | 641,757 | | | | 60,844,981 | |
| | |
Arris International PLC(a) | | | 1,465,700 | | | | 42,050,933 | |
| | |
Brocade Communications Systems, Inc. | | | 1,707,800 | | | | 21,074,252 | |
| | |
CommScope Holding Co., Inc.(a) | | | 328,575 | | | | 11,822,129 | |
| | |
F5 Networks, Inc.(a) | | | 39,400 | | | | 5,545,550 | |
| | |
Finisar Corp.(a) | | | 308,200 | | | | 10,241,486 | |
| | |
Flashpoint Technology, Inc.(a)(b)(c) | | | 246,914 | | | | — | |
| | |
Palo Alto Networks, Inc.(a) | | | 453,900 | | | | 60,990,543 | |
| | | | | | | | | |
Total | | | | | | | 212,569,874 | |
|
Internet Software & Services 8.4% | |
| | |
Alphabet, Inc., Class A(a) | | | 155,800 | | | | 120,882,104 | |
| | |
Alphabet, Inc., Class C(a) | | | 183,151 | | | | 138,835,784 | |
| | |
eBay, Inc.(a) | | | 1,345,000 | | | | 37,404,450 | |
| | |
Facebook, Inc., Class A(a) | | | 560,800 | | | | 66,409,936 | |
| | | | | | | | | |
Total | | | | | | | 363,532,274 | |
|
IT Services 6.0% | |
| | |
Computer Sciences Corp. | | | 350,100 | | | | 21,226,563 | |
| | |
Euronet Worldwide, Inc.(a) | | | 166,823 | | | | 11,964,546 | |
| | |
Fidelity National Information Services, Inc. | | | 390,200 | | | | 30,119,538 | |
| | |
Travelport Worldwide Ltd. | | | 4,235,124 | | | | 59,291,736 | |
| | |
Visa, Inc., Class A | | | 1,779,300 | | | | 137,575,476 | |
| | | | | | | | | |
Total | | | | | | | 260,177,859 | |
|
Semiconductors & Semiconductor Equipment 48.7% | |
| | |
Acacia Communications, Inc.(a) | | | 298,900 | | | | 20,701,814 | |
| | |
Advanced Energy Industries, Inc.(a) | | | 307,860 | | | | 16,996,951 | |
| | |
Applied Materials, Inc. | | | 1,582,800 | | | | 50,966,160 | |
| | |
Broadcom Ltd. | | | 1,766,101 | | | | 301,102,559 | |
| | |
Cavium, Inc.(a) | | | 2,089,048 | | | | 119,138,407 | |
| | |
Integrated Device Technology, Inc.(a) | | | 1,378,000 | | | | 32,245,200 | |
| | |
KLA-Tencor Corp. | | | 615,403 | | | | 49,133,776 | |
| | | | | | | | |
| Common Stocks (continued) | |
| Issuer | | Shares | | | Value ($) | |
Lam Research Corp. | | | 3,690,262 | | | | 391,241,577 | |
| | |
Lattice Semiconductor Corp.(a)(d) | | | 13,264,377 | | | | 92,983,283 | |
| | |
Maxim Integrated Products, Inc. | | | 3,332,187 | | | | 130,854,983 | |
| | |
Mellanox Technologies Ltd.(a) | | | 621,300 | | | | 25,752,885 | |
| | |
NXP Semiconductors NV(a) | | | 1,325,577 | | | | 131,430,960 | |
| | |
ON Semiconductor Corp.(a) | | | 6,387,000 | | | | 75,238,860 | |
| | |
Qorvo, Inc.(a) | | | 3,847,577 | | | | 205,499,088 | |
| | |
QUALCOMM, Inc. | | | 462,000 | | | | 31,476,060 | |
| | |
Skyworks Solutions, Inc. | | | 1,630,326 | | | | 125,290,553 | |
| | |
Synaptics, Inc.(a)(d) | | | 2,308,449 | | | | 125,995,146 | |
| | |
Teradyne, Inc. | | | 7,590,363 | | | | 185,053,050 | |
| | | | | | | | | |
Total | | | | | | | 2,111,101,312 | |
|
Software 16.1% | |
| | |
Check Point Software Technologies
Ltd.(a) | | | 569,149 | | | | 46,858,037 | |
| | |
CyberArk Software Ltd.(a) | | | 365,670 | | | | 18,652,827 | |
| | |
Fortinet, Inc.(a) | | | 2,402,200 | | | | 72,306,220 | |
| | |
Mentor Graphics Corp. | | | 259,297 | | | | 9,477,305 | |
| | |
Microsoft Corp. | | | 714,500 | | | | 43,055,770 | |
| | |
Nuance Communications, Inc.(a) | | | 5,866,794 | | | | 95,100,731 | |
| | |
Oracle Corp. | | | 1,085,500 | | | | 43,626,245 | |
| | |
Salesforce.com, Inc.(a) | | | 722,451 | | | | 52,016,472 | |
| | |
Splunk, Inc.(a) | | | 381,800 | | | | 21,999,316 | |
| | |
Synopsys, Inc.(a) | | | 2,778,733 | | | | 168,057,772 | |
| | |
Tableau Software, Inc., Class A(a) | | | 360,086 | | | | 16,160,659 | |
| | |
TiVo Corp.(a) | | | 5,466,200 | | | | 110,690,550 | |
| | | | | | | | | |
Total | | | | | | | 698,001,904 | |
|
Technology Hardware, Storage & Peripherals 11.3% | |
| | |
Apple, Inc. | | | 2,133,900 | | | | 235,838,628 | |
| | |
CPI Card Group, Inc. | | | 2,548,582 | | | | 9,557,183 | |
| | |
Electronics for Imaging, Inc.(a) | | | 1,627,691 | | | | 70,837,112 | |
| | |
Hewlett Packard Enterprise Co. | | | 2,803,000 | | | | 66,711,400 | |
| | |
Western Digital Corp. | | | 1,675,200 | | | | 106,643,232 | |
| | | | | | | | | |
Total | | | | | | | 489,587,555 | |
| | | | | | | | | |
Total Information Technology | | | | | | | 4,134,970,778 | |
| | |
| | | | | | | | |
TELECOMMUNICATION SERVICES 0.1% | |
Diversified Telecommunication Services 0.1% | |
| | |
Ooma, Inc.(a) | | | 493,055 | | | | 4,585,412 | |
| | | | | | | | | |
Total Telecommunication Services | | | | | | | 4,585,412 | |
| | | | | | | | | |
Total Common Stocks | | | | | | | | |
(Cost: $2,915,756,712) | | | | | | | 4,174,291,198 | |
| | |
| | | | | | | | |
The accompanying Notes to Financial Statements are an integral part of this statement.
| | | | | | |
| | |
| | | | COLUMBIA SELIGMAN COMMUNICATIONS AND INFORMATION FUND | | |
PORTFOLIO OF INVESTMENTS (continued)
November 30, 2016 (Unaudited)
| | | | | | | | |
| Money Market Funds 4.0% | |
| | | Shares | | | Value ($) | |
Columbia Short-Term Cash Fund, 0.480%(d)(e) | | | 171,242,258 | | | | 171,259,382 | |
| | | | | | | | | |
Total Money Market Funds | | | | | | | | |
(Cost: $171,242,258) | | | | | | | 171,259,382 | |
| | | | | | | | | |
Total Investments | | | | | | | | |
(Cost: $3,086,998,970) | | | | | | | 4,345,550,580 | |
| | | | | | | | | |
Other Assets & Liabilities, Net | | | | | | | (12,389,866 | ) |
| | | | | | | | | |
Net Assets | | | | | | | 4,333,160,714 | |
| | | | | | | | | |
Notes to Portfolio of Investments
| (a) | Non-income producing investment. |
| (b) | Negligible market value. |
| (c) | Represents fair value as determined in good faith under procedures approved by the Board of Trustees. At November 30, 2016, the value of these securities amounted to $0, which represents less than 0.01% of net assets. |
| (d) | As defined in the Investment Company Act of 1940, an affiliated company is one in which the Fund owns 5% or more of the company’s outstanding voting securities, or a company which is under common ownership or control with the Fund. Holdings and transactions in these affiliated companies during the period ended November 30, 2016 are as follows: |
| | | | | | | | | | | | | | | | | | | | | | | | | | | | |
| Issuer | | Beginning
Cost ($) | | | Purchase
Cost ($) | | | Proceeds
From Sales ($) | | | Realized
Gain (Loss) ($) | | | Ending
Cost ($) | | | Dividends —
Affiliated
Issuers ($) | | | Value ($) | |
Columbia Short-Term Cash Fund | | | 21,724,587 | | | | 658,733,310 | | | | (509,217,704 | ) | | | 2,065 | | | | 171,242,258 | | | | 136,610 | | | | 171,259,382 | |
| | | | | | | |
Lattice Semiconductor Corp. | | | 70,617,480 | | | | 14,760,065 | | | | — | | | | — | | | | 85,377,545 | | | | — | | | | 92,983,283 | |
| | | | | | | |
LifeLock, Inc.* | | | 79,836,696 | | | | — | | | | (140,714,363 | ) | | | 60,877,667 | | | | — | | | | — | | | | — | |
| | | | | | | |
Rovi Corp.* | | | 95,606,359 | | | | — | | | | (95,606,359 | ) | | | — | | | | — | | | | — | | | | — | |
| | | | | | | |
Synaptics, Inc. | | | 92,979,937 | | | | 11,095,277 | | | | — | | | | — | | | | 104,075,214 | | | | — | | | | 125,995,146 | |
| | | | | | | |
Teradyne, Inc.* | | | 160,452,793 | | | | 1,971,914 | | | | (58,086,471 | ) | | | 10,915,450 | | | | 115,253,686 | | | | 912,736 | | | | 185,053,050 | |
| | | | | | | | | | | | | | | | | | | | | | | | | | | | | |
Total | | | 521,217,852 | | | | 686,560,566 | | | | (803,624,897 | ) | | | 71,795,182 | | | | 475,948,703 | | | | 1,049,346 | | | | 575,290,861 | |
| | | | | | | | | | | | | | | | | | | | | | | | | | | | | |
| | * | Issuer was not an affiliate for the entire period ended November 30, 2016. |
| (e) | The rate shown is the seven-day current annualized yield at November 30, 2016. |
Fair Value Measurements
The Fund categorizes its fair value measurements according to a three-level hierarchy that maximizes the use of observable inputs and minimizes the use of unobservable inputs by prioritizing that the most observable input be used when available. Observable inputs are those that market participants would use in pricing an investment based on market data obtained from sources independent of the reporting entity. Unobservable inputs are those that reflect the Fund’s assumptions about the information market participants would use in pricing an investment. An investment’s level within the fair value hierarchy is based on the lowest level of any input that is deemed significant to the asset’s or liability’s fair value measurement. The input levels are not necessarily an indication of the risk or liquidity associated with investments at that level. For example, certain U.S. government securities are generally high quality and liquid, however, they are reflected as Level 2 because the inputs used to determine fair value may not always be quoted prices in an active market.
Fair value inputs are summarized in the three broad levels listed below:
| ∎ | | Level 1 — Valuations based on quoted prices for investments in active markets that the Fund has the ability to access at the measurement date (including NAV for open-end mutual funds). Valuation adjustments are not applied to Level 1 investments. |
| ∎ | | Level 2 — Valuations based on other significant observable inputs (including quoted prices for similar securities, interest rates, prepayment speeds, credit risks, etc.). |
| ∎ | | Level 3 — Valuations based on significant unobservable inputs (including the Fund’s own assumptions and judgment in determining the fair value of investments). |
Inputs that are used in determining fair value of an investment may include price information, credit data, volatility statistics, and other factors. These inputs can be either observable or unobservable. The availability of observable inputs can vary between investments, and is affected by various factors such as the type of investment, and the volume and level of activity for that investment or similar investments in the marketplace.
The accompanying Notes to Financial Statements are an integral part of this statement.
| | | | | | |
| | |
| | | | COLUMBIA SELIGMAN COMMUNICATIONS AND INFORMATION FUND | | |
PORTFOLIO OF INVESTMENTS (continued)
November 30, 2016 (Unaudited)
Fair Value Measurements (continued)
The inputs will be considered by the Investment Manager, along with any other relevant factors in the calculation of an investment’s fair value. The Fund uses prices and inputs that are current as of the measurement date, which may include periods of market dislocations. During these periods, the availability of prices and inputs may be reduced for many investments. This condition could cause an investment to be reclassified between the various levels within the hierarchy.
Certain investments that have been measured at fair value using the net asset value (NAV) per share (or its equivalent) are not categorized in the fair value hierarchy. The fair value amounts presented in the table are intended to reconcile the fair value hierarchy to the amounts presented in the Portfolio of Investments. The Columbia Short-Term Cash Fund seeks to provide shareholders with maximum current income consistent with liquidity and stability of principal. Columbia Short-Term Cash Fund prices its shares with a floating NAV and no longer seeks to maintain a stable NAV.
Investments falling into the Level 3 category are primarily supported by quoted prices from brokers and dealers participating in the market for those investments. However, these may be classified as Level 3 investments due to lack of market transparency and corroboration to support these quoted prices. Additionally, valuation models may be used as the pricing source for any remaining investments classified as Level 3. These models may rely on one or more significant unobservable inputs and/or significant assumptions by the Investment Manager. Inputs used in valuations may include, but are not limited to, financial statement analysis, capital account balances, discount rates and estimated cash flows, and comparable company data.
Under the direction of the Fund’s Board of Trustees (the Board), the Investment Manager’s Valuation Committee (the Committee) is responsible for overseeing the valuation procedures approved by the Board. The Committee consists of voting and non-voting members from various groups within the Investment Manager’s organization, including operations and accounting, trading and investments, compliance, risk management and legal.
The Committee meets at least monthly to review and approve valuation matters, which may include a description of specific valuation determinations, data regarding pricing information received from approved pricing vendors and brokers and the results of Board-approved valuation control policies and procedures (the Policies). The Policies address, among other things, instances when market quotations are or are not readily available, including recommendations of third party pricing vendors and a determination of appropriate pricing methodologies; events that require specific valuation determinations and assessment of fair value techniques; securities with a potential for stale pricing, including those that are illiquid, restricted, or in default; and the effectiveness of third party pricing vendors, including periodic reviews of vendors. The Committee meets more frequently, as needed, to discuss additional valuation matters, which may include the need to review back-testing results, review time-sensitive information or approve related valuation actions. The Committee reports to the Board, with members of the Committee meeting with the Board at each of its regularly scheduled meetings to discuss valuation matters and actions during the period, similar to those described earlier.
For investments categorized as Level 3, the Committee monitors information similar to that described above, which may include: (i) data specific to the issuer or comparable issuers, (ii) general market or specific sector news and (iii) quoted prices and specific or similar security transactions. The Committee considers this data and any changes from prior periods in order to assess the reasonableness of observable and unobservable inputs, any assumptions or internal models used to value those securities and changes in fair value. This data is also used to corroborate, when available, information received from approved pricing vendors and brokers. Various factors impact the frequency of monitoring this information (which may occur as often as daily). However, the Committee may determine that changes to inputs, assumptions and models are not required as a result of the monitoring procedures performed.
The following table is a summary of the inputs used to value the Fund’s investments at November 30, 2016:
| | | | | | | | | | | | | | | | |
| | | Level 1
Quoted Prices in Active
Markets for Identical
Assets ($) | | | Level 2
Other Significant
Observable Inputs ($) | | | Level 3
Significant
Unobservable Inputs ($) | | | Total ($) | |
Investments | | | | | | | | | | | | | | | | |
| | | | |
Common Stocks | | | | | | | | | | | | | | | | |
| | | | |
Consumer Discretionary | | | 34,735,008 | | | | — | | | | — | | | | 34,735,008 | |
| | | | |
Financials | | | — | | | | — | | | | 0 | (a) | | | 0 | (a) |
| | | | |
Information Technology | | | 4,134,970,778 | | | | — | | | | 0 | (a) | | | 4,134,970,778 | |
| | | | |
Telecommunication Services | | | 4,585,412 | | | | — | | | | — | | | | 4,585,412 | |
| | | | | | | | | | | | | | | | | |
Total Common Stocks | | | 4,174,291,198 | | | | — | | | | 0 | (a) | | | 4,174,291,198 | |
| | | | | | | | | | | | | | | | | |
Investments measured at net asset value | | | | | | | | | | | | | | | | |
| | | | |
Money Market Funds | | | — | | | | — | | | | — | | | | 171,259,382 | |
| | | | | | | | | | | | | | | | | |
Total Investments | | | 4,174,291,198 | | | | — | | | | 0 | (a) | | | 4,345,550,580 | |
| | | | | | | | | | | | | | | | | |
See the Portfolio of Investments for all investment classifications not indicated in the table.
There were no transfers of financial assets between levels during the period.
The Fund does not hold any significant investments (greater than one percent of net assets) categorized as Level 3.
The Fund’s assets assigned to the Level 3 category are valued utilizing the valuation technique deemed the most appropriate in the circumstances. Certain common stocks classified as Level 3 are valued using a market approach. To determine fair value for these securities, management
The accompanying Notes to Financial Statements are an integral part of this statement.
| | | | | | |
| | |
| | | | COLUMBIA SELIGMAN COMMUNICATIONS AND INFORMATION FUND | | |
PORTFOLIO OF INVESTMENTS (continued)
November 30, 2016 (Unaudited)
Fair Value Measurements (continued)
considered various factors which may have included, but were not limited to, the Fund’s pro-rata interest in the company’s capital balance, estimated earnings of the respective company, and the position of the security within the respective company’s capital structure. Significant increases (decreases) to any of these inputs would result in a significantly lower (higher) fair value measurement. Generally, a change in the fund’s pro-rata interest would result in a change to the company’s capital balance.
The accompanying Notes to Financial Statements are an integral part of this statement.
| | | | | | |
| | |
| | | | COLUMBIA SELIGMAN COMMUNICATIONS AND INFORMATION FUND | | |
STATEMENT OF ASSETS AND LIABILITIES
November 30, 2016 (Unaudited)
| | | | |
Assets | | | | |
| |
Investments, at value | | | | |
| |
Unaffiliated issuers (identified cost $2,611,050,267) | | | $3,770,259,719 | |
| |
Affiliated issuers (identified cost $475,948,703) | | | 575,290,861 | |
| |
Total investments (identified cost $3,086,998,970) | | | 4,345,550,580 | |
| |
Receivable for: | | | | |
| |
Investments sold | | | 55,097,993 | |
| |
Capital shares sold | | | 4,651,077 | |
| |
Dividends | | | 3,686,434 | |
| |
Prepaid expenses | | | 11,682 | |
| |
Other assets | | | 21,475 | |
| |
Total assets | | | 4,409,019,241 | |
| |
| |
Liabilities | | | | |
| |
Payable for: | | | | |
| |
Investments purchased | | | 70,308,474 | |
| |
Capital shares purchased | | | 4,043,393 | |
| |
Management services fees | | | 106,462 | |
| |
Distribution and/or service fees | | | 43,040 | |
| |
Transfer agent fees | | | 430,200 | |
| |
Plan administration fees | | | 15 | |
| |
Compensation of board members | | | 151,253 | |
| |
Chief compliance officer expenses | | | 304 | |
| |
Other expenses | | | 775,386 | |
| |
Total liabilities | | | 75,858,527 | |
| |
Net assets applicable to outstanding capital stock | | | $4,333,160,714 | |
| |
| |
Represented by | | | | |
| |
Paid-in capital | | | $2,604,939,518 | |
| |
Excess of distributions over net investment income | | | (11,635,794 | ) |
| |
Accumulated net realized gain | | | 481,305,380 | |
| |
Unrealized appreciation (depreciation) on: | | | | |
| |
Investments — unaffiliated issuers | | | 1,159,209,452 | |
| |
Investments — affiliated issuers | | | 99,342,158 | |
| |
Total — representing net assets applicable to outstanding capital stock | | | $4,333,160,714 | |
| |
The accompanying Notes to Financial Statements are an integral part of this statement.
| | | | | | |
| | |
| | | | COLUMBIA SELIGMAN COMMUNICATIONS AND INFORMATION FUND | | |
STATEMENT OF ASSETS AND LIABILITIES (continued)
November 30, 2016 (Unaudited)
| | | | |
Class A | | | | |
| |
Net assets | | | $2,908,932,222 | |
| |
Shares outstanding | | | 46,180,855 | |
| |
Net asset value per share | | | $62.99 | |
| |
Maximum offering price per share(a) | | | $66.83 | |
| |
Class B | | | | |
| |
Net assets | | | $9,836,846 | |
| |
Shares outstanding | | | 210,314 | |
| |
Net asset value per share | | | $46.77 | |
| |
Class C | | | | |
| |
Net assets | | | $801,163,102 | |
| |
Shares outstanding | | | 17,263,484 | |
| |
Net asset value per share | | | $46.41 | |
| |
Class I | | | | |
| |
Net assets | | | $3,691 | |
| |
Shares outstanding | | | 54 | |
| |
Net asset value per share(b) | | | $68.18 | |
| |
Class K | | | | |
| |
Net assets | | | $67,698 | |
| |
Shares outstanding | | | 1,013 | |
| |
Net asset value per share(b) | | | $66.82 | |
| |
Class R | | | | |
| |
Net assets | | | $55,077,492 | |
| |
Shares outstanding | | | 911,892 | |
| |
Net asset value per share | | | $60.40 | |
| |
Class R4 | | | | |
| |
Net assets | | | $41,456,021 | |
| |
Shares outstanding | | | 674,155 | |
| |
Net asset value per share | | | $61.49 | |
| |
Class R5 | | | | |
| |
Net assets | | | $87,183,527 | |
| |
Shares outstanding | | | 1,282,651 | |
| |
Net asset value per share | | | $67.97 | |
| |
Class Z | | | | |
| |
Net assets | | | $429,440,115 | |
| |
Shares outstanding | | | 6,344,501 | |
| |
Net asset value per share | | | $67.69 | |
| |
| (a) | The maximum offering price per share is calculated by dividing the net asset value per share by 1.0 minus the maximum sales charge of 5.75%. |
| (b) | Net asset value per share rounds to this amount due to fractional shares outstanding. |
The accompanying Notes to Financial Statements are an integral part of this statement.
| | |
| 10 | | Semiannual Report 2016 |
| | | | | | |
| | |
| | | | COLUMBIA SELIGMAN COMMUNICATIONS AND INFORMATION FUND | | |
STATEMENT OF OPERATIONS
Six Months Ended November 30, 2016 (Unaudited)
| | | | |
Net investment income | | | | |
| |
Income: | | | | |
| |
Dividends — unaffiliated issuers | | | $16,313,106 | |
| |
Dividends — affiliated issuers | | | 1,049,346 | |
| |
Total income | | | 17,362,452 | |
| |
| |
Expenses: | | | | |
| |
Management services fees | | | 18,480,050 | |
| |
Distribution and/or service fees | | | | |
| |
Class A | | | 3,489,646 | |
| |
Class B | | | 13,592 | |
| |
Class C | | | 3,885,003 | |
| |
Class R | | | 127,110 | |
| |
Transfer agent fees | | | | |
| |
Class A | | | 2,164,109 | |
| |
Class B | | | 8,532 | |
| |
Class C | | | 602,793 | |
| |
Class K | | | 15 | |
| |
Class R | | | 39,312 | |
| |
Class R4 | | | 24,901 | |
| |
Class R5 | | | 22,078 | |
| |
Class Z | | | 295,426 | |
| |
Plan administration fees | | | | |
| |
Class K | | | 75 | |
| |
Compensation of board members | | | 36,384 | |
| |
Custodian fees | | | 14,095 | |
| |
Printing and postage fees | | | 153,956 | |
| |
Registration fees | | | 72,048 | |
| |
Audit fees | | | 13,846 | |
| |
Legal fees | | | 23,956 | |
| |
Chief compliance officer expenses | | | 304 | |
| |
Other | | | 82,988 | |
| |
Total expenses | | | 29,550,219 | |
| |
Expense reductions | | | (9,626 | ) |
| |
Total net expenses | | | 29,540,593 | |
| |
Net investment loss | | | (12,178,141 | ) |
| |
| |
Realized and unrealized gain (loss) — net | | | | |
| |
Net realized gain (loss) on: | | | | |
| |
Investments — unaffiliated issuers | | | 308,034,162 | |
| |
Investments — affiliated issuers | | | 71,795,182 | |
| |
Net realized gain | | | 379,829,344 | |
| |
Net change in unrealized appreciation (depreciation) on: | | | | |
| |
Investments — unaffiliated issuers | | | 154,629,140 | |
| |
Investments — affiliated issuers | | | (14,042,688 | ) |
| |
Net change in unrealized appreciation | | | 140,586,452 | |
| |
Net realized and unrealized gain | | | 520,415,796 | |
| |
Net increase in net assets resulting from operations | | | $508,237,655 | |
| |
The accompanying Notes to Financial Statements are an integral part of this statement.
| | | | |
| Semiannual Report 2016 | | | 11 | |
| | | | | | |
| | |
| | | | COLUMBIA SELIGMAN COMMUNICATIONS AND INFORMATION FUND | | |
STATEMENT OF CHANGES IN NET ASSETS
| | | | | | | | |
| | | Six Months Ended
November 30, 2016
(Unaudited) | | | Year Ended
May 31, 2016 | |
Operations | | | | | | | | |
| | |
Net investment loss | | | $(12,178,141 | ) | | | $(23,477,619 | ) |
| | |
Net realized gain | | | 379,829,344 | | | | 241,697,557 | |
| | |
Net change in unrealized appreciation (depreciation) | | | 140,586,452 | | | | (327,516,474 | ) |
| |
Net increase (decrease) in net assets resulting from operations | | | 508,237,655 | | | | (109,296,536 | ) |
| |
| | |
Distributions to shareholders | | | | | | | | |
| | |
Net realized gains | | | | | | | | |
| | |
Class A | | | — | | | | (274,322,717 | ) |
| | |
Class B | | | — | | | | (2,028,284 | ) |
| | |
Class C | | | — | | | | (91,872,571 | ) |
| | |
Class I | | | — | | | | (334 | ) |
| | |
Class K | | | — | | | | (4,951 | ) |
| | |
Class R | | | — | | | | (4,995,703 | ) |
| | |
Class R4 | | | — | | | | (2,268,628 | ) |
| | |
Class R5 | | | — | | | | (4,608,218 | ) |
| | |
Class Z | | | — | | | | (31,968,892 | ) |
| |
Total distributions to shareholders | | | — | | | | (412,070,298 | ) |
| |
Increase (decrease) in net assets from capital stock activity | | | (141,593,658 | ) | | | 220,175,742 | |
| |
Total increase (decrease) in net assets | | | 366,643,997 | | | | (301,191,092 | ) |
| | |
Net assets at beginning of period | | | 3,966,516,717 | | | | 4,267,707,809 | |
| |
Net assets at end of period | | | $4,333,160,714 | | | | $3,966,516,717 | |
| |
Undistributed (excess of distributions over) net investment income | | | $(11,635,794 | ) | | | $542,347 | |
| |
The accompanying Notes to Financial Statements are an integral part of this statement.
| | |
| 12 | | Semiannual Report 2016 |
| | | | | | |
| | |
| | | | COLUMBIA SELIGMAN COMMUNICATIONS AND INFORMATION FUND | | |
STATEMENT OF CHANGES IN NET ASSETS (continued)
| | | | | | | | | | | | | | | | |
| | | Six Months Ended
November 30, 2016 (Unaudited) | | | Year Ended
May 31, 2016 | |
| | | Shares | | | Dollars ($) | | | Shares | | | Dollars ($) | |
Capital stock activity | | | | | | | | | | | | | | | | |
| | | | |
Class A shares | | | | | | | | | | | | | | | | |
| | | | |
Subscriptions(a) | | | 1,881,714 | | | | 112,435,322 | | | | 4,103,359 | | | | 230,755,150 | |
| | | | |
Distributions reinvested | | | — | | | | — | | | | 4,477,891 | | | | 248,075,148 | |
| | | | |
Redemptions | | | (3,662,743 | ) | | | (217,528,545 | ) | | | (7,960,732 | ) | | | (438,588,296 | ) |
| |
Net increase (decrease) | | | (1,781,029 | ) | | | (105,093,223 | ) | | | 620,518 | | | | 40,242,002 | |
| |
Class B shares | | | | | | | | | | | | | | | | |
| | | | |
Subscriptions | | | 579 | | | | 25,925 | | | | 8,738 | | | | 366,218 | |
| | | | |
Distributions reinvested | | | — | | | | — | | | | 41,336 | | | | 1,700,567 | |
| | | | |
Redemptions(a) | | | (83,734 | ) | | | (3,664,205 | ) | | | (219,373 | ) | | | (9,379,966 | ) |
| |
Net decrease | | | (83,155 | ) | | | (3,638,280 | ) | | | (169,299 | ) | | | (7,313,181 | ) |
| |
Class C shares | | | | | | | | | | | | | | | | |
| | | | |
Subscriptions | | | 493,567 | | | | 21,728,246 | | | | 1,509,756 | | | | 63,407,490 | |
| | | | |
Distributions reinvested | | | — | | | | — | | | | 1,860,829 | | | | 76,498,667 | |
| | | | |
Redemptions | | | (1,405,905 | ) | | | (61,785,765 | ) | | | (2,162,078 | ) | | | (89,869,194 | ) |
| |
Net increase (decrease) | | | (912,338 | ) | | | (40,057,519 | ) | | | 1,208,507 | | | | 50,036,963 | |
| |
Class K shares | | | | | | | | | | | | | | | | |
| | | | |
Subscriptions | | | 279 | | | | 17,571 | | | | 243 | | | | 14,332 | |
| | | | |
Distributions reinvested | | | — | | | | — | | | | 79 | | | | 4,624 | |
| | | | |
Redemptions | | | (292 | ) | | | (17,408 | ) | | | (33 | ) | | | (2,100 | ) |
| |
Net increase (decrease) | | | (13 | ) | | | 163 | | | | 289 | | | | 16,856 | |
| |
Class R shares | | | | | | | | | | | | | | | | |
| | | | |
Subscriptions | | | 170,719 | | | | 9,849,583 | | | | 349,712 | | | | 18,674,219 | |
| | | | |
Distributions reinvested | | | — | | | | — | | | | 82,642 | | | | 4,400,706 | |
| | | | |
Redemptions | | | (174,306 | ) | | | (9,890,740 | ) | | | (399,939 | ) | | | (21,509,559 | ) |
| |
Net increase (decrease) | | | (3,587 | ) | | | (41,157 | ) | | | 32,415 | | | | 1,565,366 | |
| |
Class R4 shares | | | | | | | | | | | | | | | | |
| | | | |
Subscriptions | | | 258,934 | | | | 15,259,784 | | | | 228,245 | | | | 12,414,517 | |
| | | | |
Distributions reinvested | | | — | | | | — | | | | 14,739 | | | | 795,187 | |
| | | | |
Redemptions | | | (70,064 | ) | | | (4,024,544 | ) | | | (123,233 | ) | | | (6,766,260 | ) |
| |
Net increase | | | 188,870 | | | | 11,235,240 | | | | 119,751 | | | | 6,443,444 | |
| |
Class R5 shares | | | | | | | | | | | | | | | | |
| | | | |
Subscriptions | | | 348,730 | | | | 22,540,199 | | | | 1,621,865 | | | | 94,120,811 | |
| | | | |
Distributions reinvested | | | — | | | | — | | | | 72,305 | | | | 4,307,190 | |
| | | | |
Redemptions | | | (991,434 | ) | | | (61,252,424 | ) | | | (295,098 | ) | | | (17,280,386 | ) |
| |
Net increase (decrease) | | | (642,704 | ) | | | (38,712,225 | ) | | | 1,399,072 | | | | 81,147,615 | |
| |
Class Z shares | | | | | | | | | | | | | | | | |
| | | | |
Subscriptions | | | 1,182,164 | | | | 76,393,079 | | | | 1,717,941 | | | | 103,356,181 | |
| | | | |
Distributions reinvested | | | — | | | | — | | | | 392,437 | | | | 23,306,811 | |
| | | | |
Redemptions | | | (648,810 | ) | | | (41,679,736 | ) | | | (1,344,805 | ) | | | (78,626,315 | ) |
| |
Net increase | | | 533,354 | | | | 34,713,343 | | | | 765,573 | | | | 48,036,677 | |
| |
Total net increase (decrease) | | | (2,700,602 | ) | | | (141,593,658 | ) | | | 3,976,826 | | | | 220,175,742 | |
| |
| (a) | Includes conversions of Class B shares to Class A shares, if any. |
The accompanying Notes to Financial Statements are an integral part of this statement.
| | | | |
| Semiannual Report 2016 | | | 13 | |
| | | | | | |
| | |
| | | | COLUMBIA SELIGMAN COMMUNICATIONS AND INFORMATION FUND | | |
FINANCIAL HIGHLIGHTS
The following tables are intended to help you understand the Fund’s financial performance. Certain information reflects financial results for a single share of a class held for the periods shown. Per share net investment income (loss) amounts are calculated based on average shares outstanding during the period. Total return assumes reinvestment of all dividends and distributions, if any. Total return does not reflect payment of sales charges, if any. Total return and portfolio turnover are not annualized for periods of less than one year. The portfolio turnover rate is calculated without regard to purchase and sales transactions of short-term instruments and certain derivatives, if any. If such transactions were included, the Fund’s portfolio turnover rate may be higher.
| | | | | | | | | | | | | | | | | | | | | | | | | | | | |
| |
| Six Months
Ended
November 30,
2016 |
| | | Year Ended May 31, | | |
| Year Ended
December 31, |
|
Class A | | | (Unaudited) | | | | 2016 | | | | 2015 | | | | 2014 | | | | 2013 | | | | 2012(a) | | | | 2011 | |
Per share data | | | | | | | | | | | | | | | | | | | | | | | | | | | | |
Net asset value, beginning of period | | | $55.64 | | | | $62.95 | | | | $54.27 | | | | $45.03 | | | | $42.89 | | | | $40.80 | | | | $44.71 | |
| | | | | | | | | | | | | | | | | | | | | | | | | | | | | |
Income from investment operations: | | | | | | | | | | | | | | | | | | | | | | | | | | | | |
| | | | | | | |
Net investment loss | | | (0.14 | ) | | | (0.27 | ) | | | (0.33 | ) | | | (0.27 | ) | | | (0.29 | ) | | | (0.14 | ) | | | (0.29 | ) |
| | | | | | | | | | | | | | | | | | | | | | | | | | | | | |
Net realized and unrealized gain (loss) | | | 7.49 | | | | (1.11 | ) | | | 16.09 | | | | 10.29 | | | | 5.15 | | | | 2.17 | | | | (1.88 | ) |
| | | | | | | | | | | | | | | | | | | | | | | | | | | | | |
Increase from payment by affiliate | | | — | | | | — | | | | — | | | | — | | | | — | | | | — | | | | 0.01 | |
| | | | | | | | | | | | | | | | | | | | | | | | | | | | | |
Total from investment operations | | | 7.35 | | | | (1.38 | ) | | | 15.76 | | | | 10.02 | | | | 4.86 | | | | 2.03 | | | | (2.16 | ) |
| | | | | | | | | | | | | | | | | | | | | | | | | | | | | |
Less distributions to shareholders: | | | | | | | | | | | | | | | | | | | | | | | | | | | | |
| | | | | | | |
Net realized gains | | | — | | | | (5.93 | ) | | | (7.08 | ) | | | (0.78 | ) | | | (2.72 | ) | | | — | | | | (1.75 | ) |
| | | | | | | | | | | | | | | | | | | | | | | | | | | | | |
Total distributions to shareholders | | | — | | | | (5.93 | ) | | | (7.08 | ) | | | (0.78 | ) | | | (2.72 | ) | | | — | | | | (1.75 | ) |
| | | | | | | | | | | | | | | | | | | | | | | | | | | | | |
Proceeds from regulatory settlements | | | — | | | | — | | | | — | | | | — | | | | — | | | | 0.06 | | | | — | |
| | | | | | | | | | | | | | | | | | | | | | | | | | | | | |
Net asset value, end of period | | | $62.99 | | | | $55.64 | | | | $62.95 | | | | $54.27 | | | | $45.03 | | | | $42.89 | | | | $40.80 | |
| | | | | | | | | | | | | | | | | | | | | | | | | | | | | |
Total return | | | 13.21 | % | | | (2.15 | %) | | | 31.04 | % | | | 22.48 | % | | | 11.87 | % | | | 5.12 | %(b) | | | (4.86 | %)(c) |
| | | | | | | | | | | | | | | | | | | | | | | | | | | | | |
Ratios to average net assets(d) | | | | | | | | | | | | | | | | | | | | | | | | | | | | |
| | | | | | | |
Total gross expenses | | | 1.31 | %(e) | | | 1.35 | %(f) | | | 1.35 | % | | | 1.41 | %(f) | | | 1.37 | %(f) | | | 1.34 | %(e) | | | 1.35 | %(f) |
| | | | | | | | | | | | | | | | | | | | | | | | | | | | | |
Total net expenses(g) | | | 1.31 | %(e)(h) | | | 1.35 | %(f)(h) | | | 1.35 | %(h) | | | 1.41 | %(f)(h) | | | 1.37 | %(f)(h) | | | 1.34 | %(e) | | | 1.35 | %(f)(h) |
| | | | | | | | | | | | | | | | | | | | | | | | | | | | | |
Net investment loss | | | (0.48 | %)(e) | | | (0.48 | %) | | | (0.57 | %) | | | (0.55 | %) | | | (0.66 | %) | | | (0.72 | %)(e) | | | (0.65 | %) |
| | | | | | | | | | | | | | | | | | | | | | | | | | | | | |
Supplemental data | | | | | | | | | | | | | | | | | | | | | | | | | | | | |
| | | | | | | |
Net assets, end of period (in thousands) | | | $2,908,932 | | | | $2,668,756 | | | | $2,980,017 | | | | $2,486,060 | | | | $2,411,838 | | | | $2,573,957 | | | | $2,536,229 | |
| | | | | | | | | | | | | | | | | | | | | | | | | | | | | |
Portfolio turnover | | | 27 | % | | | 48 | % | | | 61 | % | | | 48 | % | | | 61 | % | | | 38 | % | | | 66 | % |
| | | | | | | | | | | | | | | | | | | | | | | | | | | | | |
Notes to Financial Highlights
| (a) | For the period from January 1, 2012 to May 31, 2012. During the period, the Fund’s fiscal year end was changed from December 31 to May 31. |
| (b) | The Fund received proceeds from regulatory settlements. Had the Fund not received these proceeds, the total return would have been lower by 0.12%. |
| (c) | The Fund received a payment from an affiliate. Had the Fund not received this payment, the total return would have been lower by 0.01%. |
| (d) | In addition to the fees and expenses that the Fund bears directly, the Fund indirectly bears a pro rata share of the fees and expenses of any other funds in which it invests. Such indirect expenses are not included in the Fund’s reported expense ratios. |
| (f) | Ratios include line of credit interest expense which is less than 0.01%. |
| (g) | Total net expenses include the impact of certain fee waivers/expense reimbursements made by the Investment Manager and certain of its affiliates, if applicable. |
| (h) | The benefits derived from expense reductions had an impact of less than 0.01%. |
The accompanying Notes to Financial Statements are an integral part of this statement.
| | |
| 14 | | Semiannual Report 2016 |
| | | | | | |
| | |
| | | | COLUMBIA SELIGMAN COMMUNICATIONS AND INFORMATION FUND | | |
FINANCIAL HIGHLIGHTS (continued)
| | | | | | | | | | | | | | | | | | | | | | | | | | | | |
| |
| Six Months Ended
November 30, 2016 |
| | | Year Ended May 31, | | |
| Year Ended
December 31, |
|
Class B | | | (Unaudited) | | | | 2016 | | | | 2015 | | | | 2014 | | | | 2013 | | | | 2012(a) | | | | 2011 | |
Per share data | | | | | | | | | | | | | | | | | | | | | | | | | | | | |
Net asset value, beginning of period | | | $41.32 | | | | $48.31 | | | | $43.10 | | | | $35.91 | | | | $34.89 | | | | $33.29 | | | | $37.09 | |
| | | | | | | | | | | | | | | | | | | | | | | | | | | | | |
Income from investment operations: | | | | | | | | | | | | | | | | | | | | | | | | | | | | |
| | | | | | | |
Net investment loss | | | (0.11 | ) | | | (0.21 | ) | | | (0.26 | ) | | | (0.21 | ) | | | (0.39 | ) | | | (0.23 | ) | | | (0.52 | ) |
| | | | | | | | | | | | | | | | | | | | | | | | | | | | | |
Net realized and unrealized gain (loss) | | | 5.56 | | | | (0.85 | ) | | | 12.55 | | | | 8.18 | | | | 4.13 | | | | 1.78 | | | | (1.53 | ) |
| | | | | | | | | | | | | | | | | | | | | | | | | | | | | |
Increase from payment by affiliate | | | — | | | | — | | | | — | | | | — | | | | — | | | | — | | | | 0.00 | (b) |
| | | | | | | | | | | | | | | | | | | | | | | | | | | | | |
Total from investment operations | | | 5.45 | | | | (1.06 | ) | | | 12.29 | | | | 7.97 | | | | 3.74 | | | | 1.55 | | | | (2.05 | ) |
| | | | | | | | | | | | | | | | | | | | | | | | | | | | | |
Less distributions to shareholders: | | | | | | | | | | | | | | | | | | | | | | | | | | | | |
| | | | | | | |
Net realized gains | | | — | | | | (5.93 | ) | | | (7.08 | ) | | | (0.78 | ) | | | (2.72 | ) | | | — | | | | (1.75 | ) |
| | | | | | | | | | | | | | | | | | | | | | | | | | | | | |
Total distributions to shareholders | | | — | | | | (5.93 | ) | | | (7.08 | ) | | | (0.78 | ) | | | (2.72 | ) | | | — | | | | (1.75 | ) |
| | | | | | | | | | | | | | | | | | | | | | | | | | | | | |
Proceeds from regulatory settlements | | | — | | | | — | | | | — | | | | — | | | | — | | | | 0.05 | | | | — | |
| | | | | | | | | | | | | | | | | | | | | | | | | | | | | |
Net asset value, end of period | | | $46.77 | | | | $41.32 | | | | $48.31 | | | | $43.10 | | | | $35.91 | | | | $34.89 | | | | $33.29 | |
| | | | | | | | | | | | | | | | | | | | | | | | | | | | | |
Total return | | | 13.19 | % | | | (2.13 | %) | | | 31.03 | % | | | 22.48 | % | | | 11.39 | % | | | 4.81 | %(c) | | | (5.57 | %)(d) |
| | | | | | | | | | | | | | | | | | | | | | | | | | | | | |
Ratios to average net assets(e) | | | | | | | | | | | | | | | | | | | | | | | | | | | | |
| | | | | | | |
Total gross expenses | | | 1.31 | %(f) | | | 1.35 | %(g) | | | 1.35 | % | | | 1.41 | %(g)(h) | | | 1.83 | %(g)(h) | | | 2.10 | %(f) | | | 2.10 | %(g) |
| | | | | | | | | | | | | | | | | | | | | | | | | | | | | |
Total net expenses(i) | | | 1.31 | %(f)(j) | | | 1.35 | %(g)(j) | | | 1.35 | %(j) | | | 1.41 | %(g)(j) | | | 1.83 | %(g)(j) | | | 2.10 | %(f) | | | 2.10 | %(g)(j) |
| | | | | | | | | | | | | | | | | | | | | | | | | | | | | |
Net investment loss | | | (0.48 | %)(f) | | | (0.49 | %) | | | (0.57 | %) | | | (0.54 | %) | | | (1.13 | %) | | | (1.47 | %)(f) | | | (1.40 | %) |
| | | | | | | | | | | | | | | | | | | | | | | | | | | | | |
Supplemental data | | | | | | | | | | | | | | | | | | | | | | | | | | | | |
| | | | | | | |
Net assets, end of period (in thousands) | | | $9,837 | | | | $12,125 | | | | $22,356 | | | | $27,991 | | | | $36,917 | | | | $49,373 | | | | $54,282 | |
| | | | | | | | | | | | | | | | | | | | | | | | | | | | | |
Portfolio turnover | | | 27 | % | | | 48 | % | | | 61 | % | | | 48 | % | | | 61 | % | | | 38 | % | | | 66 | % |
| | | | | | | | | | | | | | | | | | | | | | | | | | | | | |
Notes to Financial Highlights
| (a) | For the period from January 1, 2012 to May 31, 2012. During the period, the Fund’s fiscal year end was changed from December 31 to May 31. |
| (c) | The Fund received proceeds from regulatory settlements. Had the Fund not received these proceeds, the total return would have been lower by 0.12%. |
| (d) | The Fund received a payment from an affiliate. Had the Fund not received this payment, the total return would have been lower by 0.01%. |
| (e) | In addition to the fees and expenses that the Fund bears directly, the Fund indirectly bears a pro rata share of the fees and expenses of any other funds in which it invests. Such indirect expenses are not included in the Fund’s reported expense ratios. |
| (g) | Ratios include line of credit interest expense which is less than 0.01%. |
| (h) | Gross expense ratio has been revised to conform to current year presentation. |
| (i) | Total net expenses include the impact of certain fee waivers/expense reimbursements made by the Investment Manager and certain of its affiliates, if applicable. |
| (j) | The benefits derived from expense reductions had an impact of less than 0.01%. |
The accompanying Notes to Financial Statements are an integral part of this statement.
| | | | |
| Semiannual Report 2016 | | | 15 | |
| | | | | | |
| | |
| | | | COLUMBIA SELIGMAN COMMUNICATIONS AND INFORMATION FUND | | |
FINANCIAL HIGHLIGHTS (continued)
| | | | | | | | | | | | | | | | | | | | | | | | | | | | |
| |
| Six Months Ended
November 30, 2016 |
| | | Year Ended May 31, | | |
| Year Ended
December 31, |
|
Class C | | | (Unaudited) | | | | 2016 | | | | 2015 | | | | 2014 | | | | 2013 | | | | 2012(a) | | | | 2011 | |
Per share data | | | | | | | | | | | | | | | | | | | | | | | | | | | | |
Net asset value, beginning of period | | | $41.15 | | | | $48.05 | | | | $42.68 | | | | $35.83 | | | | $34.91 | | | | $33.32 | | | | $37.12 | |
| | | | | | | | | | | | | | | | | | | | | | | | | | | | | |
Income from investment operations: | | | | | | | | | | | | | | | | | | | | | | | | | | | | |
| | | | | | | |
Net investment loss | | | (0.27 | ) | | | (0.52 | ) | | | (0.59 | ) | | | (0.50 | ) | | | (0.49 | ) | | | (0.23 | ) | | | (0.51 | ) |
| | | | | | | | | | | | | | | | | | | | | | | | | | | | | |
Net realized and unrealized gain (loss) | | | 5.53 | | | | (0.87 | ) | | | 12.45 | | | | 8.13 | | | | 4.13 | | | | 1.77 | | | | (1.54 | ) |
| | | | | | | | | | | | | | | | | | | | | | | | | | | | | |
Increase from payment by affiliate | | | — | | | | — | | | | — | | | | — | | | | — | | | | — | | | | 0.00 | (b) |
| | | | | | | | | | | | | | | | | | | | | | | | | | | | | |
Total from investment operations | | | 5.26 | | | | (1.39 | ) | | | 11.86 | | | | 7.63 | | | | 3.64 | | | | 1.54 | | | | (2.05 | ) |
| | | | | | | | | | | | | | | | | | | | | | | | | | | | | |
Less distributions to shareholders: | | | | | | | | | | | | | | | | | | | | | | | | | | | | |
| | | | | | | |
Net realized gains | | | — | | | | (5.51 | ) | | | (6.49 | ) | | | (0.78 | ) | | | (2.72 | ) | | | — | | | | (1.75 | ) |
| | | | | | | | | | | | | | | | | | | | | | | | | | | | | |
Total distributions to shareholders | | | — | | | | (5.51 | ) | | | (6.49 | ) | | | (0.78 | ) | | | (2.72 | ) | | | — | | | | (1.75 | ) |
| | | | | | | | | | | | | | | | | | | | | | | | | | | | | |
Proceeds from regulatory settlements | | | — | | | | — | | | | — | | | | — | | | | — | | | | 0.05 | | | | — | |
| | | | | | | | | | | | | | | | | | | | | | | | | | | | | |
Net asset value, end of period | | | $46.41 | | | | $41.15 | | | | $48.05 | | | | $42.68 | | | | $35.83 | | | | $34.91 | | | | $33.32 | |
| | | | | | | | | | | | | | | | | | | | | | | | | | | | | |
Total return | | | 12.78 | % | | | (2.88 | %) | | | 30.05 | % | | | 21.57 | % | | | 11.06 | % | | | 4.77 | %(c) | | | (5.56 | %)(d) |
| | | | | | | | | | | | | | | | | | | | | | | | | | | | | |
Ratios to average net assets(e) | | | | | | | | | | | | | | | | | | | | | | | | | | | | |
| | | | | | | |
Total gross expenses | | | 2.06 | %(f) | | | 2.10 | %(g) | | | 2.10 | % | | | 2.16 | %(g) | | | 2.12 | %(g) | | | 2.09 | %(f) | | | 2.10 | %(g) |
| | | | | | | | | | | | | | | | | | | | | | | | | | | | | |
Total net expenses(h) | | | 2.06 | %(f)(i) | | | 2.10 | %(g)(i) | | | 2.10 | %(i) | | | 2.16 | %(g)(i) | | | 2.12 | %(g)(i) | | | 2.09 | %(f) | | | 2.10 | %(g)(i) |
| | | | | | | | | | | | | | | | | | | | | | | | | | | | | |
Net investment loss | | | (1.23 | %)(f) | | | (1.23 | %) | | | (1.31 | %) | | | (1.30 | %) | | | (1.41 | %) | | | (1.47 | %)(f) | | | (1.40 | %) |
| | | | | | | | | | | | | | | | | | | | | | | | | | | | | |
Supplemental data | | | | | | | | | | | | | | | | | | | | | | | | | | | | |
| | | | | | | |
Net assets, end of period (in thousands) | | | $801,163 | | | | $747,911 | | | | $815,273 | | | | $671,468 | | | | $633,180 | | | | $668,588 | | | | $670,843 | |
| | | | | | | | | | | | | | | | | | | | | | | | | | | | | |
Portfolio turnover | | | 27 | % | | | 48 | % | | | 61 | % | | | 48 | % | | | 61 | % | | | 38 | % | | | 66 | % |
| | | | | | | | | | | | | | | | | | | | | | | | | | | | | |
Notes to Financial Highlights
| (a) | For the period from January 1, 2012 to May 31, 2012. During the period, the Fund’s fiscal year end was changed from December 31 to May 31. |
| (c) | The Fund received proceeds from regulatory settlements. Had the Fund not received these proceeds, the total return would have been lower by 0.12%. |
| (d) | The Fund received a payment from an affiliate. Had the Fund not received this payment, the total return would have been lower by 0.01%. |
| (e) | In addition to the fees and expenses that the Fund bears directly, the Fund indirectly bears a pro rata share of the fees and expenses of any other funds in which it invests. Such indirect expenses are not included in the Fund’s reported expense ratios. |
| (g) | Ratios include line of credit interest expense which is less than 0.01%. |
| (h) | Total net expenses include the impact of certain fee waivers/expense reimbursements made by the Investment Manager and certain of its affiliates, if applicable. |
| (i) | The benefits derived from expense reductions had an impact of less than 0.01%. |
The accompanying Notes to Financial Statements are an integral part of this statement.
| | |
| 16 | | Semiannual Report 2016 |
| | | | | | |
| | |
| | | | COLUMBIA SELIGMAN COMMUNICATIONS AND INFORMATION FUND | | |
FINANCIAL HIGHLIGHTS (continued)
| | | | | | | | | | | | | | | | | | | | | | | | | | | | |
| |
| Six Months Ended
November 30, 2016 |
| | | Year Ended May 31, | | |
| Year Ended
December 31, |
|
Class I | | | (Unaudited) | | | | 2016 | | | | 2015 | | | | 2014 | | | | 2013 | | | | 2012(a) | | | | 2011 | |
Per share data | | | | | | | | | | | | | | | | | | | | | | | | | | | | |
Net asset value, beginning of period | | | $60.10 | | | | $67.48 | | | | $57.80 | | | | $47.70 | | | | $45.08 | | | | $42.82 | | | | $46.62 | |
| | | | | | | | | | | | | | | | | | | | | | | | | | | | | |
Income from investment operations: | | | | | | | | | | | | | | | | | | | | | | | | | | | | |
| | | | | | | |
Net investment loss | | | (0.02 | ) | | | (0.02 | ) | | | (0.08 | ) | | | (0.06 | ) | | | (0.11 | ) | | | (0.06 | ) | | | (0.20 | ) |
| | | | | | | | | | | | | | | | | | | | | | | | | | | | | |
Net realized and unrealized gain (loss) | | | 8.10 | | | | (1.18 | ) | | | 17.18 | | | | 10.94 | | | | 5.45 | | | | 2.26 | | | | (1.86 | ) |
| | | | | | | | | | | | | | | | | | | | | | | | | | | | | |
Increase from payment by affiliate | | | — | | | | — | | | | — | | | | — | | | | — | | | | — | | | | 0.01 | |
| | | | | | | | | | | | | | | | | | | | | | | | | | | | | |
Total from investment operations | | | 8.08 | | | | (1.20 | ) | | | 17.10 | | | | 10.88 | | | | 5.34 | | | | 2.20 | | | | (2.05 | ) |
| | | | | | | | | | | | | | | | | | | | | | | | | | | | | |
Less distributions to shareholders: | | | | | | | | | | | | | | | | | | | | | | | | | | | | |
| | | | | | | |
Net realized gains | | | — | | | | (6.18 | ) | | | (7.42 | ) | | | (0.78 | ) | | | (2.72 | ) | | | — | | | | (1.75 | ) |
| | | | | | | | | | | | | | | | | | | | | | | | | | | | | |
Total distributions to shareholders | | | — | | | | (6.18 | ) | | | (7.42 | ) | | | (0.78 | ) | | | (2.72 | ) | | | — | | | | (1.75 | ) |
| | | | | | | | | | | | | | | | | | | | | | | | | | | | | |
Proceeds from regulatory settlements | | | — | | | | — | | | | — | | | | — | | | | — | | | | 0.06 | | | | — | |
| | | | | | | | | | | | | | | | | | | | | | | | | | | | | |
Net asset value, end of period | | | $68.18 | | | | $60.10 | | | | $67.48 | | | | $57.80 | | | | $47.70 | | | | $45.08 | | | | $42.82 | |
| | | | | | | | | | | | | | | | | | | | | | | | | | | | | |
Total return | | | 13.44 | % | | | (1.72 | %) | | | 31.58 | % | | | 23.03 | % | | | 12.37 | % | | | 5.28 | %(b) | | | (4.43 | %)(c) |
| | | | | | | | | | | | | | | | | | | | | | | | | | | | | |
Ratios to average net assets(d) | | | | | | | | | | | | | | | | | | | | | | | | | | | | |
| | | | | | | |
Total gross expenses | | | 0.90 | %(e) | | | 0.91 | % | | | 0.91 | % | | | 0.97 | %(f) | | | 0.94 | %(f) | | | 0.92 | %(e) | | | 0.90 | %(f) |
| | | | | | | | | | | | | | | | | | | | | | | | | | | | | |
Total net expenses(g) | | | 0.90 | %(e) | | | 0.91 | % | | | 0.91 | % | | | 0.97 | %(f) | | | 0.94 | %(f) | | | 0.92 | %(e) | | | 0.90 | %(f) |
| | | | | | | | | | | | | | | | | | | | | | | | | | | | | |
Net investment loss | | | (0.07 | %)(e) | | | (0.03 | %) | | | (0.12 | %) | | | (0.11 | %) | | | (0.23 | %) | | | (0.30 | %)(e) | | | (0.41 | %) |
| | | | | | | | | | | | | | | | | | | | | | | | | | | | | |
Supplemental data | | | | | | | | | | | | | | | | | | | | | | | | | | | | |
| | | | | | | |
Net assets, end of period (in thousands) | | | $4 | | | | $3 | | | | $4 | | | | $3 | | | | $7 | | | | $7 | | | | $6 | |
| | | | | | | | | | | | | | | | | | | | | | | | | | | | | |
Portfolio turnover | | | 27 | % | | | 48 | % | | | 61 | % | | | 48 | % | | | 61 | % | | | 38 | % | | | 66 | % |
| | | | | | | | | | | | | | | | | | | | | | | | | | | | | |
Notes to Financial Highlights
| (a) | For the period from January 1, 2012 to May 31, 2012. During the period, the Fund’s fiscal year end was changed from December 31 to May 31. |
| (b) | The Fund received proceeds from regulatory settlements. Had the Fund not received these proceeds, the total return would have been lower by 0.12%. |
| (c) | The Fund received a payment from an affiliate. Had the Fund not received this payment, the total return would have been lower by 0.01%. |
| (d) | In addition to the fees and expenses that the Fund bears directly, the Fund indirectly bears a pro rata share of the fees and expenses of any other funds in which it invests. Such indirect expenses are not included in the Fund’s reported expense ratios. |
| (f) | Ratios include line of credit interest expense which is less than 0.01%. |
| (g) | Total net expenses include the impact of certain fee waivers/expense reimbursements made by the Investment Manager and certain of its affiliates, if applicable. |
The accompanying Notes to Financial Statements are an integral part of this statement.
| | | | |
| Semiannual Report 2016 | | | 17 | |
| | | | | | |
| | |
| | | | COLUMBIA SELIGMAN COMMUNICATIONS AND INFORMATION FUND | | |
FINANCIAL HIGHLIGHTS (continued)
| | | | | | | | | | | | | | | | | | | | | | | | | | | | |
| |
| Six Months Ended
November 30, 2016 |
| | | Year Ended May 31, | | |
| Year Ended
December 31, |
|
Class K | | | (Unaudited) | | | | 2016 | | | | 2015 | | | | 2014 | | | | 2013 | | | | 2012(a) | | | | 2011 | |
Per share data | | | | | | | | | | | | | | | | | | | | | | | | | | | | |
Net asset value, beginning of period | | | $59.00 | | | | $66.36 | | | | $56.90 | | | | $47.12 | | | | $44.69 | | | | $42.50 | | | | $46.42 | |
| | | | | | | | | | | | | | | | | | | | | | | | | | | | | |
Income from investment operations: | | | | | | | | | | | | | | | | | | | | | | | | | | | | |
| | | | | | | |
Net investment loss | | | (0.11 | ) | | | (0.20 | ) | | | (0.33 | ) | | | (0.22 | ) | | | (0.24 | ) | | | (0.12 | ) | | | (0.25 | ) |
| | | | | | | | | | | | | | | | | | | | | | | | | | | | | |
Net realized and unrealized gain (loss) | | | 7.93 | | | | (1.16 | ) | | | 16.97 | | | | 10.78 | | | | 5.39 | | | | 2.25 | | | | (1.93 | ) |
| | | | | | | | | | | | | | | | | | | | | | | | | | | | | |
Increase from payment by affiliate | | | — | | | | — | | | | — | | | | — | | | | — | | | | — | | | | 0.01 | |
| | | | | | | | | | | | | | | | | | | | | | | | | | | | | |
Total from investment operations | | | 7.82 | | | | (1.36 | ) | | | 16.64 | | | | 10.56 | | | | 5.15 | | | | 2.13 | | | | (2.17 | ) |
| | | | | | | | | | | | | | | | | | | | | | | | | | | | | |
Less distributions to shareholders: | | | | | | | | | | | | | | | | | | | | | | | | | | | | |
| | | | | | | |
Net realized gains | | | — | | | | (6.00 | ) | | | (7.18 | ) | | | (0.78 | ) | | | (2.72 | ) | | | — | | | | (1.75 | ) |
| | | | | | | | | | | | | | | | | | | | | | | | | | | | | |
Total distributions to shareholders | | | — | | | | (6.00 | ) | | | (7.18 | ) | | | (0.78 | ) | | | (2.72 | ) | | | — | | | | (1.75 | ) |
| | | | | | | | | | | | | | | | | | | | | | | | | | | | | |
Proceeds from regulatory settlements | | | — | | | | — | | | | — | | | | — | | | | — | | | | 0.06 | | | | — | |
| | | | | | | | | | | | | | | | | | | | | | | | | | | | | |
Net asset value, end of period | | | $66.82 | | | | $59.00 | | | | $66.36 | | | | $56.90 | | | | $47.12 | | | | $44.69 | | | | $42.50 | |
| | | | | | | | | | | | | | | | | | | | | | | | | | | | | |
Total return | | | 13.25 | % | | | (2.01 | %) | | | 31.18 | % | | | 22.63 | % | | | 12.04 | % | | | 5.15 | %(b) | | | (4.71 | %)(c) |
| | | | | | | | | | | | | | | | | | | | | | | | | | | | | |
Ratios to average net assets(d) | | | | | | | | | | | | | | | | | | | | | | | | | | | | |
| | | | | | | |
Total gross expenses | | | 1.21 | %(e) | | | 1.22 | %(f) | | | 1.24 | % | | | 1.27 | %(f) | | | 1.24 | %(f) | | | 1.23 | %(e) | | | 1.23 | %(f) |
| | | | | | | | | | | | | | | | | | | | | | | | | | | | | |
Total net expenses(g) | | | 1.21 | %(e) | | | 1.22 | %(f) | | | 1.24 | % | | | 1.27 | %(f) | | | 1.24 | %(f) | | | 1.23 | %(e) | | | 1.23 | %(f) |
| | | | | | | | | | | | | | | | | | | | | | | | | | | | | |
Net investment loss | | | (0.36 | %)(e) | | | (0.34 | %) | | | (0.54 | %) | | | (0.44 | %) | | | (0.53 | %) | | | (0.60 | %)(e) | | | (0.54 | %) |
| | | | | | | | | | | | | | | | | | | | | | | | | | | | | |
Supplemental data | | | | | | | | | | | | | | | | | | | | | | | | | | | | |
| | | | | | | |
Net assets, end of period (in thousands) | | | $68 | | | | $61 | | | | $49 | | | | $107 | | | | $969 | | | | $1,172 | | | | $1,061 | |
| | | | | | | | | | | | | | | | | | | | | | | | | | | | | |
Portfolio turnover | | | 27 | % | | | 48 | % | | | 61 | % | | | 48 | % | | | 61 | % | | | 38 | % | | | 66 | % |
| | | | | | | | | | | | | | | | | | | | | | | | | | | | | |
Notes to Financial Highlights
| (a) | For the period from January 1, 2012 to May 31, 2012. During the period, the Fund’s fiscal year end was changed from December 31 to May 31. |
| (b) | The Fund received proceeds from regulatory settlements. Had the Fund not received these proceeds, the total return would have been lower by 0.12%. |
| (c) | The Fund received a payment from an affiliate. Had the Fund not received this payment, the total return would have been lower by 0.01%. |
| (d) | In addition to the fees and expenses that the Fund bears directly, the Fund indirectly bears a pro rata share of the fees and expenses of any other funds in which it invests. Such indirect expenses are not included in the Fund’s reported expense ratios. |
| (f) | Ratios include line of credit interest expense which is less than 0.01%. |
| (g) | Total net expenses include the impact of certain fee waivers/expense reimbursements made by the Investment Manager and certain of its affiliates, if applicable. |
The accompanying Notes to Financial Statements are an integral part of this statement.
| | |
| 18 | | Semiannual Report 2016 |
| | | | | | |
| | |
| | | | COLUMBIA SELIGMAN COMMUNICATIONS AND INFORMATION FUND | | |
FINANCIAL HIGHLIGHTS (continued)
| | | | | | | | | | | | | | | | | | | | | | | | | | | | |
| |
| Six Months Ended
November 30, 2016 |
| | | Year Ended May 31, | | |
| Year Ended
December 31, |
|
Class R | | | (Unaudited) | | | | 2016 | | | | 2015 | | | | 2014 | | | | 2013 | | | | 2012(a) | | | | 2011 | |
Per share data | | | | | | | | | | | | | | | | | | | | | | | | | | | | |
Net asset value, beginning of period | | | $53.42 | | | | $60.68 | | | | $52.49 | | | | $43.69 | | | | $41.78 | | | | $39.79 | | | | $43.75 | |
| | | | | | | | | | | | | | | | | | | | | | | | | | | | | |
Income from investment operations: | | | | | | | | | | | | | | | | | | | | | | | | | | | | |
| | | | | | | |
Net investment loss | | | (0.21 | ) | | | (0.40 | ) | | | (0.46 | ) | | | (0.38 | ) | | | (0.39 | ) | | | (0.18 | ) | | | (0.39 | ) |
| | | | | | | | | | | �� | | | | | | | | | | | | | | | | | | |
Net realized and unrealized gain (loss) | | | 7.19 | | | | (1.07 | ) | | | 15.53 | | | | 9.96 | | | | 5.02 | | | | 2.12 | | | | (1.83 | ) |
| | | | | | | | | | | | | | | | | | | | | | | | | | | | | |
Increase from payment by affiliate | | | — | | | | — | | | | — | | | | — | | | | — | | | | — | | | | 0.01 | |
| | | | | | | | | | | | | | | | | | | | | | | | | | | | | |
Total from investment operations | | | 6.98 | | | | (1.47 | ) | | | 15.07 | | | | 9.58 | | | | 4.63 | | | | 1.94 | | | | (2.21 | ) |
| | | | | | | | | | | | | | | | | | | | | | | | | | | | | |
Less distributions to shareholders: | | | | | | | | | | | | | | | | | | | | | | | | | | | | |
| | | | | | | |
Net realized gains | | | — | | | | (5.79 | ) | | | (6.88 | ) | | | (0.78 | ) | | | (2.72 | ) | | | — | | | | (1.75 | ) |
| | | | | | | | | | | | | | | | | | | | | | | | | | | | | |
Total distributions to shareholders | | | — | | | | (5.79 | ) | | | (6.88 | ) | | | (0.78 | ) | | | (2.72 | ) | | | — | | | | (1.75 | ) |
| | | | | | | | | | | | | | | | | | | | | | | | | | | | | |
Proceeds from regulatory settlements | | | — | | | | — | | | | — | | | | — | | | | — | | | | 0.05 | | | | — | |
| | | | | | | | | | | | | | | | | | | | | | | | | | | | | |
Net asset value, end of period | | | $60.40 | | | | $53.42 | | | | $60.68 | | | | $52.49 | | | | $43.69 | | | | $41.78 | | | | $39.79 | |
| | | | | | | | | | | | | | | | | | | | | | | | | | | | | |
Total return | | | 13.07 | % | | | (2.39 | %) | | | 30.70 | % | | | 22.16 | % | | | 11.63 | % | | | 5.00 | %(b) | | | (5.08 | %)(c) |
| | | | | | | | | | | | | | | | | | | | | | | | | | | | | |
Ratios to average net assets(d) | | | | | | | | | | | | | | | | | | | | | | | | | | | | |
| | | | | | | |
Total gross expenses | | | 1.56 | %(e) | | | 1.60 | %(f) | | | 1.60 | % | | | 1.66 | %(f) | | | 1.62 | %(f) | | | 1.59 | %(e) | | | 1.60 | %(f) |
| | | | | | | | | | | | | | | | | | | | | | | | | | | | | |
Total net expenses(g) | | | 1.56 | %(e)(h) | | | 1.60 | %(f)(h) | | | 1.60 | %(h) | | | 1.66 | %(f)(h) | | | 1.62 | %(f)(h) | | | 1.59 | %(e) | | | 1.60 | %(f)(h) |
| | | | | | | | | | | | | | | | | | | | | | | | | | | | | |
Net investment loss | | | (0.72 | %)(e) | | | (0.73 | %) | | | (0.82 | %) | | | (0.80 | %) | | | (0.92 | %) | | | (0.98 | %)(e) | | | (0.90 | %) |
| | | | | | | | | | | | | | | | | | | | | | | | | | | | | |
Supplemental data | | | | | | | | | | | | | | | | | | | | | | | | | | | | |
| | | | | | | |
Net assets, end of period (in thousands) | | | $55,077 | | | | $48,905 | | | | $53,583 | | | | $42,742 | | | | $41,000 | | | | $41,829 | | | | $43,815 | |
| | | | | | | | | | | | | | | | | | | | | | | | | | | | | |
Portfolio turnover | | | 27 | % | | | 48 | % | | | 61 | % | | | 48 | % | | | 61 | % | | | 38 | % | | | 66 | % |
| | | | | | | | | | | | | | | | | | | | | | | | | | | | | |
Notes to Financial Highlights
| (a) | For the period from January 1, 2012 to May 31, 2012. During the period, the Fund’s fiscal year end was changed from December 31 to May 31. |
| (b) | The Fund received proceeds from regulatory settlements. Had the Fund not received these proceeds, the total return would have been lower by 0.12%. |
| (c) | The Fund received a payment from an affiliate. Had the Fund not received this payment, the total return would have been lower by 0.01%. |
| (d) | In addition to the fees and expenses that the Fund bears directly, the Fund indirectly bears a pro rata share of the fees and expenses of any other funds in which it invests. Such indirect expenses are not included in the Fund’s reported expense ratios. |
| (f) | Ratios include line of credit interest expense which is less than 0.01%. |
| (g) | Total net expenses include the impact of certain fee waivers/expense reimbursements made by the Investment Manager and certain of its affiliates, if applicable. |
| (h) | The benefits derived from expense reductions had an impact of less than 0.01%. |
The accompanying Notes to Financial Statements are an integral part of this statement.
| | | | |
| Semiannual Report 2016 | | | 19 | |
| | | | | | |
| | |
| | | | COLUMBIA SELIGMAN COMMUNICATIONS AND INFORMATION FUND | | |
FINANCIAL HIGHLIGHTS (continued)
| | | | | | | | | | | | | | | | | | | | | | | | | | | | |
| |
| Six Months Ended
November 30, 2016 |
| | | Year Ended May 31, | | |
| Year Ended
December 31, |
|
Class R4 | | | (Unaudited) | | | | 2016 | | | | 2015 | | | | 2014 | | | | 2013 | | | | 2012(a) | | | | 2011 | |
Per share data | | | | | | | | | | | | | | | | | | | | | | | | | | | | |
Net asset value, beginning of period | | | $54.25 | | | | $61.52 | | | | $53.23 | | | | $44.08 | | | | $42.00 | | | | $39.98 | | | | $43.89 | |
| | | | | | | | | | | | | | | | | | | | | | | | | | | | | |
Income from investment operations: | | | | | | | | | | | | | | | | | | | | | | | | | | | | |
| | | | | | | |
Net investment loss | | | (0.06 | ) | | | (0.13 | ) | | | (0.18 | ) | | | (0.17 | ) | | | (0.30 | ) | | | (0.16 | ) | | | (0.38 | ) |
| | | | | | | | | | | | | | | | | | | | | | | | | | | | | |
Net realized and unrealized gain (loss) | | | 7.30 | | | | (1.07 | ) | | | 15.75 | | | | 10.10 | | | | 5.10 | | | | 2.13 | | | | (1.79 | ) |
| | | | | | | | | | | | | | | | | | | | | | | | | | | | | |
Increase from payment by affiliate | | | — | | | | — | | | | — | | | | — | | | | — | | | | — | | | | 0.01 | |
| | | | | | | | | | | | | | | | | | | | | | | | | | | | | |
Total from investment operations | | | 7.24 | | | | (1.20 | ) | | | 15.57 | | | | 9.93 | | | | 4.80 | | | | 1.97 | | | | (2.16 | ) |
| | | | | | | | | | | | | | | | | | | | | | | | | | | | | |
Less distributions to shareholders: | | | | | | | | | | | | | | | | | | | | | | | | | | | | |
| | | | | | | |
Net realized gains | | | — | | | | (6.07 | ) | | | (7.28 | ) | | | (0.78 | ) | | | (2.72 | ) | | | — | | | | (1.75 | ) |
| | | | | | | | | | | | | | | | | | | | | | | | | | | | | |
Total distributions to shareholders | | | — | | | | (6.07 | ) | | | (7.28 | ) | | | (0.78 | ) | | | (2.72 | ) | | | — | | | | (1.75 | ) |
| | | | | | | | | | | | | | | | | | | | | | | | | | | | | |
Increase from payment by affiliate | | | — | | | | — | | | | — | | | | — | | | | — | | | | 0.05 | | | | — | |
| | | | | | | | | | | | | | | | | | | | | | | | | | | | | |
Net asset value, end of period | | | $61.49 | | | | $54.25 | | | | $61.52 | | | | $53.23 | | | | $44.08 | | | | $42.00 | | | | $39.98 | |
| | | | | | | | | | | | | | | | | | | | | | | | | | | | | |
Total return | | | 13.34 | % | | | (1.91 | %) | | | 31.35 | % | | | 22.76 | % | | | 11.99 | % | | | 5.05 | %(b) | | | (4.95 | %)(c) |
| | | | | | | | | | | | | | | | | | | | | | | | | | | | | |
Ratios to average net assets(d) | | | | | | | | | | | | | | | | | | | | | | | | | | | | |
| | | | | | | |
Total gross expenses | | | 1.06 | %(e) | | | 1.10 | %(f) | | | 1.11 | % | | | 1.16 | %(f) | | | 1.22 | %(f) | | | 1.48 | %(e) | | | 1.47 | %(f) |
| | | | | | | | | | | | | | | | | | | | | | | | | | | | | |
Total net expenses(g) | | | 1.06 | %(e)(h) | | | 1.10 | %(f)(h) | | | 1.11 | %(h) | | | 1.16 | %(f)(h) | | | 1.22 | %(f) | | | 1.48 | %(e) | | | 1.47 | %(f) |
| | | | | | | | | | | | | | | | | | | | | | | | | | | | | |
Net investment loss | | | (0.22 | %)(e) | | | (0.23 | %) | | | (0.31 | %) | | | (0.35 | %) | | | (0.71 | %) | | | (0.85 | %)(e) | | | (0.85 | %) |
| | | | | | | | | | | | | | | | | | | | | | | | | | | | | |
Supplemental data | | | | | | | | | | | | | | | | | | | | | | | | | | | | |
| | | | | | | |
Net assets, end of period (in thousands) | | | $41,456 | | | | $26,328 | | | | $22,487 | | | | $14,254 | | | | $588 | | | | $26 | | | | $23 | |
| | | | | | | | | | | | | | | | | | | | | | | | | | | | | |
Portfolio turnover | | | 27 | % | | | 48 | % | | | 61 | % | | | 48 | % | | | 61 | % | | | 38 | % | | | 66 | % |
| | | | | | | | | | | | | | | | | | | | | | | | | | | | | |
Notes to Financial Highlights
| (a) | For the period from January 1, 2012 to May 31, 2012. During the period, the Fund’s fiscal year end was changed from December 31 to May 31. |
| (b) | The Fund received proceeds from regulatory settlements. Had the Fund not received these proceeds, the total return would have been lower by 0.12%. |
| (c) | The Fund received a payment from an affiliate. Had the Fund not received this payment, the total return would have been lower by 0.01%. |
| (d) | In addition to the fees and expenses that the Fund bears directly, the Fund indirectly bears a pro rata share of the fees and expenses of any other funds in which it invests. Such indirect expenses are not included in the Fund’s reported expense ratios. |
| (f) | Ratios include line of credit interest expense which is less than 0.01%. |
| (g) | Total net expenses include the impact of certain fee waivers/expense reimbursements made by the Investment Manager and certain of its affiliates, if applicable. |
| (h) | The benefits derived from expense reductions had an impact of less than 0.01%. |
The accompanying Notes to Financial Statements are an integral part of this statement.
| | |
| 20 | | Semiannual Report 2016 |
| | | | | | |
| | |
| | | | COLUMBIA SELIGMAN COMMUNICATIONS AND INFORMATION FUND | | |
FINANCIAL HIGHLIGHTS (continued)
| | | | | | | | | | | | | | | | | | | | | | | | | | | | |
| |
| Six Months Ended
November 30, 2016 |
| | | Year Ended May 31, | | |
| Year Ended
December 31, |
|
Class R5 | | | (Unaudited) | | | | 2016 | | | | 2015 | | | | 2014 | | | | 2013 | | | | 2012(a) | | | | 2011 | |
Per share data | | | | | | | | | | | | | | | | | | | | | | | | | | | | |
Net asset value, beginning of period | | | $59.94 | | | | $67.31 | | | | $57.65 | | | | $47.61 | | | | $45.03 | | | | $42.77 | | | | $46.60 | |
| | | | | | | | | | | | | | | | | | | | | | | | | | | | | |
Income from investment operations: | | | | | | | | | | | | | | | | | | | | | | | | | | | | |
| | | | | | | |
Net investment loss | | | (0.03 | ) | | | (0.05 | ) | | | (0.11 | ) | | | (0.10 | ) | | | (0.13 | ) | | | (0.07 | ) | | | (0.12 | ) |
| | | | | | | | | | | | | | | | | | | | | | | | | | | | | |
Net realized and unrealized gain (loss) | | | 8.06 | | | | (1.18 | ) | | | 17.15 | | | | 10.92 | | | | 5.43 | | | | 2.27 | | | | (1.97 | ) |
| | | | | | | | | | | | | | | | | | | | | | | | | | | | | |
Increase from payment by affiliate | | | — | | | | — | | | | — | | | | — | | | | — | | | | — | | | | 0.01 | |
| | | | | | | | | | | | | | | | | | | | | | | | | | | | | |
Total from investment operations | | | 8.03 | | | | (1.23 | ) | | | 17.04 | | | | 10.82 | | | | 5.30 | | | | 2.20 | | | | (2.08 | ) |
| | | | | | | | | | | | | | | | | | | | | | | | | | | | | |
Less distributions to shareholders: | | | | | | | | | | | | | | | | | | | | | | | | | | | | |
| | | | | | | |
Net realized gains | | | — | | | | (6.14 | ) | | | (7.38 | ) | | | (0.78 | ) | | | (2.72 | ) | | | — | | | | (1.75 | ) |
| | | | | | | | | | | | | | | | | | | | | | | | | | | | | |
Total distributions to shareholders | | | — | | | | (6.14 | ) | | | (7.38 | ) | | | (0.78 | ) | | | (2.72 | ) | | | — | | | | (1.75 | ) |
| | | | | | | | | | | | | | | | | | | | | | | | | | | | | |
Proceeds from regulatory settlements | | | — | | | | — | | | | — | | | | — | | | | — | | | | 0.06 | | | | — | |
| | | | | | | | | | | | | | | | | | | | | | | | | | | | | |
Net asset value, end of period | | | $67.97 | | | | $59.94 | | | | $67.31 | | | | $57.65 | | | | $47.61 | | | | $45.03 | | | | $42.77 | |
| | | | | | | | | | | | | | | | | | | | | | | | | | | | | |
Total return | | | 13.39 | % | | | (1.76 | %) | | | 31.54 | % | | | 22.94 | % | | | 12.29 | % | | | 5.28 | %(b) | | | (4.49 | %)(c) |
| | | | | | | | | | | | | | | | | | | | | | | | | | | | | |
Ratios to average net assets(d) | | | | | | | | | | | | | | | | | | | | | | | | | | | | |
| | | | | | | |
Total gross expenses | | | 0.95 | %(e) | | | 0.98 | %(f) | | | 0.97 | % | | | 1.03 | %(f) | | | 0.99 | %(f) | | | 0.98 | %(e) | | | 0.97 | %(f) |
| | | | | | | | | | | | | | | | | | | | | | | | | | | | | |
Total net expenses(g) | | | 0.95 | %(e) | | | 0.98 | %(f) | | | 0.97 | % | | | 1.03 | %(f) | | | 0.99 | %(f) | | | 0.98 | %(e) | | | 0.97 | %(f) |
| | | | | | | | | | | | | | | | | | | | | | | | | | | | | |
Net investment loss | | | (0.11 | %)(e) | | | (0.09 | %) | | | (0.17 | %) | | | (0.19 | %) | | | (0.28 | %) | | | (0.35 | %)(e) | | | (0.27 | %) |
| | | | | | | | | | | | | | | | | | | | | | | | | | | | | |
Supplemental data | | | | | | | | | | | | | | | | | | | | | | | | | | | | |
| | | | | | | |
Net assets, end of period (in thousands) | | | $87,184 | | | | $115,399 | | | | $35,422 | | | | $24,681 | | | | $17,365 | | | | $18,085 | | | | $16,922 | |
| | | | | | | | | | | | | | | | | | | | | | | | | | | | | |
Portfolio turnover | | | 27 | % | | | 48 | % | | | 61 | % | | | 48 | % | | | 61 | % | | | 38 | % | | | 66 | % |
| | | | | | | | | | | | | | | | | | | | | | | | | | | | | |
Notes to Financial Highlights
| (a) | For the period from January 1, 2012 to May 31, 2012. During the period, the Fund’s fiscal year end was changed from December 31 to May 31. |
| (b) | The Fund received proceeds from regulatory settlements. Had the Fund not received these proceeds, the total return would have been lower by 0.12%. |
| (c) | The Fund received a payment from an affiliate. Had the Fund not received this payment, the total return would have been lower by 0.01%. |
| (d) | In addition to the fees and expenses that the Fund bears directly, the Fund indirectly bears a pro rata share of the fees and expenses of any other funds in which it invests. Such indirect expenses are not included in the Fund’s reported expense ratios. |
| (f) | Ratios include line of credit interest expense which is less than 0.01%. |
| (g) | Total net expenses include the impact of certain fee waivers/expense reimbursements made by the Investment Manager and certain of its affiliates, if applicable. |
The accompanying Notes to Financial Statements are an integral part of this statement.
| | | | |
| Semiannual Report 2016 | | | 21 | |
| | | | | | |
| | |
| | | | COLUMBIA SELIGMAN COMMUNICATIONS AND INFORMATION FUND | | |
FINANCIAL HIGHLIGHTS (continued)
| | | | | | | | | | | | | | | | | | | | | | | | | | | | |
| |
| Six Months Ended
November 30, 2016 |
| | | Year Ended May 31, | | |
| Year Ended
December 31, |
|
Class Z | | | (Unaudited) | | | | 2016 | | | | 2015 | | | | 2014 | | | | 2013 | | | | 2012(a) | | | | 2011 | |
Per share data | | | | | | | | | | | | | | | | | | | | | | | | | | | | |
Net asset value, beginning of period | | | $59.72 | | | | $67.09 | | | | $57.47 | | | | $47.53 | | | | $45.01 | | | | $42.77 | | | | $46.62 | |
| | | | | | | | | | | | | | | | | | | | | | | | | | | | | |
Income from investment operations: | | | | | | | | | | | | | | | | | | | | | | | | | | | | |
| | | | | | | |
Net investment loss | | | (0.07 | ) | | | (0.14 | ) | | | (0.19 | ) | | | (0.15 | ) | | | (0.19 | ) | | | (0.09 | ) | | | (0.15 | ) |
| | | | | | | | | | | | | | | | | | | | | | | | | | | | | |
Net realized and unrealized gain (loss) | | | 8.04 | | | | (1.16 | ) | | | 17.09 | | | | 10.87 | | | | 5.43 | | | | 2.27 | | | | (1.96 | ) |
| | | | | | | | | | | | | | | | | | | | | | | | | | | | | |
Increase from payment by affiliate | | | — | | | | — | | | | — | | | | — | | | | — | | | | — | | | | 0.01 | |
| | | | | | | | | | | | | | | | | | | | | | | | | | | | | |
Total from investment operations | | | 7.97 | | | | (1.30 | ) | | | 16.90 | | | | 10.72 | | | | 5.24 | | | | 2.18 | | | | (2.10 | ) |
| | | | | | | | | | | | | | | | | | | | | | | | | | | | | |
Less distributions to shareholders: | | | | | | | | | | | | | | | | | | | | | | | | | | | | |
| | | | | | | |
Net realized gains | | | — | | | | (6.07 | ) | | | (7.28 | ) | | | (0.78 | ) | | | (2.72 | ) | | | — | | | | (1.75 | ) |
| | | | | | | | | | | | | | | | | | | | | | | | | | | | | |
Total distributions to shareholders | | | — | | | | (6.07 | ) | | | (7.28 | ) | | | (0.78 | ) | | | (2.72 | ) | | | — | | | | (1.75 | ) |
| | | | | | | | | | | | | | | | | | | | | | | | | | | | | |
Proceeds from regulatory settlements | | | — | | | | — | | | | — | | | | — | | | | — | | | | 0.06 | | | | — | |
| | | | | | | | | | | | | | | | | | | | | | | | | | | | | |
Net asset value, end of period | | | $67.69 | | | | $59.72 | | | | $67.09 | | | | $57.47 | | | | $47.53 | | | | $45.01 | | | | $42.77 | |
| | | | | | | | | | | | | | | | | | | | | | | | | | | | | |
Total return | | | 13.35 | % | | | (1.89 | %) | | | 31.36 | % | | | 22.77 | % | | | 12.16 | % | | | 5.24 | %(b) | | | (4.53 | %)(c) |
| | | | | | | | | | | | | | | | | | | | | | | | | | | | | |
Ratios to average net assets(d) | | | | | | | | | | | | | | | | | | | | | | | | | | | | |
| | | | | | | |
Total gross expenses | | | 1.07 | %(e) | | | 1.10 | %(f) | | | 1.10 | % | | | 1.16 | %(f) | | | 1.12 | %(f) | | | 1.09 | %(e) | | | 1.09 | %(f) |
| | | | | | | | | | | | | | | | | | | | | | | | | | | | | |
Total net expenses(g) | | | 1.07 | %(e)(h) | | | 1.10 | %(f)(h) | | | 1.10 | %(h) | | | 1.16 | %(f)(h) | | | 1.12 | %(f)(h) | | | 1.09 | %(e) | | | 1.09 | %(f)(h) |
| | | | | | | | | | | | | | | | | | | | | | | | | | | | | |
Net investment loss | | | (0.22 | %)(e) | | | (0.23 | %) | | | (0.31 | %) | | | (0.30 | %) | | | (0.41 | %) | | | (0.45 | %)(e) | | | (0.33 | %) |
| | | | | | | | | | | | | | | | | | | | | | | | | | | | | |
Supplemental data | | | | | | | | | | | | | | | | | | | | | | | | | | | | |
| | | | | | | |
Net assets, end of period (in thousands) | | | $429,440 | | | | $347,029 | | | | $338,516 | | | | $189,112 | | | | $180,926 | | | | $235,749 | | | | $148,571 | |
| | | | | | | | | | | | | | | | | | | | | | | | | | | | | |
Portfolio turnover | | | 27 | % | | | 48 | % | | | 61 | % | | | 48 | % | | | 61 | % | | | 38 | % | | | 66 | % |
| | | | | | | | | | | | | | | | | | | | | | | | | | | | | |
Notes to Financial Highlights
| (a) | For the period from January 1, 2012 to May 31, 2012. During the period, the Fund’s fiscal year end was changed from December 31 to May 31. |
| (b) | The Fund received proceeds from regulatory settlements. Had the Fund not received these proceeds, the total return would have been lower by 0.12%. |
| (c) | The Fund received a payment from an affiliate. Had the Fund not received this payment, the total return would have been lower by 0.01%. |
| (d) | In addition to the fees and expenses that the Fund bears directly, the Fund indirectly bears a pro rata share of the fees and expenses of any other funds in which it invests. Such indirect expenses are not included in the Fund’s reported expense ratios. |
| (f) | Ratios include line of credit interest expense which is less than 0.01%. |
| (g) | Total net expenses include the impact of certain fee waivers/expense reimbursements made by the Investment Manager and certain of its affiliates, if applicable. |
| (h) | The benefits derived from expense reductions had an impact of less than 0.01%. |
The accompanying Notes to Financial Statements are an integral part of this statement.
| | |
| 22 | | Semiannual Report 2016 |
| | | | | | |
| | |
| | | | COLUMBIA SELIGMAN COMMUNICATIONS AND INFORMATION FUND | | |
NOTES TO FINANCIAL STATEMENTS
November 30, 2016 (Unaudited)
Note 1. Organization
Columbia Seligman Communications and Information Fund (the Fund), a series of Columbia Funds Series Trust II (the Trust), is a non-diversified fund. The Trust is registered under the Investment Company Act of 1940, as amended (the 1940 Act), as an open-end management investment company organized as a Massachusetts business trust.
Fund Shares
The Trust may issue an unlimited number of shares (without par value). The Fund offers Class A, Class B, Class C, Class I, Class K, Class R, Class R4, Class R5 and Class Z shares. Although all share classes generally have identical voting, dividend and liquidation rights, each share class votes separately when required by the Trust’s organizational documents or by law. Different share classes pay different distribution amounts to the extent the expenses of such share classes differ, and distributions in liquidation will be proportional to the net asset value of each share class. Each share class has its own expense and sales charge structure.
Class A shares are subject to a maximum front-end sales charge of 5.75% based on the initial investment amount. Class A shares purchased without an initial sales charge in accounts aggregating $1 million to $50 million at the time of purchase are subject to a contingent deferred sales charge (CDSC) if the shares are sold within 18 months after purchase, charged as follows: 1.00% CDSC if redeemed within 12 months after purchase, and 0.50% CDSC if redeemed more than 12, but less than 18, months after purchase.
Class B shares may be subject to a maximum CDSC of 5.00% based upon the holding period after purchase. Class B shares will generally convert to Class A shares eight years after purchase. The Fund no longer accepts investments by new or existing investors in the Fund’s Class B shares, except in connection with the reinvestment of any dividend and/or capital gain distributions in Class B shares of the Fund and exchanges by existing Class B shareholders of certain other funds within the Columbia Family of Funds.
Class C shares are subject to a 1.00% CDSC on shares redeemed within 12 months after purchase.
Class I shares are not subject to sales charges and are available only to the Columbia Family of Funds.
Class K shares are not subject to sales charges, however this share class is closed to new investors.
Class R shares are not subject to sales charges and are generally available only to certain retirement plans and other investors as described in the Fund’s prospectus.
Class R4 shares are not subject to sales charges and are generally available only to omnibus retirement plans and certain investors as described in the Fund’s prospectus.
Class R5 shares are not subject to sales charges and are generally available only to investors purchasing through authorized investment professionals and omnibus retirement plans.
Class Z shares are not subject to sales charges and are generally available only to eligible investors, which are subject to different investment minimums as described in the Fund’s prospectus.
Note 2. Summary of Significant Accounting Policies
Basis of Preparation
The Fund is an investment company that applies the accounting and reporting guidance in the Financial Accounting Standards Board (FASB) Accounting Standards Codification Topic 946, Financial Services —Investment Companies (ASC 946). The financial statements are prepared in accordance with U.S. generally accepted accounting principles (GAAP), which requires management to make certain estimates and assumptions that affect the reported amounts of assets and liabilities, the disclosure of contingent assets and liabilities at the date of the financial statements and the reported amounts of income and expenses during the reporting period. Actual results could differ from those estimates.
The following is a summary of significant accounting policies followed by the Fund in the preparation of its financial statements.
Security Valuation
All equity securities are valued at the close of business of the New York Stock Exchange (NYSE). Equity securities are valued at the last quoted sales price on the principal exchange or market on which they trade, except for securities traded on the NASDAQ Stock Market, which are valued at the NASDAQ official close price. Unlisted securities or listed securities for which there were no sales during the day are valued at the mean of the latest quoted bid and ask prices on such exchanges or markets.
| | | | |
| Semiannual Report 2016 | | | 23 | |
| | | | | | |
| | |
| | | | COLUMBIA SELIGMAN COMMUNICATIONS AND INFORMATION FUND | | |
NOTES TO FINANCIAL STATEMENTS (continued)
November 30, 2016 (Unaudited)
Foreign equity securities are valued based on the closing price on the foreign exchange in which such securities are primarily traded. If any foreign equity security closing prices are not readily available, the securities are valued at the mean of the latest quoted bid and ask prices on such exchanges or markets. Foreign currency exchange rates are generally determined at 4:00 p.m. Eastern (U.S.) time. Many securities markets and exchanges outside the U.S. close prior to the close of the NYSE; therefore, the closing prices for securities in such markets or on such exchanges may not fully reflect events that occur after such close but before the close of the NYSE. In those situations, foreign securities will be fair valued pursuant to a policy adopted by the Board of Trustees (the Board), including, if available, utilizing a third party pricing service to determine these fair values. The third party pricing service takes into account multiple factors, including, but not limited to, movements in the U.S. securities markets, certain depositary receipts, futures contracts and foreign exchange rates that have occurred subsequent to the close of the foreign exchange or market, to determine a good faith estimate that reasonably reflects the current market conditions as of the close of the NYSE. The fair value of a security is likely to be different from the quoted or published price, if available.
Investments in open-end investment companies, including money market funds, are valued at their latest net asset value.
Investments for which market quotations are not readily available, or that have quotations which management believes are not reflective of market value or reliable, are valued at fair value as determined in good faith under procedures approved by and under the general supervision of the Board. If a security or class of securities (such as foreign securities) is valued at fair value, such value is likely to be different from the quoted or published price for the security.
The determination of fair value often requires significant judgment. To determine fair value, management may use assumptions including but not limited to future cash flows and estimated risk premiums. Multiple inputs from various sources may be used to determine fair value.
GAAP requires disclosure regarding the inputs and valuation techniques used to measure fair value and any changes in valuation inputs or techniques. In addition, investments shall be disclosed by major category. This information is disclosed following the Fund’s Portfolio of Investments.
Security Transactions
Security transactions are accounted for on the trade date. Cost is determined and gains (losses) are based upon the specific identification method for both financial statement and federal income tax purposes.
Income Recognition
Corporate actions and dividend income are generally recorded net of any non-reclaimable tax withholdings, on the ex-dividend date or upon receipt of ex-dividend notification in the case of certain foreign securities.
The Fund may receive distributions from holdings in equity securities, business development companies (BDCs), exchange-traded funds, other regulated investment companies (RICs), and real estate investment trusts (REITs), which report information on the tax character of their distributions annually. These distributions are allocated to dividend income, capital gain and return of capital based on actual information reported. Return of capital is recorded as a reduction of the cost basis of securities held. If the Fund no longer owns the applicable securities, return of capital is recorded as a realized gain. With respect to REITs, to the extent actual information has not yet been reported, estimates for return of capital are made by the Fund’s management. Management’s estimates are subsequently adjusted when the actual character of the distributions is disclosed by the REITs, which could result in a proportionate change in return of capital to shareholders.
Awards from class action litigation are recorded as a reduction of cost basis if the Fund still owns the applicable securities on the payment date. If the Fund no longer owns the applicable securities, the proceeds are recorded as realized gains.
Expenses
General expenses of the Trust are allocated to the Fund and other funds of the Trust based upon relative net assets or other expense allocation methodologies determined by the nature of the expense. Expenses directly attributable to the Fund are charged to the Fund. Expenses directly attributable to a specific class of shares are charged to that share class.
Determination of Class Net Asset Value
All income, expenses (other than class-specific expenses, which are charged to that share class, as shown in the Statement of Operations) and realized and
| | |
| 24 | | Semiannual Report 2016 |
| | | | | | |
| | |
| | | | COLUMBIA SELIGMAN COMMUNICATIONS AND INFORMATION FUND | | |
NOTES TO FINANCIAL STATEMENTS (continued)
November 30, 2016 (Unaudited)
unrealized gains (losses) are allocated to each class of the Fund on a daily basis, based on the relative net assets of each class, for purposes of determining the net asset value of each class.
Federal Income Tax Status
The Fund intends to qualify each year as a regulated investment company under Subchapter M of the Internal Revenue Code, as amended, and will distribute substantially all of its taxable income (including net short-term capital gains), if any, for its tax year, and as such will not be subject to federal income taxes. In addition, the Fund intends to distribute in each calendar year substantially all of its net investment income, capital gains and certain other amounts, if any, such that the Fund should not be subject to federal excise tax. Therefore, no federal income or excise tax provision is recorded.
Distributions to Shareholders
Distributions from net investment income, if any, are declared and paid annually. Net realized capital gains, if any, are distributed along with the income distribution. Income distributions and capital gain distributions are determined in accordance with federal income tax regulations, which may differ from GAAP.
Guarantees and Indemnifications
Under the Trust’s organizational documents and, in some cases, by contract, its officers and trustees are indemnified against certain liabilities arising out of the performance of their duties to the Trust or its funds. In addition, certain of the Fund’s contracts with its service providers contain general indemnification clauses. The Fund’s maximum exposure under these arrangements is unknown since the amount of any future claims that may be made against the Fund cannot be determined, and the Fund has no historical basis for predicting the likelihood of any such claims.
Investment Company Reporting Modernization
In October 2016, the U.S. Securities and Exchange Commission adopted new rules and forms, and amendments to certain current rules and forms, to modernize reporting and disclosure of information by registered investment companies. The amendments to Regulation S-X will require standardized, enhanced disclosure about derivatives in investment company financial statements, and will also change the rules governing the form and content of such financial statements. The amendments to Regulation S-X take
effect on August 1, 2017. At this time, management is assessing the anticipated impact of these regulatory developments.
Note 3. Fees and Other Transactions with Affiliates
Management Services Fees
The Fund entered into a Management Agreement with Columbia Management Investment Advisers, LLC (the Investment Manager), a wholly-owned subsidiary of Ameriprise Financial, Inc. (Ameriprise Financial). Under the Management Agreement, the Investment Manager provides the Fund with investment research and advice, as well as administrative and accounting services. The management services fee is an annual fee that is equal to a percentage of the Fund’s average daily net assets that declines from 0.915% to 0.755% as the Fund’s net assets increase. The annualized effective management services fee rate for the six months ended November 30, 2016 was 0.89% of the Fund’s average daily net assets.
Other Expenses
Other expenses are for, among other things, miscellaneous expenses of the Fund or the Board, including payments to Board Services Corp., a company providing limited administrative services to the Fund and the Board. That company’s expenses include boardroom and office expense, employee compensation, employee health and retirement benefits, and certain other expenses.
Compensation of Board Members
Board members, who are not officers or employees of the Investment Manager or Ameriprise Financial, are compensated for their services to the Fund as disclosed in the Statement of Operations. Under a Deferred Compensation Plan (the Plan), these Board members may elect to defer payment of up to 100% of their compensation. Deferred amounts are treated as though equivalent dollar amounts had been invested in shares of certain funds managed by the Investment Manager. The Fund’s liability for these amounts is adjusted for market value changes and remains in the Fund until distributed in accordance with the Plan. All amounts payable under the Plan constitute a general unsecured obligation of the Fund.
Compensation of Chief Compliance Officer
The Board has appointed a Chief Compliance Officer to the Fund in accordance with federal securities
| | | | |
| Semiannual Report 2016 | | | 25 | |
| | | | | | |
| | |
| | | | COLUMBIA SELIGMAN COMMUNICATIONS AND INFORMATION FUND | | |
NOTES TO FINANCIAL STATEMENTS (continued)
November 30, 2016 (Unaudited)
regulations. The Fund is allocated a portion of the expenses associated with the Chief Compliance Officer based on relative net assets of the Trust.
Transfer Agency Fees
Under a Transfer and Dividend Disbursing Agent Agreement, Columbia Management Investment Services Corp. (the Transfer Agent), an affiliate of the Investment Manager and a wholly-owned subsidiary of Ameriprise Financial, is responsible for providing transfer agency services to the Fund. The Transfer Agent has contracted with Boston Financial Data Services (BFDS) to serve as sub-transfer agent. The Transfer Agent pays the fees of BFDS for services as sub-transfer agent and BFDS is not entitled to reimbursement for such fees from the Fund (with the exception of out-of-pocket fees).
The Fund pays the Transfer Agent a monthly transfer agency fee based on the number or the average value of accounts, depending on the type of account. In addition, prior to October 1, 2016, the Transfer Agent also received sub-transfer agency fees based on a percentage of the average aggregate value of the Fund’s shares maintained in omnibus accounts (other than omnibus accounts for which American Enterprise Investment Services Inc. is the broker of record or accounts where the beneficial shareholder is a customer of Ameriprise Financial Services, Inc., for which the Transfer Agent receives a per account fee). Effective October 1, 2016, the Fund pays the Transfer Agent a fee for shareholder services based on the number of accounts or on a percentage of the average aggregate value of the Fund’s shares maintained in omnibus accounts up to the lesser of the amount charged by the servicing agent or a cap established by the Board from time to time.
The Transfer Agent also receives compensation from the Fund for various shareholder services and reimbursements for certain out-of-pocket fees. Effective January 1, 2017, total transfer agency fees for Class K and Class R5 shares are subject to an annual limitation of not more than 0.075% of the average daily net assets attributable to each share class. Total transfer agency fees for Class I shares are subject to an annual limitation of not more than 0.025% of the average daily net assets attributable to Class I shares. Prior to January 1, 2017, total transfer agency fees for Class K and Class R5 shares were subject to an annual limitation of not more than 0.05% of the average daily net assets attributable to each share class. Class I shares did not pay transfer agency fees.
For the six months ended November 30, 2016, the Fund’s annualized effective transfer agency fee rates as a percentage of average daily net assets of each class were as follows:
| | | | |
Class A | | | 0.15 | % |
Class B | | | 0.16 | |
Class C | | | 0.15 | |
Class K | | | 0.05 | |
Class R | | | 0.15 | |
Class R4 | | | 0.15 | |
Class R5 | | | 0.05 | |
Class Z | | | 0.15 | |
The Fund and certain other associated investment companies have severally, but not jointly, guaranteed the performance and observance of all the terms and conditions of a lease entered into by Seligman Data Corp. (SDC), the former transfer agent, including the payment of rent by SDC (the Guaranty). SDC was the legacy Seligman funds’ former transfer agent.
The lease and the Guaranty expire in January 2019. At November 30, 2016, the Fund’s total potential future obligation over the life of the Guaranty is $1,078,371. The liability remaining at November 30, 2016 for non-recurring charges associated with the lease amounted to $611,973 and is recorded as a part of the payable for other expenses in the Statement of Assets and Liabilities.
An annual minimum account balance fee of $20 may apply to certain accounts with a value below the applicable share class’s initial minimum investment requirements to reduce the impact of small accounts on transfer agency fees. These minimum account balance fees are remitted to the Fund and recorded as part of expense reductions in the Statement of Operations. For the six months ended November 30, 2016, these minimum account balance fees reduced total expenses of the Fund by $9,626.
Plan Administration Fees
Under a Plan Administration Services Agreement with the Transfer Agent, the Fund pays an annual fee at a rate of 0.25% of the Fund’s average daily net assets attributable to Class K shares for the provision of various administrative, recordkeeping, communication and educational services.
| | |
| 26 | | Semiannual Report 2016 |
| | | | | | |
| | |
| | | | COLUMBIA SELIGMAN COMMUNICATIONS AND INFORMATION FUND | | |
NOTES TO FINANCIAL STATEMENTS (continued)
November 30, 2016 (Unaudited)
Distribution and Service Fees
The Fund has an agreement with Columbia Management Investment Distributors, Inc. (the Distributor), an affiliate of the Investment Manager and a wholly-owned subsidiary of Ameriprise Financial, for distribution and shareholder services. Under a Plan and Agreement of Distribution, the Fund pays a fee at an annual rate of up to 0.25% of the Fund’s average daily net assets attributable to Class A shares, a fee at an annual rate of up to 0.50% of the Fund’s average daily net assets attributable to Class R shares (of which up to 0.25% may be used for shareholder services) and a fee at an annual rate of up to 1.00% of the Fund’s average daily net assets attributable to Class B and Class C shares. For Class B and Class C shares, of the 1.00% fee, up to 0.75% is reimbursed for distribution expenses.
The amount of distribution and shareholder services expenses incurred by the Distributor and not yet reimbursed (unreimbursed expense) was approximately $17,592,000 for Class C shares. This amount is based on the most recent information available as of September 30, 2016, and may be recovered from future payments under the distribution plan or CDSCs. There were no unreimbursed distribution expenses for Class B shares. To the extent the distribution and/or shareholder services expenses incurred by the Distributor have been fully recovered, the distribution and/or shareholder services fee is not charged to the share class.
Sales Charges
Sales charges, including front-end charges and CDSCs, received by the Distributor for distributing Fund shares were $1,126,708 for Class A, $149 for Class B and $13,644 for Class C shares for the six months ended November 30, 2016.
Expenses Waived/Reimbursed by the Investment Manager and its Affiliates
The Investment Manager and certain of its affiliates have contractually agreed to waive fees and/or reimburse expenses (excluding certain fees and expenses described below) for the periods disclosed below, unless sooner terminated at the sole discretion of the Board, so that the Fund’s net operating expenses, after giving
effect to fees waived/expenses reimbursed and any balance credits and/or overdraft charges from the Fund’s custodian, do not exceed the following annual rates as a percentage of the class’ average daily net assets:
| | | | | | | | |
| | | October 1, 2016 Through September 30, 2017 | | | Prior to October 1, 2016 | |
Class A | | | 1.45 | % | | | 1.45 | % |
Class B | | | 2.20 | | | | 2.20 | |
Class C | | | 2.20 | | | | 2.20 | |
Class I | | | 1.07 | | | | 1.06 | |
Class K | | | 1.37 | | | | 1.36 | |
Class R | | | 1.70 | | | | 1.70 | |
Class R4 | | | 1.20 | | | | 1.20 | |
Class R5 | | | 1.12 | | | | 1.11 | |
Class Z | | | 1.20 | | | | 1.20 | |
Under the agreement governing these fee waivers and/or expense reimbursement arrangements, the following fees and expenses are excluded from the waiver/reimbursement commitment, and therefore will be paid by the Fund, if applicable: taxes (including foreign transaction taxes), expenses associated with investments in affiliated and non-affiliated pooled investment vehicles (including mutual funds and exchange-traded funds), transaction costs and brokerage commissions, costs related to any securities lending program, dividend and interest expenses associated with securities sold short, inverse floater program fees and expenses, transaction charges and interest on borrowed money, interest, infrequent and/or unusual expenses and any other expenses the exclusion of which is specifically approved by the Board. This agreement may be modified or amended only with approval from the Investment Manager, certain of its affiliates and the Fund. Any fees waived and/or expenses reimbursed under the expense reimbursement arrangements described above are not recoverable by the Investment Manager or its affiliates in future periods. The contractual expense cap includes distribution and shareholder services fees. As discussed above, to the extent the distribution and/or shareholder services expenses incurred by the Distributor have been fully recovered, the distribution and/or shareholder services fee is not charged to the share class.
| | | | |
| Semiannual Report 2016 | | | 27 | |
| | | | | | |
| | |
| | | | COLUMBIA SELIGMAN COMMUNICATIONS AND INFORMATION FUND | | |
NOTES TO FINANCIAL STATEMENTS (continued)
November 30, 2016 (Unaudited)
Note 4. Federal Tax Information
The timing and character of income and capital gain distributions are determined in accordance with income tax regulations, which may differ from GAAP because of temporary or permanent book to tax differences.
At November 30, 2016, the cost of investments for federal income tax purposes was approximately $3,086,999,000 and the aggregate gross approximate unrealized appreciation and depreciation based on that cost was:
| | | | |
Unrealized appreciation | | | $1,291,778,000 | |
Unrealized depreciation | | | (33,226,000 | ) |
Net unrealized appreciation | | | $1,258,552,000 | |
Management of the Fund has concluded that there are no significant uncertain tax positions in the Fund that would require recognition in the financial statements. However, management’s conclusion may be subject to review and adjustment at a later date based on factors including, but not limited to, new tax laws, regulations, and administrative interpretations (including relevant court decisions). Generally, the Fund’s federal tax returns for the prior three fiscal years remain subject to examination by the Internal Revenue Service.
Note 5. Portfolio Information
The cost of purchases and proceeds from sales of securities, excluding short-term investments and derivatives, if any, aggregated to $1,112,988,964 and $1,400,042,462, respectively, for the six months ended November 30, 2016. The amount of purchase and sale activity impacts the portfolio turnover rate reported in the Financial Highlights.
Note 6. Affiliated Money Market Fund
The Fund invests in Columbia Short-Term Cash Fund, an affiliated money market fund established for the exclusive use by the Fund and other affiliated funds (the Affiliated MMF). The income earned by the Fund from such investments is included as Dividends — affiliated issuers in the Statement of Operations. As an investing fund, the Fund indirectly bears its proportionate share of the expenses of the Affiliated MMF. Effective October 1, 2016, the Affiliated MMF prices its shares with a floating net asset value (NAV) and no longer seeks to maintain a stable NAV. In addition, the Board of the Affiliated MMF may impose a fee on redemptions (sometimes referred to as a liquidity fee) or temporarily suspend redemptions (sometimes referred to as imposing a redemption gate) in the event its liquidity falls below regulatory limits.
Note 7. Line of Credit
The Fund has access to a revolving credit facility with a syndicate of banks led by Citibank, N.A., HSBC Bank USA, N.A. and JPMorgan Chase Bank, N.A. whereby the Fund may borrow for the temporary funding of shareholder redemptions or for other temporary or emergency purposes. The credit facility agreement, which is a collective agreement between the Fund and certain other funds managed by the Investment Manager, severally and not jointly, that permits collective borrowings up to $1 billion. Interest is charged to each participating fund based on its borrowings at a rate equal to the higher of (i) the overnight federal funds rate plus 1.00% or (ii) the one-month LIBOR rate plus 1.00%. Each borrowing under the credit facility matures no later than 60 days after the date of borrowing. The Fund also pays a commitment fee equal to its pro rata share of the amount of the credit facility at a rate of 0.15% per annum. The commitment fee is included in other expenses in the Statement of Operations.
The Fund had no borrowings during the six months ended November 30, 2016.
Note 8. Significant Risks
Shareholder Concentration Risk
At November 30, 2016, one unaffiliated shareholder of record owned 11.1% of the outstanding shares of the Fund in one or more accounts. The Fund has no knowledge about whether any portion of those shares was owned beneficially. Subscription and redemption activity by concentrated accounts may have a significant effect on the operations of the Fund. In the case of a large redemption, the Fund may be forced to sell investments at inopportune times, including its liquid or more liquid positions, resulting in Fund losses and the Fund holding a higher percentage of less liquid or illiquid securities. Large redemptions could result in decreased economies of scale and increased operating expenses for non-redeeming Fund shareholders.
Non-Diversification Risk
A non-diversified fund is permitted to invest a greater percentage of its total assets in fewer issuers than a diversified fund. The Fund may, therefore, have a greater risk of loss from a few issuers than a similar fund that invests more broadly.
| | |
| 28 | | Semiannual Report 2016 |
| | | | | | |
| | |
| | | | COLUMBIA SELIGMAN COMMUNICATIONS AND INFORMATION FUND | | |
NOTES TO FINANCIAL STATEMENTS (continued)
November 30, 2016 (Unaudited)
Technology and Technology-related Investment Risk
The Fund may be more susceptible to the particular risks that may affect companies in the information technology sector, as well as other technology-related sectors (collectively, the technology sectors) than if it were invested in a wider variety of companies in unrelated sectors. Companies in the technology sectors are subject to certain risks, including the risk that new services, equipment or technologies will not be accepted by consumers and businesses or will become rapidly obsolete. Performance of such companies may be affected by factors including obtaining and protecting patents (or the failure to do so) and significant competitive pressures, including aggressive pricing of their products or services, new market entrants, competition for market share and short product cycles due to an accelerated rate of technological developments. Such competitive pressures may lead to limited earnings and/or falling profit margins. As a result, the value of their securities may fall or fail to rise. In addition, many technology sector companies have limited operating histories and prices of these companies’ securities historically have been more volatile than other securities, especially over the short term.
Note 9. Subsequent Events
Management has evaluated the events and transactions that have occurred through the date the financial statements were issued and noted no items requiring adjustment of the financial statements or additional disclosure.
Note 10. Information Regarding Pending and Settled Legal Proceedings
Ameriprise Financial and certain of its affiliates have historically been involved in a number of legal, arbitration and regulatory proceedings, including routine litigation, class actions, and governmental actions, concerning matters arising in connection with the conduct of their business activities. Ameriprise Financial believes that the Funds are not currently the subject of, and that neither Ameriprise Financial nor any of its affiliates are the subject of, any pending legal, arbitration or regulatory proceedings that are likely to have a material adverse effect on the Funds or the ability of Ameriprise Financial or its affiliates to perform under their contracts with the Funds. Ameriprise Financial is required to make quarterly (10-Q), annual (10-K) and, as necessary, 8-K filings with the Securities and Exchange Commission
(SEC) on legal and regulatory matters that relate to Ameriprise Financial and its affiliates. Copies of these filings may be obtained by accessing the SEC website at www.sec.gov.
There can be no assurance that these matters, or the adverse publicity associated with them, will not result in increased fund redemptions, reduced sale of fund shares or other adverse consequences to the Funds. Further, although we believe proceedings are not likely to have a material adverse effect on the Funds or the ability of Ameriprise Financial or its affiliates to perform under their contracts with the Funds, these proceedings are subject to uncertainties and, as such, we are unable to estimate the possible loss or range of loss that may result. An adverse outcome in one or more of these proceedings could result in adverse judgments, settlements, fines, penalties or other relief that could have a material adverse effect on the consolidated financial condition or results of operations of Ameriprise Financial.
| | | | |
| Semiannual Report 2016 | | | 29 | |
| | | | | | |
| | |
| | | | COLUMBIA SELIGMAN COMMUNICATIONS AND INFORMATION FUND | | |
APPROVAL OF MANAGEMENT AGREEMENT
Columbia Management Investment Advisers, LLC (Columbia Threadneedle or the Investment Manager, and together with its domestic and global affiliates, Columbia Threadneedle Investments), a wholly-owned subsidiary of Ameriprise Financial, Inc. (Ameriprise Financial), serves as the investment manager to Columbia Seligman Communications and Information Fund (the Fund). Under a management agreement (the Management Agreement), Columbia Threadneedle provides investment advice and other services to the Fund and other funds distributed by Columbia Management Investment Distributors, Inc. (collectively, the Funds).
On an annual basis, the Fund’s Board of Trustees (the Board), including the independent Board members (the Independent Trustees), considers renewal of the Management Agreement. Columbia Threadneedle prepared detailed reports for the Board and its Contracts Committee in February, March and April 2016, including reports providing the results of analyses performed by an independent organization, Broadridge Financial Solutions, Inc. (Broadridge), and a comprehensive response to items of information requested by independent legal counsel to the Independent Trustees (Independent Legal Counsel) in a letter to the Investment Manager, to assist the Board in making this determination. Many of the materials presented in February, March and April were first supplied in draft form to designated independent Board representatives, i.e., Independent Legal Counsel, the Chair of the Board and/or the Chair of the Contracts Committee, and the final materials were revised to contain information reflective of discussion and subsequent requests made by the Contracts Committee. In addition, throughout the year, the Board (or its committees) regularly meets with portfolio management teams and senior management personnel and reviews information prepared by Columbia Threadneedle addressing the services Columbia Threadneedle provides and Fund performance. The Board also accords appropriate weight to the work, deliberations and conclusions of the various committees, such as the Contracts Committee, the Investment Review Committee and the Compliance Committee in determining whether to continue the Management Agreement.
The Board, at its June 13-15, 2016 in-person Board meeting (the June Meeting), considered the renewal of the Management Agreement for an additional one-year term. At the June Meeting, Independent Legal Counsel reviewed with the Independent Trustees various factors relevant to the Board’s consideration of management agreements and the Board’s legal responsibilities related to such consideration. Following an analysis and discussion of the factors identified below, the Board, including all of the Independent Trustees, approved the renewal of the Management Agreement.
Nature, Extent and Quality of Services Provided by Columbia Threadneedle
The Independent Trustees analyzed various reports and presentations they had received detailing the services performed by Columbia Threadneedle, as well as its organization, expertise, resources and capabilities.
The Independent Trustees specifically considered many developments during the past year concerning the services provided by Columbia Threadneedle, including, in particular, the relatively recent change in the leadership of equity department oversight, improvements in technology research and the use of research analysts’ model portfolios to highlight best ideas and improve implementation. The Independent Trustees further noted the restructured investment risk management department and its additional resources, including the new head of multi-asset investment risk. They also observed the relatively recent 5P leadership transition, and the additional staff and resources dedicated to the 5P team. The Board also noted the broad scope of services provided by Columbia Threadneedle to each Fund, including, among other services, investment, risk and compliance oversight. The Board also took into account the information it received concerning Columbia Threadneedle’s ability to attract and retain key portfolio management personnel.
In connection with the Board’s evaluation of the overall package of services provided by Columbia Threadneedle, the Board also considered the nature, quality and range of administrative services provided to the Fund by Columbia Threadneedle, as well as the achievements in 2015 in the performance of administrative services, and noted the various enhancements anticipated for 2016. In evaluating the quality of services provided under the Management Agreement, the Independent Trustees also took into account the organization and strength of the Fund’s and its service providers’ compliance programs. In addition, the Board reviewed the financial condition of Columbia Threadneedle and its affiliates and each entity’s ability to carry out its responsibilities under the Management Agreement and the Fund’s other service agreements with affiliates of Ameriprise Financial, observing the financial strength of Ameriprise Financial, with its solid balance sheet.
| | |
| 30 | | Semiannual Report 2016 |
| | | | | | |
| | |
| | | | COLUMBIA SELIGMAN COMMUNICATIONS AND INFORMATION FUND | | |
APPROVAL OF MANAGEMENT AGREEMENT (continued)
The Board also discussed the acceptability of the terms of the Management Agreement (including the relatively broad scope of services required to be performed by Columbia Threadneedle), noting that no material changes are proposed from the form of agreement previously approved. They also noted the wide array of legal and compliance services provided to the Funds. It was also observed that the services being performed under the Management Agreement were of a reasonably high quality.
Based on the foregoing, and based on other information received (both oral and written, including the information on investment performance referenced below) and other considerations, the Board concluded that Columbia Threadneedle and its affiliates are in a position to continue to provide a high quality and level of services to the Fund.
Investment Performance
For purposes of evaluating the nature, extent and quality of services provided under the Management Agreement, the Board carefully reviewed the investment performance of the Fund. In this regard, the Board considered detailed reports providing the results of analyses performed by an independent organization showing, for various periods, the performance of the Fund, the performance of a benchmark index, the percentage ranking of the Fund among its comparison group and the net assets of the Fund. The Board observed that the Fund’s investment performance met expectations
Comparative Fees, Costs of Services Provided and the Profits Realized by Columbia Threadneedle and its Affiliates from their Relationships with the Fund
The Board reviewed comparative fees and the costs of services provided under the Management Agreement. The Board members considered detailed comparative information set forth in an annual report on fees and expenses, including, among other things, data (based on analyses conducted by an independent organization) showing a comparison of the Fund’s expenses with median expenses paid by funds in its comparative peer universe, as well as data showing the Fund’s contribution to Columbia Threadneedle’s profitability. The Board reviewed the fees charged to comparable institutional or other accounts/vehicles managed by Columbia Threadneedle and discussed differences in how the products are managed and operated, noting no unreasonable differences in the levels of contractual fees.
The Board considered the reports of its independent fee consultant, JDL Consultants, LLC (JDL), which assisted in its analysis of the Funds’ performance and expenses, the reasonableness of the Funds’ fee rates, the reasonableness of Columbia Threadneedle’s profitability, and JDL’s conclusion that the management fees being charged to the Fund are reasonable. The Board accorded particular weight to the notion that the level of fees should generally reflect a rational pricing model applied consistently across the various product lines in the Fund family, while assuring that the overall fees for each Fund (with certain defined exceptions) are generally in line with the “pricing philosophy” currently in effect (i.e., that the total expense ratio of the Fund is generally no higher than the median expense ratio of funds in the comparison universe of the Fund). The Board took into account that the Fund’s total expense ratio (after considering proposed expense caps/waivers) was below the peer universe’s median expense ratio shown in the reports. Based on its review, the Board concluded that the Fund’s management fee was fair and reasonable in light of the extent and quality of services that the Fund receives.
The Board also considered the expected profitability of Columbia Threadneedle and its affiliates in connection with Columbia Threadneedle providing management services to the Fund. In this regard, the Independent Trustees referred to their detailed analysis of the Profitability Report, discussing the profitability to Columbia Threadneedle and Ameriprise Financial from managing, operating and distributing the Funds. The Board took into account JDL’s conclusion that 2015 Columbia Threadneedle profitability, relative to industry competitors, was reasonable. It also considered that in 2015 the Board had concluded that 2014 profitability was reasonable and that Columbia Threadneedle generated 2015 profitability that only slightly exceeded 2014 levels. It also took into account the indirect economic benefits flowing to Columbia Threadneedle or its affiliates in connection with managing or distributing the Funds, such as the enhanced ability to offer various other financial products to Ameriprise Financial customers, soft dollar benefits and overall reputational advantages. The Board noted that the fees paid by the Fund should permit the Investment Manager to offer competitive compensation to its personnel, make necessary investments in its business and earn an appropriate profit. The Board concluded that profitability levels were reasonable.
| | | | |
| Semiannual Report 2016 | | | 31 | |
| | | | | | |
| | |
| | | | COLUMBIA SELIGMAN COMMUNICATIONS AND INFORMATION FUND | | |
APPROVAL OF MANAGEMENT AGREEMENT (continued)
Economies of Scale to be Realized
The Board also considered the economies of scale that might be realized by Columbia Threadneedle as the Fund grows and took note of the extent to which Fund shareholders might also benefit from such growth. In this regard, the Board took into account that management fees decline as Fund assets exceed various breakpoints, all of which have not been surpassed. The Board concluded that the breakpoints in the management fee rate schedule satisfactorily provides for the sharing of economies of scale, as they allow for adequate opportunity for shareholders to realize benefits (fee breaks) as Fund assets grow.
Based on the foregoing, the Board, including all of the Independent Trustees, concluded that the management fees were fair and reasonable in light of the extent and quality of services provided. In reaching this conclusion, no single factor was determinative. On June 15, 2016, the Board, including all of the Independent Trustees, approved the renewal of the Management Agreement.
| | |
| 32 | | Semiannual Report 2016 |
| | | | | | |
| | |
| | | | COLUMBIA SELIGMAN COMMUNICATIONS AND INFORMATION FUND | | |
IMPORTANT INFORMATION ABOUT THIS REPORT
Each fund mails one shareholder report to each shareholder address. If you would like more than one report, please call shareholder services at 800.345.6611 and additional reports will be sent to you.
The policy of the Board is to vote the proxies of the companies in which each fund holds investments consistent with the procedures as stated in the Statement of Additional Information (SAI). You may obtain a copy of the SAI without charge by calling 800.345.6611; contacting your financial intermediary; visiting investor.columbiathreadneedleus.com; or searching the website of the Securities and Exchange Commission (SEC) at sec.gov. Information regarding how each fund voted proxies relating to portfolio securities is filed with the SEC by August 31st for the most recent 12-month period ending June 30th of that year, and is available without charge by visiting investor.columbiathreadneedleus.com, or searching the website of the SEC at sec.gov.
Each fund files a complete schedule of portfolio holdings with the SEC for the first and third quarters of each fiscal year on Form N-Q. Each fund’s Form N-Q is available on the SEC’s website at sec.gov and may be reviewed and copied at the SEC’s Public Reference Room in Washington, D.C. Information on the operation of the Public Reference Room may be obtained by calling 800.SEC.0330. Each fund’s complete schedule of portfolio holdings, as filed on Form N-Q, can also be obtained without charge, upon request, by calling 800.345.6611.
| | | | |
| Semiannual Report 2016 | | | 33 | |
Columbia Seligman Communications and Information Fund
P.O. Box 8081
Boston, MA 02266-8081
Please read and consider the investment objectives, risks, charges and expenses for any fund carefully before investing. For a prospectus and summary prospectus, which contains this and other important information about the Fund, go to investor.columbiathreadneedleus.com. The Fund is distributed by Columbia Management Investment Distributors, Inc., member FINRA, and managed by Columbia Management Investment Advisers, LLC.
Columbia Threadneedle Investments (Columbia Threadneedle) is the global brand name of the Columbia and Threadneedle group of companies. All rights reserved. Columbia Management Investment Distributors, Inc., 225 Franklin Street, Boston, MA 02110-2804
© 2017 Columbia Management Investment Advisers, LLC.
investor.columbiathreadneedleus.com
SAR219_05_G01_(01/17)
Item 2. Code of Ethics.
Not applicable for semiannual reports.
Item 3. Audit Committee Financial Expert.
Not applicable for semiannual reports.
Item 4. Principal Accountant Fees and Services.
Not applicable for semiannual reports.
Item 5. Audit Committee of Listed Registrants.
Not applicable.
Item 6. Investments
(a) The registrant’s “Schedule I — Investments in securities of unaffiliated issuers” (as set forth in 17 CFR 210.12-12) is included in Item 1 of this Form N-CSR.
(b) Not applicable.
Item 7. Disclosure of Proxy Voting Policies and Procedures for Closed-End Management Investment Companies.
Not applicable.
Item 8. Portfolio Managers of Closed-End Management Investment Companies.
Not applicable.
Item 9. Purchases of Equity Securities by Closed-End Management Investment Company and Affiliated Purchasers.
Not applicable.
Item 10. Submission of Matters to a Vote of Security Holders.
There were no material changes to the procedures by which shareholders may recommend nominees to the registrant’s board of directors.
Item 11. Controls and Procedures.
(a) The registrant’s principal executive officer and principal financial officer, based on their evaluation of the registrant’s disclosure controls and procedures as of a date within 90 days of the filing of this report, have concluded that such controls and procedures are adequately designed to ensure that material information required to be disclosed by the registrant in Form N-CSR is accumulated and communicated to the registrant’s management, including the principal executive officer and principal financial officer, or persons performing similar functions, as appropriate to allow timely decisions regarding required disclosure.
(b) There was no change in the registrant’s internal control over financial reporting that occurred during the registrant’s second fiscal quarter of the period covered by this report that has materially affected, or is reasonably likely to materially affect, the registrant’s internal control over financial reporting.
Item 12. Exhibits.
(a)(1) Code of ethics required to be disclosed under Item 2 of Form N-CSR: Not applicable for semiannual reports.
(a)(2) Certifications pursuant to Rule 30a-2(a) under the Investment Company Act of 1940 (17 CFR 270.30a-2(a)) attached hereto as Exhibit 99.CERT.
(a)(3) Not applicable.
(b) Certification pursuant to Rule 30a-2(b) under the Investment Company Act of 1940 (17 CFR 270.30a-2(b)) attached hereto as Exhibit 99.906CERT.
SIGNATURES
Pursuant to the requirements of the Securities Exchange Act of 1934 and the Investment Company Act of 1940, the registrant has duly caused this report to be signed on its behalf by the undersigned, thereunto duly authorized.
(registrant) | | | Columbia Funds Series Trust II | |
| |
| |
By (Signature and Title) | | /s/ Christopher O. Petersen | |
| Christopher O. Petersen, President and Principal Executive Officer |
| | |
| | |
Date | | | January 20, 2017 | |
| | | | | |
Pursuant to the requirements of the Securities Exchange Act of 1934 and the Investment Company Act of 1940, this report has been signed below by the following persons on behalf of the registrant and in the capacities and on the dates indicated.
By (Signature and Title) | | /s/ Christopher O. Petersen | |
| Christopher O. Petersen, President and Principal Executive Officer |
| | |
| | |
Date | | | January 20, 2017 | |
| | |
| | |
By (Signature and Title) | | /s/ Michael G. Clarke | |
| | Michael G. Clarke, Treasurer and Chief Financial Officer |
| |
| | |
Date | | | January 20, 2017 | |