UNITED STATES
SECURITIES AND EXCHANGE COMMISSION
Washington, D.C. 20549
FORM N-CSR
CERTIFIED SHAREHOLDER REPORT OF REGISTERED
MANAGEMENT INVESTMENT COMPANIES
Investment Company Act file number 811-21852
Columbia Funds Series Trust II
(Exact name of registrant as specified in charter)
225 Franklin Street
Boston, Massachusetts 02110
(Address of principal executive offices) (Zip code)
Ryan Larrenaga
c/o Columbia Management Investment Advisers, LLC
225 Franklin Street
Boston, MA 02110
(Name and address of agent for service)
Registrant’s telephone number, including area code: (800) 345-6611
Date of fiscal year end: October 31
Date of reporting period: April 30, 2017
Form N-CSR is to be used by management investment companies to file reports with the Commission not later than 10 days after the transmission to stockholders of any report that is required to be transmitted to stockholders under Rule 30e-1 under the Investment Company Act of 1940 (17 CFR 270.30e-1). The Commission may use the information provided on Form N-CSR in its regulatory, disclosure review, inspection, and policymaking roles.
A registrant is required to disclose the information specified by Form N-CSR, and the Commission will make this information public. A registrant is not required to respond to the collection of information contained in Form N-CSR unless the Form displays a currently valid Office of Management and Budget (“OMB”) control number. Please direct comments concerning the accuracy of the information collection burden estimate and any suggestions for reducing the burden to Secretary, Securities and Exchange Commission, 450 Fifth Street, NW, Washington, DC 20549-0609. The OMB has reviewed this collection of information under the clearance requirements of 44 U.S.C. § 3507.
Columbia Funds Series Trust II
Item 1. Reports to Stockholders.

SemiAnnual Report
April 30, 2017
Columbia Select Global Equity Fund
Not FDIC Insured • No bank guarantee • May lose value
Dear Shareholders,
While emotions have run high following the outcome of the U.S. Presidential election, it remains unclear how the Trump presidency will unfold in terms of policy. We have a sense of the priorities espoused by the President over the past eighteen months, but campaign priorities are not always realized and are often never pursued. What seems certain is that, while some investors have already priced expectations into the market, others have retreated, preferring instead a wait and see approach. The outcome of such behaviors appears to have created conditions ripe for ongoing market volatility.
While volatility in the financial markets can be stressful, volatility itself is not a new phenomenon. Other factors that have been at the root cause of recent volatility include uncertainty following the United Kingdom’s vote to exit the European Union (Brexit), speculation around the Federal Reserve’s decision to increase interest rates, divergent central bank policy and geopolitical unrest. The point is, financial markets have fluctuated for years and may be expected to continue to fluctuate — sometimes wildly. If anything, such volatility seems to be the new normal, perhaps exacerbated by access to information and development of technological tools which have enabled investors to react rapidly to real and perceived change. So what can you do?
Position your portfolio for the reality of market volatility
That there is a historical precedent for market volatility, or even an acceptance that it may persist, offers little comfort. A measured and strategic approach remains the best strategy for investors to stay on track in achieving their investment goals.
Step 1: Review your investment goals
Take this opportunity to review your investment goals and the strategies you are pursuing to achieve those goals in order to remain focused on what’s important to you. It is entirely possible that your goals have changed in response either to your life situation or to changes in the market. Accept what you can’t control — volatility, and focus on what you can — your investment goals and strategies.
Step 2: Reassess your risk tolerance
Sit down with your financial advisor to discuss your investment goals and strategies, as well as any changes to your tolerance for risk. Consider your investment horizon. Increased market volatility and a new investment horizon may impact the strategies that can best help you achieve your investment goals. Remember, achieving your investment goals may require a certain amount of risk. Ultimately, you must maintain vigilance in reassessing your risk tolerance and the strategies you have selected in pursuit of your investment goals, and awareness of how those strategies may react to market volatility.
Step 3: Remain calm and focus on your long-term plan
Remember, investing is about the long game. Short term events are not necessarily evidence of a longer term reality. Investors who attempt to time the market too often end up reacting to a down turn by selling low and then compounding the problem by waiting on the sidelines, ultimately missing the right opportunity to reinvest.
Columbia Select Global Equity Fund | Semiannual Report 2017
President’s Message (continued)
As long as there is a market, there will be volatility. How you respond to that volatility can make a big difference in the measure of your success as an investor. Talk to your financial advisor about how working with Columbia Threadneedle Investments may help you position your portfolio for the reality of ongoing volatility and, perhaps, even turn such volatility into investment opportunity.
Sincerely,
Christopher O. Petersen
President, Columbia Funds
Investors should consider the investment objectives, risks, charges and expenses of a mutual fund carefully before investing. For a free prospectus and summary prospectus, which contains this and other important information about a fund, visit investor.columbiathreadneedleus.com. The prospectus should be read carefully before investing.
Columbia Funds are distributed by Columbia Management Investment Distributors, Inc., member FINRA, and managed by Columbia Management Investment Advisers, LLC.
© 2017 Columbia Management Investment Advisers, LLC. All rights reserved.
Columbia Select Global Equity Fund | Semiannual Report 2017
Columbia Select Global Equity Fund | Semiannual Report 2017
Fund at a Glance
(Unaudited)
Investment objective
Columbia Select Global Equity Fund (the Fund) seeks to provide shareholders with long-term capital growth.
Portfolio management
Threadneedle International Limited
David Dudding, CFA
Pauline Grange
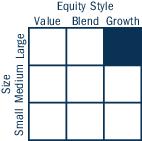
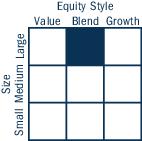
Morningstar style boxTM
The Morningstar Style Box is based on a fund’s portfolio holdings. For equity funds, the vertical axis shows the market capitalization of the stocks owned, and the horizontal axis shows investment style (value, blend, or growth). Information shown is based on the most recent data provided by Morningstar.
© 2017 Morningstar, Inc. All rights reserved. The Morningstar information contained herein: (1) is proprietary to Morningstar and/or its content providers; (2) may not be copied or distributed; and (3) is not warranted to be accurate, complete or timely. Neither Morningstar nor its content providers are responsible for any damages or losses arising from any use of this information.
| Average annual total returns (%) (for the period ended April 30, 2017) |
| | | Inception | 6 Months
cumulative | 1 Year | 5 Years | 10 Years |
| Class A | Excluding sales charges | 05/29/90 | 12.65 | 14.46 | 8.99 | 3.67 |
| | Including sales charges | | 6.15 | 7.85 | 7.71 | 3.06 |
| Class B | Excluding sales charges | 03/20/95 | 12.23 | 13.58 | 8.19 | 2.89 |
| | Including sales charges | | 7.23 | 8.58 | 7.90 | 2.89 |
| Class C | Excluding sales charges | 06/26/00 | 12.28 | 13.65 | 8.17 | 2.88 |
| | Including sales charges | | 11.28 | 12.65 | 8.17 | 2.88 |
| Class K | 03/20/95 | 12.60 | 14.61 | 9.19 | 3.86 |
| Class R | 12/11/06 | 12.54 | 14.23 | 8.72 | 3.51 |
| Class R5 | 12/11/06 | 12.87 | 14.88 | 9.47 | 4.13 |
| Class T | Excluding sales charges | 12/01/06 | 12.59 | 14.39 | 8.95 | 3.67 |
| | Including sales charges | | 9.78 | 11.49 | 8.41 | 3.41 |
| Class Y * | 03/01/17 | 12.73 | 14.54 | 9.01 | 3.68 |
| Class Z * | 09/27/10 | 12.82 | 14.73 | 9.28 | 3.85 |
| MSCI ACWI (Net) | | 11.76 | 15.14 | 8.96 | 3.71 |
Returns for Class A are shown with and without the maximum initial sales charge of 5.75%. Returns for Class B are shown with and without the applicable contingent deferred sales charge (CDSC) of 5.00% in the first year, declining to 1.00% in the sixth year and eliminated thereafter. The Fund does not accept new investments in Class B shares, except for certain limited transactions. The Fund’s current Class B investors, having held their shares for the requisite time period, are no longer subject to a CDSC upon redemption of their shares. Returns for Class C are shown with and without the 1.00% CDSC for the first year only. The returns for Class T shares are shown with and without the maximum applicable sales charge of 2.50% per transaction. Prior to March 27, 2017, Class T shares were known as Class W shares and were sold without a sales charge. The Fund’s other classes are not subject to sales charges and have limited eligibility. Please see the Fund’s prospectus for details. Performance for different share classes will vary based on differences in sales charges and fees associated with each class. All results shown assume reinvestment of distributions during the period. Returns do not reflect the deduction of taxes that a shareholder may pay on Fund distributions or on the redemption of Fund shares. Performance results reflect the effect of any fee waivers or reimbursements of Fund expenses by Columbia Management Investment Advisers, LLC and/or any of its affiliates. Absent these fee waivers or expense reimbursement arrangements, performance results would have been lower.
The performance information shown represents past performance and is not a guarantee of future results. The investment return and principal value of your investment will fluctuate so that your shares, when redeemed, may be worth more or less than their original cost. Current performance may be lower or higher than the performance information shown. You may obtain performance information current to the most recent month-end by contacting your financial intermediary, visiting investor.columbiathreadneedleus.com or calling 800.345.6611.
| * | The returns shown for periods prior to the share class inception date (including returns for the Life of the Fund, if shown, which are since Fund inception) include the returns of the Fund’s oldest share class. These returns are adjusted to reflect any higher class-related operating expenses of the newer share classes, as applicable. Please visit investor.columbiathreadneedleus.com/investment-products/mutual-funds/appended-performance for more information. |
The MSCI ACWI (Net) is a free float-adjusted market capitalization weighted index that is designed to measure the equity market performance of developed and emerging markets. The index consists of 45 country indices comprising 24 developed and 21 emerging market country indices.
Indices are not available for investment, are not professionally managed and do not reflect sales charges, fees, brokerage commissions, taxes (except the MSCI ACWI (Net), which reflects reinvested dividends net of withholding taxes) or other expenses of investing. Securities in the Fund may not match those in an index.
Columbia Select Global Equity Fund | Semiannual Report 2017
| 3 |
Fund at a Glance (continued)
(Unaudited)
| Top 10 holdings (%) (at April 30, 2017) |
| Alphabet, Inc., Class A (United States) | 5.7 |
| British American Tobacco PLC (United Kingdom) | 5.2 |
| AIA Group Ltd. (Hong Kong) | 5.0 |
| Visa, Inc., Class A (United States) | 4.9 |
| RELX NV (Netherlands) | 4.8 |
| MasterCard, Inc., Class A (United States) | 4.4 |
| HDFC Bank Ltd. (India) | 3.9 |
| S&P Global, Inc. (United States) | 3.5 |
| PepsiCo, Inc. (United States) | 3.1 |
| Aon PLC (United Kingdom) | 3.0 |
Percentages indicated are based upon total investments (excluding Money Market Funds).
For further detail about these holdings, please refer to the section entitled “Portfolio of Investments.”
Fund holdings are as of the date given, are subject to change at any time, and are not recommendations to buy or sell any security.
| Equity sector breakdown (%) (at April 30, 2017) |
| Consumer Discretionary | 8.2 |
| Consumer Staples | 18.3 |
| Energy | 1.0 |
| Financials | 19.9 |
| Health Care | 11.7 |
| Industrials | 10.8 |
| Information Technology | 29.2 |
| Materials | 0.9 |
| Total | 100.0 |
Percentages indicated are based upon total equity investments. The Fund’s portfolio composition is subject to change.
| Country breakdown (%) (at April 30, 2017) |
| Belgium | 2.0 |
| Canada | 1.0 |
| China | 2.0 |
| France | 3.0 |
| Hong Kong | 4.9 |
| India | 3.9 |
| Japan | 2.4 |
| Netherlands | 6.8 |
| Singapore | 2.0 |
| Switzerland | 1.7 |
| United Kingdom | 12.1 |
| United States(a) | 58.2 |
| Total | 100.0 |
| (a) | Includes investments in Money Market Funds. |
Country breakdown is based primarily on issuer’s place of organization/incorporation. Percentages indicated are based upon total investments. The Fund’s portfolio composition is subject to change.
The Fund may use place of organization/incorporation or other factors in determining whether an issuer is domestic (U.S.) or foreign for purposes of its investment policies. At April 30, 2017, the Fund invested at least 40% of its net assets in foreign companies in accordance with its principal investment strategy.
| 4 | Columbia Select Global Equity Fund | Semiannual Report 2017 |
Understanding Your Fund’s Expenses
(Unaudited)
As an investor, you incur two types of costs. There are transaction costs, which generally include sales charges on purchases and may include redemption fees. There are also ongoing costs, which generally include management fees, distribution and/or service fees, and other fund expenses. The following information is intended to help you understand your ongoing costs (in dollars) of investing in the Fund and to help you compare these costs with the ongoing costs of investing in other mutual funds.
Analyzing your Fund’s expenses
To illustrate these ongoing costs, we have provided examples and calculated the expenses paid by investors in each share class of the Fund during the period. The actual and hypothetical information in the table is based on an initial investment of $1,000 at the beginning of the period indicated and held for the entire period. Expense information is calculated two ways and each method provides you with different information. The amount listed in the “Actual” column is calculated using the Fund’s actual operating expenses and total return for the period. You may use the Actual information, together with the amount invested, to estimate the expenses that you paid over the period. Simply divide your account value by $1,000 (for example, an $8,600 account value divided by $1,000 = 8.6), then multiply the results by the expenses paid during the period under the “Actual” column. The amount listed in the “Hypothetical” column assumes a 5% annual rate of return before expenses (which is not the Fund’s actual return) and then applies the Fund’s actual expense ratio for the period to the hypothetical return. You should not use the hypothetical account values and expenses to estimate either your actual account balance at the end of the period or the expenses you paid during the period. See “Compare with other funds” below for details on how to use the hypothetical data.
Compare with other funds
Since all mutual funds are required to include the same hypothetical calculations about expenses in shareholder reports, you can use this information to compare the ongoing cost of investing in the Fund with other funds. To do so, compare the hypothetical example with the 5% hypothetical examples that appear in the shareholder reports of other funds. As you compare hypothetical examples of other funds, it is important to note that hypothetical examples are meant to highlight the ongoing costs of investing in a fund only and do not reflect any transaction costs, such as sales charges, or redemption or exchange fees. Therefore, the hypothetical calculations are useful in comparing ongoing costs only, and will not help you determine the relative total costs of owning different funds. If transaction costs were included in these calculations, your costs would be higher.
| November 1, 2016 — April 30, 2017 |
| | Account value at the
beginning of the
period ($) | Account value at the
end of the
period ($) | Expenses paid during
the period ($) | Fund’s annualized
expense ratio (%) |
| | Actual | Hypothetical | Actual | Hypothetical | Actual | Hypothetical | Actual |
| Class A | 1,000.00 | 1,000.00 | 1,126.50 | 1,017.56 | 7.40 | 7.02 | 1.42 |
| Class B | 1,000.00 | 1,000.00 | 1,122.30 | 1,013.93 | 11.24 | 10.67 | 2.16 |
| Class C | 1,000.00 | 1,000.00 | 1,122.80 | 1,013.88 | 11.30 | 10.72 | 2.17 |
| Class K | 1,000.00 | 1,000.00 | 1,126.00 | 1,018.39 | 6.52 | 6.19 | 1.25 |
| Class R | 1,000.00 | 1,000.00 | 1,125.40 | 1,016.33 | 8.70 | 8.26 | 1.67 |
| Class R5 | 1,000.00 | 1,000.00 | 1,128.70 | 1,019.47 | 5.38 | 5.10 | 1.03 |
| Class T (formerly Class W) | 1,000.00 | 1,000.00 | 1,125.90 | 1,017.56 | 7.40 | 7.02 | 1.42 |
| Class Y | 1,000.00 | 1,000.00 | 1,055.30 (a) | 1,019.71 | 1.57 (a) | 4.85 | 0.98 (a) |
| Class Z | 1,000.00 | 1,000.00 | 1,128.20 | 1,018.83 | 6.05 | 5.74 | 1.16 |
| (a) | Based on operations from March 1, 2017 (commencement of operations) through the stated period end. |
Expenses paid during the period are equal to the annualized expense ratio for each class as indicated above, multiplied by the average account value over the period and then multiplied by the number of days in the Fund’s most recent fiscal half year and divided by 365.
Expenses do not include fees and expenses incurred indirectly by the Fund from its investment in underlying funds, including affiliated and non-affiliated pooled investment vehicles, such as mutual funds and exchange-traded funds.
Had Columbia Management Investment Advisers, LLC and/or certain of its affiliates not waived/reimbursed certain fees and expenses, account value at the end of the period would have been reduced.
The Fund’s annualized expense ratio excludes the impact of an expense reimbursement from a third party due to overbilling.
Columbia Select Global Equity Fund | Semiannual Report 2017
| 5 |
Portfolio of Investments
April 30, 2017 (Unaudited)
(Percentages represent value of investments compared to net assets)
| Common Stocks 98.7% |
| Issuer | Shares | Value ($) |
| Belgium 2.0% |
| Anheuser-Busch InBev SA/NV | 67,578 | 7,611,553 |
| Canada 1.0% |
| Suncor Energy, Inc. | 126,620 | 3,970,803 |
| China 2.0% |
| Tencent Holdings Ltd. | 245,100 | 7,679,801 |
| France 3.0% |
| L’Oreal SA | 57,790 | 11,510,523 |
| Hong Kong 4.9% |
| AIA Group Ltd. | 2,765,000 | 19,137,768 |
| India 3.9% |
| HDFC Bank Ltd. | 628,454 | 15,081,843 |
| Japan 2.4% |
| Keyence Corp. | 23,500 | 9,447,330 |
| Netherlands 6.8% |
| RELX NV | 957,732 | 18,523,031 |
| Unilever NV-CVA | 149,513 | 7,841,110 |
| Total | 26,364,141 |
| Singapore 2.0% |
| Broadcom Ltd. | 34,603 | 7,640,688 |
| Switzerland 1.7% |
| Johnson Controls International PLC | 161,218 | 6,701,832 |
| United Kingdom 12.1% |
| Aon PLC | 97,006 | 11,625,199 |
| British American Tobacco PLC | 296,582 | 20,032,524 |
| Compass Group PLC | 390,500 | 7,879,979 |
| Reckitt Benckiser Group PLC | 81,166 | 7,475,520 |
| Total | 47,013,222 |
| United States 56.9% |
| Activision Blizzard, Inc. | 124,235 | 6,491,279 |
| Adobe Systems, Inc.(a) | 32,384 | 4,331,036 |
| Alphabet, Inc., Class A(a) | 23,468 | 21,696,635 |
| Amazon.com, Inc.(a) | 10,450 | 9,666,146 |
| Common Stocks (continued) |
| Issuer | Shares | Value ($) |
| Automatic Data Processing, Inc. | 39,006 | 4,075,737 |
| Boston Scientific Corp.(a) | 408,279 | 10,770,400 |
| Charles Schwab Corp. (The) | 261,090 | 10,143,347 |
| Charter Communications, Inc., Class A(a) | 15,343 | 5,295,790 |
| Comcast Corp., Class A | 214,871 | 8,420,794 |
| Cooper Companies, Inc. (The) | 29,984 | 6,006,695 |
| Dentsply Sirona, Inc. | 91,142 | 5,763,820 |
| Equifax, Inc. | 71,308 | 9,648,685 |
| Estee Lauder Companies, Inc. (The), Class A | 44,589 | 3,885,485 |
| Facebook, Inc., Class A(a) | 48,251 | 7,249,713 |
| Intercontinental Exchange, Inc. | 109,977 | 6,620,615 |
| MasterCard, Inc., Class A | 145,295 | 16,900,714 |
| Microsoft Corp. | 113,797 | 7,790,543 |
| PepsiCo, Inc. | 103,425 | 11,715,984 |
| PPG Industries, Inc. | 33,519 | 3,681,727 |
| S&P Global, Inc. | 100,408 | 13,473,750 |
| Thermo Fisher Scientific, Inc. | 64,093 | 10,596,496 |
| Union Pacific Corp. | 56,976 | 6,379,033 |
| UnitedHealth Group, Inc. | 41,601 | 7,275,183 |
| Visa, Inc., Class A | 204,413 | 18,646,554 |
| Zoetis, Inc. | 76,929 | 4,316,486 |
| Total | 220,842,647 |
Total Common Stocks
(Cost $330,202,315) | 383,002,151 |
|
| Money Market Funds 1.3% |
| | Shares | Value ($) |
| Columbia Short-Term Cash Fund, 0.869%(b),(c) | 4,885,073 | 4,885,073 |
Total Money Market Funds
(Cost $4,885,058) | 4,885,073 |
Total Investments
(Cost $335,087,373) | 387,887,224 |
| Other Assets & Liabilities, Net | | (4,085) |
| Net Assets | $387,883,139 |
The accompanying Notes to Financial Statements are an integral part of this statement.
| 6 | Columbia Select Global Equity Fund | Semiannual Report 2017 |
Portfolio of Investments (continued)
April 30, 2017 (Unaudited)
Notes to Portfolio of Investments
| (a) | Non-income producing investment. |
| (b) | The rate shown is the seven-day current annualized yield at April 30, 2017. |
| (c) | As defined in the Investment Company Act of 1940, an affiliated company is one in which the Fund owns 5% or more of the company’s outstanding voting securities, or a company which is under common ownership or control with the Fund. Holdings and transactions in these affiliated companies during the period ended April 30, 2017 are as follows: |
| Issuer | Beginning
shares | Shares
purchased | Shares
sold | Ending
shares | Realized gain
(loss) ($) | Dividends —
affiliated
issuers ($) | Value ($) |
| Columbia Short-Term Cash Fund, 0.869% | 5,717,866 | 63,136,131 | (63,968,924) | 4,885,073 | (475) | 14,384 | 4,885,073 |
Fair value measurements
The Fund categorizes its fair value measurements according to a three-level hierarchy that maximizes the use of observable inputs and minimizes the use of unobservable inputs by prioritizing that the most observable input be used when available. Observable inputs are those that market participants would use in pricing an investment based on market data obtained from sources independent of the reporting entity. Unobservable inputs are those that reflect the Fund’s assumptions about the information market participants would use in pricing an investment. An investment’s level within the fair value hierarchy is based on the lowest level of any input that is deemed significant to the asset’s or liability’s fair value measurement. The input levels are not necessarily an indication of the risk or liquidity associated with investments at that level. For example, certain U.S. government securities are generally high quality and liquid, however, they are reflected as Level 2 because the inputs used to determine fair value may not always be quoted prices in an active market.
Fair value inputs are summarized in the three broad levels listed below:
| • | Level 1 – Valuations based on quoted prices for investments in active markets that the Fund has the ability to access at the measurement date (including NAV for open-end mutual funds). Valuation adjustments are not applied to Level 1 investments. |
| • | Level 2 – Valuations based on other significant observable inputs (including quoted prices for similar securities, interest rates, prepayment speeds, credit risks, etc.). |
| • | Level 3 – Valuations based on significant unobservable inputs (including the Fund’s own assumptions and judgment in determining the fair value of investments). |
Inputs that are used in determining fair value of an investment may include price information, credit data, volatility statistics, and other factors. These inputs can be either observable or unobservable. The availability of observable inputs can vary between investments, and is affected by various factors such as the type of investment, and the volume and level of activity for that investment or similar investments in the marketplace. The inputs will be considered by the Investment Manager, along with any other relevant factors in the calculation of an investment’s fair value. The Fund uses prices and inputs that are current as of the measurement date, which may include periods of market dislocations. During these periods, the availability of prices and inputs may be reduced for many investments. This condition could cause an investment to be reclassified between the various levels within the hierarchy.
Foreign equity securities actively traded in markets where there is a significant delay in the local close relative to the New York Stock Exchange are classified as Level 2. The values of these securities may include an adjustment to reflect the impact of significant market movements following the close of local trading, as described in Note 2 to the financial statements – Security Valuation.
Certain investments that have been measured at fair value using the net asset value (NAV) per share (or its equivalent) are not categorized in the fair value hierarchy. The fair value amounts presented in the table are intended to reconcile the fair value hierarchy to the amounts presented in the Portfolio of Investments. The Columbia Short-Term Cash Fund seeks to provide shareholders with maximum current income consistent with liquidity and stability of principal. Columbia Short-Term Cash Fund prices its shares with a floating NAV and no longer seeks to maintain a stable NAV.
Investments falling into the Level 3 category are primarily supported by quoted prices from brokers and dealers participating in the market for those investments. However, these may be classified as Level 3 investments due to lack of market transparency and corroboration to support these quoted prices. Additionally, valuation models may be used as the pricing source for any remaining investments classified as Level 3. These models may rely on one or more significant unobservable inputs and/or significant assumptions by the Investment Manager. Inputs used in valuations may include, but are not limited to, financial statement analysis, capital account balances, discount rates and estimated cash flows, and comparable company data.
Under the direction of the Fund’s Board of Trustees (the Board), the Investment Manager’s Valuation Committee (the Committee) is responsible for overseeing the valuation procedures approved by the Board. The Committee consists of voting and non-voting members from various groups within the Investment Manager’s organization, including operations and accounting, trading and investments, compliance, risk management and legal.
The Committee meets at least monthly to review and approve valuation matters, which may include a description of specific valuation determinations, data regarding pricing information received from approved pricing vendors and brokers and the results of Board-approved valuation control policies and procedures (the Policies). The Policies address, among other things, instances when market quotations are or are not readily available, including recommendations of third party pricing vendors and a determination of appropriate pricing methodologies; events that require specific valuation determinations and assessment of fair value techniques; securities with a potential for stale pricing, including those that are illiquid, restricted, or in default; and the effectiveness of third party pricing vendors, including periodic reviews of vendors. The Committee meets more frequently, as needed, to discuss additional valuation matters, which may include the need to review back-testing results, review time-sensitive information or approve related valuation actions. The Committee reports to the Board, with members of the Committee meeting with the Board at each of its regularly scheduled meetings to discuss valuation matters and actions during the period, similar to those described earlier.
For investments categorized as Level 3, the Committee monitors information similar to that described above, which may include: (i) data specific to the issuer or comparable issuers, (ii) general market or specific sector news and (iii) quoted prices and specific or similar security transactions. The Committee considers this data and any changes from prior periods in order to assess the reasonableness of observable and unobservable inputs, any assumptions or internal models used to value those securities and changes in fair value. This data is also used to corroborate, when available, information received from approved pricing vendors and brokers. Various factors impact the frequency of monitoring this information (which may occur as often as daily). However, the Committee may determine that changes to inputs, assumptions and models are not required as a result of the monitoring procedures performed.
The accompanying Notes to Financial Statements are an integral part of this statement.
Columbia Select Global Equity Fund | Semiannual Report 2017
| 7 |
Portfolio of Investments (continued)
April 30, 2017 (Unaudited)
Fair value measurements (continued)
The following table is a summary of the inputs used to value the Fund’s investments at April 30, 2017:
| | Level 1
quoted prices
in active
markets for
identical
assets ($) | Level 2
other
significant
observable
inputs ($) | Level 3
significant
unobservable
inputs ($) | Investments
measured at
net asset
value ($) | Total ($) |
| Investments | | | | | |
| Common Stocks | | | | | |
| Belgium | — | 7,611,553 | — | — | 7,611,553 |
| Canada | 3,970,803 | — | — | — | 3,970,803 |
| China | — | 7,679,801 | — | — | 7,679,801 |
| France | — | 11,510,523 | — | — | 11,510,523 |
| Hong Kong | — | 19,137,768 | — | — | 19,137,768 |
| India | — | 15,081,843 | — | — | 15,081,843 |
| Japan | — | 9,447,330 | — | — | 9,447,330 |
| Netherlands | — | 26,364,141 | — | — | 26,364,141 |
| Singapore | 7,640,688 | — | — | — | 7,640,688 |
| Switzerland | 6,701,832 | — | — | — | 6,701,832 |
| United Kingdom | 11,625,199 | 35,388,023 | — | — | 47,013,222 |
| United States | 220,842,647 | — | — | — | 220,842,647 |
| Total Common Stocks | 250,781,169 | 132,220,982 | — | — | 383,002,151 |
| Money Market Funds | — | — | — | 4,885,073 | 4,885,073 |
| Total Investments | 250,781,169 | 132,220,982 | — | 4,885,073 | 387,887,224 |
See the Portfolio of Investments for all investment classifications not indicated in the table.
The Fund’s assets assigned to the Level 2 input category are generally valued using the market approach, in which a security’s value is determined through reference to prices and information from market transactions for similar or identical assets. These assets include certain foreign securities for which a third party statistical pricing service may be employed for purposes of fair market valuation. The model utilized by such third party statistical pricing service takes into account a security’s correlation to available market data including, but not limited to, intraday index, ADR, and exchange-traded fund movements.
There were no transfers of financial assets between levels during the period.
The accompanying Notes to Financial Statements are an integral part of this statement.
| 8 | Columbia Select Global Equity Fund | Semiannual Report 2017 |
Statement of Assets and Liabilities
April 30, 2017 (Unaudited)
| Assets | |
| Investments, at cost | |
| Unaffiliated issuers, at cost | $330,202,315 |
| Affiliated issuers, at cost | 4,885,058 |
| Total investments, at cost | 335,087,373 |
| Investments, at value | |
| Unaffiliated issuers, at value | 383,002,151 |
| Affiliated issuers, at value | 4,885,073 |
| Total investments, at value | 387,887,224 |
| Foreign currency (identified cost $142,776) | 139,400 |
| Receivable for: | |
| Investments sold | 7,772,126 |
| Capital shares sold | 80,641 |
| Regulatory settlements (Note 6) | 73,374 |
| Dividends | 1,168,760 |
| Foreign tax reclaims | 215,641 |
| Prepaid expenses | 866 |
| Trustees’ deferred compensation plan | 8,315 |
| Other assets | 34,675 |
| Total assets | 397,381,022 |
| Liabilities | |
| Due to custodian | 333,596 |
| Payable for: | |
| Investments purchased | 8,411,063 |
| Capital shares purchased | 548,401 |
| Management services fees | 9,280 |
| Distribution and/or service fees | 2,459 |
| Transfer agent fees | 41,952 |
| Compensation of board members | 101,757 |
| Other expenses | 41,060 |
| Trustees’ deferred compensation plan | 8,315 |
| Total liabilities | 9,497,883 |
| Net assets applicable to outstanding capital stock | $387,883,139 |
| Represented by | |
| Paid in capital | 346,791,291 |
| Undistributed net investment income | 124,794 |
| Accumulated net realized loss | (11,842,692) |
| Unrealized appreciation (depreciation) on: | |
| Investments - unaffiliated issuers | 52,799,836 |
| Investments - affiliated issuers | 15 |
| Foreign currency translations | 9,895 |
| Total - representing net assets applicable to outstanding capital stock | $387,883,139 |
The accompanying Notes to Financial Statements are an integral part of this statement.
Columbia Select Global Equity Fund | Semiannual Report 2017
| 9 |
Statement of Assets and Liabilities (continued)
April 30, 2017 (Unaudited)
| Class A | |
| Net assets | $300,992,700 |
| Shares outstanding | 26,408,154 |
| Net asset value per share | $11.40 |
| Maximum offering price per share(a) | $12.10 |
| Class B | |
| Net assets | $925,979 |
| Shares outstanding | 89,326 |
| Net asset value per share | $10.37 |
| Class C | |
| Net assets | $13,280,374 |
| Shares outstanding | 1,297,319 |
| Net asset value per share | $10.24 |
| Class K | |
| Net assets | $29,289 |
| Shares outstanding | 2,540 |
| Net asset value per share | $11.53 |
| Class R | |
| Net assets | $182,832 |
| Shares outstanding | 16,042 |
| Net asset value per share | $11.40 |
| Class R5 | |
| Net assets | $100,766 |
| Shares outstanding | 8,705 |
| Net asset value per share | $11.58 |
| Class T | |
| Net assets | $2,944 |
| Shares outstanding | 257 |
| Net asset value per share | $11.45 |
| Maximum offering price per share(b),(c) | $11.74 |
| Class Y | |
| Net assets | $52,608,134 |
| Shares outstanding | 4,593,783 |
| Net asset value per share | $11.45 |
| Class Z | |
| Net assets | $19,760,121 |
| Shares outstanding | 1,714,155 |
| Net asset value per share | $11.53 |
| (a) | The maximum offering price per share is calculated by dividing the net asset value per share by 1.0 minus the maximum sales charge of 5.75% for Class A. |
| (b) | The maximum offering price per share is calculated by dividing the net asset value per share by 1.0 minus the maximum sales charge of 2.50% for Class T. |
| (c) | Net asset value per share rounds to this amount due to fractional shares outstanding. |
The accompanying Notes to Financial Statements are an integral part of this statement.
| 10 | Columbia Select Global Equity Fund | Semiannual Report 2017 |
Statement of Operations
Six Months Ended April 30, 2017 (Unaudited)
| Net investment income | |
| Income: | |
| Dividends — unaffiliated issuers | $2,732,076 |
| Dividends — affiliated issuers | 14,384 |
| Foreign taxes withheld | (120,894) |
| Total income | 2,625,566 |
| Expenses: | |
| Management services fees | 1,625,009 |
| Distribution and/or service fees | |
| Class A | 360,452 |
| Class B | 5,947 |
| Class C | 63,974 |
| Class R | 488 |
| Class T | 3 |
| Transfer agent fees | |
| Class A | 299,441 |
| Class B | 1,240 |
| Class C | 13,293 |
| Class I(a) | 1,522 |
| Class K | 927 |
| Class R | 204 |
| Class R5 | 50 |
| Class T(b) | 3 |
| Class Y(c) | 539 |
| Class Z | 7,182 |
| Plan administration fees | |
| Class K | 4,236 |
| Compensation of board members | 14,083 |
| Custodian fees | 23,456 |
| Printing and postage fees | 32,532 |
| Registration fees | 55,079 |
| Audit fees | 23,988 |
| Legal fees | 4,720 |
| Compensation of chief compliance officer | 41 |
| Other | (68,686) |
| Total expenses | 2,469,723 |
| Fees waived or expenses reimbursed by Investment Manager and its affiliates | (1,221) |
| Total net expenses | 2,468,502 |
| Net investment income | 157,064 |
| Realized and unrealized gain (loss) — net | |
| Net realized gain (loss) on: | |
| Investments — unaffiliated issuers | 10,506,084 |
| Investments — affiliated issuers | (475) |
| Foreign currency translations | 119,501 |
| Net realized gain | 10,625,110 |
| Net change in unrealized appreciation (depreciation) on: | |
| Investments — unaffiliated issuers | 34,316,830 |
| Investments — affiliated issuers | 15 |
| Foreign currency translations | 30,414 |
| Foreign capital gains tax | 76,408 |
| Net change in unrealized appreciation (depreciation) | 34,423,667 |
| Net realized and unrealized gain | 45,048,777 |
| Net increase in net assets resulting from operations | $45,205,841 |
| (a) | Effective March 27, 2017, Class I shares were redeemed or exchanged for Class Y shares. |
| (b) | Effective March 27, 2017, Class W shares were renamed Class T shares. |
| (c) | Class Y shares commenced operations on March 1, 2017. Per share data and total return reflect activity from that date. |
The accompanying Notes to Financial Statements are an integral part of this statement.
Columbia Select Global Equity Fund | Semiannual Report 2017
| 11 |
Statement of Changes in Net Assets
| | Six Months Ended
April 30, 2017
(Unaudited) | Year Ended
October 31, 2016 |
| Operations | | |
| Net investment income | $157,064 | $206,067 |
| Net realized gain | 10,625,110 | 5,965,075 |
| Net change in unrealized appreciation (depreciation) | 34,423,667 | (276,598) |
| Net increase in net assets resulting from operations | 45,205,841 | 5,894,544 |
| Decrease in net assets from capital stock activity | (50,903,494) | (33,888,017) |
| Total decrease in net assets | (5,697,653) | (27,993,473) |
| Net assets at beginning of period | 393,580,792 | 421,574,265 |
| Net assets at end of period | $387,883,139 | $393,580,792 |
| Undistributed (excess of distributions over) net investment income | $124,794 | $(32,270) |
The accompanying Notes to Financial Statements are an integral part of this statement.
| 12 | Columbia Select Global Equity Fund | Semiannual Report 2017 |
Statement of Changes in Net Assets (continued)
| | Six Months Ended | Year Ended |
| | April 30, 2017 (Unaudited) | October 31, 2016 |
| | Shares | Dollars ($) | Shares | Dollars ($) |
| Capital stock activity |
| Class A | | | | |
| Subscriptions (a) | 422,020 | 4,393,675 | 1,237,345 | 12,330,334 |
| Redemptions | (3,979,082) | (41,815,915) | (4,171,433) | (41,663,576) |
| Net decrease | (3,557,062) | (37,422,240) | (2,934,088) | (29,333,242) |
| Class B | | | | |
| Subscriptions | 218 | 2,169 | 2,138 | 19,652 |
| Redemptions (a) | (71,969) | (684,089) | (182,040) | (1,642,868) |
| Net decrease | (71,751) | (681,920) | (179,902) | (1,623,216) |
| Class C | | | | |
| Subscriptions | 42,549 | 399,257 | 116,671 | 1,053,363 |
| Redemptions | (258,466) | (2,410,897) | (315,978) | (2,838,961) |
| Net decrease | (215,917) | (2,011,640) | (199,307) | (1,785,598) |
| Class I(b) | | | | |
| Subscriptions | 52,564 | 564,685 | 984,556 | 9,929,504 |
| Redemptions | (6,373,239) | (70,220,728) | (1,178,187) | (11,692,972) |
| Net decrease | (6,320,675) | (69,656,043) | (193,631) | (1,763,468) |
| Class K | | | | |
| Subscriptions | 31,477 | 323,695 | 88,370 | 874,001 |
| Redemptions | (688,463) | (7,153,236) | (85,144) | (870,081) |
| Net increase (decrease) | (656,986) | (6,829,541) | 3,226 | 3,920 |
| Class R | | | | |
| Subscriptions | 4,258 | 41,946 | 7,156 | 71,583 |
| Redemptions | (7,557) | (79,425) | (5,910) | (59,147) |
| Net increase (decrease) | (3,299) | (37,479) | 1,246 | 12,436 |
| Class R5 | | | | |
| Subscriptions | 6,859 | 70,131 | 2,222 | 22,345 |
| Redemptions | (12,618) | (138,156) | (3,208) | (33,686) |
| Net decrease | (5,759) | (68,025) | (986) | (11,341) |
| Class Y(b) | | | | |
| Subscriptions | 5,830,513 | 63,844,097 | — | — |
| Redemptions | (1,236,730) | (13,613,382) | — | — |
| Net increase | 4,593,783 | 50,230,715 | — | — |
| Class Z | | | | |
| Subscriptions | 1,636,649 | 17,817,013 | 206,701 | 2,127,196 |
| Redemptions | (210,559) | (2,244,334) | (147,219) | (1,514,704) |
| Net increase | 1,426,090 | 15,572,679 | 59,482 | 612,492 |
| Total net decrease | (4,811,576) | (50,903,494) | (3,443,960) | (33,888,017) |
| (a) | Includes conversions of Class B shares to Class A shares, if any. |
| (b) | Effective March 27, 2017, Class I shares were redeemed or exchanged for Class Y shares. |
The accompanying Notes to Financial Statements are an integral part of this statement.
Columbia Select Global Equity Fund | Semiannual Report 2017
| 13 |
The following table is intended to help you understand the Fund’s financial performance. Certain information reflects financial results for a single share of a class held for the periods shown. Per share net investment income (loss) amounts are calculated based on average shares outstanding during the period. Total return assumes reinvestment of all dividends and distributions, if any. Total return does not reflect payment of sales charges, if any. Total return and portfolio turnover are not annualized for periods of less than one year. The portfolio turnover rate is calculated without regard to purchase and sales transactions of short-term instruments and certain derivatives, if any. If such transactions were included, the Fund’s portfolio turnover rate may be higher.
| Year ended (except as noted) | Net asset value,
beginning of
period | Net
investment
income
(loss) | Net
realized
and
unrealized
gain | Total from
investment
operations | Distributions
from net
investment
income | Distributions
from net
realized
gains |
| Class A |
| 4/30/2017 (c) | $10.12 | 0.00 (d) | 1.28 | 1.28 | — | — |
| 10/31/2016 | $9.97 | 0.00 (d) | 0.15 | 0.15 | — | — |
| 10/31/2015 | $9.80 | 0.00 (d) | 0.20 | 0.20 | (0.03) | — |
| 10/31/2014 | $9.17 | 0.04 | 0.62 | 0.66 | (0.03) | — |
| 10/31/2013 | $7.39 | 0.04 | 1.83 | 1.87 | (0.09) | — |
| 10/31/2012 | $6.95 | 0.05 | 0.40 | 0.45 | (0.02) | — |
| Class B |
| 4/30/2017 (c) | $9.24 | (0.04) | 1.17 | 1.13 | — | — |
| 10/31/2016 | $9.17 | (0.07) | 0.14 | 0.07 | — | — |
| 10/31/2015 | $9.06 | (0.07) | 0.18 | 0.11 | — | — |
| 10/31/2014 | $8.50 | (0.03) | 0.59 | 0.56 | — | — |
| 10/31/2013 | $6.85 | (0.02) | 1.70 | 1.68 | (0.03) | — |
| 10/31/2012 | $6.47 | 0.00 (d) | 0.37 | 0.37 | — | — |
| Class C |
| 4/30/2017 (c) | $9.12 | (0.03) | 1.15 | 1.12 | — | — |
| 10/31/2016 | $9.06 | (0.07) | 0.13 | 0.06 | — | — |
| 10/31/2015 | $8.94 | (0.07) | 0.19 | 0.12 | — | — |
| 10/31/2014 | $8.40 | (0.03) | 0.57 | 0.54 | — | — |
| 10/31/2013 | $6.78 | (0.02) | 1.68 | 1.66 | (0.04) | — |
| 10/31/2012 | $6.40 | 0.00 (d) | 0.37 | 0.37 | — | — |
| Class K |
| 4/30/2017 (c) | $10.24 | (0.02) | 1.31 | 1.29 | — | — |
| 10/31/2016 | $10.07 | 0.02 | 0.15 | 0.17 | — | — |
| 10/31/2015 | $9.90 | 0.01 | 0.21 | 0.22 | (0.05) | — |
| 10/31/2014 | $9.26 | 0.06 | 0.63 | 0.69 | (0.05) | — |
| 10/31/2013 | $7.46 | 0.06 | 1.85 | 1.91 | (0.11) | — |
| 10/31/2012 | $7.01 | 0.07 | 0.40 | 0.47 | (0.03) | — |
| Class R |
| 4/30/2017 (c) | $10.13 | (0.01) | 1.28 | 1.27 | — | — |
| 10/31/2016 | $10.01 | (0.02) | 0.14 | 0.12 | — | — |
| 10/31/2015 | $9.84 | (0.03) | 0.20 | 0.17 | (0.00) (d) | — |
| 10/31/2014 | $9.20 | 0.01 | 0.64 | 0.65 | (0.01) | — |
| 10/31/2013 | $7.44 | 0.02 | 1.84 | 1.86 | (0.10) | — |
| 10/31/2012 | $7.00 | 0.03 | 0.41 | 0.44 | (0.01) | — |
The accompanying Notes to Financial Statements are an integral part of this statement.
| 14 | Columbia Select Global Equity Fund | Semiannual Report 2017 |
Total
distributions to
shareholders | Proceeds from
regulatory
settlements | Net
asset
value,
end of
period | Total
return | Total gross
expense
ratio to
average
net assets(a) | Total net
expense
ratio to
average
net assets(a),(b) | Net investment
income (loss)
ratio to
average
net assets | Portfolio
turnover | Net
assets,
end of
period
(000’s) |
| |
| — | — | $11.40 | 12.65% | 1.40% (e),(f) | 1.40% (e),(f) | 0.01% (e) | 45% | $300,993 |
| — | — | $10.12 | 1.50% | 1.40% | 1.40% (g) | 0.01% | 66% | $303,338 |
| (0.03) | 0.00 (d) | $9.97 | 2.00% (h) | 1.42% | 1.42% (g) | (0.03%) | 132% | $328,090 |
| (0.03) | — | $9.80 | 7.25% | 1.45% | 1.45% (g) | 0.39% | 63% | $355,168 |
| (0.09) | — | $9.17 | 25.62% | 1.51% | 1.45% (g) | 0.48% | 46% | $360,041 |
| (0.02) | 0.01 | $7.39 | 6.62% (i) | 1.51% | 1.36% (g) | 0.75% | 50% | $333,196 |
| |
| — | — | $10.37 | 12.23% | 2.14% (e),(f) | 2.14% (e),(f) | (0.84%) (e) | 45% | $926 |
| — | — | $9.24 | 0.76% | 2.15% | 2.15% (g) | (0.76%) | 66% | $1,488 |
| — | 0.00 (d) | $9.17 | 1.21% (h) | 2.17% | 2.17% (g) | (0.79%) | 132% | $3,127 |
| — | — | $9.06 | 6.59% | 2.20% | 2.20% (g) | (0.35%) | 63% | $5,915 |
| (0.03) | — | $8.50 | 24.52% | 2.27% | 2.20% (g) | (0.24%) | 46% | $9,282 |
| — | 0.01 | $6.85 | 5.87% (i) | 2.26% | 2.11% (g) | 0.02% | 50% | $10,979 |
| |
| — | — | $10.24 | 12.28% | 2.14% (e),(f) | 2.14% (e),(f) | (0.74%) (e) | 45% | $13,280 |
| — | — | $9.12 | 0.66% | 2.15% | 2.15% (g) | (0.75%) | 66% | $13,808 |
| — | 0.00 (d) | $9.06 | 1.34% (h) | 2.17% | 2.17% (g) | (0.78%) | 132% | $15,511 |
| — | — | $8.94 | 6.43% | 2.20% | 2.20% (g) | (0.36%) | 63% | $16,682 |
| (0.04) | — | $8.40 | 24.52% | 2.26% | 2.20% (g) | (0.26%) | 46% | $17,250 |
| — | 0.01 | $6.78 | 5.94% (i) | 2.25% | 2.11% (g) | (0.00%) (d) | 50% | $17,516 |
| |
| — | — | $11.53 | 12.60% | 1.21% (e),(f) | 1.21% (e),(f) | (0.37%) (e) | 45% | $29 |
| — | — | $10.24 | 1.69% | 1.25% | 1.25% | 0.15% | 66% | $6,751 |
| (0.05) | 0.00 (d) | $10.07 | 2.18% (h) | 1.25% | 1.25% | 0.13% | 132% | $6,609 |
| (0.05) | — | $9.90 | 7.49% | 1.25% | 1.25% | 0.60% | 63% | $6,712 |
| (0.11) | — | $9.26 | 25.87% | 1.26% | 1.24% | 0.67% | 46% | $6,601 |
| (0.03) | 0.01 | $7.46 | 6.87% (i) | 1.28% | 1.21% | 0.90% | 50% | $5,032 |
| |
| — | — | $11.40 | 12.54% | 1.65% (e),(f) | 1.65% (e),(f) | (0.31%) (e) | 45% | $183 |
| — | — | $10.13 | 1.20% | 1.65% | 1.65% (g) | (0.24%) | 66% | $196 |
| (0.00) (d) | 0.00 (d) | $10.01 | 1.74% (h) | 1.67% | 1.67% (g) | (0.28%) | 132% | $181 |
| (0.01) | — | $9.84 | 7.10% | 1.70% | 1.70% (g) | 0.12% | 63% | $123 |
| (0.10) | — | $9.20 | 25.19% | 1.77% | 1.70% (g) | 0.20% | 46% | $142 |
| (0.01) | 0.01 | $7.44 | 6.37% (i) | 1.76% | 1.61% (g) | 0.48% | 50% | $63 |
Columbia Select Global Equity Fund | Semiannual Report 2017
| 15 |
Financial Highlights (continued)
| Year ended (except as noted) | Net asset value,
beginning of
period | Net
investment
income
(loss) | Net
realized
and
unrealized
gain | Total from
investment
operations | Distributions
from net
investment
income | Distributions
from net
realized
gains |
| Class R5 |
| 4/30/2017 (c) | $10.26 | 0.02 | 1.30 | 1.32 | — | — |
| 10/31/2016 | $10.07 | 0.04 | 0.15 | 0.19 | — | — |
| 10/31/2015 | $9.90 | 0.04 | 0.20 | 0.24 | (0.07) | — |
| 10/31/2014 | $9.25 | 0.09 | 0.63 | 0.72 | (0.07) | — |
| 10/31/2013 | $7.46 | 0.08 | 1.84 | 1.92 | (0.13) | — |
| 10/31/2012 | $7.01 | 0.08 | 0.41 | 0.49 | (0.05) | — |
| Class T(j) |
| 4/30/2017 (c) | $10.17 | 0.00 (d) | 1.28 | 1.28 | — | — |
| 10/31/2016 | $10.02 | (0.01) | 0.16 | 0.15 | — | — |
| 10/31/2015 | $9.86 | (0.01) | 0.19 | 0.18 | (0.02) | — |
| 10/31/2014 | $9.22 | 0.04 | 0.63 | 0.67 | (0.03) | — |
| 10/31/2013 | $7.44 | 0.04 | 1.84 | 1.88 | (0.10) | — |
| 10/31/2012 | $6.97 | 0.05 | 0.41 | 0.46 | (0.00) (d) | — |
| Class Y |
| 4/30/2017 (c),(k) | $10.85 | 0.02 | 0.58 | 0.60 | — | — |
| Class Z |
| 4/30/2017 (c) | $10.22 | 0.05 | 1.26 | 1.31 | — | — |
| 10/31/2016 | $10.05 | 0.02 | 0.15 | 0.17 | — | — |
| 10/31/2015 | $9.87 | 0.02 | 0.21 | 0.23 | (0.05) | — |
| 10/31/2014 | $9.23 | 0.06 | 0.63 | 0.69 | (0.05) | — |
| 10/31/2013 | $7.45 | 0.06 | 1.84 | 1.90 | (0.12) | — |
| 10/31/2012 | $7.00 | 0.07 | 0.41 | 0.48 | (0.04) | — |
| Notes to Financial Highlights |
| (a) | In addition to the fees and expenses that the Fund bears directly, the Fund indirectly bears a pro rata share of the fees and expenses of any other funds in which it invests. Such indirect expenses are not included in the Fund’s reported expense ratios. |
| (b) | Total net expenses include the impact of certain fee waivers/expense reimbursements made by the Investment Manager and certain of its affiliates, if applicable. |
| (c) | For the six months ended April 30, 2017 (unaudited). |
| (d) | Rounds to zero. |
| (e) | Annualized. |
| (f) | Expenses have been reduced due to a reimbursement of expenses overbilled by a third party. If the reimbursement had been excluded, the expense ratios would have been higher by the percentages shown for each class in the table below. All fee waivers and expense reimbursements by the Investment Manager and its affiliates were applied before giving effect to this third party reimbursement. |
| | Class A | Class B | Class C | Class K | Class R | Class R5 | Class T | Class Z |
| 04/30/2017 | 0.02 % | 0.02 % | 0.02 % | 0.04 % | 0.02 % | 0.02 % | 0.02 % | 0.01 % |
| (g) | The benefits derived from expense reductions had an impact of less than 0.01%. |
| (h) | The Fund received proceeds from regulatory settlements. Had the Fund not received these proceeds, the total return would have been lower by 0.02%. |
| (i) | The Fund received proceeds from regulatory settlements. Had the Fund not received these proceeds, the total return would have been lower by 0.11%. |
| (j) | Effective March 27, 2017, Class W shares were renamed Class T shares. |
| (k) | Class Y shares commenced operations on March 1, 2017. Per share data and total return reflect activity from that date. |
The accompanying Notes to Financial Statements are an integral part of this statement.
| 16 | Columbia Select Global Equity Fund | Semiannual Report 2017 |
Total
distributions to
shareholders | Proceeds from
regulatory
settlements | Net
asset
value,
end of
period | Total
return | Total gross
expense
ratio to
average
net assets(a) | Total net
expense
ratio to
average
net assets(a),(b) | Net investment
income (loss)
ratio to
average
net assets | Portfolio
turnover | Net
assets,
end of
period
(000’s) |
| |
| — | — | $11.58 | 12.87% | 1.01% (e),(f) | 1.01% (e),(f) | 0.32% (e) | 45% | $101 |
| — | — | $10.26 | 1.89% | 1.00% | 1.00% | 0.40% | 66% | $148 |
| (0.07) | 0.00 (d) | $10.07 | 2.43% (h) | 1.01% | 1.01% | 0.43% | 132% | $156 |
| (0.07) | — | $9.90 | 7.83% | 1.00% | 1.00% | 0.96% | 63% | $3 |
| (0.13) | — | $9.25 | 26.06% | 1.03% | 1.00% | 0.92% | 46% | $3 |
| (0.05) | 0.01 | $7.46 | 7.15% (i) | 1.07% | 0.96% | 1.15% | 50% | $3 |
| |
| — | — | $11.45 | 12.59% | 1.40% (e),(f) | 1.40% (e),(f) | 0.02% (e) | 45% | $3 |
| — | — | $10.17 | 1.50% | 1.40% | 1.40% (g) | (0.00%) (d) | 66% | $3 |
| (0.02) | 0.00 (d) | $10.02 | 1.87% (h) | 1.49% | 1.49% (g) | (0.10%) | 132% | $3 |
| (0.03) | — | $9.86 | 7.32% | 1.49% | 1.47% (g) | 0.41% | 63% | $3 |
| (0.10) | — | $9.22 | 25.51% | 1.54% | 1.45% (g) | 0.47% | 46% | $3 |
| (0.00) (d) | 0.01 | $7.44 | 6.76% (i) | 1.59% | 1.36% (g) | 0.75% | 50% | $3 |
| |
| — | — | $11.45 | 5.53% | 0.98% (e) | 0.98% (e) | 0.98% (e) | 45% | $52,608 |
| |
| — | — | $11.53 | 12.82% | 1.18% (e),(f) | 1.15% (e),(f) | 1.02% (e) | 45% | $19,760 |
| — | — | $10.22 | 1.69% | 1.15% | 1.15% (g) | 0.24% | 66% | $2,945 |
| (0.05) | 0.00 (d) | $10.05 | 2.33% (h) | 1.17% | 1.17% (g) | 0.21% | 132% | $2,297 |
| (0.05) | — | $9.87 | 7.55% | 1.21% | 1.21% (g) | 0.62% | 63% | $3,360 |
| (0.12) | — | $9.23 | 25.74% | 1.26% | 1.20% (g) | 0.72% | 46% | $2,760 |
| (0.04) | 0.01 | $7.45 | 7.03% (i) | 1.25% | 1.11% (g) | 1.00% | 50% | $2,387 |
Columbia Select Global Equity Fund | Semiannual Report 2017
| 17 |
Notes to Financial Statements
April 30, 2017 (Unaudited)
Note 1. Organization
Columbia Select Global Equity Fund (the Fund), a series of Columbia Funds Series Trust II (the Trust), is a diversified fund. The Trust is registered under the Investment Company Act of 1940, as amended (the 1940 Act), as an open-end management investment company organized as a Massachusetts business trust.
Fund shares
The Trust may issue an unlimited number of shares (without par value). Although all share classes generally have identical voting, dividend and liquidation rights, each share class votes separately when required by the Trust’s organizational documents or by law. Different share classes pay different distribution amounts to the extent the expenses of such share classes differ, and distributions in liquidation will be proportional to the net asset value of each share class. Each share class has its own expense and sales charge structure. The Fund offers each of the share classes identified below.
Class A shares are subject to a maximum front-end sales charge of 5.75% based on the initial investment amount. Class A shares purchased without an initial sales charge in accounts aggregating $1 million to $50 million at the time of purchase are subject to a contingent deferred sales charge (CDSC) if the shares are sold within 18 months after purchase, charged as follows: 1.00% CDSC if redeemed within 12 months after purchase, and 0.50% CDSC if redeemed more than 12, but less than 18, months after purchase.
The Fund no longer accepts investments by new or existing investors in the Fund’s Class B shares, except in connection with the reinvestment of any dividend and/or capital gain distributions in Class B shares of the Fund and exchanges by existing Class B shareholders of certain other funds within the Columbia Family of Funds. Class B shares are typically subject to a maximum CDSC of 5.00% based upon the holding period after purchase. However, the Fund’s current Class B investors, having held their shares for the requisite time period, are no longer subject to a CDSC upon redemption of their shares. Effective on or about July 17, 2017, Class B shares will automatically convert to Class A shares and the Fund will no longer accept investments by new or existing investors in Class B shares.
Class C shares are subject to a 1.00% CDSC on shares redeemed within 12 months after purchase.
Effective March 27, 2017, Class I shares of the Fund are no longer offered for sale. Class I shares, when available, were not subject to sales charges or distribution and service (12b-1) fees, and were made available only to the Columbia Family of Funds. On March 27, 2017, Class I shares were redeemed or exchanged for Class Y shares of the Fund in a tax free transaction that had no impact on the fees and expenses paid by shareholders.
Class K shares are not subject to sales charges; however, this share class is closed to new investors.
Class R shares are not subject to sales charges and are generally available only to certain retirement plans and other investors as described in the Fund’s prospectus.
Class R5 shares are not subject to sales charges and are generally available only to investors purchasing through authorized investment professionals and omnibus retirement plans.
Class T shares are subject to a maximum front-end sales charge of 2.50% per transaction and must be purchased through financial intermediaries that, by written agreement with Columbia Management Investment Distributors, Inc., are specifically authorized to sell Class T shares. Prior to March 27, 2017, Class T shares were known as Class W shares, were not subject to sales charges, and were generally available only to investors purchasing through authorized investment programs managed by investment professionals, including discretionary managed accounts.
Class Y shares are not subject to sales charges or distribution and service (12b-1) fees, and are available to institutional and certain other investors as described in the Fund’s prospectus. Class Y shares commenced operations on March 1, 2017. On March 27, 2017, Class I shares were redeemed or exchanged for Class Y shares of the Fund in a tax free transaction that had no impact on the fees and expenses paid by shareholders. Class I shares of the Fund are no longer offered for sale.
Class Z shares are not subject to sales charges and are generally available only to eligible investors, which are subject to different investment minimums as described in the Fund’s prospectus.
| 18 | Columbia Select Global Equity Fund | Semiannual Report 2017 |
Notes to Financial Statements (continued)
April 30, 2017 (Unaudited)
Note 2. Summary of significant accounting policies
Basis of preparation
The Fund is an investment company that applies the accounting and reporting guidance in the Financial Accounting Standards Board (FASB) Accounting Standards Codification Topic 946, Financial Services - Investment Companies (ASC 946). The financial statements are prepared in accordance with U.S. generally accepted accounting principles (GAAP), which requires management to make certain estimates and assumptions that affect the reported amounts of assets and liabilities, the disclosure of contingent assets and liabilities at the date of the financial statements and the reported amounts of income and expenses during the reporting period. Actual results could differ from those estimates. The Fund received a reimbursement for expenses overbilled by a third party. Such reimbursement is included as an offset to Other expenses on the Statement of Operations. All fee waivers and expense reimbursements by the Investment Manager and its affiliates were applied before giving effect to the third party reimbursement.
The following is a summary of significant accounting policies followed by the Fund in the preparation of its financial statements.
Security valuation
All equity securities are valued at the close of business of the New York Stock Exchange. Equity securities are valued at the last quoted sales price on the principal exchange or market on which they trade, except for securities traded on the NASDAQ Stock Market, which are valued at the NASDAQ official close price. Unlisted securities or listed securities for which there were no sales during the day are valued at the mean of the latest quoted bid and ask prices on such exchanges or markets.
Foreign equity securities are valued based on the closing price on the foreign exchange in which such securities are primarily traded. If any foreign equity security closing prices are not readily available, the securities are valued at the mean of the latest quoted bid and ask prices on such exchanges or markets. Foreign currency exchange rates are generally determined at 4:00 p.m. Eastern (U.S.) time. Many securities markets and exchanges outside the U.S. close prior to the close of the New York Stock Exchange; therefore, the closing prices for securities in such markets or on such exchanges may not fully reflect events that occur after such close but before the close of the New York Stock Exchange. In those situations, foreign securities will be fair valued pursuant to a policy adopted by the Board of Trustees, including, if available, utilizing a third party pricing service to determine these fair values. The third party pricing service takes into account multiple factors, including, but not limited to, movements in the U.S. securities markets, certain depositary receipts, futures contracts and foreign exchange rates that have occurred subsequent to the close of the foreign exchange or market, to determine a good faith estimate that reasonably reflects the current market conditions as of the close of the New York Stock Exchange. The fair value of a security is likely to be different from the quoted or published price, if available.
Investments in open-end investment companies, including money market funds, are valued at their latest net asset value.
Investments for which market quotations are not readily available, or that have quotations which management believes are not reflective of market value or reliable, are valued at fair value as determined in good faith under procedures approved by and under the general supervision of the Board of Trustees. If a security or class of securities (such as foreign securities) is valued at fair value, such value is likely to be different from the quoted or published price for the security.
The determination of fair value often requires significant judgment. To determine fair value, management may use assumptions including but not limited to future cash flows and estimated risk premiums. Multiple inputs from various sources may be used to determine fair value.
GAAP requires disclosure regarding the inputs and valuation techniques used to measure fair value and any changes in valuation inputs or techniques. In addition, investments shall be disclosed by major category. This information is disclosed following the Fund’s Portfolio of Investments.
Columbia Select Global Equity Fund | Semiannual Report 2017
| 19 |
Notes to Financial Statements (continued)
April 30, 2017 (Unaudited)
Foreign currency transactions and translations
The values of all assets and liabilities denominated in foreign currencies are generally translated into U.S. dollars at exchange rates determined at the close of regular trading on the New York Stock Exchange. Net realized and unrealized gains (losses) on foreign currency transactions and translations include gains (losses) arising from the fluctuation in exchange rates between trade and settlement dates on securities transactions, gains (losses) arising from the disposition of foreign currency and currency gains (losses) between the accrual and payment dates on dividends, interest income and foreign withholding taxes.
For financial statement purposes, the Fund does not distinguish that portion of gains (losses) on investments which is due to changes in foreign exchange rates from that which is due to changes in market prices of the investments. Such fluctuations are included with the net realized and unrealized gains (losses) on investments in the Statement of Operations.
Security transactions
Security transactions are accounted for on the trade date. Cost is determined and gains (losses) are based upon the specific identification method for both financial statement and federal income tax purposes.
Income recognition
Corporate actions and dividend income are generally recorded net of any non-reclaimable tax withholdings, on the ex-dividend date or upon receipt of ex-dividend notification in the case of certain foreign securities.
The Fund may receive distributions from holdings in equity securities, business development companies (BDCs), exchange-traded funds, other regulated investment companies (RICs), and real estate investment trusts (REITs), which report information on the tax character of their distributions annually. These distributions are allocated to dividend income, capital gain and return of capital based on actual information reported. Return of capital is recorded as a reduction of the cost basis of securities held. If the Fund no longer owns the applicable securities, return of capital is recorded as a realized gain. With respect to REITs, to the extent actual information has not yet been reported, estimates for return of capital are made by the Fund’s management. Management’s estimates are subsequently adjusted when the actual character of the distributions is disclosed by the REITs, which could result in a proportionate change in return of capital to shareholders.
Awards from class action litigation are recorded as a reduction of cost basis if the Fund still owns the applicable securities on the payment date. If the Fund no longer owns the applicable securities, the proceeds are recorded as realized gains.
Expenses
General expenses of the Trust are allocated to the Fund and other funds of the Trust based upon relative net assets or other expense allocation methodologies determined by the nature of the expense. Expenses directly attributable to the Fund are charged to the Fund. Expenses directly attributable to a specific class of shares are charged to that share class.
Determination of class net asset value
All income, expenses (other than class-specific expenses, which are charged to that share class, as shown in the Statement of Operations) and realized and unrealized gains (losses) are allocated to each class of the Fund on a daily basis, based on the relative net assets of each class, for purposes of determining the net asset value of each class.
Federal income tax status
The Fund intends to qualify each year as a regulated investment company under Subchapter M of the Internal Revenue Code, as amended, and will distribute substantially all of its taxable income (including net short-term capital gains), if any, for its tax year, and as such will not be subject to federal income taxes. In addition, the Fund intends to distribute in each calendar year substantially all of its net investment income, capital gains and certain other amounts, if any, such that the Fund should not be subject to federal excise tax. Therefore, no federal income or excise tax provision is recorded.
| 20 | Columbia Select Global Equity Fund | Semiannual Report 2017 |
Notes to Financial Statements (continued)
April 30, 2017 (Unaudited)
Foreign taxes
The Fund may be subject to foreign taxes on income, gains on investments or currency repatriation, a portion of which may be recoverable. The Fund will accrue such taxes and recoveries, as applicable, based upon its current interpretation of tax rules and regulations that exist in the markets in which it invests.
Realized gains in certain countries may be subject to foreign taxes at the Fund level, based on statutory rates. The Fund accrues for such foreign taxes on realized and unrealized gains at the appropriate rate for each jurisdiction, as applicable. The amount, if any, is disclosed as a liability on the Statement of Assets and Liabilities.
Distributions to shareholders
Distributions from net investment income, if any, are declared and paid annually. Net realized capital gains, if any, are distributed along with the income distribution. Income distributions and capital gain distributions are determined in accordance with federal income tax regulations, which may differ from GAAP.
Guarantees and indemnifications
Under the Trust’s organizational documents and, in some cases, by contract, its officers and trustees are indemnified against certain liabilities arising out of the performance of their duties to the Trust or its funds. In addition, certain of the Fund’s contracts with its service providers contain general indemnification clauses. The Fund’s maximum exposure under these arrangements is unknown since the amount of any future claims that may be made against the Fund cannot be determined, and the Fund has no historical basis for predicting the likelihood of any such claims.
Investment company reporting modernization
In October 2016, the U.S. Securities and Exchange Commission adopted new rules and forms, and amendments to certain current rules and forms, to modernize reporting and disclosure of information by registered investment companies. The amendments to Regulation S-X will require standardized, enhanced disclosure about derivatives in investment company financial statements, and will also change the rules governing the form and content of such financial statements. The amendments to Regulation S-X take effect on August 1, 2017. At this time, management is assessing the anticipated impact of these regulatory developments.
Note 3. Fees and other transactions with affiliates
Management services fees
The Fund entered into a Management Agreement with Columbia Management Investment Advisers, LLC (the Investment Manager), a wholly-owned subsidiary of Ameriprise Financial, Inc. (Ameriprise Financial). Under the Management Agreement, the Investment Manager provides the Fund with investment research and advice, as well as administrative and accounting services. The Investment Manager is responsible for the ultimate oversight of investments made by the Fund. The Fund’s subadviser (see Subadvisory agreement below) has the primary responsibility for the day-to-day portfolio management of the Fund. The management services fee is an annual fee that is equal to a percentage of the Fund’s average daily net assets that declines from 0.88% to 0.62% as the Fund’s net assets increase. The annualized effective management services fee rate for the six months ended April 30, 2017 was 0.87% of the Fund’s average daily net assets.
Subadvisory agreement
The Investment Manager has entered into a Subadvisory Agreement with Threadneedle International Limited (Threadneedle), an affiliate of the Investment Manager and an indirect wholly-owned subsidiary of Ameriprise Financial, to serve as the subadviser to the Fund. The Investment Manager compensates Threadneedle to manage the investment of the Fund’s assets.
Columbia Select Global Equity Fund | Semiannual Report 2017
| 21 |
Notes to Financial Statements (continued)
April 30, 2017 (Unaudited)
Other expenses
Other expenses are for, among other things, miscellaneous expenses of the Fund or the Board of Trustees, including payments to Board Services Corp., a company providing limited administrative services to the Fund and the Board of Trustees. That company’s expenses include boardroom and office expense, employee compensation, employee health and retirement benefits, and certain other expenses.
Compensation of board members
Members of the Board of Trustees, who are not officers or employees of the Investment Manager or Ameriprise Financial, are compensated for their services to the Fund as disclosed in the Statement of Operations. Under a Deferred Compensation Plan (the Plan), these members of the Board of Trustees may elect to defer payment of up to 100% of their compensation. Deferred amounts are treated as though equivalent dollar amounts had been invested in shares of certain funds managed by the Investment Manager. The Fund’s liability for these amounts is adjusted for market value changes and remains in the Fund until distributed in accordance with the Plan. All amounts payable under the Plan constitute a general unsecured obligation of the Fund.
Compensation of Chief Compliance Officer
The Board of Trustees has appointed a Chief Compliance Officer to the Fund in accordance with federal securities regulations. A portion of the Chief Compliance Officer’s total compensation is allocated to the Fund, along with other affiliated funds governed by the Board of Trustees, based on relative net assets. The total amount allocated to all affiliated funds governed by the Board of Trustees will not exceed $40,000 annually.
Transfer agency fees
Under a Transfer and Dividend Disbursing Agent Agreement, Columbia Management Investment Services Corp. (the Transfer Agent), an affiliate of the Investment Manager and a wholly-owned subsidiary of Ameriprise Financial, is responsible for providing transfer agency services to the Fund. The Transfer Agent has contracted with Boston Financial Data Services (BFDS) to serve as sub-transfer agent. The Transfer Agent pays the fees of BFDS for services as sub-transfer agent and BFDS is not entitled to reimbursement for such fees from the Fund (with the exception of out-of-pocket fees).
The Fund pays the Transfer Agent a monthly transfer agency fee based on the number or the average value of accounts, depending on the type of account. In addition, the Fund pays the Transfer Agent a fee for shareholder services based on the number of accounts or on a percentage of the average aggregate value of the Fund’s shares maintained in omnibus accounts up to the lesser of the amount charged by the financial intermediary or a cap established by the Board of Trustees from time to time.
The Transfer Agent also receives compensation from the Fund for various shareholder services and reimbursements for certain out-of-pocket fees. Effective January 1, 2017, total transfer agency fees for Class K and Class R5 shares are subject to an annual limitation of not more than 0.075% of the average daily net assets attributable to each share class. Total transfer agency fees for Class I shares were subject to an annual limitation of not more than 0.025% of the average daily net assets attributable to Class I shares. Prior to January 1, 2017, total transfer agency fees for Class K and Class R5 shares were subject to an annual limitation of not more than 0.05% of the average daily net assets attributable to each share class and Class I shares did not pay transfer agency fees. Total transfer agency fees for Class Y shares are subject to an annual limitation of not more than 0.025% of the average daily net assets attributable to Class Y shares.
| 22 | Columbia Select Global Equity Fund | Semiannual Report 2017 |
Notes to Financial Statements (continued)
April 30, 2017 (Unaudited)
For the six months ended April 30, 2017, the Fund’s annualized effective transfer agency fee rates as a percentage of average daily net assets of each class were as follows:
| | Effective rate (%) |
| Class A | 0.21 |
| Class B | 0.21 |
| Class C | 0.21 |
| Class I | 0.006 (a),(b) |
| Class K | 0.055 |
| Class R | 0.21 |
| Class R5 | 0.067 |
| Class T | 0.21 |
| Class Y | 0.010 (a) |
| Class Z | 0.20 |
| (a) | Annualized. |
| (b) | Effective March 27, 2017, Class I shares were redeemed or exchanged for Class Y shares. |
The Fund and certain other associated investment companies have severally, but not jointly, guaranteed the performance and observance of all the terms and conditions of a lease entered into by Seligman Data Corp. (SDC), the former transfer agent, including the payment of rent by SDC (the Guaranty). SDC was the legacy Seligman funds’ former transfer agent.
The lease and the Guaranty expire in January 2019. At April 30, 2017, the Fund’s total potential future obligation over the life of the Guaranty is $5,366. The liability remaining at April 30, 2017 for non-recurring charges associated with the lease amounted to $3,131 and is recorded as a part of the payable for other expenses in the Statement of Assets and Liabilities.
An annual minimum account balance fee of $20 may apply to certain accounts with a value below the applicable share class’s initial minimum investment requirements to reduce the impact of small accounts on transfer agency fees. These minimum account balance fees are remitted to the Fund and recorded as part of expense reductions in the Statement of Operations. For the six months ended April 30, 2017, no minimum account balance fees were charged by the Fund.
Plan administration fees
Under a Plan Administration Services Agreement with the Transfer Agent, the Fund pays an annual fee at a rate of 0.25% of the Fund’s average daily net assets attributable to Class K shares for the provision of various administrative, recordkeeping, communication and educational services.
Distribution and service fees
The Fund has an agreement with Columbia Management Investment Distributors, Inc. (the Distributor), an affiliate of the Investment Manager and a wholly-owned subsidiary of Ameriprise Financial, for distribution and shareholder services. Under a Plan and Agreement of Distribution, the Fund pays a fee at an annual rate of up to 0.25% of the Fund’s average daily net assets attributable to Class A and Class T shares, a fee at an annual rate of up to 0.50% of the Fund’s average daily net assets attributable to Class R shares (of which up to 0.25% may be used for shareholder services) and a fee at an annual rate of up to 1.00% of the Fund’s average daily net assets attributable to Class B and Class C shares. For Class B and Class C shares, of the 1.00% fee, up to 0.75% is reimbursed for distribution expenses.
The amount of distribution and shareholder services expenses incurred by the Distributor and not yet reimbursed (unreimbursed expense) was approximately $703,000 and $1,367,000 for Class B and Class C shares, respectively. These amounts are based on the most recent information available as of March 31, 2017, and may be recovered from future payments under the distribution plan or CDSCs. To the extent the unreimbursed expense has been fully recovered, the distribution and/or shareholder services fee is reduced.
Columbia Select Global Equity Fund | Semiannual Report 2017
| 23 |
Notes to Financial Statements (continued)
April 30, 2017 (Unaudited)
Sales charges
Sales charges, including front-end charges and CDSCs, received by the Distributor for distributing Fund shares for the six months ended April 30, 2017, if any, are listed below:
| | Amount ($) |
| Class A | 48,863 |
| Class C | 372 |
Expenses waived/reimbursed by the Investment Manager and its affiliates
The Investment Manager and certain of its affiliates have contractually agreed to waive fees and/or reimburse expenses (excluding certain fees and expenses described below) for the periods disclosed below, unless sooner terminated at the sole discretion of the Board of Trustees, so that the Fund’s net operating expenses, after giving effect to fees waived/expenses reimbursed and any balance credits and/or overdraft charges from the Fund’s custodian, do not exceed the following annual rates as a percentage of the class’ average daily net assets:
| | March 1, 2017
through
February 28, 2018 | Prior to
March 1, 2017 |
| Class A | 1.400% | 1.46% |
| Class B | 2.150 | 2.21 |
| Class C | 2.150 | 2.21 |
| Class K | 1.325 | 1.36 |
| Class R | 1.650 | 1.71 |
| Class R5 | 1.075 | 1.11 |
| Class T | 1.400 | 1.46 |
| Class Y | 1.025 | — |
| Class Z | 1.150 | 1.21 |
Under the agreement governing these fee waivers and/or expense reimbursement arrangements, the following fees and expenses are excluded from the waiver/reimbursement commitment, and therefore will be paid by the Fund, if applicable: taxes (including foreign transaction taxes), expenses associated with investments in affiliated and non-affiliated pooled investment vehicles (including mutual funds and exchange-traded funds), transaction costs and brokerage commissions, costs related to any securities lending program, dividend and interest expenses associated with securities sold short, inverse floater program fees and expenses, transaction charges and interest on borrowed money, interest, infrequent and/or unusual expenses and any other expenses the exclusion of which is specifically approved by the Board of Trustees. This agreement may be modified or amended only with approval from the Investment Manager, certain of its affiliates and the Fund. Any fees waived and/or expenses reimbursed under the expense reimbursement arrangements described above are not recoverable by the Investment Manager or its affiliates in future periods.
Note 4. Federal tax information
The timing and character of income and capital gain distributions are determined in accordance with income tax regulations, which may differ from GAAP because of temporary or permanent book to tax differences.
At April 30, 2017, the approximate cost of investments for federal income tax purposes and the aggregate gross approximate unrealized appreciation and depreciation based on that cost was:
Federal
tax cost ($) | Gross unrealized
appreciation ($) | Gross unrealized
(depreciation) ($) | Net unrealized
appreciation ($) |
| 335,087,000 | 53,374,000 | (574,000) | 52,800,000 |
| 24 | Columbia Select Global Equity Fund | Semiannual Report 2017 |
Notes to Financial Statements (continued)
April 30, 2017 (Unaudited)
The following capital loss carryforwards, determined at October 31, 2016, may be available to reduce taxable income arising from future net realized gains on investments, if any, to the extent permitted by the Internal Revenue Code. Capital loss carryforwards with no expiration are required to be utilized prior to any capital losses which carry an expiration date. As a result of this ordering rule, capital loss carryforwards which carry an expiration date may be more likely to expire unused.
| 2017 ($) | 2018 ($) | 2019 ($) | No expiration
short-term ($) | No expiration
long-term ($) | Total ($) |
| 12,171,974 | — | 10,126,139 | — | — | 22,298,113 |
Management of the Fund has concluded that there are no significant uncertain tax positions in the Fund that would require recognition in the financial statements. However, management’s conclusion may be subject to review and adjustment at a later date based on factors including, but not limited to, new tax laws, regulations, and administrative interpretations (including relevant court decisions). Generally, the Fund’s federal tax returns for the prior three fiscal years remain subject to examination by the Internal Revenue Service.
Note 5. Portfolio information
The cost of purchases and proceeds from sales of securities, excluding short-term investments and derivatives, if any, aggregated to $169,134,527 and $218,853,172, respectively, for the six months ended April 30, 2017. The amount of purchase and sale activity impacts the portfolio turnover rate reported in the Financial Highlights.
Note 6. Regulatory settlements
During the six months ended April 30, 2017, the Fund recorded a receivable of $73,374 as a result of a regulatory settlement proceeding brought by the Securities and Exchange Commission against a third party relating to market timing and/or late trading of mutual funds. This amount represented the Fund’s portion of the proceeds from the settlement (neither the Fund nor the Investment Manager were a party to the proceeding) and is disclosed as a receivable on the Statement of Assets and Liabilities.
Note 7. Affiliated money market fund
The Fund invests in Columbia Short-Term Cash Fund, an affiliated money market fund established for the exclusive use by the Fund and other affiliated funds (the Affiliated MMF). The income earned by the Fund from such investments is included as Dividends - affiliated issuers in the Statement of Operations. As an investing fund, the Fund indirectly bears its proportionate share of the expenses of the Affiliated MMF. The Affiliated MMF prices its shares with a floating net asset value. In addition, the Board of Trustees of the Affiliated MMF may impose a fee on redemptions (sometimes referred to as a liquidity fee) or temporarily suspend redemptions (sometimes referred to as imposing a redemption gate) in the event its liquidity falls below regulatory limits.
Note 8. Line of credit
The Fund has access to a revolving credit facility with a syndicate of banks led by Citibank, N.A., HSBC Bank USA, N.A. and JPMorgan Chase Bank, N.A. whereby the Fund may borrow for the temporary funding of shareholder redemptions or for other temporary or emergency purposes. The credit facility agreement, which is a collective agreement between the Fund and certain other funds managed by the Investment Manager, severally and not jointly, permits collective borrowings up to $1 billion. Interest is charged to each participating fund based on its borrowings at a rate equal to the higher of (i) the overnight federal funds rate plus 1.00% or (ii) the one-month LIBOR rate plus 1.00%. Each borrowing under the credit facility matures no later than 60 days after the date of borrowing. The Fund also pays a commitment fee equal to its pro rata share of the amount of the credit facility at a rate of 0.15% per annum. The commitment fee is included in other expenses in the Statement of Operations.
The Fund had no borrowings during the six months ended April 30, 2017.
Columbia Select Global Equity Fund | Semiannual Report 2017
| 25 |
Notes to Financial Statements (continued)
April 30, 2017 (Unaudited)
Note 9. Significant risks
Foreign securities and emerging market countries risk
Investing in foreign securities may include certain risks and considerations not typically associated with investing in U.S. securities, such as fluctuating currency values and changing local and regional economic, political and social conditions, which may result in greater market volatility. In addition, certain foreign securities may not be as liquid as U.S. securities. Investing in emerging markets may accentuate these risks. These countries are also more likely to experience high levels of inflation, deflation or currency devaluation which could hurt their economies and securities markets. To the extent that the Fund concentrates its investment exposure to any one or a few specific countries, the Fund will be particularly susceptible to the various conditions, events or other factors impacting those countries and may, therefore, have a greater risk than that of a fund which is more geographically diversified.
Shareholder concentration risk
At April 30, 2017, affiliated shareholders of record owned 80.8% of the outstanding shares of the Fund in one or more accounts. Subscription and redemption activity by concentrated accounts may have a significant effect on the operations of the Fund. In the case of a large redemption, the Fund may be forced to sell investments at inopportune times, including its liquid or more liquid positions, resulting in Fund losses and the Fund holding a higher percentage of less liquid or illiquid securities. Large redemptions could result in decreased economies of scale and increased operating expenses for non-redeeming Fund shareholders.
Technology and technology-related investment risk
The Fund may be more susceptible to the particular risks that may affect companies in the information technology sector, as well as other technology-related sectors (collectively, the technology sectors) than if it were invested in a wider variety of companies in unrelated sectors. Companies in the technology sectors are subject to certain risks, including the risk that new services, equipment or technologies will not be accepted by consumers and businesses or will become rapidly obsolete. Performance of such companies may be affected by factors including obtaining and protecting patents (or the failure to do so) and significant competitive pressures, including aggressive pricing of their products or services, new market entrants, competition for market share and short product cycles due to an accelerated rate of technological developments. Such competitive pressures may lead to limited earnings and/or falling profit margins. As a result, the value of their securities may fall or fail to rise. In addition, many technology sector companies have limited operating histories and prices of these companies’ securities historically have been more volatile than other securities, especially over the short term.
Note 10. Subsequent events
Management has evaluated the events and transactions that have occurred through the date the financial statements were issued. Other than as noted in Note 1 above, there were no items requiring adjustment of the financial statements or additional disclosure.
Note 11. Information regarding pending and settled legal proceedings
Ameriprise Financial and certain of its affiliates have historically been involved in a number of legal, arbitration and regulatory proceedings, including routine litigation, class actions, and governmental actions, concerning matters arising in connection with the conduct of their business activities. Ameriprise Financial believes that the Funds are not currently the subject of, and that neither Ameriprise Financial nor any of its affiliates are the subject of, any pending legal, arbitration or regulatory proceedings that are likely to have a material adverse effect on the Funds or the ability of Ameriprise Financial or its affiliates to perform under their contracts with the Funds. Ameriprise Financial is required to make quarterly (10-Q), annual (10-K) and, as necessary, 8-K filings with the Securities and Exchange Commission (SEC) on legal and regulatory matters that relate to Ameriprise Financial and its affiliates. Copies of these filings may be obtained by accessing the SEC website at www.sec.gov.
There can be no assurance that these matters, or the adverse publicity associated with them, will not result in increased fund redemptions, reduced sale of fund shares or other adverse consequences to the Funds. Further, although we believe proceedings are not likely to have a material adverse effect on the Funds or the ability of Ameriprise Financial or its affiliates to perform under their contracts with the Funds, these proceedings are subject to uncertainties and, as such, we are unable
| 26 | Columbia Select Global Equity Fund | Semiannual Report 2017 |
Notes to Financial Statements (continued)
April 30, 2017 (Unaudited)
to estimate the possible loss or range of loss that may result. An adverse outcome in one or more of these proceedings could result in adverse judgments, settlements, fines, penalties or other relief that could have a material adverse effect on the consolidated financial condition or results of operations of Ameriprise Financial.
Columbia Select Global Equity Fund | Semiannual Report 2017
| 27 |
The Fund mails one shareholder report to each shareholder address. If you would like more than one report, please call shareholder services at 800.345.6611 and additional reports will be sent to you.
Proxy voting policies and procedures
The policy of the Board of Trustees is to vote the proxies of the companies in which the Fund holds investments consistent with the procedures as stated in the Statement of Additional Information (SAI). You may obtain a copy of the SAI without charge by calling 800.345.6611; contacting your financial intermediary; visiting investor.columbiathreadneedleus.com; or searching the website of the Securities and Exchange Commission (SEC) at sec.gov. Information regarding how the Fund voted proxies relating to portfolio securities is filed with the SEC by August 31st for the most recent 12-month period ending June 30th of that year, and is available without charge by visiting investor.columbiathreadneedleus.com, or searching the website of the SEC at sec.gov.
Quarterly schedule of investments
The Fund files a complete schedule of portfolio holdings with the SEC for the first and third quarters of each fiscal year on Form N-Q. The Fund’s Form N-Q is available on the SEC’s website at sec.gov and may be reviewed and copied at the SEC’s Public Reference Room in Washington, D.C. Information on the operation of the Public Reference Room may be obtained by calling 800.SEC.0330. The Fund’s complete schedule of portfolio holdings, as filed on Form N-Q, can also be obtained without charge, upon request, by calling 800.345.6611.
Additional Fund information
For more information about the Fund, please visit investor.columbiathreadneedleus.com or call 800.345.6611. Customer Service Representatives are available to answer your questions Monday through Friday from 8 a.m. to 7 p.m. Eastern time.
Fund investment manager
Columbia Management Investment Advisers, LLC
225 Franklin Street
Boston, MA 02110
Fund distributor
Columbia Management Investment Distributors, Inc.
225 Franklin Street
Boston, MA 02110
Fund transfer agent
Columbia Management Investment Services Corp.
P.O. Box 8081
Boston, MA 02266-8081
| 28 | Columbia Select Global Equity Fund | Semiannual Report 2017 |
[THIS PAGE INTENTIONALLY LEFT BLANK]
Columbia Select Global Equity Fund
P.O. Box 8081
Boston, MA 02266-8081
Please read and consider the investment objectives, risks, charges and expenses for any fund carefully before investing. For a prospectus and summary prospectus, which contains this and other important information about the Fund, go to
investor.columbiathreadneedleus.com. The Fund is distributed by Columbia Management Investment Distributors, Inc., member FINRA, and managed by Columbia Management Investment Advisers, LLC.
Columbia Threadneedle Investments (Columbia Threadneedle) is the global brand name of the Columbia and Threadneedle group of companies. All rights reserved. Columbia Management Investment Distributors, Inc., 225 Franklin Street, Boston, MA 02110-2804
© 2017 Columbia Management Investment Advisers, LLC.
investor.columbiathreadneedleus.com

SemiAnnual Report
April 30, 2017
Columbia European Equity Fund
Not FDIC Insured • No bank guarantee • May lose value
Dear Shareholders,
While emotions have run high following the outcome of the U.S. Presidential election, it remains unclear how the Trump presidency will unfold in terms of policy. We have a sense of the priorities espoused by the President over the past eighteen months, but campaign priorities are not always realized and are often never pursued. What seems certain is that, while some investors have already priced expectations into the market, others have retreated, preferring instead a wait and see approach. The outcome of such behaviors appears to have created conditions ripe for ongoing market volatility.
While volatility in the financial markets can be stressful, volatility itself is not a new phenomenon. Other factors that have been at the root cause of recent volatility include uncertainty following the United Kingdom’s vote to exit the European Union (Brexit), speculation around the Federal Reserve’s decision to increase interest rates, divergent central bank policy and geopolitical unrest. The point is, financial markets have fluctuated for years and may be expected to continue to fluctuate — sometimes wildly. If anything, such volatility seems to be the new normal, perhaps exacerbated by access to information and development of technological tools which have enabled investors to react rapidly to real and perceived change. So what can you do?
Position your portfolio for the reality of market volatility
That there is a historical precedent for market volatility, or even an acceptance that it may persist, offers little comfort. A measured and strategic approach remains the best strategy for investors to stay on track in achieving their investment goals.
Step 1: Review your investment goals
Take this opportunity to review your investment goals and the strategies you are pursuing to achieve those goals in order to remain focused on what’s important to you. It is entirely possible that your goals have changed in response either to your life situation or to changes in the market. Accept what you can’t control — volatility, and focus on what you can — your investment goals and strategies.
Step 2: Reassess your risk tolerance
Sit down with your financial advisor to discuss your investment goals and strategies, as well as any changes to your tolerance for risk. Consider your investment horizon. Increased market volatility and a new investment horizon may impact the strategies that can best help you achieve your investment goals. Remember, achieving your investment goals may require a certain amount of risk. Ultimately, you must maintain vigilance in reassessing your risk tolerance and the strategies you have selected in pursuit of your investment goals, and awareness of how those strategies may react to market volatility.
Step 3: Remain calm and focus on your long-term plan
Remember, investing is about the long game. Short term events are not necessarily evidence of a longer term reality. Investors who attempt to time the market too often end up reacting to a down turn by selling low and then compounding the problem by waiting on the sidelines, ultimately missing the right opportunity to reinvest.
Columbia European Equity Fund | Semiannual Report 2017
President’s Message (continued)
As long as there is a market, there will be volatility. How you respond to that volatility can make a big difference in the measure of your success as an investor. Talk to your financial advisor about how working with Columbia Threadneedle Investments may help you position your portfolio for the reality of ongoing volatility and, perhaps, even turn such volatility into investment opportunity.
Sincerely,
Christopher O. Petersen
President, Columbia Funds
Investors should consider the investment objectives, risks, charges and expenses of a mutual fund carefully before investing. For a free prospectus and summary prospectus, which contains this and other important information about a fund, visit investor.columbiathreadneedleus.com. The prospectus should be read carefully before investing.
Columbia Funds are distributed by Columbia Management Investment Distributors, Inc., member FINRA, and managed by Columbia Management Investment Advisers, LLC.
© 2017 Columbia Management Investment Advisers, LLC. All rights reserved.
Columbia European Equity Fund | Semiannual Report 2017
Columbia European Equity Fund | Semiannual Report 2017
Fund at a Glance
(Unaudited)
Investment objective
Columbia European Equity Fund (the Fund) seeks to provide shareholders with capital appreciation.
Portfolio management
Threadneedle International Limited
Dan Ison
Ann Steele
Morningstar style boxTM
The Morningstar Style Box is based on a fund’s portfolio holdings. For equity funds, the vertical axis shows the market capitalization of the stocks owned, and the horizontal axis shows investment style (value, blend, or growth). Information shown is based on the most recent data provided by Morningstar.
© 2017 Morningstar, Inc. All rights reserved. The Morningstar information contained herein: (1) is proprietary to Morningstar and/or its content providers; (2) may not be copied or distributed; and (3) is not warranted to be accurate, complete or timely. Neither Morningstar nor its content providers are responsible for any damages or losses arising from any use of this information.
| Average annual total returns (%) (for the period ended April 30, 2017) |
| | | Inception | 6 Months
cumulative | 1 Year | 5 Years | 10 Years |
| Class A | Excluding sales charges | 06/26/00 | 14.23 | 7.51 | 6.36 | 2.82 |
| | Including sales charges | | 7.68 | 1.39 | 5.12 | 2.21 |
| Class B | Excluding sales charges | 06/26/00 | 13.63 | 6.54 | 5.52 | 2.02 |
| | Including sales charges | | 8.63 | 1.54 | 5.20 | 2.02 |
| Class C | Excluding sales charges | 06/26/00 | 13.89 | 6.66 | 5.57 | 2.04 |
| | Including sales charges | | 12.89 | 5.66 | 5.57 | 2.04 |
| Class K | 06/26/00 | 14.25 | 7.51 | 6.49 | 3.03 |
| Class R4 * | 01/08/14 | 14.44 | 7.68 | 6.53 | 2.90 |
| Class R5 * | 01/08/14 | 14.45 | 7.74 | 6.62 | 2.94 |
| Class T * | Excluding sales charges | 06/18/12 | 14.31 | 7.38 | 6.35 | 2.81 |
| | Including sales charges | | 11.47 | 4.71 | 5.81 | 2.55 |
| Class Y * | 03/01/16 | 14.58 | 7.87 | 6.46 | 2.86 |
| Class Z * | 09/27/10 | 14.41 | 7.66 | 6.62 | 3.02 |
| MSCI Europe Index (Net) | | 14.52 | 10.93 | 6.86 | 0.42 |
Returns for Class A are shown with and without the maximum initial sales charge of 5.75%. Returns for Class B are shown with and without the applicable contingent deferred sales charge (CDSC) of 5.00% in the first year, declining to 1.00% in the sixth year and eliminated thereafter. The Fund does not accept new investments in Class B shares, except for certain limited transactions. The Fund’s current Class B investors, having held their shares for the requisite time period, are no longer subject to a CDSC upon redemption of their shares. Returns for Class C are shown with and without the 1.00% CDSC for the first year only. The returns for Class T shares are shown with and without the maximum applicable sales charge of 2.50% per transaction. Prior to March 27, 2017, Class T shares were known as Class W shares and were sold without a sales charge. The Fund’s other classes are not subject to sales charges and have limited eligibility. Please see the Fund’s prospectus for details. Performance for different share classes will vary based on differences in sales charges and fees associated with each class. All results shown assume reinvestment of distributions during the period. Returns do not reflect the deduction of taxes that a shareholder may pay on Fund distributions or on the redemption of Fund shares. Performance results reflect the effect of any fee waivers or reimbursements of Fund expenses by Columbia Management Investment Advisers, LLC and/or any of its affiliates. Absent these fee waivers or expense reimbursement arrangements, performance results would have been lower.
The performance information shown represents past performance and is not a guarantee of future results. The investment return and principal value of your investment will fluctuate so that your shares, when redeemed, may be worth more or less than their original cost. Current performance may be lower or higher than the performance information shown. You may obtain performance information current to the most recent month-end by contacting your financial intermediary, visiting investor.columbiathreadneedleus.com or calling 800.345.6611.
| * | The returns shown for periods prior to the share class inception date (including returns for the Life of the Fund, if shown, which are since Fund inception) include the returns of the Fund’s oldest share class. Since the Fund launched more than one share class at its inception, Class A shares were used. These returns are adjusted to reflect any higher class-related operating expenses of the newer share classes, as applicable. Please visit investor.columbiathreadneedleus.com/investment-products/mutual-funds/appended-performance for more information. |
The MSCI Europe Index (Net) is a free float-adjusted market capitalization weighted index that is designed to measure the equity market performance of the developed markets in Europe.
Indices are not available for investment, are not professionally managed and do not reflect sales charges, fees, brokerage commissions, taxes (except the MSCI Europe Index (Net), which reflects reinvested dividends net of withholding taxes) or other expenses of investing. Securities in the Fund may not match those in an index.
Columbia European Equity Fund | Semiannual Report 2017
| 3 |
Fund at a Glance (continued)
(Unaudited)
| Top 10 holdings (%) (at April 30, 2017) |
| Roche Holding AG, Genusschein Shares (Switzerland) | 3.9 |
| Sika AG (Switzerland) | 3.8 |
| Royal Dutch Shell PLC, Class B (United Kingdom) | 3.1 |
| Prudential PLC (United Kingdom) | 3.1 |
| L’Oreal SA (France) | 3.1 |
| Schneider Electric SE (France) | 3.0 |
| Unilever PLC (United Kingdom) | 3.0 |
| CRH PLC (Ireland) | 2.8 |
| Ryanair Holdings PLC, ADR (Ireland) | 2.8 |
| BASF SE (Germany) | 2.8 |
Percentages indicated are based upon total investments (excluding Money Market Funds).
For further detail about these holdings, please refer to the section entitled “Portfolio of Investments.”
Fund holdings are as of the date given, are subject to change at any time, and are not recommendations to buy or sell any security.
| Equity sector breakdown (%) (at April 30, 2017) |
| Consumer Discretionary | 9.5 |
| Consumer Staples | 9.8 |
| Energy | 5.6 |
| Financials | 22.0 |
| Health Care | 8.9 |
| Industrials | 19.2 |
| Information Technology | 6.6 |
| Materials | 14.7 |
| Telecommunication Services | 3.7 |
| Total | 100.0 |
Percentages indicated are based upon total equity investments. The Fund’s portfolio composition is subject to change.
| Country breakdown (%) (at April 30, 2017) |
| Belgium | 2.0 |
| Denmark | 2.6 |
| Finland | 1.1 |
| France | 16.9 |
| Germany | 12.5 |
| Ireland | 8.9 |
| Italy | 1.7 |
| Netherlands | 7.4 |
| Spain | 4.8 |
| Sweden | 6.2 |
| Switzerland | 9.2 |
| United Kingdom | 26.7 |
| United States(a) | 0.0 (b) |
| Total | 100.0 |
| (a) | Includes investments in Money Market Funds. |
| (b) | Rounds to zero. |
Country breakdown is based primarily on issuer’s place of organization/incorporation. Percentages indicated are based upon total investments. The Fund’s portfolio composition is subject to change.
| 4 | Columbia European Equity Fund | Semiannual Report 2017 |
Understanding Your Fund’s Expenses
(Unaudited)
As an investor, you incur two types of costs. There are transaction costs, which generally include sales charges on purchases and may include redemption fees. There are also ongoing costs, which generally include management fees, distribution and/or service fees, and other fund expenses. The following information is intended to help you understand your ongoing costs (in dollars) of investing in the Fund and to help you compare these costs with the ongoing costs of investing in other mutual funds.
Analyzing your Fund’s expenses
To illustrate these ongoing costs, we have provided examples and calculated the expenses paid by investors in each share class of the Fund during the period. The actual and hypothetical information in the table is based on an initial investment of $1,000 at the beginning of the period indicated and held for the entire period. Expense information is calculated two ways and each method provides you with different information. The amount listed in the “Actual” column is calculated using the Fund’s actual operating expenses and total return for the period. You may use the Actual information, together with the amount invested, to estimate the expenses that you paid over the period. Simply divide your account value by $1,000 (for example, an $8,600 account value divided by $1,000 = 8.6), then multiply the results by the expenses paid during the period under the “Actual” column. The amount listed in the “Hypothetical” column assumes a 5% annual rate of return before expenses (which is not the Fund’s actual return) and then applies the Fund’s actual expense ratio for the period to the hypothetical return. You should not use the hypothetical account values and expenses to estimate either your actual account balance at the end of the period or the expenses you paid during the period. See “Compare with other funds” below for details on how to use the hypothetical data.
Compare with other funds
Since all mutual funds are required to include the same hypothetical calculations about expenses in shareholder reports, you can use this information to compare the ongoing cost of investing in the Fund with other funds. To do so, compare the hypothetical example with the 5% hypothetical examples that appear in the shareholder reports of other funds. As you compare hypothetical examples of other funds, it is important to note that hypothetical examples are meant to highlight the ongoing costs of investing in a fund only and do not reflect any transaction costs, such as sales charges, or redemption or exchange fees. Therefore, the hypothetical calculations are useful in comparing ongoing costs only, and will not help you determine the relative total costs of owning different funds. If transaction costs were included in these calculations, your costs would be higher.
| November 1, 2016 — April 30, 2017 |
| | Account value at the
beginning of the
period ($) | Account value at the
end of the
period ($) | Expenses paid during
the period ($) | Fund’s annualized
expense ratio (%) |
| | Actual | Hypothetical | Actual | Hypothetical | Actual | Hypothetical | Actual |
| Class A | 1,000.00 | 1,000.00 | 1,142.30 | 1,017.75 | 7.25 | 6.83 | 1.38 |
| Class B | 1,000.00 | 1,000.00 | 1,136.30 | 1,014.07 | 11.16 | 10.52 | 2.13 |
| Class C | 1,000.00 | 1,000.00 | 1,138.90 | 1,014.07 | 11.17 | 10.52 | 2.13 |
| Class K | 1,000.00 | 1,000.00 | 1,142.50 | 1,018.15 | 6.83 | 6.43 | 1.30 |
| Class R4 | 1,000.00 | 1,000.00 | 1,144.40 | 1,018.98 | 5.94 | 5.59 | 1.13 |
| Class R5 | 1,000.00 | 1,000.00 | 1,144.50 | 1,019.42 | 5.47 | 5.15 | 1.04 |
| Class T (formerly Class W) | 1,000.00 | 1,000.00 | 1,143.10 | 1,017.80 | 7.20 | 6.78 | 1.37 |
| Class Y | 1,000.00 | 1,000.00 | 1,145.80 | 1,019.62 | 5.26 | 4.95 | 1.00 |
| Class Z | 1,000.00 | 1,000.00 | 1,144.10 | 1,018.98 | 5.94 | 5.59 | 1.13 |
Expenses paid during the period are equal to the annualized expense ratio for each class as indicated above, multiplied by the average account value over the period and then multiplied by the number of days in the Fund’s most recent fiscal half year and divided by 365.
Expenses do not include fees and expenses incurred indirectly by the Fund from its investment in underlying funds, including affiliated and non-affiliated pooled investment vehicles, such as mutual funds and exchange-traded funds.
Had Columbia Management Investment Advisers, LLC and/or certain of its affiliates not waived/reimbursed certain fees and expenses, account value at the end of the period would have been reduced.
Columbia European Equity Fund | Semiannual Report 2017
| 5 |
Portfolio of Investments
April 30, 2017 (Unaudited)
(Percentages represent value of investments compared to net assets)
| Common Stocks 99.3% |
| Issuer | Shares | Value ($) |
| Belgium 2.0% |
| KBC Group NV | 107,601 | 7,768,661 |
| Denmark 2.6% |
| Novo Nordisk A/S, Class B | 169,104 | 6,580,154 |
| Pandora A/S | 30,887 | 3,338,279 |
| Total | 9,918,433 |
| Finland 1.1% |
| Sampo OYJ, Class A | 87,396 | 4,187,867 |
| France 16.8% |
| Airbus Group SE | 80,331 | 6,495,461 |
| Amundi SA | 126,732 | 8,338,167 |
| BNP Paribas SA | 116,454 | 8,217,557 |
| Dassault Systemes | 67,819 | 6,052,596 |
| Essilor International SA | 45,045 | 5,836,580 |
| Legrand SA | 95,495 | 6,182,068 |
| L’Oreal SA | 59,572 | 11,865,459 |
| Schneider Electric SE | 147,536 | 11,651,542 |
| Total | 64,639,430 |
| Germany 12.4% |
| Allianz SE, Registered Shares | 42,771 | 8,144,008 |
| BASF SE | 109,046 | 10,626,397 |
| Brenntag AG | 65,207 | 3,866,871 |
| Continental AG | 25,635 | 5,738,423 |
| Deutsche Telekom AG, Registered Shares | 529,428 | 9,284,963 |
| Fresenius Medical Care AG & Co. KGaA | 78,363 | 6,952,637 |
| SAP SE | 33,230 | 3,332,697 |
| Total | 47,945,996 |
| Ireland 8.8% |
| CRH PLC | 293,447 | 10,714,239 |
| Kingspan Group PLC | 204,381 | 7,109,758 |
| Ryanair Holdings PLC, ADR(a) | 115,926 | 10,657,077 |
| Smurfit Kappa Group PLC | 208,508 | 5,568,625 |
| Total | 34,049,699 |
| Italy 1.7% |
| Moncler SpA | 70,767 | 1,746,780 |
| Prysmian SpA | 163,494 | 4,721,271 |
| Total | 6,468,051 |
| Common Stocks (continued) |
| Issuer | Shares | Value ($) |
| Netherlands 7.3% |
| Akzo Nobel NV | 43,123 | 3,771,062 |
| ASML Holding NV | 56,804 | 7,508,723 |
| ING Groep NV | 497,863 | 8,105,003 |
| RELX NV | 454,337 | 8,787,112 |
| Total | 28,171,900 |
| Spain 4.8% |
| Amadeus IT Group SA, Class A | 153,102 | 8,255,311 |
| Cellnex Telecom SA | 274,138 | 4,845,084 |
| Industria de Diseno Textil SA | 135,812 | 5,208,967 |
| Total | 18,309,362 |
| Sweden 6.1% |
| Atlas Copco AB, Class A | 152,373 | 5,697,666 |
| Nordea Bank AB | 313,156 | 3,853,771 |
| Svenska Handelsbanken AB, Class A | 403,353 | 5,724,258 |
| Volvo AB B Shares | 509,709 | 8,338,527 |
| Total | 23,614,222 |
| Switzerland 9.1% |
| Cie Financiere Richemont SA, Class A, Registered Shares | 71,092 | 5,941,005 |
| Roche Holding AG, Genusschein Shares | 56,440 | 14,765,158 |
| Sika AG | 2,280 | 14,550,753 |
| Total | 35,256,916 |
| United Kingdom 26.6% |
| 3i Group PLC | 419,765 | 4,314,095 |
| British American Tobacco PLC | 154,742 | 10,451,993 |
| Burberry Group PLC | 228,156 | 4,769,491 |
| Compass Group PLC | 283,422 | 5,719,230 |
| Imperial Brands PLC | 76,810 | 3,762,494 |
| ITV PLC | 1,487,505 | 4,045,892 |
| John Wood Group PLC | 605,448 | 5,955,815 |
| Johnson Matthey PLC | 106,122 | 4,094,610 |
| Prudential PLC | 535,998 | 11,912,887 |
| Rio Tinto PLC | 172,260 | 6,831,659 |
| Royal Dutch Shell PLC, Class B | 449,493 | 11,949,306 |
| St. James’s Place PLC | 291,447 | 4,333,492 |
| Standard Chartered PLC(a) | 1,000,375 | 9,344,480 |
| TechnipFMC PLC(a) | 113,188 | 3,402,960 |
The accompanying Notes to Financial Statements are an integral part of this statement.
| 6 | Columbia European Equity Fund | Semiannual Report 2017 |
Portfolio of Investments (continued)
April 30, 2017 (Unaudited)
| Common Stocks (continued) |
| Issuer | Shares | Value ($) |
| Unilever PLC | 223,493 | 11,497,667 |
| Total | 102,386,071 |
Total Common Stocks
(Cost $339,231,997) | 382,716,608 |
|
| Money Market Funds 0.0% |
| | Shares | Value ($) |
| Columbia Short-Term Cash Fund, 0.869%(b),(c) | 90 | 90 |
Total Money Market Funds
(Cost $90) | 90 |
Total Investments
(Cost $339,232,087) | 382,716,698 |
| Other Assets & Liabilities, Net | | 2,812,324 |
| Net Assets | $385,529,022 |
Notes to Portfolio of Investments
| (a) | Non-income producing investment. |
| (b) | The rate shown is the seven-day current annualized yield at April 30, 2017. |
| (c) | As defined in the Investment Company Act of 1940, an affiliated company is one in which the Fund owns 5% or more of the company’s outstanding voting securities, or a company which is under common ownership or control with the Fund. Holdings and transactions in these affiliated companies during the period ended April 30, 2017 are as follows: |
| Issuer | Beginning
shares | Shares
purchased | Shares
sold | Ending
shares | Realized gain
(loss) ($) | Dividends —
affiliated
issuers($) | Value ($) |
| Columbia Short-Term Cash Fund, 0.869% | 22 | 43,747,436 | (43,747,368) | 90 | (325) | 4,029 | 90 |
Abbreviation Legend
| ADR | American Depositary Receipt |
Fair value measurements
The Fund categorizes its fair value measurements according to a three-level hierarchy that maximizes the use of observable inputs and minimizes the use of unobservable inputs by prioritizing that the most observable input be used when available. Observable inputs are those that market participants would use in pricing an investment based on market data obtained from sources independent of the reporting entity. Unobservable inputs are those that reflect the Fund’s assumptions about the information market participants would use in pricing an investment. An investment’s level within the fair value hierarchy is based on the lowest level of any input that is deemed significant to the asset’s or liability’s fair value measurement. The input levels are not necessarily an indication of the risk or liquidity associated with investments at that level. For example, certain U.S. government securities are generally high quality and liquid, however, they are reflected as Level 2 because the inputs used to determine fair value may not always be quoted prices in an active market.
Fair value inputs are summarized in the three broad levels listed below:
| • | Level 1 – Valuations based on quoted prices for investments in active markets that the Fund has the ability to access at the measurement date (including NAV for open-end mutual funds). Valuation adjustments are not applied to Level 1 investments. |
| • | Level 2 – Valuations based on other significant observable inputs (including quoted prices for similar securities, interest rates, prepayment speeds, credit risks, etc.). |
| • | Level 3 – Valuations based on significant unobservable inputs (including the Fund’s own assumptions and judgment in determining the fair value of investments). |
Inputs that are used in determining fair value of an investment may include price information, credit data, volatility statistics, and other factors. These inputs can be either observable or unobservable. The availability of observable inputs can vary between investments, and is affected by various factors such as the type of investment, and the volume and level of activity for that investment or similar investments in the marketplace. The inputs will be considered by the Investment Manager, along with any other relevant factors in the calculation of an investment’s fair value. The Fund uses prices and inputs that are current as of the measurement date, which may include periods of market dislocations. During these periods, the availability of prices and inputs may be reduced for many investments. This condition could cause an investment to be reclassified between the various levels within the hierarchy.
Foreign equity securities actively traded in markets where there is a significant delay in the local close relative to the New York Stock Exchange are classified as Level 2. The values of these securities may include an adjustment to reflect the impact of significant market movements following the close of local trading, as described in Note 2 to the financial statements – Security valuation.
The accompanying Notes to Financial Statements are an integral part of this statement.
Columbia European Equity Fund | Semiannual Report 2017
| 7 |
Portfolio of Investments (continued)
April 30, 2017 (Unaudited)
Fair value measurements (continued)
Certain investments that have been measured at fair value using the net asset value (NAV) per share (or its equivalent) are not categorized in the fair value hierarchy. The fair value amounts presented in the table are intended to reconcile the fair value hierarchy to the amounts presented in the Portfolio of Investments. The Columbia Short-Term Cash Fund seeks to provide shareholders with maximum current income consistent with liquidity and stability of principal. Columbia Short-Term Cash Fund prices its shares with a floating NAV and no longer seeks to maintain a stable NAV.
Investments falling into the Level 3 category are primarily supported by quoted prices from brokers and dealers participating in the market for those investments. However, these may be classified as Level 3 investments due to lack of market transparency and corroboration to support these quoted prices. Additionally, valuation models may be used as the pricing source for any remaining investments classified as Level 3. These models may rely on one or more significant unobservable inputs and/or significant assumptions by the Investment Manager. Inputs used in valuations may include, but are not limited to, financial statement analysis, capital account balances, discount rates and estimated cash flows, and comparable company data.
Under the direction of the Fund’s Board of Trustees (the Board), the Investment Manager’s Valuation Committee (the Committee) is responsible for overseeing the valuation procedures approved by the Board. The Committee consists of voting and non-voting members from various groups within the Investment Manager’s organization, including operations and accounting, trading and investments, compliance, risk management and legal.
The Committee meets at least monthly to review and approve valuation matters, which may include a description of specific valuation determinations, data regarding pricing information received from approved pricing vendors and brokers and the results of Board-approved valuation control policies and procedures (the Policies). The Policies address, among other things, instances when market quotations are or are not readily available, including recommendations of third party pricing vendors and a determination of appropriate pricing methodologies; events that require specific valuation determinations and assessment of fair value techniques; securities with a potential for stale pricing, including those that are illiquid, restricted, or in default; and the effectiveness of third party pricing vendors, including periodic reviews of vendors. The Committee meets more frequently, as needed, to discuss additional valuation matters, which may include the need to review back-testing results, review time-sensitive information or approve related valuation actions. The Committee reports to the Board, with members of the Committee meeting with the Board at each of its regularly scheduled meetings to discuss valuation matters and actions during the period, similar to those described earlier.
For investments categorized as Level 3, the Committee monitors information similar to that described above, which may include: (i) data specific to the issuer or comparable issuers, (ii) general market or specific sector news and (iii) quoted prices and specific or similar security transactions. The Committee considers this data and any changes from prior periods in order to assess the reasonableness of observable and unobservable inputs, any assumptions or internal models used to value those securities and changes in fair value. This data is also used to corroborate, when available, information received from approved pricing vendors and brokers. Various factors impact the frequency of monitoring this information (which may occur as often as daily). However, the Committee may determine that changes to inputs, assumptions and models are not required as a result of the monitoring procedures performed.
The following table is a summary of the inputs used to value the Fund’s investments at April 30, 2017:
| | Level 1
quoted prices
in active
markets for
identical
assets ($) | Level 2
other
significant
observable
inputs ($) | Level 3
significant
unobservable
inputs ($) | Investments
measured at
net asset
value ($) | Total ($) |
| Investments | | | | | |
| Common Stocks | | | | | |
| Belgium | — | 7,768,661 | — | — | 7,768,661 |
| Denmark | — | 9,918,433 | — | — | 9,918,433 |
| Finland | — | 4,187,867 | — | — | 4,187,867 |
| France | — | 64,639,430 | — | — | 64,639,430 |
| Germany | — | 47,945,996 | — | — | 47,945,996 |
| Ireland | 10,657,077 | 23,392,622 | — | — | 34,049,699 |
| Italy | — | 6,468,051 | — | — | 6,468,051 |
| Netherlands | — | 28,171,900 | — | — | 28,171,900 |
| Spain | — | 18,309,362 | — | — | 18,309,362 |
| Sweden | — | 23,614,222 | — | — | 23,614,222 |
| Switzerland | — | 35,256,916 | — | — | 35,256,916 |
| United Kingdom | — | 102,386,071 | — | — | 102,386,071 |
| Total Common Stocks | 10,657,077 | 372,059,531 | — | — | 382,716,608 |
| Money Market Funds | — | — | — | 90 | 90 |
| Total Investments | 10,657,077 | 372,059,531 | — | 90 | 382,716,698 |
See the Portfolio of Investments for all investment classifications not indicated in the table.
The Fund’s assets assigned to the Level 2 input category are generally valued using the market approach, in which a security’s value is determined through reference to prices and information from market transactions for similar or identical assets. These assets include certain foreign securities for which a third party statistical pricing service may be employed for purposes of fair market valuation. The model utilized by such third party statistical pricing service takes into account a security’s correlation to available market data including, but not limited to, intraday index, ADR, and exchange-traded fund movements.
There were no transfers of financial assets between levels during the period.
The accompanying Notes to Financial Statements are an integral part of this statement.
| 8 | Columbia European Equity Fund | Semiannual Report 2017 |
Statement of Assets and Liabilities
April 30, 2017 (Unaudited)
| Assets | |
| Investments, at cost | |
| Unaffiliated issuers, at cost | $339,231,997 |
| Affiliated issuers, at cost | 90 |
| Total investments, at cost | 339,232,087 |
| Investments, at value | |
| Unaffiliated issuers, at value | 382,716,608 |
| Affiliated issuers, at value | 90 |
| Total investments, at value | 382,716,698 |
| Foreign currency (identified cost $335,654) | 335,496 |
| Receivable for: | |
| Investments sold | 4,006,827 |
| Capital shares sold | 192,161 |
| Dividends | 1,776,199 |
| Foreign tax reclaims | 1,206,907 |
| Expense reimbursement due from Investment Manager | 42 |
| Prepaid expenses | 927 |
| Other assets | 26,865 |
| Total assets | 390,262,122 |
| Liabilities | |
| Due to custodian | 970,865 |
| Payable for: | |
| Investments purchased | 2,406,623 |
| Capital shares purchased | 1,262,135 |
| Management services fees | 9,251 |
| Distribution and/or service fees | 946 |
| Transfer agent fees | 24,330 |
| Compensation of board members | 37,279 |
| Other expenses | 21,671 |
| Total liabilities | 4,733,100 |
| Net assets applicable to outstanding capital stock | $385,529,022 |
| Represented by | |
| Paid in capital | 380,174,026 |
| Undistributed net investment income | 2,242,369 |
| Accumulated net realized loss | (40,336,672) |
| Unrealized appreciation (depreciation) on: | |
| Investments - unaffiliated issuers | 43,484,611 |
| Foreign currency translations | (35,312) |
| Total - representing net assets applicable to outstanding capital stock | $385,529,022 |
The accompanying Notes to Financial Statements are an integral part of this statement.
Columbia European Equity Fund | Semiannual Report 2017
| 9 |
Statement of Assets and Liabilities (continued)
April 30, 2017 (Unaudited)
| Class A | |
| Net assets | $81,349,809 |
| Shares outstanding | 12,292,129 |
| Net asset value per share | $6.62 |
| Maximum offering price per share(a) | $7.02 |
| Class B | |
| Net assets | $319,909 |
| Shares outstanding | 48,658 |
| Net asset value per share | $6.57 |
| Class C | |
| Net assets | $13,898,322 |
| Shares outstanding | 2,151,862 |
| Net asset value per share | $6.46 |
| Class K | |
| Net assets | $3,522 |
| Shares outstanding | 535 |
| Net asset value per share(b) | $6.59 |
| Class R4 | |
| Net assets | $113,199 |
| Shares outstanding | 17,183 |
| Net asset value per share | $6.59 |
| Class R5 | |
| Net assets | $338,579 |
| Shares outstanding | 51,060 |
| Net asset value per share | $6.63 |
| Class T(c) | |
| Net assets | $2,145 |
| Shares outstanding | 326 |
| Net asset value per share(b) | $6.59 |
| Maximum offering price per share(d) | $6.76 |
| Class Y | |
| Net assets | $209,086,711 |
| Shares outstanding | 32,371,036 |
| Net asset value per share | $6.46 |
| Class Z | |
| Net assets | $80,416,826 |
| Shares outstanding | 12,201,424 |
| Net asset value per share | $6.59 |
| (a) | The maximum offering price per share is calculated by dividing the net asset value per share by 1.0 minus the maximum sales charge of 5.75% for Class A. |
| (b) | Net asset value per share rounds to this amount due to fractional shares outstanding. |
| (c) | Effective March 27, 2017, Class W shares were renamed Class T shares. |
| (d) | The maximum offering price per share is calculated by dividing the net asset value per share by 1.0 minus the maximum sales charge of 2.50% for Class T. |
The accompanying Notes to Financial Statements are an integral part of this statement.
| 10 | Columbia European Equity Fund | Semiannual Report 2017 |
Statement of Operations
Six Months Ended April 30, 2017 (Unaudited)
| Net investment income | |
| Income: | |
| Dividends — unaffiliated issuers | $5,264,008 |
| Dividends — affiliated issuers | 4,029 |
| Foreign taxes withheld | (402,411) |
| Total income | 4,865,626 |
| Expenses: | |
| Management services fees | 1,636,990 |
| Distribution and/or service fees | |
| Class A | 118,819 |
| Class B | 1,842 |
| Class C | 71,077 |
| Class T(a) | 2 |
| Transfer agent fees | |
| Class A | 87,613 |
| Class B | 340 |
| Class C | 13,119 |
| Class I(b) | 4,909 |
| Class K | 1 |
| Class R4 | 156 |
| Class R5 | 93 |
| Class T(a) | 2 |
| Class Y | 2,070 |
| Class Z | 55,347 |
| Plan administration fees | |
| Class K | 4 |
| Compensation of board members | 9,367 |
| Custodian fees | 38,893 |
| Printing and postage fees | 17,614 |
| Registration fees | 58,625 |
| Audit fees | 37,252 |
| Legal fees | 4,754 |
| Compensation of chief compliance officer | 44 |
| Other | 13,565 |
| Total expenses | 2,172,498 |
| Fees waived or expenses reimbursed by Investment Manager and its affiliates | (19,324) |
| Total net expenses | 2,153,174 |
| Net investment income | 2,712,452 |
| Realized and unrealized gain (loss) — net | |
| Net realized gain (loss) on: | |
| Investments — unaffiliated issuers | (9,157,386) |
| Investments — affiliated issuers | (325) |
| Foreign currency translations | (170,892) |
| Net realized loss | (9,328,603) |
| Net change in unrealized appreciation (depreciation) on: | |
| Investments — unaffiliated issuers | 57,198,472 |
| Foreign currency translations | 44,871 |
| Net change in unrealized appreciation (depreciation) | 57,243,343 |
| Net realized and unrealized gain | 47,914,740 |
| Net increase in net assets resulting from operations | $50,627,192 |
| (a) | Effective March 27, 2017, Class W shares were renamed Class T shares. |
| (b) | Effective March 27, 2017, Class I shares were redeemed or exchanged for Class Y shares. |
The accompanying Notes to Financial Statements are an integral part of this statement.
Columbia European Equity Fund | Semiannual Report 2017
| 11 |
Statement of Changes in Net Assets
| | Six Months Ended
April 30, 2017
(Unaudited) | Year Ended
October 31, 2016 |
| Operations | | |
| Net investment income | $2,712,452 | $9,275,098 |
| Net realized loss | (9,328,603) | (29,945,916) |
| Net change in unrealized appreciation (depreciation) | 57,243,343 | (38,796,620) |
| Net increase (decrease) in net assets resulting from operations | 50,627,192 | (59,467,438) |
| Distributions to shareholders | | |
| Net investment income | | |
| Class A | (2,197,533) | (2,093,251) |
| Class B | (5,301) | (3,202) |
| Class C | (202,021) | (105,665) |
| Class I(a) | (5,442,983) | (4,363,997) |
| Class K | (71) | (45) |
| Class R4 | (4,384) | (54,498) |
| Class R5 | (6,565) | (2,598) |
| Class T(b) | (41) | (26) |
| Class Y | (65) | — |
| Class Z | (1,320,204) | (796,112) |
| Net realized gains | | |
| Class A | — | (5,406,872) |
| Class B | — | (26,894) |
| Class C | — | (862,126) |
| Class I(a) | — | (8,098,156) |
| Class K | — | (104) |
| Class R4 | — | (114,644) |
| Class R5 | — | (5,020) |
| Class T(b) | — | (65) |
| Class Z | — | (1,687,203) |
| Total distributions to shareholders | (9,179,168) | (23,620,478) |
| Decrease in net assets from capital stock activity | (75,233,736) | (65,552,261) |
| Total decrease in net assets | (33,785,712) | (148,640,177) |
| Net assets at beginning of period | 419,314,734 | 567,954,911 |
| Net assets at end of period | $385,529,022 | $419,314,734 |
| Undistributed net investment income | $2,242,369 | $8,709,085 |
| (a) | Effective March 27, 2017, Class I shares were redeemed or exchanged for Class Y shares. |
| (b) | Effective March 27, 2017, Class W shares were renamed Class T shares. |
The accompanying Notes to Financial Statements are an integral part of this statement.
| 12 | Columbia European Equity Fund | Semiannual Report 2017 |
Statement of Changes in Net Assets (continued)
| | Six Months Ended | Year Ended |
| | April 30, 2017 (Unaudited) | October 31, 2016 (a) |
| | Shares | Dollars ($) | Shares | Dollars ($) |
| Capital stock activity |
| Class A | | | | |
| Subscriptions (b) | 624,311 | 3,790,544 | 2,757,645 | 17,484,919 |
| Distributions reinvested | 375,156 | 2,187,162 | 1,152,394 | 7,363,800 |
| Redemptions | (8,079,829) | (48,819,182) | (11,783,394) | (72,836,126) |
| Net decrease | (7,080,362) | (42,841,476) | (7,873,355) | (47,987,407) |
| Class B | | | | |
| Subscriptions | — | — | 9,132 | 55,948 |
| Distributions reinvested | 908 | 5,273 | 4,720 | 30,019 |
| Redemptions (b) | (33,260) | (198,573) | (78,631) | (480,597) |
| Net decrease | (32,352) | (193,300) | (64,779) | (394,630) |
| Class C | | | | |
| Subscriptions | 108,508 | 663,899 | 390,539 | 2,428,504 |
| Distributions reinvested | 32,798 | 187,276 | 142,969 | 893,554 |
| Redemptions | (929,343) | (5,462,048) | (1,878,517) | (11,343,237) |
| Net decrease | (788,037) | (4,610,873) | (1,345,009) | (8,021,179) |
| Class I(c) | | | | |
| Subscriptions | 162,518 | 987,439 | 690,528 | 4,336,122 |
| Distributions reinvested | 933,607 | 5,442,929 | 1,950,242 | 12,462,045 |
| Redemptions | (40,119,599) | (250,360,112) | (4,134,956) | (25,594,876) |
| Net decrease | (39,023,474) | (243,929,744) | (1,494,186) | (8,796,709) |
| Class K | | | | |
| Distributions reinvested | 5 | 26 | 8 | 54 |
| Net increase | 5 | 26 | 8 | 54 |
| Class R4 | | | | |
| Subscriptions | 433 | 2,706 | 16,995 | 109,226 |
| Distributions reinvested | 748 | 4,337 | 26,579 | 169,045 |
| Redemptions | (25,968) | (155,812) | (980,855) | (6,344,855) |
| Net decrease | (24,787) | (148,769) | (937,281) | (6,066,584) |
| Class R5 | | | | |
| Subscriptions | 16,503 | 101,300 | 38,086 | 233,251 |
| Distributions reinvested | 1,116 | 6,516 | 1,177 | 7,519 |
| Redemptions | (9,092) | (55,556) | (22,989) | (144,837) |
| Net increase | 8,527 | 52,260 | 16,274 | 95,933 |
| Class Y(c) | | | | |
| Subscriptions | 34,273,108 | 210,437,261 | 426 | 2,500 |
| Redemptions | (1,902,498) | (11,856,118) | — | — |
| Net increase | 32,370,610 | 198,581,143 | 426 | 2,500 |
| Class Z | | | | |
| Subscriptions | 4,513,303 | 27,481,907 | 3,758,945 | 22,975,684 |
| Distributions reinvested | 222,413 | 1,289,997 | 354,869 | 2,256,970 |
| Redemptions | (1,806,817) | (10,914,907) | (3,181,182) | (19,616,893) |
| Net increase | 2,928,899 | 17,856,997 | 932,632 | 5,615,761 |
| Total net decrease | (11,640,971) | (75,233,736) | (10,765,270) | (65,552,261) |
| (a) | Class Y shares commenced operations on March 1, 2016. Per share data and total return reflect activity from that date. |
| (b) | Includes conversions of Class B shares to Class A shares, if any. |
| (c) | Effective March 27, 2017, Class I shares were redeemed or exchanged for Class Y shares. |
The accompanying Notes to Financial Statements are an integral part of this statement.
Columbia European Equity Fund | Semiannual Report 2017
| 13 |
The following table is intended to help you understand the Fund’s financial performance. Certain information reflects financial results for a single share of a class held for the periods shown. Per share net investment income (loss) amounts are calculated based on average shares outstanding during the period. Total return assumes reinvestment of all dividends and distributions, if any. Total return does not reflect payment of sales charges, if any. Total return and portfolio turnover are not annualized for periods of less than one year. The portfolio turnover rate is calculated without regard to purchase and sales transactions of short-term instruments and certain derivatives, if any. If such transactions were included, the Fund’s portfolio turnover rate may be higher.
| Year ended (except as noted) | Net asset value,
beginning of
period | Net
investment
income | Net
realized
and
unrealized
gain (loss) | Total from
investment
operations | Distributions
from net
investment
income | Distributions
from net
realized
gains |
| Class A |
| 4/30/2017 (c) | $5.92 | 0.03 | 0.80 | 0.83 | (0.13) | — |
| 10/31/2016 | $6.96 | 0.10 | (0.86) | (0.76) | (0.08) | (0.20) |
| 10/31/2015 | $7.05 | 0.08 | 0.16 | 0.24 | (0.12) | (0.21) |
| 10/31/2014 | $7.55 | 0.13 | (0.29) | (0.16) | (0.06) | (0.28) |
| 10/31/2013 | $5.94 | 0.07 | 1.66 | 1.73 | (0.09) | (0.03) |
| 10/31/2012 | $5.47 | 0.08 | 0.40 | 0.48 | (0.01) | — |
| Class B |
| 4/30/2017 (c) | $5.86 | 0.01 | 0.78 | 0.79 | (0.08) | — |
| 10/31/2016 | $6.89 | 0.06 | (0.87) | (0.81) | (0.02) | (0.20) |
| 10/31/2015 | $6.97 | 0.03 | 0.17 | 0.20 | (0.07) | (0.21) |
| 10/31/2014 | $7.48 | 0.07 | (0.28) | (0.21) | (0.02) | (0.28) |
| 10/31/2013 | $5.87 | 0.03 | 1.64 | 1.67 | (0.03) | (0.03) |
| 10/31/2012 | $5.44 | 0.04 | 0.39 | 0.43 | — | — |
| Class C |
| 4/30/2017 (c) | $5.75 | 0.01 | 0.78 | 0.79 | (0.08) | — |
| 10/31/2016 | $6.77 | 0.06 | (0.86) | (0.80) | (0.02) | (0.20) |
| 10/31/2015 | $6.86 | 0.02 | 0.17 | 0.19 | (0.07) | (0.21) |
| 10/31/2014 | $7.37 | 0.07 | (0.28) | (0.21) | (0.02) | (0.28) |
| 10/31/2013 | $5.82 | (0.00) (g) | 1.64 | 1.64 | (0.06) | (0.03) |
| 10/31/2012 | $5.39 | 0.04 | 0.39 | 0.43 | — | — |
| Class K |
| 4/30/2017 (c) | $5.90 | 0.04 | 0.78 | 0.82 | (0.13) | — |
| 10/31/2016 | $6.94 | 0.11 | (0.86) | (0.75) | (0.09) | (0.20) |
| 10/31/2015 | $7.03 | 0.08 | 0.18 | 0.26 | (0.14) | (0.21) |
| 10/31/2014 | $7.54 | 0.13 | (0.29) | (0.16) | (0.07) | (0.28) |
| 10/31/2013 | $5.93 | 0.08 | 1.67 | 1.75 | (0.11) | (0.03) |
| 10/31/2012 | $5.47 | 0.08 | 0.41 | 0.49 | (0.03) | — |
| Class R4 |
| 4/30/2017 (c) | $5.90 | 0.03 | 0.80 | 0.83 | (0.14) | — |
| 10/31/2016 | $6.94 | 0.12 | (0.87) | (0.75) | (0.09) | (0.20) |
| 10/31/2015 | $7.03 | 0.11 | 0.15 | 0.26 | (0.14) | (0.21) |
| 10/31/2014 (h) | $7.59 | 0.10 | (0.66) | (0.56) | — | — |
| Class R5 |
| 4/30/2017 (c) | $5.94 | 0.05 | 0.79 | 0.84 | (0.15) | — |
| 10/31/2016 | $6.99 | 0.13 | (0.88) | (0.75) | (0.10) | (0.20) |
| 10/31/2015 | $7.08 | 0.12 | 0.15 | 0.27 | (0.15) | (0.21) |
| 10/31/2014 (i) | $7.63 | 0.09 | (0.64) | (0.55) | — | — |
The accompanying Notes to Financial Statements are an integral part of this statement.
| 14 | Columbia European Equity Fund | Semiannual Report 2017 |
Total
distributions to
shareholders | Net
asset
value,
end of
period | Total
return | Total gross
expense
ratio to
average
net assets(a) | Total net
expense
ratio to
average
net assets(a),(b) | Net investment
income (loss)
ratio to
average
net assets | Portfolio
turnover | Net
assets,
end of
period
(000’s) |
| |
| (0.13) | $6.62 | 14.23% | 1.39% (d) | 1.38% (d) | 0.98% (d) | 30% | $81,350 |
| (0.28) | $5.92 | (11.25%) | 1.36% | 1.36% (e) | 1.68% | 55% | $114,672 |
| (0.33) | $6.96 | 3.61% | 1.35% (f) | 1.35% (e),(f) | 1.14% | 63% | $189,670 |
| (0.34) | $7.05 | (2.33%) | 1.37% | 1.37% | 1.74% | 64% | $163,706 |
| (0.12) | $7.55 | 29.57% | 1.42% | 1.42% (e) | 1.03% | 73% | $100,943 |
| (0.01) | $5.94 | 8.88% | 1.54% (f) | 1.52% (e),(f) | 1.42% | 126% | $52,850 |
| |
| (0.08) | $6.57 | 13.63% | 2.15% (d) | 2.13% (d) | 0.25% (d) | 30% | $320 |
| (0.22) | $5.86 | (11.96%) | 2.11% | 2.11% (e) | 0.92% | 55% | $474 |
| (0.28) | $6.89 | 2.95% | 2.11% (f) | 2.11% (e),(f) | 0.43% | 63% | $1,004 |
| (0.30) | $6.97 | (3.06%) | 2.11% | 2.11% | 0.97% | 64% | $1,535 |
| (0.06) | $7.48 | 28.59% | 2.18% | 2.18% (e) | 0.42% | 73% | $1,561 |
| — | $5.87 | 7.90% | 2.28% (f) | 2.27% (e),(f) | 0.78% | 126% | $1,492 |
| |
| (0.08) | $6.46 | 13.89% | 2.15% (d) | 2.13% (d) | 0.38% (d) | 30% | $13,898 |
| (0.22) | $5.75 | (12.02%) | 2.11% | 2.11% (e) | 0.92% | 55% | $16,919 |
| (0.28) | $6.77 | 2.84% | 2.10% (f) | 2.10% (e),(f) | 0.36% | 63% | $29,009 |
| (0.30) | $6.86 | (3.08%) | 2.12% | 2.12% | 1.00% | 64% | $26,264 |
| (0.09) | $7.37 | 28.58% | 2.15% | 2.15% (e) | (0.05%) | 73% | $13,322 |
| — | $5.82 | 7.98% | 2.31% (f) | 2.27% (e),(f) | 0.72% | 126% | $2,106 |
| |
| (0.13) | $6.59 | 14.25% | 1.31% (d) | 1.30% (d) | 1.37% (d) | 30% | $4 |
| (0.29) | $5.90 | (11.16%) | 1.24% | 1.24% | 1.74% | 55% | $3 |
| (0.35) | $6.94 | 3.78% | 1.22% (f) | 1.22% (f) | 1.17% | 63% | $4 |
| (0.35) | $7.03 | (2.33%) | 1.22% | 1.22% | 1.74% | 64% | $12 |
| (0.14) | $7.54 | 29.93% | 1.23% | 1.23% | 1.21% | 73% | $14 |
| (0.03) | $5.93 | 9.08% | 1.27% (f) | 1.27% (f) | 1.43% | 126% | $17 |
| |
| (0.14) | $6.59 | 14.44% | 1.14% (d) | 1.13% (d) | 1.05% (d) | 30% | $113 |
| (0.29) | $5.90 | (11.05%) | 1.09% | 1.09% (e) | 1.87% | 55% | $248 |
| (0.35) | $6.94 | 3.90% | 1.10% (f) | 1.10% (e),(f) | 1.51% | 63% | $6,800 |
| — | $7.03 | (7.38%) | 1.12% (d) | 1.12% (d) | 1.69% (d) | 64% | $53 |
| |
| (0.15) | $6.63 | 14.45% | 1.04% (d) | 1.04% (d) | 1.76% (d) | 30% | $339 |
| (0.30) | $5.94 | (10.99%) | 0.99% | 0.99% | 2.13% | 55% | $253 |
| (0.36) | $6.99 | 4.03% | 0.98% (f) | 0.98% (f) | 1.68% | 63% | $184 |
| — | $7.08 | (7.21%) | 0.98% (d) | 0.98% (d) | 1.51% (d) | 64% | $50 |
Columbia European Equity Fund | Semiannual Report 2017
| 15 |
Financial Highlights (continued)
| Year ended (except as noted) | Net asset value,
beginning of
period | Net
investment
income | Net
realized
and
unrealized
gain (loss) | Total from
investment
operations | Distributions
from net
investment
income | Distributions
from net
realized
gains |
| Class T(j) |
| 4/30/2017 (c) | $5.89 | 0.04 | 0.79 | 0.83 | (0.13) | — |
| 10/31/2016 | $6.93 | 0.10 | (0.86) | (0.76) | (0.08) | (0.20) |
| 10/31/2015 | $7.02 | 0.08 | 0.17 | 0.25 | (0.13) | (0.21) |
| 10/31/2014 | $7.52 | 0.12 | (0.28) | (0.16) | (0.06) | (0.28) |
| 10/31/2013 | $5.94 | 0.07 | 1.65 | 1.72 | (0.11) | (0.03) |
| 10/31/2012 (k) | $5.21 | (0.00) (g) | 0.73 | 0.73 | — | — |
| Class Y |
| 4/30/2017 (c) | $5.79 | 0.14 | 0.68 | 0.82 | (0.15) | — |
| 10/31/2016 (l) | $5.87 | 0.12 | (0.20) | (0.08) | — | — |
| Class Z |
| 4/30/2017 (c) | $5.90 | 0.05 | 0.78 | 0.83 | (0.14) | — |
| 10/31/2016 | $6.94 | 0.11 | (0.86) | (0.75) | (0.09) | (0.20) |
| 10/31/2015 | $7.04 | 0.08 | 0.17 | 0.25 | (0.14) | (0.21) |
| 10/31/2014 | $7.53 | 0.14 | (0.28) | (0.14) | (0.07) | (0.28) |
| 10/31/2013 | $5.94 | 0.09 | 1.65 | 1.74 | (0.12) | (0.03) |
| 10/31/2012 | $5.49 | 0.02 | 0.47 | 0.49 | (0.04) | — |
| Notes to Financial Highlights |
| (a) | In addition to the fees and expenses that the Fund bears directly, the Fund indirectly bears a pro rata share of the fees and expenses of any other funds in which it invests. Such indirect expenses are not included in the Fund’s reported expense ratios. |
| (b) | Total net expenses include the impact of certain fee waivers/expense reimbursements made by the Investment Manager and certain of its affiliates, if applicable. |
| (c) | For the six months ended April 30, 2017 (unaudited). |
| (d) | Annualized. |
| (e) | The benefits derived from expense reductions had an impact of less than 0.01%. |
| (f) | Ratios include line of credit interest expense which is less than 0.01%. |
| (g) | Rounds to zero. |
| (h) | Class R4 shares commenced operations on January 8, 2014. Per share data and total return reflect activity from that date. |
| (i) | Class R5 shares commenced operations on January 8, 2014. Per share data and total return reflect activity from that date. |
| (j) | Effective March 27, 2017, Class W shares were renamed Class T shares. |
| (k) | Class T shares commenced operations on June 18, 2012. Per share data and total return reflect activity from that date. |
| (l) | Class Y shares commenced operations on March 1, 2016. Per share data and total return reflect activity from that date. |
The accompanying Notes to Financial Statements are an integral part of this statement.
| 16 | Columbia European Equity Fund | Semiannual Report 2017 |
Total
distributions to
shareholders | Net
asset
value,
end of
period | Total
return | Total gross
expense
ratio to
average
net assets(a) | Total net
expense
ratio to
average
net assets(a),(b) | Net investment
income (loss)
ratio to
average
net assets | Portfolio
turnover | Net
assets,
end of
period
(000’s) |
| |
| (0.13) | $6.59 | 14.31% | 1.44% (d) | 1.37% (d) | 1.30% (d) | 30% | $2 |
| (0.28) | $5.89 | (11.26%) | 1.35% | 1.35% (e) | 1.64% | 55% | $2 |
| (0.34) | $6.93 | 3.65% | 1.30% (f) | 1.30% (e),(f) | 1.20% | 63% | $2 |
| (0.34) | $7.02 | (2.37%) | 1.35% | 1.35% | 1.62% | 64% | $2 |
| (0.14) | $7.52 | 29.42% | 1.46% | 1.46% (e) | 1.09% | 73% | $4 |
| — | $5.94 | 14.01% | 1.64% (d) | 1.52% (d) | 0.11% (d) | 126% | $3 |
| |
| (0.15) | $6.46 | 14.58% | 1.02% (d) | 1.00% (d) | 4.75% (d) | 30% | $209,087 |
| — | $5.79 | (1.36%) | 0.92% (d) | 0.92% (d) | 2.91% (d) | 55% | $2 |
| |
| (0.14) | $6.59 | 14.41% | 1.16% (d) | 1.13% (d) | 1.83% (d) | 30% | $80,417 |
| (0.29) | $5.90 | (11.06%) | 1.11% | 1.11% (e) | 1.85% | 55% | $54,741 |
| (0.35) | $6.94 | 3.75% | 1.11% (f) | 1.11% (e),(f) | 1.18% | 63% | $57,916 |
| (0.35) | $7.04 | (2.01%) | 1.12% | 1.12% | 1.92% | 64% | $115,755 |
| (0.15) | $7.53 | 29.83% | 1.17% | 1.17% (e) | 1.34% | 73% | $107,086 |
| (0.04) | $5.94 | 9.09% | 1.49% (f) | 1.27% (e),(f) | 0.34% | 126% | $60,380 |
Columbia European Equity Fund | Semiannual Report 2017
| 17 |
Notes to Financial Statements
April 30, 2017 (Unaudited)
Note 1. Organization
Columbia European Equity Fund (the Fund), a series of Columbia Funds Series Trust II (the Trust), is a diversified fund. The Trust is registered under the Investment Company Act of 1940, as amended (the 1940 Act), as an open-end management investment company organized as a Massachusetts business trust.
Fund shares
The Trust may issue an unlimited number of shares (without par value). Although all share classes generally have identical voting, dividend and liquidation rights, each share class votes separately when required by the Trust’s organizational documents or by law. Different share classes pay different distribution amounts to the extent the expenses of such share classes differ, and distributions in liquidation will be proportional to the net asset value of each share class. Each share class has its own expense and sales charge structure. The Fund offers each of the share classes identified below.
Class A shares are subject to a maximum front-end sales charge of 5.75% based on the initial investment amount. Class A shares purchased without an initial sales charge in accounts aggregating $1 million to $50 million at the time of purchase are subject to a contingent deferred sales charge (CDSC) if the shares are sold within 18 months after purchase, charged as follows: 1.00% CDSC if redeemed within 12 months after purchase, and 0.50% CDSC if redeemed more than 12, but less than 18, months after purchase.
The Fund no longer accepts investments by new or existing investors in the Fund’s Class B shares, except in connection with the reinvestment of any dividend and/or capital gain distributions in Class B shares of the Fund and exchanges by existing Class B shareholders of certain other funds within the Columbia Family of Funds. Class B shares are typically subject to a maximum CDSC of 5.00% based upon the holding period after purchase. However, the Fund’s current Class B investors, having held their shares for the requisite time period, are no longer subject to a CDSC upon redemption of their shares. Effective on or about July 17, 2017, Class B shares will automatically convert to Class A shares and the Fund will no longer accept investments by new or existing investors in Class B shares.
Class C shares are subject to a 1.00% CDSC on shares redeemed within 12 months after purchase.
Effective March 27, 2017, Class I shares of the Fund are no longer offered for sale. Class I shares, when available, were not subject to sales charges or distribution and service (12b-1) fees, and were made available only to the Columbia Family of Funds. On March 27, 2017, Class I shares were redeemed or exchanged for Class Y shares of the Fund in a tax free transaction that had no impact on the fees and expenses paid by shareholders.
Class K shares are not subject to sales charges; however, this share class is closed to new investors.
Class R4 shares are not subject to sales charges and are generally available only to omnibus retirement plans and certain investors as described in the Fund’s prospectus.
Class R5 shares are not subject to sales charges and are generally available only to investors purchasing through authorized investment professionals and omnibus retirement plans.
Class T shares are subject to a maximum front-end sales charge of 2.50% per transaction and must be purchased through financial intermediaries that, by written agreement with Columbia Management Investment Distributors, Inc., are specifically authorized to sell Class T shares. Prior to March 27, 2017, Class T shares were known as Class W shares, were not subject to sales charges, and were generally available only to investors purchasing through authorized investment programs managed by investment professionals, including discretionary managed accounts.
Class Y shares are not subject to sales charges or distribution and service (12b-1) fees, and are available to institutional and certain other investors as described in the Fund’s prospectus. On March 27, 2017, Class I shares were redeemed or exchanged for Class Y shares of the Fund in a tax free transaction that had no impact on the fees and expenses paid by shareholders. Class I shares of the Fund are no longer offered for sale.
Class Z shares are not subject to sales charges and are generally available only to eligible investors, which are subject to different investment minimums as described in the Fund’s prospectus.
| 18 | Columbia European Equity Fund | Semiannual Report 2017 |
Notes to Financial Statements (continued)
April 30, 2017 (Unaudited)
Note 2. Summary of significant accounting policies
Basis of preparation
The Fund is an investment company that applies the accounting and reporting guidance in the Financial Accounting Standards Board (FASB) Accounting Standards Codification Topic 946, Financial Services - Investment Companies (ASC 946). The financial statements are prepared in accordance with U.S. generally accepted accounting principles (GAAP), which requires management to make certain estimates and assumptions that affect the reported amounts of assets and liabilities, the disclosure of contingent assets and liabilities at the date of the financial statements and the reported amounts of income and expenses during the reporting period. Actual results could differ from those estimates.
The following is a summary of significant accounting policies followed by the Fund in the preparation of its financial statements.
Security valuation
All equity securities are valued at the close of business of the New York Stock Exchange. Equity securities are valued at the last quoted sales price on the principal exchange or market on which they trade, except for securities traded on the NASDAQ Stock Market, which are valued at the NASDAQ official close price. Unlisted securities or listed securities for which there were no sales during the day are valued at the mean of the latest quoted bid and ask prices on such exchanges or markets.
Foreign equity securities are valued based on the closing price on the foreign exchange in which such securities are primarily traded. If any foreign equity security closing prices are not readily available, the securities are valued at the mean of the latest quoted bid and ask prices on such exchanges or markets. Foreign currency exchange rates are generally determined at 4:00 p.m. Eastern (U.S.) time. Many securities markets and exchanges outside the U.S. close prior to the close of the New York Stock Exchange; therefore, the closing prices for securities in such markets or on such exchanges may not fully reflect events that occur after such close but before the close of the New York Stock Exchange. In those situations, foreign securities will be fair valued pursuant to a policy adopted by the Board of Trustees, including, if available, utilizing a third party pricing service to determine these fair values. The third party pricing service takes into account multiple factors, including, but not limited to, movements in the U.S. securities markets, certain depositary receipts, futures contracts and foreign exchange rates that have occurred subsequent to the close of the foreign exchange or market, to determine a good faith estimate that reasonably reflects the current market conditions as of the close of the New York Stock Exchange. The fair value of a security is likely to be different from the quoted or published price, if available.
Investments in open-end investment companies, including money market funds, are valued at their latest net asset value.
Investments for which market quotations are not readily available, or that have quotations which management believes are not reflective of market value or reliable, are valued at fair value as determined in good faith under procedures approved by and under the general supervision of the Board of Trustees. If a security or class of securities (such as foreign securities) is valued at fair value, such value is likely to be different from the quoted or published price for the security.
The determination of fair value often requires significant judgment. To determine fair value, management may use assumptions including but not limited to future cash flows and estimated risk premiums. Multiple inputs from various sources may be used to determine fair value.
GAAP requires disclosure regarding the inputs and valuation techniques used to measure fair value and any changes in valuation inputs or techniques. In addition, investments shall be disclosed by major category. This information is disclosed following the Fund’s Portfolio of Investments.
Foreign currency transactions and translations
The values of all assets and liabilities denominated in foreign currencies are generally translated into U.S. dollars at exchange rates determined at the close of regular trading on the New York Stock Exchange. Net realized and unrealized gains (losses) on foreign currency transactions and translations include gains (losses) arising from the fluctuation in exchange
Columbia European Equity Fund | Semiannual Report 2017
| 19 |
Notes to Financial Statements (continued)
April 30, 2017 (Unaudited)
rates between trade and settlement dates on securities transactions, gains (losses) arising from the disposition of foreign currency and currency gains (losses) between the accrual and payment dates on dividends, interest income and foreign withholding taxes.
For financial statement purposes, the Fund does not distinguish that portion of gains (losses) on investments which is due to changes in foreign exchange rates from that which is due to changes in market prices of the investments. Such fluctuations are included with the net realized and unrealized gains (losses) on investments in the Statement of Operations.
Security transactions
Security transactions are accounted for on the trade date. Cost is determined and gains (losses) are based upon the specific identification method for both financial statement and federal income tax purposes.
Income recognition
Corporate actions and dividend income are generally recorded net of any non-reclaimable tax withholdings, on the ex-dividend date or upon receipt of ex-dividend notification in the case of certain foreign securities.
Awards from class action litigation are recorded as a reduction of cost basis if the Fund still owns the applicable securities on the payment date. If the Fund no longer owns the applicable securities, the proceeds are recorded as realized gains.
Expenses
General expenses of the Trust are allocated to the Fund and other funds of the Trust based upon relative net assets or other expense allocation methodologies determined by the nature of the expense. Expenses directly attributable to the Fund are charged to the Fund. Expenses directly attributable to a specific class of shares are charged to that share class.
Determination of class net asset value
All income, expenses (other than class-specific expenses, which are charged to that share class, as shown in the Statement of Operations) and realized and unrealized gains (losses) are allocated to each class of the Fund on a daily basis, based on the relative net assets of each class, for purposes of determining the net asset value of each class.
Federal income tax status
The Fund intends to qualify each year as a regulated investment company under Subchapter M of the Internal Revenue Code, as amended, and will distribute substantially all of its taxable income (including net short-term capital gains), if any, for its tax year, and as such will not be subject to federal income taxes. In addition, the Fund intends to distribute in each calendar year substantially all of its net investment income, capital gains and certain other amounts, if any, such that the Fund should not be subject to federal excise tax. Therefore, no federal income or excise tax provision is recorded.
Foreign taxes
The Fund may be subject to foreign taxes on income, gains on investments or currency repatriation, a portion of which may be recoverable. The Fund will accrue such taxes and recoveries, as applicable, based upon its current interpretation of tax rules and regulations that exist in the markets in which it invests.
Realized gains in certain countries may be subject to foreign taxes at the Fund level, based on statutory rates. The Fund accrues for such foreign taxes on realized and unrealized gains at the appropriate rate for each jurisdiction, as applicable. The amount, if any, is disclosed as a liability on the Statement of Assets and Liabilities.
Distributions to shareholders
Distributions from net investment income, if any, are declared and paid annually. Net realized capital gains, if any, are distributed along with the income distribution. Income distributions and capital gain distributions are determined in accordance with federal income tax regulations, which may differ from GAAP.
| 20 | Columbia European Equity Fund | Semiannual Report 2017 |
Notes to Financial Statements (continued)
April 30, 2017 (Unaudited)
Guarantees and indemnifications
Under the Trust’s organizational documents and, in some cases, by contract, its officers and trustees are indemnified against certain liabilities arising out of the performance of their duties to the Trust or its funds. In addition, certain of the Fund’s contracts with its service providers contain general indemnification clauses. The Fund’s maximum exposure under these arrangements is unknown since the amount of any future claims that may be made against the Fund cannot be determined, and the Fund has no historical basis for predicting the likelihood of any such claims.
Investment company reporting modernization
In October 2016, the U.S. Securities and Exchange Commission adopted new rules and forms, and amendments to certain current rules and forms, to modernize reporting and disclosure of information by registered investment companies. The amendments to Regulation S-X will require standardized, enhanced disclosure about derivatives in investment company financial statements, and will also change the rules governing the form and content of such financial statements. The amendments to Regulation S-X take effect on August 1, 2017. At this time, management is assessing the anticipated impact of these regulatory developments.
Note 3. Fees and other transactions with affiliates
Management services fees
The Fund entered into a Management Agreement with Columbia Management Investment Advisers, LLC (the Investment Manager), a wholly-owned subsidiary of Ameriprise Financial, Inc. (Ameriprise Financial). Under the Management Agreement, the Investment Manager provides the Fund with investment research and advice, as well as administrative and accounting services. The Investment Manager is responsible for the ultimate oversight of investments made by the Fund. The Fund’s subadviser (see Subadvisory agreement below) has the primary responsibility for the day-to-day portfolio management of the Fund. The management services fee is an annual fee that is equal to a percentage of the Fund’s average daily net assets that declines from 0.88% to 0.62% as the Fund’s net assets increase. The annualized effective management services fee rate for the six months ended April 30, 2017 was 0.87% of the Fund’s average daily net assets.
Subadvisory agreement
The Investment Manager has entered into a Subadvisory Agreement with Threadneedle International Limited (Threadneedle), an affiliate of the Investment Manager and an indirect wholly-owned subsidiary of Ameriprise Financial, to serve as the subadviser to the Fund. The Investment Manager compensates Threadneedle to manage the investment of the Fund’s assets.
Other expenses
Other expenses are for, among other things, miscellaneous expenses of the Fund or the Board of Trustees, including payments to Board Services Corp., a company providing limited administrative services to the Fund and the Board of Trustees. That company’s expenses include boardroom and office expense, employee compensation, employee health and retirement benefits, and certain other expenses.
Compensation of board members
Members of the Board of Trustees, who are not officers or employees of the Investment Manager or Ameriprise Financial, are compensated for their services to the Fund as disclosed in the Statement of Operations. Under a Deferred Compensation Plan (the Plan), these members of the Board of Trustees may elect to defer payment of up to 100% of their compensation. Deferred amounts are treated as though equivalent dollar amounts had been invested in shares of certain funds managed by the Investment Manager. The Fund’s liability for these amounts is adjusted for market value changes and remains in the Fund until distributed in accordance with the Plan. All amounts payable under the Plan constitute a general unsecured obligation of the Fund.
Columbia European Equity Fund | Semiannual Report 2017
| 21 |
Notes to Financial Statements (continued)
April 30, 2017 (Unaudited)
Compensation of Chief Compliance Officer
The Board of Trustees has appointed a Chief Compliance Officer to the Fund in accordance with federal securities regulations. A portion of the Chief Compliance Officer’s total compensation is allocated to the Fund, along with other affiliated funds governed by the Board of Trustees, based on relative net assets. The total amount allocated to all affiliated funds governed by the Board of Trustees will not exceed $40,000 annually.
Transfer agency fees
Under a Transfer and Dividend Disbursing Agent Agreement, Columbia Management Investment Services Corp. (the Transfer Agent), an affiliate of the Investment Manager and a wholly-owned subsidiary of Ameriprise Financial, is responsible for providing transfer agency services to the Fund. The Transfer Agent has contracted with Boston Financial Data Services (BFDS) to serve as sub-transfer agent. The Transfer Agent pays the fees of BFDS for services as sub-transfer agent and BFDS is not entitled to reimbursement for such fees from the Fund (with the exception of out-of-pocket fees).
The Fund pays the Transfer Agent a monthly transfer agency fee based on the number or the average value of accounts, depending on the type of account. In addition, the Fund pays the Transfer Agent a fee for shareholder services based on the number of accounts or on a percentage of the average aggregate value of the Fund’s shares maintained in omnibus accounts up to the lesser of the amount charged by the financial intermediary or a cap established by the Board of Trustees from time to time.
The Transfer Agent also receives compensation from the Fund for various shareholder services and reimbursements for certain out-of-pocket fees. Effective January 1, 2017, total transfer agency fees for Class K and Class R5 shares are subject to an annual limitation of not more than 0.075% of the average daily net assets attributable to each share class. Total transfer agency fees for Class I, prior to March 27, 2017 were, and Class Y shares are subject to an annual limitation of not more than 0.025% of the average daily net assets attributable to each share class. Prior to January 1, 2017, total transfer agency fees for Class K and Class R5 shares were subject to an annual limitation of not more than 0.05% of the average daily net assets attributable to each share class and Class I and Class Y shares did not pay transfer agency fees.
For the six months ended April 30, 2017, the Fund’s annualized effective transfer agency fee rates as a percentage of average daily net assets of each class were as follows:
| | Effective rate (%) |
| Class A | 0.18 |
| Class B | 0.18 |
| Class C | 0.18 |
| Class I | 0.006 (a),(b) |
| Class K | 0.063 |
| Class R4 | 0.18 |
| Class R5 | 0.067 |
| Class T | 0.20 |
| Class Y | 0.010 |
| Class Z | 0.19 |
| (a) | Annualized. |
| (b) | Effective March 27, 2017, Class I shares were redeemed or exchanged for Class Y shares. |
An annual minimum account balance fee of $20 may apply to certain accounts with a value below the applicable share class’s initial minimum investment requirements to reduce the impact of small accounts on transfer agency fees. These minimum account balance fees are remitted to the Fund and recorded as part of expense reductions in the Statement of Operations. For the six months ended April 30, 2017, no minimum account balance fees were charged by the Fund.
Plan administration fees
Under a Plan Administration Services Agreement with the Transfer Agent, the Fund pays an annual fee at a rate of 0.25% of the Fund’s average daily net assets attributable to Class K shares for the provision of various administrative, recordkeeping, communication and educational services.
| 22 | Columbia European Equity Fund | Semiannual Report 2017 |
Notes to Financial Statements (continued)
April 30, 2017 (Unaudited)
Distribution and service fees
The Fund has an agreement with Columbia Management Investment Distributors, Inc. (the Distributor), an affiliate of the Investment Manager and a wholly-owned subsidiary of Ameriprise Financial, for distribution and shareholder services. Under a Plan and Agreement of Distribution, the Fund pays a fee at an annual rate of up to 0.25% of the Fund’s average daily net assets attributable to Class A and Class T shares and a fee at an annual rate of up to 1.00% of the Fund’s average daily net assets attributable to Class B and Class C shares. For Class B and Class C shares, of the 1.00% fee, up to 0.75% is reimbursed for distribution expenses.
The amount of distribution and shareholder services expenses incurred by the Distributor and not yet reimbursed (unreimbursed expense) was approximately $152,000 and $150,000 for Class B and Class C shares, respectively. These amounts are based on the most recent information available as of March 31, 2017, and may be recovered from future payments under the distribution plan or CDSCs. To the extent the unreimbursed expense has been fully recovered, the distribution and/or shareholder services fee is reduced.
Sales charges
Sales charges, including front-end charges and CDSCs, received by the Distributor for distributing Fund shares for the six months ended April 30, 2017, if any, are listed below:
| | Amount ($) |
| Class A | 36,438 |
| Class C | 386 |
Expenses waived/reimbursed by the Investment Manager and its affiliates
The Investment Manager and certain of its affiliates have contractually agreed to waive fees and/or reimburse expenses (excluding certain fees and expenses described below) for the periods disclosed below, unless sooner terminated at the sole discretion of the Board of Trustees, so that the Fund’s net operating expenses, after giving effect to fees waived/expenses reimbursed and any balance credits and/or overdraft charges from the Fund’s custodian, do not exceed the following annual rates as a percentage of the class’ average daily net assets:
| | March 1,2017
through
February 28, 2018 | Prior to
March 1, 2017 |
| Class A | 1.370% | 1.46% |
| Class B | 2.120 | 2.21 |
| Class C | 2.120 | 2.21 |
| Class K | 1.315 | 1.38 |
| Class R4 | 1.120 | 1.21 |
| Class R5 | 1.065 | 1.13 |
| Class T | 1.370 | 1.46 |
| Class Y | 1.015 | 1.08 |
| Class Z | 1.120 | 1.21 |
Under the agreement governing these fee waivers and/or expense reimbursement arrangements, the following fees and expenses are excluded from the waiver/reimbursement commitment, and therefore will be paid by the Fund, if applicable: taxes (including foreign transaction taxes), expenses associated with investments in affiliated and non-affiliated pooled investment vehicles (including mutual funds and exchange-traded funds), transaction costs and brokerage commissions, costs related to any securities lending program, dividend and interest expenses associated with securities sold short, inverse floater program fees and expenses, transaction charges and interest on borrowed money, interest, infrequent and/or unusual expenses and any other expenses the exclusion of which is specifically approved by the Board of Trustees. This agreement may be modified or amended only with approval from the Investment Manager, certain of its affiliates and the Fund. In addition to the contractual agreement, the Investment Manager and certain of its affiliates have voluntarily agreed to waive fees and/or reimburse Fund expenses (excluding certain fees and expenses described above) so that Fund level expenses (expenses directly attributable to the Fund and not to a specific share class) are waived proportionately across all share
Columbia European Equity Fund | Semiannual Report 2017
| 23 |
Notes to Financial Statements (continued)
April 30, 2017 (Unaudited)
classes, but the Fund’s net operating expenses shall not exceed the contractual annual rates listed in the table above. This arrangement may be revised or discontinued at any time. Any fees waived and/or expenses reimbursed under the expense reimbursement arrangements described above are not recoverable by the Investment Manager or its affiliates in future periods.
Note 4. Federal tax information
The timing and character of income and capital gain distributions are determined in accordance with income tax regulations, which may differ from GAAP because of temporary or permanent book to tax differences.
At April 30, 2017, the approximate cost of investments for federal income tax purposes and the aggregate gross approximate unrealized appreciation and depreciation based on that cost was:
Federal
tax cost ($) | Gross unrealized
appreciation ($) | Gross unrealized
(depreciation) ($) | Net unrealized
appreciation ($) |
| 339,232,000 | 46,970,000 | (3,485,000) | 43,485,000 |
Management of the Fund has concluded that there are no significant uncertain tax positions in the Fund that would require recognition in the financial statements. However, management’s conclusion may be subject to review and adjustment at a later date based on factors including, but not limited to, new tax laws, regulations, and administrative interpretations (including relevant court decisions). Generally, the Fund’s federal tax returns for the prior three fiscal years remain subject to examination by the Internal Revenue Service.
Note 5. Portfolio information
The cost of purchases and proceeds from sales of securities, excluding short-term investments and derivatives, if any, aggregated to $115,929,862 and $198,182,853, respectively, for the six months ended April 30, 2017. The amount of purchase and sale activity impacts the portfolio turnover rate reported in the Financial Highlights.
Note 6. Affiliated money market fund
The Fund invests in Columbia Short-Term Cash Fund, an affiliated money market fund established for the exclusive use by the Fund and other affiliated funds (the Affiliated MMF). The income earned by the Fund from such investments is included as Dividends - affiliated issuers in the Statement of Operations. As an investing fund, the Fund indirectly bears its proportionate share of the expenses of the Affiliated MMF. The Affiliated MMF prices its shares with a floating net asset value. In addition, the Board of Trustees of the Affiliated MMF may impose a fee on redemptions (sometimes referred to as a liquidity fee) or temporarily suspend redemptions (sometimes referred to as imposing a redemption gate) in the event its liquidity falls below regulatory limits.
Note 7. Line of credit
The Fund has access to a revolving credit facility with a syndicate of banks led by Citibank, N.A., HSBC Bank USA, N.A. and JPMorgan Chase Bank, N.A. whereby the Fund may borrow for the temporary funding of shareholder redemptions or for other temporary or emergency purposes. The credit facility agreement, which is a collective agreement between the Fund and certain other funds managed by the Investment Manager, severally and not jointly, permits collective borrowings up to $1 billion. Interest is charged to each participating fund based on its borrowings at a rate equal to the higher of (i) the overnight federal funds rate plus 1.00% or (ii) the one-month LIBOR rate plus 1.00%. Each borrowing under the credit facility matures no later than 60 days after the date of borrowing. The Fund also pays a commitment fee equal to its pro rata share of the amount of the credit facility at a rate of 0.15% per annum. The commitment fee is included in other expenses in the Statement of Operations.
The Fund had no borrowings during the six months ended April 30, 2017.
| 24 | Columbia European Equity Fund | Semiannual Report 2017 |
Notes to Financial Statements (continued)
April 30, 2017 (Unaudited)
Note 8. Significant risks
Financial sector risk
The Fund may be more susceptible to the particular risks that may affect companies in the financial services sector than if it were invested in a wider variety of companies in unrelated sectors. Companies in the financial services sector are subject to certain risks, including the risk of regulatory change, decreased liquidity in credit markets and unstable interest rates. Such companies may have concentrated portfolios, such as a high level of loans to real estate developers, which makes them vulnerable to economic conditions that affect that industry. Performance of such companies may be affected by competitive pressures and exposure to investments or agreements that, under certain circumstances, may lead to losses (e.g., subprime loans). Companies in the financial services sector are subject to extensive governmental regulation that may limit the amount and types of loans and other financial commitments they can make, and interest rates and fees that they may charge. In addition, profitability of such companies is largely dependent upon the availability and the cost of capital.
Foreign securities and emerging market countries risk
Investing in foreign securities may include certain risks and considerations not typically associated with investing in U.S. securities, such as fluctuating currency values and changing local and regional economic, political and social conditions, which may result in greater market volatility. In addition, certain foreign securities may not be as liquid as U.S. securities. Investing in emerging markets may accentuate these risks. These countries are also more likely to experience high levels of inflation, deflation or currency devaluation which could hurt their economies and securities markets. To the extent that the Fund concentrates its investment exposure to any one or a few specific countries, the Fund will be particularly susceptible to the various conditions, events or other factors impacting those countries and may, therefore, have a greater risk than that of a fund which is more geographically diversified.
Geographic concentration risk
The Fund may be particularly susceptible to economic, political, regulatory or other events or conditions affecting issuers and countries in Europe. Currency devaluations could occur in countries that have not yet experienced currency devaluation to date, or could continue to occur in countries that have already experienced such devaluations. In addition, the private and public sectors’ debt problems of a single European Union (EU) country can pose significant economic risks to the EU as a whole. As a result, the Fund’s NAV may be more volatile than the NAV of a more geographically diversified fund. If securities of issuers in Europe fall out of favor, it may cause the Fund to underperform other funds that do not concentrate in this region of the world.
Shareholder concentration risk
At April 30, 2017, affiliated shareholders of record owned 91.7% of the outstanding shares of the Fund in one or more accounts. Subscription and redemption activity by concentrated accounts may have a significant effect on the operations of the Fund. In the case of a large redemption, the Fund may be forced to sell investments at inopportune times, including its liquid or more liquid positions, resulting in Fund losses and the Fund holding a higher percentage of less liquid or illiquid securities. Large redemptions could result in decreased economies of scale and increased operating expenses for non-redeeming Fund shareholders.
Note 9. Subsequent events
Management has evaluated the events and transactions that have occurred through the date the financial statements were issued. Other than as noted in Note 1 above, there were no items requiring adjustment of the financial statements or additional disclosure.
Note 10. Information regarding pending and settled legal proceedings
Ameriprise Financial and certain of its affiliates have historically been involved in a number of legal, arbitration and regulatory proceedings, including routine litigation, class actions, and governmental actions, concerning matters arising in connection with the conduct of their business activities. Ameriprise Financial believes that the Funds are not currently the subject of, and that neither Ameriprise Financial nor any of its affiliates are the subject of, any pending legal, arbitration or regulatory proceedings that are likely to have a material adverse effect on the Funds or the ability of Ameriprise Financial or its affiliates
Columbia European Equity Fund | Semiannual Report 2017
| 25 |
Notes to Financial Statements (continued)
April 30, 2017 (Unaudited)
to perform under their contracts with the Funds. Ameriprise Financial is required to make quarterly (10-Q), annual (10-K) and, as necessary, 8-K filings with the Securities and Exchange Commission (SEC) on legal and regulatory matters that relate to Ameriprise Financial and its affiliates. Copies of these filings may be obtained by accessing the SEC website at www.sec.gov.
There can be no assurance that these matters, or the adverse publicity associated with them, will not result in increased fund redemptions, reduced sale of fund shares or other adverse consequences to the Funds. Further, although we believe proceedings are not likely to have a material adverse effect on the Funds or the ability of Ameriprise Financial or its affiliates to perform under their contracts with the Funds, these proceedings are subject to uncertainties and, as such, we are unable to estimate the possible loss or range of loss that may result. An adverse outcome in one or more of these proceedings could result in adverse judgments, settlements, fines, penalties or other relief that could have a material adverse effect on the consolidated financial condition or results of operations of Ameriprise Financial.
| 26 | Columbia European Equity Fund | Semiannual Report 2017 |
The Fund mails one shareholder report to each shareholder address. If you would like more than one report, please call shareholder services at 800.345.6611 and additional reports will be sent to you.
Proxy voting policies and procedures
The policy of the Board of Trustees is to vote the proxies of the companies in which the Fund holds investments consistent with the procedures as stated in the Statement of Additional Information (SAI). You may obtain a copy of the SAI without charge by calling 800.345.6611; contacting your financial intermediary; visiting investor.columbiathreadneedleus.com; or searching the website of the Securities and Exchange Commission (SEC) at sec.gov. Information regarding how the Fund voted proxies relating to portfolio securities is filed with the SEC by August 31st for the most recent 12-month period ending June 30th of that year, and is available without charge by visiting investor.columbiathreadneedleus.com, or searching the website of the SEC at sec.gov.
Quarterly schedule of investments
The Fund files a complete schedule of portfolio holdings with the SEC for the first and third quarters of each fiscal year on Form N-Q. The Fund’s Form N-Q is available on the SEC’s website at sec.gov and may be reviewed and copied at the SEC’s Public Reference Room in Washington, D.C. Information on the operation of the Public Reference Room may be obtained by calling 800.SEC.0330. The Fund’s complete schedule of portfolio holdings, as filed on Form N-Q, can also be obtained without charge, upon request, by calling 800.345.6611.
Additional Fund information
For more information about the Fund, please visit investor.columbiathreadneedleus.com or call 800.345.6611. Customer Service Representatives are available to answer your questions Monday through Friday from 8 a.m. to 7 p.m. Eastern time.
Fund investment manager
Columbia Management Investment Advisers, LLC
225 Franklin Street
Boston, MA 02110
Fund distributor
Columbia Management Investment Distributors, Inc.
225 Franklin Street
Boston, MA 02110
Fund transfer agent
Columbia Management Investment Services Corp.
P.O. Box 8081
Boston, MA 02266-8081
Columbia European Equity Fund | Semiannual Report 2017
| 27 |
[THIS PAGE INTENTIONALLY LEFT BLANK]
[THIS PAGE INTENTIONALLY LEFT BLANK]
Columbia European Equity Fund
P.O. Box 8081
Boston, MA 02266-8081
Please read and consider the investment objectives, risks, charges and expenses for any fund carefully before investing. For a prospectus and summary prospectus, which contains this and other important information about the Fund, go to
investor.columbiathreadneedleus.com. The Fund is distributed by Columbia Management Investment Distributors, Inc., member FINRA, and managed by Columbia Management Investment Advisers, LLC.
Columbia Threadneedle Investments (Columbia Threadneedle) is the global brand name of the Columbia and Threadneedle group of companies. All rights reserved. Columbia Management Investment Distributors, Inc., 225 Franklin Street, Boston, MA 02110-2804
© 2017 Columbia Management Investment Advisers, LLC.
investor.columbiathreadneedleus.com

SemiAnnual Report
April 30, 2017
Columbia Emerging Markets Bond Fund
Not FDIC Insured • No bank guarantee • May lose value
Dear Shareholders,
While emotions have run high following the outcome of the U.S. Presidential election, it remains unclear how the Trump presidency will unfold in terms of policy. We have a sense of the priorities espoused by the President over the past eighteen months, but campaign priorities are not always realized and are often never pursued. What seems certain is that, while some investors have already priced expectations into the market, others have retreated, preferring instead a wait and see approach. The outcome of such behaviors appears to have created conditions ripe for ongoing market volatility.
While volatility in the financial markets can be stressful, volatility itself is not a new phenomenon. Other factors that have been at the root cause of recent volatility include uncertainty following the United Kingdom’s vote to exit the European Union (Brexit), speculation around the Federal Reserve’s decision to increase interest rates, divergent central bank policy and geopolitical unrest. The point is, financial markets have fluctuated for years and may be expected to continue to fluctuate — sometimes wildly. If anything, such volatility seems to be the new normal, perhaps exacerbated by access to information and development of technological tools which have enabled investors to react rapidly to real and perceived change. So what can you do?
Position your portfolio for the reality of market volatility
That there is a historical precedent for market volatility, or even an acceptance that it may persist, offers little comfort. A measured and strategic approach remains the best strategy for investors to stay on track in achieving their investment goals.
Step 1: Review your investment goals
Take this opportunity to review your investment goals and the strategies you are pursuing to achieve those goals in order to remain focused on what’s important to you. It is entirely possible that your goals have changed in response either to your life situation or to changes in the market. Accept what you can’t control — volatility, and focus on what you can — your investment goals and strategies.
Step 2: Reassess your risk tolerance
Sit down with your financial advisor to discuss your investment goals and strategies, as well as any changes to your tolerance for risk. Consider your investment horizon. Increased market volatility and a new investment horizon may impact the strategies that can best help you achieve your investment goals. Remember, achieving your investment goals may require a certain amount of risk. Ultimately, you must maintain vigilance in reassessing your risk tolerance and the strategies you have selected in pursuit of your investment goals, and awareness of how those strategies may react to market volatility.
Step 3: Remain calm and focus on your long-term plan
Remember, investing is about the long game. Short term events are not necessarily evidence of a longer term reality. Investors who attempt to time the market too often end up reacting to a down turn by selling low and then compounding the problem by waiting on the sidelines, ultimately missing the right opportunity to reinvest.
Columbia Emerging Markets Bond Fund | Semiannual Report 2017
President’s Message (continued)
As long as there is a market, there will be volatility. How you respond to that volatility can make a big difference in the measure of your success as an investor. Talk to your financial advisor about how working with Columbia Threadneedle Investments may help you position your portfolio for the reality of ongoing volatility and, perhaps, even turn such volatility into investment opportunity.
Sincerely,
Christopher O. Petersen
President, Columbia Funds
Investors should consider the investment objectives, risks, charges and expenses of a mutual fund carefully before investing. For a free prospectus and summary prospectus, which contains this and other important information about a fund, visit investor.columbiathreadneedleus.com. The prospectus should be read carefully before investing.
Columbia Funds are distributed by Columbia Management Investment Distributors, Inc., member FINRA, and managed by Columbia Management Investment Advisers, LLC.
© 2017 Columbia Management Investment Advisers, LLC. All rights reserved.
Columbia Emerging Markets Bond Fund | Semiannual Report 2017
Columbia Emerging Markets Bond Fund | Semiannual Report 2017
Fund at a Glance
(Unaudited)
Investment objective
Columbia Emerging Markets Bond Fund (the Fund) seeks to provide shareholders with high total return through current income and, secondarily, through capital appreciation.
Portfolio management
Jim Carlen, CFA
Lead manager
Managed Fund since 2008
Christopher Cooke
Co-manager
Managed Fund since May 2017
| Average annual total returns (%) (for the period ended April 30, 2017) |
| | | Inception | 6 Months
cumulative | 1 Year | 5 Years | 10 Years |
| Class A | Excluding sales charges | 02/16/06 | 3.53 | 11.21 | 4.31 | 6.55 |
| | Including sales charges | | -1.39 | 5.97 | 3.30 | 6.03 |
| Class B | Excluding sales charges | 02/16/06 | 3.15 | 10.40 | 3.53 | 5.74 |
| | Including sales charges | | -1.85 | 5.40 | 3.18 | 5.74 |
| Class C | Excluding sales charges | 02/16/06 | 3.16 | 10.45 | 3.53 | 5.77 |
| | Including sales charges | | 2.16 | 9.45 | 3.53 | 5.77 |
| Class K | 02/16/06 | 3.74 | 11.56 | 4.53 | 6.78 |
| Class R * | 11/16/11 | 3.49 | 11.03 | 4.06 | 6.34 |
| Class R4 * | 03/19/13 | 3.74 | 11.57 | 4.54 | 6.66 |
| Class R5 * | 11/08/12 | 3.85 | 11.81 | 4.73 | 6.76 |
| Class T | Excluding sales charges | 12/01/06 | 3.54 | 11.23 | 4.30 | 6.54 |
| | Including sales charges | | 0.93 | 8.45 | 3.78 | 6.27 |
| Class Y * | 11/08/12 | 3.79 | 11.77 | 4.78 | 6.78 |
| Class Z * | 09/27/10 | 3.65 | 11.58 | 4.56 | 6.74 |
| JPMorgan Emerging Markets Bond Index-Global | | 2.65 | 8.52 | 5.22 | 6.99 |
Returns for Class A are shown with and without the maximum initial sales charge of 4.75%. Returns for Class B are shown with and without the applicable contingent deferred sales charge (CDSC) of 5.00% in the first year, declining to 1.00% in the sixth year and eliminated thereafter. The Fund does not accept new investments in Class B shares, except for certain limited transactions. The Fund’s current Class B investors, having held their shares for the requisite time period, are no longer subject to a CDSC upon redemption of their shares. Returns for Class C are shown with and without the 1.00% CDSC for the first year only. The returns for Class T shares are shown with and without the maximum applicable sales charge of 2.50% per transaction. Prior to March 27, 2017, Class T shares were known as Class W shares and were sold without a sales charge. The Fund’s other classes are not subject to sales charges and have limited eligibility. Please see the Fund’s prospectus for details. Performance for different share classes will vary based on differences in sales charges and fees associated with each class. All results shown assume reinvestment of distributions during the period. Returns do not reflect the deduction of taxes that a shareholder may pay on Fund distributions or on the redemption of Fund shares. Performance results reflect the effect of any fee waivers or reimbursements of Fund expenses by Columbia Management Investment Advisers, LLC and/or any of its affiliates. Absent these fee waivers or expense reimbursement arrangements, performance results would have been lower.
The performance information shown represents past performance and is not a guarantee of future results. The investment return and principal value of your investment will fluctuate so that your shares, when redeemed, may be worth more or less than their original cost. Current performance may be lower or higher than the performance information shown. You may obtain performance information current to the most recent month-end by contacting your financial intermediary, visiting investor.columbiathreadneedleus.com or calling 800.345.6611.
| * | The returns shown for periods prior to the share class inception date (including returns for the Life of the Fund, if shown, which are since Fund inception) include the returns of the Fund’s oldest share class. Since the Fund launched more than one share class at its inception, Class A shares were used. These returns are adjusted to reflect any higher class-related operating expenses of the newer share classes, as applicable. Please visit investor.columbiathreadneedleus.com/investment-products/mutual-funds/appended-performance for more information. |
The JPMorgan Emerging Markets Bond Index-Global is based on U.S. dollar-denominated debt instruments issued by emerging market sovereign and quasi-sovereign entities, such as Brady bonds, Eurobonds and loans, and reflects reinvestment of all distributions and changes in market prices.
Indices are not available for investment, are not professionally managed and do not reflect sales charges, fees, brokerage commissions, taxes or other expenses of investing. Securities in the Fund may not match those in an index.
Columbia Emerging Markets Bond Fund | Semiannual Report 2017
| 3 |
Fund at a Glance (continued)
(Unaudited)
| Quality breakdown (%) (at April 30, 2017) |
| AA rating | 1.6 |
| A rating | 3.7 |
| BBB rating | 24.0 |
| BB rating | 37.4 |
| B rating | 28.7 |
| CCC rating | 1.0 |
| CC rating | 3.6 |
| Total | 100.0 |
Percentages indicated are based upon total fixed income investments (excluding Money Market Funds).
Bond ratings apply to the underlying holdings of the Fund and not the Fund itself and are divided into categories ranging from highest to lowest credit quality, determined by using the middle rating of Moody’s, S&P and Fitch, after dropping the highest and lowest available ratings. When ratings are available from only two rating agencies, the lower rating is used. When a rating is available from only one rating agency, that rating is used. When a bond is not rated by any rating agency, it is designated as “Not rated.” Credit quality ratings assigned by a rating agency are subjective opinions, not statements of fact, and are subject to change, including daily. The ratings assigned by credit rating agencies are but one of the considerations that the Investment Manager and/or Fund’s subadviser incorporates into its credit analysis process, along with such other country-specific factors as the direction and stance of fiscal policy, balance of payment trends and commodity prices, the level and structure of public debt as well as political stability and commitment to strong macroeconomic policies.
| Country breakdown (%) (at April 30, 2017) |
| Angola | 0.5 |
| Argentina | 7.2 |
| Brazil | 7.5 |
| Chile | 1.0 |
| Colombia | 3.1 |
| Costa Rica | 1.8 |
| Croatia | 1.3 |
| Dominican Republic | 7.1 |
| Ecuador | 1.9 |
| Egypt | 1.1 |
| El Salvador | 0.9 |
| Gabon | 0.7 |
| Georgia | 0.6 |
| Ghana | 2.3 |
| Guatemala | 2.0 |
| Honduras | 0.7 |
| Hungary | 1.0 |
| Indonesia | 6.9 |
| Ivory Coast | 2.3 |
| Jamaica | 0.7 |
| Kazakhstan | 1.4 |
| Mexico | 14.3 |
| Namibia | 0.4 |
| Nigeria | 0.5 |
| Pakistan | 1.0 |
| Panama | 0.7 |
| Paraguay | 1.0 |
| Peru | 2.9 |
| Russian Federation | 5.3 |
| Senegal | 0.7 |
| Serbia | 0.9 |
| Sri Lanka | 0.6 |
| Trinidad and Tobago | 1.5 |
| Tunisia | 0.2 |
| Turkey | 5.1 |
| Ukraine | 1.7 |
| United States | 5.2 (a) |
| Uruguay | 0.6 |
| Venezuela | 3.4 |
| Virgin Islands | 1.5 |
| Zambia | 0.5 |
| Total | 100.0 |
| (a) | Includes investments in Money Market Funds. |
Country breakdown is based primarily on issuer’s place of organization/incorporation. Percentages indicated are based upon total investments. The Fund’s portfolio composition is subject to change.
| 4 | Columbia Emerging Markets Bond Fund | Semiannual Report 2017 |
Understanding Your Fund’s Expenses
(Unaudited)
As an investor, you incur two types of costs. There are transaction costs, which generally include sales charges on purchases and may include redemption fees. There are also ongoing costs, which generally include management fees, distribution and/or service fees, and other fund expenses. The following information is intended to help you understand your ongoing costs (in dollars) of investing in the Fund and to help you compare these costs with the ongoing costs of investing in other mutual funds.
Analyzing your Fund’s expenses
To illustrate these ongoing costs, we have provided examples and calculated the expenses paid by investors in each share class of the Fund during the period. The actual and hypothetical information in the table is based on an initial investment of $1,000 at the beginning of the period indicated and held for the entire period. Expense information is calculated two ways and each method provides you with different information. The amount listed in the “Actual” column is calculated using the Fund’s actual operating expenses and total return for the period. You may use the Actual information, together with the amount invested, to estimate the expenses that you paid over the period. Simply divide your account value by $1,000 (for example, an $8,600 account value divided by $1,000 = 8.6), then multiply the results by the expenses paid during the period under the “Actual” column. The amount listed in the “Hypothetical” column assumes a 5% annual rate of return before expenses (which is not the Fund’s actual return) and then applies the Fund’s actual expense ratio for the period to the hypothetical return. You should not use the hypothetical account values and expenses to estimate either your actual account balance at the end of the period or the expenses you paid during the period. See “Compare with other funds” below for details on how to use the hypothetical data.
Compare with other funds
Since all mutual funds are required to include the same hypothetical calculations about expenses in shareholder reports, you can use this information to compare the ongoing cost of investing in the Fund with other funds. To do so, compare the hypothetical example with the 5% hypothetical examples that appear in the shareholder reports of other funds. As you compare hypothetical examples of other funds, it is important to note that hypothetical examples are meant to highlight the ongoing costs of investing in a fund only and do not reflect any transaction costs, such as sales charges, or redemption or exchange fees. Therefore, the hypothetical calculations are useful in comparing ongoing costs only, and will not help you determine the relative total costs of owning different funds. If transaction costs were included in these calculations, your costs would be higher.
| November 1, 2016 — April 30, 2017 |
| | Account value at the
beginning of the
period ($) | Account value at the
end of the
period ($) | Expenses paid during
the period ($) | Fund’s annualized
expense ratio (%) |
| | Actual | Hypothetical | Actual | Hypothetical | Actual | Hypothetical | Actual |
| Class A | 1,000.00 | 1,000.00 | 1,035.30 | 1,018.64 | 5.99 | 5.94 | 1.20 |
| Class B | 1,000.00 | 1,000.00 | 1,031.50 | 1,014.96 | 9.71 | 9.63 | 1.95 |
| Class C | 1,000.00 | 1,000.00 | 1,031.60 | 1,014.96 | 9.71 | 9.63 | 1.95 |
| Class K | 1,000.00 | 1,000.00 | 1,037.40 | 1,019.76 | 4.85 | 4.80 | 0.97 |
| Class R | 1,000.00 | 1,000.00 | 1,034.90 | 1,017.41 | 7.24 | 7.17 | 1.45 |
| Class R4 | 1,000.00 | 1,000.00 | 1,037.40 | 1,019.86 | 4.75 | 4.71 | 0.95 |
| Class R5 | 1,000.00 | 1,000.00 | 1,038.50 | 1,020.89 | 3.70 | 3.67 | 0.74 |
| Class T (formerly Class W) | 1,000.00 | 1,000.00 | 1,035.40 | 1,018.64 | 5.99 | 5.94 | 1.20 |
| Class Y | 1,000.00 | 1,000.00 | 1,037.90 | 1,021.19 | 3.40 | 3.37 | 0.68 |
| Class Z | 1,000.00 | 1,000.00 | 1,036.50 | 1,019.86 | 4.74 | 4.71 | 0.95 |
Expenses paid during the period are equal to the annualized expense ratio for each class as indicated above, multiplied by the average account value over the period and then multiplied by the number of days in the Fund’s most recent fiscal half year and divided by 365.
Expenses do not include fees and expenses incurred indirectly by the Fund from its investment in underlying funds, including affiliated and non-affiliated pooled investment vehicles, such as mutual funds and exchange-traded funds.
Had Columbia Management Investment Advisers, LLC and/or certain of its affiliates not waived/reimbursed certain fees and expenses, account value at the end of the period would have been reduced.
Columbia Emerging Markets Bond Fund | Semiannual Report 2017
| 5 |
Portfolio of Investments
April 30, 2017 (Unaudited)
(Percentages represent value of investments compared to net assets)
| Corporate Bonds & Notes(a) 16.8% |
| Issuer | Coupon
Rate | | Principal
Amount ($) | Value ($) |
| Brazil 1.0% |
| MARB BondCo PLC(b) |
| 03/15/24 | 7.000% | | 1,600,000 | 1,617,920 |
| Marfrig Holdings Europe BV(b) |
| 06/08/23 | 8.000% | | 2,400,000 | 2,546,976 |
| Total | 4,164,896 |
| Chile 1.0% |
| Cencosud SA(b) |
| 02/12/45 | 6.625% | | 4,350,000 | 4,559,839 |
| Colombia 0.9% |
| Banco de Bogota SA(b) |
| Subordinated |
| 05/12/26 | 6.250% | | 3,800,000 | 4,047,258 |
| Ghana 1.5% |
| Kosmos Energy Ltd.(b) |
| 08/01/21 | 7.875% | | 3,160,000 | 3,223,200 |
| 08/01/21 | 7.875% | | 3,076,000 | 3,152,900 |
| Total | 6,376,100 |
| Guatemala 2.0% |
| Comcel Trust(b) |
| 02/06/24 | 6.875% | | 3,300,000 | 3,497,274 |
| Comcel Trust via Comunicaciones Celulares SA(b) |
| 02/06/24 | 6.875% | | 200,000 | 211,956 |
| Energuate Trust(b),(c) |
| 05/03/27 | 5.875% | | 2,100,000 | 2,133,495 |
| Industrial Senior Trust(b) |
| 11/01/22 | 5.500% | | 2,877,000 | 2,916,559 |
| Total | 8,759,284 |
| Mexico 5.8% |
| Banco Mercantil del Norte SA(b),(d) |
| Subordinated |
| 10/04/31 | 5.750% | | 3,000,000 | 2,946,000 |
| BBVA Bancomer SA(b),(d) |
| Subordinated |
| 11/12/29 | 5.350% | | 3,402,000 | 3,317,317 |
| Cemex SAB de CV(b) |
| 04/16/26 | 7.750% | | 3,700,000 | 4,204,310 |
| Concesionaria Mexiquense SA de CV(b) |
| (linked to Mexican Unidad de Inversion Index) |
| 12/15/35 | 5.950% | MXN | 45,997,960 | 2,339,549 |
| Elementia SAB de CV(b) |
| 01/15/25 | 5.500% | | 3,700,000 | 3,755,500 |
| Grupo Posadas SAB de CV(b) |
| 06/30/22 | 7.875% | | 5,224,000 | 5,400,310 |
| Corporate Bonds & Notes(a) (continued) |
| Issuer | Coupon
Rate | | Principal
Amount ($) | Value ($) |
| Grupo Televisa SAB |
| 05/14/43 | 7.250% | MXN | 59,800,000 | 2,410,189 |
| Mexichem SAB de CV(b) |
| 09/19/42 | 6.750% | | 1,000,000 | 1,072,500 |
| Total | 25,445,675 |
| Panama 0.7% |
| Panama Canal Railway Co.(b) |
| 11/01/26 | 7.000% | | 3,227,874 | 3,211,735 |
| Peru 1.1% |
| Banco de Credito del Peru(b),(d) |
| Subordinated |
| 10/15/22 | 7.170% | PEN | 6,000,000 | 1,804,393 |
| Volcan Cia Minera SAA(b) |
| 02/02/22 | 5.375% | | 3,000,000 | 3,033,750 |
| Total | 4,838,143 |
| Russian Federation 0.5% |
| Lukoil International Finance BV(b) |
| 11/02/26 | 4.750% | | 2,100,000 | 2,149,665 |
| Ukraine 1.7% |
| Kernel Holding SA(b) |
| 01/31/22 | 8.750% | | 3,700,000 | 3,935,231 |
| MHP SA(b) |
| 04/02/20 | 8.250% | | 3,204,000 | 3,336,165 |
| Total | 7,271,396 |
| Uruguay 0.6% |
| ACI Airport SudAmerica SA(b) |
| 11/29/32 | 6.875% | | 2,481,250 | 2,462,641 |
Total Corporate Bonds & Notes
(Cost $74,428,996) | 73,286,632 |
|
| Foreign Government Obligations(a),(e) 78.3% |
| | | | |
| Angola 0.5% |
| Angolan Government International Bond(b) |
| 11/12/25 | 9.500% | | 2,200,000 | 2,301,750 |
| Argentina 7.2% |
| Argentine Republic Government International Bond |
| 04/22/26 | 7.500% | | 2,200,000 | 2,410,100 |
| 01/26/27 | 6.875% | | 2,491,000 | 2,631,742 |
| 07/06/28 | 6.625% | | 1,100,000 | 1,125,300 |
| 12/31/33 | 8.280% | | 4,065,910 | 4,460,303 |
| 07/06/36 | 7.125% | | 1,500,000 | 1,518,000 |
| Provincia de Buenos Aires(b) |
| 06/09/21 | 9.950% | | 1,500,000 | 1,732,800 |
| 06/15/27 | 7.875% | | 6,665,000 | 6,957,793 |
The accompanying Notes to Financial Statements are an integral part of this statement.
| 6 | Columbia Emerging Markets Bond Fund | Semiannual Report 2017 |
Portfolio of Investments (continued)
April 30, 2017 (Unaudited)
| Foreign Government Obligations(a),(e) (continued) |
| Issuer | Coupon
Rate | | Principal
Amount ($) | Value ($) |
| Provincia de Cordoba(b) |
| 06/10/21 | 7.125% | | 3,100,000 | 3,270,500 |
| 09/01/24 | 7.450% | | 5,125,000 | 5,331,384 |
| YPF SA(b) |
| 03/23/21 | 8.500% | | 1,700,000 | 1,908,250 |
| Total | 31,346,172 |
| Brazil 6.6% |
| Brazil Notas do Tesouro Nacional Series F |
| 01/01/25 | 10.000% | BRL | 20,000,000 | 6,429,833 |
| Brazilian Government International Bond |
| 01/07/41 | 5.625% | | 8,000,000 | 7,950,000 |
| Petrobras Global Finance BV |
| 01/27/21 | 5.375% | | 3,987,000 | 4,091,659 |
| 05/23/21 | 8.375% | | 5,200,000 | 5,882,500 |
| 05/23/26 | 8.750% | | 3,800,000 | 4,430,800 |
| Total | 28,784,792 |
| Colombia 2.2% |
| Colombia Government International Bond |
| 08/26/26 | 7.500% | COP | 6,500,000,000 | 2,404,638 |
| 02/26/44 | 5.625% | | 3,500,000 | 3,823,750 |
| Ecopetrol SA |
| 09/18/43 | 7.375% | | 3,200,000 | 3,472,000 |
| Total | 9,700,388 |
| Costa Rica 1.8% |
| Costa Rica Government International Bond(b) |
| 03/12/45 | 7.158% | | 7,600,000 | 7,923,000 |
| Croatia 1.3% |
| Croatia Government International Bond(b) |
| 01/26/24 | 6.000% | | 5,117,000 | 5,696,244 |
| Dominican Republic 7.1% |
| Banco de Reservas de la Republica Dominicana(b) |
| Subordinated |
| 02/01/23 | 7.000% | | 5,988,000 | 6,149,856 |
| Dominican Republic International Bond(b) |
| 07/05/19 | 14.500% | DOP | 109,000,000 | 2,512,223 |
| 01/08/21 | 14.000% | DOP | 226,239,000 | 5,288,491 |
| 01/25/27 | 5.950% | | 3,300,000 | 3,456,750 |
| 04/20/27 | 8.625% | | 4,320,000 | 5,152,593 |
| 04/30/44 | 7.450% | | 6,000,000 | 6,780,000 |
| 01/27/45 | 6.850% | | 1,800,000 | 1,914,750 |
| Total | 31,254,663 |
| Foreign Government Obligations(a),(e) (continued) |
| Issuer | Coupon
Rate | | Principal
Amount ($) | Value ($) |
| Ecuador 1.9% |
| Ecuador Government International Bond(b) |
| 03/24/20 | 10.500% | | 3,800,000 | 4,066,000 |
| 03/28/22 | 10.750% | | 2,500,000 | 2,707,400 |
| 12/13/26 | 9.650% | | 1,500,000 | 1,526,250 |
| Total | 8,299,650 |
| Egypt 1.1% |
| Egypt Government International Bond(b) |
| 01/31/22 | 6.125% | | 500,000 | 520,245 |
| 01/31/27 | 7.500% | | 2,400,000 | 2,589,000 |
| 01/31/47 | 8.500% | | 1,500,000 | 1,635,000 |
| Total | 4,744,245 |
| El Salvador 0.9% |
| El Salvador Government International Bond(b) |
| 01/18/27 | 6.375% | | 500,000 | 446,250 |
| 04/10/32 | 8.250% | | 959,000 | 925,435 |
| 06/15/35 | 7.650% | | 2,836,000 | 2,580,760 |
| Total | 3,952,445 |
| Gabon 0.7% |
| Gabon Government International Bond(b) |
| 12/12/24 | 6.375% | | 3,279,527 | 3,211,477 |
| Georgia 0.6% |
| Georgian Railway JSC(b) |
| 07/11/22 | 7.750% | | 2,372,000 | 2,606,235 |
| Ghana 0.8% |
| Ghana Government International Bond(b) |
| 10/14/30 | 10.750% | | 2,900,000 | 3,498,850 |
| Honduras 0.7% |
| Honduras Government International Bond(b) |
| 03/15/24 | 7.500% | | 1,432,000 | 1,586,842 |
| 01/19/27 | 6.250% | | 1,500,000 | 1,553,475 |
| Total | 3,140,317 |
| Hungary 1.0% |
| Hungary Government International Bond |
| 03/29/41 | 7.625% | | 2,940,000 | 4,344,556 |
| Indonesia 6.9% |
| Indonesia Government International Bond(b) |
| 01/15/24 | 5.875% | | 3,200,000 | 3,646,970 |
| 01/17/38 | 7.750% | | 3,548,000 | 4,880,384 |
| 01/17/38 | 7.750% | | 1,700,000 | 2,338,403 |
| 01/17/42 | 5.250% | | 1,000,000 | 1,077,665 |
| 01/15/45 | 5.125% | | 1,000,000 | 1,061,107 |
The accompanying Notes to Financial Statements are an integral part of this statement.
Columbia Emerging Markets Bond Fund | Semiannual Report 2017
| 7 |
Portfolio of Investments (continued)
April 30, 2017 (Unaudited)
| Foreign Government Obligations(a),(e) (continued) |
| Issuer | Coupon
Rate | | Principal
Amount ($) | Value ($) |
| PT Pertamina Persero(b) |
| 05/27/41 | 6.500% | | 1,000,000 | 1,125,000 |
| 05/03/42 | 6.000% | | 3,000,000 | 3,187,698 |
| 05/30/44 | 6.450% | | 755,000 | 851,681 |
| PT Perusahaan Listrik Negara(b) |
| 11/22/21 | 5.500% | | 11,103,000 | 12,119,146 |
| Total | 30,288,054 |
| Ivory Coast 2.3% |
| Ivory Coast Government International Bond(b) |
| 07/23/24 | 5.375% | | 2,000,000 | 1,947,292 |
| 03/03/28 | 6.375% | | 6,077,000 | 6,109,087 |
| Ivory Coast Government International Bond(b),(d) |
| 12/31/32 | 5.750% | | 2,058,000 | 1,973,622 |
| Total | 10,030,001 |
| Jamaica 0.7% |
| Jamaica Government International Bond |
| 03/15/39 | 8.000% | | 1,000,000 | 1,161,960 |
| 07/28/45 | 7.875% | | 1,600,000 | 1,854,144 |
| Total | 3,016,104 |
| Kazakhstan 1.4% |
| Kazakhstan Government International Bond(b) |
| 07/21/25 | 5.125% | | 2,850,000 | 3,110,062 |
| 07/21/45 | 6.500% | | 2,400,000 | 2,853,936 |
| Total | 5,963,998 |
| Mexico 8.5% |
| Comision Federal de Electricidad(b) |
| 06/16/45 | 6.125% | | 3,700,000 | 3,820,250 |
| Mexican Bonos |
| 06/10/21 | 6.500% | MXN | 37,100,000 | 1,932,032 |
| 06/09/22 | 6.500% | MXN | 105,338,800 | 5,458,802 |
| Petroleos Mexicanos(b) |
| 11/24/21 | 7.650% | MXN | 54,300,000 | 2,729,242 |
| 09/12/24 | 7.190% | MXN | 3,440,000 | 161,079 |
| 03/13/27 | 6.500% | | 2,880,000 | 3,117,600 |
| Petroleos Mexicanos |
| 08/04/26 | 6.875% | | 2,500,000 | 2,793,750 |
| 11/12/26 | 7.470% | MXN | 50,100,000 | 2,399,179 |
| 06/02/41 | 6.500% | | 5,453,000 | 5,461,180 |
| 01/23/45 | 6.375% | | 6,300,000 | 6,149,380 |
| 09/21/47 | 6.750% | | 3,000,000 | 3,048,900 |
| Total | 37,071,394 |
| Namibia 0.4% |
| Namibia International Bonds(b) |
| 11/03/21 | 5.500% | | 1,500,000 | 1,591,875 |
| Foreign Government Obligations(a),(e) (continued) |
| Issuer | Coupon
Rate | | Principal
Amount ($) | Value ($) |
| Nigeria 0.5% |
| Nigeria Government International Bond(b) |
| 02/16/32 | 7.875% | | 2,000,000 | 2,172,500 |
| Pakistan 1.0% |
| Pakistan Government International Bond(b) |
| 04/15/24 | 8.250% | | 2,600,000 | 2,893,517 |
| 03/31/36 | 7.875% | | 1,500,000 | 1,521,592 |
| Total | 4,415,109 |
| Paraguay 1.0% |
| Paraguay Government International Bond(b) |
| 03/27/27 | 4.700% | | 1,212,000 | 1,235,028 |
| 08/11/44 | 6.100% | | 2,900,000 | 3,124,750 |
| Total | 4,359,778 |
| Peru 1.8% |
| Peruvian Government International Bond(b) |
| 08/12/28 | 6.350% | PEN | 24,650,000 | 7,973,013 |
| Russian Federation 4.9% |
| Gazprom Neft OAO Via GPN Capital SA(b) |
| 09/19/22 | 4.375% | | 5,579,000 | 5,648,738 |
| Gazprom OAO Via Gaz Capital SA(b) |
| 03/07/22 | 6.510% | | 2,005,000 | 2,231,677 |
| 03/07/22 | 6.510% | | 1,800,000 | 2,003,501 |
| 02/06/28 | 4.950% | | 6,000,000 | 6,030,000 |
| 08/16/37 | 7.288% | | 2,829,000 | 3,358,368 |
| Sberbank of Russia Via SB Capital SA(b) |
| Subordinated |
| 10/29/22 | 5.125% | | 1,201,000 | 1,243,616 |
| Vnesheconombank Via VEB Finance PLC(b) |
| 11/21/23 | 5.942% | | 700,000 | 750,308 |
| Total | 21,266,208 |
| Senegal 0.7% |
| Senegal Government International Bond(b) |
| 07/30/24 | 6.250% | | 2,796,000 | 2,855,415 |
| Serbia 0.9% |
| Serbia International Bond(b) |
| 12/03/18 | 5.875% | | 1,125,000 | 1,182,656 |
| 09/28/21 | 7.250% | | 2,500,000 | 2,878,750 |
| Total | 4,061,406 |
| Sri Lanka 0.6% |
| Sri Lanka Government International Bond(b) |
| 07/18/26 | 6.825% | | 2,615,000 | 2,745,996 |
The accompanying Notes to Financial Statements are an integral part of this statement.
| 8 | Columbia Emerging Markets Bond Fund | Semiannual Report 2017 |
Portfolio of Investments (continued)
April 30, 2017 (Unaudited)
| Foreign Government Obligations(a),(e) (continued) |
| Issuer | Coupon
Rate | | Principal
Amount ($) | Value ($) |
| Trinidad and Tobago 1.5% |
| Petroleum Co. of Trinidad & Tobago Ltd.(b) |
| 08/14/19 | 9.750% | | 6,014,000 | 6,389,875 |
| Tunisia 0.2% |
| Banque Centrale de Tunisie International Bond(b) |
| 01/30/25 | 5.750% | | 1,000,000 | 981,250 |
| Turkey 5.2% |
| Export Credit Bank of Turkey(b) |
| 04/24/19 | 5.875% | | 1,517,000 | 1,583,369 |
| 09/23/21 | 5.000% | | 2,250,000 | 2,278,125 |
| Turkey Government International Bond |
| 03/23/23 | 3.250% | | 1,500,000 | 1,404,375 |
| 02/05/25 | 7.375% | | 2,868,000 | 3,327,195 |
| 03/25/27 | 6.000% | | 7,500,000 | 8,025,000 |
| 03/17/36 | 6.875% | | 2,794,000 | 3,166,301 |
| 05/30/40 | 6.750% | | 2,473,000 | 2,782,125 |
| Total | 22,566,490 |
| Venezuela 3.4% |
| Petroleos de Venezuela SA(b) |
| 11/17/21 | 9.000% | | 4,698,939 | 2,474,931 |
| 05/16/24 | 6.000% | | 28,227,059 | 11,159,003 |
| 11/15/26 | 6.000% | | 3,772,636 | 1,439,261 |
| Total | 15,073,195 |
| Foreign Government Obligations(a),(e) (continued) |
| Issuer | Coupon
Rate | | Principal
Amount ($) | Value ($) |
| Virgin Islands 1.5% |
| State Grid Overseas Investment 2016 Ltd.(b),(c) |
| 05/04/27 | 3.500% | | 6,600,000 | 6,584,134 |
| Zambia 0.5% |
| Zambia Government International Bond(b) |
| 07/30/27 | 8.970% | | 1,950,000 | 2,079,187 |
Total Foreign Government Obligations
(Cost $330,139,011) | 342,289,766 |
| Money Market Funds 5.2% |
| | Shares | Value ($) |
| Columbia Short-Term Cash Fund, 0.869%(f),(g) | 22,930,990 | 22,930,990 |
Total Money Market Funds
(Cost $22,930,281) | 22,930,990 |
Total Investments
(Cost $427,498,288) | 438,507,388 |
| Other Assets & Liabilities, Net | | (1,246,807) |
| Net Assets | $437,260,581 |
At April 30, 2017, securities and/or cash totaling $85,644 were pledged as collateral.
Investments in derivatives
| Forward foreign currency exchange contracts open at April 30, 2017 |
| Counterparty | Exchange
date | Currency to
be delivered | Currency to
be received | Unrealized
appreciation ($) | Unrealized
depreciation ($) |
| Barclays | 5/15/2017 | 175,000,000 MXN | 9,284,509 USD | 10,827 | — |
| Barclays | 5/15/2017 | 9,066,277 USD | 175,000,000 MXN | 207,405 | — |
| Citi | 5/15/2017 | 16,349,972,000 COP | 5,668,217 USD | 122,993 | — |
| Citi | 5/15/2017 | 558,866 USD | 1,600,000,000 COP | — | (16,213) |
| Total | | | | 341,225 | (16,213) |
Futures contracts outstanding at April 30, 2017
| Long futures contracts outstanding |
| Contract description | Number of
contracts | Trading
currency | Notional market
value ($) | Expiration date | Unrealized
appreciation ($) | Unrealized
depreciation ($) |
| U.S. Ultra Bond | 28 | USD | 4,562,250 | 06/2017 | 85,644 | — |
The accompanying Notes to Financial Statements are an integral part of this statement.
Columbia Emerging Markets Bond Fund | Semiannual Report 2017
| 9 |
Portfolio of Investments (continued)
April 30, 2017 (Unaudited)
Notes to Portfolio of Investments
| (a) | Principal amounts are denominated in United States Dollars unless otherwise noted. |
| (b) | Represents privately placed and other securities and instruments exempt from SEC registration (collectively, private placements), such as Section 4(a)(2) and Rule 144A eligible securities, which are often sold only to qualified institutional buyers. The Fund may invest in private placements determined to be liquid as well as those determined to be illiquid. Private placements may be determined to be liquid under guidelines established by the Fund’s Board of Trustees. At April 30, 2017, the value of these securities amounted to $309,226,705 or 70.72% of net assets. |
| (c) | Represents a security purchased on a when-issued basis. |
| (d) | Variable rate security. |
| (e) | Principal and interest may not be guaranteed by the government. |
| (f) | The rate shown is the seven-day current annualized yield at April 30, 2017. |
| (g) | As defined in the Investment Company Act of 1940, an affiliated company is one in which the Fund owns 5% or more of the company’s outstanding voting securities, or a company which is under common ownership or control with the Fund. Holdings and transactions in these affiliated companies during the period ended April 30, 2017 are as follows: |
| Issuer | Beginning
shares | Shares
purchased | Shares
sold | Ending
shares | Realized gain
(loss) ($) | Dividends —
affiliated
issuers ($) | Value ($) |
| Columbia Short-Term Cash Fund, 0.869% | 26,206,367 | 79,050,096 | (82,325,473) | 22,930,990 | (488) | 70,228 | 22,930,990 |
Currency Legend
| BRL | Brazilian Real |
| COP | Colombian Peso |
| DOP | Dominican Republic Peso |
| MXN | Mexican Peso |
| PEN | Peruvian New Sol |
| USD | US Dollar |
Fair value measurements
The Fund categorizes its fair value measurements according to a three-level hierarchy that maximizes the use of observable inputs and minimizes the use of unobservable inputs by prioritizing that the most observable input be used when available. Observable inputs are those that market participants would use in pricing an investment based on market data obtained from sources independent of the reporting entity. Unobservable inputs are those that reflect the Fund’s assumptions about the information market participants would use in pricing an investment. An investment’s level within the fair value hierarchy is based on the lowest level of any input that is deemed significant to the asset’s or liability’s fair value measurement. The input levels are not necessarily an indication of the risk or liquidity associated with investments at that level. For example, certain U.S. government securities are generally high quality and liquid, however, they are reflected as Level 2 because the inputs used to determine fair value may not always be quoted prices in an active market.
Fair value inputs are summarized in the three broad levels listed below:
| • | Level 1 – Valuations based on quoted prices for investments in active markets that the Fund has the ability to access at the measurement date (including NAV for open-end mutual funds). Valuation adjustments are not applied to Level 1 investments. |
| • | Level 2 – Valuations based on other significant observable inputs (including quoted prices for similar securities, interest rates, prepayment speeds, credit risks, etc.). |
| • | Level 3 – Valuations based on significant unobservable inputs (including the Fund’s own assumptions and judgment in determining the fair value of investments). |
Inputs that are used in determining fair value of an investment may include price information, credit data, volatility statistics, and other factors. These inputs can be either observable or unobservable. The availability of observable inputs can vary between investments, and is affected by various factors such as the type of investment, and the volume and level of activity for that investment or similar investments in the marketplace. The inputs will be considered by the Investment Manager, along with any other relevant factors in the calculation of an investment’s fair value. The Fund uses prices and inputs that are current as of the measurement date, which may include periods of market dislocations. During these periods, the availability of prices and inputs may be reduced for many investments. This condition could cause an investment to be reclassified between the various levels within the hierarchy.
Certain investments that have been measured at fair value using the net asset value (NAV) per share (or its equivalent) are not categorized in the fair value hierarchy. The fair value amounts presented in the table are intended to reconcile the fair value hierarchy to the amounts presented in the Portfolio of Investments. The Columbia Short-Term Cash Fund seeks to provide shareholders with maximum current income consistent with liquidity and stability of principal. Columbia Short-Term Cash Fund prices its shares with a floating NAV and no longer seeks to maintain a stable NAV.
Investments falling into the Level 3 category are primarily supported by quoted prices from brokers and dealers participating in the market for those investments. However, these may be classified as Level 3 investments due to lack of market transparency and corroboration to support these quoted prices. Additionally, valuation models may be used as the pricing source for any remaining investments classified as Level 3. These models may rely on one or more significant unobservable inputs and/or significant assumptions by the Investment Manager. Inputs used in valuations may include, but are not limited to, financial statement analysis, capital account balances, discount rates and estimated cash flows, and comparable company data.
Under the direction of the Fund’s Board of Trustees (the Board), the Investment Manager’s Valuation Committee (the Committee) is responsible for overseeing the valuation procedures approved by the Board. The Committee consists of voting and non-voting members from various groups within the Investment Manager’s organization, including operations and accounting, trading and investments, compliance, risk management and legal.
The accompanying Notes to Financial Statements are an integral part of this statement.
| 10 | Columbia Emerging Markets Bond Fund | Semiannual Report 2017 |
Portfolio of Investments (continued)
April 30, 2017 (Unaudited)
Fair value measurements (continued)
The Committee meets at least monthly to review and approve valuation matters, which may include a description of specific valuation determinations, data regarding pricing information received from approved pricing vendors and brokers and the results of Board-approved valuation control policies and procedures (the Policies). The Policies address, among other things, instances when market quotations are or are not readily available, including recommendations of third party pricing vendors and a determination of appropriate pricing methodologies; events that require specific valuation determinations and assessment of fair value techniques; securities with a potential for stale pricing, including those that are illiquid, restricted, or in default; and the effectiveness of third party pricing vendors, including periodic reviews of vendors. The Committee meets more frequently, as needed, to discuss additional valuation matters, which may include the need to review back-testing results, review time-sensitive information or approve related valuation actions. The Committee reports to the Board, with members of the Committee meeting with the Board at each of its regularly scheduled meetings to discuss valuation matters and actions during the period, similar to those described earlier.
For investments categorized as Level 3, the Committee monitors information similar to that described above, which may include: (i) data specific to the issuer or comparable issuers, (ii) general market or specific sector news and (iii) quoted prices and specific or similar security transactions. The Committee considers this data and any changes from prior periods in order to assess the reasonableness of observable and unobservable inputs, any assumptions or internal models used to value those securities and changes in fair value. This data is also used to corroborate, when available, information received from approved pricing vendors and brokers. Various factors impact the frequency of monitoring this information (which may occur as often as daily). However, the Committee may determine that changes to inputs, assumptions and models are not required as a result of the monitoring procedures performed.
The following table is a summary of the inputs used to value the Fund’s investments at April 30, 2017:
| | Level 1
quoted prices
in active
markets for
identical
assets ($) | Level 2
other
significant
observable
inputs ($) | Level 3
significant
unobservable
inputs ($) | Investments
measured at
net asset
value ($) | Total ($) |
| Investments | | | | | |
| Corporate Bonds & Notes | — | 71,482,239 | 1,804,393 | — | 73,286,632 |
| Foreign Government Obligations | — | 342,289,766 | — | — | 342,289,766 |
| Money Market Funds | — | — | — | 22,930,990 | 22,930,990 |
| Total Investments | — | 413,772,005 | 1,804,393 | 22,930,990 | 438,507,388 |
| Derivatives | | | | | |
| Asset | | | | | |
| Forward Foreign Currency Exchange Contracts | — | 341,225 | — | — | 341,225 |
| Futures Contracts | 85,644 | — | — | — | 85,644 |
| Liability | | | | | |
| Forward Foreign Currency Exchange Contracts | — | (16,213) | — | — | (16,213) |
| Total | 85,644 | 414,097,017 | 1,804,393 | 22,930,990 | 438,918,044 |
See the Portfolio of Investments for all investment classifications not indicated in the table.
The Fund’s assets assigned to the Level 2 input category are generally valued using the market approach, in which a security’s value is determined through reference to prices and information from market transactions for similar or identical assets
Derivative instruments are valued at unrealized appreciation (depreciation).
There were no transfers of financial assets between Levels 1 and 2 during the period.
Financial assets were transferred from Level 3 to Level 2 as observable market inputs were utilized and management determined that there was sufficient, reliable and observable market data to value these assets as of period end.
Transfers between Levels are determined based on the fair value at the beginning of the period for security positions held throughout the period.
The following table(s) shows transfers between Levels of the fair value hierarchy:
| Transfers In | Transfers Out |
| Level 2 ($) | Level 3 ($) | Level 2 ($) | Level 3 ($) |
| 7,966,818 | — | — | 7,966,818 |
The accompanying Notes to Financial Statements are an integral part of this statement.
Columbia Emerging Markets Bond Fund | Semiannual Report 2017
| 11 |
Portfolio of Investments (continued)
April 30, 2017 (Unaudited)
Fair value measurements (continued)
The following table is a reconciliation of Level 3 assets for which significant observable and unobservable inputs were used to determine fair value:
| Investments in securities | Balance
as of
10/31/2016
($) | Increase
(decrease)
in accrued
discounts/
premiums
($) | Realized
gain (loss)
($) | Change
in unrealized
appreciation
(depreciation)(a)
($) | Purchases
($) | Sales
($) | Transfers
into
Level 3
($) | Transfers
out of
Level 3
($) | Balance
as of
04/30/2017
($) |
| Corporate Bonds & Notes | 1,721,421 | 374 | — | 82,598 | — | — | — | — | 1,804,393 |
| Foreign Government Obligations | 7,966,818 | — | — | — | — | — | — | (7,966,818) | — |
| Total | 9,688,239 | 374 | — | 82,598 | — | — | — | (7,966,818) | 1,804,393 |
(a) Change in unrealized appreciation (depreciation) relating to securities held at April 30, 2017 was $82,598, all of which are Corporate Bonds & Notes.
The Fund’s assets assigned to the Level 3 category are valued utilizing the valuation technique deemed the most appropriate in the circumstances. Certain foreign bonds classified as Level 3 securities are valued using the market approach and utilize single market quotations from broker dealers which may have included, but were not limited to, observable transactions for identical or similar assets in the market and the distressed nature of the security. The appropriateness of fair values for these securities is monitored on an ongoing basis which may include results of back testing, manual price reviews and other control procedures. Significant increases (decreases) to any of these inputs would result in a significantly lower (higher) fair value measurement.
The accompanying Notes to Financial Statements are an integral part of this statement.
| 12 | Columbia Emerging Markets Bond Fund | Semiannual Report 2017 |
Statement of Assets and Liabilities
April 30, 2017 (Unaudited)
| Assets | |
| Investments, at cost | |
| Unaffiliated issuers, at cost | $404,568,007 |
| Affiliated issuers, at cost | 22,930,281 |
| Total investments, at cost | 427,498,288 |
| Investments, at value | |
| Unaffiliated issuers, at value | 415,576,398 |
| Affiliated issuers, at value | 22,930,990 |
| Total investments, at value | 438,507,388 |
| Foreign currency (identified cost $27,909) | 27,924 |
| Margin deposits | 142,800 |
| Unrealized appreciation on forward foreign currency exchange contracts | 341,225 |
| Receivable for: | |
| Investments sold | 5,525,376 |
| Capital shares sold | 414,096 |
| Dividends | 12,529 |
| Interest | 7,752,336 |
| Foreign tax reclaims | 35,234 |
| Variation margin | 11,375 |
| Prepaid expenses | 886 |
| Other assets | 35,900 |
| Total assets | 452,807,069 |
| Liabilities | |
| Due to custodian | 251,412 |
| Unrealized depreciation on forward foreign currency exchange contracts | 16,213 |
| Payable for: | |
| Investments purchased | 5,580,270 |
| Investments purchased on a delayed delivery basis | 8,696,106 |
| Capital shares purchased | 840,205 |
| Management services fees | 7,181 |
| Distribution and/or service fees | 1,501 |
| Transfer agent fees | 61,285 |
| Compensation of board members | 47,393 |
| Other expenses | 44,922 |
| Total liabilities | 15,546,488 |
| Net assets applicable to outstanding capital stock | $437,260,581 |
| Represented by | |
| Paid in capital | 449,909,898 |
| Undistributed net investment income | 3,377,250 |
| Accumulated net realized loss | (27,474,242) |
| Unrealized appreciation (depreciation) on: | |
| Investments - unaffiliated issuers | 11,008,391 |
| Investments - affiliated issuers | 709 |
| Foreign currency translations | 27,919 |
| Forward foreign currency exchange contracts | 325,012 |
| Futures contracts | 85,644 |
| Total - representing net assets applicable to outstanding capital stock | $437,260,581 |
The accompanying Notes to Financial Statements are an integral part of this statement.
Columbia Emerging Markets Bond Fund | Semiannual Report 2017
| 13 |
Statement of Assets and Liabilities (continued)
April 30, 2017 (Unaudited)
| Class A | |
| Net assets | $81,071,053 |
| Shares outstanding | 6,875,540 |
| Net asset value per share | $11.79 |
| Maximum offering price per share(a) | $12.38 |
| Class B | |
| Net assets | $125,922 |
| Shares outstanding | 10,696 |
| Net asset value per share | $11.77 |
| Class C | |
| Net assets | $20,450,961 |
| Shares outstanding | 1,745,233 |
| Net asset value per share | $11.72 |
| Class K | |
| Net assets | $27,134 |
| Shares outstanding | 2,302 |
| Net asset value per share | $11.79 |
| Class R | |
| Net assets | $27,767,641 |
| Shares outstanding | 2,355,983 |
| Net asset value per share | $11.79 |
| Class R4 | |
| Net assets | $5,593,670 |
| Shares outstanding | 473,754 |
| Net asset value per share | $11.81 |
| Class R5 | |
| Net assets | $40,680,582 |
| Shares outstanding | 3,447,637 |
| Net asset value per share | $11.80 |
| Class T(b) | |
| Net assets | $300,575 |
| Shares outstanding | 25,528 |
| Net asset value per share | $11.77 |
| Maximum offering price per share(c) | $12.07 |
| Class Y | |
| Net assets | $171,479,673 |
| Shares outstanding | 14,526,151 |
| Net asset value per share | $11.80 |
| Class Z | |
| Net assets | $89,763,370 |
| Shares outstanding | 7,606,882 |
| Net asset value per share | $11.80 |
| (a) | The maximum offering price per share is calculated by dividing the net asset value per share by 1.0 minus the maximum sales charge of 4.75% for Class A. |
| (b) | Effective March 27, 2017, Class W shares were renamed Class T shares. |
| (c) | The maximum offering price per share is calculated by dividing the net asset value per share by 1.0 minus the maximum sales charge of 2.50% for Class T. |
The accompanying Notes to Financial Statements are an integral part of this statement.
| 14 | Columbia Emerging Markets Bond Fund | Semiannual Report 2017 |
Statement of Operations
Six Months Ended April 30, 2017 (Unaudited)
| Net investment income | |
| Income: | |
| Dividends — affiliated issuers | $70,228 |
| Interest | 14,683,328 |
| Foreign taxes withheld | (101,913) |
| Total income | 14,651,643 |
| Expenses: | |
| Management services fees | 1,287,652 |
| Distribution and/or service fees | |
| Class A | 133,587 |
| Class B | 1,100 |
| Class C | 104,249 |
| Class R | 57,780 |
| Class T(a) | 5,252 |
| Transfer agent fees | |
| Class A | 142,994 |
| Class B | 295 |
| Class C | 27,820 |
| Class I(b) | 4,129 |
| Class K | 9 |
| Class R | 30,771 |
| Class R4 | 2,640 |
| Class R5 | 9,044 |
| Class T(a) | 5,747 |
| Class Y | 1,870 |
| Class Z | 101,742 |
| Plan administration fees | |
| Class K | 41 |
| Compensation of board members | 10,846 |
| Custodian fees | 14,846 |
| Printing and postage fees | 29,535 |
| Registration fees | 69,022 |
| Audit fees | 20,943 |
| Legal fees | 4,939 |
| Compensation of chief compliance officer | 47 |
| Other | 32,343 |
| Total expenses | 2,099,243 |
| Fees waived or expenses reimbursed by Investment Manager and its affiliates | (2,012) |
| Fees waived by transfer agent | |
| Class I | (1,227) |
| Class K | (1) |
| Class R5 | (1,562) |
| Class Y | (1,820) |
| Total net expenses | 2,092,621 |
| Net investment income | 12,559,022 |
The accompanying Notes to Financial Statements are an integral part of this statement.
Columbia Emerging Markets Bond Fund | Semiannual Report 2017
| 15 |
Statement of Operations (continued)
Six Months Ended April 30, 2017 (Unaudited)
| Realized and unrealized gain (loss) — net | |
| Net realized gain (loss) on: | |
| Investments — unaffiliated issuers | $69,471 |
| Investments — affiliated issuers | (488) |
| Foreign currency translations | (61,504) |
| Forward foreign currency exchange contracts | (1,186,465) |
| Futures contracts | (4,593) |
| Swap contracts | 170 |
| Net realized loss | (1,183,409) |
| Net change in unrealized appreciation (depreciation) on: | |
| Investments — unaffiliated issuers | 3,880,623 |
| Investments — affiliated issuers | 709 |
| Foreign currency translations | 28,064 |
| Forward foreign currency exchange contracts | 26,821 |
| Futures contracts | 85,644 |
| Swap contracts | (514) |
| Foreign capital gains tax | 63,479 |
| Net change in unrealized appreciation (depreciation) | 4,084,826 |
| Net realized and unrealized gain | 2,901,417 |
| Net increase in net assets resulting from operations | $15,460,439 |
| (a) | Effective March 27, 2017, Class W shares were renamed Class T shares. |
| (b) | Effective March 27, 2017, Class I shares were redeemed or exchanged for Class Y shares. |
The accompanying Notes to Financial Statements are an integral part of this statement.
| 16 | Columbia Emerging Markets Bond Fund | Semiannual Report 2017 |
Statement of Changes in Net Assets
| | Six Months Ended
April 30, 2017
(Unaudited) | Year Ended
October 31, 2016 |
| Operations | | |
| Net investment income | $12,559,022 | $26,607,462 |
| Net realized loss | (1,183,409) | (24,202,411) |
| Net change in unrealized appreciation (depreciation) | 4,084,826 | 50,779,972 |
| Net increase in net assets resulting from operations | 15,460,439 | 53,185,023 |
| Distributions to shareholders | | |
| Net investment income | | |
| Class A | (2,404,287) | (3,496,511) |
| Class B | (4,085) | (8,484) |
| Class C | (387,564) | (554,385) |
| Class I(a) | (3,473,248) | (5,465,987) |
| Class K | (756) | (1,165) |
| Class R | (479,714) | (376,196) |
| Class R4 | (47,159) | (55,798) |
| Class R5 | (677,994) | (332,997) |
| Class T(b) | (97,027) | (204,438) |
| Class Y | (599,178) | (57,594) |
| Class Z | (1,798,605) | (2,270,483) |
| Total distributions to shareholders | (9,969,617) | (12,824,038) |
| Decrease in net assets from capital stock activity | (24,087,570) | (42,171,208) |
| Total decrease in net assets | (18,596,748) | (1,810,223) |
| Net assets at beginning of period | 455,857,329 | 457,667,552 |
| Net assets at end of period | $437,260,581 | $455,857,329 |
| Undistributed net investment income | $3,377,250 | $787,845 |
| (a) | Effective March 27, 2017, Class I shares were redeemed or exchanged for Class Y shares. |
| (b) | Effective March 27, 2017, Class W shares were renamed Class T shares. |
The accompanying Notes to Financial Statements are an integral part of this statement.
Columbia Emerging Markets Bond Fund | Semiannual Report 2017
| 17 |
Statement of Changes in Net Assets (continued)
| | Six Months Ended | Year Ended |
| | April 30, 2017 (Unaudited) | October 31, 2016 |
| | Shares | Dollars ($) | Shares | Dollars ($) |
| Capital stock activity |
| Class A | | | | |
| Subscriptions (a) | 703,517 | 7,975,528 | 4,090,138 | 45,630,262 |
| Distributions reinvested | 204,575 | 2,300,234 | 312,162 | 3,322,402 |
| Redemptions | (5,707,354) | (64,740,851) | (5,610,952) | (60,570,982) |
| Net decrease | (4,799,262) | (54,465,089) | (1,208,652) | (11,618,318) |
| Class B | | | | |
| Subscriptions | (1) | 28 | 1,375 | 14,724 |
| Distributions reinvested | 348 | 3,890 | 780 | 8,161 |
| Redemptions (a) | (14,858) | (169,552) | (31,363) | (334,260) |
| Net decrease | (14,511) | (165,634) | (29,208) | (311,375) |
| Class C | | | | |
| Subscriptions | 65,189 | 738,293 | 138,264 | 1,492,816 |
| Distributions reinvested | 30,846 | 345,309 | 46,953 | 490,872 |
| Redemptions | (400,980) | (4,519,688) | (1,146,737) | (12,288,067) |
| Net decrease | (304,945) | (3,436,086) | (961,520) | (10,304,379) |
| Class I(b) | | | | |
| Subscriptions | 311,732 | 3,530,693 | 113,728 | 1,280,371 |
| Distributions reinvested | 309,041 | 3,473,030 | 512,161 | 5,465,669 |
| Redemptions | (15,016,940) | (174,142,613) | (3,078,890) | (32,476,971) |
| Net decrease | (14,396,167) | (167,138,890) | (2,453,001) | (25,730,931) |
| Class K | | | | |
| Subscriptions | — | — | 7,268 | 79,217 |
| Distributions reinvested | 46 | 519 | 79 | 876 |
| Redemptions | (4,206) | (48,487) | (2,650) | (31,000) |
| Net increase (decrease) | (4,160) | (47,968) | 4,697 | 49,093 |
| Class R | | | | |
| Subscriptions | 642,649 | 7,320,979 | 719,403 | 8,044,055 |
| Distributions reinvested | 35,955 | 406,354 | 28,314 | 302,680 |
| Redemptions | (152,776) | (1,727,435) | (176,000) | (1,889,197) |
| Net increase | 525,828 | 5,999,898 | 571,717 | 6,457,538 |
| Class R4 | | | | |
| Subscriptions | 324,683 | 3,808,812 | 153,021 | 1,644,427 |
| Distributions reinvested | 4,140 | 46,925 | 5,175 | 55,505 |
| Redemptions | (23,563) | (270,453) | (138,951) | (1,567,060) |
| Net increase | 305,260 | 3,585,284 | 19,245 | 132,872 |
| Class R5 | | | | |
| Subscriptions | 2,185,466 | 24,615,740 | 1,256,370 | 13,980,922 |
| Distributions reinvested | 59,499 | 677,216 | 30,609 | 332,032 |
| Redemptions | (395,893) | (4,542,967) | (481,986) | (5,130,069) |
| Net increase | 1,849,072 | 20,749,989 | 804,993 | 9,182,885 |
| Class T(c) | | | | |
| Subscriptions | 296,662 | 3,415,141 | 97,318 | 1,053,511 |
| Distributions reinvested | 8,709 | 96,805 | 19,212 | 204,174 |
| Redemptions | (932,189) | (10,626,186) | (172,549) | (1,896,168) |
| Net decrease | (626,818) | (7,114,240) | (56,019) | (638,483) |
| Class Y(b) | | | | |
| Subscriptions | 14,699,336 | 170,478,917 | 216,938 | 2,377,263 |
| Distributions reinvested | 51,121 | 599,178 | 5,268 | 57,594 |
| Redemptions | (498,823) | (5,796,803) | (53,626) | (595,813) |
| Net increase | 14,251,634 | 165,281,292 | 168,580 | 1,839,044 |
The accompanying Notes to Financial Statements are an integral part of this statement.
| 18 | Columbia Emerging Markets Bond Fund | Semiannual Report 2017 |
Statement of Changes in Net Assets (continued)
| | Six Months Ended | Year Ended |
| | April 30, 2017 (Unaudited) | October 31, 2016 |
| | Shares | Dollars ($) | Shares | Dollars ($) |
| Class Z | | | | |
| Subscriptions | 4,785,673 | 54,626,607 | 2,818,472 | 30,538,633 |
| Distributions reinvested | 150,004 | 1,698,412 | 189,722 | 2,025,508 |
| Redemptions | (3,814,102) | (43,661,145) | (4,046,820) | (43,793,295) |
| Net increase (decrease) | 1,121,575 | 12,663,874 | (1,038,626) | (11,229,154) |
| Total net decrease | (2,092,494) | (24,087,570) | (4,177,794) | (42,171,208) |
| (a) | Includes conversions of Class B shares to Class A shares, if any. |
| (b) | Effective March 27, 2017, Class I shares were redeemed or exchanged for Class Y shares. |
| (c) | Effective March 27, 2017, Class W shares were renamed Class T shares. |
The accompanying Notes to Financial Statements are an integral part of this statement.
Columbia Emerging Markets Bond Fund | Semiannual Report 2017
| 19 |
The following table is intended to help you understand the Fund’s financial performance. Certain information reflects financial results for a single share of a class held for the periods shown. Per share net investment income (loss) amounts are calculated based on average shares outstanding during the period. Total return assumes reinvestment of all dividends and distributions, if any. Total return does not reflect payment of sales charges, if any. Total return and portfolio turnover are not annualized for periods of less than one year. The portfolio turnover rate is calculated without regard to purchase and sales transactions of short-term instruments and certain derivatives, if any. If such transactions were included, the Fund’s portfolio turnover rate may be higher.
| Year ended (except as noted) | Net asset value,
beginning of
period | Net
investment
income | Net
realized
and
unrealized
gain (loss) | Total from
investment
operations | Distributions
from net
investment
income | Distributions
from net
realized
gains |
| Class A |
| 4/30/2017 (c) | $11.64 | 0.31 | 0.09 | 0.40 | (0.25) | — |
| 10/31/2016 | $10.56 | 0.64 | 0.73 | 1.37 | (0.29) | — |
| 10/31/2015 | $11.37 | 0.62 | (1.12) | (0.50) | (0.30) | (0.01) |
| 10/31/2014 | $11.59 | 0.60 | (0.18) | 0.42 | (0.49) | (0.15) |
| 10/31/2013 | $12.51 | 0.61 | (0.86) | (0.25) | (0.59) | (0.08) |
| 10/31/2012 | $11.33 | 0.65 | 1.16 | 1.81 | (0.63) | — |
| Class B |
| 4/30/2017 (c) | $11.62 | 0.27 | 0.08 | 0.35 | (0.20) | — |
| 10/31/2016 | $10.54 | 0.56 | 0.73 | 1.29 | (0.21) | — |
| 10/31/2015 | $11.37 | 0.53 | (1.12) | (0.59) | (0.23) | (0.01) |
| 10/31/2014 | $11.59 | 0.51 | (0.18) | 0.33 | (0.40) | (0.15) |
| 10/31/2013 | $12.51 | 0.52 | (0.86) | (0.34) | (0.50) | (0.08) |
| 10/31/2012 | $11.32 | 0.57 | 1.16 | 1.73 | (0.54) | — |
| Class C |
| 4/30/2017 (c) | $11.57 | 0.27 | 0.08 | 0.35 | (0.20) | — |
| 10/31/2016 | $10.50 | 0.56 | 0.72 | 1.28 | (0.21) | — |
| 10/31/2015 | $11.32 | 0.53 | (1.11) | (0.58) | (0.23) | (0.01) |
| 10/31/2014 | $11.54 | 0.51 | (0.18) | 0.33 | (0.40) | (0.15) |
| 10/31/2013 | $12.46 | 0.52 | (0.86) | (0.34) | (0.50) | (0.08) |
| 10/31/2012 | $11.30 | 0.56 | 1.15 | 1.71 | (0.55) | — |
| Class K |
| 4/30/2017 (c) | $11.63 | 0.32 | 0.10 | 0.42 | (0.26) | — |
| 10/31/2016 | $10.55 | 0.67 | 0.73 | 1.40 | (0.32) | — |
| 10/31/2015 | $11.36 | 0.64 | (1.12) | (0.48) | (0.32) | (0.01) |
| 10/31/2014 | $11.58 | 0.62 | (0.18) | 0.44 | (0.51) | (0.15) |
| 10/31/2013 | $12.50 | 0.63 | (0.86) | (0.23) | (0.61) | (0.08) |
| 10/31/2012 | $11.31 | 0.68 | 1.16 | 1.84 | (0.65) | — |
| Class R |
| 4/30/2017 (c) | $11.63 | 0.30 | 0.09 | 0.39 | (0.23) | — |
| 10/31/2016 | $10.55 | 0.62 | 0.73 | 1.35 | (0.27) | — |
| 10/31/2015 | $11.37 | 0.59 | (1.12) | (0.53) | (0.28) | (0.01) |
| 10/31/2014 | $11.59 | 0.57 | (0.18) | 0.39 | (0.46) | (0.15) |
| 10/31/2013 | $12.50 | 0.58 | (0.85) | (0.27) | (0.56) | (0.08) |
| 10/31/2012 (f) | $11.30 | 0.58 | 1.23 | 1.81 | (0.61) | — |
The accompanying Notes to Financial Statements are an integral part of this statement.
| 20 | Columbia Emerging Markets Bond Fund | Semiannual Report 2017 |
Total
distributions to
shareholders | Net
asset
value,
end of
period | Total
return | Total gross
expense
ratio to
average
net assets(a) | Total net
expense
ratio to
average
net assets(a),(b) | Net investment
income
ratio to
average
net assets | Portfolio
turnover | Net
assets,
end of
period
(000’s) |
| |
| (0.25) | $11.79 | 3.53% | 1.20% (d) | 1.20% (d) | 5.58% (d) | 26% | $81,071 |
| (0.29) | $11.64 | 13.30% | 1.20% | 1.20% | 5.91% | 44% | $135,877 |
| (0.31) | $10.56 | (4.39%) | 1.15% | 1.15% (e) | 5.72% | 32% | $136,042 |
| (0.64) | $11.37 | 3.84% | 1.16% | 1.16% (e) | 5.29% | 42% | $188,935 |
| (0.67) | $11.59 | (2.12%) | 1.13% | 1.13% (e) | 5.00% | 26% | $235,667 |
| (0.63) | $12.51 | 16.51% | 1.16% | 1.16% | 5.54% | 21% | $284,818 |
| |
| (0.20) | $11.77 | 3.15% | 1.95% (d) | 1.95% (d) | 4.83% (d) | 26% | $126 |
| (0.21) | $11.62 | 12.48% | 1.95% | 1.95% | 5.14% | 44% | $293 |
| (0.24) | $10.54 | (5.17%) | 1.90% | 1.90% (e) | 4.95% | 32% | $574 |
| (0.55) | $11.37 | 3.07% | 1.91% | 1.91% (e) | 4.55% | 42% | $1,083 |
| (0.58) | $11.59 | (2.85%) | 1.88% | 1.88% (e) | 4.25% | 26% | $2,064 |
| (0.54) | $12.51 | 15.73% | 1.90% | 1.90% | 4.87% | 21% | $2,908 |
| |
| (0.20) | $11.72 | 3.16% | 1.95% (d) | 1.95% (d) | 4.86% (d) | 26% | $20,451 |
| (0.21) | $11.57 | 12.43% | 1.95% | 1.95% | 5.16% | 44% | $23,714 |
| (0.24) | $10.50 | (5.11%) | 1.90% | 1.90% (e) | 4.96% | 32% | $31,610 |
| (0.55) | $11.32 | 3.08% | 1.91% | 1.91% (e) | 4.55% | 42% | $53,086 |
| (0.58) | $11.54 | (2.85%) | 1.88% | 1.88% (e) | 4.28% | 26% | $58,219 |
| (0.55) | $12.46 | 15.55% | 1.91% | 1.91% | 4.78% | 21% | $45,979 |
| |
| (0.26) | $11.79 | 3.74% | 0.98% (d) | 0.97% (d) | 5.70% (d) | 26% | $27 |
| (0.32) | $11.63 | 13.55% | 0.99% | 0.99% | 5.95% | 44% | $75 |
| (0.33) | $10.55 | (4.23%) | 0.96% | 0.96% | 5.90% | 32% | $19 |
| (0.66) | $11.36 | 4.05% | 0.96% | 0.96% | 5.50% | 42% | $37 |
| (0.69) | $11.58 | (1.97%) | 0.95% | 0.95% | 5.16% | 26% | $36 |
| (0.65) | $12.50 | 16.87% | 0.98% | 0.98% | 5.78% | 21% | $72 |
| |
| (0.23) | $11.79 | 3.49% | 1.45% (d) | 1.45% (d) | 5.38% (d) | 26% | $27,768 |
| (0.27) | $11.63 | 13.03% | 1.45% | 1.45% | 5.64% | 44% | $21,289 |
| (0.29) | $10.55 | (4.69%) | 1.40% | 1.40% (e) | 5.53% | 32% | $13,281 |
| (0.61) | $11.37 | 3.57% | 1.41% | 1.41% (e) | 5.07% | 42% | $10,212 |
| (0.64) | $11.59 | (2.29%) | 1.39% | 1.39% (e) | 4.79% | 26% | $3,711 |
| (0.61) | $12.50 | 16.57% | 1.42% (d) | 1.42% (d) | 5.15% (d) | 21% | $2,877 |
Columbia Emerging Markets Bond Fund | Semiannual Report 2017
| 21 |
Financial Highlights (continued)
| Year ended (except as noted) | Net asset value,
beginning of
period | Net
investment
income | Net
realized
and
unrealized
gain (loss) | Total from
investment
operations | Distributions
from net
investment
income | Distributions
from net
realized
gains |
| Class R4 |
| 4/30/2017 (c) | $11.65 | 0.33 | 0.09 | 0.42 | (0.26) | — |
| 10/31/2016 | $10.57 | 0.68 | 0.72 | 1.40 | (0.32) | — |
| 10/31/2015 | $11.38 | 0.64 | (1.12) | (0.48) | (0.32) | (0.01) |
| 10/31/2014 | $11.60 | 0.63 | (0.18) | 0.45 | (0.52) | (0.15) |
| 10/31/2013 (g) | $12.57 | 0.41 | (0.98) | (0.57) | (0.40) | — |
| Class R5 |
| 4/30/2017 (c) | $11.64 | 0.34 | 0.09 | 0.43 | (0.27) | — |
| 10/31/2016 | $10.56 | 0.70 | 0.72 | 1.42 | (0.34) | — |
| 10/31/2015 | $11.37 | 0.66 | (1.12) | (0.46) | (0.34) | (0.01) |
| 10/31/2014 | $11.59 | 0.65 | (0.18) | 0.47 | (0.54) | (0.15) |
| 10/31/2013 (h) | $12.57 | 0.64 | (0.90) | (0.26) | (0.64) | (0.08) |
| Class T(i) |
| 4/30/2017 (c) | $11.62 | 0.31 | 0.09 | 0.40 | (0.25) | — |
| 10/31/2016 | $10.54 | 0.64 | 0.73 | 1.37 | (0.29) | — |
| 10/31/2015 | $11.36 | 0.62 | (1.13) | (0.51) | (0.30) | (0.01) |
| 10/31/2014 | $11.57 | 0.60 | (0.17) | 0.43 | (0.49) | (0.15) |
| 10/31/2013 | $12.49 | 0.61 | (0.86) | (0.25) | (0.59) | (0.08) |
| 10/31/2012 | $11.31 | 0.66 | 1.15 | 1.81 | (0.63) | — |
| Class Y |
| 4/30/2017 (c) | $11.65 | 0.36 | 0.07 | 0.43 | (0.28) | — |
| 10/31/2016 | $10.57 | 0.71 | 0.72 | 1.43 | (0.35) | — |
| 10/31/2015 | $11.38 | 0.67 | (1.12) | (0.45) | (0.35) | (0.01) |
| 10/31/2014 | $11.59 | 0.65 | (0.16) | 0.49 | (0.55) | (0.15) |
| 10/31/2013 (j) | $12.57 | 0.65 | (0.90) | (0.25) | (0.65) | (0.08) |
| Class Z |
| 4/30/2017 (c) | $11.65 | 0.33 | 0.08 | 0.41 | (0.26) | — |
| 10/31/2016 | $10.57 | 0.67 | 0.73 | 1.40 | (0.32) | — |
| 10/31/2015 | $11.37 | 0.64 | (1.11) | (0.47) | (0.32) | (0.01) |
| 10/31/2014 | $11.59 | 0.63 | (0.18) | 0.45 | (0.52) | (0.15) |
| 10/31/2013 | $12.51 | 0.64 | (0.86) | (0.22) | (0.62) | (0.08) |
| 10/31/2012 | $11.35 | 0.68 | 1.14 | 1.82 | (0.66) | — |
| Notes to Financial Highlights |
| (a) | In addition to the fees and expenses that the Fund bears directly, the Fund indirectly bears a pro rata share of the fees and expenses of any other funds in which it invests. Such indirect expenses are not included in the Fund’s reported expense ratios. |
| (b) | Total net expenses include the impact of certain fee waivers/expense reimbursements made by the Investment Manager and certain of its affiliates, if applicable. |
| (c) | For the six months ended April 30, 2017 (unaudited). |
| (d) | Annualized. |
| (e) | The benefits derived from expense reductions had an impact of less than 0.01%. |
| (f) | Class R shares commenced operations on November 16, 2011. Per share data and total return reflect activity from that date. |
| (g) | Class R4 shares commenced operations on March 19, 2013. Per share data and total return reflect activity from that date. |
| (h) | Class R5 shares commenced operations on November 8, 2012. Per share data and total return reflect activity from that date. |
| (i) | Effective March 27, 2017, Class W shares were renamed Class T shares. |
| (j) | Class Y shares commenced operations on November 8, 2012. Per share data and total return reflect activity from that date. |
The accompanying Notes to Financial Statements are an integral part of this statement.
| 22 | Columbia Emerging Markets Bond Fund | Semiannual Report 2017 |
Total
distributions to
shareholders | Net
asset
value,
end of
period | Total
return | Total gross
expense
ratio to
average
net assets(a) | Total net
expense
ratio to
average
net assets(a),(b) | Net investment
income
ratio to
average
net assets | Portfolio
turnover | Net
assets,
end of
period
(000’s) |
| |
| (0.26) | $11.81 | 3.74% | 0.96% (d) | 0.95% (d) | 5.94% (d) | 26% | $5,594 |
| (0.32) | $11.65 | 13.57% | 0.95% | 0.95% | 6.21% | 44% | $1,964 |
| (0.33) | $10.57 | (4.19%) | 0.89% | 0.89% (e) | 5.99% | 32% | $1,578 |
| (0.67) | $11.38 | 4.09% | 0.91% | 0.91% (e) | 5.54% | 42% | $1,985 |
| (0.40) | $11.60 | (4.57%) | 0.92% (d) | 0.92% (d),(e) | 5.70% (d) | 26% | $1,055 |
| |
| (0.27) | $11.80 | 3.85% | 0.75% (d) | 0.74% (d) | 6.11% (d) | 26% | $40,681 |
| (0.34) | $11.64 | 13.82% | 0.74% | 0.74% | 6.34% | 44% | $18,615 |
| (0.35) | $10.56 | (4.03%) | 0.72% | 0.72% | 6.19% | 32% | $8,384 |
| (0.69) | $11.37 | 4.31% | 0.70% | 0.70% | 5.67% | 42% | $8,928 |
| (0.72) | $11.59 | (2.19%) | 0.71% (d) | 0.71% (d) | 5.54% (d) | 26% | $11,814 |
| |
| (0.25) | $11.77 | 3.54% | 1.21% (d) | 1.20% (d) | 5.57% (d) | 26% | $301 |
| (0.29) | $11.62 | 13.32% | 1.20% | 1.20% | 5.91% | 44% | $7,581 |
| (0.31) | $10.54 | (4.49%) | 1.16% | 1.16% (e) | 5.72% | 32% | $7,469 |
| (0.64) | $11.36 | 3.93% | 1.16% | 1.16% (e) | 5.26% | 42% | $31,493 |
| (0.67) | $11.57 | (2.13%) | 1.13% | 1.13% (e) | 5.02% | 26% | $64,994 |
| (0.63) | $12.49 | 16.53% | 1.15% | 1.15% | 5.63% | 21% | $63,707 |
| |
| (0.28) | $11.80 | 3.79% | 0.69% (d) | 0.68% (d) | 6.74% (d) | 26% | $171,480 |
| (0.35) | $11.65 | 13.86% | 0.69% | 0.69% | 6.41% | 44% | $3,199 |
| (0.36) | $10.57 | (3.99%) | 0.67% | 0.67% | 6.23% | 32% | $1,120 |
| (0.70) | $11.38 | 4.46% | 0.65% | 0.65% | 5.83% | 42% | $1,384 |
| (0.73) | $11.59 | (2.14%) | 0.65% (d) | 0.65% (d) | 5.66% (d) | 26% | $9,286 |
| |
| (0.26) | $11.80 | 3.65% | 0.95% (d) | 0.95% (d) | 5.91% (d) | 26% | $89,763 |
| (0.32) | $11.65 | 13.57% | 0.95% | 0.95% | 6.17% | 44% | $75,526 |
| (0.33) | $10.57 | (4.10%) | 0.90% | 0.90% (e) | 5.98% | 32% | $79,496 |
| (0.67) | $11.37 | 4.10% | 0.91% | 0.91% (e) | 5.55% | 42% | $107,518 |
| (0.70) | $11.59 | (1.87%) | 0.88% | 0.88% (e) | 5.23% | 26% | $124,223 |
| (0.66) | $12.51 | 16.64% | 0.91% | 0.91% | 5.72% | 21% | $144,687 |
Columbia Emerging Markets Bond Fund | Semiannual Report 2017
| 23 |
Notes to Financial Statements
April 30, 2017 (Unaudited)
Note 1. Organization
Columbia Emerging Markets Bond Fund (the Fund), a series of Columbia Funds Series Trust II (the Trust), is a non-diversified fund. The Trust is registered under the Investment Company Act of 1940, as amended (the 1940 Act), as an open-end management investment company organized as a Massachusetts business trust.
Fund shares
The Trust may issue an unlimited number of shares (without par value). Although all share classes generally have identical voting, dividend and liquidation rights, each share class votes separately when required by the Trust’s organizational documents or by law. Different share classes pay different distribution amounts to the extent the expenses of such share classes differ, and distributions in liquidation will be proportional to the net asset value of each share class. Each share class has its own expense and sales charge structure. The Fund offers each of the share classes identified below.
Class A shares are subject to a maximum front-end sales charge of 4.75% based on the initial investment amount. Class A shares purchased without an initial sales charge in accounts aggregating $1 million to $50 million at the time of purchase are subject to a contingent deferred sales charge (CDSC) if the shares are sold within 18 months after purchase, charged as follows: 1.00% CDSC if redeemed within 12 months after purchase, and 0.50% CDSC if redeemed more than 12, but less than 18, months after purchase.
The Fund no longer accepts investments by new or existing investors in the Fund’s Class B shares, except in connection with the reinvestment of any dividend and/or capital gain distributions in Class B shares of the Fund and exchanges by existing Class B shareholders of certain other funds within the Columbia Family of Funds. Class B shares are typically subject to a maximum CDSC of 5.00% based upon the holding period after purchase. However, the Fund’s current Class B investors, having held their shares for the requisite time period, are no longer subject to a CDSC upon redemption of their shares. Effective on or about July 17, 2017, Class B shares will automatically convert to Class A shares and the Fund will no longer accept investments by new or existing investors in Class B shares.
Class C shares are subject to a 1.00% CDSC on shares redeemed within 12 months after purchase.
Effective March 27, 2017, Class I shares of the Fund are no longer offered for sale. Class I shares, when available, were not subject to sales charges or distribution and service (12b-1) fees, and were made available only to the Columbia Family of Funds. On March 27, 2017, Class I shares were redeemed or exchanged for Class Y shares of the Fund in a tax free transaction that had no impact on the fees and expenses paid by shareholders.
Class K shares are not subject to sales charges; however, this share class is closed to new investors.
Class R shares are not subject to sales charges and are generally available only to certain retirement plans and other investors as described in the Fund’s prospectus.
Class R4 shares are not subject to sales charges and are generally available only to omnibus retirement plans and certain investors as described in the Fund’s prospectus.
Class R5 shares are not subject to sales charges and are generally available only to investors purchasing through authorized investment professionals and omnibus retirement plans.
Class T shares are subject to a maximum front-end sales charge of 2.50% per transaction and must be purchased through financial intermediaries that, by written agreement with Columbia Management Investment Distributors, Inc., are specifically authorized to sell Class T shares. Prior to March 27, 2017, Class T shares were known as Class W shares, were not subject to sales charges, and were generally available only to investors purchasing through authorized investment programs managed by investment professionals, including discretionary managed accounts.
Class Y shares are not subject to sales charges or distribution and service (12b-1) fees, and are available to institutional and certain other investors as described in the Fund’s prospectus. On March 27, 2017, Class I shares were redeemed or exchanged for Class Y shares of the Fund in a tax free transaction that had no impact on the fees and expenses paid by shareholders. Class I shares of the Fund are no longer offered for sale.
| 24 | Columbia Emerging Markets Bond Fund | Semiannual Report 2017 |
Notes to Financial Statements (continued)
April 30, 2017 (Unaudited)
Class Z shares are not subject to sales charges and are generally available only to eligible investors, which are subject to different investment minimums as described in the Fund’s prospectus.
Note 2. Summary of significant accounting policies
Basis of preparation
The Fund is an investment company that applies the accounting and reporting guidance in the Financial Accounting Standards Board (FASB) Accounting Standards Codification Topic 946, Financial Services - Investment Companies (ASC 946). The financial statements are prepared in accordance with U.S. generally accepted accounting principles (GAAP), which requires management to make certain estimates and assumptions that affect the reported amounts of assets and liabilities, the disclosure of contingent assets and liabilities at the date of the financial statements and the reported amounts of income and expenses during the reporting period. Actual results could differ from those estimates.
The following is a summary of significant accounting policies followed by the Fund in the preparation of its financial statements.
Security valuation
Debt securities generally are valued by pricing services approved by the Board of Trustees based upon market transactions for normal, institutional-size trading units of similar securities. The services may use various pricing techniques that take into account, as applicable, factors such as yield, quality, coupon rate, maturity, type of issue, trading characteristics and other data, as well as approved independent broker-dealer quotes. Debt securities for which quotations are not readily available or not believed to be reflective of market value may also be valued based upon a bid quote from an approved independent broker-dealer. Debt securities maturing in 60 days or less are valued primarily at amortized cost value, unless this method results in a valuation that management believes does not approximate market value.
Investments in open-end investment companies, including money market funds, are valued at their latest net asset value.
Forward foreign currency exchange contracts are marked-to-market based upon foreign currency exchange rates provided by a pricing service.
Futures and options on futures contracts are valued based upon the settlement price at the close of regular trading on their principal exchanges or, in the absence of transactions, at the mean of the latest quoted bid and ask prices.
Swap transactions are valued through an independent pricing service or broker, or if neither is available, through an internal model based upon observable inputs.
Investments for which market quotations are not readily available, or that have quotations which management believes are not reflective of market value or reliable, are valued at fair value as determined in good faith under procedures approved by and under the general supervision of the Board of Trustees. If a security or class of securities (such as foreign securities) is valued at fair value, such value is likely to be different from the quoted or published price for the security.
The determination of fair value often requires significant judgment. To determine fair value, management may use assumptions including but not limited to future cash flows and estimated risk premiums. Multiple inputs from various sources may be used to determine fair value.
GAAP requires disclosure regarding the inputs and valuation techniques used to measure fair value and any changes in valuation inputs or techniques. In addition, investments shall be disclosed by major category. This information is disclosed following the Fund’s Portfolio of Investments.
Foreign currency transactions and translations
The values of all assets and liabilities denominated in foreign currencies are generally translated into U.S. dollars at exchange rates determined at the close of regular trading on the New York Stock Exchange. Net realized and unrealized gains (losses) on foreign currency transactions and translations include gains (losses) arising from the fluctuation in exchange
Columbia Emerging Markets Bond Fund | Semiannual Report 2017
| 25 |
Notes to Financial Statements (continued)
April 30, 2017 (Unaudited)
rates between trade and settlement dates on securities transactions, gains (losses) arising from the disposition of foreign currency and currency gains (losses) between the accrual and payment dates on dividends, interest income and foreign withholding taxes.
For financial statement purposes, the Fund does not distinguish that portion of gains (losses) on investments which is due to changes in foreign exchange rates from that which is due to changes in market prices of the investments. Such fluctuations are included with the net realized and unrealized gains (losses) on investments in the Statement of Operations.
Derivative instruments
The Fund invests in certain derivative instruments, as detailed below, to meet its investment objectives. Derivatives are instruments whose values depend on, or are derived from, in whole or in part, the value of one or more securities, currencies, commodities, indices, or other assets or instruments. Derivatives may be used to increase investment flexibility (including to maintain cash reserves while maintaining desired exposure to certain assets), for risk management (hedging) purposes, to facilitate trading, to reduce transaction costs and to pursue higher investment returns. The Fund may also use derivative instruments to mitigate certain investment risks, such as foreign currency exchange rate risk, interest rate risk and credit risk. Derivatives may involve various risks, including the potential inability of the counterparty to fulfill its obligations under the terms of the contract, the potential for an illiquid secondary market (making it difficult for the Fund to sell or terminate, including at favorable prices) and the potential for market movements which may expose the Fund to gains or losses in excess of the amount shown in the Statement of Assets and Liabilities. The notional amounts of derivative instruments, if applicable, are not recorded in the financial statements.
A derivative instrument may suffer a marked-to-market loss if the value of the contract decreases due to an unfavorable change in the market rates or values of the underlying instrument. Losses can also occur if the counterparty does not perform its obligations under the contract. The Fund’s risk of loss from counterparty credit risk on over-the-counter derivatives is generally limited to the aggregate unrealized gain netted against any collateral held by the Fund and the amount of any variation margin held by the counterparty, plus any replacement costs or related amounts. With exchange-traded or centrally cleared derivatives, there is reduced counterparty credit risk to the Fund since the clearinghouse or central counterparty (CCP) provides some protection in the case of clearing member default. The clearinghouse or CCP stands between the buyer and the seller of the contract; therefore, additional counterparty credit risk is failure of the clearinghouse or CCP. However, credit risk still exists in exchange-traded or centrally cleared derivatives with respect to initial and variation margin that is held in a broker’s customer account. While brokers are required to segregate customer margin from their own assets, in the event that a broker becomes insolvent or goes into bankruptcy and at that time there is a shortfall in the aggregate amount of margin held by the broker for all its clients, U.S. bankruptcy laws will typically allocate that shortfall on a pro-rata basis across all the broker’s customers (including the Fund), potentially resulting in losses to the Fund.
In order to better define its contractual rights and to secure rights that will help the Fund mitigate its counterparty risk, the Fund may enter into an International Swaps and Derivatives Association, Inc. Master Agreement (ISDA Master Agreement) or similar agreement with its derivatives contract counterparties. An ISDA Master Agreement is an agreement between the Fund and a counterparty that governs over-the-counter derivatives and typically contains, among other things, collateral posting terms and netting provisions in the event of a default and/or termination event. Under an ISDA Master Agreement, the Fund may, under certain circumstances, offset with the counterparty certain derivative instrument’s payables and/or receivables with collateral held and/or posted and create one single net payment. The provisions of the ISDA Master Agreement typically permit a single net payment in the event of default (close-out netting), including the bankruptcy or insolvency of the counterparty. Note, however, that bankruptcy or insolvency laws of a particular jurisdiction may impose restrictions on or prohibitions against the right of offset or netting in bankruptcy, insolvency or other events.
Collateral (margin) requirements differ by type of derivative. Margin requirements are established by the clearinghouse or CCP for exchange-traded and centrally cleared derivatives. Brokers can ask for margin in excess of the minimum in certain circumstances. Collateral terms are contract specific for over-the-counter derivatives. For over-the-counter derivatives traded under an ISDA Master Agreement, the collateral requirements are typically calculated by netting the marked-to-market amount for each transaction under such agreement and comparing that amount to the value of any variation margin currently pledged by the Fund and/or the counterparty. Generally, the amount of collateral due from or to a party has to exceed a minimum transfer amount threshold (e.g., $250,000) before a transfer has to be made. To the extent amounts due to the Fund from its
| 26 | Columbia Emerging Markets Bond Fund | Semiannual Report 2017 |
Notes to Financial Statements (continued)
April 30, 2017 (Unaudited)
counterparties are not fully collateralized, contractually or otherwise, the Fund bears the risk of loss from counterparty nonperformance. The Fund attempts to mitigate counterparty risk by only entering into agreements with counterparties that it believes have the financial resources to honor their obligations and by monitoring the financial stability of those counterparties.
Certain ISDA Master Agreements allow counterparties of over-the-counter derivatives transactions to terminate derivatives contracts prior to maturity in the event the Fund’s net asset value declines by a stated percentage over a specified time period or if the Fund fails to meet certain terms of the ISDA Master Agreement, which would cause the Fund to accelerate payment of any net liability owed to the counterparty. The Fund also has termination rights if the counterparty fails to meet certain terms of the ISDA Master Agreement. In addition to considering counterparty credit risk, the Fund would consider terminating the derivatives contracts based on whether termination would result in a net liability owed from the counterparty.
For financial reporting purposes, the Fund does not offset derivative assets and derivative liabilities that are subject to netting arrangements in the Statement of Assets and Liabilities.
Forward foreign currency exchange contracts
Forward foreign currency exchange contracts are over-the-counter agreements between two parties to buy and sell a currency at a set price on a future date. The Fund utilized forward foreign currency exchange contracts to hedge the currency exposure associated with some or all of the Fund’s securities and to shift foreign currency exposure back to U.S. dollars. These instruments may be used for other purposes in future periods.
The values of forward foreign currency exchange contracts fluctuate daily with changes in foreign currency exchange rates. Changes in the value of these contracts are recorded as unrealized appreciation or depreciation until the contract is exercised or has expired. The Fund will realize a gain or loss when the forward foreign currency exchange contract is closed or expires.
The use of forward foreign currency exchange contracts does not eliminate fluctuations in the prices of the Fund’s portfolio securities. The risks of forward foreign currency exchange contracts include movement in the values of the foreign currencies relative to the U.S. dollar (or other foreign currencies) and the possibility that counterparties will not complete their contractual obligations, which may be in excess of the amount reflected, if any, in the Statement of Assets and Liabilities.
Futures contracts
Futures contracts are exchange-traded and represent commitments for the future purchase or sale of an asset at a specified price on a specified date. The Fund bought and sold futures contracts to manage the duration and yield curve exposure of the Fund versus the benchmark. These instruments may be used for other purposes in future periods. Upon entering into futures contracts, the Fund bears risks that it may not achieve the anticipated benefits of the futures contracts and may realize a loss. Additional risks include counterparty credit risk, the possibility of an illiquid market, and that a change in the value of the contract or option may not correlate with changes in the value of the underlying asset.
Upon entering into a futures contract, the Fund deposits cash or securities with the broker, known as a futures commission merchant (FCM), in an amount sufficient to meet the initial margin requirement. The initial margin deposit must be maintained at an established level over the life of the contract. Cash deposited as initial margin is recorded in the Statement of Assets and Liabilities as margin deposits. Securities deposited as initial margin are designated in the Portfolio of Investments. Subsequent payments (variation margin) are made or received by the Fund each day. The variation margin payments are equal to the daily change in the contract value and are recorded as variation margin receivable or payable and are offset in unrealized gains or losses. The Fund recognizes a realized gain or loss when the contract is closed or expires. Futures contracts involve, to varying degrees, risk of loss in excess of the variation margin disclosed in the Statement of Assets and Liabilities.
Swap contracts
Swap contracts are negotiated in the over-the-counter market and may be entered into as a bilateral contract or centrally cleared (centrally cleared swap contract). In a centrally cleared swap contract, immediately following execution of the swap contract with a broker, the swap contract is novated to a central counterparty (the CCP) and the CCP becomes the Fund’s
Columbia Emerging Markets Bond Fund | Semiannual Report 2017
| 27 |
Notes to Financial Statements (continued)
April 30, 2017 (Unaudited)
counterparty to the centrally cleared swap contract. The Fund is required to deposit initial margin with the futures commission merchant (FCM), which pledges it through to the CCP in the form of cash or securities in an amount that varies depending on the size and risk profile of the particular swap contract. Securities deposited as initial margin are designated in the Portfolio of Investments and cash deposited is recorded in the Statement of Assets and Liabilities as margin deposits. Unlike a bilateral swap contract, for centrally cleared swap contracts, the Fund has minimal credit exposure to the FCM because the CCP stands between the Fund and the relevant buyer/seller on the other side of the contract. Swap contracts are marked-to-market daily and changes in value are recorded as unrealized appreciation (depreciation). The daily change in valuation of centrally cleared swap contracts, if any, is recorded as a receivable or payable for variation margin in the Statement of Assets and Liabilities.
Entering into these contracts involves, to varying degrees, elements of interest, liquidity and counterparty credit risk in excess of the amounts recognized in the Statement of Assets and Liabilities. Such risks involve the possibility that there may be unfavorable changes in interest rates, market conditions or other conditions, it may be difficult to initiate a swap transaction or liquidate a position at an advantageous time or price which may result in significant losses, and that the FCM or CCP may not fulfill its obligation under the contract.
Credit default swap contracts
The Fund entered into credit default swap contracts increase or decrease its credit exposure to a single issuer of debt securities. These instruments may be used for other purposes in future periods. Credit default swap contracts are agreements in which one party pays fixed periodic payments to a counterparty in consideration for an agreement from the counterparty to make a specific payment should a specified credit event(s) take place. Although specified credit events are contract specific, credit events are generally defined as bankruptcy, failure to pay, restructuring, obligation acceleration, obligation default, or repudiation/moratorium.
As the purchaser of a credit default swap contract, the Fund purchases protection by paying a periodic interest rate on the notional amount to the counterparty. The interest amount is accrued daily as a component of unrealized appreciation (depreciation) and is recorded as a realized loss upon payment. If a credit event as specified in the contract occurs, the Fund may have the option either to deliver the reference obligation to the seller in exchange for a cash payment of its par amount, or to receive a net cash settlement equal to the par amount less an agreed-upon value of the reference obligation as of the date of the credit event. The difference between the value of the obligation or cash delivered and the notional amount received will be recorded as a realized gain (loss).
As the seller of a credit default swap contract, the Fund sells protection to a buyer and will generally receive a periodic interest rate on a notional amount. The interest amount is accrued daily as a component of unrealized appreciation (depreciation) and is recorded as a realized gain upon receipt of the payment. If a credit event as specified in the contract with the counterparty occurs, the Fund may either be required to accept the reference obligation from the buyer in exchange for a cash payment of its notional amount, or to pay the buyer a net cash settlement equal to the notional amount less an agreed-upon value of the reference obligation (recovery value) as of the date of the credit event. The difference between the value of the obligation or cash received and the notional amount paid will be recorded as a realized gain (loss). The maximum potential amount of undiscounted future payments the Fund could be required to make as the seller of protection under a credit default swap contract is equal to the notional amount of the reference obligation. These potential amounts may be partially offset by any recovery values of the respective reference obligations or premiums received upon entering into the agreement. The notional amounts and market values of all credit default swap contracts in which the Fund is the seller of protection, if any, are disclosed in the Credit Default Swap Contracts Outstanding schedule following the Portfolio of Investments.
As a protection seller, the Fund bears the risk of loss from the credit events specified in the contract with the counterparty. For credit default swap contracts on credit indices, quoted market prices and resulting market values serve as an indicator of the current status of the payment/performance risk. Increasing market values, in absolute terms when compared to the notional amount of the swap, represent a deterioration of the reference entity’s credit soundness and a greater likelihood or risk of default or other credit event occurring as defined under the terms of the contract.
| 28 | Columbia Emerging Markets Bond Fund | Semiannual Report 2017 |
Notes to Financial Statements (continued)
April 30, 2017 (Unaudited)
Effects of derivative transactions in the financial statements
The following tables are intended to provide additional information about the effect of derivatives on the financial statements of the Fund, including: the fair value of derivatives by risk category and the location of those fair values in the Statement of Assets and Liabilities; and the impact of derivative transactions over the period in the Statement of Operations, including realized and unrealized gains (losses). The derivative instrument schedules following the Portfolio of Investments present additional information regarding derivative instruments outstanding at the end of the period, if any.
The following table is a summary of the fair value of derivative instruments (not considered to be hedging instruments for accounting disclosure purposes) at April 30, 2017:
| | Asset derivatives | |
Risk exposure
category | Statement
of assets and liabilities
location | Fair value ($) |
| Foreign exchange risk | Unrealized appreciation on forward foreign currency exchange contracts | 341,225* |
| Interest rate risk | Net assets — unrealized appreciation on futures contracts | 85,644* |
| Total | | 426,869 |
| | Liability derivatives | |
Risk exposure
category | Statement
of assets and liabilities
location | Fair value ($) |
| Foreign exchange risk | Unrealized depreciation on forward foreign currency exchange contracts | 16,213* |
| * | Includes cumulative appreciation (depreciation) as reported in the tables following the Portfolio of Investments. Only the current day’s variation margin is reported in receivables or payables in the Statement of Assets and Liabilities. |
The following table indicates the effect of derivative instruments (not considered to be hedging instruments for accounting disclosure purposes) in the Statement of Operations for the six months ended April 30, 2017:
| Amount of realized gain (loss) on derivatives recognized in income |
| Risk exposure category | Forward
foreign
currency
exchange
contracts
($) | Futures
contracts
($) | Swap
contracts
($) | Total
($) |
| Credit risk | — | — | 170 | 170 |
| Foreign exchange risk | (1,186,465) | — | — | (1,186,465) |
| Interest rate risk | — | (4,593) | — | (4,593) |
| Total | (1,186,465) | (4,593) | 170 | (1,190,888) |
| |
| Change in unrealized appreciation (depreciation) on derivatives recognized in income |
| Risk exposure category | Forward
foreign
currency
exchange
contracts
($) | Futures
contracts
($) | Swap
contracts
($) | Total
($) |
| Credit risk | — | — | (514) | (514) |
| Foreign exchange risk | 26,821 | — | — | 26,821 |
| Interest rate risk | — | 85,644 | — | 85,644 |
| Total | 26,821 | 85,644 | (514) | 111,951 |
Columbia Emerging Markets Bond Fund | Semiannual Report 2017
| 29 |
Notes to Financial Statements (continued)
April 30, 2017 (Unaudited)
The following table is a summary of the average outstanding volume by derivative instrument for the six months ended April 30, 2017:
| Derivative instrument | Average notional
amounts ($) |
| Futures contracts — long | 4,530,750* |
| Credit default swap contracts — buy protection | 6,767** |
| Derivative instrument | Average unrealized
appreciation ($)* | Average unrealized
depreciation ($)* |
| Forward foreign currency exchange contracts | 170,613 | (199,126) |
| * | Based on the ending quarterly outstanding amounts for the six months ended April 30, 2017. |
| ** | Based on the ending daily outstanding amounts for the six months ended April 30, 2017. |
Delayed delivery securities
The Fund may trade securities on other than normal settlement terms, including securities purchased or sold on a “when-issued” or "forward commitment" basis. This may increase risk to the Fund since the other party to the transaction may fail to deliver, which could cause the Fund to subsequently invest at less advantageous prices. The Fund designates cash or liquid securities in an amount equal to the delayed delivery commitment.
Treasury inflation protected securities
The Fund may invest in treasury inflation protected securities (TIPS). The principal amount of TIPS is adjusted periodically and is increased for inflation or decreased for deflation based on a monthly published index. These adjustments are recorded as interest income in the Statement of Operations. Coupon payments are based on the adjusted principal at the time the interest is paid.
Offsetting of assets and liabilities
The following table presents the Fund’s gross and net amount of assets and liabilities available for offset under netting arrangements as well as any related collateral received or pledged by the Fund as of April 30, 2017:
| | Barclays
($) | Citi
($) | Total
($) | | | | | | |
| Assets | | | | | | | | | |
| Forward foreign currency exchange contracts | 218,232 | 122,993 | 341,225 | | | | | | |
| Liabilities | | | | | | | | | |
| Forward foreign currency exchange contracts | - | 16,213 | 16,213 | | | | | | |
| Total financial and derivative net assets | 218,232 | 106,780 | 325,012 | | | | | | |
| Total collateral received (pledged) (a) | - | - | - | | | | | | |
| Net amount (b) | 218,232 | 106,780 | 325,012 | | | | | | |
| (a) | In some instances, the actual collateral received and/or pledged may be more than the amount shown due to overcollateralization. |
| (b) | Represents the net amount due from/(to) counterparties in the event of default. |
Security transactions
Security transactions are accounted for on the trade date. Cost is determined and gains (losses) are based upon the specific identification method for both financial statement and federal income tax purposes.
Income recognition
Interest income is recorded on an accrual basis. Market premiums and discounts, including original issue discounts, are amortized and accreted, respectively, over the expected life of the security on all debt securities, unless otherwise noted.
| 30 | Columbia Emerging Markets Bond Fund | Semiannual Report 2017 |
Notes to Financial Statements (continued)
April 30, 2017 (Unaudited)
The Fund may place a debt security on non-accrual status and reduce related interest income when it becomes probable that the interest will not be collected and the amount of uncollectible interest can be reasonably estimated. A defaulted debt security is removed from non-accrual status when the issuer resumes interest payments or when collectibility of interest is reasonably assured.
Dividend income is recorded on the ex-dividend date.
Expenses
General expenses of the Trust are allocated to the Fund and other funds of the Trust based upon relative net assets or other expense allocation methodologies determined by the nature of the expense. Expenses directly attributable to the Fund are charged to the Fund. Expenses directly attributable to a specific class of shares are charged to that share class.
Determination of class net asset value
All income, expenses (other than class-specific expenses, which are charged to that share class, as shown in the Statement of Operations) and realized and unrealized gains (losses) are allocated to each class of the Fund on a daily basis, based on the relative net assets of each class, for purposes of determining the net asset value of each class.
Federal income tax status
The Fund intends to qualify each year as a regulated investment company under Subchapter M of the Internal Revenue Code, as amended, and will distribute substantially all of its taxable income (including net short-term capital gains), if any, for its tax year, and as such will not be subject to federal income taxes. In addition, the Fund intends to distribute in each calendar year substantially all of its net investment income, capital gains and certain other amounts, if any, such that the Fund should not be subject to federal excise tax. Therefore, no federal income or excise tax provision is recorded.
Foreign taxes
The Fund may be subject to foreign taxes on income, gains on investments or currency repatriation, a portion of which may be recoverable. The Fund will accrue such taxes and recoveries, as applicable, based upon its current interpretation of tax rules and regulations that exist in the markets in which it invests.
Realized gains in certain countries may be subject to foreign taxes at the Fund level, based on statutory rates. The Fund accrues for such foreign taxes on realized and unrealized gains at the appropriate rate for each jurisdiction, as applicable. The amount, if any, is disclosed as a liability on the Statement of Assets and Liabilities.
Distributions to shareholders
Distributions from net investment income, if any, are declared and paid monthly. Net realized capital gains, if any, are distributed at least annually. Income distributions and capital gain distributions are determined in accordance with federal income tax regulations, which may differ from GAAP.
Guarantees and indemnifications
Under the Trust’s organizational documents and, in some cases, by contract, its officers and trustees are indemnified against certain liabilities arising out of the performance of their duties to the Trust or its funds. In addition, certain of the Fund’s contracts with its service providers contain general indemnification clauses. The Fund’s maximum exposure under these arrangements is unknown since the amount of any future claims that may be made against the Fund cannot be determined, and the Fund has no historical basis for predicting the likelihood of any such claims.
Investment company reporting modernization
In October 2016, the U.S. Securities and Exchange Commission adopted new rules and forms, and amendments to certain current rules and forms, to modernize reporting and disclosure of information by registered investment companies. The amendments to Regulation S-X will require standardized, enhanced disclosure about derivatives in investment company financial statements, and will also change the rules governing the form and content of such financial statements. The amendments to Regulation S-X take effect on August 1, 2017. At this time, management is assessing the anticipated impact of these regulatory developments.
Columbia Emerging Markets Bond Fund | Semiannual Report 2017
| 31 |
Notes to Financial Statements (continued)
April 30, 2017 (Unaudited)
Note 3. Fees and other transactions with affiliates
Management services fees
The Fund entered into a Management Agreement with Columbia Management Investment Advisers, LLC (the Investment Manager), a wholly-owned subsidiary of Ameriprise Financial, Inc. (Ameriprise Financial). Under the Management Agreement, the Investment Manager provides the Fund with investment research and advice, as well as administrative and accounting services. The management services fee is an annual fee that is equal to a percentage of the Fund’s average daily net assets that declines from 0.600% to 0.393% as the Fund’s net assets increase. The annualized effective management services fee rate for the six months ended April 30, 2017 was 0.599% of the Fund’s average daily net assets.
Participating Affiliates
The Investment Manager and its investment advisory affiliates (Participating Affiliates) around the world may coordinate in providing services to their clients. From time to time the Investment Manager (or any affiliated investment subadviser to the Fund, as the case may be) may engage its Participating Affiliates to provide a variety of services such as investment research, investment monitoring, trading and discretionary investment management (including portfolio management) to certain accounts managed by the Investment Manager, including the Fund. These Participating Affiliates will provide services to the Investment Manager (or any affiliated investment subadviser to the Fund as the case may be) either pursuant to subadvisory agreements, personnel-sharing agreements or similar inter-company arrangements and the Fund will pay no additional fees and expenses as a result of any such arrangements.
These Participating Affiliates, like the Investment Manager, are direct or indirect subsidiaries of Ameriprise Financial and are registered with appropriate respective regulators in their home jurisdictions and, where required, the Securities and Exchange Commission and the Commodity Futures Trading Commission in the United States.
Pursuant to some of these arrangements, certain employees of these Participating Affiliates may serve as "associated persons" of the Investment Manager and, in this capacity, subject to the oversight and supervision of the Investment Manager and consistent with the investment objectives, policies and limitations set forth in the Fund’s prospectus and Statement of Additional Information (SAI), may provide such services to the Fund on behalf of the Investment Manager.
Other expenses
Other expenses are for, among other things, miscellaneous expenses of the Fund or the Board of Trustees, including payments to Board Services Corp., a company providing limited administrative services to the Fund and the Board of Trustees. That company’s expenses include boardroom and office expense, employee compensation, employee health and retirement benefits, and certain other expenses.
Compensation of board members
Members of the Board of Trustees, who are not officers or employees of the Investment Manager or Ameriprise Financial, are compensated for their services to the Fund as disclosed in the Statement of Operations. Under a Deferred Compensation Plan (the Plan), these members of the Board of Trustees may elect to defer payment of up to 100% of their compensation. Deferred amounts are treated as though equivalent dollar amounts had been invested in shares of certain funds managed by the Investment Manager. The Fund’s liability for these amounts is adjusted for market value changes and remains in the Fund until distributed in accordance with the Plan. All amounts payable under the Plan constitute a general unsecured obligation of the Fund.
Compensation of Chief Compliance Officer
The Board of Trustees has appointed a Chief Compliance Officer to the Fund in accordance with federal securities regulations. A portion of the Chief Compliance Officer’s total compensation is allocated to the Fund, along with other affiliated funds governed by the Board of Trustees, based on relative net assets. The total amount allocated to all affiliated funds governed by the Board of Trustees will not exceed $40,000 annually.
| 32 | Columbia Emerging Markets Bond Fund | Semiannual Report 2017 |
Notes to Financial Statements (continued)
April 30, 2017 (Unaudited)
Transfer agency fees
Under a Transfer and Dividend Disbursing Agent Agreement, Columbia Management Investment Services Corp. (the Transfer Agent), an affiliate of the Investment Manager and a wholly-owned subsidiary of Ameriprise Financial, is responsible for providing transfer agency services to the Fund. The Transfer Agent has contracted with Boston Financial Data Services (BFDS) to serve as sub-transfer agent. The Transfer Agent pays the fees of BFDS for services as sub-transfer agent and BFDS is not entitled to reimbursement for such fees from the Fund (with the exception of out-of-pocket fees).
The Fund pays the Transfer Agent a monthly transfer agency fee based on the number or the average value of accounts, depending on the type of account. In addition, the Fund pays the Transfer Agent a fee for shareholder services based on the number of accounts or on a percentage of the average aggregate value of the Fund’s shares maintained in omnibus accounts up to the lesser of the amount charged by the financial intermediary or a cap established by the Board of Trustees from time to time.
The Transfer Agent also receives compensation from the Fund for various shareholder services and reimbursements for certain out-of-pocket fees. Effective January 1, 2017, total transfer agency fees for Class K and Class R5 shares are subject to an annual limitation of not more than 0.075% of the average daily net assets attributable to each share class. Total transfer agency fees for Class I, prior to March 27, 2017 were, and Class Y shares are subject to an annual limitation of not more than 0.025% of the average daily net assets attributable to each share class. In addition, effective March 1, 2017 through February 28, 2018, Class K and Class R5 shares are subject to a contractual transfer agency fee annual limitation of not more than 0.05% and Class I and Class Y shares are subject to a contractual transfer agency fee annual limitation of not more than 0.00% of the average daily net assets attributable to each share class. Prior to January 1, 2017, total transfer agency fees for Class K and Class R5 shares were subject to an annual limitation of not more than 0.05% of the average daily net assets attributable to each share class and Class I and Class Y did not pay transfer agency fees.
For the six months ended April 30, 2017, the Fund’s annualized effective transfer agency fee rates as a percentage of average daily net assets of each class were as follows:
| | Effective rate (%) |
| Class A | 0.27 |
| Class B | 0.27 |
| Class C | 0.27 |
| Class I | 0.004 (a),(b) |
| Class K | 0.050 |
| Class R | 0.27 |
| Class R4 | 0.27 |
| Class R5 | 0.050 |
| Class T | 0.27 |
| Class Y | 0.00 (c) |
| Class Z | 0.27 |
| (a) | Annualized. |
| (b) | Effective March 27, 2017, Class I shares were redeemed or exchanged for Class Y shares. |
| (c) | Rounds to zero. |
An annual minimum account balance fee of $20 may apply to certain accounts with a value below the applicable share class’s initial minimum investment requirements to reduce the impact of small accounts on transfer agency fees. These minimum account balance fees are remitted to the Fund and recorded as part of expense reductions in the Statement of Operations. For the six months ended April 30, 2017, no minimum account balance fees were charged by the Fund.
Plan administration fees
Under a Plan Administration Services Agreement with the Transfer Agent, the Fund pays an annual fee at a rate of 0.25% of the Fund’s average daily net assets attributable to Class K shares for the provision of various administrative, recordkeeping, communication and educational services.
Columbia Emerging Markets Bond Fund | Semiannual Report 2017
| 33 |
Notes to Financial Statements (continued)
April 30, 2017 (Unaudited)
Distribution and service fees
The Fund has an agreement with Columbia Management Investment Distributors, Inc. (the Distributor), an affiliate of the Investment Manager and a wholly-owned subsidiary of Ameriprise Financial, for distribution and shareholder services. Under a Plan and Agreement of Distribution, the Fund pays a fee at an annual rate of up to 0.25% of the Fund’s average daily net assets attributable to Class A and Class T shares, a fee at an annual rate of up to 0.50% of the Fund’s average daily net assets attributable to Class R shares (of which up to 0.25% may be used for shareholder services) and a fee at an annual rate of up to 1.00% of the Fund’s average daily net assets attributable to Class B and Class C shares. For Class B and Class C shares, of the 1.00% fee, up to 0.75% is reimbursed for distribution expenses.
The amount of distribution and shareholder services expenses incurred by the Distributor and not yet reimbursed (unreimbursed expense) was approximately $109,000 and $322,000 for Class B and Class C shares, respectively. These amounts are based on the most recent information available as of March 31, 2017, and may be recovered from future payments under the distribution plan or CDSCs. To the extent the unreimbursed expense has been fully recovered, the distribution and/or shareholder services fee is reduced.
Sales charges
Sales charges, including front-end charges and CDSCs, received by the Distributor for distributing Fund shares for the six months ended April 30, 2017, if any, are listed below:
| | Amount ($) |
| Class A | 18,858 |
| Class B | 119 |
| Class C | 284 |
Expenses waived/reimbursed by the Investment Manager and its affiliates
The Investment Manager and certain of its affiliates have contractually agreed to waive fees and/or reimburse expenses (excluding certain fees and expenses described below) for the periods disclosed below, unless sooner terminated at the sole discretion of the Board of Trustees, so that the Fund’s net operating expenses, after giving effect to fees waived/expenses reimbursed and any balance credits and/or overdraft charges from the Fund’s custodian, do not exceed the following annual rates as a percentage of the class’ average daily net assets:
| | March 1, 2017
through
February 28, 2018 | Prior to
March 1, 2017 |
| Class A | 1.180% | 1.22% |
| Class B | 1.930 | 1.97 |
| Class C | 1.930 | 1.97 |
| Class K | 1.065 | 1.08 |
| Class R | 1.430 | 1.47 |
| Class R4 | 0.930 | 0.97 |
| Class R5 | 0.815 | 0.83 |
| Class T | 1.180 | 1.22 |
| Class Y | 0.765 | 0.78 |
| Class Z | 0.930 | 0.97 |
Under the agreement governing these fee waivers and/or expense reimbursement arrangements, the following fees and expenses are excluded from the waiver/reimbursement commitment, and therefore will be paid by the Fund, if applicable: taxes (including foreign transaction taxes), expenses associated with investments in affiliated and non-affiliated pooled investment vehicles (including mutual funds and exchange-traded funds), transaction costs and brokerage commissions, costs related to any securities lending program, dividend and interest expenses associated with securities sold short, inverse floater program fees and expenses, transaction charges and interest on borrowed money, interest, infrequent and/or unusual expenses and any other expenses the exclusion of which is specifically approved by the Board of Trustees. This agreement may be modified or amended only with approval from the Investment Manager, certain of its affiliates and the Fund. Any fees
| 34 | Columbia Emerging Markets Bond Fund | Semiannual Report 2017 |
Notes to Financial Statements (continued)
April 30, 2017 (Unaudited)
waived and/or expenses reimbursed under the expense reimbursement arrangements described above are not recoverable by the Investment Manager or its affiliates in future periods. In addition to the waiver/reimbursement commitment under the agreement, effective March 1, 2017 through February 28, 2018, is the Transfer Agent’s contractual agreement to limit total transfer agency fees to an annual rate of not more than 0.05% for Class K and R5 and 0.00% for Class Y of the average daily net assets attributable to each share class, unless sooner terminated at the sole discretion of the Board of Trustees.
Note 4. Federal tax information
The timing and character of income and capital gain distributions are determined in accordance with income tax regulations, which may differ from GAAP because of temporary or permanent book to tax differences.
At April 30, 2017, the approximate cost of investments for federal income tax purposes and the aggregate gross approximate unrealized appreciation and depreciation based on that cost was:
Federal
tax cost ($) | Gross unrealized
appreciation ($) | Gross unrealized
(depreciation) ($) | Net unrealized
appreciation ($) |
| 427,498,000 | 22,045,000 | (11,036,000) | 11,009,000 |
The following capital loss carryforwards, determined at October 31, 2016, may be available to reduce taxable income arising from future net realized gains on investments, if any, to the extent permitted by the Internal Revenue Code. Capital loss carryforwards with no expiration are required to be utilized prior to any capital losses which carry an expiration date. As a result of this ordering rule, capital loss carryforwards which carry an expiration date may be more likely to expire unused.
| 2017 ($) | 2018 ($) | 2019 ($) | No expiration
short-term ($) | No expiration
long-term ($) | Total ($) |
| — | — | — | 753,667 | 25,192,544 | 25,946,211 |
Management of the Fund has concluded that there are no significant uncertain tax positions in the Fund that would require recognition in the financial statements. However, management’s conclusion may be subject to review and adjustment at a later date based on factors including, but not limited to, new tax laws, regulations, and administrative interpretations (including relevant court decisions). Generally, the Fund’s federal tax returns for the prior three fiscal years remain subject to examination by the Internal Revenue Service.
Note 5. Portfolio information
The cost of purchases and proceeds from sales of securities, excluding short-term investments and derivatives, if any, aggregated to $105,488,042 and $117,373,196, respectively, for the six months ended April 30, 2017. The amount of purchase and sale activity impacts the portfolio turnover rate reported in the Financial Highlights.
Note 6. Affiliated money market fund
The Fund invests in Columbia Short-Term Cash Fund, an affiliated money market fund established for the exclusive use by the Fund and other affiliated funds (the Affiliated MMF). The income earned by the Fund from such investments is included as Dividends - affiliated issuers in the Statement of Operations. As an investing fund, the Fund indirectly bears its proportionate share of the expenses of the Affiliated MMF. The Affiliated MMF prices its shares with a floating net asset value. In addition, the Board of Trustees of the Affiliated MMF may impose a fee on redemptions (sometimes referred to as a liquidity fee) or temporarily suspend redemptions (sometimes referred to as imposing a redemption gate) in the event its liquidity falls below regulatory limits.
Note 7. Line of credit
The Fund has access to a revolving credit facility with a syndicate of banks led by Citibank, N.A., HSBC Bank USA, N.A. and JPMorgan Chase Bank, N.A. whereby the Fund may borrow for the temporary funding of shareholder redemptions or for other temporary or emergency purposes. The credit facility agreement, which is a collective agreement between the Fund and certain other funds managed by the Investment Manager, severally and not jointly, permits collective borrowings up to $1 billion. Interest is charged to each participating fund based on its borrowings at a rate equal to the higher of (i) the
Columbia Emerging Markets Bond Fund | Semiannual Report 2017
| 35 |
Notes to Financial Statements (continued)
April 30, 2017 (Unaudited)
overnight federal funds rate plus 1.00% or (ii) the one-month LIBOR rate plus 1.00%. Each borrowing under the credit facility matures no later than 60 days after the date of borrowing. The Fund also pays a commitment fee equal to its pro rata share of the amount of the credit facility at a rate of 0.15% per annum. The commitment fee is included in other expenses in the Statement of Operations.
The Fund had no borrowings during the six months ended April 30, 2017.
Note 8. Significant risks
Credit risk
Credit risk is the risk that the value of debt securities in the Fund’s portfolio may decline because the issuer may default and fail to pay interest or repay principal when due. Rating agencies assign credit ratings to debt securities to indicate their credit risk. Lower rated or unrated debt securities held by the Fund may present increased credit risk as compared to higher-rated debt securities.
Foreign securities and emerging market countries risk
Investing in foreign securities may include certain risks and considerations not typically associated with investing in U.S. securities, such as fluctuating currency values and changing local and regional economic, political and social conditions, which may result in greater market volatility. In addition, certain foreign securities may not be as liquid as U.S. securities. Investing in emerging markets may accentuate these risks. These countries are also more likely to experience high levels of inflation, deflation or currency devaluation which could hurt their economies and securities markets. To the extent that the Fund concentrates its investment exposure to any one or a few specific countries, the Fund will be particularly susceptible to the various conditions, events or other factors impacting those countries and may, therefore, have a greater risk than that of a fund which is more geographically diversified.
High-yield investments risk
Securities and other debt instruments held by the Fund that are rated below investment grade (commonly called "high-yield" or "junk" bonds) and unrated debt instruments of comparable quality expose the Fund to a greater risk of loss of principal and income than a fund that invests solely or primarily in investment grade securities. In addition, these investments have greater price fluctuations, are less liquid and are more likely to experience a default than higher-rated debt instruments. High-yield debt instruments are considered to be predominantly speculative with respect to the issuer’s capacity to pay interest and repay principal.
Interest rate risk
Interest rate risk is the risk of losses attributable to changes in interest rates. In general, if prevailing interest rates rise, the values of debt securities tend to fall, and if interest rates fall, the values of debt securities tend to rise. Actions by governments and central banking authorities can result in increases in interest rates. Increasing interest rates may negatively affect the value of debt securities held by the Fund, resulting in a negative impact on the Fund’s performance and net asset value per share. In general, the longer the maturity or duration of a debt security, the greater its sensitivity to changes in interest rates.
Liquidity risk
Liquidity risk is the risk associated with a lack of marketability of investments which may make it difficult to sell the investment at a desirable time or price. Changing regulatory, market or other conditions or environments (for example, the interest rate or credit environments) may adversely affect the liquidity of the Fund’s investments. The Fund may have to accept a lower selling price for the holding, sell other investments, or forego another, more appealing investment opportunity. Generally, the less liquid the market at the time the Fund sells a portfolio investment, the greater the risk of loss or decline of value to the Fund. A less liquid market can lead to an increase in Fund redemptions, which may negatively impact Fund performance and net asset value per share, including, for example, if the Fund is forced to sell securities in a down market.
| 36 | Columbia Emerging Markets Bond Fund | Semiannual Report 2017 |
Notes to Financial Statements (continued)
April 30, 2017 (Unaudited)
Non-diversification risk
A non-diversified fund is permitted to invest a greater percentage of its total assets in fewer issuers than a diversified fund. The Fund may, therefore, have a greater risk of loss from a few issuers than a similar fund that invests more broadly.
Shareholder concentration risk
At April 30, 2017, affiliated shareholders of record owned 55.8% of the outstanding shares of the Fund in one or more accounts. Subscription and redemption activity by concentrated accounts may have a significant effect on the operations of the Fund. In the case of a large redemption, the Fund may be forced to sell investments at inopportune times, including its liquid or more liquid positions, resulting in Fund losses and the Fund holding a higher percentage of less liquid or illiquid securities. Large redemptions could result in decreased economies of scale and increased operating expenses for non-redeeming Fund shareholders.
Note 9. Subsequent events
Management has evaluated the events and transactions that have occurred through the date the financial statements were issued. Other than as noted in Note 1 and below, there were no items requiring adjustment of the financial statements or additional disclosure.
On April 21, 2017, the Board of Trustees approved a change in the Fund’s fiscal year end from October 31 to August 31. The change will be effective on August 31, 2017.
Note 10. Information regarding pending and settled legal proceedings
Ameriprise Financial and certain of its affiliates have historically been involved in a number of legal, arbitration and regulatory proceedings, including routine litigation, class actions, and governmental actions, concerning matters arising in connection with the conduct of their business activities. Ameriprise Financial believes that the Funds are not currently the subject of, and that neither Ameriprise Financial nor any of its affiliates are the subject of, any pending legal, arbitration or regulatory proceedings that are likely to have a material adverse effect on the Funds or the ability of Ameriprise Financial or its affiliates to perform under their contracts with the Funds. Ameriprise Financial is required to make quarterly (10-Q), annual (10-K) and, as necessary, 8-K filings with the Securities and Exchange Commission (SEC) on legal and regulatory matters that relate to Ameriprise Financial and its affiliates. Copies of these filings may be obtained by accessing the SEC website at www.sec.gov.
There can be no assurance that these matters, or the adverse publicity associated with them, will not result in increased fund redemptions, reduced sale of fund shares or other adverse consequences to the Funds. Further, although we believe proceedings are not likely to have a material adverse effect on the Funds or the ability of Ameriprise Financial or its affiliates to perform under their contracts with the Funds, these proceedings are subject to uncertainties and, as such, we are unable to estimate the possible loss or range of loss that may result. An adverse outcome in one or more of these proceedings could result in adverse judgments, settlements, fines, penalties or other relief that could have a material adverse effect on the consolidated financial condition or results of operations of Ameriprise Financial.
Columbia Emerging Markets Bond Fund | Semiannual Report 2017
| 37 |
The Fund mails one shareholder report to each shareholder address. If you would like more than one report, please call shareholder services at 800.345.6611 and additional reports will be sent to you.
Proxy voting policies and procedures
The policy of the Board of Trustees is to vote the proxies of the companies in which the Fund holds investments consistent with the procedures as stated in the Statement of Additional Information (SAI). You may obtain a copy of the SAI without charge by calling 800.345.6611; contacting your financial intermediary; visiting investor.columbiathreadneedleus.com; or searching the website of the Securities and Exchange Commission (SEC) at sec.gov. Information regarding how the Fund voted proxies relating to portfolio securities is filed with the SEC by August 31st for the most recent 12-month period ending June 30th of that year, and is available without charge by visiting investor.columbiathreadneedleus.com, or searching the website of the SEC at sec.gov.
Quarterly schedule of investments
The Fund files a complete schedule of portfolio holdings with the SEC for the first and third quarters of each fiscal year on Form N-Q. The Fund’s Form N-Q is available on the SEC’s website at sec.gov and may be reviewed and copied at the SEC’s Public Reference Room in Washington, D.C. Information on the operation of the Public Reference Room may be obtained by calling 800.SEC.0330. The Fund’s complete schedule of portfolio holdings, as filed on Form N-Q, can also be obtained without charge, upon request, by calling 800.345.6611.
Additional Fund information
For more information about the Fund, please visit investor.columbiathreadneedleus.com or call 800.345.6611. Customer Service Representatives are available to answer your questions Monday through Friday from 8 a.m. to 7 p.m. Eastern time.
Fund investment manager
Columbia Management Investment Advisers, LLC
225 Franklin Street
Boston, MA 02110
Fund distributor
Columbia Management Investment Distributors, Inc.
225 Franklin Street
Boston, MA 02110
Fund transfer agent
Columbia Management Investment Services Corp.
P.O. Box 8081
Boston, MA 02266-8081
| 38 | Columbia Emerging Markets Bond Fund | Semiannual Report 2017 |
[THIS PAGE INTENTIONALLY LEFT BLANK]
[THIS PAGE INTENTIONALLY LEFT BLANK]
[THIS PAGE INTENTIONALLY LEFT BLANK]
Columbia Emerging Markets Bond Fund
P.O. Box 8081
Boston, MA 02266-8081
Please read and consider the investment objectives, risks, charges and expenses for any fund carefully before investing. For a prospectus and summary prospectus, which contains this and other important information about the Fund, go to
investor.columbiathreadneedleus.com. The Fund is distributed by Columbia Management Investment Distributors, Inc., member FINRA, and managed by Columbia Management Investment Advisers, LLC.
Columbia Threadneedle Investments (Columbia Threadneedle) is the global brand name of the Columbia and Threadneedle group of companies. All rights reserved. Columbia Management Investment Distributors, Inc., 225 Franklin Street, Boston, MA 02110-2804
© 2017 Columbia Management Investment Advisers, LLC.
investor.columbiathreadneedleus.com

SemiAnnual Report
April 30, 2017
Columbia Seligman Global Technology Fund
Not FDIC Insured • No bank guarantee • May lose value
Dear Shareholders,
While emotions have run high following the outcome of the U.S. Presidential election, it remains unclear how the Trump presidency will unfold in terms of policy. We have a sense of the priorities espoused by the President over the past eighteen months, but campaign priorities are not always realized and are often never pursued. What seems certain is that, while some investors have already priced expectations into the market, others have retreated, preferring instead a wait and see approach. The outcome of such behaviors appears to have created conditions ripe for ongoing market volatility.
While volatility in the financial markets can be stressful, volatility itself is not a new phenomenon. Other factors that have been at the root cause of recent volatility include uncertainty following the United Kingdom’s vote to exit the European Union (Brexit), speculation around the Federal Reserve’s decision to increase interest rates, divergent central bank policy and geopolitical unrest. The point is, financial markets have fluctuated for years and may be expected to continue to fluctuate — sometimes wildly. If anything, such volatility seems to be the new normal, perhaps exacerbated by access to information and development of technological tools which have enabled investors to react rapidly to real and perceived change. So what can you do?
Position your portfolio for the reality of market volatility
That there is a historical precedent for market volatility, or even an acceptance that it may persist, offers little comfort. A measured and strategic approach remains the best strategy for investors to stay on track in achieving their investment goals.
Step 1: Review your investment goals
Take this opportunity to review your investment goals and the strategies you are pursuing to achieve those goals in order to remain focused on what’s important to you. It is entirely possible that your goals have changed in response either to your life situation or to changes in the market. Accept what you can’t control — volatility, and focus on what you can — your investment goals and strategies.
Step 2: Reassess your risk tolerance
Sit down with your financial advisor to discuss your investment goals and strategies, as well as any changes to your tolerance for risk. Consider your investment horizon. Increased market volatility and a new investment horizon may impact the strategies that can best help you achieve your investment goals. Remember, achieving your investment goals may require a certain amount of risk. Ultimately, you must maintain vigilance in reassessing your risk tolerance and the strategies you have selected in pursuit of your investment goals, and awareness of how those strategies may react to market volatility.
Step 3: Remain calm and focus on your long-term plan
Remember, investing is about the long game. Short term events are not necessarily evidence of a longer term reality. Investors who attempt to time the market too often end up reacting to a down turn by selling low and then compounding the problem by waiting on the sidelines, ultimately missing the right opportunity to reinvest.
Columbia Seligman Global Technology Fund | Semiannual Report 2017
President’s Message (continued)
As long as there is a market, there will be volatility. How you respond to that volatility can make a big difference in the measure of your success as an investor. Talk to your financial advisor about how working with Columbia Threadneedle Investments may help you position your portfolio for the reality of ongoing volatility and, perhaps, even turn such volatility into investment opportunity.
Sincerely,
Christopher O. Petersen
President, Columbia Funds
Investors should consider the investment objectives, risks, charges and expenses of a mutual fund carefully before investing. For a free prospectus and summary prospectus, which contains this and other important information about a fund, visit investor.columbiathreadneedleus.com. The prospectus should be read carefully before investing.
Columbia Funds are distributed by Columbia Management Investment Distributors, Inc., member FINRA, and managed by Columbia Management Investment Advisers, LLC.
© 2017 Columbia Management Investment Advisers, LLC. All rights reserved.
Columbia Seligman Global Technology Fund | Semiannual Report 2017
Columbia Seligman Global Technology Fund | Semiannual Report 2017
Fund at a Glance
(Unaudited)
Investment objective
Columbia Seligman Global Technology Fund (the Fund) seeks to to provide shareholders with long-term capital appreciation.
Portfolio management
Paul Wick
Lead manager
Managed Fund since 1994
Rahul Narang
Co-manager
Managed Fund since 2014
Shekhar Pramanick
Co-manager
Managed Fund since 2014
Sanjay Devgan
Technology Team member
Managed Fund since 2014
Jeetil Patel
Technology Team member
Managed Fund since 2015
Christopher Boova
Technology Team member
Managed Fund since 2016
Morningstar style boxTM
The Morningstar Style Box is based on a fund’s portfolio holdings. For equity funds, the vertical axis shows the market capitalization of the stocks owned, and the horizontal axis shows investment style (value, blend, or growth). Information shown is based on the most recent data provided by Morningstar.
© 2017 Morningstar, Inc. All rights reserved. The Morningstar information contained herein: (1) is proprietary to Morningstar and/or its content providers; (2) may not be copied or distributed; and (3) is not warranted to be accurate, complete or timely. Neither Morningstar nor its content providers are responsible for any damages or losses arising from any use of this information.
| Average annual total returns (%) (for the period ended April 30, 2017) |
| | | Inception | 6 Months
cumulative | 1 Year | 5 Years | 10 Years |
| Class A | Excluding sales charges | 05/23/94 | 21.80 | 42.59 | 17.06 | 11.34 |
| | Including sales charges | | 14.81 | 34.40 | 15.68 | 10.69 |
| Class B | Excluding sales charges | 04/22/96 | 21.35 | 41.48 | 16.18 | 10.50 |
| | Including sales charges | | 16.35 | 36.48 | 15.96 | 10.50 |
| Class C | Excluding sales charges | 05/27/99 | 21.36 | 41.50 | 16.19 | 10.51 |
| | Including sales charges | | 20.36 | 40.50 | 16.19 | 10.51 |
| Class K * | 08/03/09 | 21.85 | 42.70 | 17.23 | 11.49 |
| Class R | 04/30/03 | 21.65 | 42.24 | 16.77 | 11.06 |
| Class R4 * | 11/08/12 | 21.92 | 42.91 | 17.32 | 11.47 |
| Class R5 * | 08/03/09 | 21.97 | 43.06 | 17.53 | 11.68 |
| Class Y * | 03/01/17 | 21.87 | 42.68 | 17.07 | 11.35 |
| Class Z * | 09/27/10 | 21.91 | 42.92 | 17.35 | 11.53 |
| MSCI World Information Technology Index (Net) | | 15.92 | 32.51 | 14.15 | 8.71 |
Returns for Class A are shown with and without the maximum initial sales charge of 5.75%. Returns for Class B are shown with and without the applicable contingent deferred sales charge (CDSC) of 5.00% in the first year, declining to 1.00% in the sixth year and eliminated thereafter. The Fund does not accept new investments in Class B shares, except for certain limited transactions. The Fund’s current Class B investors, having held their shares for the requisite time period, are no longer subject to a CDSC upon redemption of their shares. Returns for Class C are shown with and without the 1.00% CDSC for the first year only. The Fund’s other classes are not subject to sales charges and have limited eligibility. Please see the Fund’s prospectus for details. Performance for different share classes will vary based on differences in sales charges and fees associated with each class. All results shown assume reinvestment of distributions during the period. Returns do not reflect the deduction of taxes that a shareholder may pay on Fund distributions or on the redemption of Fund shares. Performance results reflect the effect of any fee waivers or reimbursements of Fund expenses by Columbia Management Investment Advisers, LLC and/or any of its affiliates. Absent these fee waivers or expense reimbursement arrangements, performance results would have been lower.
The performance information shown represents past performance and is not a guarantee of future results. The investment return and principal value of your investment will fluctuate so that your shares, when redeemed, may be worth more or less than their original cost. Current performance may be lower or higher than the performance information shown. You may obtain performance information current to the most recent month-end by contacting your financial intermediary, visiting investor.columbiathreadneedleus.com or calling 800.345.6611.
| * | The returns shown for periods prior to the share class inception date (including returns for the Life of the Fund, if shown, which are since Fund inception) include the returns of the Fund’s oldest share class. These returns are adjusted to reflect any higher class-related operating expenses of the newer share classes, as applicable. Please visit investor.columbiathreadneedleus.com/investment-products/mutual-funds/appended-performance for more information. |
The MSCI World Information Technology Index (Net) is a free float-adjusted market capitalization index designed to measure information technology stock performance in the global developed equity market.
Indices are not available for investment, are not professionally managed and do not reflect sales charges, fees, brokerage commissions, taxes (except the MSCI World Information Technology Index (Net), which reflects reinvested dividends net of withholding taxes) or other expenses of investing. Securities in the Fund may not match those in an index.
Columbia Seligman Global Technology Fund | Semiannual Report 2017
| 3 |
Fund at a Glance (continued)
(Unaudited)
| Top 10 holdings (%) (at April 30, 2017) |
| Lam Research Corp. (United States) | 9.6 |
| Broadcom Ltd. (Singapore) | 6.6 |
| Apple, Inc. (United States) | 5.2 |
| Qorvo, Inc. (United States) | 4.5 |
| Synopsys, Inc. (United States) | 3.6 |
| Western Digital Corp. (United States) | 3.4 |
| Nuance Communications, Inc. (United States) | 3.2 |
| Teradyne, Inc. (United States) | 3.1 |
| Maxim Integrated Products, Inc. (United States) | 3.1 |
| Synaptics, Inc. (United States) | 3.0 |
Percentages indicated are based upon total investments (excluding Money Market Funds).
For further detail about these holdings, please refer to the section entitled “Portfolio of Investments.”
Fund holdings are as of the date given, are subject to change at any time, and are not recommendations to buy or sell any security.
| Equity sector breakdown (%) (at April 30, 2017) |
| Consumer Discretionary | 1.6 |
| Health Care | 0.8 |
| Information Technology | 97.6 |
| Total | 100.0 |
Percentages indicated are based upon total equity investments. The Fund’s portfolio composition is subject to change.
| Equity sub-industry breakdown (%) (at April 30, 2017) |
| Information Technology | |
| Application Software | 8.9 |
| Communications Equipment | 3.3 |
| Data Processing & Outsourced Services | 4.3 |
| Electronic Equipment & Instruments | 1.3 |
| Home Entertainment Software | 0.5 |
| Internet Software & Services | 7.8 |
| IT Consulting & Other Services | 1.1 |
| Semiconductor Equipment | 15.0 |
| Semiconductors | 34.6 |
| Systems Software | 8.0 |
| Technology Hardware, Storage & Peripherals | 12.8 |
| Total | 97.6 |
Percentages indicated are based upon total equity investments. The Fund’s portfolio composition is subject to change.
| Country breakdown (%) (at April 30, 2017) |
| China | 0.3 |
| Germany | 0.2 |
| Israel | 4.7 |
| Japan | 0.2 |
| Netherlands | 2.5 |
| Singapore | 6.3 |
| Taiwan | 0.5 |
| United States(a) | 85.3 |
| Total | 100.0 |
| (a) | Includes investments in Money Market Funds. |
Country breakdown is based primarily on issuer’s place of organization/incorporation. Percentages indicated are based upon total investments. The Fund’s portfolio composition is subject to change.
The Fund may use place of organization/incorporation or other factors in determining whether an issuer is domestic (U.S.) or foreign for purposes of its investment policies. At April 30, 2017, the Fund invested at least 40% of its net assets in foreign companies in accordance with its principal investment strategy.
Summary of investments in securities by industry (%)
(at April 30, 2017) |
| Communications Equipment | 3.2 |
| Electronic Equipment, Instruments & Components | 1.2 |
| Health Care Equipment & Supplies | 0.7 |
| Internet & Direct Marketing Retail | 0.9 |
| Internet Software & Services | 7.4 |
| IT Services | 5.2 |
| Media | 0.6 |
| Semiconductors & Semiconductor Equipment | 47.1 |
| Software | 16.4 |
| Technology Hardware, Storage & Peripherals | 12.3 |
| Money Market Funds | 4.3 |
| Total | 99.3 |
Percentages indicated are based upon net assets. The Fund’s portfolio composition is subject to change.
| 4 | Columbia Seligman Global Technology Fund | Semiannual Report 2017 |
Understanding Your Fund’s Expenses
(Unaudited)
As an investor, you incur two types of costs. There are transaction costs, which generally include sales charges on purchases and may include redemption fees. There are also ongoing costs, which generally include management fees, distribution and/or service fees, and other fund expenses. The following information is intended to help you understand your ongoing costs (in dollars) of investing in the Fund and to help you compare these costs with the ongoing costs of investing in other mutual funds.
Analyzing your Fund’s expenses
To illustrate these ongoing costs, we have provided examples and calculated the expenses paid by investors in each share class of the Fund during the period. The actual and hypothetical information in the table is based on an initial investment of $1,000 at the beginning of the period indicated and held for the entire period. Expense information is calculated two ways and each method provides you with different information. The amount listed in the “Actual” column is calculated using the Fund’s actual operating expenses and total return for the period. You may use the Actual information, together with the amount invested, to estimate the expenses that you paid over the period. Simply divide your account value by $1,000 (for example, an $8,600 account value divided by $1,000 = 8.6), then multiply the results by the expenses paid during the period under the “Actual” column. The amount listed in the “Hypothetical” column assumes a 5% annual rate of return before expenses (which is not the Fund’s actual return) and then applies the Fund’s actual expense ratio for the period to the hypothetical return. You should not use the hypothetical account values and expenses to estimate either your actual account balance at the end of the period or the expenses you paid during the period. See “Compare with other funds” below for details on how to use the hypothetical data.
Compare with other funds
Since all mutual funds are required to include the same hypothetical calculations about expenses in shareholder reports, you can use this information to compare the ongoing cost of investing in the Fund with other funds. To do so, compare the hypothetical example with the 5% hypothetical examples that appear in the shareholder reports of other funds. As you compare hypothetical examples of other funds, it is important to note that hypothetical examples are meant to highlight the ongoing costs of investing in a fund only and do not reflect any transaction costs, such as sales charges, or redemption or exchange fees. Therefore, the hypothetical calculations are useful in comparing ongoing costs only, and will not help you determine the relative total costs of owning different funds. If transaction costs were included in these calculations, your costs would be higher.
| November 1, 2016 — April 30, 2017 |
| | Account value at the
beginning of the
period ($) | Account value at the
end of the
period ($) | Expenses paid during
the period ($) | Fund’s annualized
expense ratio (%) |
| | Actual | Hypothetical | Actual | Hypothetical | Actual | Hypothetical | Actual |
| Class A | 1,000.00 | 1,000.00 | 1,218.00 | 1,017.95 | 7.29 | 6.63 | 1.34 |
| Class B | 1,000.00 | 1,000.00 | 1,213.50 | 1,014.32 | 11.29 | 10.27 | 2.08 |
| Class C | 1,000.00 | 1,000.00 | 1,213.60 | 1,014.27 | 11.34 | 10.32 | 2.09 |
| Class K | 1,000.00 | 1,000.00 | 1,218.50 | 1,018.34 | 6.85 | 6.24 | 1.26 |
| Class R | 1,000.00 | 1,000.00 | 1,216.50 | 1,016.72 | 8.64 | 7.86 | 1.59 |
| Class R4 | 1,000.00 | 1,000.00 | 1,219.20 | 1,019.18 | 5.93 | 5.40 | 1.09 |
| Class R5 | 1,000.00 | 1,000.00 | 1,219.70 | 1,019.52 | 5.55 | 5.05 | 1.02 |
| Class Y | 1,000.00 | 1,000.00 | 1,050.50 (a) | 1,019.18 | 1.75 (a) | 5.40 | 1.09 (a) |
| Class Z | 1,000.00 | 1,000.00 | 1,219.10 | 1,019.08 | 6.04 | 5.50 | 1.11 |
| (a) | Based on operations from March 1, 2017 (commencement of operations) through the stated period end. |
Expenses paid during the period are equal to the annualized expense ratio for each class as indicated above, multiplied by the average account value over the period and then multiplied by the number of days in the Fund’s most recent fiscal half year and divided by 365.
Expenses do not include fees and expenses incurred indirectly by the Fund from its investment in underlying funds, including affiliated and non-affiliated pooled investment vehicles, such as mutual funds and exchange-traded funds.
Columbia Seligman Global Technology Fund | Semiannual Report 2017
| 5 |
Portfolio of Investments
April 30, 2017 (Unaudited)
(Percentages represent value of investments compared to net assets)
| Common Stocks 95.0% |
| Issuer | Shares | Value ($) |
| China 0.3% |
| Ctrip.com International Ltd., ADR(a) | 57,000 | 2,879,070 |
| Germany 0.2% |
| Zalando SE(a) | 44,500 | 1,962,463 |
| Israel 4.6% |
| Check Point Software Technologies Ltd.(a) | 100,760 | 10,480,048 |
| CyberArk Software Ltd.(a) | 112,600 | 5,957,666 |
| Mellanox Technologies Ltd.(a) | 240,000 | 11,328,000 |
| Orbotech Ltd.(a) | 359,400 | 11,835,042 |
| Tower Semiconductor Ltd.(a) | 218,739 | 4,707,263 |
| Total | 44,308,019 |
| Japan 0.1% |
| Nintendo Co., Ltd., ADR(a) | 45,500 | 1,440,985 |
| Netherlands 2.5% |
| NXP Semiconductors NV(a) | 227,144 | 24,020,478 |
| Singapore 6.3% |
| Broadcom Ltd. | 272,996 | 60,280,247 |
| Taiwan 0.5% |
| Catcher Technology Co., Ltd. | 466,000 | 4,785,519 |
| United States 80.5% |
| Adobe Systems, Inc.(a) | 17,500 | 2,340,450 |
| Advanced Energy Industries, Inc.(a) | 10,287 | 759,181 |
| Alere, Inc.(a) | 145,900 | 7,173,903 |
| Alphabet, Inc., Class A(a) | 22,200 | 20,524,344 |
| Alphabet, Inc., Class C(a) | 25,843 | 23,412,724 |
| Apple, Inc. | 331,985 | 47,689,645 |
| Applied Materials, Inc. | 504,600 | 20,491,806 |
| Arista Networks, Inc.(a) | 78,141 | 10,911,609 |
| Arris International PLC(a) | 461,600 | 11,996,984 |
| Cavium, Inc.(a) | 281,647 | 19,391,396 |
| Cirrus Logic, Inc.(a) | 69,100 | 4,446,585 |
| Comcast Corp., Class A | 140,000 | 5,486,600 |
| CPI Card Group, Inc. | 517,562 | 1,863,223 |
| DXC Technology Co.(a) | 126,392 | 9,522,373 |
| eBay, Inc.(a) | 300,900 | 10,053,069 |
| Electronics for Imaging, Inc.(a) | 294,682 | 13,490,542 |
| Euronet Worldwide, Inc.(a) | 52,674 | 4,351,926 |
| Facebook, Inc., Class A(a) | 103,400 | 15,535,850 |
| Common Stocks (continued) |
| Issuer | Shares | Value ($) |
| Fidelity National Information Services, Inc. | 51,200 | 4,310,528 |
| Fortinet, Inc.(a) | 318,000 | 12,402,000 |
| GoDaddy, Inc., Class A(a) | 23,900 | 930,188 |
| Hewlett Packard Enterprise Co. | 440,100 | 8,199,063 |
| Inphi Corp.(a) | 167,200 | 6,925,424 |
| Integrated Device Technology, Inc.(a) | 714,900 | 17,150,451 |
| Lam Research Corp. | 602,423 | 87,260,971 |
| Lattice Semiconductor Corp.(a) | 1,818,187 | 12,472,763 |
| Maxim Integrated Products, Inc. | 640,162 | 28,263,152 |
| Microchip Technology, Inc. | 119,400 | 9,024,252 |
| Micron Technology, Inc.(a) | 943,100 | 26,095,577 |
| Microsoft Corp. | 117,900 | 8,071,434 |
| Nuance Communications, Inc.(a) | 1,635,457 | 29,258,326 |
| Oclaro, Inc.(a) | 935,200 | 7,490,952 |
| Okta, Inc.(a) | 36,309 | 945,849 |
| ON Semiconductor Corp.(a) | 770,204 | 10,921,493 |
| Oracle Corp. | 367,000 | 16,500,320 |
| Priceline Group, Inc. (The)(a) | 2,200 | 4,063,004 |
| Qorvo, Inc.(a) | 597,204 | 40,627,788 |
| Salesforce.com, Inc.(a) | 101,433 | 8,735,410 |
| Skyworks Solutions, Inc. | 120,581 | 12,026,749 |
| Splunk, Inc.(a) | 76,700 | 4,932,577 |
| Synaptics, Inc.(a) | 498,664 | 27,311,827 |
| Synopsys, Inc.(a) | 450,611 | 33,210,031 |
| Tableau Software, Inc., Class A(a) | 50,435 | 2,707,351 |
| Teradyne, Inc. | 803,499 | 28,339,410 |
| TiVo Corp. | 867,400 | 17,131,150 |
| Travelport Worldwide Ltd. | 649,598 | 8,555,206 |
| Verint Systems, Inc.(a) | 55,100 | 2,165,430 |
| Visa, Inc., Class A | 242,100 | 22,084,362 |
| Western Digital Corp. | 343,300 | 30,577,731 |
| Xerox Corp. | 1,435,100 | 10,318,369 |
| Zynga, Inc., Class A(a) | 1,000,600 | 2,891,734 |
| Total | 771,343,082 |
Total Common Stocks
(Cost $609,330,814) | 911,019,863 |
|
The accompanying Notes to Financial Statements are an integral part of this statement.
| 6 | Columbia Seligman Global Technology Fund | Semiannual Report 2017 |
Portfolio of Investments (continued)
April 30, 2017 (Unaudited)
| Money Market Funds 4.3% |
| | Shares | Value ($) |
| Columbia Short-Term Cash Fund, 0.869%(b),(c) | 41,222,916 | 41,222,916 |
Total Money Market Funds
(Cost $41,222,282) | 41,222,916 |
Total Investments
(Cost $650,553,096) | 952,242,779 |
| Other Assets & Liabilities, Net | | 6,531,560 |
| Net Assets | $958,774,339 |
Notes to Portfolio of Investments
| (a) | Non-income producing investment. |
| (b) | The rate shown is the seven-day current annualized yield at April 30, 2017. |
| (c) | As defined in the Investment Company Act of 1940, an affiliated company is one in which the Fund owns 5% or more of the company’s outstanding voting securities, or a company which is under common ownership or control with the Fund. Holdings and transactions in these affiliated companies during the period ended April 30, 2017 are as follows: |
| Issuer | Beginning
shares | Shares
purchased | Shares
sold | Ending
shares | Realized gain
(loss) ($) | Dividends —
affiliated
issuers($) | Value ($) |
| Columbia Short-Term Cash Fund, 0.869% | 2,798,952 | 148,966,703 | (110,542,739) | 41,222,916 | (1,769) | 88,172 | 41,222,916 |
Abbreviation Legend
| ADR | American Depositary Receipt |
Fair value measurements
The Fund categorizes its fair value measurements according to a three-level hierarchy that maximizes the use of observable inputs and minimizes the use of unobservable inputs by prioritizing that the most observable input be used when available. Observable inputs are those that market participants would use in pricing an investment based on market data obtained from sources independent of the reporting entity. Unobservable inputs are those that reflect the Fund’s assumptions about the information market participants would use in pricing an investment. An investment’s level within the fair value hierarchy is based on the lowest level of any input that is deemed significant to the asset’s or liability’s fair value measurement. The input levels are not necessarily an indication of the risk or liquidity associated with investments at that level. For example, certain U.S. government securities are generally high quality and liquid, however, they are reflected as Level 2 because the inputs used to determine fair value may not always be quoted prices in an active market.
Fair value inputs are summarized in the three broad levels listed below:
| • | Level 1 – Valuations based on quoted prices for investments in active markets that the Fund has the ability to access at the measurement date (including NAV for open-end mutual funds). Valuation adjustments are not applied to Level 1 investments. |
| • | Level 2 – Valuations based on other significant observable inputs (including quoted prices for similar securities, interest rates, prepayment speeds, credit risks, etc.). |
| • | Level 3 – Valuations based on significant unobservable inputs (including the Fund’s own assumptions and judgment in determining the fair value of investments) |
Inputs that are used in determining fair value of an investment may include price information, credit data, volatility statistics, and other factors. These inputs can be either observable or unobservable. The availability of observable inputs can vary between investments, and is affected by various factors such as the type of investment, and the volume and level of activity for that investment or similar investments in the marketplace. The inputs will be considered by the Investment Manager, along with any other relevant factors in the calculation of an investment’s fair value. The Fund uses prices and inputs that are current as of the measurement date, which may include periods of market dislocations. During these periods, the availability of prices and inputs may be reduced for many investments. This condition could cause an investment to be reclassified between the various levels within the hierarchy.
Foreign equity securities actively traded in markets where there is a significant delay in the local close relative to the New York Stock Exchange are classified as Level 2. The values of these securities may include an adjustment to reflect the impact of significant market movements following the close of local trading, as described in Note 2 to the financial statements – Security valuation.
Certain investments that have been measured at fair value using the net asset value (NAV) per share (or its equivalent) are not categorized in the fair value hierarchy. The fair value amounts presented in the table are intended to reconcile the fair value hierarchy to the amounts presented in the Portfolio of Investments. The Columbia Short-Term Cash Fund seeks to provide shareholders with maximum current income consistent with liquidity and stability of principal. Columbia Short-Term Cash Fund prices its shares with a floating NAV and no longer seeks to maintain a stable NAV.
Investments falling into the Level 3 category are primarily supported by quoted prices from brokers and dealers participating in the market for those investments. However, these may be classified as Level 3 investments due to lack of market transparency and corroboration to support these quoted prices. Additionally, valuation models may be used as the pricing source for any remaining investments classified as Level 3. These models may rely on one or more significant unobservable inputs and/or significant assumptions by the Investment Manager. Inputs used in valuations may include, but are not limited to, financial statement analysis, capital account balances, discount rates and estimated cash flows, and comparable company data.
The accompanying Notes to Financial Statements are an integral part of this statement.
Columbia Seligman Global Technology Fund | Semiannual Report 2017
| 7 |
Portfolio of Investments (continued)
April 30, 2017 (Unaudited)
Fair value measurements (continued)
Under the direction of the Fund’s Board of Trustees (the Board), the Investment Manager’s Valuation Committee (the Committee) is responsible for overseeing the valuation procedures approved by the Board. The Committee consists of voting and non-voting members from various groups within the Investment Manager’s organization, including operations and accounting, trading and investments, compliance, risk management and legal.
The Committee meets at least monthly to review and approve valuation matters, which may include a description of specific valuation determinations, data regarding pricing information received from approved pricing vendors and brokers and the results of Board-approved valuation control policies and procedures (the Policies). The Policies address, among other things, instances when market quotations are or are not readily available, including recommendations of third party pricing vendors and a determination of appropriate pricing methodologies; events that require specific valuation determinations and assessment of fair value techniques; securities with a potential for stale pricing, including those that are illiquid, restricted, or in default; and the effectiveness of third party pricing vendors, including periodic reviews of vendors. The Committee meets more frequently, as needed, to discuss additional valuation matters, which may include the need to review back-testing results, review time-sensitive information or approve related valuation actions. The Committee reports to the Board, with members of the Committee meeting with the Board at each of its regularly scheduled meetings to discuss valuation matters and actions during the period, similar to those described earlier.
For investments categorized as Level 3, the Committee monitors information similar to that described above, which may include: (i) data specific to the issuer or comparable issuers, (ii) general market or specific sector news and (iii) quoted prices and specific or similar security transactions. The Committee considers this data and any changes from prior periods in order to assess the reasonableness of observable and unobservable inputs, any assumptions or internal models used to value those securities and changes in fair value. This data is also used to corroborate, when available, information received from approved pricing vendors and brokers. Various factors impact the frequency of monitoring this information (which may occur as often as daily). However, the Committee may determine that changes to inputs, assumptions and models are not required as a result of the monitoring procedures performed.
The following table is a summary of the inputs used to value the Fund’s investments at April 30, 2017:
| | Level 1
quoted prices
in active
markets for
identical
assets ($) | Level 2
other
significant
observable
inputs ($) | Level 3
significant
unobservable
inputs ($) | Investments
measured at
net asset
value ($) | Total ($) |
| Investments | | | | | |
| Common Stocks | | | | | |
| China | 2,879,070 | — | — | — | 2,879,070 |
| Germany | — | 1,962,463 | — | — | 1,962,463 |
| Israel | 44,308,019 | — | — | — | 44,308,019 |
| Japan | 1,440,985 | — | — | — | 1,440,985 |
| Netherlands | 24,020,478 | — | — | — | 24,020,478 |
| Singapore | 60,280,247 | — | — | — | 60,280,247 |
| Taiwan | — | 4,785,519 | — | — | 4,785,519 |
| United States | 771,343,082 | — | — | — | 771,343,082 |
| Total Common Stocks | 904,271,881 | 6,747,982 | — | — | 911,019,863 |
| Money Market Funds | — | — | — | 41,222,916 | 41,222,916 |
| Total Investments | 904,271,881 | 6,747,982 | — | 41,222,916 | 952,242,779 |
See the Portfolio of Investments for all investment classifications not indicated in the table.
The Fund’s assets assigned to the Level 2 input category are generally valued using the market approach, in which a security’s value is determined through reference to prices and information from market transactions for similar or identical assets. These assets include certain foreign securities for which a third party statistical pricing service may be employed for purposes of fair market valuation. The model utilized by such third party statistical pricing service takes into account a security’s correlation to available market data including, but not limited to, intraday index, ADR, and exchange-traded fund movements.
There were no transfers of financial assets between levels during the period.
The accompanying Notes to Financial Statements are an integral part of this statement.
| 8 | Columbia Seligman Global Technology Fund | Semiannual Report 2017 |
Statement of Assets and Liabilities
April 30, 2017 (Unaudited)
| Assets | |
| Investments, at cost | |
| Unaffiliated issuers, at cost | $609,330,814 |
| Affiliated issuers, at cost | 41,222,282 |
| Total investments, at cost | 650,553,096 |
| Investments, at value | |
| Unaffiliated issuers, at value | 911,019,863 |
| Affiliated issuers, at value | 41,222,916 |
| Total investments, at value | 952,242,779 |
| Receivable for: | |
| Investments sold | 8,536,985 |
| Capital shares sold | 12,298,963 |
| Dividends | 22,579 |
| Prepaid expenses | 1,025 |
| Other assets | 58,738 |
| Total assets | 973,161,069 |
| Liabilities | |
| Due to custodian | 877,037 |
| Payable for: | |
| Investments purchased | 12,405,104 |
| Capital shares purchased | 864,514 |
| Management services fees | 23,854 |
| Distribution and/or service fees | 7,980 |
| Transfer agent fees | 81,948 |
| Plan administration fees | 1 |
| Compensation of board members | 41,816 |
| Other expenses | 84,476 |
| Total liabilities | 14,386,730 |
| Net assets applicable to outstanding capital stock | $958,774,339 |
| Represented by | |
| Paid in capital | 623,767,362 |
| Excess of distributions over net investment income | (2,101,906) |
| Accumulated net realized gain | 35,419,200 |
| Unrealized appreciation (depreciation) on: | |
| Investments - unaffiliated issuers | 301,689,049 |
| Investments - affiliated issuers | 634 |
| Total - representing net assets applicable to outstanding capital stock | $958,774,339 |
The accompanying Notes to Financial Statements are an integral part of this statement.
Columbia Seligman Global Technology Fund | Semiannual Report 2017
| 9 |
Statement of Assets and Liabilities (continued)
April 30, 2017 (Unaudited)
| Class A | |
| Net assets | $618,916,078 |
| Shares outstanding | 16,710,381 |
| Net asset value per share | $37.04 |
| Maximum offering price per share(a) | $39.30 |
| Class B | |
| Net assets | $1,337,789 |
| Shares outstanding | 45,842 |
| Net asset value per share | $29.18 |
| Class C | |
| Net assets | $128,801,691 |
| Shares outstanding | 4,415,329 |
| Net asset value per share | $29.17 |
| Class K | |
| Net assets | $194,199 |
| Shares outstanding | 5,187 |
| Net asset value per share | $37.44 |
| Class R | |
| Net assets | $11,904,465 |
| Shares outstanding | 332,662 |
| Net asset value per share | $35.79 |
| Class R4 | |
| Net assets | $14,035,061 |
| Shares outstanding | 367,383 |
| Net asset value per share | $38.20 |
| Class R5 | |
| Net assets | $6,364,018 |
| Shares outstanding | 168,181 |
| Net asset value per share | $37.84 |
| Class Y | |
| Net assets | $27,490 |
| Shares outstanding | 731 |
| Net asset value per share(b) | $37.62 |
| Class Z | |
| Net assets | $177,193,548 |
| Shares outstanding | 4,704,508 |
| Net asset value per share | $37.66 |
| (a) | The maximum offering price per share is calculated by dividing the net asset value per share by 1.0 minus the maximum sales charge of 5.75% for Class A. |
| (b) | Net asset value per share rounds to this amount due to fractional shares outstanding. |
The accompanying Notes to Financial Statements are an integral part of this statement.
| 10 | Columbia Seligman Global Technology Fund | Semiannual Report 2017 |
Statement of Operations
Six Months Ended April 30, 2017 (Unaudited)
| Net investment income | |
| Income: | |
| Dividends — unaffiliated issuers | $3,426,455 |
| Dividends — affiliated issuers | 88,172 |
| Foreign taxes withheld | (3,244) |
| Total income | 3,511,383 |
| Expenses: | |
| Management services fees | 3,591,532 |
| Distribution and/or service fees | |
| Class A | 707,206 |
| Class B | 7,992 |
| Class C | 554,297 |
| Class R | 26,564 |
| Transfer agent fees | |
| Class A | 381,206 |
| Class B | 1,080 |
| Class C | 74,710 |
| Class I(a) | 1 |
| Class K | 55 |
| Class R | 7,165 |
| Class R4 | 5,683 |
| Class R5 | 1,279 |
| Class Z | 57,306 |
| Plan administration fees | |
| Class K | 219 |
| Compensation of board members | 11,387 |
| Custodian fees | 8,802 |
| Printing and postage fees | 38,646 |
| Registration fees | 64,795 |
| Audit fees | 17,391 |
| Legal fees | 6,139 |
| Compensation of chief compliance officer | 78 |
| Other | 13,919 |
| Total expenses | 5,577,452 |
| Net investment loss | (2,066,069) |
| Realized and unrealized gain (loss) — net | |
| Net realized gain (loss) on: | |
| Investments — unaffiliated issuers | 36,125,945 |
| Investments — affiliated issuers | (1,769) |
| Foreign currency translations | 22,240 |
| Net realized gain | 36,146,416 |
| Net change in unrealized appreciation (depreciation) on: | |
| Investments — unaffiliated issuers | 124,243,828 |
| Investments — affiliated issuers | 634 |
| Foreign currency translations | 2,171 |
| Net change in unrealized appreciation (depreciation) | 124,246,633 |
| Net realized and unrealized gain | 160,393,049 |
| Net increase in net assets resulting from operations | $158,326,980 |
| (a) | Effective March 27, 2017, Class I shares were redeemed or exchanged for Class Y shares. |
The accompanying Notes to Financial Statements are an integral part of this statement.
Columbia Seligman Global Technology Fund | Semiannual Report 2017
| 11 |
Statement of Changes in Net Assets
| | Six Months Ended
April 30, 2017
(Unaudited) | Year Ended
October 31, 2016 |
| Operations | | |
| Net investment loss | $(2,066,069) | $(3,802,386) |
| Net realized gain | 36,146,416 | 59,434,566 |
| Net change in unrealized appreciation (depreciation) | 124,246,633 | 35,112,074 |
| Net increase in net assets resulting from operations | 158,326,980 | 90,744,254 |
| Distributions to shareholders | | |
| Net realized gains | | |
| Class A | (41,117,282) | (34,709,686) |
| Class B | (149,204) | (229,932) |
| Class C | (9,062,625) | (7,751,853) |
| Class I(a) | (330) | (306) |
| Class K | (12,966) | (11,106) |
| Class R | (788,271) | (690,302) |
| Class R4 | (421,496) | (35,648) |
| Class R5 | (224,117) | (87,631) |
| Class Z | (4,186,466) | (3,150,690) |
| Total distributions to shareholders | (55,962,757) | (46,667,154) |
| Increase in net assets from capital stock activity | 161,474,961 | 51,720,137 |
| Total increase in net assets | 263,839,184 | 95,797,237 |
| Net assets at beginning of period | 694,935,155 | 599,137,918 |
| Net assets at end of period | $958,774,339 | $694,935,155 |
| Excess of distributions over net investment income | $(2,101,906) | $(35,837) |
| (a) | Effective March 27, 2017, Class I shares were redeemed or exchanged for Class Y shares. |
The accompanying Notes to Financial Statements are an integral part of this statement.
| 12 | Columbia Seligman Global Technology Fund | Semiannual Report 2017 |
Statement of Changes in Net Assets (continued)
| | Six Months Ended | Year Ended |
| | April 30, 2017 (Unaudited)(a) | October 31, 2016 |
| | Shares | Dollars ($) | Shares | Dollars ($) |
| Capital stock activity |
| Class A | | | | |
| Subscriptions (b) | 3,149,179 | 108,248,481 | 2,950,456 | 87,113,886 |
| Distributions reinvested | 1,202,012 | 38,175,898 | 1,122,577 | 32,094,468 |
| Redemptions | (3,647,360) | (126,623,060) | (2,836,245) | (83,066,808) |
| Net increase | 703,831 | 19,801,319 | 1,236,788 | 36,141,546 |
| Class B | | | | |
| Subscriptions | 898 | 23,945 | 4,990 | 115,641 |
| Distributions reinvested | 5,899 | 148,052 | 9,890 | 227,669 |
| Redemptions (b) | (30,479) | (826,798) | (61,182) | (1,439,567) |
| Net decrease | (23,682) | (654,801) | (46,302) | (1,096,257) |
| Class C | | | | |
| Subscriptions | 567,358 | 15,357,662 | 460,754 | 10,886,153 |
| Distributions reinvested | 305,186 | 7,657,117 | 280,342 | 6,450,673 |
| Redemptions | (329,340) | (8,885,628) | (465,537) | (11,093,064) |
| Net increase | 543,204 | 14,129,151 | 275,559 | 6,243,762 |
| Class I(c) | | | | |
| Redemptions | (124) | (4,470) | — | — |
| Net decrease | (124) | (4,470) | — | — |
| Class K | | | | |
| Distributions reinvested | 396 | 12,704 | 376 | 10,864 |
| Redemptions | (224) | (7,345) | — | — |
| Net increase | 172 | 5,359 | 376 | 10,864 |
| Class R | | | | |
| Subscriptions | 99,833 | 3,301,837 | 125,523 | 3,670,381 |
| Distributions reinvested | 22,451 | 689,707 | 21,785 | 603,889 |
| Redemptions | (100,343) | (3,299,857) | (151,953) | (4,335,839) |
| Net increase (decrease) | 21,941 | 691,687 | (4,645) | (61,569) |
| Class R4 | | | | |
| Subscriptions | 239,876 | 8,456,609 | 141,884 | 4,520,932 |
| Distributions reinvested | 12,870 | 421,246 | 1,205 | 35,417 |
| Redemptions | (30,603) | (1,072,459) | (9,978) | (310,951) |
| Net increase | 222,143 | 7,805,396 | 133,111 | 4,245,398 |
| Class R5 | | | | |
| Subscriptions | 94,181 | 3,320,071 | 85,033 | 2,656,584 |
| Distributions reinvested | 6,906 | 223,824 | 3,001 | 87,359 |
| Redemptions | (14,397) | (500,553) | (37,505) | (1,184,906) |
| Net increase | 86,690 | 3,043,342 | 50,529 | 1,559,037 |
| Class Y(c) | | | | |
| Subscriptions | 731 | 27,550 | — | — |
| Net increase | 731 | 27,550 | — | — |
| Class Z | | | | |
| Subscriptions | 3,549,751 | 126,480,804 | 839,076 | 25,541,036 |
| Distributions reinvested | 112,920 | 3,643,923 | 88,261 | 2,559,583 |
| Redemptions | (389,680) | (13,494,299) | (800,494) | (23,423,263) |
| Net increase | 3,272,991 | 116,630,428 | 126,843 | 4,677,356 |
| Total net increase | 4,827,897 | 161,474,961 | 1,772,259 | 51,720,137 |
| (a) | Class Y shares are based on operations from March 1, 2017 (commencement of operations) through the stated period end. |
| (b) | Includes conversions of Class B shares to Class A shares, if any. |
| (c) | Effective March 27, 2017, Class I shares were redeemed or exchanged for Class Y shares. |
The accompanying Notes to Financial Statements are an integral part of this statement.
Columbia Seligman Global Technology Fund | Semiannual Report 2017
| 13 |
The following table is intended to help you understand the Fund’s financial performance. Certain information reflects financial results for a single share of a class held for the periods shown. Per share net investment income (loss) amounts are calculated based on average shares outstanding during the period. Total return assumes reinvestment of all dividends and distributions, if any. Total return does not reflect payment of sales charges, if any. Total return and portfolio turnover are not annualized for periods of less than one year. The portfolio turnover rate is calculated without regard to purchase and sales transactions of short-term instruments and certain derivatives, if any. If such transactions were included, the Fund’s portfolio turnover rate may be higher.
| Year ended (except as noted) | Net asset value,
beginning of
period | Net
investment
income
(loss) | Net
realized
and
unrealized
gain | Total from
investment
operations | Distributions
from net
realized
gains |
| Class A |
| 4/30/2017 (c) | $32.85 | (0.07) | 6.81 | 6.74 | (2.55) |
| 10/31/2016 | $30.77 | (0.15) | 4.58 | 4.43 | (2.35) |
| 10/31/2015 | $30.15 | (0.21) | 4.36 | 4.15 | (3.53) |
| 10/31/2014 | $24.60 | (0.19) | 6.33 | 6.14 | (0.59) |
| 10/31/2013 | $20.07 | (0.16) | 4.69 | 4.53 | — |
| 10/31/2012 | $20.16 | (0.15) | 0.04 | (0.11) | — |
| Class B |
| 4/30/2017 (c) | $26.28 | (0.15) | 5.38 | 5.23 | (2.33) |
| 10/31/2016 | $25.04 | (0.29) | 3.66 | 3.37 | (2.13) |
| 10/31/2015 | $25.14 | (0.35) | 3.58 | 3.23 | (3.33) |
| 10/31/2014 | $20.75 | (0.33) | 5.31 | 4.98 | (0.59) |
| 10/31/2013 | $17.06 | (0.27) | 3.96 | 3.69 | — |
| 10/31/2012 | $17.27 | (0.27) | 0.04 | (0.23) | — |
| Class C |
| 4/30/2017 (c) | $26.27 | (0.16) | 5.39 | 5.23 | (2.33) |
| 10/31/2016 | $25.04 | (0.30) | 3.66 | 3.36 | (2.13) |
| 10/31/2015 | $25.13 | (0.35) | 3.59 | 3.24 | (3.33) |
| 10/31/2014 | $20.74 | (0.33) | 5.31 | 4.98 | (0.59) |
| 10/31/2013 | $17.06 | (0.28) | 3.96 | 3.68 | — |
| 10/31/2012 | $17.26 | (0.26) | 0.04 | (0.22) | — |
The accompanying Notes to Financial Statements are an integral part of this statement.
| 14 | Columbia Seligman Global Technology Fund | Semiannual Report 2017 |
Total
distributions to
shareholders | Proceeds from
regulatory
settlements | Net
asset
value,
end of
period | Total
return | Total gross
expense
ratio to
average
net assets(a) | Total net
expense
ratio to
average
net assets(a),(b) | Net investment
income (loss)
ratio to
average
net assets | Portfolio
turnover | Net
assets,
end of
period
(000’s) |
| |
| (2.55) | — | $37.04 | 21.80% | 1.34% (d) | 1.34% (d) | (0.43%) (d) | 28% | $618,916 |
| (2.35) | — | $32.85 | 15.54% | 1.40% | 1.40% (e) | (0.51%) | 55% | $525,860 |
| (3.53) | — | $30.77 | 14.65% | 1.42% | 1.42% (e) | (0.68%) | 64% | $454,512 |
| (0.59) | — | $30.15 | 25.47% | 1.46% | 1.46% (e) | (0.70%) | 89% | $379,433 |
| — | — | $24.60 | 22.57% | 1.55% | 1.50% (e) | (0.70%) | 81% | $342,423 |
| — | 0.02 | $20.07 | (0.45%) (f) | 1.50% | 1.40% (e) | (0.70%) | 88% | $311,523 |
| |
| (2.33) | — | $29.18 | 21.35% | 2.08% (d) | 2.08% (d) | (1.16%) (d) | 28% | $1,338 |
| (2.13) | — | $26.28 | 14.67% | 2.15% | 2.15% (e) | (1.19%) | 55% | $1,827 |
| (3.33) | — | $25.04 | 13.76% | 2.17% | 2.17% (e) | (1.40%) | 64% | $2,901 |
| (0.59) | — | $25.14 | 24.58% | 2.21% | 2.21% (e) | (1.45%) | 89% | $4,732 |
| — | — | $20.75 | 21.63% | 2.30% | 2.25% (e) | (1.43%) | 81% | $6,045 |
| — | 0.02 | $17.06 | (1.22%) (f) | 2.26% | 2.17% (e) | (1.47%) | 88% | $7,858 |
| |
| (2.33) | — | $29.17 | 21.36% | 2.09% (d) | 2.09% (d) | (1.19%) (d) | 28% | $128,802 |
| (2.13) | — | $26.27 | 14.63% | 2.15% | 2.15% (e) | (1.26%) | 55% | $101,739 |
| (3.33) | — | $25.04 | 13.81% | 2.17% | 2.17% (e) | (1.43%) | 64% | $90,044 |
| (0.59) | — | $25.13 | 24.59% | 2.21% | 2.21% (e) | (1.45%) | 89% | $79,309 |
| — | — | $20.74 | 21.57% | 2.30% | 2.25% (e) | (1.45%) | 81% | $69,151 |
| — | 0.02 | $17.06 | (1.16%) (f) | 2.25% | 2.15% (e) | (1.45%) | 88% | $64,360 |
Columbia Seligman Global Technology Fund | Semiannual Report 2017
| 15 |
Financial Highlights (continued)
| Year ended (except as noted) | Net asset value,
beginning of
period | Net
investment
income
(loss) | Net
realized
and
unrealized
gain | Total from
investment
operations | Distributions
from net
realized
gains |
| Class K |
| 4/30/2017 (c) | $33.20 | (0.06) | 6.89 | 6.83 | (2.59) |
| 10/31/2016 | $31.08 | (0.12) | 4.63 | 4.51 | (2.39) |
| 10/31/2015 | $30.42 | (0.16) | 4.40 | 4.24 | (3.58) |
| 10/31/2014 | $24.77 | (0.15) | 6.39 | 6.24 | (0.59) |
| 10/31/2013 | $20.18 | (0.12) | 4.71 | 4.59 | — |
| 10/31/2012 | $20.22 | (0.10) | 0.04 | (0.06) | — |
| Class R |
| 4/30/2017 (c) | $31.79 | (0.11) | 6.59 | 6.48 | (2.48) |
| 10/31/2016 | $29.85 | (0.22) | 4.44 | 4.22 | (2.28) |
| 10/31/2015 | $29.35 | (0.27) | 4.23 | 3.96 | (3.46) |
| 10/31/2014 | $24.02 | (0.25) | 6.17 | 5.92 | (0.59) |
| 10/31/2013 | $19.65 | (0.21) | 4.58 | 4.37 | — |
| 10/31/2012 | $19.78 | (0.19) | 0.04 | (0.15) | — |
| Class R4 |
| 4/30/2017 (c) | $33.84 | (0.04) | 7.02 | 6.98 | (2.62) |
| 10/31/2016 | $31.63 | (0.15) | 4.78 | 4.63 | (2.42) |
| 10/31/2015 | $30.89 | (0.13) | 4.47 | 4.34 | (3.60) |
| 10/31/2014 | $25.12 | (0.13) | 6.49 | 6.36 | (0.59) |
| 10/31/2013 (g) | $20.20 | (0.12) | 5.04 | 4.92 | — |
| Class R5 |
| 4/30/2017 (c) | $33.57 | (0.03) | 6.96 | 6.93 | (2.66) |
| 10/31/2016 | $31.40 | (0.07) | 4.71 | 4.64 | (2.47) |
| 10/31/2015 | $30.69 | (0.13) | 4.48 | 4.35 | (3.64) |
| 10/31/2014 | $24.92 | (0.08) | 6.44 | 6.36 | (0.59) |
| 10/31/2013 | $20.25 | (0.04) | 4.71 | 4.67 | — |
| 10/31/2012 | $20.27 | (0.05) | 0.01 | (0.04) | — |
| Class Y |
| 4/30/2017 (c),(h) | $35.81 | (0.46) | 2.27 | 1.81 | — |
| Class Z |
| 4/30/2017 (c) | $33.40 | (0.05) | 6.93 | 6.88 | (2.62) |
| 10/31/2016 | $31.24 | (0.08) | 4.66 | 4.58 | (2.42) |
| 10/31/2015 | $30.55 | (0.13) | 4.41 | 4.28 | (3.59) |
| 10/31/2014 | $24.85 | (0.13) | 6.42 | 6.29 | (0.59) |
| 10/31/2013 | $20.23 | (0.10) | 4.72 | 4.62 | — |
| 10/31/2012 | $20.26 | (0.09) | 0.04 | (0.05) | — |
| Notes to Financial Highlights |
| (a) | In addition to the fees and expenses that the Fund bears directly, the Fund indirectly bears a pro rata share of the fees and expenses of any other funds in which it invests. Such indirect expenses are not included in the Fund’s reported expense ratios. |
| (b) | Total net expenses include the impact of certain fee waivers/expense reimbursements made by the Investment Manager and certain of its affiliates, if applicable. |
| (c) | For the six months ended April 30, 2017 (unaudited). |
| (d) | Annualized. |
| (e) | The benefits derived from expense reductions had an impact of less than 0.01%. |
| (f) | The Fund received proceeds from regulatory settlements. Had the Fund not received these proceeds, the total return would have been lower by 0.11%. |
| (g) | Class R4 shares commenced operations on November 8, 2012. Per share data and total return reflect activity from that date. |
| (h) | Class Y shares commenced operations on March 1, 2017. Per share data and total return reflect activity from that date. |
The accompanying Notes to Financial Statements are an integral part of this statement.
| 16 | Columbia Seligman Global Technology Fund | Semiannual Report 2017 |
Total
distributions to
shareholders | Proceeds from
regulatory
settlements | Net
asset
value,
end of
period | Total
return | Total gross
expense
ratio to
average
net assets(a) | Total net
expense
ratio to
average
net assets(a),(b) | Net investment
income (loss)
ratio to
average
net assets | Portfolio
turnover | Net
assets,
end of
period
(000’s) |
| |
| (2.59) | — | $37.44 | 21.85% | 1.26% (d) | 1.26% (d) | (0.36%) (d) | 28% | $194 |
| (2.39) | — | $33.20 | 15.68% | 1.27% | 1.27% | (0.38%) | 55% | $167 |
| (3.58) | — | $31.08 | 14.83% | 1.27% | 1.27% | (0.52%) | 64% | $144 |
| (0.59) | — | $30.42 | 25.70% | 1.29% | 1.29% | (0.52%) | 89% | $188 |
| — | — | $24.77 | 22.75% | 1.34% | 1.32% | (0.52%) | 81% | $167 |
| — | 0.02 | $20.18 | (0.20%) (f) | 1.30% | 1.16% | (0.45%) | 88% | $231 |
| |
| (2.48) | — | $35.79 | 21.65% | 1.59% (d) | 1.59% (d) | (0.69%) (d) | 28% | $11,904 |
| (2.28) | — | $31.79 | 15.25% | 1.65% | 1.65% (e) | (0.75%) | 55% | $9,878 |
| (3.46) | — | $29.85 | 14.37% | 1.67% | 1.67% (e) | (0.93%) | 64% | $9,414 |
| (0.59) | — | $29.35 | 25.16% | 1.71% | 1.71% (e) | (0.95%) | 89% | $7,628 |
| — | — | $24.02 | 22.24% | 1.80% | 1.75% (e) | (0.94%) | 81% | $7,291 |
| — | 0.02 | $19.65 | (0.66%) (f) | 1.75% | 1.65% (e) | (0.94%) | 88% | $8,124 |
| |
| (2.62) | — | $38.20 | 21.92% | 1.09% (d) | 1.09% (d) | (0.22%) (d) | 28% | $14,035 |
| (2.42) | — | $33.84 | 15.81% | 1.15% | 1.15% (e) | (0.47%) | 55% | $4,915 |
| (3.60) | — | $31.63 | 14.95% | 1.17% | 1.17% (e) | (0.42%) | 64% | $384 |
| (0.59) | — | $30.89 | 25.82% | 1.21% | 1.21% (e) | (0.47%) | 89% | $231 |
| — | — | $25.12 | 24.36% | 1.33% (d) | 1.29% (d),(e) | (0.53%) (d) | 81% | $17 |
| |
| (2.66) | — | $37.84 | 21.97% | 1.02% (d) | 1.02% (d) | (0.16%) (d) | 28% | $6,364 |
| (2.47) | — | $33.57 | 15.97% | 1.02% | 1.02% | (0.23%) | 55% | $2,735 |
| (3.64) | — | $31.40 | 15.12% | 1.02% | 1.02% | (0.41%) | 64% | $972 |
| (0.59) | — | $30.69 | 26.03% | 1.04% | 1.04% | (0.28%) | 89% | $56 |
| — | — | $24.92 | 23.06% | 1.08% | 1.06% | (0.16%) | 81% | $58 |
| — | 0.02 | $20.25 | (0.10%) (f) | 1.06% | 0.99% | (0.23%) | 88% | $165 |
| |
| — | — | $37.62 | 5.05% | 1.09% (d) | 1.09% (d) | (9.70%) (d) | 28% | $27 |
| |
| (2.62) | — | $37.66 | 21.91% | 1.11% (d) | 1.11% (d) | (0.28%) (d) | 28% | $177,194 |
| (2.42) | — | $33.40 | 15.85% | 1.15% | 1.15% (e) | (0.25%) | 55% | $47,809 |
| (3.59) | — | $31.24 | 14.94% | 1.17% | 1.17% (e) | (0.42%) | 64% | $40,763 |
| (0.59) | — | $30.55 | 25.82% | 1.22% | 1.22% (e) | (0.47%) | 89% | $32,271 |
| — | — | $24.85 | 22.84% | 1.30% | 1.24% (e) | (0.42%) | 81% | $16,097 |
| — | 0.02 | $20.23 | (0.15%) (f) | 1.23% | 1.13% (e) | (0.42%) | 88% | $22,115 |
Columbia Seligman Global Technology Fund | Semiannual Report 2017
| 17 |
Notes to Financial Statements
April 30, 2017 (Unaudited)
Note 1. Organization
Columbia Seligman Global Technology Fund (the Fund), a series of Columbia Funds Series Trust II (the Trust), is a non-diversified fund. The Trust is registered under the Investment Company Act of 1940, as amended (the 1940 Act), as an open-end management investment company organized as a Massachusetts business trust.
Fund shares
The Trust may issue an unlimited number of shares (without par value). Although all share classes generally have identical voting, dividend and liquidation rights, each share class votes separately when required by the Trust’s organizational documents or by law. Different share classes pay different distribution amounts to the extent the expenses of such share classes differ, and distributions in liquidation will be proportional to the net asset value of each share class. Each share class has its own expense and sales charge structure. The Fund offers each of the share classes identified below.
Class A shares are subject to a maximum front-end sales charge of 5.75% based on the initial investment amount. Class A shares purchased without an initial sales charge in accounts aggregating $1 million to $50 million at the time of purchase are subject to a contingent deferred sales charge (CDSC) if the shares are sold within 18 months after purchase, charged as follows: 1.00% CDSC if redeemed within 12 months after purchase, and 0.50% CDSC if redeemed more than 12, but less than 18, months after purchase.
The Fund no longer accepts investments by new or existing investors in the Fund’s Class B shares, except in connection with the reinvestment of any dividend and/or capital gain distributions in Class B shares of the Fund and exchanges by existing Class B shareholders of certain other funds within the Columbia Family of Funds. Class B shares are typically subject to a maximum CDSC of 5.00% based upon the holding period after purchase. However, the Fund’s current Class B investors, having held their shares for the requisite time period, are no longer subject to a CDSC upon redemption of their shares. Effective on or about July 17, 2017, Class B shares will automatically convert to Class A shares and the Fund will no longer accept investments by new or existing investors in Class B shares.
Class C shares are subject to a 1.00% CDSC on shares redeemed within 12 months after purchase.
Effective March 27, 2017, Class I shares of the Fund are no longer offered for sale. Class I shares, when available, were not subject to sales charges or distribution and service (12b-1) fees, and were made available only to the Columbia Family of Funds. On March 27, 2017, Class I shares were redeemed or exchanged for Class Y shares of the Fund in a tax free transaction that had no impact on the fees and expenses paid by shareholders.
Class K shares are not subject to sales charges; however, this share class is closed to new investors.
Class R shares are not subject to sales charges and are generally available only to certain retirement plans and other investors as described in the Fund’s prospectus.
Class R4 shares are not subject to sales charges and are generally available only to omnibus retirement plans and certain investors as described in the Fund’s prospectus.
Class R5 shares are not subject to sales charges and are generally available only to investors purchasing through authorized investment professionals and omnibus retirement plans.
Class Y shares are not subject to sales charges or distribution and service (12b-1) fees, and are available to institutional and certain other investors as described in the Fund’s prospectus. Class Y shares commenced operations on March 1, 2017. On March 27, 2017, Class I shares were redeemed or exchanged for Class Y shares of the Fund in a tax free transaction that had no impact on the fees and expenses paid by shareholders. Class I shares of the Fund are no longer offered for sale.
Class Z shares are not subject to sales charges and are generally available only to eligible investors, which are subject to different investment minimums as described in the Fund’s prospectus.
| 18 | Columbia Seligman Global Technology Fund | Semiannual Report 2017 |
Notes to Financial Statements (continued)
April 30, 2017 (Unaudited)
Note 2. Summary of significant accounting policies
Basis of preparation
The Fund is an investment company that applies the accounting and reporting guidance in the Financial Accounting Standards Board (FASB) Accounting Standards Codification Topic 946, Financial Services - Investment Companies (ASC 946). The financial statements are prepared in accordance with U.S. generally accepted accounting principles (GAAP), which requires management to make certain estimates and assumptions that affect the reported amounts of assets and liabilities, the disclosure of contingent assets and liabilities at the date of the financial statements and the reported amounts of income and expenses during the reporting period. Actual results could differ from those estimates.
The following is a summary of significant accounting policies followed by the Fund in the preparation of its financial statements.
Security valuation
All equity securities are valued at the close of business of the New York Stock Exchange. Equity securities are valued at the last quoted sales price on the principal exchange or market on which they trade, except for securities traded on the NASDAQ Stock Market, which are valued at the NASDAQ official close price. Unlisted securities or listed securities for which there were no sales during the day are valued at the mean of the latest quoted bid and ask prices on such exchanges or markets.
Foreign equity securities are valued based on the closing price on the foreign exchange in which such securities are primarily traded. If any foreign equity security closing prices are not readily available, the securities are valued at the mean of the latest quoted bid and ask prices on such exchanges or markets. Foreign currency exchange rates are generally determined at 4:00 p.m. Eastern (U.S.) time. Many securities markets and exchanges outside the U.S. close prior to the close of the New York Stock Exchange; therefore, the closing prices for securities in such markets or on such exchanges may not fully reflect events that occur after such close but before the close of the New York Stock Exchange. In those situations, foreign securities will be fair valued pursuant to a policy adopted by the Board of Trustees, including, if available, utilizing a third party pricing service to determine these fair values. The third party pricing service takes into account multiple factors, including, but not limited to, movements in the U.S. securities markets, certain depositary receipts, futures contracts and foreign exchange rates that have occurred subsequent to the close of the foreign exchange or market, to determine a good faith estimate that reasonably reflects the current market conditions as of the close of the New York Stock Exchange. The fair value of a security is likely to be different from the quoted or published price, if available.
Investments in open-end investment companies, including money market funds, are valued at their latest net asset value.
Investments for which market quotations are not readily available, or that have quotations which management believes are not reflective of market value or reliable, are valued at fair value as determined in good faith under procedures approved by and under the general supervision of the Board of Trustees. If a security or class of securities (such as foreign securities) is valued at fair value, such value is likely to be different from the quoted or published price for the security.
The determination of fair value often requires significant judgment. To determine fair value, management may use assumptions including but not limited to future cash flows and estimated risk premiums. Multiple inputs from various sources may be used to determine fair value.
GAAP requires disclosure regarding the inputs and valuation techniques used to measure fair value and any changes in valuation inputs or techniques. In addition, investments shall be disclosed by major category. This information is disclosed following the Fund’s Portfolio of Investments.
Foreign currency transactions and translations
The values of all assets and liabilities denominated in foreign currencies are generally translated into U.S. dollars at exchange rates determined at the close of regular trading on the New York Stock Exchange. Net realized and unrealized gains (losses) on foreign currency transactions and translations include gains (losses) arising from the fluctuation in exchange
Columbia Seligman Global Technology Fund | Semiannual Report 2017
| 19 |
Notes to Financial Statements (continued)
April 30, 2017 (Unaudited)
rates between trade and settlement dates on securities transactions, gains (losses) arising from the disposition of foreign currency and currency gains (losses) between the accrual and payment dates on dividends, interest income and foreign withholding taxes.
For financial statement purposes, the Fund does not distinguish that portion of gains (losses) on investments which is due to changes in foreign exchange rates from that which is due to changes in market prices of the investments. Such fluctuations are included with the net realized and unrealized gains (losses) on investments in the Statement of Operations.
Security transactions
Security transactions are accounted for on the trade date. Cost is determined and gains (losses) are based upon the specific identification method for both financial statement and federal income tax purposes.
Income recognition
Corporate actions and dividend income are generally recorded net of any non-reclaimable tax withholdings, on the ex-dividend date or upon receipt of ex-dividend notification in the case of certain foreign securities.
The Fund may receive distributions from holdings in equity securities, business development companies (BDCs), exchange-traded funds, other regulated investment companies (RICs), and real estate investment trusts (REITs), which report information on the tax character of their distributions annually. These distributions are allocated to dividend income, capital gain and return of capital based on actual information reported. Return of capital is recorded as a reduction of the cost basis of securities held. If the Fund no longer owns the applicable securities, return of capital is recorded as a realized gain. With respect to REITs, to the extent actual information has not yet been reported, estimates for return of capital are made by the Fund’s management. Management’s estimates are subsequently adjusted when the actual character of the distributions is disclosed by the REITs, which could result in a proportionate change in return of capital to shareholders.
Awards from class action litigation are recorded as a reduction of cost basis if the Fund still owns the applicable securities on the payment date. If the Fund no longer owns the applicable securities, the proceeds are recorded as realized gains.
Expenses
General expenses of the Trust are allocated to the Fund and other funds of the Trust based upon relative net assets or other expense allocation methodologies determined by the nature of the expense. Expenses directly attributable to the Fund are charged to the Fund. Expenses directly attributable to a specific class of shares are charged to that share class.
Determination of class net asset value
All income, expenses (other than class-specific expenses, which are charged to that share class, as shown in the Statement of Operations) and realized and unrealized gains (losses) are allocated to each class of the Fund on a daily basis, based on the relative net assets of each class, for purposes of determining the net asset value of each class.
Federal income tax status
The Fund intends to qualify each year as a regulated investment company under Subchapter M of the Internal Revenue Code, as amended, and will distribute substantially all of its taxable income (including net short-term capital gains), if any, for its tax year, and as such will not be subject to federal income taxes. In addition, the Fund intends to distribute in each calendar year substantially all of its net investment income, capital gains and certain other amounts, if any, such that the Fund should not be subject to federal excise tax. Therefore, no federal income or excise tax provision is recorded.
Foreign taxes
The Fund may be subject to foreign taxes on income, gains on investments or currency repatriation, a portion of which may be recoverable. The Fund will accrue such taxes and recoveries, as applicable, based upon its current interpretation of tax rules and regulations that exist in the markets in which it invests.
| 20 | Columbia Seligman Global Technology Fund | Semiannual Report 2017 |
Notes to Financial Statements (continued)
April 30, 2017 (Unaudited)
Realized gains in certain countries may be subject to foreign taxes at the Fund level, based on statutory rates. The Fund accrues for such foreign taxes on realized and unrealized gains at the appropriate rate for each jurisdiction, as applicable. The amount, if any, is disclosed as a liability on the Statement of Assets and Liabilities.
Distributions to shareholders
Distributions from net investment income, if any, are declared and paid annually. Net realized capital gains, if any, are distributed along with the income distribution. Income distributions and capital gain distributions are determined in accordance with federal income tax regulations, which may differ from GAAP.
Guarantees and indemnifications
Under the Trust’s organizational documents and, in some cases, by contract, its officers and trustees are indemnified against certain liabilities arising out of the performance of their duties to the Trust or its funds. In addition, certain of the Fund’s contracts with its service providers contain general indemnification clauses. The Fund’s maximum exposure under these arrangements is unknown since the amount of any future claims that may be made against the Fund cannot be determined, and the Fund has no historical basis for predicting the likelihood of any such claims.
Investment company reporting modernization
In October 2016, the U.S. Securities and Exchange Commission adopted new rules and forms, and amendments to certain current rules and forms, to modernize reporting and disclosure of information by registered investment companies. The amendments to Regulation S-X will require standardized, enhanced disclosure about derivatives in investment company financial statements, and will also change the rules governing the form and content of such financial statements. The amendments to Regulation S-X take effect on August 1, 2017. At this time, management is assessing the anticipated impact of these regulatory developments.
Note 3. Fees and other transactions with affiliates
Management services fees
The Fund entered into a Management Agreement with Columbia Management Investment Advisers, LLC (the Investment Manager), a wholly-owned subsidiary of Ameriprise Financial, Inc. (Ameriprise Financial). Under the Management Agreement, the Investment Manager provides the Fund with investment research and advice, as well as administrative and accounting services. The management services fee is an annual fee that is equal to a percentage of the Fund’s average daily net assets that declines from 0.915% to 0.755% as the Fund’s net assets increase. The annualized effective management services fee rate for the six months ended April 30, 2017 was 0.912% of the Fund’s average daily net assets.
Other expenses
Other expenses are for, among other things, miscellaneous expenses of the Fund or the Board of Trustees, including payments to Board Services Corp., a company providing limited administrative services to the Fund and the Board of Trustees. That company’s expenses include boardroom and office expense, employee compensation, employee health and retirement benefits, and certain other expenses.
Compensation of board members
Members of the Board of Trustees, who are not officers or employees of the Investment Manager or Ameriprise Financial, are compensated for their services to the Fund as disclosed in the Statement of Operations. Under a Deferred Compensation Plan (the Plan), these members of the Board of Trustees may elect to defer payment of up to 100% of their compensation. Deferred amounts are treated as though equivalent dollar amounts had been invested in shares of certain funds managed by the Investment Manager. The Fund’s liability for these amounts is adjusted for market value changes and remains in the Fund until distributed in accordance with the Plan. All amounts payable under the Plan constitute a general unsecured obligation of the Fund.
Columbia Seligman Global Technology Fund | Semiannual Report 2017
| 21 |
Notes to Financial Statements (continued)
April 30, 2017 (Unaudited)
Compensation of Chief Compliance Officer
The Board of Trustees has appointed a Chief Compliance Officer to the Fund in accordance with federal securities regulations. A portion of the Chief Compliance Officer’s total compensation is allocated to the Fund, along with other affiliated funds governed by the Board of Trustees, based on relative net assets. The total amount allocated to all affiliated funds governed by the Board of Trustees will not exceed $40,000 annually.
Transfer agency fees
Under a Transfer and Dividend Disbursing Agent Agreement, Columbia Management Investment Services Corp. (the Transfer Agent), an affiliate of the Investment Manager and a wholly-owned subsidiary of Ameriprise Financial, is responsible for providing transfer agency services to the Fund. The Transfer Agent has contracted with Boston Financial Data Services (BFDS) to serve as sub-transfer agent. The Transfer Agent pays the fees of BFDS for services as sub-transfer agent and BFDS is not entitled to reimbursement for such fees from the Fund (with the exception of out-of-pocket fees).
The Fund pays the Transfer Agent a monthly transfer agency fee based on the number or the average value of accounts, depending on the type of account. In addition, the Fund pays the Transfer Agent a fee for shareholder services based on the number of accounts or on a percentage of the average aggregate value of the Fund’s shares maintained in omnibus accounts up to the lesser of the amount charged by the financial intermediary or a cap established by the Board of Trustees from time to time.
The Transfer Agent also receives compensation from the Fund for various shareholder services and reimbursements for certain out-of-pocket fees. Effective January 1, 2017, total transfer agency fees for Class K and Class R5 shares are subject to an annual limitation of not more than 0.075% of the average daily net assets attributable to each share class. Total transfer agency fees for Class I shares were subject to an annual limitation of not more than 0.025% of the average daily net assets attributable to Class I shares. Prior to January 1, 2017, total transfer agency fees for Class K and Class R5 shares were subject to an annual limitation of not more than 0.05% of the average daily net assets attributable to each share class and Class I shares did not pay transfer agency fees. Total transfer agency fees for Class Y shares are subject to an annual limitation of not more than 0.025% of the average daily net assets attributable to Class Y shares.
For the six months ended April 30, 2017, the Fund’s annualized effective transfer agency fee rates as a percentage of average daily net assets of each class were as follows:
| | Effective rate (%) |
| Class A | 0.13 |
| Class B | 0.14 |
| Class C | 0.13 |
| Class I | 0.025 (a) |
| Class K | 0.063 |
| Class R | 0.13 |
| Class R4 | 0.13 |
| Class R5 | 0.065 |
| Class Y | 0.025 |
| Class Z | 0.13 |
| (a) | Effective March 27, 2017, Class I shares were redeemed or exchanged for Class Y shares. |
The Fund and certain other associated investment companies have severally, but not jointly, guaranteed the performance and observance of all the terms and conditions of a lease entered into by Seligman Data Corp. (SDC), the former transfer agent, including the payment of rent by SDC (the Guaranty). SDC was the legacy Seligman funds’ former transfer agent.
The lease and the Guaranty expire in January 2019. At April 30, 2017, the Fund’s total potential future obligation over the life of the Guaranty is $76,821. The liability remaining at April 30, 2017 for non-recurring charges associated with the lease amounted to $44,699 and is recorded as a part of the payable for other expenses in the Statement of Assets and Liabilities.
| 22 | Columbia Seligman Global Technology Fund | Semiannual Report 2017 |
Notes to Financial Statements (continued)
April 30, 2017 (Unaudited)
An annual minimum account balance fee of $20 may apply to certain accounts with a value below the applicable share class’s initial minimum investment requirements to reduce the impact of small accounts on transfer agency fees. These minimum account balance fees are remitted to the Fund and recorded as part of expense reductions in the Statement of Operations. For the six months ended April 30, 2017, no minimum account balance fees were charged by the Fund.
Plan administration fees
Under a Plan Administration Services Agreement with the Transfer Agent, the Fund pays an annual fee at a rate of 0.25% of the Fund’s average daily net assets attributable to Class K shares for the provision of various administrative, recordkeeping, communication and educational services.
Distribution and service fees
The Fund has an agreement with Columbia Management Investment Distributors, Inc. (the Distributor), an affiliate of the Investment Manager and a wholly-owned subsidiary of Ameriprise Financial, for distribution and shareholder services. Under a Plan and Agreement of Distribution, the Fund pays a fee at an annual rate of up to 0.25% of the Fund’s average daily net assets attributable to Class A, a fee at an annual rate of up to 0.50% of the Fund’s average daily net assets attributable to Class R shares (of which up to 0.25% may be used for shareholder services) and a fee at an annual rate of up to 1.00% of the Fund’s average daily net assets attributable to Class B and Class C shares. For Class B and Class C shares, of the 1.00% fee, up to 0.75% is reimbursed for distribution expenses.
The amount of distribution and shareholder services expenses incurred by the Distributor and not yet reimbursed (unreimbursed expense) was approximately $91,000 and $4,305,000 for Class B and Class C shares, respectively. These amounts are based on the most recent information available as of March 31, 2017, and may be recovered from future payments under the distribution plan or CDSCs. To the extent the unreimbursed expense has been fully recovered, the distribution and/or shareholder services fee is reduced.
Sales charges
Sales charges, including front-end charges and CDSCs, received by the Distributor for distributing Fund shares for the six months ended April 30, 2017, if any, are listed below:
| | Amount ($) |
| Class A | 474,756 |
| Class C | 3,596 |
Expenses waived/reimbursed by the Investment Manager and its affiliates
The Investment Manager and certain of its affiliates have contractually agreed to waive fees and/or reimburse expenses (excluding certain fees and expenses described below) for the periods disclosed below, unless sooner terminated at the sole discretion of the Board of Trustees, so that the Fund’s net operating expenses, after giving effect to fees waived/expenses reimbursed and any balance credits and/or overdraft charges from the Fund’s custodian, do not exceed the following annual rates as a percentage of the class’ average daily net assets:
| | March 1, 2017
through
February 28, 2018 | Prior to
March 1, 2017 |
| Class A | 1.440% | 1.50% |
| Class B | 2.190 | 2.25 |
| Class C | 2.190 | 2.25 |
| Class K | 1.415 | 1.41 |
| Class R | 1.690 | 1.75 |
| Class R4 | 1.190 | 1.25 |
| Class R5 | 1.165 | 1.16 |
| Class Y | 1.115 | – |
| Class Z | 1.190 | 1.25 |
Columbia Seligman Global Technology Fund | Semiannual Report 2017
| 23 |
Notes to Financial Statements (continued)
April 30, 2017 (Unaudited)
Under the agreement governing these fee waivers and/or expense reimbursement arrangements, the following fees and expenses are excluded from the waiver/reimbursement commitment, and therefore will be paid by the Fund, if applicable: taxes (including foreign transaction taxes), expenses associated with investments in affiliated and non-affiliated pooled investment vehicles (including mutual funds and exchange-traded funds), transaction costs and brokerage commissions, costs related to any securities lending program, dividend and interest expenses associated with securities sold short, inverse floater program fees and expenses, transaction charges and interest on borrowed money, interest, infrequent and/or unusual expenses and any other expenses the exclusion of which is specifically approved by the Board of Trustees. This agreement may be modified or amended only with approval from the Investment Manager, certain of its affiliates and the Fund. Any fees waived and/or expenses reimbursed under the expense reimbursement arrangements described above are not recoverable by the Investment Manager or its affiliates in future periods.
Note 4. Federal tax information
The timing and character of income and capital gain distributions are determined in accordance with income tax regulations, which may differ from GAAP because of temporary or permanent book to tax differences.
At April 30, 2017, the approximate cost of investments for federal income tax purposes and the aggregate gross approximate unrealized appreciation and depreciation based on that cost was:
Federal
tax cost ($) | Gross unrealized
appreciation ($) | Gross unrealized
(depreciation) ($) | Net unrealized
appreciation ($) |
| 650,553,000 | 308,348,000 | (6,658,000) | 301,690,000 |
Management of the Fund has concluded that there are no significant uncertain tax positions in the Fund that would require recognition in the financial statements. However, management’s conclusion may be subject to review and adjustment at a later date based on factors including, but not limited to, new tax laws, regulations, and administrative interpretations (including relevant court decisions). Generally, the Fund’s federal tax returns for the prior three fiscal years remain subject to examination by the Internal Revenue Service.
Note 5. Portfolio information
The cost of purchases and proceeds from sales of securities, excluding short-term investments and derivatives, if any, aggregated to $280,743,057 and $217,029,282, respectively, for the six months ended April 30, 2017. The amount of purchase and sale activity impacts the portfolio turnover rate reported in the Financial Highlights.
Note 6. Affiliated money market fund
The Fund invests in Columbia Short-Term Cash Fund, an affiliated money market fund established for the exclusive use by the Fund and other affiliated funds (the Affiliated MMF). The income earned by the Fund from such investments is included as Dividends - affiliated issuers in the Statement of Operations. As an investing fund, the Fund indirectly bears its proportionate share of the expenses of the Affiliated MMF. Effective October 1, 2016, the Affiliated MMF prices its shares with a floating net asset value (NAV) and no longer seeks to maintain a stable NAV. In addition, the Board of Trustees of the Affiliated MMF may impose a fee on redemptions (sometimes referred to as a liquidity fee) or temporarily suspend redemptions (sometimes referred to as imposing a redemption gate) in the event its liquidity falls below regulatory limits.
Note 7. Line of credit
The Fund has access to a revolving credit facility with a syndicate of banks led by Citibank, N.A., HSBC Bank USA, N.A. and JPMorgan Chase Bank, N.A. whereby the Fund may borrow for the temporary funding of shareholder redemptions or for other temporary or emergency purposes. The credit facility agreement, which is a collective agreement between the Fund and certain other funds managed by the Investment Manager, severally and not jointly, permits collective borrowings up to $1 billion. Interest is charged to each participating fund based on its borrowings at a rate equal to the higher of (i) the overnight federal funds rate plus 1.00% or (ii) the one-month LIBOR rate plus 1.00%. Each borrowing under the credit facility matures no later than 60 days after the date of borrowing. The Fund also pays a commitment fee equal to its pro rata share of the amount of the credit facility at a rate of 0.15% per annum. The commitment fee is included in other expenses in the Statement of Operations.
| 24 | Columbia Seligman Global Technology Fund | Semiannual Report 2017 |
Notes to Financial Statements (continued)
April 30, 2017 (Unaudited)
The Fund had no borrowings during the six months ended April 30, 2017.
Note 8. Significant risks
Foreign securities and emerging market countries risk
Investing in foreign securities may include certain risks and considerations not typically associated with investing in U.S. securities, such as fluctuating currency values and changing local and regional economic, political and social conditions, which may result in greater market volatility. In addition, certain foreign securities may not be as liquid as U.S. securities. Investing in emerging markets may accentuate these risks. These countries are also more likely to experience high levels of inflation, deflation or currency devaluation which could hurt their economies and securities markets. To the extent that the Fund concentrates its investment exposure to any one or a few specific countries, the Fund will be particularly susceptible to the various conditions, events or other factors impacting those countries and may, therefore, have a greater risk than that of a fund which is more geographically diversified.
Non-diversification risk
A non-diversified fund is permitted to invest a greater percentage of its total assets in fewer issuers than a diversified fund. The Fund may, therefore, have a greater risk of loss from a few issuers than a similar fund that invests more broadly.
Shareholder concentration risk
At April 30, 2017, affiliated shareholders of record owned 31.8% of the outstanding shares of the Fund in one or more accounts. Subscription and redemption activity by concentrated accounts may have a significant effect on the operations of the Fund. In the case of a large redemption, the Fund may be forced to sell investments at inopportune times, including its liquid or more liquid positions, resulting in Fund losses and the Fund holding a higher percentage of less liquid or illiquid securities. Large redemptions could result in decreased economies of scale and increased operating expenses for non-redeeming Fund shareholders.
Technology and technology-related investment risk
The Fund may be more susceptible to the particular risks that may affect companies in the information technology sector, as well as other technology-related sectors (collectively, the technology sectors) than if it were invested in a wider variety of companies in unrelated sectors. Companies in the technology sectors are subject to certain risks, including the risk that new services, equipment or technologies will not be accepted by consumers and businesses or will become rapidly obsolete. Performance of such companies may be affected by factors including obtaining and protecting patents (or the failure to do so) and significant competitive pressures, including aggressive pricing of their products or services, new market entrants, competition for market share and short product cycles due to an accelerated rate of technological developments. Such competitive pressures may lead to limited earnings and/or falling profit margins. As a result, the value of their securities may fall or fail to rise. In addition, many technology sector companies have limited operating histories and prices of these companies’ securities historically have been more volatile than other securities, especially over the short term.
Note 9. Subsequent events
Management has evaluated the events and transactions that have occurred through the date the financial statements were issued. Other than as noted in Note 1 above, there were no items requiring adjustment of the financial statements or additional disclosure.
Note 10. Information regarding pending and settled legal proceedings
Ameriprise Financial and certain of its affiliates have historically been involved in a number of legal, arbitration and regulatory proceedings, including routine litigation, class actions, and governmental actions, concerning matters arising in connection with the conduct of their business activities. Ameriprise Financial believes that the Funds are not currently the subject of, and that neither Ameriprise Financial nor any of its affiliates are the subject of, any pending legal, arbitration or regulatory proceedings that are likely to have a material adverse effect on the Funds or the ability of Ameriprise Financial or its affiliates
Columbia Seligman Global Technology Fund | Semiannual Report 2017
| 25 |
Notes to Financial Statements (continued)
April 30, 2017 (Unaudited)
to perform under their contracts with the Funds. Ameriprise Financial is required to make quarterly (10-Q), annual (10-K) and, as necessary, 8-K filings with the Securities and Exchange Commission (SEC) on legal and regulatory matters that relate to Ameriprise Financial and its affiliates. Copies of these filings may be obtained by accessing the SEC website at www.sec.gov.
There can be no assurance that these matters, or the adverse publicity associated with them, will not result in increased fund redemptions, reduced sale of fund shares or other adverse consequences to the Funds. Further, although we believe proceedings are not likely to have a material adverse effect on the Funds or the ability of Ameriprise Financial or its affiliates to perform under their contracts with the Funds, these proceedings are subject to uncertainties and, as such, we are unable to estimate the possible loss or range of loss that may result. An adverse outcome in one or more of these proceedings could result in adverse judgments, settlements, fines, penalties or other relief that could have a material adverse effect on the consolidated financial condition or results of operations of Ameriprise Financial.
| 26 | Columbia Seligman Global Technology Fund | Semiannual Report 2017 |
The Fund mails one shareholder report to each shareholder address. If you would like more than one report, please call shareholder services at 800.345.6611 and additional reports will be sent to you.
Proxy voting policies and procedures
The policy of the Board of Trustees is to vote the proxies of the companies in which the Fund holds investments consistent with the procedures as stated in the Statement of Additional Information (SAI). You may obtain a copy of the SAI without charge by calling 800.345.6611; contacting your financial intermediary; visiting investor.columbiathreadneedleus.com; or searching the website of the Securities and Exchange Commission (SEC) at sec.gov. Information regarding how the Fund voted proxies relating to portfolio securities is filed with the SEC by August 31st for the most recent 12-month period ending June 30th of that year, and is available without charge by visiting investor.columbiathreadneedleus.com, or searching the website of the SEC at sec.gov.
Quarterly schedule of investments
The Fund files a complete schedule of portfolio holdings with the SEC for the first and third quarters of each fiscal year on Form N-Q. The Fund’s Form N-Q is available on the SEC’s website at sec.gov and may be reviewed and copied at the SEC’s Public Reference Room in Washington, D.C. Information on the operation of the Public Reference Room may be obtained by calling 800.SEC.0330. The Fund’s complete schedule of portfolio holdings, as filed on Form N-Q, can also be obtained without charge, upon request, by calling 800.345.6611.
Additional Fund information
For more information about the Fund, please visit investor.columbiathreadneedleus.com or call 800.345.6611. Customer Service Representatives are available to answer your questions Monday through Friday from 8 a.m. to 7 p.m. Eastern time.
Fund investment manager
Columbia Management Investment Advisers, LLC
225 Franklin Street
Boston, MA 02110
Fund distributor
Columbia Management Investment Distributors, Inc.
225 Franklin Street
Boston, MA 02110
Fund transfer agent
Columbia Management Investment Services Corp.
P.O. Box 8081
Boston, MA 02266-8081
Columbia Seligman Global Technology Fund | Semiannual Report 2017
| 27 |
[THIS PAGE INTENTIONALLY LEFT BLANK]
[THIS PAGE INTENTIONALLY LEFT BLANK]
Columbia Seligman Global Technology Fund
P.O. Box 8081
Boston, MA 02266-8081
Please read and consider the investment objectives, risks, charges and expenses for any fund carefully before investing. For a prospectus and summary prospectus, which contains this and other important information about the Fund, go to
investor.columbiathreadneedleus.com. The Fund is distributed by Columbia Management Investment Distributors, Inc., member FINRA, and managed by Columbia Management Investment Advisers, LLC.
Columbia Threadneedle Investments (Columbia Threadneedle) is the global brand name of the Columbia and Threadneedle group of companies. All rights reserved. Columbia Management Investment Distributors, Inc., 225 Franklin Street, Boston, MA 02110-2804
© 2017 Columbia Management Investment Advisers, LLC.
investor.columbiathreadneedleus.com

SemiAnnual Report
April 30, 2017
Columbia Asia Pacific ex-Japan Fund
Not FDIC Insured • No bank guarantee • May lose value
Dear Shareholders,
While emotions have run high following the outcome of the U.S. Presidential election, it remains unclear how the Trump presidency will unfold in terms of policy. We have a sense of the priorities espoused by the President over the past eighteen months, but campaign priorities are not always realized and are often never pursued. What seems certain is that, while some investors have already priced expectations into the market, others have retreated, preferring instead a wait and see approach. The outcome of such behaviors appears to have created conditions ripe for ongoing market volatility.
While volatility in the financial markets can be stressful, volatility itself is not a new phenomenon. Other factors that have been at the root cause of recent volatility include uncertainty following the United Kingdom’s vote to exit the European Union (Brexit), speculation around the Federal Reserve’s decision to increase interest rates, divergent central bank policy and geopolitical unrest. The point is, financial markets have fluctuated for years and may be expected to continue to fluctuate — sometimes wildly. If anything, such volatility seems to be the new normal, perhaps exacerbated by access to information and development of technological tools which have enabled investors to react rapidly to real and perceived change. So what can you do?
Position your portfolio for the reality of market volatility
That there is a historical precedent for market volatility, or even an acceptance that it may persist, offers little comfort. A measured and strategic approach remains the best strategy for investors to stay on track in achieving their investment goals.
Step 1: Review your investment goals
Take this opportunity to review your investment goals and the strategies you are pursuing to achieve those goals in order to remain focused on what’s important to you. It is entirely possible that your goals have changed in response either to your life situation or to changes in the market. Accept what you can’t control — volatility, and focus on what you can — your investment goals and strategies.
Step 2: Reassess your risk tolerance
Sit down with your financial advisor to discuss your investment goals and strategies, as well as any changes to your tolerance for risk. Consider your investment horizon. Increased market volatility and a new investment horizon may impact the strategies that can best help you achieve your investment goals. Remember, achieving your investment goals may require a certain amount of risk. Ultimately, you must maintain vigilance in reassessing your risk tolerance and the strategies you have selected in pursuit of your investment goals, and awareness of how those strategies may react to market volatility.
Step 3: Remain calm and focus on your long-term plan
Remember, investing is about the long game. Short term events are not necessarily evidence of a longer term reality. Investors who attempt to time the market too often end up reacting to a down turn by selling low and then compounding the problem by waiting on the sidelines, ultimately missing the right opportunity to reinvest.
Columbia Asia Pacific ex-Japan Fund | Semiannual Report 2017
President’s Message (continued)
As long as there is a market, there will be volatility. How you respond to that volatility can make a big difference in the measure of your success as an investor. Talk to your financial advisor about how working with Columbia Threadneedle Investments may help you position your portfolio for the reality of ongoing volatility and, perhaps, even turn such volatility into investment opportunity.
Sincerely,
Christopher O. Petersen
President, Columbia Funds
Investors should consider the investment objectives, risks, charges and expenses of a mutual fund carefully before investing. For a free prospectus and summary prospectus, which contains this and other important information about a fund, visit investor.columbiathreadneedleus.com. The prospectus should be read carefully before investing.
Columbia Funds are distributed by Columbia Management Investment Distributors, Inc., member FINRA, and managed by Columbia Management Investment Advisers, LLC.
© 2017 Columbia Management Investment Advisers, LLC. All rights reserved.
Columbia Asia Pacific ex-Japan Fund | Semiannual Report 2017
Columbia Asia Pacific ex-Japan Fund | Semiannual Report 2017
Fund at a Glance
(Unaudited)
Investment objective
Columbia Asia Pacific ex-Japan Fund (the Fund) seeks to provide shareholders with long-term growth of capital.
Portfolio management
Threadneedle International Limited
Vanessa Donegan
George Gosden
Morningstar style boxTM
The Morningstar Style Box is based on a fund’s portfolio holdings. For equity funds, the vertical axis shows the market capitalization of the stocks owned, and the horizontal axis shows investment style (value, blend, or growth). Information shown is based on the most recent data provided by Morningstar.
© 2017 Morningstar, Inc. All rights reserved. The Morningstar information contained herein: (1) is proprietary to Morningstar and/or its content providers; (2) may not be copied or distributed; and (3) is not warranted to be accurate, complete or timely. Neither Morningstar nor its content providers are responsible for any damages or losses arising from any use of this information.
| Average annual total returns (%) (for the period ended April 30, 2017) |
| | | Inception | 6 Months
cumulative | 1 Year | 5 Years | Life |
| Class A * | Excluding sales charges | 09/27/10 | 9.57 | 18.65 | 4.94 | 6.87 |
| | Including sales charges | | 3.23 | 11.79 | 3.71 | 6.06 |
| Class C * | Excluding sales charges | 09/27/10 | 9.10 | 17.57 | 4.14 | 6.03 |
| | Including sales charges | | 8.10 | 16.57 | 4.14 | 6.03 |
| Class R * | 09/27/10 | 9.38 | 18.18 | 4.65 | 6.56 |
| Class R5 | 07/15/09 | 9.61 | 18.87 | 5.32 | 7.25 |
| Class Y * | 03/01/17 | 9.68 | 18.95 | 5.33 | 7.26 |
| Class Z * | 09/27/10 | 9.53 | 18.70 | 5.18 | 7.09 |
| MSCI AC Asia Pacific ex Japan Index (Net) | | 10.79 | 20.14 | 4.98 | 8.28 |
Returns for Class A are shown with and without the maximum initial sales charge of 5.75%. Returns for Class C are shown with and without the 1.00% contingent deferred sales charge for the first year only. The Fund’s other classes are not subject to sales charges and have limited eligibility. Please see the Fund’s prospectus for details. Performance for different share classes will vary based on differences in sales charges and fees associated with each class. All results shown assume reinvestment of distributions during the period. Returns do not reflect the deduction of taxes that a shareholder may pay on Fund distributions or on the redemption of Fund shares. Performance results reflect the effect of any fee waivers or reimbursements of Fund expenses by Columbia Management Investment Advisers, LLC and/or any of its affiliates. Absent these fee waivers or expense reimbursement arrangements, performance results would have been lower.
The performance information shown represents past performance and is not a guarantee of future results. The investment return and principal value of your investment will fluctuate so that your shares, when redeemed, may be worth more or less than their original cost. Current performance may be lower or higher than the performance information shown. You may obtain performance information current to the most recent month-end by contacting your financial intermediary, visiting investor.columbiathreadneedleus.com or calling 800.345.6611.
| * | The returns shown for periods prior to the share class inception date (including returns for the Life of the Fund, if shown, which are since Fund inception) include the returns of the Fund’s oldest share class. These returns are adjusted to reflect any higher class-related operating expenses of the newer share classes, as applicable. Please visit investor.columbiathreadneedleus.com/investment-products/mutual-funds/appended-performance for more information. |
The MSCI AC Asia Pacific ex Japan Index (Net) is a free float-adjusted market capitalization weighted index that is designed to measure the equity market performance of Asia, excluding Japan.
Indices are not available for investment, are not professionally managed and do not reflect sales charges, fees, brokerage commissions, taxes (except the MSCI AC Asia Pacific ex Japan Index (Net), which reflects reinvested dividends net of withholding taxes) or other expenses of investing. Securities in the Fund may not match those in an index.
Columbia Asia Pacific ex-Japan Fund | Semiannual Report 2017
| 3 |
Fund at a Glance (continued)
(Unaudited)
| Top 10 holdings (%) (at April 30, 2017) |
| Samsung Electronics Co., Ltd. (South Korea) | 6.7 |
| Tencent Holdings Ltd. (China) | 5.1 |
| Taiwan Semiconductor Manufacturing Co., Ltd. (Taiwan) | 4.8 |
| Alibaba Group Holding Ltd., ADR (China) | 4.5 |
| AIA Group Ltd. (Hong Kong) | 4.4 |
| Ping An Insurance Group Co. of China Ltd., Class H (China) | 2.6 |
| China Construction Bank Corp., Class H (China) | 2.6 |
| Australia and New Zealand Banking Group Ltd. (Australia) | 2.5 |
| Westpac Banking Corp. (Australia) | 2.3 |
| BHP Billiton Ltd. (Australia) | 2.1 |
Percentages indicated are based upon total investments (excluding Money Market Funds).
For further detail about these holdings, please refer to the section entitled “Portfolio of Investments.”
Fund holdings are as of the date given, are subject to change at any time, and are not recommendations to buy or sell any security.
| Equity sector breakdown (%) (at April 30, 2017) |
| Consumer Discretionary | 8.8 |
| Consumer Staples | 0.8 |
| Energy | 4.6 |
| Financials | 31.1 |
| Health Care | 2.6 |
| Industrials | 4.5 |
| Information Technology | 30.0 |
| Materials | 11.6 |
| Real Estate | 3.1 |
| Telecommunication Services | 2.2 |
| Utilities | 0.7 |
| Total | 100.0 |
Percentages indicated are based upon total equity investments. The Fund’s portfolio composition is subject to change.
| Country breakdown (%) (at April 30, 2017) |
| Australia | 18.1 |
| China | 26.5 |
| Hong Kong | 10.1 |
| India | 7.9 |
| Indonesia | 4.3 |
| Malaysia | 0.4 |
| Philippines | 1.4 |
| Singapore | 1.9 |
| South Korea | 16.5 |
| Taiwan | 11.0 |
| Thailand | 1.4 |
| United States(a) | 0.5 |
| Total | 100.0 |
| (a) | Includes investments in Money Market Funds. |
Country breakdown is based primarily on issuer’s place of organization/incorporation. Percentages indicated are based upon total investments. The Fund’s portfolio composition is subject to change.
| 4 | Columbia Asia Pacific ex-Japan Fund | Semiannual Report 2017 |
Understanding Your Fund’s Expenses
(Unaudited)
As an investor, you incur two types of costs. There are transaction costs, which generally include sales charges on purchases and may include redemption fees. There are also ongoing costs, which generally include management fees, distribution and/or service fees, and other fund expenses. The following information is intended to help you understand your ongoing costs (in dollars) of investing in the Fund and to help you compare these costs with the ongoing costs of investing in other mutual funds.
Analyzing your Fund’s expenses
To illustrate these ongoing costs, we have provided examples and calculated the expenses paid by investors in each share class of the Fund during the period. The actual and hypothetical information in the table is based on an initial investment of $1,000 at the beginning of the period indicated and held for the entire period. Expense information is calculated two ways and each method provides you with different information. The amount listed in the “Actual” column is calculated using the Fund’s actual operating expenses and total return for the period. You may use the Actual information, together with the amount invested, to estimate the expenses that you paid over the period. Simply divide your account value by $1,000 (for example, an $8,600 account value divided by $1,000 = 8.6), then multiply the results by the expenses paid during the period under the “Actual” column. The amount listed in the “Hypothetical” column assumes a 5% annual rate of return before expenses (which is not the Fund’s actual return) and then applies the Fund’s actual expense ratio for the period to the hypothetical return. You should not use the hypothetical account values and expenses to estimate either your actual account balance at the end of the period or the expenses you paid during the period. See “Compare with other funds” below for details on how to use the hypothetical data.
Compare with other funds
Since all mutual funds are required to include the same hypothetical calculations about expenses in shareholder reports, you can use this information to compare the ongoing cost of investing in the Fund with other funds. To do so, compare the hypothetical example with the 5% hypothetical examples that appear in the shareholder reports of other funds. As you compare hypothetical examples of other funds, it is important to note that hypothetical examples are meant to highlight the ongoing costs of investing in a fund only and do not reflect any transaction costs, such as sales charges, or redemption or exchange fees. Therefore, the hypothetical calculations are useful in comparing ongoing costs only, and will not help you determine the relative total costs of owning different funds. If transaction costs were included in these calculations, your costs would be higher.
| November 1, 2016 — April 30, 2017 |
| | Account value at the
beginning of the
period ($) | Account value at the
end of the
period ($) | Expenses paid during
the period ($) | Fund’s annualized
expense ratio (%) |
| | Actual | Hypothetical | Actual | Hypothetical | Actual | Hypothetical | Actual |
| Class A | 1,000.00 | 1,000.00 | 1,095.70 | 1,017.02 | 7.86 | 7.57 | 1.53 |
| Class C | 1,000.00 | 1,000.00 | 1,091.00 | 1,013.34 | 11.69 | 11.26 | 2.28 |
| Class R | 1,000.00 | 1,000.00 | 1,093.80 | 1,015.79 | 9.14 | 8.80 | 1.78 |
| Class R5 | 1,000.00 | 1,000.00 | 1,096.10 | 1,018.78 | 6.01 | 5.79 | 1.17 |
| Class Y | 1,000.00 | 1,000.00 | 1,052.70 (a) | 1,018.73 | 1.89 (a) | 5.84 | 1.18 (a) |
| Class Z | 1,000.00 | 1,000.00 | 1,095.30 | 1,018.24 | 6.58 | 6.33 | 1.28 |
| (a) | Based on operations from March 1, 2017 (commencement of operations) through the stated period end. |
Expenses paid during the period are equal to the annualized expense ratio for each class as indicated above, multiplied by the average account value over the period and then multiplied by the number of days in the Fund’s most recent fiscal half year and divided by 365.
Expenses do not include fees and expenses incurred indirectly by the Fund from its investment in underlying funds, including affiliated and non-affiliated pooled investment vehicles, such as mutual funds and exchange-traded funds.
Had Columbia Management Investment Advisers, LLC and/or certain of its affiliates not waived/reimbursed certain fees and expenses, account value at the end of the period would have been reduced.
Columbia Management Investment Advisers, LLC and/or certain of its affiliates have contractually agreed to waive certain fees and/or to reimburse certain expenses (excluding transaction costs and certain other investment related expenses, interest, taxes, acquired fund fees and expenses, and infrequent and/or unusual expenses) until February 28, 2018, unless sooner terminated at the sole discretion of the Fund’s Board, such that net expenses, subject to applicable exclusions, will not exceed 1.590% for Class A, 2.340% for Class C, 1.840% for Class R, 1.245% for Class R5 and 1.340% for Class Z. Any amounts waived will not be reimbursed by the Fund. This change becomes effective March 1, 2017. If this change had been in place for the entire six month period ended April 30, 2017, the actual expenses paid would have been $8.17 for Class A, $12.00 for Class C, $9.45 for Class R, $6.42 for Class R5 and $6.88 for Class Z; and the hypothetical expenses paid would have been $7.86 for Class A, $11.55 for Class C, $9.09 for Class R, $6.19 for Class R5 and $6.63 for Class Z. Other share classes may have had expense waiver changes; however, the changes were not considered material.
Columbia Asia Pacific ex-Japan Fund | Semiannual Report 2017
| 5 |
Portfolio of Investments
April 30, 2017 (Unaudited)
(Percentages represent value of investments compared to net assets)
| Common Stocks 98.9% |
| Issuer | Shares | Value ($) |
| Australia 18.1% |
| Amcor Ltd. | 27,191 | 319,720 |
| Australia and New Zealand Banking Group Ltd. | 28,712 | 702,841 |
| BHP Billiton Ltd. | 34,057 | 606,349 |
| Commonwealth Bank of Australia | 7,095 | 463,402 |
| CSL Ltd. | 4,343 | 430,652 |
| Domino’s Pizza Enterprises Ltd. | 3,882 | 177,524 |
| James Hardie Industries PLC | 12,299 | 208,103 |
| LendLease Group | 25,158 | 302,038 |
| Link Administration Holdings Ltd. | 36,299 | 209,821 |
| Macquarie Group Ltd. | 4,902 | 340,527 |
| Rio Tinto Ltd. | 11,140 | 504,327 |
| Transurban Group | 29,848 | 272,688 |
| Westpac Banking Corp. | 24,647 | 646,116 |
| Total | 5,184,108 |
| China 26.0% |
| Alibaba Group Holding Ltd., ADR(a) | 11,086 | 1,280,433 |
| Anhui Conch Cement Co., Ltd., Class H | 97,500 | 340,963 |
| ANTA Sports Products Ltd. | 93,000 | 261,025 |
| Bank of China Ltd., Class H | 822,000 | 397,612 |
| China Construction Bank Corp., Class H | 900,380 | 730,806 |
| China Mobile Ltd. | 26,500 | 282,136 |
| China Overseas Land & Investment Ltd. | 86,000 | 249,451 |
| China Petroleum & Chemical Corp., Class H | 464,000 | 376,793 |
| CNOOC Ltd. | 204,000 | 237,986 |
| CSPC Pharmaceutical Group Ltd. | 136,000 | 188,634 |
| Guangdong Investment Ltd. | 126,000 | 194,894 |
| JD.com, Inc., ADR(a) | 4,733 | 165,986 |
| Minth Group Ltd. | 54,000 | 200,398 |
| NetEase, Inc., ADR | 632 | 167,726 |
| PetroChina Co., Ltd., Class H | 288,000 | 202,343 |
| Ping An Insurance Group Co. of China Ltd., Class H | 130,000 | 730,893 |
| Tencent Holdings Ltd. | 45,900 | 1,438,200 |
| Total | 7,446,279 |
| Hong Kong 10.1% |
| AIA Group Ltd. | 181,000 | 1,252,780 |
| BOC Hong Kong Holdings Ltd. | 137,500 | 565,061 |
| CK Hutchison Holdings Ltd. | 16,872 | 210,685 |
| Galaxy Entertainment Group Ltd. | 39,000 | 216,663 |
| Common Stocks (continued) |
| Issuer | Shares | Value ($) |
| Samsonite International SA | 66,600 | 256,993 |
| Sands China Ltd. | 44,800 | 202,906 |
| Techtronic Industries Co., Ltd. | 40,500 | 173,760 |
| Total | 2,878,848 |
| India 7.9% |
| Adani Ports & Special Economic Zone(a) | 13,677 | 69,674 |
| Asian Paints Ltd. | 13,795 | 240,450 |
| Eicher Motors Ltd.(a) | 657 | 265,913 |
| HDFC Bank Ltd. | 16,659 | 399,788 |
| ICICI Bank Ltd. | 81,614 | 351,925 |
| Larsen & Toubro Ltd. | 8,772 | 238,510 |
| Maruti Suzuki India Ltd. | 1,935 | 196,122 |
| Reliance Industries Ltd.(a) | 15,638 | 338,902 |
| Zee Entertainment Enterprises Ltd. | 20,923 | 171,324 |
| Total | 2,272,608 |
| Indonesia 4.3% |
| PT Astra International Tbk | 475,700 | 318,810 |
| PT Bank Rakyat Indonesia Persero Tbk | 336,200 | 324,736 |
| PT Indofood Sukses Makmur Tbk | 168,100 | 105,349 |
| PT Matahari Department Store Tbk | 141,700 | 154,837 |
| PT Telekomunikasi Indonesia Persero Tbk | 1,011,100 | 333,548 |
| Total | 1,237,280 |
| Malaysia 0.4% |
| IHH Healthcare Bhd | 84,300 | 120,012 |
| Philippines 1.4% |
| Metro Pacific Investments Corp. | 1,306,100 | 171,989 |
| Metropolitan Bank & Trust Co. | 126,784 | 214,192 |
| Total | 386,181 |
| Singapore 1.9% |
| CapitaLand Ltd. | 69,400 | 186,474 |
| DBS Group Holdings Ltd. | 15,800 | 218,205 |
| Keppel DC REIT | 169,586 | 150,310 |
| Total | 554,989 |
| South Korea 16.5% |
| Doosan Bobcat, Inc. | 6,872 | 236,027 |
| Hana Financial Group, Inc. | 5,523 | 189,688 |
| LG Chem Ltd. | 1,260 | 303,065 |
| LG Innotek Co., Ltd. | 2,121 | 244,934 |
The accompanying Notes to Financial Statements are an integral part of this statement.
| 6 | Columbia Asia Pacific ex-Japan Fund | Semiannual Report 2017 |
Portfolio of Investments (continued)
April 30, 2017 (Unaudited)
| Common Stocks (continued) |
| Issuer | Shares | Value ($) |
| Lotte Chemical Corp. | 632 | 189,723 |
| NAVER Corp. | 499 | 350,709 |
| NCSoft Corp. | 578 | 182,790 |
| POSCO | 1,598 | 377,261 |
| Samsung Electronics Co., Ltd. | 968 | 1,897,695 |
| Samsung Life Insurance Co., Ltd. | 2,099 | 201,797 |
| Samsung SDI Co., Ltd. | 2,000 | 241,447 |
| Shinhan Financial Group Co., Ltd. | 7,279 | 303,909 |
| Total | 4,719,045 |
| Taiwan 10.9% |
| Cathay Financial Holding Co., Ltd. | 131,000 | 209,942 |
| Chroma ATE, Inc. | 77,000 | 240,719 |
| E.Sun Financial Holding Co., Ltd. | 305,154 | 184,445 |
| Formosa Plastics Corp. | 72,000 | 216,349 |
| Hon Hai Precision Industry Co., Ltd. | 175,000 | 572,804 |
| Largan Precision Co., Ltd. | 2,000 | 332,139 |
| Taiwan Semiconductor Manufacturing Co., Ltd. | 214,000 | 1,378,565 |
| Total | 3,134,963 |
| Thailand 1.4% |
| Kasikornbank PCL, Foreign Registered Shares | 45,614 | 243,722 |
| PTT PCL, Foreign Registered Shares | 15,000 | 168,393 |
| Total | 412,115 |
Total Common Stocks
(Cost $20,705,441) | 28,346,428 |
|
| Warrants 0.4% |
| Issuer | Shares | Value ($) |
| China 0.4% |
| Wuliangye Yibin Co., Ltd.(a),(b) | 19,000 | 125,256 |
Total Warrants
(Cost $114,096) | 125,256 |
|
| Money Market Funds 0.5% |
| | Shares | Value ($) |
| Columbia Short-Term Cash Fund, 0.869%(c),(d) | 142,309 | 142,309 |
Total Money Market Funds
(Cost $142,309) | 142,309 |
Total Investments
(Cost $20,961,846) | 28,613,993 |
| Other Assets & Liabilities, Net | | 64,919 |
| Net Assets | $28,678,912 |
Notes to Portfolio of Investments
| (a) | Non-income producing investment. |
| (b) | Represents fair value as determined in good faith under procedures approved by the Board of Trustees. At April 30, 2017, the value of these securities amounted to $125,256, which represents 0.44% of net assets. |
| (c) | The rate shown is the seven-day current annualized yield at April 30, 2017. |
| (d) | As defined in the Investment Company Act of 1940, an affiliated company is one in which the Fund owns 5% or more of the company’s outstanding voting securities, or a company which is under common ownership or control with the Fund. Holdings and transactions in these affiliated companies during the period ended April 30, 2017 are as follows: |
| Issuer | Beginning
shares | Shares
purchased | Shares
sold | Ending
shares | Realized gain
(loss) ($) | Dividends —
affiliated
issuers($) | Value ($) |
| Columbia Short-Term Cash Fund, 0.869% | 271,254 | 4,150,886 | (4,279,831) | 142,309 | (9) | 504 | 142,309 |
Abbreviation Legend
| ADR | American Depositary Receipt |
The accompanying Notes to Financial Statements are an integral part of this statement.
Columbia Asia Pacific ex-Japan Fund | Semiannual Report 2017
| 7 |
Portfolio of Investments (continued)
April 30, 2017 (Unaudited)
Fair value measurements
The Fund categorizes its fair value measurements according to a three-level hierarchy that maximizes the use of observable inputs and minimizes the use of unobservable inputs by prioritizing that the most observable input be used when available. Observable inputs are those that market participants would use in pricing an investment based on market data obtained from sources independent of the reporting entity. Unobservable inputs are those that reflect the Fund’s assumptions about the information market participants would use in pricing an investment. An investment’s level within the fair value hierarchy is based on the lowest level of any input that is deemed significant to the asset’s or liability’s fair value measurement. The input levels are not necessarily an indication of the risk or liquidity associated with investments at that level. For example, certain U.S. government securities are generally high quality and liquid, however, they are reflected as Level 2 because the inputs used to determine fair value may not always be quoted prices in an active market.
Fair value inputs are summarized in the three broad levels listed below:
| • | Level 1 – Valuations based on quoted prices for investments in active markets that the Fund has the ability to access at the measurement date (including NAV for open-end mutual funds). Valuation adjustments are not applied to Level 1 investments. |
| • | Level 2 – Valuations based on other significant observable inputs (including quoted prices for similar securities, interest rates, prepayment speeds, credit risks, etc.). |
| • | Level 3 – Valuations based on significant unobservable inputs (including the Fund’s own assumptions and judgment in determining the fair value of investments). |
Inputs that are used in determining fair value of an investment may include price information, credit data, volatility statistics, and other factors. These inputs can be either observable or unobservable. The availability of observable inputs can vary between investments, and is affected by various factors such as the type of investment, and the volume and level of activity for that investment or similar investments in the marketplace. The inputs will be considered by the Investment Manager, along with any other relevant factors in the calculation of an investment’s fair value. The Fund uses prices and inputs that are current as of the measurement date, which may include periods of market dislocations. During these periods, the availability of prices and inputs may be reduced for many investments. This condition could cause an investment to be reclassified between the various levels within the hierarchy.
Foreign equity securities actively traded in markets where there is a significant delay in the local close relative to the New York Stock Exchange are classified as Level 2. The values of these securities may include an adjustment to reflect the impact of significant market movements following the close of local trading, as described in Note 2 to the financial statements – Security valuation.
Certain investments that have been measured at fair value using the net asset value (NAV) per share (or its equivalent) are not categorized in the fair value hierarchy. The fair value amounts presented in the table are intended to reconcile the fair value hierarchy to the amounts presented in the Portfolio of Investments. The Columbia Short-Term Cash Fund seeks to provide shareholders with maximum current income consistent with liquidity and stability of principal. Columbia Short-Term Cash Fund prices its shares with a floating NAV and no longer seeks to maintain a stable NAV.
Investments falling into the Level 3 category are primarily supported by quoted prices from brokers and dealers participating in the market for those investments. However, these may be classified as Level 3 investments due to lack of market transparency and corroboration to support these quoted prices. Additionally, valuation models may be used as the pricing source for any remaining investments classified as Level 3. These models may rely on one or more significant unobservable inputs and/or significant assumptions by the Investment Manager. Inputs used in valuations may include, but are not limited to, financial statement analysis, capital account balances, discount rates and estimated cash flows, and comparable company data.
Under the direction of the Fund’s Board of Trustees (the Board), the Investment Manager’s Valuation Committee (the Committee) is responsible for overseeing the valuation procedures approved by the Board. The Committee consists of voting and non-voting members from various groups within the Investment Manager’s organization, including operations and accounting, trading and investments, compliance, risk management and legal.
The Committee meets at least monthly to review and approve valuation matters, which may include a description of specific valuation determinations, data regarding pricing information received from approved pricing vendors and brokers and the results of Board-approved valuation control policies and procedures (the Policies). The Policies address, among other things, instances when market quotations are or are not readily available, including recommendations of third party pricing vendors and a determination of appropriate pricing methodologies; events that require specific valuation determinations and assessment of fair value techniques; securities with a potential for stale pricing, including those that are illiquid, restricted, or in default; and the effectiveness of third party pricing vendors, including periodic reviews of vendors. The Committee meets more frequently, as needed, to discuss additional valuation matters, which may include the need to review back-testing results, review time-sensitive information or approve related valuation actions. The Committee reports to the Board, with members of the Committee meeting with the Board at each of its regularly scheduled meetings to discuss valuation matters and actions during the period, similar to those described earlier.
For investments categorized as Level 3, the Committee monitors information similar to that described above, which may include: (i) data specific to the issuer or comparable issuers, (ii) general market or specific sector news and (iii) quoted prices and specific or similar security transactions. The Committee considers this data and any changes from prior periods in order to assess the reasonableness of observable and unobservable inputs, any assumptions or internal models used to value those securities and changes in fair value. This data is also used to corroborate, when available, information received from approved pricing vendors and brokers. Various factors impact the frequency of monitoring this information (which may occur as often as daily). However, the Committee may determine that changes to inputs, assumptions and models are not required as a result of the monitoring procedures performed.
The following table is a summary of the inputs used to value the Fund’s investments at April 30, 2017:
| | Level 1
quoted prices
in active
markets for
identical
assets ($) | Level 2
other
significant
observable
inputs ($) | Level 3
significant
unobservable
inputs ($) | Investments
measured at
net asset
value ($) | Total ($) |
| Investments | | | | | |
| Common Stocks | | | | | |
| Australia | — | 5,184,108 | — | — | 5,184,108 |
| China | 1,614,145 | 5,832,134 | — | — | 7,446,279 |
| Hong Kong | — | 2,878,848 | — | — | 2,878,848 |
| India | — | 2,272,608 | — | — | 2,272,608 |
| Indonesia | — | 1,237,280 | — | — | 1,237,280 |
The accompanying Notes to Financial Statements are an integral part of this statement.
| 8 | Columbia Asia Pacific ex-Japan Fund | Semiannual Report 2017 |
Portfolio of Investments (continued)
April 30, 2017 (Unaudited)
Fair value measurements (continued)
| | Level 1
quoted prices
in active
markets for
identical
assets ($) | Level 2
other
significant
observable
inputs ($) | Level 3
significant
unobservable
inputs ($) | Investments
measured at
net asset
value ($) | Total ($) |
| Malaysia | — | 120,012 | — | — | 120,012 |
| Philippines | — | 386,181 | — | — | 386,181 |
| Singapore | — | 554,989 | — | — | 554,989 |
| South Korea | — | 4,719,045 | — | — | 4,719,045 |
| Taiwan | — | 3,134,963 | — | — | 3,134,963 |
| Thailand | — | 412,115 | — | — | 412,115 |
| Total Common Stocks | 1,614,145 | 26,732,283 | — | — | 28,346,428 |
| Warrants | — | — | 125,256 | — | 125,256 |
| Money Market Funds | — | — | — | 142,309 | 142,309 |
| Total Investments | 1,614,145 | 26,732,283 | 125,256 | 142,309 | 28,613,993 |
See the Portfolio of Investments for all investment classifications not indicated in the table.
The Fund’s assets assigned to the Level 2 input category are generally valued using the market approach, in which a security’s value is determined through reference to prices and information from market transactions for similar or identical assets. These assets include certain foreign securities for which a third party statistical pricing service may be employed for purposes of fair market valuation. The model utilized by such third party statistical pricing service takes into account a security’s correlation to available market data including, but not limited to, intraday index, ADR, and exchange-traded fund movements.
There were no transfers of financial assets between levels during the period.
The Fund does not hold any significant investments (greater than one percent of net assets) categorized as Level 3.
The Fund’s assets assigned to the Level 3 category are valued utilizing the valuation technique deemed the most appropriate in the circumstances. Certain warrants classified as Level 3 securities are valued using the market approach. To determine fair value for these securities, management considered various factors which may have included, but were not limited to, discount rates observed in the market for similar assets as well as the movement in certain foreign or domestic market indices. Significant increases (decreases) to any of these inputs would result in a significantly lower (higher) fair value measurement. Generally, a change in observable yields on comparable securities would result in a directionally similar change to discount rates.
The accompanying Notes to Financial Statements are an integral part of this statement.
Columbia Asia Pacific ex-Japan Fund | Semiannual Report 2017
| 9 |
Statement of Assets and Liabilities
April 30, 2017 (Unaudited)
| Assets | |
| Investments, at cost | |
| Unaffiliated issuers, at cost | $20,819,537 |
| Affiliated issuers, at cost | 142,309 |
| Total investments, at cost | 20,961,846 |
| Investments, at value | |
| Unaffiliated issuers, at value | 28,471,684 |
| Affiliated issuers, at value | 142,309 |
| Total investments, at value | 28,613,993 |
| Cash | 6,135 |
| Foreign currency (identified cost $4,279) | 4,225 |
| Receivable for: | |
| Investments sold | 269,547 |
| Capital shares sold | 65 |
| Dividends | 8,699 |
| Foreign tax reclaims | 331 |
| Expense reimbursement due from Investment Manager | 381 |
| Prepaid expenses | 595 |
| Other assets | 26,963 |
| Total assets | 28,930,934 |
| Liabilities | |
| Payable for: | |
| Investments purchased | 144,318 |
| Capital shares purchased | 10,409 |
| Foreign capital gains taxes deferred | 39,946 |
| Management services fees | 692 |
| Distribution and/or service fees | 18 |
| Transfer agent fees | 450 |
| Compensation of board members | 39,139 |
| Other expenses | 17,050 |
| Total liabilities | 252,022 |
| Net assets applicable to outstanding capital stock | $28,678,912 |
| Represented by | |
| Paid in capital | 114,044,076 |
| Excess of distributions over net investment income | (111,477) |
| Accumulated net realized loss | (92,865,697) |
| Unrealized appreciation (depreciation) on: | |
| Investments - unaffiliated issuers | 7,652,147 |
| Foreign currency translations | (191) |
| Foreign capital gains tax | (39,946) |
| Total - representing net assets applicable to outstanding capital stock | $28,678,912 |
The accompanying Notes to Financial Statements are an integral part of this statement.
| 10 | Columbia Asia Pacific ex-Japan Fund | Semiannual Report 2017 |
Statement of Assets and Liabilities (continued)
April 30, 2017 (Unaudited)
| Class A | |
| Net assets | $665,721 |
| Shares outstanding | 58,009 |
| Net asset value per share | $11.48 |
| Maximum offering price per share(a) | $12.18 |
| Class C | |
| Net assets | $353,188 |
| Shares outstanding | 31,170 |
| Net asset value per share | $11.33 |
| Class R | |
| Net assets | $294,924 |
| Shares outstanding | 25,927 |
| Net asset value per share | $11.38 |
| Class R5 | |
| Net assets | $13,298,069 |
| Shares outstanding | 1,154,326 |
| Net asset value per share | $11.52 |
| Class Y | |
| Net assets | $13,870,139 |
| Shares outstanding | 1,217,231 |
| Net asset value per share | $11.39 |
| Class Z | |
| Net assets | $196,871 |
| Shares outstanding | 17,148 |
| Net asset value per share | $11.48 |
| (a) | The maximum offering price per share is calculated by dividing the net asset value per share by 1.0 minus the maximum sales charge of 5.75% for Class A. |
The accompanying Notes to Financial Statements are an integral part of this statement.
Columbia Asia Pacific ex-Japan Fund | Semiannual Report 2017
| 11 |
Statement of Operations
Six Months Ended April 30, 2017 (Unaudited)
| Net investment income | |
| Income: | |
| Dividends — unaffiliated issuers | $238,976 |
| Dividends — affiliated issuers | 504 |
| Foreign taxes withheld | (19,212) |
| Total income | 220,268 |
| Expenses: | |
| Management services fees | 125,855 |
| Distribution and/or service fees | |
| Class A | 850 |
| Class C | 1,776 |
| Class R | 656 |
| Transfer agent fees | |
| Class A | 763 |
| Class C | 399 |
| Class I(a) | 336 |
| Class R | 294 |
| Class R5 | 4,600 |
| Class Y(b) | 142 |
| Class Z | 190 |
| Compensation of board members | 7,660 |
| Custodian fees | 14,925 |
| Printing and postage fees | 9,795 |
| Registration fees | 38,681 |
| Audit fees | 26,414 |
| Legal fees | 3,036 |
| Compensation of chief compliance officer | 4 |
| Other | 9,365 |
| Total expenses | 245,741 |
| Fees waived or expenses reimbursed by Investment Manager and its affiliates | (77,297) |
| Total net expenses | 168,444 |
| Net investment income | 51,824 |
| Realized and unrealized gain (loss) — net | |
| Net realized gain (loss) on: | |
| Investments — unaffiliated issuers | 2,488,182 |
| Investments — affiliated issuers | (9) |
| Foreign currency translations | (3,338) |
| Net realized gain | 2,484,835 |
| Net change in unrealized appreciation (depreciation) on: | |
| Investments — unaffiliated issuers | (16,882) |
| Foreign currency translations | 5,709 |
| Foreign capital gains tax | (3,725) |
| Net change in unrealized appreciation (depreciation) | (14,898) |
| Net realized and unrealized gain | 2,469,937 |
| Net increase in net assets resulting from operations | $2,521,761 |
| (a) | Effective March 27, 2017, Class I shares were redeemed or exchanged for Class Y shares. |
| (b) | Class Y shares are based on operations from March 1, 2017 (commencement of operations) through the stated period end. |
The accompanying Notes to Financial Statements are an integral part of this statement.
| 12 | Columbia Asia Pacific ex-Japan Fund | Semiannual Report 2017 |
Statement of Changes in Net Assets
| | Six Months Ended
April 30, 2017
(Unaudited) | Year Ended
October 31, 2016 |
| Operations | | |
| Net investment income | $51,824 | $565,377 |
| Net realized gain | 2,484,835 | 5,140,922 |
| Net change in unrealized appreciation (depreciation) | (14,898) | (4,598,998) |
| Net increase in net assets resulting from operations | 2,521,761 | 1,107,301 |
| Distributions to shareholders | | |
| Net investment income | | |
| Class A | (7,413) | (192,870) |
| Class C | (857) | (68,234) |
| Class I(a) | (179,781) | (3,515,999) |
| Class R | (1,785) | (67,564) |
| Class R5 | (188,844) | (10,709,458) |
| Class Z | (1,902) | (142,042) |
| Total distributions to shareholders | (380,582) | (14,696,167) |
| Decrease in net assets from capital stock activity | (5,790,068) | (31,184,505) |
| Total decrease in net assets | (3,648,889) | (44,773,371) |
| Net assets at beginning of period | 32,327,801 | 77,101,172 |
| Net assets at end of period | $28,678,912 | $32,327,801 |
| Undistributed (excess of distributions over) net investment income | $(111,477) | $217,281 |
| (a) | Effective March 27, 2017, Class I shares were redeemed or exchanged for Class Y shares. |
The accompanying Notes to Financial Statements are an integral part of this statement.
Columbia Asia Pacific ex-Japan Fund | Semiannual Report 2017
| 13 |
Statement of Changes in Net Assets (continued)
| | Six Months Ended | Year Ended |
| | April 30, 2017 (Unaudited)(a) | October 31, 2016 |
| | Shares | Dollars ($) | Shares | Dollars ($) |
| Capital stock activity |
| Class A | | | | |
| Subscriptions | 18,227 | 193,742 | 77,358 | 758,481 |
| Distributions reinvested | 744 | 7,413 | 20,431 | 192,870 |
| Redemptions | (28,400) | (298,326) | (97,645) | (943,304) |
| Net increase (decrease) | (9,429) | (97,171) | 144 | 8,047 |
| Class C | | | | |
| Subscriptions | 188 | 2,050 | 9,194 | 89,052 |
| Distributions reinvested | 87 | 857 | 7,298 | 68,234 |
| Redemptions | (6,897) | (72,876) | (3,551) | (35,312) |
| Net increase (decrease) | (6,622) | (69,969) | 12,941 | 121,974 |
| Class I(b) | | | | |
| Subscriptions | 16,583 | 180,916 | 32,910 | 325,876 |
| Distributions reinvested | 18,048 | 179,755 | 372,793 | 3,515,442 |
| Redemptions | (1,360,353) | (15,180,782) | (265,432) | (2,713,210) |
| Net increase (decrease) | (1,325,722) | (14,820,111) | 140,271 | 1,128,108 |
| Class R | | | | |
| Subscriptions | 1,468 | 15,491 | 3,105 | 30,625 |
| Distributions reinvested | 179 | 1,771 | 7,154 | 67,030 |
| Redemptions | (3,624) | (38,056) | (5,851) | (57,972) |
| Net increase (decrease) | (1,977) | (20,794) | 4,408 | 39,683 |
| Class R5 | | | | |
| Subscriptions | 30,032 | 319,655 | 224,022 | 2,591,322 |
| Distributions reinvested | 11,563 | 115,627 | 475,575 | 4,503,698 |
| Redemptions | (434,139) | (4,566,163) | (3,732,178) | (39,374,342) |
| Net decrease | (392,544) | (4,130,881) | (3,032,581) | (32,279,322) |
| Class Y(b) | | | | |
| Subscriptions | 1,234,582 | 13,753,178 | — | — |
| Redemptions | (17,351) | (193,877) | — | — |
| Net increase | 1,217,231 | 13,559,301 | — | — |
| Class Z | | | | |
| Subscriptions | 4,085 | 44,138 | 6,389 | 67,636 |
| Distributions reinvested | 188 | 1,879 | 14,989 | 141,495 |
| Redemptions | (24,296) | (256,460) | (40,164) | (412,126) |
| Net decrease | (20,023) | (210,443) | (18,786) | (202,995) |
| Total net decrease | (539,086) | (5,790,068) | (2,893,603) | (31,184,505) |
| (a) | Class Y shares are based on operations from March 1, 2017 (commencement of operations) through the stated period end. |
| (b) | Effective March 27, 2017, Class I shares were redeemed or exchanged for Class Y shares. |
The accompanying Notes to Financial Statements are an integral part of this statement.
| 14 | Columbia Asia Pacific ex-Japan Fund | Semiannual Report 2017 |
[THIS PAGE INTENTIONALLY LEFT BLANK]
Columbia Asia Pacific ex-Japan Fund | Semiannual Report 2017
| 15 |
The following table is intended to help you understand the Fund’s financial performance. Certain information reflects financial results for a single share of a class held for the periods shown. Per share net investment income (loss) amounts are calculated based on average shares outstanding during the period. Total return assumes reinvestment of all dividends and distributions, if any. Total return does not reflect payment of sales charges, if any. Total return and portfolio turnover are not annualized for periods of less than one year. The portfolio turnover rate is calculated without regard to purchase and sales transactions of short-term instruments and certain derivatives, if any. If such transactions were included, the Fund’s portfolio turnover rate may be higher.
| Year ended (except as noted) | Net asset value,
beginning of
period | Net
investment
income
(loss) | Net
realized
and
unrealized
gain (loss) | Total from
investment
operations | Distributions
from net
investment
income | Distributions
from net
realized
gains |
| Class A |
| 4/30/2017 (c) | $10.58 | 0.00 (d) | 1.00 | 1.00 | (0.10) | — |
| 10/31/2016 | $12.91 | 0.09 | 0.45 | 0.54 | (2.87) | — |
| 10/31/2015 | $14.58 | 0.14 | (1.67) | (1.53) | (0.14) | — |
| 10/31/2014 | $13.73 | 0.27 | 0.70 | 0.97 | (0.12) | — |
| 10/31/2013 | $12.35 | 0.08 | 1.54 | 1.62 | (0.24) | — |
| 10/31/2012 | $12.49 | 0.15 | 0.41 | 0.56 | (0.14) | (0.56) |
| Class C |
| 4/30/2017 (c) | $10.41 | (0.04) | 0.98 | 0.94 | (0.02) | — |
| 10/31/2016 | $12.73 | 0.04 | 0.41 | 0.45 | (2.77) | — |
| 10/31/2015 | $14.37 | 0.02 | (1.63) | (1.61) | (0.03) | — |
| 10/31/2014 | $13.52 | 0.09 | 0.78 | 0.87 | (0.02) | — |
| 10/31/2013 | $12.20 | 0.04 | 1.46 | 1.50 | (0.18) | — |
| 10/31/2012 | $12.38 | 0.03 | 0.42 | 0.45 | (0.07) | (0.56) |
| Class R |
| 4/30/2017 (c) | $10.48 | (0.01) | 0.98 | 0.97 | (0.07) | — |
| 10/31/2016 | $12.81 | 0.08 | 0.43 | 0.51 | (2.84) | — |
| 10/31/2015 | $14.46 | 0.09 | (1.64) | (1.55) | (0.10) | — |
| 10/31/2014 | $13.62 | 0.15 | 0.78 | 0.93 | (0.09) | — |
| 10/31/2013 | $12.27 | 0.13 | 1.44 | 1.57 | (0.22) | — |
| 10/31/2012 | $12.46 | 0.13 | 0.37 | 0.50 | (0.13) | (0.56) |
| Class R5 |
| 4/30/2017 (c) | $10.65 | 0.02 | 0.98 | 1.00 | (0.13) | — |
| 10/31/2016 | $12.99 | 0.13 | 0.45 | 0.58 | (2.92) | — |
| 10/31/2015 | $14.66 | 0.26 | (1.74) | (1.48) | (0.19) | — |
| 10/31/2014 | $13.80 | 0.24 | 0.79 | 1.03 | (0.17) | — |
| 10/31/2013 | $12.38 | 0.20 | 1.48 | 1.68 | (0.26) | — |
| 10/31/2012 | $12.54 | 0.21 | 0.37 | 0.58 | (0.18) | (0.56) |
| Class Y |
| 4/30/2017 (c),(h) | $10.82 | (0.01) | 0.58 | 0.57 | — | — |
The accompanying Notes to Financial Statements are an integral part of this statement.
| 16 | Columbia Asia Pacific ex-Japan Fund | Semiannual Report 2017 |
Total
distributions to
shareholders | Net
asset
value,
end of
period | Total
return | Total gross
expense
ratio to
average
net assets(a) | Total net
expense
ratio to
average
net assets(a),(b) | Net investment
income (loss)
ratio to
average
net assets | Portfolio
turnover | Net
assets,
end of
period
(000’s) |
| |
| (0.10) | $11.48 | 9.57% | 2.12% (e) | 1.53% (e) | 0.04% (e) | 19% | $666 |
| (2.87) | $10.58 | 6.91% | 1.84% (f) | 1.51% (f),(g) | 0.90% | 20% | $713 |
| (0.14) | $12.91 | (10.58%) | 1.38% (f) | 1.29% (f) | 1.13% | 86% | $869 |
| (0.12) | $14.58 | 7.18% | 1.34% (f) | 1.34% (f) | 1.88% | 39% | $538 |
| (0.24) | $13.73 | 13.26% | 1.37% (f) | 1.37% (f) | 0.60% | 34% | $618 |
| (0.70) | $12.35 | 5.23% | 1.42% (f) | 1.42% (f) | 1.25% | 50% | $452 |
| |
| (0.02) | $11.33 | 9.10% | 2.87% (e) | 2.28% (e) | (0.75%) (e) | 19% | $353 |
| (2.77) | $10.41 | 6.01% | 2.59% (f) | 2.25% (f),(g) | 0.38% | 20% | $394 |
| (0.03) | $12.73 | (11.23%) | 2.13% (f) | 2.03% (f) | 0.31% | 86% | $316 |
| (0.02) | $14.37 | 6.48% | 2.11% (f) | 2.11% (f) | 0.67% | 39% | $311 |
| (0.18) | $13.52 | 12.33% | 2.13% (f) | 2.13% (f) | 0.31% | 34% | $220 |
| (0.63) | $12.20 | 4.33% | 2.16% (f) | 2.16% (f) | 0.25% | 50% | $70 |
| |
| (0.07) | $11.38 | 9.38% | 2.38% (e) | 1.78% (e) | (0.26%) (e) | 19% | $295 |
| (2.84) | $10.48 | 6.61% | 2.09% (f) | 1.76% (f),(g) | 0.77% | 20% | $293 |
| (0.10) | $12.81 | (10.78%) | 1.63% (f) | 1.53% (f) | 0.79% | 86% | $301 |
| (0.09) | $14.46 | 6.89% | 1.61% (f) | 1.61% (f) | 1.05% | 39% | $352 |
| (0.22) | $13.62 | 12.92% | 1.63% (f) | 1.63% (f) | 1.01% | 34% | $341 |
| (0.69) | $12.27 | 4.78% | 1.63% (f) | 1.63% (f) | 1.08% | 50% | $175 |
| |
| (0.13) | $11.52 | 9.61% | 1.71% (e) | 1.17% (e) | 0.36% (e) | 19% | $13,298 |
| (2.92) | $10.65 | 7.30% | 1.41% (f) | 1.15% (f) | 1.24% | 20% | $16,471 |
| (0.19) | $12.99 | (10.17%) | 0.95% (f) | 0.94% (f) | 1.76% | 86% | $59,489 |
| (0.17) | $14.66 | 7.63% | 0.97% (f) | 0.97% (f) | 1.73% | 39% | $899,110 |
| (0.26) | $13.80 | 13.66% | 0.98% (f) | 0.98% (f) | 1.51% | 34% | $636,047 |
| (0.74) | $12.38 | 5.44% | 1.01% (f) | 1.01% (f) | 1.76% | 50% | $389,978 |
| |
| — | $11.39 | 5.27% | 1.78% (e) | 1.18% (e) | (0.38%) (e) | 19% | $13,870 |
Columbia Asia Pacific ex-Japan Fund | Semiannual Report 2017
| 17 |
Financial Highlights (continued)
| Year ended (except as noted) | Net asset value,
beginning of
period | Net
investment
income
(loss) | Net
realized
and
unrealized
gain (loss) | Total from
investment
operations | Distributions
from net
investment
income | Distributions
from net
realized
gains |
| Class Z |
| 4/30/2017 (c) | $10.61 | 0.01 | 0.98 | 0.99 | (0.12) | — |
| 10/31/2016 | $12.95 | 0.12 | 0.45 | 0.57 | (2.91) | — |
| 10/31/2015 | $14.62 | 0.21 | (1.71) | (1.50) | (0.17) | — |
| 10/31/2014 | $13.76 | 0.24 | 0.78 | 1.02 | (0.16) | — |
| 10/31/2013 | $12.36 | 0.17 | 1.48 | 1.65 | (0.25) | — |
| 10/31/2012 | $12.51 | 0.17 | 0.40 | 0.57 | (0.16) | (0.56) |
| Notes to Financial Highlights |
| (a) | In addition to the fees and expenses that the Fund bears directly, the Fund indirectly bears a pro rata share of the fees and expenses of any other funds in which it invests. Such indirect expenses are not included in the Fund’s reported expense ratios. |
| (b) | Total net expenses include the impact of certain fee waivers/expense reimbursements made by the Investment Manager and certain of its affiliates, if applicable. |
| (c) | For the six months ended April 30, 2017 (unaudited). |
| (d) | Rounds to zero. |
| (e) | Annualized. |
| (f) | Ratios include line of credit interest expense. For the periods indicated below, if line of credit interest expense had been excluded, expenses would have been lower by: |
| Class | 4/30/2017 | 10/31/2016 | 10/31/2015 | 10/31/2014 | 10/31/2013 | 10/31/2012 |
| Class A | —% | less than .01% | 0.02% | less than .01% | less than .01% | less than .01% |
| Class C | —% | less than .01% | 0.02% | less than .01% | less than .01% | less than .01% |
| Class R | —% | less than .01% | 0.02% | less than .01% | less than .01% | less than .01% |
| Class R5 | —% | less than .01% | less than .01% | less than .01% | less than .01% | less than .01% |
| Class Z | —% | less than .01% | 0.03% | less than .01% | less than .01% | less than .01% |
| (g) | The benefits derived from expense reductions had an impact of less than 0.01%. |
| (h) | Class Y shares commenced operations on March 1, 2017. Per share data and total return reflect activity from that date. |
The accompanying Notes to Financial Statements are an integral part of this statement.
| 18 | Columbia Asia Pacific ex-Japan Fund | Semiannual Report 2017 |
Total
distributions to
shareholders | Net
asset
value,
end of
period | Total
return | Total gross
expense
ratio to
average
net assets(a) | Total net
expense
ratio to
average
net assets(a),(b) | Net investment
income (loss)
ratio to
average
net assets | Portfolio
turnover | Net
assets,
end of
period
(000’s) |
| |
| (0.12) | $11.48 | 9.53% | 1.88% (e) | 1.28% (e) | 0.22% (e) | 19% | $197 |
| (2.91) | $10.61 | 7.21% | 1.57% (f) | 1.26% (f),(g) | 1.19% | 20% | $394 |
| (0.17) | $12.95 | (10.34%) | 1.13% (f) | 1.01% (f) | 1.68% | 86% | $725 |
| (0.16) | $14.62 | 7.50% | 1.11% (f) | 1.11% (f) | 1.71% | 39% | $336 |
| (0.25) | $13.76 | 13.45% | 1.13% (f) | 1.13% (f) | 1.32% | 34% | $284 |
| (0.72) | $12.36 | 5.33% | 1.15% (f) | 1.15% (f) | 1.41% | 50% | $243 |
Columbia Asia Pacific ex-Japan Fund | Semiannual Report 2017
| 19 |
Notes to Financial Statements
April 30, 2017 (Unaudited)
Note 1. Organization
Columbia Asia Pacific ex-Japan Fund (the Fund), a series of Columbia Funds Series Trust II (the Trust), is a diversified fund. The Trust is registered under the Investment Company Act of 1940, as amended (the 1940 Act), as an open-end management investment company organized as a Massachusetts business trust.
Fund shares
The Trust may issue an unlimited number of shares (without par value). Although all share classes generally have identical voting, dividend and liquidation rights, each share class votes separately when required by the Trust’s organizational documents or by law. Different share classes pay different distribution amounts to the extent the expenses of such share classes differ, and distributions in liquidation will be proportional to the net asset value of each share class. Each share class has its own expense and sales charge structure. The Fund offers each of the share classes identified below.
Class A shares are subject to a maximum front-end sales charge of 5.75% based on the initial investment amount. Class A shares purchased without an initial sales charge in accounts aggregating $1 million to $50 million at the time of purchase are subject to a contingent deferred sales charge (CDSC) if the shares are sold within 18 months after purchase, charged as follows: 1.00% CDSC if redeemed within 12 months after purchase, and 0.50% CDSC if redeemed more than 12, but less than 18, months after purchase.
Class C shares are subject to a 1.00% CDSC on shares redeemed within 12 months after purchase.
Effective March 27, 2017, Class I shares of the Fund are no longer offered for sale. Class I shares, when available, were not subject to sales charges or distribution and service (12b-1) fees, and were made available only to the Columbia Family of Funds. On March 27, 2017, Class I shares were redeemed or exchanged for Class Y shares of the Fund in a tax free transaction that had no impact on the fees and expenses paid by shareholders.
Class R shares are not subject to sales charges and are generally available only to certain retirement plans and other investors as described in the Fund’s prospectus.
Class R5 shares are not subject to sales charges and are generally available only to investors purchasing through authorized investment professionals and omnibus retirement plans.
Class Y shares are not subject to sales charges or distribution and service (12b-1) fees, and are available to institutional and certain other investors as described in the Fund’s prospectus. Class Y shares commenced operations on March 1, 2017. On March 27, 2017, Class I shares were redeemed or exchanged for Class Y shares of the Fund in a tax free transaction that had no impact on the fees and expenses paid by shareholders. Class I shares of the Fund are no longer offered for sale.
Class Z shares are not subject to sales charges and are generally available only to eligible investors, which are subject to different investment minimums as described in the Fund’s prospectus.
Note 2. Summary of significant accounting policies
Basis of preparation
The Fund is an investment company that applies the accounting and reporting guidance in the Financial Accounting Standards Board (FASB) Accounting Standards Codification Topic 946, Financial Services - Investment Companies (ASC 946). The financial statements are prepared in accordance with U.S. generally accepted accounting principles (GAAP), which requires management to make certain estimates and assumptions that affect the reported amounts of assets and liabilities, the disclosure of contingent assets and liabilities at the date of the financial statements and the reported amounts of income and expenses during the reporting period. Actual results could differ from those estimates.
The following is a summary of significant accounting policies followed by the Fund in the preparation of its financial statements.
| 20 | Columbia Asia Pacific ex-Japan Fund | Semiannual Report 2017 |
Notes to Financial Statements (continued)
April 30, 2017 (Unaudited)
Security valuation
All equity securities are valued at the close of business of the New York Stock Exchange. Equity securities are valued at the last quoted sales price on the principal exchange or market on which they trade, except for securities traded on the NASDAQ Stock Market, which are valued at the NASDAQ official close price. Unlisted securities or listed securities for which there were no sales during the day are valued at the mean of the latest quoted bid and ask prices on such exchanges or markets.
Foreign equity securities are valued based on the closing price on the foreign exchange in which such securities are primarily traded. If any foreign equity security closing prices are not readily available, the securities are valued at the mean of the latest quoted bid and ask prices on such exchanges or markets. Foreign currency exchange rates are generally determined at 4:00 p.m. Eastern (U.S.) time. Many securities markets and exchanges outside the U.S. close prior to the close of the New York Stock Exchange; therefore, the closing prices for securities in such markets or on such exchanges may not fully reflect events that occur after such close but before the close of the New York Stock Exchange. In those situations, foreign securities will be fair valued pursuant to a policy adopted by the Board of Trustees, including, if available, utilizing a third party pricing service to determine these fair values. The third party pricing service takes into account multiple factors, including, but not limited to, movements in the U.S. securities markets, certain depositary receipts, futures contracts and foreign exchange rates that have occurred subsequent to the close of the foreign exchange or market, to determine a good faith estimate that reasonably reflects the current market conditions as of the close of the New York Stock Exchange. The fair value of a security is likely to be different from the quoted or published price, if available.
Investments in open-end investment companies, including money market funds, are valued at their latest net asset value.
Investments for which market quotations are not readily available, or that have quotations which management believes are not reflective of market value or reliable, are valued at fair value as determined in good faith under procedures approved by and under the general supervision of the Board of Trustees. If a security or class of securities (such as foreign securities) is valued at fair value, such value is likely to be different from the quoted or published price for the security.
The determination of fair value often requires significant judgment. To determine fair value, management may use assumptions including but not limited to future cash flows and estimated risk premiums. Multiple inputs from various sources may be used to determine fair value.
GAAP requires disclosure regarding the inputs and valuation techniques used to measure fair value and any changes in valuation inputs or techniques. In addition, investments shall be disclosed by major category. This information is disclosed following the Fund’s Portfolio of Investments.
Foreign currency transactions and translations
The values of all assets and liabilities denominated in foreign currencies are generally translated into U.S. dollars at exchange rates determined at the close of regular trading on the New York Stock Exchange. Net realized and unrealized gains (losses) on foreign currency transactions and translations include gains (losses) arising from the fluctuation in exchange rates between trade and settlement dates on securities transactions, gains (losses) arising from the disposition of foreign currency and currency gains (losses) between the accrual and payment dates on dividends, interest income and foreign withholding taxes.
For financial statement purposes, the Fund does not distinguish that portion of gains (losses) on investments which is due to changes in foreign exchange rates from that which is due to changes in market prices of the investments. Such fluctuations are included with the net realized and unrealized gains (losses) on investments in the Statement of Operations.
Security transactions
Security transactions are accounted for on the trade date. Cost is determined and gains (losses) are based upon the specific identification method for both financial statement and federal income tax purposes.
Income recognition
Corporate actions and dividend income are generally recorded net of any non-reclaimable tax withholdings, on the ex-dividend date or upon receipt of ex-dividend notification in the case of certain foreign securities.
Columbia Asia Pacific ex-Japan Fund | Semiannual Report 2017
| 21 |
Notes to Financial Statements (continued)
April 30, 2017 (Unaudited)
Awards from class action litigation are recorded as a reduction of cost basis if the Fund still owns the applicable securities on the payment date. If the Fund no longer owns the applicable securities, the proceeds are recorded as realized gains.
Expenses
General expenses of the Trust are allocated to the Fund and other funds of the Trust based upon relative net assets or other expense allocation methodologies determined by the nature of the expense. Expenses directly attributable to the Fund are charged to the Fund. Expenses directly attributable to a specific class of shares are charged to that share class.
Determination of class net asset value
All income, expenses (other than class-specific expenses, which are charged to that share class, as shown in the Statement of Operations) and realized and unrealized gains (losses) are allocated to each class of the Fund on a daily basis, based on the relative net assets of each class, for purposes of determining the net asset value of each class.
Federal income tax status
The Fund intends to qualify each year as a regulated investment company under Subchapter M of the Internal Revenue Code, as amended, and will distribute substantially all of its taxable income (including net short-term capital gains), if any, for its tax year, and as such will not be subject to federal income taxes. In addition, the Fund intends to distribute in each calendar year substantially all of its net investment income, capital gains and certain other amounts, if any, such that the Fund should not be subject to federal excise tax. Therefore, no federal income or excise tax provision is recorded.
Foreign taxes
The Fund may be subject to foreign taxes on income, gains on investments or currency repatriation, a portion of which may be recoverable. The Fund will accrue such taxes and recoveries, as applicable, based upon its current interpretation of tax rules and regulations that exist in the markets in which it invests.
Realized gains in certain countries may be subject to foreign taxes at the Fund level, based on statutory rates. The Fund accrues for such foreign taxes on realized and unrealized gains at the appropriate rate for each jurisdiction, as applicable. The amount, if any, is disclosed as a liability on the Statement of Assets and Liabilities.
Distributions to shareholders
Distributions from net investment income, if any, are declared and paid annually. Net realized capital gains, if any, are distributed along with the income distribution. Income distributions and capital gain distributions are determined in accordance with federal income tax regulations, which may differ from GAAP.
Guarantees and indemnifications
Under the Trust’s organizational documents and, in some cases, by contract, its officers and trustees are indemnified against certain liabilities arising out of the performance of their duties to the Trust or its funds. In addition, certain of the Fund’s contracts with its service providers contain general indemnification clauses. The Fund’s maximum exposure under these arrangements is unknown since the amount of any future claims that may be made against the Fund cannot be determined, and the Fund has no historical basis for predicting the likelihood of any such claims.
Investment company reporting modernization
In October 2016, the U.S. Securities and Exchange Commission adopted new rules and forms, and amendments to certain current rules and forms, to modernize reporting and disclosure of information by registered investment companies. The amendments to Regulation S-X will require standardized, enhanced disclosure about derivatives in investment company financial statements, and will also change the rules governing the form and content of such financial statements. The amendments to Regulation S-X take effect on August 1, 2017. At this time, management is assessing the anticipated impact of these regulatory developments.
| 22 | Columbia Asia Pacific ex-Japan Fund | Semiannual Report 2017 |
Notes to Financial Statements (continued)
April 30, 2017 (Unaudited)
Note 3. Fees and other transactions with affiliates
Management services fees
The Fund entered into a Management Agreement with Columbia Management Investment Advisers, LLC (the Investment Manager), a wholly-owned subsidiary of Ameriprise Financial, Inc. (Ameriprise Financial). Under the Management Agreement, the Investment Manager provides the Fund with investment research and advice, as well as administrative and accounting services. The Investment Manager is responsible for the ultimate oversight of investments made by the Fund. The Fund’s subadviser (see Subadvisory agreement below) has the primary responsibility for the day-to-day portfolio management of the Fund. The management services fee is an annual fee that is equal to a percentage of the Fund’s average daily net assets that declines from 0.88% to 0.62% as the Fund’s net assets increase. The annualized effective management services fee rate for the six months ended April 30, 2017 was 0.88% of the Fund’s average daily net assets.
Subadvisory agreement
The Investment Manager has entered into a Subadvisory Agreement with Threadneedle International Limited (Threadneedle), an affiliate of the Investment Manager and an indirect wholly-owned subsidiary of Ameriprise Financial, to serve as the subadviser to the Fund. The Investment Manager compensates Threadneedle to manage the investment of the Fund’s assets.
Other expenses
Other expenses are for, among other things, miscellaneous expenses of the Fund or the Board of Trustees, including payments to Board Services Corp., a company providing limited administrative services to the Fund and the Board of Trustees. That company’s expenses include boardroom and office expense, employee compensation, employee health and retirement benefits, and certain other expenses.
Compensation of board members
Members of the Board of Trustees, who are not officers or employees of the Investment Manager or Ameriprise Financial, are compensated for their services to the Fund as disclosed in the Statement of Operations. Under a Deferred Compensation Plan (the Plan), these members of the Board of Trustees may elect to defer payment of up to 100% of their compensation. Deferred amounts are treated as though equivalent dollar amounts had been invested in shares of certain funds managed by the Investment Manager. The Fund’s liability for these amounts is adjusted for market value changes and remains in the Fund until distributed in accordance with the Plan. All amounts payable under the Plan constitute a general unsecured obligation of the Fund.
Compensation of Chief Compliance Officer
The Board of Trustees has appointed a Chief Compliance Officer to the Fund in accordance with federal securities regulations. A portion of the Chief Compliance Officer’s total compensation is allocated to the Fund, along with other affiliated funds governed by the Board of Trustees, based on relative net assets. The total amount allocated to all affiliated funds governed by the Board of Trustees will not exceed $40,000 annually.
Transfer agency fees
Under a Transfer and Dividend Disbursing Agent Agreement, Columbia Management Investment Services Corp. (the Transfer Agent), an affiliate of the Investment Manager and a wholly-owned subsidiary of Ameriprise Financial, is responsible for providing transfer agency services to the Fund. The Transfer Agent has contracted with Boston Financial Data Services (BFDS) to serve as sub-transfer agent. The Transfer Agent pays the fees of BFDS for services as sub-transfer agent and BFDS is not entitled to reimbursement for such fees from the Fund (with the exception of out-of-pocket fees).
The Fund pays the Transfer Agent a monthly transfer agency fee based on the number or the average value of accounts, depending on the type of account. In addition, the Fund pays the Transfer Agent a fee for shareholder services based on the number of accounts or on a percentage of the average aggregate value of the Fund’s shares maintained in omnibus accounts up to the lesser of the amount charged by the financial intermediary or a cap established by the Board of Trustees from time to time.
Columbia Asia Pacific ex-Japan Fund | Semiannual Report 2017
| 23 |
Notes to Financial Statements (continued)
April 30, 2017 (Unaudited)
The Transfer Agent also receives compensation from the Fund for various shareholder services and reimbursements for certain out-of-pocket fees. Effective January 1, 2017, total transfer agency fees for Class R5 shares are subject to an annual limitation of not more than 0.075% of the average daily net assets attributable to Class R5 shares. Total transfer agency fees for Class I shares were subject to an annual limitation of not more than 0.025% of the average daily net assets attributable to Class I shares. Prior to January 1, 2017, total transfer agency fees for Class R5 shares were subject to an annual limitation of not more than 0.05% of the average daily net assets attributable to Class R5 shares and Class I shares did not pay transfer agency fees. Total transfer agency fees for Class Y shares are subject to an annual limitation of not more than 0.025% of the average daily net assets attributable to Class Y shares.
For the six months ended April 30, 2017, the Fund’s annualized effective transfer agency fee rates as a percentage of average daily net assets of each class were as follows:
| | Effective rate (%) |
| Class A | 0.22 |
| Class C | 0.22 |
| Class I | 0.006 (a),(b) |
| Class R | 0.22 |
| Class R5 | 0.066 |
| Class Y | 0.011 (a) |
| Class Z | 0.22 |
| (a) | Annualized. |
| (b) | Effective March 27, 2017, Class I shares were redeemed or exchanged for Class Y shares. |
An annual minimum account balance fee of $20 may apply to certain accounts with a value below the applicable share class’s initial minimum investment requirements to reduce the impact of small accounts on transfer agency fees. These minimum account balance fees are remitted to the Fund and recorded as part of expense reductions in the Statement of Operations. For the six months ended April 30, 2017, no minimum account balance fees were charged by the Fund.
Distribution and service fees
The Fund has an agreement with Columbia Management Investment Distributors, Inc. (the Distributor), an affiliate of the Investment Manager and a wholly-owned subsidiary of Ameriprise Financial, for distribution and shareholder services. Under a Plan and Agreement of Distribution, the Fund pays a fee at an annual rate of up to 0.25% of the Fund’s average daily net assets attributable to Class A shares, a fee at an annual rate of up to 0.50% of the Fund’s average daily net assets attributable to Class R shares (of which up to 0.25% may be used for shareholder services) and a fee at an annual rate of up to 1.00% of the Fund’s average daily net assets attributable to Class C shares. For Class C shares, of the 1.00% fee, up to 0.75% is reimbursed for distribution expenses.
The amount of distribution and shareholder services expenses incurred by the Distributor and not yet reimbursed (unreimbursed expense) was approximately $1,000 for Class C shares. This amount is based on the most recent information available as of March 31, 2017, and may be recovered from future payments under the distribution plan or CDSCs. To the extent the unreimbursed expense has been fully recovered, the distribution and/or shareholder services fee is reduced.
Sales charges
Sales charges, including front-end charges and CDSCs, received by the Distributor for distributing Fund shares for the six months ended April 30, 2017, if any, are listed below:
| 24 | Columbia Asia Pacific ex-Japan Fund | Semiannual Report 2017 |
Notes to Financial Statements (continued)
April 30, 2017 (Unaudited)
Expenses waived/reimbursed by the Investment Manager and its affiliates
The Investment Manager and certain of its affiliates have contractually agreed to waive fees and/or reimburse expenses (excluding certain fees and expenses described below) for the period disclosed below, unless sooner terminated at the sole discretion of the Board of Trustees, so that the Fund’s net operating expenses, after giving effect to fees waived/expenses reimbursed and any balance credits and/or overdraft charges from the Fund’s custodian, do not exceed the following annual rates as a percentage of the class’ average daily net assets:
| | March 1, 2017
through
February 28, 2018 | Prior to
March 1, 2017 |
| Class A | 1.590% | 1.50% |
| Class C | 2.340 | 2.25 |
| Class R | 1.840 | 1.75 |
| Class R5 | 1.245 | 1.14 |
| Class Y | 1.195 | – |
| Class Z | 1.340 | 1.25 |
Under the agreement governing these fee waivers and/or expense reimbursement arrangements, the following fees and expenses are excluded from the waiver/reimbursement commitment, and therefore will be paid by the Fund, if applicable: taxes (including foreign transaction taxes), expenses associated with investments in affiliated and non-affiliated pooled investment vehicles (including mutual funds and exchange-traded funds), transaction costs and brokerage commissions, costs related to any securities lending program, dividend and interest expenses associated with securities sold short, inverse floater program fees and expenses, transaction charges and interest on borrowed money, interest, infrequent and/or unusual expenses and any other expenses the exclusion of which is specifically approved by the Board of Trustees. This agreement may be modified or amended only with approval from the Investment Manager, certain of its affiliates and the Fund. In addition to the contractual agreement, the Investment Manager and certain of its affiliates have voluntarily agreed to waive fees and/or reimburse Fund expenses (excluding certain fees and expenses described above) so that Fund level expenses (expenses directly attributable to the Fund and not to a specific share class) are waived proportionately across all share classes, but the Fund’s net operating expenses shall not exceed the contractual annual rates listed in the table above. This arrangement may be revised or discontinued at any time. Any fees waived and/or expenses reimbursed under the expense reimbursement arrangements described above are not recoverable by the Investment Manager or its affiliates in future periods.
Note 4. Federal tax information
The timing and character of income and capital gain distributions are determined in accordance with income tax regulations, which may differ from GAAP because of temporary or permanent book to tax differences.
At April 30, 2017, the approximate cost of investments for federal income tax purposes and the aggregate gross approximate unrealized appreciation and depreciation based on that cost was:
Federal
tax cost ($) | Gross unrealized
appreciation ($) | Gross unrealized
(depreciation) ($) | Net unrealized
appreciation ($) |
| 20,962,000 | 8,053,000 | (401,000) | 7,652,000 |
The following capital loss carryforwards, determined at October 31, 2016, may be available to reduce taxable income arising from future net realized gains on investments, if any, to the extent permitted by the Internal Revenue Code. Capital loss carryforwards with no expiration are required to be utilized prior to any capital losses which carry an expiration date. As a result of this ordering rule, capital loss carryforwards which carry an expiration date may be more likely to expire unused.
| 2017 ($) | 2018 ($) | 2019 ($) | No expiration
short-term ($) | No expiration
long-term ($) | Total ($) |
| — | — | — | 95,247,351 | — | 95,247,351 |
Columbia Asia Pacific ex-Japan Fund | Semiannual Report 2017
| 25 |
Notes to Financial Statements (continued)
April 30, 2017 (Unaudited)
Management of the Fund has concluded that there are no significant uncertain tax positions in the Fund that would require recognition in the financial statements. However, management’s conclusion may be subject to review and adjustment at a later date based on factors including, but not limited to, new tax laws, regulations, and administrative interpretations (including relevant court decisions). Generally, the Fund’s federal tax returns for the prior three fiscal years remain subject to examination by the Internal Revenue Service.
Note 5. Portfolio information
The cost of purchases and proceeds from sales of securities, excluding short-term investments and derivatives, if any, aggregated to $5,408,779 and $11,665,215, respectively, for the six months ended April 30, 2017. The amount of purchase and sale activity impacts the portfolio turnover rate reported in the Financial Highlights.
Note 6. Affiliated money market fund
The Fund invests in Columbia Short-Term Cash Fund, an affiliated money market fund established for the exclusive use by the Fund and other affiliated funds (the Affiliated MMF). The income earned by the Fund from such investments is included as Dividends - affiliated issuers in the Statement of Operations. As an investing fund, the Fund indirectly bears its proportionate share of the expenses of the Affiliated MMF. The Affiliated MMF prices its shares with a floating net asset value. In addition, the Board of Trustees of the Affiliated MMF may impose a fee on redemptions (sometimes referred to as a liquidity fee) or temporarily suspend redemptions (sometimes referred to as imposing a redemption gate) in the event its liquidity falls below regulatory limits.
Note 7. Line of credit
The Fund has access to a revolving credit facility with a syndicate of banks led by Citibank, N.A., HSBC Bank USA, N.A. and JPMorgan Chase Bank, N.A. whereby the Fund may borrow for the temporary funding of shareholder redemptions or for other temporary or emergency purposes. The credit facility agreement, which is a collective agreement between the Fund and certain other funds managed by the Investment Manager, severally and not jointly, permits collective borrowings up to $1 billion. Interest is charged to each participating fund based on its borrowings at a rate equal to the higher of (i) the overnight federal funds rate plus 1.00% or (ii) the one-month LIBOR rate plus 1.00%. Each borrowing under the credit facility matures no later than 60 days after the date of borrowing. The Fund also pays a commitment fee equal to its pro rata share of the amount of the credit facility at a rate of 0.15% per annum. The commitment fee is included in other expenses in the Statement of Operations.
The Fund had no borrowings during the six months ended April 30, 2017.
Note 8. Significant risks
Asia Pacific region risk
Because the Fund concentrates its investments in the Asia Pacific region, the Fund may be particularly susceptible to economic, political or regulatory events affecting companies and countries within the Asia Pacific region. Many of the countries in the Asia Pacific region are considered underdeveloped or developing, including from a political economic and/or social perspective, and may have relatively unstable governments and economies based on limited business, industries and/or natural resources or commodities. Events in any one country within the region may impact other countries in the region or the region as a whole. As a result, events in the region will generally have a greater effect on the Fund than if the Fund were more geographically diversified. This could result in increased volatility in the value of the Fund’s investments and losses for the Fund. Also, securities of some companies in the region can be less liquid than U.S. or other foreign securities, potentially making it difficult for the Fund to sell such securities at a desirable time and place.
Financial sector risk
The Fund may be more susceptible to the particular risks that may affect companies in the financial services sector than if it were invested in a wider variety of companies in unrelated sectors. Companies in the financial services sector are subject to certain risks, including the risk of regulatory change, decreased liquidity in credit markets and unstable interest rates. Such companies may have concentrated portfolios, such as a high level of loans to real estate developers, which makes them
| 26 | Columbia Asia Pacific ex-Japan Fund | Semiannual Report 2017 |
Notes to Financial Statements (continued)
April 30, 2017 (Unaudited)
vulnerable to economic conditions that affect that industry. Performance of such companies may be affected by competitive pressures and exposure to investments or agreements that, under certain circumstances, may lead to losses (e.g., subprime loans). Companies in the financial services sector are subject to extensive governmental regulation that may limit the amount and types of loans and other financial commitments they can make, and interest rates and fees that they may charge. In addition, profitability of such companies is largely dependent upon the availability and the cost of capital.
Foreign securities and emerging market countries risk
Investing in foreign securities may include certain risks and considerations not typically associated with investing in U.S. securities, such as fluctuating currency values and changing local and regional economic, political and social conditions, which may result in greater market volatility. In addition, certain foreign securities may not be as liquid as U.S. securities. Investing in emerging markets may accentuate these risks. These countries are also more likely to experience high levels of inflation, deflation or currency devaluation which could hurt their economies and securities markets. To the extent that the Fund concentrates its investment exposure to any one or a few specific countries, the Fund will be particularly susceptible to the various conditions, events or other factors impacting those countries and may, therefore, have a greater risk than that of a fund which is more geographically diversified.
Shareholder concentration risk
At April 30, 2017, two unaffiliated shareholders of record owned 39.2% of the outstanding shares of the Fund in one or more accounts. The Fund has no knowledge about whether any portion of those shares was owned beneficially. Affiliated shareholders of record owned 50.0% of the outstanding shares of the Fund in one or more accounts. Subscription and redemption activity by concentrated accounts may have a significant effect on the operations of the Fund. In the case of a large redemption, the Fund may be forced to sell investments at inopportune times, including its liquid or more liquid positions, resulting in Fund losses and the Fund holding a higher percentage of less liquid or illiquid securities. Large redemptions could result in decreased economies of scale and increased operating expenses for non-redeeming Fund shareholders.
Technology and technology-related investment risk
The Fund may be more susceptible to the particular risks that may affect companies in the information technology sector, as well as other technology-related sectors (collectively, the technology sectors) than if it were invested in a wider variety of companies in unrelated sectors. Companies in the technology sectors are subject to certain risks, including the risk that new services, equipment or technologies will not be accepted by consumers and businesses or will become rapidly obsolete. Performance of such companies may be affected by factors including obtaining and protecting patents (or the failure to do so) and significant competitive pressures, including aggressive pricing of their products or services, new market entrants, competition for market share and short product cycles due to an accelerated rate of technological developments. Such competitive pressures may lead to limited earnings and/or falling profit margins. As a result, the value of their securities may fall or fail to rise. In addition, many technology sector companies have limited operating histories and prices of these companies’ securities historically have been more volatile than other securities, especially over the short term.
Note 9. Subsequent events
Management has evaluated the events and transactions that have occurred through the date the financial statements were issued and noted no items requiring adjustment of the financial statements or additional disclosure.
Note 10. Information regarding pending and settled legal proceedings
Ameriprise Financial and certain of its affiliates have historically been involved in a number of legal, arbitration and regulatory proceedings, including routine litigation, class actions, and governmental actions, concerning matters arising in connection with the conduct of their business activities. Ameriprise Financial believes that the Funds are not currently the subject of, and that neither Ameriprise Financial nor any of its affiliates are the subject of, any pending legal, arbitration or regulatory proceedings that are likely to have a material adverse effect on the Funds or the ability of Ameriprise Financial or its affiliates to perform under their contracts with the Funds. Ameriprise Financial is required to make quarterly (10-Q), annual (10-K) and, as necessary, 8-K filings with the Securities and Exchange Commission (SEC) on legal and regulatory matters that relate to Ameriprise Financial and its affiliates. Copies of these filings may be obtained by accessing the SEC website at www.sec.gov.
Columbia Asia Pacific ex-Japan Fund | Semiannual Report 2017
| 27 |
Notes to Financial Statements (continued)
April 30, 2017 (Unaudited)
There can be no assurance that these matters, or the adverse publicity associated with them, will not result in increased fund redemptions, reduced sale of fund shares or other adverse consequences to the Funds. Further, although we believe proceedings are not likely to have a material adverse effect on the Funds or the ability of Ameriprise Financial or its affiliates to perform under their contracts with the Funds, these proceedings are subject to uncertainties and, as such, we are unable to estimate the possible loss or range of loss that may result. An adverse outcome in one or more of these proceedings could result in adverse judgments, settlements, fines, penalties or other relief that could have a material adverse effect on the consolidated financial condition or results of operations of Ameriprise Financial.
| 28 | Columbia Asia Pacific ex-Japan Fund | Semiannual Report 2017 |
The Fund mails one shareholder report to each shareholder address. If you would like more than one report, please call shareholder services at 800.345.6611 and additional reports will be sent to you.
Proxy voting policies and procedures
The policy of the Board of Trustees is to vote the proxies of the companies in which the Fund holds investments consistent with the procedures as stated in the Statement of Additional Information (SAI). You may obtain a copy of the SAI without charge by calling 800.345.6611; contacting your financial intermediary; visiting investor.columbiathreadneedleus.com; or searching the website of the Securities and Exchange Commission (SEC) at sec.gov. Information regarding how the Fund voted proxies relating to portfolio securities is filed with the SEC by August 31st for the most recent 12-month period ending June 30th of that year, and is available without charge by visiting investor.columbiathreadneedleus.com, or searching the website of the SEC at sec.gov.
Quarterly schedule of investments
The Fund files a complete schedule of portfolio holdings with the SEC for the first and third quarters of each fiscal year on Form N-Q. The Fund’s Form N-Q is available on the SEC’s website at sec.gov and may be reviewed and copied at the SEC’s Public Reference Room in Washington, D.C. Information on the operation of the Public Reference Room may be obtained by calling 800.SEC.0330. The Fund’s complete schedule of portfolio holdings, as filed on Form N-Q, can also be obtained without charge, upon request, by calling 800.345.6611.
Additional Fund information
For more information about the Fund, please visit investor.columbiathreadneedleus.com or call 800.345.6611. Customer Service Representatives are available to answer your questions Monday through Friday from 8 a.m. to 7 p.m. Eastern time.
Fund investment manager
Columbia Management Investment Advisers, LLC
225 Franklin Street
Boston, MA 02110
Fund distributor
Columbia Management Investment Distributors, Inc.
225 Franklin Street
Boston, MA 02110
Fund transfer agent
Columbia Management Investment Services Corp.
P.O. Box 8081
Boston, MA 02266-8081
Columbia Asia Pacific ex-Japan Fund | Semiannual Report 2017
| 29 |
Columbia Asia Pacific ex-Japan Fund
P.O. Box 8081
Boston, MA 02266-8081
Please read and consider the investment objectives, risks, charges and expenses for any fund carefully before investing. For a prospectus and summary prospectus, which contains this and other important information about the Fund, go to
investor.columbiathreadneedleus.com. The Fund is distributed by Columbia Management Investment Distributors, Inc., member FINRA, and managed by Columbia Management Investment Advisers, LLC.
Columbia Threadneedle Investments (Columbia Threadneedle) is the global brand name of the Columbia and Threadneedle group of companies. All rights reserved. Columbia Management Investment Distributors, Inc., 225 Franklin Street, Boston, MA 02110-2804
© 2017 Columbia Management Investment Advisers, LLC.
investor.columbiathreadneedleus.com

SemiAnnual Report
April 30, 2017
Columbia Global Bond Fund
Not FDIC Insured • No bank guarantee • May lose value
Dear Shareholders,
While emotions have run high following the outcome of the U.S. Presidential election, it remains unclear how the Trump presidency will unfold in terms of policy. We have a sense of the priorities espoused by the President over the past eighteen months, but campaign priorities are not always realized and are often never pursued. What seems certain is that, while some investors have already priced expectations into the market, others have retreated, preferring instead a wait and see approach. The outcome of such behaviors appears to have created conditions ripe for ongoing market volatility.
While volatility in the financial markets can be stressful, volatility itself is not a new phenomenon. Other factors that have been at the root cause of recent volatility include uncertainty following the United Kingdom’s vote to exit the European Union (Brexit), speculation around the Federal Reserve’s decision to increase interest rates, divergent central bank policy and geopolitical unrest. The point is, financial markets have fluctuated for years and may be expected to continue to fluctuate — sometimes wildly. If anything, such volatility seems to be the new normal, perhaps exacerbated by access to information and development of technological tools which have enabled investors to react rapidly to real and perceived change. So what can you do?
Position your portfolio for the reality of market volatility
That there is a historical precedent for market volatility, or even an acceptance that it may persist, offers little comfort. A measured and strategic approach remains the best strategy for investors to stay on track in achieving their investment goals.
Step 1: Review your investment goals
Take this opportunity to review your investment goals and the strategies you are pursuing to achieve those goals in order to remain focused on what’s important to you. It is entirely possible that your goals have changed in response either to your life situation or to changes in the market. Accept what you can’t control — volatility, and focus on what you can — your investment goals and strategies.
Step 2: Reassess your risk tolerance
Sit down with your financial advisor to discuss your investment goals and strategies, as well as any changes to your tolerance for risk. Consider your investment horizon. Increased market volatility and a new investment horizon may impact the strategies that can best help you achieve your investment goals. Remember, achieving your investment goals may require a certain amount of risk. Ultimately, you must maintain vigilance in reassessing your risk tolerance and the strategies you have selected in pursuit of your investment goals, and awareness of how those strategies may react to market volatility.
Step 3: Remain calm and focus on your long-term plan
Remember, investing is about the long game. Short term events are not necessarily evidence of a longer term reality. Investors who attempt to time the market too often end up reacting to a down turn by selling low and then compounding the problem by waiting on the sidelines, ultimately missing the right opportunity to reinvest.
Columbia Global Bond Fund | Semiannual Report 2017
President’s Message (continued)
As long as there is a market, there will be volatility. How you respond to that volatility can make a big difference in the measure of your success as an investor. Talk to your financial advisor about how working with Columbia Threadneedle Investments may help you position your portfolio for the reality of ongoing volatility and, perhaps, even turn such volatility into investment opportunity.
Sincerely,
Christopher O. Petersen
President, Columbia Funds
Investors should consider the investment objectives, risks, charges and expenses of a mutual fund carefully before investing. For a free prospectus and summary prospectus, which contains this and other important information about a fund, visit investor.columbiathreadneedleus.com. The prospectus should be read carefully before investing.
Columbia Funds are distributed by Columbia Management Investment Distributors, Inc., member FINRA, and managed by Columbia Management Investment Advisers, LLC.
© 2017 Columbia Management Investment Advisers, LLC. All rights reserved.
Columbia Global Bond Fund | Semiannual Report 2017
Columbia Global Bond Fund | Semiannual Report 2017
Fund at a Glance
(Unaudited)
Investment objective
Columbia Global Bond Fund (the Fund) seeks to provide shareholders with high total return through income and growth of capital.
Portfolio management
Adrian Hilton
Lead manager
Managed Fund since March 2017
Jim Cielinski
Co-manager
Managed Fund since 2013
Gene Tannuzzo, CFA
Co-manager
Managed Fund since 2014
| Average annual total returns (%) (for the period ended April 30, 2017) |
| | | Inception | 6 Months
cumulative | 1 Year | 5 Years | 10 Years |
| Class A | Excluding sales charges | 03/20/89 | -3.28 | -5.24 | -2.09 | 1.81 |
| | Including sales charges | | -7.88 | -9.81 | -3.04 | 1.32 |
| Class B | Excluding sales charges | 03/20/95 | -3.64 | -5.92 | -2.81 | 1.06 |
| | Including sales charges | | -8.46 | -10.63 | -3.16 | 1.06 |
| Class C | Excluding sales charges | 06/26/00 | -3.69 | -6.00 | -2.84 | 1.06 |
| | Including sales charges | | -4.65 | -6.94 | -2.84 | 1.06 |
| Class K | 03/20/95 | -3.26 | -5.22 | -1.94 | 2.00 |
| Class R * | 03/15/10 | -3.30 | -5.43 | -2.31 | 1.53 |
| Class T | Excluding sales charges | 12/01/06 | -3.28 | -5.24 | -2.09 | 1.81 |
| | Including sales charges | | -5.71 | -7.58 | -2.59 | 1.56 |
| Class Y * | 11/08/12 | -2.93 | -4.74 | -1.69 | 2.02 |
| Class Z * | 09/27/10 | -3.09 | -5.04 | -1.81 | 2.01 |
| Bloomberg Barclays Global Aggregate Index | | -1.63 | -2.10 | 0.37 | 3.34 |
Returns for Class A are shown with and without the maximum initial sales charge of 4.75%. Returns for Class B are shown with and without the applicable contingent deferred sales charge (CDSC) of 5.00% in the first year, declining to 1.00% in the sixth year and eliminated thereafter. The Fund does not accept new investments in Class B shares, except for certain limited transactions. The Fund’s current Class B investors, having held their shares for the requisite time period, are no longer subject to a CDSC upon redemption of their shares. Returns for Class C are shown with and without the 1.00% CDSC for the first year only. The returns for Class T shares are shown with and without the maximum applicable sales charge of 2.50% per transaction. Prior to March 27, 2017, Class T shares were known as Class W shares and were sold without a sales charge. The Fund’s other classes are not subject to sales charges and have limited eligibility. Please see the Fund’s prospectus for details. Performance for different share classes will vary based on differences in sales charges and fees associated with each class. All results shown assume reinvestment of distributions during the period. Returns do not reflect the deduction of taxes that a shareholder may pay on Fund distributions or on the redemption of Fund shares. Performance results reflect the effect of any fee waivers or reimbursements of Fund expenses by Columbia Management Investment Advisers, LLC and/or any of its affiliates. Absent these fee waivers or expense reimbursement arrangements, performance results would have been lower.
The performance information shown represents past performance and is not a guarantee of future results. The investment return and principal value of your investment will fluctuate so that your shares, when redeemed, may be worth more or less than their original cost. Current performance may be lower or higher than the performance information shown. You may obtain performance information current to the most recent month-end by contacting your financial intermediary, visiting investor.columbiathreadneedleus.com or calling 800.345.6611.
| * | The returns shown for periods prior to the share class inception date (including returns for the Life of the Fund, if shown, which are since Fund inception) include the returns of the Fund’s oldest share class. These returns are adjusted to reflect any higher class-related operating expenses of the newer share classes, as applicable. Please visit investor.columbiathreadneedleus.com/investment-products/mutual-funds/appended-performance for more information. |
The Bloomberg Barclays Global Aggregate Index is a broad-based benchmark that measures the global investment-grade fixed-rate debt markets.
Indices are not available for investment, are not professionally managed and do not reflect sales charges, fees, brokerage commissions, taxes or other expenses of investing. Securities in the Fund may not match those in an index.
Columbia Global Bond Fund | Semiannual Report 2017
| 3 |
Fund at a Glance (continued)
(Unaudited)
| Quality breakdown (%) (at April 30, 2017) |
| AAA rating | 23.5 |
| AA rating | 3.3 |
| A rating | 7.0 |
| BBB rating | 42.5 |
| BB rating | 9.9 |
| B rating | 9.6 |
| CCC rating | 2.1 |
| Not rated | 2.1 |
| Total | 100.0 |
Percentages indicated are based upon total fixed income investments (excluding Money Market Funds).
Bond ratings apply to the underlying holdings of the Fund and not the Fund itself and are divided into categories ranging from highest to lowest credit quality, determined by using the middle rating of Moody’s, S&P and Fitch, after dropping the highest and lowest available ratings. When ratings are available from only two rating agencies, the lower rating is used. When a rating is available from only one rating agency, that rating is used. When a bond is not rated by any rating agency, it is designated as “Not rated.” Credit quality ratings assigned by a rating agency are subjective opinions, not statements of fact, and are subject to change, including daily. The ratings assigned by credit rating agencies are but one of the considerations that the Investment Manager and/or Fund’s subadviser incorporates into its credit analysis process, along with such other country-specific factors as the direction and stance of fiscal policy, balance of payment trends and commodity prices, the level and structure of public debt as well as political stability and commitment to strong macroeconomic policies.
| Country breakdown (%) (at April 30, 2017) |
| Argentina | 1.4 |
| Australia | 0.7 |
| Bahamas | 0.0 (a) |
| Bermuda | 1.0 |
| Brazil | 0.7 |
| Canada | 1.0 |
| Colombia | 2.6 |
| Dominican Republic | 1.4 |
| El Salvador | 0.2 |
| France | 0.2 |
| Georgia | 0.7 |
| Germany | 6.9 |
| Guatemala | 0.7 |
| Hungary | 1.6 |
| Indonesia | 0.8 |
| Ireland | 0.2 |
| Italy | 0.2 |
| Japan | 0.4 |
| Kazakhstan | 0.4 |
| Luxembourg | 0.1 |
| Mexico | 2.5 |
| Netherlands | 0.2 |
| Panama | 0.2 |
| Philippines | 0.3 |
| Romania | 0.2 |
| Russian Federation | 17.2 |
| Serbia | 0.4 |
| South Korea | 1.1 |
| Spain | 2.1 |
| Trinidad and Tobago | 0.8 |
| Ukraine | 0.4 |
| United Kingdom | 2.8 |
| United States | 50.2 (b) |
| Virgin Islands | 0.0 (a) |
| Zambia | 0.4 |
| Total | 100.0 |
| (a) | Rounds to zero. |
| (b) | Includes investments in Money Market Funds. |
Country breakdown is based primarily on issuer’s place of organization/incorporation. Percentages indicated are based upon total investments. The Fund’s portfolio composition is subject to change.
The Fund may use place of organization/incorporation or other factors in determining whether an issuer is domestic (U.S.) or foreign for purposes of its investment policies. At April 30, 2017, the Fund invested at least 40% of its net assets in foreign companies in accordance with its principal investment strategy.
| 4 | Columbia Global Bond Fund | Semiannual Report 2017 |
Fund at a Glance (continued)
(Unaudited)
| Market exposure through derivatives investments (% of notional exposure) (at April 30, 2017) (a) |
| | Long | Short | Net |
| Fixed Income Derivative Contracts | 271.5 | (197.1) | 74.4 |
| Foreign Currency Derivative Contracts | 129.2 | (103.6) | 25.6 |
| Total Notional Market Value of Derivative Contracts | 400.7 | (300.7) | 100.0 |
(a) The Fund has market exposure (long and/or short) to the fixed income and foreign currency through its investments in derivatives. The notional exposure of a financial instrument is the nominal or face amount that is used to calculate payments made on that instrument and/or changes in value for the instrument. The notional exposure is a hypothetical underlying quantity upon which payment obligations are computed. Notional exposures provide a gauge for how the Fund may behave given changes in individual markets. For a description of the Fund’s investments in derivatives, see Investments in derivatives following the Portfolio of Investments, and Note 2 to the Notes to Financial Statements.
Columbia Global Bond Fund | Semiannual Report 2017
| 5 |
Understanding Your Fund’s Expenses
(Unaudited)
As an investor, you incur two types of costs. There are transaction costs, which generally include sales charges on purchases and may include redemption fees. There are also ongoing costs, which generally include management fees, distribution and/or service fees, and other fund expenses. The following information is intended to help you understand your ongoing costs (in dollars) of investing in the Fund and to help you compare these costs with the ongoing costs of investing in other mutual funds.
Analyzing your Fund’s expenses
To illustrate these ongoing costs, we have provided examples and calculated the expenses paid by investors in each share class of the Fund during the period. The actual and hypothetical information in the table is based on an initial investment of $1,000 at the beginning of the period indicated and held for the entire period. Expense information is calculated two ways and each method provides you with different information. The amount listed in the “Actual” column is calculated using the Fund’s actual operating expenses and total return for the period. You may use the Actual information, together with the amount invested, to estimate the expenses that you paid over the period. Simply divide your account value by $1,000 (for example, an $8,600 account value divided by $1,000 = 8.6), then multiply the results by the expenses paid during the period under the “Actual” column. The amount listed in the “Hypothetical” column assumes a 5% annual rate of return before expenses (which is not the Fund’s actual return) and then applies the Fund’s actual expense ratio for the period to the hypothetical return. You should not use the hypothetical account values and expenses to estimate either your actual account balance at the end of the period or the expenses you paid during the period. See “Compare with other funds” below for details on how to use the hypothetical data.
Compare with other funds
Since all mutual funds are required to include the same hypothetical calculations about expenses in shareholder reports, you can use this information to compare the ongoing cost of investing in the Fund with other funds. To do so, compare the hypothetical example with the 5% hypothetical examples that appear in the shareholder reports of other funds. As you compare hypothetical examples of other funds, it is important to note that hypothetical examples are meant to highlight the ongoing costs of investing in a fund only and do not reflect any transaction costs, such as sales charges, or redemption or exchange fees. Therefore, the hypothetical calculations are useful in comparing ongoing costs only, and will not help you determine the relative total costs of owning different funds. If transaction costs were included in these calculations, your costs would be higher.
| November 1, 2016 — April 30, 2017 |
| | Account value at the
beginning of the
period ($) | Account value at the
end of the
period ($) | Expenses paid during
the period ($) | Fund’s annualized
expense ratio (%) |
| | Actual | Hypothetical | Actual | Hypothetical | Actual | Hypothetical | Actual |
| Class A | 1,000.00 | 1,000.00 | 967.20 | 1,019.27 | 5.16 | 5.30 | 1.07 |
| Class B | 1,000.00 | 1,000.00 | 963.60 | 1,015.60 | 8.76 | 9.00 | 1.82 |
| Class C | 1,000.00 | 1,000.00 | 963.10 | 1,015.60 | 8.76 | 9.00 | 1.82 |
| Class K | 1,000.00 | 1,000.00 | 967.40 | 1,019.86 | 4.58 | 4.71 | 0.95 |
| Class R | 1,000.00 | 1,000.00 | 967.00 | 1,018.05 | 6.37 | 6.53 | 1.32 |
| Class T (formerly Class W) | 1,000.00 | 1,000.00 | 967.20 | 1,019.27 | 5.16 | 5.30 | 1.07 |
| Class Y | 1,000.00 | 1,000.00 | 970.70 | 1,021.33 | 3.14 | 3.22 | 0.65 |
| Class Z | 1,000.00 | 1,000.00 | 969.10 | 1,020.55 | 3.91 | 4.01 | 0.81 |
Expenses paid during the period are equal to the annualized expense ratio for each class as indicated above, multiplied by the average account value over the period and then multiplied by the number of days in the Fund’s most recent fiscal half year and divided by 365.
Expenses do not include fees and expenses incurred indirectly by the Fund from its investment in underlying funds, including affiliated and non-affiliated pooled investment vehicles, such as mutual funds and exchange-traded funds.
Had Columbia Management Investment Advisers, LLC and/or certain of its affiliates not waived/reimbursed certain fees and expenses, account value at the end of the period would have been reduced.
| 6 | Columbia Global Bond Fund | Semiannual Report 2017 |
Portfolio of Investments
April 30, 2017 (Unaudited)
(Percentages represent value of investments compared to net assets)
| Asset-Backed Securities — Non-Agency 3.8% |
| Issuer | Coupon
Rate | | Principal
Amount ($) | Value ($) |
| Bermuda 0.9% |
| Cronos Containers Program I Ltd.(a) |
| Series 2013-1A Class A |
| 04/18/28 | 3.080% | | 600,000 | 583,262 |
| United States 2.9% |
| Centre Point Funding LLC(a) |
| Series 2012-2A Class 1 |
| 08/20/21 | 2.610% | | 276,578 | 272,081 |
| CLI Funding V LLC(a) |
| Series 2013-1A |
| 03/18/28 | 2.830% | | 345,400 | 336,879 |
| Exeter Automobile Receivables Trust(a) |
| Series 2015-1A Class A |
| 06/17/19 | 1.600% | | 16,236 | 16,234 |
| SBA Tower Trust(a) |
| 04/16/18 | 2.240% | | 900,000 | 893,018 |
| TAL Advantage V LLC(a) |
| Series 2013-1A Class A |
| 02/22/38 | 2.830% | | 306,250 | 297,384 |
| Total | 1,815,596 |
Total Asset-Backed Securities — Non-Agency
(Cost $2,446,949) | 2,398,858 |
|
| Commercial Mortgage-Backed Securities - Agency 3.6% |
| | | | |
| United States 3.6% |
| Government National Mortgage Association |
| Series 2013-13 Class AC |
| 04/16/46 | 1.700% | | 391,458 | 370,935 |
| Series 2013-33 Class AC |
| 05/16/46 | 1.744% | | 2,011,609 | 1,902,759 |
| Total | 2,273,694 |
Total Commercial Mortgage-Backed Securities - Agency
(Cost $2,386,238) | 2,273,694 |
|
| Commercial Mortgage-Backed Securities - Non-Agency 2.8% |
| | | | |
| United States 2.8% |
| American Homes 4 Rent(a) |
| Series 2015-SFR1 Class A |
| 04/17/52 | 3.467% | | 963,729 | 987,795 |
| VSD (a),(b) |
| Series 2017-PLT1 Class A |
| 12/25/43 | 3.600% | | 754,329 | 753,814 |
| Total | 1,741,609 |
Total Commercial Mortgage-Backed Securities - Non-Agency
(Cost $1,718,019) | 1,741,609 |
|
| Corporate Bonds & Notes 29.9% |
| Issuer | Coupon
Rate | | Principal
Amount ($) | Value ($) |
| Australia 0.7% |
| Woodside Finance Ltd.(a) |
| 03/05/25 | 3.650% | | 425,000 | 420,601 |
| Bahamas 0.0% |
| Silversea Cruise Finance Ltd.(a) |
| 02/01/25 | 7.250% | | 7,000 | 7,420 |
| Canada 1.0% |
| Bombardier, Inc.(a) |
| 12/01/21 | 8.750% | | 17,000 | 18,912 |
| HudBay Minerals, Inc.(a) |
| 01/15/23 | 7.250% | | 5,000 | 5,319 |
| 01/15/25 | 7.625% | | 17,000 | 18,211 |
| MDC Partners, Inc.(a) |
| 05/01/24 | 6.500% | | 44,000 | 42,900 |
| MEG Energy Corp.(a) |
| 01/15/25 | 6.500% | | 10,000 | 9,875 |
| Precision Drilling Corp.(a) |
| 12/15/23 | 7.750% | | 2,000 | 2,120 |
| Ritchie Bros. Auctioneers, Inc.(a) |
| 01/15/25 | 5.375% | | 5,000 | 5,163 |
| Teck Resources Ltd.(a) |
| 06/01/24 | 8.500% | | 7,000 | 8,111 |
| Teck Resources Ltd. |
| 07/15/41 | 6.250% | | 54,000 | 57,240 |
| Thomson Reuters Corp. |
| 05/23/43 | 4.500% | | 255,000 | 243,300 |
| Trinidad Drilling Ltd.(a) |
| 02/15/25 | 6.625% | | 5,000 | 5,038 |
| Valeant Pharmaceuticals International, Inc.(a) |
| 07/15/21 | 7.500% | | 20,000 | 16,550 |
| 12/01/21 | 5.625% | | 7,000 | 5,390 |
| 03/15/22 | 6.500% | | 6,000 | 6,143 |
| 05/15/23 | 5.875% | | 71,000 | 52,451 |
| 03/15/24 | 7.000% | | 31,000 | 31,620 |
| 04/15/25 | 6.125% | | 52,000 | 38,389 |
| Videotron Ltd.(a) |
| 06/15/24 | 5.375% | | 39,000 | 41,096 |
| Videotron Ltd./Ltee(a) |
| 04/15/27 | 5.125% | | 6,000 | 6,118 |
| Total | 613,946 |
| Colombia 0.4% |
| Corporación Andina de Fomento |
| 06/15/22 | 4.375% | | 232,000 | 249,662 |
The accompanying Notes to Financial Statements are an integral part of this statement.
Columbia Global Bond Fund | Semiannual Report 2017
| 7 |
Portfolio of Investments (continued)
April 30, 2017 (Unaudited)
| Corporate Bonds & Notes (continued) |
| Issuer | Coupon
Rate | | Principal
Amount ($) | Value ($) |
| France 0.2% |
| SFR Group SA(a) |
| 05/15/22 | 6.000% | | 50,000 | 52,125 |
| 05/01/26 | 7.375% | | 46,000 | 48,357 |
| SPCM SA(a) |
| 09/15/25 | 4.875% | | 11,000 | 11,124 |
| Total | 111,606 |
| Germany 0.0% |
| Unitymedia GmbH(a) |
| 01/15/25 | 6.125% | | 7,000 | 7,473 |
| Ireland 0.2% |
| Allegion PLC |
| 09/15/23 | 5.875% | | 10,000 | 10,675 |
| Ardagh Packaging Finance PLC/Holdings USA, Inc.(a) |
| 05/15/24 | 7.250% | | 48,000 | 52,260 |
| 02/15/25 | 6.000% | | 13,000 | 13,439 |
| Park Aerospace Holdings Ltd.(a) |
| 08/15/22 | 5.250% | | 8,000 | 8,450 |
| 02/15/24 | 5.500% | | 8,000 | 8,460 |
| Total | 93,284 |
| Italy 0.1% |
| Telecom Italia Capital SA |
| 09/30/34 | 6.000% | | 27,000 | 27,608 |
| Wind Acquisition Finance SA(a) |
| 07/15/20 | 4.750% | | 62,000 | 62,930 |
| Total | 90,538 |
| Luxembourg 0.1% |
| ARD Finance SA PIK(a) |
| 09/15/23 | 7.125% | | 14,000 | 14,525 |
| FAGE International SA/USA Dairy Industry, Inc.(a) |
| 08/15/26 | 5.625% | | 17,000 | 17,298 |
| INEOS Group Holdings SA(a) |
| 08/01/24 | 5.625% | | 26,000 | 26,455 |
| Total | 58,278 |
| Mexico 0.5% |
| Cemex SAB de CV(a) |
| 04/16/26 | 7.750% | | 300,000 | 340,890 |
| Netherlands 0.2% |
| Atotech USA, Inc.(a) |
| 02/01/25 | 6.250% | | 21,000 | 21,315 |
| Constellium NV(a) |
| 05/15/24 | 5.750% | | 35,000 | 32,813 |
| 03/01/25 | 6.625% | | 13,000 | 12,805 |
| Corporate Bonds & Notes (continued) |
| Issuer | Coupon
Rate | | Principal
Amount ($) | Value ($) |
| Sensata Technologies BV(a) |
| 10/01/25 | 5.000% | | 20,000 | 20,425 |
| Ziggo Secured Finance BV(a) |
| 01/15/27 | 5.500% | | 44,000 | 45,101 |
| Total | 132,459 |
| Ukraine 0.4% |
| MHP SA(a) |
| 04/02/20 | 8.250% | | 250,000 | 260,312 |
| United Kingdom 1.2% |
| Sky PLC(a) |
| 11/26/22 | 3.125% | | 670,000 | 672,067 |
| Virgin Media Finance PLC(a) |
| 01/15/25 | 5.750% | | 47,000 | 47,940 |
| Virgin Media Secured Finance PLC(a) |
| 01/15/26 | 5.250% | | 14,000 | 14,175 |
| Total | 734,182 |
| United States 24.9% |
| Acadia Healthcare Co., Inc. |
| 07/01/22 | 5.125% | | 15,000 | 15,169 |
| 02/15/23 | 5.625% | | 4,000 | 4,139 |
| 03/01/24 | 6.500% | | 13,000 | 13,780 |
| AES Corp. (The) |
| 05/15/26 | 6.000% | | 11,000 | 11,605 |
| Aircastle Ltd. |
| 03/15/21 | 5.125% | | 24,000 | 25,590 |
| 02/15/22 | 5.500% | | 5,000 | 5,415 |
| 04/01/23 | 5.000% | | 3,000 | 3,203 |
| Allegion US Holding Co., Inc. |
| 10/01/21 | 5.750% | | 27,000 | 28,164 |
| Alliant Holdings Intermediate LP(a) |
| 08/01/23 | 8.250% | | 4,000 | 4,271 |
| Ally Financial, Inc. |
| 05/19/22 | 4.625% | | 14,000 | 14,280 |
| 09/30/24 | 5.125% | | 4,000 | 4,085 |
| 03/30/25 | 4.625% | | 14,000 | 13,816 |
| 11/01/31 | 8.000% | | 9,000 | 10,710 |
| Altice US Finance I Corp.(a) |
| 07/15/23 | 5.375% | | 17,000 | 17,744 |
| 05/15/26 | 5.500% | | 38,000 | 39,282 |
| AMC Entertainment Holdings, Inc.(a) |
| 05/15/27 | 6.125% | | 7,000 | 7,149 |
| AMC Networks, Inc. |
| 04/01/24 | 5.000% | | 23,000 | 23,302 |
| American Builders & Contractors Supply Co., Inc.(a) |
| 04/15/21 | 5.625% | | 17,000 | 17,489 |
The accompanying Notes to Financial Statements are an integral part of this statement.
| 8 | Columbia Global Bond Fund | Semiannual Report 2017 |
Portfolio of Investments (continued)
April 30, 2017 (Unaudited)
| Corporate Bonds & Notes (continued) |
| Issuer | Coupon
Rate | | Principal
Amount ($) | Value ($) |
| American Greetings Corp.(a) |
| 02/15/25 | 7.875% | | 3,000 | 3,203 |
| Amsurg Corp. |
| 07/15/22 | 5.625% | | 10,000 | 10,317 |
| Angus Chemical Co.(a) |
| 02/15/23 | 8.750% | | 24,000 | 24,960 |
| APX Group, Inc. |
| 12/01/20 | 8.750% | | 40,000 | 41,450 |
| 12/01/22 | 7.875% | | 61,000 | 66,490 |
| Aramark Services, Inc. |
| 01/15/24 | 5.125% | | 11,000 | 11,605 |
| Asbury Automotive Group, Inc. |
| 12/15/24 | 6.000% | | 23,000 | 23,747 |
| AT&T, Inc. |
| 06/15/45 | 4.350% | | 300,000 | 266,231 |
| Avis Budget Car Rental LLC/Finance, Inc.(a) |
| 03/15/25 | 5.250% | | 26,000 | 24,505 |
| B&G Foods, Inc. |
| 06/01/21 | 4.625% | | 15,000 | 15,225 |
| 04/01/25 | 5.250% | | 10,000 | 10,238 |
| Beacon Roofing Supply, Inc. |
| 10/01/23 | 6.375% | | 9,000 | 9,698 |
| Berkshire Hathaway Energy Co. |
| 02/01/45 | 4.500% | | 70,000 | 73,827 |
| Berry Plastics Corp. |
| 05/15/22 | 5.500% | | 10,000 | 10,450 |
| 10/15/22 | 6.000% | | 10,000 | 10,625 |
| 07/15/23 | 5.125% | | 42,000 | 43,667 |
| Booz Allen Hamilton, Inc.(a) |
| 05/01/25 | 5.125% | | 2,000 | 2,035 |
| Boyd Gaming Corp. |
| 05/15/23 | 6.875% | | 16,000 | 17,220 |
| 04/01/26 | 6.375% | | 9,000 | 9,698 |
| CalAtlantic Group, Inc. |
| 12/15/21 | 6.250% | | 14,000 | 15,573 |
| 11/15/24 | 5.875% | | 8,000 | 8,600 |
| 06/01/26 | 5.250% | | 2,000 | 2,055 |
| Callon Petroleum Co.(a) |
| 10/01/24 | 6.125% | | 10,000 | 10,475 |
| Camelot Finance SA(a) |
| 10/15/24 | 7.875% | | 12,000 | 12,870 |
| Capsugel SA(a) |
| PIK |
| 05/15/19 | 7.000% | | 4,000 | 4,000 |
| Carlson Travel, Inc.(a) |
| 12/15/23 | 6.750% | | 13,000 | 13,431 |
| Carrizo Oil & Gas, Inc. |
| 04/15/23 | 6.250% | | 83,000 | 83,622 |
| Corporate Bonds & Notes (continued) |
| Issuer | Coupon
Rate | | Principal
Amount ($) | Value ($) |
| CB Richard Ellis Services, Inc. |
| 03/15/25 | 5.250% | | 47,000 | 50,622 |
| CBS Radio, Inc.(a) |
| 11/01/24 | 7.250% | | 4,000 | 4,350 |
| CCO Holdings LLC/Capital Corp.(a) |
| 04/01/24 | 5.875% | | 12,000 | 12,855 |
| 02/15/26 | 5.750% | | 4,000 | 4,249 |
| 05/01/26 | 5.500% | | 3,000 | 3,148 |
| 05/01/27 | 5.125% | | 29,000 | 29,580 |
| 05/01/27 | 5.875% | | 47,000 | 49,996 |
| Cedar Fair LP/Canada’s Wonderland Co./Magnum Management Corp./Millenium Operations LLC(a) |
| 04/15/27 | 5.375% | | 15,000 | 15,505 |
| Centene Corp. |
| 02/15/24 | 6.125% | | 28,000 | 30,170 |
| 01/15/25 | 4.750% | | 47,000 | 47,764 |
| CenturyLink, Inc. |
| 12/01/23 | 6.750% | | 32,000 | 34,280 |
| 04/01/24 | 7.500% | | 19,000 | 20,644 |
| 04/01/25 | 5.625% | | 2,000 | 1,953 |
| Cequel Communications Holdings I LLC/Capital Corp.(a) |
| 09/15/20 | 6.375% | | 24,000 | 24,735 |
| 12/15/21 | 5.125% | | 15,000 | 15,337 |
| 07/15/25 | 7.750% | | 13,000 | 14,495 |
| Change Healthcare Holdings LLC/Finance, Inc.(a) |
| 03/01/25 | 5.750% | | 19,000 | 19,499 |
| Chemours Co. (The) |
| 05/15/23 | 6.625% | | 26,000 | 27,820 |
| 05/15/25 | 7.000% | | 15,000 | 16,481 |
| Chesapeake Energy Corp.(a) |
| 01/15/25 | 8.000% | | 22,000 | 21,752 |
| Chobani LLC/Finance Corp., Inc.(a) |
| 04/15/25 | 7.500% | | 14,000 | 14,437 |
| CHS/Community Health Systems, Inc. |
| 02/01/22 | 6.875% | | 18,000 | 14,895 |
| 03/31/23 | 6.250% | | 34,000 | 34,595 |
| CMS Energy Corp. |
| 02/15/27 | 2.950% | | 225,000 | 214,639 |
| Columbia Pipeline Group, Inc. |
| 06/01/45 | 5.800% | | 80,000 | 93,718 |
| ConAgra Foods, Inc. |
| 09/15/22 | 3.250% | | 345,000 | 348,913 |
| Continental Resources, Inc. |
| 09/15/22 | 5.000% | | 28,000 | 28,245 |
| CrownRock LP/Finance, Inc.(a) |
| 02/15/23 | 7.750% | | 41,000 | 43,870 |
| CSC Holdings LLC |
| 11/15/21 | 6.750% | | 30,000 | 32,850 |
The accompanying Notes to Financial Statements are an integral part of this statement.
Columbia Global Bond Fund | Semiannual Report 2017
| 9 |
Portfolio of Investments (continued)
April 30, 2017 (Unaudited)
| Corporate Bonds & Notes (continued) |
| Issuer | Coupon
Rate | | Principal
Amount ($) | Value ($) |
| CSC Holdings LLC(a) |
| 10/15/25 | 6.625% | | 39,000 | 42,607 |
| 10/15/25 | 10.875% | | 38,000 | 45,647 |
| CSX Corp. |
| 11/01/46 | 3.800% | | 105,000 | 98,731 |
| CyrusOne LP/Finance Corp.(a) |
| 03/15/24 | 5.000% | | 7,000 | 7,193 |
| 03/15/27 | 5.375% | | 7,000 | 7,210 |
| DaVita, Inc. |
| 05/01/25 | 5.000% | | 30,000 | 30,225 |
| Diamondback Energy, Inc.(a) |
| 11/01/24 | 4.750% | | 6,000 | 6,015 |
| 05/31/25 | 5.375% | | 34,000 | 35,190 |
| DISH DBS Corp. |
| 06/01/21 | 6.750% | | 6,000 | 6,525 |
| 07/15/22 | 5.875% | | 24,000 | 25,423 |
| 03/15/23 | 5.000% | | 21,000 | 21,052 |
| 11/15/24 | 5.875% | | 11,000 | 11,550 |
| 07/01/26 | 7.750% | | 53,000 | 62,076 |
| Duke Energy Carolinas LLC |
| 03/15/46 | 3.875% | | 45,000 | 44,452 |
| Dynegy, Inc. |
| 11/01/24 | 7.625% | | 8,000 | 7,320 |
| Eagle Holding Co., II LLC PIK(a),(c) |
| 05/15/22 | 7.625% | | 4,000 | 4,073 |
| Eco Services Operations LLC/Finance Corp.(a) |
| 11/01/22 | 8.500% | | 21,000 | 22,155 |
| Emera US Finance LP |
| 06/15/46 | 4.750% | | 150,000 | 152,316 |
| Endo Dac/Finance LLC/Finco, Inc.(a),(b) |
| 02/01/25 | 6.000% | | 18,000 | 15,201 |
| Energy Transfer Equity LP |
| 06/01/27 | 5.500% | | 68,000 | 73,100 |
| Entegris, Inc.(a) |
| 04/01/22 | 6.000% | | 21,000 | 21,892 |
| Enterprise Products Operating LLC |
| 02/15/45 | 5.100% | | 150,000 | 160,426 |
| Envision Healthcare Corp.(a) |
| 12/01/24 | 6.250% | | 10,000 | 10,525 |
| Equinix, Inc. |
| 01/15/26 | 5.875% | | 29,000 | 31,247 |
| 05/15/27 | 5.375% | | 37,000 | 38,657 |
| ERAC U.S.A. Finance LLC(a) |
| 02/15/45 | 4.500% | | 353,000 | 336,702 |
| Extraction Oil & Gas Holdings LLC/Finance Corp.(a) |
| 07/15/21 | 7.875% | | 50,000 | 52,375 |
| First Data Corp.(a) |
| 12/01/23 | 7.000% | | 64,000 | 68,621 |
| Corporate Bonds & Notes (continued) |
| Issuer | Coupon
Rate | | Principal
Amount ($) | Value ($) |
| Five Corners Funding Trust(a) |
| 11/15/23 | 4.419% | | 295,000 | 317,041 |
| Freeport-McMoRan, Inc. |
| 03/01/22 | 3.550% | | 10,000 | 9,400 |
| 03/15/23 | 3.875% | | 20,000 | 18,550 |
| 11/14/24 | 4.550% | | 34,000 | 31,943 |
| Fresenius Medical Care U.S. Finance II, Inc.(a) |
| 07/31/19 | 5.625% | | 14,000 | 14,945 |
| 01/31/22 | 5.875% | | 11,000 | 12,059 |
| Fresenius Medical Care US Finance II, Inc.(a) |
| 10/15/24 | 4.750% | | 14,000 | 14,315 |
| Frontier Communications Corp. |
| 04/15/22 | 8.750% | | 15,000 | 14,470 |
| 01/15/23 | 7.125% | | 18,000 | 15,750 |
| 01/15/25 | 6.875% | | 40,000 | 33,310 |
| 09/15/25 | 11.000% | | 44,000 | 42,405 |
| FTI Consulting, Inc. |
| 11/15/22 | 6.000% | | 11,000 | 11,495 |
| Gartner, Inc.(a) |
| 04/01/25 | 5.125% | | 24,000 | 24,840 |
| Gates Global LLC/Co.(a) |
| 07/15/22 | 6.000% | | 29,000 | 29,145 |
| Gibraltar Industries, Inc. |
| 02/01/21 | 6.250% | | 9,000 | 9,311 |
| GLP Capital LP/Financing II, Inc. |
| 11/01/20 | 4.875% | | 17,000 | 18,105 |
| 04/15/26 | 5.375% | | 9,000 | 9,495 |
| Grinding Media, Inc./MC Canada, Inc.(a) |
| 12/15/23 | 7.375% | | 12,000 | 12,802 |
| Group 1 Automotive, Inc. |
| 06/01/22 | 5.000% | | 8,000 | 8,100 |
| Group 1 Automotive, Inc.(a) |
| 12/15/23 | 5.250% | | 13,000 | 13,098 |
| Halcon Resources Corp.(a) |
| 02/15/25 | 6.750% | | 19,000 | 18,240 |
| HCA, Inc. |
| 05/01/23 | 5.875% | | 40,000 | 43,528 |
| 04/15/25 | 5.250% | | 66,000 | 70,930 |
| 06/15/26 | 5.250% | | 14,000 | 14,927 |
| 02/15/27 | 4.500% | | 26,000 | 26,247 |
| HD Supply, Inc.(a) |
| 04/15/24 | 5.750% | | 9,000 | 9,563 |
| Hertz Corp. (The)(a) |
| 10/15/24 | 5.500% | | 32,000 | 27,600 |
| Hill-Rom Holdings, Inc.(a) |
| 02/15/25 | 5.000% | | 11,000 | 11,138 |
| Hilton Domestic Operating Co., Inc.(a) |
| 09/01/24 | 4.250% | | 18,000 | 18,135 |
The accompanying Notes to Financial Statements are an integral part of this statement.
| 10 | Columbia Global Bond Fund | Semiannual Report 2017 |
Portfolio of Investments (continued)
April 30, 2017 (Unaudited)
| Corporate Bonds & Notes (continued) |
| Issuer | Coupon
Rate | | Principal
Amount ($) | Value ($) |
| Hilton Grand Vacations Borrower LLC/Inc.(a) |
| 12/01/24 | 6.125% | | 8,000 | 8,520 |
| HUB International Ltd.(a) |
| 10/01/21 | 7.875% | | 53,000 | 55,525 |
| IHS Markit Ltd.(a) |
| 11/01/22 | 5.000% | | 15,000 | 16,031 |
| 02/15/25 | 4.750% | | 29,000 | 30,341 |
| Indiana Michigan Power Co. |
| 03/15/23 | 3.200% | | 1,070,000 | 1,088,042 |
| Infor US, Inc.(a) |
| 08/15/20 | 5.750% | | 6,000 | 6,263 |
| Informatica LLC(a) |
| 07/15/23 | 7.125% | | 12,000 | 11,805 |
| International Game Technology PLC(a) |
| 02/15/22 | 6.250% | | 56,000 | 61,040 |
| Interval Acquisition Corp. |
| 04/15/23 | 5.625% | | 43,000 | 44,290 |
| Isle of Capri Casinos LLC(a) |
| 04/01/25 | 6.000% | | 9,000 | 9,304 |
| iStar, Inc. |
| 04/01/22 | 6.000% | | 13,000 | 13,325 |
| Jack Ohio Finance LLC/1 Corp.(a) |
| 11/15/21 | 6.750% | | 24,000 | 25,080 |
| Jaguar Holding Co. II/Pharmaceutical Product Development LLC(a) |
| 08/01/23 | 6.375% | | 39,000 | 40,657 |
| KFC Holding Co./Pizza Hut Holdings LLC/Taco Bell of America LLC(a) |
| 06/01/26 | 5.250% | | 12,000 | 12,300 |
| Kinder Morgan Energy Partners LP |
| 03/01/43 | 5.000% | | 80,000 | 78,014 |
| Kinetic Concepts, Inc./KCI U.S.A., Inc.(a) |
| 02/15/21 | 7.875% | | 12,000 | 12,795 |
| Koppers, Inc.(a) |
| 02/15/25 | 6.000% | | 6,000 | 6,285 |
| L Brands, Inc. |
| 11/01/35 | 6.875% | | 15,000 | 14,790 |
| Lamb Weston Holdings, Inc.(a) |
| 11/01/24 | 4.625% | | 8,000 | 8,260 |
| 11/01/26 | 4.875% | | 13,000 | 13,406 |
| Laredo Petroleum, Inc. |
| 01/15/22 | 5.625% | | 23,000 | 23,000 |
| 03/15/23 | 6.250% | | 24,000 | 24,240 |
| Lennar Corp. |
| 04/30/24 | 4.500% | | 19,000 | 19,190 |
| Level 3 Communications, Inc. |
| 12/01/22 | 5.750% | | 16,000 | 16,660 |
| Corporate Bonds & Notes (continued) |
| Issuer | Coupon
Rate | | Principal
Amount ($) | Value ($) |
| Level 3 Financing, Inc. |
| 02/01/23 | 5.625% | | 6,000 | 6,225 |
| 05/01/25 | 5.375% | | 28,000 | 29,190 |
| Liberty Mutual Group, Inc.(a) |
| 06/15/23 | 4.250% | | 500,000 | 532,211 |
| Live Nation Entertainment, Inc.(a) |
| 11/01/24 | 4.875% | | 18,000 | 18,135 |
| LTF Merger Sub, Inc.(a) |
| 06/15/23 | 8.500% | | 20,000 | 21,250 |
| Mallinckrodt International Finance SA/CB LLC(a) |
| 10/15/23 | 5.625% | | 4,000 | 3,820 |
| 04/15/25 | 5.500% | | 9,000 | 8,190 |
| Match Group, Inc. |
| 06/01/24 | 6.375% | | 25,000 | 27,219 |
| MEDNAX, Inc.(a) |
| 12/01/23 | 5.250% | | 14,000 | 14,315 |
| Meritage Homes Corp. |
| 04/01/22 | 7.000% | | 32,000 | 36,320 |
| 06/01/25 | 6.000% | | 7,000 | 7,459 |
| MetLife, Inc. |
| 09/15/23 | 4.368% | | 735,000 | 797,706 |
| MGM Growth Properties Operating Partnership LP/Finance Co-Issuer, Inc. |
| 05/01/24 | 5.625% | | 10,000 | 10,788 |
| 09/01/26 | 4.500% | | 10,000 | 9,963 |
| MGM Resorts International |
| 10/01/20 | 6.750% | | 12,000 | 13,350 |
| 12/15/21 | 6.625% | | 50,000 | 56,125 |
| 03/15/23 | 6.000% | | 7,000 | 7,648 |
| Microsemi Corp.(a) |
| 04/15/23 | 9.125% | | 19,000 | 21,850 |
| Molina Healthcare, Inc. |
| 11/15/22 | 5.375% | | 7,000 | 7,315 |
| Molson Coors Brewing Co. |
| 05/01/42 | 5.000% | | 200,000 | 213,207 |
| MPH Acquisition Holdings LLC(a) |
| 06/01/24 | 7.125% | | 31,000 | 33,325 |
| MSCI, Inc.(a) |
| 08/01/26 | 4.750% | | 15,000 | 15,412 |
| Nabors Industries, Inc.(a) |
| 01/15/23 | 5.500% | | 4,000 | 4,045 |
| Navient Corp. |
| 01/25/22 | 7.250% | | 20,000 | 21,300 |
| 06/15/22 | 6.500% | | 5,000 | 5,169 |
| 03/25/24 | 6.125% | | 19,000 | 18,810 |
| 10/25/24 | 5.875% | | 12,000 | 11,670 |
| Netflix, Inc. |
| 02/15/25 | 5.875% | | 59,000 | 64,015 |
The accompanying Notes to Financial Statements are an integral part of this statement.
Columbia Global Bond Fund | Semiannual Report 2017
| 11 |
Portfolio of Investments (continued)
April 30, 2017 (Unaudited)
| Corporate Bonds & Notes (continued) |
| Issuer | Coupon
Rate | | Principal
Amount ($) | Value ($) |
| Netflix, Inc.(a) |
| 11/15/26 | 4.375% | | 46,000 | 45,310 |
| Newfield Exploration Co. |
| 07/01/24 | 5.625% | | 9,000 | 9,512 |
| 01/01/26 | 5.375% | | 15,000 | 15,731 |
| Nielsen Luxembourg SARL(a) |
| 02/01/25 | 5.000% | | 40,000 | 40,050 |
| Novelis Corp.(a) |
| 08/15/24 | 6.250% | | 13,000 | 13,683 |
| 09/30/26 | 5.875% | | 39,000 | 40,072 |
| Novolex (a) |
| 01/15/25 | 6.875% | | 6,000 | 6,180 |
| NPF Corp.(a) |
| 07/15/21 | 9.000% | | 8,000 | 8,460 |
| NRG Energy, Inc. |
| 05/01/24 | 6.250% | | 17,000 | 16,940 |
| 05/15/26 | 7.250% | | 11,000 | 11,248 |
| 01/15/27 | 6.625% | | 30,000 | 29,700 |
| NRG Yield Operating LLC |
| 08/15/24 | 5.375% | | 49,000 | 50,102 |
| NRG Yield Operating LLC(a) |
| 09/15/26 | 5.000% | | 21,000 | 20,580 |
| NuStar Logistics LP |
| 04/28/27 | 5.625% | | 19,000 | 19,594 |
| Oasis Petroleum, Inc. |
| 01/15/23 | 6.875% | | 2,000 | 2,020 |
| OneMain Financial Holdings LLC(a) |
| 12/15/19 | 6.750% | | 28,000 | 29,400 |
| 12/15/21 | 7.250% | | 14,000 | 14,562 |
| Oracle Corp. |
| 07/15/46 | 4.000% | | 285,000 | 278,520 |
| Outfront Media Capital LLC/Corp. |
| 03/15/25 | 5.875% | | 38,000 | 40,185 |
| Owens-Brockway Glass Container, Inc.(a) |
| 08/15/23 | 5.875% | | 14,000 | 14,980 |
| Pacific Gas & Electric Co. |
| 02/15/44 | 4.750% | | 229,000 | 254,200 |
| Parsley Energy LLC/Finance Corp.(a) |
| 06/01/24 | 6.250% | | 12,000 | 12,690 |
| 01/15/25 | 5.375% | | 25,000 | 25,250 |
| 08/15/25 | 5.250% | | 29,000 | 29,217 |
| Pattern Energy Group, Inc.(a) |
| 02/01/24 | 5.875% | | 23,000 | 23,604 |
| PDC Energy, Inc.(a) |
| 09/15/24 | 6.125% | | 37,000 | 37,925 |
| Penn National Gaming, Inc.(a) |
| 01/15/27 | 5.625% | | 5,000 | 5,038 |
| Corporate Bonds & Notes (continued) |
| Issuer | Coupon
Rate | | Principal
Amount ($) | Value ($) |
| Penske Automotive Group, Inc. |
| 12/01/24 | 5.375% | | 17,000 | 17,127 |
| Plains All American Pipeline LP/Finance Corp. |
| 10/15/23 | 3.850% | | 215,000 | 217,021 |
| 02/15/45 | 4.900% | | 460,000 | 442,922 |
| Plastipak Holdings, Inc.(a) |
| 10/01/21 | 6.500% | | 15,000 | 15,412 |
| Platform Specialty Products Corp.(a) |
| 05/01/21 | 10.375% | | 22,000 | 24,502 |
| Post Holdings, Inc.(a) |
| 03/01/25 | 5.500% | | 7,000 | 7,315 |
| 08/15/26 | 5.000% | | 33,000 | 32,835 |
| 03/01/27 | 5.750% | | 20,000 | 20,775 |
| PPL Capital Funding, Inc. |
| 06/01/23 | 3.400% | | 885,000 | 904,215 |
| PQ Corp.(a) |
| 11/15/22 | 6.750% | | 50,000 | 53,875 |
| Prestige Brands, Inc.(a) |
| 03/01/24 | 6.375% | | 26,000 | 27,820 |
| Progress Energy, Inc. |
| 04/01/22 | 3.150% | | 1,325,000 | 1,349,208 |
| Provident Funding Associates LP/Finance Corp.(a) |
| 06/15/21 | 6.750% | | 49,000 | 50,225 |
| PTC, Inc. |
| 05/15/24 | 6.000% | | 26,000 | 27,820 |
| Qualitytech LP/Finance Corp. |
| 08/01/22 | 5.875% | | 34,000 | 35,020 |
| Quicken Loans, Inc.(a) |
| 05/01/25 | 5.750% | | 20,000 | 20,200 |
| Quintiles IMS, Inc.(a) |
| 05/15/23 | 4.875% | | 22,000 | 22,605 |
| 10/15/26 | 5.000% | | 26,000 | 26,520 |
| Radiate HoldCo LLC/Finance, Inc.(a) |
| 02/15/25 | 6.625% | | 8,000 | 7,980 |
| Reynolds Group Issuer, Inc./LLC(a) |
| 07/15/23 | 5.125% | | 24,000 | 25,020 |
| 07/15/24 | 7.000% | | 33,000 | 35,516 |
| Rite Aid Corp.(a) |
| 04/01/23 | 6.125% | | 8,000 | 7,920 |
| Rivers Pittsburgh Borrower LP/Finance Corp.(a) |
| 08/15/21 | 6.125% | | 6,000 | 6,065 |
| RSP Permian, Inc.(a) |
| 01/15/25 | 5.250% | | 44,000 | 44,660 |
| Sally Holdings LLC/Capital, Inc. |
| 12/01/25 | 5.625% | | 7,000 | 7,228 |
| SBA Communications Corp.(a) |
| 09/01/24 | 4.875% | | 81,000 | 81,709 |
The accompanying Notes to Financial Statements are an integral part of this statement.
| 12 | Columbia Global Bond Fund | Semiannual Report 2017 |
Portfolio of Investments (continued)
April 30, 2017 (Unaudited)
| Corporate Bonds & Notes (continued) |
| Issuer | Coupon
Rate | | Principal
Amount ($) | Value ($) |
| Scientific Games International, Inc.(a) |
| 01/01/22 | 7.000% | | 60,000 | 64,237 |
| Scientific Games International, Inc. |
| 12/01/22 | 10.000% | | 25,000 | 27,125 |
| Scotts Miracle-Gro Co. (The) |
| 10/15/23 | 6.000% | | 23,000 | 24,581 |
| Scotts Miracle-Gro Co. (The)(a) |
| 12/15/26 | 5.250% | | 4,000 | 4,110 |
| Scripps Networks Interactive, Inc. |
| 06/15/25 | 3.950% | | 755,000 | 775,299 |
| Sempra Energy |
| 12/01/23 | 4.050% | | 180,000 | 189,956 |
| SESI LLC |
| 12/15/21 | 7.125% | | 5,000 | 5,050 |
| Sirius XM Radio, Inc.(a) |
| 04/15/25 | 5.375% | | 24,000 | 24,600 |
| 07/15/26 | 5.375% | | 6,000 | 6,150 |
| SM Energy Co. |
| 06/01/25 | 5.625% | | 7,000 | 6,685 |
| 09/15/26 | 6.750% | | 52,000 | 52,390 |
| Solera LLC/Finance, Inc.(a) |
| 03/01/24 | 10.500% | | 22,000 | 25,107 |
| Spectrum Brands, Inc. |
| 11/15/22 | 6.625% | | 32,000 | 33,680 |
| 07/15/25 | 5.750% | | 23,000 | 24,654 |
| Springleaf Finance Corp. |
| 12/15/20 | 8.250% | | 4,000 | 4,383 |
| Springs Industries, Inc. |
| 06/01/21 | 6.250% | | 33,000 | 33,990 |
| Sprint Communications, Inc.(a) |
| 03/01/20 | 7.000% | | 38,000 | 41,515 |
| Sprint Corp. |
| 06/15/24 | 7.125% | | 22,000 | 23,994 |
| 02/15/25 | 7.625% | | 100,000 | 111,625 |
| SPX FLOW, Inc.(a) |
| 08/15/24 | 5.625% | | 6,000 | 6,075 |
| 08/15/26 | 5.875% | | 24,000 | 24,300 |
| Sterigenics-Nordion Holdings LLC(a) |
| 05/15/23 | 6.500% | | 25,000 | 25,750 |
| Symantec Corp.(a) |
| 04/15/25 | 5.000% | | 19,000 | 19,641 |
| Tallgrass Energy Partners LP/Finance Corp.(a) |
| 09/15/24 | 5.500% | | 7,000 | 7,035 |
| Targa Resources Partners LP/Finance Corp. |
| 11/15/23 | 4.250% | | 16,000 | 15,840 |
| 03/15/24 | 6.750% | | 22,000 | 23,980 |
| Corporate Bonds & Notes (continued) |
| Issuer | Coupon
Rate | | Principal
Amount ($) | Value ($) |
| Targa Resources Partners LP/Finance Corp.(a) |
| 02/01/27 | 5.375% | | 41,000 | 42,845 |
| Taylor Morrison Communities, Inc./Holdings II(a) |
| 04/15/23 | 5.875% | | 22,000 | 23,430 |
| Team Health Holdings, Inc.(a) |
| 02/01/25 | 6.375% | | 15,000 | 14,512 |
| Teleflex, Inc. |
| 06/01/26 | 4.875% | | 6,000 | 6,090 |
| Tempo Acquisition LLC/Finance Corp.(a),(c) |
| 06/01/25 | 6.750% | | 9,000 | 9,248 |
| Tempur Sealy International, Inc. |
| 10/15/23 | 5.625% | | 15,000 | 15,330 |
| Tenet Healthcare Corp.(a) |
| 01/01/22 | 7.500% | | 10,000 | 10,700 |
| Tenet Healthcare Corp. |
| 04/01/22 | 8.125% | | 3,000 | 3,045 |
| 06/15/23 | 6.750% | | 19,000 | 18,145 |
| Tesoro Logistics LP/Finance Corp. |
| 10/15/19 | 5.500% | | 7,000 | 7,420 |
| 10/15/22 | 6.250% | | 14,000 | 15,015 |
| 05/01/24 | 6.375% | | 17,000 | 18,572 |
| 01/15/25 | 5.250% | | 29,000 | 30,776 |
| T-Mobile USA, Inc. |
| 03/01/25 | 6.375% | | 19,000 | 20,764 |
| 01/15/26 | 6.500% | | 42,000 | 46,567 |
| 04/15/27 | 5.375% | | 15,000 | 16,050 |
| Toll Brothers Finance Corp. |
| 11/15/25 | 4.875% | | 12,000 | 12,330 |
| TransDigm, Inc. |
| 07/15/22 | 6.000% | | 2,000 | 2,060 |
| 05/15/25 | 6.500% | | 21,000 | 21,472 |
| 06/15/26 | 6.375% | | 26,000 | 26,195 |
| TransDigm, Inc.(a) |
| 05/15/25 | 6.500% | | 26,000 | 26,585 |
| United Rentals North America, Inc. |
| 06/15/23 | 6.125% | | 4,000 | 4,180 |
| 09/15/26 | 5.875% | | 37,000 | 39,035 |
| 05/15/27 | 5.500% | | 21,000 | 21,604 |
| Univision Communications, Inc.(a) |
| 02/15/25 | 5.125% | | 29,000 | 28,891 |
| US Concrete, Inc.(a) |
| 06/01/24 | 6.375% | | 11,000 | 11,495 |
| Valvoline, Inc.(a) |
| 07/15/24 | 5.500% | | 3,000 | 3,173 |
| VeriSign, Inc. |
| 05/01/23 | 4.625% | | 14,000 | 14,329 |
| 04/01/25 | 5.250% | | 24,000 | 25,110 |
The accompanying Notes to Financial Statements are an integral part of this statement.
Columbia Global Bond Fund | Semiannual Report 2017
| 13 |
Portfolio of Investments (continued)
April 30, 2017 (Unaudited)
| Corporate Bonds & Notes (continued) |
| Issuer | Coupon
Rate | | Principal
Amount ($) | Value ($) |
| Verizon Communications, Inc. |
| 11/01/42 | 3.850% | | 215,000 | 180,105 |
| Weatherford International Ltd. |
| 06/15/21 | 7.750% | | 16,000 | 17,060 |
| 06/15/23 | 8.250% | | 28,000 | 30,345 |
| 08/01/36 | 6.500% | | 3,000 | 2,835 |
| Weatherford International Ltd.(a) |
| 02/15/24 | 9.875% | | 20,000 | 23,300 |
| WellCare Health Plans, Inc. |
| 04/01/25 | 5.250% | | 25,000 | 26,000 |
| WESCO Distribution, Inc. |
| 06/15/24 | 5.375% | | 9,000 | 9,248 |
| WhiteWave Foods Co. (The) |
| 10/01/22 | 5.375% | | 26,000 | 29,055 |
| Whiting Petroleum Corp. |
| 03/15/21 | 5.750% | | 33,000 | 32,835 |
| 04/01/23 | 6.250% | | 19,000 | 19,000 |
| Williams Companies, Inc. (The) |
| 01/15/23 | 3.700% | | 20,000 | 19,700 |
| 06/24/24 | 4.550% | | 68,000 | 69,615 |
| WPX Energy, Inc. |
| 01/15/22 | 6.000% | | 81,000 | 82,215 |
| Zayo Group LLC/Capital, Inc. |
| 04/01/23 | 6.000% | | 13,000 | 13,861 |
| 05/15/25 | 6.375% | | 23,000 | 24,869 |
| Zayo Group LLC/Capital, Inc.(a) |
| 01/15/27 | 5.750% | | 13,000 | 13,796 |
| Zekelman Industries, Inc.(a) |
| 06/15/23 | 9.875% | | 9,000 | 10,170 |
| Total | 15,697,992 |
| Virgin Islands 0.0% |
| Platform Specialty Products Corp.(a) |
| 02/01/22 | 6.500% | | 12,000 | 12,300 |
Total Corporate Bonds & Notes
(Cost $18,278,761) | 18,830,943 |
|
| Foreign Government Obligations(d),(e) 41.9% |
| | | | |
| Argentina 1.4% |
| Argentine Republic Government International Bond |
| 04/22/21 | 6.875% | | 300,000 | 328,200 |
| 04/22/26 | 7.500% | | 500,000 | 547,750 |
| Total | 875,950 |
| Brazil 0.7% |
| Petrobras Global Finance BV |
| 01/27/21 | 5.375% | | 420,000 | 431,025 |
| Foreign Government Obligations(d),(e) (continued) |
| Issuer | Coupon
Rate | | Principal
Amount ($) | Value ($) |
| Canada 0.0% |
| NOVA Chemicals Corp.(a) |
| 05/01/25 | 5.000% | | 19,000 | 19,451 |
| Colombia 2.1% |
| Empresas Publicas de Medellin ESP(a) |
| 09/10/24 | 7.625% | COP | 3,995,000,000 | 1,344,069 |
| Dominican Republic 1.3% |
| Dominican Republic International Bond(a) |
| 04/20/27 | 8.625% | | 700,000 | 834,911 |
| El Salvador 0.2% |
| El Salvador Government International Bond(a) |
| 01/18/27 | 6.375% | | 125,000 | 111,562 |
| Georgia 0.7% |
| Georgian Railway JSC(a) |
| 07/11/22 | 7.750% | | 400,000 | 439,500 |
| Germany 6.6% |
| Bundesrepublik Deutschland(a),(f) |
| 08/15/26 | 0.000% | EUR | 3,930,000 | 4,184,631 |
| Guatemala 0.7% |
| Guatemala Government Bond(a) |
| 06/06/22 | 5.750% | | 400,000 | 439,924 |
| Hungary 1.6% |
| Hungary Government International Bond |
| 03/25/24 | 5.375% | | 100,000 | 112,250 |
| MFB Hungarian Development Bank(a) |
| 10/21/20 | 6.250% | | 800,000 | 880,152 |
| Total | 992,402 |
| Indonesia 0.7% |
| Indonesia Government International Bond(a) |
| 10/12/35 | 8.500% | | 190,000 | 272,286 |
| 01/17/38 | 7.750% | | 140,000 | 192,574 |
| Total | 464,860 |
| Italy 0.0% |
| Italy Buoni Poliennali Del Tesoro |
| 11/01/26 | 7.250% | EUR | 283 | 444 |
| Japan 0.4% |
| Japan Government 30-Year Bond |
| 09/20/46 | 0.500% | JPY | 30,000,000 | 249,543 |
| Kazakhstan 0.4% |
| KazMunayGas National Co. JSC(a) |
| 07/02/18 | 9.125% | | 250,000 | 268,437 |
The accompanying Notes to Financial Statements are an integral part of this statement.
| 14 | Columbia Global Bond Fund | Semiannual Report 2017 |
Portfolio of Investments (continued)
April 30, 2017 (Unaudited)
| Foreign Government Obligations(d),(e) (continued) |
| Issuer | Coupon
Rate | | Principal
Amount ($) | Value ($) |
| Mexico 1.8% |
| Mexican Bonos |
| 05/31/29 | 8.500% | MXN | 5,200,000 | 302,129 |
| Mexico Government International Bond |
| 09/27/34 | 6.750% | | 270,000 | 339,261 |
| Petroleos Mexicanos |
| 01/24/22 | 4.875% | | 500,000 | 516,250 |
| Total | 1,157,640 |
| Panama 0.2% |
| Ena Norte Trust(a) |
| 04/25/23 | 4.950% | | 116,390 | 119,882 |
| Philippines 0.3% |
| Power Sector Assets & Liabilities Management Corp.(a) |
| 05/27/19 | 7.250% | | 140,000 | 155,064 |
| Romania 0.2% |
| Romanian Government International Bond(a) |
| 01/22/24 | 4.875% | | 100,000 | 108,750 |
| Russian Federation 16.5% |
| Gazprom OAO Via Gaz Capital SA(a) |
| 03/07/22 | 6.510% | | 550,000 | 612,181 |
| 08/16/37 | 7.288% | | 115,000 | 136,519 |
| Russian Federal Bond - OFZ |
| 04/14/21 | 7.600% | RUB | 551,200,000 | 9,662,914 |
| Total | 10,411,614 |
| Serbia 0.3% |
| Serbia International Bond(a) |
| 12/03/18 | 5.875% | | 200,000 | 210,250 |
| South Korea 1.1% |
| Korea Treasury Bond |
| 06/10/26 | 1.875% | KRW | 800,000,000 | 684,881 |
| Spain 2.0% |
| Spain Government Bond(a) |
| 10/31/25 | 2.150% | EUR | 635,000 | 732,289 |
| 10/31/44 | 5.150% | EUR | 346,000 | 537,361 |
| Total | 1,269,650 |
| Trinidad and Tobago 0.8% |
| Petroleum Co. of Trinidad & Tobago Ltd.(a) |
| 08/14/19 | 9.750% | | 450,000 | 478,125 |
| United Kingdom 1.6% |
| United Kingdom Gilt(a) |
| 01/22/45 | 3.500% | GBP | 550,000 | 983,838 |
| Foreign Government Obligations(d),(e) (continued) |
| Issuer | Coupon
Rate | | Principal
Amount ($) | Value ($) |
| Zambia 0.3% |
| Zambia Government International Bond(a) |
| 04/14/24 | 8.500% | | 200,000 | 210,040 |
Total Foreign Government Obligations
(Cost $25,542,812) | 26,446,443 |
|
| Residential Mortgage-Backed Securities - Non-Agency 0.8% |
| | | | |
| United States 0.8% |
| Citigroup Mortgage Loan Trust, Inc.(a),(b) |
| CMO Series 2013-2 Class 1A3 |
| 11/25/37 | 3.139% | | 528,524 | 521,135 |
Total Residential Mortgage-Backed Securities - Non-Agency
(Cost $536,723) | 521,135 |
|
| Senior Loans 0.1% |
| Borrower | Weighted
Average
Coupon | | Principal
Amount ($) | Value ($) |
| United States 0.1% |
| Ancestry.com Operations, Inc.(b),(g) |
| 2nd Lien Term Loan |
| 10/19/24 | 9.270% | | 7,451 | 7,619 |
| Chesapeake Energy Corp.(b),(g) |
| Tranche A Term Loan |
| 08/23/21 | 8.553% | | 22,759 | 24,573 |
| Genesys Telecom(b),(g) |
| Tranche B1 Term Loan |
| 12/01/23 | 5.158% | | 6,983 | 7,034 |
| Kronos, Inc.(b),(g) |
| 2nd Lien Term Loan |
| 11/01/24 | 9.420% | | 11,000 | 11,445 |
| Misys Ltd.(b),(c),(g) |
| 2nd Lien Term Loan |
| 04/28/24 | 0.000% | | 3,322 | 3,388 |
| Serta Simmons Holdings, LLC(b),(g) |
| 2nd Lien Term Loan |
| 11/08/24 | 9.038% | | 29,707 | 30,078 |
| UFC Holdings LLC(b),(g) |
| 2nd Lien Term Loan |
| 08/18/24 | 8.500% | | 2,000 | 2,035 |
| Total | 86,172 |
Total Senior Loans
(Cost $82,855) | 86,172 |
|
The accompanying Notes to Financial Statements are an integral part of this statement.
Columbia Global Bond Fund | Semiannual Report 2017
| 15 |
Portfolio of Investments (continued)
April 30, 2017 (Unaudited)
| U.S. Treasury Obligations 10.0% |
| Issuer | Coupon
Rate | | Principal
Amount ($) | Value ($) |
| United States 10.0% |
| U.S. Treasury |
| 02/28/22 | 1.875% | | 5,040,000 | 5,057,325 |
| 02/15/27 | 2.250% | | 1,250,000 | 1,246,338 |
| Total | 6,303,663 |
Total U.S. Treasury Obligations
(Cost $6,273,517) | 6,303,663 |
| Money Market Funds 3.2% |
| | Shares | Value ($) |
| Columbia Short-Term Cash Fund, 0.869%(h),(i) | 1,996,473 | 1,996,473 |
Total Money Market Funds
(Cost $1,996,440) | 1,996,473 |
Total Investments
(Cost $59,262,314) | 60,598,990 |
| Other Assets & Liabilities, Net | | 2,451,234 |
| Net Assets | $63,050,224 |
At April 30, 2017, securities and/or cash totaling $1,615,095 were pledged as collateral.
Investments in derivatives
| Forward foreign currency exchange contracts open at April 30, 2017 |
| Counterparty | Exchange
date | Currency to
be delivered | Currency to
be received | Unrealized
appreciation ($) | Unrealized
depreciation ($) |
| Barclays | 5/15/2017 | 1,942,000 MXN | 103,032 USD | 121 | — |
| Barclays | 5/15/2017 | 1,400,000 SEK | 159,210 USD | 1,035 | — |
| Barclays | 5/15/2017 | 192,628 USD | 55,000,000 HUF | — | (1,249) |
| Barclays | 5/15/2017 | 423,893 USD | 3,792,000 SEK | 4,534 | — |
| BNP Paribas | 5/15/2017 | 104,848 USD | 150,000 NZD | — | (1,893) |
| BNP Paribas | 5/18/2017 | 4,198,000 AUD | 3,150,431 USD | 7,910 | — |
| BNP Paribas | 5/18/2017 | 3,176,774 USD | 4,198,000 AUD | — | (34,252) |
| Citi | 5/5/2017 | 163,389,000 CZK | 6,491,418 USD | — | (138,646) |
| Citi | 5/5/2017 | 6,491,512 USD | 6,064,000 EUR | 115,045 | — |
| Citi | 5/15/2017 | 230,000 AUD | 173,292 USD | 1,110 | — |
| Citi | 5/15/2017 | 2,600,000 THB | 75,541 USD | 382 | — |
| Citi | 5/15/2017 | 949,438 USD | 1,250,000 AUD | — | (13,665) |
| Citi | 5/15/2017 | 315,778 USD | 2,200,000 DKK | 6,626 | — |
| Citi | 5/15/2017 | 147,936 USD | 650,000 MYR | 1,889 | — |
| Citi | 5/15/2017 | 235,301 USD | 8,100,000 THB | — | (1,150) |
| Credit Suisse | 5/5/2017 | 6,689,000 CZK | 268,742 USD | — | (2,686) |
| Credit Suisse | 5/5/2017 | 9,251,000 EUR | 9,821,047 USD | — | (257,657) |
| Credit Suisse | 5/5/2017 | 9,838,039 USD | 249,928,000 CZK | 303,640 | — |
| Credit Suisse | 5/5/2017 | 9,950,593 USD | 9,251,000 EUR | 128,110 | — |
| Credit Suisse | 5/15/2017 | 420,000 CAD | 309,315 USD | 1,577 | — |
| Credit Suisse | 5/15/2017 | 1,871,835 USD | 2,506,000 CAD | — | (35,667) |
| Credit Suisse | 5/15/2017 | 9,349,079 USD | 8,753,000 EUR | 192,089 | — |
| Credit Suisse | 5/18/2017 | 3,803,000 EUR | 4,151,661 USD | 5,564 | — |
| Credit Suisse | 5/18/2017 | 5,177,000 GBP | 6,422,043 USD | — | (286,379) |
| Credit Suisse | 5/18/2017 | 1,590,372 USD | 1,495,000 EUR | 39,503 | — |
| Credit Suisse | 5/18/2017 | 305,695 USD | 238,000 GBP | 2,708 | — |
| HSBC | 5/15/2017 | 4,100,000,000 COP | 1,419,932 USD | 29,384 | — |
| HSBC | 5/15/2017 | 81,000,000 JPY | 732,445 USD | 5,465 | — |
| HSBC | 5/15/2017 | 558,227,930 RUB | 9,834,965 USD | 59,148 | — |
| HSBC | 5/15/2017 | 11,211,131 USD | 1,242,968,000 JPY | — | (55,422) |
| HSBC | 5/15/2017 | 142,153 USD | 8,000,000 RUB | — | (2,055) |
| HSBC | 5/15/2017 | 203,711 USD | 2,800,000 ZAR | 5,296 | — |
| HSBC | 5/15/2017 | 1,000,000 ZAR | 76,383 USD | 1,738 | — |
| HSBC | 5/18/2017 | 2,232,263 USD | 2,242,000 CHF | 23,460 | — |
| Morgan Stanley | 5/15/2017 | 110,433 USD | 440,000 PLN | 2,973 | — |
| Standard Chartered | 5/15/2017 | 300,000 GBP | 384,716 USD | — | (3,993) |
| Standard Chartered | 5/15/2017 | 2,128,229,000 IDR | 158,942 USD | — | (518) |
| Standard Chartered | 5/15/2017 | 140,000,000 KRW | 124,113 USD | 1,054 | — |
| Standard Chartered | 5/15/2017 | 614,552 USD | 615,000 CHF | 4,086 | — |
The accompanying Notes to Financial Statements are an integral part of this statement.
| 16 | Columbia Global Bond Fund | Semiannual Report 2017 |
Portfolio of Investments (continued)
April 30, 2017 (Unaudited)
Investments in derivatives (continued)
| Forward foreign currency exchange contracts open at April 30, 2017 (continued) |
| Counterparty | Exchange
date | Currency to
be delivered | Currency to
be received | Unrealized
appreciation ($) | Unrealized
depreciation ($) |
| Standard Chartered | 5/15/2017 | 2,533,282 USD | 2,028,000 GBP | 94,392 | — |
| Standard Chartered | 5/15/2017 | 160,162 USD | 2,128,229,000 IDR | — | (702) |
| Standard Chartered | 5/15/2017 | 200,071 USD | 225,000,000 KRW | — | (2,297) |
| Standard Chartered | 5/15/2017 | 116,477 USD | 1,000,000 NOK | 12 | — |
| Standard Chartered | 5/15/2017 | 150,318 USD | 210,000 SGD | 10 | — |
| Standard Chartered | 5/18/2017 | 699,387,000 JPY | 6,340,053 USD | 62,300 | — |
| Total | | | | 1,101,161 | (838,231) |
Futures contracts outstanding at April 30, 2017
| Long futures contracts outstanding |
| Contract description | Number of
contracts | Trading
currency | Notional market
value ($) | Expiration date | Unrealized
appreciation ($) | Unrealized
depreciation ($) |
| 90-Day Euro$ | 258 | USD | 63,542,175 | 12/2017 | 99,405 | — |
| Australian 10-Year Bond | 6 | AUD | 582,802 | 06/2017 | — | (4,204) |
| Australian 3-Year Bond | 134 | AUD | 11,249,926 | 06/2017 | 60,341 | — |
| Euro-Bobl | 98 | EUR | 14,076,236 | 06/2017 | — | (80,941) |
| U.S. Treasury 10-Year Note | 70 | USD | 8,800,313 | 06/2017 | 1,978 | — |
| U.S. Treasury 5-Year Note | 18 | USD | 2,131,313 | 06/2017 | 14,878 | — |
| U.S. Ultra Bond | 1 | USD | 162,938 | 06/2017 | — | (2,907) |
| Total | | | 100,545,703 | | 176,602 | (88,052) |
| Short futures contracts outstanding |
| Contract description | Number of
contracts | Trading
currency | Notional market
value ($) | Expiration date | Unrealized
appreciation ($) | Unrealized
depreciation ($) |
| 90-Day Euro$ | (258) | USD | (63,303,525) | 12/2018 | — | (223,065) |
| Euro-BTP | (103) | EUR | (14,777,581) | 06/2017 | — | (132,563) |
| Euro-Bund | (5) | EUR | (881,135) | 06/2017 | — | (1,359) |
| Euro-Buxl 30-Year | (5) | EUR | (921,330) | 06/2017 | 14,385 | — |
| Long Gilt | (33) | GBP | (5,482,462) | 06/2017 | — | (72,049) |
| Total | | | (85,366,033) | | 14,385 | (429,036) |
| Cleared interest rate swaps contracts outstanding at April 30, 2017 |
| Counterparty | Fund receives | Fund pays | Expiration
date | Notional
currency | Notional
amount | Unrealized
appreciation ($) | Unrealized
depreciation ($) |
| Morgan Stanley | Fixed rate of 2.420% | 6-Month PLN-WIBOR | 12/5/2021 | PLN | 32,000,000 | 41,283 | — |
| Morgan Stanley | 6-Month HUF-BUBOR | Fixed rate of 1.430% | 1/11/2022 | HUF | 1,020,000,000 | — | (40,375) |
| Morgan Stanley | 6-Month HUF-BUBOR | Fixed rate of 1.409% | 1/31/2022 | HUF | 1,000,000,000 | — | (32,603) |
| Morgan Stanley | Fixed rate of 2.104% | 3-Month USD LIBOR-BBA | 3/3/2022 | USD | 6,850,000 | 66,408 | — |
| Morgan Stanley | Fixed rate of 2.132% | 3-Month USD LIBOR-BBA | 3/17/2022 | USD | 6,800,000 | 70,952 | — |
| Morgan Stanley | Fixed rate of 1.513% | 3-Month CAD Canadian Bankers Acceptances (BA) | 6/23/2026 | CAD | 2,300,000 | — | (26,404) |
| Morgan Stanley | Fixed rate of 2.341% | 3-Month USD LIBOR-BBA | 4/27/2027 | USD | 4,300,000 | 23,833 | — |
| Morgan Stanley | Fixed rate of 0.254% | 6-Month JPY LIBOR-BBA | 7/19/2046 | JPY | 258,962,883 | — | (338,569) |
The accompanying Notes to Financial Statements are an integral part of this statement.
Columbia Global Bond Fund | Semiannual Report 2017
| 17 |
Portfolio of Investments (continued)
April 30, 2017 (Unaudited)
| Cleared interest rate swaps contracts outstanding at April 30, 2017 (continued) |
| Counterparty | Fund receives | Fund pays | Expiration
date | Notional
currency | Notional
amount | Unrealized
appreciation ($) | Unrealized
depreciation ($) |
| Morgan Stanley | 3-Month USD LIBOR-BBA | Fixed rate of 2.725% | 3/3/2047 | USD | 1,560,000 | — | (60,604) |
| Morgan Stanley | 3-Month USD LIBOR-BBA | Fixed rate of 2.762% | 3/17/2047 | USD | 1,600,000 | — | (74,297) |
| Total | | | | | | 202,476 | (572,852) |
Credit default swap contracts outstanding at April 30, 2017
| Buy protection |
| Counterparty | Reference
entity | Expiration
date | Pay
fixed
rate
(%) | Notional
currency | Notional
amount | Market
value
($) | Periodic
payments
receivable
(payable)
($) | Premium
paid
($) | Premium
received
($) | Unrealized
appreciation
($) | Unrealized
depreciation
($) |
| Barclays | Markit CDX Emerging Markets Index, Series 27 | 6/20/2022 | 1.000 | USD | 6,500,000 | 291,190 | (7,222) | 340,994 | — | — | (57,026) |
| Barclays | Republic of South Africa | 6/20/2022 | 1.000 | USD | 675,000 | 29,490 | (751) | 35,832 | — | — | (7,093) |
| Total | | | | | | | | 376,826 | — | — | (64,119) |
Cleared credit default swap contracts outstanding at April 30, 2017
| Buy protection |
| Counterparty | Reference
entity | Expiration
date | Pay fixed
rate (%) | Notional
currency | Notional
amount | Unrealized
appreciation ($) | Unrealized
depreciation ($) |
| Morgan Stanley | Markit CDX North America High Yield Index, Series 28 | 6/20/2022 | 5.000 | USD | 5,050,000 | — | (100,326) |
| Morgan Stanley | Markit CDX North America Investment Grade Index, Series 28 | 6/20/2022 | 1.000 | USD | 1,800,000 | — | (5,794) |
| Morgan Stanley | Markit iTraxx Europe Crossover Index, Series 25 | 6/20/2022 | 5.000 | EUR | 5,760,000 | — | (129,522) |
| Total | | | | | | — | (235,642) |
Credit default swap contracts outstanding at April 30, 2017
| Sell protection |
| Counterparty | Reference
entity | Expiration
date | Receive
fixed
rate
(%) | Implied
credit
spread
(%)* | Notional
currency | Notional
amount | Market
value
($) | Periodic
payments
receivable
(payable)
($) | Premium
paid
($) | Premium
received
($) | Unrealized
appreciation
($) | Unrealized
depreciation
($) |
| Goldman Sachs International | Markit CMBX North America Index, Series 6 BBB- | 5/11/2063 | 3.000 | 5.523 | USD | 750,000 | (83,823) | 250 | — | (90,461) | 6,888 | — |
| * | Implied credit spreads, represented in absolute terms, utilized in determining the market value of credit default swap agreements on corporate or sovereign issues as of period end serve as an indicator of the current status of the payment/performance risk and represent the likelihood or risk of default for the credit derivative. The implied credit spread of a particular referenced entity reflects the cost of buying/selling protection and may include upfront payments required to be made to enter into the agreement. Wider credit spreads represent a deterioration of the referenced entity’s credit soundness and a greater likelihood or risk of default or other credit event occurring as defined under the terms of the agreement. |
Notes to Portfolio of Investments
| (a) | Represents privately placed and other securities and instruments exempt from SEC registration (collectively, private placements), such as Section 4(a)(2) and Rule 144A eligible securities, which are often sold only to qualified institutional buyers. The Fund may invest in private placements determined to be liquid as well as those determined to be illiquid. Private placements may be determined to be liquid under guidelines established by the Fund’s Board of Trustees. At April 30, 2017, the value of these securities amounted to $24,466,198 which represents 38.80% of net assets. |
| (b) | Variable rate security. |
| (c) | Represents a security purchased on a when-issued basis. |
The accompanying Notes to Financial Statements are an integral part of this statement.
| 18 | Columbia Global Bond Fund | Semiannual Report 2017 |
Portfolio of Investments (continued)
April 30, 2017 (Unaudited)
Notes to Portfolio of Investments (continued)
| (d) | Principal amounts are denominated in United States Dollars unless otherwise noted. |
| (e) | Principal and interest may not be guaranteed by the government. |
| (f) | Zero coupon bond. |
| (g) | Senior loans have interest rates that float periodically based primarily on the London Interbank Offered Rate (“LIBOR”) and other short-term rates. The interest rate shown reflects the weighted average coupon as of April 30, 2017. The interest rate shown for senior loans purchased on a when-issued or delayed delivery basis, if any, reflects an estimated average coupon. Remaining maturities of senior loans may be less than the stated maturities shown as a result of contractual or optional prepayments by the borrower. Such prepayments cannot be predicted. |
| (h) | The rate shown is the seven-day current annualized yield at April 30, 2017. |
| (i) | As defined in the Investment Company Act of 1940, an affiliated company is one in which the Fund owns 5% or more of the company’s outstanding voting securities, or a company which is under common ownership or control with the Fund. Holdings and transactions in these affiliated companies during the period ended April 30, 2017 are as follows: |
| Issuer | Beginning
shares | Shares
purchased | Shares
sold | Ending
shares | Realized gain
(loss) ($) | Dividends —
affiliated
issuers($) | Value ($) |
| Columbia Short-Term Cash Fund, 0.869% | 1,248,886 | 30,484,034 | (29,736,447) | 1,996,473 | (133) | 12,341 | 1,996,473 |
Abbreviation Legend
| CMO | Collateralized Mortgage Obligation |
| PIK | Payment In Kind |
Currency Legend
| AUD | Australian Dollar |
| CAD | Canada Dollar |
| CHF | Swiss Franc |
| COP | Colombian Peso |
| CZK | Czech Koruna |
| DKK | Danish Krone |
| EUR | Euro |
| GBP | British Pound |
| HUF | Hungarian Forint |
| IDR | Indonesian Rupiah |
| JPY | Japanese Yen |
| KRW | South Korean Won |
| MXN | Mexican Peso |
| MYR | Malaysian Ringgit |
| NOK | Norwegian Krone |
| NZD | New Zealand Dollar |
| PLN | Polish Zloty |
| RUB | Russia Ruble |
| SEK | Swedish Krona |
| SGD | Singapore Dollar |
| THB | Thailand Baht |
| USD | US Dollar |
| ZAR | South African Rand |
Fair value measurements
The Fund categorizes its fair value measurements according to a three-level hierarchy that maximizes the use of observable inputs and minimizes the use of unobservable inputs by prioritizing that the most observable input be used when available. Observable inputs are those that market participants would use in pricing an investment based on market data obtained from sources independent of the reporting entity. Unobservable inputs are those that reflect the Fund’s assumptions about the information market participants would use in
The accompanying Notes to Financial Statements are an integral part of this statement.
Columbia Global Bond Fund | Semiannual Report 2017
| 19 |
Portfolio of Investments (continued)
April 30, 2017 (Unaudited)
Fair value measurements (continued)
pricing an investment. An investment’s level within the fair value hierarchy is based on the lowest level of any input that is deemed significant to the asset’s or liability’s fair value measurement. The input levels are not necessarily an indication of the risk or liquidity associated with investments at that level. For example, certain U.S. government securities are generally high quality and liquid, however, they are reflected as Level 2 because the inputs used to determine fair value may not always be quoted prices in an active market.
Fair value inputs are summarized in the three broad levels listed below:
| • | Level 1 – Valuations based on quoted prices for investments in active markets that the Fund has the ability to access at the measurement date (including NAV for open-end mutual funds). Valuation adjustments are not applied to Level 1 investments. |
| • | Level 2 – Valuations based on other significant observable inputs (including quoted prices for similar securities, interest rates, prepayment speeds, credit risks, etc.). |
| • | Level 3 – Valuations based on significant unobservable inputs (including the Fund’s own assumptions and judgment in determining the fair value of investments). |
Inputs that are used in determining fair value of an investment may include price information, credit data, volatility statistics, and other factors. These inputs can be either observable or unobservable. The availability of observable inputs can vary between investments, and is affected by various factors such as the type of investment, and the volume and level of activity for that investment or similar investments in the marketplace. The inputs will be considered by the Investment Manager, along with any other relevant factors in the calculation of an investment’s fair value. The Fund uses prices and inputs that are current as of the measurement date, which may include periods of market dislocations. During these periods, the availability of prices and inputs may be reduced for many investments. This condition could cause an investment to be reclassified between the various levels within the hierarchy.
Certain investments that have been measured at fair value using the net asset value (NAV) per share (or its equivalent) are not categorized in the fair value hierarchy. The fair value amounts presented in the table are intended to reconcile the fair value hierarchy to the amounts presented in the Portfolio of Investments. The Columbia Short-Term Cash Fund seeks to provide shareholders with maximum current income consistent with liquidity and stability of principal. Columbia Short-Term Cash Fund prices its shares with a floating NAV and no longer seeks to maintain a stable NAV.
Investments falling into the Level 3 category are primarily supported by quoted prices from brokers and dealers participating in the market for those investments. However, these may be classified as Level 3 investments due to lack of market transparency and corroboration to support these quoted prices. Additionally, valuation models may be used as the pricing source for any remaining investments classified as Level 3. These models may rely on one or more significant unobservable inputs and/or significant assumptions by the Investment Manager. Inputs used in valuations may include, but are not limited to, financial statement analysis, capital account balances, discount rates and estimated cash flows, and comparable company data.
Under the direction of the Fund’s Board of Trustees (the Board), the Investment Manager’s Valuation Committee (the Committee) is responsible for overseeing the valuation procedures approved by the Board. The Committee consists of voting and non-voting members from various groups within the Investment Manager’s organization, including operations and accounting, trading and investments, compliance, risk management and legal.
The Committee meets at least monthly to review and approve valuation matters, which may include a description of specific valuation determinations, data regarding pricing information received from approved pricing vendors and brokers and the results of Board-approved valuation control policies and procedures (the Policies). The Policies address, among other things, instances when market quotations are or are not readily available, including recommendations of third party pricing vendors and a determination of appropriate pricing methodologies; events that require specific valuation determinations and assessment of fair value techniques; securities with a potential for stale pricing, including those that are illiquid, restricted, or in default; and the effectiveness of third party pricing vendors, including periodic reviews of vendors. The Committee meets more frequently, as needed, to discuss additional valuation matters, which may include the need to review back-testing results, review time-sensitive information or approve related valuation actions. The Committee reports to the Board, with members of the Committee meeting with the Board at each of its regularly scheduled meetings to discuss valuation matters and actions during the period, similar to those described earlier.
For investments categorized as Level 3, the Committee monitors information similar to that described above, which may include: (i) data specific to the issuer or comparable issuers, (ii) general market or specific sector news and (iii) quoted prices and specific or similar security transactions. The Committee considers this data and any changes from prior periods in order to assess the reasonableness of observable and unobservable inputs, any assumptions or internal models used to value those securities and changes in fair value. This data is also used to corroborate, when available, information received from approved pricing vendors and brokers. Various factors impact the frequency of monitoring this information (which may occur as often as daily). However, the Committee may determine that changes to inputs, assumptions and models are not required as a result of the monitoring procedures performed.
The following table is a summary of the inputs used to value the Fund’s investments at April 30, 2017:
| | Level 1
quoted prices
in active
markets for
identical
assets ($) | Level 2
other
significant
observable
inputs ($) | Level 3
significant
unobservable
inputs ($) | Investments
measured at
net asset
value ($) | Total ($) |
| Investments | | | | | |
| Asset-Backed Securities — Non-Agency | — | 2,398,858 | — | — | 2,398,858 |
| Commercial Mortgage-Backed Securities - Agency | — | 2,273,694 | — | — | 2,273,694 |
| Commercial Mortgage-Backed Securities - Non-Agency | — | 1,741,609 | — | — | 1,741,609 |
| Corporate Bonds & Notes | — | 18,830,943 | — | — | 18,830,943 |
| Foreign Government Obligations | — | 26,446,443 | — | — | 26,446,443 |
| Residential Mortgage-Backed Securities - Non-Agency | — | 521,135 | — | — | 521,135 |
| Senior Loans | — | 86,172 | — | — | 86,172 |
| U.S. Treasury Obligations | 6,303,663 | — | — | — | 6,303,663 |
| Money Market Funds | — | — | — | 1,996,473 | 1,996,473 |
| Total Investments | 6,303,663 | 52,298,854 | — | 1,996,473 | 60,598,990 |
| Derivatives | | | | | |
The accompanying Notes to Financial Statements are an integral part of this statement.
| 20 | Columbia Global Bond Fund | Semiannual Report 2017 |
Portfolio of Investments (continued)
April 30, 2017 (Unaudited)
Fair value measurements (continued)
| | Level 1
quoted prices
in active
markets for
identical
assets ($) | Level 2
other
significant
observable
inputs ($) | Level 3
significant
unobservable
inputs ($) | Investments
measured at
net asset
value ($) | Total ($) |
| Asset | | | | | |
| Forward Foreign Currency Exchange Contracts | — | 1,101,161 | — | — | 1,101,161 |
| Futures Contracts | 190,987 | — | — | — | 190,987 |
| Swap Contracts | — | 209,364 | — | — | 209,364 |
| Liability | | | | | |
| Forward Foreign Currency Exchange Contracts | — | (838,231) | — | — | (838,231) |
| Futures Contracts | (517,088) | — | — | — | (517,088) |
| Swap Contracts | — | (872,613) | — | — | (872,613) |
| Total | 5,977,562 | 51,898,535 | — | 1,996,473 | 59,872,570 |
See the Portfolio of Investments for all investment classifications not indicated in the table.
The Fund’s assets assigned to the Level 2 input category are generally valued using the market approach, in which a security’s value is determined through reference to prices and information from market transactions for similar or identical assets.
Derivative contracts are valued at unrealized appreciation (depreciation).
There were no transfers of financial assets between levels during the period.
The accompanying Notes to Financial Statements are an integral part of this statement.
Columbia Global Bond Fund | Semiannual Report 2017
| 21 |
Statement of Assets and Liabilities
April 30, 2017 (Unaudited)
| Assets | |
| Investments, at cost | |
| Unaffiliated issuers, at cost | $57,265,874 |
| Affiliated issuers, at cost | 1,996,440 |
| Total investments, at cost | 59,262,314 |
| Investments, at value | |
| Unaffiliated issuers, at value | 58,602,517 |
| Affiliated issuers, at value | 1,996,473 |
| Total investments, at value | 60,598,990 |
| Foreign currency (identified cost $1,123) | 1,122 |
| Margin deposits | 1,615,095 |
| Unrealized appreciation on forward foreign currency exchange contracts | 1,101,161 |
| Unrealized appreciation on swap contracts | 6,888 |
| Premiums paid on outstanding swap contracts | 376,826 |
| Receivable for: | |
| Capital shares sold | 9,547 |
| Dividends | 2,052 |
| Interest | 455,122 |
| Foreign tax reclaims | 41,135 |
| Variation margin | 82,588 |
| Expense reimbursement due from Investment Manager | 870 |
| Prepaid expenses | 632 |
| Other assets | 17,803 |
| Total assets | 64,309,831 |
| Liabilities | |
| Due to custodian | 65,678 |
| Unrealized depreciation on forward foreign currency exchange contracts | 838,231 |
| Unrealized depreciation on swap contracts | 64,119 |
| Premiums received on outstanding swap contracts | 90,461 |
| Payable for: | |
| Investments purchased on a delayed delivery basis | 16,289 |
| Capital shares purchased | 55,600 |
| Variation margin | 34,506 |
| Management services fees | 1,122 |
| Distribution and/or service fees | 443 |
| Transfer agent fees | 12,848 |
| Compensation of board members | 40,587 |
| Other expenses | 39,723 |
| Total liabilities | 1,259,607 |
| Net assets applicable to outstanding capital stock | $63,050,224 |
| Represented by | |
| Paid in capital | 68,499,319 |
| Undistributed net investment income | 364,389 |
| Accumulated net realized loss | (6,441,754) |
| Unrealized appreciation (depreciation) on: | |
| Investments - unaffiliated issuers | 1,336,643 |
| Investments - affiliated issuers | 33 |
| Foreign currency translations | 18,014 |
| Forward foreign currency exchange contracts | 262,930 |
| Futures contracts | (326,101) |
| Swap contracts | (663,249) |
| Total - representing net assets applicable to outstanding capital stock | $63,050,224 |
The accompanying Notes to Financial Statements are an integral part of this statement.
| 22 | Columbia Global Bond Fund | Semiannual Report 2017 |
Statement of Assets and Liabilities (continued)
April 30, 2017 (Unaudited)
| Class A | |
| Net assets | $56,193,686 |
| Shares outstanding | 10,011,304 |
| Net asset value per share | $5.61 |
| Maximum offering price per share(a) | $5.89 |
| Class B | |
| Net assets | $141,908 |
| Shares outstanding | 25,533 |
| Net asset value per share | $5.56 |
| Class C | |
| Net assets | $2,007,950 |
| Shares outstanding | 366,263 |
| Net asset value per share | $5.48 |
| Class K | |
| Net assets | $56,618 |
| Shares outstanding | 10,053 |
| Net asset value per share | $5.63 |
| Class R | |
| Net assets | $19,603 |
| Shares outstanding | 3,519 |
| Net asset value per share | $5.57 |
| Class T(b) | |
| Net assets | $36,729 |
| Shares outstanding | 6,545 |
| Net asset value per share | $5.61 |
| Maximum offering price per share(c) | $5.75 |
| Class Y | |
| Net assets | $9,041 |
| Shares outstanding | 1,607 |
| Net asset value per share | $5.63 |
| Class Z | |
| Net assets | $4,584,689 |
| Shares outstanding | 812,053 |
| Net asset value per share | $5.65 |
| (a) | The maximum offering price per share is calculated by dividing the net asset value per share by 1.0 minus the maximum sales charge of 4.75% for Class A. |
| (b) | Effective March 27, 2017, Class W shares were renamed Class T shares. |
| (c) | The maximum offering price per share is calculated by dividing the net asset value per share by 1.0 minus the maximum sales charge of 2.50% for Class T. |
The accompanying Notes to Financial Statements are an integral part of this statement.
Columbia Global Bond Fund | Semiannual Report 2017
| 23 |
Statement of Operations
Six Months Ended April 30, 2017 (Unaudited)
| Net investment income | |
| Income: | |
| Dividends — affiliated issuers | $12,341 |
| Interest | 1,383,463 |
| Total income | 1,395,804 |
| Expenses: | |
| Management services fees | 217,477 |
| Distribution and/or service fees | |
| Class A | 77,141 |
| Class B | 1,024 |
| Class C | 10,459 |
| Class R | 88 |
| Class T(a) | 47 |
| Transfer agent fees | |
| Class A | 79,239 |
| Class B | 263 |
| Class C | 2,688 |
| Class I(b) | 1 |
| Class K | 23 |
| Class R | 44 |
| Class T(a) | 49 |
| Class Y | 1 |
| Class Z | 3,582 |
| Plan administration fees | |
| Class K | 85 |
| Compensation of board members | 6,207 |
| Custodian fees | 14,859 |
| Printing and postage fees | 17,846 |
| Registration fees | 52,405 |
| Audit fees | 23,379 |
| Legal fees | 3,502 |
| Compensation of chief compliance officer | 8 |
| Other | 5,933 |
| Total expenses | 516,350 |
| Fees waived or expenses reimbursed by Investment Manager and its affiliates | (153,639) |
| Total net expenses | 362,711 |
| Net investment income | 1,033,093 |
| Realized and unrealized gain (loss) — net | |
| Net realized gain (loss) on: | |
| Investments — unaffiliated issuers | (790,679) |
| Investments — affiliated issuers | (133) |
| Foreign currency translations | (48,822) |
| Forward foreign currency exchange contracts | (3,225,896) |
| Futures contracts | 1,016,692 |
| Options purchased | (87,500) |
| Swap contracts | (736,170) |
| Net realized loss | (3,872,508) |
| Net change in unrealized appreciation (depreciation) on: | |
| Investments — unaffiliated issuers | 1,332,619 |
| Investments — affiliated issuers | 33 |
| Foreign currency translations | 25,382 |
| Forward foreign currency exchange contracts | (154,929) |
| Futures contracts | (651,746) |
| Options purchased | 87,450 |
| Swap contracts | (431,352) |
| Net change in unrealized appreciation (depreciation) | 207,457 |
| Net realized and unrealized loss | (3,665,051) |
| Net decrease in net assets resulting from operations | $(2,631,958) |
The accompanying Notes to Financial Statements are an integral part of this statement.
| 24 | Columbia Global Bond Fund | Semiannual Report 2017 |
Statement of Operations (continued)
Six Months Ended April 30, 2017 (Unaudited)
| (a) | Effective March 27, 2017, Class W shares were renamed Class T shares. |
| (b) | Effective March 27, 2017, Class I shares were redeemed or exchanged for Class Y shares. |
The accompanying Notes to Financial Statements are an integral part of this statement.
Columbia Global Bond Fund | Semiannual Report 2017
| 25 |
Statement of Changes in Net Assets
| | Six Months Ended
April 30, 2017
(Unaudited) | Year Ended
October 31, 2016 |
| Operations | | |
| Net investment income | $1,033,093 | $2,467,289 |
| Net realized loss | (3,872,508) | (6,278,665) |
| Net change in unrealized appreciation (depreciation) | 207,457 | 5,035,543 |
| Net increase (decrease) in net assets resulting from operations | (2,631,958) | 1,224,167 |
| Decrease in net assets from capital stock activity | (11,789,654) | (19,064,271) |
| Total decrease in net assets | (14,421,612) | (17,840,104) |
| Net assets at beginning of period | 77,471,836 | 95,311,940 |
| Net assets at end of period | $63,050,224 | $77,471,836 |
| Undistributed (excess of distributions over) net investment income | $364,389 | $(668,704) |
The accompanying Notes to Financial Statements are an integral part of this statement.
| 26 | Columbia Global Bond Fund | Semiannual Report 2017 |
Statement of Changes in Net Assets (continued)
| | Six Months Ended | Year Ended |
| | April 30, 2017 (Unaudited) | October 31, 2016 |
| | Shares | Dollars ($) | Shares | Dollars ($) |
| Capital stock activity |
| Class A | | | | |
| Subscriptions (a) | 126,407 | 710,444 | 406,575 | 2,345,644 |
| Redemptions | (2,563,974) | (14,239,432) | (3,553,136) | (20,472,211) |
| Net decrease | (2,437,567) | (13,528,988) | (3,146,561) | (18,126,567) |
| Class B | | | | |
| Subscriptions | 1,467 | 8,144 | — | — |
| Redemptions (a) | (22,243) | (122,707) | (89,541) | (512,025) |
| Net decrease | (20,776) | (114,563) | (89,541) | (512,025) |
| Class C | | | | |
| Subscriptions | 12,901 | 69,731 | 33,806 | 191,737 |
| Redemptions | (64,021) | (348,820) | (127,466) | (723,119) |
| Net decrease | (51,120) | (279,089) | (93,660) | (531,382) |
| Class I(b) | | | | |
| Redemptions | (1,638) | (9,197) | — | — |
| Net decrease | (1,638) | (9,197) | — | — |
| Class K | | | | |
| Subscriptions | 284 | 1,588 | 540 | 3,127 |
| Redemptions | (3,021) | (16,880) | (855) | (4,853) |
| Net decrease | (2,737) | (15,292) | (315) | (1,726) |
| Class R | | | | |
| Subscriptions | 545 | 3,012 | 1,159 | 6,667 |
| Redemptions | (4,570) | (25,161) | (1,583) | (8,845) |
| Net decrease | (4,025) | (22,149) | (424) | (2,178) |
| Class T(c) | | | | |
| Redemptions | (813) | (4,491) | (1,954) | (11,271) |
| Net decrease | (813) | (4,491) | (1,954) | (11,271) |
| Class Z | | | | |
| Subscriptions | 968,542 | 5,401,893 | 97,350 | 576,008 |
| Redemptions | (573,292) | (3,217,778) | (77,622) | (455,130) |
| Net increase | 395,250 | 2,184,115 | 19,728 | 120,878 |
| Total net decrease | (2,123,426) | (11,789,654) | (3,312,727) | (19,064,271) |
| (a) | Includes conversions of Class B shares to Class A shares, if any. |
| (b) | Effective March 27, 2017, Class I shares were redeemed or exchanged for Class Y shares. |
| (c) | Effective March 27, 2017, Class W shares were renamed Class T shares. |
The accompanying Notes to Financial Statements are an integral part of this statement.
Columbia Global Bond Fund | Semiannual Report 2017
| 27 |
The following table is intended to help you understand the Fund’s financial performance. Certain information reflects financial results for a single share of a class held for the periods shown. Per share net investment income (loss) amounts are calculated based on average shares outstanding during the period. Total return assumes reinvestment of all dividends and distributions, if any. Total return does not reflect payment of sales charges, if any. Total return and portfolio turnover are not annualized for periods of less than one year. The portfolio turnover rate is calculated without regard to purchase and sales transactions of short-term instruments and certain derivatives, if any. If such transactions were included, the Fund’s portfolio turnover rate may be higher.
| Year ended (except as noted) | Net asset value,
beginning of
period | Net
investment
income
(loss) | Net
realized
and
unrealized
gain (loss) | Total from
investment
operations | Distributions
from net
investment
income | Distributions
from net
realized
gains |
| Class A |
| 4/30/2017 (c) | $5.80 | 0.08 | (0.27) | (0.19) | — | — |
| 10/31/2016 | $5.72 | 0.17 | (0.09) | 0.08 | — | — |
| 10/31/2015 | $6.31 | 0.21 | (0.61) | (0.40) | (0.04) | (0.15) |
| 10/31/2014 | $6.41 | 0.17 | (0.16) | 0.01 | (0.01) | (0.10) |
| 10/31/2013 | $7.22 | 0.16 | (0.49) | (0.33) | (0.46) | (0.02) |
| 10/31/2012 | $7.35 | 0.18 | 0.17 | 0.35 | (0.45) | (0.03) |
| Class B |
| 4/30/2017 (c) | $5.77 | 0.06 | (0.27) | (0.21) | — | — |
| 10/31/2016 | $5.73 | 0.12 | (0.08) | 0.04 | — | — |
| 10/31/2015 | $6.32 | 0.16 | (0.60) | (0.44) | — | (0.15) |
| 10/31/2014 | $6.46 | 0.12 | (0.16) | (0.04) | (0.00) (f) | (0.10) |
| 10/31/2013 | $7.28 | 0.11 | (0.49) | (0.38) | (0.42) | (0.02) |
| 10/31/2012 | $7.41 | 0.13 | 0.18 | 0.31 | (0.41) | (0.03) |
| Class C |
| 4/30/2017 (c) | $5.69 | 0.06 | (0.27) | (0.21) | — | — |
| 10/31/2016 | $5.65 | 0.12 | (0.08) | 0.04 | — | — |
| 10/31/2015 | $6.24 | 0.16 | (0.60) | (0.44) | — | (0.15) |
| 10/31/2014 | $6.38 | 0.12 | (0.16) | (0.04) | (0.00) (f) | (0.10) |
| 10/31/2013 | $7.19 | 0.11 | (0.48) | (0.37) | (0.42) | (0.02) |
| 10/31/2012 | $7.33 | 0.12 | 0.18 | 0.30 | (0.41) | (0.03) |
| Class K |
| 4/30/2017 (c) | $5.82 | 0.09 | (0.28) | (0.19) | — | — |
| 10/31/2016 | $5.73 | 0.17 | (0.08) | 0.09 | — | — |
| 10/31/2015 | $6.32 | 0.21 | (0.60) | (0.39) | (0.05) | (0.15) |
| 10/31/2014 | $6.42 | 0.18 | (0.17) | 0.01 | (0.01) | (0.10) |
| 10/31/2013 | $7.23 | 0.17 | (0.49) | (0.32) | (0.47) | (0.02) |
| 10/31/2012 | $7.36 | 0.19 | 0.18 | 0.37 | (0.47) | (0.03) |
| Class R |
| 4/30/2017 (c) | $5.76 | 0.08 | (0.27) | (0.19) | — | — |
| 10/31/2016 | $5.69 | 0.15 | (0.08) | 0.07 | — | — |
| 10/31/2015 | $6.28 | 0.20 | (0.61) | (0.41) | (0.03) | (0.15) |
| 10/31/2014 | $6.40 | 0.16 | (0.17) | (0.01) | (0.01) | (0.10) |
| 10/31/2013 | $7.20 | 0.14 | (0.47) | (0.33) | (0.45) | (0.02) |
| 10/31/2012 | $7.34 | 0.16 | 0.17 | 0.33 | (0.44) | (0.03) |
The accompanying Notes to Financial Statements are an integral part of this statement.
| 28 | Columbia Global Bond Fund | Semiannual Report 2017 |
Total
distributions to
shareholders | Net
asset
value,
end of
period | Total
return | Total gross
expense
ratio to
average
net assets(a) | Total net
expense
ratio to
average
net assets(a),(b) | Net investment
income (loss)
ratio to
average
net assets | Portfolio
turnover | Net
assets,
end of
period
(000’s) |
| |
| — | $5.61 | (3.28%) | 1.52% (d) | 1.07% (d) | 3.10% (d) | 47% | $56,194 |
| — | $5.80 | 1.40% | 1.44% | 1.08% (e) | 2.88% | 129% | $72,222 |
| (0.19) | $5.72 | (6.41%) | 1.37% | 1.08% (e) | 3.48% | 90% | $89,178 |
| (0.11) | $6.31 | 0.19% | 1.36% | 1.08% (e) | 2.69% | 62% | $121,977 |
| (0.48) | $6.41 | (4.89%) | 1.33% | 1.10% (e) | 2.37% | 47% | $158,471 |
| (0.48) | $7.22 | 5.20% | 1.33% | 1.15% (e) | 2.51% | 34% | $209,873 |
| |
| — | $5.56 | (3.64%) | 2.27% (d) | 1.82% (d) | 2.34% (d) | 47% | $142 |
| — | $5.77 | 0.70% | 2.17% | 1.83% (e) | 2.08% | 129% | $267 |
| (0.15) | $5.73 | (7.04%) | 2.11% | 1.83% (e) | 2.68% | 90% | $778 |
| (0.10) | $6.32 | (0.63%) | 2.11% | 1.83% (e) | 1.94% | 62% | $1,647 |
| (0.44) | $6.46 | (5.62%) | 2.09% | 1.85% (e) | 1.60% | 47% | $2,881 |
| (0.44) | $7.28 | 4.50% | 2.10% | 1.90% (e) | 1.79% | 34% | $5,819 |
| |
| — | $5.48 | (3.69%) | 2.28% (d) | 1.82% (d) | 2.35% (d) | 47% | $2,008 |
| — | $5.69 | 0.71% | 2.19% | 1.83% (e) | 2.13% | 129% | $2,374 |
| (0.15) | $5.65 | (7.14%) | 2.12% | 1.83% (e) | 2.72% | 90% | $2,889 |
| (0.10) | $6.24 | (0.64%) | 2.11% | 1.83% (e) | 1.94% | 62% | $4,319 |
| (0.44) | $6.38 | (5.53%) | 2.08% | 1.85% (e) | 1.62% | 47% | $6,331 |
| (0.44) | $7.19 | 4.42% | 2.09% | 1.90% (e) | 1.73% | 34% | $8,481 |
| |
| — | $5.63 | (3.26%) | 1.34% (d) | 0.95% (d) | 3.22% (d) | 47% | $57 |
| — | $5.82 | 1.57% | 1.26% | 0.96% | 3.01% | 129% | $74 |
| (0.20) | $5.73 | (6.25%) | 1.18% | 0.96% | 3.53% | 90% | $75 |
| (0.11) | $6.32 | 0.23% | 1.13% | 0.93% | 2.85% | 62% | $121 |
| (0.49) | $6.42 | (4.73%) | 1.08% | 0.95% | 2.48% | 47% | $153 |
| (0.50) | $7.23 | 5.39% | 1.08% | 1.00% | 2.65% | 34% | $410 |
| |
| — | $5.57 | (3.30%) | 1.77% (d) | 1.32% (d) | 2.84% (d) | 47% | $20 |
| — | $5.76 | 1.23% | 1.69% | 1.33% (e) | 2.65% | 129% | $43 |
| (0.18) | $5.69 | (6.70%) | 1.62% | 1.33% (e) | 3.31% | 90% | $45 |
| (0.11) | $6.28 | (0.19%) | 1.62% | 1.34% (e) | 2.46% | 62% | $32 |
| (0.47) | $6.40 | (4.98%) | 1.58% | 1.34% (e) | 2.16% | 47% | $5 |
| (0.47) | $7.20 | 4.83% | 1.60% | 1.40% (e) | 2.26% | 34% | $5 |
Columbia Global Bond Fund | Semiannual Report 2017
| 29 |
Financial Highlights (continued)
| Year ended (except as noted) | Net asset value,
beginning of
period | Net
investment
income
(loss) | Net
realized
and
unrealized
gain (loss) | Total from
investment
operations | Distributions
from net
investment
income | Distributions
from net
realized
gains |
| Class T(g) |
| 4/30/2017 (c) | $5.80 | 0.08 | (0.27) | (0.19) | — | — |
| 10/31/2016 | $5.72 | 0.17 | (0.09) | 0.08 | — | — |
| 10/31/2015 | $6.31 | 0.21 | (0.61) | (0.40) | (0.04) | (0.15) |
| 10/31/2014 | $6.41 | 0.17 | (0.16) | 0.01 | (0.01) | (0.10) |
| 10/31/2013 | $7.22 | 0.17 | (0.51) | (0.34) | (0.45) | (0.02) |
| 10/31/2012 | $7.35 | 0.18 | 0.17 | 0.35 | (0.45) | (0.03) |
| Class Y |
| 4/30/2017 (c) | $5.80 | (0.50) | 0.33 (h) | (0.17) | — | — |
| 10/31/2016 | $5.70 | 0.19 | (0.09) | 0.10 | — | — |
| 10/31/2015 | $6.29 | 0.23 | (0.60) | (0.37) | (0.07) | (0.15) |
| 10/31/2014 | $6.37 | 0.20 | (0.16) | 0.04 | (0.02) | (0.10) |
| 10/31/2013 (i) | $7.20 | 0.18 | (0.50) | (0.32) | (0.49) | (0.02) |
| Class Z |
| 4/30/2017 (c) | $5.83 | 0.09 | (0.27) | (0.18) | — | — |
| 10/31/2016 | $5.73 | 0.18 | (0.08) | 0.10 | — | — |
| 10/31/2015 | $6.32 | 0.22 | (0.60) | (0.38) | (0.06) | (0.15) |
| 10/31/2014 | $6.42 | 0.19 | (0.18) | 0.01 | (0.01) | (0.10) |
| 10/31/2013 | $7.22 | 0.17 | (0.47) | (0.30) | (0.48) | (0.02) |
| 10/31/2012 | $7.36 | 0.19 | 0.17 | 0.36 | (0.47) | (0.03) |
| Notes to Financial Highlights |
| (a) | In addition to the fees and expenses that the Fund bears directly, the Fund indirectly bears a pro rata share of the fees and expenses of any other funds in which it invests. Such indirect expenses are not included in the Fund’s reported expense ratios. |
| (b) | Total net expenses include the impact of certain fee waivers/expense reimbursements made by the Investment Manager and certain of its affiliates, if applicable. |
| (c) | For the six months ended April 30, 2017 (unaudited). |
| (d) | Annualized. |
| (e) | The benefits derived from expense reductions had an impact of less than 0.01%. |
| (f) | Rounds to zero. |
| (g) | Effective March 27, 2017, Class W shares were renamed Class T shares. |
| (h) | Calculation of the net gain (loss) per share (both realized and unrealized) does not correlate to the aggregate realized and unrealized gain (loss) presented in the Statement of Operations due to the timing of subscriptions and redemptions of Fund shares in relation to fluctuations in the market value of the portfolio. |
| (i) | Class Y shares commenced operations on November 8, 2012. Per share data and total return reflect activity from that date. |
The accompanying Notes to Financial Statements are an integral part of this statement.
| 30 | Columbia Global Bond Fund | Semiannual Report 2017 |
Total
distributions to
shareholders | Net
asset
value,
end of
period | Total
return | Total gross
expense
ratio to
average
net assets(a) | Total net
expense
ratio to
average
net assets(a),(b) | Net investment
income (loss)
ratio to
average
net assets | Portfolio
turnover | Net
assets,
end of
period
(000’s) |
| |
| — | $5.61 | (3.28%) | 1.52% (d) | 1.07% (d) | 3.10% (d) | 47% | $37 |
| — | $5.80 | 1.40% | 1.43% | 1.08% (e) | 2.88% | 129% | $43 |
| (0.19) | $5.72 | (6.40%) | 1.37% | 1.08% (e) | 3.49% | 90% | $53 |
| (0.11) | $6.31 | 0.19% | 1.36% | 1.08% (e) | 2.69% | 62% | $90 |
| (0.47) | $6.41 | (5.04%) | 1.36% | 1.13% (e) | 2.38% | 47% | $124 |
| (0.48) | $7.22 | 5.18% | 1.34% | 1.16% (e) | 2.56% | 34% | $31,187 |
| |
| — | $5.63 | (2.93%) | 1.04% (d) | 0.65% (d) | (18.44%) (d) | 47% | $9 |
| — | $5.80 | 1.75% | 0.96% | 0.66% | 3.32% | 129% | $9 |
| (0.22) | $5.70 | (5.99%) | 0.89% | 0.66% | 3.92% | 90% | $9 |
| (0.12) | $6.29 | 0.63% | 0.83% | 0.64% | 3.15% | 62% | $10 |
| (0.51) | $6.37 | (4.75%) | 0.79% (d) | 0.64% (d) | 2.86% (d) | 47% | $2 |
| |
| — | $5.65 | (3.09%) | 1.31% (d) | 0.81% (d) | 3.45% (d) | 47% | $4,585 |
| — | $5.83 | 1.75% | 1.19% | 0.83% (e) | 3.15% | 129% | $2,430 |
| (0.21) | $5.73 | (6.15%) | 1.12% | 0.83% (e) | 3.68% | 90% | $2,275 |
| (0.11) | $6.32 | 0.26% | 1.11% | 0.83% (e) | 2.94% | 62% | $3,469 |
| (0.50) | $6.42 | (4.50%) | 1.08% | 0.84% (e) | 2.65% | 47% | $3,264 |
| (0.50) | $7.22 | 5.34% | 1.08% | 0.89% (e) | 2.70% | 34% | $2,123 |
Columbia Global Bond Fund | Semiannual Report 2017
| 31 |
Notes to Financial Statements
April 30, 2017 (Unaudited)
Note 1. Organization
Columbia Global Bond Fund (the Fund), a series of Columbia Funds Series Trust II (the Trust), is a non-diversified fund. The Trust is registered under the Investment Company Act of 1940, as amended (the 1940 Act), as an open-end management investment company organized as a Massachusetts business trust.
Fund shares
The Trust may issue an unlimited number of shares (without par value). Although all share classes generally have identical voting, dividend and liquidation rights, each share class votes separately when required by the Trust’s organizational documents or by law. Different share classes pay different distribution amounts to the extent the expenses of such share classes differ, and distributions in liquidation will be proportional to the net asset value of each share class. Each share class has its own expense and sales charge structure. The Fund offers each of the share classes identified below.
Class A shares are subject to a maximum front-end sales charge of 4.75% based on the initial investment amount. Class A shares purchased without an initial sales charge in accounts aggregating $1 million to $50 million at the time of purchase are subject to a contingent deferred sales charge (CDSC) if the shares are sold within 18 months after purchase, charged as follows: 1.00% CDSC if redeemed within 12 months after purchase, and 0.50% CDSC if redeemed more than 12, but less than 18, months after purchase.
The Fund no longer accepts investments by new or existing investors in the Fund’s Class B shares, except in connection with the reinvestment of any dividend and/or capital gain distributions in Class B shares of the Fund and exchanges by existing Class B shareholders of certain other funds within the Columbia Family of Funds. Class B shares are typically subject to a maximum CDSC of 5.00% based upon the holding period after purchase. However, the Fund’s current Class B investors, having held their shares for the requisite time period, are no longer subject to a CDSC upon redemption of their shares. Effective on or about July 17, 2017, Class B shares will automatically convert to Class A shares and the Fund will no longer accept investments by new or existing investors in Class B shares.
Class C shares are subject to a 1.00% CDSC on shares redeemed within 12 months after purchase.
Effective March 27, 2017, Class I shares of the Fund are no longer offered for sale. Class I shares, when available, were not subject to sales charges or distribution and service (12b-1) fees, and were made available only to the Columbia Family of Funds. On March 27, 2017, Class I shares were redeemed or exchanged for Class Y shares of the Fund in a tax free transaction that had no impact on the fees and expenses paid by shareholders.
Class K shares are not subject to sales charges; however, this share class is closed to new investors.
Class R shares are not subject to sales charges and are generally available only to certain retirement plans and other investors as described in the Fund’s prospectus.
Class T shares are subject to a maximum front-end sales charge of 2.50% per transaction and must be purchased through financial intermediaries that, by written agreement with Columbia Management Investment Distributors, Inc., are specifically authorized to sell Class T shares. Prior to March 27, 2017, Class T shares were known as Class W shares, were not subject to sales charges, and were generally available only to investors purchasing through authorized investment programs managed by investment professionals, including discretionary managed accounts.
Class Y shares are not subject to sales charges or distribution and service (12b-1) fees, and are available to institutional and certain other investors as described in the Fund’s prospectus. On March 27, 2017, Class I shares were redeemed or exchanged for Class Y shares of the Fund in a tax free transaction that had no impact on the fees and expenses paid by shareholders. Class I shares of the Fund are no longer offered for sale.
Class Z shares are not subject to sales charges and are generally available only to eligible investors, which are subject to different investment minimums as described in the Fund’s prospectus.
| 32 | Columbia Global Bond Fund | Semiannual Report 2017 |
Notes to Financial Statements (continued)
April 30, 2017 (Unaudited)
Note 2. Summary of significant accounting policies
Basis of preparation
The Fund is an investment company that applies the accounting and reporting guidance in the Financial Accounting Standards Board (FASB) Accounting Standards Codification Topic 946, Financial Services - Investment Companies (ASC 946). The financial statements are prepared in accordance with U.S. generally accepted accounting principles (GAAP), which requires management to make certain estimates and assumptions that affect the reported amounts of assets and liabilities, the disclosure of contingent assets and liabilities at the date of the financial statements and the reported amounts of income and expenses during the reporting period. Actual results could differ from those estimates.
The following is a summary of significant accounting policies followed by the Fund in the preparation of its financial statements.
Security valuation
Debt securities generally are valued by pricing services approved by the Board of Trustees based upon market transactions for normal, institutional-size trading units of similar securities. The services may use various pricing techniques that take into account, as applicable, factors such as yield, quality, coupon rate, maturity, type of issue, trading characteristics and other data, as well as approved independent broker-dealer quotes. Debt securities for which quotations are not readily available or not believed to be reflective of market value may also be valued based upon a bid quote from an approved independent broker-dealer. Debt securities maturing in 60 days or less are valued primarily at amortized cost value, unless this method results in a valuation that management believes does not approximate market value.
Asset- and mortgage-backed securities are generally valued by pricing services, which utilize pricing models that incorporate the securities’ cash flow and loan performance data. These models also take into account available market data, including trades, market quotations, and benchmark yield curves for identical or similar securities. Factors used to identify similar securities may include, but are not limited to, issuer, collateral type, vintage, prepayment speeds, collateral performance, credit ratings, credit enhancement and expected life. Asset-backed securities for which quotations are readily available may also be valued based upon an over-the-counter or exchange bid quote from an approved independent broker-dealer.
Senior loan securities for which reliable market quotations are readily available are generally valued by pricing services at the average of the bids received.
Investments in open-end investment companies, including money market funds, are valued at their latest net asset value.
Forward foreign currency exchange contracts are marked-to-market based upon foreign currency exchange rates provided by a pricing service.
Futures and options on futures contracts are valued based upon the settlement price at the close of regular trading on their principal exchanges or, in the absence of transactions, at the mean of the latest quoted bid and ask prices.
Option contracts are valued at the mean of the latest quoted bid and ask prices on their primary exchanges. Option contracts, including over-the-counter option contracts, with no readily available market quotations are valued using quotes obtained from independent brokers as of the close of the New York Stock Exchange.
Swap transactions are valued through an independent pricing service or broker, or if neither is available, through an internal model based upon observable inputs.
Investments for which market quotations are not readily available, or that have quotations which management believes are not reflective of market value or reliable, are valued at fair value as determined in good faith under procedures approved by and under the general supervision of the Board of Trustees. If a security or class of securities (such as foreign securities) is valued at fair value, such value is likely to be different from the quoted or published price for the security.
The determination of fair value often requires significant judgment. To determine fair value, management may use assumptions including but not limited to future cash flows and estimated risk premiums. Multiple inputs from various sources may be used to determine fair value.
Columbia Global Bond Fund | Semiannual Report 2017
| 33 |
Notes to Financial Statements (continued)
April 30, 2017 (Unaudited)
GAAP requires disclosure regarding the inputs and valuation techniques used to measure fair value and any changes in valuation inputs or techniques. In addition, investments shall be disclosed by major category. This information is disclosed following the Fund’s Portfolio of Investments.
Foreign currency transactions and translations
The values of all assets and liabilities denominated in foreign currencies are generally translated into U.S. dollars at exchange rates determined at the close of regular trading on the New York Stock Exchange. Net realized and unrealized gains (losses) on foreign currency transactions and translations include gains (losses) arising from the fluctuation in exchange rates between trade and settlement dates on securities transactions, gains (losses) arising from the disposition of foreign currency and currency gains (losses) between the accrual and payment dates on dividends, interest income and foreign withholding taxes.
For financial statement purposes, the Fund does not distinguish that portion of gains (losses) on investments which is due to changes in foreign exchange rates from that which is due to changes in market prices of the investments. Such fluctuations are included with the net realized and unrealized gains (losses) on investments in the Statement of Operations.
Derivative instruments
The Fund invests in certain derivative instruments, as detailed below, to meet its investment objectives. Derivatives are instruments whose values depend on, or are derived from, in whole or in part, the value of one or more securities, currencies, commodities, indices, or other assets or instruments. Derivatives may be used to increase investment flexibility (including to maintain cash reserves while maintaining desired exposure to certain assets), for risk management (hedging) purposes, to facilitate trading, to reduce transaction costs and to pursue higher investment returns. The Fund may also use derivative instruments to mitigate certain investment risks, such as foreign currency exchange rate risk, interest rate risk and credit risk. Derivatives may involve various risks, including the potential inability of the counterparty to fulfill its obligations under the terms of the contract, the potential for an illiquid secondary market (making it difficult for the Fund to sell or terminate, including at favorable prices) and the potential for market movements which may expose the Fund to gains or losses in excess of the amount shown in the Statement of Assets and Liabilities. The notional amounts of derivative instruments, if applicable, are not recorded in the financial statements.
A derivative instrument may suffer a marked-to-market loss if the value of the contract decreases due to an unfavorable change in the market rates or values of the underlying instrument. Losses can also occur if the counterparty does not perform its obligations under the contract. The Fund’s risk of loss from counterparty credit risk on over-the-counter derivatives is generally limited to the aggregate unrealized gain netted against any collateral held by the Fund and the amount of any variation margin held by the counterparty, plus any replacement costs or related amounts. With exchange-traded or centrally cleared derivatives, there is reduced counterparty credit risk to the Fund since the clearinghouse or central counterparty (CCP) provides some protection in the case of clearing member default. The clearinghouse or CCP stands between the buyer and the seller of the contract; therefore, additional counterparty credit risk is failure of the clearinghouse or CCP. However, credit risk still exists in exchange-traded or centrally cleared derivatives with respect to initial and variation margin that is held in a broker’s customer account. While brokers are required to segregate customer margin from their own assets, in the event that a broker becomes insolvent or goes into bankruptcy and at that time there is a shortfall in the aggregate amount of margin held by the broker for all its clients, U.S. bankruptcy laws will typically allocate that shortfall on a pro-rata basis across all the broker’s customers (including the Fund), potentially resulting in losses to the Fund.
In order to better define its contractual rights and to secure rights that will help the Fund mitigate its counterparty risk, the Fund may enter into an International Swaps and Derivatives Association, Inc. Master Agreement (ISDA Master Agreement) or similar agreement with its derivatives contract counterparties. An ISDA Master Agreement is an agreement between the Fund and a counterparty that governs over-the-counter derivatives and typically contains, among other things, collateral posting terms and netting provisions in the event of a default and/or termination event. Under an ISDA Master Agreement, the Fund may, under certain circumstances, offset with the counterparty certain derivative instrument’s payables and/or receivables with collateral held and/or posted and create one single net payment. The provisions of the ISDA Master Agreement typically permit a single net payment in the event of default (close-out netting), including the bankruptcy or insolvency of the counterparty. Note, however, that bankruptcy or insolvency laws of a particular jurisdiction may impose restrictions on or prohibitions against the right of offset or netting in bankruptcy, insolvency or other events.
| 34 | Columbia Global Bond Fund | Semiannual Report 2017 |
Notes to Financial Statements (continued)
April 30, 2017 (Unaudited)
Collateral (margin) requirements differ by type of derivative. Margin requirements are established by the clearinghouse or CCP for exchange-traded and centrally cleared derivatives. Brokers can ask for margin in excess of the minimum in certain circumstances. Collateral terms are contract specific for over-the-counter derivatives. For over-the-counter derivatives traded under an ISDA Master Agreement, the collateral requirements are typically calculated by netting the marked-to-market amount for each transaction under such agreement and comparing that amount to the value of any variation margin currently pledged by the Fund and/or the counterparty. Generally, the amount of collateral due from or to a party has to exceed a minimum transfer amount threshold (e.g., $250,000) before a transfer has to be made. To the extent amounts due to the Fund from its counterparties are not fully collateralized, contractually or otherwise, the Fund bears the risk of loss from counterparty nonperformance. The Fund attempts to mitigate counterparty risk by only entering into agreements with counterparties that it believes have the financial resources to honor their obligations and by monitoring the financial stability of those counterparties.
Certain ISDA Master Agreements allow counterparties of over-the-counter derivatives transactions to terminate derivatives contracts prior to maturity in the event the Fund’s net asset value declines by a stated percentage over a specified time period or if the Fund fails to meet certain terms of the ISDA Master Agreement, which would cause the Fund to accelerate payment of any net liability owed to the counterparty. The Fund also has termination rights if the counterparty fails to meet certain terms of the ISDA Master Agreement. In addition to considering counterparty credit risk, the Fund would consider terminating the derivatives contracts based on whether termination would result in a net liability owed from the counterparty.
For financial reporting purposes, the Fund does not offset derivative assets and derivative liabilities that are subject to netting arrangements in the Statement of Assets and Liabilities.
Forward foreign currency exchange contracts
Forward foreign currency exchange contracts are over-the-counter agreements between two parties to buy and sell a currency at a set price on a future date. The Fund utilized forward foreign currency exchange contracts to hedge the currency exposure associated with some or all of the Fund’s securities and to generate total return through long and short positions versus the U.S. dollar. These instruments may be used for other purposes in future periods.
The values of forward foreign currency exchange contracts fluctuate daily with changes in foreign currency exchange rates. Changes in the value of these contracts are recorded as unrealized appreciation or depreciation until the contract is exercised or has expired. The Fund will realize a gain or loss when the forward foreign currency exchange contract is closed or expires.
The use of forward foreign currency exchange contracts does not eliminate fluctuations in the prices of the Fund’s portfolio securities. The risks of forward foreign currency exchange contracts include movement in the values of the foreign currencies relative to the U.S. dollar (or other foreign currencies) and the possibility that counterparties will not complete their contractual obligations, which may be in excess of the amount reflected, if any, in the Statement of Assets and Liabilities.
Futures contracts
Futures contracts are exchange-traded and represent commitments for the future purchase or sale of an asset at a specified price on a specified date. The Fund bought and sold futures contracts to manage the duration and yield curve exposure of the Fund versus the benchmark. These instruments may be used for other purposes in future periods. Upon entering into futures contracts, the Fund bears risks that it may not achieve the anticipated benefits of the futures contracts and may realize a loss. Additional risks include counterparty credit risk, the possibility of an illiquid market, and that a change in the value of the contract or option may not correlate with changes in the value of the underlying asset.
Upon entering into a futures contract, the Fund deposits cash or securities with the broker, known as a futures commission merchant (FCM), in an amount sufficient to meet the initial margin requirement. The initial margin deposit must be maintained at an established level over the life of the contract. Cash deposited as initial margin is recorded in the Statement of Assets and Liabilities as margin deposits. Securities deposited as initial margin are designated in the Portfolio of Investments. Subsequent payments (variation margin) are made or received by the Fund each day. The variation margin payments are
Columbia Global Bond Fund | Semiannual Report 2017
| 35 |
Notes to Financial Statements (continued)
April 30, 2017 (Unaudited)
equal to the daily change in the contract value and are recorded as variation margin receivable or payable and are offset in unrealized gains or losses. The Fund recognizes a realized gain or loss when the contract is closed or expires. Futures contracts involve, to varying degrees, risk of loss in excess of the variation margin disclosed in the Statement of Assets and Liabilities.
Options contracts
Options are contracts which entitle the holder to purchase or sell securities or other identified assets at a specified price, or in the case of index option contracts, to receive or pay the difference between the index value and the strike price of the index option contract. Option contracts can be either exchange-traded or over-the-counter. The Fund purchased and wrote option contracts to manage the duration and yield curve exposure of the Fund versus the benchmark. These instruments may be used for other purposes in future periods. Completion of transactions for option contracts traded in the over-the-counter market depends upon the performance of the other party. Cash collateral may be collected or posted by the Fund to secure certain over-the-counter option contract trades. Cash collateral held or posted by the Fund for such option contract trades must be returned to the broker or the Fund upon closure, exercise or expiration of the contract.
Options contracts purchased are recorded as investments. When the Fund writes an options contract, the premium received is recorded as an asset and an amount equivalent to the premium is recorded as a liability in the Statement of Assets and Liabilities and is subsequently adjusted to reflect the current fair value of the option written. Changes in the fair value of the written option are recorded as unrealized appreciation or depreciation until the contract is exercised or has expired. The Fund will realize a gain or loss when the option contract is closed or expires. When option contracts are exercised, the proceeds on sales for a written call or purchased put option contract, or the purchase cost for a written put or purchased call option contract, is adjusted by the amount of premium received or paid.
For over-the-counter options purchased, the Fund bears the risk of loss of the amount of the premiums paid plus the positive change in market values net of any collateral held by the Fund should the counterparty fail to perform under the contracts. Option contracts written by the Fund do not typically give rise to significant counterparty credit risk, as options written generally obligate the Fund and not the counterparty to perform. The risk in writing a call option contract is that the Fund gives up the opportunity for profit if the market price of the security increases above the strike price and the option contract is exercised. The risk in writing a put option contract is that the Fund may incur a loss if the market price of the security decreases below the strike price and the option contract is exercised. Exercise of a written option could result in the Fund purchasing or selling a security or foreign currency when it otherwise would not, or at a price different from the current market value. In purchasing and writing options, the Fund bears the risk of an unfavorable change in the value of the underlying instrument or the risk that the Fund may not be able to enter into a closing transaction due to an illiquid market.
Interest rate swaption contracts
Interest rate swaption contracts entered into by the Fund typically represent an option that gives the purchaser the right, but not the obligation, to enter into an interest rate swap contract on a future date. Each interest rate swaption agreement will specify if the buyer is entitled to receive the fixed or floating rate if the interest rate is exercised. Changes in the value of a purchased interest rate swaption contracts are reported as unrealized appreciation or depreciation on options in the Statement of Assets and Liabilities. Gain or loss is recognized in the Statement of Operations when the interest rate swaption contract is closed or expires.
When the Fund writes an interest rate swaption contract, the premium received is recorded as an asset and an amount equivalent to the premium is recorded as a liability in the Statement of Assets and Liabilities and is subsequently adjusted to reflect the current fair value of the interest rate swaption contract written. Premiums received from writing interest rate swaption contracts that expire unexercised are recorded by the Fund on the expiration date as realized gains from options written in the Statement of Operations. The difference between the premium and the amount paid on effecting a closing purchase transaction, including brokerage commissions, is also recorded as realized gain, or if the premium is less than the amount paid for the closing purchase, as realized loss. These amounts are reflected as net realized gain (loss) on options written in the Statement of Operations.
| 36 | Columbia Global Bond Fund | Semiannual Report 2017 |
Notes to Financial Statements (continued)
April 30, 2017 (Unaudited)
Swap contracts
Swap contracts are negotiated in the over-the-counter market and may be entered into as a bilateral contract or centrally cleared (centrally cleared swap contract). In a centrally cleared swap contract, immediately following execution of the swap contract with a broker, the swap contract is novated to a central counterparty (the CCP) and the CCP becomes the Fund’s counterparty to the centrally cleared swap contract. The Fund is required to deposit initial margin with the futures commission merchant (FCM), which pledges it through to the CCP in the form of cash or securities in an amount that varies depending on the size and risk profile of the particular swap contract. Securities deposited as initial margin are designated in the Portfolio of Investments and cash deposited is recorded in the Statement of Assets and Liabilities as margin deposits. Unlike a bilateral swap contract, for centrally cleared swap contracts, the Fund has minimal credit exposure to the FCM because the CCP stands between the Fund and the relevant buyer/seller on the other side of the contract. Swap contracts are marked-to-market daily and changes in value are recorded as unrealized appreciation (depreciation). The daily change in valuation of centrally cleared swap contracts, if any, is recorded as a receivable or payable for variation margin in the Statement of Assets and Liabilities.
Entering into these contracts involves, to varying degrees, elements of interest, liquidity and counterparty credit risk in excess of the amounts recognized in the Statement of Assets and Liabilities. Such risks involve the possibility that there may be unfavorable changes in interest rates, market conditions or other conditions, it may be difficult to initiate a swap transaction or liquidate a position at an advantageous time or price which may result in significant losses, and that the FCM or CCP may not fulfill its obligation under the contract.
Credit default swap contracts
The Fund entered into credit default swap contracts to increase or decrease its credit exposure to an index and increase or decrease its credit exposure to a single issuer of debt securities. These instruments may be used for other purposes in future periods. Credit default swap contracts are agreements in which one party pays fixed periodic payments to a counterparty in consideration for an agreement from the counterparty to make a specific payment should a specified credit event(s) take place. Although specified credit events are contract specific, credit events are generally defined as bankruptcy, failure to pay, restructuring, obligation acceleration, obligation default, or repudiation/moratorium.
As the purchaser of a credit default swap contract, the Fund purchases protection by paying a periodic interest rate on the notional amount to the counterparty. The interest amount is accrued daily as a component of unrealized appreciation (depreciation) and is recorded as a realized loss upon payment. If a credit event as specified in the contract occurs, the Fund may have the option either to deliver the reference obligation to the seller in exchange for a cash payment of its par amount, or to receive a net cash settlement equal to the par amount less an agreed-upon value of the reference obligation as of the date of the credit event. The difference between the value of the obligation or cash delivered and the notional amount received will be recorded as a realized gain (loss).
As the seller of a credit default swap contract, the Fund sells protection to a buyer and will generally receive a periodic interest rate on a notional amount. The interest amount is accrued daily as a component of unrealized appreciation (depreciation) and is recorded as a realized gain upon receipt of the payment. If a credit event as specified in the contract with the counterparty occurs, the Fund may either be required to accept the reference obligation from the buyer in exchange for a cash payment of its notional amount, or to pay the buyer a net cash settlement equal to the notional amount less an agreed-upon value of the reference obligation (recovery value) as of the date of the credit event. The difference between the value of the obligation or cash received and the notional amount paid will be recorded as a realized gain (loss). The maximum potential amount of undiscounted future payments the Fund could be required to make as the seller of protection under a credit default swap contract is equal to the notional amount of the reference obligation. These potential amounts may be partially offset by any recovery values of the respective reference obligations or premiums received upon entering into the agreement. The notional amounts and market values of all credit default swap contracts in which the Fund is the seller of protection, if any, are disclosed in the Credit Default Swap Contracts Outstanding schedule following the Portfolio of Investments.
Columbia Global Bond Fund | Semiannual Report 2017
| 37 |
Notes to Financial Statements (continued)
April 30, 2017 (Unaudited)
As a protection seller, the Fund bears the risk of loss from the credit events specified in the contract with the counterparty. For credit default swap contracts on credit indices, quoted market prices and resulting market values serve as an indicator of the current status of the payment/performance risk. Increasing market values, in absolute terms when compared to the notional amount of the swap, represent a deterioration of the reference entity’s credit soundness and a greater likelihood or risk of default or other credit event occurring as defined under the terms of the contract.
Any premium paid or received by the Fund upon entering into a credit default swap contract is recorded as an asset or liability, respectively, and amortized daily as a component of realized gain (loss) in the Statement of Operations. Credit default swap contracts are valued daily, and the change in value is recorded as unrealized appreciation (depreciation) until the termination of the swap, at which time a realized gain (loss) is recorded.
Credit default swap contracts can involve greater risks than if a fund had invested in the reference obligation directly since, in addition to general market risks, credit default swaps are subject to counterparty credit risk, leverage risk, hedging risk, correlation risk and liquidity risk.
Interest rate swap contracts
The Fund entered into interest rate swap transactions which may include inflation rate swap contracts to manage the duration and yield curve exposure of the Fund versus the benchmark. These instruments may be used for other purposes in future periods. An interest rate swap is an agreement between two parties where there are two flows and payments are made between the two counterparties and the payments are dependent upon changes in an interest rate, inflation rate or inflation index calculated on a nominal amount. Interest rate swaps are agreements between two parties that involve the exchange of one type of interest rate for another type of interest rate cash flow on specified dates in the future, based on a predetermined, specified notional amount. Certain interest rate swaps are considered forward-starting, whereby the accrual for the exchange of cash flows does not begin until a specified date in the future. The net cash flow for a standard interest rate swap transaction is generally the difference between a floating market interest rate versus a fixed interest rate.
Interest rate swaps are valued daily and unrealized appreciation (depreciation) is recorded. Certain interest rate swaps may accrue periodic interest on a daily basis as a component of unrealized appreciation (depreciation); the Fund will realize a gain or loss upon the payment or receipt of accrued interest. The Fund will realize a gain or a loss when the interest rate swap is terminated.
Effects of derivative transactions in the financial statements
The following tables are intended to provide additional information about the effect of derivatives on the financial statements of the Fund, including: the fair value of derivatives by risk category and the location of those fair values in the Statement of Assets and Liabilities; and the impact of derivative transactions over the period in the Statement of Operations, including realized and unrealized gains (losses). The derivative instrument schedules following the Portfolio of Investments present additional information regarding derivative instruments outstanding at the end of the period, if any.
The following table is a summary of the fair value of derivative instruments (not considered to be hedging instruments for accounting disclosure purposes) at April 30, 2017:
| | Asset derivatives | |
Risk exposure
category | Statement
of assets and liabilities
location | Fair value ($) |
| Credit risk | Net assets — unrealized appreciation on swap contracts | 6,888* |
| Credit risk | Premiums paid on outstanding swap contracts | 376,826 |
| Foreign exchange risk | Unrealized appreciation on forward foreign currency exchange contracts | 1,101,161 |
| Interest rate risk | Net assets — unrealized appreciation on futures contracts | 190,987* |
| Interest rate risk | Net assets — unrealized appreciation on swap contracts | 202,476* |
| Total | | 1,878,338 |
| 38 | Columbia Global Bond Fund | Semiannual Report 2017 |
Notes to Financial Statements (continued)
April 30, 2017 (Unaudited)
| | Liability derivatives | |
Risk exposure
category | Statement
of assets and liabilities
location | Fair value ($) |
| Credit risk | Net assets — unrealized depreciation on swap contracts | 299,761* |
| Credit risk | Premiums received on outstanding swap contracts | 90,461 |
| Foreign exchange risk | Unrealized depreciation on forward foreign currency exchange contracts | 838,231 |
| Interest rate risk | Net assets — unrealized depreciation on futures contracts | 517,088* |
| Interest rate risk | Net assets — unrealized depreciation on swap contracts | 572,852* |
| Total | | 2,318,393 |
| * | Includes cumulative appreciation (depreciation) as reported in the tables following the Portfolio of Investments. Only the current day’s variation margin is reported in receivables or payables in the Statement of Assets and Liabilities. |
The following table indicates the effect of derivative instruments (not considered to be hedging instruments for accounting disclosure purposes) in the Statement of Operations for the six months ended April 30, 2017:
| Amount of realized gain (loss) on derivatives recognized in income |
| Risk exposure category | Forward
foreign
currency
exchange
contracts
($) | Futures
contracts
($) | Options
contracts
purchased
($) | Swap
contracts
($) | Total
($) |
| Credit risk | — | — | — | (575,546) | (575,546) |
| Foreign exchange risk | (3,225,896) | — | — | — | (3,225,896) |
| Interest rate risk | — | 1,016,692 | (87,500) | (160,624) | 768,568 |
| Total | (3,225,896) | 1,016,692 | (87,500) | (736,170) | (3,032,874) |
| |
| Change in unrealized appreciation (depreciation) on derivatives recognized in income |
| Risk exposure category | Forward
foreign
currency
exchange
contracts
($) | Futures
contracts
($) | Options
contracts
purchased
($) | Swap
contracts
($) | Total
($) |
| Credit risk | — | — | — | (256,838) | (256,838) |
| Foreign exchange risk | (154,929) | — | — | — | (154,929) |
| Interest rate risk | — | (651,746) | 87,450 | (174,514) | (738,810) |
| Total | (154,929) | (651,746) | 87,450 | (431,352) | (1,150,577) |
The following table is a summary of the average outstanding volume by derivative instrument for the six months ended April 30, 2017:
| Derivative instrument | Average notional
amounts ($)* |
| Futures contracts — long | 70,810,616 |
| Futures contracts — short | 56,223,843 |
| Credit default swap contracts — buy protection | 17,307,500 |
| Credit default swap contracts — sell protection | 5,725,000 |
| Derivative instrument | Average unrealized
appreciation ($)* | Average unrealized
depreciation ($)* |
| Forward foreign currency exchange contracts | 1,020,341 | (612,928) |
| Interest rate swap contracts | 101,238 | (580,261) |
| * | Based on the ending quarterly outstanding amounts for the six months ended April 30, 2017. |
Columbia Global Bond Fund | Semiannual Report 2017
| 39 |
Notes to Financial Statements (continued)
April 30, 2017 (Unaudited)
Investments in senior loans
The Fund may invest in senior loan assignments. When the Fund purchases an assignment of a senior loan, the Fund typically has direct rights against the borrower; provided, however, that the Fund’s rights may be more limited than the lender from which it acquired the assignment and the Fund may be able to enforce its rights only through an administrative agent. Although certain senior loan assignments are secured by collateral, the Fund could experience delays or limitations in realizing such collateral or have its interest subordinated to other indebtedness of the obligor. In the event that the administrator or collateral agent of a loan becomes insolvent, enters into receivership or bankruptcy, the Fund may incur costs and delays in realizing payment or may suffer a loss of principal and/or interest. The risk of loss is greater for unsecured or subordinated loans. In addition, senior loan assignments are vulnerable to market, economic or other conditions or events that may reduce the demand for senior loan assignments and certain senior loan assignments which were liquid, when purchased, may become illiquid.
The Fund may enter into senior loan assignments where all or a portion of the loan may be unfunded. The Fund is obligated to fund these commitments at the borrower’s discretion. These commitments are generally traded and priced in the same manner as other senior loan securities and are disclosed as unfunded senior loan commitments in the Fund’s Portfolio of Investments with a corresponding payable for investments purchased. The Fund designates cash or liquid securities to cover these commitments.
Asset- and mortgage-backed securities
The Fund may invest in asset-backed and mortgage-backed securities. The maturity dates shown represent the original maturity of the underlying obligation. Actual maturity may vary based upon prepayment activity on these obligations. All, or a portion, of the obligation may be prepaid at any time because the underlying asset may be prepaid. As a result, decreasing market interest rates could result in an increased level of prepayment. An increased prepayment rate will have the effect of shortening the maturity of the security. Unless otherwise noted, the coupon rates presented are fixed rates.
Delayed delivery securities
The Fund may trade securities on other than normal settlement terms, including securities purchased or sold on a “when-issued” or "forward commitment" basis. This may increase risk to the Fund since the other party to the transaction may fail to deliver, which could cause the Fund to subsequently invest at less advantageous prices. The Fund designates cash or liquid securities in an amount equal to the delayed delivery commitment.
Mortgage dollar roll transactions
The Fund may enter into mortgage “dollar rolls” in which the Fund sells securities for delivery in the current month and simultaneously contracts with the same counterparty to repurchase similar but not identical securities (same type, coupon and maturity) on a specified future date. During the roll period, the Fund loses the right to receive principal and interest paid on the securities sold. However, the Fund will benefit because it receives negotiated amounts in the form of reductions of the purchase price for the future purchase plus the interest earned on the cash proceeds of the securities sold until the settlement date of the forward purchase. The Fund records the incremental difference between the forward purchase and sale of each forward roll as a realized gain or loss. Unless any realized gains exceed the income, capital appreciation, and gain or loss due to mortgage prepayments that would have been realized on the securities sold as part of the mortgage dollar roll, the use of this technique will diminish the investment performance of the Fund compared to what the performance would have been without the use of mortgage dollar rolls. All cash proceeds will be invested in instruments that are permissible investments for the Fund. The Fund identifies cash or liquid securities in an amount equal to the forward purchase price.
For financial reporting and tax purposes, the Fund treats “to be announced” mortgage dollar rolls as two separate transactions, one involving the purchase of a security and a separate transaction involving a sale. These transactions may increase the Fund’s portfolio turnover rate. The Fund does not currently enter into mortgage dollar rolls that are accounted for as financing transactions.
Mortgage dollar rolls involve the risk that the market value of the securities the Fund is obligated to repurchase may decline below the repurchase price, or that the counterparty may default on its obligations.
| 40 | Columbia Global Bond Fund | Semiannual Report 2017 |
Notes to Financial Statements (continued)
April 30, 2017 (Unaudited)
Offsetting of assets and liabilities
The following table presents the Fund’s gross and net amount of assets and liabilities available for offset under netting arrangements as well as any related collateral received or pledged by the Fund as of April 30, 2017:
| | Barclays
($) | BNP
Paribas
($) | Citi
($) | Credit
Suisse
($) | Goldman
Sachs
International
($) | HSBC
($) | Morgan
Stanley
($) | Morgan
Stanley
($) (a) | Standard
Chartered($) | Total
($) |
| Assets | | | | | | | | | | |
| Centrally cleared credit default swap contracts (b) | - | - | - | - | - | - | - | 7,212 | - | 7,212 |
| Centrally cleared interest rate swap contracts (b) | - | - | - | - | - | - | - | 25,719 | - | 25,719 |
| Forward foreign currency exchange contracts | 5,690 | 7,910 | 125,052 | 673,191 | - | 124,491 | 2,973 | - | 161,854 | 1,101,161 |
| OTC credit default swap contracts (c) | 312,707 | - | - | - | - | - | - | - | - | 312,707 |
| Total assets | 318,397 | 7,910 | 125,052 | 673,191 | - | 124,491 | 2,973 | 32,931 | 161,854 | 1,446,799 |
| Liabilities | | | | | | | | | | |
| Centrally cleared credit default swap contracts (b) | - | - | - | - | - | - | - | 6,367 | - | 6,367 |
| Centrally cleared interest rate swap contracts (b) | - | - | - | - | - | - | - | 21,734 | - | 21,734 |
| Forward foreign currency exchange contracts | 1,249 | 36,145 | 153,461 | 582,389 | - | 57,477 | - | - | 7,510 | 838,231 |
| OTC credit default swap contracts (c) | - | - | - | - | 83,573 | - | - | - | - | 83,573 |
| Total liabilities | 1,249 | 36,145 | 153,461 | 582,389 | 83,573 | 57,477 | - | 28,101 | 7,510 | 949,905 |
| Total financial and derivative net assets | 317,148 | (28,235) | (28,409) | 90,802 | (83,573) | 67,014 | 2,973 | 4,830 | 154,344 | 496,894 |
| Total collateral received (pledged) (d) | 228,162 | - | - | - | - | - | - | - | - | 228,162 |
| Net amount (e) | 88,986 | (28,235) | (28,409) | 90,802 | (83,573) | 67,014 | 2,973 | 4,830 | 154,344 | 268,732 |
| (a) | Exposure can only be netted across transactions governed under the same master agreement with the same legal entity. |
| (b) | Centrally cleared swaps are included within payable/receivable for variation margin on the Statement of Assets and Liabilities. |
| (c) | Over-the-Counter Swap Contracts are presented at market value plus periodic payments receivable (payable), which is comprised of unrealized appreciation, unrealized depreciation, premiums paid and premiums received. |
| (d) | In some instances, the actual collateral received and/or pledged may be more than the amount shown due to overcollateralization. |
| (e) | Represents the net amount due from/(to) counterparties in the event of default. |
Security transactions
Security transactions are accounted for on the trade date. Cost is determined and gains (losses) are based upon the specific identification method for both financial statement and federal income tax purposes.
Trade date for senior loans purchased in the primary market is the date on which the loan is allocated. Trade date for senior loans purchased in the secondary market is the date on which the transaction is entered into.
Income recognition
Interest income is recorded on an accrual basis. Market premiums and discounts, including original issue discounts, are amortized and accreted, respectively, over the expected life of the security on all debt securities, unless otherwise noted. The Fund classifies gains and losses realized on prepayments received on mortgage-backed securities as adjustments to interest income.
The Fund may place a debt security on non-accrual status and reduce related interest income when it becomes probable that the interest will not be collected and the amount of uncollectible interest can be reasonably estimated. A defaulted debt security is removed from non-accrual status when the issuer resumes interest payments or when collectibility of interest is reasonably assured.
Dividend income is recorded on the ex-dividend date.
The value of additional securities received as an income payment is recorded as income and increases the cost basis of such securities.
Columbia Global Bond Fund | Semiannual Report 2017
| 41 |
Notes to Financial Statements (continued)
April 30, 2017 (Unaudited)
The Fund may receive other income from senior loans, including amendment fees, consent fees and commitment fees. These fees are recorded as income when received by the Fund. These amounts are included in Interest Income in the Statement of Operations.
Expenses
General expenses of the Trust are allocated to the Fund and other funds of the Trust based upon relative net assets or other expense allocation methodologies determined by the nature of the expense. Expenses directly attributable to the Fund are charged to the Fund. Expenses directly attributable to a specific class of shares are charged to that share class.
Determination of class net asset value
All income, expenses (other than class-specific expenses, which are charged to that share class, as shown in the Statement of Operations) and realized and unrealized gains (losses) are allocated to each class of the Fund on a daily basis, based on the relative net assets of each class, for purposes of determining the net asset value of each class.
Federal income tax status
The Fund intends to qualify each year as a regulated investment company under Subchapter M of the Internal Revenue Code, as amended, and will distribute substantially all of its taxable income (including net short-term capital gains), if any, for its tax year, and as such will not be subject to federal income taxes. In addition, the Fund intends to distribute in each calendar year substantially all of its net investment income, capital gains and certain other amounts, if any, such that the Fund should not be subject to federal excise tax. Therefore, no federal income or excise tax provision is recorded.
Foreign taxes
The Fund may be subject to foreign taxes on income, gains on investments or currency repatriation, a portion of which may be recoverable. The Fund will accrue such taxes and recoveries, as applicable, based upon its current interpretation of tax rules and regulations that exist in the markets in which it invests.
Realized gains in certain countries may be subject to foreign taxes at the Fund level, based on statutory rates. The Fund accrues for such foreign taxes on realized and unrealized gains at the appropriate rate for each jurisdiction, as applicable. The amount, if any, is disclosed as a liability on the Statement of Assets and Liabilities.
Distributions to shareholders
Distributions from net investment income, if any, are declared and paid each calendar quarter. Net realized capital gains, if any, are distributed at least annually. Income distributions and capital gain distributions are determined in accordance with federal income tax regulations, which may differ from GAAP.
Guarantees and indemnifications
Under the Trust’s organizational documents and, in some cases, by contract, its officers and trustees are indemnified against certain liabilities arising out of the performance of their duties to the Trust or its funds. In addition, certain of the Fund’s contracts with its service providers contain general indemnification clauses. The Fund’s maximum exposure under these arrangements is unknown since the amount of any future claims that may be made against the Fund cannot be determined, and the Fund has no historical basis for predicting the likelihood of any such claims.
Investment company reporting modernization
In October 2016, the U.S. Securities and Exchange Commission adopted new rules and forms, and amendments to certain current rules and forms, to modernize reporting and disclosure of information by registered investment companies. The amendments to Regulation S-X will require standardized, enhanced disclosure about derivatives in investment company financial statements, and will also change the rules governing the form and content of such financial statements. The amendments to Regulation S-X take effect on August 1, 2017. At this time, management is assessing the anticipated impact of these regulatory developments.
| 42 | Columbia Global Bond Fund | Semiannual Report 2017 |
Notes to Financial Statements (continued)
April 30, 2017 (Unaudited)
Note 3. Fees and other transactions with affiliates
Management services fees
The Fund entered into a Management Agreement with Columbia Management Investment Advisers, LLC (the Investment Manager), a wholly-owned subsidiary of Ameriprise Financial, Inc. (Ameriprise Financial). Under the Management Agreement, the Investment Manager provides the Fund with investment research and advice, as well as administrative and accounting services. The management services fee is an annual fee that is equal to a percentage of the Fund’s average daily net assets that declines from 0.65% to 0.52% as the Fund’s net assets increase. The annualized effective management services fee rate for the six months ended April 30, 2017 was 0.65% of the Fund’s average daily net assets.
Participating Affiliates
The Investment Manager and its investment advisory affiliates (Participating Affiliates) around the world may coordinate in providing services to their clients. From time to time the Investment Manager (or any affiliated investment subadviser to the Fund, as the case may be) may engage its Participating Affiliates to provide a variety of services such as investment research, investment monitoring, trading and discretionary investment management (including portfolio management) to certain accounts managed by the Investment Manager, including the Fund. These Participating Affiliates will provide services to the Investment Manager (or any affiliated investment subadviser to the Fund as the case may be) either pursuant to subadvisory agreements, personnel-sharing agreements or similar inter-company arrangements and the Fund will pay no additional fees and expenses as a result of any such arrangements.
These Participating Affiliates, like the Investment Manager, are direct or indirect subsidiaries of Ameriprise Financial and are registered with appropriate respective regulators in their home jurisdictions and, where required, the Securities and Exchange Commission and the Commodity Futures Trading Commission in the United States.
Pursuant to some of these arrangements, certain employees of these Participating Affiliates may serve as "associated persons" of the Investment Manager and, in this capacity, subject to the oversight and supervision of the Investment Manager and consistent with the investment objectives, policies and limitations set forth in the Fund’s prospectus and Statement of Additional Information (SAI), may provide such services to the Fund on behalf of the Investment Manager.
Other expenses
Other expenses are for, among other things, miscellaneous expenses of the Fund or the Board of Trustees, including payments to Board Services Corp., a company providing limited administrative services to the Fund and the Board of Trustees. That company’s expenses include boardroom and office expense, employee compensation, employee health and retirement benefits, and certain other expenses.
Compensation of board members
Members of the Board of Trustees, who are not officers or employees of the Investment Manager or Ameriprise Financial, are compensated for their services to the Fund as disclosed in the Statement of Operations. Under a Deferred Compensation Plan (the Plan), these members of the Board of Trustees may elect to defer payment of up to 100% of their compensation. Deferred amounts are treated as though equivalent dollar amounts had been invested in shares of certain funds managed by the Investment Manager. The Fund’s liability for these amounts is adjusted for market value changes and remains in the Fund until distributed in accordance with the Plan. All amounts payable under the Plan constitute a general unsecured obligation of the Fund.
Compensation of Chief Compliance Officer
The Board of Trustees has appointed a Chief Compliance Officer to the Fund in accordance with federal securities regulations. A portion of the Chief Compliance Officer’s total compensation is allocated to the Fund, along with other affiliated funds governed by the Board of Trustees, based on relative net assets. The total amount allocated to all affiliated funds governed by the Board of Trustees will not exceed $40,000 annually.
Columbia Global Bond Fund | Semiannual Report 2017
| 43 |
Notes to Financial Statements (continued)
April 30, 2017 (Unaudited)
Transfer agency fees
Under a Transfer and Dividend Disbursing Agent Agreement, Columbia Management Investment Services Corp. (the Transfer Agent), an affiliate of the Investment Manager and a wholly-owned subsidiary of Ameriprise Financial, is responsible for providing transfer agency services to the Fund. The Transfer Agent has contracted with Boston Financial Data Services (BFDS) to serve as sub-transfer agent. The Transfer Agent pays the fees of BFDS for services as sub-transfer agent and BFDS is not entitled to reimbursement for such fees from the Fund (with the exception of out-of-pocket fees).
The Fund pays the Transfer Agent a monthly transfer agency fee based on the number or the average value of accounts, depending on the type of account. In addition, the Fund pays the Transfer Agent a fee for shareholder services based on the number of accounts or on a percentage of the average aggregate value of the Fund’s shares maintained in omnibus accounts up to the lesser of the amount charged by the financial intermediary or a cap established by the Board of Trustees from time to time.
The Transfer Agent also receives compensation from the Fund for various shareholder services and reimbursements for certain out-of-pocket fees. Effective January 1, 2017, total transfer agency fees for Class K shares are subject to an annual limitation of not more than 0.075% of the average daily net assets attributable to Class K shares. Total transfer agency fees for Class I, prior to March 27, 2017 were, and Class Y shares are subject to an annual limitation of not more than 0.025% of the average daily net assets attributable to each share class. Prior to January 1, 2017, total transfer agency fees for Class K shares were subject to an annual limitation of not more than 0.05% of the average daily net assets attributable to Class K shares and Class I and Class Y shares did not pay transfer agency fees.
For the six months ended April 30, 2017, the Fund’s annualized effective transfer agency fee rates as a percentage of average daily net assets of each class were as follows:
| | Effective rate (%) |
| Class A | 0.26 |
| Class B | 0.26 |
| Class C | 0.26 |
| Class I | 0.019 (a),(b) |
| Class K | 0.066 |
| Class R | 0.26 |
| Class T | 0.26 |
| Class Y | 0.017 |
| Class Z | 0.26 |
| (a) | Annualized. |
| (b) | Effective March 27, 2017, Class I shares were redeemed or exchanged for Class Y shares. |
An annual minimum account balance fee of $20 may apply to certain accounts with a value below the applicable share class’s initial minimum investment requirements to reduce the impact of small accounts on transfer agency fees. These minimum account balance fees are remitted to the Fund and recorded as part of expense reductions in the Statement of Operations. For the six months ended April 30, 2017, no minimum account balance fees were charged by the Fund.
Plan administration fees
Under a Plan Administration Services Agreement with the Transfer Agent, the Fund pays an annual fee at a rate of 0.25% of the Fund’s average daily net assets attributable to Class K shares for the provision of various administrative, recordkeeping, communication and educational services.
Distribution and service fees
The Fund has an agreement with Columbia Management Investment Distributors, Inc. (the Distributor), an affiliate of the Investment Manager and a wholly-owned subsidiary of Ameriprise Financial, for distribution and shareholder services. Under a Plan and Agreement of Distribution, the Fund pays a fee at an annual rate of up to 0.25% of the Fund’s average daily net assets attributable to Class A and Class T shares, a fee at an annual rate of up to 0.50% of the Fund’s average daily net
| 44 | Columbia Global Bond Fund | Semiannual Report 2017 |
Notes to Financial Statements (continued)
April 30, 2017 (Unaudited)
assets attributable to Class R shares (of which up to 0.25% may be used for shareholder services) and a fee at an annual rate of up to 1.00% of the Fund’s average daily net assets attributable to Class B and Class C shares. For Class B and Class C shares, of the 1.00% fee, up to 0.75% is reimbursed for distribution expenses.
The amount of distribution and shareholder services expenses incurred by the Distributor and not yet reimbursed (unreimbursed expense) was approximately $561,000 and $72,000 for Class B and Class C shares, respectively. These amounts are based on the most recent information available as of March 31, 2017, and may be recovered from future payments under the distribution plan or CDSCs. To the extent the unreimbursed expense has been fully recovered, the distribution and/or shareholder services fee is reduced.
Sales charges
Sales charges, including front-end charges and CDSCs, received by the Distributor for distributing Fund shares for the six months ended April 30, 2017, if any, are listed below:
| | Amount ($) |
| Class A | 6,914 |
| Class C | 41 |
Expenses waived/reimbursed by the Investment Manager and its affiliates
The Investment Manager and certain of its affiliates have contractually agreed to waive fees and/or reimburse expenses (excluding certain fees and expenses described below) for the periods disclosed below, unless sooner terminated at the sole discretion of the Board of Trustees, so that the Fund’s net operating expenses, after giving effect to fees waived/expenses reimbursed and any balance credits and/or overdraft charges from the Fund’s custodian, do not exceed the following annual rates as a percentage of the class’ average daily net assets:
| | March 1, 2017
through
February 28, 2018 | Prior to
March 1, 2017 |
| Class A | 1.040% | 1.08% |
| Class B | 1.790 | 1.83 |
| Class C | 1.790 | 1.83 |
| Class K | 0.935 | 0.96 |
| Class R | 1.290 | 1.33 |
| Class T | 1.040 | 1.08 |
| Class Y | 0.635 | 0.66 |
| Class Z | 0.790 | 0.83 |
Under the agreement governing these fee waivers and/or expense reimbursement arrangements, the following fees and expenses are excluded from the waiver/reimbursement commitment, and therefore will be paid by the Fund, if applicable: taxes (including foreign transaction taxes), expenses associated with investments in affiliated and non-affiliated pooled investment vehicles (including mutual funds and exchange-traded funds), transaction costs and brokerage commissions, costs related to any securities lending program, dividend and interest expenses associated with securities sold short, inverse floater program fees and expenses, transaction charges and interest on borrowed money, interest, infrequent and/or unusual expenses and any other expenses the exclusion of which is specifically approved by the Board of Trustees. This agreement may be modified or amended only with approval from the Investment Manager, certain of its affiliates and the Fund. Any fees waived and/or expenses reimbursed under the expense reimbursement arrangements described above are not recoverable by the Investment Manager or its affiliates in future periods.
Note 4. Federal tax information
The timing and character of income and capital gain distributions are determined in accordance with income tax regulations, which may differ from GAAP because of temporary or permanent book to tax differences.
Columbia Global Bond Fund | Semiannual Report 2017
| 45 |
Notes to Financial Statements (continued)
April 30, 2017 (Unaudited)
At April 30, 2017, the approximate cost of investments for federal income tax purposes and the aggregate gross approximate unrealized appreciation and depreciation based on that cost was:
Federal
tax cost ($) | Gross unrealized
appreciation ($) | Gross unrealized
(depreciation) ($) | Net unrealized
appreciation ($) |
| 59,262,000 | 2,520,000 | (1,183,000) | 1,337,000 |
The following capital loss carryforwards, determined at October 31, 2016, may be available to reduce taxable income arising from future net realized gains on investments, if any, to the extent permitted by the Internal Revenue Code. Capital loss carryforwards with no expiration are required to be utilized prior to any capital losses which carry an expiration date. As a result of this ordering rule, capital loss carryforwards which carry an expiration date may be more likely to expire unused.
| 2017 ($) | 2018 ($) | 2019 ($) | No expiration
short-term ($) | No expiration
long-term ($) | Total ($) |
| — | — | — | 68,487 | 2,205,360 | 2,273,847 |
Management of the Fund has concluded that there are no significant uncertain tax positions in the Fund that would require recognition in the financial statements. However, management’s conclusion may be subject to review and adjustment at a later date based on factors including, but not limited to, new tax laws, regulations, and administrative interpretations (including relevant court decisions). Generally, the Fund’s federal tax returns for the prior three fiscal years remain subject to examination by the Internal Revenue Service.
Note 5. Portfolio information
The cost of purchases and proceeds from sales of securities, excluding short-term investments and derivatives, if any, aggregated to $30,075,963 and $45,543,441, respectively, for the six months ended April 30, 2017, of which $11,707,322 and $12,531,809, respectively, were U.S. government securities. The amount of purchase and sale activity impacts the portfolio turnover rate reported in the Financial Highlights.
Note 6. Affiliated money market fund
The Fund invests in Columbia Short-Term Cash Fund, an affiliated money market fund established for the exclusive use by the Fund and other affiliated funds (the Affiliated MMF). The income earned by the Fund from such investments is included as Dividends - affiliated issuers in the Statement of Operations. As an investing fund, the Fund indirectly bears its proportionate share of the expenses of the Affiliated MMF. The Affiliated MMF prices its shares with a floating net asset value. In addition, the Board of Trustees of the Affiliated MMF may impose a fee on redemptions (sometimes referred to as a liquidity fee) or temporarily suspend redemptions (sometimes referred to as imposing a redemption gate) in the event its liquidity falls below regulatory limits.
Note 7. Line of credit
The Fund has access to a revolving credit facility with a syndicate of banks led by Citibank, N.A., HSBC Bank USA, N.A. and JPMorgan Chase Bank, N.A. whereby the Fund may borrow for the temporary funding of shareholder redemptions or for other temporary or emergency purposes. The credit facility agreement, which is a collective agreement between the Fund and certain other funds managed by the Investment Manager, severally and not jointly, permits collective borrowings up to $1 billion. Interest is charged to each participating fund based on its borrowings at a rate equal to the higher of (i) the overnight federal funds rate plus 1.00% or (ii) the one-month LIBOR rate plus 1.00%. Each borrowing under the credit facility matures no later than 60 days after the date of borrowing. The Fund also pays a commitment fee equal to its pro rata share of the amount of the credit facility at a rate of 0.15% per annum. The commitment fee is included in other expenses in the Statement of Operations.
The Fund had no borrowings during the six months ended April 30, 2017.
| 46 | Columbia Global Bond Fund | Semiannual Report 2017 |
Notes to Financial Statements (continued)
April 30, 2017 (Unaudited)
Note 8. Significant risks
Credit risk
Credit risk is the risk that the value of debt securities in the Fund’s portfolio may decline because the issuer may default and fail to pay interest or repay principal when due. Rating agencies assign credit ratings to debt securities to indicate their credit risk. Lower rated or unrated debt securities held by the Fund may present increased credit risk as compared to higher-rated debt securities.
Derivatives risk
Losses involving derivative instruments may be substantial, because a relatively small price movement in the underlying security(ies), commodity, currency or index or other instrument or asset may result in a substantial loss for the Fund. In addition to the potential for increased losses, the use of derivative instruments may lead to increased volatility within the Fund. Derivatives will typically increase the Fund’s exposure to principal risks to which it is otherwise exposed, and may expose the Fund to additional risks, including correlation risk, counterparty risk, hedging risk, leverage risk and liquidity risk.
Foreign securities and emerging market countries risk
Investing in foreign securities may include certain risks and considerations not typically associated with investing in U.S. securities, such as fluctuating currency values and changing local and regional economic, political and social conditions, which may result in greater market volatility. In addition, certain foreign securities may not be as liquid as U.S. securities. Investing in emerging markets may accentuate these risks. These countries are also more likely to experience high levels of inflation, deflation or currency devaluation which could hurt their economies and securities markets. To the extent that the Fund concentrates its investment exposure to any one or a few specific countries, the Fund will be particularly susceptible to the various conditions, events or other factors impacting those countries and may, therefore, have a greater risk than that of a fund which is more geographically diversified.
Geographic concentration risk
The Fund may be particularly susceptible to economic, political, regulatory or other events or conditions affecting issuers and countries within the specific geographic regions in which the Fund invests. Currency devaluations could occur in countries that have not yet experienced currency devaluation to date, or could continue to occur in countries that have already experienced such devaluations. The Fund’s NAV may be more volatile than the NAV of a more geographically diversified fund.
High-yield investments risk
Securities and other debt instruments held by the Fund that are rated below investment grade (commonly called "high-yield" or "junk" bonds) and unrated debt instruments of comparable quality expose the Fund to a greater risk of loss of principal and income than a fund that invests solely or primarily in investment grade securities. In addition, these investments have greater price fluctuations, are less liquid and are more likely to experience a default than higher-rated debt instruments. High-yield debt instruments are considered to be predominantly speculative with respect to the issuer’s capacity to pay interest and repay principal.
Interest rate risk
Interest rate risk is the risk of losses attributable to changes in interest rates. In general, if prevailing interest rates rise, the values of debt securities tend to fall, and if interest rates fall, the values of debt securities tend to rise. Actions by governments and central banking authorities can result in increases in interest rates. Increasing interest rates may negatively affect the value of debt securities held by the Fund, resulting in a negative impact on the Fund’s performance and net asset value per share. In general, the longer the maturity or duration of a debt security, the greater its sensitivity to changes in interest rates.
Liquidity risk
Liquidity risk is the risk associated with a lack of marketability of investments which may make it difficult to sell the investment at a desirable time or price. Changing regulatory, market or other conditions or environments (for example, the interest rate or credit environments) may adversely affect the liquidity of the Fund’s investments. The Fund may have to
Columbia Global Bond Fund | Semiannual Report 2017
| 47 |
Notes to Financial Statements (continued)
April 30, 2017 (Unaudited)
accept a lower selling price for the holding, sell other investments, or forego another, more appealing investment opportunity. Generally, the less liquid the market at the time the Fund sells a portfolio investment, the greater the risk of loss or decline of value to the Fund. A less liquid market can lead to an increase in Fund redemptions, which may negatively impact Fund performance and net asset value per share, including, for example, if the Fund is forced to sell securities in a down market.
Non-diversification risk
A non-diversified fund is permitted to invest a greater percentage of its total assets in fewer issuers than a diversified fund. The Fund may, therefore, have a greater risk of loss from a few issuers than a similar fund that invests more broadly.
Shareholder concentration risk
At April 30, 2017, affiliated shareholders of record owned 88.7% of the outstanding shares of the Fund in one or more accounts. Subscription and redemption activity by concentrated accounts may have a significant effect on the operations of the Fund. In the case of a large redemption, the Fund may be forced to sell investments at inopportune times, including its liquid or more liquid positions, resulting in Fund losses and the Fund holding a higher percentage of less liquid or illiquid securities. Large redemptions could result in decreased economies of scale and increased operating expenses for non-redeeming Fund shareholders.
Note 9. Subsequent events
Management has evaluated the events and transactions that have occurred through the date the financial statements were issued. Other than as noted in Note 1 above, there were no items requiring adjustment of the financial statements or additional disclosure.
Note 10. Information regarding pending and settled legal proceedings
Ameriprise Financial and certain of its affiliates have historically been involved in a number of legal, arbitration and regulatory proceedings, including routine litigation, class actions, and governmental actions, concerning matters arising in connection with the conduct of their business activities. Ameriprise Financial believes that the Funds are not currently the subject of, and that neither Ameriprise Financial nor any of its affiliates are the subject of, any pending legal, arbitration or regulatory proceedings that are likely to have a material adverse effect on the Funds or the ability of Ameriprise Financial or its affiliates to perform under their contracts with the Funds. Ameriprise Financial is required to make quarterly (10-Q), annual (10-K) and, as necessary, 8-K filings with the Securities and Exchange Commission (SEC) on legal and regulatory matters that relate to Ameriprise Financial and its affiliates. Copies of these filings may be obtained by accessing the SEC website at www.sec.gov.
There can be no assurance that these matters, or the adverse publicity associated with them, will not result in increased fund redemptions, reduced sale of fund shares or other adverse consequences to the Funds. Further, although we believe proceedings are not likely to have a material adverse effect on the Funds or the ability of Ameriprise Financial or its affiliates to perform under their contracts with the Funds, these proceedings are subject to uncertainties and, as such, we are unable to estimate the possible loss or range of loss that may result. An adverse outcome in one or more of these proceedings could result in adverse judgments, settlements, fines, penalties or other relief that could have a material adverse effect on the consolidated financial condition or results of operations of Ameriprise Financial.
| 48 | Columbia Global Bond Fund | Semiannual Report 2017 |
The Fund mails one shareholder report to each shareholder address. If you would like more than one report, please call shareholder services at 800.345.6611 and additional reports will be sent to you.
Proxy voting policies and procedures
The policy of the Board of Trustees is to vote the proxies of the companies in which the Fund holds investments consistent with the procedures as stated in the Statement of Additional Information (SAI). You may obtain a copy of the SAI without charge by calling 800.345.6611; contacting your financial intermediary; visiting investor.columbiathreadneedleus.com; or searching the website of the Securities and Exchange Commission (SEC) at sec.gov. Information regarding how the Fund voted proxies relating to portfolio securities is filed with the SEC by August 31st for the most recent 12-month period ending June 30th of that year, and is available without charge by visiting investor.columbiathreadneedleus.com, or searching the website of the SEC at sec.gov.
Quarterly schedule of investments
The Fund files a complete schedule of portfolio holdings with the SEC for the first and third quarters of each fiscal year on Form N-Q. The Fund’s Form N-Q is available on the SEC’s website at sec.gov and may be reviewed and copied at the SEC’s Public Reference Room in Washington, D.C. Information on the operation of the Public Reference Room may be obtained by calling 800.SEC.0330. The Fund’s complete schedule of portfolio holdings, as filed on Form N-Q, can also be obtained without charge, upon request, by calling 800.345.6611.
Additional Fund information
For more information about the Fund, please visit investor.columbiathreadneedleus.com or call 800.345.6611. Customer Service Representatives are available to answer your questions Monday through Friday from 8 a.m. to 7 p.m. Eastern time.
Fund investment manager
Columbia Management Investment Advisers, LLC
225 Franklin Street
Boston, MA 02110
Fund distributor
Columbia Management Investment Distributors, Inc.
225 Franklin Street
Boston, MA 02110
Fund transfer agent
Columbia Management Investment Services Corp.
P.O. Box 8081
Boston, MA 02266-8081
Columbia Global Bond Fund | Semiannual Report 2017
| 49 |
Columbia Global Bond Fund
P.O. Box 8081
Boston, MA 02266-8081
Please read and consider the investment objectives, risks, charges and expenses for any fund carefully before investing. For a prospectus and summary prospectus, which contains this and other important information about the Fund, go to
investor.columbiathreadneedleus.com. The Fund is distributed by Columbia Management Investment Distributors, Inc., member FINRA, and managed by Columbia Management Investment Advisers, LLC.
Columbia Threadneedle Investments (Columbia Threadneedle) is the global brand name of the Columbia and Threadneedle group of companies. All rights reserved. Columbia Management Investment Distributors, Inc., 225 Franklin Street, Boston, MA 02110-2804
© 2017 Columbia Management Investment Advisers, LLC.
investor.columbiathreadneedleus.com

SemiAnnual Report
April 30, 2017
Columbia Absolute Return Currency and Income Fund
Not FDIC Insured • No bank guarantee • May lose value
Dear Shareholders,
While emotions have run high following the outcome of the U.S. Presidential election, it remains unclear how the Trump presidency will unfold in terms of policy. We have a sense of the priorities espoused by the President over the past eighteen months, but campaign priorities are not always realized and are often never pursued. What seems certain is that, while some investors have already priced expectations into the market, others have retreated, preferring instead a wait and see approach. The outcome of such behaviors appears to have created conditions ripe for ongoing market volatility.
While volatility in the financial markets can be stressful, volatility itself is not a new phenomenon. Other factors that have been at the root cause of recent volatility include uncertainty following the United Kingdom’s vote to exit the European Union (Brexit), speculation around the Federal Reserve’s decision to increase interest rates, divergent central bank policy and geopolitical unrest. The point is, financial markets have fluctuated for years and may be expected to continue to fluctuate — sometimes wildly. If anything, such volatility seems to be the new normal, perhaps exacerbated by access to information and development of technological tools which have enabled investors to react rapidly to real and perceived change. So what can you do?
Position your portfolio for the reality of market volatility
That there is a historical precedent for market volatility, or even an acceptance that it may persist, offers little comfort. A measured and strategic approach remains the best strategy for investors to stay on track in achieving their investment goals.
Step 1: Review your investment goals
Take this opportunity to review your investment goals and the strategies you are pursuing to achieve those goals in order to remain focused on what’s important to you. It is entirely possible that your goals have changed in response either to your life situation or to changes in the market. Accept what you can’t control — volatility, and focus on what you can — your investment goals and strategies.
Step 2: Reassess your risk tolerance
Sit down with your financial advisor to discuss your investment goals and strategies, as well as any changes to your tolerance for risk. Consider your investment horizon. Increased market volatility and a new investment horizon may impact the strategies that can best help you achieve your investment goals. Remember, achieving your investment goals may require a certain amount of risk. Ultimately, you must maintain vigilance in reassessing your risk tolerance and the strategies you have selected in pursuit of your investment goals, and awareness of how those strategies may react to market volatility.
Step 3: Remain calm and focus on your long-term plan
Remember, investing is about the long game. Short term events are not necessarily evidence of a longer term reality. Investors who attempt to time the market too often end up reacting to a down turn by selling low and then compounding the problem by waiting on the sidelines, ultimately missing the right opportunity to reinvest.
Columbia Absolute Return Currency and Income Fund | Semiannual Report 2017
President’s Message (continued)
As long as there is a market, there will be volatility. How you respond to that volatility can make a big difference in the measure of your success as an investor. Talk to your financial advisor about how working with Columbia Threadneedle Investments may help you position your portfolio for the reality of ongoing volatility and, perhaps, even turn such volatility into investment opportunity.
Sincerely,
Christopher O. Petersen
President, Columbia Funds
Investors should consider the investment objectives, risks, charges and expenses of a mutual fund carefully before investing. For a free prospectus and summary prospectus, which contains this and other important information about a fund, visit investor.columbiathreadneedleus.com. The prospectus should be read carefully before investing.
Columbia Funds are distributed by Columbia Management Investment Distributors, Inc., member FINRA, and managed by Columbia Management Investment Advisers, LLC.
© 2017 Columbia Management Investment Advisers, LLC. All rights reserved.
Columbia Absolute Return Currency and Income Fund | Semiannual Report 2017
Columbia Absolute Return Currency and Income Fund | Semiannual Report 2017
Fund at a Glance
(Unaudited)
Investment objective
Columbia Absolute Return Currency and Income Fund (the Fund) seeks to provide shareholders with positive absolute return.
Portfolio management
Nicholas Pifer, CFA
Co-manager
Managed Fund since 2006
Timothy Flanagan, CFA
Co-manager
Managed Fund since 2016
| Average annual total returns (%) (for the period ended April 30, 2017) |
| | | Inception | 6 Months
cumulative | 1 Year | 5 Years | 10 Years |
| Class A | Excluding sales charges | 06/15/06 | 2.95 | 3.15 | 4.61 | 2.91 |
| | Including sales charges | | -0.16 | 0.03 | 3.97 | 2.60 |
| Class B | Excluding sales charges | 06/15/06 | 2.40 | 2.29 | 3.82 | 2.16 |
| | Including sales charges | | -2.60 | -2.70 | 3.47 | 2.16 |
| Class C | Excluding sales charges | 06/15/06 | 2.50 | 2.30 | 3.82 | 2.16 |
| | Including sales charges | | 1.50 | 1.30 | 3.82 | 2.16 |
| Class R4 * | 03/19/13 | 2.93 | 3.31 | 4.83 | 3.02 |
| Class R5 * | 06/25/14 | 3.09 | 3.46 | 4.80 | 3.00 |
| Class T | Excluding sales charges | 12/01/06 | 2.88 | 3.07 | 4.55 | 2.86 |
| | Including sales charges | | 0.31 | 0.49 | 4.03 | 2.60 |
| Class Y * | 02/28/13 | 3.07 | 3.54 | 4.95 | 3.07 |
| Class Z * | 09/27/10 | 3.04 | 3.42 | 4.87 | 3.10 |
| Citi One-Month U.S. Treasury Bill Index | | 0.22 | 0.32 | 0.10 | 0.50 |
Returns for Class A are shown with and without the maximum initial sales charge of 3.00%. Returns for Class B are shown with and without the applicable contingent deferred sales charge (CDSC) of 5.00% in the first year, declining to 1.00% in the sixth year and eliminated thereafter. The Fund does not accept new investments in Class B shares, except for certain limited transactions. The Fund’s current Class B investors, having held their shares for the requisite time period, are no longer subject to a CDSC upon redemption of their shares. Returns for Class C are shown with and without the 1.00% CDSC for the first year only. The returns for Class T shares are shown with and without the maximum applicable sales charge of 2.50% per transaction. Prior to March 27, 2017, Class T shares were known as Class W shares and were sold without a sales charge. The Fund’s other classes are not subject to sales charges and have limited eligibility. Please see the Fund’s prospectus for details. Performance for different share classes will vary based on differences in sales charges and fees associated with each class. All results shown assume reinvestment of distributions during the period. Returns do not reflect the deduction of taxes that a shareholder may pay on Fund distributions or on the redemption of Fund shares. Performance results reflect the effect of any fee waivers or reimbursements of Fund expenses by Columbia Management Investment Advisers, LLC and/or any of its affiliates. Absent these fee waivers or expense reimbursement arrangements, performance results would have been lower.
The performance information shown represents past performance and is not a guarantee of future results. The investment return and principal value of your investment will fluctuate so that your shares, when redeemed, may be worth more or less than their original cost. Current performance may be lower or higher than the performance information shown. You may obtain performance information current to the most recent month-end by contacting your financial intermediary, visiting investor.columbiathreadneedleus.com or calling 800.345.6611.
| * | The returns shown for periods prior to the share class inception date (including returns for the Life of the Fund, if shown, which are since Fund inception) include the returns of the Fund’s oldest share class. Since the Fund launched more than one share class at its inception, Class A shares were used. These returns are adjusted to reflect any higher class-related operating expenses of the newer share classes, as applicable. Please visit investor.columbiathreadneedleus.com/investment-products/mutual-funds/appended-performance for more information. |
The Citi One-Month U.S. Treasury Bill Index, an unmanaged index, that measures the rate of return for 30-day U.S. Treasury Bills.
Indices are not available for investment, are not professionally managed and do not reflect sales charges, fees, brokerage commissions, taxes or other expenses of investing. Securities in the Fund may not match those in an index.
Columbia Absolute Return Currency and Income Fund | Semiannual Report 2017
| 3 |
Fund at a Glance (continued)
(Unaudited)
| Portfolio breakdown (%) (at April 30, 2017) |
| Asset-Backed Securities — Non-Agency | 1.2 |
| Money Market Funds(a) | 98.8 |
| Total | 100.0 |
| (a) | Includes investments in Money Market Funds (amounting to $62.1 million) which have been segregated to cover obligations relating to the Fund’s investment in derivatives which provide exposure to multiple markets. For a description of the Fund’s investments in derivatives, see Investments in Derivatives following the Portfolio of Investments and Note 2 to the Notes to Financial Statements. |
Percentages indicated are based upon total investments. The Fund’s portfolio composition is subject to change.
| Quality breakdown (%) (at April 30, 2017) |
| AAA rating | 100.0 |
| Total | 100.0 |
Percentages indicated are based upon total fixed income investments (excluding Money Market Funds).
Bond ratings apply to the underlying holdings of the Fund and not the Fund itself and are divided into categories ranging from highest to lowest credit quality, determined by using the middle rating of Moody’s, S&P and Fitch, after dropping the highest and lowest available ratings. When ratings are available from only two rating agencies, the lower rating is used. When a rating is available from only one rating agency, that rating is used. When a bond is not rated by any rating agency, it is designated as “Not rated.” Credit quality ratings assigned by a rating agency are subjective opinions, not statements of fact, and are subject to change, including daily. The ratings assigned by credit rating agencies are but one of the considerations that the Investment Manager and/or Fund’s subadviser incorporates into its credit analysis process, along with such other issuer-specific factors as cash flows, capital structure and leverage ratios, ability to de-leverage (repay) through free cash flow, quality of management, market positioning
and access to capital, as well as such security-specific factors as the terms of the security (e.g., interest rate and time to maturity) and the amount and type of any collateral.
| Notional market value (in USD) of forward foreign currency contracts exposure (% of net assets) (at April 30, 2017) | |
| Currencies Long | |
| Australian Dollar | 153.9 |
| Norwegian Krone | 134.7 |
| British Pound | 78.4 |
| Japanese Yen | 62.5 |
| Swiss Franc | 45.3 |
| Euro | 43.9 |
| Swedish Krona | 42.9 |
| New Zealand Dollar | 42.5 |
| Canadian Dollar | 38.2 |
| Currencies Short | |
| Swedish Krona | (42.5) |
| New Zealand Dollar | (42.9) |
| Euro | (44.5) |
| Australian Dollar | (58.4) |
| Norwegian Krone | (78.4) |
| Swiss Franc | (82.9) |
| Japanese Yen | (121.2) |
| British Pound | (171.5) |
| 4 | Columbia Absolute Return Currency and Income Fund | Semiannual Report 2017 |
Understanding Your Fund’s Expenses
(Unaudited)
As an investor, you incur two types of costs. There are transaction costs, which generally include sales charges on purchases and may include redemption fees. There are also ongoing costs, which generally include management fees, distribution and/or service fees, and other fund expenses. The following information is intended to help you understand your ongoing costs (in dollars) of investing in the Fund and to help you compare these costs with the ongoing costs of investing in other mutual funds.
Analyzing your Fund’s expenses
To illustrate these ongoing costs, we have provided examples and calculated the expenses paid by investors in each share class of the Fund during the period. The actual and hypothetical information in the table is based on an initial investment of $1,000 at the beginning of the period indicated and held for the entire period. Expense information is calculated two ways and each method provides you with different information. The amount listed in the “Actual” column is calculated using the Fund’s actual operating expenses and total return for the period. You may use the Actual information, together with the amount invested, to estimate the expenses that you paid over the period. Simply divide your account value by $1,000 (for example, an $8,600 account value divided by $1,000 = 8.6), then multiply the results by the expenses paid during the period under the “Actual” column. The amount listed in the “Hypothetical” column assumes a 5% annual rate of return before expenses (which is not the Fund’s actual return) and then applies the Fund’s actual expense ratio for the period to the hypothetical return. You should not use the hypothetical account values and expenses to estimate either your actual account balance at the end of the period or the expenses you paid during the period. See “Compare with other funds” below for details on how to use the hypothetical data.
Compare with other funds
Since all mutual funds are required to include the same hypothetical calculations about expenses in shareholder reports, you can use this information to compare the ongoing cost of investing in the Fund with other funds. To do so, compare the hypothetical example with the 5% hypothetical examples that appear in the shareholder reports of other funds. As you compare hypothetical examples of other funds, it is important to note that hypothetical examples are meant to highlight the ongoing costs of investing in a fund only and do not reflect any transaction costs, such as sales charges, or redemption or exchange fees. Therefore, the hypothetical calculations are useful in comparing ongoing costs only, and will not help you determine the relative total costs of owning different funds. If transaction costs were included in these calculations, your costs would be higher.
| November 1, 2016 — April 30, 2017 |
| | Account value at the
beginning of the
period ($) | Account value at the
end of the
period ($) | Expenses paid during
the period ($) | Fund’s annualized
expense ratio (%) |
| | Actual | Hypothetical | Actual | Hypothetical | Actual | Hypothetical | Actual |
| Class A | 1,000.00 | 1,000.00 | 1,029.50 | 1,016.28 | 8.36 | 8.31 | 1.68 |
| Class B | 1,000.00 | 1,000.00 | 1,024.00 | 1,012.70 | 11.96 | 11.89 | 2.41 |
| Class C | 1,000.00 | 1,000.00 | 1,025.00 | 1,012.55 | 12.12 | 12.04 | 2.44 |
| Class R4 | 1,000.00 | 1,000.00 | 1,029.30 | 1,017.46 | 7.17 | 7.12 | 1.44 |
| Class R5 | 1,000.00 | 1,000.00 | 1,030.90 | 1,017.95 | 6.67 | 6.63 | 1.34 |
| Class T (formerly Class W) | 1,000.00 | 1,000.00 | 1,028.80 | 1,016.23 | 8.41 | 8.36 | 1.69 |
| Class Y | 1,000.00 | 1,000.00 | 1,030.70 | 1,018.00 | 6.62 | 6.58 | 1.33 |
| Class Z | 1,000.00 | 1,000.00 | 1,030.40 | 1,017.36 | 7.27 | 7.22 | 1.46 |
Expenses paid during the period are equal to the annualized expense ratio for each class as indicated above, multiplied by the average account value over the period and then multiplied by the number of days in the Fund’s most recent fiscal half year and divided by 365.
Expenses do not include fees and expenses incurred indirectly by the Fund from its investment in underlying funds, including affiliated and non-affiliated pooled investment vehicles, such as mutual funds and exchange-traded funds.
Columbia Absolute Return Currency and Income Fund | Semiannual Report 2017
| 5 |
Portfolio of Investments
April 30, 2017 (Unaudited)
(Percentages represent value of investments compared to net assets)
| Asset-Backed Securities — Non-Agency 1.2% |
| Issuer | Coupon
Rate | | Principal
Amount ($) | Value ($) |
| Northstar Education Finance, Inc.(a) |
| Series 2007-1 Class A2 |
| 01/29/46 | 1.922% | | 750,000 | 723,984 |
Total Asset-Backed Securities — Non-Agency
(Cost $746,953) | 723,984 |
| Money Market Funds 101.3% |
| | Shares | Value ($) |
| Columbia Short-Term Cash Fund, 0.869%(b),(c) | 62,142,075 | 62,142,075 |
Total Money Market Funds
(Cost $62,142,058) | 62,142,075 |
Total Investments
(Cost: $62,889,011) | 62,866,059 |
| Other Assets & Liabilities, Net | | (1,535,550) |
| Net Assets | 61,330,509 |
Investments in derivatives
| Forward foreign currency exchange contracts open at April 30, 2017 |
| Counterparty | Exchange
date | Currency to
be delivered | Currency to
be received | Unrealized
appreciation ($) | Unrealized
depreciation ($) |
| Barclays | 5/10/2017 | 11,059,000 CHF | 11,139,988 USD | 19,356 | — |
| Barclays | 5/10/2017 | 39,996,000 CHF | 39,696,150 USD | — | (522,749) |
| Barclays | 5/10/2017 | 27,141,155 USD | 27,078,000 CHF | 87,752 | — |
| Barclays | 5/10/2017 | 613,460 USD | 609,000 CHF | — | (1,066) |
| BNP Paribas | 5/10/2017 | 83,784,000 GBP | 105,162,575 USD | — | (3,380,094) |
| BNP Paribas | 5/10/2017 | 8,070,146,000 JPY | 74,331,993 USD | 1,915,741 | — |
| BNP Paribas | 5/10/2017 | 48,077,746 USD | 37,902,000 GBP | 1,024,520 | — |
| BNP Paribas | 5/10/2017 | 38,339,977 USD | 4,187,601,000 JPY | — | (763,163) |
| Citi | 5/10/2017 | 236,303,000 SEK | 26,079,274 USD | — | (611,346) |
| Citi | 5/10/2017 | 26,323,531 USD | 236,303,000 SEK | 367,088 | — |
| Deutsche Bank | 5/10/2017 | 47,605,000 AUD | 35,847,190 USD | 205,899 | — |
| Deutsche Bank | 5/10/2017 | 411,419,000 NOK | 48,072,814 USD | 150,239 | — |
| Deutsche Bank | 5/10/2017 | 38,994,406 USD | 52,103,000 AUD | 14,483 | — |
| Deutsche Bank | 5/10/2017 | 55,382,586 USD | 73,107,000 AUD | — | (648,254) |
| Deutsche Bank | 5/10/2017 | 65,101,250 USD | 562,439,000 NOK | 412,314 | — |
| Deutsche Bank | 5/10/2017 | 17,497,278 USD | 149,517,000 NOK | — | (81,360) |
| Morgan Stanley | 5/10/2017 | 37,480,000 NZD | 26,307,362 USD | 579,091 | — |
| Morgan Stanley | 5/10/2017 | 23,458,913 USD | 31,582,000 CAD | — | (320,141) |
| Morgan Stanley | 5/10/2017 | 26,046,164 USD | 37,480,000 NZD | — | (317,893) |
| UBS | 5/10/2017 | 25,235,000 EUR | 27,310,067 USD | — | (189,991) |
| UBS | 5/10/2017 | 26,917,373 USD | 25,235,000 EUR | 582,685 | — |
| Total | | | | 5,359,168 | (6,836,057) |
The accompanying Notes to Financial Statements are an integral part of this statement.
| 6 | Columbia Absolute Return Currency and Income Fund | Semiannual Report 2017 |
Portfolio of Investments (continued)
April 30, 2017 (Unaudited)
Notes to Portfolio of Investments
| (a) | Variable rate security. |
| (b) | The rate shown is the seven-day current annualized yield at April 30, 2017. |
| (c) | As defined in the Investment Company Act of 1940, an affiliated company is one in which the Fund owns 5% or more of the company’s outstanding voting securities, or a company which is under common ownership or control with the Fund. Holdings and transactions in these affiliated companies during the period ended April 30, 2017 are as follows: |
| Issuer | Beginning
shares | Shares
purchased | Shares
sold | Ending
shares | Realized gain
(loss) ($) | Dividends —
affiliated
issuers($) | Value ($) |
| Columbia Short-Term Cash Fund, 0.869% | 66,611,700 | 29,040,264 | (33,509,889) | 62,142,075 | (44) | 199,311 | 62,142,075 |
Currency Legend
| AUD | Australian Dollar |
| CAD | Canada Dollar |
| CHF | Swiss Franc |
| EUR | Euro |
| GBP | British Pound |
| JPY | Japanese Yen |
| NOK | Norwegian Krone |
| NZD | New Zealand Dollar |
| SEK | Swedish Krona |
| USD | US Dollar |
Fair value measurements
The Fund categorizes its fair value measurements according to a three-level hierarchy that maximizes the use of observable inputs and minimizes the use of unobservable inputs by prioritizing that the most observable input be used when available. Observable inputs are those that market participants would use in pricing an investment based on market data obtained from sources independent of the reporting entity. Unobservable inputs are those that reflect the Fund’s assumptions about the information market participants would use in pricing an investment. An investment’s level within the fair value hierarchy is based on the lowest level of any input that is deemed significant to the asset’s or liability’s fair value measurement. The input levels are not necessarily an indication of the risk or liquidity associated with investments at that level. For example, certain U.S. government securities are generally high quality and liquid, however, they are reflected as Level 2 because the inputs used to determine fair value may not always be quoted prices in an active market.
Fair value inputs are summarized in the three broad levels listed below:
| • | Level 1 – Valuations based on quoted prices for investments in active markets that the Fund has the ability to access at the measurement date (including NAV for open-end mutual funds). Valuation adjustments are not applied to Level 1 investments. |
| • | Level 2 – Valuations based on other significant observable inputs (including quoted prices for similar securities, interest rates, prepayment speeds, credit risks, etc.). |
| • | Level 3 – Valuations based on significant unobservable inputs (including the Fund’s own assumptions and judgment in determining the fair value of investments). |
Inputs that are used in determining fair value of an investment may include price information, credit data, volatility statistics, and other factors. These inputs can be either observable or unobservable. The availability of observable inputs can vary between investments, and is affected by various factors such as the type of investment, and the volume and level of activity for that investment or similar investments in the marketplace. The inputs will be considered by the Investment Manager, along with any other relevant factors in the calculation of an investment’s fair value. The Fund uses prices and inputs that are current as of the measurement date, which may include periods of market dislocations. During these periods, the availability of prices and inputs may be reduced for many investments. This condition could cause an investment to be reclassified between the various levels within the hierarchy.
Certain investments that have been measured at fair value using the net asset value (NAV) per share (or its equivalent) are not categorized in the fair value hierarchy. The fair value amounts presented in the table are intended to reconcile the fair value hierarchy to the amounts presented in the Portfolio of Investments. The Columbia Short-Term Cash Fund seeks to provide shareholders with maximum current income consistent with liquidity and stability of principal. Columbia Short-Term Cash Fund prices its shares with a floating NAV and no longer seeks to maintain a stable NAV.
Investments falling into the Level 3 category are primarily supported by quoted prices from brokers and dealers participating in the market for those investments. However, these may be classified as Level 3 investments due to lack of market transparency and corroboration to support these quoted prices. Additionally, valuation models may be used as the pricing source for any remaining investments classified as Level 3. These models may rely on one or more significant unobservable inputs and/or significant assumptions by the Investment Manager. Inputs used in valuations may include, but are not limited to, financial statement analysis, capital account balances, discount rates and estimated cash flows, and comparable company data.
Under the direction of the Fund’s Board of Trustees (the Board), the Investment Manager’s Valuation Committee (the Committee) is responsible for overseeing the valuation procedures approved by the Board. The Committee consists of voting and non-voting members from various groups within the Investment Manager’s organization, including operations and accounting, trading and investments, compliance, risk management and legal.
The Committee meets at least monthly to review and approve valuation matters, which may include a description of specific valuation determinations, data regarding pricing information received from approved pricing vendors and brokers and the results of Board-approved valuation control policies and procedures (the Policies). The Policies address, among other things, instances when market quotations are or are not readily available, including recommendations of third party pricing vendors and a determination of appropriate pricing methodologies; events that require specific valuation determinations and assessment of fair value techniques; securities with a potential for stale pricing, including those that are illiquid, restricted, or in default; and the effectiveness of third party pricing vendors, including periodic reviews of vendors. The Committee meets more frequently, as needed, to discuss
The accompanying Notes to Financial Statements are an integral part of this statement.
Columbia Absolute Return Currency and Income Fund | Semiannual Report 2017
| 7 |
Portfolio of Investments (continued)
April 30, 2017 (Unaudited)
Fair value measurements (continued)
additional valuation matters, which may include the need to review back-testing results, review time-sensitive information or approve related valuation actions. The Committee reports to the Board, with members of the Committee meeting with the Board at each of its regularly scheduled meetings to discuss valuation matters and actions during the period, similar to those described earlier.
For investments categorized as Level 3, the Committee monitors information similar to that described above, which may include: (i) data specific to the issuer or comparable issuers, (ii) general market or specific sector news and (iii) quoted prices and specific or similar security transactions. The Committee considers this data and any changes from prior periods in order to assess the reasonableness of observable and unobservable inputs, any assumptions or internal models used to value those securities and changes in fair value. This data is also used to corroborate, when available, information received from approved pricing vendors and brokers. Various factors impact the frequency of monitoring this information (which may occur as often as daily). However, the Committee may determine that changes to inputs, assumptions and models are not required as a result of the monitoring procedures performed.
The following table is a summary of the inputs used to value the Fund’s investments at April 30, 2017:
| | Level 1
quoted prices
in active
markets for
identical
assets ($) | Level 2
other
significant
observable
inputs ($) | Level 3
significant
unobservable
inputs ($) | Investments
measured at
net asset
value ($) | Total ($) |
| Investments | | | | | |
| Asset-Backed Securities — Non-Agency | — | 723,984 | — | — | 723,984 |
| Money Market Funds | — | — | — | 62,142,075 | 62,142,075 |
| Total Investments | — | 723,984 | — | 62,142,075 | 62,866,059 |
| Derivatives | | | | | |
| Asset | | | | | |
| Forward Foreign Currency Exchange Contracts | — | 5,359,168 | — | — | 5,359,168 |
| Liability | | | | | |
| Forward Foreign Currency Exchange Contracts | — | (6,836,057) | — | — | (6,836,057) |
| Total | — | (752,905) | — | 62,142,075 | 61,389,170 |
See the Portfolio of Investments for all investment classifications not indicated in the table.
The Fund’s assets assigned to the Level 2 input category are generally valued using the market approach, in which a security’s value is determined through reference to prices and information from market transactions for similar or identical assets.
Derivative instruments are valued at unrealized appreciation (depreciation).
There were no transfers of financial assets between levels during the period.
The accompanying Notes to Financial Statements are an integral part of this statement.
| 8 | Columbia Absolute Return Currency and Income Fund | Semiannual Report 2017 |
Statement of Assets and Liabilities
April 30, 2017 (Unaudited)
| Assets | |
| Investments, at cost | |
| Unaffiliated issuers, at cost | $746,953 |
| Affiliated issuers, at cost | 62,142,058 |
| Total investments, at cost | 62,889,011 |
| Investments, at value | |
| Unaffiliated issuers, at value | 723,984 |
| Affiliated issuers, at value | 62,142,075 |
| Total investments, at value | 62,866,059 |
| Unrealized appreciation on forward foreign currency exchange contracts | 5,359,168 |
| Receivable for: | |
| Capital shares sold | 34,686 |
| Dividends | 40,030 |
| Interest | 40 |
| Prepaid expenses | 615 |
| Other assets | 29,546 |
| Total assets | 68,330,144 |
| Liabilities | |
| Due to custodian | 51,633 |
| Unrealized depreciation on forward foreign currency exchange contracts | 6,836,057 |
| Payable for: | |
| Capital shares purchased | 54,901 |
| Management services fees | 1,631 |
| Distribution and/or service fees | 170 |
| Transfer agent fees | 3,753 |
| Compensation of board members | 29,258 |
| Other expenses | 22,232 |
| Total liabilities | 6,999,635 |
| Net assets applicable to outstanding capital stock | $61,330,509 |
| Represented by | |
| Paid in capital | 59,509,389 |
| Excess of distributions over net investment income | (291,850) |
| Accumulated net realized gain | 3,612,811 |
| Unrealized appreciation (depreciation) on: | |
| Investments - unaffiliated issuers | (22,969) |
| Investments - affiliated issuers | 17 |
| Forward foreign currency exchange contracts | (1,476,889) |
| Total - representing net assets applicable to outstanding capital stock | $61,330,509 |
The accompanying Notes to Financial Statements are an integral part of this statement.
Columbia Absolute Return Currency and Income Fund | Semiannual Report 2017
| 9 |
Statement of Assets and Liabilities (continued)
April 30, 2017 (Unaudited)
| Class A | |
| Net assets | $12,219,618 |
| Shares outstanding | 1,150,021 |
| Net asset value per share | $10.63 |
| Maximum offering price per share(a) | $10.96 |
| Class B | |
| Net assets | $14,820 |
| Shares outstanding | 1,489 |
| Net asset value per share | $9.95 |
| Class C | |
| Net assets | $3,239,853 |
| Shares outstanding | 325,864 |
| Net asset value per share | $9.94 |
| Class R4 | |
| Net assets | $708,206 |
| Shares outstanding | 64,654 |
| Net asset value per share | $10.95 |
| Class R5 | |
| Net assets | $2,484,819 |
| Shares outstanding | 225,524 |
| Net asset value per share | $11.02 |
| Class T(b) | |
| Net assets | $64,622 |
| Shares outstanding | 6,111 |
| Net asset value per share | $10.57 |
| Maximum offering price per share(c) | $10.84 |
| Class Y | |
| Net assets | $25,543,964 |
| Shares outstanding | 2,322,457 |
| Net asset value per share | $11.00 |
| Class Z | |
| Net assets | $17,054,607 |
| Shares outstanding | 1,557,253 |
| Net asset value per share | $10.95 |
| (a) | The maximum offering price per share is calculated by dividing the net asset value per share by 1.0 minus the maximum sales charge of 3.00% for Class A. |
| (b) | Effective March 27, 2017, Class W shares were renamed Class T shares. |
| (c) | The maximum offering price per share is calculated by dividing the net asset value per share by 1.0 minus the maximum sales charge of 2.50% for Class T. |
The accompanying Notes to Financial Statements are an integral part of this statement.
| 10 | Columbia Absolute Return Currency and Income Fund | Semiannual Report 2017 |
Statement of Operations
Six Months Ended April 30, 2017 (Unaudited)
| Net investment income | |
| Income: | |
| Dividends — affiliated issuers | $199,311 |
| Interest | 6,470 |
| Total income | 205,781 |
| Expenses: | |
| Management services fees | 304,525 |
| Distribution and/or service fees | |
| Class A | 22,828 |
| Class B | 80 |
| Class C | 15,470 |
| Class T(a) | 82 |
| Transfer agent fees | |
| Class A | 13,369 |
| Class B | 12 |
| Class C | 2,283 |
| Class I(b) | 669 |
| Class R4 | 481 |
| Class R5 | 579 |
| Class T(a) | 48 |
| Class Y | 277 |
| Class Z | 9,563 |
| Compensation of board members | 7,164 |
| Custodian fees | 2,534 |
| Printing and postage fees | 9,546 |
| Registration fees | 53,676 |
| Audit fees | 18,841 |
| Legal fees | 3,481 |
| Compensation of chief compliance officer | 7 |
| Other | 5,853 |
| Total expenses | 471,368 |
| Net investment loss | (265,587) |
| Realized and unrealized gain (loss) — net | |
| Net realized gain (loss) on: | |
| Investments — unaffiliated issuers | 23,924 |
| Investments — affiliated issuers | (44) |
| Foreign currency translations | (223,253) |
| Forward foreign currency exchange contracts | 3,889,014 |
| Net realized gain | 3,689,641 |
| Net change in unrealized appreciation (depreciation) on: | |
| Investments — unaffiliated issuers | 27,253 |
| Investments — affiliated issuers | 17 |
| Forward foreign currency exchange contracts | (1,523,120) |
| Net change in unrealized appreciation (depreciation) | (1,495,850) |
| Net realized and unrealized gain | 2,193,791 |
| Net increase in net assets resulting from operations | $1,928,204 |
| (a) | Effective March 27, 2017, Class W shares were renamed Class T shares. |
| (b) | Effective March 27, 2017, Class I shares were redeemed or exchanged for Class Y shares. |
The accompanying Notes to Financial Statements are an integral part of this statement.
Columbia Absolute Return Currency and Income Fund | Semiannual Report 2017
| 11 |
Statement of Changes in Net Assets
| | Six Months Ended
April 30, 2017
(Unaudited) | Year Ended
October 31, 2016 |
| Operations | | |
| Net investment loss | $(265,587) | $(713,098) |
| Net realized gain | 3,689,641 | 2,244,954 |
| Net change in unrealized appreciation (depreciation) | (1,495,850) | 221,000 |
| Net increase in net assets resulting from operations | 1,928,204 | 1,752,856 |
| Distributions to shareholders | | |
| Net investment income | | |
| Class A | — | (861,209) |
| Class B | — | (2,086) |
| Class C | — | (109,871) |
| Class I(a) | — | (1,215,601) |
| Class R4 | — | (17,685) |
| Class R5 | — | (15,968) |
| Class T(b) | — | (3,542) |
| Class Y | — | (566) |
| Class Z | — | (419,730) |
| Net realized gains | | |
| Class A | (505,619) | (1,727,785) |
| Class B | (822) | (4,987) |
| Class C | (81,680) | (262,698) |
| Class I(a) | (741,281) | (2,254,954) |
| Class R4 | (18,357) | (33,743) |
| Class R5 | (96,019) | (29,977) |
| Class T(b) | (1,638) | (7,106) |
| Class Y | (319) | (1,051) |
| Class Z | (319,615) | (799,217) |
| Total distributions to shareholders | (1,765,350) | (7,767,776) |
| Increase (decrease) in net assets from capital stock activity | (5,613,911) | 18,035,854 |
| Total increase (decrease) in net assets | (5,451,057) | 12,020,934 |
| Net assets at beginning of period | 66,781,566 | 54,760,632 |
| Net assets at end of period | $61,330,509 | $66,781,566 |
| Excess of distributions over net investment income | $(291,850) | $(26,263) |
| (a) | Effective March 27, 2017, Class I shares were redeemed or exchanged for Class Y shares. |
| (b) | Effective March 27, 2017, Class W shares were renamed Class T shares. |
The accompanying Notes to Financial Statements are an integral part of this statement.
| 12 | Columbia Absolute Return Currency and Income Fund | Semiannual Report 2017 |
Statement of Changes in Net Assets (continued)
| | Six Months Ended | Year Ended |
| | April 30, 2017 (Unaudited) | October 31, 2016 |
| | Shares | Dollars ($) | Shares | Dollars ($) |
| Capital stock activity |
| Class A | | | | |
| Subscriptions (a) | 339,383 | 3,644,857 | 1,328,009 | 14,435,631 |
| Distributions reinvested | 47,674 | 494,863 | 245,434 | 2,559,874 |
| Redemptions | (1,185,067) | (12,690,442) | (946,157) | (9,939,991) |
| Net increase (decrease) | (798,010) | (8,550,722) | 627,286 | 7,055,514 |
| Class B | | | | |
| Subscriptions | 504 | 5,014 | — | — |
| Distributions reinvested | 60 | 582 | 572 | 5,647 |
| Redemptions (a) | (2,582) | (25,247) | (2,361) | (23,647) |
| Net decrease | (2,018) | (19,651) | (1,789) | (18,000) |
| Class C | | | | |
| Subscriptions | 88,850 | 894,433 | 144,678 | 1,474,895 |
| Distributions reinvested | 7,909 | 77,031 | 36,986 | 364,678 |
| Redemptions | (88,994) | (883,435) | (92,020) | (910,496) |
| Net increase | 7,765 | 88,029 | 89,644 | 929,077 |
| Class I(b) | | | | |
| Subscriptions | 33,826 | 382,260 | 47,938 | 523,254 |
| Distributions reinvested | 68,926 | 740,956 | 321,492 | 3,468,903 |
| Redemptions | (2,516,318) | (27,907,111) | (232,289) | (2,607,227) |
| Net increase (decrease) | (2,413,566) | (26,783,895) | 137,141 | 1,384,930 |
| Class R4 | | | | |
| Subscriptions | 16,285 | 180,648 | 20,944 | 229,539 |
| Distributions reinvested | 1,687 | 18,054 | 4,639 | 49,824 |
| Redemptions | (7,543) | (83,153) | (1,759) | (19,090) |
| Net increase | 10,429 | 115,549 | 23,824 | 260,273 |
| Class R5 | | | | |
| Subscriptions | 245,478 | 2,693,837 | 296,755 | 3,268,026 |
| Distributions reinvested | 8,895 | 95,710 | 4,110 | 44,345 |
| Redemptions | (348,074) | (3,793,777) | (13,411) | (150,122) |
| Net increase (decrease) | (93,701) | (1,004,230) | 287,454 | 3,162,249 |
| Class T(c) | | | | |
| Distributions reinvested | 131 | 1,354 | 869 | 9,025 |
| Redemptions | (615) | (6,598) | (1,302) | (13,688) |
| Net decrease | (484) | (5,244) | (433) | (4,663) |
| Class Y(b) | | | | |
| Subscriptions | 2,338,186 | 25,883,927 | — | — |
| Redemptions | (16,759) | (186,286) | — | — |
| Net increase | 2,321,427 | 25,697,641 | — | — |
| Class Z | | | | |
| Subscriptions | 903,349 | 10,014,366 | 1,602,635 | 17,474,134 |
| Distributions reinvested | 18,178 | 194,323 | 81,839 | 878,129 |
| Redemptions | (483,956) | (5,360,077) | (1,211,088) | (13,085,789) |
| Net increase | 437,571 | 4,848,612 | 473,386 | 5,266,474 |
| Total net increase (decrease) | (530,587) | (5,613,911) | 1,636,513 | 18,035,854 |
| (a) | Includes conversions of Class B shares to Class A shares, if any. |
| (b) | Effective March 27, 2017, Class I shares were redeemed or exchanged for Class Y shares. |
| (c) | Effective March 27, 2017, Class W shares were renamed Class T shares. |
The accompanying Notes to Financial Statements are an integral part of this statement.
Columbia Absolute Return Currency and Income Fund | Semiannual Report 2017
| 13 |
The following table is intended to help you understand the Fund’s financial performance. Certain information reflects financial results for a single share of a class held for the periods shown. Per share net investment income (loss) amounts are calculated based on average shares outstanding during the period. Total return assumes reinvestment of all dividends and distributions, if any. Total return does not reflect payment of sales charges, if any. Total return and portfolio turnover are not annualized for periods of less than one year. The portfolio turnover rate is calculated without regard to purchase and sales transactions of short-term instruments and certain derivatives, if any. If such transactions were included, the Fund’s portfolio turnover rate may be higher.
| Year ended (except as noted) | Net asset value,
beginning of
period | Net
investment
income
(loss) | Net
realized
and
unrealized
gain (loss) | Total from
investment
operations | Distributions
from net
investment
income | Distributions
from net
realized
gains |
| Class A |
| 4/30/2017 (c) | $10.59 | (0.05) | 0.36 | 0.31 | — | (0.27) |
| 10/31/2016 | $11.83 | (0.14) | 0.43 | 0.29 | (0.51) | (1.02) |
| 10/31/2015 | $9.64 | (0.16) | 2.35 | 2.19 | — | — |
| 10/31/2014 | $9.75 | (0.14) | 0.03 (e) | (0.11) | — | — |
| 10/31/2013 | $10.21 | (0.13) | (0.09) | (0.22) | — | (0.24) |
| 10/31/2012 | $9.95 | (0.12) | 0.38 | 0.26 | — | — |
| Class B |
| 4/30/2017 (c) | $9.96 | (0.09) | 0.32 | 0.23 | — | (0.24) |
| 10/31/2016 | $11.20 | (0.20) | 0.41 | 0.21 | (0.43) | (1.02) |
| 10/31/2015 | $9.19 | (0.23) | 2.24 | 2.01 | — | — |
| 10/31/2014 | $9.37 | (0.20) | 0.02 (e) | (0.18) | — | — |
| 10/31/2013 | $9.90 | (0.20) | (0.09) | (0.29) | — | (0.24) |
| 10/31/2012 | $9.72 | (0.19) | 0.37 | 0.18 | — | — |
| Class C |
| 4/30/2017 (c) | $9.94 | (0.09) | 0.33 | 0.24 | — | (0.24) |
| 10/31/2016 | $11.19 | (0.20) | 0.40 | 0.20 | (0.43) | (1.02) |
| 10/31/2015 | $9.19 | (0.23) | 2.23 | 2.00 | — | — |
| 10/31/2014 | $9.36 | (0.20) | 0.03 (e) | (0.17) | — | — |
| 10/31/2013 | $9.89 | (0.20) | (0.09) | (0.29) | — | (0.24) |
| 10/31/2012 | $9.71 | (0.19) | 0.37 | 0.18 | — | — |
| Class R4 |
| 4/30/2017 (c) | $10.93 | (0.04) | 0.35 | 0.31 | — | (0.29) |
| 10/31/2016 | $12.15 | (0.11) | 0.45 | 0.34 | (0.54) | (1.02) |
| 10/31/2015 | $9.87 | (0.14) | 2.42 | 2.28 | — | — |
| 10/31/2014 | $9.97 | (0.12) | 0.02 (e) | (0.10) | — | — |
| 10/31/2013 (f) | $10.28 | (0.06) | (0.25) | (0.31) | — | — |
| Class R5 |
| 4/30/2017 (c) | $10.99 | (0.04) | 0.37 | 0.33 | — | (0.30) |
| 10/31/2016 | $12.22 | (0.10) | 0.43 | 0.33 | (0.54) | (1.02) |
| 10/31/2015 | $9.92 | (0.13) | 2.43 | 2.30 | — | — |
| 10/31/2014 (g) | $9.78 | (0.04) | 0.18 (e) | 0.14 | — | — |
| Class T(h) |
| 4/30/2017 (c) | $10.54 | (0.05) | 0.35 | 0.30 | — | (0.27) |
| 10/31/2016 | $11.78 | (0.14) | 0.43 | 0.29 | (0.51) | (1.02) |
| 10/31/2015 | $9.60 | (0.16) | 2.34 | 2.18 | — | — |
| 10/31/2014 | $9.71 | (0.14) | 0.03 (e) | (0.11) | — | — |
| 10/31/2013 | $10.19 | (0.12) | (0.12) | (0.24) | — | (0.24) |
| 10/31/2012 | $9.94 | (0.14) | 0.39 | 0.25 | — | — |
The accompanying Notes to Financial Statements are an integral part of this statement.
| 14 | Columbia Absolute Return Currency and Income Fund | Semiannual Report 2017 |
Total
distributions to
shareholders | Net
asset
value,
end of
period | Total
return | Total gross
expense
ratio to
average
net assets(a) | Total net
expense
ratio to
average
net assets(a),(b) | Net investment
income (loss)
ratio to
average
net assets | Portfolio
turnover | Net
assets,
end of
period
(000’s) |
| |
| (0.27) | $10.63 | 2.95% | 1.68% (d) | 1.68% (d) | (1.04%) (d) | 0% | $12,220 |
| (1.53) | $10.59 | 2.64% | 1.68% | 1.68% | (1.27%) | 0% | $20,632 |
| — | $11.83 | 22.72% | 1.76% | 1.67% | (1.51%) | 0% | $15,622 |
| — | $9.64 | (1.13%) | 1.77% | 1.66% | (1.50%) | 0% | $12,068 |
| (0.24) | $9.75 | (2.28%) | 1.68% | 1.48% | (1.29%) | 0% | $20,050 |
| — | $10.21 | 2.61% | 1.65% | 1.42% | (1.18%) | 0% | $30,758 |
| |
| (0.24) | $9.95 | 2.40% | 2.41% (d) | 2.41% (d) | (1.83%) (d) | 0% | $15 |
| (1.45) | $9.96 | 1.97% | 2.42% | 2.42% | (2.03%) | 0% | $35 |
| — | $11.20 | 21.87% | 2.51% | 2.42% | (2.26%) | 0% | $59 |
| — | $9.19 | (1.92%) | 2.51% | 2.41% | (2.25%) | 0% | $52 |
| (0.24) | $9.37 | (3.08%) | 2.46% | 2.23% | (2.04%) | 0% | $189 |
| — | $9.90 | 1.85% | 2.39% | 2.17% | (1.93%) | 0% | $456 |
| |
| (0.24) | $9.94 | 2.50% | 2.44% (d) | 2.44% (d) | (1.78%) (d) | 0% | $3,240 |
| (1.45) | $9.94 | 1.87% | 2.43% | 2.43% | (2.03%) | 0% | $3,163 |
| — | $11.19 | 21.76% | 2.51% | 2.42% | (2.26%) | 0% | $2,556 |
| — | $9.19 | (1.82%) | 2.52% | 2.41% | (2.25%) | 0% | $1,256 |
| (0.24) | $9.36 | (3.08%) | 2.42% | 2.23% | (2.05%) | 0% | $2,374 |
| — | $9.89 | 1.85% | 2.39% | 2.16% | (1.92%) | 0% | $2,887 |
| |
| (0.29) | $10.95 | 2.93% | 1.44% (d) | 1.44% (d) | (0.78%) (d) | 0% | $708 |
| (1.56) | $10.93 | 2.99% | 1.43% | 1.43% | (1.03%) | 0% | $592 |
| — | $12.15 | 23.10% | 1.52% | 1.43% | (1.26%) | 0% | $369 |
| — | $9.87 | (1.00%) | 1.54% | 1.41% | (1.25%) | 0% | $10 |
| — | $9.97 | (3.02%) | 1.19% (d) | 1.19% (d) | (1.03%) (d) | 0% | $2 |
| |
| (0.30) | $11.02 | 3.09% | 1.34% (d) | 1.34% (d) | (0.72%) (d) | 0% | $2,485 |
| (1.56) | $10.99 | 2.97% | 1.35% | 1.35% | (0.94%) | 0% | $3,509 |
| — | $12.22 | 23.18% | 1.45% | 1.35% | (1.19%) | 0% | $388 |
| — | $9.92 | 1.43% | 1.46% (d) | 1.33% (d) | (1.08%) (d) | 0% | $10 |
| |
| (0.27) | $10.57 | 2.88% | 1.69% (d) | 1.69% (d) | (1.03%) (d) | 0% | $65 |
| (1.53) | $10.54 | 2.66% | 1.67% | 1.67% | (1.28%) | 0% | $70 |
| — | $11.78 | 22.71% | 1.75% | 1.67% | (1.51%) | 0% | $83 |
| — | $9.60 | (1.13%) | 1.77% | 1.66% | (1.50%) | 0% | $86 |
| (0.24) | $9.71 | (2.49%) | 1.83% | 1.33% | (1.13%) | 0% | $123 |
| — | $10.19 | 2.52% | 1.83% | 1.62% | (1.38%) | 0% | $10,922 |
Columbia Absolute Return Currency and Income Fund | Semiannual Report 2017
| 15 |
Financial Highlights (continued)
| Year ended (except as noted) | Net asset value,
beginning of
period | Net
investment
income
(loss) | Net
realized
and
unrealized
gain (loss) | Total from
investment
operations | Distributions
from net
investment
income | Distributions
from net
realized
gains |
| Class Y |
| 4/30/2017 (c) | $10.98 | (0.03) | 0.36 | 0.33 | — | (0.31) |
| 10/31/2016 | $12.20 | (0.10) | 0.45 | 0.35 | (0.55) | (1.02) |
| 10/31/2015 | $9.91 | (0.12) | 2.41 | 2.29 | — | — |
| 10/31/2014 | $9.98 | (0.11) | 0.04 (e) | (0.07) | — | — |
| 10/31/2013 (i) | $10.25 | (0.07) | (0.20) | (0.27) | — | — |
| Class Z |
| 4/30/2017 (c) | $10.92 | (0.04) | 0.36 | 0.32 | — | (0.29) |
| 10/31/2016 | $12.15 | (0.11) | 0.44 | 0.33 | (0.54) | (1.02) |
| 10/31/2015 | $9.88 | (0.14) | 2.41 | 2.27 | — | — |
| 10/31/2014 | $9.97 | (0.12) | 0.03 (e) | (0.09) | — | — |
| 10/31/2013 | $10.41 | (0.11) | (0.09) | (0.20) | — | (0.24) |
| 10/31/2012 | $10.11 | (0.09) | 0.39 | 0.30 | — | — |
| Notes to Financial Highlights |
| (a) | In addition to the fees and expenses that the Fund bears directly, the Fund indirectly bears a pro rata share of the fees and expenses of any other funds in which it invests. Such indirect expenses are not included in the Fund’s reported expense ratios. |
| (b) | Total net expenses include the impact of certain fee waivers/expense reimbursements made by the Investment Manager and certain of its affiliates, if applicable. |
| (c) | For the six months ended April 30, 2017 (unaudited). |
| (d) | Annualized. |
| (e) | Calculation of the net gain (loss) per share (both realized and unrealized) does not correlate to the aggregate realized and unrealized gain (loss) presented in the Statement of Operations due to the timing of subscriptions and redemptions of Fund shares in relation to fluctuations in the market value of the portfolio. |
| (f) | Class R4 shares commenced operations on March 19, 2013. Per share data and total return reflect activity from that date. |
| (g) | Class R5 shares commenced operations on June 25, 2014. Per share data and total return reflect activity from that date. |
| (h) | Effective March 27, 2017, Class W shares were renamed Class T shares. |
| (i) | Class Y shares commenced operations on February 28, 2013. Per share data and total return reflect activity from that date. |
The accompanying Notes to Financial Statements are an integral part of this statement.
| 16 | Columbia Absolute Return Currency and Income Fund | Semiannual Report 2017 |
Total
distributions to
shareholders | Net
asset
value,
end of
period | Total
return | Total gross
expense
ratio to
average
net assets(a) | Total net
expense
ratio to
average
net assets(a),(b) | Net investment
income (loss)
ratio to
average
net assets | Portfolio
turnover | Net
assets,
end of
period
(000’s) |
| |
| (0.31) | $11.00 | 3.07% | 1.33% (d) | 1.33% (d) | (0.49%) (d) | 0% | $25,544 |
| (1.57) | $10.98 | 3.13% | 1.28% | 1.28% | (0.89%) | 0% | $11 |
| — | $12.20 | 23.11% | 1.35% | 1.29% | (1.13%) | 0% | $13 |
| — | $9.91 | (0.70%) | 1.36% | 1.28% | (1.11%) | 0% | $10 |
| — | $9.98 | (2.63%) | 1.20% (d) | 1.20% (d) | (1.04%) (d) | 0% | $2 |
| |
| (0.29) | $10.95 | 3.04% | 1.46% (d) | 1.46% (d) | (0.77%) (d) | 0% | $17,055 |
| (1.56) | $10.92 | 2.91% | 1.42% | 1.42% | (1.02%) | 0% | $12,231 |
| — | $12.15 | 22.98% | 1.50% | 1.42% | (1.27%) | 0% | $7,853 |
| — | $9.88 | (0.90%) | 1.54% | 1.41% | (1.25%) | 0% | $7,422 |
| (0.24) | $9.97 | (2.04%) | 1.45% | 1.24% | (1.05%) | 0% | $4,677 |
| — | $10.41 | 2.97% | 1.34% | 1.09% | (0.85%) | 0% | $9,146 |
Columbia Absolute Return Currency and Income Fund | Semiannual Report 2017
| 17 |
Notes to Financial Statements
April 30, 2017 (Unaudited)
Note 1. Organization
Columbia Absolute Return Currency and Income Fund (the Fund), a series of Columbia Funds Series Trust II (the Trust), is a diversified fund. The Trust is registered under the Investment Company Act of 1940, as amended (the 1940 Act), as an open-end management investment company organized as a Massachusetts business trust.
Fund shares
The Trust may issue an unlimited number of shares (without par value). Although all share classes generally have identical voting, dividend and liquidation rights, each share class votes separately when required by the Trust’s organizational documents or by law. Different share classes pay different distribution amounts to the extent the expenses of such share classes differ, and distributions in liquidation will be proportional to the net asset value of each share class. Each share class has its own expense and sales charge structure. The Fund offers each of the share classes identified below.
Class A shares are subject to a maximum front-end sales charge of 3.00% based on the initial investment amount. Class A shares purchased without an initial sales charge in accounts aggregating $1 million to $50 million at the time of purchase are subject to a contingent deferred sales charge (CDSC) if the shares are sold within 18 months after purchase, charged as follows: 1.00% CDSC if redeemed within 12 months after purchase, and 0.50% CDSC if redeemed more than 12, but less than 18, months after purchase.
The Fund no longer accepts investments by new or existing investors in the Fund’s Class B shares, except in connection with the reinvestment of any dividend and/or capital gain distributions in Class B shares of the Fund and exchanges by existing Class B shareholders of certain other funds within the Columbia Family of Funds. Class B shares are typically subject to a maximum CDSC of 5.00% based upon the holding period after purchase. However, the Fund’s current Class B investors, having held their shares for the requisite time period, are no longer subject to a CDSC upon redemption of their shares. Effective on or about July 17, 2017, Class B shares will automatically convert to Class A shares and the Fund will no longer accept investments by new or existing investors in Class B shares.
Class C shares are subject to a 1.00% CDSC on shares redeemed within 12 months after purchase.
Effective March 27, 2017, Class I shares of the Fund are no longer offered for sale. Class I shares, when available, were not subject to sales charges or distribution and service (12b-1) fees, and were made available only to the Columbia Family of Funds. On March 27, 2017, Class I shares were redeemed or exchanged for Class Y shares of the Fund in a tax free transaction that had no impact on the fees and expenses paid by shareholders.
Class R4 shares are not subject to sales charges and are generally available only to omnibus retirement plans and certain investors as described in the Fund’s prospectus.
Class R5 shares are not subject to sales charges and are generally available only to investors purchasing through authorized investment professionals and omnibus retirement plans.
Class T shares are subject to a maximum front-end sales charge of 2.50% per transaction and must be purchased through financial intermediaries that, by written agreement with Columbia Management Investment Distributors, Inc., are specifically authorized to sell Class T shares. Prior to March 27, 2017, Class T shares were known as Class W shares, were not subject to sales charges, and were generally available only to investors purchasing through authorized investment programs managed by investment professionals, including discretionary managed accounts.
Class Y shares are not subject to sales charges or distribution and service (12b-1) fees, and are available to institutional and certain other investors as described in the Fund’s prospectus. On March 27, 2017, Class I shares were redeemed or exchanged for Class Y shares of the Fund in a tax free transaction that had no impact on the fees and expenses paid by shareholders. Class I shares of the Fund are no longer offered for sale.
Class Z shares are not subject to sales charges and are generally available only to eligible investors, which are subject to different investment minimums as described in the Fund’s prospectus.
| 18 | Columbia Absolute Return Currency and Income Fund | Semiannual Report 2017 |
Notes to Financial Statements (continued)
April 30, 2017 (Unaudited)
Note 2. Summary of significant accounting policies
Basis of preparation
The Fund is an investment company that applies the accounting and reporting guidance in the Financial Accounting Standards Board (FASB) Accounting Standards Codification Topic 946, Financial Services - Investment Companies (ASC 946). The financial statements are prepared in accordance with U.S. generally accepted accounting principles (GAAP), which requires management to make certain estimates and assumptions that affect the reported amounts of assets and liabilities, the disclosure of contingent assets and liabilities at the date of the financial statements and the reported amounts of income and expenses during the reporting period. Actual results could differ from those estimates.
The following is a summary of significant accounting policies followed by the Fund in the preparation of its financial statements.
Security valuation
Debt securities generally are valued by pricing services approved by the Board of Trustees based upon market transactions for normal, institutional-size trading units of similar securities. The services may use various pricing techniques that take into account, as applicable, factors such as yield, quality, coupon rate, maturity, type of issue, trading characteristics and other data, as well as approved independent broker-dealer quotes. Debt securities for which quotations are not readily available or not believed to be reflective of market value may also be valued based upon a bid quote from an approved independent broker-dealer. Debt securities maturing in 60 days or less are valued primarily at amortized cost value, unless this method results in a valuation that management believes does not approximate market value.
Asset- and mortgage-backed securities are generally valued by pricing services, which utilize pricing models that incorporate the securities’ cash flow and loan performance data. These models also take into account available market data, including trades, market quotations, and benchmark yield curves for identical or similar securities. Factors used to identify similar securities may include, but are not limited to, issuer, collateral type, vintage, prepayment speeds, collateral performance, credit ratings, credit enhancement and expected life. Asset-backed securities for which quotations are readily available may also be valued based upon an over-the-counter or exchange bid quote from an approved independent broker-dealer.
Investments in open-end investment companies, including money market funds, are valued at their latest net asset value.
Forward foreign currency exchange contracts are marked-to-market based upon foreign currency exchange rates provided by a pricing service.
Investments for which market quotations are not readily available, or that have quotations which management believes are not reflective of market value or reliable, are valued at fair value as determined in good faith under procedures approved by and under the general supervision of the Board of Trustees. If a security or class of securities (such as foreign securities) is valued at fair value, such value is likely to be different from the quoted or published price for the security.
The determination of fair value often requires significant judgment. To determine fair value, management may use assumptions including but not limited to future cash flows and estimated risk premiums. Multiple inputs from various sources may be used to determine fair value.
GAAP requires disclosure regarding the inputs and valuation techniques used to measure fair value and any changes in valuation inputs or techniques. In addition, investments shall be disclosed by major category. This information is disclosed following the Fund’s Portfolio of Investments.
Derivative instruments
The Fund invests in certain derivative instruments, as detailed below, to meet its investment objectives. Derivatives are instruments whose values depend on, or are derived from, in whole or in part, the value of one or more securities, currencies, commodities, indices, or other assets or instruments. Derivatives may be used to increase investment flexibility (including to maintain cash reserves while maintaining desired exposure to certain assets), for risk management (hedging) purposes, to facilitate trading, to reduce transaction costs and to pursue higher investment returns. The Fund may also use derivative instruments to mitigate certain investment risks, such as foreign currency exchange rate risk, interest rate risk and
Columbia Absolute Return Currency and Income Fund | Semiannual Report 2017
| 19 |
Notes to Financial Statements (continued)
April 30, 2017 (Unaudited)
credit risk. Derivatives may involve various risks, including the potential inability of the counterparty to fulfill its obligations under the terms of the contract, the potential for an illiquid secondary market (making it difficult for the Fund to sell or terminate, including at favorable prices) and the potential for market movements which may expose the Fund to gains or losses in excess of the amount shown in the Statement of Assets and Liabilities. The notional amounts of derivative instruments, if applicable, are not recorded in the financial statements.
A derivative instrument may suffer a marked-to-market loss if the value of the contract decreases due to an unfavorable change in the market rates or values of the underlying instrument. Losses can also occur if the counterparty does not perform its obligations under the contract. The Fund’s risk of loss from counterparty credit risk on over-the-counter derivatives is generally limited to the aggregate unrealized gain netted against any collateral held by the Fund and the amount of any variation margin held by the counterparty, plus any replacement costs or related amounts. With exchange-traded or centrally cleared derivatives, there is reduced counterparty credit risk to the Fund since the clearinghouse or central counterparty (CCP) provides some protection in the case of clearing member default. The clearinghouse or CCP stands between the buyer and the seller of the contract; therefore, additional counterparty credit risk is failure of the clearinghouse or CCP. However, credit risk still exists in exchange-traded or centrally cleared derivatives with respect to initial and variation margin that is held in a broker’s customer account. While brokers are required to segregate customer margin from their own assets, in the event that a broker becomes insolvent or goes into bankruptcy and at that time there is a shortfall in the aggregate amount of margin held by the broker for all its clients, U.S. bankruptcy laws will typically allocate that shortfall on a pro-rata basis across all the broker’s customers (including the Fund), potentially resulting in losses to the Fund.
In order to better define its contractual rights and to secure rights that will help the Fund mitigate its counterparty risk, the Fund may enter into an International Swaps and Derivatives Association, Inc. Master Agreement (ISDA Master Agreement) or similar agreement with its derivatives contract counterparties. An ISDA Master Agreement is an agreement between the Fund and a counterparty that governs over-the-counter derivatives and typically contains, among other things, collateral posting terms and netting provisions in the event of a default and/or termination event. Under an ISDA Master Agreement, the Fund may, under certain circumstances, offset with the counterparty certain derivative instrument’s payables and/or receivables with collateral held and/or posted and create one single net payment. The provisions of the ISDA Master Agreement typically permit a single net payment in the event of default (close-out netting), including the bankruptcy or insolvency of the counterparty. Note, however, that bankruptcy or insolvency laws of a particular jurisdiction may impose restrictions on or prohibitions against the right of offset or netting in bankruptcy, insolvency or other events.
Collateral (margin) requirements differ by type of derivative. Margin requirements are established by the clearinghouse or CCP for exchange-traded and centrally cleared derivatives. Brokers can ask for margin in excess of the minimum in certain circumstances. Collateral terms are contract specific for over-the-counter derivatives. For over-the-counter derivatives traded under an ISDA Master Agreement, the collateral requirements are typically calculated by netting the marked-to-market amount for each transaction under such agreement and comparing that amount to the value of any variation margin currently pledged by the Fund and/or the counterparty. Generally, the amount of collateral due from or to a party has to exceed a minimum transfer amount threshold (e.g., $250,000) before a transfer has to be made. To the extent amounts due to the Fund from its counterparties are not fully collateralized, contractually or otherwise, the Fund bears the risk of loss from counterparty nonperformance. The Fund attempts to mitigate counterparty risk by only entering into agreements with counterparties that it believes have the financial resources to honor their obligations and by monitoring the financial stability of those counterparties.
Certain ISDA Master Agreements allow counterparties of over-the-counter derivatives transactions to terminate derivatives contracts prior to maturity in the event the Fund’s net asset value declines by a stated percentage over a specified time period or if the Fund fails to meet certain terms of the ISDA Master Agreement, which would cause the Fund to accelerate payment of any net liability owed to the counterparty. The Fund also has termination rights if the counterparty fails to meet certain terms of the ISDA Master Agreement. In addition to considering counterparty credit risk, the Fund would consider terminating the derivatives contracts based on whether termination would result in a net liability owed from the counterparty.
For financial reporting purposes, the Fund does not offset derivative assets and derivative liabilities that are subject to netting arrangements in the Statement of Assets and Liabilities.
| 20 | Columbia Absolute Return Currency and Income Fund | Semiannual Report 2017 |
Notes to Financial Statements (continued)
April 30, 2017 (Unaudited)
Forward foreign currency exchange contracts
Forward foreign currency exchange contracts are over-the-counter agreements between two parties to buy and sell a currency at a set price on a future date. The Fund utilized forward foreign currency exchange contracts to generate total return through long and short positions versus the U.S. dollar. These instruments may be used for other purposes in future periods.
The values of forward foreign currency exchange contracts fluctuate daily with changes in foreign currency exchange rates. Changes in the value of these contracts are recorded as unrealized appreciation or depreciation until the contract is exercised or has expired. The Fund will realize a gain or loss when the forward foreign currency exchange contract is closed or expires.
The use of forward foreign currency exchange contracts does not eliminate fluctuations in the prices of the Fund’s portfolio securities. The risks of forward foreign currency exchange contracts include movement in the values of the foreign currencies relative to the U.S. dollar (or other foreign currencies) and the possibility that counterparties will not complete their contractual obligations, which may be in excess of the amount reflected, if any, in the Statement of Assets and Liabilities.
Effects of derivative transactions in the financial statements
The following tables are intended to provide additional information about the effect of derivatives on the financial statements of the Fund, including: the fair value of derivatives by risk category and the location of those fair values in the Statement of Assets and Liabilities; and the impact of derivative transactions over the period in the Statement of Operations, including realized and unrealized gains (losses). The derivative instrument schedules following the Portfolio of Investments present additional information regarding derivative instruments outstanding at the end of the period, if any.
The following table is a summary of the fair value of derivative instruments (not considered to be hedging instruments for accounting disclosure purposes) at April 30, 2017:
| | Asset derivatives | |
Risk exposure
category | Statement
of assets and liabilities
location | Fair value ($) |
| Foreign exchange risk | Unrealized appreciation on forward foreign currency exchange contracts | 5,359,168 |
| | Liability derivatives | |
Risk exposure
category | Statement
of assets and liabilities
location | Fair value ($) |
| Foreign exchange risk | Unrealized depreciation on forward foreign currency exchange contracts | 6,836,057 |
Columbia Absolute Return Currency and Income Fund | Semiannual Report 2017
| 21 |
Notes to Financial Statements (continued)
April 30, 2017 (Unaudited)
The following table indicates the effect of derivative instruments (not considered to be hedging instruments for accounting disclosure purposes) in the Statement of Operations for the six months ended April 30, 2017:
| Amount of realized gain (loss) on derivatives recognized in income |
| Risk exposure category | Forward
foreign
currency
exchange
contracts
($) |
| Foreign exchange risk | 3,889,014 |
| |
| Change in unrealized appreciation (depreciation) on derivatives recognized in income |
| Risk exposure category | Forward
foreign
currency
exchange
contracts
($) |
| Foreign exchange risk | (1,523,120) |
The following table is a summary of the average outstanding volume by derivative instrument for the six months ended April 30, 2017:
| Derivative instrument | Average unrealized
appreciation ($)* | Average unrealized
depreciation ($)* |
| Forward foreign currency exchange contracts | 6,920,329 | (7,102,485) |
| * | Based on the ending quarterly outstanding amounts for the six months ended April 30, 2017. |
Asset- and mortgage-backed securities
The Fund may invest in asset-backed and mortgage-backed securities. The maturity dates shown represent the original maturity of the underlying obligation. Actual maturity may vary based upon prepayment activity on these obligations. All, or a portion, of the obligation may be prepaid at any time because the underlying asset may be prepaid. As a result, decreasing market interest rates could result in an increased level of prepayment. An increased prepayment rate will have the effect of shortening the maturity of the security. Unless otherwise noted, the coupon rates presented are fixed rates.
Offsetting of assets and liabilities
The following table presents the Fund’s gross and net amount of assets and liabilities available for offset under netting arrangements as well as any related collateral received or pledged by the Fund as of April 30, 2017:
| | Barclays ($) | BNP
Paribas ($) | Citi ($) | Deutsche
Bank ($) | Morgan
Stanley ($) | UBS ($) | Total ($) | | |
| Assets | | | | | | | | | |
| Forward foreign currency exchange contracts | 107,108 | 2,940,261 | 367,088 | 782,935 | 579,091 | 582,685 | 5,359,168 | | |
| Liabilities | | | | | | | | | |
| Forward foreign currency exchange contracts | 523,815 | 4,143,257 | 611,346 | 729,614 | 638,034 | 189,991 | 6,836,057 | | |
| Total financial and derivative net assets | (416,707) | (1,202,996) | (244,258) | 53,321 | (58,943) | 392,694 | (1,476,889) | | |
| Total collateral received (pledged) (a) | - | - | - | - | - | - | - | | |
| Net amount (b) | (416,707) | (1,202,996) | (244,258) | 53,321 | (58,943) | 392,694 | (1,476,889) | | |
| (a) | In some instances, the actual collateral received and/or pledged may be more than the amount shown due to overcollateralization. |
| (b) | Represents the net amount due from/(to) counterparties in the event of default. |
Security transactions
Security transactions are accounted for on the trade date. Cost is determined and gains (losses) are based upon the specific identification method for both financial statement and federal income tax purposes.
| 22 | Columbia Absolute Return Currency and Income Fund | Semiannual Report 2017 |
Notes to Financial Statements (continued)
April 30, 2017 (Unaudited)
Income recognition
Interest income is recorded on an accrual basis. Market premiums and discounts, including original issue discounts, are amortized and accreted, respectively, over the expected life of the security on all debt securities, unless otherwise noted.
The Fund may place a debt security on non-accrual status and reduce related interest income when it becomes probable that the interest will not be collected and the amount of uncollectible interest can be reasonably estimated. A defaulted debt security is removed from non-accrual status when the issuer resumes interest payments or when collectibility of interest is reasonably assured.
Dividend income is recorded on the ex-dividend date.
Expenses
General expenses of the Trust are allocated to the Fund and other funds of the Trust based upon relative net assets or other expense allocation methodologies determined by the nature of the expense. Expenses directly attributable to the Fund are charged to the Fund. Expenses directly attributable to a specific class of shares are charged to that share class.
Determination of class net asset value
All income, expenses (other than class-specific expenses, which are charged to that share class, as shown in the Statement of Operations) and realized and unrealized gains (losses) are allocated to each class of the Fund on a daily basis, based on the relative net assets of each class, for purposes of determining the net asset value of each class.
Federal income tax status
The Fund intends to qualify each year as a regulated investment company under Subchapter M of the Internal Revenue Code, as amended, and will distribute substantially all of its taxable income (including net short-term capital gains), if any, for its tax year, and as such will not be subject to federal income taxes. In addition, the Fund intends to distribute in each calendar year substantially all of its net investment income, capital gains and certain other amounts, if any, such that the Fund should not be subject to federal excise tax. Therefore, no federal income or excise tax provision is recorded.
Distributions to shareholders
Distributions from net investment income, if any, are declared and paid monthly. Net realized capital gains, if any, are distributed at least annually. Income distributions and capital gain distributions are determined in accordance with federal income tax regulations, which may differ from GAAP.
Guarantees and indemnifications
Under the Trust’s organizational documents and, in some cases, by contract, its officers and trustees are indemnified against certain liabilities arising out of the performance of their duties to the Trust or its funds. In addition, certain of the Fund’s contracts with its service providers contain general indemnification clauses. The Fund’s maximum exposure under these arrangements is unknown since the amount of any future claims that may be made against the Fund cannot be determined, and the Fund has no historical basis for predicting the likelihood of any such claims.
Investment company reporting modernization
In October 2016, the U.S. Securities and Exchange Commission adopted new rules and forms, and amendments to certain current rules and forms, to modernize reporting and disclosure of information by registered investment companies. The amendments to Regulation S-X will require standardized, enhanced disclosure about derivatives in investment company financial statements, and will also change the rules governing the form and content of such financial statements. The amendments to Regulation S-X take effect on August 1, 2017. At this time, management is assessing the anticipated impact of these regulatory developments.
Columbia Absolute Return Currency and Income Fund | Semiannual Report 2017
| 23 |
Notes to Financial Statements (continued)
April 30, 2017 (Unaudited)
Note 3. Fees and other transactions with affiliates
Management services fees
The Fund entered into a Management Agreement with Columbia Management Investment Advisers, LLC (the Investment Manager), a wholly-owned subsidiary of Ameriprise Financial, Inc. (Ameriprise Financial). Under the Management Agreement, the Investment Manager provides the Fund with investment research and advice, as well as administrative and accounting services. The management services fee is an annual fee that is equal to a percentage of the Fund’s average daily net assets that declines from 0.97% to 0.75% as the Fund’s net assets increase. The annualized effective management services fee rate for the six months ended April 30, 2017 was 0.97% of the Fund’s average daily net assets.
Other expenses
Other expenses are for, among other things, miscellaneous expenses of the Fund or the Board of Trustees, including payments to Board Services Corp., a company providing limited administrative services to the Fund and the Board of Trustees. That company’s expenses include boardroom and office expense, employee compensation, employee health and retirement benefits, and certain other expenses.
Compensation of board members
Members of the Board of Trustees, who are not officers or employees of the Investment Manager or Ameriprise Financial, are compensated for their services to the Fund as disclosed in the Statement of Operations. Under a Deferred Compensation Plan (the Plan), these members of the Board of Trustees may elect to defer payment of up to 100% of their compensation. Deferred amounts are treated as though equivalent dollar amounts had been invested in shares of certain funds managed by the Investment Manager. The Fund’s liability for these amounts is adjusted for market value changes and remains in the Fund until distributed in accordance with the Plan. All amounts payable under the Plan constitute a general unsecured obligation of the Fund.
Compensation of Chief Compliance Officer
The Board of Trustees has appointed a Chief Compliance Officer to the Fund in accordance with federal securities regulations. A portion of the Chief Compliance Officer’s total compensation is allocated to the Fund, along with other affiliated funds governed by the Board of Trustees, based on relative net assets. The total amount allocated to all affiliated funds governed by the Board of Trustees will not exceed $40,000 annually.
Transfer agency fees
Under a Transfer and Dividend Disbursing Agent Agreement, Columbia Management Investment Services Corp. (the Transfer Agent), an affiliate of the Investment Manager and a wholly-owned subsidiary of Ameriprise Financial, is responsible for providing transfer agency services to the Fund. The Transfer Agent has contracted with Boston Financial Data Services (BFDS) to serve as sub-transfer agent. The Transfer Agent pays the fees of BFDS for services as sub-transfer agent and BFDS is not entitled to reimbursement for such fees from the Fund (with the exception of out-of-pocket fees).
The Fund pays the Transfer Agent a monthly transfer agency fee based on the number or the average value of accounts, depending on the type of account. In addition, the Fund pays the Transfer Agent a fee for shareholder services based on the number of accounts or on a percentage of the average aggregate value of the Fund’s shares maintained in omnibus accounts up to the lesser of the amount charged by the financial intermediary or a cap established by the Board of Trustees from time to time.
The Transfer Agent also receives compensation from the Fund for various shareholder services and reimbursements for certain out-of-pocket fees. Effective January 1, 2017, total transfer agency fees for Class R5 shares are subject to an annual limitation of not more than 0.075% of the average daily net assets attributable to Class R5 shares. Total transfer agency fees for Class I, prior to March 27, 2017 were, and Class Y shares are subject to an annual limitation of not more than 0.025% of the average daily net assets attributable to each share class. Prior to January 1, 2017, total transfer agency fees for Class R5 shares were subject to an annual limitation of not more than 0.05% of the average daily net assets attributable to Class R5 shares and Class I and Class Y shares did not pay transfer agency fees.
| 24 | Columbia Absolute Return Currency and Income Fund | Semiannual Report 2017 |
Notes to Financial Statements (continued)
April 30, 2017 (Unaudited)
For the six months ended April 30, 2017, the Fund’s annualized effective transfer agency fee rates as a percentage of average daily net assets of each class were as follows:
| | Effective rate (%) |
| Class A | 0.15 |
| Class B | 0.15 |
| Class C | 0.15 |
| Class I | 0.006 (a),(b) |
| Class R4 | 0.15 |
| Class R5 | 0.058 |
| Class T | 0.15 |
| Class Y | 0.011 |
| Class Z | 0.15 |
| (a) | Annualized. |
| (b) | Effective March 27, 2017, Class I shares were redeemed or exchanged for Class Y shares. |
An annual minimum account balance fee of $20 may apply to certain accounts with a value below the applicable share class’s initial minimum investment requirements to reduce the impact of small accounts on transfer agency fees. These minimum account balance fees are remitted to the Fund and recorded as part of expense reductions in the Statement of Operations. For the six months ended April 30, 2017, no minimum account balance fees were charged by the Fund.
Distribution and service fees
The Fund has an agreement with Columbia Management Investment Distributors, Inc. (the Distributor), an affiliate of the Investment Manager and a wholly-owned subsidiary of Ameriprise Financial, for distribution and shareholder services. Under a Plan and Agreement of Distribution, the Fund pays a fee at an annual rate of up to 0.25% of the Fund’s average daily net assets attributable to Class A and Class T shares and a fee at an annual rate of up to 1.00% of the Fund’s average daily net assets attributable to Class B and Class C shares. For Class B and Class C shares, of the 1.00% fee, up to 0.75% is reimbursed for distribution expenses.
The amount of distribution and shareholder services expenses incurred by the Distributor and not yet reimbursed (unreimbursed expense) was approximately $23,000 and $22,000 for Class B and Class C shares, respectively. These amounts are based on the most recent information available as of March 31, 2017, and may be recovered from future payments under the distribution plan or CDSCs. To the extent the unreimbursed expense has been fully recovered, the distribution and/or shareholder services fee is reduced.
Sales charges
Sales charges, including front-end charges and CDSCs, received by the Distributor for distributing Fund shares for the six months ended April 30, 2017, if any, are listed below:
| | Amount ($) |
| Class A | 10,158 |
| Class B | 154 |
Columbia Absolute Return Currency and Income Fund | Semiannual Report 2017
| 25 |
Notes to Financial Statements (continued)
April 30, 2017 (Unaudited)
Expenses waived/reimbursed by the Investment Manager and its affiliates
The Investment Manager and certain of its affiliates have contractually agreed to waive fees and/or reimburse expenses (excluding certain fees and expenses described below) for the periods disclosed below, unless sooner terminated at the sole discretion of the Board of Trustees, so that the Fund’s net operating expenses, after giving effect to fees waived/expenses reimbursed and any balance credits and/or overdraft charges from the Fund’s custodian, do not exceed the following annual rates as a percentage of the class’ average daily net assets:
| | March 1, 2017
through
February 28, 2018 | Prior to
March 1, 2017 |
| Class A | 1.850% | 1.80% |
| Class B | 2.600 | 2.55 |
| Class C | 2.600 | 2.55 |
| Class R4 | 1.600 | 1.55 |
| Class R5 | 1.575 | 1.50 |
| Class T | 1.850 | 1.80 |
| Class Y | 1.525 | 1.45 |
| Class Z | 1.600 | 1.55 |
Under the agreement governing these fee waivers and/or expense reimbursement arrangements, the following fees and expenses are excluded from the waiver/reimbursement commitment, and therefore will be paid by the Fund, if applicable: taxes (including foreign transaction taxes), expenses associated with investments in affiliated and non-affiliated pooled investment vehicles (including mutual funds and exchange-traded funds), transaction costs and brokerage commissions, costs related to any securities lending program, dividend and interest expenses associated with securities sold short, inverse floater program fees and expenses, transaction charges and interest on borrowed money, interest, infrequent and/or unusual expenses and any other expenses the exclusion of which is specifically approved by the Board of Trustees. This agreement may be modified or amended only with approval from the Investment Manager, certain of its affiliates and the Fund. Any fees waived and/or expenses reimbursed under the expense reimbursement arrangements described above are not recoverable by the Investment Manager or its affiliates in future periods.
Note 4. Federal tax information
The timing and character of income and capital gain distributions are determined in accordance with income tax regulations, which may differ from GAAP because of temporary or permanent book to tax differences.
At April 30, 2017, the approximate cost of investments for federal income tax purposes and the aggregate gross approximate unrealized appreciation and depreciation based on that cost was:
Federal
tax cost ($) | Gross unrealized
appreciation ($) | Gross unrealized
(depreciation) ($) | Net unrealized
(depreciation) ($) |
| 62,889,000 | — | (23,000) | (23,000) |
Management of the Fund has concluded that there are no significant uncertain tax positions in the Fund that would require recognition in the financial statements. However, management’s conclusion may be subject to review and adjustment at a later date based on factors including, but not limited to, new tax laws, regulations, and administrative interpretations (including relevant court decisions). Generally, the Fund’s federal tax returns for the prior three fiscal years remain subject to examination by the Internal Revenue Service.
Note 5. Portfolio information
For the six months ended April 30, 2017, there were no purchases or proceeds from the sale of securities other than short-term investment transactions and derivative activity, if any. Only the amount of long-term security purchases and sales activity, excluding derivatives, impacts the portfolio turnover reported in the Financial Highlights.
| 26 | Columbia Absolute Return Currency and Income Fund | Semiannual Report 2017 |
Notes to Financial Statements (continued)
April 30, 2017 (Unaudited)
Note 6. Affiliated money market fund
The Fund invests significantly in Columbia Short-Term Cash Fund, an affiliated money market fund established for the exclusive use by the Fund and other affiliated funds (the Affiliated MMF). The income earned by the Fund from such investments is included as Dividends - affiliated issuers in the Statement of Operations. As an investing fund, the Fund indirectly bears its proportionate share of the expenses of the Affiliated MMF. The Affiliated MMF prices its shares with a floating net asset value. In addition, the Board of Trustees of the Affiliated MMF may impose a fee on redemptions (sometimes referred to as a liquidity fee) or temporarily suspend redemptions (sometimes referred to as imposing a redemption gate) in the event its liquidity falls below regulatory limits.
Note 7. Line of credit
The Fund has access to a revolving credit facility with a syndicate of banks led by Citibank, N.A., HSBC Bank USA, N.A. and JPMorgan Chase Bank, N.A. whereby the Fund may borrow for the temporary funding of shareholder redemptions or for other temporary or emergency purposes. The credit facility agreement, which is a collective agreement between the Fund and certain other funds managed by the Investment Manager, severally and not jointly, permits collective borrowings up to $1 billion. Interest is charged to each participating fund based on its borrowings at a rate equal to the higher of (i) the overnight federal funds rate plus 1.00% or (ii) the one-month LIBOR rate plus 1.00%. Each borrowing under the credit facility matures no later than 60 days after the date of borrowing. The Fund also pays a commitment fee equal to its pro rata share of the amount of the credit facility at a rate of 0.15% per annum. The commitment fee is included in other expenses in the Statement of Operations.
The Fund had no borrowings during the six months ended April 30, 2017.
Note 8. Significant risks
Counterparty risk
Counterparty risk is the risk that a counterparty to a financial instrument entered into by the Fund or held by a special purpose or structured vehicle becomes bankrupt or otherwise fails to perform its obligations due to financial difficulties. The Fund may experience significant delays in obtaining any recovery in a bankruptcy or other reorganization proceeding. The Fund may obtain only limited recovery or may obtain no recovery in such circumstances.
Credit risk
Credit risk is the risk that the value of debt securities in the Fund’s portfolio may decline because the issuer may default and fail to pay interest or repay principal when due. Rating agencies assign credit ratings to debt securities to indicate their credit risk. Lower rated or unrated debt securities held by the Fund may present increased credit risk as compared to higher-rated debt securities.
Derivatives risk
Losses involving derivative instruments may be substantial, because a relatively small price movement in the underlying security(ies), commodity, currency or index or other instrument or asset may result in a substantial loss for the Fund. In addition to the potential for increased losses, the use of derivative instruments may lead to increased volatility within the Fund. Derivatives will typically increase the Fund’s exposure to principal risks to which it is otherwise exposed, and may expose the Fund to additional risks, including correlation risk, counterparty risk, hedging risk, leverage risk and liquidity risk.
Foreign currency risk
The performance of the Fund may be materially affected positively or negatively by foreign currency strength or weakness relative to the U.S. dollar, particularly if the Fund invests a significant percentage of its assets in foreign securities or other assets denominated in currencies other than the U.S. dollar. Currency rates in foreign countries may fluctuate significantly over short or long periods of time for a number of reasons, including changes in interest rates, imposition of currency controls and economic or political developments in the U.S. or abroad. The Fund may also incur currency conversion costs when converting foreign currencies into U.S. dollars and vice versa.
Columbia Absolute Return Currency and Income Fund | Semiannual Report 2017
| 27 |
Notes to Financial Statements (continued)
April 30, 2017 (Unaudited)
Interest rate risk
Interest rate risk is the risk of losses attributable to changes in interest rates. In general, if prevailing interest rates rise, the values of debt securities tend to fall, and if interest rates fall, the values of debt securities tend to rise. Actions by governments and central banking authorities can result in increases in interest rates. Increasing interest rates may negatively affect the value of debt securities held by the Fund, resulting in a negative impact on the Fund’s performance and net asset value per share. In general, the longer the maturity or duration of a debt security, the greater its sensitivity to changes in interest rates.
Liquidity risk
Liquidity risk is the risk associated with a lack of marketability of investments which may make it difficult to sell the investment at a desirable time or price. Changing regulatory, market or other conditions or environments (for example, the interest rate or credit environments) may adversely affect the liquidity of the Fund’s investments. The Fund may have to accept a lower selling price for the holding, sell other investments, or forego another, more appealing investment opportunity. Generally, the less liquid the market at the time the Fund sells a portfolio investment, the greater the risk of loss or decline of value to the Fund. A less liquid market can lead to an increase in Fund redemptions, which may negatively impact Fund performance and net asset value per share, including, for example, if the Fund is forced to sell securities in a down market.
Money market fund investment risk
An investment in a money market fund is not a bank deposit and is not insured or guaranteed by any bank, the FDIC or any other government agency. Certain money market funds float their net asset value while others seek to preserve the value of investments at a stable net asset value (typically, $1.00 per share). An investment in a money market fund, even an investment in a fund seeking to maintain a stable net asset value per share, is not guaranteed and it is possible for the Fund to lose money by investing in these and other types of money market funds. If the liquidity of a money market fund’s portfolio deteriorates below certain levels, the money market fund may suspend redemptions (i.e., impose a redemption gate) and thereby prevent the Fund from selling its investment in the money market fund or impose a fee of up to 2% on amounts the Fund redeems from the money market fund (i.e., impose a liquidity fee). These measures may result in an investment loss or prohibit the Fund from redeeming shares when the Investment Manager would otherwise redeem shares. In addition to the fees and expenses that the Fund directly bears, the Fund indirectly bears the fees and expenses of any money market funds in which it invests, including affiliated money market funds. The Fund will also be exposed to the investment risks of the money market fund. To the extent the Fund invests in instruments such as derivatives, the Fund may hold investments, which may be significant, in money market fund shares to cover its obligations resulting from its investments in derivatives. Money market funds and the securities they invest in are subject to comprehensive regulations. The enactment of new legislation or regulations, as well as changes in interpretation and enforcement of current laws, may affect the manner of operation, performance and/or yield of money market funds.
Shareholder concentration risk
At April 30, 2017, affiliated shareholders of record owned 68.7% of the outstanding shares of the Fund in one or more accounts. Subscription and redemption activity by concentrated accounts may have a significant effect on the operations of the Fund. In the case of a large redemption, the Fund may be forced to sell investments at inopportune times, including its liquid or more liquid positions, resulting in Fund losses and the Fund holding a higher percentage of less liquid or illiquid securities. Large redemptions could result in decreased economies of scale and increased operating expenses for non-redeeming Fund shareholders.
Note 9. Subsequent events
Management has evaluated the events and transactions that have occurred through the date the financial statements were issued. Other than as noted in Note 1 above, there were no items requiring adjustment of the financial statements or additional disclosure.
| 28 | Columbia Absolute Return Currency and Income Fund | Semiannual Report 2017 |
Notes to Financial Statements (continued)
April 30, 2017 (Unaudited)
Note 10. Information regarding pending and settled legal proceedings
Ameriprise Financial and certain of its affiliates have historically been involved in a number of legal, arbitration and regulatory proceedings, including routine litigation, class actions, and governmental actions, concerning matters arising in connection with the conduct of their business activities. Ameriprise Financial believes that the Funds are not currently the subject of, and that neither Ameriprise Financial nor any of its affiliates are the subject of, any pending legal, arbitration or regulatory proceedings that are likely to have a material adverse effect on the Funds or the ability of Ameriprise Financial or its affiliates to perform under their contracts with the Funds. Ameriprise Financial is required to make quarterly (10-Q), annual (10-K) and, as necessary, 8-K filings with the Securities and Exchange Commission (SEC) on legal and regulatory matters that relate to Ameriprise Financial and its affiliates. Copies of these filings may be obtained by accessing the SEC website at www.sec.gov.
There can be no assurance that these matters, or the adverse publicity associated with them, will not result in increased fund redemptions, reduced sale of fund shares or other adverse consequences to the Funds. Further, although we believe proceedings are not likely to have a material adverse effect on the Funds or the ability of Ameriprise Financial or its affiliates to perform under their contracts with the Funds, these proceedings are subject to uncertainties and, as such, we are unable to estimate the possible loss or range of loss that may result. An adverse outcome in one or more of these proceedings could result in adverse judgments, settlements, fines, penalties or other relief that could have a material adverse effect on the consolidated financial condition or results of operations of Ameriprise Financial.
Columbia Absolute Return Currency and Income Fund | Semiannual Report 2017
| 29 |
The Fund mails one shareholder report to each shareholder address. If you would like more than one report, please call shareholder services at 800.345.6611 and additional reports will be sent to you.
Proxy voting policies and procedures
The policy of the Board of Trustees is to vote the proxies of the companies in which the Fund holds investments consistent with the procedures as stated in the Statement of Additional Information (SAI). You may obtain a copy of the SAI without charge by calling 800.345.6611; contacting your financial intermediary; visiting investor.columbiathreadneedleus.com; or searching the website of the Securities and Exchange Commission (SEC) at sec.gov. Information regarding how the Fund voted proxies relating to portfolio securities is filed with the SEC by August 31st for the most recent 12-month period ending June 30th of that year, and is available without charge by visiting investor.columbiathreadneedleus.com, or searching the website of the SEC at sec.gov.
Quarterly schedule of investments
The Fund files a complete schedule of portfolio holdings with the SEC for the first and third quarters of each fiscal year on Form N-Q. The Fund’s Form N-Q is available on the SEC’s website at sec.gov and may be reviewed and copied at the SEC’s Public Reference Room in Washington, D.C. Information on the operation of the Public Reference Room may be obtained by calling 800.SEC.0330. The Fund’s complete schedule of portfolio holdings, as filed on Form N-Q, can also be obtained without charge, upon request, by calling 800.345.6611.
Additional Fund information
For more information about the Fund, please visit investor.columbiathreadneedleus.com or call 800.345.6611. Customer Service Representatives are available to answer your questions Monday through Friday from 8 a.m. to 7 p.m. Eastern time.
Fund investment manager
Columbia Management Investment Advisers, LLC
225 Franklin Street
Boston, MA 02110
Fund distributor
Columbia Management Investment Distributors, Inc.
225 Franklin Street
Boston, MA 02110
Fund transfer agent
Columbia Management Investment Services Corp.
P.O. Box 8081
Boston, MA 02266-8081
| 30 | Columbia Absolute Return Currency and Income Fund | Semiannual Report 2017 |
[THIS PAGE INTENTIONALLY LEFT BLANK]
[THIS PAGE INTENTIONALLY LEFT BLANK]
[THIS PAGE INTENTIONALLY LEFT BLANK]
Columbia Absolute Return Currency and Income Fund
P.O. Box 8081
Boston, MA 02266-8081
Please read and consider the investment objectives, risks, charges and expenses for any fund carefully before investing. For a prospectus and summary prospectus, which contains this and other important information about the Fund, go to
investor.columbiathreadneedleus.com. The Fund is distributed by Columbia Management Investment Distributors, Inc., member FINRA, and managed by Columbia Management Investment Advisers, LLC.
Columbia Threadneedle Investments (Columbia Threadneedle) is the global brand name of the Columbia and Threadneedle group of companies. All rights reserved. Columbia Management Investment Distributors, Inc., 225 Franklin Street, Boston, MA 02110-2804
© 2017 Columbia Management Investment Advisers, LLC.
investor.columbiathreadneedleus.com
Item 2. Code of Ethics.
Not applicable for semiannual reports.
Item 3. Audit Committee Financial Expert.
Not applicable for semiannual reports.
Item 4. Principal Accountant Fees and Services.
Not applicable for semiannual reports.
Item 5. Audit Committee of Listed Registrants.
Not applicable.
Item 6. Investments
| | (a) | The registrant’s “Schedule I – Investments in securities of unaffiliated issuers” (as set forth in 17 CFR 210.12-12) is included in Item 1 of this Form N-CSR. |
Item 7. Disclosure of Proxy Voting Policies and Procedures for Closed-End Management Investment Companies.
Not applicable.
Item 8. Portfolio Managers of Closed-End Management Investment Companies.
Not applicable.
Item 9. Purchases of Equity Securities by Closed-End Management Investment Company and Affiliated Purchasers.
Not applicable.
Item 10. Submission of Matters to a Vote of Security Holders.
There were no material changes to the procedures by which shareholders may recommend nominees to the registrant’s board of directors.
Item 11. Controls and Procedures.
| | (a) | The registrant’s principal executive officer and principal financial officer, based on their evaluation of the registrant’s disclosure controls and procedures as of a date within 90 days of the filing of this report, have concluded that such controls and procedures are adequately designed to ensure that material information required to be disclosed by the registrant in Form N-CSR is accumulated and communicated to the registrant’s management, including the principal executive officer and principal financial officer, or persons performing similar functions, as appropriate to allow timely decisions regarding required disclosure. |
| | (b) | There was no change in the registrant’s internal control over financial reporting that occurred during the registrant’s second fiscal quarter of the period covered by this report that has materially affected, or is reasonably likely to materially affect, the registrant’s internal control over financial reporting. |
Item 12. Exhibits.
(a)(1) Code of ethics required to be disclosed under Item 2 of Form N-CSR: Not applicable for semiannual reports.
(a)(2) Certifications pursuant to Rule 30a-2(a) under the Investment Company Act of 1940 (17 CFR 270.30a-2(a)) attached hereto as Exhibit 99.CERT.
(a)(3) Not applicable.
(b) Certification pursuant to Rule 30a-2(b) under the Investment Company Act of 1940 (17 CFR 270.30a-2(b)) attached hereto as Exhibit 99.906CERT.
SIGNATURES
Pursuant to the requirements of the Securities Exchange Act of 1934 and the Investment Company Act of 1940, the registrant has duly caused this report to be signed on its behalf by the undersigned, thereunto duly authorized.
| | | | |
| (registrant) | | Columbia Funds Series Trust II | | |
| | | | |
| By (Signature and Title) | | /s/ Christopher O. Petersen | | |
| | Christopher O. Petersen, President and Principal Executive Officer | | |
Pursuant to the requirements of the Securities Exchange Act of 1934 and the Investment Company Act of 1940, this report has been signed below by the following persons on behalf of the registrant and in the capacities and on the dates indicated.
| | | | |
| By (Signature and Title) | | /s/ Christopher O. Petersen | | |
| | Christopher O. Petersen, President and Principal Executive Officer | | |
| | | | |
| By (Signature and Title) | | /s/ Michael G. Clarke | | |
| | Michael G. Clarke, Treasurer and Chief Financial Officer | | |