UNITED STATES
SECURITIES AND EXCHANGE COMMISSION
Washington, D.C. 20549
FORM N-CSR
CERTIFIED SHAREHOLDER REPORT OF REGISTERED
MANAGEMENT INVESTMENT COMPANIES
Investment Company Act File Number 811-21852
COLUMBIA FUNDS SERIES TRUST II
(Exact name of registrant as specified in charter)
50606 Ameriprise Financial Center,
Minneapolis, Minnesota 55474
(Address of principal executive offices) (Zip code)
Scott R. Plummer—5228 Ameriprise Financial
Center, Minneapolis, MN 55474
(Name and address of agent for service)
Registrant’s telephone number, including area code: (612) 671-1947
Date of fiscal year end: October 31
Date of reporting period: April 30, 2012
Item 1. Reports to Stockholders.
Semiannual Report
Semiannual Report

Columbia
Absolute Return Currency and
Income Fund
Semiannual Report for the Period Ended April 30, 2012
Columbia Absolute Return Currency and Income Fund seeks to provide shareholders with positive absolute return.
Not FDIC insured ¡ No bank guarantee ¡ May lose value
| | | | |
| |
Your Fund at a Glance | | | 2 | |
| |
Fund Expense Example | | | 5 | |
| |
Portfolio of Investments | | | 7 | |
| |
Statement of Assets and Liabilities | | | 12 | |
| |
Statement of Operations | | | 14 | |
| |
Statement of Changes in Net Assets | | | 15 | |
| |
Financial Highlights | | | 17 | |
| |
Notes to Financial Statements | | | 23 | |
| |
Proxy Voting | | | 38 | |
| |
Approval of Investment Management Services Agreement | | | 38 | |
See the Fund’s prospectus for risks associated with investing in the Fund.
| | | | |
| COLUMBIA ABSOLUTE RETURN CURRENCY AND INCOME FUND — 2012 SEMIANNUAL REPORT | | | 1 | |
FUND SUMMARY
| > | | Columbia Absolute Return Currency and Income Fund (the Fund) Class A shares returned 2.61% (excluding sales charge) for the six months ended April 30, 2012. |
| > | | The Fund outperformed its benchmark, the Citigroup 3-month U.S. Treasury Bill Index, which rose 0.02% for the same timeframe. |
ANNUALIZED TOTAL RETURNS (for period ended April 30, 2012)
| | | | | | | | | | | | | | | | |
| | | 6 months* | | | 1 year | | | 5 years | | | Since
inception
06/15/06 | |
Columbia Absolute Return Currency and Income Fund (excluding sales charge) | | | +2.61% | | | | +0.89% | | | | +1.24% | | | | +2.45% | |
Citigroup 3-month U.S. Treasury Bill Index(1) (unmanaged) | | | +0.02% | | | | +0.04% | | | | +1.03% | | | | +1.60% | ** |
| ** | | Citigroup 3-month U.S. Treasury Bill Index is as of June 30, 2006. |
The performance information shown represents past performance and is not a guarantee of future results. The investment return and principal value of your investment will fluctuate so that your shares, when redeemed, may be worth more or less than their original cost. Current performance may be lower or higher than the performance information shown. You may obtain performance information current to the most recent month-end by contacting your financial intermediary, visiting columbiamanagement.com or calling 800.345.6611.
The 3.00% sales charge applicable to Class A shares of the Fund is not reflected in the table above. If reflected, returns would be lower than those shown. The performance of other classes may vary from that shown because of differences in fees and expenses. The Fund’s returns reflect the effect of fee waivers/expense reimbursements, if any. Without such waivers/reimbursements, the Fund’s returns would be lower. See the Average Annual Total Returns table for performance of other share classes of the Fund.
The index does not reflect the effects of sales charges, expenses and taxes. It is not possible to invest directly in an index.
| (1) | | The Citigroup 3-month U.S. Treasury Bill Index, an unmanaged index, represents the performance of three-month Treasury bills. The index reflects reinvestment of all distributions and changes in market prices. |
| | |
| 2 | | COLUMBIA ABSOLUTE RETURN CURRENCY AND INCOME FUND — 2012 SEMIANNUAL REPORT |
AVERAGE ANNUAL TOTAL RETURNS
| | | | | | | | | | | | | | | | |
| at April 30, 2012 | | | | | | | | | | | | |
| Without sales charge | | 6 months* | | | 1 year | | | 5 years | | | Since
inception | |
Class A (inception 6/15/06) | | | +2.61% | | | | +0.89% | | | | +1.24% | | | | +2.45% | |
Class B (inception 6/15/06) | | | +2.16% | | | | +0.10% | | | | +0.52% | | | | +1.72% | |
Class C (inception 6/15/06) | | | +2.16% | | | | +0.10% | | | | +0.53% | | | | +1.72% | |
Class I (inception 6/15/06) | | | +2.77% | | | | +1.46% | | | | +1.71% | | | | +2.91% | |
Class W** (inception 12/1/06) | | | +2.52% | | | | +0.79% | | | | +1.20% | | | | +2.40% | |
Class Z** (inception 9/27/10) | | | +2.77% | | | | +1.37% | | | | +1.36% | | | | +2.54% | |
| | | | |
| With sales charge | | | | | | | | | | | | |
Class A (inception 6/15/06) | | | -0.49% | | | | -2.11% | | | | +0.62% | | | | +1.91% | |
Class B (inception 6/15/06) | | | -2.84% | | | | -4.90% | | | | +0.14% | | | | +1.56% | |
Class C (inception 6/15/06) | | | +1.16% | | | | -0.90% | | | | +0.53% | | | | +1.72% | |
The “Without sales charge” returns for Class A, Class B and Class C shares do not include applicable initial or contingent deferred sales charges. If included, returns would be lower than those shown. The “With sales charge” returns for Class A, Class B and Class C shares include: the maximum initial sales charge of 3.00% for Class A shares; the applicable contingent deferred sales charge (CDSC) for Class B shares (applied as follows: first year 5%; second year 4%; third and fourth years 3%; fifth year 2%; sixth year 1%; no sales charge thereafter); and a 1% CDSC for Class C shares sold within one year after purchase. The Fund’s other share classes are not subject to sales charges and have limited eligibility. See the Fund’s prospectuses for details.
| ** | The returns shown for periods prior to the share class inception date (including returns since inception, which are since Fund inception) include the returns of the Fund’s Class A shares. These returns are adjusted to reflect any higher class-related operating expenses of the newer share classes, as applicable. Please visit columbiamanagement.com/mutual-fund/appended-performance for more information. |
| | | | |
| COLUMBIA ABSOLUTE RETURN CURRENCY AND INCOME FUND — 2012 SEMIANNUAL REPORT | | | 3 | |
| | |
| Your Fund at a Glance (continued) | | |
| | | | |
| PORTFOLIO BREAKDOWN(1) (at April 30, 2012) | | | |
Bonds | | | 8.3 | % |
Asset-Backed Securities — Agency | | | 2.1 | |
Commercial Mortgage-Backed Securities — Non-Agency | | | 2.6 | |
Corporate Bonds & Notes | | | 1.8 | |
Foreign Government Obligations | | | 1.8 | |
Short-Term Investments Segregated in Connection With Open Derivatives Contracts(2) | | | 91.7 | |
| (1) | | Percentages indicated are based upon total investments. The Fund's portfolio composition is subject to change. |
| (2) | | Includes investments in an affiliated money market fund (amounting to $103.4 million) which have been segregated to cover obligations relating to the Fund's investment in derivatives, which provides exposure to currencies. For a description of the Fund's investments in derivatives, see Investments in Derivatives following the Portfolio of Investments, and Note 2 to the financial statements. |
| | | | |
| QUALITY BREAKDOWN(1) (at April 30, 2012) | | | |
AAA rating | | | 75.9 | % |
AA rating | | | 23.6 | |
Non-investment grade | | | 0.5 | |
| (1) | | Percentages indicated are based upon total fixed income securities (excluding Investments of Cash Collateral Received for Securities on Loan and Money Market Funds). |
Bond ratings apply to the underlying holdings of the Fund and not the Fund itself and are divided into categories ranging from AAA (highest) to D (lowest), and are subject to change. The ratings shown are determined by using the middle rating of Moody’s, S&P, and Fitch after dropping the highest and lowest available ratings. When a rating from only two agencies is available, the lower rating is used. When a rating from only one agency is available, that rating is used. When a bond is not rated by one of these agencies, it is designated as Not rated. Credit ratings are subjective to opinions and not statements of fact.
| | |
| 4 | | COLUMBIA ABSOLUTE RETURN CURRENCY AND INCOME FUND — 2012 SEMIANNUAL REPORT |
(Unaudited)
Understanding your expenses
As an investor, you incur two types of costs. There are transaction costs, which generally include sales charges on purchases and may include redemption fees. There are also ongoing costs, which generally include management fees, distribution and service (Rule 12b-1) fees, and other fund expenses. The following information is intended to help you understand your ongoing costs (in dollars) of investing in the Fund and to help you compare these costs with the ongoing costs of investing in other mutual funds.
Analyzing your fund’s expenses
To illustrate these ongoing costs, we have provided examples and calculated the expenses paid by investors in each share class of the Fund during the period. The actual and hypothetical information in the table is based on an initial investment of $1,000 at the beginning of the period indicated and held for the entire period. Expense information is calculated two ways and each method provides you with different information. The amount listed in the “Actual” column is calculated using the Fund’s actual operating expenses and total return for the period. You may use the Actual information, together with the amount invested, to estimate the expenses that you paid over the period. Simply divide your account value by $1,000 (for example, an $8,600 account value divided by $1,000 = 8.6), then multiply the results by the expenses paid during the period under the Actual column. The amount listed in the “Hypothetical” column assumes a 5% annual rate of return before expenses (which is not the Fund’s actual return) and then applies the Fund’s actual expense ratio for the period to the hypothetical return. You should not use the hypothetical account values and expenses to estimate either your actual account balance at the end of the period or the expenses you paid during the period. See “Compare with other funds” below for details on how to use the hypothetical data.
Compare with other funds
Since all mutual funds are required to include the same hypothetical calculations about expenses in shareholder reports, you can use this information to compare the ongoing cost of investing in the Fund with other funds. To do so, compare the hypothetical example with the 5% hypothetical examples that appear in the shareholder reports of other funds. As you compare hypothetical examples of other funds, it is important to note that hypothetical examples are meant to highlight the ongoing costs of investing in a fund only and do not reflect any transaction costs, such as sales charges, or redemption or exchange fees. Therefore, the hypothetical calculations are useful in comparing ongoing costs only, and will not help you determine the relative total costs of owning different funds. If transaction costs were included in these calculations, your costs would be higher.
| | | | |
| COLUMBIA ABSOLUTE RETURN CURRENCY AND INCOME FUND — 2012 SEMIANNUAL REPORT | | | 5 | |
| | |
| Fund Expense Example (continued) | | |
November 1, 2011 — April 30, 2012
| | | | | | | | | | | | | | | | | | | | | | | | | | | | |
| | | Account value at the
beginning of the
period ($) | | | Account value at the
end of the period ($) | | | Expenses paid
during the period ($) | | | Fund’s
annualized
expense
ratio (%) | |
| | | Actual | | | Hypothetical | | | Actual | | | Hypothetical | | | Actual | | | Hypothetical | | | Actual | |
Class A | | | 1,000.00 | | | | 1,000.00 | | | | 1,026.10 | | | | 1,017.85 | | | | 7.10 | | | | 7.07 | | | | 1.41 | |
Class B | | | 1,000.00 | | | | 1,000.00 | | | | 1,021.60 | | | | 1,014.12 | | | | 10.86 | | | | 10.82 | | | | 2.16 | |
Class C | | | 1,000.00 | | | | 1,000.00 | | | | 1,021.60 | | | | 1,014.17 | | | | 10.81 | | | | 10.77 | | | | 2.15 | |
Class I | | | 1,000.00 | | | | 1,000.00 | | | | 1,027.70 | | | | 1,020.14 | | | | 4.79 | | | | 4.77 | | | | 0.95 | |
Class W | | | 1,000.00 | | | | 1,000.00 | | | | 1,025.20 | | | | 1,016.16 | | | | 8.81 | | | | 8.77 | | | | 1.75 | |
Class Z | | | 1,000.00 | | | | 1,000.00 | | | | 1,027.70 | | | | 1,019.99 | | | | 4.94 | | | | 4.92 | | | | 0.98 | |
Expenses paid during the period are equal to the annualized expense ratio for each class as indicated above, multiplied by the average account value over the period and then multiplied by the number of days in the Fund’s most recent fiscal half year and divided by 366.
Expenses do not include fees and expenses incurred indirectly by the Fund from the underlying funds in which the Fund may invest (also referred to as “acquired funds”), including affiliated and non-affiliated pooled investment vehicles (including mutual funds and exchange traded funds).
Columbia Management Investment Advisers, LLC and/or certain of its affiliates have contractually agreed to waive certain fees and to absorb certain expenses until February 28, 2013, unless sooner terminated at the sole discretion of the Fund’s Board, such that net expenses (excluding fees and expenses of acquired funds) will not exceed 1.32% for Class A, 2.07% for Class B, 2.07% for Class C, 0.87% for Class I, 1.32% for Class W and 1.07 for Class Z. Any amounts waived will not be reimbursed by the Fund. This change was effective January 1, 2012. If this change had been in place for the entire six month period ended April 30, 2012, the actual expenses paid would have been $6.65 for Class A, $10.40 for Class B, $10.40 for Class C, $4.39 for Class I, $6.65 for Class W and $5.39 for Class Z; the hypothetical expenses paid would have been $6.62 for Class A, $10.37 for Class B, $10.37 for Class C, $4.37 for Class I, $6.62 for Class W and $5.37 for Class Z.
| | |
| 6 | | COLUMBIA ABSOLUTE RETURN CURRENCY AND INCOME FUND — 2012 SEMIANNUAL REPORT |
Columbia Absolute Return Currency and Income Fund
April 30, 2012 (Unaudited)
(Percentages represent value of investments compared to net assets)
| | | | | | | | | | | | |
| Issuer | | Coupon
Rate | | | Principal
Amount | | | Value | |
| Corporate Bonds & Notes 1.8% | |
| | | | | | | | | | | | |
Agencies 1.8% | |
Bank of America Corp.
FDIC Government Guaranty(a) | |
06/22/12 | | | 0.674 | % | | | $2,000,000 | | | | $2,001,554 | |
Total Corporate Bonds & Notes | |
(Cost: $2,000,000) | | | | $2,001,554 | |
| | | | | | | | | | | | |
Commercial Mortgage-Backed
Securities - Non-Agency 2.6% | |
GS Mortgage Securities Corp. II(a)(b)(c)
Series 2007-EOP Class A2 | |
03/06/20 | | | 1.260 | % | | | $1,200,000 | | | | $1,183,469 | |
Series 2007-EOP Class A3 | |
03/06/20 | | | 1.456 | % | | | 1,770,000 | | | | 1,745,457 | |
Total Commercial Mortgage-Backed Securities - Non-Agency | |
(Cost: $2,926,031) | | | | $2,928,926 | |
| | | | | | | | | | | | |
Asset-Backed Securities -
Non-Agency 2.1% | |
Countrywide Home Equity Loan Trust
Series 2005-H Class 2A (FGIC)(a) | |
12/15/35 | | | 0.480 | % | | | $107,458 | | | | $48,504 | |
Northstar Education Finance, Inc.
Series 2007-1 Class A2(a) | |
01/29/46 | | | 1.216 | % | | | 750,000 | | | | 676,272 | |
SLM Student Loan Trust(a)
Series 2005-5 Class A2 | |
10/25/21 | | | 0.546 | % | | | 405,980 | | | | 404,145 | |
Series 2005-8 Class A2 | |
07/25/22 | | | 0.556 | % | | | 495,415 | | | | 494,005 | |
Series 2006-C Class A2 | |
09/15/20 | | | 0.524 | % | | | 194,492 | | | | 193,635 | |
Series 2007-2 Class A2 | |
07/25/17 | | | 0.466 | % | | | 579,502 | | | | 576,987 | |
Total Asset-Backed Securities - Non-Agency | |
(Cost: $2,515,417) | | | | $2,393,548 | |
| | | | | | | | | | | | |
| Issuer | | Coupon
Rate | | | Principal
Amount | | | Value | |
| Foreign Government Obligations 1.8% | |
| | | | | | | | | | | | |
UNITED KINGDOM 1.8% | |
Royal Bank of Scotland PLC (The)
Government Liquid Guaranteed(a)(c) | |
05/11/12 | | | 1.210 | % | | | $2,000,000 | | | | $2,000,391 | |
Total Foreign Government Obligations | |
(Cost: $2,000,000) | | | | $2,000,391 | |
| | | |
| | | | | | Shares | | | Value | |
| Money Market Funds 92.1% | |
Columbia Short-Term Cash Fund, 0.144%(d)(e) | | | | 103,424,843 | | | | $103,424,843 | |
Total Money Market Funds | |
(Cost: $103,424,843) | | | | $103,424,843 | |
Total Investments | |
(Cost: $112,866,291) | | | | $112,749,262 | |
Other Assets & Liabilities, Net | | | | (479,572 | ) |
Net Assets | | | | $112,269,690 | |
The accompanying Notes to Financial Statements are an integral part of this statement.
| | | | |
| COLUMBIA ABSOLUTE RETURN CURRENCY AND INCOME FUND — 2012 SEMIANNUAL REPORT | | | 7 | |
| | |
| Portfolio of Investments (continued) | | |
Investment in Derivatives
| | | | | | | | | | | | | | | | | | |
| Forward Foreign Currency Exchange Contracts Open at April 30, 2012 | |
| Counterparty | | Exchange Date | | | Currency to
be Delivered | | | Currency to
be Received | | Unrealized
Appreciation | | | Unrealized
Depreciation | |
| | | | | |
Goldman, Sachs & Co. | | | May 23, 2012 | | | | 20,545,000 (EUR | ) | | 26,839,988 (USD) | | | $— | | | | $(357,739 | ) |
State Street Bank & Trust Company | | | May 23, 2012 | | | | 6,691,000 (GBP | ) | | 10,597,540 (USD) | | | — | | | | (259,644 | ) |
HSBC Securities (USA), Inc. | | | May 23, 2012 | | | | 1,303,614,000 (JPY | ) | | 16,212,396 (USD) | | | — | | | | (118,556 | ) |
J.P. Morgan Securities, Inc. | | | May 23, 2012 | | | | 16,137,295 (USD | ) | | 93,555,000 (NOK) | | | 196,064 | | | | — | |
Citigroup Global Markets Inc. | | | May 23, 2012 | | | | 5,577,057 (USD | ) | | 6,893,000 (NZD) | | | 50,912 | | | | — | |
Citigroup Global Markets Inc. | | | May 23, 2012 | | | | 5,211,551 (USD | ) | | 6,376,000 (NZD) | | | — | | | | (5,701 | ) |
Morgan Stanley | | | May 23, 2012 | | | | 27,205,015 (USD | ) | | 183,136,000 (SEK) | | | 42,095 | | | | — | |
Total | | | | | | | | | | | | | $289,071 | | | | $(741,640 | ) |
| | |
| Notes to Portfolio of Investments |
| (a) | Variable rate security. The interest rate shown reflects the rate as of April 30, 2012. |
| (b) | The maturity dates shown represent the original maturity of the underlying obligation. Actual maturity may vary based upon prepayment activity on these obligations. Unless otherwise noted, the coupon rates presented are fixed rates. |
| (c) | Security exempt from registration pursuant to Rule 144A under the Securities Act of 1933. This security may be resold in transactions exempt from registration, normally to qualified institutional buyers. At April 30, 2012, the value of these securities amounted to $4,929,317 or 4.39% of net assets. |
| (d) | The rate shown is the seven-day current annualized yield at April 30, 2012. |
| (e) | Investments in affiliates during the period ended April 30, 2012: |
| | | | | | | | | | | | | | | | | | | | | | | | | | | | |
| Issuer | | Beginning
Cost | | | Purchase
Cost | | | Sales Cost/
Proceeds
from Sales | | | Realized
Gain/Loss | | | Ending
Cost | | | Dividends
or
Interest
Income | | | Value | |
Columbia Short-Term Cash Fund | | | $132,263,114 | | | | $10,345,715 | | | | $(39,183,986 | ) | | | $— | | | | $103,424,843 | | | | $85,786 | | | | $103,424,843 | |
| | |
| Abbreviation Legend |
| FDIC | | Federal Deposit Insurance Corporation |
| FGIC | | Financial Guaranty Insurance Company |
The accompanying Notes to Financial Statements are an integral part of this statement.
| | |
| 8 | | COLUMBIA ABSOLUTE RETURN CURRENCY AND INCOME FUND — 2012 SEMIANNUAL REPORT |
| | |
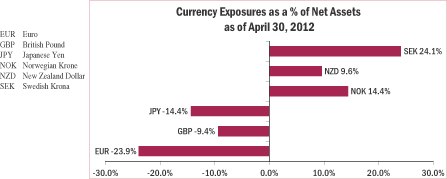
| Currency Legend |
| EUR | | Euro |
| GBP | | British Pound |
| JPY | | Japanese Yen |
| NOK | | Norwegian Krone |
| NZD | | New Zealand Dollar |
| SEK | | Swedish Krona |
| USD | | US Dollar |
The accompanying Notes to Financial Statements are an integral part of this statement.
| | | | |
| COLUMBIA ABSOLUTE RETURN CURRENCY AND INCOME FUND — 2012 SEMIANNUAL REPORT | | | 9 | |
| | |
| Portfolio of Investments (continued) | | |
Generally accepted accounting principles (GAAP) require disclosure regarding the inputs and valuation techniques used to measure fair value and any changes in valuation inputs or techniques. In addition, investments shall be disclosed by major category.
The Fund categorizes its fair value measurements according to a three-level hierarchy that maximizes the use of observable inputs and minimizes the use of unobservable inputs by prioritizing that the most observable input be used when available. Observable inputs are those that market participants would use in pricing an investment based on market data obtained from sources independent of the reporting entity. Unobservable inputs are those that reflect the Fund’s assumptions about the information market participants would use in pricing an investment. An investment’s level within the fair value hierarchy is based on the lowest level of any input that is deemed significant to the asset or liability’s fair value measurement. The input levels are not necessarily an indication of the risk or liquidity associated with investments at that level. For example, certain U.S. government securities are generally high quality and liquid, however, they are reflected as Level 2 because the inputs used to determine fair value may not always be quoted prices in an active market.
Fair value inputs are summarized in the three broad levels listed below:
| | Ÿ | | Level 1 — Valuations based on quoted prices for investments in active markets that the Fund has the ability to access at the measurement date (including NAV for open-end mutual funds). Valuation adjustments are not applied to Level 1 investments. |
| | Ÿ | | Level 2 — Valuations based on other significant observable inputs (including quoted prices for similar securities, interest rates, prepayment speeds, credit risks, etc.). |
| | Ÿ | | Level 3 — Valuations based on significant unobservable inputs (including the Fund’s own assumptions and judgment in determining the fair value of investments). |
Inputs that are used in determining fair value of an investment may include price information, credit data, volatility statistics, and other factors. These inputs can be either observable or unobservable. The availability of observable inputs can vary between investments, and is affected by various factors such as the type of investment, and the volume and level of activity for that investment or similar investments in the marketplace. The inputs will be considered by the Investment Manager, along with any other relevant factors in the calculation of an investment’s fair value. The Fund uses prices and inputs that are current as of the measurement date, which may include periods of market dislocations. During these periods, the availability of prices and inputs may be reduced for many investments. This condition could cause an investment to be reclassified between the various levels within the hierarchy.
Investments falling into the Level 3 category are primarily supported by quoted prices from brokers and dealers participating in the market for those investments. However, these may be classified as Level 3 investments due to lack of market transparency and corroboration to support these quoted prices. Additionally, valuation models may be used as the pricing source for any remaining investments classified as Level 3. These models rely on one or more significant unobservable inputs and/or significant assumptions by the Investment Manager. Inputs used in valuations may include, but are not limited to, financial statement analysis, capital account balances, discount rates and estimated cash flows, and comparable company data.
The accompanying Notes to Financial Statements are an integral part of this statement.
| | |
| 10 | | COLUMBIA ABSOLUTE RETURN CURRENCY AND INCOME FUND — 2012 SEMIANNUAL REPORT |
| | |
| Fair Value Measurements (continued) |
The following table is a summary of the inputs used to value the Fund’s investments as of April 30, 2012:
| | | | | | | | | | | | | | | | |
| | | Fair Value at April 30, 2012 | |
| Description | | Level 1
Quoted Prices
in Active
Markets for
Identical Assets | | | Level 2
Other
Significant
Observable
Inputs | | | Level 3
Significant
Unobservable
Inputs | | | Total | |
| Bonds | | | | | | | | | | | | | | | | |
Corporate Bonds & Notes | | | $— | | | | $2,001,554 | | | | $— | | | | $2,001,554 | |
Commercial Mortgage-Backed
Securities — Non-Agency | | | — | | | | 2,928,926 | | | | — | | | | 2,928,926 | |
Asset-Backed Securities — Non-Agency | | | — | | | | 2,393,548 | | | | — | | | | 2,393,548 | |
Foreign Government Obligations | | | — | | | | 2,000,391 | | | | — | | | | 2,000,391 | |
| Total Bonds | | | — | | | | 9,324,419 | | | | — | | | | 9,324,419 | |
| Other | | | | | | | | | | | | | | | | |
Money Market Funds | | | 103,424,843 | | | | — | | | | — | | | | 103,424,843 | |
| Total Other | | | 103,424,843 | | | | — | | | | — | | | | 103,424,843 | |
| Investments in Securities | | | 103,424,843 | | | | 9,324,419 | | | | — | | | | 112,749,262 | |
| Derivatives | | | | | | | | | | | | | | | | |
Assets | | | | | | | | | | | | | | | | |
Forward Foreign Currency
Exchange Contracts | | | — | | | | 289,071 | | | | — | | | | 289,071 | |
Liabilities | | | | | | | | | | | | | | | | |
Forward Foreign Currency
Exchange Contracts | | | — | | | | (741,640 | ) | | | — | | | | (741,640 | ) |
| Total | | | $103,424,843 | | | | $8,871,850 | | | | $— | | | | $112,296,693 | |
See the Portfolio of Investments for all investment classifications not indicated in the table.
The Fund’s assets assigned to the Level 2 input category are generally valued using the market approach, in which a security’s value is determined through reference to prices and information from market transactions for similar or identical assets.
There were no transfers of financial assets between Levels 1 and 2 during the period.
Derivative instruments are valued at unrealized appreciation (depreciation).
How to find information about the Fund’s quarterly portfolio holdings
| (i) | The Fund files its complete schedule of portfolio holdings with the Securities and Exchange Commission (SEC) for the first and third quarters of each fiscal year on Form N-Q; |
| (ii) | The Fund’s Forms N-Q are available on the SEC’s website at www.sec.gov; |
| (iii) | The Fund’s Forms N-Q may be reviewed and copied at the SEC’s Public Reference Room in Washington, DC (information on the operations of the Public Reference Room may be obtained by calling 800.SEC.0330); and |
| (iv) | The Fund’s complete schedule of portfolio holdings, as filed on Form N-Q, can be obtained without charge, upon request, by calling 800.345.6611. |
The accompanying Notes to Financial Statements are an integral part of this statement.
| | | | |
| COLUMBIA ABSOLUTE RETURN CURRENCY AND INCOME FUND — 2012 SEMIANNUAL REPORT | | | 11 | |
| | |
| Statement of Assets and Liabilities | | |
April 30, 2012 (Unaudited)
| | | | | |
Assets | |
Investments, at value | | | | | |
Unaffiliated issuers (identified cost $9,441,448) | | | $ | 9,324,419 | |
Affiliated issuers (identified cost $103,424,843) | | | | 103,424,843 | |
Total investments (identified cost $112,866,291) | | | | 112,749,262 | |
Cash | | | | 207,615 | |
Unrealized appreciation on forward foreign currency exchange contracts | | | | 289,071 | |
Receivable for: | | | | | |
Investments sold | | | | 49,724 | |
Capital shares sold | | | | 60,166 | |
Dividends | | | | 13,369 | |
Interest | | | | 9,891 | |
Expense reimbursement due from Investment Manager | | | | 2,450 | |
Prepaid expense | | | | 109 | |
Total assets | | | | 113,381,657 | |
Liabilities | | | | | |
Unrealized depreciation on forward foreign currency exchange contracts | | | | 741,640 | |
Payable for: | | | | | |
Investments purchased | | | | 3,551 | |
Capital shares purchased | | | | 253,757 | |
Investment management fees | | | | 8,218 | |
Distribution fees | | | | 1,241 | |
Transfer agent fees | | | | 54,270 | |
Administration fees | | | | 739 | |
Compensation of board members | | | | 9,953 | |
Other expenses | | | | 38,598 | |
Total liabilities | | | | 1,111,967 | |
Net assets applicable to outstanding capital stock | | | $ | 112,269,690 | |
The accompanying Notes to Financial Statements are an integral part of this statement.
| | |
| 12 | | COLUMBIA ABSOLUTE RETURN CURRENCY AND INCOME FUND — 2012 SEMIANNUAL REPORT |
April 30, 2012 (Unaudited)
| | | | | |
Represented by | | | | | |
Paid-in capital | | | $ | 111,092,310 | |
Excess of distributions over net investment income | | | | (599,924 | ) |
Accumulated net realized gain | | | | 2,346,902 | |
Unrealized appreciation (depreciation) on: | | | | | |
Investments | | | | (117,029 | ) |
Forward foreign currency exchange contracts | | | | (452,569 | ) |
Total — representing net assets applicable to outstanding capital stock | | | $ | 112,269,690 | |
Net assets applicable to outstanding shares | | | | | |
Class A | | | $ | 35,036,206 | |
Class B | | | $ | 608,643 | |
Class C | | | $ | 2,926,258 | |
Class I | | | $ | 53,484,868 | |
Class W | | | $ | 11,130,045 | |
Class Z | | | $ | 9,083,670 | |
Shares outstanding | | | | | |
Class A | | | | 3,432,050 | |
Class B | | | | 61,267 | |
Class C | | | | 294,876 | |
Class I | | | | 5,147,798 | |
Class W | | | | 1,092,481 | |
Class Z | | | | 874,096 | |
Net asset value per share | | | | | |
Class A(a) | | | $ | 10.21 | |
Class B | | | $ | 9.93 | |
Class C | | | $ | 9.92 | |
Class I | | | $ | 10.39 | |
Class W | | | $ | 10.19 | |
Class Z | | | $ | 10.39 | |
| (a) | The maximum offering price per share for Class A is $10.53. The offering price is calculated by dividing the net asset value by 1.0 minus the maximum sales charge of 3.00%. |
The accompanying Notes to Financial Statements are an integral part of this statement.
| | | | |
| COLUMBIA ABSOLUTE RETURN CURRENCY AND INCOME FUND — 2012 SEMIANNUAL REPORT | | | 13 | |
Six months ended April 30, 2012 (Unaudited)
| | | | | |
Net investment income | |
Income: | | | | | |
Interest | | | $ | 65,934 | |
Dividends from affiliates | | | | 85,786 | |
Total income | | | | 151,720 | |
Expenses: | | | | | |
Investment management fees | | | | 534,959 | |
Distribution fees | | | | | |
Class A | | | | 46,698 | |
Class B | | | | 3,256 | |
Class C | | | | 15,548 | |
Class W | | | | 20,126 | |
Transfer agent fees | | | | | |
Class A | | | | 38,907 | |
Class B | | | | 688 | |
Class C | | | | 3,112 | |
Class W | | | | 43,145 | |
Class Z | | | | 1,824 | |
Administration fees | | | | 48,086 | |
Compensation of board members | | | | 5,000 | |
Custodian fees | | | | 2,129 | |
Printing and postage fees | | | | 32,759 | |
Registration fees | | | | 29,856 | |
Professional fees | | | | 24,602 | |
Other | | | | 6,891 | |
Total expenses | | | | 857,586 | |
Fees waived or expenses reimbursed by Investment Manager and its affiliates | | | | (113,121 | ) |
Total net expenses | | | | 744,465 | |
Net investment loss | | | | (592,745 | ) |
Realized and unrealized gain (loss) — net | |
Net realized gain (loss) on: | | | | | |
Investments | | | | 21,537 | |
Forward foreign currency exchange contracts | | | | 4,278,338 | |
Net realized gain | | | | 4,299,875 | |
Net change in unrealized appreciation (depreciation) on: | | | | | |
Investments | | | | (29,688 | ) |
Forward foreign currency exchange contracts | | | | (430,338 | ) |
Net change in unrealized depreciation | | | | (460,026 | ) |
Net realized and unrealized gain | | | | 3,839,849 | |
Net increase in net assets resulting from operations | | | $ | 3,247,104 | |
The accompanying Notes to Financial Statements are an integral part of this statement.
| | |
| 14 | | COLUMBIA ABSOLUTE RETURN CURRENCY AND INCOME FUND — 2012 SEMIANNUAL REPORT |
| | |
| Statements of Changes in Net Assets | | |
| | | | | | | | | | |
| | | Six months ended
April 30, 2012 | | Year ended
October 31, 2011 |
| | | (Unaudited) | | |
Operations | |
Net investment loss | | | $ | (592,745 | ) | | | $ | (2,286,684 | ) |
Net realized gain (loss) | | | | 4,299,875 | | | | | (1,650,824 | ) |
Net change in unrealized appreciation (depreciation) | | | | (460,026 | ) | | | | 1,981,432 | |
Net increase (decrease) in net assets resulting from operations | | | | 3,247,104 | | | | | (1,956,076 | ) |
Increase (decrease) in net assets from share transactions | | | | (33,673,441 | ) | | | | (25,367,036 | ) |
Total decrease in net assets | | | | (30,426,337 | ) | | | | (27,323,112 | ) |
Net assets at beginning of period | | | | 142,696,027 | | | | | 170,019,139 | |
Net assets at end of period | | | $ | 112,269,690 | | | | $ | 142,696,027 | |
Excess of distributions over net investment income | | | $ | (599,924 | ) | | | $ | (7,179 | ) |
The accompanying Notes to Financial Statements are an integral part of this statement.
| | | | |
| COLUMBIA ABSOLUTE RETURN CURRENCY AND INCOME FUND — 2012 SEMIANNUAL REPORT | | | 15 | |
| | |
| Statements of Changes in Net Assets (continued) | | |
| | | | | | | | | | | | | | | | | | | | |
| | | Six months ended
April 30, 2012
(Unaudited) | | Year ended
October 31, 2011 |
| | | Shares | | Dollars ($) | | Shares | | Dollars ($) |
Capital stock activity | | | | | | | | | | | | | | | | | | | | |
Class A shares | | | | | | | | | | | | | | | | | | | | |
Subscriptions(a) | | | | 359,171 | | | | | 3,644,547 | | | | | 1,251,491 | | | | | 12,532,928 | |
Redemptions | | | | (1,022,389 | ) | | | | (10,329,947 | ) | | | | (3,375,910 | ) | | | | (33,903,777 | ) |
Net decrease | | | | (663,218 | ) | | | | (6,685,400 | ) | | | | (2,124,419 | ) | | | | (21,370,849 | ) |
Class B shares | | | | | | | | | | | | | | | | | | | | |
Subscriptions | | | | 3,529 | | | | | 34,759 | | | | | 31,072 | | | | | 305,161 | |
Redemptions(a) | | | | (14,018 | ) | | | | (138,362 | ) | | | | (61,533 | ) | | | | (603,991 | ) |
Net decrease | | | | (10,489 | ) | | | | (103,603 | ) | | | | (30,461 | ) | | | | (298,830 | ) |
Class C shares | | | | | | | | | | | | | | | | | | | | |
Subscriptions | | | | 23,629 | | | | | 233,248 | | | | | 81,907 | | | | | 804,381 | |
Redemptions | | | | (71,948 | ) | | | | (708,771 | ) | | | | (216,896 | ) | | | | (2,133,457 | ) |
Net decrease | | | | (48,319 | ) | | | | (475,523 | ) | | | | (134,989 | ) | | | | (1,329,076 | ) |
Class I shares | | | | | | | | | | | | | | | | | | | | |
Subscriptions | | | | 314,078 | | | | | 3,239,463 | | | | | 12,643,001 | | | | | 128,114,306 | |
Redemptions | | | | (1,860,456 | ) | | | | (18,977,611 | ) | | | | (9,785,869 | ) | | | | (98,320,174 | ) |
Net increase (decrease) | | | | (1,546,378 | ) | | | | (15,738,148 | ) | | | | 2,857,132 | | | | | 29,794,132 | |
Class W shares | | | | | | | | | | | | | | | | | | | | |
Subscriptions | | | | 215,872 | | | | | 2,173,350 | | | | | 1,817,360 | | | | | 18,226,039 | |
Redemptions | | | | (1,553,991 | ) | | | | (15,659,507 | ) | | | | (5,728,728 | ) | | | | (56,478,697 | ) |
Net decrease | | | | (1,338,119 | ) | | | | (13,486,157 | ) | | | | (3,911,368 | ) | | | | (38,252,658 | ) |
Class Z shares | | | | | | | | | | | | | | | | | | | | |
Subscriptions | | | | 427,896 | | | | | 4,411,482 | | | | | 703,290 | | | | | 7,134,897 | |
Redemptions | | | | (154,970 | ) | | | | (1,596,092 | ) | | | | (103,525 | ) | | | | (1,044,652 | ) |
Net increase | | | | 272,926 | | | | | 2,815,390 | | | | | 599,765 | | | | | 6,090,245 | |
Total net decrease | | | | (3,333,597 | ) | | | | (33,673,441 | ) | | | | (2,744,340 | ) | | | | (25,367,036 | ) |
| (a) | Includes conversions of Class B shares to Class A shares, if any. The line items from the prior year have been combined to conform to the current year presentation. |
The accompanying Notes to Financial Statements are an integral part of this statement.
| | |
| 16 | | COLUMBIA ABSOLUTE RETURN CURRENCY AND INCOME FUND — 2012 SEMIANNUAL REPORT |
The following tables are intended to help you understand the Fund’s financial performance. Certain information reflects financial results for a single share of a class held for the periods shown. Per share net investment income (loss) amounts are calculated based on average shares outstanding during the period. Total returns assume reinvestment of all dividends and distributions. Total returns do not reflect payment of sales charges, if any, and are not annualized for periods of less than one year.
| | | | | | | | | | | | | | | | | | | | | | | | | | | | | | |
| | | Six months
ended April 30,
2012 | | Year ended Oct. 31, |
| | | | 2011 | | 2010 | | 2009 | | 2008 | | 2007 |
| | | (Unaudited) | | | | | | | | | | |
Class A | | | | | | | | | | | | | | | | | | | | | | | | | | | | | | |
Per share data | | | | | | | | | | | | | | | | | | | | | | | | | | | | | | |
Net asset value, beginning of period | | | | $9.95 | | | | | $10.00 | | | | | $9.93 | | | | | $9.97 | | | | | $10.58 | | | | | $10.09 | |
Income from investment operations: | | | | | | | | | | | | | | | | | | | | | | | | | | | | | | |
Net investment income (loss) | | | | (0.06 | ) | | | | (0.15 | ) | | | | (0.12 | ) | | | | (0.08 | ) | | | | 0.15 | | | | | 0.41 | |
Net realized and unrealized gain (loss) | | | | 0.32 | | | | | 0.10 | | | | | 0.19 | | | | | 0.09 | | | | | (0.22 | ) | | | | 0.57 | |
Total from investment operations | | | | 0.26 | | | | | (0.05 | ) | | | | 0.07 | | | | | 0.01 | | | | | (0.07 | ) | | | | 0.98 | |
Less distributions to shareholders from: | | | | | | | | | | | | | | | | | | | | | | | | | | | | | | |
Net investment income | | | | — | | | | | — | | | | | — | | | | | (0.00 | )(a) | | | | (0.18 | ) | | | | (0.39 | ) |
Net realized gains | | | | — | | | | | — | | | | | — | | | | | (0.05 | ) | | | | (0.36 | ) | | | | (0.10 | ) |
Total distributions to shareholders | | | | — | | | | | — | | | | | — | | | | | (0.05 | ) | | | | (0.54 | ) | | | | (0.49 | ) |
Net asset value, end of period | | | | $10.21 | | | | | $9.95 | | | | | $10.00 | | | | | $9.93 | | | | | $9.97 | | | | | $10.58 | |
Total return | | | | 2.61% | | | | | (0.50% | ) | | | | 0.71% | | | | | 0.15% | | | | | (0.57% | ) | | | | 9.96% | (b) |
Ratios to average net assets(c) | | | | | | | | | | | | | | | | | | | | | | | | | | | | | | |
Expenses prior to fees waived or expenses reimbursed | | | | 1.60% | (d) | | | | 1.73% | | | | | 1.47% | | | | | 1.38% | | | | | 1.39% | | | | | 1.36% | |
Net expenses after fees waived or expenses reimbursed(e) | | | | 1.41% | (d) | | | | 1.73% | | | | | 1.47% | | | | | 1.38% | | | | | 1.39% | | | | | 1.36% | |
Net investment income (loss) | | | | (1.15% | )(d) | | | | (1.48% | ) | | | | (1.19% | ) | | | | (0.83% | ) | | | | 1.50% | | | | | 3.98% | |
Supplemental data | | | | | | | | | | | | | | | | | | | | | | | | | | | | | | |
Net assets, end of period (in thousands) | | | | $35,036 | | | | | $40,755 | | | | | $62,209 | | | | | $114,238 | | | | | $175,659 | | | | | $8,851 | |
Portfolio turnover | | | | 0% | | | | | 0% | | | | | 0% | | | | | 16% | | | | | 39% | | | | | 36% | |
Notes to Financial Highlights
| (a) | Rounds to less than $0.01. |
| (b) | During the year ended October 31, 2007, Ameriprise Financial reimbursed the Fund for a loss on a trading error. Had the Fund not received this reimbursement, total return would have been lower by 0.05%. |
| (c) | In addition to the fees and expenses which the Fund bears directly, the Fund indirectly bears a pro rata share of the fees and expenses of the acquired funds in which it invests. Such indirect expenses are not included in the reported expense ratios. |
| (e) | The Investment Manager and certain of its affiliates agreed to waive/reimburse certain fees and expenses, if applicable. |
The accompanying Notes to Financial Statements are an integral part of this statement.
| | | | |
| COLUMBIA ABSOLUTE RETURN CURRENCY AND INCOME FUND — 2012 SEMIANNUAL REPORT | | | 17 | |
| | |
| Financial Highlights (continued) | | |
| | | | | | | | | | | | | | | | | | | | | | | | |
| | | Six months
ended April 30,
2012 | | | Year ended Oct. 31, | |
| | | | 2011 | | | 2010 | | | 2009 | | | 2008 | | | 2007 | |
| | | (Unaudited) | | | | | | | | | | | | | | | | |
Class B | | | | | | | | | | | | | | | | | | | | | | | | |
Per share data | | | | | | | | | | | | | | | | | | | | | | | | |
Net asset value, beginning of period | | | $9.72 | | | | $9.85 | | | | $9.85 | | | | $9.96 | | | | $10.58 | | | | $10.09 | |
Income from investment operations: | | | | | | | | | | | | | | | | | | | | | | | | |
Net investment income (loss) | | | (0.09 | ) | | | (0.22 | ) | | | (0.19 | ) | | | (0.16 | ) | | | 0.04 | | | | 0.34 | |
Net realized and unrealized gain (loss) | | | 0.30 | | | | 0.09 | | | | 0.19 | | | | 0.10 | | | | (0.18 | ) | | | 0.59 | |
Total from investment operations | | | 0.21 | | | | (0.13 | ) | | | — | | | | (0.06 | ) | | | (0.14 | ) | | | 0.93 | |
Less distributions to shareholders from: | | | | | | | | | | | | | | | | | | | | | | | | |
Net investment income | | | — | | | | — | | | | — | | | | — | | | | (0.12 | ) | | | (0.34 | ) |
Net realized gains | | | — | | | | — | | | | — | | | | (0.05 | ) | | | (0.36 | ) | | | (0.10 | ) |
Total distributions to shareholders | | | — | | | | — | | | | — | | | | (0.05 | ) | | | (0.48 | ) | | | (0.44 | ) |
Net asset value, end of period | | | $9.93 | | | | $9.72 | | | | $9.85 | | | | $9.85 | | | | $9.96 | | | | $10.58 | |
Total return | | | 2.16% | | | | (1.32% | ) | | | 0.00% | (a) | | | (0.56% | ) | | | (1.35% | ) | | | 9.38% | (b) |
Ratios to average net assets(c) | | | | | | | | | | | | | | | | | | | | | | | | |
Expenses prior to fees waived or
expenses reimbursed | | | 2.35% | (d) | | | 2.47% | | | | 2.23% | | | | 2.14% | | | | 2.16% | | | | 2.10% | |
Net expenses after fees waived or
expenses reimbursed(e) | | | 2.16% | (d) | | | 2.47% | | | | 2.23% | | | | 2.14% | | | | 2.16% | | | | 2.10% | |
Net investment income (loss) | | | (1.91% | )(d) | | | (2.21% | ) | | | (1.95% | ) | | | (1.59% | ) | | | 0.38% | | | | 3.26% | |
Supplemental data | | | | | | | | | | | | | | | | | | | | | | | | |
Net assets, end of period (in thousands) | | | $609 | | | | $698 | | | | $1,006 | | | | $2,026 | | | | $3,269 | | | | $11 | |
Portfolio turnover | | | 0% | | | | 0% | | | | 0% | | | | 16% | | | | 39% | | | | 36% | |
Notes to Financial Highlights
| (a) | Rounds to less than 0.01%. |
| (b) | During the year ended October 31, 2007, Ameriprise Financial reimbursed the Fund for a loss on a trading error. Had the Fund not received this reimbursement, total return would have been lower by 0.05%. |
| (c) | In addition to the fees and expenses which the Fund bears directly, the Fund indirectly bears a pro rata share of the fees and expenses of the acquired funds in which it invests. Such indirect expenses are not included in the reported expense ratios. |
| (e) | The Investment Manager and certain of its affiliates agreed to waive/reimburse certain fees and expenses, if applicable. |
The accompanying Notes to Financial Statements are an integral part of this statement.
| | |
| 18 | | COLUMBIA ABSOLUTE RETURN CURRENCY AND INCOME FUND — 2012 SEMIANNUAL REPORT |
| | | | | | | | | | | | | | | | | | | | | | | | | | | | | | |
| | | Six months
ended April 30, 2012 | | Year ended Oct. 31, |
| | | | 2011 | | 2010 | | 2009 | | 2008 | | 2007 |
| | | (Unaudited) | | | | | | | | | | |
Class C | | | | | | | | | | | | | | | | | | | | | | | | | | | | | | |
Per share data | | | | | | | | | | | | | | | | | | | | | | | | | | | | | | |
Net asset value, beginning of period | | | | $9.71 | | | | | $9.83 | | | | | $9.84 | | | | | $9.95 | | | | | $10.57 | | | | | $10.09 | |
Income from investment operations: | | | | | | | | | | | | | | | | | | | | | | | | | | | | | | |
Net investment income (loss) | | | | (0.09 | ) | | | | (0.22 | ) | | | | (0.19 | ) | | | | (0.16 | ) | | | | 0.06 | | | | | 0.34 | |
Net realized and unrealized gain (loss) | | | | 0.30 | | | | | 0.10 | | | | | 0.18 | | | | | 0.10 | | | | | (0.20 | ) | | | | 0.58 | |
Total from investment operations | | | | 0.21 | | | | | (0.12 | ) | | | | (0.01 | ) | | | | (0.06 | ) | | | | (0.14 | ) | | | | 0.92 | |
Less distributions to shareholders from: | | | | | | | | | | | | | | | | | | | | | | | | | | | | | | |
Net investment income | | | | — | | | | | — | | | | | — | | | | | — | | | | | (0.12 | ) | | | | (0.34 | ) |
Net realized gains | | | | — | | | | | — | | | | | — | | | | | (0.05 | ) | | | | (0.36 | ) | | | | (0.10 | ) |
Total distributions to shareholders | | | | — | | | | | — | | | | | — | | | | | (0.05 | ) | | | | (0.48 | ) | | | | (0.44 | ) |
Net asset value, end of period | | | | $9.92 | | | | | $9.71 | | | | | $9.83 | | | | | $9.84 | | | | | $9.95 | | | | | $10.57 | |
Total return | | | | 2.16% | | | | | (1.22% | ) | | | | (0.10% | ) | | | | (0.56% | ) | | | | (1.31% | ) | | | | 9.37% | (a) |
Ratios to average net assets(b) | | | | | | | | | | | | | | | | | | | | | | | | | | | | | | |
Expenses prior to fees waived or expenses reimbursed | | | | 2.34% | (c) | | | | 2.48% | | | | | 2.22% | | | | | 2.14% | | | | | 2.15% | | | | | 2.12% | |
Net expenses after fees waived or expenses reimbursed(d) | | | | 2.15% | (c) | | | | 2.48% | | | | | 2.22% | | | | | 2.14% | | | | | 2.15% | | | | | 2.12% | |
Net investment income (loss) | | | | (1.89% | )(c) | | | | (2.23% | ) | | | | (1.94% | ) | | | | (1.60% | ) | | | | 0.66% | | | | | 3.42% | |
Supplemental data | | | | | | | | | | | | | | | | | | | | | | | | | | | | | | |
Net assets, end of period (in thousands) | | | | $2,926 | | | | | $3,333 | | | | | $4,703 | | | | | $7,609 | | | | | $9,463 | | | | | $220 | |
Portfolio turnover | | | | 0% | | | | | 0% | | | | �� | 0% | | | | | 16% | | | | | 39% | | | | | 36% | |
Notes to Financial Highlights
| (a) | During the year ended October 31, 2007, Ameriprise Financial reimbursed the Fund for a loss on a trading error. Had the Fund not received this reimbursement, total return would have been lower by 0.05%. |
| (b) | In addition to the fees and expenses which the Fund bears directly, the Fund indirectly bears a pro rata share of the fees and expenses of the acquired funds in which it invests. Such indirect expenses are not included in the reported expense ratios. |
| (d) | The Investment Manager and certain of its affiliates agreed to waive/reimburse certain fees and expenses, if applicable. |
The accompanying Notes to Financial Statements are an integral part of this statement.
| | | | |
| COLUMBIA ABSOLUTE RETURN CURRENCY AND INCOME FUND — 2012 SEMIANNUAL REPORT | | | 19 | |
| | |
| Financial Highlights (continued) | | |
| | | | | | | | | | | | | | | | | | | | | | | | | | | | | | |
| | | Six months
ended April 30, 2012 | | Year ended Oct. 31, |
| | | | 2011 | | 2010 | | 2009 | | 2008 | | 2007 |
| | | (Unaudited) | | | | | | | | | | |
Class I | | | | | | | | | | | | | | | | | | | | | | | | | | | | | | |
Per share data | | | | | | | | | | | | | | | | | | | | | | | | | | | | | | |
Net asset value, beginning of period | | | | $10.11 | | | | | $10.09 | | | | | $9.98 | | | | | $9.98 | | | | | $10.59 | | | | | $10.10 | |
Income from investment operations: | | | | | | | | | | | | | | | | | | | | | | | | | | | | | | |
Net investment income (loss) | | | | (0.04 | ) | | | | (0.08 | ) | | | | (0.08 | ) | | | | (0.04 | ) | | | | 0.21 | | | | | 0.44 | |
Net realized and unrealized gain (loss) | | | | 0.32 | | | | | 0.10 | | | | | 0.19 | | | | | 0.10 | | | | | (0.24 | ) | | | | 0.59 | |
Total from investment operations | | | | 0.28 | | | | | 0.02 | | | | | 0.11 | | | | | 0.06 | | | | | (0.03 | ) | | | | 1.03 | |
Less distributions to shareholders from: | | | | | | | | | | | | | | | | | | | | | | | | | | | | | | |
Net investment income | | | | — | | | | | — | | | | | — | | | | | (0.01 | ) | | | | (0.22 | ) | | | | (0.44 | ) |
Net realized gains | | | | — | | | | | — | | | | | — | | | | | (0.05 | ) | | | | (0.36 | ) | | | | (0.10 | ) |
Total distributions to shareholders | | | | — | | | | | — | | | | | — | | | | | (0.06 | ) | | | | (0.58 | ) | | | | (0.54 | ) |
Net asset value, end of period | | | | $10.39 | | | | | $10.11 | | | | | $10.09 | | | | | $9.98 | | | | | $9.98 | | | | | $10.59 | |
Total return | | | | 2.77% | | | | | 0.20% | | | | | 1.10% | | | | | 0.56% | | | | | (0.25% | ) | | | | 10.49% | (a) |
Ratios to average net assets(b) | | | | | | | | | | | | | | | | | | | | | | | | | | | | | | |
Expenses prior to fees waived or expenses reimbursed | | | | 1.14% | (c) | | | | 1.05% | | | | | 1.07% | | | | | 1.01% | | | | | 1.03% | | | | | 1.07% | |
Net expenses after fees waived or expenses reimbursed(d) | | | | 0.95% | (c) | | | | 1.05% | | | | | 1.07% | | | | | 1.01% | | | | | 1.03% | | | | | 1.07% | |
Net investment income (loss) | | | | (0.70% | )(c) | | | | (0.84% | ) | | | | (0.79% | ) | | | | (0.40% | ) | | | | 2.10% | | | | | 4.30% | |
Supplemental data | | | | | | | | | | | | | | | | | | | | | | | | | | | | | | |
Net assets, end of period (in thousands) | | | | $53,485 | | | | | $67,660 | | | | | $38,718 | | | | | $28,926 | | | | | $202,106 | | | | | $121,970 | |
Portfolio turnover | | | | 0% | | | | | 0% | | | | | 0% | | | | | 16% | | | | | 39% | | | | | 36% | |
Notes to Financial Highlights
| (a) | During the year ended October 31, 2007, Ameriprise Financial reimbursed the Fund for a loss on a trading error. Had the Fund not received this reimbursement, total return would have been lower by 0.05%. |
| (b) | In addition to the fees and expenses which the Fund bears directly, the Fund indirectly bears a pro rata share of the fees and expenses of the acquired funds in which it invests. Such indirect expenses are not included in the reported expense ratios. |
| (d) | The Investment Manager and certain of its affiliates agreed to waive/reimburse certain fees and expenses, if applicable. |
The accompanying Notes to Financial Statements are an integral part of this statement.
| | |
| 20 | | COLUMBIA ABSOLUTE RETURN CURRENCY AND INCOME FUND — 2012 SEMIANNUAL REPORT |
| | | | | | | | | | | | | | | | | | | | | | | | |
| | | Six months
ended April 30, 2012 | | | Year ended Oct. 31, | |
| | | | 2011 | | | 2010 | | | 2009 | | | 2008 | | | 2007(a) | |
| | | (Unaudited) | | | | | | | | | | | | | | | | |
Class W | | | | | | | | | | | | | | | | | | | | | | | | |
Per share data | | | | | | | | | | | | | | | | | | | | | | | | |
Net asset value, beginning of period | | | $9.94 | | | | $9.99 | | | | $9.92 | | | | $9.97 | | | | $10.58 | | | | $10.13 | |
Income from investment operations: | | | | | | | | | | | | | | | | | | | | | | | | |
Net investment income (loss) | | | (0.08 | ) | | | (0.15 | ) | | | (0.12 | ) | | | (0.08 | ) | | | 0.11 | | | | 0.36 | |
Net realized and unrealized gain (loss) | | | 0.33 | | | | 0.10 | | | | 0.19 | | | | 0.08 | | | | (0.19 | ) | | | 0.55 | |
Total from investment operations | | | 0.25 | | | | (0.05 | ) | | | 0.07 | | | | — | | | | (0.08 | ) | | | 0.91 | |
Less distributions to shareholders from: | | | | | | | | | | | | | | | | | | | | | | | | |
Net investment income | | | — | | | | — | | | | — | | | | — | | | | (0.17 | ) | | | (0.36 | ) |
Net realized gains | | | — | | | | — | | | | — | | | | (0.05 | ) | | | (0.36 | ) | | | (0.10 | ) |
Total distributions to shareholders | | | — | | | | — | | | | — | | | | (0.05 | ) | | | (0.53 | ) | | | (0.46 | ) |
Net asset value, end of period | | | $10.19 | | | | $9.94 | | | | $9.99 | | | | $9.92 | | | | $9.97 | | | | $10.58 | |
Total return | | | 2.52% | | | | (0.50% | ) | | | 0.71% | | | | 0.04% | | | | (0.66% | ) | | | 9.21% | (b) |
Ratios to average net assets(c) | | | | | | | | | | | | | | | | | | | | | | | | |
Expenses prior to fees waived or expenses reimbursed | | | 1.92% | (d) | | | 1.71% | | | | 1.51% | | | | 1.46% | | | | 1.50% | | | | 1.54% | (d) |
Net expenses after fees waived or expenses reimbursed(e) | | | 1.75% | (d) | | | 1.71% | | | | 1.51% | | | | 1.46% | | | | 1.50% | | | | 1.54% | (d) |
Net investment income (loss) | | | (1.51% | )(d) | | | (1.46% | ) | | | (1.23% | ) | | | (0.86% | ) | | | 1.09% | | | | 3.88% | (d) |
Supplemental data | | | | | | | | | | | | | | | | | | | | | | | | |
Net assets, end of period (in thousands) | | | $11,130 | | | | $24,171 | | | | $63,369 | | | | $87,000 | | | | $303,933 | | | | $5 | |
Portfolio turnover | | | 0% | | | | 0% | | | | 0% | | | | 16% | | | | 39% | | | | 36% | |
Notes to Financial Highlights
| (a) | For the period from December 1, 2006 (commencement of operations) to October 31, 2007. |
| (b) | During the year ended October 31, 2007, Ameriprise Financial reimbursed the Fund for a loss on a trading error. Had the Fund not received this reimbursement, total return would have been lower by 0.05%. |
| (c) | In addition to the fees and expenses which the Fund bears directly, the Fund indirectly bears a pro rata share of the fees and expenses of the acquired funds in which it invests. Such indirect expenses are not included in the reported expense ratios. |
| (e) | The Investment Manager and certain of its affiliates agreed to waive/reimburse certain fees and expenses, if applicable. |
The accompanying Notes to Financial Statements are an integral part of this statement.
| | | | |
| COLUMBIA ABSOLUTE RETURN CURRENCY AND INCOME FUND — 2012 SEMIANNUAL REPORT | | | 21 | |
| | |
| Financial Highlights (continued) | | |
| | | | | | | | | | | | | | | |
| | | Six months
ended April 30, 2012 | | Year ended Oct. 31, |
| | | | 2011 | | 2010 (a) |
| | | (Unaudited) | | | | |
Class Z | | | | | | | | | | | | | | | |
Per share data | | | | | | | | | | | | | | | |
Net asset value, beginning of period | | | | $10.11 | | | | | $10.09 | | | | | $10.18 | |
Income from investment operations: | | | | | | | | | | | | | | | |
Net investment income (loss) | | | | (0.04 | ) | | | | (0.10 | ) | | | | (0.01 | ) |
Net realized and unrealized gain (loss) | | | | 0.32 | | | | | 0.12 | | | | | (0.08 | ) |
Total from investment operations | | | | 0.28 | | | | | 0.02 | | | | | (0.09 | ) |
Net asset value, end of period | | | | $10.39 | | | | | $10.11 | | | | | $10.09 | |
Total return | | | | 2.77% | | | | | 0.20% | | | | | (0.88% | ) |
Ratios to average net assets(b) | | | | | | | | | | | | | | | |
Expenses prior to fees waived or
expenses reimbursed | | | | 1.20% | (c) | | | | 1.15% | | | | | 1.54% | (c) |
Net expenses after fees waived or
expenses reimbursed(d) | | | | 0.98% | (c) | | | | 1.15% | | | | | 1.54% | (c) |
Net investment income (loss) | | | | (0.72% | )(c) | | | | (0.95% | ) | | | | (1.20% | )(c) |
Supplemental data | | | | | | | | | | | | | | | |
Net assets, end of period (in thousands) | | | | $9,084 | | | | | $6,079 | | | | | $14 | |
Portfolio turnover | | | | 0% | | | | | 0% | | | | | 0% | |
Notes to Financial Highlights
| (a) | For the period from September 27, 2010 (commencement of operations) to October 31, 2010. |
| (b) | In addition to the fees and expenses which the Fund bears directly, the Fund indirectly bears a pro rata share of the fees and expenses of the acquired funds in which it invests. Such indirect expenses are not included in the reported expense ratios. |
| (d) | The Investment Manager and certain of its affiliates agreed to waive/reimburse certain fees and expenses, if applicable. |
The accompanying Notes to Financial Statements are an integral part of this statement.
| | |
| 22 | | COLUMBIA ABSOLUTE RETURN CURRENCY AND INCOME FUND — 2012 SEMIANNUAL REPORT |
| | |
| Notes to Financial Statements | | |
April 30, 2012 (Unaudited)
Columbia Absolute Return Currency and Income Fund (the Fund), a series of Columbia Funds Series Trust II (the Trust), is a diversified fund. The Trust is registered under the Investment Company Act of 1940, as amended (the 1940 Act), as an open-end management investment company organized as a Massachusetts business trust.
Fund Shares
The Trust may issue an unlimited number of shares (without par value). The Fund offers Class A, Class B, Class C, Class I, Class W and Class Z shares. All share classes have identical voting, dividend and liquidation rights. Each share class has its own expense structure and sales charges, as applicable.
Class A shares are subject to a maximum front-end sales charge of 3.00% based on the initial investment amount. Class A shares purchased without an initial sales charge in accounts aggregating $1 million to $50 million at the time of purchase are subject to a contingent deferred sales charge (CDSC) if the shares are sold within 18 months of purchase, charged as follows: 1.00% CDSC if redeemed within 12 months of purchase, and 0.50% CDSC if redeemed more than 12, but less than 18, months after purchase.
Class B shares may be subject to a maximum CDSC of 5.00% based upon the holding period after purchase. Class B shares will generally convert to Class A shares eight years after purchase. The Fund no longer accepts investments by new or existing investors in the Fund’s Class B shares, except in connection with the reinvestment of any dividend and/or capital gain distributions in Class B shares of the Fund and exchanges by existing Class B shareholders of certain other funds within the Columbia Family of Funds.
Class C shares are subject to a 1.00% CDSC on shares redeemed within one year of purchase.
Class I shares are not subject to sales charges and are only available to the Columbia Family of Funds.
Class W shares are not subject to sales charges and are only available to investors purchasing through authorized investment programs managed by investment professionals, including discretionary managed account programs.
Class Z shares are not subject to sales charges, and are only available to certain investors, as described in the Fund’s prospectus.
| | | | |
| COLUMBIA ABSOLUTE RETURN CURRENCY AND INCOME FUND — 2012 SEMIANNUAL REPORT | | | 23 | |
| | |
| Notes to Financial Statements (continued) | | |
| Note | 2. Summary of Significant Accounting Policies |
Use of Estimates
The preparation of financial statements in accordance with U.S. generally accepted accounting principles (GAAP) requires management to make certain estimates and assumptions that affect the reported amounts of assets and liabilities, the disclosure of contingent assets and liabilities at the date of the financial statements and the reported amounts of revenue and expenses during the reporting period. Actual results could differ from those estimates.
The following is a summary of significant accounting policies consistently followed by the Fund in the preparation of its financial statements.
Security Valuation
All equity securities are valued at the close of business of the New York Stock Exchange (NYSE). Equity securities are valued at the last quoted sales price on the principal exchange or market on which they trade, except for securities traded on the NASDAQ Stock Market, which are valued at the NASDAQ official close price. Unlisted securities or listed securities for which there were no sales during the day are valued at the mean of the latest quoted bid and asked prices on such exchanges or markets.
Debt securities generally are valued by pricing services approved by the Board of Trustees (the Board) based upon market transactions for normal, institutional-size trading units of similar securities. The services may use various pricing techniques which take into account appropriate factors such as yield, quality, coupon rate, maturity, type of issue, trading characteristics and other data, as well as broker quotes. Debt securities for which quotations are readily available may also be valued based upon an over-the-counter or exchange bid quotation.
Asset and mortgage-backed securities are generally valued by pricing services, which utilize pricing models that incorporate the securities’ cash flow and loan performance data. These models also take into account available market data, including trades, market quotations, and benchmark yield curves for identical or similar securities. Factors used to identify similar securities may include, but are not limited to, issuer, collateral type, vintage, prepayment speeds, collateral performance, credit ratings, credit enhancement and expected life. Asset-backed securities for which quotations are readily available may also be valued based upon an over-the-counter or exchange bid quotation.
Foreign securities are valued based on quotations from the principal market in which such securities are normally traded. If any foreign share prices are not readily available as a result of limited share activity the securities are valued at the mean of the latest quoted bid and asked prices on such exchanges or markets.
| | |
| 24 | | COLUMBIA ABSOLUTE RETURN CURRENCY AND INCOME FUND — 2012 SEMIANNUAL REPORT |
Foreign currency exchange rates are generally determined at 4:00 p.m. Eastern (U.S.) time. However, many securities markets and exchanges outside the U.S. close prior to the close of the NYSE; therefore, the closing prices for securities in such markets or on such exchanges may not fully reflect events that occur after such close but before the close of the NYSE. In those situations, foreign securities will be fair valued pursuant to the policy adopted by the Board, including utilizing a third party pricing service to determine these fair values. The third party pricing service takes into account multiple factors, including, but not limited to, movements in the U.S. securities markets, certain depositary receipts, futures contracts and foreign exchange rates that have occurred subsequent to the close of the foreign exchange, to determine a good faith estimate that reasonably reflects the current market conditions as of the close of the NYSE. The fair value of a security is likely to be different from the quoted or published price, if available.
Investments in other open-end investment companies, including money market funds, are valued at net asset value.
Short-term securities purchased within 60 days to maturity are valued at amortized cost, which approximates market value. The value of short-term securities originally purchased with maturities greater than 60 days is determined based on an amortized value to par upon reaching 60 days to maturity. Short-term securities maturing in more than 60 days from the valuation date are valued at the market price or approximate market value based on current interest rates.
Forward foreign currency exchange contracts are marked-to-market based upon foreign currency exchange rates provided by a pricing service.
Investments for which market quotations are not readily available, or that have quotations which management believes are not reliable, are valued at fair value as determined in good faith under consistently applied procedures established by and under the general supervision of the Board. If a security or class of securities (such as foreign securities) is valued at fair value, such value is likely to be different from the last quoted market price for the security. The determination of fair value often requires significant judgment. To determine fair value, management may use assumptions including but not limited to future cash flows and estimated risk premiums. Multiple inputs from various sources may be used to determine value.
Foreign Currency Transactions and Translation
The values of all assets and liabilities denominated in foreign currencies are translated into U.S. dollars at that day’s exchange rates. Net realized and unrealized gains (losses) on foreign currency transactions and translations include gains (losses) arising from the fluctuation in exchange rates between
| | | | |
| COLUMBIA ABSOLUTE RETURN CURRENCY AND INCOME FUND — 2012 SEMIANNUAL REPORT | | | 25 | |
| | |
| Notes to Financial Statements (continued) | | |
trade and settlement dates on securities transactions, gains (losses) arising from the disposition of foreign currency and currency gains (losses) between the accrual and payment dates on dividends, interest income and foreign withholding taxes.
For financial statement purposes, the Fund does not distinguish that portion of gains (losses) on investments which is due to changes in foreign exchange rates from that which is due to changes in market prices of the investments. Such fluctuations are included with the net realized and unrealized gains (losses) on investments in the Statement of Operations.
Derivative Instruments
The Fund invests in certain derivative instruments as detailed below to meet its investment objectives. Derivatives are instruments whose values depend on, or are derived from, in whole or in part, the value of one or more other assets, such as securities, currencies, commodities or indices. Derivative instruments may be used to maintain cash reserves while maintaining exposure to certain other assets, to offset anticipated declines in values of investments, to facilitate trading, to reduce transaction costs and to pursue higher investment returns. The Fund may also use derivative instruments to mitigate certain investment risks, such as foreign currency exchange rate risk, interest rate risk and credit risk. Derivatives may involve various risks, including the potential inability of the counterparty to fulfill its obligation under the terms of the contract, the potential for an illiquid secondary market and the potential for market movements which may expose the Fund to gains or losses in excess of the amount shown in the Statement of Assets and Liabilities.
The Fund and any counterparty are required to maintain an agreement that requires the Fund and that counterparty to monitor (on a daily basis) the net fair value of all derivatives entered into pursuant to the agreement between the Fund and such counterparty. If the net fair value of such derivatives between the Fund and that counterparty exceeds a certain threshold (as defined in the agreement), the Fund or the counterparty (as the case may be) is required to post cash and/or securities as collateral. Fair values of derivatives presented in the financial statements are not netted with the fair value of other derivatives or with any collateral amounts posted by the Fund or any counterparty.
Forward Foreign Currency Exchange Contracts
Forward foreign currency exchange contracts are agreements between two parties to buy and sell a currency at a set price on a future date. These contracts are intended to be used to minimize the exposure to foreign exchange rate fluctuations during the period between the trade and settlement dates of the contract. The Fund utilized forward foreign currency exchange contracts to shift investment exposure from one currency to another and to go long and short foreign currencies versus the U.S. dollars, as a way to generate returns.
| | |
| 26 | | COLUMBIA ABSOLUTE RETURN CURRENCY AND INCOME FUND — 2012 SEMIANNUAL REPORT |
The values of forward foreign currency exchange contracts fluctuate with changes in foreign currency exchange rates. The Fund will record a realized gain or loss when the forward foreign currency exchange contract is closed.
The use of forward foreign currency exchange contracts does not eliminate fluctuations in the prices of the Fund’s portfolio securities. The risks of forward foreign currency exchange contracts include movement in the values of the foreign currencies relative to the U.S. dollar (or other foreign currencies) and the possibility that counterparties will not complete their contractual obligations, which may be in excess of the amount reflected, if any, in the Statement of Assets and Liabilities.
Effects of Derivative Transactions in the Financial Statements
The following tables are intended to provide additional information about the effect of derivatives on the financial statements of the Fund, including: the fair value of derivatives by risk category and the location of those fair values in the Statement of Assets and Liabilities; the impact of derivative transactions on the Fund’s operations over the period including realized gains or losses and unrealized gains or losses. The derivative schedules following the Portfolio of Investments present additional information regarding derivative instruments outstanding at the end of the period, if any.
Fair Values of Derivative Instruments at April 30, 2012
| | | | | | | | | | | | |
Risk Exposure
Category | | Asset derivatives | | | Liability derivatives | |
| | Statement of Assets
and Liabilities
Location | | Fair Value | | | Statement of Assets
and Liabilities
Location | | Fair Value | |
| Foreign exchange contracts | | Unrealized appreciation on forward foreign currency exchange contracts | | $ | 289,071 | | | Unrealized depreciation on forward foreign currency exchange contracts | | $ | 741,640 | |
Effect of Derivative Instruments in the Statement of Operations
for the Six Months Ended April 30, 2012
| | | | |
| Amount of Realized Gain (Loss) on Derivatives Recognized in Income | |
| Risk Exposure Category | | Forward Foreign
Currency Exchange
Contracts | |
Foreign exchange contracts | | $ | 4,278,338 | |
| | | | |
| COLUMBIA ABSOLUTE RETURN CURRENCY AND INCOME FUND — 2012 SEMIANNUAL REPORT | | | 27 | |
| | |
| Notes to Financial Statements (continued) | | |
| | | | |
| Change in Unrealized Appreciation (Depreciation) on Derivatives Recognized in Income | |
| Risk Exposure Category | | Forward Foreign
Currency Exchange
Contracts | |
Foreign exchange contracts | | $ | (430,338 | ) |
Volume of Derivative Instruments for the Six Months Ended April 30, 2012
| | | | |
| | | Contracts
Opened | |
Forward Foreign Currency Exchange Contracts | | | 116 | |
Security Transactions
Security transactions are accounted for on the trade date. Cost is determined and gains (losses) are based upon the specific identification method for both financial statement and federal income tax purposes.
Income Recognition
Interest income is recorded on the accrual basis. Market premium and discount are amortized and accreted, respectively, on all debt securities, unless otherwise noted. Original issue discount is accreted to interest income over the life of the security with a corresponding increase in the cost basis, if any. For convertible securities, premiums attributable to the conversion feature are not amortized.
Dividend income is recorded on the ex-dividend date.
Expenses
General expenses of the Trust are allocated to the Fund and other funds of the Trust based upon relative net assets or other expense allocation methodologies determined by the nature of the expense. Expenses directly attributable to the Fund are charged to the Fund. Expenses directly attributable to a specific class of shares are charged to that share class.
Determination of Class Net Asset Value
All income, expenses (other than class-specific expenses, which are charged to that share class, as shown in the Statement of Operations) and realized and unrealized gains (losses) are allocated to each class of the Fund on a daily basis, based on the relative net assets of each class, for purposes of determining the net asset value of each class.
Federal Income Tax Status
The Fund intends to qualify each year as a regulated investment company under Subchapter M of the Internal Revenue Code, as amended, and will distribute substantially all of its tax exempt or taxable income (including net short-term
| | |
| 28 | | COLUMBIA ABSOLUTE RETURN CURRENCY AND INCOME FUND — 2012 SEMIANNUAL REPORT |
capital gains), if any, for its tax year, and as such will not be subject to federal income taxes. In addition, the Fund intends to distribute in each calendar year substantially all of its net investment income, capital gains and certain other amounts, if any, such that the Fund should not be subject to federal excise tax. Therefore, no federal income or excise tax provision is recorded.
Foreign Taxes
The Fund may be subject to foreign taxes on income, gains on investments or currency repatriation, a portion of which may be recoverable. The Fund will accrue such taxes and recoveries, as applicable, based upon its current interpretation of tax rules and regulations that exist in the markets in which it invests.
Realized gains in certain countries may be subject to foreign taxes at the Fund level, based on statutory rates. The Fund accrues for such foreign taxes on net realized and unrealized gains at the appropriate rate for each jurisdiction, as applicable.
Distributions to Shareholders
Distributions from net investment income are declared and paid monthly. Net realized capital gains, if any, are distributed along with the income dividend. Income distributions and capital gain distributions are determined in accordance with federal income tax regulations which may differ from GAAP.
Guarantees and Indemnifications
Under the Trust’s organizational documents and, in some cases, by contract, its officers and trustees are indemnified against certain liabilities arising out of the performance of their duties to the Trust or its funds. In addition, certain of the Fund’s contracts with its service providers contain general indemnification clauses. The Fund’s maximum exposure under these arrangements is unknown since the amount of any future claims that may be made against the Fund cannot be determined, and the Fund has no historical basis for predicting the likelihood of any such claims.
Recent Accounting Pronouncement
Fair Value Measurements and Disclosures
In May 2011, the Financial Accounting Standards Board (FASB) issued ASU No. 2011-04 modifying Topic 820, Fair Value Measurements and Disclosures. At the same time, the International Accounting Standards Board (IASB) issued International Financial Reporting Standard 13, Fair Value Measurement. The objective of the FASB and IASB is convergence of their guidance on fair value measurements and disclosures.
| | | | |
| COLUMBIA ABSOLUTE RETURN CURRENCY AND INCOME FUND — 2012 SEMIANNUAL REPORT | | | 29 | |
| | |
| Notes to Financial Statements (continued) | | |
Specifically, ASU No. 2011-04 requires reporting entities to disclose i) the amounts of any transfers between Level 1 and Level 2, and the reasons for the transfers, ii) for Level 3 fair value measurements, a) quantitative information about significant unobservable inputs used, b) a description of the valuation processes used by the reporting entity and c) a narrative description of the sensitivity of the fair value measurement to changes in unobservable inputs if a change in those inputs might result in a significantly higher or lower fair value measurement. The effective date of ASU No. 2011-04 is for interim and annual periods beginning after December 15, 2011. At this time, management is evaluating the implications of this guidance and the impact it will have on the financial statement amounts and footnote disclosures, if any.
| Note | 3. Fees and Compensation Paid to Affiliates |
Investment Management Fees
Under an Investment Management Services Agreement, Columbia Management Investment Advisers, LLC (the Investment Manager), a wholly-owned subsidiary of Ameriprise Financial, Inc. (Ameriprise Financial), determines which securities will be purchased, held or sold. The management fee is an annual fee that is equal to a percentage of the Fund’s average daily net assets that declines from 0.89% to 0.70% as the Fund’s net assets increase. The annualized effective management fee rate for the six months ended April 30, 2012 was 0.89% of the Fund’s average daily net assets.
Administration Fees
Under an Administrative Services Agreement, the Investment Manager serves as the Fund Administrator. The Fund pays the Fund Administrator an annual fee for administration and accounting services equal to a percentage of the Fund’s average daily net assets that declines from 0.08% to 0.05% as the Fund’s net assets increase. The annualized effective administration fee rate for the six months ended April 30, 2012 was 0.08% of the Fund’s average daily net assets.
Other Expenses
Other expenses are for, among other things, certain expenses of the Fund or the Board, including: Fund boardroom and office expense, employee compensation, employee health and retirement benefits, and certain other expenses. Payment of these Fund and Board expenses is facilitated by a company providing limited administrative services to the Fund and the Board. For the six months ended April 30, 2012, other expenses paid to this company were $1,033.
Compensation of Board Members
Board members are compensated for their services to the Fund as disclosed in the Statement of Operations. Under a Deferred Compensation Plan (the Plan), the
| | |
| 30 | | COLUMBIA ABSOLUTE RETURN CURRENCY AND INCOME FUND — 2012 SEMIANNUAL REPORT |
Board members who are not “interested persons” of the Fund, as defined under the 1940 Act, may elect to defer payment of up to 100% of their compensation. Deferred amounts are treated as though equivalent dollar amounts had been invested in shares of certain funds managed by the Investment Manager. The Fund’s liability for these amounts is adjusted for market value changes and remains in the Fund until distributed in accordance with the Plan.
Transfer Agent Fees
Under a Transfer and Dividend Disbursing Agent Agreement, Columbia Management Investment Services Corp. (the Transfer Agent), an affiliate of the Investment Manager and a wholly-owned subsidiary of Ameriprise Financial, is responsible for providing transfer agency services to the Fund. The Transfer Agent has contracted with Boston Financial Data Services (BFDS) to serve as sub-transfer agent.
The Transfer Agent receives monthly account-based service fees based on the number of open accounts and is reimbursed by the Fund for the fees and expenses the Transfer Agent pays to financial intermediaries that maintain omnibus accounts with the Fund that is a percentage of the average aggregate value of the Fund’s shares maintained in each such omnibus account (other than omnibus accounts for which American Enterprise Investment Services Inc. is the broker of record or accounts where the beneficial shareholder is a customer of Ameriprise Financial Services, Inc., which are paid a per account fee). The Transfer Agent pays the fees of BFDS for services as sub-transfer agent and is not entitled to reimbursement for such fees from the Fund (with the exception of out-of-pocket fees).
The Transfer Agent also receives compensation from fees for various shareholder services and reimbursements for certain out-of -pocket expenses. Class I shares do not pay transfer agent fees.
For the six months ended April 30, 2012, the Fund’s annualized effective transfer agent fee rates as a percentage of average daily net assets of each class were as follows:
| | | | |
Class A | | | 0.21 | % |
Class B | | | 0.21 | |
Class C | | | 0.20 | |
Class W | | | 0.54 | |
Class Z | | | 0.05 | |
An annual minimum account balance fee of $20 may apply to certain accounts with a value below the Fund’s initial minimum investment requirements to reduce the impact of small accounts on transfer agent fees. These minimum account balance fees are recorded as part of expense reductions in the Statement
| | | | |
| COLUMBIA ABSOLUTE RETURN CURRENCY AND INCOME FUND — 2012 SEMIANNUAL REPORT | | | 31 | |
| | |
| Notes to Financial Statements (continued) | | |
of Operations. For the six months ended April 30, 2012, no minimum account balance fees were charged by the Fund.
Distribution Fees
The Fund has an agreement with Columbia Management Investment Distributors, Inc. (the Distributor), an affiliate of the Investment Manager and a wholly-owned subsidiary of Ameriprise Financial, for distribution and shareholder services. Under a Plan and Agreement of Distribution pursuant to Rule 12b-1, the Fund pays a fee at an annual rate of up to 0.25% of the Fund’s average daily net assets attributable to Class A and Class W shares and a fee at an annual rate of up to 1.00% of the Fund’s average daily net assets attributable to Class B and Class C shares. For Class B and Class C shares, of the 1.00% fee, up to 0.75% is reimbursed for distribution expenses.
The amount of distribution expenses incurred by the Distributor and not yet reimbursed (unreimbursed expense) was approximately $53,000 and $26,000 for Class B and Class C shares, respectively. These amounts are based on the most recent information available as of March 31, 2012, and may be recovered from future payments under the distribution plan or CDSCs. To the extent the unreimbursed expense has been fully recovered, the distribution fee is reduced.
Sales Charges
Sales charges, including front-end charges and CDSCs, received by the Distributor for distributing Fund shares were $4,720 for Class A, $235 for Class B and $183 for Class C shares for the six months ended April 30, 2012.
Expenses Waived/Reimbursed by the Investment Manager and its Affiliates
Effective January 1, 2012, the Investment Manager and certain of its affiliates have contractually agreed to waive fees and/or reimburse expenses (excluding certain fees and expenses described below), through February 28, 2013, unless sooner terminated at the sole discretion of the Board, so that the Fund’s net operating expenses, after giving effect to fees waived/expenses reimbursed and any balance credits and/or overdraft charges from the Fund’s custodian, do not exceed the following annual rates as a percentage of the class’ average daily net assets:
| | | | |
Class A | | | 1.32 | % |
Class B | | | 2.07 | |
Class C | | | 2.07 | |
Class I | | | 0.87 | |
Class W | | | 1.32 | |
Class Z | | | 1.07 | |
Under the agreement, the following fees and expenses are excluded from the waiver/reimbursement commitment, and therefore will be paid by the Fund, if
| | |
| 32 | | COLUMBIA ABSOLUTE RETURN CURRENCY AND INCOME FUND — 2012 SEMIANNUAL REPORT |
applicable: taxes (including foreign transaction taxes), expenses associated with investments in affiliated and non-affiliated pooled investment vehicles (including mutual funds and exchange traded funds), transaction costs and brokerage commissions, costs related to any securities lending program, dividend expenses associated with securities sold short, inverse floater program fees and expenses, transaction charges and interest on borrowed money, interest, extraordinary expenses and any other expenses the exclusion of which is specifically approved by the Board. This agreement may be modified or amended only with approval from all parties.
| Note | 4. Federal Tax Information |
The timing and character of income and capital gain distributions are determined in accordance with income tax regulations, which may differ from GAAP because of temporary or permanent book to tax differences.
At April 30, 2012, the cost of investments for federal income tax purposes was approximately $112,866,000 and the aggregate gross approximate unrealized appreciation and depreciation based on that cost was:
| | | | |
Unrealized appreciation | | $ | 15,000 | |
Unrealized depreciation | | $ | (132,000 | ) |
Net unrealized depreciation | | $ | (117,000 | ) |
The following capital loss carryforward, determined as of October 31, 2011, may be available to reduce taxable income arising from future net realized gains on investments, if any, to the extent permitted by the Internal Revenue Code:
| | | | |
| Year of expiration | | Amount | |
2017 | | $ | 1,692,023 | |
2019 | | | 122,544 | |
Total | | $ | 1,814,567 | |
On December 22, 2010, the Regulated Investment Company Modernization Act of 2010 (the Act) was enacted, which changed various technical rules governing the tax treatment of regulated investment companies. The changes are generally effective for taxable years beginning after the date of enactment. Under the Act, the Fund will be permitted to carry forward capital losses incurred in taxable years beginning after the date of enactment for an unlimited period. However, any losses incurred during those future taxable years will be required to be utilized prior to the losses incurred in pre-enactment taxable years, which carry an expiration date. As a result of this ordering rule, pre-enactment capital loss carryforwards may be more likely to expire unused.
| | | | |
| COLUMBIA ABSOLUTE RETURN CURRENCY AND INCOME FUND — 2012 SEMIANNUAL REPORT | | | 33 | |
| | |
| Notes to Financial Statements (continued) | | |
Management of the Fund has concluded that there are no significant uncertain tax positions that would require recognition in the financial statements. However, management’s conclusion may be subject to review and adjustment at a later date based on factors including, but not limited to, new tax laws, regulations, and administrative interpretations (including relevant court decisions). Generally, the Fund’s federal tax returns for the prior three fiscal years remain subject to examination by the Internal Revenue Service.
| Note | 5. Portfolio Information |
The cost of purchases and proceeds from sales of securities, excluding short-term obligations, aggregated to $0 and $492,718, respectively, for the six months ended April 30, 2012.
| Note | 6. Affiliated Money Market Fund |
The Fund significantly invests in Columbia Short-Term Cash Fund, a money market fund established for the exclusive use by the Fund and other affiliated funds. The income earned by the Fund from such investments is included as “Dividends from affiliates” in the Statement of Operations. As an investing fund, the Fund indirectly bears its proportionate share of the expenses of Columbia Short-Term Cash Fund.
| Note | 7. Shareholder Concentration |
At April 30, 2012, one unaffiliated shareholder account owned 27.1% of the outstanding shares of the Fund. The Fund has no knowledge about whether any portion of those shares was owned beneficially by such account. Affiliated shareholder accounts owned 47.2% of the outstanding shares of the Fund. Subscription and redemption activity by concentrated accounts may have a significant effect on the operations of the Fund.
The Fund has entered into a revolving credit facility with a syndicate of banks led by JPMorgan Chase Bank, N.A. (the Administrative Agent), whereby the Fund may borrow for the temporary funding of shareholder redemptions or for other temporary or emergency purposes. The credit facility agreement, as amended, which is a collective agreement between the Fund and certain other funds managed by the Investment Manager, severally and not jointly, permits collective borrowings up to $500 million. Pursuant to a December 13, 2011 amendment to the credit facility agreement, interest is charged to each participating fund based on its borrowings at a rate equal to the higher of (i) the overnight federal funds rate plus 1.00% or (i) the one-month LIBOR rate plus
| | |
| 34 | | COLUMBIA ABSOLUTE RETURN CURRENCY AND INCOME FUND — 2012 SEMIANNUAL REPORT |
1.00%. Each borrowing under the credit facility matures no later than 60 days after the date of borrowing. The Fund also pays a commitment fee equal to its pro rata share of the amount of the credit facility at a rate of 0.08% per annum.
Prior to December 13, 2011, interest was charged to each participating fund based on its borrowings at a rate equal to the sum of the federal funds rate plus (i) 1.25% per annum plus (ii) if one-month LIBOR exceeds the federal funds rate, the amount of such excess. The Fund also paid a commitment fee equal to its pro rata share of the amount of the credit facility at a rate of 0.10% per annum.
The Fund had no borrowings during the six months ended April 30, 2012.
Foreign Currency Risk
The Fund’s exposure to foreign currencies subjects the Fund to constantly changing exchange rates and the risk that those currencies will decline in value relative to the U.S. dollar, or, in the case of short positions, that the U.S. dollar will decline in value relative to the currency being sold forward. Currency rates in foreign countries may fluctuate significantly over short periods of time for a number of reasons, including changes in interest rates and economic or political developments in U.S. or abroad. As a result, the Fund’s exposure to foreign currencies may reduce the returns of the Fund. Trading of foreign currencies also includes the risk of clearing and settling trades which, if prices are volatile, may be difficult.
Geographic Concentration Risk
The Fund may be particularly susceptible to political, regulatory and economic events affecting companies and countries within the specific geographic region in which the Fund focuses its investments. Currency devaluation could occur in countries that have not yet experienced currency devaluations to date, or could continue to occur in countries that have already experienced such devaluations. As a result, the Fund may be more volatile than a more geographically diversified fund.
Counterparty Risk
Counterparty risk is the risk that a counterparty to a financial instrument entered into by the Fund or held by a special purpose or structured vehicle becomes bankrupt or otherwise fails to perform its obligations due to financial difficulties. The Fund may experience significant delays in obtaining any recovery in a bankruptcy or other reorganization proceeding. The Fund may obtain only limited recovery or may obtain no recovery in such circumstances. The Fund will typically enter into financial instrument transactions with counterparties whose
| | | | |
| COLUMBIA ABSOLUTE RETURN CURRENCY AND INCOME FUND — 2012 SEMIANNUAL REPORT | | | 35 | |
| | |
| Notes to Financial Statements (continued) | | |
credit rating is investment grade, or, if unrated, determined to be of comparable quality by the Investment Manager.
| Note | 10. Subsequent Events |
Management has evaluated the events and transactions that have occurred through the date the financial statements were issued and noted no items requiring adjustment of the financial statements or additional disclosure.
| Note | 11. Information Regarding Pending and Settled Legal Proceedings |
In December 2005, without admitting or denying the allegations, American Express Financial Corporation (AEFC, which is now known as Ameriprise Financial, Inc. (Ameriprise Financial)) entered into settlement agreements with the Securities and Exchange Commission (SEC) and Minnesota Department of Commerce (MDOC) related to market timing activities. As a result, AEFC was censured and ordered to cease and desist from committing or causing any violations of certain provisions of the Investment Advisers Act of 1940, the Investment Company Act of 1940, and various Minnesota laws. AEFC agreed to pay disgorgement of $10 million and civil money penalties of $7 million. AEFC also agreed to retain an independent distribution consultant to assist in developing a plan for distribution of all disgorgement and civil penalties ordered by the SEC in accordance with various undertakings detailed at www.sec.gov/litigation/admin/ia-2451.pdf. Ameriprise Financial and its affiliates have cooperated with the SEC and the MDOC in these legal proceedings, and have made regular reports to the funds’ Boards of Trustees.
Ameriprise Financial and certain of its affiliates have historically been involved in a number of legal, arbitration and regulatory proceedings, including routine litigation, class actions, and governmental actions, concerning matters arising in connection with the conduct of their business activities. Ameriprise Financial believes that the Funds are not currently the subject of, and that neither Ameriprise Financial nor any of its affiliates are the subject of, any pending legal, arbitration or regulatory proceedings that are likely to have a material adverse effect on the Funds or the ability of Ameriprise Financial or its affiliates to perform under their contracts with the Funds. Ameriprise Financial is required to make 10-Q, 10-K and, as necessary, 8-K filings with the Securities and Exchange Commission on legal and regulatory matters that relate to Ameriprise Financial and its affiliates. Copies of these filings may be obtained by accessing the SEC website at www.sec.gov.
There can be no assurance that these matters, or the adverse publicity associated with them, will not result in increased fund redemptions, reduced sale of fund shares or other adverse consequences to the Funds. Further, although we believe
| | |
| 36 | | COLUMBIA ABSOLUTE RETURN CURRENCY AND INCOME FUND — 2012 SEMIANNUAL REPORT |
proceedings are not likely to have a material adverse effect on the Funds or the ability of Ameriprise Financial or its affiliates to perform under their contracts with the Funds, these proceedings are subject to uncertainties and, as such, we are unable to estimate the possible loss or range of loss that may result. An adverse outcome in one or more of these proceedings could result in adverse judgments, settlements, fines, penalties or other relief that could have a material adverse effect on the consolidated financial condition or results of operations of Ameriprise Financial.
| | | | |
| COLUMBIA ABSOLUTE RETURN CURRENCY AND INCOME FUND — 2012 SEMIANNUAL REPORT | | | 37 | |
The policy of the Board is to vote the proxies of the companies in which the Fund holds investments consistent with the procedures as stated in the Statement of Additional Information (SAI). You may obtain a copy of the SAI without charge by calling 800.345.6611; contacting your financial intermediary; visiting columbiamanagement.com; or searching the website of the Securities and Exchange Commission (SEC) at www.sec.gov. Information regarding how the Fund voted proxies relating to portfolio securities is filed with the SEC by August 31 for the most recent 12-month period ending June 30 of that year, and is available without charge by visiting columbiamanagement.com; or searching the website of the SEC at www.sec.gov.
| | |
| Approval of Investment Management Services |
| |
| Agreement | | |
Columbia Management Investment Advisers, LLC (“Columbia Management” or the “investment manager”), a wholly-owned subsidiary of Ameriprise Financial, Inc. (“Ameriprise Financial”), serves as the investment manager to Columbia Absolute Return Currency and Income Fund (the “Fund”). Under an investment management services agreement (the “IMS Agreement”), Columbia Management provides investment advice and other services to the Fund and all funds distributed by Columbia Management Investment Distributors, Inc. (collectively, the “Funds”).
On an annual basis, the Fund’s Board of Trustees (the “Board”), including the independent Board members (the “Independent Trustees”), considers renewal of the IMS Agreement. Columbia Management prepared detailed reports for the Board and its Contracts Committee in March and April 2012, including reports based on analyses of data provided by an independent organization and a comprehensive response to each item of information requested by independent legal counsel to the Independent Trustees (“Independent Legal Counsel”) in a letter to the investment manager, to assist the Board in making this determination. All of the materials presented in March and April were first supplied in draft form to designated representatives of the Independent Trustees, i.e., Independent Legal Counsel, the Chair and the Chair of the Contracts Committee, and the final materials were revised to reflect comments provided by these Board representatives. In addition, throughout the year, the Board (or its committees) regularly meets with portfolio management teams and senior management personnel, and reviews information prepared by Columbia Management addressing the services Columbia Management provides and Fund performance. The Board accords particular weight to the work, deliberations and conclusions of the Contracts Committee, the Investment Review Committee and the Compliance Committee in determining whether to continue the IMS Agreement.
| | |
| 38 | | COLUMBIA ABSOLUTE RETURN CURRENCY AND INCOME FUND — 2012 SEMIANNUAL REPORT |
The Board, at its April 10-12, 2012 in-person Board meeting (the “April Meeting”), considered the renewal of the IMS Agreement for an additional one-year term. At the April Meeting, Independent Legal Counsel reviewed with the Independent Trustees various factors relevant to the Board’s consideration of advisory agreements and the Board’s legal responsibilities related to such consideration. Following an analysis and discussion of the factors identified below, the Board, including all of the Independent Trustees, approved the renewal of the IMS Agreement.
Nature, Extent and Quality of Services Provided by Columbia Management: The Independent Trustees analyzed various reports and presentations they had received detailing the services performed by Columbia Management, as well as its expertise, resources and capabilities. The Independent Trustees specifically considered many developments during the past year concerning the services provided by Columbia Management, including, in particular, the continued investment in, and resources dedicated to, the Funds’ operations and the successful completion of various integration initiatives and the consolidation of dozens of Funds. The Independent Trustees noted the information they received concerning Columbia Management’s ability to retain key portfolio management personnel. In that connection, the Independent Trustees took into account their meetings with Columbia Management’s Chief Investment Officer (the “CIO”) and considered the CIO’s successful execution of additional risk and portfolio management oversight applied to the Funds. The Independent Trustees also assessed Columbia Management’s significant investment in upgrading technology (such as an equity trading system) and considered management’s commitments to enhance existing resources in this area.
In connection with the Board’s evaluation of the overall package of services provided by Columbia Management, the Board also considered the quality of administrative services provided to the Fund by Columbia Management. In addition, the Board also reviewed the financial condition of Columbia Management (and its affiliates) and each entity’s ability to carry out its responsibilities under the IMS Agreement and the Fund’s other services agreements with affiliates of Ameriprise Financial. The Board also discussed the acceptability of the terms of the IMS Agreement (including the relatively broad scope of services required to be performed by Columbia Management). The Board concluded that the services being performed under the IMS Agreement were of a reasonably high quality.
| | | | |
| COLUMBIA ABSOLUTE RETURN CURRENCY AND INCOME FUND — 2012 SEMIANNUAL REPORT | | | 39 | |
| | |
| Approval of Investment Management Services |
| |
| Agreement (continued) | | |
Based on the foregoing, and based on other information received (both oral and written, including the information on investment performance referenced below) and other considerations, the Board concluded that Columbia Management and its affiliates were in a position to continue to provide a high quality and level of services to the Fund.
Investment Performance: For purposes of evaluating the nature, extent and quality of services provided under the IMS Agreement, the Board carefully reviewed the investment performance of the Fund. In this regard, the Board considered detailed reports providing the results of analyses performed by an independent organization showing, for various periods, the performance of the Fund, the performance of a benchmark index, the percentage ranking of the Fund among its comparison group and the net assets of the Fund. The Board observed that the Fund’s investment performance met expectations.
Comparative Fees, Costs of Services Provided and the Profits Realized By Columbia Management and its Affiliates from their Relationships with the Fund: The Board reviewed comparative fees and the costs of services to be provided under the IMS Agreement. The Board members considered detailed comparative information set forth in an annual report on fees and expenses, including, among other things, data (based on analyses conducted by an independent organization) showing a comparison of the Fund’s expenses with median expenses paid by funds in its comparative peer universe, as well as data showing the Fund’s contribution to Columbia Management’s profitability. The Board reviewed the fees charged to comparable institutional or other accounts/vehicles managed by Columbia Management and discussed differences in how the products are managed and operated, noting no unreasonable differences in the levels of contractual fees.
The Board accorded particular weight to the notion that the level of fees should reflect a rational pricing model applied consistently across the various product lines in the Fund family, while assuring that the overall fees for each Fund (with few defined exceptions) are generally in line with the “pricing philosophy” (i.e., that the total expense ratio of the Fund is at, or below, the median expense ratio of funds in the same comparison universe of the Fund). The Board took into account that the Fund’s total expense ratio (after considering proposed expense caps/waivers) was slightly below the peer universe’s median expense ratio shown in the reports. Based on its review, the Board concluded that the Fund’s management fee was fair and reasonable in light of the extent and quality of services that the Fund receives.
| | |
| 40 | | COLUMBIA ABSOLUTE RETURN CURRENCY AND INCOME FUND — 2012 SEMIANNUAL REPORT |
The Board also considered the expected profitability of Columbia Management and its affiliates in connection with Columbia Management providing investment management services to the Fund. In this regard, the Board referred to a detailed profitability report, discussing the profitability to Columbia Management and Ameriprise Financial from managing, operating and distributing the Funds. In this regard, the Board observed that 2011 profitability, while slightly lower than 2010, was generally in line with the reported profitability of other asset management firms. The Board also considered the indirect economic benefits flowing to Columbia Management or its affiliates in connection with managing or distributing the Funds, such as the enhanced ability to offer various other financial products to Ameriprise Financial customers, soft dollar benefits and overall reputational advantages. The Board noted that the fees paid by the Fund should permit the investment manager to offer competitive compensation to its personnel, make necessary investments in its business and earn an appropriate profit. The Board concluded that profitability levels were reasonable.
Economies of Scale to be Realized: The Board also considered the economies of scale that might be realized by Columbia Management as the Fund grows and took note of the extent to which Fund shareholders might also benefit from such growth.
Based on the foregoing, the Board, including all of the Independent Trustees, concluded that the investment management service fees were fair and reasonable in light of the extent and quality of services provided. In reaching this conclusion, no single factor was determinative. On April 12, 2012, the Board, including all of the Independent Trustees, approved the renewal of the IMS Agreement.
| | | | |
| COLUMBIA ABSOLUTE RETURN CURRENCY AND INCOME FUND — 2012 SEMIANNUAL REPORT | | | 41 | |
Columbia Absolute Return Currency and Income Fund
P.O. Box 8081
Boston, MA 02266-8081
columbiamanagement.com
| | | | |
 | | This report must be accompanied or preceded by the Fund’s current prospectus. The
Fund is distributed by Columbia Management Investment Distributors, Inc., member
FINRA, and managed by Columbia Management Investment Advisers, LLC. ©2012 Columbia Management Investment Advisers, LLC. All rights reserved. | | S-6512 G (6/12) |
Semiannual Report

Columbia
Asia Pacific ex-Japan Fund
Semiannual Report for the Period Ended April 30, 2012
Columbia Asia Pacific ex-Japan Fund seeks to provide shareholders with long-term capital growth.
Not FDIC insured ¡ No bank guarantee ¡ May lose value
| | | | |
| |
Your Fund at a Glance | | | 2 | |
| |
Fund Expense Example | | | 7 | |
| |
Portfolio of Investments | | | 9 | |
| |
Statement of Assets and Liabilities | | | 17 | |
| |
Statement of Operations | | | 19 | |
| |
Statement of Changes in Net Assets | | | 21 | |
| |
Financial Highlights | | | 23 | |
| |
Notes to Financial Statements | | | 29 | |
| |
Proxy Voting | | | 42 | |
| |
Approval of Investment Management Services and Subadvisory Agreements | | | 42 | |
See the Fund’s prospectus for risks associated with investing in the Fund.
| | | | |
| COLUMBIA ASIA PACIFIC EX-JAPAN FUND — 2012 SEMIANNUAL REPORT | | | 1 | |
FUND SUMMARY
| > | | Columbia Asia Pacific ex-Japan Fund (the Fund) Class R5 shares returned 5.18% for the six months ended April 30, 2012. |
| > | | The Fund outperformed its benchmark, the MSCI All Country (AC) Asia ex Japan Index (MSCI Index) (Net), which returned 4.18% for the period. |
ANNUALIZED TOTAL RETURNS (for period ended April 30, 2012)
| | | | | | | | | | | | |
| | | 6 months* | | | 1 year | | | Since
inception
7/15/09 | |
Columbia Asia Pacific ex-Japan Fund
Class R5 (excluding sales charge) | | | +5.18% | | | | -12.30% | | | | +10.80% | |
MSCI All Country Asia ex Japan Index (Net)(1) (unmanaged) | | | +4.18% | | | | -10.34% | | | | +14.44% | |
MSCI All Country Asia ex Japan Index (Gross)(1) (unmanaged) | | | +4.26% | | | | -10.11% | | | | +14.70% | |
The performance information shown represents past performance and is not a guarantee of future results. The investment return and principal value of your investment will fluctuate so that your shares, when redeemed, may be worth more or less than their original cost. Current performance may be lower or higher than the performance information shown. You may obtain performance information current to the most recent month-end by contacting your financial intermediary, visiting columbiamanagement.com or calling 800.345.6611.
The performance of other classes may vary from that shown because of differences in fees and expenses. The Fund’s returns reflect the effect of fee waivers/expense reimbursements, if any. Without such waivers/reimbursements, the Fund’s returns would be lower. See the Average Annual Total Returns table for performance of other share classes of the Fund.
The indices do not reflect the effects of sales charges, expenses and taxes (except the MSCI All Country Asia ex Japan Index (Net), which reflects reinvested dividends net of withholding taxes). It is not possible to invest directly in an index.
| (1) | | The MSCI All Country (AC) Asia ex Japan Index (Net) and the MSCI AC Asia Pacific ex-Japan Index (Gross), each an unmanaged index, are free float adjusted market capitalization weighted indexes that are designed to measure the equity market performance of the following countries: Australia, China, Hong Kong, India, Indonesia, Korea, Malaysia, Singapore, Taiwan and Thailand. On September 30, 2011, the MSCI AC Asia ex Japan (Net) replaced the MSCI AC Asia ex Japan Index |
| | |
| 2 | | COLUMBIA ASIA PACIFIC EX-JAPAN FUND — 2012 SEMIANNUAL REPORT |
| | (Gross) as the Fund’s primary benchmark. The Fund’s investment manager made this recommendation to the Fund’s Board because the investment manager believes that the Net version of the index better reflects how dividends paid to the Fund on foreign securities generally are treated for tax purposes and, therefore, provides a more appropriate basis for comparing the Fund’s performance. Information on both versions of the index will be included for a one-year transition period. Thereafter, only the Net version will be included. |
| | | | |
| COLUMBIA ASIA PACIFIC EX-JAPAN FUND — 2012 SEMIANNUAL REPORT | | | 3 | |
| | |
| Your Fund at a Glance (continued) | | |
AVERAGE ANNUAL TOTAL RETURNS
| | | | | | | | | | | | |
| at April 30, 2012 | | | | | | | | | |
| Without sales charge | | 6 months* | | | 1 year | | | Since
inception | |
Class A** (inception 9/27/10) | | | +5.14% | | | | -12.57% | | | | +10.42% | |
Class C** (inception 9/27/10) | �� | | +4.59% | | | | -13.45% | | | | +9.49% | |
Class I** (inception 9/27/10) | | | +5.22% | | | | -12.27% | | | | +10.83% | |
Class R** (inception 9/27/10) | | | +4.87% | | | | -12.95% | | | | +10.06% | |
Class R5 (inception 7/15/09) | | | +5.18% | | | | -12.30% | | | | +10.80% | |
Class Z** (inception 9/27/10) | | | +5.08% | | | | -12.60% | | | | +10.61% | |
| | | |
| With sales charge | | | | | | | | | |
Class A** (inception 9/27/10) | | | -0.89% | | | | -17.62% | | | | +8.11% | |
Class C** (inception 9/27/10) | | | +3.60% | | | | -14.27% | | | | +9.49% | |
The “Without sales charge” returns for Class A and Class C shares do not include applicable initial or contingent deferred sales charges. If included, returns would be lower than those shown. The “With sales charge” returns for Class A and Class C shares include: the maximum initial sales charge of 5.75% for Class A shares; and a 1% CDSC for Class C shares sold within one year after purchase.
The Fund’s other share classes are not subject to sales charges and have limited eligibility. See the Fund’s prospectuses for details.
| ** | The returns shown for periods prior to the share class inception date (including returns since inception, which are since Fund inception) include the returns of the Fund’s Class R5 shares. These returns are adjusted to reflect any higher class-related operating expenses of the newer share classes, as applicable. Please visit columbiamanagement.com/mutual-fund/appended-performance for more information. |
| | |
| 4 | | COLUMBIA ASIA PACIFIC EX-JAPAN FUND — 2012 SEMIANNUAL REPORT |
| | | | |
| COUNTRY BREAKDOWN(1) (at April 30, 2012) | |
Australia | | | 15.8 | % |
China | | | 22.8 | |
Hong Kong | | | 9.3 | |
India | | | 6.1 | |
Indonesia | | | 3.2 | |
Luxembourg | | | 0.3 | |
Macau | | | 1.9 | |
Malaysia | | | 1.9 | |
Philippines | | | 1.0 | |
Singapore | | | 5.4 | |
South Korea | | | 16.7 | |
Taiwan | | | 9.9 | |
Thailand | | | 3.7 | |
Other(2) | | | 2.0 | |
| (1) | | Percentages indicated are based upon total investments (excluding Investments of Cash Collateral Received for Securities on Loan). The Fund’s portfolio composition is subject to change. |
| (2) | | Includes investments in Money Market Funds. |
| | | | |
| TOP TEN HOLDINGS(1) (at April 30, 2012) | |
Samsung Electronics Co., Ltd. (South Korea) | | | 6.0 | % |
Commonwealth Bank of Australia (Australia) | | | 2.9 | |
Taiwan Semiconductor Manufacturing Co., Ltd., ADR (Taiwan) | | | 2.7 | |
Australia & New Zealand Banking Group Ltd. (Australia) | | | 2.6 | |
BHP Billiton Ltd. (Australia) | | | 2.6 | |
CNOOC Ltd. (China) | | | 2.6 | |
China Construction Bank Corp., Class H (China) | | | 2.1 | |
Sands China Ltd. (Macau) | | | 1.9 | |
AIA Group Ltd. (Hong Kong) | | | 1.7 | |
Siam Commercial Bank PCL, Foreign Registered Shares (Thailand) | | | 1.7 | |
(1) Percentages indicated are based upon total investments (excluding Investments of Cash Collateral Received for Securities on Loan and Money Market Funds).
For further detail about these holdings, please refer to the section entitled “Portfolio of Investments.”
Fund holdings are as of the date given, are subject to change at any time, and are not recommendations to buy or sell any security.
| | | | |
| COLUMBIA ASIA PACIFIC EX-JAPAN FUND — 2012 SEMIANNUAL REPORT | | | 5 | |
| | |
| Your Fund at a Glance (continued) | | |
MORNINGSTAR STYLE BOXTM
| | |
 | | The Morningstar Style BoxTM is based on the Fund’s portfolio holdings.
For equity funds, the vertical axis shows the market capitalization of the
stocks owned, and the horizontal axis shows investment style (value,
blend, or growth). Information shown is based on the most recent data
provided by Morningstar. |
©2012 Morningstar, Inc. All rights reserved. The Morningstar information contained herein: (1) is proprietary to Morningstar and/or its content providers; (2) may not be copied or distributed; and (3) is not warranted to be accurate, complete, or timely. Neither Morningstar nor its content providers are responsible for any damages or losses arising from any use of this information. Past performance is no guarantee of future results.
| | |
| 6 | | COLUMBIA ASIA PACIFIC EX-JAPAN FUND — 2012 SEMIANNUAL REPORT |
(Unaudited)
Understanding your expenses
As an investor, you incur two types of costs. There are transaction costs, which generally include sales charges on purchases and may include redemption fees. There are also ongoing costs, which generally include management fees, distribution and service (Rule 12b-1) fees, and other fund expenses. The following information is intended to help you understand your ongoing costs (in dollars) of investing in the Fund and to help you compare these costs with the ongoing costs of investing in other mutual funds.
Analyzing your fund’s expenses
To illustrate these ongoing costs, we have provided examples and calculated the expenses paid by investors in each share class of the Fund during the period. The actual and hypothetical information in the table is based on an initial investment of $1,000 at the beginning of the period indicated and held for the entire period. Expense information is calculated two ways and each method provides you with different information. The amount listed in the “Actual” column is calculated using the Fund’s actual operating expenses and total return for the period. You may use the Actual information, together with the amount invested, to estimate the expenses that you paid over the period. Simply divide your account value by $1,000 (for example, an $8,600 account value divided by $1,000 = 8.6), then multiply the results by the expenses paid during the period under the Actual column. The amount listed in the “Hypothetical” column assumes a 5% annual rate of return before expenses (which is not the Fund’s actual return) and then applies the Fund’s actual expense ratio for the period to the hypothetical return. You should not use the hypothetical account values and expenses to estimate either your actual account balance at the end of the period or the expenses you paid during the period. See “Compare with other funds” below for details on how to use the hypothetical data.
Compare with other funds
Since all mutual funds are required to include the same hypothetical calculations about expenses in shareholder reports, you can use this information to compare the ongoing cost of investing in the Fund with other funds. To do so, compare the hypothetical example with the 5% hypothetical examples that appear in the shareholder reports of other funds. As you compare hypothetical examples of other funds, it is important to note that hypothetical examples are meant to highlight the ongoing costs of investing in a fund only and do not reflect any transaction costs, such as sales charges, or redemption or exchange fees. Therefore, the hypothetical calculations are useful in comparing ongoing costs only, and will not help you determine the relative total costs of owning different funds. If transaction costs were included in these calculations, your costs would be higher.
| | | | |
| COLUMBIA ASIA PACIFIC EX-JAPAN FUND — 2012 SEMIANNUAL REPORT | | | 7 | |
| | |
| Fund Expense Example (continued) | | |
November 1, 2011 — April 30, 2012
| | | | | | | | | | | | | | | | | | | | | | | | | | | | |
| | | Account value at the
beginning of the
period ($) | | | Account value at the
end of the period ($) | | | Expenses paid
during the period ($) | | | Fund’s
annualized
expense
ratio (%) | |
| | | Actual | | | Hypothetical | | | Actual | | | Hypothetical | | | Actual | | | Hypothetical | | | Actual | |
Class A | | | 1,000.00 | | | | 1,000.00 | | | | 1,051.40 | | | | 1,017.60 | | | | 7.45 | | | | 7.32 | | | | 1.46 | |
Class C | | | 1,000.00 | | | | 1,000.00 | | | | 1,045.90 | | | | 1,013.82 | | | | 11.29 | | | | 11.12 | | | | 2.22 | |
Class I | | | 1,000.00 | | | | 1,000.00 | | | | 1,052.20 | | | | 1,019.74 | | | | 5.26 | | | | 5.17 | | | | 1.03 | |
Class R | | | 1,000.00 | | | | 1,000.00 | | | | 1,048.70 | | | | 1,016.36 | | | | 8.71 | | | | 8.57 | | | | 1.71 | |
Class R5 | | | 1,000.00 | | | | 1,000.00 | | | | 1,051.80 | | | | 1,019.79 | | | | 5.20 | | | | 5.12 | | | | 1.02 | |
Class Z | | | 1,000.00 | | | | 1,000.00 | | | | 1,050.80 | | | | 1,018.80 | | | | 6.22 | | | | 6.12 | | | | 1.22 | |
Expenses paid during the period are equal to the annualized expense ratio for each class as indicated above, multiplied by the average account value over the period and then multiplied by the number of days in the Fund’s most recent fiscal half year and divided by 366.
Expenses do not include fees and expenses incurred indirectly by the Fund from the underlying funds in which the Fund may invest (also referred to as “acquired funds”), including affiliated and non-affiliated pooled investment vehicles (including mutual funds and exchange traded funds).
| | |
| 8 | | COLUMBIA ASIA PACIFIC EX-JAPAN FUND — 2012 SEMIANNUAL REPORT |
Columbia Asia Pacific ex-Japan Fund
April 30, 2012 (Unaudited)
(Percentages represent value of investments compared to net assets)
| | | | | | | | |
| Issuer | | Shares | | | Value | |
| Common Stocks 97.7% | |
| | | | | | | | |
AUSTRALIA 15.8% | | | | | | | | |
Australia & New Zealand Banking Group Ltd. | | | 425,622 | | | | $10,544,048 | |
BHP Billiton Ltd. | | | 281,770 | | | | 10,455,710 | |
Commonwealth Bank of Australia | | | 216,319 | | | | 11,668,894 | |
Iluka Resources Ltd. | | | 299,770 | | | | 5,236,512 | |
Macquarie Group Ltd. | | | 92,311 | | | | 2,782,301 | |
National Australia Bank Ltd. | | | 183,000 | | | | 4,783,494 | |
Newcrest Mining Ltd. | | | 107,829 | | | | 2,938,349 | |
Rio Tinto Ltd.(a) | | | 80,600 | | | | 5,515,049 | |
Santos Ltd. | | | 153,583 | | | | 2,228,026 | |
Telstra Corp., Ltd. | | | 1,589,959 | | | | 5,862,163 | |
Wesfarmers Ltd. | | | 108,675 | | | | 3,412,596 | |
| | | | | | | | |
Total | | | | | | | 65,427,142 | |
CHINA 22.8% | | | | | | | | |
AAC Technologies Holdings, Inc. | | | 1,412,000 | | | | 4,146,260 | |
Agile Property Holdings Ltd.(a) | | | 2,424,000 | | | | 3,153,847 | |
Agricultural Bank of China Ltd., Class H(a) | | | 9,432,000 | | | | 4,460,859 | |
Baidu, Inc., ADR(b) | | | 29,702 | | | | 3,941,455 | |
Belle International Holdings Ltd. | | | 1,483,000 | | | | 2,893,685 | |
China BlueChemical Ltd.(b) | | | 3,880,000 | | | | 2,765,325 | |
China Construction Bank Corp., Class H | | | 10,849,380 | | | | 8,419,598 | |
China Overseas Land & Investment Ltd. | | | 1,976,000 | | | | 4,270,168 | |
China Shenhua Energy Co., Ltd., Class H(b) | | | 871,500 | | | | 3,848,589 | |
China Unicom Hong Kong Ltd.(a) | | | 3,694,000 | | | | 6,460,720 | |
CNOOC Ltd. | | | 4,900,000 | | | | 10,354,429 | |
Dongfeng Motor Group Co., Ltd., Class H(a) | | | 2,004,000 | | | | 3,919,555 | |
ENN Energy Holdings Ltd. | | | 1,362,000 | | | | 4,758,647 | |
Focus Media Holding Ltd., ADR | | | 167,262 | | | | 3,995,889 | |
Industrial & Commercial Bank of China, Class H | | | 7,827,000 | | | | 5,200,525 | |
Intime Department Store Group Co., Ltd. | | | 780,000 | | | | 980,645 | |
Lenovo Group Ltd. | | | 4,826,000 | | | | 4,615,227 | |
New Oriental Education & Technology Group, ADR(b) | | | 96,354 | | | | 2,575,542 | |
PetroChina Co., Ltd., Class H | | | 4,274,000 | | | | 6,375,514 | |
Ping An Insurance Group Co., Class H | | | 489,500 | | | | 4,065,916 | |
| | | | | | | | |
| Issuer | | Shares | | | Value | |
| Common Stocks (continued) | |
| | | | | | | | |
CHINA (cont.) | | | | | | | | |
Sany Heavy Equipment International Holdings Co., Ltd. | | | 2,261,500 | | | | $1,738,153 | |
Zhuzhou CSR Times Electric Co., Ltd., Class H | | | 532,000 | | | | 1,499,754 | |
| | | | | | | | |
Total | | | | | | | 94,440,302 | |
HONG KONG 9.3% | | | | | | | | |
AIA Group Ltd. | | | 1,969,400 | | | | 6,969,454 | |
BOC Hong Kong Holdings Ltd. | | | 1,142,500 | | | | 3,531,313 | |
Cheung Kong Holdings Ltd. | | | 253,000 | | | | 3,345,940 | |
Comba Telecom Systems Holdings Ltd.(a) | | | 1,993,090 | | | | 1,098,965 | |
Hang Lung Properties Ltd. | | | 598,000 | | | | 2,198,563 | |
Hutchison Whampoa Ltd. | | | 396,000 | | | | 3,793,697 | |
Li & Fung Ltd. | | | 2,118,000 | | | | 4,516,515 | |
Samsonite International SA(b) | | | 1,051,800 | | | | 2,028,993 | |
Sun Hung Kai Properties Ltd. | | | 276,974 | | | | 3,317,566 | |
Swire Pacific Ltd., Class A | | | 237,000 | | | | 2,793,764 | |
Swire Properties Ltd. | | | 165,900 | | | | 454,380 | |
Wharf Holdings Ltd. | | | 732,900 | | | | 4,346,364 | |
| | | | | | | | |
Total | | | | | | | 38,395,514 | |
INDIA 6.1% | | | | | | | | |
Bajaj Auto Ltd. | | | 88,632 | | | | 2,724,494 | |
HDFC Bank Ltd. | | | 401,351 | | | | 4,132,726 | |
ICICI Bank Ltd., ADR | | | 78,310 | | | | 2,653,926 | |
Infosys Ltd. | | | 8,141 | | | | 377,987 | |
Infosys Ltd., ADR | | | 41,385 | | | | 1,959,580 | |
ITC Ltd. | | | 1,206,919 | | | | 5,616,408 | |
Larsen & Toubro Ltd. | | | 98,974 | | | | 2,298,245 | |
State Bank of India | | | 15,473 | | | | 626,112 | |
State Bank of India, GDR(c) | | | 19,418 | | | | 1,578,683 | |
Tata Consultancy Services Ltd. | | | 139,982 | | | | 3,301,377 | |
| | | | | | | | |
Total | | | | | | | 25,269,538 | |
INDONESIA 3.2% | | | | | | | | |
PT Astra International Tbk | | | 383,500 | | | | 2,953,245 | |
PT Bank Mandiri Persero Tbk | | | 4,492,816 | | | | 3,603,015 | |
PT Bank Rakyat Indonesia Persero Tbk | | | 4,158,000 | | | | 2,993,481 | |
PT Semen Gresik Persero Tbk | | | 2,922,500 | | | | 3,851,773 | |
| | | | | | | | |
Total | | | | | | | 13,401,514 | |
MACAU 1.9% | | | | | | | | |
Sands China Ltd. | | | 1,984,000 | | | | 7,767,927 | |
The accompanying Notes to Financial Statements are an integral part of this statement.
| | | | |
| COLUMBIA ASIA PACIFIC EX-JAPAN FUND — 2012 SEMIANNUAL REPORT | | | 9 | |
| | |
| Portfolio of Investments (continued) | | |
| | | | | | | | |
| Issuer | | Shares | | | Value | |
| Common Stocks (continued) | |
| | | | | | | | |
MALAYSIA 1.9% | | | | | | | | |
Genting Bhd | | | 1,210,900 | | | | $4,127,418 | |
Telekom Malaysia Bhd | | | 2,070,100 | | | | 3,674,819 | |
| | | | | | | | |
Total | | | | | | | 7,802,237 | |
PHILIPPINES 1.0% | | | | | | | | |
Ayala Corp. | | | 386,732 | | | | 3,930,584 | |
SINGAPORE 5.4% | | | | | | | | |
DBS Group Holdings Ltd. | | | 204,000 | | | | 2,291,807 | |
Keppel Corp., Ltd. | | | 708,000 | | | | 6,297,469 | |
Oversea-Chinese Banking Corp., Ltd. | | | 522,196 | | | | 3,771,032 | |
SembCorp Industries Ltd. | | | 723,000 | | | | 2,936,758 | |
SembCorp.Marine Ltd. | | | 715,000 | | | | 2,925,562 | |
Singapore Telecommunications Ltd. | | | 793,000 | | | | 1,994,769 | |
United Overseas Bank Ltd. | | | 142,801 | | | | 2,215,613 | |
| | | | | | | | |
Total | | | | | | | 22,433,010 | |
SOUTH KOREA 16.7% | | | | | | | | |
Amorepacific Corp. | | | 1,975 | | | | 1,896,140 | |
Hana Financial Group, Inc. | | | 87,930 | | | | 2,997,635 | |
| | | | | | | | |
Hyundai Department Store Co., Ltd. | | | 22,914 | | | | 3,222,465 | |
Hyundai Heavy Industries Co., Ltd. | | | 10,840 | | | | 2,693,741 | |
Hyundai Mobis | | | 20,884 | | | | 5,646,343 | |
Hyundai Motor Co. | | | 27,663 | | | | 6,530,412 | |
Hyundai Steel Co. | | | 32,902 | | | | 2,846,604 | |
LG Chem Ltd. | | | 12,872 | | | | 3,217,518 | |
LG Household & Health Care Ltd. | | | 6,388 | | | | 3,345,526 | |
Samsung Electronics Co., Ltd. | | | 19,770 | | | | 24,197,716 | |
Samsung Engineering Co., Ltd. | | | 20,978 | | | | 3,971,660 | |
Samsung Heavy Industries Co., Ltd. | | | 69,060 | | | | 2,524,850 | |
Shinhan Financial Group Co., Ltd. | | | 103,750 | | | | 3,600,786 | |
SK Hynix, Inc.(b) | | | 88,890 | | | | 2,190,910 | |
| | | | | | | | |
Total | | | | | | | 68,882,306 | |
TAIWAN 9.9% | | | | | | | | |
Advanced Semiconductor Engineering, Inc. | | | 1,679,000 | | | | 1,688,393 | |
Catcher Technology Co., Ltd. | | | 549,000 | | | | 3,485,721 | |
Chinatrust Financial Holding Co., Ltd. | | | 4,856,636 | | | | 3,078,534 | |
Far EasTone Telecommunications Co., Ltd. | | | 2,016,000 | | | | 4,362,421 | |
Fubon Financial Holding Co., Ltd. | | | 872 | | | | 902 | |
Hon Hai Precision Industry Co., Ltd. | | | 2,042,788 | | | | 6,422,886 | |
HTC Corp. | | | 144,400 | | | | 2,167,482 | |
Mega Financial Holding Co., Ltd. | | | 1,393,160 | | | | 1,095,329 | |
President Chain Store Corp. | | | 638,000 | | | | 3,409,840 | |
Taiwan Semiconductor Manufacturing Co., Ltd. | | | 1,426,000 | | | | 4,214,738 | |
Taiwan Semiconductor Manufacturing Co., Ltd., ADR | | | 715,114 | | | | 11,141,476 | |
| | | | | | | | |
Total | | | | | | | 41,067,722 | |
| | | | | | | | |
| Issuer | | Shares | | | Value | |
| Common Stocks (continued) | |
| | | | | | | | |
THAILAND 3.7% | | | | | | | | |
Bangkok Bank PCL, NVDR | | | 559,100 | | | | $3,462,808 | |
Banpu PCL, Foreign Registered Shares | | | 111,400 | | | | 2,011,536 | |
PTT PCL, Foreign Registered Shares | | | 260,100 | | | | 2,966,346 | |
Siam Commercial Bank PCL, Foreign Registered Shares | | | 1,336,600 | | | | 6,711,104 | |
| | | | | | | | |
Total | | | | | | | 15,151,794 | |
Total Common Stocks (Cost: $372,264,255) | | | | $403,969,590 | |
| | | | | | | | |
| Exchange-Traded Notes 0.3% | |
LUXEMBOURG 0.3% | |
CSI 300 Banks Index ETF | | | 1,423,500 | | | | $1,210,919 | |
Total Exchange-Traded Notes (Cost: $1,579,360) | | | | $1,210,919 | |
| | | | | | | | |
| | | Shares | | | Value | |
| Money Market Funds 2.0% | |
Columbia Short-Term
Cash Fund, 0.144%(d)(e) | | | 8,380,269 | | | | $8,380,269 | |
Total Money Market Funds (Cost: $8,380,269) | | | | $8,380,269 | |
| | | | | | | | | | | | |
| Issuer | | Effective
Yield | | | Par/
Principal/
Shares | | | Value | |
Investments of Cash Collateral Received
for Securities on Loan 2.5% | |
| | | | | | | | | | | | |
Asset-Backed Commercial Paper 0.2% | |
Kells Funding LLC | | | | | | | | | | | | |
06/04/12 | | | 0.501 | % | | | $998,681 | | | | $998,681 | |
Repurchase Agreements 2.3% | |
Natixis Financial Products, Inc.
dated 04/30/12, matures 05/01/12,
repurchase price $5,000,033(f) | |
| | | 0.240 | % | | | 5,000,000 | | | | 5,000,000 | |
Pershing LLC
dated 04/30/12, matures 05/01/12,
repurchase price $2,000,018(f) | |
| | | 0.330 | % | | | 2,000,000 | | | | 2,000,000 | |
The accompanying Notes to Financial Statements are an integral part of this statement.
| | |
| 10 | | COLUMBIA ASIA PACIFIC EX-JAPAN FUND — 2012 SEMIANNUAL REPORT |
| | | | | | | | | | | | |
| Issuer | | Effective
Yield | | | Par/
Principal/
Shares | | | Value | |
Investments of Cash Collateral Received
for Securities on Loan (continued) | |
| | | | | | | | | | | | |
Repurchase Agreements (cont.) | |
Societe Generale
dated 04/30/12, matures 05/01/12,
repurchase price $2,415,780(f) | |
| | | 0.210 | % | | | $2,415,765 | | | | $2,415,765 | |
| | | | | | | | | | | | |
Total | | | | | | | | | | | 9,415,765 | |
Total Investments of Cash Collateral Received for Securities on Loan | |
(Cost: $10,414,446) | | | | $10,414,446 | |
Total Investments | |
(Cost: $392,638,330) | | | | $423,975,224 | |
Other Assets & Liabilities, Net | | | | (10,196,636 | ) |
Net Assets | | | | $413,778,588 | |
Summary of Investments in Securities by Industry
The following table represents the portfolio investments of the Fund by industry classifications as a percentage of net assets at April 30, 2012:
| | | | | | | | |
| Industry | | Percentage of
Net Assets | | | Value | |
| Auto Components | | | 1.4 | % | | | $5,646,343 | |
| Automobiles | | | 3.9 | | | | 16,127,707 | |
| Capital Markets | | | 0.7 | | | | 2,782,301 | |
| Chemicals | | | 1.4 | | | | 5,982,843 | |
| Commercial Banks | | | 22.6 | | | | 93,421,323 | |
| Communications Equipment | | | 1.8 | | | | 7,412,707 | |
| Computers & Peripherals | | | 1.9 | | | | 8,100,948 | |
| Construction & Engineering | | | 1.5 | | | | 6,269,905 | |
| Construction Materials | | | 0.9 | | | | 3,851,773 | |
| Distributors | | | 1.1 | | | | 4,516,515 | |
| Diversified Consumer Services | | | 0.6 | | | | 2,575,542 | |
| Diversified Financial Services | | | 1.2 | | | | 5,142,405 | |
| Diversified Telecommunication Services | | | 4.3 | | | | 17,992,471 | |
| Electrical Equipment | | | 0.4 | | | | 1,499,755 | |
| Electronic Equipment, Instruments & Components | | | 1.5 | | | | 6,422,886 | |
| Food & Staples Retailing | | | 1.6 | | | | 6,822,435 | |
| Gas Utilities | | | 1.2 | | | | 4,758,647 | |
| Hotels, Restaurants & Leisure | | | 2.9 | | | | 11,895,345 | |
| Household Products | | | 0.8 | | | | 3,345,526 | |
| Industrial Conglomerates | | | 3.1 | | | | 13,027,924 | |
| Insurance | | | 2.7 | | | | 11,035,369 | |
The accompanying Notes to Financial Statements are an integral part of this statement.
| | | | |
| COLUMBIA ASIA PACIFIC EX-JAPAN FUND — 2012 SEMIANNUAL REPORT | | | 11 | |
| | |
| Portfolio of Investments (continued) | | |
Summary of Investments in Securities by Industry (continued)
| | | | | | | | |
| Industry | | Percentage of
Net Assets | | | Value | |
| Internet Software & Services | | | 1.0 | % | | | $3,941,455 | |
| IT Services | | | 1.4 | | | | 5,638,944 | |
| Machinery | | | 2.4 | | | | 9,882,306 | |
| Media | | | 1.0 | | | | 3,995,889 | |
| Metals & Mining | | | 6.5 | | | | 26,992,224 | |
| Multiline Retail | | | 1.0 | | | | 4,203,111 | |
| Oil, Gas & Consumable Fuels | | | 6.7 | | | | 27,784,439 | |
| Personal Products | | | 0.5 | | | | 1,896,140 | |
| Real Estate Management & Development | | | 5.8 | | | | 23,880,591 | |
| Semiconductors & Semiconductor Equipment | | | 10.5 | | | | 43,433,233 | |
| Specialty Retail | | | 0.7 | | | | 2,893,685 | |
| Textiles, Apparel & Luxury Goods | | | 0.5 | | | | 2,028,993 | |
| Tobacco | | | 1.4 | | | | 5,616,408 | |
| Wireless Telecommunication Services | | | 1.1 | | | | 4,362,421 | |
| Other(1) | | | 4.5 | | | | 18,794,715 | |
| Total | | | | | | | $423,975,224 | |
| (1) | Includes Cash Equivalents. |
| | |
| Notes to Portfolio of Investments |
| (a) | At April 30, 2012, security was partially or fully on loan. |
| (c) | Security exempt from registration pursuant to Rule 144A under the Securities Act of 1933. This security may be resold in transactions exempt from registration, normally to qualified institutional buyers. At April 30, 2012, the value of these securities amounted to $1,578,683 or 0.38% of net assets. |
| (d) | The rate shown is the seven-day current annualized yield at April 30, 2012. |
| (e) | Investments in affiliates during the period ended April 30, 2012: |
| | | | | | | | | | | | | | | | | | | | | | | | | | | | |
| Issuer | | Beginning
Cost | | | Purchase
Cost | | | Sales Cost/
Proceeds
from Sales | | | Realized
Gain/Loss | | | Ending
Cost | | | Dividends
or
Interest
Income | | | Value | |
Columbia Short-Term Cash Fund | | | $891,067 | | | | $64,245,827 | | | | $(56,756,625 | ) | | | $— | | | | $8,380,269 | | | | $5,055 | | | | $8,380,269 | |
The accompanying Notes to Financial Statements are an integral part of this statement.
| | |
| 12 | | COLUMBIA ASIA PACIFIC EX-JAPAN FUND — 2012 SEMIANNUAL REPORT |
| | |
| Notes to Portfolio of Investments (continued) |
| (f) | The table below represents securities received as collateral for repurchase agreements. This collateral is deposited with the Fund’s custodian and, pursuant to the terms of the repurchase agreement, must have an aggregate value greater than or equal to the repurchase price plus accrued interest at all times. The value of securities and/or cash held as collateral for repurchase agreements is monitored on a daily basis to ensure the proper level of collateral. |
| | | | |
| Natixis Financial Products, Inc. (0.240%) | | | | |
| Security Description | | Value | |
| Fannie Mae Pool | | | $ 176,700 | |
| Fannie Mae REMICS | | | 1,311,602 | |
| Fannie Mae Whole Loan | | | 41,206 | |
| Freddie Mac Gold Pool | | | 370,107 | |
| Freddie Mac Non Gold Pool | | | 95,748 | |
| Freddie Mac REMICS | | | 1,145,633 | |
| Government National Mortgage Association | | | 816,532 | |
| United States Treasury Note/Bond | | | 1,142,506 | |
| Total Market Value of Collateral Securities | | | $5,100,034 | |
| Pershing LLC (0.330%) | | | | |
| Security Description | | Value | |
| Fannie Mae Pool | | | $414,997 | |
| Fannie Mae REMICS | | | 108,619 | |
| Fannie Mae-Aces | | | 11,920 | |
| Federal Farm Credit Bank | | | 75,344 | |
| Federal Home Loan Banks | | | 19,702 | |
| Federal Home Loan Mortgage Corp | | | 16,112 | |
| Federal National Mortgage Association | | | 22,820 | |
| Freddie Mac Coupon Strips | | | 15,741 | |
| Freddie Mac Gold Pool | | | 160,283 | |
| Freddie Mac Non Gold Pool | | | 60,432 | |
| Freddie Mac Reference REMIC | | | 19,218 | |
| Freddie Mac REMICS | | | 125,076 | |
| Ginnie Mae I Pool | | | 206,346 | |
| Ginnie Mae II Pool | | | 576,031 | |
| Government National Mortgage Association | | | 68,448 | |
| United States Treasury Note/Bond | | | 138,911 | |
| Total Market Value of Collateral Securities | | | $2,040,000 | |
| Societe Generale (0.210%) | | | | |
| Security Description | | Value | |
| Fannie Mae Pool | | | $1,678,951 | |
| Freddie Mac Gold Pool | | | 785,130 | |
| Total Market Value of Collateral Securities | | | $2,464,081 | |
| | |
| Abbreviation Legend |
| ADR | | American Depositary Receipt |
| GDR | | Global Depositary Receipt |
| NVDR | | Non-voting Depository Receipt |
The accompanying Notes to Financial Statements are an integral part of this statement.
| | | | |
| COLUMBIA ASIA PACIFIC EX-JAPAN FUND — 2012 SEMIANNUAL REPORT | | | 13 | |
| | |
| Portfolio of Investments (continued) | | |
Generally accepted accounting principles (GAAP) require disclosure regarding the inputs and valuation techniques used to measure fair value and any changes in valuation inputs or techniques. In addition, investments shall be disclosed by major category.
The Fund categorizes its fair value measurements according to a three-level hierarchy that maximizes the use of observable inputs and minimizes the use of unobservable inputs by prioritizing that the most observable input be used when available. Observable inputs are those that market participants would use in pricing an investment based on market data obtained from sources independent of the reporting entity. Unobservable inputs are those that reflect the Fund’s assumptions about the information market participants would use in pricing an investment. An investment’s level within the fair value hierarchy is based on the lowest level of any input that is deemed significant to the asset or liability’s fair value measurement. The input levels are not necessarily an indication of the risk or liquidity associated with investments at that level. For example, certain U.S. government securities are generally high quality and liquid, however, they are reflected as Level 2 because the inputs used to determine fair value may not always be quoted prices in an active market.
Fair value inputs are summarized in the three broad levels listed below:
| | Ÿ | | Level 1 — Valuations based on quoted prices for investments in active markets that the Fund has the ability to access at the measurement date (including NAV for open-end mutual funds). Valuation adjustments are not applied to Level 1 investments. |
| | Ÿ | | Level 2 — Valuations based on other significant observable inputs (including quoted prices for similar securities, interest rates, prepayment speeds, credit risks, etc.). |
| | Ÿ | | Level 3 — Valuations based on significant unobservable inputs (including the Fund’s own assumptions and judgment in determining the fair value of investments). |
Inputs that are used in determining fair value of an investment may include price information, credit data, volatility statistics, and other factors. These inputs can be either observable or unobservable. The availability of observable inputs can vary between investments, and is affected by various factors such as the type of investment, and the volume and level of activity for that investment or similar investments in the marketplace. The inputs will be considered by the Investment Manager, along with any other relevant factors in the calculation of an investment’s fair value. The Fund uses prices and inputs that are current as of the measurement date, which may include periods of market dislocations. During these periods, the availability of prices and inputs may be reduced for many investments. This condition could cause an investment to be reclassified between the various levels within the hierarchy.
Foreign equity securities actively traded in markets where there is a significant delay in the local close relative to the New York Stock Exchange (NYSE) are classified as Level 2. The values of these securities may include an adjustment to reflect the impact of significant market movements following the close of local trading, as described in Note 2 to the financial statements – Security Valuation.
Investments falling into the Level 3 category are primarily supported by quoted prices from brokers and dealers participating in the market for those investments. However, these may be classified as Level 3 investments due to lack of market transparency and corroboration to support these quoted prices. Additionally, valuation models may be used as the pricing source for any remaining
The accompanying Notes to Financial Statements are an integral part of this statement.
| | |
| 14 | | COLUMBIA ASIA PACIFIC EX-JAPAN FUND — 2012 SEMIANNUAL REPORT |
| | |
| Fair Value Measurements (continued) |
investments classified as Level 3. These models rely on one or more significant unobservable inputs and/or significant assumptions by the Investment Manager. Inputs used in valuations may include, but are not limited to, financial statement analysis, capital account balances, discount rates and estimated cash flows, and comparable company data.
The following table is a summary of the inputs used to value the Fund’s investments as of April 30, 2012:
| | | | | | | | | | | | | | | | |
| | | Fair value at April 30, 2012 | |
| Description | | Level 1
quoted prices
in active
markets for
identical assets | | | Level 2
other
significant
observable
inputs | | | Level 3
significant
unobservable
inputs | | | Total | |
| Equity Securities | | | | | | | | | | | | | | | | |
Common Stocks | | | | | | | | | | | | | | | | |
Consumer Discretionary | | | $6,571,432 | | | | $47,311,698 | | | | $— | | | | $53,883,130 | |
Consumer Staples | | | — | | | | 17,680,508 | | | | — | | | | 17,680,508 | |
Energy | | | — | | | | 27,784,439 | | | | — | | | | 27,784,439 | |
Financials | | | 2,653,926 | | | | 132,397,146 | | | | — | | | | 135,051,072 | |
Industrials | | | — | | | | 30,679,889 | | | | — | | | | 30,679,889 | |
Information Technology | | | 17,042,511 | | | | 57,907,662 | | | | — | | | | 74,950,173 | |
Materials | | | — | | | | 36,826,840 | | | | — | | | | 36,826,840 | |
Telecommunication Services | | | — | | | | 22,354,892 | | | | — | | | | 22,354,892 | |
Utilities | | | — | | | | 4,758,647 | | | | — | | | | 4,758,647 | |
| Total Equity Securities | | | 26,267,869 | | | | 377,701,721 | | | | — | | | | 403,969,590 | |
| Other | | | | | | | | | | | | | | | | |
Exchange-Trades Notes | | | — | | | | 1,210,919 | | | | — | | | | 1,210,919 | |
Money Market Funds | | | 8,380,269 | | | | — | | | | — | | | | 8,380,269 | |
Investments of Cash Collateral Received for Securities on Loan | | | — | | | | 10,414,446 | | | | — | | | | 10,414,446 | |
| Total Other | | | 8,380,269 | | | | 11,625,365 | | | | — | | | | 20,005,634 | |
| Total | | | $34,648,138 | | | | $389,327,086 | | | | $— | | | | $423,975,224 | |
See the Portfolio of Investments for all investment classifications not indicated in the table.
The Fund’s assets assigned to the Level 2 input category are generally valued using the market approach, in which a security’s value is determined through reference to prices and information from market transactions for similar or identical assets. These assets include certain foreign securities for which a third party statistical pricing service may be employed for purposes of fair market valuation. The models utilized by the third party statistical pricing service take into account a security’s correlation to available market data including, but not limited to, intraday index, ADR, and ETF movements.
There were no transfers of financial assets between Levels 1 and 2 during the period.
The accompanying Notes to Financial Statements are an integral part of this statement.
| | | | |
| COLUMBIA ASIA PACIFIC EX-JAPAN FUND — 2012 SEMIANNUAL REPORT | | | 15 | |
| | |
| Portfolio of Investments (continued) | | |
How to find information about the Fund’s quarterly portfolio holdings
| (i) | The Fund files its complete schedule of portfolio holdings with the Securities and Exchange Commission (SEC) for the first and third quarters of each fiscal year on Form N-Q; |
| (ii) | The Fund’s Forms N-Q are available on the SEC’s website at www.sec.gov; |
| (iii) | The Fund’s Forms N-Q may be reviewed and copied at the SEC’s Public Reference Room in Washington, DC (information on the operations of the Public Reference Room may be obtained by calling 800.SEC.0330); and |
| (iv) | The Fund’s complete schedule of portfolio holdings, as filed on Form N-Q, can be obtained without charge, upon request, by calling 800.345.6611. |
The accompanying Notes to Financial Statements are an integral part of this statement.
| | |
| 16 | | COLUMBIA ASIA PACIFIC EX-JAPAN FUND — 2012 SEMIANNUAL REPORT |
| | |
| Statement of Assets and Liabilities | | |
April 30, 2012 (Unaudited)
| | | | | |
Assets | | | | | |
Investments, at value* | | | | | |
Unaffiliated issuers (identified cost $373,843,615) | | | $ | 405,180,509 | |
Affiliated issuers (identified cost $8,380,269) | | | | 8,380,269 | |
Investment of cash collateral received for securities on loan | | | | | |
Short-term securities (identified cost $998,681) | | | | 998,681 | |
Repurchase agreements (identified cost $9,415,765) | | | | 9,415,765 | |
Total investments (identified cost $392,638,330) | | | | 423,975,224 | |
Foreign currency (identified cost $2,143,133) | | | | 2,150,218 | |
Receivable for: | | | | | |
Capital shares sold | | | | 1,492,733 | |
Dividends | | | | 739,305 | |
Interest | | | | 9,869 | |
Prepaid expense | | | | 2,169 | |
Total assets | | | | 428,369,518 | |
Liabilities | | | | | |
Due upon return of securities on loan | | | | 10,414,446 | |
Payable for: | | | | | |
Investments purchased | | | | 3,011,026 | |
Capital shares purchased | | | | 299,483 | |
Foreign capital gains taxes deferred | | | | 663,825 | |
Investment management fees | | | | 26,781 | |
Distribution fees | | | | 18 | |
Transfer agent fees | | | | 3,640 | |
Administration fees | | | | 2,712 | |
Compensation of board members | | | | 10,549 | |
Other expenses | | | | 158,450 | |
Total liabilities | | | | 14,590,930 | |
Net assets applicable to outstanding capital stock | | | $ | 413,778,588 | |
The accompanying Notes to Financial Statements are an integral part of this statement.
| | | | |
| COLUMBIA ASIA PACIFIC EX-JAPAN FUND — 2012 SEMIANNUAL REPORT | | | 17 | |
| | |
| Statement of Assets and Liabilities (continued) | | |
April 30, 2012 (Unaudited)
| | | | | |
Represented by | | | | | |
Paid-in capital | | | $ | 414,433,678 | |
Undistributed net investment income | | | | 810,245 | |
Accumulated net realized loss | | | | (32,145,159 | ) |
Unrealized appreciation (depreciation) on: | | | | | |
Investments | | | | 31,336,894 | |
Foreign currency translations | | | | 6,755 | |
Foreign capital gains tax | | | | (663,825 | ) |
Total — representing net assets applicable to outstanding capital stock | | | $ | 413,778,588 | |
*Value of securities on loan | | | $ | 9,814,328 | |
Net assets applicable to outstanding shares | | | | | |
Class A | | | $ | 647,469 | |
Class C | | | $ | 41,795 | |
Class I | | | $ | 2,321 | |
Class R | | | $ | 34,211 | |
Class R5 | | | $ | 412,897,027 | |
Class Z | | | $ | 155,765 | |
Shares outstanding | | | | | |
Class A | | | | 52,481 | |
Class C | | | | 3,417 | |
Class I | | | | 188 | |
Class R | | | | 2,787 | |
Class R5 | | | | 33,426,105 | |
Class Z | | | | 12,632 | |
Net asset value per share | | | | | |
Class A(a) | | | $ | 12.34 | |
Class C | | | $ | 12.23 | |
Class I | | | $ | 12.35 | |
Class R | | | $ | 12.28 | |
Class R5 | | | $ | 12.35 | |
Class Z | | | $ | 12.33 | |
| (a) | The maximum offering price per share for Class A is $13.09. The offering price is calculated by dividing the net asset value by 1.0 minus the maximum sales charge of 5.75%. |
The accompanying Notes to Financial Statements are an integral part of this statement.
| | |
| 18 | | COLUMBIA ASIA PACIFIC EX-JAPAN FUND — 2012 SEMIANNUAL REPORT |
Six months ended April 30, 2012 (Unaudited)
| | | | | |
Net investment income | |
Income: | | | | | |
Dividends | | | $ | 4,133,478 | |
Interest | | | | 666 | |
Dividends from affiliates | | | | 5,055 | |
Income from securities lending — net | | | | 89,678 | |
Foreign taxes withheld | | | | (769,893 | ) |
Total income | | | | 3,458,984 | |
Expenses: | | | | | |
Investment management fees | | | | 1,597,877 | |
Distribution fees | | | | | |
Class A | | | | 784 | |
Class C | | | | 240 | |
Class R | | | | 80 | |
Transfer agent fees | | | | | |
Class A | | | | 658 | |
Class C | | | | 51 | |
Class R | | | | 33 | |
Class R5 | | | | 45,291 | |
Class Z | | | | 139 | |
Administration fees | | | | 161,727 | |
Compensation of board members | | | | 10,444 | |
Custodian fees | | | | 115,735 | |
Printing and postage fees | | | | 38,770 | |
Registration fees | | | | 33,505 | |
Professional fees | | | | 41,931 | |
Line of credit interest expense | | | | 7,750 | |
Other | | | | 16,490 | |
Total expenses | | | | 2,071,505 | |
Net investment income | | | | 1,387,479 | |
The accompanying Notes to Financial Statements are an integral part of this statement.
| | | | |
| COLUMBIA ASIA PACIFIC EX-JAPAN FUND — 2012 SEMIANNUAL REPORT | | | 19 | |
| | |
| Statement of Operations (continued) | | |
| | | | | |
Realized and unrealized gain (loss) — net | |
Net realized gain (loss) on: | | | | | |
Investments | | | $ | (33,495,113 | ) |
Foreign currency translations | | | | 1,583 | |
Net realized loss | | | | (33,493,530 | ) |
Net change in unrealized appreciation (depreciation) on: | | | | | |
Investments | | | | 43,316,682 | |
Foreign currency translations | | | | (23,573 | ) |
Foreign capital gains tax | | | | (572,383 | ) |
Net change in unrealized appreciation | | | | 42,720,726 | |
Net realized and unrealized gain | | | | 9,227,196 | |
Net increase in net assets resulting from operations | | | $ | 10,614,675 | |
The accompanying Notes to Financial Statements are an integral part of this statement.
| | |
| 20 | | COLUMBIA ASIA PACIFIC EX-JAPAN FUND — 2012 SEMIANNUAL REPORT |
| | |
| Statement of Changes in Net assets | | |
| | | | | | | | | | |
| | | Six months ended
April 30, 2012 | | Year ended
October 31, 2011 |
| | | (Unaudited) | | |
Operations | | | | | | | | | | |
Net investment income | | | $ | 1,387,479 | | | | $ | 6,768,875 | |
Net realized gain (loss) | | | | (33,493,530 | ) | | | | 18,864,574 | |
Net change in unrealized appreciation (depreciation) | | | | 42,720,726 | | | | | (79,163,982 | ) |
Net increase (decrease) in net assets resulting from operations | | | | 10,614,675 | | | | | (53,530,533 | ) |
Distributions to shareholders from: | | | | | | | | | | |
Net investment income | | | | | | | | | | |
Class A | | | | (6,071 | ) | | | | (1,210 | ) |
Class C | | | | (317 | ) | | | | (78 | ) |
Class I | | | | (35 | ) | | | | (16 | ) |
Class R | | | | (355 | ) | | | | (11 | ) |
Class R5 | | | | (5,950,962 | ) | | | | (3,273,747 | ) |
Class Z | | | | (1,257 | ) | | | | (136 | ) |
Net realized gains | | | | | | | | | | |
Class A | | | | (27,634 | ) | | | | (247 | ) |
Class C | | | | (2,240 | ) | | | | (18 | ) |
Class I | | | | (104 | ) | | | | (3 | ) |
Class R | | | | (1,429 | ) | | | | (3 | ) |
Class R5 | | | | (17,996,325 | ) | | | | (633,212 | ) |
Class Z | | | | (4,325 | ) | | | | (25 | ) |
Total distributions to shareholders | | | | (23,991,054 | ) | | | | (3,908,706 | ) |
Increase (decrease) in net assets from share transactions | | | | (78,033,432 | ) | | | | 49,818,055 | |
Total decrease in net assets | | | | (91,409,811 | ) | | | | (7,621,184 | ) |
Net assets at beginning of period | | | | 505,188,399 | | | | | 512,809,583 | |
Net assets at end of period | | | $ | 413,778,588 | | | | $ | 505,188,399 | |
Undistributed net investment income | | | $ | 810,245 | | | | $ | 5,381,763 | |
The accompanying Notes to Financial Statements are an integral part of this statement.
| | | | |
| COLUMBIA ASIA PACIFIC EX-JAPAN FUND — 2012 SEMIANNUAL REPORT | | | 21 | |
| | |
| Statement of Changes in Net assets (continued) | | |
| | | | | | | | | | | | | | | | | | | | |
| | | Six months ended
April 30, 2012
(Unaudited) | | Year ended
October 31, 2011 |
| | | Shares | | Dollars ($) | | Shares | | Dollars ($) |
Capital stock activity | | | | | | | | | | | | | | | | | | | | |
Class A shares | | | | | | | | | | | | | | | | | | | | |
Subscriptions(a) | | | | 4,109 | | | | | 49,608 | | | | | 55,497 | | | | | 764,739 | |
Distributions reinvested | | | | 2,779 | | | | | 30,151 | | | | | 105 | | | | | 1,439 | |
Redemptions | | | | (5,778 | ) | | | | (67,865 | ) | | | | (9,887 | ) | | | | (125,939 | ) |
Net increase | | | | 1,110 | | | | | 11,894 | | | | | 45,715 | | | | | 640,239 | |
Class C shares | | | | | | | | | | | | | | | | | | | | |
Subscriptions | | | | 747 | | | | | 8,945 | | | | | 3,454 | | | | | 48,032 | |
Distributions reinvested | | | | 224 | | | | | 2,425 | | | | | 6 | | | | | 81 | |
Redemptions(a) | | | | (1,200 | ) | | | | (14,494 | ) | | | | (2 | ) | | | | (20 | ) |
Net increase (decrease) | | | | (229 | ) | | | | (3,124 | ) | | | | 3,458 | | | | | 48,093 | |
Class R shares | | | | | | | | | | | | | | | | | | | | |
Subscriptions | | | | 178 | | | | | 2,110 | | | | | 2,901 | | | | | 41,379 | |
Distributions reinvested | | | | 153 | | | | | 1,654 | | | | | — | | | | | — | |
Redemptions | | | | (77 | ) | | | | (948 | ) | | | | (556 | ) | | | | (7,980 | ) |
Net increase | | | | 254 | | | | | 2,816 | | | | | 2,345 | | | | | 33,399 | |
Class R5 shares | | | | | | | | | | | | | | | | | | | | |
Subscriptions | | | | 6,516,753 | | | | | 78,393,603 | | | | | 25,759,112 | | | | | 358,782,668 | |
Distributions reinvested | | | | 709,038 | | | | | 7,707,242 | | | | | 75,140 | | | | | 1,033,922 | |
Redemptions | | | | (14,012,598 | ) | | | | (164,199,996 | ) | | | | (22,803,465 | ) | | | | (310,843,511 | ) |
Net increase (decrease) | | | | (6,786,807 | ) | | | | (78,099,151 | ) | | | | 3,030,787 | | | | | 48,973,079 | |
Class Z shares | | | | | | | | | | | | | | | | | | | | |
Subscriptions | | | | 4,678 | | | | | 52,601 | | | | | 70,961 | | | | | 1,038,250 | |
Distributions reinvested | | | | 502 | | | | | 5,448 | | | | | 10 | | | | | 143 | |
Redemptions | | | | (330 | ) | | | | (3,916 | ) | | | | (63,377 | ) | | | | (915,148 | ) |
Net increase | | | | 4,850 | | | | | 54,133 | | | | | 7,594 | | | | | 123,245 | |
Total net increase (decrease) | | | | (6,780,822 | ) | | | | (78,033,432 | ) | | | | 3,089,899 | | | | | 49,818,055 | |
| (a) | Includes conversions of Class B shares to Class A shares, if any. |
The accompanying Notes to Financial Statements are an integral part of this statement.
| | |
| 22 | | COLUMBIA ASIA PACIFIC EX-JAPAN FUND — 2012 SEMIANNUAL REPORT |
The following tables are intended to help you understand the Fund’s financial performance. Certain information reflects financial results for a single share of a class held for the periods shown. Per share net investment income (loss) amounts are calculated based on average shares outstanding during the period. Total returns assume reinvestment of all dividends and distributions. Total returns do not reflect payments of sales charges, if any, and are not annualized for periods of less than one year.
| | | | | | | | | | | | | | | |
| | | Six months
ended April 30, | | Year ended Oct. 31, |
| | | 2012 | | 2011 | | 2010(a) |
| | | (Unaudited) | | | | |
Class A | | | | | | | | | | | | | | | |
Per share data | | | | | | | | | | | | | | | |
Net asset value, beginning of period | | | | $12.49 | | | | | $13.79 | | | | | $13.32 | |
Income from investment operations: | | | | | | | | | | | | | | | |
Net investment income (loss) | | | | 0.02 | | | | | 0.15 | | | | | (0.01 | ) |
Net realized and unrealized gain (loss) | | | | 0.53 | | | | | (1.36 | ) | | | | 0.48 | |
Total from investment operations | | | | 0.55 | | | | | (1.21 | ) | | | | 0.47 | |
Less distributions to shareholders from: | | | | | | | | | | | | | | | |
Net investment income | | | | (0.14 | ) | | | | (0.07 | ) | | | | — | |
Net realized gains | | | | (0.56 | ) | | | | (0.02 | ) | | | | — | |
Total distributions to shareholders | | | | (0.70 | ) | | | | (0.09 | ) | | | | — | |
Net asset value, end of period | | | | $12.34 | | | | | $12.49 | | | | | $13.79 | |
Total return | | | | 5.14% | | | | | (8.82% | ) | | | | 3.53% | |
Ratios to average net assets(b) | | | | | | | | | | | | | | | |
Expenses prior to fees waived or expenses reimbursed
(including interest expense) | | | | 1.46% | (c)(d) | | | | 1.45% | (d) | | | | 1.50% | (c) |
Net expenses after fees waived or expenses reimbursed
(including interest expense)(e) | | | | 1.46% | (c)(d) | | | | 1.45% | (d)(f) | | | | 1.50% | (c) |
Expenses prior to fees waived or expenses reimbursed
(excluding interest expense) | | | | 1.46% | (c) | | | | 1.45% | | | | | 1.50% | (c) |
Net expenses after fees waived or expenses reimbursed
(excluding interest expense)(e) | | | | 1.46% | (c) | | | | 1.45% | (f) | | | | 1.50% | (c) |
Net investment income (loss) | | | | 0.27% | (c) | | | | 1.12% | (f) | | | | (0.95% | )(c) |
Supplemental data | | | | | | | | | | | | | | | |
Net assets, end of period (in thousands) | | | | $647 | | | | | $642 | | | | | $78 | |
Portfolio turnover | | | | 16% | | | | | 63% | | | | | 21% | |
Notes to Financial Highlights
| (a) | For the period from September 27, 2010 (commencement of operations) to October 31, 2010. |
| (b) | In addition to the fees and expenses which the Fund bears directly, the Fund indirectly bears a pro rata share of the fees and expenses of the acquired funds in which it invests. Such indirect expenses are not included in the reported expense ratios. |
| (d) | Includes interest expense which rounds to less than 0.01%. |
| (e) | The Investment Manager and certain of its affiliates agreed to waive/reimburse certain fees and expenses, if applicable. |
| (f) | The benefits derived from expense reductions had an impact of less than 0.01%. |
The accompanying Notes to Financial Statements are an integral part of this statement.
| | | | |
| COLUMBIA ASIA PACIFIC EX-JAPAN FUND — 2012 SEMIANNUAL REPORT | | | 23 | |
| | |
| Financial Highlights (continued) | | |
| | | | | | | | | | | | | | | |
| | | Six months
ended April 30, | | Year ended Oct. 31, |
| | | 2012 | | 2011 | | 2010(a) |
| | | (Unaudited) | | | | |
Class C | | | | | | | | | | | | | | | |
Per share data | | | | | | | | | | | | | | | |
Net asset value, beginning of period | | | | $12.38 | | | | | $13.78 | | | | | $13.32 | |
Income from investment operations: | | | | | | | | | | | | | | | |
Net investment income (loss) | | | | (0.03 | ) | | | | 0.06 | | | | | (0.02 | ) |
Net realized and unrealized gain (loss) | | | | 0.51 | | | | | (1.38 | ) | | | | 0.48 | |
Total from investment operations | | | | 0.48 | | | | | (1.32 | ) | | | | 0.46 | |
Less distributions to shareholders from: | | | | | | | | | | | | | | | |
Net investment income | | | | (0.07 | ) | | | | (0.06 | ) | | | | — | |
Net realized gains | | | | (0.56 | ) | | | | (0.02 | ) | | | | — | |
Total distributions to shareholders | | | | (0.63 | ) | | | | (0.08 | ) | | | | — | |
Net asset value, end of period | | | | $12.23 | | | | | $12.38 | | | | | $13.78 | |
Total return | | | | 4.59% | | | | | (9.62% | ) | | | | 3.45% | |
Ratios to average net assets(b) | | | | | | | | | | | | | | | |
Expenses prior to fees waived or expenses reimbursed
(including interest expense) | | | | 2.22% | (c)(d) | | | | 2.19% | (d) | | | | 2.22% | (c) |
Net expenses after fees waived or expenses reimbursed
(including interest expense)(e) | | | | 2.22% | (c)(d) | | | | 2.19% | (d)(f) | | | | 2.22% | (c) |
Expenses prior to fees waived or expenses reimbursed
(excluding interest expense) | | | | 2.21% | (c) | | | | 2.19% | | | | | 2.22% | (c) |
Net expenses after fees waived or expenses reimbursed
(excluding interest expense)(e) | | | | 2.21% | (c) | | | | 2.19% | (f) | | | | 2.22% | (c) |
Net investment income (loss) | | | | (0.50% | )(c) | | | | 0.44% | (f) | | | | (1.93% | )(c) |
Supplemental data | | | | | | | | | | | | | | | |
Net assets, end of period (in thousands) | | | | $42 | | | | | $45 | | | | | $3 | |
Portfolio turnover | | | | 16% | | | | | 63% | | | | | 21% | |
Notes to Financial Highlights
| (a) | For the period from September 27, 2010 (commencement of operations) to October 31, 2010. |
| (b) | In addition to the fees and expenses which the Fund bears directly, the Fund indirectly bears a pro rata share of the fees and expenses of the acquired funds in which it invests. Such indirect expenses are not included in the reported expense ratios. |
| (d) | Includes interest expense which rounds to less than 0.01%. |
| (e) | The Investment Manager and certain of its affiliates agreed to waive/reimburse certain fees and expenses, if applicable. |
| (f) | The benefits derived from expense reductions had an impact of less than 0.01%. |
The accompanying Notes to Financial Statements are an integral part of this statement.
| | |
| 24 | | COLUMBIA ASIA PACIFIC EX-JAPAN FUND — 2012 SEMIANNUAL REPORT |
| | | | | | | | | | | | | | | |
| | | Six months
ended April 30, | | Year ended Oct. 31, |
| | | 2012 | | 2011 | | 2010(a) |
| | | (Unaudited) | | | | |
Class I | | | | | | | | | | | | | | | |
Per share data | | | | | | | | | | | | | | | |
Net asset value, beginning of period | | | | $12.54 | | | | | $13.79 | | | | | $13.32 | |
Income from investment operations: | | | | | | | | | | | | | | | |
Net investment income (loss) | | | | 0.04 | | | | | 0.18 | | | | | (0.01 | ) |
Net realized and unrealized gain (loss) | | | | 0.51 | | | | | (1.33 | ) | | | | 0.48 | |
Total from investment operations | | | | 0.55 | | | | | (1.15 | ) | | | | 0.47 | |
Less distributions to shareholders from: | | | | | | | | | | | | | | | |
Net investment income | | | | (0.18 | ) | | | | (0.08 | ) | | | | — | |
Net realized gains | | | | (0.56 | ) | | | | (0.02 | ) | | | | — | |
Total distributions to shareholders | | | | (0.74 | ) | | | | (0.10 | ) | | | | — | |
Net asset value, end of period | | | | $12.35 | | | | | $12.54 | | | | | $13.79 | |
Total return | | | | 5.22% | | | | | (8.40% | ) | | | | 3.53% | |
Ratios to average net assets(b) | | | | | | | | | | | | | | | |
Expenses prior to fees waived or expenses reimbursed
(including interest expense) | | | | 1.03% | (c)(d) | | | | 0.99% | (d) | | | | 1.08% | (c) |
Net expenses after fees waived or expenses reimbursed
(including interest expense)(e) | | | | 1.03% | (c)(d) | | | | 0.99% | (d) | | | | 1.08% | (c) |
Expenses prior to fees waived or expenses reimbursed
(excluding interest expense) | | | | 1.03% | (c) | | | | 0.99% | | | | | 1.08% | (c) |
Net expenses after fees waived or expenses reimbursed
(excluding interest expense)(e) | | | | 1.03% | (c) | | | | 0.99% | | | | | 1.08% | (c) |
Net investment income (loss) | | | | 0.68% | (c) | | | | 1.31% | | | | | (0.78% | )(c) |
Supplemental data | | | | | | | | | | | | | | | |
Net assets, end of period (in thousands) | | | | $2 | | | | | $2 | | | | | $3 | |
Portfolio turnover | | | | 16% | | | | | 63% | | | | | 21% | |
Notes to Financial Highlights
| (a) | For the period from September 27, 2010 (commencement of operations) to October 31, 2010. |
| (b) | In addition to the fees and expenses which the Fund bears directly, the Fund indirectly bears a pro rata share of the fees and expenses of the acquired funds in which it invests. Such indirect expenses are not included in the reported expense ratios. |
| (d) | Includes interest expense which rounds to less than 0.01%. |
| (e) | The Investment Manager and certain of its affiliates agreed to waive/reimburse certain fees and expenses, if applicable. |
The accompanying Notes to Financial Statements are an integral part of this statement.
| | | | |
| COLUMBIA ASIA PACIFIC EX-JAPAN FUND — 2012 SEMIANNUAL REPORT | | | 25 | |
| | |
| Financial Highlights (continued) | | |
| | | | | | | | | | | | | | | |
| | | Six months
ended April 30, | | Year ended Oct. 31, |
| | | 2012 | | 2011 | | 2010(a) |
| | | (Unaudited) | | | | |
Class R | | | | | | | | | | | | | | | |
Per share data | | | | | | | | | | | | | | | |
Net asset value, beginning of period | | | | $12.46 | | | | | $13.79 | | | | | $13.32 | |
Income from investment operations: | | | | | | | | | | | | | | | |
Net investment income (loss) | | | | 0.00 | (b) | | | | 0.16 | | | | | (0.02 | ) |
Net realized and unrealized gain (loss) | | | | 0.51 | | | | | (1.41 | ) | | | | 0.49 | |
Total from investment operations | | | | 0.51 | | | | | (1.25 | ) | | | | 0.47 | |
Less distributions to shareholders from: | | | | | | | | | | | | | | | |
Net investment income | | | | (0.13 | ) | | | | (0.06 | ) | | | | — | |
Net realized gains | | | | (0.56 | ) | | | | (0.02 | ) | | | | — | |
Total distributions to shareholders | | | | (0.69 | ) | | | | (0.08 | ) | | | | — | |
Net asset value, end of period | | | | $12.28 | | | | | $12.46 | | | | | $13.79 | |
Total return | | | | 4.87% | | | | | (9.15% | ) | | | | 3.53% | |
Ratios to average net assets(c) | | | | | | | | | | | | | | | |
Expenses prior to fees waived or expenses reimbursed
(including interest expense) | | | | 1.71% | (d)(e) | | | | 1.70% | (e) | | | | 1.73% | (d) |
Net expenses after fees waived or expenses reimbursed
(including interest expense)(f) | | | | 1.71% | (d)(e) | | | | 1.68% | (e)(g) | | | | 1.73% | (d) |
Expenses prior to fees waived or expenses reimbursed
(excluding interest expense) | | | | 1.71% | (d) | | | | 1.70% | | | | | 1.73% | (d) |
Net expenses after fees waived or expenses reimbursed
(excluding interest expense)(f) | | | | 1.71% | (d) | | | | 1.68% | (g) | | | | 1.73% | (d) |
Net investment income (loss) | | | | 0.03% | (d) | | | | 1.26% | (g) | | | | (1.43% | )(d) |
Supplemental data | | | | | | | | | | | | | | | |
Net assets, end of period (in thousands) | | | | $34 | | | | | $32 | | | | | $3 | |
Portfolio turnover | | | | 16% | | | | | 63% | | | | | 21% | |
Notes to Financial Highlights
| (a) | For the period from September 27, 2010 (commencement of operations) to October 31, 2010. |
| (b) | Rounds to less than $0.01. |
| (c) | In addition to the fees and expenses which the Fund bears directly, the Fund indirectly bears a pro rata share of the fees and expenses of the acquired funds in which it invests. Such indirect expenses are not included in the reported expense ratios. |
| (e) | Includes interest expense which rounds to less than 0.01%. |
| (f) | The Investment Manager and certain of its affiliates agreed to waive/reimburse certain fees and expenses, if applicable. |
| (g) | The benefits derived from expense reductions had an impact of 0.01%. |
The accompanying Notes to Financial Statements are an integral part of this statement.
| | |
| 26 | | COLUMBIA ASIA PACIFIC EX-JAPAN FUND — 2012 SEMIANNUAL REPORT |
| | | | | | | | | | | | | | | | | | | | |
| | | Six months
ended April 30, | | Year ended Oct. 31, |
| | | 2012 | | 2011 | | 2010 | | 2009(a) |
| | | (Unaudited) | | | | | | |
Class R5 | | | | | | | | | | | | | | | | | | | | |
Per share data | | | | | | | | | | | | | | | | | | | | |
Net asset value, beginning of period | | | | $12.54 | | | | | $13.79 | | | | | $11.42 | | | | | $10.00 | |
Income from investment operations: | | | | | | | | | | | | | | | | | | | | |
Net investment income | | | | 0.04 | | | | | 0.18 | | | | | 0.13 | | | | | 0.02 | |
Net realized and unrealized gain (loss) | | | | 0.51 | | | | | (1.33 | ) | | | | 2.27 | | | | | 1.40 | |
Total from investment operations | | | | 0.55 | | | | | (1.15 | ) | | | | 2.40 | | | | | 1.42 | |
Less distributions to shareholders from: | | | | | | | | | | | | | | | | | | | | |
Net investment income | | | | (0.18 | ) | | | | (0.08 | ) | | | | (0.02 | ) | | | | — | |
Net realized gains | | | | (0.56 | ) | | | | (0.02 | ) | | | | (0.01 | ) | | | | — | |
Total distributions to shareholders | | | | (0.74 | ) | | | | (0.10 | ) | | | | (0.03 | ) | | | | — | |
Net asset value, end of period | | | | $12.35 | | | | | $12.54 | | | | | $13.79 | | | | | $11.42 | |
Total return | | | | 5.18% | | | | | (8.42% | ) | | | | 21.06% | | | | | 14.20% | |
Ratios to average net assets(b) | | | | | | | | | | | | | | | | | | | | |
Expenses prior to fees waived or expenses reimbursed (including interest expense) | | | | 1.02% | (c)(d) | | | | 0.98% | (d) | | | | 1.09% | | | | | 1.67% | (c) |
Net expenses after fees waived or expenses reimbursed (including interest expense)(e) | | | | 1.02% | (c)(d) | | | | 0.98% | (d) | | | | 1.09% | | | | | 1.15% | (c) |
Expenses prior to fees waived or expenses reimbursed (excluding interest expense) | | | | 1.02% | (c) | | | | 0.98% | | | | | 1.09% | | | | | 1.67% | (c) |
Net expenses after fees waived or expenses reimbursed (excluding interest expense)(e) | | | | 1.02% | (c) | | | | 0.98% | | | | | 1.09% | | | | | 1.15% | (c) |
Net investment income | | | | 0.69% | (c) | | | | 1.31% | | | | | 1.09% | | | | | 0.47% | (c) |
Supplemental data | | | | | | | | | | | | | | | | | | | | |
Net assets, end of period (in thousands) | | | | $412,897 | | | | | $504,370 | | | | | $512,721 | | | | | $53,643 | |
Portfolio turnover | | | | 16% | | | | | 63% | | | | | 21% | | | | | 4% | |
Notes to Financial Highlights
| (a) | For the period from July 15, 2009 (commencement of operations) to October 31, 2009. |
| (b) | In addition to the fees and expenses which the Fund bears directly, the Fund indirectly bears a pro rata share of the fees and expenses of the acquired funds in which it invests. Such indirect expenses are not included in the reported expense ratios. |
| (d) | Includes interest expense which rounds to less than 0.01%. |
| (e) | The Investment Manager and certain of its affiliates agreed to waive/reimburse certain fees and expenses, if applicable. |
The accompanying Notes to Financial Statements are an integral part of this statement.
| | | | |
| COLUMBIA ASIA PACIFIC EX-JAPAN FUND — 2012 SEMIANNUAL REPORT | | | 27 | |
| | |
| Financial Highlights (continued) | | |
| | | | | | | | | | | | | | | |
| | | Six months
ended April 30, | | Year ended Oct. 31, |
| | | 2012 | | 2011 | | 2010(a) |
| | | (Unaudited) | | | | |
Class Z | | | | | | | | | | | | | | | |
Per share data | | | | | | | | | | | | | | | |
Net asset value, beginning of period | | | | $12.51 | | | | | $13.79 | | | | | $13.32 | |
Income from investment operations: | | | | | | | | | | | | | | | |
Net investment income (loss) | | | | 0.04 | | | | | 0.19 | | | | | (0.01 | ) |
Net realized and unrealized gain (loss) | | | | 0.50 | | | | | (1.37 | ) | | | | 0.48 | |
Total from investment operations | | | | 0.54 | | | | | (1.18 | ) | | | | 0.47 | |
Less distributions to shareholders from: | | | | | | | | | | | | | | | |
Net investment income | | | | (0.16 | ) | | | | (0.08 | ) | | | | — | |
Net realized gains | | | | (0.56 | ) | | | | (0.02 | ) | | | | — | |
Total distributions to shareholders | | | | (0.72 | ) | | | | (0.10 | ) | | | | — | |
Net asset value, end of period | | | | $12.33 | | | | | $12.51 | | | | | $13.79 | |
Total return | | | | 5.08% | | | | | (8.63% | ) | | | | 3.53% | |
Ratios to average net assets(b) | | | | | | | | | | | | | | | |
Expenses prior to fees waived or expenses reimbursed
(including interest expense) | | | | 1.22% | (c)(d) | | | | 1.24% | (d) | | | | 1.23% | (c) |
Net expenses after fees waived or expenses reimbursed
(including interest expense)(e) | | | | 1.22% | (c)(d) | | | | 1.24% | (d)(f) | | | | 1.23% | (c) |
Expenses prior to fees waived or expenses reimbursed
(excluding interest expense) | | | | 1.22% | (c) | | | | 1.24% | | | | | 1.23% | (c) |
Net expenses after fees waived or expenses reimbursed
(excluding interest expense)(e) | | | | 1.22% | (c) | | | | 1.24% | (f) | | | | 1.23% | (c) |
Net investment income (loss) | | | | 0.59% | (c) | | | | 1.35% | (f) | | | | (0.93% | )(c) |
Supplemental data | | | | | | | | | | | | | | | |
Net assets, end of period (in thousands) | | | | $156 | | | | | $97 | | | | | $3 | |
Portfolio turnover | | | | 16% | | | | | 63% | | | | | 21% | |
Notes to Financial Highlights
| (a) | For the period from September 27, 2010 (commencement of operations) to October 31, 2010. |
| (b) | In addition to the fees and expenses which the Fund bears directly, the Fund indirectly bears a pro rata share of the fees and expenses of the acquired funds in which it invests. Such indirect expenses are not included in the reported expense ratios. |
| (d) | Includes interest expense which rounds to less than 0.01%. |
| (e) | The Investment Manager and certain of its affiliates agreed to waive/reimburse certain fees and expenses, if applicable. |
| (f) | The benefits derived from expense reductions had an impact of less than 0.01%. |
The accompanying Notes to Financial Statements are an integral part of this statement.
| | |
| 28 | | COLUMBIA ASIA PACIFIC EX-JAPAN FUND — 2012 SEMIANNUAL REPORT |
| | |
| Notes to Financial Statements | | |
April 30, 2012 (Unaudited)
Columbia Asia Pacific ex-Japan Fund (the Fund), a series of Columbia Funds Series Trust II (the Trust), is a diversified fund. The Trust is registered under the Investment Company Act of 1940, as amended (the 1940 Act), as an open-end management investment company organized as a Massachusetts business trust.
Fund Shares
The Trust may issue an unlimited number of shares (without par value). The Fund offers Class A, Class C, Class I, Class R, Class R5 and Class Z shares. All share classes have identical voting, dividend and liquidation rights. Each share class has its own expense structure and sales charges, as applicable.
Class A shares are subject to a maximum front-end sales charge of 5.75% based on the initial investment amount. Class A shares purchased without an initial sales charge in accounts aggregating $1 million to $50 million at the time of purchase are subject to a contingent deferred sales charge (CDSC) if the shares are sold within 18 months of purchase, charged as follows: 1.00% CDSC if redeemed within 12 months of purchase, and 0.50% CDSC if redeemed more than 12, but less than 18, months after purchase.
Class C shares are subject to a 1.00% CDSC on shares redeemed within one year of purchase.
Class I shares are not subject to sales charges and are only available to the Columbia Family of Funds.
Class R shares are not subject to sales charges and are only available to qualifying institutional investors.
Class R5 shares are not subject to sales charges; however, this share class is closed to new investors.
Class Z shares are not subject to sales charges, and are only available to certain investors, as described in the Fund’s prospectus.
| Note 2. Summary | of Significant Accounting Policies |
Use of Estimates
The preparation of financial statements in accordance with U.S. generally accepted accounting principles (GAAP) requires management to make certain estimates and assumptions that affect the reported amounts of assets and liabilities, the disclosure of contingent assets and liabilities at the date of the financial statements and the reported amounts of revenue and expenses during the reporting period. Actual results could differ from those estimates.
| | | | |
| COLUMBIA ASIA PACIFIC EX-JAPAN FUND — 2012 SEMIANNUAL REPORT | | | 29 | |
| | |
| Notes to Financial Statements (continued) | | |
The following is a summary of significant accounting policies consistently followed by the Fund in the preparation of its financial statements.
Security Valuation
All equity securities are valued at the close of business of the New York Stock Exchange (NYSE). Equity securities are valued at the last quoted sales price on the principal exchange or market on which they trade, except for securities traded on the NASDAQ Stock Market, which are valued at the NASDAQ official close price. Unlisted securities or listed securities for which there were no sales during the day are valued at the mean of the latest quoted bid and asked prices on such exchanges or markets.
Debt securities generally are valued by pricing services approved by the Board of Trustees (the Board) based upon market transactions for normal, institutional-size trading units of similar securities. The services may use various pricing techniques which take into account appropriate factors such as yield, quality, coupon rate, maturity, type of issue, trading characteristics and other data, as well as broker quotes. Debt securities for which quotations are readily available may also be valued based upon an over-the-counter or exchange bid quotation.
Foreign securities are valued based on quotations from the principal market in which such securities are normally traded. If any foreign share prices are not readily available as a result of limited share activity the securities are valued at the mean of the latest quoted bid and asked prices on such exchanges or markets. Foreign currency exchange rates are generally determined at 4:00 p.m. Eastern (U.S.) time. However, many securities markets and exchanges outside the U.S. close prior to the close of the NYSE; therefore, the closing prices for securities in such markets or on such exchanges may not fully reflect events that occur after such close but before the close of the NYSE. In those situations, foreign securities will be fair valued pursuant to the policy adopted by the Board, including utilizing a third party pricing service to determine these fair values. The third party pricing service takes into account multiple factors, including, but not limited to, movements in the U.S. securities markets, certain depositary receipts, futures contracts and foreign exchange rates that have occurred subsequent to the close of the foreign exchange, to determine a good faith estimate that reasonably reflects the current market conditions as of the close of the NYSE. The fair value of a security is likely to be different from the quoted or published price, if available.
Investments in other open-end investment companies, including money market funds, are valued at net asset value.
Short-term securities purchased within 60 days to maturity are valued at amortized cost, which approximates market value. The value of short-term
| | |
| 30 | | COLUMBIA ASIA PACIFIC EX-JAPAN FUND — 2012 SEMIANNUAL REPORT |
securities originally purchased with maturities greater than 60 days is determined based on an amortized value to par upon reaching 60 days to maturity. Short-term securities maturing in more than 60 days from the valuation date are valued at the market price or approximate market value based on current interest rates.
Investments for which market quotations are not readily available, or that have quotations which management believes are not reliable, are valued at fair value as determined in good faith under consistently applied procedures established by and under the general supervision of the Board. If a security or class of securities (such as foreign securities) is valued at fair value, such value is likely to be different from the last quoted market price for the security. The determination of fair value often requires significant judgment. To determine fair value, management may use assumptions including but not limited to future cash flows and estimated risk premiums. Multiple inputs from various sources may be used to determine value.
Foreign Currency Transactions and Translation
The values of all assets and liabilities denominated in foreign currencies are translated into U.S. dollars at that day’s exchange rates. Net realized and unrealized gains (losses) on foreign currency transactions and translations include gains (losses) arising from the fluctuation in exchange rates between trade and settlement dates on securities transactions, gains (losses) arising from the disposition of foreign currency and currency gains (losses) between the accrual and payment dates on dividends, interest income and foreign withholding taxes.
For financial statement purposes, the Fund does not distinguish that portion of gains (losses) on investments which is due to changes in foreign exchange rates from that which is due to changes in market prices of the investments. Such fluctuations are included with the net realized and unrealized gains (losses) on investments in the Statement of Operations.
Repurchase Agreements
The Fund may engage in repurchase agreement transactions with institutions that management has determined are creditworthy. The Fund, through the custodian, receives delivery of the underlying securities collateralizing a repurchase agreement. Management is responsible for determining that the collateral is at least equal, at all times, to the value of the repurchase obligation including interest. A repurchase agreement transaction involves certain risks in the event of default or insolvency of the counterparty. These risks include possible delays in or restrictions on a Fund’s ability to dispose of the underlying securities and a possible decline in the value of the underlying securities during the period while the Fund seeks to assert its rights.
| | | | |
| COLUMBIA ASIA PACIFIC EX-JAPAN FUND — 2012 SEMIANNUAL REPORT | | | 31 | |
| | |
| Notes to Financial Statements (continued) | | |
Security Transactions
Security transactions are accounted for on the trade date. Cost is determined and gains (losses) are based upon the specific identification method for both financial statement and federal income tax purposes.
Income Recognition
Corporate actions and dividend income are recorded net of any non-reclaimable tax withholdings, on the ex-dividend date or upon receipt of ex-dividend notification in the case of certain foreign securities.
Interest income is recorded on the accrual basis.
Awards from class action litigation are recorded as a reduction of cost basis if the Fund still owns the applicable securities on the payment date. If the Fund no longer owns the applicable securities, the proceeds are recorded as realized gains.
Expenses
General expenses of the Trust are allocated to the Fund and other funds of the Trust based upon relative net assets or other expense allocation methodologies determined by the nature of the expense. Expenses directly attributable to the Fund are charged to the Fund. Expenses directly attributable to a specific class of shares are charged to that share class.
Determination of Class Net Asset Value
All income, expenses (other than class-specific expenses, which are charged to that share class, as shown in the Statement of Operations) and realized and unrealized gains (losses) are allocated to each class of the Fund on a daily basis, based on the relative net assets of each class, for purposes of determining the net asset value of each class.
Federal Income Tax Status
The Fund intends to qualify each year as a regulated investment company under Subchapter M of the Internal Revenue Code, as amended, and will distribute substantially all of its taxable income (including net short-term capital gains), if any, for its tax year, and as such will not be subject to federal income taxes. In addition, the Fund intends to distribute in each calendar year substantially all of its net investment income, capital gains and certain other amounts, if any, such that the Fund should not be subject to federal excise tax. Therefore, no federal income or excise tax provision is recorded.
Foreign Taxes
The Fund may be subject to foreign taxes on income, gains on investments or currency repatriation, a portion of which may be recoverable. The Fund will accrue such taxes and recoveries, as applicable, based upon its current interpretation of tax rules and regulations that exist in the markets in which it invests.
| | |
| 32 | | COLUMBIA ASIA PACIFIC EX-JAPAN FUND — 2012 SEMIANNUAL REPORT |
Realized gains in certain countries may be subject to foreign taxes at the Fund level, based on statutory rates. The Fund accrues for such foreign taxes on net realized and unrealized gains at the appropriate rate for each jurisdiction, as applicable.
Distributions to Shareholders
Distributions from net investment income are declared and paid annually. Net realized capital gains, if any, are distributed along with the income dividend. Income distributions and capital gain distributions are determined in accordance with federal income tax regulations which may differ from GAAP.
Guarantees and Indemnifications
Under the Trust’s organizational documents and, in some cases, by contract, its officers and trustees are indemnified against certain liabilities arising out of the performance of their duties to the Trust or its funds. In addition, certain of the Fund’s contracts with its service providers contain general indemnification clauses. The Fund’s maximum exposure under these arrangements is unknown since the amount of any future claims that may be made against the Fund cannot be determined, and the Fund has no historical basis for predicting the likelihood of any such claims.
Recent Accounting Pronouncement
Fair Value Measurements and Disclosures
In May 2011, the Financial Accounting Standards Board (FASB) issued ASU No. 2011-04 modifying Topic 820, Fair Value Measurements and Disclosures. At the same time, the International Accounting Standards Board (IASB) issued International Financial Reporting Standard 13, Fair Value Measurement. The objective of the FASB and IASB is convergence of their guidance on fair value measurements and disclosures.
Specifically, ASU No. 2011-04 requires reporting entities to disclose i) the amounts of any transfers between Level 1 and Level 2, and the reasons for the transfers and ii) for Level 3 fair value measurements, a) quantitative information about significant unobservable inputs used, b) a description of the valuation processes used by the reporting entity and c) a narrative description of the sensitivity of the fair value measurement to changes in unobservable inputs if a change in those inputs might result in a significantly higher or lower fair value measurement. The effective date of ASU No. 2011-04 is for interim and annual periods beginning after December 15, 2011. At this time, management is evaluating the implications of this guidance and the impact it will have on the financial statement amounts and footnote disclosures, if any.
| | | | |
| COLUMBIA ASIA PACIFIC EX-JAPAN FUND — 2012 SEMIANNUAL REPORT | | | 33 | |
| | |
| Notes to Financial Statements (continued) | | |
| Note 3. Fees | and Compensation Paid to Affiliates |
Investment Management Fees
Under an Investment Management Services Agreement, Columbia Management Investment Advisers, LLC (the Investment Manager), a wholly-owned subsidiary of Ameriprise Financial, Inc. (Ameriprise Financial), is responsible for the ultimate oversight of investments made by the Fund. The Fund’s subadviser (see Subadvisory Agreement below) has the primary responsibility for the day-to-day portfolio management of the Fund. The management fee is an annual fee that is equal to a percentage of the Fund’s average daily net assets that declines from 0.80% to 0.57% as the Fund’s net assets increase. The annualized effective management fee rate for the six months ended April 30, 2012 was 0.79% of the Fund’s average daily net assets.
Subadvisory Agreement
The Investment Manager has entered into a Subadvisory Agreement with Threadneedle International Limited (Threadneedle), an affiliate of the Investment Manager and wholly-owned subsidiary of Ameriprise Financial, the subadviser of the Fund. The Investment Manager compensates Threadneedle to manage the investments of the Fund’s assets.
Administration Fees
Under an Administrative Services Agreement, the Investment Manager serves as the Fund Administrator. The Fund pays the Fund Administrator an annual fee for administration and accounting services equal to a percentage of the Fund’s average daily net assets that declines from 0.08% to 0.05% as the Fund’s net assets increase. The annualized effective administration fee rate for the six months ended April 30, 2012 was 0.08% of the Fund’s average daily net assets.
Other Expenses
Other expenses are for, among other things, certain expenses of the Fund or the Board, including: Fund boardroom and office expense, employee compensation, employee health and retirement benefits, and certain other expenses. Payment of these Fund and Board expenses is facilitated by a company providing limited administrative services to the Fund and the Board. For the six months ended April 30, 2012, other expenses paid to this company were $1,514.
Compensation of Board Members
Board members are compensated for their services to the Fund as disclosed in the Statement of Operations. Under a Deferred Compensation Plan (the Plan), the Board members who are not “interested persons” of the Fund, as defined under the 1940 Act, may elect to defer payment of up to 100% of their compensation. Deferred amounts are treated as though equivalent dollar amounts had been invested in shares of certain funds managed by the Investment Manager. The
| | |
| 34 | | COLUMBIA ASIA PACIFIC EX-JAPAN FUND — 2012 SEMIANNUAL REPORT |
Fund’s liability for these amounts is adjusted for market value changes and remains in the Fund until distributed in accordance with the Plan.
Transfer Agent Fees
Under a Transfer and Dividend Disbursing Agent Agreement, Columbia Management Investment Services Corp. (the Transfer Agent), an affiliate of the Investment Manager and a wholly-owned subsidiary of Ameriprise Financial, is responsible for providing transfer agency services to the Fund. The Transfer Agent has contracted with Boston Financial Data Services (BFDS) to serve as sub-transfer agent.
The Transfer Agent receives monthly account-based service fees based on the number of open accounts and is reimbursed by the Fund for the fees and expenses the Transfer Agent pays to financial intermediaries that maintain omnibus accounts with the Fund that is a percentage of the average aggregate value of the Fund’s shares maintained in each such omnibus account (other than omnibus accounts for which American Enterprise Investment Services Inc. is the broker of record or accounts where the beneficial shareholder is a customer of Ameriprise Financial Services, Inc., which are paid a per account fee). The Transfer Agent pays the fees of BFDS for services as sub-transfer agent and is not entitled to reimbursement for such fees from the Fund (with the exception of out-of-pocket fees).
The Transfer Agent also receives compensation from fees for various shareholder services and reimbursements for certain out-of-pocket expenses. Class I shares do not pay transfer agent fees. Total transfer agent fees for Class R5 shares are subject to an annual limitation of not more than 0.05% of the average daily net assets attributable to the share class.
For the six months ended April 30, 2012, the Fund’s annualized effective transfer agent fee rates as a percentage of average daily net assets of each class were as follows:
| | | | |
Class A | | | 0.21 | % |
Class C | | | 0.21 | |
Class R | | | 0.21 | |
Class R5 | | | 0.02 | |
Class Z | | | 0.21 | |
An annual minimum account balance fee of $20 may apply to certain accounts with a value below the Fund’s initial minimum investment requirements to reduce the impact of small accounts on transfer agent fees. These minimum account balance fees are recorded as part of expense reductions in the Statement of Operations. For the six months ended April 30, 2012, no minimum account balance fees were charged by the Fund.
| | | | |
| COLUMBIA ASIA PACIFIC EX-JAPAN FUND — 2012 SEMIANNUAL REPORT | | | 35 | |
| | |
| Notes to Financial Statements (continued) | | |
Distribution Fees
The Fund has an agreement with Columbia Management Investment Distributors, Inc. (the Distributor), an affiliate of the Investment Manager and a wholly-owned subsidiary of Ameriprise Financial, for distribution and shareholder services. Under a Plan and Agreement of Distribution pursuant to Rule 12b-1, the Fund pays a fee at an annual rate of up to 0.25% of the Fund’s average daily net assets attributable to Class A shares, a fee at an annual rate of up to 0.50% of the Fund’s average daily net assets attributable to Class R shares (of which up to 0.25% may be used for shareholder services) and a fee at an annual rate of up to 1.00% of the Fund’s average daily net assets attributable to Class C shares. For Class C shares, of the 1.00% fee, up to 0.75% is reimbursed for distribution expenses.
The amount of distribution expenses incurred by the Distributor and not yet reimbursed (unreimbursed expense) was approximately $1,000 Class C shares. These amounts are based on the most recent information available as of March 31, 2012, and may be recovered from future payments under the distribution plan or CDSCs. To the extent the unreimbursed expense has been fully recovered, the distribution fee is reduced.
Sales Charges
Sales charges, including front-end charges and CDSCs, received by the Distributor for distributing Fund shares were $141 for Class A and $2 for Class C shares for the six months ended April 30, 2012.
Expenses Waived/Reimbursed by the Investment Manager and its Affiliates
Effective January 1, 2012, the Investment Manager and certain of its affiliates have contractually agreed to waive fees and/or reimburse expenses (excluding certain fees and expenses described below), through February 28, 2013, unless sooner terminated at the sole discretion of the Board, so that the Fund’s net operating expenses, after giving effect to fees waived/expenses reimbursed and any balance credits and/or overdraft charges from the Fund’s custodian, do not exceed the following annual rates as a percentage of the class’ average daily net assets:
| | | | |
Class A | | | 1.50 | % |
Class C | | | 2.25 | |
Class I | | | 1.08 | |
Class R | | | 1.75 | |
Class R5 | | | 1.13 | |
Class Z | | | 1.25 | |
Prior to January 1, 2012, the Investment Manager and its affiliates contractually agreed to waive fees and/or reimburse expenses (excluding certain fees and expenses described below), so that the Fund’s net operating expenses, after
| | |
| 36 | | COLUMBIA ASIA PACIFIC EX-JAPAN FUND — 2012 SEMIANNUAL REPORT |
giving effect to fees waived/expenses reimbursed and any balance credits and/or overdraft charges from the Fund’s custodian, did not exceed the following annual rates as a percentage of the class’ average daily net assets:
| | | | |
Class A | | | 1.50 | % |
Class C | | | 2.25 | |
Class I | | | 1.10 | |
Class R | | | 1.75 | |
Class R5 | | | 1.15 | |
Class Z | | | 1.25 | |
Under the agreement, the following fees and expenses are excluded from the waiver/reimbursement commitment, and therefore will be paid by the Fund, if applicable: taxes (including foreign transaction taxes), expenses associated with investments in affiliated and non-affiliated pooled investment vehicles (including mutual funds and exchange traded funds), transaction costs and brokerage commissions, costs related to any securities lending program, dividend expenses associated with securities sold short, inverse floater program fees and expenses, transaction charges and interest on borrowed money, interest, extraordinary expenses and any other expenses the exclusion of which is specifically approved by the Board. This agreement may be modified or amended only with approval from all parties.
| Note 4. Federal | Tax Information |
The timing and character of income and capital gain distributions are determined in accordance with income tax regulations, which may differ from GAAP because of temporary or permanent book to tax differences.
At April 30, 2012, the cost of investments for federal income tax purposes was approximately $392,638,000 and the aggregate gross approximate unrealized appreciation and depreciation based on that cost was:
| | | | |
Unrealized appreciation | | $ | 52,548,000 | |
Unrealized depreciation | | $ | (21,211,000 | ) |
Net unrealized appreciation | | $ | 31,337,000 | |
Management of the Fund has concluded that there are no significant uncertain tax positions that would require recognition in the financial statements. However, management’s conclusion may be subject to review and adjustment at a later date based on factors including, but not limited to, new tax laws, regulations, and administrative interpretations (including relevant court decisions). Generally, the Fund’s federal tax returns for the prior three fiscal years remain subject to examination by the Internal Revenue Service.
| | | | |
| COLUMBIA ASIA PACIFIC EX-JAPAN FUND — 2012 SEMIANNUAL REPORT | | | 37 | |
| | |
| Notes to Financial Statements (continued) | | |
| Note 5. Portfolio | Information |
The cost of purchases and proceeds from sales of securities, excluding short-term obligations, aggregated to $66,735,155 and $169,425,138, respectively, for the six months ended April 30, 2012.
| Note 6. Lending | of Portfolio Securities |
The Fund has entered into a Master Securities Lending Agreement (the Agreement) with JPMorgan Chase Bank, N.A. (JPMorgan). The Agreement authorizes JPMorgan as lending agent to lend securities to authorized borrowers in order to generate additional income on behalf of the Fund. Pursuant to the Agreement, the securities loaned are secured by cash or U.S. government securities equal to at least 100% of the market value of the loaned securities. Any additional collateral required to maintain those levels due to market fluctuations of the loaned securities is requested to be delivered the following business day. Cash collateral received is invested by the lending agent on behalf of the Fund into authorized investments pursuant to the Agreement. The investments made with the cash collateral are listed in the Portfolio of Investments. The values of such investments and any uninvested cash collateral are disclosed in the Statement of Assets and Liabilities along with the related obligation to return the collateral upon the return of the securities loaned.
Risks of delay in recovery of securities or even loss of rights in the securities may occur should the borrower of the securities fail financially. Risks may also arise to the extent that the value of the securities loaned increases above the value of the collateral received. JPMorgan will indemnify the Fund from losses resulting from a borrower’s failure to return a loaned security when due. Such indemnification does not extend to losses associated with declines in the value of cash collateral investments. The Investment Manager is not responsible for any losses incurred by the Fund in connection with the securities lending program. Loans are subject to termination by the Fund or the borrower at any time, and are, therefore, not considered to be illiquid investments.
Pursuant to the Agreement, the Fund receives income for lending its securities either in the form of fees or by earning interest on invested cash collateral, net of negotiated rebates paid to borrowers and fees paid to the lending agent for services provided and any other securities lending expenses. Net income earned from securities lending for the six months ended April 30, 2012 is disclosed in the Statement of Operations. The Fund continues to earn and accrue interest and dividends on the securities loaned.
At April 30, 2012, securities valued at $9,814,328 were on loan, secured by cash collateral of $10,414,446 (which does not reflect calls for collateral made to
| | |
| 38 | | COLUMBIA ASIA PACIFIC EX-JAPAN FUND — 2012 SEMIANNUAL REPORT |
borrowers by JPMorgan at period end) that is partially or fully invested in short-term securities or other cash equivalents.
| Note 7. Affiliated | Money Market Fund |
The Fund may invest its daily cash balances in Columbia Short-Term Cash Fund, an affiliated money market fund established for the exclusive use by the Fund and other affiliated funds. The income earned by the Fund from such investments is included as “Dividends from affiliates” in the Statement of Operations. As an investing fund, the Fund indirectly bears its proportionate share of the expenses of Columbia Short-Term Cash Fund.
Note 8. Shareholder Concentration
At April 30, 2012, one unaffiliated shareholder account owned 21.1% of the outstanding shares of the Fund. The Fund has no knowledge about whether any portion of those shares was owned beneficially by such account. Subscription and redemption activity by concentrated accounts may have a significant effect on the operations of the Fund.
Note 9. Line of Credit
The Fund has entered into a revolving credit facility with a syndicate of banks led by JPMorgan, whereby the Fund may borrow for the temporary funding of shareholder redemptions or for other temporary or emergency purposes. The credit facility agreement, as amended, which is a collective agreement between the Fund and certain other funds managed by the Investment Manager, severally and not jointly, permits collective borrowings up to $500 million. Pursuant to a December 13, 2011 amendment to the credit facility agreement, interest is charged to each participating fund based on its borrowings at a rate equal to the higher of (i) the overnight federal funds rate plus 1.00% or (i) the one-month LIBOR rate plus 1.00%. Each borrowing under the credit facility matures no later than 60 days after the date of borrowing. The Fund also pays a commitment fee equal to its pro rata share of the amount of the credit facility at a rate of 0.08% per annum.
Prior to December 13, 2011, interest was charged to each participating fund based on its borrowings at a rate equal to the sum of the federal funds rate plus (i) 1.25% per annum plus (ii) if one-month LIBOR exceeds the federal funds rate, the amount of such excess. The Fund also paid a commitment fee equal to its pro rata share of the amount of the credit facility at a rate of 0.10% per annum.
For the six months ended April 30, 2012, the average daily loan balance outstanding on days when borrowing existed was $10,994,737 at a weighted average interest rate of 1.35%.
| | | | |
| COLUMBIA ASIA PACIFIC EX-JAPAN FUND — 2012 SEMIANNUAL REPORT | | | 39 | |
| | |
| Notes to Financial Statements (continued) | | |
Note 10. Significant Risks
Foreign Securities Risk
Investing in foreign securities may include certain risks and considerations not typically associated with investing in U.S. securities, such as fluctuating currency values and changing local and regional economic, political and social conditions, which may result in greater market volatility. In addition, certain foreign securities may not be as liquid as U.S. securities. Investing in emerging markets may accentuate these risks.
Investments in emerging market countries are subject to additional risk. The risk of foreign investments is typically increased in less developed countries. These countries are also more likely to experience high levels of inflation, deflation or currency devaluation which could hurt their economies and securities markets.
Asian Pacific Region Risk
Many of the countries in the Asian Pacific Region are developing both politically and economically, and may have relatively unstable governments and economies based on a limited number of commodities or industries. Securities markets in the Asian Pacific Region are smaller and have a lower trading volume than those in the United States, which may result in the securities of some companies in the Asian Pacific Region being less liquid than similar U.S. or other foreign securities. Some currencies in the Asian Pacific Region are more volatile than the U.S. dollar and some countries in the Asian Pacific Region have restricted the flow of money in and out of the country.
Geographic Concentration Risk
Because the Fund concentrates its investments in the Asian Pacific Region, the Fund may be particularly susceptible to economic, political, regulatory or other events or conditions affecting issuers and countries within the Asian Pacific Region. Currency devaluations could occur in countries that have not yet experienced currency devaluation to date, or could continue to occur in countries that have already experienced such devaluations. As a result, the Fund may be more volatile than a more geographically diversified fund. If securities of companies in the Asian Pacific Region fall out of favor, it may cause the Fund to underperform funds that do not concentrate in a single region of the world.
| Note 11. Subsequent | Events |
Management has evaluated the events and transactions that have occurred through the date the financial statements were issued and noted no items requiring adjustment of the financial statements or additional disclosure.
| | |
| 40 | | COLUMBIA ASIA PACIFIC EX-JAPAN FUND — 2012 SEMIANNUAL REPORT |
| Note 12. Information | Regarding Pending and Settled Legal Proceedings |
In December 2005, without admitting or denying the allegations, American Express Financial Corporation (AEFC, which is now known as Ameriprise Financial, Inc. (Ameriprise Financial)) entered into settlement agreements with the Securities and Exchange Commission (SEC) and Minnesota Department of Commerce (MDOC) related to market timing activities. As a result, AEFC was censured and ordered to cease and desist from committing or causing any violations of certain provisions of the Investment Advisers Act of 1940, the Investment Company Act of 1940, and various Minnesota laws. AEFC agreed to pay disgorgement of $10 million and civil money penalties of $7 million. AEFC also agreed to retain an independent distribution consultant to assist in developing a plan for distribution of all disgorgement and civil penalties ordered by the SEC in accordance with various undertakings detailed at www.sec.gov/litigation/admin/ia-2451.pdf. Ameriprise Financial and its affiliates have cooperated with the SEC and the MDOC in these legal proceedings, and have made regular reports to the funds’ Boards of Trustees.
Ameriprise Financial and certain of its affiliates have historically been involved in a number of legal, arbitration and regulatory proceedings, including routine litigation, class actions, and governmental actions, concerning matters arising in connection with the conduct of their business activities. Ameriprise Financial believes that the Funds are not currently the subject of, and that neither Ameriprise Financial nor any of its affiliates are the subject of, any pending legal, arbitration or regulatory proceedings that are likely to have a material adverse effect on the Funds or the ability of Ameriprise Financial or its affiliates to perform under their contracts with the Funds. Ameriprise Financial is required to make 10-Q, 10-K and, as necessary, 8-K filings with the Securities and Exchange Commission on legal and regulatory matters that relate to Ameriprise Financial and its affiliates. Copies of these filings may be obtained by accessing the SEC website at www.sec.gov.
There can be no assurance that these matters, or the adverse publicity associated with them, will not result in increased fund redemptions, reduced sale of fund shares or other adverse consequences to the Funds. Further, although we believe proceedings are not likely to have a material adverse effect on the Funds or the ability of Ameriprise Financial or its affiliates to perform under their contracts with the Funds, these proceedings are subject to uncertainties and, as such, we are unable to estimate the possible loss or range of loss that may result. An adverse outcome in one or more of these proceedings could result in adverse judgments, settlements, fines, penalties or other relief that could have a material adverse effect on the consolidated financial condition or results of operations of Ameriprise Financial.
| | | | |
| COLUMBIA ASIA PACIFIC EX-JAPAN FUND — 2012 SEMIANNUAL REPORT | | | 41 | |
The policy of the Board is to vote the proxies of the companies in which the Fund holds investments consistent with the procedures as stated in the Statement of Additional Information (SAI). You may obtain a copy of the SAI without charge by calling 800.345.6611; contacting your financial intermediary; visiting columbiamanagement.com; or searching the website of the Securities and Exchange Commission (SEC) at www.sec.gov. Information regarding how the Fund voted proxies relating to portfolio securities is filed with the SEC by August 31 for the most recent 12-month period ending June 30 of that year, and is available without charge by visiting columbiamanagement.com; or searching the website of the SEC at www.sec.gov.
| | |
| Approval of Investment Management Services |
| |
| and Subadvisory Agreements | | |
Columbia Management Investment Advisers, LLC (“Columbia Management” or the “investment manager”), a wholly-owned subsidiary of Ameriprise Financial, Inc. (“Ameriprise Financial”), serves as the investment manager to Columbia Asia Pacific ex-Japan Fund (the “Fund”). Under an investment management services agreement (the “IMS Agreement”), Columbia Management provides investment advice and other services to the Fund and all funds distributed by Columbia Management Investment Distributors, Inc. (collectively, the “Funds”). In addition, under a Subadvisory Agreement (the “Subadvisory Agreement”) between Columbia Management and Threadneedle International Limited (the “Subadviser”) an affiliate of Columbia Management, the Subadviser has provided portfolio management and related services for the Fund.
On an annual basis, the Fund’s Board of Trustees (the “Board”), including the independent Board members (the “Independent Trustees”), considers renewal of the IMS Agreement and the Subadvisory Agreement (together, the “Advisory Agreements”). Columbia Management prepared detailed reports for the Board and its Contracts Committee in March and April 2012, including reports based on analyses of data provided by an independent organization and a comprehensive response to each item of information requested by independent legal counsel to the Independent Trustees (“Independent Legal Counsel”) in a letter to the investment manager, to assist the Board in making this determination. All of the materials presented in March and April were first supplied in draft form to designated representatives of the Independent Trustees, i.e., Independent Legal Counsel, the Chair of the Board and the Chair of the Contracts Committee (including materials relating to the Fund’s expense cap), and the final materials were revised to reflect comments provided by these Board representatives. In addition, throughout the year, the Board (or its committees) regularly meets with portfolio management teams and senior management
| | |
| 42 | | COLUMBIA ASIA PACIFIC EX-JAPAN FUND — 2012 SEMIANNUAL REPORT |
personnel and reviews information prepared by Columbia Management addressing the services Columbia Management provides and Fund performance. The Board accords particular weight to the work, deliberations and conclusions of the Contracts Committee, the Investment Review Committee and the Compliance Committee in determining whether to continue the Advisory Agreements.
The Board, at its April 10-12, 2012 in-person Board meeting (the “April Meeting”), considered the renewal of the Advisory Agreements for an additional one-year term. At the April Meeting, Independent Legal Counsel reviewed with the Independent Trustees various factors relevant to the Board’s consideration of advisory and subadvisory agreements and the Board’s legal responsibilities related to such consideration. Following an analysis and discussion of the factors identified below, the Board, including all of the Independent Trustees, approved the renewal of each of the Advisory Agreements.
Nature, Extent and Quality of Services Provided by Columbia Management and the Subadviser: The Board considered its analysis of various reports and presentations received by it or one of its committees detailing the services performed by Columbia Management and the Subadviser, as well as their history, reputation, expertise, resources and relative capabilities, and the qualifications of their personnel.
With respect to Columbia Management, the Board specifically considered many developments during the past year concerning the services provided by Columbia Management, including, in particular, the continued investment in, and resources dedicated to, the Funds’ operations and the successful completion of various integration initiatives and the consolidation of dozens of Funds. The Board noted the information it received concerning Columbia Management’s ability to retain key portfolio management personnel. In that connection, the Board took into account its meetings with Columbia Management’s Chief Investment Officer (the “CIO”) and considered the CIO’s successful execution of additional risk and portfolio management oversight applied to the Funds. The Board also assessed Columbia Management’s significant investment in upgrading technology (such as an equity trading system) and considered management’s commitments to enhance existing resources in this area.
In connection with the Board’s evaluation of the overall package of services provided by Columbia Management, the Board also considered the quality of administrative services provided to the Fund by Columbia Management. The Board also reviewed the financial condition of Columbia Management and its affiliates and their ability to carry out their responsibilities under the IMS
| | | | |
| COLUMBIA ASIA PACIFIC EX-JAPAN FUND — 2012 SEMIANNUAL REPORT | | | 43 | |
| | |
| Approval of Investment Management Services |
| |
| and Subadvisory Agreements (continued) | | |
Agreement and the Fund’s other service agreements with affiliates of Ameriprise Financial. In addition, the Board discussed the acceptability of the terms of the IMS Agreement (including the relatively broad scope of services required to be performed by Columbia Management). The Board concluded that the services being performed under the IMS Agreement were of a reasonably high quality.
Based on the foregoing, and based on other information received (both oral and written, including the information on investment performance referenced below) and other considerations, the Board concluded that Columbia Management and its affiliates were in a position to continue to provide a high quality and level of services to the Fund.
With respect to the Subadviser, the Board observed that it had previously approved the Subadviser’s code of ethics and compliance program, that the Chief Compliance Officer of the Fund continues to monitor the code and the program, and that no material issues have been reported. The Board also considered the Subadviser’s investment strategy/style, including particularly as it relates to the Fund, as well as the experience of the personnel that manage the Fund. The Board also considered the financial condition of the Subadviser and its capability and wherewithal to carry out its responsibilities under the Subadvisory Agreement. In addition, the Board discussed the acceptability of the terms of the Subadvisory Agreement including the scope of services required to be performed. The Board noted that the terms of the Subadvisory Agreement are generally consistent with the terms of other subadviser agreements for subadvisers who manage other funds managed by the investment manager. It was observed that no changes were recommended to the Subadvisory Agreement. Based on the foregoing, and based on other information received (both oral and written) and other considerations, including, in particular, the performance of the Fund (discussed below) as well as the investment manager’s recommendation that the Board approve renewal of the Subadvisory Agreement with the Subadviser the Board concluded that the services being performed under the Subadvisory Agreement were of a reasonably high quality.
Based on the foregoing, and based on other information received (both oral and written, including the information on investment performance referenced below) and other considerations, the Board concluded that the Subadviser was in a position to continue to provide a high quality and level of services to the Fund.
Investment Performance: For purposes of evaluating the nature, extent and quality of services provided under the Advisory Agreements, the Board carefully reviewed the investment performance of the Fund. In this regard, the Board considered detailed reports providing the results of analyses performed by an independent
| | |
| 44 | | COLUMBIA ASIA PACIFIC EX-JAPAN FUND — 2012 SEMIANNUAL REPORT |
organization showing, for various periods, the performance of the Fund, the performance of a benchmark index, the percentage ranking of the Fund among its comparison group and the net assets of the Fund. The Board observed that the Fund’s investment performance met expectations.
Additionally, the Board reviewed the performance of the Subadviser and Columbia Management’s process for monitoring the Subadviser. The Board considered, in particular, management’s rationale for recommending the continued retention of the Subadviser.
Comparative Fees, Costs of Services Provided and the Profits Realized By Columbia Management, its Affiliates and the Subadviser from their Relationships with the Fund: The Board reviewed comparative fees and the costs of services provided under each of the Advisory Agreements. The Board members considered detailed comparative information set forth in an annual report on fees and expenses, including, among other things, data (based on analyses conducted by an independent organization) showing a comparison of the Fund’s expenses with median expenses paid by funds in its comparative peer universe, as well as data showing the Fund’s contribution to Columbia Management’s profitability. The Board reviewed the fees charged to comparable institutional or other accounts/vehicles managed by Columbia Management and discussed differences in how the products are managed and operated, noting no unreasonable differences in the levels of contractual fees.
The Board accorded particular weight to the notion that the level of fees should reflect a rational pricing model applied consistently across the various product lines in the Fund family, while assuring that the overall fees for each Fund (with few defined exceptions) are generally in line with the “pricing philosophy” (i.e., that the total expense ratio of the Fund is at, or below, the median expense ratio of funds in the same comparison universe of the Fund). The Board took into account that the Fund’s total expense ratio (after considering proposed expense caps/waivers) was slightly below the peer universe’s median expense ratio shown in the reports. Additionally, the Board reviewed the level of subadvisory fees paid to the Subadviser, noting that the fees are paid by the investment manager and do not impact the fees paid by the Fund. The Board observed that the subadvisory fee level for the Subadviser was generally comparable to those charged by other subadvisers to similar funds managed by the investment manager. The Board also reviewed fee rates charged by the Subadviser to other client accounts. Based on its review, the Board concluded that the Fund’s management and subadvisory fees were fair and reasonable in light of the extent and quality of services that the Fund receives.
| | | | |
| COLUMBIA ASIA PACIFIC EX-JAPAN FUND — 2012 SEMIANNUAL REPORT | | | 45 | |
| | |
| Approval of Investment Management Services |
| |
| and Subadvisory Agreements (continued) | | |
The Board also considered the expected profitability of Columbia Management and its affiliates in connection with Columbia Management providing investment management services to the Fund. In this regard, the Board referred to a detailed profitability report, discussing the profitability to Columbia Management and Ameriprise Financial from managing, operating and distributing the Funds. In this regard, the Board observed that 2011 profitability, while slightly lower than 2010, was generally in line with the reported profitability of other asset management firms. The Board also considered the indirect economic benefits flowing to Columbia Management or its affiliates in connection with managing or distributing the Funds, such as the enhanced ability to offer various other financial products to Ameriprise Financial customers, soft dollar benefits and overall reputational advantages. The Board noted that the fees paid by the Fund should permit the investment manager to offer competitive compensation to its personnel, make necessary investments in its business and earn an appropriate profit. The Board concluded that profitability levels were reasonable.
Economies of Scale to be Realized: The Board also considered the economies of scale that might be realized by Columbia Management as the Fund grows and took note of the extent to which Fund shareholders might also benefit from such growth.
Based on the foregoing, the Board, including all of the Independent Trustees, concluded that fees payable under the Advisory Agreements were fair and reasonable in light of the extent and quality of services provided. In reaching this conclusion, no single factor was determinative. At the April Meeting, the Board, including all of the Independent Trustees, approved the renewal of the Advisory Agreements.
| | |
| 46 | | COLUMBIA ASIA PACIFIC EX-JAPAN FUND — 2012 SEMIANNUAL REPORT |
Columbia Asia Pacific ex-Japan Fund
P.O. Box 8081
Boston, MA 02266-8081
columbiamanagement.com
| | | | |
 | | This report must be accompanied or preceded by the Fund’s current prospectus. The
Fund is distributed by Columbia Management Investment Distributors, Inc., member
FINRA, and managed by Columbia Management Investment Advisers, LLC. ©2012 Columbia Management Investment Advisers, LLC. All rights reserved. | | S-6533 D (6/12) |
Semiannual Report

Columbia
Emerging Markets Bond Fund
Semiannual Report for the Period Ended April 30, 2012
Columbia Emerging Markets Bond Fund seeks to provide shareholders with high total return through current income and, secondarily, through capital appreciation.
Not FDIC insured ¡ No bank guarantee ¡ May lose value
| | | | |
| |
Your Fund at a Glance | | | 2 | |
| |
Fund Expense Example | | | 6 | |
| |
Portfolio of Investments | | | 8 | |
| |
Statement of Assets and Liabilities | | | 19 | |
| |
Statement of Operations | | | 21 | |
| |
Statement of Changes in Net Assets | | | 23 | |
| |
Financial Highlights | | | 25 | |
| |
Notes to Financial Statements | | | 33 | |
| |
Proxy Voting | | | 51 | |
| |
Approval of Investment Management Services Agreement | | | 51 | |
See the Fund’s prospectus for risks associated with investing in the Fund.
| | | | |
| COLUMBIA EMERGING MARKETS BOND FUND — 2012 SEMIANNUAL REPORT | | | 1 | |
FUND SUMMARY
| > | | Columbia Emerging Markets Bond Fund (the Fund) Class A shares returned 7.52% (excluding sales charge) for the six months ended April 30, 2012. |
| > | | The Fund outperformed its benchmark, the J.P. Morgan Emerging Markets Bond Index-Global (J.P. Morgan EMBI-Global), which rose 7.33% for the same timeframe. |
ANNUALIZED TOTAL RETURNS (for period ended April 30, 2012)
| | | | | | | | | | | | | | | | |
| | | 6 months* | | | 1 year | | | 5 years | | | Since
inception
2/16/06 | |
Columbia Emerging Markets Bond Fund
Class A (excluding sales charge) | | | +7.52% | | | | +9.60% | | | | +8.83% | | | | +9.19% | |
J.P. Morgan EMBI-Global(1) (unmanaged) | | | +7.33% | | | | +13.00% | | | | +8.79% | | | | +8.83% | |
The performance information shown represents past performance and is not a guarantee of future results. The investment return and principal value of your investment will fluctuate so that your shares, when redeemed, may be worth more or less than their original cost. Current performance may be lower or higher than the performance information shown. You may obtain performance information current to the most recent month-end by contacting your financial intermediary, visiting columbiamanagement.com or calling 800.345.6611.
The 4.75% sales charge applicable to Class A shares of the Fund is not reflected in the table above. If reflected, returns would be lower than those shown. The performance of other classes may vary from that shown because of differences in fees and expenses. The Fund’s returns reflect the effect of fee waivers/expense reimbursements, if any. Without such waivers/reimbursements, the Fund’s returns would be lower. See the Average Annual Total Returns table for performance of other share classes of the Fund.
The index does not reflect the effects of sales charges, expenses and taxes. It is not possible to invest directly in an index.
| (1) | | The J.P. Morgan EMBI-Global, an unmanaged index, is based on U.S. dollar-denominated debt instruments issued by emerging market sovereign and quasi-sovereign entities, such as Brady bonds, Eurobonds and loans. The index reflects reinvestment of all distributions and changes in market prices. |
| | |
| 2 | | COLUMBIA EMERGING MARKETS BOND FUND — 2012 SEMIANNUAL REPORT |
AVERAGE ANNUAL TOTAL RETURNS
| | | | | | | | | | | | | | | | |
| at April 30, 2012 | | | | | | | | | | | | |
| Without sales charge | | 6 months* | | | 1 year | | | 5 years | | | Since
inception | |
Class A (inception 2/16/06) | | | +7.52% | | | | +9.60% | | | | +8.83% | | | | +9.19% | |
Class B (inception 2/16/06) | | | +7.18% | | | | +8.72% | | | | +8.00% | | | | +8.36% | |
Class C (inception 2/16/06) | | | +7.09% | | | | +8.87% | | | | +8.05% | | | | +8.38% | |
Class I (inception 2/16/06) | | | +7.75% | | | | +10.18% | | | | +9.33% | | | | +9.65% | |
Class R** (inception 11/16/11) | | | +7.51% | | | | +9.51% | | | | +8.68% | | | | +9.04% | |
Class R4 (inception 2/16/06) | | | +7.78% | | | | +9.85% | | | | +9.08% | | | | +9.41% | |
Class W** (inception 12/1/06) | | | +7.60% | | | | +9.59% | | | | +8.82% | | | | +9.16% | |
Class Z** (inception 9/27/10) | | | +7.60% | | | | +10.04% | | | | +8.97% | | | | +9.30% | |
| | | | |
| With sales charge | | | | | | | | | | | | |
Class A (inception 2/16/06) | | | +2.37% | | | | +4.40% | | | | +7.77% | | | | +8.33% | |
Class B (inception 2/16/06) | | | +2.18% | | | | +3.72% | | | | +7.71% | | | | +8.36% | |
Class C (inception 2/16/06) | | | +6.09% | | | | +7.87% | | | | +8.05% | | | | +8.38% | |
The “Without sales charge” returns for Class A, Class B and Class C shares do not include applicable initial or contingent deferred sales charges. If included, returns would be lower than those shown. The “With sales charge” returns for Class A, Class B and Class C shares include: the maximum initial sales charge of 4.75% for Class A shares; the applicable contingent deferred sales charge (CDSC) for Class B shares (applied as follows: first year 5%; second year 4%; third and fourth years 3%; fifth year 2%; sixth year 1%; no sales charge thereafter); and a 1% CDSC for Class C shares sold within one year after purchase. The Fund’s other share classes are not subject to sales charges and have limited eligibility. See the Fund’s prospectuses for details.
| ** | The returns shown for periods prior to the share class inception date (including returns since inception, which are since Fund inception) include the returns of the Fund’s Class A shares. These returns are adjusted to reflect any higher class-related operating expenses of the newer share classes, as applicable. Please visit columbiamanagement.com/mutual-fund/appended-performance for more information. |
| | | | |
| COLUMBIA EMERGING MARKETS BOND FUND — 2012 SEMIANNUAL REPORT | | | 3 | |
| | |
| Your Fund at a Glance (continued) | | |
| | | | | | |
| COUNTRY BREAKDOWN(1) (at April 30, 2012) | | | |
Argentina | | | | | 3.4 | % |
Brazil | | | | | 7.4 | |
Colombia | | | | | 6.8 | |
Dominican Republic | | | | | 2.1 | |
El Salvador | | | | | 0.5 | |
Hungary | | | | | 0.7 | |
Indonesia | | | | | 9.1 | |
Kazakhstan | | | | | 1.7 | |
Latvia | | | | | 0.3 | |
Lithuania | | | | | 2.0 | |
Mexico | | | | | 9.3 | |
Peru | | | | | 3.4 | |
Philippines | | | | | 1.4 | |
Poland | | | | | 1.9 | |
Qatar | | | | | 1.1 | |
Rebublic of Namibia | | | | | 1.3 | |
Rebublic of the Congo | | | | | 0.3 | |
Romania | | | | | 1.0 | |
Russian Federation | | | | | 13.0 | |
South Africa | | | | | 0.4 | |
South Korea | | | | | 0.9 | |
Supra-National | | | | | 0.2 | |
Trinidad and Tobago | | | | | 1.3 | |
Turkey | | | | | 6.0 | |
Ukraine | | | | | 1.5 | |
United Arab Emirates | | | | | 1.5 | |
Uruguay | | | | | 6.1 | |
Venezuela | | | | | 9.3 | |
Other(2) | | | | | 6.1 | |
| (1) | | Percentages indicated are based upon total investments (excluding Investments of Cash Collateral Received for Securities on Loan). The Fund’s portfolio composition is subject to change. |
| (2) | | Includes investments in Money Market Funds. |
| | |
| 4 | | COLUMBIA EMERGING MARKETS BOND FUND — 2012 SEMIANNUAL REPORT |
| | | | |
| QUALITY BREAKDOWN(1) (at April 30, 2012) | | | |
AA rating | | | 1.1 | % |
A rating | | | 5.7 | |
BBB rating | | | 53.9 | |
BB rating | | | 21.0 | |
B rating | | | 17.7 | |
Not rated | | | 0.6 | |
| (1) | | Percentages indicated are based upon total fixed income securities (excluding Investments of Cash Collateral Received for Securities on Loan and Money Market Funds). |
Bond ratings apply to the underlying holdings of the Fund and not the Fund itself and are divided into categories ranging from AAA (highest) to D (lowest), and are subject to change. The ratings shown are determined by using the middle rating of Moody’s, S&P, and Fitch after dropping the highest and lowest available ratings. When a rating from only two agencies is available, the lower rating is used. When a rating from only one agency is available, that rating is used. When a bond is not rated by one of these agencies, it is designated as Not rated. Credit ratings are subjective to opinions and not statements of fact.
| | | | |
| COLUMBIA EMERGING MARKETS BOND FUND — 2012 SEMIANNUAL REPORT | | | 5 | |
(Unaudited)
Understanding your expenses
As an investor, you incur two types of costs. There are transaction costs, which generally include sales charges on purchases and may include redemption fees. There are also ongoing costs, which generally include management fees, distribution and service (Rule 12b-1) fees, and other fund expenses. The following information is intended to help you understand your ongoing costs (in dollars) of investing in the Fund and to help you compare these costs with the ongoing costs of investing in other mutual funds.
Analyzing your fund’s expenses
To illustrate these ongoing costs, we have provided examples and calculated the expenses paid by investors in each share class of the Fund during the period. The actual and hypothetical information in the table is based on an initial investment of $1,000 at the beginning of the period indicated and held for the entire period. Expense information is calculated two ways and each method provides you with different information. The amount listed in the “Actual” column is calculated using the Fund’s actual operating expenses and total return for the period. You may use the Actual information, together with the amount invested, to estimate the expenses that you paid over the period. Simply divide your account value by $1,000 (for example, an $8,600 account value divided by $1,000 = 8.6), then multiply the results by the expenses paid during the period under the Actual column. The amount listed in the “Hypothetical” column assumes a 5% annual rate of return before expenses (which is not the Fund’s actual return) and then applies the Fund’s actual expense ratio for the period to the hypothetical return. You should not use the hypothetical account values and expenses to estimate either your actual account balance at the end of the period or the expenses you paid during the period. See “Compare with other funds” below for details on how to use the hypothetical data.
Compare with other funds
Since all mutual funds are required to include the same hypothetical calculations about expenses in shareholder reports, you can use this information to compare the ongoing cost of investing in the Fund with other funds. To do so, compare the hypothetical example with the 5% hypothetical examples that appear in the shareholder reports of other funds. As you compare hypothetical examples of other funds, it is important to note that hypothetical examples are meant to highlight the ongoing costs of investing in a fund only and do not reflect any transaction costs, such as sales charges, or redemption or exchange fees. Therefore, the hypothetical calculations are useful in comparing ongoing costs only, and will not help you determine the relative total costs of owning different funds. If transaction costs were included in these calculations, your costs would be higher.
| | |
| 6 | | COLUMBIA EMERGING MARKETS BOND FUND — 2012 SEMIANNUAL REPORT |
November 1, 2011 — April 30, 2012
| | | | | | | | | | | | | | | | | | | | | | | | | | | | |
| | | Account value at the
beginning of the
period ($) | | | Account value at the
end of the period ($) | | | Expenses paid
during the period ($) | | | Fund’s
annualized
expense
ratio (%) | |
| | | Actual | | | Hypothetical | | | Actual | | | Hypothetical | | | Actual | | | Hypothetical | | | Actual | |
Class A | | | 1,000.00 | | | | 1,000.00 | | | | 1,075.20 | | | | 1,019.19 | | | | 5.88 | | | | 5.72 | | | | 1.14 | |
Class B | | | 1,000.00 | | | | 1,000.00 | | | | 1,071.80 | | | | 1,015.12 | | | | 10.10 | | | | 9.82 | | | | 1.96 | |
Class C | | | 1,000.00 | | | | 1,000.00 | | | | 1,070.90 | | | | 1,015.61 | | | | 9.58 | | | | 9.32 | | | | 1.86 | |
Class I | | | 1,000.00 | | | | 1,000.00 | | | | 1,077.50 | | | | 1,021.48 | | | | 3.51 | | | | 3.42 | | | | 0.68 | |
Class R | | | 1,000.00 | | | | 1,000.00 | | | | 1,078.00 | * | | | 1,016.36 | | | | 6.42 | * | | | 6.23 | | | | 1.37 | * |
Class R4 | | | 1,000.00 | | | | 1,000.00 | | | | 1,077.80 | | | | 1,019.99 | | | | 5.06 | | | | 4.92 | | | | 0.98 | |
Class W | | | 1,000.00 | | | | 1,000.00 | | | | 1,076.00 | | | | 1,019.05 | | | | 6.04 | | | | 5.87 | | | | 1.17 | |
Class Z | | | 1,000.00 | | | | 1,000.00 | | | | 1,076.00 | | | | 1,020.64 | | | | 4.39 | | | | 4.27 | | | | 0.85 | |
| * | | For the period November 16, 2011 through April 30, 2012. Class R shares commenced operations on November 16, 2011. |
Expenses paid during the period are equal to the annualized expense ratio for each class as indicated above, multiplied by the average account value over the period and then multiplied by the number of days in the Fund’s most recent fiscal half year and divided by 366.
Expenses do not include fees and expenses incurred indirectly by the Fund from the underlying funds in which the Fund may invest (also referred to as “acquired funds”), including affiliated and non-affiliated pooled investment vehicles (including mutual funds and exchange traded funds).
| | | | |
| COLUMBIA EMERGING MARKETS BOND FUND — 2012 SEMIANNUAL REPORT | | | 7 | |
Columbia Emerging Markets Bond Fund
April 30, 2012 (Unaudited)
(Percentages represent value of investments compared to net assets)
| | | | | | | | | | | | |
| Issuer | | Coupon
Rate | | | Principal
Amount | | | Value | |
| Corporate Bonds & Notes(a) 8.1% | |
| | | | | | | | | | | | |
BRAZIL 2.3% | |
Banco BMG SA
Senior Notes(b) | |
04/15/18 | | | 8.000 | % | | | $1,500,000 | | | | $1,318,632 | |
Banco Cruzeiro do Sul SA
Senior Unsecured(b) | |
01/20/16 | | | 8.250 | % | | | 3,100,000 | | | | 2,325,081 | |
Centrais Eletricas Brasileiras SA
Senior Unsecured(b) | |
10/27/21 | | | 5.750 | % | | | 7,000,000 | | | | 7,612,500 | |
Companhia De Eletricidade Do Estad | |
04/27/16 | | | 11.750 | % | | | BRL 3,500,000 | | | | 1,946,332 | |
| | | | | | | | | | | | |
Total | | | | 13,202,545 | |
COLOMBIA 1.2% | |
BanColombia SA
Senior Unsecured | |
06/03/21 | | | 5.950 | % | | | 4,500,000 | | | | 4,781,250 | |
Banco de Bogota SA
Senior Unsecured(b) | |
01/15/17 | | | 5.000 | % | | | 2,000,000 | | | | 2,080,308 | |
| | | | | | | | | | | | |
Total | | | | 6,861,558 | |
PERU 0.4% | |
Banco de Credito del Peru
Subordinated Notes(b)(c) | |
10/15/22 | | | 7.170 | % | | | PEN 6,000,000 | | | | 2,399,546 | |
RUSSIAN FEDERATION 3.1% | |
Lukoil International Finance BV(b) | |
11/05/19 | | | 7.250 | % | | | 2,400,000 | | | | 2,705,939 | |
11/09/20 | | | 6.125 | % | | | 2,250,000 | | | | 2,387,907 | |
Lukoil International Finance BV(b)(d) | |
06/07/22 | | | 6.656 | % | | | 1,000,000 | | | | 1,107,840 | |
Metalloinvest Finance Ltd.(b) | |
07/21/16 | | | 6.500 | % | | | 2,000,000 | | | | 1,982,448 | |
Novatek Finance Ltd.
Senior Unsecured(b) | |
02/03/21 | | | 6.604 | % | | | 4,000,000 | | | | 4,400,563 | |
Severstal JSC via Steel Capital SA
Notes(b) | |
07/26/16 | | | 6.250 | % | | | 1,500,000 | | | | 1,492,618 | |
TNK-BP Finance SA(b) | |
03/13/18 | | | 7.875 | % | | | 1,000,000 | | | | 1,160,217 | |
| | | | | | | | | | | | |
| Issuer | | Coupon
Rate | | | Principal
Amount | | | Value | |
| Corporate Bonds & Notes(a) (continued) | |
| | | | | | | | | | | | |
RUSSIAN FEDERATION (cont.) | |
VimpelCom Holdings BV(b) | |
03/01/22 | | | 7.504 | % | | | $2,500,000 | | | | $2,425,000 | |
| | | | | | | | | | | | |
Total | | | | 17,662,532 | |
UKRAINE 1.1% | |
Ferrexpo Finance PLC(b) | |
04/07/16 | | | 7.875 | % | | | 800,000 | | | | 748,499 | |
MHP SA(b) | |
04/29/15 | | | 10.250 | % | | | 3,928,000 | | | | 3,892,429 | |
Metinvest BV(b) | |
02/14/18 | | | 8.750 | % | | | 1,500,000 | | | | 1,387,500 | |
| | | | | | | | | | | | |
Total | | | | 6,028,428 | |
Total Corporate Bonds & Notes | |
(Cost: $44,751,249) | | | | $46,154,609 | |
| | | | | | | | | | | | |
| Foreign Government Obligations(a) 85.0% | |
| | | | | | | | | | | | |
ARGENTINA 3.4% | |
Argentina Boden Bonds
Senior Unsecured | |
10/03/15 | | | 7.000 | % | | | $4,035,000 | | | | $3,651,675 | |
Argentina Bonar Bonds
Senior Unsecured(d) | |
04/17/17 | | | 7.000 | % | | | 7,935,000 | | | | 6,459,090 | |
Argentina Republic Government International Bond
Senior Unsecured(c) | |
12/15/35 | | | 4.383 | % | | | 13,450,000 | | | | 1,614,000 | |
City of Buenos Aires
Senior Unsecured(b) | |
03/01/17 | | | 9.950 | % | | | 2,000,000 | | | | 1,764,873 | |
Provincia de Buenos Aires(b)
Senior Unsecured | |
10/05/15 | | | 11.750 | % | | | 1,990,000 | | | | 1,750,927 | |
01/26/21 | | | 10.875 | % | | | 2,780,000 | | | | 1,966,916 | |
Provincia de Cordoba
Senior Unsecured(b) | |
08/17/17 | | | 12.375 | % | | | 2,450,000 | | | | 1,927,342 | |
| | | | | | | | | | | | |
Total | | | | 19,134,823 | |
The accompanying Notes to Financial Statements are an integral part of this statement.
| | |
| 8 | | COLUMBIA EMERGING MARKETS BOND FUND — 2012 SEMIANNUAL REPORT |
| | | | | | | | | | | | |
| Issuer | | Coupon
Rate | | | Principal
Amount | | | Value | |
Foreign Government Obligations(a)
(continued) | |
| | | | | | | | | | | | |
BRAZIL 5.0% | |
Brazil Notas do Tesouro Nacional | |
01/01/13 | | | 10.000 | % | | | BRL 1,218,100 | | | | $6,662,489 | |
01/01/17 | | | 10.000 | % | | | BRL 681,900 | | | | 3,679,863 | |
Cia de Saneamento Basico do Estado de Sao Paulo
Senior Unsecured(b) | |
12/16/20 | | | 6.250 | % | | | 500,000 | | | | 533,750 | |
Morgan Stanley
Senior Unsecured | |
10/22/20 | | | 11.500 | % | | | BRL 3,300,000 | | | | 1,764,628 | |
Petrobras International Finance Co. | |
03/15/19 | | | 7.875 | % | | | 3,200,000 | | | | 3,956,323 | |
01/20/20 | | | 5.750 | % | | | 1,000,000 | | | | 1,116,158 | |
01/27/21 | | | 5.375 | % | | | 7,224,000 | | | | 7,877,244 | |
01/20/40 | | | 6.875 | % | | | 2,600,000 | | | | 3,143,834 | |
| | | | | | | | | | | | |
Total | | | | 28,734,289 | |
COLOMBIA 5.5% | |
Bogota Distrito Capital
Senior Unsecured(b) | |
07/26/28 | | | 9.750 | % | | | COP 1,377,000,000 | | | | 1,063,128 | |
Colombia Government International Bond
Senior Unsecured | |
10/22/15 | | | 12.000 | % | | | COP 2,093,000,000 | | | | 1,483,916 | |
01/18/41 | | | 6.125 | % | | | 6,600,000 | | | | 8,312,439 | |
Corp. Andina de Fomento
Senior Unsecured | |
06/04/19 | | | 8.125 | % | | | 3,125,000 | | | | 3,907,009 | |
Empresa de Energia de Bogota SA
Senior Unsecured(b)(d) | |
11/10/21 | | | 6.125 | % | | | 6,645,000 | | | | 7,011,163 | |
Empresas Publicas de Medellin ESP
Senior Unsecured(b) | |
02/01/21 | | | 8.375 | % | | | COP 12,188,000,000 | | | | 7,426,023 | |
Republic of Colombia
Senior Unsecured | |
06/28/27 | | | 9.850 | % | | | COP 1,000,000,000 | | | | 825,872 | |
Transportadora de Gas Internacional SA ESP
Senior Unsecured(b)(d) | |
03/20/22 | | | 5.700 | % | | | 1,400,000 | | | | 1,431,623 | |
| | | | | | | | | | | | |
Total | | | | 31,461,173 | |
DOMINICAN REPUBLIC 2.1% | |
Dominican Republic International Bond(b)
Senior Unsecured | |
05/06/21 | | | 7.500 | % | | | 7,500,000 | | | | 7,877,876 | |
04/20/27 | | | 8.625 | % | | | 3,984,000 | | | | 4,262,880 | |
| | | | | | | | | | | | |
Total | | | | 12,140,756 | |
| | | | | | | | | | | | |
| Issuer | | Coupon
Rate | | | Principal
Amount | | | Value | |
Foreign Government Obligations(a)
(continued) | |
| | | | | | | | | | | | |
EL SALVADOR 0.5% | |
El Salvador Government International Bond(b)
Senior Unsecured | |
04/10/32 | | | 8.250 | % | | | $1,000,000 | | | | $1,105,000 | |
06/15/35 | | | 7.650 | % | | | 1,810,000 | | | | 1,877,875 | |
| | | | | | | | | | | | |
Total | | | | 2,982,875 | |
HUNGARY 0.7% | |
Hungary Government International Bond
Senior Unsecured | |
03/29/41 | | | 7.625 | % | | | 1,500,000 | | | | 1,423,125 | |
Hungary Government International Bond(d)
Senior Unsecured | |
03/29/21 | | | 6.375 | % | | | 2,400,000 | | | | 2,303,644 | |
| | | | | | | | | | | | |
Total | | | | 3,726,769 | |
INDONESIA 9.1% | |
Indonesia Government International Bond(b)
Senior Unsecured | |
05/05/21 | | | 4.875 | % | | | 8,000,000 | | | | 8,601,301 | |
01/17/38 | | | 7.750 | % | | | 3,700,000 | | | | 5,013,500 | |
Indonesia Government International Bond(b)(d) | |
01/17/42 | | | 5.250 | % | | | 1,000,000 | | | | 1,023,750 | |
Indonesia Treasury Bond
Senior Unsecured | |
10/15/14 | | | 11.000 | % | | | IDR 6,000,000,000 | | | | 748,268 | |
07/15/17 | | | 10.000 | % | | | IDR 10,000,000,000 | | | | 1,316,559 | |
09/15/19 | | | 11.500 | % | | | IDR 29,400,000,000 | | | | 4,278,174 | |
11/15/20 | | | 11.000 | % | | | IDR 9,000,000,000 | | | | 1,311,611 | |
06/15/21 | | | 12.800 | % | | | IDR 6,800,000,000 | | | | 1,091,310 | |
07/15/22 | | | 10.250 | % | | | IDR 23,210,000,000 | | | | 3,278,690 | |
09/15/24 | | | 10.000 | % | | | IDR 9,000,000,000 | | | | 1,275,225 | |
Majapahit Holding BV(b) | |
10/17/16 | | | 7.750 | % | | | 1,830,000 | | | | 2,099,925 | |
06/28/17 | | | 7.250 | % | | | 1,150,000 | | | | 1,316,434 | |
08/07/19 | | | 8.000 | % | | | 3,600,000 | | | | 4,302,000 | |
01/20/20 | | | 7.750 | % | | | 4,900,000 | | | | 5,817,710 | |
PT Pertamina Persero(b) | |
05/23/21 | | | 5.250 | % | | | 2,000,000 | | | | 2,064,107 | |
Senior Unsecured | |
05/27/41 | | | 6.500 | % | | | 1,000,000 | | | | 1,058,860 | |
PT Pertamina Persero(b)(e)
Senior Unsecured | |
05/03/22 | | | 4.875 | % | | | 1,000,000 | | | | 995,000 | |
05/03/42 | | | 6.000 | % | | | 3,000,000 | | | | 2,947,500 | |
PT Perusahaan Listrik Negara
Senior Unsecured(b) | |
11/22/21 | | | 5.500 | % | | | 3,000,000 | | | | 3,088,681 | |
| | | | | | | | | | | | |
Total | | | | 51,628,605 | |
The accompanying Notes to Financial Statements are an integral part of this statement.
| | | | |
| COLUMBIA EMERGING MARKETS BOND FUND — 2012 SEMIANNUAL REPORT | | | 9 | |
| | |
| Portfolio of Investments (continued) | | |
| | | | | | | | | | | | |
| Issuer | | Coupon
Rate | | | Principal
Amount | | | Value | |
Foreign Government Obligations(a)
(continued) | |
| | | | | | | | | | | | |
KAZAKHSTAN 1.7% | |
KazMunayGas National Co.(b)
Senior Unsecured | |
07/02/18 | | | 9.125 | % | | | $4,095,000 | | | | $5,093,156 | |
05/05/20 | | | 7.000 | % | | | 2,650,000 | | | | 3,034,662 | |
04/09/21 | | | 6.375 | % | | | 1,500,000 | | | | 1,666,875 | |
| | | | | | | | | | | | |
Total | | | | 9,794,693 | |
LATVIA 0.3% | |
Republic of Latvia
Senior Unsecured(b) | |
06/16/21 | | | 5.250 | % | | | 1,500,000 | | | | 1,488,935 | |
LITHUANIA 2.0% | |
Lithuania Government International Bond(b)
Senior Unsecured | |
02/11/20 | | | 7.375 | % | | | 600,000 | | | | 705,336 | |
03/09/21 | | | 6.125 | % | | | 4,850,000 | | | | 5,259,448 | |
02/01/22 | | | 6.625 | % | | | 3,830,000 | | | | 4,287,646 | |
Lithuania Government International Bond(b)(d)
Senior Unsecured | |
09/14/17 | | | 5.125 | % | | | 1,150,000 | | | | 1,200,722 | |
| | | | | | | | | | | | |
Total | | | | 11,453,152 | |
MEXICO 9.2% | |
Comision Federal De Electricidad
Senior Unsecured(b) | |
02/14/42 | | | 5.750 | % | | | 3,200,000 | | | | 3,248,000 | |
Mexican Bonos | |
12/17/15 | | | 8.000 | % | | | MXN 1,940,000 | | | | 1,634,852 | |
12/15/16 | | | 7.250 | % | | | MXN 4,801,000 | | | | 3,990,127 | |
12/14/17 | | | 7.750 | % | | | MXN 3,910,000 | | | | 3,340,409 | |
06/10/21 | | | 6.500 | % | | | MXN 1,500,000 | | | | 1,180,029 | |
06/09/22 | | | 6.500 | % | | | MXN 8,900,000 | | | | 6,949,283 | |
06/03/27 | | | 7.500 | % | | | MXN 15,188,000 | | | | 12,398,462 | |
Pemex Project Funding Master Trust | |
01/21/21 | | | 5.500 | % | | | 1,500,000 | | | | 1,669,500 | |
06/15/35 | | | 6.625 | % | | | 4,304,000 | | | | 5,046,440 | |
06/15/38 | | | 6.625 | % | | | 2,000,000 | | | | 2,350,000 | |
Pemex Project Funding Master Trust(b)(d) | |
01/24/22 | | | 4.875 | % | | | 1,800,000 | | | | 1,919,032 | |
Petroleos Mexicanos | |
05/03/19 | | | 8.000 | % | | | 1,600,000 | | | | 2,032,000 | |
06/02/41 | | | 6.500 | % | | | 2,000,000 | | | | 2,320,000 | |
Petroleos Mexicanos(b)(d) | |
06/02/41 | | | 6.500 | % | | | 4,000,000 | | | | 4,640,000 | |
| | | | | | | | | | | | |
Total | | | | 52,718,134 | |
| | | | | | | | | | | | |
| | | | | | | | | | |
| | |
| | | | | | | | | | | | |
PERU 3.0% | |
Corp. Financiera de Desarrollo SA
Senior Unsecured(b) | |
02/08/22 | | | 4.750 | % | | | $5,000,000 | | | | $5,222,317 | |
Peru Enhanced Pass-Through Finance Ltd.
Pass-Thru Certificates(b)(f) | |
05/31/18 | | | 0.000 | % | | | 5,513,287 | | | | 4,851,692 | |
Peruvian Government International Bond
Senior Unsecured | |
07/21/25 | | | 7.350 | % | | | 1,500,000 | | | | 2,077,500 | |
11/18/50 | | | 5.625 | % | | | 1,800,000 | | | | 2,083,500 | |
Peruvian Government International Bond(b)
Senior Unsecured | |
08/12/20 | | | 7.840 | % | | | PEN 1,400,000 | | | | 625,790 | |
Peruvian Government International Bond(d)
Senior Unsecured | |
03/14/37 | | | 6.550 | % | | | 1,500,000 | | | | 1,970,250 | |
| | | | | | | | | | | | |
Total | | | | 16,831,049 | |
PHILIPPINES 1.4% | |
Philippine Government International Bond
Senior Unsecured | |
03/30/26 | | | 5.500 | % | | | 1,500,000 | | | | 1,721,250 | |
01/14/36 | | | 6.250 | % | | | PHP 106,000,000 | | | | 2,625,207 | |
Power Sector Assets & Liabilities Management Corp.
Government Guaranteed(b) | |
12/02/24 | | | 7.390 | % | | | 3,000,000 | | | | 3,795,231 | |
| | | | | | | | | | | | |
Total | | | | 8,141,688 | |
POLAND 1.9% | |
Poland Government International Bond
Senior Unsecured | |
04/21/21 | | | 5.125 | % | | | 8,000,000 | | | | 8,640,000 | |
03/23/22 | | | 5.000 | % | | | 2,000,000 | | | | 2,140,000 | |
| | | | | | | | | | | | |
Total | | | | 10,780,000 | |
QATAR 1.0% | |
Qatar Government International Bond(b)
Senior Unsecured | |
01/20/22 | | | 4.500 | % | | | 4,500,000 | | | | 4,747,500 | |
01/20/40 | | | 6.400 | % | | | 1,000,000 | | | | 1,196,250 | |
| | | | | | | | | | | | |
Total | | | | 5,943,750 | |
REPUBLIC OF NAMIBIA 1.3% | |
Namibia International Bonds
Senior Unsecured(b) | |
11/03/21 | | | 5.500 | % | | | 7,300,000 | | | | 7,610,250 | |
The accompanying Notes to Financial Statements are an integral part of this statement.
| | |
| 10 | | COLUMBIA EMERGING MARKETS BOND FUND — 2012 SEMIANNUAL REPORT |
| | | | | | | | | | | | |
| Issuer | | Coupon
Rate | | | Principal
Amount | | | Value | |
Foreign Government Obligations(a)
(continued) | |
| | | | | | | | | | | | |
REPUBLIC OF THE CONGO 0.3% | |
Republic of Congo
Senior Unsecured(c) | |
06/30/29 | | | 3.000 | % | | | $2,232,500 | | | | $1,730,188 | |
ROMANIA 1.0% | |
Romanian Government International Bond
Senior Unsecured(b) | |
02/07/22 | | | 6.750 | % | | | 5,400,000 | | | | 5,667,173 | |
RUSSIAN FEDERATION 9.7% | |
AK Transneft OJSC Via TransCapitalInvest Ltd.
Senior Unsecured(b) | |
08/07/18 | | | 8.700 | % | | | 3,180,000 | | | | 3,927,300 | |
Gazprom OAO Via Gaz Capital SA(b)
Senior Unsecured | |
11/22/16 | | | 6.212 | % | | | 3,350,000 | | | | 3,655,687 | |
04/11/18 | | | 8.146 | % | | | 850,000 | | | | 1,002,873 | |
01/23/21 | | | 5.999 | % | | | 2,000,000 | | | | 2,130,800 | |
Gazprom OAO Via Gaz Capital SA(b)(d)
Senior Unsecured | |
03/07/22 | | | 6.510 | % | | | 9,800,000 | | | | 10,757,460 | |
08/16/37 | | | 7.288 | % | | | 2,950,000 | | | | 3,403,562 | |
Russian Foreign Bond—Eurobond(b)
Senior Unsecured | |
03/10/18 | | | 7.850 | % | | | RUB 60,000,000 | | | | 2,129,749 | |
04/29/20 | | | 5.000 | % | | | 6,000,000 | | | | 6,487,500 | |
Russian Foreign Bond—Eurobond(b)(c)
Senior Unsecured | |
03/31/30 | | | 7.500 | % | | | 6,368,355 | | | | 7,634,066 | |
Russian Foreign Bond—Eurobond(b)(d)
Senior Unsecured | |
04/04/42 | | | 5.625 | % | | | 3,000,000 | | | | 3,159,300 | |
Sberbank of Russia Via SB Capital SA
Senior Unsecured | |
06/16/21 | | | 5.717 | % | | | 1,500,000 | | | | 1,518,750 | |
Sberbank of Russia Via SB Capital SA(b)
Senior Unsecured | |
02/07/22 | | | 6.125 | % | | | 4,800,000 | | | | 4,923,325 | |
Vnesheconombank Via VEB Finance PLC
Senior Unsecured(b) | |
11/22/25 | | | 6.800 | % | | | 4,500,000 | | | | 4,770,000 | |
| | | | | | | | | | | | |
Total | | | | 55,500,372 | |
SOUTH AFRICA 0.4% | |
South Africa Government International Bond
Senior Unsecured | |
01/17/24 | | | 4.665 | % | | | 2,200,000 | | | | 2,304,500 | |
| | | | | | | | | | | | |
| Issuer | | Coupon
Rate | | | Principal
Amount | | | Value | |
Foreign Government Obligations(a)
(continued) | |
| | | | | | | | | | | | |
SOUTH KOREA 0.9% | |
Export-Import Bank of Korea
Senior Unsecured | |
09/15/21 | | | 4.375 | % | | | $4,000,000 | | | | $4,073,756 | |
04/11/22 | | | 5.000 | % | | | 1,000,000 | | | | 1,074,105 | |
| | | | | | | | | | | | |
Total | | | | 5,147,861 | |
SUPRA-NATIONAL 0.2% | |
African Export-Import Bank
Senior Unsecured | |
07/27/16 | | | 5.750 | % | | | 1,000,000 | | | | 1,037,800 | |
TRINIDAD AND TOBAGO 1.3% | |
Petroleum Co. of Trinidad & Tobago Ltd.
Senior Unsecured(b) | |
08/14/19 | | | 9.750 | % | | | 5,800,000 | | | | 7,140,180 | |
TURKEY 5.9% | |
Export Credit Bank of Turkey(b) | |
11/04/16 | | | 5.375 | % | | | 3,000,000 | | | | 3,046,195 | |
Senior Unsecured | |
04/24/19 | | | 5.875 | % | | | 3,000,000 | | | | 3,022,093 | |
Turkey Government International Bond | |
03/25/22 | | | 5.125 | % | | | 4,000,000 | | | | 4,074,000 | |
01/14/41 | | | 6.000 | % | | | 2,100,000 | | | | 2,136,750 | |
Senior Unsecured | |
11/07/19 | | | 7.500 | % | | | 1,625,000 | | | | 1,950,000 | |
06/05/20 | | | 7.000 | % | | | 1,300,000 | | | | 1,521,000 | |
03/30/21 | | | 5.625 | % | | | 4,550,000 | | | | 4,868,500 | |
09/26/22 | | | 6.250 | % | | | 5,000,000 | | | | 5,537,500 | |
03/17/36 | | | 6.875 | % | | | 3,800,000 | | | | 4,303,500 | |
05/30/40 | | | 6.750 | % | | | 3,100,000 | | | | 3,433,250 | |
| | | | | | | | | | | | |
Total | | | | 33,892,788 | |
UKRAINE 0.4% | |
City of Kyiv Via Kyiv Finance PLC
Senior Unsecured(b) | |
07/11/16 | | | 9.375 | % | | | 1,100,000 | | | | 958,298 | |
Ukraine Government International Bond
Senior Unsecured(b) | |
02/23/21 | | | 7.950 | % | | | 1,655,000 | | | | 1,496,068 | |
| | | | | | | | | | | | |
Total | | | | 2,454,366 | |
UNITED ARAB EMIRATES 1.5% | |
Abu Dhabi National Energy Co.
Senior Unsecured(b) | |
12/13/21 | | | 5.875 | % | | | 4,500,000 | | | | 4,866,132 | |
Dolphin Energy Ltd.
Senior Secured(b) | |
12/15/21 | | | 5.500 | % | | | 3,550,000 | | | | 3,814,446 | |
| | | | | | | | | | | | |
Total | | | | 8,680,578 | |
The accompanying Notes to Financial Statements are an integral part of this statement.
| | | | |
| COLUMBIA EMERGING MARKETS BOND FUND — 2012 SEMIANNUAL REPORT | | | 11 | |
| | |
| Portfolio of Investments (continued) | | |
| | | | | | | | | | | | |
| Issuer | | Coupon
Rate | | | Principal
Amount | | | Value | |
Foreign Government Obligations(a)
(continued) | |
| | | | | | | | | | | | |
URUGUAY 6.0% | |
Uruguay Government International Bond | |
04/05/27 | | | 4.250 | % | | | UYU 17,027,199 | | | | $19,416,056 | |
06/26/37 | | | 3.700 | % | | | UYU 3,428,591 | | | | 3,645,626 | |
Senior Unsecured | |
12/15/28 | | | 4.375 | % | | | UYU 7,443,766 | | | | 8,674,254 | |
03/21/36 | | | 7.625 | % | | | 1,783,939 | | | | 2,505,542 | |
| | | | | | | | | | | | |
Total | | | | 34,241,478 | |
VENEZUELA 9.2% | |
Petroleos de Venezuela SA | |
04/12/17 | | | 5.250 | % | | | 11,647,000 | | | | 9,040,984 | |
11/02/17 | | | 8.500 | % | | | 18,020,000 | | | | 16,082,850 | |
02/17/22 | | | 12.750 | % | | | 2,140,000 | | | | 2,177,450 | |
Petroleos de Venezuela SA(d)
Senior Unsecured | |
10/28/15 | | | 5.000 | % | | | 10,700,500 | | | | 9,127,526 | |
Venezuela Government International Bond
Senior Unsecured | |
02/26/16 | | | 5.750 | % | | | 4,289,500 | | | | 3,881,998 | |
05/07/23 | | | 9.000 | % | | | 13,050,000 | | | | 11,353,500 | |
03/31/38 | | | 7.000 | % | | | 800,000 | | | | 572,000 | |
| | | | | | | | | | | | |
Total | | | | 52,236,308 | |
Total Foreign Government Obligations | |
(Cost: $447,073,161) | | | | $484,604,533 | |
| | | | | |
Shares | | | Value | |
| Money Market Funds 6.0% | |
| | | | | | | | | | | | |
Columbia Short-Term Cash Fund, | | | | | |
0.144%(g)(h) | | | | 34,054,457 | | | | $34,054,457 | |
Total Money Market Funds | |
(Cost: $34,054,457) | | | | $34,054,457 | |
| | | |
| Issuer | | Effective
Yield | | | Par/
Principal/
Shares | | | Value | |
Investments of Cash Collateral
Received for Securities on Loan 3.6% | |
| | | | | | | | | | | | |
REPURCHASE AGREEMENTS 3.6% | |
Citigroup Global Markets, Inc.
dated 04/30/12, matures 05/01/12,
repurchase price $2,000,012(i) | |
| | | 0.210 | % | | | $2,000,000 | | | | $2,000,000 | |
| | | | | | | | | | | | |
| | | |
| Issuer | | Effective
Yield | | | Par/
Principal/
Shares | | | Value | |
Investments of Cash Collateral
Received for Securities on Loan
(continued) | |
| | | | | | | | | | | | |
REPURCHASE AGREEMENTS (cont.) | |
Mizuho Securities USA, Inc.
dated 04/30/12, matures 05/01/12,
repurchase price $5,000,033(i) | |
| | | 0.240 | % | | | $5,000,000 | | | | $5,000,000 | |
Natixis Financial Products, Inc.
dated 04/30/12, matures 05/01/12,
repurchase price $7,000,047(i) | |
| | | 0.240 | % | | | 7,000,000 | | | | 7,000,000 | |
Pershing LLC
dated 04/30/12, matures 05/01/12,
repurchase price $1,000,009(i) | |
| | | 0.330 | % | | | 1,000,000 | | | | 1,000,000 | |
Societe Generale
dated 04/30/12, matures 05/01/12,
repurchase price $5,796,409(i) | |
| | | 0.210 | % | | | 5,796,376 | | | | 5,796,376 | |
| | | | | | | | | | | | |
Total | | | | 20,796,376 | |
Total Investments of Cash Collateral Received for Securities on Loan | |
(Cost: $20,796,376) | | | | $20,796,376 | |
Total Investments | |
(Cost: $546,675,243) | | | | $585,609,975 | |
Other Assets & Liabilities, Net | | | | (15,477,021 | ) |
Net Assets | | | | $570,162,954 | |
The accompanying Notes to Financial Statements are an integral part of this statement.
| | |
| 12 | | COLUMBIA EMERGING MARKETS BOND FUND — 2012 SEMIANNUAL REPORT |
Investments in Derivatives
| | | | | | | | | | | | | | | | | | | | |
| Forward Foreign Currency Exchange Contracts Open at April 30, 2012 | |
| Counterparty | | Exchange Date | | | Currency to
be Delivered | | | Currency to
be Received | | | Unrealized
Appreciation | | | Unrealized
Depreciation | |
| Citigroup Global Markets, Inc. | | | May 7, 2012 | | | | 6,000,000 (USD | ) | | | 53,892,000,000 (IDR | ) | | | $— | | | | $(139,353 | ) |
| | | | | | | | | | | | | | | | | | | | | | | | | | | | | | | | | | | | |
Credit Default Swap Contracts Outstanding at April 30, 2012 Buy Protection | |
| Counterparty | | Reference
Entity | | | Expiration
Date | | | Pay
Fixed
Rate | | | Notional
Amount | | | Market
Value | | | Unamortized
Premium
(Paid)
Received | | | Periodic
Payments
Receivable
(Payable) | | | Unrealized
Appreciation | | | Unrealized
Depreciation | |
| | | | | | | | | |
JPMorgan
Chase Bank | |
| CDX Emerging
Markets Index |
| |
| June 20,
2013 |
| | | 2.650 | % | | | $2,000,000 | | | | $(26,068 | ) | | | $(93,744 | ) | | | $(19,581 | ) | | | $— | | | | $(139,393 | ) |
| | | | | | | | | | | | | | | | | | | | | | | | | | | | | | | | | | | | |
Credit Default Swap Contracts Outstanding at April 30, 2012 Sell Protection | |
| Counterparty | | Reference
Entity | | | Expiration
Date | | | Pay
Fixed
Rate | | | Notional
Amount | | | Market
Value | | | Unamortized
Premium
(Paid)
Received | | | Periodic
Payments
Receivable
(Payable) | | | Unrealized
Appreciation | | | Unrealized
Depreciation | |
| Merril Lynch Intl | |
| CDX Emerging
Markets Index |
| |
| June 20,
2013 |
| | | 2.650 | % | | | $2,000,000 | | | | $26,068 | | | | $— | | | | $19,581 | | | | $45,649 | | | | $— | |
| | |
| Notes to Portfolio of Investments |
| (a) | Principal amounts are denominated in United States Dollars unless otherwise noted. |
| (b) | Security exempt from registration pursuant to Rule 144A under the Securities Act of 1933. This security may be resold in transactions exempt from registration, normally to qualified institutional buyers. At April 30, 2012, the value of these securities amounted to $262,340,221 or 46.01% of net assets. |
| (c) | Variable rate security. The interest rate shown reflects the rate as of April 30, 2012. |
| (d) | At April 30, 2012, security was partially or fully on loan. |
| (e) | Represents a security purchased on a when-issued or delayed delivery basis. |
| (g) | The rate shown is the seven-day current annualized yield at April 30, 2012. |
The accompanying Notes to Financial Statements are an integral part of this statement.
| | | | |
| COLUMBIA EMERGING MARKETS BOND FUND — 2012 SEMIANNUAL REPORT | | | 13 | |
| | |
| Portfolio of Investments (continued) | | |
| | |
| Notes to Portfolio of Investments (continued) |
| (h) | Investments in affiliates during the period ended April 30, 2012: |
| | | | | | | | | | | | | | | | | | | | | | | | | | | | |
| Issuer | | Beginning
Cost | | | Purchase
Cost | | | Sales Cost/
Proceeds
from Sales | | | Realized
Gain/Loss | | | Ending
Cost | | | Dividends
or
Interest
Income | | | Value | |
| Columbia Short-Term Cash Fund | | | $43,207,633 | | | | $103,307,472 | | | | $(112,460,648 | ) | | | $— | | | | $34,054,457 | | | | $24,981 | | | | $34,054,457 | |
| (i) | The table below represents securities received as collateral for repurchase agreements. This collateral is deposited with the Fund’s custodian and, pursuant to the terms of the repurchase agreement, must have an aggregate value greater than or equal to the repurchase price plus accrued interest at all times. The value of securities and/or cash held as collateral for repurchase agreements is monitored on a daily basis to ensure the proper level of collateral. |
| | | | |
| Citigroup Global Markets, Inc. (0.210%) | | | | |
| |
| Security Description | | Value | |
| Fannie Mae REMICS | | | $733,049 | |
| Fannie Mae-Aces | | | 137,795 | |
| Freddie Mac REMICS | | | 718,141 | |
| Government National Mortgage Association | | | 451,015 | |
| Total Market Value of Collateral Securities | | | $2,040,000 | |
| |
| Mizuho Securities USA, Inc. (0.240%) | | | | |
| |
| Security Description | | Value | |
| Fannie Mae REMICS | | | $2,530,245 | |
| Freddie Mac REMICS | | | 2,569,755 | |
| Total Market Value of Collateral Securities | | | $5,100,000 | |
| |
| Natixis Financial Products, Inc. (0.240%) | | | | |
| |
| Security Description | | Value | |
| Fannie Mae Pool | | | $247,380 | |
| Fannie Mae REMICS | | | 1,836,242 | |
| Fannie Mae Whole Loan | | | 57,689 | |
| Freddie Mac Gold Pool | | | 518,151 | |
| Freddie Mac Non Gold Pool | | | 134,047 | |
| Freddie Mac REMICS | | | 1,603,886 | |
| Government National Mortgage Association | | | 1,143,145 | |
| United States Treasury Note/Bond | | | 1,599,508 | |
| Total Market Value of Collateral Securities | | | $7,140,048 | |
The accompanying Notes to Financial Statements are an integral part of this statement.
| | |
| 14 | | COLUMBIA EMERGING MARKETS BOND FUND — 2012 SEMIANNUAL REPORT |
| | |
| Notes to Portfolio of Investments (continued) |
| | | | |
| |
| Pershing LLC (0.330%) | | | | |
| |
| Security Description | | Value | |
| Fannie Mae Pool | | | $207,499 | |
| Fannie Mae REMICS | | | 54,310 | |
| Fannie Mae-Aces | | | 5,960 | |
| Federal Farm Credit Bank | | | 37,671 | |
| Federal Home Loan Banks | | | 9,851 | |
| Federal Home Loan Mortgage Corp | | | 8,055 | |
| Federal National Mortgage Association | | | 11,410 | |
| Freddie Mac Coupon Strips | | | 7,871 | |
| Freddie Mac Gold Pool | | | 80,142 | |
| Freddie Mac Non Gold Pool | | | 30,216 | |
| Freddie Mac Reference REMIC | | | 9,609 | |
| Freddie Mac REMICS | | | 62,538 | |
| Ginnie Mae I Pool | | | 103,173 | |
| Ginnie Mae II Pool | | | 288,015 | |
| Government National Mortgage Association | | | 34,224 | |
| United States Treasury Note/Bond | | | 69,456 | |
| Total Market Value of Collateral Securities | | | $1,020,000 | |
| |
| Societe Generale (0.210%) | | | | |
| |
| Security Description | | Value | |
| Fannie Mae Pool | | | $4,028,467 | |
| Freddie Mac Gold Pool | | | 1,883,836 | |
| Total Market Value of Collateral Securities | | | $5,912,303 | |
| | |
| Currency Legend |
| BRL | | Brazilian Real |
| COP | | Colombian Peso |
| IDR | | Indonesian Rupiah |
| MXN | | Mexican Peso |
| PEN | | Peru Nuevos Soles |
| PHP | | Philippine Peso |
| RUB | | Russian Rouble |
| UYU | | Uruguay Pesos |
The accompanying Notes to Financial Statements are an integral part of this statement.
| | | | |
| COLUMBIA EMERGING MARKETS BOND FUND — 2012 SEMIANNUAL REPORT | | | 15 | |
| | |
| Portfolio of Investments (continued) | | |
Generally accepted accounting principles (GAAP) require disclosure regarding the inputs and valuation techniques used to measure fair value and any changes in valuation inputs or techniques. In addition, investments shall be disclosed by major category.
The Fund categorizes its fair value measurements according to a three-level hierarchy that maximizes the use of observable inputs and minimizes the use of unobservable inputs by prioritizing that the most observable input be used when available. Observable inputs are those that market participants would use in pricing an investment based on market data obtained from sources independent of the reporting entity. Unobservable inputs are those that reflect the Fund’s assumptions about the information market participants would use in pricing an investment. An investment’s level within the fair value hierarchy is based on the lowest level of any input that is deemed significant to the asset or liability’s fair value measurement. The input levels are not necessarily an indication of the risk or liquidity associated with investments at that level. For example, certain U.S. government securities are generally high quality and liquid, however, they are reflected as Level 2 because the inputs used to determine fair value may not always be quoted prices in an active market.
Fair value inputs are summarized in the three broad levels listed below:
| | Ÿ | | Level 1 — Valuations based on quoted prices for investments in active markets that the Fund has the ability to access at the measurement date (including NAV for open-end mutual funds). Valuation adjustments are not applied to Level 1 investments. |
| | Ÿ | | Level 2 — Valuations based on other significant observable inputs (including quoted prices for similar securities, interest rates, prepayment speeds, credit risks, etc.). |
| | Ÿ | | Level 3 — Valuations based on significant unobservable inputs (including the Fund’s own assumptions and judgment in determining the fair value of investments). |
Inputs that are used in determining fair value of an investment may include price information, credit data, volatility statistics, and other factors. These inputs can be either observable or unobservable. The availability of observable inputs can vary between investments, and is affected by various factors such as the type of investment, and the volume and level of activity for that investment or similar investments in the marketplace. The inputs will be considered by the Investment Manager, along with any other relevant factors in the calculation of an investment’s fair value. The Fund uses prices and inputs that are current as of the measurement date, which may include periods of market dislocations. During these periods, the availability of prices and inputs may be reduced for many investments. This condition could cause an investment to be reclassified between the various levels within the hierarchy.
Investments falling into the Level 3 category are primarily supported by quoted prices from brokers and dealers participating in the market for those investments. However, these may be classified as Level 3 investments due to lack of market transparency and corroboration to support these quoted prices. Additionally, valuation models may be used as the pricing source for any remaining investments classified as Level 3. These models rely on one or more significant unobservable inputs and/or significant assumptions by the Investment Manager. Inputs used in valuations may include, but are not limited to, financial statement analysis, capital account balances, discount rates and estimated cash flows, and comparable company data.
The accompanying Notes to Financial Statements are an integral part of this statement.
| | |
| 16 | | COLUMBIA EMERGING MARKETS BOND FUND — 2012 SEMIANNUAL REPORT |
| | |
| Fair Value Measurements (continued) |
The following table is a summary of the inputs used to value the Fund’s investments as of April 30, 2012:
| | | | | | | | | | | | | | | | |
| | | Fair Value at April 30, 2012 | |
| Description | | Level 1
Quoted Prices
in Active
Markets for
Identical Assets | | | Level 2
Other
Significant
Observable
Inputs | | | Level 3
Significant
Unobservable
Inputs | | | Total | |
| Bonds | | | | | | | | | | | | | | | | |
Corporate Bonds & Notes | | | | | | | | | | | | | | | | |
Banking | | | $— | | | | $18,675,225 | | | | $2,399,546 | | | | $21,074,771 | |
All Other Industries | | | — | | | | 25,079,838 | | | | — | | | | 25,079,838 | |
Foreign Government Obligations | | | — | | | | 479,752,841 | | | | 4,851,692 | | | | 484,604,533 | |
| Total Bonds | | | — | | | | 523,507,904 | | | | 7,251,238 | | | | 530,759,142 | |
| Other | | | | | | | | | | | | | | | | |
Money Market Funds | | | 34,054,457 | | | | — | | | | — | | | | 34,054,457 | |
Investments of Cash Collateral
Received for Securities on Loan | | | — | | | | 20,796,376 | | | | — | | | | 20,796,376 | |
| Total Other | | | 34,054,457 | | | | 20,796,376 | | | | — | | | | 54,850,833 | |
| Investments in Securities | | | 34,054,457 | | | | 544,304,280 | | | | 7,251,238 | | | | 585,609,975 | |
| Derivatives | | | | | | | | | | | | | | | | |
Assets | | | | | | | | | | | | | | | | |
Swap Contracts | | | — | | | | 45,649 | | | | — | | | | 45,649 | |
Liabilities | | | | | | | | | | | | | | | | |
Forward Foreign Currency Exchange Contracts | | | — | | | | (139,353 | ) | | | — | | | | (139,353 | ) |
Swap Contracts | | | — | | | | (139,393 | ) | | | — | | | | (139,393 | ) |
| Total | | | $34,054,457 | | | | $544,071,183 | | | | $7,251,238 | | | | $585,376,878 | |
See the Portfolio of Investments for all investment classifications not indicated in the table.
The Fund’s assets assigned to the Level 2 input category are generally valued using the market approach, in which a security’s value is determined through reference to prices and information from market transactions for similar or identical assets.
The Fund’s assets assigned to the Level 3 category are valued utilizing the valuation technique deemed the most appropriate in the circumstances. Certain Corporate Bonds and Foreign Government Obligations classified as Level 3 are valued using the market approach and utilize single market quotations from broker dealers.
There were no transfers of financial assets between Levels 1 and 2 during the period.
Derivative instruments are valued at unrealized appreciation (depreciation).
The accompanying Notes to Financial Statements are an integral part of this statement.
| | | | |
| COLUMBIA EMERGING MARKETS BOND FUND — 2012 SEMIANNUAL REPORT | | | 17 | |
| | |
| Portfolio of Investments (continued) | | |
The following table is a reconciliation of Level 3 assets for which significant unobservable inputs were used to determine fair value.
| | | | | | | | | | | | |
| | | Corporate Bonds &
Notes | | | Foreign
Government
Obligations | | | Total | |
| Balance as of October 31, 2011 | | | $5,323,255 | | | | $5,106,152 | | | | $10,429,407 | |
Accrued discounts/premiums | | | 323 | | | | 87,461 | | | | 87,784 | |
Realized gain (loss) | | | — | | | | 138,027 | | | | 138,027 | |
Change in unrealized appreciation (depreciation)* | | | 60,668 | | | | (55,849 | ) | | | 4,819 | |
Sales | | | — | | | | (424,099 | ) | | | (424,099 | ) |
Purchases | | | — | | | | — | | | | — | |
Transfers into Level 3 | | | — | | | | — | | | | — | |
Transfers out of Level 3 | | | (2,984,700 | ) | | | — | | | | (2,984,700 | ) |
| Balance as of April 30, 2012 | | | $2,399,546 | | | | $4,851,692 | | | | $7,251,238 | |
| * | Change in unrealized appreciation (depreciation) relating to securities held at April 30, 2012 was $4,819, which is comprised of Corporate Bonds & Notes of $60,668 and Foreign Government Obligations of $(55,849). |
Financial assets were transferred from Level 3 to Level 2 as observable market inputs were utilized and management’s determination that there was sufficient, reliable and observable market data to value these assets as of period end.
How to find information about the Fund’s quarterly portfolio holdings
| (i) | The Fund files its complete schedule of portfolio holdings with the Securities and Exchange Commission (SEC) for the first and third quarters of each fiscal year on Form N-Q; |
| (ii) | The Fund’s Forms N-Q are available on the SEC’s website at www.sec.gov; |
| (iii) | The Fund’s Forms N-Q may be reviewed and copied at the SEC’s Public Reference Room in Washington, DC (information on the operations of the Public Reference Room may be obtained by calling 800.SEC.0330); and |
| (iv) | The Fund’s complete schedule of portfolio holdings, as filed on Form N-Q, can be obtained without charge, upon request, by calling 800.345.6611. |
The accompanying Notes to Financial Statements are an integral part of this statement.
| | |
| 18 | | COLUMBIA EMERGING MARKETS BOND FUND — 2012 SEMIANNUAL REPORT |
| | |
| Statement of Assets and Liabilities | | |
April 30, 2012 (Unaudited)
| | | | | |
Assets | | | | | |
Investments, at value* | | | | | |
Unaffiliated issuers (identified cost $491,824,410) | | | $ | 530,759,142 | |
Affiliated issuers (identified cost $34,054,457) | | | | 34,054,457 | |
Investment of cash collateral received for securities on loan | | | | | |
Repurchase agreements (identified cost $20,796,376) | | | | 20,796,376 | |
Total investments (identified cost $546,675,243) | | | | 585,609,975 | |
Foreign currency (identified cost $20,075) | | | | 19,970 | |
Unrealized appreciation on swap contracts | | | | 45,649 | |
Premiums paid on outstanding swap contracts | | | | 93,744 | |
Receivable for: | | | | | |
Capital shares sold | | | | 2,368,404 | |
Dividends | | | | 4,693 | |
Interest | | | | 8,105,534 | |
Reclaims | | | | 237,234 | |
Prepaid expense | | | | 401 | |
Total assets | | | | 596,485,604 | |
Liabilities | | | | | |
Due upon return of securities on loan | | | | 20,796,376 | |
Unrealized depreciation on forward foreign currency exchange contracts | | | | 139,353 | |
Unrealized depreciation on swap contracts | | | | 139,393 | |
Payable for: | | | | | |
Investments purchased on a delayed delivery basis | | | | 3,953,070 | |
Capital shares purchased | | | | 688,516 | |
Foreign capital gains taxes deferred | | | | 506,990 | |
Investment management fees | | | | 24,730 | |
Distribution fees | | | | 8,849 | |
Transfer agent fees | | | | 16,992 | |
Administration fees | | | | 3,241 | |
Plan administration fees | | | | 1 | |
Compensation of board members | | | | 12,439 | |
Other expenses | | | | 32,700 | |
Total liabilities | | | | 26,322,650 | |
Net assets applicable to outstanding capital stock | | | $ | 570,162,954 | |
The accompanying Notes to Financial Statements are an integral part of this statement.
| | | | |
| COLUMBIA EMERGING MARKETS BOND FUND — 2012 SEMIANNUAL REPORT | | | 19 | |
| | |
| Statement of Assets and Liabilities (continued) | | |
April 30, 2012 (Unaudited)
| | | | | |
Represented by | | | | | |
Paid-in capital | | | $ | 530,845,103 | |
Undistributed net investment income | | | | 53,040 | |
Accumulated net realized gain | | | | 1,067,214 | |
Unrealized appreciation (depreciation) on: | | | | | |
Investments | | | | 38,934,732 | |
Foreign currency translations | | | | 2,952 | |
Forward foreign currency exchange contracts | | | | (139,353 | ) |
Swap contracts | | | | (93,744 | ) |
Foreign capital gains tax | | | | (506,990 | ) |
Total — representing net assets applicable to outstanding capital stock | | | $ | 570,162,954 | |
*Value of securities on loan | | | $ | 20,518,348 | |
Net assets applicable to outstanding shares | | | | | |
Class A | | | $ | 211,661,256 | |
Class B | | | $ | 3,096,228 | |
Class C | | | $ | 35,092,314 | |
Class I | | | $ | 176,052,096 | |
Class R | | | $ | 2,798,098 | |
Class R4 | | | $ | 67,274 | |
Class W | | | $ | 63,052,578 | |
Class Z | | | $ | 78,343,110 | |
Shares outstanding | | | | | |
Class A | | | | 17,884,455 | |
Class B | | | | 261,689 | |
Class C | | | | 2,976,691 | |
Class I | | | | 14,872,362 | |
Class R | | | | 236,501 | |
Class R4 | | | | 5,686 | |
Class W | | | | 5,334,276 | |
Class Z | | | | 6,618,890 | |
Net asset value per share | | | | | |
Class A(a) | | | $ | 11.83 | |
Class B | | | $ | 11.83 | |
Class C | | | $ | 11.79 | |
Class I | | | $ | 11.84 | |
Class R | | | $ | 11.83 | |
Class R4 | | | $ | 11.83 | |
Class W | | | $ | 11.82 | |
Class Z | | | $ | 11.84 | |
| (a) | The maximum offering price per share for Class A is $12.42. The offering price is calculated by dividing the net asset value by 1.0 minus the maximum sales charge of 4.75%. |
The accompanying Notes to Financial Statements are an integral part of this statement.
| | |
| 20 | | COLUMBIA EMERGING MARKETS BOND FUND — 2012 SEMIANNUAL REPORT |
Six months ended April 30, 2012 (Unaudited)
| | | | | |
Net investment income | |
Income: | | | | | |
Interest | | | $ | 17,246,564 | |
Dividends from affiliates | | | | 24,981 | |
Income from securities lending — net | | | | 18,290 | |
Foreign taxes withheld | | | | (99,476 | ) |
Total income | | | | 17,190,359 | |
Expenses: | | | | | |
Investment management fees | | | | 1,287,426 | |
Distribution fees | | | | | |
Class A | | | | 218,641 | |
Class B | | | | 14,522 | |
Class C | | | | 133,160 | |
Class R | | | | 3,596 | |
Class W | | | | 81,162 | |
Transfer agent fees | | | | | |
Class A | | | | 181,983 | |
Class B | | | | 4,081 | |
Class C | | | | 24,126 | |
Class R | | | | 1,327 | |
Class R4 | | | | 16 | |
Class W | | | | 80,440 | |
Class Z | | | | 41,815 | |
Administration fees | | | | 169,677 | |
Plan administration fees | | | | | |
Class R4 | | | | 80 | |
Compensation of board members | | | | 8,508 | |
Custodian fees | | | | 17,649 | |
Printing and postage fees | | | | 70,078 | |
Registration fees | | | | 57,623 | |
Professional fees | | | | 25,530 | |
Other | | | | 10,719 | |
Total expenses | | | | 2,432,159 | |
Net investment income | | | | 14,758,200 | |
The accompanying Notes to Financial Statements are an integral part of this statement.
| | | | |
| COLUMBIA EMERGING MARKETS BOND FUND — 2012 SEMIANNUAL REPORT | | | 21 | |
| | |
| Statement of Operations (continued) | | |
| | | | | |
Realized and unrealized gain (loss) — net | |
Net realized gain (loss) on: | | | | | |
Investments | | | $ | 4,378,763 | |
Foreign currency translations | | | | (8,774 | ) |
Forward foreign currency exchange contracts | | | | (87,804 | ) |
Swap contracts | | | | (41,112 | ) |
Net realized gain | | | | 4,241,073 | |
Net change in unrealized appreciation (depreciation) on: | | | | | |
Investments | | | | 16,862,089 | |
Foreign currency translations | | | | 57,177 | |
Forward foreign currency exchange contracts | | | | (139,353 | ) |
Swap contracts | | | | 41,112 | |
Foreign capital gains tax | | | | 196,382 | |
Net change in unrealized appreciation | | | | 17,017,407 | |
Net realized and unrealized gain | | | | 21,258,480 | |
Net increase in net assets resulting from operations | | | $ | 36,016,680 | |
The accompanying Notes to Financial Statements are an integral part of this statement.
| | |
| 22 | | COLUMBIA EMERGING MARKETS BOND FUND — 2012 SEMIANNUAL REPORT |
| | |
| Statement of Changes in Net Assets | | |
| | | | | | | | | | |
| | | Six months ended
April 30, 2012 | | Year ended
October 31, 2011 |
| | | (Unaudited) | | |
Operations | |
Net investment income | | | $ | 14,758,200 | | | | $ | 17,711,105 | |
Net realized gain | | | | 4,241,073 | | | | | 3,212,656 | |
Net change in unrealized appreciation (depreciation) | | | | 17,017,407 | | | | | (7,872,951 | ) |
Net increase in net assets resulting from operations | | | | 36,016,680 | | | | | 13,050,810 | |
Distributions to shareholders from: | | | | | | | | | | |
Net investment income | | | | | | | | | | |
Class A | | | | (5,229,864 | ) | | | | (7,750,174 | ) |
Class B | | | | (73,566 | ) | | | | (196,832 | ) |
Class C | | | | (700,990 | ) | | | | (630,862 | ) |
Class I | | | | (5,166,283 | ) | | | | (5,953,682 | ) |
Class R | | | | (39,527 | ) | | | | — | |
Class R4 | | | | (1,918 | ) | | | | (6,037 | ) |
Class W | | | | (1,886,667 | ) | | | | (4,620,928 | ) |
Class Z | | | | (1,638,441 | ) | | | | (639,172 | ) |
Total distributions to shareholders | | | | (14,737,256 | ) | | | | (19,797,687 | ) |
Increase (decrease) in net assets from share transactions | | | | 113,694,017 | | | | | 205,552,705 | |
Total increase in net assets | | | | 134,973,441 | | | | | 198,805,828 | |
Net assets at beginning of period | | | | 435,189,513 | | | | | 236,383,685 | |
Net assets at end of period | | | $ | 570,162,954 | | | | $ | 435,189,513 | |
Undistributed (excess of distributions over) net investment income | | | $ | 53,040 | | | | $ | 32,096 | |
| | | | | | | | | | | | | | | | | | | | |
| | | Six months ended
April 30, 2012
(Unaudited) | | Year ended
October 31, 2011 |
| | | Shares | | Dollars ($) | | Shares | | Dollars ($) |
Capital stock activity | | | | | | | | | | | | | | | | | | | | |
Class A shares | | | | | | | | | | | | | | | | | | | | |
Subscriptions(a) | | | | 7,704,724 | | | | | 89,411,920 | | | | | 13,938,745 | | | | | 159,706,661 | |
Distributions reinvested | | | | 387,358 | | | | | 4,449,604 | | | | | 571,149 | | | | | 6,453,743 | |
Redemptions | | | | (4,505,563 | ) | | | | (51,340,060 | ) | | | | (6,775,696 | ) | | | | (76,877,295 | ) |
Net increase | | | | 3,586,519 | | | | | 42,521,464 | | | | | 7,734,198 | | | | | 89,283,109 | |
Class B shares | | | | | | | | | | | | | | | | | | | | |
Subscriptions | | | | 35,752 | | | | | 410,718 | | | | | 92,140 | | | | | 1,049,749 | |
Distributions reinvested | | | | 6,068 | | | | | 69,506 | | | | | 16,350 | | | | | 184,551 | |
Redemptions(a) | | | | (31,562 | ) | | | | (358,751 | ) | | | | (162,774 | ) | | | | (1,867,927 | ) |
Net increase (decrease) | | | | 10,258 | | | | | 121,473 | | | | | (54,284 | ) | | | | (633,627 | ) |
Class C shares | | | | | | | | | | | | | | | | | | | | |
Subscriptions | | | | 1,470,557 | | | | | 16,870,020 | | | | | 1,570,385 | | | | | 17,929,446 | |
Distributions reinvested | | | | 44,084 | | | | | 505,224 | | | | | 40,128 | | | | | 451,517 | |
Redemptions | | | | (297,246 | ) | | | | (3,402,523 | ) | | | | (162,089 | ) | | | | (1,812,992 | ) |
Net increase | | | | 1,217,395 | | | | | 13,972,721 | | | | | 1,448,424 | | | | | 16,567,971 | |
The accompanying Notes to Financial Statements are an integral part of this statement.
| | | | |
| COLUMBIA EMERGING MARKETS BOND FUND — 2012 SEMIANNUAL REPORT | | | 23 | |
| | |
| Statement of Changes in Net Assets (continued) | | |
| | | | | | | | | | | | | | | | | | | | |
| | | Six months ended
April 30, 2012
(Unaudited) | | Year ended
October 31, 2011 |
| | | Shares | | Dollars ($) | | Shares | | Dollars ($) |
Class I shares | | | | | | | | | | | | | | | | | | | | |
Subscriptions | | | | 1,927,981 | | | | | 21,857,911 | | | | | 10,033,486 | | | | | 111,973,959 | |
Distributions reinvested | | | | 450,630 | | | | | 5,165,921 | | | | | 527,831 | | | | | 5,952,874 | |
Redemptions | | | | (430,947 | ) | | | | (4,997,829 | ) | | | | (4,320,641 | ) | | | | (49,447,808 | ) |
Net increase | | | | 1,947,664 | | | | | 22,026,003 | | | | | 6,240,676 | | | | | 68,479,025 | |
Class R shares | | | | | | | | | | | | | | | | | | | | |
Subscriptions | | | | 255,373 | | | | | 2,916,805 | | | | | — | | | | | — | |
Distributions reinvested | | | | 908 | | | | | 10,600 | | | | | — | | | | | — | |
Redemptions | | | | (19,780 | ) | | | | (233,258 | ) | | | | — | | | | | — | |
Net increase | | | | 236,501 | | | | | 2,694,147 | | | | | — | | | | | — | |
Class R4 shares | | | | | | | | | | | | | | | | | | | | |
Subscriptions | | | | 67 | | | | | 763 | | | | | 59 | | | | | 692 | |
Distributions reinvested | | | | 138 | | | | | 1,575 | | | | | 468 | | | | | 5,267 | |
Redemptions | | | | (2 | ) | | | | (24 | ) | | | | (5,676 | ) | | | | (63,898 | ) |
Net increase (decrease) | | | | 203 | | | | | 2,314 | | | | | (5,149 | ) | | | | (57,939 | ) |
Class W shares | | | | | | | | | | | | | | | | | | | | |
Subscriptions | | | | 782,046 | | | | | 8,976,289 | | | | | 1,785,831 | | | | | 20,130,576 | |
Distributions reinvested | | | | 165,201 | | | | | 1,886,504 | | | | | 409,579 | | | | | 4,620,561 | |
Redemptions | | | | (1,613,605 | ) | | | | (18,620,063 | ) | | | | (2,537,796 | ) | | | | (28,817,552 | ) |
Net decrease | | | | (666,358 | ) | | | | (7,757,270 | ) | | | | (342,386 | ) | | | | (4,066,415 | ) |
Class Z shares | | | | | | | | | | | | | | | | | | | | |
Subscriptions | | | | 4,226,026 | | | | | 48,974,875 | | | | | 3,410,088 | | | | | 38,870,785 | |
Distributions reinvested | | | | 112,728 | | | | | 1,298,844 | | | | | 45,123 | | | | | 506,557 | |
Redemptions | | | | (883,165 | ) | | | | (10,160,554 | ) | | | | (302,416 | ) | | | | (3,396,761 | ) |
Net increase | | | | 3,455,589 | | | | | 40,113,165 | | | | | 3,152,795 | | | | | 35,980,581 | |
Total net increase | | | | 9,787,771 | | | | | 113,694,017 | | | | | 18,174,274 | | | | | 205,552,705 | |
| (a) | Includes conversions of Class B shares to Class A shares, if any. The line items from the prior year have been combined to conform to the current year presentation. |
The accompanying Notes to Financial Statements are an integral part of this statement.
| | |
| 24 | | COLUMBIA EMERGING MARKETS BOND FUND — 2012 SEMIANNUAL REPORT |
The following tables are intended to help you understand the Fund’s financial performance. Certain information reflects financial results for a single share of a class held for the periods shown. Per share net investment income (loss) amounts are calculated based on average shares outstanding during the period. Total returns assume reinvestment of all dividends and distributions. Total returns do not reflect payment of sales charges, if any, and are not annualized for periods of less than one year.
| | | | | | | | | | | | | | | | | | | | | | | | | | | | | | |
| | | Six months
ended April 30, 2012 | | Year ended Oct. 31, |
| | | | 2011 | | 2010 | | 2009 | | 2008 | | 2007 |
| | | (Unaudited) | | | | | | | | | | |
Class A | | | | | | | | | | | | | | | | | | | | | | | | | | | | | | |
Per share data | | | | | | | | | | | | | | | | | | | | | | | | | | | | | | |
Net asset value, beginning of period | | | | $11.33 | | | | | $11.69 | | | | | $10.35 | | | | | $7.05 | | | | | $10.57 | | | | | $10.16 | |
Income from investment operations: | | | | | | | | | | | | | | | | | | | | | | | | | | | | | | |
Net investment income | | | | 0.34 | | | | | 0.68 | | | | | 0.76 | | | | | 0.53 | | | | | 0.61 | | | | | 0.59 | |
Net realized and unrealized gain (loss) | | | | 0.50 | | | | | (0.29 | ) | | | | 1.32 | | | | | 3.22 | | | | | (3.43 | ) | | | | 0.39 | |
Total from investment operations | | | | 0.84 | | | | | 0.39 | | | | | 2.08 | | | | | 3.75 | | | | | (2.82 | ) | | | | 0.98 | |
Less distributions to shareholders from: | | | | | | | | | | | | | | | | | | | | | | | | | | | | | | |
Net investment income | | | | (0.34 | ) | | | | (0.75 | ) | | | | (0.74 | ) | | | | (0.45 | ) | | | | (0.61 | ) | | | | (0.55 | ) |
Net realized gains | | | | — | | | | | — | | | | | — | | | | | — | | | | | (0.09 | ) | | | | (0.02 | ) |
Total distributions to shareholders | | | | (0.34 | ) | | | | (0.75 | ) | | | | (0.74 | ) | | | | (0.45 | ) | | | | (0.70 | ) | | | | (0.57 | ) |
Net asset value, end of period | | | | $11.83 | | | | | $11.33 | | | | | $11.69 | | | | | $10.35 | | | | | $7.05 | | | | | $10.57 | |
Total return | | | | 7.52% | | | | | 3.58% | | | | | 20.75% | | | | | 54.87% | | | | | (28.44% | ) | | | | 9.94% | |
Ratios to average net assets(a) | | | | | | | | | | | | | | | | | | | | | | | | | | | | | | |
Expenses prior to fees waived or expenses reimbursed | | | | 1.14% | (b) | | | | 1.35% | | | | | 1.37% | | | | | 1.37% | | | | | 1.41% | | | | | 1.33% | |
Net expenses after fees waived or expenses reimbursed(c) | | | | 1.14% | (b) | | | | 1.28% | (d) | | | | 1.31% | | | | | 1.27% | | | | | 1.40% | | | | | 1.33% | |
Net investment income | | | | 5.93% | (b) | | | | 5.91% | (d) | | | | 6.93% | | | | | 5.85% | | | | | 6.31% | | | | | 5.61% | |
Supplemental data | | | | | | | | | | | | | | | | | | | | | | | | | | | | | | |
Net assets, end of period (in thousands) | | | | $211,661 | | | | | $162,047 | | | | | $76,725 | | | | | $32,726 | | | | | $9,671 | | | | | $4,674 | |
Portfolio turnover | | | | 11% | | | | | 24% | | | | | 38% | | | | | 62% | | | | | 82% | | | | | 41% | |
Notes to Financial Highlights
| (a) | In addition to the fees and expenses which the Fund bears directly, the Fund indirectly bears a pro rata share of the fees and expenses of the acquired funds in which it invests. Such indirect expenses are not included in the reported expense ratios. |
| (c) | The Investment Manager and certain of its affiliates agreed to waive/reimburse certain fees and expenses, if applicable. |
| (d) | The benefits derived from expense reductions had an impact of less than 0.01%. |
The accompanying Notes to Financial Statements are an integral part of this statement.
| | | | |
| COLUMBIA EMERGING MARKETS BOND FUND — 2012 SEMIANNUAL REPORT | | | 25 | |
| | |
| Financial Highlights (continued) | | |
| | | | | | | | | | | | | | | | | | | | | | | | | | | | | | |
| | | Six months
ended April 30,
2012 | | Year ended Oct. 31, |
| | | | 2011 | | 2010 | | 2009 | | 2008 | | 2007 |
| | | (Unaudited) | | | | | | | | | | |
Class B | | | | | | | | | | | | | | | | | | | | | | | | | | | | | | |
Per share data | | | | | | | | | | | | | | | | | | | | | | | | | | | | | | |
Net asset value, beginning of period | | | | $11.32 | | | | | $11.67 | | | | | $10.34 | | | | | $7.05 | | | | | $10.55 | | | | | $10.16 | |
Income from investment operations: | | | | | | | | | | | | | | | | | | | | | | | | | | | | | | |
Net investment income | | | | 0.29 | | | | | 0.60 | | | | | 0.67 | | | | | 0.46 | | | | | 0.55 | | | | | 0.52 | |
Net realized and unrealized gain (loss) | | | | 0.51 | | | | | (0.30 | ) | | | | 1.31 | | | | | 3.22 | | | | | (3.42 | ) | | | | 0.37 | |
Total from investment operations | | | | 0.80 | | | | | 0.30 | | | | | 1.98 | | | | | 3.68 | | | | | (2.87 | ) | | | | 0.89 | |
Less distributions to shareholders from: | | | | | | | | | | | | | | | | | | | | | | | | | | | | | | |
Net investment income | | | | (0.29 | ) | | | | (0.65 | ) | | | | (0.65 | ) | | | | (0.39 | ) | | | | (0.54 | ) | | | | (0.48 | ) |
Net realized gains | | | | — | | | | | — | | | | | — | | | | | — | | | | | (0.09 | ) | | | | (0.02 | ) |
Total distributions to shareholders | | | | (0.29 | ) | | | | (0.65 | ) | | | | (0.65 | ) | | | | (0.39 | ) | | | | (0.63 | ) | | | | (0.50 | ) |
Net asset value, end of period | | | | $11.83 | | | | | $11.32 | | | | | $11.67 | | | | | $10.34 | | | | | $7.05 | | | | | $10.55 | |
Total return | | | | 7.18% | | | | | 2.77% | | | | | 19.76% | | | | | 53.60% | | | | | (28.85% | ) | | | | 8.94% | |
Ratios to average net assets(a) | | | | | | | | | | | | | | | | | | | | | | | | | | | | | | |
Expenses prior to fees waived or expenses reimbursed | | | | 1.96% | (b) | | | | 2.22% | | | | | 2.13% | | | | | 2.15% | | | | | 2.19% | | | | | 2.13% | |
Net expenses after fees waived or expenses reimbursed(c) | | | | 1.96% | (b) | | | | 2.04% | (d) | | | | 2.08% | | | | | 2.04% | | | | | 2.17% | | | | | 2.13% | |
Net investment income | | | | 5.12% | (b) | | | | 5.27% | (d) | | | | 6.20% | | | | | 5.28% | | | | | 5.61% | | | | | 4.90% | |
Supplemental data | | | | | | | | | | | | | | | | | | | | | | | | | | | | | | |
Net assets, end of period (in thousands) | | | | $3,096 | | | | | $2,846 | | | | | $3,569 | | | | | $2,420 | | | | | $1,178 | | | | | $1,147 | |
Portfolio turnover | | | | 11% | | | | | 24% | | | | | 38% | | | | | 62% | | | | | 82% | | | | | 41% | |
Notes to Financial Highlights
| (a) | In addition to the fees and expenses which the Fund bears directly, the Fund indirectly bears a pro rata share of the fees and expenses of the acquired funds in which it invests. Such indirect expenses are not included in the reported expense ratios. |
| (c) | The Investment Manager and certain of its affiliates agreed to waive/reimburse certain fees and expenses, if applicable. |
| (d) | The benefits derived from expense reductions had an impact of less than 0.01%. |
The accompanying Notes to Financial Statements are an integral part of this statement.
| | |
| 26 | | COLUMBIA EMERGING MARKETS BOND FUND — 2012 SEMIANNUAL REPORT |
| | | | | | | | | | | | | | | | | | | | | | | | | | | | | | |
| | | Six months
ended April 30, 2012 | | Year ended Oct. 31, |
| | | | 2011 | | 2010 | | 2009 | | 2008 | | 2007 |
| | | (Unaudited) | | | | | | | | | | |
Class C | | | | | | | | | | | | | | | | | | | | | | | | | | | | | | |
Per share data | | | | | | | | | | | | | | | | | | | | | | | | | | | | | | |
Net asset value, beginning of period | | | | $11.30 | | | | | $11.65 | | | | | $10.32 | | | | | $7.04 | | | | | $10.54 | | | | | $10.15 | |
Income from investment operations: | | | | | | | | | | | | | | | | | | | | | | | | | | | | | | |
Net investment income | | | | 0.30 | | | | | 0.58 | | | | | 0.67 | | | | | 0.45 | | | | | 0.55 | | | | | 0.53 | |
Net realized and unrealized gain (loss) | | | | 0.49 | | | | | (0.26 | ) | | | | 1.32 | | | | | 3.22 | | | | | (3.42 | ) | | | | 0.36 | |
Total from investment operations | | | | 0.79 | | | | | 0.32 | | | | | 1.99 | | | | | 3.67 | | | | | (2.87 | ) | | | | 0.89 | |
Less distributions to shareholders from: | | | | | | | | | | | | | | | | | | | | | | | | | | | | | | |
Net investment income | | | | (0.30 | ) | | | | (0.67 | ) | | | | (0.66 | ) | | | | (0.39 | ) | | | | (0.54 | ) | | | | (0.48 | ) |
Net realized gains | | | | — | | | | | — | | | | | — | | | | | — | | | | | (0.09 | ) | | | | (0.02 | ) |
Total distributions to shareholders | | | | (0.30 | ) | | | | (0.67 | ) | | | | (0.66 | ) | | | | (0.39 | ) | | | | (0.63 | ) | | | | (0.50 | ) |
Net asset value, end of period | | | | $11.79 | | | | | $11.30 | | | | | $11.65 | | | | | $10.32 | | | | | $7.04 | | | | | $10.54 | |
Total return | | | | 7.09% | | | | | 2.96% | | | | | 19.87% | | | | | 53.57% | | | | | (28.88% | ) | | | | 8.94% | |
Ratios to average net assets(a) | | | | | | | | | | | | | | | | | | | | | | | | | | | | | | |
Expenses prior to fees waived or expenses reimbursed | | | | 1.86% | (b) | | | | 2.03% | | | | | 2.14% | | | | | 2.13% | | | | | 2.18% | | | | | 2.13% | |
Net expenses after fees waived or expenses reimbursed(c) | | | | 1.86% | (b) | | | | 2.02% | (d) | | | | 2.06% | | | | | 2.03% | | | | | 2.16% | | | | | 2.13% | |
Net investment income | | | | 5.20% | (b) | | | | 5.11% | (d) | | | | 6.14% | | | | | 5.06% | | | | | 5.64% | | | | | 5.00% | |
Supplemental data | | | | | | | | | | | | | | | | | | | | | | | | | | | | | | |
Net assets, end of period (in thousands) | | | | $35,092 | | | | | $19,877 | | | | | $3,622 | | | | | $722 | | | | | $191 | | | | | $169 | |
Portfolio turnover | | | | 11% | | | | | 24% | | | | | 38% | | | | | 62% | | | | | 82% | | | | | 41% | |
Notes to Financial Highlights
| (a) | In addition to the fees and expenses which the Fund bears directly, the Fund indirectly bears a pro rata share of the fees and expenses of the acquired funds in which it invests. Such indirect expenses are not included in the reported expense ratios. |
| (c) | The Investment Manager and certain of its affiliates agreed to waive/reimburse certain fees and expenses, if applicable. |
| (d) | The benefits derived from expense reductions had an impact of less than 0.01%. |
The accompanying Notes to Financial Statements are an integral part of this statement.
| | | | |
| COLUMBIA EMERGING MARKETS BOND FUND — 2012 SEMIANNUAL REPORT | | | 27 | |
| | |
| Financial Highlights (continued) | | |
| | | | | | | | | | | | | | | | | | | | | | | | | | | | | | |
| | | Six months
ended April 30, 2012 | | Year ended Oct. 31, |
| | | | 2011 | | 2010 | | 2009 | | 2008 | | 2007 |
| | | (Unaudited) | | | | | | | | | | |
Class I | | | | | | | | | | | | | | | | | | | | | | | | | | | | | | |
Per share data | | | | | | | | | | | | | | | | | | | | | | | | | | | | | | |
Net asset value, beginning of period | | | | $11.34 | | | | | $11.69 | | | | | $10.35 | | | | | $7.05 | | | | | $10.57 | | | | | $10.16 | |
Income from investment operations: | | | | | | | | | | | | | | | | | | | | | | | | | | | | | | |
Net investment income | | | | 0.37 | | | | | 0.73 | | | | | 0.77 | | | | | 0.57 | | | | | 0.69 | | | | | 0.65 | |
Net realized and unrealized gain (loss) | | | | 0.49 | | | | | (0.27 | ) | | | | 1.35 | | | | | 3.22 | | | | | (3.46 | ) | | | | 0.38 | |
Total from investment operations | | | | 0.86 | | | | | 0.46 | | | | | 2.12 | | | | | 3.79 | | | | | (2.77 | ) | | | | 1.03 | |
Less distributions to shareholders from: | | | | | | | | | | | | | | | | | | | | | | | | | | | | | | |
Net investment income | | | | (0.36 | ) | | | | (0.81 | ) | | | | (0.78 | ) | | | | (0.49 | ) | | | | (0.66 | ) | | | | (0.60 | ) |
Net realized gains | | | | — | | | | | — | | | | | — | | | | | — | | | | | (0.09 | ) | | | | (0.02 | ) |
Total distributions to shareholders | | | | (0.36 | ) | | | | (0.81 | ) | | | | (0.78 | ) | | | | (0.49 | ) | | | | (0.75 | ) | | | | (0.62 | ) |
Net asset value, end of period | | | | $11.84 | | | | | $11.34 | | | | | $11.69 | | | | | $10.35 | | | | | $7.05 | | | | | $10.57 | |
Total return | | | | 7.75% | | | | | 4.18% | | | | | 21.19% | | | | | 55.52% | | | | | (28.08% | ) | | | | 10.38% | |
Ratios to average net assets(a) | | | | | | | | | | | | | | | | | | | | | | | | | | | | | | |
Expenses prior to fees waived or expenses reimbursed | | | | 0.68% | (b) | | | | 0.83% | | | | | 0.92% | | | | | 0.88% | | | | | 0.91% | | | | | 0.93% | |
Net expenses after fees waived or expenses reimbursed(c) | | | | 0.68% | (b) | | | | 0.83% | | | | | 0.92% | | | | | 0.85% | | | | | 0.91% | | | | | 0.93% | |
Net investment income | | | | 6.42% | (b) | | | | 6.43% | | | | | 7.13% | | | | | 6.59% | | | | | 6.89% | | | | | 6.14% | |
Supplemental data | | | | | | | | | | | | | | | | | | | | | | | | | | | | | | |
Net assets, end of period (in thousands) | | | | $176,052 | | | | | $146,569 | | | | | $78,154 | | | | | $106,359 | | | | | $65,282 | | | | | $147,109 | |
Portfolio turnover | | | | 11% | | | | | 24% | | | | | 38% | | | | | 62% | | | | | 82% | | | | | 41% | |
Notes to Financial Highlights
| (a) | In addition to the fees and expenses which the Fund bears directly, the Fund indirectly bears a pro rata share of the fees and expenses of the acquired funds in which it invests. Such indirect expenses are not included in the reported expense ratios. |
| (c) | The Investment Manager and certain of its affiliates agreed to waive/reimburse certain fees and expenses, if applicable. |
The accompanying Notes to Financial Statements are an integral part of this statement.
| | |
| 28 | | COLUMBIA EMERGING MARKETS BOND FUND — 2012 SEMIANNUAL REPORT |
| | | | | |
| | | Six months
ended April 30,
2012(a)
(Unaudited) |
Class R | | | | | |
Per share data | | | | | |
Net asset value, beginning of period | | | | $11.30 | |
Income from investment operations: | | | | | |
Net investment income | | | | 0.28 | |
Net realized and unrealized gain | | | | 0.59 | |
Total from investment operations | | | | 0.87 | |
Less distributions to shareholders
from: | | | | | |
Net investment income | | | | (0.34 | ) |
Total distributions to shareholders | | | | (0.34 | ) |
Net asset value, end of period | | | | $11.83 | |
Total return | | | | 7.80% | |
Ratios to average net assets(b) | | | | | |
Expenses prior to fees waived or
expenses reimbursed | | | | 1.37% | (c) |
Net expenses after fees waived or
expenses reimbursed(b) | | | | 1.37% | (c) |
Net investment income | | | | 5.41% | (c) |
Supplemental data | | | | | |
Net assets, end of period (in thousands) | | | | $2,798 | |
Portfolio turnover | | | | 11% | |
Notes to Financial Highlights
| (a) | For the period from November 16, 2011 (commencement of operations) to April 30, 2012. |
| (b) | In addition to the fees and expenses which the Fund bears directly, the Fund indirectly bears a pro rata share of the fees and expenses of the acquired funds in which it invests. Such indirect expenses are not included in the reported expense ratios. |
The accompanying Notes to Financial Statements are an integral part of this statement.
| | | | |
| COLUMBIA EMERGING MARKETS BOND FUND — 2012 SEMIANNUAL REPORT | | | 29 | |
| | |
| Financial Highlights (continued) | | |
| | | | | | | | | | | | | | | | | | | | | | | | | | | | | | |
| | | Six months
ended April 30, 2012 | | Year ended Oct. 31, |
| | | | 2011 | | 2010 | | 2009 | | 2008 | | 2007 |
| | | (Unaudited) | | | | | | | | | | |
Class R4 | | | | | | | | | | | | | | | | | | | | | | | | | | | | | | |
Per share data | | | | | | | | | | | | | | | | | | | | | | | | | | | | | | |
Net asset value, beginning of period | | | | $11.31 | | | | | $11.68 | | | | | $10.35 | | | | | $7.05 | | | | | $10.56 | | | | | $10.16 | |
Income from investment operations: | | | | | | | | | | | | | | | | | | | | | | | | | | | | | | |
Net investment income | | | | 0.35 | | | | | 0.71 | | | | | 0.72 | | | | | 0.54 | | | | | 0.67 | | | | | 0.60 | |
Net realized and unrealized gain (loss) | | | | 0.51 | | | | | (0.31 | ) | | | | 1.35 | | | | | 3.23 | | | | | (3.43 | ) | | | | 0.39 | |
Total from investment operations | | | | 0.86 | | | | | 0.40 | | | | | 2.07 | | | | | 3.77 | | | | | (2.76 | ) | | | | 0.99 | |
Less distributions to shareholders from: | | | | | | | | | | | | | | | | | | | | | | | | | | | | | | |
Net investment income | | | | (0.34 | ) | | | | (0.77 | ) | | | | (0.74 | ) | | | | (0.47 | ) | | | | (0.66 | ) | | | | (0.57 | ) |
Net realized gains | | | | — | | | | | — | | | | | — | | | | | — | | | | | (0.09 | ) | | | | (0.02 | ) |
Total distributions to shareholders | | | | (0.34 | ) | | | | (0.77 | ) | | | | (0.74 | ) | | | | (0.47 | ) | | | | (0.75 | ) | | | | (0.59 | ) |
Net asset value, end of period | | | | $11.83 | | | | | $11.31 | | | | | $11.68 | | | | | $10.35 | | | | | $7.05 | | | | | $10.56 | |
Total return | | | | 7.78% | | | | | 3.65% | | | | | 20.75% | | | | | 55.14% | | | | | (27.98% | ) | | | | 9.97% | |
Ratios to average net assets(a) | | | | | | | | | | | | | | | | | | | | | | | | | | | | | | |
Expenses prior to fees waived or expenses reimbursed | | | | 0.98% | (b) | | | | 1.17% | | | | | 1.27% | | | | | 1.18% | | | | | 1.22% | | | | | 1.24% | |
Net expenses after fees waived or expenses reimbursed(c) | | | | 0.98% | (b) | | | | 1.13% | | | | | 1.22% | | | | | 1.11% | | | | | 0.97% | | | | | 1.24% | |
Net investment income | | | | 6.12% | (b) | | | | 6.18% | | | | | 6.52% | | | | | 6.31% | | | | | 6.82% | | | | | 5.75% | |
Supplemental data | | | | | | | | | | | | | | | | | | | | | | | | | | | | | | |
Net assets, end of period (in thousands) | | | | $67 | | | | | $62 | | | | | $124 | | | | | $23 | | | | | $15 | | | | | $16 | |
Portfolio turnover | | | | 11% | | | | | 24% | | | | | 38% | | | | | 62% | | | | | 82% | | | | | 41% | |
Notes to Financial Highlights
| (a) | In addition to the fees and expenses which the Fund bears directly, the Fund indirectly bears a pro rata share of the fees and expenses of the acquired funds in which it invests. Such indirect expenses are not included in the reported expense ratios. |
| (c) | The Investment Manager and certain of its affiliates agreed to waive/reimburse certain fees and expenses, if applicable. |
The accompanying Notes to Financial Statements are an integral part of this statement.
| | |
| 30 | | COLUMBIA EMERGING MARKETS BOND FUND — 2012 SEMIANNUAL REPORT |
| | | | | | | | | | | | | | | | | | | | | | | | | | | | | | |
| | | Six months
ended April 30, 2012 | | Year ended Oct. 31, |
| | | | 2011 | | 2010 | | 2009 | | 2008 | | 2007(a) |
| | | (Unaudited) | | | | | | | | | | |
Class W | | | | | | | | | | | | | | | | | | | | | | | | | | | | | | |
Per share data | | | | | | | | | | | | | | | | | | | | | | | | | | | | | | |
Net asset value, beginning of period | | | | $11.31 | | | | | $11.68 | | | | | $10.34 | | | | | $7.05 | | | | | $10.55 | | | | | $10.24 | |
Income from investment operations: | | | | | | | | | | | | | | | | | | | | | | | | | | | | | | |
Net investment income | | | | 0.34 | | | | | 0.68 | | | | | 0.75 | | | | | 0.53 | | | | | 0.56 | | | | | 0.57 | |
Net realized and unrealized gain (loss) | | | | 0.50 | | | | | (0.30 | ) | | | | 1.32 | | | | | 3.21 | | | | | (3.36 | ) | | | | 0.28 | |
Total from investment operations | | | | 0.84 | | | | | 0.38 | | | | | 2.07 | | | | | 3.74 | | | | | (2.80 | ) | | | | 0.85 | |
Less distributions to shareholders from: | | | | | | | | | | | | | | | | | | | | | | | | | | | | | | |
Net investment income | | | | (0.33 | ) | | | | (0.75 | ) | | | | (0.73 | ) | | | | (0.45 | ) | | | | (0.61 | ) | | | | (0.52 | ) |
Net realized gains | | | | — | | | | | — | | | | | — | | | | | — | | | | | (0.09 | ) | | | | (0.02 | ) |
Total distributions to shareholders | | | | (0.33 | ) | | | | (0.75 | ) | | | | (0.73 | ) | | | | (0.45 | ) | | | | (0.70 | ) | | | | (0.54 | ) |
Net asset value, end of period | | | | $11.82 | | | | | $11.31 | | | | | $11.68 | | | | | $10.34 | | | | | $7.05 | | | | | $10.55 | |
Total return | | | | 7.60% | | | | | 3.47% | | | | | 20.68% | | | | | 54.69% | | | | | (28.29% | ) | | | | 8.49% | |
Ratios to average net assets(b) | | | | | | | | | | | | | | | | | | | | | | | | | | | | | | |
Expenses prior to fees waived or expenses reimbursed | | | | 1.17% | (c) | | | | 1.45% | | | | | 1.37% | | | | | 1.33% | | | | | 1.35% | | | | | 1.33% | (c) |
Net expenses after fees waived or expenses reimbursed(d) | | | | 1.17% | (c) | | | | 1.30% | (e) | | | | 1.37% | | | | | 1.30% | | | | | 1.35% | | | | | 1.33% | (c) |
Net investment income | | | | 5.94% | (c) | | | | 5.96% | (e) | | | | 6.93% | | | | | 6.18% | | | | | 6.08% | | | | | 5.86% | (c) |
Supplemental data | | | | | | | | | | | | | | | | | | | | | | | | | | | | | | |
Net assets, end of period (in thousands) | | | | $63,053 | | | | | $67,886 | | | | | $74,067 | | | | | $117,037 | | | | | $104,386 | | | | | $37,921 | |
Portfolio turnover | | | | 11% | | | | | 24% | | | | | 38% | | | | | 62% | | | | | 82% | | | | | 41% | |
Notes to Financial Highlights
| (a) | For the period from December 1, 2006 (commencement of operations) to October 31, 2007. |
| (b) | In addition to the fees and expenses which the Fund bears directly, the Fund indirectly bears a pro rata share of the fees and expenses of the acquired funds in which it invests. Such indirect expenses are not included in the reported expense ratios. |
| (d) | The Investment Manager and certain of its affiliates agreed to waive/reimburse certain fees and expenses, if applicable. |
| (e) | The benefits derived from expense reductions had an impact of less than 0.01%. |
The accompanying Notes to Financial Statements are an integral part of this statement.
| | | | |
| COLUMBIA EMERGING MARKETS BOND FUND — 2012 SEMIANNUAL REPORT | | | 31 | |
| | |
| Financial Highlights (continued) | | |
| | | | | | | | | | | | | | | |
| | | Six months
ended April 30, 2012 (Unaudited) | | Year ended Oct. 31, |
| | | | 2011 | | 2010(a) |
| | | | | | |
Class Z | | | | | | | | | | | | | | | |
Per share data | | | | | | | | | | | | | | | |
Net asset value, beginning of period | | | | $11.35 | | | | | $11.69 | | | | | $11.47 | |
Income from investment operations: | | | | | | | | | | | | | | | |
Net investment income | | | | 0.35 | | | | | 0.68 | | | | | 0.07 | |
Net realized and unrealized gain (loss) | | | | 0.50 | | | | | (0.22 | ) | | | | 0.24 | |
Total from investment operations | | | | 0.85 | | | | | 0.46 | | | | | 0.31 | |
Less distributions to shareholders
from: | | | | | | | | | | | | | | | |
Net investment income | | | | (0.36 | ) | | | | (0.80 | ) | | | | (0.09 | ) |
Total distributions to shareholders | | | | (0.36 | ) | | | | (0.80 | ) | | | | (0.09 | ) |
Net asset value, end of period | | | | $11.84 | | | | | $11.35 | | | | | $11.69 | |
Total return | | | | 7.60% | | | | | 4.16% | | | | | 2.68% | |
Ratios to average net assets(b) | | | | | | | | | | | | | | | |
Expenses prior to fees waived or
expenses reimbursed | | | | 0.85% | (c) | | | | 0.84% | | | | | 1.32% | (c) |
Net expenses after fees waived or
expenses reimbursed(d) | | | | 0.85% | (c) | | | | 0.84% | (e) | | | | 0.97% | (c) |
Net investment income | | | | 6.19% | (c) | | | | 6.03% | (e) | | | | 7.36% | (c) |
Supplemental data | | | | | | | | | | | | | | | |
Net assets, end of period (in thousands) | | | | $78,343 | | | | | $35,902 | | | | | $123 | |
Portfolio turnover | | | | 11% | | | | | 24% | | | | | 38% | |
Notes to Financial Highlights
| (a) | For the period from September 27, 2010 (commencement of operations) to October 31, 2010. |
| (b) | In addition to the fees and expenses which the Fund bears directly, the Fund indirectly bears a pro rata share of the fees and expenses of the acquired funds in which it invests. Such indirect expenses are not included in the reported expense ratios. |
| (d) | The Investment Manager and certain of its affiliates agreed to waive/reimburse certain fees and expenses, if applicable. |
| (e) | The benefits derived from expense reductions had an impact of less than 0.01%. |
The accompanying Notes to Financial Statements are an integral part of this statement.
| | |
| 32 | | COLUMBIA EMERGING MARKETS BOND FUND — 2012 SEMIANNUAL REPORT |
| | |
| Notes to Financial Statements | | |
April 30, 2012 (Unaudited)
Columbia Emerging Markets Bond Fund (the Fund), a series of Columbia Funds Series Trust II (the Trust), is a non-diversified fund. The Trust is registered under the Investment Company Act of 1940, as amended (the 1940 Act), as an open-end management investment company organized as a Massachusetts business trust.
Fund Shares
The Trust may issue an unlimited number of shares (without par value). The Fund offers Class A, Class B, Class C, Class I, Class R, Class R4, Class W and Class Z shares. All share classes have identical voting, dividend and liquidation rights. Each share class has its own expense structure and sales charges, as applicable.
Class A shares are subject to a maximum front-end sales charge of 4.75% based on the initial investment amount. Class A shares purchased without an initial sales charge in accounts aggregating $1 million to $50 million at the time of purchase are subject to a contingent deferred sales charge (CDSC) if the shares are sold within 18 months of purchase, charged as follows: 1.00% CDSC if redeemed within 12 months of purchase, and 0.50% CDSC if redeemed more than 12, but less than 18, months after purchase.
Class B shares may be subject to a maximum CDSC of 5.00% based upon the holding period after purchase. Class B shares will generally convert to Class A shares eight years after purchase. The Fund no longer accepts investments by new or existing investors in the Fund’s Class B shares, except in connection with the reinvestment of any dividend and/or capital gain distributions in Class B shares of the Fund and exchanges by existing Class B shareholders of certain other funds within the Columbia Family of Funds.
Class C shares are subject to a 1.00% CDSC on shares redeemed within one year of purchase.
Class I shares are not subject to sales charges and are only available to the Columbia Family of Funds.
Class R shares are not subject to sales charges and are only available to qualifying institutional investors. Class R shares commenced operations on November 16, 2011.
Class R4 shares are not subject to sales charges; however, this share class is closed to new investors.
| | | | |
| COLUMBIA EMERGING MARKETS BOND FUND — 2012 SEMIANNUAL REPORT | | | 33 | |
| | |
| Notes to Financial Statements (continued) | | |
Class W shares are not subject to sales charges and are only available to investors purchasing through authorized investment programs managed by investment professionals, including discretionary managed account programs.
Class Z shares are not subject to sales charges, and are only available to certain investors, as described in the Fund’s prospectus.
| Note 2. Summary | of Significant Accounting Policies |
Use of Estimates
The preparation of financial statements in accordance with U.S. generally accepted accounting principles (GAAP) requires management to make certain estimates and assumptions that affect the reported amounts of assets and liabilities, the disclosure of contingent assets and liabilities at the date of the financial statements and the reported amounts of revenue and expenses during the reporting period. Actual results could differ from those estimates.
The following is a summary of significant accounting policies consistently followed by the Fund in the preparation of its financial statements.
Security Valuation
All equity securities are valued at the close of business of the New York Stock Exchange (NYSE). Equity securities are valued at the last quoted sales price on the principal exchange or market on which they trade, except for securities traded on the NASDAQ Stock Market, which are valued at the NASDAQ official close price. Unlisted securities or listed securities for which there were no sales during the day are valued at the mean of the latest quoted bid and asked prices on such exchanges or markets.
Debt securities generally are valued by pricing services approved by the Board of Trustees (the Board) based upon market transactions for normal, institutional-size trading units of similar securities. The services may use various pricing techniques which take into account appropriate factors such as yield, quality, coupon rate, maturity, type of issue, trading characteristics and other data, as well as broker quotes. Debt securities for which quotations are readily available may also be valued based upon an over-the-counter or exchange bid quotation.
Foreign securities are valued based on quotations from the principal market in which such securities are normally traded. If any foreign share prices are not readily available as a result of limited share activity the securities are valued at the mean of the latest quoted bid and asked prices on such exchanges or markets. Foreign currency exchange rates are generally determined at 4:00 p.m. Eastern (U.S.) time. However, many securities markets and exchanges outside the U.S. close prior to the close of the NYSE; therefore, the closing prices for securities in
| | |
| 34 | | COLUMBIA EMERGING MARKETS BOND FUND — 2012 SEMIANNUAL REPORT |
such markets or on such exchanges may not fully reflect events that occur after such close but before the close of the NYSE. In those situations, foreign securities will be fair valued pursuant to the policy adopted by the Board, including utilizing a third party pricing service to determine these fair values. The third party pricing service takes into account multiple factors, including, but not limited to, movements in the U.S. securities markets, certain depositary receipts, futures contracts and foreign exchange rates that have occurred subsequent to the close of the foreign exchange, to determine a good faith estimate that reasonably reflects the current market conditions as of the close of the NYSE. The fair value of a security is likely to be different from the quoted or published price, if available.
Investments in other open-end investment companies, including money market funds, are valued at net asset value.
Short-term securities purchased within 60 days to maturity are valued at amortized cost, which approximates market value. The value of short-term securities originally purchased with maturities greater than 60 days is determined based on an amortized value to par upon reaching 60 days to maturity. Short-term securities maturing in more than 60 days from the valuation date are valued at the market price or approximate market value based on current interest rates.
Forward foreign currency exchange contracts are marked-to-market based upon foreign currency exchange rates provided by a pricing service.
Swap transactions are valued through an independent pricing service or broker, or if neither is available, through an internal model based upon observable inputs.
Investments for which market quotations are not readily available, or that have quotations which management believes are not reliable, are valued at fair value as determined in good faith under consistently applied procedures established by and under the general supervision of the Board. If a security or class of securities (such as foreign securities) is valued at fair value, such value is likely to be different from the last quoted market price for the security. The determination of fair value often requires significant judgment. To determine fair value, management may use assumptions including but not limited to future cash flows and estimated risk premiums. Multiple inputs from various sources may be used to determine value.
Foreign Currency Transactions and Translation
The values of all assets and liabilities denominated in foreign currencies are translated into U.S. dollars at that day’s exchange rates. Net realized and unrealized gains (losses) on foreign currency transactions and translations
| | | | |
| COLUMBIA EMERGING MARKETS BOND FUND — 2012 SEMIANNUAL REPORT | | | 35 | |
| | |
| Notes to Financial Statements (continued) | | |
include gains (losses) arising from the fluctuation in exchange rates between trade and settlement dates on securities transactions, gains (losses) arising from the disposition of foreign currency and currency gains (losses) between the accrual and payment dates on dividends, interest income and foreign withholding taxes.
For financial statement purposes, the Fund does not distinguish that portion of gains (losses) on investments which is due to changes in foreign exchange rates from that which is due to changes in market prices of the investments. Such fluctuations are included with the net realized and unrealized gains (losses) on investments in the Statement of Operations.
Derivative Instruments
The Fund invests in certain derivative instruments as detailed below to meet its investment objectives. Derivatives are instruments whose values depend on, or are derived from, in whole or in part, the value of one or more other assets, such as securities, currencies, commodities or indices. Derivative instruments may be used to maintain cash reserves while maintaining exposure to certain other assets, to offset anticipated declines in values of investments, to facilitate trading, to reduce transaction costs and to pursue higher investment returns. The Fund may also use derivative instruments to mitigate certain investment risks, such as foreign currency exchange rate risk, interest rate risk and credit risk. Derivatives may involve various risks, including the potential inability of the counterparty to fulfill its obligation under the terms of the contract, the potential for an illiquid secondary market and the potential for market movements which may expose the Fund to gains or losses in excess of the amount shown in the Statement of Assets and Liabilities.
The Fund and any counterparty are required to maintain an agreement that requires the Fund and that counterparty to monitor (on a daily basis) the net fair value of all derivatives entered into pursuant to the agreement between the Fund and such counterparty. If the net fair value of such derivatives between the Fund and that counterparty exceeds a certain threshold (as defined in the agreement), the Fund or the counterparty (as the case may be) is required to post cash and/or securities as collateral. Fair values of derivatives presented in the financial statements are not netted with the fair value of other derivatives or with any collateral amounts posted by the Fund or any counterparty.
Forward Foreign Currency Exchange Contracts
Forward foreign currency exchange contracts are agreements between two parties to buy and sell a currency at a set price on a future date. These contracts are intended to be used to minimize the exposure to foreign exchange rate fluctuations during the period between the trade and settlement dates of the contract. The Fund
| | |
| 36 | | COLUMBIA EMERGING MARKETS BOND FUND — 2012 SEMIANNUAL REPORT |
utilized forward foreign currency exchange contracts to shift investment exposure from one currency to another.
The values of forward foreign currency exchange contracts fluctuate with changes in foreign currency exchange rates. The Fund will record a realized gain or loss when the forward foreign currency exchange contract is closed.
The use of forward foreign currency exchange contracts does not eliminate fluctuations in the prices of the Fund’s portfolio securities. The risks of forward foreign currency exchange contracts include movement in the values of the foreign currencies relative to the U.S. dollar (or other foreign currencies) and the possibility that counterparties will not complete their contractual obligations, which may be in excess of the amount reflected, if any, in the Statement of Assets and Liabilities.
Credit Default Swap Contracts
Credit default swap contracts are agreements in which one party pays fixed periodic payments to a counterparty in consideration for a guarantee from the counterparty to make a specific payment should a specified negative credit event(s) take place. The Fund entered into credit default swap contracts to increase or decrease its credit exposure to an index.
As the purchaser of a credit default swap contract, the Fund purchases protection by paying a periodic interest rate on the notional amount to the counterparty. The interest amount is accrued daily as a component of unrealized appreciation (depreciation) and is recorded as a realized loss upon payment. If a credit event as specified in the contract occurs, the Fund may have the option either to deliver the reference obligation to the seller in exchange for a cash payment of its par amount, or to receive a net cash settlement equal to the par amount less an agreed-upon value of the reference obligation as of the date of the credit event. The difference between the value of the obligation or cash delivered and the notional amount received will be recorded as a realized gain (loss).
As the seller of a credit default swap contract, the Fund sells protection to a buyer and will generally receive a periodic interest rate on the notional amount.
The interest amount is accrued daily as a component of unrealized appreciation (depreciation) and is recorded as a realized gain upon receipt of the payment. If a credit event as specified in the contract occurs, the Fund may either be required to accept the reference obligation from the buyer in exchange for a cash payment of its notional amount, or to pay the buyer a net cash settlement equal to the notional amount less an agreed-upon value of the reference obligation as of the date of the credit event. The difference between the value of the obligation or cash received and the notional amount paid will be recorded as a realized gain (loss). The maximum potential amount of undiscounted future payments the
| | | | |
| COLUMBIA EMERGING MARKETS BOND FUND — 2012 SEMIANNUAL REPORT | | | 37 | |
| | |
| Notes to Financial Statements (continued) | | |
Fund could be required to make as the seller of protection under a credit default swap contract is equal to the notional amount of the reference obligation. Notional amounts of all credit default swap contracts outstanding for which the Fund is the seller of protection, if any, are disclosed in the Credit Default Swap Contracts Outstanding schedule following the Portfolio of Investments. These potential amounts may be partially offset by any recovery values of the respective reference obligations or premiums received upon entering into the agreement.
As a protection seller, the Fund bears the risk of loss from the credit events specified in the contract. Although specified events are contract specific, credit events are generally defined as bankruptcy, failure to pay, restructuring, obligation acceleration, obligation default, or repudiation/moratorium. For credit default swap contracts on credit indices, quoted market prices and resulting market values serve as an indicator of the current status of the payment/performance risk. Increasing market values, in absolute terms when compared to the notional amount of the swap, represent a deterioration of the reference entity’s credit soundness and a greater likelihood or risk of default or other credit event occurring as defined under the terms of the contract. Market values for credit default swap contracts in which the Fund is the seller of protection, if any, are disclosed in the Credit Default Swap Contracts Outstanding schedule following the Portfolio of Investments.
The notional amounts and market values of credit default swap contracts are not recorded in the financial statements. Any premium paid or received by the Fund upon entering into a credit default swap contract is recorded as an asset or liability, respectively, and amortized daily as a component of realized gain (loss) in the Statement of Operations. Credit default swap contracts are valued daily, and the change in value is recorded as unrealized appreciation (depreciation) until the termination of the swap, at which time a realized gain (loss) is recorded.
Credit default swap contracts can involve greater risks than if a fund had invested in the reference obligation directly since, in addition to general market risks, credit default swaps are subject to counterparty credit risk, leverage risk, hedging risk, correlation risk and liquidity risk. The Fund will enter into credit default swap transactions only with counterparties that meet certain standards of creditworthiness.
Effects of Derivative Transactions in the Financial Statements
The following tables are intended to provide additional information about the effect of derivatives on the financial statements of the Fund, including: the fair value of derivatives by risk category and the location of those fair values in the Statement of Assets and Liabilities; the impact of derivative transactions on the
| | |
| 38 | | COLUMBIA EMERGING MARKETS BOND FUND — 2012 SEMIANNUAL REPORT |
Fund’s operations over the period including realized gains or losses and unrealized gains or losses. The derivative schedules following the Portfolio of Investments present additional information regarding derivative instruments outstanding at the end of the period, if any.
Fair Values of Derivative Instruments at April 30, 2012
| | | | | | | | | | | | |
| | | Asset derivatives | | | Liability derivatives | |
Risk Exposure
Category | | Statement of Assets
and Liabilities
Location | | Fair Value | | | Statement of Assets
and Liabilities
Location | | Fair Value | |
Credit contracts | | Unrealized appreciation on swap contracts | | $ | 45,649 | | | Unrealized depreciation on swap contracts | | $ | 139,393 | |
| Foreign exchange contracts | | Unrealized appreciation on forward foreign currency exchange contracts | | | — | | | Unrealized depreciation on forward foreign currency exchange contracts | | | 139,353 | |
Total | | | | $ | 45,649 | | | | | $ | 278,746 | |
Effect of Derivative Instruments in the Statement of Operations for the Year Ended April 30, 2012
| | | | | | | | | | | | |
| Amount of Realized Gain (Loss) on Derivatives Recognized in Income | |
| Risk Exposure Category | | Forward
Foreign Currency
Exchange Contracts | | | Swap
Contracts | | | Total | |
Credit contracts | | $ | — | | | $ | (41,112 | ) | | $ | (41,112 | ) |
Foreign exchange contracts | | | (87,804 | ) | | | — | | | $ | (87,804 | ) |
Total | | $ | (87,804 | ) | | $ | (41,112 | ) | | $ | (128,916 | ) |
| | | | | | | | | | | | |
|
| Change in Unrealized Appreciation (Depreciation) on Derivatives Recognized in Income | |
| Risk Exposure Category | | Forward
Foreign Currency
Exchange Contracts | | | Swap
Contracts | | | Total | |
Credit contracts | | $ | — | | | $ | 41,112 | | | $ | 41,112 | |
Foreign exchange contracts | | | (139,353 | ) | | | — | | | $ | (139,353 | ) |
Total | | $ | (139,353 | ) | | $ | 41,112 | | | $ | (98,241 | ) |
Volume of Derivative Instruments for the Year Ended April 30, 2012
| | | | |
| | | Contracts Opened | |
Forward Foreign Currency Exchange Contracts | | | 2 | |
Swap Contracts | | | — | |
| | | | |
| COLUMBIA EMERGING MARKETS BOND FUND — 2012 SEMIANNUAL REPORT | | | 39 | |
| | |
| Notes to Financial Statements (continued) | | |
| | | | |
| | | Aggregate
Notional Opened | |
Credit Default Swap Contracts — Buy Protection | | $ | — | |
Credit Default Swap Contracts — Sell Protection | | $ | — | |
Repurchase Agreements
The Fund may engage in repurchase agreement transactions with institutions that management has determined are creditworthy. The Fund, through the custodian, receives delivery of the underlying securities collateralizing a repurchase agreement. Management is responsible for determining that the collateral is at least equal, at all times, to the value of the repurchase obligation including interest. A repurchase agreement transaction involves certain risks in the event of default or insolvency of the counterparty. These risks include possible delays in or restrictions on a Fund’s ability to dispose of the underlying securities and a possible decline in the value of the underlying securities during the period while the Fund seeks to assert its rights.
Delayed Delivery Securities and Forward Sale Commitments
The Fund may trade securities on other than normal settlement terms, including securities purchased or sold on a “when-issued” basis. This may increase the risk if the other party to the transaction fails to deliver and causes the Fund to subsequently invest at less advantageous prices. The Fund designates cash or liquid securities in an amount equal to the delayed delivery commitment.
The Fund may enter into forward sale commitments to hedge its portfolio positions or to sell mortgage-backed securities it owns under delayed delivery arrangements. Proceeds of forward sale commitments are not received until the contractual settlement date. While a forward sale commitment is outstanding, equivalent deliverable securities or an offsetting forward purchase commitment deliverable on or before the sale commitment date, are used to satisfy the commitment.
Unsettled forward sale commitments are valued at the current market value of the underlying securities, generally according to the procedures described under “Security Valuation” above. The forward sale commitment is “marked-to-market” daily and the change in market value is recorded by the Fund as an unrealized gain or loss. If the forward sale commitment is closed through the acquisition of an offsetting purchase commitment, the Fund realizes a gain or loss. If the Fund delivers securities under the commitment, the Fund realizes a gain or a loss from the sale of the securities based upon the market price established at the date the commitment was entered into.
| | |
| 40 | | COLUMBIA EMERGING MARKETS BOND FUND — 2012 SEMIANNUAL REPORT |
Security Transactions
Security transactions are accounted for on the trade date. Cost is determined and gains (losses) are based upon the specific identification method for both financial statement and federal income tax purposes.
Income Recognition
Interest income is recorded on the accrual basis. Market premium and discount are amortized and accreted, respectively, on all debt securities, unless otherwise noted. Original issue discount is accreted to interest income over the life of the security with a corresponding increase in the cost basis, if any. For convertible securities, premiums attributable to the conversion feature are not amortized.
Dividend income is recorded on the ex-dividend date.
Expenses
General expenses of the Trust are allocated to the Fund and other funds of the Trust based upon relative net assets or other expense allocation methodologies determined by the nature of the expense. Expenses directly attributable to the Fund are charged to the Fund. Expenses directly attributable to a specific class of shares are charged to that share class.
Determination of Class Net Asset Value
All income, expenses (other than class-specific expenses, which are charged to that share class, as shown in the Statement of Operations) and realized and unrealized gains (losses) are allocated to each class of the Fund on a daily basis, based on the relative net assets of each class, for purposes of determining the net asset value of each class.
Federal Income Tax Status
The Fund intends to qualify each year as a regulated investment company under Subchapter M of the Internal Revenue Code, as amended, and will distribute substantially all of its taxable income (including net short-term capital gains), if any, for its tax year, and as such will not be subject to federal income taxes. In addition, the Fund intends to distribute in each calendar year substantially all of its net investment income, capital gains and certain other amounts, if any, such that the Fund should not be subject to federal excise tax. Therefore, no federal income or excise tax provision is recorded.
Foreign Taxes
The Fund may be subject to foreign taxes on income, gains on investments or currency repatriation, a portion of which may be recoverable. The Fund will accrue such taxes and recoveries, as applicable, based upon its current interpretation of tax rules and regulations that exist in the markets in which it invests.
| | | | |
| COLUMBIA EMERGING MARKETS BOND FUND — 2012 SEMIANNUAL REPORT | | | 41 | |
| | |
| Notes to Financial Statements (continued) | | |
Realized gains in certain countries may be subject to foreign taxes at the Fund level, based on statutory rates. The Fund accrues for such foreign taxes on net realized and unrealized gains at the appropriate rate for each jurisdiction, as applicable.
Distributions to Shareholders
Distributions from net investment income are declared and paid monthly. Net realized capital gains, if any, are distributed along with the income dividend.
Income distributions and capital gain distributions are determined in accordance with federal income tax regulations which may differ from GAAP.
Guarantees and Indemnifications
Under the Trust’s organizational documents and, in some cases, by contract, its officers and trustees are indemnified against certain liabilities arising out of the performance of their duties to the Trust or its funds. In addition, certain of the Fund’s contracts with its service providers contain general indemnification clauses. The Fund’s maximum exposure under these arrangements is unknown since the amount of any future claims that may be made against the Fund cannot be determined, and the Fund has no historical basis for predicting the likelihood of any such claims.
Recent Accounting Pronouncement
Fair Value Measurements and Disclosures
In May 2011, the Financial Accounting Standards Board (FASB) issued ASU No. 2011-04 modifying Topic 820, Fair Value Measurements and Disclosures. At the same time, the International Accounting Standards Board (IASB) issued International Financial Reporting Standard 13, Fair Value Measurement. The objective of the FASB and IASB is convergence of their guidance on fair value measurements and disclosures.
Specifically, ASU No. 2011-04 requires reporting entities to disclose i) the amounts of any transfers between Level 1 and Level 2, and the reasons for the transfers, ii) for Level 3 fair value measurements, a) quantitative information about significant unobservable inputs used, b) a description of the valuation processes used by the reporting entity and c) a narrative description of the sensitivity of the fair value measurement to changes in unobservable inputs if a change in those inputs might result in a significantly higher or lower fair value measurement. The effective date of ASU No. 2011-04 is for interim and annual periods beginning after December 15, 2011. At this time, management is evaluating the implications of this guidance and the impact it will have on the financial statement amounts and footnote disclosures, if any.
| | |
| 42 | | COLUMBIA EMERGING MARKETS BOND FUND — 2012 SEMIANNUAL REPORT |
| Note 3. Fees | and Compensation Paid to Affiliates |
Investment Management Fees
Under an Investment Management Services Agreement, Columbia Management Investment Advisers, LLC (the Investment Manager), a wholly-owned subsidiary of Ameriprise Financial, Inc. (Ameriprise Financial), determines which securities will be purchased, held or sold. The management fee is an annual fee that is equal to a percentage of the Fund’s average daily net assets that declines from 0.530% to 0.353% as the Fund’s net assets increase. The annualized effective management fee rate for the six months ended April 30, 2012 was 0.53% of the Fund’s average daily net assets.
Administration Fees
Under an Administrative Services Agreement, the Investment Manager serves as the Fund Administrator. The Fund pays the Fund Administrator an annual fee for administration and accounting services equal to a percentage of the Fund’s average daily net assets that declines from 0.07% to 0.04% as the Fund’s net assets increase. The annualized effective administration fee rate for the six months ended April 30, 2012 was 0.07% of the Fund’s average daily net assets.
Other Expenses
Other expenses are for, among other things, certain expenses of the Fund or the Board, including: Fund boardroom and office expense, employee compensation, employee health and retirement benefits, and certain other expenses. Payment of these Fund and Board expenses is facilitated by a company providing limited administrative services to the Fund and the Board. For the six months ended April 30, 2012, other expenses paid to this company were $1,544.
Compensation of Board Members
Board members are compensated for their services to the Fund as disclosed in the Statement of Operations. Under a Deferred Compensation Plan (the Plan), the Board members who are not “interested persons” of the Fund, as defined under the 1940 Act, may elect to defer payment of up to 100% of their compensation. Deferred amounts are treated as though equivalent dollar amounts had been invested in shares of certain funds managed by the Investment Manager. The Fund’s liability for these amounts is adjusted for market value changes and remains in the Fund until distributed in accordance with the Plan.
Transfer Agent Fees
Under a Transfer and Dividend Disbursing Agent Agreement, Columbia Management Investment Services Corp. (the Transfer Agent), an affiliate of the Investment Manager and a wholly-owned subsidiary of Ameriprise Financial, is responsible for providing transfer agency services to the Fund. The Transfer Agent has contracted with Boston Financial Data Services (BFDS) to serve as sub-transfer agent.
| | | | |
| COLUMBIA EMERGING MARKETS BOND FUND — 2012 SEMIANNUAL REPORT | | | 43 | |
| | |
| Notes to Financial Statements (continued) | | |
The Transfer Agent receives monthly account-based service fees based on the number of open accounts and is reimbursed by the Fund for the fees and expenses the Transfer Agent pays to financial intermediaries that maintain omnibus accounts with the Fund that is a percentage of the average aggregate value of the Fund’s shares maintained in each such omnibus account (other than omnibus accounts for which American Enterprise Investment Services Inc. is the broker of record or accounts where the beneficial shareholder is a customer of Ameriprise Financial Services, Inc., which are paid a per account fee). The Transfer Agent pays the fees of BFDS for services as sub-transfer agent and is not entitled to reimbursement for such fees from the Fund (with the exception of out-of-pocket fees).
The Transfer Agent also receives compensation from fees for various shareholder services and reimbursements for certain out-of-pocket expenses. Class I shares do not pay transfer agent fees. Total transfer agent fees for Class R4 shares are subject to an annual limitation of not more than 0.05% of the average daily net assets attributable to each share class.
For the six months ended April 30, 2012, the Fund’s annualized effective transfer agent fee rates as a percentage of average daily net assets of each class were as follows:
| | | | |
Class A | | | 0.21 | % |
Class B | | | 0.28 | |
Class C | | | 0.18 | |
Class R | | | 0.18 | |
Class R4 | | | 0.05 | |
Class W | | | 0.25 | |
Class Z | | | 0.16 | |
An annual minimum account balance fee of $20 may apply to certain accounts with a value below the Fund’s initial minimum investment requirements to reduce the impact of small accounts on transfer agent fees. These minimum account balance fees are recorded as part of expense reductions in the Statement of Operations. For the six months ended April 30, 2012, no minimum account balance fees were charged by the Fund.
Plan Administration Fees
Under a Plan Administration Services Agreement with the Transfer Agent, the Fund pays an annual fee at a rate of 0.25% of the Fund’s average daily net assets attributable to Class R4 shares for the provision of various administrative, recordkeeping, communication and educational services.
| | |
| 44 | | COLUMBIA EMERGING MARKETS BOND FUND — 2012 SEMIANNUAL REPORT |
Distribution Fees
The Fund has an agreement with Columbia Management Investment Distributors, Inc. (the Distributor), an affiliate of the Investment Manager and a wholly-owned subsidiary of Ameriprise Financial, for distribution and shareholder services. Under a Plan and Agreement of Distribution pursuant to Rule 12b-1, the Fund pays a fee at an annual rate of up to 0.25% of the Fund’s average daily net assets attributable to Class A and Class W shares and a fee at an annual rate of up to 1.00% of the Fund’s average daily net assets attributable to Class B and Class C shares. For Class B and Class C shares, of the 1.00% fee, up to 0.75% is reimbursed for distribution expenses.
The amount of distribution expenses incurred by the Distributor and not yet reimbursed (unreimbursed expense) was approximately $115,000 and $268,000 for Class B and Class C shares, respectively. These amounts are based on the most recent information available as of March 31, 2012, and may be recovered from future payments under the distribution plan or CDSCs. To the extent the unreimbursed expense has been fully recovered, the distribution fee is reduced.
Sales Charges
Sales charges, including front-end charges and CDSCs, received by the Distributor for distributing Fund shares were $350,408 for Class A, $931 for Class B and $3,724 for Class C shares for the six months ended April 30, 2012.
Expenses Waived/Reimbursed by the Investment Manager and its Affiliates
The Investment Manager and certain of its affiliates have contractually agreed to waive fees and/or reimburse expenses (excluding certain fees and expenses described below), through February 28, 2013, unless sooner terminated at the sole discretion of the Board, so that the Fund’s net operating expenses, after giving effect to fees waived/expenses reimbursed and any balance credits and/or overdraft charges from the Fund’s custodian, do not exceed the following annual rates as a percentage of the class’ average daily net assets:
| | | | |
Class A | | | 1.28 | % |
Class B | | | 2.03 | |
Class C | | | 2.03 | |
Class I | | | 0.83 | |
Class R | | | 1.53 | |
Class R4 | | | 1.13 | |
Class W | | | 1.28 | |
Class Z | | | 1.03 | |
Under the agreement, the following fees and expenses are excluded from the waiver/reimbursement commitment, and therefore will be paid by the Fund, if applicable: taxes (including foreign transaction taxes), expenses associated with
| | | | |
| COLUMBIA EMERGING MARKETS BOND FUND — 2012 SEMIANNUAL REPORT | | | 45 | |
| | |
| Notes to Financial Statements (continued) | | |
investments in affiliated and non-affiliated pooled investment vehicles (including mutual funds and exchange traded funds), transaction costs and brokerage commissions, costs related to any securities lending program, dividend expenses associated with securities sold short, inverse floater program fees and expenses, transaction charges and interest on borrowed money, interest, extraordinary expenses and any other expenses the exclusion of which is specifically approved by the Board. This agreement may be modified or amended only with approval from all parties.
| Note 4. Federal | Tax Information |
The timing and character of income and capital gain distributions are determined in accordance with income tax regulations, which may differ from GAAP because of temporary or permanent book to tax differences.
At April 30, 2012, the cost of investments for federal income tax purposes was approximately $546,675,000 and the aggregate gross approximate unrealized appreciation and depreciation based on that cost was:
| | | | | | |
Unrealized appreciation | | | | $ | 43,064,000 | |
Unrealized depreciation | | | | $ | (4,129,000 | ) |
Net unrealized appreciation | | | | $ | 38,935,000 | |
The following capital loss carryforward, determined as of October 31, 2011 may be available to reduce taxable income arising from future net realized gains on investments, if any, to the extent permitted by the Internal Revenue Code:
| | | | |
| Year of expiration | | Amount | |
2017 | | $ | 2,547,316 | |
On December 22, 2010, the Regulated Investment Company Modernization Act of 2010 (the Act) was enacted, which changed various technical rules governing the tax treatment of regulated investment companies. The changes are generally effective for taxable years beginning after the date of enactment. Under the Act, the Fund will be permitted to carry forward capital losses incurred in taxable years beginning after the date of enactment for an unlimited period. However, any losses incurred during those future taxable years will be required to be utilized prior to the losses incurred in pre-enactment taxable years, which carry an expiration date. As a result of this ordering rule, pre-enactment capital loss carryforwards may be more likely to expire unused.
Management of the Fund has concluded that there are no significant uncertain tax positions that would require recognition in the financial statements. However, management’s conclusion may be subject to review and adjustment at a later date based on factors including, but not limited to, new tax laws, regulations, and
| | |
| 46 | | COLUMBIA EMERGING MARKETS BOND FUND — 2012 SEMIANNUAL REPORT |
administrative interpretations (including relevant court decisions). Generally, the Fund’s federal tax returns for the prior three fiscal years remain subject to examination by the Internal Revenue Service.
| Note 5. Portfolio | Information |
The cost of purchases and proceeds from sales of securities, excluding short-term obligations, aggregated to $163,562,487 and $48,769,285, respectively, for the six months ended April 30, 2012.
| Note 6. Lending | of Portfolio Securities |
The Fund has entered into a Master Securities Lending Agreement (the Agreement) with JPMorgan Chase Bank, N.A. (JPMorgan). The Agreement authorizes JPMorgan as lending agent to lend securities to authorized borrowers in order to generate additional income on behalf of the Fund. Pursuant to the Agreement, the securities loaned are secured by cash or U.S. government securities equal to at least 100% of the market value of the loaned securities. Any additional collateral required to maintain those levels due to market fluctuations of the loaned securities is requested to be delivered the following business day. Cash collateral received is invested by the lending agent on behalf of the Fund into authorized investments pursuant to the Agreement. The investments made with the cash collateral are listed in the Portfolio of Investments. The values of such investments and any uninvested cash collateral are disclosed in the Statement of Assets and Liabilities along with the related obligation to return the collateral upon the return of the securities loaned.
Risks of delay in recovery of securities or even loss of rights in the securities may occur should the borrower of the securities fail financially. Risks may also arise to the extent that the value of the securities loaned increases above the value of the collateral received. JPMorgan will indemnify the Fund from losses resulting from a borrower’s failure to return a loaned security when due. Such indemnification does not extend to losses associated with declines in the value of cash collateral investments. The Investment Manager is not responsible for any losses incurred by the Fund in connection with the securities lending program. Loans are subject to termination by the Fund or the borrower at any time, and are, therefore, not considered to be illiquid investments.
Pursuant to the Agreement, the Fund receives income for lending its securities either in the form of fees or by earning interest on invested cash collateral, net of negotiated rebates paid to borrowers and fees paid to the lending agent for services provided and any other securities lending expenses. Net income earned
| | | | |
| COLUMBIA EMERGING MARKETS BOND FUND — 2012 SEMIANNUAL REPORT | | | 47 | |
| | |
| Notes to Financial Statements (continued) | | |
from securities lending for the six months ended April 30, 2012 is disclosed in the Statement of Operations. The Fund continues to earn and accrue interest and dividends on the securities loaned.
At April 30, 2012, securities valued at $20,518,348 were on loan, secured by cash collateral of $20,796,376 that is partially or fully invested in short-term securities or other cash equivalents.
| Note 7. Affiliated | Money Market Fund |
The Fund may invest its daily cash balances in Columbia Short-Term Cash Fund, an affiliated money market fund established for the exclusive use by the Fund and other affiliated funds. The income earned by the Fund from such investments is included as “Dividends from affiliates” in the Statement of Operations. As an investing fund, the Fund indirectly bears its proportionate share of the expenses of Columbia Short-Term Cash Fund.
| Note 8. Shareholder | Concentration |
At April 30, 2012, one unaffiliated shareholder account owned 26.2% of the outstanding shares of the Fund. The Fund has no knowledge about whether any portion of those shares was owned beneficially by such account. Affiliated shareholder accounts owned 30.9% of the outstanding shares of the Fund. Subscription and redemption activity by concentrated accounts may have a significant effect on the operations of the Fund.
The Fund has entered into a revolving credit facility with a syndicate of banks led by JPMorgan, whereby the Fund may borrow for the temporary funding of shareholder redemptions or for other temporary or emergency purposes. The credit facility agreement, as amended, which is a collective agreement between the Fund and certain other funds managed by the Investment Manager, severally and not jointly, permits collective borrowings up to $500 million. Pursuant to a December 13, 2011 amendment to the credit facility agreement, interest is charged to each participating fund based on its borrowings at a rate equal to the higher of (i) the overnight federal funds rate plus 1.00% or (i) the one-month LIBOR rate plus 1.00%. Each borrowing under the credit facility matures no later than 60 days after the date of borrowing. The Fund also pays a commitment fee equal to its pro rata share of the amount of the credit facility at a rate of 0.08% per annum.
Prior to December 13, 2011, interest was charged to each participating fund based on its borrowings at a rate equal to the sum of the federal funds rate plus (i) 1.25% per annum plus (ii) if one-month LIBOR exceeds the federal funds rate,
| | |
| 48 | | COLUMBIA EMERGING MARKETS BOND FUND — 2012 SEMIANNUAL REPORT |
the amount of such excess. The Fund also paid a commitment fee equal to its pro rata share of the amount of the credit facility at a rate of 0.10% per annum. The Fund had no borrowings during the six months ended April 30, 2012.
| Note 10. Significant | Risks |
Non-Diversification Risk
A non-diversified fund is permitted to invest a greater percentage of its total assets in fewer issuers than a diversified fund. The Fund may, therefore, have a greater risk of loss from a few issuers than a similar fund that invests more broadly.
Foreign Securities Risk
Investing in foreign securities may include certain risks and considerations not typically associated with investing in U.S. securities, such as fluctuating currency values and changing local and regional economic, political and social conditions, which may result in greater market volatility. In addition, certain foreign securities may not be as liquid as U.S. securities. Investing in emerging markets may accentuate these risks.
Investments in emerging market countries are subject to additional risk. The risk of foreign investments is typically increased in less developed countries. These countries are also more likely to experience high levels of inflation, deflation or currency devaluation which could hurt their economies and securities markets.
| Note 11. Subsequent | Events |
Management has evaluated the events and transactions that have occurred through the date the financial statements were issued and noted no items requiring adjustment of the financial statements or additional disclosure.
| Note 12. Information | Regarding Pending and Settled Legal Proceedings |
In December 2005, without admitting or denying the allegations, American Express Financial Corporation (AEFC, which is now known as Ameriprise Financial, Inc. (Ameriprise Financial)) entered into settlement agreements with the Securities and Exchange Commission (SEC) and Minnesota Department of Commerce (MDOC) related to market timing activities. As a result, AEFC was censured and ordered to cease and desist from committing or causing any violations of certain provisions of the Investment Advisers Act of 1940, the Investment Company Act of 1940, and various Minnesota laws. AEFC agreed to pay disgorgement of $10 million and civil money penalties of $7 million. AEFC also agreed to retain an independent distribution consultant to assist in developing a plan for distribution of all disgorgement and civil penalties ordered by the SEC in accordance with various undertakings detailed at
| | | | |
| COLUMBIA EMERGING MARKETS BOND FUND — 2012 SEMIANNUAL REPORT | | | 49 | |
| | |
| Notes to Financial Statements (continued) | | |
www.sec.gov/litigation/admin/ia-2451.pdf. Ameriprise Financial and its affiliates have cooperated with the SEC and the MDOC in these legal proceedings, and have made regular reports to the funds’ Boards of Trustees.
Ameriprise Financial and certain of its affiliates have historically been involved in a number of legal, arbitration and regulatory proceedings, including routine litigation, class actions, and governmental actions, concerning matters arising in connection with the conduct of their business activities. Ameriprise Financial believes that the Funds are not currently the subject of, and that neither Ameriprise Financial nor any of its affiliates are the subject of, any pending legal, arbitration or regulatory proceedings that are likely to have a material adverse effect on the Funds or the ability of Ameriprise Financial or its affiliates to perform under their contracts with the Funds. Ameriprise Financial is required to make 10-Q, 10-K and, as necessary, 8-K filings with the Securities and Exchange Commission on legal and regulatory matters that relate to Ameriprise Financial and its affiliates. Copies of these filings may be obtained by accessing the SEC website at www.sec.gov.
There can be no assurance that these matters, or the adverse publicity associated with them, will not result in increased fund redemptions, reduced sale of fund shares or other adverse consequences to the Funds. Further, although we believe proceedings are not likely to have a material adverse effect on the Funds or the ability of Ameriprise Financial or its affiliates to perform under their contracts with the Funds, these proceedings are subject to uncertainties and, as such, we are unable to estimate the possible loss or range of loss that may result. An adverse outcome in one or more of these proceedings could result in adverse judgments, settlements, fines, penalties or other relief that could have a material adverse effect on the consolidated financial condition or results of operations of Ameriprise Financial.
| | |
| 50 | | COLUMBIA EMERGING MARKETS BOND FUND — 2012 SEMIANNUAL REPORT |
The policy of the Board is to vote the proxies of the companies in which the Fund holds investments consistent with the procedures as stated in the Statement of Additional Information (SAI). You may obtain a copy of the SAI without charge by calling 800.345.6611; contacting your financial intermediary; visiting columbiamanagement.com; or searching the website of the Securities and Exchange Commission (SEC) at www.sec.gov. Information regarding how the Fund voted proxies relating to portfolio securities is filed with the SEC by August 31 for the most recent 12-month period ending June 30 of that year, and is available without charge by visiting columbiamanagement.com; or searching the website of the SEC at www.sec.gov.
| | |
| Approval of Investment Management Services |
| |
| Agreement | | |
Columbia Management Investment Advisers, LLC (“Columbia Management” or the “investment manager”), a wholly-owned subsidiary of Ameriprise Financial, Inc. (“Ameriprise Financial”), serves as the investment manager to Columbia Emerging Markets Bond Fund (the “Fund”). Under an investment management services agreement (the “IMS Agreement”), Columbia Management provides investment advice and other services to the Fund and all funds distributed by Columbia Management Investment Distributors, Inc. (collectively, the “Funds”).
On an annual basis, the Fund’s Board of Trustees (the “Board”), including the independent Board members (the “Independent Trustees”), considers renewal of the IMS Agreement. Columbia Management prepared detailed reports for the Board and its Contracts Committee in March and April 2012, including reports based on analyses of data provided by an independent organization and a comprehensive response to each item of information requested by independent legal counsel to the Independent Trustees (“Independent Legal Counsel”) in a letter to the investment manager, to assist the Board in making this determination. All of the materials presented in March and April were first supplied in draft form to designated representatives of the Independent Trustees, i.e., Independent Legal Counsel, the Chair and the Chair of the Contracts Committee (including materials relating to the Fund’s expense cap), and the final materials were revised to reflect comments provided by these Board representatives. In addition, throughout the year, the Board (or its committees) regularly meets with portfolio management teams and senior management personnel, and reviews information prepared by Columbia Management addressing the services Columbia Management provides and Fund performance. The Board accords particular weight to the work, deliberations and conclusions
| | | | |
| COLUMBIA EMERGING MARKETS BOND FUND — 2012 SEMIANNUAL REPORT | | | 51 | |
| | |
Approval of Investment Management Services |
| |
| Agreement (continued) | | |
of the Contracts Committee, the Investment Review Committee and the Compliance Committee in determining whether to continue the IMS Agreement.
The Board, at its April 10-12, 2012 in-person Board meeting (the “April Meeting”), considered the renewal of the IMS Agreement for an additional one-year term. At the April Meeting, Independent Legal Counsel reviewed with the Independent Trustees various factors relevant to the Board’s consideration of advisory agreements and the Board’s legal responsibilities related to such consideration. Following an analysis and discussion of the factors identified below, the Board, including all of the Independent Trustees, approved the renewal of the IMS Agreement.
Nature, Extent and Quality of Services Provided by Columbia Management: The Independent Trustees analyzed various reports and presentations they had received detailing the services performed by Columbia Management, as well as its expertise, resources and capabilities. The Independent Trustees specifically considered many developments during the past year concerning the services provided by Columbia Management, including, in particular, the continued investment in, and resources dedicated to, the Funds’ operations and the successful completion of various integration initiatives and the consolidation of dozens of Funds. The Independent Trustees noted the information they received concerning Columbia Management’s ability to retain key portfolio management personnel. In that connection, the Independent Trustees took into account their meetings with Columbia Management’s Chief Investment Officer (the “CIO”) and considered the CIO’s successful execution of additional risk and portfolio management oversight applied to the Funds. The Independent Trustees also assessed Columbia Management’s significant investment in upgrading technology (such as an equity trading system) and considered management’s commitments to enhance existing resources in this area.
In connection with the Board’s evaluation of the overall package of services provided by Columbia Management, the Board also considered the quality of administrative services provided to the Fund by Columbia Management. In addition, the Board also reviewed the financial condition of Columbia Management (and its affiliates) and each entity’s ability to carry out its responsibilities under the IMS Agreement and the Fund’s other services agreements with affiliates of Ameriprise Financial. The Board also discussed the acceptability of the terms of the IMS Agreement (including the relatively broad scope of services required to be performed by Columbia Management). The Board concluded that the services being performed under the IMS Agreement were of a reasonably high quality.
| | |
| 52 | | COLUMBIA EMERGING MARKETS BOND FUND — 2012 SEMIANNUAL REPORT |
Based on the foregoing, and based on other information received (both oral and written, including the information on investment performance referenced below) and other considerations, the Board concluded that Columbia Management and its affiliates were in a position to continue to provide a high quality and level of services to the Fund.
Investment Performance: For purposes of evaluating the nature, extent and quality of services provided under the IMS Agreement, the Board carefully reviewed the investment performance of the Fund. In this regard, the Board considered detailed reports providing the results of analyses performed by an independent organization showing, for various periods, the performance of the Fund, the performance of a benchmark index, the percentage ranking of the Fund among its comparison group and the net assets of the Fund. The Board observed that the Fund’s investment performance met expectations.
Comparative Fees, Costs of Services Provided and the Profits Realized By Columbia Management and its Affiliates from their Relationships with the Fund: The Board reviewed comparative fees and the costs of services to be provided under the IMS Agreement. The Board members considered detailed comparative information set forth in an annual report on fees and expenses, including, among other things, data (based on analyses conducted by an independent organization) showing a comparison of the Fund’s expenses with median expenses paid by funds in its comparative peer universe, as well as data showing the Fund’s contribution to Columbia Management’s profitability. The Board reviewed the fees charged to comparable institutional or other accounts/vehicles managed by Columbia Management and discussed differences in how the products are managed and operated, noting no unreasonable differences in the levels of contractual fees.
The Board accorded particular weight to the notion that the level of fees should reflect a rational pricing model applied consistently across the various product lines in the Fund family, while assuring that the overall fees for each Fund (with few defined exceptions) are generally in line with the “pricing philosophy” (i.e., that the total expense ratio of the Fund is at, or below, the median expense ratio of funds in the same comparison universe of the Fund). The Board took into account that the Fund’s total expense ratio (after considering proposed expense caps/waivers) approximated the peer universe’s median expense ratio. Based on its review, the Board concluded that the Fund’s management fee was fair and reasonable in light of the extent and quality of services that the Fund receives.
The Board also considered the expected profitability of Columbia Management and its affiliates in connection with Columbia Management providing investment
| | | | |
| COLUMBIA EMERGING MARKETS BOND FUND — 2012 SEMIANNUAL REPORT | | | 53 | |
| | |
Approval of Investment Management Services |
| |
| Agreement (continued) | | |
management services to the Fund. In this regard, the Board referred to a detailed profitability report, discussing the profitability to Columbia Management and Ameriprise Financial from managing, operating and distributing the Funds. In this regard, the Board observed that 2011 profitability, while slightly lower than 2010, was generally in line with the reported profitability of other asset management firms. The Board also considered the indirect economic benefits flowing to Columbia Management or its affiliates in connection with managing or distributing the Funds, such as the enhanced ability to offer various other financial products to Ameriprise Financial customers, soft dollar benefits and overall reputational advantages. The Board noted that the fees paid by the Fund should permit the investment manager to offer competitive compensation to its personnel, make necessary investments in its business and earn an appropriate profit. The Board concluded that profitability levels were reasonable.
Economies of Scale to be Realized: The Board also considered the economies of scale that might be realized by Columbia Management as the Fund grows and took note of the extent to which Fund shareholders might also benefit from such growth.
Based on the foregoing, the Board, including all of the Independent Trustees, concluded that the investment management service fees were fair and reasonable in light of the extent and quality of services provided. In reaching this conclusion, no single factor was determinative. On April 12, 2012, the Board, including all of the Independent Trustees, approved the renewal of the IMS Agreement.
| | |
| 54 | | COLUMBIA EMERGING MARKETS BOND FUND — 2012 SEMIANNUAL REPORT |
Columbia Emerging Markets Bond Fund
P.O. Box 8081
Boston, MA 02266-8081
columbiamanagement.com
| | | | |
 | | This report must be accompanied or preceded by the Fund’s current prospectus. The
Fund is distributed by Columbia Management Investment Distributors, Inc., member
FINRA, and managed by Columbia Management Investment Advisers, LLC. ©2012 Columbia Management Investment Advisers, LLC. All rights reserved. | | S-6511 H (6/12) |
Semiannual Report

Columbia
Emerging Markets Opportunity Fund
Semiannual Report for the Period Ended April 30, 2012
Columbia Emerging Markets Opportunity Fund seeks to provide shareholders with long-term capital growth.
Not FDIC insured ¡ No bank guarantee ¡ May lose value
| | | | |
| |
Your Fund at a Glance | | | 2 | |
| |
Fund Expense Example | | | 6 | |
| |
Portfolio of Investments | | | 8 | |
| |
Statement of Assets and Liabilities | | | 17 | |
| |
Statement of Operations | | | 19 | |
| |
Statement of Changes in Net Assets | | | 21 | |
| |
Financial Highlights | | | 23 | |
| |
Notes to Financial Statements | | | 32 | |
| |
Proxy Voting | | | 46 | |
| |
Approval of Investment Management Services and Subadvisory Agreements | | | 46 | |
See the Fund’s prospectus for risks associated with investing in the Fund.
| | | | |
| COLUMBIA EMERGING MARKETS OPPORTUNITY FUND — 2012 SEMIANNUAL REPORT | | | 1 | |
FUND SUMMARY
| > | | Columbia Emerging Markets Opportunity Fund (the Fund) Class A shares gained 5.63% (excluding sales charge) for the six months ended April 30, 2012. |
| > | | The Fund outperformed its benchmark, the MSCI Emerging Markets Index (Net), which gained 3.93% during the same six-month period. |
ANNUALIZED TOTAL RETURNS (for period ended April 30, 2012)
| | | | | | | | | | | | | | | | |
| | | 6 months* | | | 1 year | | | 5 years | | | 10 years | |
Columbia Emerging Markets Opportunity Fund
Class A (excluding sales charge) | | | +5.63% | | | | -15.57% | | | | +1.51% | | | | +12.08% | |
MSCI Emerging Markets Index (Net)(1) (unmanaged) | | | +3.93% | | | | -12.61% | | | | +3.48% | | | | +13.92% | |
MSCI Emerging Markets Index (Gross)(1) (unmanaged) | | | +4.02% | | | | -12.34% | | | | +3.77% | | | | +14.26% | |
The performance information shown represents past performance and is not a guarantee of future results. The investment return and principal value of your investment will fluctuate so that your shares, when redeemed, may be worth more or less than their original cost. Current performance may be lower or higher than the performance information shown. You may obtain performance information current to the most recent month-end by contacting your financial intermediary, visiting columbiamanagement.com or calling 800.345.6611.
The 5.75% sales charge applicable to Class A shares of the Fund is not reflected in the table above. If reflected, returns would be lower than those shown. The performance of other classes may vary from that shown because of differences in fees and expenses. The Fund’s returns reflect the effect of fee waivers/expense reimbursements, if any. Without such waivers/reimbursements, the Fund’s returns would be lower. See the Average Annual Total Returns table for performance of other share classes of the Fund.
The indices do not reflect the effects of sales charges, expenses and taxes (except the MSCI Emerging Markets Index (Net), which reflects reinvested dividends net of withholding taxes). It is not possible to invest directly in an index.
| (1) | | The MSCI Emerging Markets Index (Net) and the MSCI Emerging Markets Index (Gross), each an unmanaged index of equity securities, is designed to measure equity market performance of emerging markets. Each index reflects reinvestment of all distributions and changes in market prices. On September 30, 2011, the MSCI Emerging Markets Index (Net) replaced the MSCI Emerging Markets Index (Gross) as the Fund’s primary benchmark. The Fund’s Investment Manager |
| | |
| 2 | | COLUMBIA EMERGING MARKETS OPPORTUNITY FUND — 2012 SEMIANNUAL REPORT |
| | made this recommendation to the Fund’s Board because the Investment Manager believes that the Net version of the index better reflects how dividends paid to the Fund on foreign securities generally are treated for tax purposes and, therefore, provides a more appropriate basis for comparing the Fund’s performance. Information on both versions of the index will be included for a one-year transition period. Thereafter, only the Net version will be included. |
AVERAGE ANNUAL TOTAL RETURNS
| | | | | | | | | | | | | | | | |
| at April 30, 2012 | | | | | | | | | | | | |
| Without sales charge | | 6 months* | | | 1 year | | | 5 years | | | 10 years | |
Class A (inception 11/13/96) | | | +5.63% | | | | -15.57% | | | | +1.51% | | | | +12.08% | |
Class B (inception 11/13/96) | | | +5.27% | | | | -16.25% | | | | +0.73% | | | | +11.24% | |
Class C (inception 6/26/00) | | | +5.14% | | | | -16.23% | | | | +0.74% | | | | +11.25% | |
Class I** (inception 3/4/04) | | | +5.76% | | | | -15.25% | | | | +2.01% | | | | +12.53% | |
Class R** (inception 8/3/09) | | | +5.41% | | | | -15.82% | | | | +1.25% | | | | +11.78% | |
Class R4 (inception 11/13/96) | | | +5.65% | | | | -15.42% | | | | +1.78% | | | | +12.36% | |
Class R5** (inception 08/1/08) | | | +5.76% | | | | -15.22% | | | | +1.87% | | | | +12.28% | |
Class W** (inception 09/27/10) | | | +5.53% | | | | -15.64% | | | | +1.46% | | | | +12.03% | |
Class Z** (inception 09/27/10) | | | +5.65% | | | | -15.38% | | | | +1.58% | | | | +12.12% | |
| | | | |
| With sales charge | | | | | | | | | | | | |
Class A (inception 11/13/96) | | | -0.41% | | | | -20.44% | | | | +0.31% | | | | +11.42% | |
Class B (inception 11/13/96) | | | +0.49% | | | | -20.04% | | | | +0.46% | | | | +11.24% | |
Class C (inception 6/26/00) | | | +4.19% | | | | -16.99% | | | | +0.74% | | | | +11.25% | |
The “Without sales charge” returns for Class A, Class B and Class C shares do not include applicable initial or contingent deferred sales charges. If included, returns would be lower than those shown. The “With sales charge” returns for Class A, Class B and Class C shares include: the maximum initial sales charge of 5.75% for Class A shares; the applicable contingent deferred sales charge (CDSC) for Class B shares (applied as follows: first year 5%; second year 4%; third and fourth years 3%; fifth year 2%; sixth year 1%; no sales charge thereafter); and a 1% CDSC for Class C shares sold within one year after purchase. The Fund’s other share classes are not subject to sales charges and have limited eligibility. See the Fund’s prospectuses for details.
| ** | The returns shown for periods prior to the share class inception date (including returns since inception, which are since Fund inception) include the returns of the Fund’s Class A shares. These returns are adjusted to reflect any higher class-related operating expenses of the newer share classes, as applicable. Please visit columbiamanagement.com/mutual-fund/appended-performance for more information. |
| | | | |
| COLUMBIA EMERGING MARKETS OPPORTUNITY FUND — 2012 SEMIANNUAL REPORT | | | 3 | |
| | |
| Your Fund at a Glance (continued) | | |
| | | | |
| COUNTRY BREAKDOWN(1) (at April 30, 2012) | |
Brazil | | | 10.8 | % |
Canada | | | 0.1 | |
Chile | | | 1.1 | |
China | | | 14.9 | |
Colombia | | | 0.9 | |
Czech Republic | | | 0.6 | |
Hong Kong | | | 2.9 | |
India | | | 6.4 | |
Indonesia | | | 2.3 | |
Israel | | | 0.5 | |
Malaysia | | | 3.0 | |
Mexico | | | 4.4 | |
Netherlands | | | 0.5 | |
Peru | | | 1.3 | |
Philippines | | | 1.6 | |
Russian Federation | | | 7.6 | |
Singapore | | | 1.0 | |
South Africa | | | 7.0 | |
South Korea | | | 16.1 | |
Taiwan | | | 9.3 | |
Thailand | | | 4.6 | |
Turkey | | | 2.0 | |
United Kingdom | | | 1.1 | |
| (1) | | Percentages indicated are based upon total investments (excluding Investments of Cash Collateral Received for Securities on Loan). The Fund’s portfolio composition is subject to change. |
| | |
| 4 | | COLUMBIA EMERGING MARKETS OPPORTUNITY FUND — 2012 SEMIANNUAL REPORT |
| | | | |
| TOP TEN HOLDINGS(1) (at April 30, 2012) | |
Samsung Electronics Co., Ltd. (South Korea) | | | 6.0 | % |
PetroChina Co., Ltd., Class H (China) | | | 1.9 | |
Taiwan Semiconductor Manufacturing Co., Ltd., ADR (Taiwan) | | | 1.9 | |
Hyundai Motor Co. (South Korea) | | | 1.8 | |
Hyundai Mobis (South Korea) | | | 1.7 | |
Hon Hai Precision Industry Co., Ltd. (Taiwan) | | | 1.6 | |
Magnit OJSC, GDR (Russian Federation) | | | 1.6 | |
Telekom Malaysia Bhd (Malaysia) | | | 1.5 | |
Naspers Ltd., Class N (South Africa) | | | 1.5 | |
Life Healthcare Group Holdings Ltd. (South Africa) | | | 1.4 | |
| (1) | | Percentages indicated are based upon total investments (excluding Investments of Cash Collateral Received for Securities on Loan). |
For further detail about these holdings, please refer to the section entitled “Portfolio of Investments.”
Fund holdings are as of the date given, are subject to change at any time, and are not recommendations to buy or sell any security.
MORNINGSTAR STYLE BOXTM
| | |
 | | The Morningstar Style BoxTM is based on the Fund’s portfolio holdings.
For equity funds, the vertical axis shows the market capitalization of the
stocks owned, and the horizontal axis shows investment style (value,
blend, or growth). Information shown is based on the most recent data
provided by Morningstar. |
©2012 Morningstar, Inc. All rights reserved. The Morningstar information contained herein: (1) is proprietary to Morningstar and/or its content providers; (2) may not be copied or distributed; and (3) is not warranted to be accurate, complete, or timely. Neither Morningstar nor its content providers are responsible for any damages or losses arising from any use of this information. Past performance is no guarantee of future results.
| | | | |
| COLUMBIA EMERGING MARKETS OPPORTUNITY FUND — 2012 SEMIANNUAL REPORT | | | 5 | |
(Unaudited)
Understanding your expenses
As an investor, you incur two types of costs. There are transaction costs, which generally include sales charges on purchases and may include redemption fees. There are also ongoing costs, which generally include management fees, distribution and service (Rule 12b-1) fees, and other fund expenses. The following information is intended to help you understand your ongoing costs (in dollars) of investing in the Fund and to help you compare these costs with the ongoing costs of investing in other mutual funds.
Analyzing your fund’s expenses
To illustrate these ongoing costs, we have provided examples and calculated the expenses paid by investors in each share class of the Fund during the period. The actual and hypothetical information in the table is based on an initial investment of $1,000 at the beginning of the period indicated and held for the entire period. Expense information is calculated two ways and each method provides you with different information. The amount listed in the “Actual” column is calculated using the Fund’s actual operating expenses and total return for the period. You may use the Actual information, together with the amount invested, to estimate the expenses that you paid over the period. Simply divide your account value by $1,000 (for example, an $8,600 account value divided by $1,000 = 8.6), then multiply the results by the expenses paid during the period under the Actual column. The amount listed in the “Hypothetical” column assumes a 5% annual rate of return before expenses (which is not the Fund’s actual return) and then applies the Fund’s actual expense ratio for the period to the hypothetical return. You should not use the hypothetical account values and expenses to estimate either your actual account balance at the end of the period or the expenses you paid during the period. See “Compare with other funds” below for details on how to use the hypothetical data.
Compare with other funds
Since all mutual funds are required to include the same hypothetical calculations about expenses in shareholder reports, you can use this information to compare the ongoing cost of investing in the Fund with other funds. To do so, compare the hypothetical example with the 5% hypothetical examples that appear in the shareholder reports of other funds. As you compare hypothetical examples of other funds, it is important to note that hypothetical examples are meant to highlight the ongoing costs of investing in a fund only and do not reflect any transaction costs, such as sales charges, or redemption or exchange fees. Therefore, the hypothetical calculations are useful in comparing ongoing costs only, and will not help you determine the relative total costs of owning different funds. If transaction costs were included in these calculations, your costs would be higher.
| | |
| 6 | | COLUMBIA EMERGING MARKETS OPPORTUNITY FUND — 2012 SEMIANNUAL REPORT |
November 1, 2011 — April 30, 2012
| | | | | | | | | | | | | | | | | | | | | | | | | | | | |
| | | Account value at the
beginning of the
period ($) | | | Account value at the
end of the period ($) | | | Expenses paid
during the period ($) | | | Fund’s
annualized
expense
ratio (%) | |
| | | Actual | | | Hypothetical | | | Actual | | | Hypothetical | | | Actual | | | Hypothetical | | | Actual | |
Class A | | | 1,000.00 | | | | 1,000.00 | | | | 1,056.30 | | | | 1,015.71 | | | | 9.41 | | | | 9.22 | | | | 1.84 | |
Class B | | | 1,000.00 | | | | 1,000.00 | | | | 1,052.70 | | | | 1,012.03 | | | | 13.17 | | | | 12.91 | | | | 2.58 | |
Class C | | | 1,000.00 | | | | 1,000.00 | | | | 1,051.40 | | | | 1,011.98 | | | | 13.21 | | | | 12.96 | | | | 2.59 | |
Class I | | | 1,000.00 | | | | 1,000.00 | | | | 1,057.60 | | | | 1,018.25 | | | | 6.80 | | | | 6.67 | | | | 1.33 | |
Class R | | | 1,000.00 | | | | 1,000.00 | | | | 1,054.10 | | | | 1,014.47 | | | | 10.67 | | | | 10.47 | | | | 2.09 | |
Class R4 | | | 1,000.00 | | | | 1,000.00 | | | | 1,056.50 | | | | 1,016.81 | | | | 8.28 | | | | 8.12 | | | | 1.62 | |
Class R5 | | | 1,000.00 | | | | 1,000.00 | | | | 1,057.60 | | | | 1,018.00 | | | | 7.06 | | | | 6.92 | | | | 1.38 | |
Class W | | | 1,000.00 | | | | 1,000.00 | | | | 1,055.30 | | | | 1,015.86 | | | | 9.25 | | | | 9.07 | | | | 1.81 | |
Class Z | | | 1,000.00 | | | | 1,000.00 | | | | 1,056.50 | | | | 1,017.06 | | | | 8.03 | | | | 7.87 | | | | 1.57 | |
Expenses paid during the period are equal to the annualized expense ratio for each class as indicated above, multiplied by the average account value over the period and then multiplied by the number of days in the Fund’s most recent fiscal half year and divided by 366.
Expenses do not include fees and expenses incurred indirectly by the Fund from the underlying funds in which the Fund may invest (also referred to as “acquired funds”), including affiliated and non-affiliated pooled investment vehicles (including mutual funds and exchange traded funds).
Had Columbia Management Investment Advisers, LLC and/or certain of its affiliates not waived/reimbursed certain fees and expenses, account value at the end of the period would have been reduced.
| | | | |
| COLUMBIA EMERGING MARKETS OPPORTUNITY FUND — 2012 SEMIANNUAL REPORT | | | 7 | |
Columbia Emerging Markets Opportunity Fund
April 30, 2012 (Unaudited)
(Percentages represent value of investments compared to net assets)
| | | | | | | | |
| Issuer | | Shares | | | Value | |
| Common Stocks 94.2% | |
| | | | | | | | |
BRAZIL 8.3% | |
BR Malls Participacoes SA | | | 379,000 | | | | $4,684,437 | |
CETIP SA—Mercados Organizados | | | 228,400 | | | | 3,510,805 | |
Cia de Bebidas das Americas, ADR | | | 139,491 | | | | 5,855,832 | |
Cia Hering | | | 192,600 | | | | 4,782,288 | |
Cyrela Brazil Realty SA Empreendimentos e Participacoes | | | 279,600 | | | | 2,253,052 | |
Gerdau SA, ADR | | | 461,514 | | | | 4,333,616 | |
Petroleo Brasileiro SA, ADR | | | 158,962 | | | | 3,741,965 | |
Tim Participacoes SA, ADR | | | 91,093 | | | | 2,726,414 | |
Totvs SA | | | 198,400 | | | | 3,851,114 | |
| | | | | | | | |
Total | | | | | | | 35,739,523 | |
CANADA 0.1% | | | | | | | | |
First Quantum Minerals Ltd. | | | 17,800 | | | | 369,748 | |
CHILE 1.1% | | | | | | | | |
Cencosud SA | | | 709,732 | | | | 4,520,865 | |
CHINA 14.6% | | | | | | | | |
AAC Technologies Holdings, Inc. | | | 590,000 | | | | 1,732,502 | |
Baidu, Inc., ADR(a) | | | 37,654 | | | | 4,996,686 | |
Belle International Holdings Ltd. | | | 2,991,000 | | | | 5,836,151 | |
China Construction Bank Corp., Class H | | | 7,273,080 | | | | 5,644,231 | |
China Mobile Ltd., ADR | | | 19,144 | | | | 1,059,429 | |
China Unicom
Hong Kong Ltd. | | | 968,000 | | | | 1,693,010 | |
CNOOC Ltd. | | | 2,385,000 | | | | 5,039,860 | |
Dongfeng Motor Group Co., Ltd., Class H | | | 2,692,000 | | | | 5,265,191 | |
ENN Energy Holdings Ltd. | | | 838,000 | | | | 2,927,860 | |
Golden Eagle Retail
Group Ltd. | | | 1,573,000 | | | | 4,105,963 | |
Hengan International Group Co., Ltd. | | | 309,000 | | | | 3,265,091 | |
Lenovo Group Ltd. | | | 2,940,000 | | | | 2,811,597 | |
New Oriental Education & Technology Group, ADR(a) | | | 113,217 | | | | 3,026,290 | |
PetroChina Co., Ltd., ADR | | | 9,987 | | | | 1,486,265 | |
| | | | | | | | |
| Issuer | | Shares | | | Value | |
| Common Stocks (continued) | |
| | | | | | | | |
| | | | | | | | |
CHINA (cont.) | |
PetroChina Co., Ltd., Class H | | | 5,416,000 | | | | $8,079,032 | |
Ping An Insurance Group Co., Class H | | | 494,500 | | | | 4,107,447 | |
Zhuzhou CSR Times Electric Co., Ltd., Class H | | | 543,000 | | | | 1,530,764 | |
| | | | | | | | |
Total | | | | | | | 62,607,369 | |
COLOMBIA 0.9% | | | | | | | | |
BanColombia SA, ADR | | | 58,623 | | | | 3,976,398 | |
CZECH REPUBLIC 0.6% | | | | | | | | |
Telefonica Czech Republic AS | | | 120,820 | | | | 2,436,527 | |
HONG KONG 2.8% | | | | | | | | |
AIA Group Ltd. | | | 638,600 | | | | 2,259,923 | |
China Mobile Ltd. | | | 517,500 | | | | 5,725,373 | |
CNOOC Ltd., ADR | | | 1,123 | | | | 237,683 | |
COSCO Pacific Ltd. | | | 1,144,000 | | | | 1,653,768 | |
Samsonite International SA(a) | | | 1,146,600 | | | | 2,211,869 | |
| | | | | | | | |
Total | | | | | | | 12,088,616 | |
INDIA 6.2% | | | | | | | | |
Bajaj Auto Ltd. | | | 146,051 | | | | 4,489,520 | |
ICICI Bank Ltd. | | | 280,416 | | | | 4,694,602 | |
Infosys Ltd. | | | 101,552 | | | | 4,715,063 | |
ITC Ltd. | | | 1,073,414 | | | | 4,995,141 | |
Jain Irrigation Systems Ltd., DVR(a) | | | 1 | | | | 1 | |
Larsen & Toubro Ltd. | | | 63,594 | | | | 1,476,697 | |
Maruti Suzuki India Ltd. | | | 145,039 | | | | 3,770,707 | |
State Bank of India | | | 63,741 | | | | 2,579,267 | |
| | | | | | | | |
Total | | | | | | | 26,720,998 | |
INDONESIA 2.2% | | | | | | | | |
PT Astra International Tbk | | | 333,500 | | | | 2,568,206 | |
PT Bank Mandiri
Persero Tbk | | | 3,814,345 | | | | 3,058,915 | |
PT Semen Gresik Persero Tbk | | | 3,025,000 | | | | 3,986,866 | |
| | | | | | | | |
Total | | | | | | | 9,613,987 | |
ISRAEL 0.5% | | | | | | | | |
Teva Pharmaceutical Industries Ltd., ADR | | | 47,562 | | | | 2,175,486 | |
The accompanying Notes to Financial Statements are an integral part of this statement.
| | |
| 8 | | COLUMBIA EMERGING MARKETS OPPORTUNITY FUND — 2012 SEMIANNUAL REPORT |
| | | | | | | | |
| Issuer | | Shares | | | Value | |
| Common Stocks (continued) | |
| | | | | | | | |
MALAYSIA 2.9% | | | | | | | | |
AirAsia BHD | | | 1,811,700 | | | | $1,987,692 | |
Genting Bhd | | | 1,255,400 | | | | 4,279,099 | |
Telekom Malaysia Bhd | | | 3,517,400 | | | | 6,244,050 | |
| | | | | | | | |
Total | | | | | | | 12,510,841 | |
MEXICO 4.3% | | | | | | | | |
Alpek SAB de CV(a) | | | 1,071,100 | | | | 2,364,060 | |
Fomento Economico Mexicano SAB de
CV, ADR | | | 54,125 | | | | 4,398,198 | |
Genomma Lab Internacional SA de CV(a) | | | 599,000 | | | | 1,053,059 | |
Grupo Financiero Banorte SAB de CV, Class O | | | 978,600 | | | | 4,719,476 | |
Grupo Modelo SAB de CV, Class C | | | 569,900 | | | | 4,027,291 | |
Wal-Mart de Mexico SAB de CV, Class V | | | 627,000 | | | | 1,793,017 | |
| | | | | | | | |
Total | | | | | | | 18,355,101 | |
NETHERLANDS 0.5% | | | | | | | | |
VimpelCom Ltd., ADR | | | 203,220 | | | | 2,070,812 | |
PERU 1.2% | | | | | | | | |
Cia de Minas Buenaventura SA, ADR | | | 59,072 | | | | 2,437,902 | |
Credicorp Ltd. | | | 22,165 | | | | 2,901,620 | |
| | | | | | | | |
Total | | | | | | | 5,339,522 | |
PHILIPPINES 1.6% | | | | | | | | |
Ayala Corp. | | | 430,362 | | | | 4,374,022 | |
BDO Unibank, Inc. | | | 1,538,450 | | | | 2,405,610 | |
| | | | | | | | |
Total | | | | | | | 6,779,632 | |
RUSSIAN FEDERATION 6.2% | |
Lukoil OAO, ADR | | | 6,989 | | | | 428,600 | |
Magnit OJSC, GDR(b) | | | 222,306 | | | | 6,509,120 | |
Mail.ru Group Ltd., GDR(a)(b) | | | 103,376 | | | | 4,471,012 | |
Mobile Telesystems
OJSC, ADR | | | 229,994 | | | | 4,498,683 | |
Polymetal International PLC(a) | | | 158,066 | | | | 2,347,206 | |
Rosneft Oil Co.(a) | | | 619,314 | | | | 4,418,805 | |
Rosneft Oil Co., GDR(a)(b) | | | 245,311 | | | | 1,750,294 | |
Severstal OAO, GDR(a)(b) | | | 160,330 | | | | 2,185,410 | |
| | | | | | | | |
Total | | | | | | | 26,609,130 | |
SINGAPORE 1.0% | | | | | | | | |
Keppel Corp., Ltd. | | | 469,000 | | | | 4,171,629 | |
| | | | | | | | |
| Issuer | | Shares | | | Value | |
| Common Stocks (continued) | |
| | | | | | | | |
SOUTH AFRICA 6.8% | | | | | | | | |
FirstRand Ltd. | | | 1,003,190 | | | | $3,261,221 | |
Harmony Gold Mining Co., Ltd. | | | 39,394 | | | | 383,330 | |
Harmony Gold Mining Co., Ltd., ADR | | | 544,548 | | | | 5,282,116 | |
Kumba Iron Ore Ltd.(c) | | | 69,232 | | | | 4,894,027 | |
Life Healthcare Group Holdings Ltd. | | | 1,700,702 | | | | 5,880,974 | |
Naspers Ltd., Class N | | | 102,864 | | | | 6,198,954 | |
Shoprite Holdings Ltd. | | | 197,768 | | | | 3,419,378 | |
| | | | | | | | |
Total | | | | | | | 29,320,000 | |
SOUTH KOREA 15.7% | | | | | | | | |
Hana Financial
Group, Inc. | | | 118,751 | | | | 4,048,358 | |
Hyundai Department Store Co., Ltd. | | | 36,978 | | | | 5,200,329 | |
Hyundai Mobis | | | 25,782 | | | | 6,970,600 | |
Hyundai Motor Co. | | | 32,024 | | | | 7,559,915 | |
Hyundai Steel Co. | | | 43,304 | | | | 3,746,561 | |
LG Chem Ltd. | | | 16,047 | | | | 4,011,149 | |
Samsung Electronics Co., Ltd. | | | 20,413 | | | | 24,984,723 | |
Samsung Engineering Co., Ltd. | | | 28,516 | | | | 5,398,792 | |
Samsung Heavy Industries Co., Ltd. | | | 89,480 | | | | 3,271,410 | |
SK Telecom Co.,
Ltd., ADR | | | 158,498 | | | | 2,142,893 | |
| | | | | | | | |
Total | | | | | | | 67,334,730 | |
TAIWAN 9.1% | | | | | | | | |
Advanced Semiconductor Engineering, Inc. | | | 5,172,000 | | | | 5,200,935 | |
Far EasTone Telecommunications
Co., Ltd. | | | 1,979,000 | | | | 4,282,356 | |
Formosa Plastics Corp. | | | 1,589,000 | | | | 4,494,329 | |
Hon Hai Precision Industry Co., Ltd. | | | 2,092,915 | | | | 6,580,494 | |
HTC Corp. | | | 119,700 | | | | 1,796,729 | |
President Chain
Store Corp. | | | 579,000 | | | | 3,094,509 | |
Taiwan Semiconductor Manufacturing Co., Ltd. | | | 1,965,858 | | | | 5,810,362 | |
Taiwan Semiconductor Manufacturing Co.,
Ltd., ADR | | | 498,225 | | | | 7,762,346 | |
| | | | | | | | |
Total | | | | | | | 39,022,060 | |
The accompanying Notes to Financial Statements are an integral part of this statement.
| | | | |
| COLUMBIA EMERGING MARKETS OPPORTUNITY FUND — 2012 SEMIANNUAL REPORT | | | 9 | |
| | |
| Portfolio of Investments (continued) | | |
| | | | | | | | |
| Issuer | | Shares | | | Value | |
| Common Stocks (continued) | |
| | | | | | | | |
THAILAND 4.5% | | | | | | | | |
Bangkok Bank PCL, NVDR | | | 723,975 | | | | $4,483,968 | |
Banpu PCL, Foreign Registered Shares | | | 90,250 | | | | 1,629,633 | |
PTT PCL, Foreign
Registered Shares | | | 344,000 | | | | 3,923,195 | |
Siam Commercial Bank PCL, Foreign Registered Shares | | | 1,148,600 | | | | 5,767,151 | |
Total Access Communication PCL, Foreign
Registered Shares | | | 399,917 | | | | 1,072,825 | |
Total Access Communication PCL, NVDR | | | 841,683 | | | | 2,257,916 | |
| | | | | | | | |
Total | | | | | | | 19,134,688 | |
TURKEY 2.0% | | | | | | | | |
Tav Havalimanlari
Holding AS(a) | | | 505,674 | | | | 2,660,457 | |
Turkiye Garanti
Bankasi AS(a) | | | 1,364,917 | | | | 5,020,563 | |
Turkiye Halk Bankasi AS | | | 103,931 | | | | 727,887 | |
| | | | | | | | |
Total | | | | | | | 8,408,907 | |
UNITED KINGDOM 1.1% | | | | | | | | |
Rio Tinto PLC | | | 83,793 | | | | 4,667,776 | |
Total Common Stocks (Cost: $358,765,032) | | | | $403,974,345 | |
| | | | | | | | |
| Preferred Stocks 3.6% | |
BRAZIL 2.3% | | | | | | | | |
Alpargatas SA | | | 494,406 | | | | $3,981,393 | |
Cia de Bebidas das Americas | | | 27,600 | | | | 1,156,039 | |
Gerdau SA | | | 53,300 | | | | 497,726 | |
Petroleo Brasileiro SA | | | 358,800 | | | | 3,967,948 | |
| | | | | | | | |
Total | | | | | | | 9,603,106 | |
RUSSIAN FEDERATION 1.3% | | | | | |
Mechel | | | 44,948 | | | | 301,593 | |
Surgutneftegas OJSC(a) | | | 7,909,869 | | | | 5,268,084 | |
| | | | | | | | |
Total | | | | | | | 5,569,677 | |
Total Preferred Stocks (Cost: $16,399,175) | | | | $15,172,783 | |
| | | | | | | | |
| Issuer | | Shares | | | Value | |
| Rights —% | |
| | | | | | | | |
BRAZIL —% | | | | | | | | |
Cia de Bebidas das Americas(a) | | | 67 | | | | $563 | |
Total Rights (Cost: $—) | | | | | | | $563 | |
| | | | | | | | | | | | |
| Issuer | | Effective
Yield | | | Par/
Principal/
Shares | | | Value | |
Investments of Cash Collateral
Received for Securities on Loan 0.8% | |
Repurchase Agreements 0.8% | |
Citibank NA
dated 04/30/12, matures 05/01/12,
repurchase price $2,000,011(d) | |
| | | 0.200 | % | | | $2,000,000 | | | | $2,000,000 | |
Pershing LLC
dated 04/30/12, matures 05/01/12,
repurchase price $1,000,009(d) | |
| | | 0.330 | % | | | 1,000,000 | | | | 1,000,000 | |
Societe Generale
dated 04/30/12, matures 05/01/12,
repurchase price $396,294(d) | |
| | | 0.210 | % | | | 396,291 | | | | 396,291 | |
| | | | | | | | | | | | |
Total | | | | | | | | | | | 3,396,291 | |
Total Investments of Cash Collateral Received for
Securities on Loan | |
(Cost: $3,396,291) | | | | $3,396,291 | |
Total Investments | | | | | |
(Cost: $378,560,498)(e) | | | | $422,543,982 | |
Other Assets & Liabilities, Net | | | | 6,214,053 | |
Net Assets | | | | $428,758,035 | |
The accompanying Notes to Financial Statements are an integral part of this statement.
| | |
| 10 | | COLUMBIA EMERGING MARKETS OPPORTUNITY FUND — 2012 SEMIANNUAL REPORT |
Summary of Investments in Securities by Industry
The following table represents the portfolio investments of the Fund by industry classifications as a percentage of net assets at April 30, 2012:
| | | | | | | | |
| Industry | | Percentage of
Net Assets | | | Value | |
| Airlines | | | 0.5 | % | | | $1,987,692 | |
| Auto Components | | | 1.6 | | | | 6,970,600 | |
| Automobiles | | | 5.5 | | | | 23,653,539 | |
| Beverages | | | 3.6 | | | | 15,437,923 | |
| Capital Markets | | | 0.8 | | | | 3,510,805 | |
| Chemicals | | | 2.6 | | | | 10,869,539 | |
| Commercial Banks | | | 11.7 | | | | 50,028,045 | |
| Communications Equipment | | | 0.8 | | | | 3,529,231 | |
| Computers & Peripherals | | | 0.7 | | | | 2,811,597 | |
| Construction & Engineering | | | 1.6 | | | | 6,875,489 | |
| Construction Materials | | | 1.0 | | | | 3,986,865 | |
| Diversified Consumer Services | | | 0.7 | | | | 3,026,290 | |
| Diversified Financial Services | | | 1.8 | | | | 7,635,242 | |
| Diversified Telecommunication Services | | | 2.4 | | | | 10,373,586 | |
| Electrical Equipment | | | 0.4 | | | | 1,530,764 | |
| Electronic Equipment, Instruments & Components | | | 1.6 | | | | 6,580,494 | |
| Food & Staples Retailing | | | 4.5 | | | | 19,336,889 | |
| Health Care Providers & Services | | | 1.4 | | | | 5,880,974 | |
| Hotels, Restaurants & Leisure | | | 1.0 | | | | 4,279,099 | |
| Household Durables | | | 0.5 | | | | 2,253,052 | |
| Industrial Conglomerates | | | 1.0 | | | | 4,171,629 | |
| Insurance | | | 1.5 | | | | 6,367,370 | |
| Internet Software & Services | | | 2.2 | | | | 9,467,698 | |
| IT Services | | | 1.1 | | | | 4,715,063 | |
| Machinery | | | 0.8 | | | | 3,271,411 | |
| Media | | | 1.5 | | | | 6,198,954 | |
| Metals & Mining | | | 7.4 | | | | 31,447,012 | |
| Multiline Retail | | | 2.2 | | | | 9,306,292 | |
| Oil, Gas & Consumable Fuels | | | 9.3 | | | | 39,971,365 | |
| Personal Products | | | 0.8 | | | | 3,265,091 | |
| Pharmaceuticals | | | 0.8 | | | | 3,228,545 | |
| Real Estate Management & Development | | | 1.1 | | | | 4,684,437 | |
| Semiconductors & Semiconductor Equipment | | | 10.2 | | | | 43,758,366 | |
| Software | | | 0.9 | | | | 3,851,114 | |
| Specialty Retail | | | 2.5 | | | | 10,618,439 | |
| Textiles, Apparel & Luxury Goods | | | 1.5 | | | | 6,193,262 | |
| Tobacco | | | 1.2 | | | | 4,995,141 | |
| Transportation Infrastructure | | | 1.0 | | | | 4,314,225 | |
| Wireless Telecommunication Services | | | 6.1 | | | | 25,836,701 | |
| Other(1) | | | 0.8 | | | | 3,396,291 | |
| Total | | | | | | | $422,543,982 | |
| (1) | Includes Investments of Cash Collateral Received for Securites on Loan. |
The accompanying Notes to Financial Statements are an integral part of this statement.
| | | | |
| COLUMBIA EMERGING MARKETS OPPORTUNITY FUND — 2012 SEMIANNUAL REPORT | | | 11 | |
| | |
| Portfolio of Investments (continued) | | |
| | |
| Notes to Portfolio of Investments |
| (a) | Non-income producing. |
| (b) | Security exempt from registration pursuant to Rule 144A under the Securities Act of 1933. This security may be resold in transactions exempt from registration, normally to qualified institutional buyers. At April 30, 2012, the value of these securities amounted to $14,915,836 or 3.48% of net assets. |
| (c) | At April 30, 2012, security was partially or fully on loan. |
| (d) | The table below represents securities received as collateral for repurchase agreements. This collateral is deposited with the Fund’s custodian and, pursuant to the terms of the repurchase agreement, must have an aggregate value greater than or equal to the repurchase price plus accrued interest at all times. The value of securities and/or cash held as collateral for repurchase agreements is monitored on a daily basis to ensure the proper level of collateral. |
| | | | |
| Citibank NA (0.200%) | | | | |
| |
| Security Description | | Value | |
| Fannie Mae REMICS | | | $1,056,059 | |
| Freddie Mac REMICS | | | 908,635 | |
| Government National Mortgage Association | | | 75,306 | |
| Total Market Value of Collateral Securities | | | $2,040,000 | |
| |
| Pershing LLC (0.330%) | | | | |
| |
| Security Description | | Value | |
| Fannie Mae Pool | | | $207,499 | |
| Fannie Mae REMICS | | | 54,310 | |
| Fannie Mae-Aces | | | 5,960 | |
| Federal Farm Credit Bank | | | 37,671 | |
| Federal Home Loan Banks | | | 9,851 | |
| Federal Home Loan Mortgage Corp | | | 8,055 | |
| Federal National Mortgage Association | | | 11,410 | |
| Freddie Mac Coupon Strips | | | 7,871 | |
| Freddie Mac Gold Pool | | | 80,142 | |
| Freddie Mac Non Gold Pool | | | 30,216 | |
| Freddie Mac Reference REMIC | | | 9,609 | |
| Freddie Mac REMICS | | | 62,538 | |
| Ginnie Mae I Pool | | | 103,172 | |
| Ginnie Mae II Pool | | | 288,016 | |
| Government National Mortgage Association | | | 34,224 | |
| United States Treasury Note/Bond | | | 69,456 | |
| Total Market Value of Collateral Securities | | | $1,020,000 | |
The accompanying Notes to Financial Statements are an integral part of this statement.
| | |
| 12 | | COLUMBIA EMERGING MARKETS OPPORTUNITY FUND — 2012 SEMIANNUAL REPORT |
| | | | |
| Societe Generale (0.210%) | | | | |
| |
| Security Description | | Value | |
| Fannie Mae Pool | | | $275,422 | |
| Freddie Mac Gold Pool | | | 128,795 | |
| Total Market Value of Collateral Securities | | | $404,217 | |
| (e) | Investments in affiliates during the period ended April 30, 2012: |
| | | | | | | | | | | | | | | | | | | | | | | | | | | | |
| Issuer | | Beginning
Cost | | | Purchase
Cost | | | Sales Cost/
Proceeds
from Sales | | | Realized
Gain/Loss | | | Ending
Cost | | | Dividends
or
Interest
Income | | | Value | |
Columbia Short-Term
Cash Fund | | | $6,910,442 | | | | $98,099,933 | | | | $(105,010,375 | ) | | | $— | | | | $— | | | | $2,943 | | | | $— | |
| | |
| Abbreviation Legend |
| ADR | | American Depositary Receipt |
| DVR | | Differential Voting Rights |
| GDR | | Global Depositary Receipt |
| NVDR | | Non-voting Depository Receipt |
The accompanying Notes to Financial Statements are an integral part of this statement.
| | | | |
| COLUMBIA EMERGING MARKETS OPPORTUNITY FUND — 2012 SEMIANNUAL REPORT | | | 13 | |
| | |
| Portfolio of Investments (continued) | | |
Generally accepted accounting principles (GAAP) require disclosure regarding the inputs and valuation techniques used to measure fair value and any changes in valuation inputs or techniques. In addition, investments shall be disclosed by major category.
The Fund categorizes its fair value measurements according to a three-level hierarchy that maximizes the use of observable inputs and minimizes the use of unobservable inputs by prioritizing that the most observable input be used when available. Observable inputs are those that market participants would use in pricing an investment based on market data obtained from sources independent of the reporting entity. Unobservable inputs are those that reflect the Fund’s assumptions about the information market participants would use in pricing an investment. An investment’s level within the fair value hierarchy is based on the lowest level of any input that is deemed significant to the asset or liability’s fair value measurement. The input levels are not necessarily an indication of the risk or liquidity associated with investments at that level. For example, certain U.S. government securities are generally high quality and liquid, however, they are reflected as Level 2 because the inputs used to determine fair value may not always be quoted prices in an active market.
Fair value inputs are summarized in the three broad levels listed below:
| | Ÿ | | Level 1 — Valuations based on quoted prices for investments in active markets that the Fund has the ability to access at the measurement date (including NAV for open-end mutual funds). Valuation adjustments are not applied to Level 1 investments. |
| | Ÿ | | Level 2 — Valuations based on other significant observable inputs (including quoted prices for similar securities, interest rates, prepayment speeds, credit risks, etc.). |
| | Ÿ | | Level 3 — Valuations based on significant unobservable inputs (including the Fund’s own assumptions and judgment in determining the fair value of investments). |
Inputs that are used in determining fair value of an investment may include price information, credit data, volatility statistics, and other factors. These inputs can be either observable or unobservable. The availability of observable inputs can vary between investments, and is affected by various factors such as the type of investment, and the volume and level of activity for that investment or similar investments in the marketplace. The inputs will be considered by the Investment Manager, along with any other relevant factors in the calculation of an investment’s fair value. The Fund uses prices and inputs that are current as of the measurement date, which may include periods of market dislocations. During these periods, the availability of prices and inputs may be reduced for many investments. This condition could cause an investment to be reclassified between the various levels within the hierarchy.
Foreign equity securities actively traded in markets where there is a significant delay in the local close relative to the New York Stock Exchange (NYSE) are classified as Level 2. The values of these securities may include an adjustment to reflect the impact of significant market movements following the close of local trading, as described in Note 2 to the financial statements — Security Valuation.
Investments falling into the Level 3 category are primarily supported by quoted prices from brokers and dealers participating in the market for those investments. However, these may be classified as Level 3 investments due to lack of market transparency and corroboration to support these quoted
The accompanying Notes to Financial Statements are an integral part of this statement.
| | |
| 14 | | COLUMBIA EMERGING MARKETS OPPORTUNITY FUND — 2012 SEMIANNUAL REPORT |
| | |
| Fair Value Measurements (continued) |
prices. Additionally, valuation models may be used as the pricing source for any remaining investments classified as Level 3. These models rely on one or more significant unobservable inputs and/or significant assumptions by the Investment Manager. Inputs used in valuations may include, but are not limited to, financial statement analysis, capital account balances, discount rates and estimated cash flows, and comparable company data.
The following table is a summary of the inputs used to value the Fund’s investments as of April 30, 2012:
| | | | | | | | | | | | | | | | |
| | | Fair Value at April 30, 2012 | |
| Description | | Level 1
Quoted Prices
in Active Markets for Identical Assets | | | Level 2
Other
Significant
Observable
Inputs | | | Level 3
Significant
Unobservable
Inputs | | | Total | |
| Equity Securities | | | | | | | | | | | | | | | | |
Common Stocks | | | | | | | | | | | | | | | | |
Consumer Discretionary | | | $10,061,631 | | | | $58,456,503 | | | | $— | | | | $68,518,134 | |
Consumer Staples | | | 16,074,338 | | | | 25,804,104 | | | | — | | | | 41,878,442 | |
Energy | | | 5,894,514 | | | | 24,840,819 | | | | — | | | | 30,735,333 | |
Financials | | | 19,792,735 | | | | 52,433,165 | | | | — | | | | 72,225,900 | |
Health Care | | | 3,228,545 | | | | 5,880,974 | | | | — | | | | 9,109,519 | |
Industrials | | | — | | | | 22,151,210 | | | | — | | | | 22,151,210 | |
Information Technology | | | 16,610,145 | | | | 58,103,417 | | | | — | | | | 74,713,562 | |
Materials | | | 14,787,442 | | | | 30,716,655 | | | | — | | | | 45,504,097 | |
Telecommunication Services | | | 12,498,230 | | | | 23,712,058 | | | | — | | | | 36,210,288 | |
Utilities | | | — | | | | 2,927,860 | | | | — | | | | 2,927,860 | |
Preferred Stocks | | | | | | | | | | | | | | | | |
Consumer Discretionary | | | 3,981,393 | | | | — | | | | — | | | | 3,981,393 | |
Consumer Staples | | | 1,156,039 | | | | — | | | | — | | | | 1,156,039 | |
Energy | | | 3,967,948 | | | | 5,268,084 | | | | — | | | | 9,236,032 | |
Materials | | | 497,726 | | | | 301,593 | | | | — | | | | 799,319 | |
Rights | | | | | | | | | | | | | | | | |
Consumer Staples | | | — | | | | 563 | | | | — | | | | 563 | |
| Total Equity Securities | | | 108,550,686 | | | | 310,597,005 | | | | — | | | | 419,147,691 | |
| Other | | | | | | | | | | | | | | | | |
Investments of Cash Collateral Received for Securities on Loan | | | — | | | | 3,396,291 | | | | — | | | | 3,396,291 | |
| Total Other | | | — | | | | 3,396,291 | | | | — | | | | 3,396,291 | |
| Total | | | $108,550,686 | | | | $313,993,296 | | | | $— | | | | $422,543,982 | |
See the Portfolio of Investments for all investment classifications not indicated in the table.
The Fund’s assets assigned to the Level 2 input category are generally valued using the market approach, in which a security’s value is determined through reference to prices and information from market transactions for similar or identical assets. These assets include certain foreign securities for which a third party statistical pricing service may be employed for purposes of fair market valuation. The models utilized by the third party statistical pricing service take into account a
The accompanying Notes to Financial Statements are an integral part of this statement.
| | | | |
| COLUMBIA EMERGING MARKETS OPPORTUNITY FUND — 2012 SEMIANNUAL REPORT | | | 15 | |
| | |
| Portfolio of Investments (continued) | | |
| | |
| Fair Value Measurements (continued) |
security’s correlation to available market data including, but not limited to, intraday index, ADR, and ETF movements.
Financial assets were transferred from Level 2 to Level 1 as the market for these assets was deemed to be active during the period and fair values were consequently obtained using quoted prices for identical assets rather than being based upon other observable market inputs as of period end, April 30, 2012.
The following table shows transfers between Level 1 and Level 2 of the fair value hierarchy:
| | | | | | | | | | | | | | |
| Transfers In | | | Transfers Out | |
| | Level 1 | | | | Level 2 | | | | Level 1 | | | | Level 2 | |
| | | | | | | | | | | | | | |
| $ | 3,510,805 | | | $ | — | | | $ | — | | | $ | 3,510,805 | |
Transfers between Level 1 and Level 2 are determined based on the fair value at the beginning of the period for security positions held throughout the period.
How to find information about the Fund’s quarterly portfolio holdings
| (i) | The Fund files its complete schedule of portfolio holdings with the Securities and Exchange Commission (SEC) for the first and third quarters of each fiscal year on Form N-Q; |
| (ii) | The Fund’s Forms N-Q are available on the SEC’s website at www.sec.gov; |
| (iii) | The Fund’s Forms N-Q may be reviewed and copied at the SEC’s Public Reference Room in Washington, DC (information on the operations of the Public Reference Room may be obtained by calling 800.SEC.0330); and |
| (iv) | The Fund’s complete schedule of portfolio holdings, as filed on Form N-Q, can be obtained without charge, upon request, by calling 800.345.6611. |
The accompanying Notes to Financial Statements are an integral part of this statement.
| | |
| 16 | | COLUMBIA EMERGING MARKETS OPPORTUNITY FUND — 2012 SEMIANNUAL REPORT |
| | |
| Statement of Assets and Liabilities | | |
April 30, 2012 (Unaudited)
| | | | | |
Assets | | | | | |
Investments, at value* | | | | | |
(identified cost $375,164,207) | | | $ | 419,147,691 | |
Investment of cash collateral received for securities on loan
Repurchase agreements (identified cost $3,396,291) | | | | 3,396,291 | |
Total investments (identified cost $378,560,498) | | | | 422,543,982 | |
Foreign currency (identified cost $6,814,193) | | | | 6,652,885 | |
Receivable for: | | | | | |
Investments sold | | | | 15,786,893 | |
Capital shares sold | | | | 134,264 | |
Dividends | | | | 897,742 | |
Interest | | | | 4,927 | |
Reclaims | | | | 8,852 | |
Prepaid expense | | | | 1,696 | |
Total assets | | | | 446,031,241 | |
Liabilities | | | | | |
Bank overdraft | | | | 3,642,797 | |
Due upon return of securities on loan | | | | 3,396,291 | |
Payable for: | | | | | |
Investments purchased | | | | 8,292,802 | |
Capital shares purchased | | | | 509,027 | |
Foreign capital gains taxes deferred | | | | 1,002,457 | |
Investment management fees | | | | 38,523 | |
Distribution fees | | | | 11,694 | |
Transfer agent fees | | | | 103,641 | |
Administration fees | | | | 2,823 | |
Plan administration fees | | | | 13 | |
Compensation of board members | | | | 28,979 | |
Other expenses | | | | 244,159 | |
Total liabilities | | | | 17,273,206 | |
Net assets applicable to outstanding capital stock | | | $ | 428,758,035 | |
The accompanying Notes to Financial Statements are an integral part of this statement.
| | | | |
| COLUMBIA EMERGING MARKETS OPPORTUNITY FUND — 2012 SEMIANNUAL REPORT | | | 17 | |
| | |
| Statement of Assets and Liabilities (continued) | | |
April 30, 2012 (Unaudited)
| | | | | |
Represented by | | | | | |
Paid-in capital | | | $ | 404,317,405 | |
Excess of distributions over net investment income | | | | (964,510 | ) |
Accumulated net realized loss | | | | (17,623,418 | ) |
Unrealized appreciation (depreciation) on: | | | | | |
Investments | | | | 43,983,484 | |
Foreign currency translations | | | | 47,531 | |
Foreign capital gains tax | | | | (1,002,457 | ) |
Total — representing net assets applicable to outstanding capital stock | | | $ | 428,758,035 | |
*Value of securities on loan | | | $ | 3,280,706 | |
Net assets applicable to outstanding shares | | | | | |
Class A | | | $ | 374,049,828 | |
Class B | | | $ | 19,899,299 | |
Class C | | | $ | 24,904,316 | |
Class I | | | $ | 13,046 | |
Class R | | | $ | 7,486,939 | |
Class R4 | | | $ | 599,104 | |
Class R5 | | | $ | 639,092 | |
Class W | | | $ | 36,739 | |
Class Z | | | $ | 1,129,672 | |
Shares outstanding | | | | | |
Class A | | | | 46,822,815 | |
Class B | | | | 2,864,944 | |
Class C | | | | 3,603,302 | |
Class I | | | | 1,558 | |
Class R | | | | 943,215 | |
Class R4 | | | | 71,638 | |
Class R5 | | | | 76,153 | |
Class W | | | | 4,619 | |
Class Z | | | | 135,378 | |
Net asset value per share | | | | | |
Class A(a) | | | $ | 7.99 | |
Class B | | | $ | 6.95 | |
Class C | | | $ | 6.91 | |
Class I | | | $ | 8.37 | |
Class R | | | $ | 7.94 | |
Class R4 | | | $ | 8.36 | |
Class R5 | | | $ | 8.39 | |
Class W | | | $ | 7.95 | |
Class Z | | | $ | 8.34 | |
| (a) | The maximum offering price per share for Class A is $8.48. The offering price is calculated by dividing the net asset value by 1.0 minus the maximum sales charge of 5.75%. |
The accompanying Notes to Financial Statements are an integral part of this statement.
| | |
| 18 | | COLUMBIA EMERGING MARKETS OPPORTUNITY FUND — 2012 SEMIANNUAL REPORT |
Six months ended April 30, 2012 (Unaudited)
| | | | | |
Net investment income | | | | | |
Income: | | | | | |
Dividends | | | $ | 3,483,948 | |
Interest | | | | 262 | |
Dividends from affiliates | | | | 2,943 | |
Income from securities lending — net | | | | 33,952 | |
Foreign taxes withheld | | | | (325,534 | ) |
Total income | | | | 3,195,571 | |
Expenses: | | | | | |
Investment management fees | | | | 2,358,055 | |
Distribution fees | | | | | |
Class A | | | | 469,148 | |
Class B | | | | 99,869 | |
Class C | | | | 128,420 | |
Class R | | | | 21,926 | |
Class W | | | | 21 | |
Transfer agent fees | | | | | |
Class A | | | | 531,399 | |
Class B | | | | 29,907 | |
Class C | | | | 36,970 | |
Class R | | | | 12,866 | |
Class R4 | | | | 143 | |
Class R5 | | | | 164 | |
Class W | | | | 22 | |
Class Z | | | | 1,315 | |
Administration fees | | | | 172,827 | |
Plan administration fees | | | | | |
Class R4 | | | | 766 | |
Compensation of board members | | | | 10,338 | |
Custodian fees | | | | 156,936 | |
Printing and postage fees | | | | 49,472 | |
Registration fees | | | | 42,074 | |
Professional fees | | | | 23,302 | |
Other | | | | 42,973 | |
Total expenses | | | | 4,188,913 | |
Fees waived or expenses reimbursed by Investment Manager and its affiliates | | | | (48,967 | ) |
Expense reductions | | | | (20 | ) |
Total net expenses | | | | 4,139,926 | |
Net investment loss | | | | (944,355 | ) |
The accompanying Notes to Financial Statements are an integral part of this statement.
| | | | |
| COLUMBIA EMERGING MARKETS OPPORTUNITY FUND — 2012 SEMIANNUAL REPORT | | | 19 | |
| | |
| Statement of Operations (continued) | | |
| | | | | |
Realized and unrealized gain (loss) — net | | | | | |
Net realized gain (loss) on: | | | | | |
Investments | | | $ | (15,297,663 | ) |
Foreign currency translations | | | | (182,788 | ) |
Forward foreign currency exchange contracts | | | | 34,203 | |
Increase from payment by affiliate (see Note 7) | | | | 78,049 | |
Net realized loss | | | | (15,368,199 | ) |
Net change in unrealized appreciation (depreciation) on: | | | | | |
Investments | | | | 39,227,532 | |
Foreign currency translations | | | | (68,778 | ) |
Forward foreign currency exchange contracts | | | | 1,342 | |
Foreign capital gains tax | | | | (862,488 | ) |
Net change in unrealized appreciation | | | | 38,297,608 | |
Net realized and unrealized gain | | | | 22,929,409 | |
Net increase in net assets resulting from operations | | | $ | 21,985,054 | |
The accompanying Notes to Financial Statements are an integral part of this statement.
| | |
| 20 | | COLUMBIA EMERGING MARKETS OPPORTUNITY FUND — 2012 SEMIANNUAL REPORT |
| | |
| Statement of Changes in Net Assets | | |
| | | | | | | | | | |
| | | Six months ended
April 30, 2012 (Unaudited) | | Year ended
October 31, 2011 |
| | | | |
Operations | | | | | | | | | | |
Net investment income (loss) | | | $ | (944,355 | ) | | | $ | 1,811,762 | |
Net realized gain (loss) | | | | (15,368,199 | ) | | | | 36,135,034 | |
Net change in unrealized appreciation (depreciation) | | | | 38,297,608 | | | | | (114,134,618 | ) |
Net increase (decrease) in net assets resulting from operations | | | | 21,985,054 | | | | | (76,187,822 | ) |
Distributions to shareholders from: | | | | | | | | | | |
Net investment income | | | | | | | | | | |
Class A | | | | — | | | �� | | (5,232,400 | ) |
Class B | | | | — | | | | | (129,969 | ) |
Class C | | | | — | | | | | (204,839 | ) |
Class I | | | | — | | | | | (1,187,025 | ) |
Class R | | | | — | | | | | (124,581 | ) |
Class R4 | | | | — | | | | | (15,517 | ) |
Class R5 | | | | — | | | | | (9,648 | ) |
Class W | | | | — | | | | | (36 | ) |
Class Z | | | | — | | | | | (373 | ) |
Net realized gains | | | | | | | | | | |
Class A | | | | (29,002,402 | ) | | | | (6,285,005 | ) |
Class B | | | | (1,752,149 | ) | | | | (519,528 | ) |
Class C | | | | (2,366,032 | ) | | | | (535,291 | ) |
Class I | | | | (982 | ) | | | | (989,436 | ) |
Class R | | | | (767,669 | ) | | | | (190,513 | ) |
Class R4 | | | | (45,547 | ) | | | | (16,172 | ) |
Class R5 | | | | (45,363 | ) | | | | (8,371 | ) |
Class W | | | | (171 | ) | | | | (32 | ) |
Class Z | | | | (71,297 | ) | | | | (316 | ) |
Total distributions to shareholders | | | | (34,051,612 | ) | | | | (15,449,052 | ) |
Increase (decrease) in net assets from share transactions | | | | (18,766,697 | ) | | | | (149,713,034 | ) |
Proceeds from regulatory settlements (Note 6) | | | | 12,908 | | | | | — | |
Total decrease in net assets | | | | (30,820,347 | ) | | | | (241,349,908 | ) |
Net assets at beginning of period | | | | 459,578,382 | | | | | 700,928,290 | |
Net assets at end of period | | | $ | 428,758,035 | | | | $ | 459,578,382 | |
Excess of distributions over net investment income | | | $ | (964,510 | ) | | | $ | (20,155 | ) |
The accompanying Notes to Financial Statements are an integral part of this statement.
| | | | |
| COLUMBIA EMERGING MARKETS OPPORTUNITY FUND — 2012 SEMIANNUAL REPORT | | | 21 | |
| | |
| Statement of Changes in Net Assets (continued) | | |
| | | | | | | | | | | | | | | | | | | | |
| | | Six months ended
April 30, 2012
(Unaudited) | | Year ended
October 31, 2011 |
| | | Shares | | Dollars ($) | | Shares | | Dollars ($) |
Capital stock activity | | | | | | | | | | | | | | | | | | | | |
Class A shares | | | | | | | | | | | | | | | | | | | | |
Subscriptions(a) | | | | 12,792,191 | | | | | 104,356,806 | | | | | 6,888,977 | | | | | 66,082,356 | |
Distributions reinvested | | | | 3,902,839 | | | | | 27,515,017 | | | | | 1,146,557 | | | | | 10,915,221 | |
Redemptions | | | | (18,123,345 | ) | | | | (145,877,150 | ) | | | | (13,437,427 | ) | | | | (125,504,490 | ) |
Net decrease | | | | (1,428,315 | ) | | | | (14,005,327 | ) | | | | (5,401,893 | ) | | | | (48,506,913 | ) |
Class B shares | | | | | | | | | | | | | | | | | | | | |
Subscriptions | | | | 82,417 | | | | | 566,591 | | | | | 319,885 | | | | | 2,738,539 | |
Distributions reinvested | | | | 276,204 | | | | | 1,695,893 | | | | | 74,591 | | | | | 631,036 | |
Redemptions(a) | | | | (369,602 | ) | | | | (2,540,090 | ) | | | | (1,838,207 | ) | | | | (15,596,940 | ) |
Net decrease | | | | (10,981 | ) | | | | (277,606 | ) | | | | (1,443,731 | ) | | | | (12,227,365 | ) |
Class C shares | | | | | | | | | | | | | | | | | | | | |
Subscriptions | | | | 464,454 | | | | | 3,076,138 | | | | | 861,785 | | | | | 7,189,413 | |
Distributions reinvested | | | | 258,638 | | | | | 1,580,279 | | | | | 57,204 | | | | | 481,660 | |
Redemptions | | | | (969,502 | ) | | | | (6,551,616 | ) | | | | (1,570,450 | ) | | | | (12,861,777 | ) |
Net decrease | | | | (246,410 | ) | | | | (1,895,199 | ) | | | | (651,461 | ) | | | | (5,190,704 | ) |
Class I shares | | | | | | | | | | | | | | | | | | | | |
Subscriptions | | | | — | | | | | — | | | | | 135,792 | | | | | 1,378,107 | |
Distributions reinvested | | | | — | | | | | — | | | | | 220,471 | | | | | 2,176,053 | |
Redemptions | | | | — | | | | | — | | | | | (8,661,081 | ) | | | | (85,525,974 | ) |
Net decrease | | | | — | | | | | — | | | | | (8,304,818 | ) | | | | (81,971,814 | ) |
Class R shares | | | | | | | | | | | | | | | | | | | | |
Subscriptions | | | | 292,988 | | | | | 2,188,021 | | | | | 644,424 | | | | | 6,108,623 | |
Distributions reinvested | | | | 17,559 | | | | | 123,088 | | | | | 6,431 | | | | | 61,030 | |
Redemptions | | | | (665,275 | ) | | | | (5,078,005 | ) | | | | (914,311 | ) | | | | (8,666,950 | ) |
Net decrease | | | | (354,728 | ) | | | | (2,766,896 | ) | | | | (263,456 | ) | | | | (2,497,297 | ) |
Class R4 shares | | | | | | | | | | | | | | | | | | | | |
Subscriptions | | | | 778 | | | | | 6,444 | | | | | 4,826 | | | | | 44,838 | |
Distributions reinvested | | | | 6,180 | | | | | 45,547 | | | | | 3,161 | | | | | 31,300 | |
Redemptions | | | | (8,320 | ) | | | | (69,074 | ) | | | | (73,175 | ) | | | | (659,816 | ) |
Net decrease | | | | (1,362 | ) | | | | (17,083 | ) | | | | (65,188 | ) | | | | (583,678 | ) |
Class R5 shares | | | | | | | | | | | | | | | | | | | | |
Subscriptions | | | | 1,683 | | | | | 13,726 | | | | | 3,757 | | | | | 38,462 | |
Distributions reinvested | | | | 6,093 | | | | | 45,026 | | | | | 992 | | | | | 9,824 | |
Redemptions | | | | (3,858 | ) | | | | (31,239 | ) | | | | (121 | ) | | | | (1,126 | ) |
Net increase | | | | 3,918 | | | | | 27,513 | | | | | 4,628 | | | | | 47,160 | |
Class W shares | | | | | | | | | | | | | | | | | | | | |
Subscriptions | | | | 4,348 | | | | | 35,001 | | | | | — | | | | | — | |
Net increase | | | | 4,348 | | | | | 35,001 | | | | | — | | | | | — | |
Class Z shares | | | | | | | | | | | | | | | | | | | | |
Subscriptions | | | | 57,406 | | | | | 461,179 | | | | | 145,020 | | | | | 1,486,962 | |
Distributions reinvested | | | | 6,711 | | | | | 49,395 | | | | | 63 | | | | | 621 | |
Redemptions | | | | (46,008 | ) | | | | (377,674 | ) | | | | (29,928 | ) | | | | (270,006 | ) |
Net increase | | | | 18,109 | | | | | 132,900 | | | | | 115,155 | | | | | 1,217,577 | |
Total net decrease | | | | (2,015,421 | ) | | | | (18,766,697 | ) | | | | (16,010,764 | ) | | | | (149,713,034 | ) |
| (a) | Includes conversions of Class B shares to Class A shares, if any. The line items from the prior year have been combined to conform to the current year presentation. |
The accompanying Notes to Financial Statements are an integral part of this statement.
| | |
| 22 | | COLUMBIA EMERGING MARKETS OPPORTUNITY FUND — 2012 SEMIANNUAL REPORT |
The following tables are intended to help you understand the Fund’s financial performance. Certain information reflects financial results for a single share of a class held for the periods shown. Per share net investment income (loss) amounts are calculated based on average shares outstanding during the period. Total returns assume reinvestment of all dividends and distributions. Total returns do not reflect payment of sales charges, if any, and are not annualized for periods of less than one year.
| | | | | | | | | | | | | | | | | | | | | | | | | | | | | | |
| | | Six months
ended April 30, 2012 | | Year ended Oct. 31, |
| | | | 2011 | | 2010 | | 2009 | | 2008 | | 2007 |
| | | (Unaudited) | | | | | | | | | | |
Class A | | | | | | | | | | | | | | | | | | | | | | | | | | | | | | |
Per share data | | | | | | | | | | | | | | | | | | | | | | | | | | | | | | |
Net asset value, beginning of period | | | | $8.24 | | | | | $9.75 | | | | | $7.74 | | | | | $4.96 | | | | | $14.99 | | | | | $11.32 | |
Income from investment operations: | | | | | | | | | | | | | | | | | | | | | | | | | | | | | | |
Net investment income (loss) | | | | (0.01 | ) | | | | 0.04 | | | | | 0.03 | | | | | 0.02 | | | | | 0.08 | | | | | 0.04 | |
Net realized and unrealized gain (loss) | | | | 0.39 | | | | | (1.33 | ) | | | | 2.03 | | | | | 2.75 | | | | | (7.24 | ) | | | | 6.27 | |
Increase from payment by affiliate | | | | 0.00 | (a) | | | | — | | | | | — | | | | | — | | | | | — | | | | | — | |
Total from investment operations | | | | 0.38 | | | | | (1.29 | ) | | | | 2.06 | | | | | 2.77 | | | | | (7.16 | ) | | | | 6.31 | |
Less distributions to shareholders from: | | | | | | | | | | | | | | | | | | | | | | | | | | | | | | |
Net investment income | | | | — | | | | | (0.10 | ) | | | | (0.05 | ) | | | | — | | | | | (0.18 | ) | | | | — | |
Net realized gains | | | | (0.63 | ) | | | | (0.12 | ) | | | | — | | | | | — | | | | | (2.69 | ) | | | | (2.64 | ) |
Total distributions to shareholders | | | | (0.63 | ) | | | | (0.22 | ) | | | | (0.05 | ) | | | | — | | | | | (2.87 | ) | | | | (2.64 | ) |
Proceeds from regulatory settlements | | | | 0.00 | (a) | | | | — | | | | | 0.00 | (a) | | | | 0.01 | | | | | — | | | | | — | |
Net asset value, end of period | | | | $7.99 | | | | | $8.24 | | | | | $9.75 | | | | | $7.74 | | | | | $4.96 | | | | | $14.99 | |
Total return | | | | 5.63% | (b)(c) | | | | (13.55% | ) | | | | 26.70% | (d) | | | | 56.05% | (e) | | | | (57.79% | ) | | | | 68.21% | |
Ratios to average net assets(f) | | | | | | | | | | | | | | | | | | | | | | | | | | | | | | |
Expenses prior to fees waived or expenses reimbursed | | | | 1.86% | (g) | | | | 1.79% | | | | | 1.85% | | | | | 1.90% | | | | | 1.87% | | | | | 1.83% | |
Net expenses after fees waived or expenses reimbursed(h) | | | | 1.84% | (g)(i) | | | | 1.79% | (i) | | | | 1.85% | | | | | 1.90% | | | | | 1.87% | | | | | 1.83% | |
Net investment income (loss) | | | | (0.35% | )(g)(i) | | | | 0.38% | (i) | | | | 0.34% | | | | | 0.38% | | | | | 0.78% | | | | | 0.31% | |
Supplemental data | | | | | | | | | | | | | | | | | | | | | | | | | | | | | | |
Net assets, end of period (in thousands) | | | | $374,050 | | | | | $397,803 | | | | | $523,288 | | | | | $416,297 | | | | | $250,088 | | | | | $661,299 | |
Portfolio turnover | | | | 59% | | | | | 84% | | | | | 96% | | | | | 149% | | | | | 133% | | | | | 125% | |
Notes to Financial Highlights
| (a) | Rounds to less than $0.01. |
| (b) | During the six months ended April 30, 2012, the Fund received proceeds from a regulatory settlement. Had the Fund not received these proceeds, the total return would have been lower by less than 0.01%. |
| (c) | During the six months ended April 30, 2012, the Investment Manager reimbursed the Fund for a loss on a trading error. Had the Fund not received this reimbursement, total return would have been lower by 0.02%. |
| (d) | During the year ended October 31, 2010, the Fund received proceeds from a regulatory settlement. Had the Fund not received these proceeds, the total return would have been lower by 0.03%. |
| (e) | During the year ended October 31, 2009, the Fund received proceeds from a regulatory settlement. Had the Fund not received these proceeds, the total return would have been lower by 0.12%. |
| (f) | In addition to the fees and expenses which the Fund bears directly, the Fund indirectly bears a pro rata share of the fees and expenses of the acquired funds in which it invests. Such indirect expenses are not included in the reported expense ratios. |
| (h) | The Investment Manager and certain of its affiliates agreed to waive/reimburse certain fees and expenses, if applicable. |
| (i) | The benefits derived from expense reductions had an impact of less than 0.01%. |
The accompanying Notes to Financial Statements are an integral part of this statement.
| | | | |
| COLUMBIA EMERGING MARKETS OPPORTUNITY FUND — 2012 SEMIANNUAL REPORT | | | 23 | |
| | |
| Financial Highlights (continued) | | |
| | | | | | | | | | | | | | | | | | | | | | | | | | | | | | |
| | | Six months
ended April 30, 2012 | | Year ended Oct. 31, |
| | | | 2011 | | 2010 | | 2009 | | 2008 | | 2007 |
| | | (Unaudited) | | | | | | | | | | |
Class B | | | | | | | | | | | | | | | | | | | | | | | | | | | | | | |
Per share data | | | | | | | | | | | | | | | | | | | | | | | | | | | | | | |
Net asset value, beginning of period | | | | $7.28 | | | | | $8.64 | | | | | $6.87 | | | | | $4.43 | | | | | $13.73 | | | | | $10.63 | |
Income from investment operations: | | | | | | | | | | | | | | | | | | | | | | | | | | | | | | |
Net investment income (loss) | | | | (0.04 | ) | | | | (0.04 | ) | | | | (0.03 | ) | | | | (0.02 | ) | | | | 0.00 | (a) | | | | (0.05 | ) |
Net realized and unrealized gain (loss) | | | | 0.34 | | | | | (1.17 | ) | | | | 1.80 | | | | | 2.45 | | | | | (6.53 | ) | | | | 5.79 | |
Increase from payment by affiliate | | | | 0.00 | (a) | | | | — | | | | | — | | | | | — | | | | | — | | | | | — | |
Total from investment operations | | | | 0.30 | | | | | (1.21 | ) | | | | 1.77 | | | | | 2.43 | | | | | (6.53 | ) | | | | 5.74 | |
Less distributions to shareholders from: | | | | | | | | | | | | | | | | | | | | | | | | | | | | | | |
Net investment income | | | | — | | | | | (0.03 | ) | | | | (0.00 | )(a) | | | | — | | | | | (0.08 | ) | | | | — | |
Net realized gains | | | | (0.63 | ) | | | | (0.12 | ) | | | | — | | | | | — | | | | | (2.69 | ) | | | | (2.64 | ) |
Total distributions to shareholders | | | | (0.63 | ) | | | | (0.15 | ) | | | | (0.00 | )(a) | | | | — | | | | | (2.77 | ) | | | | (2.64 | ) |
Proceeds from regulatory settlements | | | | 0.00 | (a) | | | | — | | | | | 0.00 | (a) | | | | 0.01 | | | | | — | | | | | — | |
Net asset value, end of period | | | | $6.95 | | | | | $7.28 | | | | | $8.64 | | | | | $6.87 | | | | | $4.43 | | | | | $13.73 | |
Total return | | | | 5.27% | (b)(c) | | | | (14.26% | ) | | | | 25.82% | (d) | | | | 55.08% | (e) | | | | (58.08% | ) | | | | 66.95% | |
Ratios to average net assets(f) | | | | | | | | | | | | | | | | | | | | | | | | | | | | | | |
Expenses prior to fees waived or
expenses reimbursed | | | | 2.62% | (g) | | | | 2.54% | | | | | 2.60% | | | | | 2.68% | | | | | 2.62% | | | | | 2.58% | |
Net expenses after fees waived or expenses reimbursed(h) | | | | 2.58% | (g)(i) | | | | 2.54% | (i) | | | | 2.60% | | | | | 2.68% | | | | | 2.62% | | | | | 2.58% | |
Net investment income (loss) | | | | (1.10% | )(g)(i) | | | | (0.43% | )(i) | | | | (0.42% | ) | | | | (0.36% | ) | | | | 0.02% | | | | | (0.48% | ) |
Supplemental data | | | | | | | | | | | | | | | | | | | | | | | | | | | | | | |
Net assets, end of period (in thousands) | | | | $19,899 | | | | | $20,944 | | | | | $37,312 | | | | | $38,489 | | | | | $28,179 | | | | | $93,787 | |
Portfolio turnover | | | | 59% | | | | | 84% | | | | | 96% | | | | | 149% | | | | | 133% | | | | | 125% | |
Notes to Financial Highlights
| (a) | Rounds to less than $0.01. |
| (b) | During the six months ended April 30, 2012, the Fund received proceeds from a regulatory settlement. Had the Fund not received these proceeds, the total return would have been lower by less than 0.01%. |
| (c) | During the six months ended April 30, 2012, the Investment Manager reimbursed the Fund for a loss on a trading error. Had the Fund not received this reimbursement, total return would have been lower by 0.02%. |
| (d) | During the year ended October 31, 2010, the Fund received proceeds from a regulatory settlement. Had the Fund not received these proceeds, the total return would have been lower by 0.04%. |
| (e) | During the year ended October 31, 2009, the Fund received proceeds from a regulatory settlement. Had the Fund not received these proceeds, the total return would have been lower by 0.12%. |
| (f) | In addition to the fees and expenses which the Fund bears directly, the Fund indirectly bears a pro rata share of the fees and expenses of the acquired funds in which it invests. Such indirect expenses are not included in the reported expense ratios. |
| (h) | The Investment Manager and certain of its affiliates agreed to waive/reimburse certain fees and expenses, if applicable. |
| (i) | The benefits derived from expense reductions had an impact of less than 0.01%. |
The accompanying Notes to Financial Statements are an integral part of this statement.
| | |
| 24 | | COLUMBIA EMERGING MARKETS OPPORTUNITY FUND — 2012 SEMIANNUAL REPORT |
| | | | | | | | | | | | | | | | | | | | | | | | | | | | | | |
| | | Six months
ended April 30, 2012 | | Year ended Oct. 31, |
| | | | 2011 | | 2010 | | 2009 | | 2008 | | 2007 |
| | | (Unaudited) | | | | | | | | | | |
Class C | | | | | | | | | | | | | | | | | | | | | | | | | | | | | | |
Per share data | | | | | | | | | | | | | | | | | | | | | | | | | | | | | | |
Net asset value, beginning of period | | | | $7.25 | | | | | $8.61 | | | | | $6.89 | | | | | $4.44 | | | | | $13.78 | | | | | $10.66 | |
Income from investment operations: | | | | | | | | | | | | | | | | | | | | | | | | | | | | | | |
Net investment income (loss) | | | | (0.04 | ) | | | | (0.03 | ) | | | | (0.03 | ) | | | | (0.04 | ) | | | | 0.00 | (a) | | | | (0.05 | ) |
Net realized and unrealized gain (loss) | | | | 0.33 | | | | | (1.17 | ) | | | | 1.79 | | | | | 2.48 | | | | | (6.54 | ) | | | | 5.81 | |
Increase from payment by affiliate | | | | 0.00 | (a) | | | | — | | | | | — | | | | | — | | | | | — | | | | | — | |
Total from investment operations | | | | 0.29 | | | | | (1.20 | ) | | | | 1.76 | | | | | 2.44 | | | | | (6.54 | ) | | | | 5.76 | |
Less distributions to shareholders from: | | | | | | | | | | | | | | | | | | | | | | | | | | | | | | |
Net investment income | | | | — | | | | | (0.04 | ) | | | | (0.04 | ) | | | | — | | | | | (0.11 | ) | | | | — | |
Net realized gains | | | | (0.63 | ) | | | | (0.12 | ) | | | | — | | | | | — | | | | | (2.69 | ) | | | | (2.64 | ) |
Total distributions to shareholders | | | | (0.63 | ) | | | | (0.16 | ) | | | | (0.04 | ) | | | | — | | | | | (2.80 | ) | | | | (2.64 | ) |
Proceeds from regulatory settlements | | | | 0.00 | (a) | | | | — | | | | | 0.00 | (a) | | | | 0.01 | | | | | — | | | | | — | |
Net asset value, end of period | | | | $6.91 | | | | | $7.25 | | | | | $8.61 | | | | | $6.89 | | | | | $4.44 | | | | | $13.78 | |
Total return | | | | 5.14% | (b)(c) | | | | (14.15% | ) | | | | 25.67% | (d) | | | | 55.18% | (e) | | | | (58.15% | ) | | | | 67.03% | |
Ratios to average net assets(f) | | | | | | | | | | | | | | | | | | | | | | | | | | | | | | |
Expenses prior to fees waived or expenses reimbursed | | | | 2.61% | (g) | | | | 2.54% | | | | | 2.60% | | | | | 2.60% | | | | | 2.63% | | | | | 2.59% | |
Net expenses after fees waived or expenses reimbursed(h) | | | | 2.59% | (g)(i) | | | | 2.54% | (i) | | | | 2.60% | | | | | 2.60% | | | | | 2.63% | | | | | 2.59% | |
Net investment income (loss) | | | | (1.11% | )(g)(i) | | | | (0.39% | )(i) | | | | (0.43% | ) | | | | (0.65% | ) | | | | 0.03% | | | | | (0.48% | ) |
Supplemental data | | | | | | | | | | | | | | | | | | | | | | | | | | | | | | |
Net assets, end of period (in thousands) | | | | $24,904 | | | | | $27,910 | | | | | $38,770 | | | | | $32,757 | | | | | $3,163 | | | | | $7,684 | |
Portfolio turnover | | | | 59% | | | | | 84% | | | | | 96% | | | | | 149% | | | | | 133% | | | | | 125% | |
Notes to Financial Highlights
| (a) | Rounds to less than $0.01. |
| (b) | During the six months ended April 30, 2012, the Investment Manager reimbursed the Fund for a loss on a trading error. Had the Fund not received this reimbursement, total return would have been lower by 0.02%. |
| (c) | During the six months ended April 30, 2012, the Fund received proceeds from a regulatory settlement. Had the Fund not received these proceeds, the total return would have been lower by less than 0.01%. |
| (d) | During the year ended October 31, 2010, the Fund received proceeds from a regulatory settlement. Had the Fund not received these proceeds, the total return would have been lower by 0.04%. |
| (e) | During the year ended October 31, 2009, the Fund received proceeds from a regulatory settlement. Had the Fund not received these proceeds, the total return would have been lower by 0.12%. |
| (f) | In addition to the fees and expenses which the Fund bears directly, the Fund indirectly bears a pro rata share of the fees and expenses of the acquired funds in which it invests. Such indirect expenses are not included in the reported expense ratios. |
| (h) | The Investment Manager and certain of its affiliates agreed to waive/reimburse certain fees and expenses, if applicable. |
| (i) | The benefits derived from expense reductions had an impact of less than 0.01%. |
The accompanying Notes to Financial Statements are an integral part of this statement.
| | | | |
| COLUMBIA EMERGING MARKETS OPPORTUNITY FUND — 2012 SEMIANNUAL REPORT | | | 25 | |
| | |
| Financial Highlights (continued) | | |
| | | | | | | | | | | | | | | | | | | | | | | | | | | | | | |
| | | Six months
ended April 30, 2012 | | Year ended Oct. 31, |
| | | | 2011 | | 2010 | | 2009 | | 2008 | | 2007 |
| | | (Unaudited) | | | | | | | | | | |
Class I | | | | | | | | | | | | | | | | | | | | | | | | | | | | | | |
Per share data | | | | | | | | | | | | | | | | | | | | | | | | | | | | | | |
Net asset value, beginning of period | | | | $8.59 | | | | | $10.15 | | | | | $8.04 | | | | | $5.12 | | | | | $15.38 | | | | | $11.50 | |
Income from investment operations: | | | | | | | | | | | | | | | | | | | | | | | | | | | | | | |
Net investment income | | | | 0.01 | | | | | 0.04 | | | | | 0.07 | | | | | 0.06 | | | | | 0.11 | | | | | 0.09 | |
Net realized and unrealized gain (loss) | | | | 0.40 | | | | | (1.34 | ) | | | | 2.12 | | | | | 2.85 | | | | | (7.45 | ) | | | | 6.43 | |
Increase from payment by affiliate | | | | 0.00 | (a) | | | | — | | | | | — | | | | | — | | | | | — | | | | | — | |
Total from investment operations | | | | 0.41 | | | | | (1.30 | ) | | | | 2.19 | | | | | 2.91 | | | | | (7.34 | ) | | | | 6.52 | |
Less distributions to shareholders from: | | | | | | | | | | | | | | | | | | | | | | | | | | | | | | |
Net investment income | | | | — | | | | | (0.14 | ) | | | | (0.08 | ) | | | | — | | | | | (0.23 | ) | | | | — | |
Net realized gains | | | | (0.63 | ) | | | | (0.12 | ) | | | | — | | | | | — | | | | | (2.69 | ) | | | | (2.64 | ) |
Total distributions to shareholders | | | | (0.63 | ) | | | | (0.26 | ) | | | | (0.08 | ) | | | | — | | | | | (2.92 | ) | | | | (2.64 | ) |
Proceeds from regulatory settlements | | | | 0.00 | (a) | | | | — | | | | | 0.00 | (a) | | | | 0.01 | | | | | — | | | | | — | |
Net asset value, end of period | | | | $8.37 | | | | | $8.59 | | | | | $10.15 | | | | | $8.04 | | | | | $5.12 | | | | | $15.38 | |
Total return | | | | 5.76% | (b)(c) | | | | (13.12% | ) | | | | 27.45% | (d) | | | | 57.03% | (e) | | | | (57.63% | ) | | | | 69.07% | |
Ratios to average net assets(f) | | | | | | | | | | | | | | | | | | | | | | | | | | | | | | |
Expenses prior to fees waived or expenses reimbursed | | | | 1.33% | (g) | | | | 1.27% | | | | | 1.35% | | | | | 1.26% | | | | | 1.42% | | | | | 1.39% | |
Net expenses after fees waived or expenses reimbursed(h) | | | | 1.33% | (g) | | | | 1.27% | | | | | 1.35% | | | | | 1.26% | | | | | 1.42% | | | | | 1.39% | |
Net investment income | | | | 0.16% | (g) | | | | 0.41% | | | | | 0.84% | | | | | 0.77% | | | | | 0.97% | | | | | 0.75% | |
Supplemental data | | | | | | | | | | | | | | | | | | | | | | | | | | | | | | |
Net assets, end of period (in thousands) | | | | $13 | | | | | $13 | | | | | $84,279 | | | | | $68,978 | | | | | $8 | | | | | $55,503 | |
Portfolio turnover | | | | 59% | | | | | 84% | | | | | 96% | | | | | 149% | | | | | 133% | | | | | 125% | |
Notes to Financial Highlights
| (a) | Rounds to less than $0.01. |
| (b) | During the six months ended April 30, 2012, the Investment Manager reimbursed the Fund for a loss on a trading error. Had the Fund not received this reimbursement, total return would have been lower by 0.02%. |
| (c) | During the six months ended April 30, 2012, the Fund received proceeds from a regulatory settlement. Had the Fund not received these proceeds, the total return would have been lower by less than 0.01%. |
| (d) | During the year ended October 31, 2010, the Fund received proceeds from a regulatory settlement. Had the Fund not received these proceeds, the total return would have been lower by 0.03%. |
| (e) | During the year ended October 31, 2009, the Fund received proceeds from a regulatory settlement. Had the Fund not received these proceeds, the total return would have been lower by 0.12%. |
| (f) | In addition to the fees and expenses which the Fund bears directly, the Fund indirectly bears a pro rata share of the fees and expenses of the acquired funds in which it invests. Such indirect expenses are not included in the reported expense ratios. |
| (h) | The Investment Manager and certain of its affiliates agreed to waive/reimburse certain fees and expenses, if applicable. |
The accompanying Notes to Financial Statements are an integral part of this statement.
| | |
| 26 | | COLUMBIA EMERGING MARKETS OPPORTUNITY FUND — 2012 SEMIANNUAL REPORT |
| | | | | | | | | | | | | | | | | | | | |
| | | Six months
ended April 30, 2012 | | Year ended Oct. 31, |
| | | | 2011 | | 2010 | | 2009(a) |
| | | (Unaudited) | | | | | | |
Class R | | | | | | | | | | | | | | | | | | | | |
Per share data | | | | | | | | | | | | | | | | | | | | |
Net asset value, beginning of period | | | | $8.21 | | | | | $9.71 | | | | | $7.74 | | | | | $7.42 | |
Income from investment operations: | | | | | | | | | | | | | | | | | | | | |
Net investment income (loss) | | | | (0.03 | ) | | | | 0.01 | | | | | 0.00 | (b) | | | | (0.01 | ) |
Net realized and unrealized gain (loss) | | | | 0.39 | | | | | (1.31 | ) | | | | 2.03 | | | | | 0.33 | |
Increase from payment by affiliate | | | | 0.00 | (b) | | | | — | | | | | — | | | | | — | |
Total from investment operations | | | | 0.36 | | | | | (1.30 | ) | | | | 2.03 | | | | | 0.32 | |
Less distributions to shareholders
from: | | | | | | | | | | | | | | | | | | | | |
Net investment income | | | | — | | | | | (0.08 | ) | | | | (0.06 | ) | | | | — | |
Net realized gains | | | | (0.63 | ) | | | | (0.12 | ) | | | | — | | | | | — | |
Total distributions to shareholders | | | | (0.63 | ) | | | | (0.20 | ) | | | | (0.06 | ) | | | | — | |
Proceeds from regulatory settlements | | | | 0.00 | (b) | | | | — | | | | | 0.00 | (b) | | | | — | |
Net asset value, end of period | | | | $7.94 | | | | | $8.21 | | | | | $9.71 | | | | | $7.74 | |
Total return | | | | 5.41% | (c)(d) | | | | (13.69% | ) | | | | 26.36% | (e) | | | | 4.31% | |
Ratios to average net assets(f) | | | | | | | | | | | | | | | | | | | | |
Expenses prior to fees waived or
expenses reimbursed | | | | 2.12% | (g) | | | | 2.04% | | | | | 2.13% | | | | | 2.06% | (g) |
Net expenses after fees waived or
expenses reimbursed(h) | | | | 2.09% | (g)(i) | | | | 2.04% | (i) | | | | 2.13% | | | | | 2.06% | (g) |
Net investment income (loss) | | | | (0.65% | )(g)(i) | | | | 0.11% | (i) | | | | 0.04% | | | | | (0.36% | )(g) |
Supplemental data | | | | | | | | | | | | | | | | | | | | |
Net assets, end of period (in thousands) | | | | $7,487 | | | | | $10,652 | | | | | $15,165 | | | | | $12,236 | |
Portfolio turnover | | | | 59% | | | | | 84% | | | | | 96% | | | | | 149% | |
Notes to Financial Highlights
| (a) | For the period from August 3, 2009 (commencement of operations) to October 31, 2009. |
| (b) | Rounds to less than $0.01. |
| (c) | During the six months ended April 30, 2012, the Investment Manager reimbursed the Fund for a loss on a trading error. Had the Fund not received this reimbursement, total return would have been lower by 0.02%. |
| (d) | During the six months ended April 30, 2012, the Fund received proceeds from a regulatory settlement. Had the Fund not received these proceeds, the total return would have been lower by less than 0.01%. |
| (e) | During the year ended October 31, 2010, the Fund received proceeds from a regulatory settlement. Had the Fund not received these proceeds, the total return would have been lower by 0.03%. |
| (f) | In addition to the fees and expenses which the Fund bears directly, the Fund indirectly bears a pro rata share of the fees and expenses of the acquired funds in which it invests. Such indirect expenses are not included in the reported expense ratios. |
| (h) | The Investment Manager and certain of its affiliates agreed to waive/reimburse certain fees and expenses, if applicable. |
| (i) | The benefits derived from expense reductions had an impact of less than 0.01%. |
The accompanying Notes to Financial Statements are an integral part of this statement.
| | | | |
| COLUMBIA EMERGING MARKETS OPPORTUNITY FUND — 2012 SEMIANNUAL REPORT | | | 27 | |
| | |
| Financial Highlights (continued) | | |
| | | | | | | | | | | | | | | | | | | | | | | | | | | | | | |
| | | Six months
ended April 30, 2012 | | Year ended Oct. 31, |
| | | | 2011 | | 2010 | | 2009 | | 2008 | | 2007 |
| | | (Unaudited) | | | | | | | | | | |
Class R4 | | | | | | | | | | | | | | | | | | | | | | | | | | | | | | |
Per share data | | | | | | | | | | | | | | | | | | | | | | | | | | | | | | |
Net asset value, beginning of period | | | | $8.59 | | | | | $10.15 | | | | | $8.05 | | | | | $5.14 | | | | | $15.32 | | | | | $11.50 | |
Income from investment operations: | | | | | | | | | | | | | | | | | | | | | | | | | | | | | | |
Net investment income (loss) | | | | (0.01 | ) | | | | 0.05 | | | | | 0.05 | | | | | 0.04 | | | | | 0.11 | | | | | 0.05 | |
Net realized and unrealized gain (loss) | | | | 0.41 | | | | | (1.38 | ) | | | | 2.11 | | | | | 2.86 | | | | | (7.45 | ) | | | | 6.41 | |
Increase from payment by affiliate | | | | 0.00 | (a) | | | | — | | | | | — | | | | | — | | | | | — | | | | | — | |
Total from investment operations | | | | 0.40 | | | | | (1.33 | ) | | | | 2.16 | | | | | 2.90 | | | | | (7.34 | ) | | | | 6.46 | |
Less distributions to shareholders from: | | | | | | | | | | | | | | | | | | | | | | | | | | | | | | |
Net investment income | | | | — | | | | | (0.11 | ) | | | | (0.06 | ) | | | | — | | | | | (0.15 | ) | | | | — | |
Net realized gains | | | | (0.63 | ) | | | | (0.12 | ) | | | | — | | | | | — | | | | | (2.69 | ) | | | | (2.64 | ) |
Total distributions to shareholders | | | | (0.63 | ) | | | | (0.23 | ) | | | | (0.06 | ) | | | | — | | | | | (2.84 | ) | | | | (2.64 | ) |
Proceeds from regulatory settlements | | | | 0.00 | (a) | | | | — | | | | | 0.00 | (a) | | | | 0.01 | | | | | — | | | | | — | |
Net asset value, end of period | | | | $8.36 | | | | | $8.59 | | | | | $10.15 | | | | | $8.05 | | | | | $5.14 | | | | | $15.32 | |
Total return | | | | 5.65% | (b)(c) | | | | (13.37% | ) | | | | 26.99% | (d) | | | | 56.62% | (e) | | | | (57.58% | ) | | | | 68.51% | |
Ratios to average net assets(f) | | | | | | | | | | | | | | | | | | | | | | | | | | | | | | |
Expenses prior to fees waived or expenses reimbursed | | | | 1.62% | (g) | | | | 1.59% | | | | | 1.65% | | | | | 1.62% | | | | | 1.73% | | | | | 1.65% | |
Net expenses after fees waived or expenses reimbursed(h) | | | | 1.62% | (g) | | | | 1.59% | | | | | 1.65% | | | | | 1.56% | | | | | 1.47% | | | | | 1.65% | |
Net investment income (loss) | | | | (0.13% | )(g) | | | | 0.49% | | | | | 0.51% | | | | | 0.72% | | | | | 1.12% | | | | | 0.45% | |
Supplemental data | | | | | | | | | | | | | | | | | | | | | | | | | | | | | | |
Net assets, end of period (in thousands) | | | | $599 | | | | | $627 | | | | | $1,402 | | | | | $1,187 | | | | | $782 | | | | | $2,304 | |
Portfolio turnover | | | | 59% | | | | | 84% | | | | | 96% | | | | | 149% | | | | | 133% | | | | | 125% | |
Notes to Financial Highlights
| (a) | Rounds to less than $0.01. |
| (b) | During the six months ended April 30, 2012, the Investment Manager reimbursed the Fund for a loss on a trading error. Had the Fund not received this reimbursement, total return would have been lower by 0.02%. |
| (c) | During the six months ended April 30, 2012, the Fund received proceeds from a regulatory settlement. Had the Fund not received these proceeds, the total return would have been lower by less than 0.01%. |
| (d) | During the year ended October 31, 2010, the Fund received proceeds from a regulatory settlement. Had the Fund not received these proceeds, the total return would have been lower by 0.03%. |
| (e) | During the year ended October 31, 2009, the Fund received proceeds from a regulatory settlement. Had the Fund not received these proceeds, the total return would have been lower by 0.12%. |
| (f) | In addition to the fees and expenses which the Fund bears directly, the Fund indirectly bears a pro rata share of the fees and expenses of the acquired funds in which it invests. Such indirect expenses are not included in the reported expense ratios. |
| (h) | The Investment Manager and certain of its affiliates agreed to waive/reimburse certain fees and expenses, if applicable. |
The accompanying Notes to Financial Statements are an integral part of this statement.
| | |
| 28 | | COLUMBIA EMERGING MARKETS OPPORTUNITY FUND — 2012 SEMIANNUAL REPORT |
| | | | | | | | | | | | | | | | | | | | | | | | | |
| | | Six months
ended April 30, 2012 | | Year ended Oct. 31, |
| | | | 2011 | | 2010 | | 2009 | | 2008(a) |
| | | (Unaudited) | | | | | | | | |
Class R5 | | | | | | | | | | | | | | | | | | | | | | | | | |
Per share data | | | | | | | | | | | | | | | | | | | | | | | | | |
Net asset value, beginning of period | | | | $8.61 | | | | | $10.17 | | | | | $8.06 | | | | | $5.13 | | | | | $9.32 | |
Income from investment operations: | | | | | | | | | | | | | | | | | | | | | | | | | |
Net investment income | | | | 0.00 | (b) | | | | 0.08 | | | | | 0.07 | | | | | 0.05 | | | | | 0.03 | |
Net realized and unrealized gain (loss) | | | | 0.41 | | | | | (1.38 | ) | | | | 2.12 | | | | | 2.87 | | | | | (4.22 | ) |
Increase from payment by affiliate | | | | 0.00 | (b) | | | | — | | | | | — | | | | | — | | | | | — | |
Total from investment operations | | | | 0.41 | | | | | (1.30 | ) | | | | 2.19 | | | | | 2.92 | | | | | (4.19 | ) |
Less distributions to shareholders
from: | | | | | | | | | | | | | | | | | | | | | | | | | |
Net investment income | | | | — | | | | | (0.14 | ) | | | | (0.08 | ) | | | | — | | | | | — | |
Net realized gains | | | | (0.63 | ) | | | | (0.12 | ) | | | | — | | | | | — | | | | | — | |
Total distributions to shareholders | | | | (0.63 | ) | | | | (0.26 | ) | | | | (0.08 | ) | | | | — | | | | | — | |
Proceeds from regulatory settlements | | | | 0.00 | (b) | | | | — | | | | | 0.00 | (b) | | | | 0.01 | | | | | — | |
Net asset value, end of period | | | | $8.39 | | | | | $8.61 | | | | | $10.17 | | | | | $8.06 | | | | | $5.13 | |
Total return | | | | 5.76% | (c)(d) | | | | (13.14% | ) | | | | 27.36% | (e) | | | | 57.12% | (f) | | | | (44.96% | ) |
Ratios to average net assets(g) | | | | | | | | | | | | | | | | | | | | | | | | | |
Expenses prior to fees waived or
expenses reimbursed | | | | 1.38% | (h) | | | | 1.35% | | | | | 1.41% | | | | | 1.31% | | | | | 1.47% | (h) |
Net expenses after fees waived or
expenses reimbursed(i) | | | | 1.38% | (h) | | | | 1.35% | | | | | 1.41% | | | | | 1.31% | | | | | 1.47% | (h) |
Net investment income | | | | 0.12% | (h) | | | | 0.86% | | | | | 0.78% | | | | | 0.68% | | | | | 1.57% | (h) |
Supplemental data | | | | | | | | | | | | | | | | | | | | | | | | | |
Net assets, end of period (in thousands) | | | | $639 | | | | | $622 | | | | | $687 | | | | | $538 | | | | | $3 | |
Portfolio turnover | | | | 59% | | | | | 84% | | | | | 96% | | | | | 149% | | | | | 133% | |
Notes to Financial Highlights
| (a) | For the period from August 1, 2008 (commencement of operations) to October 31, 2008. |
| (b) | Rounds to less than $0.01. |
| (c) | During the six months ended April 30, 2012, the Investment Manager reimbursed the Fund for a loss on a trading error. Had the Fund not received this reimbursement, total return would have been lower by 0.02%. |
| (d) | During the six months ended April 30, 2012, the Fund received proceeds from a regulatory settlement. Had the Fund not received these proceeds, the total return would have been lower by less than 0.01%. |
| (e) | During the year ended October 31, 2010, the Fund received proceeds from a regulatory settlement. Had the Fund not received these proceeds, the total return would have been lower by 0.03%. |
| (f) | During the year ended October 31, 2009, the Fund received proceeds from a regulatory settlement. Had the Fund not received these proceeds, the total return would have been lower by 0.12%. |
| (g) | In addition to the fees and expenses which the Fund bears directly, the Fund indirectly bears a pro rata share of the fees and expenses of the acquired funds in which it invests. Such indirect expenses are not included in the reported expense ratios. |
| (i) | The Investment Manager and certain of its affiliates agreed to waive/reimburse certain fees and expenses, if applicable. |
The accompanying Notes to Financial Statements are an integral part of this statement.
| | | | |
| COLUMBIA EMERGING MARKETS OPPORTUNITY FUND — 2012 SEMIANNUAL REPORT | | | 29 | |
| | |
| Financial Highlights (continued) | | |
| | | | | | | | | | | | | | | |
| | | Six months
ended April 30, 2012 | | Year ended Oct. 31, |
| | | | 2011 | | 2010(a) |
| | | (Unaudited) | | | | |
Class W | | | | | | | | | | | | | | | |
Per share data | | | | | | | | | | | | | | | |
Net asset value, beginning of period | | | | $8.21 | | | | | $9.75 | | | | | $9.23 | |
Income from investment operations: | | | | | | | | | | | | | | | |
Net investment income (loss) | | | | 0.00 | (b) | | | | 0.03 | | | | | (0.01 | ) |
Net realized and unrealized gain (loss) | | | | 0.37 | | | | | (1.32 | ) | | | | 0.53 | |
Increase from payment by affiliate | | | | 0.00 | (b) | | | | — | | | | | — | |
Total from investment operations | | | | 0.37 | | | | | (1.29 | ) | | | | 0.52 | |
Less distributions to shareholders
from: | | | | | | | | | | | | | | | |
Net investment income | | | | — | | | | | (0.13 | ) | | | | — | |
Net realized gains | | | | (0.63 | ) | | | | (0.12 | ) | | | | — | |
Total distributions to shareholders | | | | (0.63 | ) | | | | (0.25 | ) | | | | — | |
Net asset value, end of period | | | | $7.95 | | | | | $8.21 | | | | | $9.75 | |
Total return | | | | 5.53% | (c)(d) | | | | (13.56% | ) | | | | 5.63% | |
Ratios to average net assets(e) | | | | | | | | | | | | | | | |
Expenses prior to fees waived or
expenses reimbursed | | | | 1.81% | (f) | | | | 1.82% | | | | | 1.89% | (f) |
Net expenses after fees waived or
expenses reimbursed(g) | | | | 1.81% | (f) | | | | 1.82% | (h) | | | | 1.89% | (f) |
Net investment income (loss) | | | | 0.07% | (f) | | | | 0.37% | (h) | | | | (0.71% | )(f) |
Supplemental data | | | | | | | | | | | | | | | |
Net assets, end of period (in thousands) | | | | $37 | | | | | $2 | | | | | $3 | |
Portfolio turnover | | | | 59% | | | | | 84% | | | | | 96% | |
Notes to Financial Highlights
| (a) | For the period from September 27, 2010 (commencement of operations) to October 31, 2010. |
| (b) | Rounds to less than $0.01. |
| (c) | During the six months ended April 30, 2012, the Investment Manager reimbursed the Fund for a loss on a trading error. Had the Fund not received this reimbursement, total return would have been lower by 0.02%. |
| (d) | During the six months ended April 30, 2012, the Fund received proceeds from a regulatory settlement. Had the Fund not received these proceeds, the total return would have been lower by less than 0.01%. |
| (e) | In addition to the fees and expenses which the Fund bears directly, the Fund indirectly bears a pro rata share of the fees and expenses of the acquired funds in which it invests. Such indirect expenses are not included in the reported expense ratios. |
| (g) | The Investment Manager and certain of its affiliates agreed to waive/reimburse certain fees and expenses, if applicable. |
| (h) | The benefits derived from expense reductions had an impact of less than 0.01%. |
The accompanying Notes to Financial Statements are an integral part of this statement.
| | |
| 30 | | COLUMBIA EMERGING MARKETS OPPORTUNITY FUND — 2012 SEMIANNUAL REPORT |
| | | | | | | | | | | | |
| | | Six months
ended April 30, 2012 | | | Year ended Oct. 31, | |
| | | | 2011 | | | 2010(a) | |
| | | (Unaudited) | | | | | | | |
Class Z | | | | | | | | | | | | |
Per share data | | | | | | | | | | | | |
Net asset value, beginning of period | | | $8.57 | | | | $10.14 | | | | $9.60 | |
Income from investment operations: | | | | | | | | | | | | |
Net investment income | | | (0.00 | )(b) | | | 0.13 | | | | 0.00 | (b) |
Net realized and unrealized gain (loss) | | | 0.40 | | | | (1.44 | ) | | | 0.54 | |
Increase from payment by affiliate | | | 0.00 | (b) | | | — | | | | — | |
Total from investment operations | | | 0.40 | | | | (1.31 | ) | | | 0.54 | |
Less distributions to shareholders
from: | | | | | | | | | | | | |
Net investment income | | | — | | | | (0.14 | ) | | | — | |
Net realized gains | | | (0.63 | ) | | | (0.12 | ) | | | — | |
Total distributions to shareholders | | | (0.63 | ) | | | (0.26 | ) | | | — | |
Proceeds from regulatory settlements | | | 0.00 | (b) | | | — | | | | — | |
Net asset value, end of period | | | $8.34 | | | | $8.57 | | | | $10.14 | |
Total return | | | 5.65% | (c)(d) | | | (13.25% | ) | | | 5.63% | |
Ratios to average net assets(e) | | | | | | | | | | | | |
Expenses prior to fees waived or
expenses reimbursed | | | 1.57% | (f) | | | 1.59% | | | | 1.56% | (f) |
Net expenses after fees waived or
expenses reimbursed(g) | | | 1.57% | (f)(h) | | | 1.59% | (h) | | | 1.56% | (f) |
Net investment income (loss) | | | (0.06% | )(f)(h) | | | 1.36% | (h) | | | (0.46% | )(f) |
Supplemental data | | | | | | | | | | | | |
Net assets, end of period (in thousands) | | | $1,130 | | | | $1,005 | | | | $21 | |
Portfolio turnover | | | 59% | | | | 84% | | | | 96% | |
Notes to Financial Highlights
| (a) | For the period from September 27, 2010 (commencement of operations) to October 31, 2010. |
| (b) | Rounds to less than $0.01. |
| (c) | During the six months ended April 30, 2012, the Investment Manager reimbursed the Fund for a loss on a trading error. Had the Fund not received this reimbursement, total return would have been lower by 0.02%. |
| (d) | During the six months ended April 30, 2012, the Fund received proceeds from a regulatory settlement. Had the Fund not received these proceeds, the total return would have been lower by less than 0.01%. |
| (e) | In addition to the fees and expenses which the Fund bears directly, the Fund indirectly bears a pro rata share of the fees and expenses of the acquired funds in which it invests. Such indirect expenses are not included in the reported expense ratios. |
| (g) | The Investment Manager and certain of its affiliates agreed to waive/reimburse certain fees and expenses, if applicable. |
| (h) | The benefits derived from expense reductions had an impact of less than 0.01%. |
The accompanying Notes to Financial Statements are an integral part of this statement.
| | | | |
| COLUMBIA EMERGING MARKETS OPPORTUNITY FUND — 2012 SEMIANNUAL REPORT | | | 31 | |
| | |
| Notes to Financial Statements | | |
April 30, 2012 (Unaudited)
Columbia Emerging Markets Opportunity Fund (the Fund), a series of Columbia Funds Series Trust II (the Trust), is a diversified fund. The Trust is registered under the Investment Company Act of 1940, as amended (the 1940 Act), as an open-end management investment company organized as a Massachusetts business trust.
Fund Shares
The Trust may issue an unlimited number of shares (without par value). The Fund offers Class A, Class B, Class C, Class I, Class R, Class R4, Class R5, Class W and Class Z shares. All share classes have identical voting, dividend and liquidation rights. Each share class has its own expense structure and sales charges, as applicable.
Class A shares are subject to a maximum front-end sales charge of 5.75% based on the initial investment amount. Class A shares purchased without an initial sales charge in accounts aggregating $1 million to $50 million at the time of purchase are subject to a contingent deferred sales charge (CDSC) if the shares are sold within 18 months of purchase, charged as follows: 1.00% CDSC if redeemed within 12 months of purchase, and 0.50% CDSC if redeemed more than 12, but less than 18, months after purchase.
Class B shares may be subject to a maximum CDSC of 5.00% based upon the holding period after purchase. Class B shares will generally convert to Class A shares eight years after purchase. The Fund no longer accepts investments by new or existing investors in the Fund’s Class B shares, except in connection with the reinvestment of any dividend and/or capital gain distributions in Class B shares of the Fund and exchanges by existing Class B shareholders of certain other funds within the Columbia Family of Funds.
Class C shares are subject to a 1.00% CDSC on shares redeemed within one year of purchase.
Class I shares are not subject to sales charges and are only available to the Columbia Family of Funds.
Class R shares are not subject to sales charges and are only available to qualifying institutional investors.
Class R4 shares are not subject to sales charges; however, this share class is closed to new investors.
Class R5 shares are not subject to sales charges; however, this share class is closed to new investors.
| | |
| 32 | | COLUMBIA EMERGING MARKETS OPPORTUNITY FUND — 2012 SEMIANNUAL REPORT |
Class W shares are not subject to sales charges and are only available to investors purchasing through authorized investment programs managed by investment professionals, including discretionary managed account programs.
Class Z shares are not subject to sales charges, and are only available to certain investors, as described in the Fund’s prospectus.
| Note 2. Summary | of Significant Accounting Policies |
Use of Estimates
The preparation of financial statements in accordance with U.S. generally accepted accounting principles (GAAP) requires management to make certain estimates and assumptions that affect the reported amounts of assets and liabilities, the disclosure of contingent assets and liabilities at the date of the financial statements and the reported amounts of revenue and expenses during the reporting period. Actual results could differ from those estimates.
The following is a summary of significant accounting policies consistently followed by the Fund in the preparation of its financial statements.
Security Valuation
All equity securities are valued at the close of business of the New York Stock Exchange (NYSE). Equity securities are valued at the last quoted sales price on the principal exchange or market on which they trade, except for securities traded on the NASDAQ Stock Market, which are valued at the NASDAQ official close price. Unlisted securities or listed securities for which there were no sales during the day are valued at the mean of the latest quoted bid and asked prices on such exchanges or markets.
Debt securities generally are valued by pricing services approved by the Board of Trustees (the Board) based upon market transactions for normal, institutional-size trading units of similar securities. The services may use various pricing techniques which take into account appropriate factors such as yield, quality, coupon rate, maturity, type of issue, trading characteristics and other data, as well as broker quotes. Debt securities for which quotations are readily available may also be valued based upon an over-the-counter or exchange bid quotation.
Foreign securities are valued based on quotations from the principal market in which such securities are normally traded. If any foreign share prices are not readily available as a result of limited share activity the securities are valued at the mean of the latest quoted bid and asked prices on such exchanges or markets. Foreign currency exchange rates are generally determined at 4:00 p.m. Eastern (U.S.) time. However, many securities markets and exchanges outside the U.S. close prior to the close of the NYSE; therefore, the closing prices for securities in
| | | | |
| COLUMBIA EMERGING MARKETS OPPORTUNITY FUND — 2012 SEMIANNUAL REPORT | | | 33 | |
| | |
| Notes to Financial Statements (continued) | | |
such markets or on such exchanges may not fully reflect events that occur after such close but before the close of the NYSE. In those situations, foreign securities will be fair valued pursuant to the policy adopted by the Board, including utilizing a third party pricing service to determine these fair values. The third party pricing service takes into account multiple factors, including, but not limited to, movements in the U.S. securities markets, certain depositary receipts, futures contracts and foreign exchange rates that have occurred subsequent to the close of the foreign exchange, to determine a good faith estimate that reasonably reflects the current market conditions as of the close of the NYSE. The fair value of a security is likely to be different from the quoted or published price, if available.
Investments in other open-end investment companies, including money market funds, are valued at net asset value.
Short-term securities purchased within 60 days to maturity are valued at amortized cost, which approximates market value. The value of short-term securities originally purchased with maturities greater than 60 days is determined based on an amortized value to par upon reaching 60 days to maturity. Short-term securities maturing in more than 60 days from the valuation date are valued at the market price or approximate market value based on current interest rates.
Investments for which market quotations are not readily available, or that have quotations which management believes are not reliable, are valued at fair value as determined in good faith under consistently applied procedures established by and under the general supervision of the Board. If a security or class of securities (such as foreign securities) is valued at fair value, such value is likely to be different from the last quoted market price for the security. The determination of fair value often requires significant judgment. To determine fair value, management may use assumptions including but not limited to future cash flows and estimated risk premiums. Multiple inputs from various sources may be used to determine value.
Foreign Currency Transactions and Translation
The values of all assets and liabilities denominated in foreign currencies are translated into U.S. dollars at that day’s exchange rates. Net realized and unrealized gains (losses) on foreign currency transactions and translations include gains (losses) arising from the fluctuation in exchange rates between trade and settlement dates on securities transactions, gains (losses) arising from the disposition of foreign currency and currency gains (losses) between the accrual and payment dates on dividends, interest income and foreign withholding taxes.
| | |
| 34 | | COLUMBIA EMERGING MARKETS OPPORTUNITY FUND — 2012 SEMIANNUAL REPORT |
For financial statement purposes, the Fund does not distinguish that portion of gains (losses) on investments which is due to changes in foreign exchange rates from that which is due to changes in market prices of the investments. Such fluctuations are included with the net realized and unrealized gains (losses) on investments in the Statement of Operations.
Repurchase Agreements
The Fund may engage in repurchase agreement transactions with institutions that management has determined are creditworthy. The Fund, through the custodian, receives delivery of the underlying securities collateralizing a repurchase agreement. Management is responsible for determining that the collateral is at least equal, at all times, to the value of the repurchase obligation including interest. A repurchase agreement transaction involves certain risks in the event of default or insolvency of the counterparty. These risks include possible delays in or restrictions on a Fund’s ability to dispose of the underlying securities and a possible decline in the value of the underlying securities during the period while the Fund seeks to assert its rights.
Security Transactions
Security transactions are accounted for on the trade date. Cost is determined and gains (losses) are based upon the specific identification method for both financial statement and federal income tax purposes.
Income Recognition
Corporate actions and dividend income are recorded net of any non-reclaimable tax withholdings, on the ex-dividend date or upon receipt of ex-dividend notification in the case of certain foreign securities.
Interest income is recorded on the accrual basis.
Awards from class action litigation are recorded as a reduction of cost basis if the Fund still owns the applicable securities on the payment date. If the Fund no longer owns the applicable securities, the proceeds are recorded as realized gains.
Expenses
General expenses of the Trust are allocated to the Fund and other funds of the Trust based upon relative net assets or other expense allocation methodologies determined by the nature of the expense. Expenses directly attributable to the Fund are charged to the Fund. Expenses directly attributable to a specific class of shares are charged to that share class.
Determination of Class Net Asset Value
All income, expenses (other than class-specific expenses, which are charged to that share class, as shown in the Statement of Operations) and realized and unrealized gains (losses) are allocated to each class of the Fund on a daily basis,
| | | | |
| COLUMBIA EMERGING MARKETS OPPORTUNITY FUND — 2012 SEMIANNUAL REPORT | | | 35 | |
| | |
| Notes to Financial Statements (continued) | | |
based on the relative net assets of each class, for purposes of determining the net asset value of each class.
Federal Income Tax Status
The Fund intends to qualify each year as a regulated investment company under Subchapter M of the Internal Revenue Code, as amended, and will distribute substantially all of its taxable income (including net short-term capital gains), if any, for its tax year, and as such will not be subject to federal income taxes. In addition, the Fund intends to distribute in each calendar year substantially all of its net investment income, capital gains and certain other amounts, if any, such that the Fund should not be subject to federal excise tax. Therefore, no federal income or excise tax provision is recorded.
Foreign Taxes
The Fund may be subject to foreign taxes on income, gains on investments or currency repatriation, a portion of which may be recoverable. The Fund will accrue such taxes and recoveries, as applicable, based upon its current interpretation of tax rules and regulations that exist in the markets in which it invests.
Realized gains in certain countries may be subject to foreign taxes at the Fund level, based on statutory rates. The Fund accrues for such foreign taxes on net realized and unrealized gains at the appropriate rate for each jurisdiction, as applicable.
Distributions to Shareholders
Distributions from net investment income are declared and paid annually. Net realized capital gains, if any, are distributed along with the income dividend. Income distributions and capital gain distributions are determined in accordance with federal income tax regulations which may differ from GAAP.
Guarantees and Indemnifications
Under the Trust’s organizational documents and, in some cases, by contract, its officers and trustees are indemnified against certain liabilities arising out of the performance of their duties to the Trust or its funds. In addition, certain of the Fund’s contracts with its service providers contain general indemnification clauses. The Fund’s maximum exposure under these arrangements is unknown since the amount of any future claims that may be made against the Fund cannot be determined, and the Fund has no historical basis for predicting the likelihood of any such claims.
| | |
| 36 | | COLUMBIA EMERGING MARKETS OPPORTUNITY FUND — 2012 SEMIANNUAL REPORT |
Recent Accounting Pronouncement
Fair Value Measurements and Disclosures
In May 2011, the Financial Accounting Standards Board (FASB) issued ASU No. 2011-04 modifying Topic 820, Fair Value Measurements and Disclosures. At the same time, the International Accounting Standards Board (IASB) issued International Financial Reporting Standard 13, Fair Value Measurement. The objective of the FASB and IASB is convergence of their guidance on fair value measurements and disclosures.
Specifically, ASU No. 2011-04 requires reporting entities to disclose i) the amounts of any transfers between Level 1 and Level 2, and the reasons for the transfers, ii) for Level 3 fair value measurements, a) quantitative information about significant unobservable inputs used, b) a description of the valuation processes used by the reporting entity and c) a narrative description of the sensitivity of the fair value measurement to changes in unobservable inputs if a change in those inputs might result in a significantly higher or lower fair value measurement. The effective date of ASU No. 2011-04 is for interim and annual periods beginning after December 15, 2011. At this time, management is evaluating the implications of this guidance and the impact it will have on the financial statement amounts and footnote disclosures, if any.
| Note 3. Fees | and Compensation Paid to Affiliates |
Investment Management Fees
Under an Investment Management Services Agreement, Columbia Management Investment Advisers, LLC (the Investment Manager), a wholly-owned subsidiary of Ameriprise Financial, Inc. (Ameriprise Financial), is responsible for the ultimate oversight of investments made by the Fund. The Fund’s subadviser (see Subadvisory Agreement below) has the primary responsibility for the day-to-day portfolio management of the Fund. The management fee is an annual fee that is equal to a percentage of the Fund’s average daily net assets that declines from 1.100% to 0.900% as the Fund’s net assets increase. The annualized effective management fee rate for the six months ended April 30, 2012 was 1.09% of the Fund’s average daily net assets.
Subadvisory Agreement
The Investment Manager has entered into a Subadvisory Agreement with Threadneedle International Limited (Threadneedle), an affiliate of the Investment Manager and wholly-owned subsidiary of Ameriprise Financial, the subadviser of the Fund. The Investment Manager compensates Threadneedle to manage the investments of the Fund’s assets.
| | | | |
| COLUMBIA EMERGING MARKETS OPPORTUNITY FUND — 2012 SEMIANNUAL REPORT | | | 37 | |
| | |
| Notes to Financial Statements (continued) | | |
Administration Fees
Under an Administrative Services Agreement, the Investment Manager serves as the Fund Administrator. The Fund pays the Fund Administrator an annual fee for administration and accounting services equal to a percentage of the Fund’s average daily net assets that declines from 0.08% to 0.05% as the Fund’s net assets increase. The annualized effective administration fee rate for the six months ended April 30, 2012 was 0.08% of the Fund’s average daily net assets.
Other Expenses
Other expenses are for, among other things, certain expenses of the Fund or the Board, including: Fund boardroom and office expense, employee compensation, employee health and retirement benefits, and certain other expenses. Payment of these Fund and Board expenses is facilitated by a company providing limited administrative services to the Fund and the Board.
For the six months ended April 30, 2012, other expenses paid to this company were $1,537.
Compensation of Board Members
Board members are compensated for their services to the Fund as disclosed in the Statement of Operations. Under a Deferred Compensation Plan (the Plan), the Board members who are not “interested persons” of the Fund, as defined under the 1940 Act, may elect to defer payment of up to 100% of their compensation. Deferred amounts are treated as though equivalent dollar amounts had been invested in shares of certain funds managed by the Investment Manager. The Fund’s liability for these amounts is adjusted for market value changes and remains in the Fund until distributed in accordance with the Plan.
Transfer Agent Fees
Under a Transfer and Dividend Disbursing Agent Agreement, Columbia Management Investment Services Corp. (the Transfer Agent), an affiliate of the Investment Manager and a wholly-owned subsidiary of Ameriprise Financial, is responsible for providing transfer agency services to the Fund. The Transfer Agent has contracted with Boston Financial Data Services (BFDS) to serve as sub-transfer agent.
The Transfer Agent receives monthly account-based service fees based on the number of open accounts and is reimbursed by the Fund for the fees and expenses the Transfer Agent pays to financial intermediaries that maintain omnibus accounts with the Fund that is a percentage of the average aggregate value of the Fund’s shares maintained in each such omnibus account (other than omnibus accounts for which American Enterprise Investment Services Inc. is the broker of record or accounts where the beneficial shareholder is a customer of Ameriprise Financial Services, Inc., which are paid a per account fee). The
| | |
| 38 | | COLUMBIA EMERGING MARKETS OPPORTUNITY FUND — 2012 SEMIANNUAL REPORT |
Transfer Agent pays the fees of BFDS for services as sub-transfer agent and is not entitled to reimbursement for such fees from the Fund (with the exception of out-of-pocket fees).
The Transfer Agent also receives compensation from fees for various shareholder services and reimbursements for certain out-of-pocket expenses. Class I shares do not pay transfer agent fees. Total transfer agent fees for Class R4 and Class R5 shares are subject to an annual limitation of not more than 0.05% of the average daily net assets attributable to each share class.
For the six months ended April 30, 2012, the Fund’s annualized effective transfer agent fee rates as a percentage of average daily net assets of each class were as follows:
| | | | |
Class A | | | 0.28 | % |
Class B | | | 0.30 | |
Class C | | | 0.29 | |
Class R | | | 0.29 | |
Class R4 | | | 0.05 | |
Class R5 | | | 0.05 | |
Class W | | | 0.25 | |
Class Z | | | 0.25 | |
The Fund and certain other associated investment companies (together, the Guarantors), have severally, but not jointly, guaranteed the performance and observance of all the terms and conditions of a lease entered into by Seligman Data Corp. (SDC), the former transfer agent, including the payment of rent by SDC (the Guaranty). The lease and the Guaranty expire in January 2019. At April 30, 2012, the Fund’s total potential future obligation over the life of the Guaranty is $93,958. The liability remaining at April 30, 2012 for non-recurring charges associated with the lease amounted to $62,945 and is included within other accrued expenses in the Statement of Assets and Liabilities.
An annual minimum account balance fee of $20 may apply to certain accounts with a value below the Fund’s initial minimum investment requirements to reduce the impact of small accounts on transfer agent fees. These minimum account balance fees are recorded as part of expense reductions in the Statement of Operations. For the six months ended April 30, 2012, these minimum account balance fees reduced total expenses by $20.
Plan Administration Fees
Under a Plan Administration Services Agreement with the Transfer Agent, the Fund pays an annual fee at a rate of 0.25% of the Fund’s average daily net assets attributable to Class R4 shares for the provision of various administrative, recordkeeping, communication and educational services.
| | | | |
| COLUMBIA EMERGING MARKETS OPPORTUNITY FUND — 2012 SEMIANNUAL REPORT | | | 39 | |
| | |
| Notes to Financial Statements (continued) | | |
Distribution Fees
The Fund has an agreement with Columbia Management Investment Distributors, Inc. (the Distributor), an affiliate of the Investment Manager and a wholly-owned subsidiary of Ameriprise Financial, for distribution and shareholder services. Under a Plan and Agreement of Distribution pursuant to Rule 12b-1, the Fund pays a fee at an annual rate of up to 0.25% of the Fund’s average daily net assets attributable to Class A and Class W shares, a fee at an annual rate of up to 0.50% of the Fund’s average daily net assets attributable to Class R shares (of which up to 0.25% may be used for shareholder services) and a fee at an annual rate of up to 1.00% of the Fund’s average daily net assets attributable to Class B and Class C shares. For Class B and Class C shares, of the 1.00% fee, up to 0.75% is reimbursed for distribution expenses.
The amount of distribution expenses incurred by the Distributor and not yet reimbursed (unreimbursed expense) was approximately $685,000 and $1,364,000 for Class B and Class C shares, respectively. These amounts are based on the most recent information available as of March 31, 2012, and may be recovered from future payments under the distribution plan or CDSCs. To the extent the unreimbursed expense has been fully recovered, the distribution fee is reduced.
Sales Charges
Sales charges, including front-end charges and CDSCs, received by the Distributor for distributing Fund shares were $186,125 for Class A, $6,254 for Class B and $760 for Class C shares for the six months ended April 30, 2012.
Expenses Waived/Reimbursed by the Investment Manager and its Affiliates
Effective January 1, 2012, the Investment Manager and certain of its affiliates have contractually agreed to waive fees and/or reimburse expenses (excluding certain fees and expenses described below), through February 28, 2013, unless sooner terminated at the sole discretion of the Board, so that the Fund’s net operating expenses, after giving effect to fees waived/expenses reimbursed and any balance credits and/or overdraft charges from the Fund’s custodian, do not exceed the following annual rates as a percentage of the class’ average daily net assets:
| | | | |
Class A | | | 1.85 | % |
Class B | | | 2.60 | |
Class C | | | 2.60 | |
Class I | | | 1.42 | |
Class R | | | 2.10 | |
Class R4 | | | 1.72 | |
Class R5 | | | 1.47 | |
Class W | | | 1.85 | |
Class Z | | | 1.60 | |
| | |
| 40 | | COLUMBIA EMERGING MARKETS OPPORTUNITY FUND — 2012 SEMIANNUAL REPORT |
Prior to January 1, 2012, the Investment Manager and its affiliates contractually agreed to waive fees and/or reimburse expenses (excluding certain fees and expenses described below), so that the Fund’s net operating expenses, after giving effect to fees waived/expenses reimbursed and any balance credits and/or overdraft charges from the Fund’s custodian, did not exceed the following annual rates as a percentage of the class’ average daily net assets:
| | | | |
Class A | | | 1.85 | % |
Class B | | | 2.60 | |
Class C | | | 2.60 | |
Class I | | | 1.41 | |
Class R | | | 2.10 | |
Class R4 | | | 1.71 | |
Class R5 | | | 1.46 | |
Class W | | | 1.85 | |
Class Z | | | 1.60 | |
Under the agreement, the following fees and expenses are excluded from the waiver/reimbursement commitment, and therefore will be paid by the Fund, if applicable: taxes (including foreign transaction taxes), expenses associated with investments in affiliated and non-affiliated pooled investment vehicles (including mutual funds and exchange traded funds), transaction costs and brokerage commissions, costs related to any securities lending program, dividend expenses associated with securities sold short, inverse floater program fees and expenses, transaction charges and interest on borrowed money, interest, extraordinary expenses and any other expenses the exclusion of which is specifically approved by the Board. This agreement may be modified or amended only with approval from all parties.
| Note 4. Federal | Tax Information |
The timing and character of income and capital gain distributions are determined in accordance with income tax regulations, which may differ from GAAP because of temporary or permanent book to tax differences.
At April 30, 2012, the cost of investments for federal income tax purposes was approximately $378,560,000 and the aggregate gross approximate unrealized appreciation and depreciation based on that cost was:
| | | | |
Unrealized appreciation | | $ | 61,288,000 | |
Unrealized depreciation | | | (17,304,000 | ) |
Net unrealized appreciation | | $ | 43,984,000 | |
| | | | |
| COLUMBIA EMERGING MARKETS OPPORTUNITY FUND — 2012 SEMIANNUAL REPORT | | | 41 | |
| | |
| Notes to Financial Statements (continued) | | |
Management of the Fund has concluded that there are no significant uncertain tax positions that would require recognition in the financial statements. However, management’s conclusion may be subject to review and adjustment at a later date based on factors including, but not limited to, new tax laws, regulations, and administrative interpretations (including relevant court decisions). Generally, the Fund’s federal tax returns for the prior three fiscal years remain subject to examination by the Internal Revenue Service.
| Note 5. Portfolio | Information |
The cost of purchases and proceeds from sales of securities, excluding short-term obligations, aggregated to $256,029,086 and $311,714,382, respectively, for the six months ended April 30, 2012.
Note 6. Regulatory Settlements
During the six months ended April 30, 2012, the Fund received $12,908 as a result of a regulatory settlement proceeding brought by the Securities and Exchange Commission against an unaffiliated third party relating to market timing and/or late trading of mutual funds. This amount represented the Fund’s portion of the proceeds from the settlement (the Fund was not a party to the proceedings). The payments have been included in “Proceeds from regulatory settlements” in the Statement of Changes in Net Assets.
| Note 7. Payments | by Affiliates |
During the six months ended April 30, 2012, an affiliate of the Investment Manager reimbursed the Fund $78,049 due to certain shareholder transactions processed at an incorrect price. The payment has been included in “Increase from payment by affiliate” on the Statement of Operations.
| Note 8. Lending | of Portfolio Securities |
The Fund has entered into a Master Securities Lending Agreement (the Agreement) with JPMorgan Chase Bank, N.A. (JPMorgan). The Agreement authorizes JPMorgan as lending agent to lend securities to authorized borrowers in order to generate additional income on behalf of the Fund. Pursuant to the Agreement, the securities loaned are secured by cash or U.S. government securities equal to at least 100% of the market value of the loaned securities. Any additional collateral required to maintain those levels due to market fluctuations of the loaned securities is requested to be delivered the following business day. Cash collateral received is invested by the lending agent on behalf of the Fund into authorized investments pursuant to the Agreement. The investments made with the cash collateral are listed in the Portfolio of Investments. The values of
| | |
| 42 | | COLUMBIA EMERGING MARKETS OPPORTUNITY FUND — 2012 SEMIANNUAL REPORT |
such investments and any uninvested cash collateral are disclosed in the Statement of Assets and Liabilities along with the related obligation to return the collateral upon the return of the securities loaned.
Risks of delay in recovery of securities or even loss of rights in the securities may occur should the borrower of the securities fail financially. Risks may also arise to the extent that the value of the securities loaned increases above the value of the collateral received. JPMorgan will indemnify the Fund from losses resulting from a borrower’s failure to return a loaned security when due. Such indemnification does not extend to losses associated with declines in the value of cash collateral investments. The Investment Manager is not responsible for any losses incurred by the Fund in connection with the securities lending program. Loans are subject to termination by the Fund or the borrower at any time, and are, therefore, not considered to be illiquid investments.
Pursuant to the Agreement, the Fund receives income for lending its securities either in the form of fees or by earning interest on invested cash collateral, net of negotiated rebates paid to borrowers and fees paid to the lending agent for services provided and any other securities lending expenses. Net income earned from securities lending for the six months ended April 30, 2012 is disclosed in the Statement of Operations. The Fund continues to earn and accrue interest and dividends on the securities loaned.
At April 30, 2012, securities valued at $3,280,706 were on loan, secured by cash collateral of $3,396,291 (which does not reflect calls for collateral made to borrowers by JPMorgan at period end) that is partially or fully invested in short-term securities or other cash equivalents.
| Note 9. Affiliated | Money Market Fund |
The Fund may invest its daily cash balances in Columbia Short-Term Cash Fund, an affiliated money market fund established for the exclusive use by the Fund and other affiliated funds. The income earned by the Fund from such investments is included as “Dividends from affiliates” in the Statement of Operations. As an investing fund, the Fund indirectly bears its proportionate share of the expenses of Columbia Short-Term Cash Fund.
| Note 10. Shareholder | Concentration |
At April 30, 2012, one unaffiliated shareholder account owned 21.5% of the outstanding shares of the Fund. The Fund has no knowledge about whether any portion of those shares was owned beneficially by such account. Subscription and redemption activity by concentrated accounts may have a significant effect on the operations of the Fund.
| | | | |
| COLUMBIA EMERGING MARKETS OPPORTUNITY FUND — 2012 SEMIANNUAL REPORT | | | 43 | |
| | |
| Notes to Financial Statements (continued) | | |
The Fund has entered into a revolving credit facility with a syndicate of banks led by JPMorgan Chase Bank, N.A. (the Administrative Agent), whereby the Fund may borrow for the temporary funding of shareholder redemptions or for other temporary or emergency purposes. The credit facility agreement, as amended, which is a collective agreement between the Fund and certain other funds managed by the Investment Manager, severally and not jointly, permits collective borrowings up to $500 million. Pursuant to a December 13, 2011 amendment to the credit facility agreement, interest is charged to each participating fund based on its borrowings at a rate equal to the higher of (i) the overnight federal funds rate plus 1.00% or (i) the one-month LIBOR rate plus 1.00%. Each borrowing under the credit facility matures no later than 60 days after the date of borrowing. The Fund also pays a commitment fee equal to its pro rata share of the amount of the credit facility at a rate of 0.08% per annum.
Prior to December 13, 2011, interest was charged to each participating fund based on its borrowings at a rate equal to the sum of the federal funds rate plus (i) 1.25% per annum plus (ii) if one-month LIBOR exceeds the federal funds rate, the amount of such excess. The Fund also paid a commitment fee equal to its pro rata share of the amount of the credit facility at a rate of 0.10% per annum.
The Fund had no borrowings during the six months ended April 30, 2012.
| Note 12. Significant | Risks |
Foreign Securities Risk
Investing in foreign securities may include certain risks and considerations not typically associated with investing in U.S. securities, such as fluctuating currency values and changing local and regional economic, political and social conditions, which may result in greater market volatility. In addition, certain foreign securities may not be as liquid as U.S. securities. Investing in emerging markets may accentuate these risks.
Investments in emerging market countries are subject to additional risk. The risk of foreign investments is typically increased in less developed countries. These countries are also more likely to experience high levels of inflation, deflation or currency devaluation which could hurt their economies and securities markets.
| Note 13. Subsequent | Events |
Management has evaluated the events and transactions that have occurred through the date the financial statements were issued and noted no items requiring adjustment of the financial statements or additional disclosure.
| | |
| 44 | | COLUMBIA EMERGING MARKETS OPPORTUNITY FUND — 2012 SEMIANNUAL REPORT |
| Note 14. Information | Regarding Pending and Settled Legal Proceedings |
In December 2005, without admitting or denying the allegations, American Express Financial Corporation (AEFC, which is now known as Ameriprise Financial, Inc. (Ameriprise Financial)) entered into settlement agreements with the Securities and Exchange Commission (SEC) and Minnesota Department of Commerce (MDOC) related to market timing activities. As a result, AEFC was censured and ordered to cease and desist from committing or causing any violations of certain provisions of the Investment Advisers Act of 1940, the Investment Company Act of 1940, and various Minnesota laws. AEFC agreed to pay disgorgement of $10 million and civil money penalties of $7 million. AEFC also agreed to retain an independent distribution consultant to assist in developing a plan for distribution of all disgorgement and civil penalties ordered by the SEC in accordance with various undertakings detailed at www.sec.gov/litigation/admin/ia-2451.pdf. Ameriprise Financial and its affiliates have cooperated with the SEC and the MDOC in these legal proceedings, and have made regular reports to the funds’ Boards of Trustees.
Ameriprise Financial and certain of its affiliates have historically been involved in a number of legal, arbitration and regulatory proceedings, including routine litigation, class actions, and governmental actions, concerning matters arising in connection with the conduct of their business activities. Ameriprise Financial believes that the Funds are not currently the subject of, and that neither Ameriprise Financial nor any of its affiliates are the subject of, any pending legal, arbitration or regulatory proceedings that are likely to have a material adverse effect on the Funds or the ability of Ameriprise Financial or its affiliates to perform under their contracts with the Funds. Ameriprise Financial is required to make 10-Q, 10-K and, as necessary, 8-K filings with the Securities and Exchange Commission on legal and regulatory matters that relate to Ameriprise Financial and its affiliates. Copies of these filings may be obtained by accessing the SEC website at www.sec.gov.
There can be no assurance that these matters, or the adverse publicity associated with them, will not result in increased fund redemptions, reduced sale of fund shares or other adverse consequences to the Funds. Further, although we believe proceedings are not likely to have a material adverse effect on the Funds or the ability of Ameriprise Financial or its affiliates to perform under their contracts with the Funds, these proceedings are subject to uncertainties and, as such, we are unable to estimate the possible loss or range of loss that may result. An adverse outcome in one or more of these proceedings could result in adverse judgments, settlements, fines, penalties or other relief that could have a material adverse effect on the consolidated financial condition or results of operations of Ameriprise Financial.
| | | | |
| COLUMBIA EMERGING MARKETS OPPORTUNITY FUND — 2012 SEMIANNUAL REPORT | | | 45 | |
The policy of the Board is to vote the proxies of the companies in which the Fund holds investments consistent with the procedures as stated in the Statement of Additional Information (SAI). You may obtain a copy of the SAI without charge by calling 800.345.6611; contacting your financial intermediary; visiting columbiamanagement.com; or searching the website of the Securities and Exchange Commission (SEC) at www.sec.gov. Information regarding how the Fund voted proxies relating to portfolio securities is filed with the SEC by August 31 for the most recent 12-month period ending June 30 of that year, and is available without charge by visiting columbiamanagement.com; or searching the website of the SEC at www.sec.gov.
| | |
| Approval of Investment Management Services |
| |
| and Subadvisory Agreements | | |
Columbia Management Investment Advisers, LLC (“Columbia Management” or the “investment manager”), a wholly-owned subsidiary of Ameriprise Financial, Inc. (“Ameriprise Financial”), serves as the investment manager to Columbia Emerging Markets Opportunity Fund (the “Fund”). Under an investment management services agreement (the “IMS Agreement”), Columbia Management provides investment advice and other services to the Fund and all funds distributed by Columbia Management Investment Distributors, Inc. (collectively, the “Funds”). In addition, under a Subadvisory Agreement (the “Subadvisory Agreement”) between Columbia Management and Threadneedle International Limited (the “Subadviser”), an affiliate of Columbia Management, the Subadviser has provided portfolio management and related services for the Fund.
On an annual basis, the Fund’s Board of Trustees (the “Board”), including the independent Board members (the “Independent Trustees”), considers renewal of the IMS Agreement and the Subadvisory Agreement (together, the “Advisory Agreements”). Columbia Management prepared detailed reports for the Board and its Contracts Committee in March and April 2012, including reports based on analyses of data provided by an independent organization and a comprehensive response to each item of information requested by independent legal counsel to the Independent Trustees (“Independent Legal Counsel”) in a letter to the investment manager, to assist the Board in making this determination. All of the materials presented in March and April were first supplied in draft form to designated representatives of the Independent Trustees, i.e., Independent Legal Counsel, the Chair of the Board and the Chair of the Contracts Committee (including materials relating to the Fund’s expense cap), and the final materials were revised to reflect comments provided by these Board representatives. In addition, throughout the year, the Board (or its committees) regularly meets with portfolio management teams and senior management
| | |
| 46 | | COLUMBIA EMERGING MARKETS OPPORTUNITY FUND — 2012 SEMIANNUAL REPORT |
personnel and reviews information prepared by Columbia Management addressing the services Columbia Management provides and Fund performance. The Board accords particular weight to the work, deliberations and conclusions of the Contracts Committee, the Investment Review Committee and the Compliance Committee in determining whether to continue the Advisory Agreements.
The Board, at its April 10-12, 2012 in-person Board meeting (the “April Meeting”), considered the renewal of the Advisory Agreements for an additional one-year term. At the April Meeting, Independent Legal Counsel reviewed with the Independent Trustees various factors relevant to the Board’s consideration of advisory and subadvisory agreements and the Board’s legal responsibilities related to such consideration. Following an analysis and discussion of the factors identified below, the Board, including all of the Independent Trustees, approved the renewal of each of the Advisory Agreements.
Nature, Extent and Quality of Services Provided by Columbia Management and the Subadviser: The Board considered its analysis of various reports and presentations received by it or one of its committees detailing the services performed by Columbia Management and the Subadviser, as well as their history, reputation, expertise, resources and relative capabilities, and the qualifications of their personnel.
With respect to Columbia Management, the Board specifically considered many developments during the past year concerning the services provided by Columbia Management, including, in particular, the continued investment in, and resources dedicated to, the Funds’ operations and the successful completion of various integration initiatives and the consolidation of dozens of Funds. The Board noted the information it received concerning Columbia Management’s ability to retain key portfolio management personnel. In that connection, the Board took into account its meetings with Columbia Management’s Chief Investment Officer (the “CIO”) and considered the CIO’s successful execution of additional risk and portfolio management oversight applied to the Funds. The Board also assessed Columbia Management’s significant investment in upgrading technology (such as an equity trading system) and considered management’s commitments to enhance existing resources in this area.
In connection with the Board’s evaluation of the overall package of services provided by Columbia Management, the Board also considered the quality of administrative services provided to the Fund by Columbia Management. The Board also reviewed the financial condition of Columbia Management and its affiliates and their ability to carry out their responsibilities under the IMS
| | | | |
| COLUMBIA EMERGING MARKETS OPPORTUNITY FUND — 2012 SEMIANNUAL REPORT | | | 47 | |
| | |
Approval of Investment Management Services |
| |
| and Subadvisory Agreements (continued) | | |
Agreement and the Fund’s other service agreements with affiliates of Ameriprise Financial. In addition, the Board discussed the acceptability of the terms of the IMS Agreement (including the relatively broad scope of services required to be performed by Columbia Management). The Board concluded that the services being performed under the IMS Agreement were of a reasonably high quality.
Based on the foregoing, and based on other information received (both oral and written, including the information on investment performance referenced below) and other considerations, the Board concluded that Columbia Management and its affiliates were in a position to continue to provide a high quality and level of services to the Fund.
With respect to the Subadviser, the Board observed that it had previously approved the Subadviser’s code of ethics and compliance program, that the Chief Compliance Officer of the Fund continues to monitor the code and the program, and that no material issues have been reported. The Board also considered the Subadviser’s investment strategy/style, including particularly as it relates to the Fund, as well as the experience of the personnel that manage the Fund. The Board also considered the financial condition of the Subadviser and its capability and wherewithal to carry out its responsibilities under the Subadvisory Agreement. In addition, the Board discussed the acceptability of the terms of the Subadvisory Agreement including the scope of services required to be performed. The Board noted that the terms of the Subadvisory Agreement are generally consistent with the terms of other subadviser agreements for subadvisers who manage other funds managed by the investment manager. It was observed that no changes were recommended to the Subadvisory Agreement. Based on the foregoing, and based on other information received (both oral and written) and other considerations, including, in particular, the performance of the Fund (discussed below) as well as the investment manager’s recommendation that the Board approve renewal of the Subadvisory Agreement with the Subadviser the Board concluded that the services being performed under the Subadvisory Agreement were of a reasonably high quality.
Based on the foregoing, and based on other information received (both oral and written, including the information on investment performance referenced below) and other considerations, the Board concluded that the Subadviser was in a position to continue to provide a high quality and level of services to the Fund.
Investment Performance: For purposes of evaluating the nature, extent and quality of services provided under the Advisory Agreements, the Board carefully reviewed the investment performance of the Fund. In this regard, the Board considered detailed reports providing the results of analyses performed by an
| | |
| 48 | | COLUMBIA EMERGING MARKETS OPPORTUNITY FUND — 2012 SEMIANNUAL REPORT |
independent organization showing, for various periods, the performance of the Fund, the performance of a benchmark index, the percentage ranking of the Fund among its comparison group and the net assets of the Fund. The Board observed that the Fund’s investment performance was appropriate in light of the particular management style. The Board observed that the relatively recent portfolio management changes were intended to help improve the Fund’s performance.
Additionally, the Board reviewed the performance of the Subadviser and Columbia Management’s process for monitoring the Subadviser. The Board considered, in particular, management’s rationale for recommending the continued retention of the Subadviser.
Comparative Fees, Costs of Services Provided and the Profits Realized By Columbia Management, its Affiliates and the Subadviser from their Relationships with the Fund: The Board reviewed comparative fees and the costs of services provided under each of the Advisory Agreements. The Board members considered detailed comparative information set forth in an annual report on fees and expenses, including, among other things, data (based on analyses conducted by an independent organization) showing a comparison of the Fund’s expenses with median expenses paid by funds in its comparative peer universe, as well as data showing the Fund’s contribution to Columbia Management’s profitability. The Board reviewed the fees charged to comparable institutional or other accounts/vehicles managed by Columbia Management and discussed differences in how the products are managed and operated, noting no unreasonable differences in the levels of contractual fees.
The Board accorded particular weight to the notion that the level of fees should reflect a rational pricing model applied consistently across the various product lines in the Fund family, while assuring that the overall fees for each Fund (with few defined exceptions) are generally in line with the “pricing philosophy” (i.e., that the total expense ratio of the Fund is at, or below, the median expense ratio of funds in the same comparison universe of the Fund). The Board took into account that the Fund’s total expense ratio (after considering proposed expense caps/waivers) approximated the peer universe’s median expense ratio. Additionally, the Board reviewed the level of subadvisory fees paid to the Subadviser, noting that the fees are paid by the investment manager and do not impact the fees paid by the Fund. The Board observed that the subadvisory fee level for the Subadviser was generally comparable to those charged by other subadvisers to similar funds managed by the investment manager. The Board also reviewed fee rates charged by the Subadviser to other client accounts. Based
| | | | |
| COLUMBIA EMERGING MARKETS OPPORTUNITY FUND — 2012 SEMIANNUAL REPORT | | | 49 | |
| | |
Approval of Investment Management Services |
| |
| and Subadvisory Agreements (continued) | | |
on its review, the Board concluded that the Fund’s management and subadvisory fees were fair and reasonable in light of the extent and quality of services that the Fund receives.
The Board also considered the expected profitability of Columbia Management and its affiliates in connection with Columbia Management providing investment management services to the Fund. In this regard, the Board referred to a detailed profitability report, discussing the profitability to Columbia Management and Ameriprise Financial from managing, operating and distributing the Funds. In this regard, the Board observed that 2011 profitability, while slightly lower than 2010, was generally in line with the reported profitability of other asset management firms. The Board also considered the indirect economic benefits flowing to Columbia Management or its affiliates in connection with managing or distributing the Funds, such as the enhanced ability to offer various other financial products to Ameriprise Financial customers, soft dollar benefits and overall reputational advantages. The Board noted that the fees paid by the Fund should permit the investment manager to offer competitive compensation to its personnel, make necessary investments in its business and earn an appropriate profit. The Board concluded that profitability levels were reasonable.
Economies of Scale to be Realized: The Board also considered the economies of scale that might be realized by Columbia Management as the Fund grows and took note of the extent to which Fund shareholders might also benefit from such growth.
Based on the foregoing, the Board, including all of the Independent Trustees, concluded that fees payable under the Advisory Agreements were fair and reasonable in light of the extent and quality of services provided. In reaching this conclusion, no single factor was determinative. At the April Meeting, the Board, including all of the Independent Trustees, approved the renewal of the Advisory Agreements.
| | |
| 50 | | COLUMBIA EMERGING MARKETS OPPORTUNITY FUND — 2012 SEMIANNUAL REPORT |
Columbia Emerging Markets Opportunity Fund
P.O. Box 8081
Boston, MA 02266-8081
columbiamanagement.com
| | | | |
 | | This report must be accompanied or preceded by the Fund’s current prospectus. The
Fund is distributed by Columbia Management Investment Distributors, Inc., member
FINRA, and managed by Columbia Management Investment Advisers, LLC. ©2012 Columbia Management Investment Advisers, LLC. All rights reserved. | | S-6344 V (6/12) |
Semiannual Report

Columbia
European Equity Fund
Semiannual Report for the Period Ended April 30, 2012
Columbia European Equity Fund seeks to provide shareholders with capital appreciation.
Not FDIC insured ¡ No bank guarantee ¡ May lose value
| | | | |
| |
Your Fund at a Glance | | | 2 | |
| |
Fund Expense Example | | | 6 | |
| |
Portfolio of Investments | | | 8 | |
| |
Statement of Assets and Liabilities | | | 15 | |
| |
Statement of Operations | | | 17 | |
| |
Statement of Changes in Net Assets | | | 18 | |
| |
Financial Highlights | | | 20 | |
| |
Notes to Financial Statements | | | 26 | |
| |
Proxy Voting | | | 40 | |
| |
Approval of Investment Management Services and Subadvisory Agreements | | | 40 | |
See the Fund’s prospectus for risks associated with investing in the Fund.
| | | | |
| COLUMBIA EUROPEAN EQUITY FUND — 2012 SEMIANNUAL REPORT | | | 1 | |
FUND SUMMARY
| > | | Columbia European Equity Fund (the Fund) Class A shares gained 6.32% (excluding sales charge) for the six months ended April 30, 2012. |
| > | | The Fund outperformed its benchmark, the MSCI Europe Index (Net), which gained 1.65% during the same six-month period. |
ANNUALIZED TOTAL RETURNS (for period ended April 30, 2012)
| | | | | | | | | | | | | | | | |
| | | 6 months* | | | 1 year | | | 5 years | | | 10 years | |
Columbia European Equity Fund
Class A (excluding sales charge) | | | +6.32% | | | | -12.55% | | | | -0.61% | | | | +6.25% | |
MSCI Europe Index (Net)(1) (unmanaged) | | | +1.65% | | | | -16.36% | | | | -5.62% | | | | +5.26% | |
MSCI Europe Index (Gross)(1) (unmanaged) | | | +2.02% | | | | -15.77% | | | | -5.03% | | | | +5.83% | |
The performance information shown represents past performance and is not a guarantee of future results. The investment return and principal value of your investment will fluctuate so that your shares, when redeemed, may be worth more or less than their original cost. Current performance may be lower or higher than the performance information shown. You may obtain performance information current to the most recent month-end by contacting your financial intermediary, visiting columbiamanagement.com or calling 800.345.6611.
The 5.75% sales charge applicable to Class A shares of the Fund is not reflected in the table above. If reflected, returns would be lower than those shown. The performance of other classes may vary from that shown because of differences in fees and expenses. The Fund’s returns reflect the effect of fee waivers/expense reimbursements, if any. Without such waivers/reimbursements, the Fund’s returns would be lower. See the Average Annual Total Returns table for performance of other share classes of the Fund.
The indicies do not reflect the effects of sales charges, expenses and taxes (except the MSCI Europe Index (Net), which reflects reinvested dividends net of withholding taxes). It is not possible to invest directly in an index.
| (1) | | The MSCI Europe Index (Net) and the MSCI Europe Index (Gross), each an unmanaged index of equity securities, are designed to measure equity market performance in the global developed and emerging markets. Each index reflects reinvestment of all distributions and changes in market prices. On September 30, 2011, the MSCI Europe Index (Net) replaced the MSCI Europe Index (Gross) as the Fund’s primary benchmark. The Fund’s Investment Manager made this recommendation to the Fund’s Board because the Investment Manager believes that the Net version of the index better reflects how dividends paid to the Fund on foreign securities generally are treated for tax purposes and, therefore, provides a more appropriate basis for comparing the Fund’s performance. Information on both versions of the index will be included for a one-year transition period. Thereafter, only the Net version will be included. |
| | |
| 2 | | COLUMBIA EUROPEAN EQUITY FUND — 2012 SEMIANNUAL REPORT |
AVERAGE ANNUAL TOTAL RETURNS
| | | | | | | | | | | | | | | | |
| at April 30, 2012 | | | | | | | | | | | | |
| Without sales charge | | 6 months* | | | 1 year | | | 5 years | | | 10 years | |
Class A (inception 6/26/00) | | | +6.32% | | | | -12.55% | | | | -0.61% | | | | +6.25% | |
Class B (inception 6/26/00) | | | +5.88% | | | | -13.12% | | | | -1.36% | | | | +5.45% | |
Class C (inception 6/26/00) | | | +5.75% | | | | -13.24% | | | | -1.37% | | | | +5.44% | |
Class I** (inception 7/15/04) | | | +6.60% | | | | -11.96% | | | | -0.02% | | | | +6.71% | |
Class R4 (inception 6/26/00) | | | +6.51% | | | | -12.13% | | | | -0.31% | | | | +6.53% | |
Class Z** (inception 9/27/10) | | | +6.34% | | | | -12.34% | | | | -0.47% | | | | +6.32% | |
| | | | |
| With sales charge | | | | | | | | | | | | |
Class A (inception 6/26/00) | | | +0.27% | | | | -17.63% | | | | -1.78% | | | | +5.63% | |
Class B (inception 6/26/00) | | | +0.88% | | | | -17.47% | | | | -1.75% | | | | +5.45% | |
Class C (inception 6/26/00) | | | +4.75% | | | | -14.11% | | | | -1.37% | | | | +5.44% | |
The “Without sales charge” returns for Class A, Class B and Class C shares do not include applicable initial or contingent deferred sales charges. If included, returns would be lower than those shown. The “With sales charge” returns for Class A, Class B and Class C shares include: the maximum initial sales charge of 5.75% for Class A shares; the applicable contingent deferred sales charge (CDSC) for Class B shares (applied as follows: first year 5%; second year 4%; third and fourth years 3%; fifth year 2%; sixth year 1%; no sales charge thereafter); and a 1% CDSC for Class C shares sold within one year after purchase. The Fund’s other share classes are not subject to sales charges and have limited eligibility. See the Fund’s prospectuses for details.
| ** | The returns shown for periods prior to the share class inception date (including returns since inception, which are since Fund inception) include the returns of the Fund’s Class A shares. These returns are adjusted to reflect any higher class-related operating expenses of the newer share classes, as applicable. Please visit columbiamanagement.com/mutual-fund/appended-performance for more information. |
| | | | |
| COLUMBIA EUROPEAN EQUITY FUND — 2012 SEMIANNUAL REPORT | | | 3 | |
| | |
| Your Fund at a Glance (continued) | | |
| | | | |
| COUNTRY BREAKDOWN(1) (at April 30, 2012) | | | |
Denmark | | | 2.8 | % |
Finland | | | 1.1 | |
France | | | 12.0 | |
Germany | | | 21.0 | |
Italy | | | 1.1 | |
Netherlands | | | 5.4 | |
Norway | | | 0.8 | |
Portugal | | | 0.9 | |
Spain | | | 3.3 | |
Sweden | | | 5.7 | |
Switzerland | | | 10.1 | |
United Kingdom | | | 35.7 | |
Other(2) | | | 0.1 | |
| (1) | | Percentages indicated are based upon total investments (excluding Investments of Cash Collateral Received for Securities on Loan). The Fund’s portfolio composition is subject to change. |
| (2) | | Includes investments in Money Market Funds. |
| | | | |
| TOP TEN HOLDINGS(1) (at April 30, 2012) | | | |
Nestlé SA, Registered Shares (Switzerland) | | | 4.5 | % |
BG Group PLC (United Kingdom) | | | 4.1 | |
Novo Nordisk A/S, Class B (Denmark) | | | 2.8 | |
Diageo PLC (United Kingdom) | | | 2.7 | |
GlaxoSmithKline PLC (United Kingdom) | | | 2.5 | |
Fresenius Medical Care AG & Co. KGaA (Germany) | | | 2.4 | |
Unilever PLC (United Kingdom) | | | 2.3 | |
Standard Chartered PLC (United Kingdom) | | | 2.3 | |
Allianz SE, Registered Shares (Germany) | | | 2.2 | |
BASF SE (Germany) | | | 2.1 | |
| (1) | | Percentages indicated are based upon total investments (excluding Investments of Cash Collateral Received for Securities on Loan and Money Market Funds). |
For further detail about these holdings, please refer to the section entitled “Portfolio of Investments.”
Fund holdings are as of the date given, are subject to change at any time, and are not recommendations to buy or sell any security.
| | |
| 4 | | COLUMBIA EUROPEAN EQUITY FUND — 2012 SEMIANNUAL REPORT |
MORNINGSTAR STYLE BOXTM
| | |
 | | The Morningstar Style BoxTM is based on the Fund’s portfolio holdings.
For equity funds, the vertical axis shows the market capitalization of the
stocks owned, and the horizontal axis shows investment style (value,
blend, or growth). Information shown is based on the most recent data
provided by Morningstar. |
©2012 Morningstar, Inc. All rights reserved. The Morningstar information contained herein: (1) is proprietary to Morningstar and/or its content providers; (2) may not be copied or distributed; and (3) is not warranted to be accurate, complete, or timely. Neither Morningstar nor its content providers are responsible for any damages or losses arising from any use of this information. Past performance is no guarantee of future results.
| | | | |
| COLUMBIA EUROPEAN EQUITY FUND — 2012 SEMIANNUAL REPORT | | | 5 | |
(Unaudited)
Understanding your expenses
As an investor, you incur two types of costs. There are transaction costs, which generally include sales charges on purchases and may include redemption fees. There are also ongoing costs, which generally include management fees, distribution and service (Rule 12b-1) fees, and other fund expenses. The following information is intended to help you understand your ongoing costs (in dollars) of investing in the Fund and to help you compare these costs with the ongoing costs of investing in other mutual funds.
Analyzing your fund’s expenses
To illustrate these ongoing costs, we have provided examples and calculated the expenses paid by investors in each share class of the Fund during the period. The actual and hypothetical information in the table is based on an initial investment of $1,000 at the beginning of the period indicated and held for the entire period. Expense information is calculated two ways and each method provides you with different information. The amount listed in the “Actual” column is calculated using the Fund’s actual operating expenses and total return for the period. You may use the Actual information, together with the amount invested, to estimate the expenses that you paid over the period. Simply divide your account value by $1,000 (for example, an $8,600 account value divided by $1,000 = 8.6), then multiply the results by the expenses paid during the period under the Actual column. The amount listed in the “Hypothetical” column assumes a 5% annual rate of return before expenses (which is not the Fund’s actual return) and then applies the Fund’s actual expense ratio for the period to the hypothetical return. You should not use the hypothetical account values and expenses to estimate either your actual account balance at the end of the period or the expenses you paid during the period. See “Compare with other funds” below for details on how to use the hypothetical data.
Compare with other funds
Since all mutual funds are required to include the same hypothetical calculations about expenses in shareholder reports, you can use this information to compare the ongoing cost of investing in the Fund with other funds. To do so, compare the hypothetical example with the 5% hypothetical examples that appear in the shareholder reports of other funds. As you compare hypothetical examples of other funds, it is important to note that hypothetical examples are meant to highlight the ongoing costs of investing in a fund only and do not reflect any transaction costs, such as sales charges, or redemption or exchange fees. Therefore, the hypothetical calculations are useful in comparing ongoing costs only, and will not help you determine the relative total costs of owning different funds. If transaction costs were included in these calculations, your costs would be higher.
| | |
| 6 | | COLUMBIA EUROPEAN EQUITY FUND — 2012 SEMIANNUAL REPORT |
November 1, 2011 — April 30, 2012
| | | | | | | | | | | | | | | | | | | | | | | | | | | | |
| | | Account value at
the beginning of the
period ($) | | | Account value at the
end of the period ($) | | | Expenses paid
during the period ($) | | | Fund’s
annualized
expense
ratio (%) | |
| | | Actual | | | Hypothetical | | | Actual | | | Hypothetical | | | Actual | | | Hypothetical | | | Actual | |
Class A | | | 1,000.00 | | | | 1,000.00 | | | | 1,063.20 | | | | 1,017.45 | | | | 7.64 | | | | 7.47 | | | | 1.49 | |
Class B | | | 1,000.00 | | | | 1,000.00 | | | | 1,058.80 | | | | 1,013.72 | | | | 11.47 | | | | 11.22 | | | | 2.24 | |
Class C | | | 1,000.00 | | | | 1,000.00 | | | | 1,057.50 | | | | 1,013.72 | | | | 11.46 | | | | 11.22 | | | | 2.24 | |
Class I | | | 1,000.00 | | | | 1,000.00 | | | | 1,066.00 | | | | 1,020.19 | | | | 4.83 | | | | 4.72 | | | | 0.94 | |
Class R4 | | | 1,000.00 | | | | 1,000.00 | | | | 1,065.10 | | | | 1,018.70 | | | | 6.37 | | | | 6.22 | | | | 1.24 | |
Class Z | | | 1,000.00 | | | | 1,000.00 | | | | 1,063.40 | | | | 1,018.75 | | | | 6.31 | | | | 6.17 | | | | 1.23 | |
Expenses paid during the period are equal to the annualized expense ratio for each class as indicated above, multiplied by the average account value over the period and then multiplied by the number of days in the Fund’s most recent fiscal half year and divided by 366.
Expenses do not include fees and expenses incurred indirectly by the Fund from the underlying funds in which the Fund may invest (also referred to as “acquired funds”), including affiliated and non-affiliated pooled investment vehicles (including mutual funds and exchange traded funds).
| | | | |
| COLUMBIA EUROPEAN EQUITY FUND — 2012 SEMIANNUAL REPORT | | | 7 | |
Columbia European Equity Fund
April 30, 2012 (Unaudited)
(Percentages represent value of investments compared to net assets)
| | | | | | | | |
| Issuer | | Shares | | | Value | |
| | | | | | | | |
| Common Stocks 95.4% | |
DENMARK 2.8% | |
Novo Nordisk A/S, Class B | | | 56,967 | | | | $8,402,840 | |
| | |
FINLAND 1.1% | | | | | | | | |
KONE OYJ, Class B | | | 52,706 | | | | 3,261,605 | |
| | |
FRANCE 11.9% | | | | | | | | |
Air Liquide SA | | | 35,502 | | | | 4,566,408 | |
AtoS | | | 34,576 | | | | 2,226,855 | |
BNP Paribas SA | | | 105,314 | | | | 4,230,917 | |
Cap Gemini SA | | | 51,061 | | | | 1,993,213 | |
Edenred | | | 166,686 | | | | 5,324,099 | |
Eutelsat Communications SA | | | 94,128 | | | | 3,350,420 | |
Publicis Groupe SA | | | 97,191 | | | | 5,012,273 | |
Rexel Sa | | | 97,779 | | | | 2,044,995 | |
Safran SA | | | 83,585 | | | | 3,097,962 | |
Schneider Electric SA(a) | | | 71,072 | | | | 4,366,161 | |
| | | | | | | | |
Total | | | | | | | 36,213,303 | |
| | |
GERMANY 17.1% | | | | | | | | |
Allianz SE, Registered Shares | | | 58,414 | | | | 6,509,019 | |
BASF SE(b) | | | 75,951 | | | | 6,252,357 | |
Bayerische Motoren Werke AG | | | 62,459 | | | | 5,937,035 | |
Brenntag AG | | | 28,154 | | | | 3,506,868 | |
Continental AG | | | 15,989 | | | | 1,549,675 | |
Deutsche Bank AG, Registered Shares | | | 66,817 | | | | 2,907,210 | |
Fresenius Medical Care AG & Co. KGaA | | | 101,704 | | | | 7,219,972 | |
Kabel Deutschland Holding AG(a) | | | 84,827 | | | | 5,344,791 | |
Lanxess AG | | | 46,292 | | | | 3,685,796 | |
Linde AG | | | 32,094 | | | | 5,493,031 | |
SAP AG | | | 54,570 | | | | 3,618,217 | |
| | | | | | | | |
Total | | | | | | | 52,023,971 | |
| | |
ITALY 1.1% | | | | | | | | |
Saipem SpA | | | 65,902 | | | | 3,255,592 | |
| | |
NETHERLANDS 5.4% | | | | | | | | |
ASML Holding NV(b) | | | 68,524 | | | | 3,486,710 | |
European Aeronautic Defence and Space Co. NV | | | 121,189 | | | | 4,784,464 | |
ING Groep NV-CVA(a) | | | 697,109 | | | | 4,915,561 | |
Koninklijke DSM NV | | | 57,002 | | | | 3,268,271 | |
| | | | | | | | |
Total | | | | | | | 16,455,006 | |
| | | | | | | | |
| Issuer | | Shares | | | Value | |
| | | | | | | | |
| Common Stocks (continued) | |
NORWAY 0.7% | | | | | | | | |
Subsea 7 SA(a) | | | 88,819 | | | | $2,301,585 | |
| | |
PORTUGAL 0.9% | | | | | | | | |
Galp Energia SGPS SA | | | 184,725 | | | | 2,907,349 | |
| | |
SPAIN 3.3% | | | | | | | | |
Amadeus IT Holding SA, Class A | | | 174,691 | | | | 3,570,323 | |
Banco Bilbao Vizcaya Argentaria SA | | | 536,350 | | | | 3,625,090 | |
Inditex SA(b) | | | 30,644 | | | | 2,756,288 | |
| | | | | | | | |
Total | | | | | | | 9,951,701 | |
| | |
SWEDEN 5.7% | | | | | | | | |
Atlas Copco AB, Class A | | | 180,254 | | | | 4,290,932 | |
Getinge AB, Series CPO | | | 97,185 | | | | 2,608,450 | |
Swedish Match AB | | | 149,952 | | | | 6,095,084 | |
Volvo AB B Shares(b) | | | 309,977 | | | | 4,298,254 | |
| | | | | | | | |
Total | | | | | | | 17,292,720 | |
| | |
SWITZERLAND 10.0% | | | | | | | | |
Nestlé SA, Registered Shares | | | 219,387 | | | | 13,439,010 | |
Novartis AG, Registered Shares | | | 54,207 | | | | 2,989,104 | |
SGS SA, Registered Shares | | | 1,686 | | | | 3,256,275 | |
Sika AG | | | 1,178 | | | | 2,495,779 | |
Swatch Group AG (The), Registered Shares | | | 71,425 | | | | 5,697,317 | |
UBS AG, Registered Shares(a) | | | 215,252 | | | | 2,686,945 | |
| | | | | | | | |
Total | | | | | | | 30,564,430 | |
| | |
UNITED KINGDOM 35.4% | | | | | | | | |
Aggreko PLC | | | 126,853 | | | | 4,634,127 | |
ARM Holdings PLC | | | 306,130 | | | | 2,603,328 | |
Barclays PLC | | | 867,339 | | | | 3,072,096 | |
BG Group PLC | | | 523,694 | | | | 12,327,841 | |
British American Tobacco PLC | | | 89,801 | | | | 4,603,864 | |
Diageo PLC | | | 325,819 | | | | 8,201,247 | |
Experian PLC | | | 339,965 | | | | 5,365,566 | |
GlaxoSmithKline PLC | | | 329,891 | | | | 7,629,165 | |
IMI PLC | | | 242,566 | | | | 3,895,269 | |
Johnson Matthey PLC | | | 87,195 | | | | 3,274,512 | |
Legal & General Group PLC | | | 1,503,030 | | | | 2,868,578 | |
Persimmon PLC | | | 582,550 | | | | 5,941,966 | |
Prudential PLC | | | 297,105 | | | | 3,637,985 | |
The accompanying Notes to Financial Statements are an integral part of this statement.
| | |
| 8 | | COLUMBIA EUROPEAN EQUITY FUND — 2012 SEMIANNUAL REPORT |
| | | | | | | | |
| Issuer | | Shares | | | Value | |
| | | | | | | | |
| Common Stocks (continued) | |
UNITED KINGDOM (cont.) | |
Rio Tinto PLC | | | 83,365 | | | | $4,643,934 | |
Shire PLC | | | 154,574 | | | | 5,042,248 | |
Smith & Nephew PLC | | | 311,002 | | | | 3,061,158 | |
Standard Chartered PLC | | | 279,754 | | | | 6,837,431 | |
Tullow Oil PLC | | | 238,237 | | | | 5,930,978 | |
Unilever PLC | | | 200,968 | | | | 6,858,954 | |
Weir Group PLC (The) | | | 147,945 | | | | 4,093,703 | |
Wolseley PLC | | | 84,925 | | | | 3,229,234 | |
| | | | | | | | |
Total | | | | | | | 107,753,184 | |
Total Common Stocks (Cost: $272,226,084) | | | | | | | $290,383,286 | |
| | | | | | | | |
| Preferred Stocks 3.7% | |
GERMANY 3.7% | | | | | | | | |
Henkel AG & Co. KGaA | | | 54,833 | | | | $4,079,134 | |
Hugo Boss AG(b) | | | 26,081 | | | | 2,910,670 | |
Volkswagen AG(b) | | | 22,428 | | | | 4,248,346 | |
| | | | | | | | |
Total | | | | | | | 11,238,150 | |
Total Preferred Stocks (Cost: $9,677,280) | | | | | | | $11,238,150 | |
| | | | | | | | |
| Rights ��% | | | | | | |
SPAIN —% | | | | | | | | |
Banco Bilbao Vizcaya Argentaria SA(a) | | | 630,835 | | | | $90,184 | |
Total Rights (Cost: $—) | | | | | | | $90,184 | |
| | | | | | | | |
| | | Shares | | | Value | |
| Money Market Funds 0.1% | |
| | | | | | | | |
Columbia Short-Term Cash Fund, 0.144%(c)(d) | | | 206,117 | | | | $206,117 | |
Total Money Market Funds (Cost: $206,117) | | | | | | | $206,117 | |
| | | | | | | | | | | | |
| Issuer | | Effective
Yield | | | Par/
Principal/
Shares | | | Value | |
| | | | | | | | | | | | |
Investments of Cash Collateral
Received for Securities on Loan 7.4% | |
Repurchase Agreements 7.4% | | | | | |
Mizuho Securities USA, Inc.
dated 04/30/12, matures 05/01/12,
repurchase price $2,000,013(e) | |
| | | 0.240 | % | | | $2,000,000 | | | | $2,000,000 | |
Natixis Financial Products, Inc.
dated 04/30/12, matures 05/01/12,
repurchase price $2,000,013(e) | |
| | | 0.240 | % | | | 2,000,000 | | | | 2,000,000 | |
RBS Securities, Inc.
dated 04/30/12, matures 05/01/12,
repurchase price $10,000,058(e) | |
| | | 0.210 | % | | | 10,000,000 | | | | 10,000,000 | |
UBS Securities LLC
dated 04/30/12, matures 05/01/12,
repurchase price $8,447,428(e) | |
| | | 0.210 | % | | | 8,447,378 | | | | 8,447,378 | |
| | | | | | | | | | | | |
Total | | | | | | | | | | | 22,447,378 | |
Total Investments of Cash Collateral Received for Securities on Loan | |
(Cost: $22,447,378) | | | | $22,447,378 | |
Total Investments | | | | | |
(Cost: $304,556,859) | | | | $324,365,115 | |
Other Assets & Liabilities, Net | | | | (20,197,350 | ) |
Net Assets | | | | $304,167,765 | |
The accompanying Notes to Financial Statements are an integral part of this statement.
| | | | |
| COLUMBIA EUROPEAN EQUITY FUND — 2012 SEMIANNUAL REPORT | | | 9 | |
| | |
| Portfolio of Investments (continued) | | |
Summary of Investments in Securities by Industry
The following table represents the portfolio investments of the Fund by industry classifications as a percentage of net assets at April 30, 2012:
| | | | | | | | |
| Industry | | Percentage of Net Assets | | | Value | |
| Aerospace & Defense | | | 2.6 | % | | | $7,882,426 | |
| Auto Components | | | 0.5 | | | | 1,549,675 | |
| Automobiles | �� | | 3.4 | | | | 10,185,381 | |
| Beverages | | | 2.7 | | | | 8,201,247 | |
| Capital Markets | | | 1.8 | | | | 5,594,154 | |
| Chemicals | | | 9.5 | | | | 29,036,154 | |
| Commercial Banks | | | 5.9 | | | | 17,855,718 | |
| Commercial Services & Supplies | | | 3.3 | | | | 9,958,226 | |
| Diversified Financial Services | | | 1.6 | | | | 4,915,561 | |
| Electrical Equipment | | | 1.4 | | | | 4,366,161 | |
| Energy Equipment & Services | | | 1.8 | | | | 5,557,177 | |
| Food Products | | | 6.7 | | | | 20,297,964 | |
| Health Care Equipment & Supplies | | | 1.9 | | | | 5,669,607 | |
| Health Care Providers & Services | | | 2.4 | | | | 7,219,972 | |
| Household Durables | | | 3.3 | | | | 10,021,101 | |
| Insurance | | | 4.3 | | | | 13,015,582 | |
| IT Services | | | 2.6 | | | | 7,790,391 | |
| Machinery | | | 6.5 | | | | 19,839,763 | |
| Media | | | 4.5 | | | | 13,707,484 | |
| Metals & Mining | | | 1.5 | | | | 4,643,934 | |
| Oil, Gas & Consumable Fuels | | | 7.0 | | | | 21,166,168 | |
| Pharmaceuticals | | | 7.9 | | | | 24,063,358 | |
| Professional Services | | | 2.8 | | | | 8,621,841 | |
| Semiconductors & Semiconductor Equipment | | | 2.0 | | | | 6,090,037 | |
| Software | | | 1.2 | | | | 3,618,217 | |
| Specialty Retail | | | 0.9 | | | | 2,756,288 | |
| Textiles, Apparel & Luxury Goods | | | 2.8 | | | | 8,607,987 | |
| Tobacco | | | 3.5 | | | | 10,698,948 | |
| Trading Companies & Distributors | | | 2.9 | | | | 8,781,098 | |
| Other(1) | | | 7.4 | | | | 22,653,495 | |
| Total | | | | | | | $324,365,115 | |
| (1) | Includes Money Market Funds and Investments of Cash Collateral Received for Securities on Loan. |
| | |
| Notes to Portfolio of Investments |
| (b) | At April 30, 2012, security was partially or fully on loan. |
| (c) | The rate shown is the seven-day current annualized yield at April 30, 2012. |
The accompanying Notes to Financial Statements are an integral part of this statement.
| | |
| 10 | | COLUMBIA EUROPEAN EQUITY FUND — 2012 SEMIANNUAL REPORT |
| (d) | Investments in affiliates during the period ended April 30, 2012: |
| | | | | | | | | | | | | | | | | | | | | | | | | | | | |
| Issuer | | Beginning
Cost | | | Purchase Cost | | | Sales Cost/
Proceeds from Sales | | | Realized
Gain/Loss | | | Ending
Cost | | | Dividends
or
Interest
Income | | | Value | |
Columbia Short-Term Cash Fund | | | $12,138,122 | | | | $145,927,811 | | | | $(157,859,816 | ) | | | $— | | | | $206,117 | | | | $4,959 | | | | $206,117 | |
| (e) | The table below represents securities received as collateral for repurchase agreements. This collateral is deposited with the Fund’s custodian and, pursuant to the terms of the repurchase agreement, must have an aggregate value greater than or equal to the repurchase price plus accrued interest at all times. The value of securities and/or cash held as collateral for repurchase agreements is monitored on a daily basis to ensure the proper level of collateral. |
| | | | |
| Mizuho Securities USA, Inc. (0.240%) | | | | |
| |
| Security Description | | Value | |
| Fannie Mae REMICS | | | $1,012,098 | |
| Freddie Mac REMICS | | | 1,027,902 | |
| Total Market Value of Collateral Securities | | | $2,040,000 | |
| |
| Natixis Financial Products, Inc. (0.240%) | | | | |
| |
| Security Description | | Value | |
| Fannie Mae Pool | | | $70,680 | |
| Fannie Mae REMICS | | | 524,641 | |
| Fannie Mae Whole Loan | | | 16,483 | |
| Freddie Mac Gold Pool | | | 148,043 | |
| Freddie Mac Non Gold Pool | | | 38,299 | |
| Freddie Mac REMICS | | | 458,253 | |
| Government National Mortgage Association | | | 326,613 | |
| United States Treasury Note/Bond | | | 457,002 | |
| Total Market Value of Collateral Securities | | | $2,040,014 | |
| |
| RBS Securities, Inc. (0.210%) | | | | |
| |
| Security Description | | Value | |
| United States Treasury Note/Bond | | | $10,200,049 | |
| Total Market Value of Collateral Securities | | | $10,200,049 | |
| |
| UBS Securities LLC (0.210%) | | | | |
| |
| Security Description | | Value | |
| Fannie Mae Pool | | | $6,042,091 | |
| Freddie Mac Gold Pool | | | 2,574,235 | |
| Total Market Value of Collateral Securities | | | $8,616,326 | |
The accompanying Notes to Financial Statements are an integral part of this statement.
| | | | |
| COLUMBIA EUROPEAN EQUITY FUND — 2012 SEMIANNUAL REPORT | | | 11 | |
| | |
| Portfolio of Investments (continued) | | |
Generally accepted accounting principles (GAAP) require disclosure regarding the inputs and valuation techniques used to measure fair value and any changes in valuation inputs or techniques. In addition, investments shall be disclosed by major category.
The Fund categorizes its fair value measurements according to a three-level hierarchy that maximizes the use of observable inputs and minimizes the use of unobservable inputs by prioritizing that the most observable input be used when available. Observable inputs are those that market participants would use in pricing an investment based on market data obtained from sources independent of the reporting entity. Unobservable inputs are those that reflect the Fund’s assumptions about the information market participants would use in pricing an investment. An investment’s level within the fair value hierarchy is based on the lowest level of any input that is deemed significant to the asset or liability’s fair value measurement. The input levels are not necessarily an indication of the risk or liquidity associated with investments at that level. For example, certain U.S. government securities are generally high quality and liquid, however, they are reflected as Level 2 because the inputs used to determine fair value may not always be quoted prices in an active market.
Fair value inputs are summarized in the three broad levels listed below:
| | Ÿ | | Level 1 — Valuations based on quoted prices for investments in active markets that the Fund has the ability to access at the measurement date (including NAV for open-end mutual funds). Valuation adjustments are not applied to Level 1 investments. |
| | Ÿ | | Level 2 — Valuations based on other significant observable inputs (including quoted prices for similar securities, interest rates, prepayment speeds, credit risks, etc.). |
| | Ÿ | | Level 3 — Valuations based on significant unobservable inputs (including the Fund’s own assumptions and judgment in determining the fair value of investments). |
Inputs that are used in determining fair value of an investment may include price information, credit data, volatility statistics, and other factors. These inputs can be either observable or unobservable. The availability of observable inputs can vary between investments, and is affected by various factors such as the type of investment, and the volume and level of activity for that investment or similar investments in the marketplace. The inputs will be considered by the Investment Manager, along with any other relevant factors in the calculation of an investment’s fair value. The Fund uses prices and inputs that are current as of the measurement date, which may include periods of market dislocations. During these periods, the availability of prices and inputs may be reduced for many investments. This condition could cause an investment to be reclassified between the various levels within the hierarchy.
Foreign equity securities actively traded in markets where there is a significant delay in the local close relative to the New York Stock Exchange (NYSE) are classified as Level 2. The values of these securities may include an adjustment to reflect the impact of significant market movements following the close of local trading, as described in Note 2 to the financial statements — Security Valuation.
Investments falling into the Level 3 category are primarily supported by quoted prices from brokers and dealers participating in the market for those investments. However, these may be classified as Level 3 investments due to lack of market transparency and corroboration to support these quoted
The accompanying Notes to Financial Statements are an integral part of this statement.
| | |
| 12 | | COLUMBIA EUROPEAN EQUITY FUND — 2012 SEMIANNUAL REPORT |
| | |
| Fair Value Measurements (continued) |
prices. Additionally, valuation models may be used as the pricing source for any remaining investments classified as Level 3. These models rely on one or more significant unobservable inputs and/or significant assumptions by the Investment Manager. Inputs used in valuations may include, but are not limited to, financial statement analysis, capital account balances, discount rates and estimated cash flows, and comparable company data.
The following table is a summary of the inputs used to value the Fund’s investments as of April 30, 2012:
| | | | | | | | | | | | | | | | |
| | | Fair value at April 30, 2012 | |
| Description | | Level 1
Quoted Prices
in Active
Markets for
Identical Assets | | | Level 2
Other
Significant
Observable
Inputs | | | Level 3
Significant
Unobservable
Inputs | | | Total | |
| Equity Securities | | | | | | | | | | | | | | | | |
Common Stocks | | | | | | | | | | | | | | | | |
Consumer Discretionary | | | $— | | | | $35,589,766 | | | | $— | | | | $35,589,766 | |
Consumer Staples | | | — | | | | 39,198,159 | | | | — | | | | 39,198,159 | |
Energy | | | — | | | | 26,723,345 | | | | — | | | | 26,723,345 | |
Financials | | | — | | | | 41,290,831 | | | | — | | | | 41,290,831 | |
Health Care | | | — | | | | 36,952,937 | | | | — | | | | 36,952,937 | |
Industrials | | | — | | | | 59,449,515 | | | | — | | | | 59,449,515 | |
Information Technology | | | — | | | | 17,498,646 | | | | — | | | | 17,498,646 | |
Materials | | | — | | | | 33,680,087 | | | | — | | | | 33,680,087 | |
Preferred Stocks | | | | | | | | | | | | | | | | |
Consumer Discretionary | | | — | | | | 7,159,016 | | | | — | | | | 7,159,016 | |
Consumer Staples | | | — | | | | 4,079,134 | | | | — | | | | 4,079,134 | |
Rights | | | | | | | | | | | | | | | | |
Financials | | | — | | | | 90,184 | | | | — | | | | 90,184 | |
| Total Equity Securities | | | — | | | | 301,711,620 | | | | — | | | | 301,711,620 | |
| Other | | | | | | | | | | | | | | | | |
Money Market Funds | | | 206,117 | | | | — | | | | — | | | | 206,117 | |
Investments of Cash Collateral Received for Securities on Loan | | | — | | | | 22,447,378 | | | | — | | | | 22,447,378 | |
| Total Other | | | 206,117 | | | | 22,447,378 | | | | — | | | | 22,653,495 | |
| Total | | | $206,117 | | | | $324,158,998 | | | | $— | | | | $324,365,115 | |
See the Portfolio of Investments for all investment classifications not indicated in the table.
The Fund’s assets assigned to the Level 2 input category are generally valued using the market approach, in which a security’s value is determined through reference to prices and information from market transactions for similar or identical assets. These assets include certain foreign securities for which a third party statistical pricing service may be employed for purposes of fair market
The accompanying Notes to Financial Statements are an integral part of this statement.
| | | | |
| COLUMBIA EUROPEAN EQUITY FUND — 2012 SEMIANNUAL REPORT | | | 13 | |
| | |
| Portfolio of Investments (continued) | | |
| | |
| Fair Value Measurements (continued) |
valuation. The models utilized by the third party statistical pricing service take into account a security’s correlation to available market data including, but not limited to, intraday index, ADR, and ETF movements.
There were no transfers of financial assets between Levels 1 and 2 during the period.
How to find information about the Fund’s quarterly portfolio holdings
| (i) | The Fund files its complete schedule of portfolio holdings with the Securities and Exchange Commission (SEC) for the first and third quarters of each fiscal year on Form N-Q; |
| (ii) | The Fund’s Forms N-Q are available on the SEC’s website at www.sec.gov; |
| (iii) | The Fund’s Forms N-Q may be reviewed and copied at the SEC’s Public Reference Room in Washington, DC (information on the operations of the Public Reference Room may be obtained by calling 800.SEC.0330); and |
| (iv) | The Fund’s complete schedule of portfolio holdings, as filed on Form N-Q, can be obtained without charge, upon request, by calling 800.345.6611. |
The accompanying Notes to Financial Statements are an integral part of this statement.
| | |
| 14 | | COLUMBIA EUROPEAN EQUITY FUND — 2012 SEMIANNUAL REPORT |
| | |
| Statement of Assets and Liabilities | | |
April 30, 2012 (Unaudited)
| | | | | |
Assets | |
Investments, at value* | | | | | |
Unaffiliated issuers (identified cost $281,903,364) | | | $ | 301,711,620 | |
Affiliated issuers (identified cost $206,117) | | | | 206,117 | |
Investment of cash collateral received for securities on loan | | | | | |
Repurchase agreements (identified cost $22,447,378) | | | | 22,447,378 | |
Total investments (identified cost $304,556,859) | | | | 324,365,115 | |
Foreign currency (identified cost $521,539) | | | | 521,643 | |
Receivable for: | | | | | |
Investments sold | | | | 7,027,044 | |
Capital shares sold | | | | 34,536 | |
Dividends | | | | 1,085,277 | |
Interest | | | | 35,369 | |
Reclaims | | | | 523,103 | |
Prepaid expense | | | | 2,282 | |
Total assets | | | | 333,594,369 | |
Liabilities | | | | | |
Due upon return of securities on loan | | | | 22,447,378 | |
Payable for: | | | | | |
Investments purchased | | | | 6,802,963 | |
Capital shares purchased | | | | 92,317 | |
Investment management fees | | | | 20,006 | |
Distribution fees | | | | 1,465 | |
Transfer agent fees | | | | 10,710 | |
Administration fees | | | | 2,012 | |
Compensation of board members | | | | 6,562 | |
Other expenses | | | | 43,191 | |
Total liabilities | | | | 29,426,604 | |
Net assets applicable to outstanding capital stock | | | $ | 304,167,765 | |
The accompanying Notes to Financial Statements are an integral part of this statement.
| | | | |
| COLUMBIA EUROPEAN EQUITY FUND — 2012 SEMIANNUAL REPORT | | | 15 | |
| | |
| Statement of Assets and Liabilities (continued) | | |
April 30, 2012 (Unaudited)
| | | | | |
Represented by | | | | | |
Paid-in capital | | | $ | 306,913,484 | |
Undistributed net investment income | | | | 1,999,559 | |
Accumulated net realized loss | | | | (24,580,283 | ) |
Unrealized appreciation (depreciation) on: | | | | | |
Investments | | | | 19,808,256 | |
Foreign currency translations | | | | 26,749 | |
Total — representing net assets applicable to outstanding capital stock | | | $ | 304,167,765 | |
*Value of securities on loan | | | $ | 21,018,398 | |
Net assets applicable to outstanding shares | | | | | |
Class A | | | $ | 55,272,336 | |
Class B | | | $ | 2,217,686 | |
Class C | | | $ | 1,695,844 | |
Class I | | | $ | 244,174,502 | |
Class R4 | | | $ | 16,548 | |
Class Z | | | $ | 790,849 | |
Shares outstanding | | | | | |
Class A | | | | 9,529,593 | |
Class B | | | | 385,272 | |
Class C | | | | 297,411 | |
Class I | | | | 42,039,840 | |
Class R4 | | | | 2,860 | |
Class Z | | | | 136,597 | |
Net asset value per share | | | | | |
Class A(a) | | | $ | 5.80 | |
Class B | | | $ | 5.76 | |
Class C | | | $ | 5.70 | |
Class I | | | $ | 5.81 | |
Class R4 | | | $ | 5.79 | |
Class Z | | | $ | 5.79 | |
| (a) | The maximum offering price per share for Class A is $6.15. The offering price is calculated by dividing the net asset value by 1.0 minus the maximum sales charge of 5.75%. |
The accompanying Notes to Financial Statements are an integral part of this statement.
| | |
| 16 | | COLUMBIA EUROPEAN EQUITY FUND — 2012 SEMIANNUAL REPORT |
Six months ended April 30, 2012 (Unaudited)
| | | | | |
Net investment income | | | | | |
Income: | | | | | |
Dividends | | | $ | 5,499,669 | |
Dividends from affiliates | | | | 4,959 | |
Income from securities lending—net | | | | 108,883 | |
Foreign taxes withheld | | | | (678,025 | ) |
Total income | | | | 4,935,486 | |
Expenses: | | | | | |
Investment management fees | | | | 1,541,956 | |
Distribution fees | | | | | |
Class A | | | | 69,701 | |
Class B | | | | 11,221 | |
Class C | | | | 6,826 | |
Transfer agent fees | | | | | |
Class A | | | | 83,614 | |
Class B | | | | 3,366 | |
Class C | | | | 2,029 | |
Class R4 | | | | 6 | |
Class Z | | | | 831 | |
Administration fees | | | | 155,959 | |
Plan administration fees | | | | | |
Class R4 | | | | 27 | |
Compensation of board members | | | | 7,157 | |
Custodian fees | | | | 23,444 | |
Printing and postage fees | | | | 27,849 | |
Registration fees | | | | 32,011 | |
Professional fees | | | | 22,302 | |
Line of credit interest expense | | | | 928 | |
Other | | | | 11,296 | |
Total expenses | | | | 2,000,523 | |
Net investment income | | | | 2,934,963 | |
Realized and unrealized gain (loss) — net | | | | | |
Net realized gain (loss) on: | | | | | |
Investments | | | | 4,679,874 | |
Foreign currency translations | | | | (48,775 | ) |
Net realized gain | | | | 4,631,099 | |
Net change in unrealized appreciation (depreciation) on: | | | | | |
Investments | | | | 17,052,939 | |
Foreign currency translations | | | | 2,945 | |
Net change in unrealized appreciation | | | | 17,055,884 | |
Net realized and unrealized gain | | | | 21,686,983 | |
Net increase in net assets resulting from operations | | | $ | 24,621,946 | |
The accompanying Notes to Financial Statements are an integral part of this statement.
| | | | |
| COLUMBIA EUROPEAN EQUITY FUND — 2012 SEMIANNUAL REPORT | | | 17 | |
| | |
| Statement of Changes in Net Assets | | |
| | | | | | | | | | |
| | | Six months ended
April 30, 2012 | | Year ended
October 31, 2011 |
| | | (Unaudited) | | |
| | | | | |
Operations | | | | | | | | | | |
Net investment income | | | $ | 2,934,963 | | | | $ | 3,110,943 | |
Net realized gain (loss) | | | | 4,631,099 | | | | | (2,746,431 | ) |
Net change in unrealized appreciation (depreciation) | | | | 17,055,884 | | | | | (12,392,498 | ) |
Net increase (decrease) in net assets resulting from operations | | | | 24,621,946 | | | | | (12,027,986 | ) |
Distributions to shareholders from: | | | | | | | | | | |
Net investment income | | | | | | | | | | |
Class A | | | | (146,906 | ) | | | | (329,400 | ) |
Class I | | | | (2,750,865 | ) | | | | (109,439 | ) |
Class R4 | | | | (156 | ) | | | | (165 | ) |
Class Z | | | | (2,120 | ) | | | | (22 | ) |
Total distributions to shareholders | | | | (2,900,047 | ) | | | | (439,026 | ) |
Increase (decrease) in net assets from share transactions | | | | (100,838,464 | ) | | | | 320,427,314 | |
Total increase (decrease) in net assets | | | | (79,116,565 | ) | | | | 307,960,302 | |
Net assets at beginning of period | | | | 383,284,330 | | | | | 75,324,028 | |
Net assets at end of period | | | $ | 304,167,765 | | | | $ | 383,284,330 | |
Undistributed net investment income | | | $ | 1,999,559 | | | | $ | 1,964,643 | |
The accompanying Notes to Financial Statements are an integral part of this statement.
| | |
| 18 | | COLUMBIA EUROPEAN EQUITY FUND — 2012 SEMIANNUAL REPORT |
| | | | | | | | | | | | | | | | | | | | |
| | | Six months ended
April 30, 2012
(Unaudited) | | Year ended
October 31, 2011 |
| | | Shares | | Dollars ($) | | Shares | | Dollars ($) |
Capital stock activity | | | | | | | | | | | | | | | | | | | | |
Class A shares | | | | | | | | | | | | | | | | | | | | |
Subscriptions(a) | | | | 389,254 | | | | | 2,160,120 | | | | | 2,426,130 | | | | | 14,509,749 | |
Distributions reinvested | | | | 27,218 | | | | | 140,171 | | | | | 52,959 | | | | | 312,457 | |
Redemptions | | | | (1,905,669 | ) | | | | (10,407,900 | ) | | | | (3,504,557 | ) | | | | (20,676,576 | ) |
Net decrease | | | | (1,489,197 | ) | | | | (8,107,609 | ) | | | | (1,025,468 | ) | | | | (5,854,370 | ) |
Class B shares | | | | | | | | | | | | | | | | | | | | |
Subscriptions | | | | 5,017 | | | | | 28,704 | | | | | 68,874 | | | | | 415,718 | |
Redemptions(a) | | | | (57,968 | ) | | | | (319,165 | ) | | | | (331,724 | ) | | | | (1,996,474 | ) |
Net decrease | | | | (52,951 | ) | | | | (290,461 | ) | | | | (262,850 | ) | | | | (1,580,756 | ) |
Class C shares | | | | | | | | | | | | | | | | | | | | |
Subscriptions | | | | 100,633 | | | | | 567,852 | | | | | 85,052 | | | | | 507,312 | |
Redemptions | | | | (39,857 | ) | | | | (220,630 | ) | | | | (94,134 | ) | | | | (554,194 | ) |
Net increase (decrease) | | | | 60,776 | | | | | 347,222 | | | | | (9,082 | ) | | | | (46,882 | ) |
Class I shares | | | | | | | | | | | | | | | | | | | | |
Subscriptions | | | | 17,549,006 | | | | | 98,875,596 | | | | | 69,008,099 | | | | | 393,119,293 | |
Distributions reinvested | | | | 534,136 | | | | | 2,750,802 | | | | | 18,601 | | | | | 109,372 | |
Redemptions | | | | (34,089,252 | ) | | | | (195,061,226 | ) | | | | (10,982,086 | ) | | | | (65,424,857 | ) |
Net increase (decrease) | | | | (16,006,110 | ) | | | | (93,434,828 | ) | | | | 58,044,614 | | | | | 327,803,808 | |
Class R4 shares | | | | | | | | | | | | | | | | | | | | |
Subscriptions | | | | 53 | | | | | 277 | | | | | 476 | | | | | 2,721 | |
Distributions reinvested | | | | 27 | | | | | 136 | | | | | 24 | | | | | 142 | |
Redemptions | | | | (2,082 | ) | | | | (11,825 | ) | | | | (23 | ) | | | | (139 | ) |
Net increase (decrease) | | | | (2,002 | ) | | | | (11,412 | ) | | | | 477 | | | | | 2,724 | |
Class Z shares | | | | | | | | | | | | | | | | | | | | |
Subscriptions | | | | 162,245 | | | | | 868,654 | | | | | 52,314 | | | | | 329,729 | |
Distributions reinvested | | | | 402 | | | | | 2,066 | | | | | — | | | | | — | |
Redemptions | | | | (38,830 | ) | | | | (212,096 | ) | | | | (39,987 | ) | | | | (226,939 | ) |
Net increase | | | | 123,817 | | | | | 658,624 | | | | | 12,327 | | | | | 102,790 | |
Total net increase (decrease) | | | | (17,365,667 | ) | | | | (100,838,464 | ) | | | | 56,760,018 | | | | | 320,427,314 | |
| (a) | Includes conversions of Class B shares to Class A shares, if any. The line items from the prior year have been combined to conform to the current year presentation. |
The accompanying Notes to Financial Statements are an integral part of this statement.
| | | | |
| COLUMBIA EUROPEAN EQUITY FUND — 2012 SEMIANNUAL REPORT | | | 19 | |
The following tables are intended to help you understand the Fund’s financial performance. Certain information reflects financial results for a single share of a class held for the periods shown. Per share net investment income (loss) amounts are calculated based on average shares outstanding during the period. Total returns assume reinvestment of all dividends and distributions. Total returns do not reflect payment of sales charges, if any, and are not annualized for periods of less than one year.
| | | | | | | | | | | | | | | | | | | | | | | | | | | | | | |
| | | Six months
ended April 30, 2012 | | Year ended Oct. 31, |
| | | | 2011 | | 2010 | | 2009 | | 2008 | | 2007 |
| | | (Unaudited) | | | | | | | | | | |
Class A | | | | | | | | | | | | | | | | | | | | | | | | | | | | | | |
Per share data | | | | | | | | | | | | | | | | | | | | | | | | | | | | | | |
Net asset value, beginning of period | | | | $5.47 | | | | | $5.80 | | | | | $4.86 | | | | | $3.88 | | | | | $6.83 | | | | | $5.39 | |
Income from investment operations: | | | | | | | | | | | | | | | | | | | | | | | | | | | | | | |
Net investment income | | | | 0.03 | | | | | 0.05 | | | | | 0.03 | | | | | 0.07 | | | | | 0.06 | | | | | 0.04 | |
Net realized and unrealized gain (loss) | | | | 0.31 | | | | | (0.35 | ) | | | | 0.98 | | | | | 0.96 | | | | | (2.96 | ) | | | | 1.47 | |
Total from investment operations | | | | 0.34 | | | | | (0.30 | ) | | | | 1.01 | | | | | 1.03 | | | | | (2.90 | ) | | | | 1.51 | |
Less distributions to shareholders from: | | | | | | | | | | | | | | | | | | | | | | | | | | | | | | |
Net investment income | | | | (0.01 | ) | | | | (0.03 | ) | | | | (0.07 | ) | | | | (0.06 | ) | | | | (0.05 | ) | | | | (0.07 | ) |
Total distributions to shareholders | | | | (0.01 | ) | | | | (0.03 | ) | | | | (0.07 | ) | | | | (0.06 | ) | | | | (0.05 | ) | | | | (0.07 | ) |
Proceeds from regulatory settlements | | | | — | | | | | — | | | | | — | | | | | 0.01 | | | | | — | | | | | — | |
Net asset value, end of period | | | | $5.80 | | | | | $5.47 | | | | | $5.80 | | | | | $4.86 | | | | | $3.88 | | | | | $6.83 | |
Total return | | | | 6.32% | | | | | (5.25% | ) | | | | 21.14% | | | | | 27.11% | (a) | | | | (42.70% | ) | | | | 28.24% | |
Ratios to average net assets(b) | | | | | | | | | | | | | | | | | | | | | | | | | | | | | | |
Expenses prior to fees waived or expenses
reimbursed (including interest expense) | | | | 1.49% | (c)(d) | | | | 1.55% | | | | | 1.67% | | | | | 1.93% | | | | | 1.58% | | | | | 1.43% | |
Net expenses after fees waived or expenses
reimbursed (including interest expense)(e) | | | | 1.49% | (c)(d) | | | | 1.51% | (f) | | | | 1.41% | | | | | 1.61% | | | | | 1.58% | | | | | 1.43% | |
Expenses prior to fees waived or expenses
reimbursed (excluding interest expense) | | | | 1.49% | (d) | | | | 1.55% | | | | | 1.67% | | | | | 1.93% | | | | | 1.58% | | | | | 1.43% | |
Net expenses after fees waived or expenses
reimbursed (excluding interest expense)(e) | | | | 1.49% | (d) | | | | 1.51% | (f) | | | | 1.41% | | | | | 1.61% | | | | | 1.58% | | | | | 1.43% | |
Net investment income | | | | 1.11% | (d) | | | | 0.84% | (f) | | | | 0.63% | | | | | 1.79% | | | | | 0.95% | | | | | 0.70% | |
Supplemental data | | | | | | | | | | | | | | | | | | | | | | | | | | | | | | |
Net assets, end of period (in thousands) | | | | $55,272 | | | | | $60,295 | | | | | $69,831 | | | | | $64,717 | | | | | $57,916 | | | | | $114,600 | |
Portfolio turnover | | | | 56% | | | | | 121% | | | | | 115% | | | | | 154% | | | | | 180% | | | | | 114% | |
Notes to Financial Highlights
| (a) | During the year ended October 31, 2009, the Fund received proceeds from regulatory settlements. Had the Fund not received these proceeds, the total return would have been lower by 0.12%. |
| (b) | In addition to the fees and expenses which the Fund bears directly, the Fund indirectly bears a pro rata share of the fees and expenses of the acquired funds in which it invests. Such indirect expenses are not included in the reported expense ratios. |
| (c) | Includes interest expense which rounds to less than 0.01%. |
| (e) | The Investment Manager and certain of its affiliates agreed to waive/reimburse certain fees and expenses, if applicable. |
| (f) | The benefits derived from expense reductions had an impact of less than 0.01%. |
The accompanying Notes to Financial Statements are an integral part of this statement.
| | |
| 20 | | COLUMBIA EUROPEAN EQUITY FUND — 2012 SEMIANNUAL REPORT |
| | | | | | | | | | | | | | | | | | | | | | | | | | | | | | |
| | | Six months
ended April 30, 2012 | | Year ended Oct. 31, |
| | | | 2011 | | 2010 | | 2009 | | 2008 | | 2007 |
| | | (Unaudited) | | | | | | | | | | |
Class B | | | | | | | | | | | | | | | | | | | | | | | | | | | | | | |
Per share data | | | | | | | | | | | | | | | | | | | | | | | | | | | | | | |
Net asset value, beginning of period | | | | $5.44 | | | | | $5.78 | | | | | $4.83 | | | | | $3.82 | | | | | $6.73 | | | | | $5.31 | |
Income from investment operations: | | | | | | | | | | | | | | | | | | | | | | | | | | | | | | |
Net investment income (loss) | | | | 0.01 | | | | | 0.01 | | | | | (0.00 | )(a) | | | | 0.05 | | | | | 0.02 | | | | | 0.00 | (a) |
Net realized and unrealized gain (loss) | | | | 0.31 | | | | | (0.35 | ) | | | | 0.97 | | | | | 0.95 | | | | | (2.93 | ) | | | | 1.44 | |
Total from investment operations | | | | 0.32 | | | | | (0.34 | ) | | | | 0.97 | | | | | 1.00 | | | | | (2.91 | ) | | | | 1.44 | |
Less distributions to shareholders from: | | | | | | | | | | | | | | | | | | | | | | | | | | | | | | |
Net investment income | | | | — | | | | | — | | | | | (0.02 | ) | | | | — | | | | | — | | | | | (0.02 | ) |
Total distributions to shareholders | | | | — | | | | | — | | | | | (0.02 | ) | | | | — | | | | | — | | | | | (0.02 | ) |
Proceeds from regulatory settlements | | | | — | | | | | — | | | | | — | | | | | 0.01 | | | | | — | | | | | — | |
Net asset value, end of period | | | | $5.76 | | | | | $5.44 | | | | | $5.78 | | | | | $4.83 | | | | | $3.82 | | | | | $6.73 | |
Total return | | | | 5.88% | | | | | (5.88% | ) | | | | 20.10% | | | | | 26.44% | (b) | | | | (43.24% | ) | | | | 27.28% | |
Ratios to average net assets(c) | | | | | | | | | | | | | | | | | | | | | | | | | | | | | | |
Expenses prior to fees waived or expenses reimbursed (including interest expense) | | | | 2.24% | (d)(e) | | | | 2.30% | | | | | 2.41% | | | | | 2.74% | | | | | 2.32% | | | | | 2.19% | |
Net expenses after fees waived or expenses reimbursed (including interest expense)(f) | | | | 2.24% | (d)(e) | | | | 2.26% | (g) | | | | 2.16% | | | | | 2.40% | | | | | 2.32% | | | | | 2.19% | |
Expenses prior to fees waived or expenses reimbursed (excluding interest expense) | | | | 2.24% | (e) | | | | 2.30% | | | | | 2.41% | | | | | 2.74% | | | | | 2.32% | | | | | 2.19% | |
Net expenses after fees waived or expenses reimbursed (excluding interest expense)(f) | | | | 2.24% | (e) | | | | 2.26% | (g) | | | | 2.16% | | | | | 2.40% | | | | | 2.32% | | | | | 2.19% | |
Net investment income (loss) | | | | 0.36% | (e) | | | | 0.15% | (g) | | | | (0.06% | ) | | | | 1.22% | | | | | 0.28% | | | | | (0.03% | ) |
Supplemental data | | | | | | | | | | | | | | | | | | | | | | | | | | | | | | |
Net assets, end of period (in thousands) | | | | $2,218 | | | | | $2,382 | | | | | $4,051 | | | | | $6,124 | | | | | $10,080 | | | | | $30,143 | |
Portfolio turnover | | | | 56% | | | | | 121% | | | | | 115% | | | | | 154% | | | | | 180% | | | | | 114% | |
Notes to Financial Highlights
| (a) | Rounds to less than $0.01. |
| (b) | During the year ended October 31, 2009, the Fund received proceeds from regulatory settlements. Had the Fund not received these proceeds, the total return would have been lower by 0.12%. |
| (c) | In addition to the fees and expenses which the Fund bears directly, the Fund indirectly bears a pro rata share of the fees and expenses of the acquired funds in which it invests. Such indirect expenses are not included in the reported expense ratios. |
| (d) | Includes interest expense which rounds to less than 0.01%. |
| (f) | The Investment Manager and certain of its affiliates agreed to waive/reimburse certain fees and expenses, if applicable. |
| (g) | The benefits derived from expense reductions had an impact of less than 0.01%. |
The accompanying Notes to Financial Statements are an integral part of this statement.
| | | | |
| COLUMBIA EUROPEAN EQUITY FUND — 2012 SEMIANNUAL REPORT | | | 21 | |
| | |
| Financial Highlights (continued) | | |
| | | | | | | | | | | | | | | | | | | | | | | | | | | | | | |
| | | Six months
ended April 30, 2012 | | Year ended Oct. 31, |
| | | | 2011 | | 2010 | | 2009 | | 2008 | | 2007 |
| | | (Unaudited) | | | | | | | | | | |
Class C | | | | | | | | | | | | | | | | | | | | | | | | | | | | | | |
Per share data | | | | | | | | | | | | | | | | | | | | | | | | | | | | | | |
Net asset value, beginning of period | | | | $5.39 | | | | | $5.72 | | | | | $4.81 | | | | | $3.81 | | | | | $6.71 | | | | | $5.30 | |
Income from investment operations: | | | | | | | | | | | | | | | | | | | | | | | | | | | | | | |
Net investment income (loss) | | | | 0.01 | | | | | 0.01 | | | | | (0.01 | ) | | | | 0.04 | | | | | 0.01 | | | | | 0.00 | (a) |
Net realized and unrealized gain (loss) | | | | 0.30 | | | | | (0.34 | ) | | | | 0.96 | | | | | 0.95 | | | | | (2.90 | ) | | | | 1.44 | |
Total from investment operations | | | | 0.31 | | | | | (0.33 | ) | | | | 0.95 | | | | | 0.99 | | | | | (2.89 | ) | | | | 1.44 | |
Less distributions to shareholders from: | | | | | | | | | | | | | | | | | | | | | | | | | | | | | | |
Net investment income | | | | — | | | | | — | | | | | (0.04 | ) | | | | (0.00 | )(a) | | | | (0.01 | ) | | | | (0.03 | ) |
Total distributions to shareholders | | | | — | | | | | — | | | | | (0.04 | ) | | | | (0.00 | )(a) | | | | (0.01 | ) | | | | (0.03 | ) |
Proceeds from regulatory settlements | | | | — | | | | | — | | | | | — | | | | | 0.01 | | | | | — | | | | | — | |
Net asset value, end of period | | | | $5.70 | | | | | $5.39 | | | | | $5.72 | | | | | $4.81 | | | | | $3.81 | | | | | $6.71 | |
Total return | | | | 5.75% | | | | | (5.77% | ) | | | | 19.96% | | | | | 26.39% | (b) | | | | (43.10% | ) | | | | 27.21% | |
Ratios to average net assets(c) | | | | | | | | | | | | | | | | | | | | | | | | | | | | | | |
Expenses prior to fees waived or expenses reimbursed (including interest expense) | | | | 2.24% | (d)(e) | | | | 2.29% | | | | | 2.43% | | | | | 2.69% | | | | | 2.33% | | | | | 2.19% | |
Net expenses after fees waived or expenses reimbursed (including interest expense)(f) | | | | 2.24% | (d)(e) | | | | 2.26% | (g) | | | | 2.17% | | | | | 2.37% | | | | | 2.33% | | | | | 2.19% | |
Expenses prior to fees waived or expenses reimbursed (excluding interest expense) | | | | 2.24% | (e) | | | | 2.29% | | | | | 2.43% | | | | | 2.69% | | | | | 2.33% | | | | | 2.19% | |
Net expenses after fees waived or expenses reimbursed (excluding interest expense)(f) | | | | 2.24% | (e) | | | | 2.26% | (g) | | | | 2.17% | | | | | 2.37% | | | | | 2.33% | | | | | 2.19% | |
Net investment income (loss) | | | | 0.52% | (e) | | | | 0.11% | (g) | | | | (0.10% | ) | | | | 1.07% | | | | | 0.25% | | | | | (0.05% | ) |
Supplemental data | | | | | | | | | | | | | | | | | | | | | | | | | | | | | | |
Net assets, end of period (in thousands) | | | | $1,696 | | | | | $1,274 | | | | | $1,406 | | | | | $1,157 | | | | | $954 | | | | | $2,138 | |
Portfolio turnover | | | | 56% | | | | | 121% | | | | | 115% | | | | | 154% | | | | | 180% | | | | | 114% | |
Notes to Financial Highlights
| (a) | Rounds to less than $0.01. |
| (b) | During the year ended October 31, 2009, the Fund received proceeds from regulatory settlements. Had the Fund not received these proceeds, the total return would have been lower by 0.12%. |
| (c) | In addition to the fees and expenses which the Fund bears directly, the Fund indirectly bears a pro rata share of the fees and expenses of the acquired funds in which it invests. Such indirect expenses are not included in the reported expense ratios. |
| (d) | Includes interest expense which rounds to less than 0.01%. |
| (f) | The Investment Manager and certain of its affiliates agreed to waive/reimburse certain fees and expenses, if applicable. |
| (g) | The benefits derived from expense reductions had an impact of less than 0.01%. |
The accompanying Notes to Financial Statements are an integral part of this statement.
| | |
| 22 | | COLUMBIA EUROPEAN EQUITY FUND — 2012 SEMIANNUAL REPORT |
| | | | | | | | | | | | | | | | | | | | | | | | | | | | | | |
| | | Six months
ended April 30,
2012 | | Year ended Oct. 31, |
| | | | 2011 | | 2010 | | 2009 | | 2008 | | 2007 |
| | | (Unaudited) | | | | | | | | | | |
Class I | | | | | | | | | | | | | | | | | | | | | | | | | | | | | | |
Per share data | | | | | | | | | | | | | | | | | | | | | | | | | | | | | | |
Net asset value, beginning of period | | | | $5.50 | | | | | $5.80 | | | | | $4.86 | | | | | $3.89 | | | | | $6.84 | | | | | $5.40 | |
Income from investment operations: | | | | | | | | | | | | | | | | | | | | | | | | | | | | | | |
Net investment income | | | | 0.04 | | | | | 0.11 | | | | | 0.05 | | | | | 0.09 | | | | | 0.09 | | | | | 0.07 | |
Net realized and unrealized gain (loss) | | | | 0.32 | | | | | (0.36 | ) | | | | 0.98 | | | | | 0.95 | | | | | (2.96 | ) | | | | 1.46 | |
Total from investment operations | | | | 0.36 | | | | | (0.25 | ) | | | | 1.03 | | | | | 1.04 | | | | | (2.87 | ) | | | | 1.53 | |
Less distributions to shareholders from: | | | | | | | | | | | | | | | | | | | | | | | | | | | | | | |
Net investment income | | | | (0.05 | ) | | | | (0.05 | ) | | | | (0.09 | ) | | | | (0.08 | ) | | | | (0.08 | ) | | | | (0.09 | ) |
Total distributions to shareholders | | | | (0.05 | ) | | | | (0.05 | ) | | | | (0.09 | ) | | | | (0.08 | ) | | | | (0.08 | ) | | | | (0.09 | ) |
Proceeds from regulatory settlements | | | | — | | | | | — | | | | | — | | | | | 0.01 | | | | | — | | | | | — | |
Net asset value, end of period | | | | $5.81 | | | | | $5.50 | | | | | $5.80 | | | | | $4.86 | | | | | $3.89 | | | | | $6.84 | |
Total return | | | | 6.60% | | | | | (4.36% | ) | | | | 21.61% | | | | | 27.78% | (a) | | | | (42.38% | ) | | | | 28.78% | |
Ratios to average net assets(b) | | | | | | | | | | | | | | | | | | | | | | | | | | | | | | |
Expenses prior to fees waived or expenses reimbursed (including interest expense) | | | | 0.94% | (c)(d) | | | | 1.00% | | | | | 1.14% | | | | | 1.31% | | | | | 1.08% | | | | | 0.95% | |
Net expenses after fees waived or expenses reimbursed (including interest expense)(e) | | | | 0.94% | (c)(d) | | | | 1.00% | | | | | 0.96% | | | | | 1.16% | | | | | 1.08% | | | | | 0.95% | |
Expenses prior to fees waived or expenses reimbursed (excluding interest expense) | | | | 0.94% | (d) | | | | 1.00% | | | | | 1.14% | | | | | 1.31% | | | | | 1.08% | | | | | 0.95% | |
Net expenses after fees waived or expenses reimbursed (excluding interest expense)(e) | | | | 0.94% | (d) | | | | 1.00% | | | | | 0.96% | | | | | 1.16% | | | | | 1.08% | | | | | 0.95% | |
Net investment income | | | | 1.59% | (d) | | | | 1.83% | | | | | 1.07% | | | | | 2.27% | | | | | 1.50% | | | | | 1.17% | |
Supplemental data | | | | | | | | | | | | | | | | | | | | | | | | | | | | | | |
Net assets, end of period (in thousands) | | | | $244,175 | | | | | $319,236 | | | | | $8 | | | | | $6 | | | | | $5 | | | | | $3 | |
Portfolio turnover | | | | 56% | | | | | 121% | | | | | 115% | | | | | 154% | | | | | 180% | | | | | 114% | |
Notes to Financial Highlights
| (a) | During the year ended October 31, 2009, the Fund received proceeds from regulatory settlements. Had the Fund not received these proceeds, the total return would have been lower by 0.12%. |
| (b) | In addition to the fees and expenses which the Fund bears directly, the Fund indirectly bears a pro rata share of the fees and expenses of the acquired funds in which it invests. Such indirect expenses are not included in the reported expense ratios. |
| (c) | Includes interest expense which rounds to less than 0.01%. |
| (e) | The Investment Manager and certain of its affiliates agreed to waive/reimburse certain fees and expenses, if applicable. |
The accompanying Notes to Financial Statements are an integral part of this statement.
| | | | |
| COLUMBIA EUROPEAN EQUITY FUND — 2012 SEMIANNUAL REPORT | | | 23 | |
| | |
| Financial Highlights (continued) | | |
| | | | | | | | | | | | | | | | | | | | | | | | | | | | | | |
| | | Six months
ended April 30, 2012 | | Year ended Oct. 31, |
| | | | 2011 | | 2010 | | 2009 | | 2008 | | 2007 |
| | | (Unaudited) | | | | | | | | | | |
Class R4 | | | | | | | | | | | | | | | | | | | | | | | | | | | | | | |
Per share data | | | | | | | | | | | | | | | | | | | | | | | | | | | | | | |
Net asset value, beginning of period | | | | $5.47 | | | | | $5.79 | | | | | $4.86 | | | | | $3.90 | | | | | $6.84 | | | | | $5.41 | |
Income from investment operations: | | | | | | | | | | | | | | | | | | | | | | | | | | | | | | |
Net investment income | | | | 0.03 | | | | | 0.06 | | | | | 0.04 | | | | | 0.07 | | | | | 0.08 | | | | | 0.00 | (a) |
Net realized and unrealized gain (loss) | | | | 0.32 | | | | | (0.34 | ) | | | | 0.97 | | | | | 0.97 | | | | | (2.94 | ) | | | | 1.51 | |
Total from investment operations | | | | 0.35 | | | | | (0.28 | ) | | | | 1.01 | | | | | 1.04 | | | | | (2.86 | ) | | | | 1.51 | |
Less distributions to shareholders from: | | | | | | | | | | | | | | | | | | | | | | | | | | | | | | |
Net investment income | | | | (0.03 | ) | | | | (0.04 | ) | | | | (0.08 | ) | | | | (0.09 | ) | | | | (0.08 | ) | | | | (0.08 | ) |
Total distributions to shareholders | | | | (0.03 | ) | | | | (0.04 | ) | | | | (0.08 | ) | | | | (0.09 | ) | | | | (0.08 | ) | | | | (0.08 | ) |
Proceeds from regulatory settlements | | | | — | | | | | — | | | | | — | | | | | 0.01 | | | | | — | | | | | — | |
Net asset value, end of period | | | | $5.79 | | | | | $5.47 | | | | | $5.79 | | | | | $4.86 | | | | | $3.90 | | | | | $6.84 | |
Total return | | | | 6.51% | | | | | (4.93% | ) | | | | 21.08% | | | | | 27.57% | (b) | | | | (42.29% | ) | | | | 28.16% | |
Ratios to average net assets(c) | | | | | | | | | | | | | | | | | | | | | | | | | | | | | | |
Expenses prior to fees waived or expenses reimbursed (including interest expense) | | | | 1.24% | (d)(e) | | | | 1.32% | | | | | 1.49% | | | | | 1.58% | | | | | 1.36% | | | | | 1.26% | |
Net expenses after fees waived or expenses reimbursed (including interest expense)(f) | | | | 1.24% | (d)(e) | | | | 1.26% | | | | | 1.27% | | | | | 1.39% | | | | | 1.11% | | | | | 1.26% | |
Expenses prior to fees waived or expenses reimbursed (excluding interest expense) | | | | 1.24% | (e) | | | | 1.32% | | | | | 1.49% | | | | | 1.58% | | | | | 1.36% | | | | | 1.26% | |
Net expenses after fees waived or expenses reimbursed (excluding interest expense)(f) | | | | 1.24% | (e) | | | | 1.26% | | | | | 1.27% | | | | | 1.39% | | | | | 1.11% | | | | | 1.26% | |
Net investment income | | | | 1.07% | (e) | | | | 1.08% | | | | | 0.79% | | | | | 1.79% | | | | | 1.35% | | | | | 0.04% | |
Supplemental data | | | | | | | | | | | | | | | | | | | | | | | | | | | | | | |
Net assets, end of period (in thousands) | | | | $17 | | | | | $27 | | | | | $25 | | | | | $18 | | | | | $13 | | | | | $7 | |
Portfolio turnover | | | | 56% | | | | | 121% | | | | | 115% | | | | | 154% | | | | | 180% | | | | | 114% | |
Notes to Financial Highlights
| (a) | Rounds to less than $0.01. |
| (b) | During the year ended October 31, 2009, the Fund received proceeds from regulatory settlements. Had the Fund not received these proceeds, the total return would have been lower by 0.12%. |
| (c) | In addition to the fees and expenses which the Fund bears directly, the Fund indirectly bears a pro rata share of the fees and expenses of the acquired funds in which it invests. Such indirect expenses are not included in the reported expense ratios. |
| (d) | Includes interest expense which rounds to less than 0.01%. |
| (f) | The Investment Manager and certain of its affiliates agreed to waive/reimburse certain fees and expenses, if applicable. |
The accompanying Notes to Financial Statements are an integral part of this statement.
| | |
| 24 | | COLUMBIA EUROPEAN EQUITY FUND — 2012 SEMIANNUAL REPORT |
| | | | | | | | | | | | | | | |
| | | Six months
ended April 30, 2012 | | Year ended Oct. 31, |
| | | | 2011 | | 2010(a) |
| | | (Unaudited) | | | | |
Class Z | | | | | | | | | | | | | | | |
Per share data | | | | | | | | | | | | | | | |
Net asset value, beginning of period | | | | $5.49 | | | | | $5.80 | | | | | $5.52 | |
Income from investment operations: | | | | | | | | | | | | | | | |
Net investment income | | | | 0.04 | | | | | 0.10 | | | | | 0.00 | (b) |
Net realized and unrealized gain (loss) | | | | 0.30 | | | | | (0.36 | ) | | | | 0.28 | |
Total from investment operations | | | | 0.34 | | | | | (0.26 | ) | | | | 0.28 | |
Less distributions to shareholders from: | | | | | | | | | | | | | | | |
Net investment income | | | | (0.04 | ) | | | | (0.05 | ) | | | | — | |
Total distributions to shareholders | | | | (0.04 | ) | | | | (0.05 | ) | | | | — | |
Net asset value, end of period | | | | $5.79 | | | | | $5.49 | | | | | $5.80 | |
Total return | | | | 6.34% | | | | | (4.57% | ) | | | | 5.07% | |
Ratios to average net assets(c) | | | | | | | | | | | | | | | |
Expenses prior to fees waived or expenses
reimbursed (including interest expense) | | | | 1.23% | (d)(e) | | | | 1.24% | | | | | 1.96% | (e) |
Net expenses after fees waived or expenses
reimbursed (including interest expense)(f) | | | | 1.23% | (d)(e) | | | | 1.24% | (g) | | | | 1.27% | (e) |
Expenses prior to fees waived or expenses
reimbursed (excluding interest expense) | | | | 1.23% | (e) | | | | 1.24% | | | | | 1.96% | (e) |
Net expenses after fees waived or expenses
reimbursed (excluding interest expense)(f) | | | | 1.23% | (e) | | | | 1.24% | (g) | | | | 1.27% | (e) |
Net investment income | | | | 1.55% | (e) | | | | 1.72% | (g) | | | | 0.12% | (e) |
Supplemental data | | | | | | | | | | | | | | | |
Net assets, end of period (in thousands) | | | | $791 | | | | | $70 | | | | | $3 | |
Portfolio turnover | | | | 56% | | | | | 121% | | | | | 115% | |
Notes to Financial Highlights
| (a) | For the period from September 27, 2010 (commencement of operations) to October 31, 2010. |
| (b) | Rounds to less than $0.01. |
| (c) | In addition to the fees and expenses which the Fund bears directly, the Fund indirectly bears a pro rata share of the fees and expenses of the acquired funds in which it invests. Such indirect expenses are not included in the reported expense ratios. |
| (d) | Includes interest expense which rounds to less than 0.01%. |
| (f) | The Investment Manager and certain of its affiliates agreed to waive/reimburse certain fees and expenses, if applicable. |
| (g) | The benefits derived from expense reductions had an impact of less than 0.01%. |
The accompanying Notes to Financial Statements are an integral part of this statement.
| | | | |
| COLUMBIA EUROPEAN EQUITY FUND — 2012 SEMIANNUAL REPORT | | | 25 | |
| | |
| Notes to Financial Statements | | |
April 30, 2012 (Unaudited)
Columbia European Equity Fund (the Fund), a series of Columbia Funds Series Trust II (the Trust), is a diversified fund. The Trust is registered under the Investment Company Act of 1940, as amended (the 1940 Act), as an open-end management investment company organized as a Massachusetts business trust.
Fund Shares
The Trust may issue an unlimited number of shares (without par value). The Fund offers Class A, Class B, Class C, Class I, Class R4 and Class Z shares. All share classes have identical voting, dividend and liquidation rights. Each share class has its own expense structure and sales charges, as applicable.
Class A shares are subject to a maximum front-end sales charge of 5.75% based on the initial investment amount. Class A shares purchased without an initial sales charge in accounts aggregating $1 million to $50 million at the time of purchase are subject to a contingent deferred sales charge (CDSC) if the shares are sold within 18 months of purchase, charged as follows: 1.00% CDSC if redeemed within 12 months of purchase, and 0.50% CDSC if redeemed more than 12, but less than 18, months after purchase.
Class B shares may be subject to a maximum CDSC of 5.00% based upon the holding period after purchase. Class B shares will generally convert to Class A shares eight years after purchase. The Fund no longer accepts investments by new or existing investors in the Fund’s Class B shares, except in connection with the reinvestment of any dividend and/or capital gain distributions in Class B shares of the Fund and exchanges by existing Class B shareholders of certain other funds within the Columbia Family of Funds.
Class C shares are subject to a 1.00% CDSC on shares redeemed within one year of purchase.
Class I shares are not subject to sales charges and are only available to the Columbia Family of Funds.
Class R4 shares are not subject to sales charges; however, this share class is closed to new investors.
Class Z shares are not subject to sales charges, and are only available to certain investors, as described in the Fund’s prospectus.
| | |
| 26 | | COLUMBIA EUROPEAN EQUITY FUND — 2012 SEMIANNUAL REPORT |
| Note 2. Summary | of Significant Accounting Policies |
Use of Estimates
The preparation of financial statements in accordance with U.S. generally accepted accounting principles (GAAP) requires management to make certain estimates and assumptions that affect the reported amounts of assets and liabilities, the disclosure of contingent assets and liabilities at the date of the financial statements and the reported amounts of revenue and expenses during the reporting period. Actual results could differ from those estimates.
The following is a summary of significant accounting policies consistently followed by the Fund in the preparation of its financial statements.
Security Valuation
All equity securities are valued at the close of business of the New York Stock Exchange (NYSE). Equity securities are valued at the last quoted sales price on the principal exchange or market on which they trade, except for securities traded on the NASDAQ Stock Market, which are valued at the NASDAQ official close price. Unlisted securities or listed securities for which there were no sales during the day are valued at the mean of the latest quoted bid and asked prices on such exchanges or markets.
Debt securities generally are valued by pricing services approved by the Board of Trustees (the Board) based upon market transactions for normal, institutional-size trading units of similar securities. The services may use various pricing techniques which take into account appropriate factors such as yield, quality, coupon rate, maturity, type of issue, trading characteristics and other data, as well as broker quotes. Debt securities for which quotations are readily available may also be valued based upon an over-the-counter or exchange bid quotation.
Foreign securities are valued based on quotations from the principal market in which such securities are normally traded. If any foreign share prices are not readily available as a result of limited share activity the securities are valued at the mean of the latest quoted bid and asked prices on such exchanges or markets. Foreign currency exchange rates are generally determined at 4:00 p.m. Eastern (U.S.) time. However, many securities markets and exchanges outside the U.S. close prior to the close of the NYSE; therefore, the closing prices for securities in such markets or on such exchanges may not fully reflect events that occur after such close but before the close of the NYSE. In those situations, foreign securities will be fair valued pursuant to the policy adopted by the Board, including utilizing a third party pricing service to determine these fair values. The third party pricing service takes into account multiple factors, including, but not limited to, movements in the U.S. securities markets, certain depositary receipts, futures contracts and foreign exchange rates that have occurred
| | | | |
| COLUMBIA EUROPEAN EQUITY FUND — 2012 SEMIANNUAL REPORT | | | 27 | |
| | |
| Notes to Financial Statements (continued) | | |
subsequent to the close of the foreign exchange, to determine a good faith estimate that reasonably reflects the current market conditions as of the close of the NYSE. The fair value of a security is likely to be different from the quoted or published price, if available.
Investments in other open-end investment companies, including money market funds, are valued at net asset value.
Short-term securities purchased within 60 days to maturity are valued at amortized cost, which approximates market value. The value of short-term securities originally purchased with maturities greater than 60 days is determined based on an amortized value to par upon reaching 60 days to maturity. Short-term securities maturing in more than 60 days from the valuation date are valued at the market price or approximate market value based on current interest rates.
Investments for which market quotations are not readily available, or that have quotations which management believes are not reliable, are valued at fair value as determined in good faith under consistently applied procedures established by and under the general supervision of the Board. If a security or class of securities (such as foreign securities) is valued at fair value, such value is likely to be different from the last quoted market price for the security. The determination of fair value often requires significant judgment. To determine fair value, management may use assumptions including but not limited to future cash flows and estimated risk premiums. Multiple inputs from various sources may be used to determine value.
Foreign Currency Transactions and Translation
The values of all assets and liabilities denominated in foreign currencies are translated into U.S. dollars at that day’s exchange rates. Net realized and unrealized gains (losses) on foreign currency transactions and translations include gains (losses) arising from the fluctuation in exchange rates between trade and settlement dates on securities transactions, gains (losses) arising from the disposition of foreign currency and currency gains (losses) between the accrual and payment dates on dividends, interest income and foreign withholding taxes.
For financial statement purposes, the Fund does not distinguish that portion of gains (losses) on investments which is due to changes in foreign exchange rates from that which is due to changes in market prices of the investments. Such fluctuations are included with the net realized and unrealized gains (losses) on investments in the Statement of Operations.
Repurchase Agreements
The Fund may engage in repurchase agreement transactions with institutions that management has determined are creditworthy. The Fund, through the custodian,
| | |
| 28 | | COLUMBIA EUROPEAN EQUITY FUND — 2012 SEMIANNUAL REPORT |
receives delivery of the underlying securities collateralizing a repurchase agreement. Management is responsible for determining that the collateral is at least equal, at all times, to the value of the repurchase obligation including interest. A repurchase agreement transaction involves certain risks in the event of default or insolvency of the counterparty. These risks include possible delays in or restrictions on a Fund’s ability to dispose of the underlying securities and a possible decline in the value of the underlying securities during the period while the Fund seeks to assert its rights.
Security Transactions
Security transactions are accounted for on the trade date. Cost is determined and gains (losses) are based upon the specific identification method for both financial statement and federal income tax purposes.
Income Recognition
Corporate actions and dividend income are recorded net of any non-reclaimable tax withholdings, on the ex-dividend date or upon receipt of ex-dividend notification in the case of certain foreign securities.
Awards from class action litigation are recorded as a reduction of cost basis if the Fund still owns the applicable securities on the payment date. If the Fund no longer owns the applicable securities, the proceeds are recorded as realized gains.
Interest income is recorded on the accrual basis.
Expenses
General expenses of the Trust are allocated to the Fund and other funds of the Trust based upon relative net assets or other expense allocation methodologies determined by the nature of the expense. Expenses directly attributable to the Fund are charged to the Fund. Expenses directly attributable to a specific class of shares are charged to that share class.
Determination of Class Net Asset Value
All income, expenses (other than class-specific expenses, which are charged to that share class, as shown in the Statement of Operations) and realized and unrealized gains (losses) are allocated to each class of the Fund on a daily basis, based on the relative net assets of each class, for purposes of determining the net asset value of each class.
Federal Income Tax Status
The Fund intends to qualify each year as a regulated investment company under Subchapter M of the Internal Revenue Code, as amended, and will distribute substantially all of its tax exempt or taxable income (including net short-term capital gains), if any, for its tax year, and as such will not be subject to federal income taxes. In addition, the Fund intends to distribute in each calendar year
| | | | |
| COLUMBIA EUROPEAN EQUITY FUND — 2012 SEMIANNUAL REPORT | | | 29 | |
| | |
| Notes to Financial Statements (continued) | | |
substantially all of its net investment income, capital gains and certain other amounts, if any, such that the Fund should not be subject to federal excise tax. Therefore, no federal income or excise tax provision is recorded.
Foreign Taxes
The Fund may be subject to foreign taxes on income, gains on investments or currency repatriation, a portion of which may be recoverable. The Fund will accrue such taxes and recoveries, as applicable, based upon its current interpretation of tax rules and regulations that exist in the markets in which it invests.
Realized gains in certain countries may be subject to foreign taxes at the Fund level, based on statutory rates. The Fund accrues for such foreign taxes on net realized and unrealized gains at the appropriate rate for each jurisdiction, as applicable.
Distributions to Shareholders
Distributions from net investment income are declared and paid annually. Net realized capital gains, if any, are distributed along with the income dividend. Income distributions and capital gain distributions are determined in accordance with federal income tax regulations which may differ from GAAP.
Guarantees and Indemnifications
Under the Trust’s organizational documents and, in some cases, by contract, its officers and trustees are indemnified against certain liabilities arising out of the performance of their duties to the Trust or its funds. In addition, certain of the Fund’s contracts with its service providers contain general indemnification clauses. The Fund’s maximum exposure under these arrangements is unknown since the amount of any future claims that may be made against the Fund cannot be determined, and the Fund has no historical basis for predicting the likelihood of any such claims.
Recent Accounting Pronouncement
Fair Value Measurements and Disclosures
In May 2011, the Financial Accounting Standards Board (FASB) issued ASU No. 2011-04 modifying Topic 820, Fair Value Measurements and Disclosures. At the same time, the International Accounting Standards Board (IASB) issued International Financial Reporting Standard 13, Fair Value Measurement. The objective of the FASB and IASB is convergence of their guidance on fair value measurements and disclosures.
Specifically, ASU No. 2011-04 requires reporting entities to disclose i) the amounts of any transfers between Level 1 and Level 2, and the reasons for the transfers, ii) for Level 3 fair value measurements, a) quantitative information about significant unobservable inputs used, b) a description of the valuation processes used by the reporting entity and c) a narrative description of the
| | |
| 30 | | COLUMBIA EUROPEAN EQUITY FUND — 2012 SEMIANNUAL REPORT |
sensitivity of the fair value measurement to changes in unobservable inputs if a change in those inputs might result in a significantly higher or lower fair value measurement. The effective date of ASU No. 2011-04 is for interim and annual periods beginning after December 15, 2011. At this time, management is evaluating the implications of this guidance and the impact it will have on the financial statement amounts and footnote disclosures, if any.
| Note 3. Fees | and Compensation Paid to Affiliates |
Investment Management Fees
Under an Investment Management Services Agreement, Columbia Management Investment Advisers, LLC (the Investment Manager), a wholly-owned subsidiary of Ameriprise Financial, Inc. (Ameriprise Financial), is responsible for the ultimate oversight of investments made by the Fund. The Fund’s subadviser (see Subadvisory Agreement below) has the primary responsibility for the day-to-day portfolio management of the Fund. The management fee is an annual fee that is equal to a percentage of the Fund’s average daily net assets that declines from 0.80% to 0.57% as the Fund’s net assets increase. The annualized effective management fee rate for the six months ended April 30, 2012 was 0.79% of the Fund’s average daily net assets.
Subadvisory Agreement
The Investment Manager has entered into a Subadvisory Agreement with Threadneedle International Limited (Threadneedle), an affiliate of the Investment Manager and wholly-owned subsidiary of Ameriprise Financial, the subadviser of the Fund. The Investment Manager compensates Threadneedle to manage the investments of the Fund’s assets.
Administration Fees
Under an Administrative Services Agreement, the Investment Manager serves as the Fund Administrator. The Fund pays the Fund Administrator an annual fee for administration and accounting services equal to a percentage of the Fund’s average daily net assets that declines from 0.08% to 0.05% as the Fund’s net assets increase. The annualized effective administration fee rate for the six months ended April 30, 2012 was 0.08% of the Fund’s average daily net assets.
Other Expenses
Other expenses are for, among other things, certain expenses of the Fund or the Board, including: Fund boardroom and office expense, employee compensation, employee health and retirement benefits, and certain other expenses. Payment of these Fund and Board expenses is facilitated by a company providing limited administrative services to the Fund and the Board. For the six months ended April 30, 2012, other expenses paid to this company were $1,395.
| | | | |
| COLUMBIA EUROPEAN EQUITY FUND — 2012 SEMIANNUAL REPORT | | | 31 | |
| | |
| Notes to Financial Statements (continued) | | |
Compensation of Board Members
Board members are compensated for their services to the Fund as disclosed in the Statement of Operations. Under a Deferred Compensation Plan (the Plan), the Board members who are not “interested persons” of the Fund, as defined under the 1940 Act, may elect to defer payment of up to 100% of their compensation. Deferred amounts are treated as though equivalent dollar amounts had been invested in shares of certain funds managed by the Investment Manager. The Fund’s liability for these amounts is adjusted for market value changes and remains in the Fund until distributed in accordance with the Plan.
Transfer Agent Fees
Under a Transfer and Dividend Disbursing Agent Agreement, Columbia Management Investment Services Corp. (the Transfer Agent), an affiliate of the Investment Manager and a wholly-owned subsidiary of Ameriprise Financial, is responsible for providing transfer agency services to the Fund. The Transfer Agent has contracted with Boston Financial Data Services (BFDS) to serve as sub-transfer agent.
The Transfer Agent receives monthly account-based service fees based on the number of open accounts and is reimbursed by the Fund for the fees and expenses the Transfer Agent pays to financial intermediaries that maintain omnibus accounts with the Fund that is a percentage of the average aggregate value of the Fund’s shares maintained in each such omnibus account (other than omnibus accounts for which American Enterprise Investment Services Inc. is the broker of record or accounts where the beneficial shareholder is a customer of Ameriprise Financial Services, Inc., which are paid a per account fee). The Transfer Agent pays the fees of BFDS for services as sub-transfer agent and is not entitled to reimbursement for such fees from the Fund (with the exception of out-of-pocket fees).
The Transfer Agent also receives compensation from fees for various shareholder services and reimbursements for certain out-of-pocket expenses. Class I shares do not pay transfer agent fees. Total transfer agent fees for Class R4 shares are subject to an annual limitation of not more than 0.05% of the average daily net assets attributable to the share class.
For the six months ended April 30, 2012, the Fund’s effective transfer agent fee rates as a percentage of average daily net assets of each class were as follows:
| | | | |
Class A | | | 0.30 | % |
Class B | | | 0.30 | |
Class C | | | 0.30 | |
Class R4 | | | 0.05 | |
Class Z | | | 0.28 | |
| | |
| 32 | | COLUMBIA EUROPEAN EQUITY FUND — 2012 SEMIANNUAL REPORT |
An annual minimum account balance fee of $20 may apply to certain accounts with a value below the Fund’s initial minimum investment requirements to reduce the impact of small accounts on transfer agent fees. These minimum account balance fees are recorded as part of expense reductions in the Statement of Operations. For the six months ended April 30, 2012, no minimum account balance fees were charged by the Fund.
Plan Administration Fees
Under a Plan Administration Services Agreement with the Transfer Agent, the Fund pays an annual fee at a rate of 0.25% of the Fund’s average daily net assets attributable to Class R4 shares for the provision of various administrative, recordkeeping, communication and educational services.
Distribution Fees
The Fund has an agreement with Columbia Management Investment Distributors, Inc. (the Distributor), an affiliate of the Investment Manager and a wholly-owned subsidiary of Ameriprise Financial, for distribution and shareholder services. Under a Plan and Agreement of Distribution pursuant to Rule 12b-1, the Fund pays a fee at an annual rate of up to 0.25% of the Fund’s average daily net assets attributable to Class A shares and a fee at an annual rate of up to 1.00% of the Fund’s average daily net assets attributable to Class B and Class C shares. For Class B and Class C shares, of the 1.00% fee, up to 0.75% is reimbursed for distribution expenses.
The amount of distribution expenses incurred by the Distributor and not yet reimbursed (unreimbursed expense) was approximately $122,000 and $28,000 for Class B and Class C shares, respectively. These amounts are based on the most recent information available as of March 31, 2012, and may be recovered from future payments under the distribution plan or CDSCs. To the extent the unreimbursed expense has been fully recovered, the distribution fee is reduced.
Sales Charges
Sales charges, including front-end charges and CDSCs, received by the Distributor for distributing Fund shares were $23,185 for Class A, $830 for Class B and $72 for Class C shares for the six months ended April 30, 2012.
Expenses Waived/Reimbursed by the Investment Manager and its Affiliates
Effective January 1, 2012, the Investment Manager and certain of its affiliates have contractually agreed to waive fees and/or reimburse expenses (excluding certain fees and expenses described below), through February 28, 2013, unless sooner terminated at the sole discretion of the Board, so that the Fund’s net operating expenses, after giving effect to fees waived/expenses reimbursed and any balance credits and/or
| | | | |
| COLUMBIA EUROPEAN EQUITY FUND — 2012 SEMIANNUAL REPORT | | | 33 | |
| | |
| Notes to Financial Statements (continued) | | |
overdraft charges from the Fund’s custodian, do not exceed the following annual rates as a percentage of the class’ average daily net assets:
| | | | |
Class A | | | 1.52 | % |
Class B | | | 2.27 | |
Class C | | | 2.27 | |
Class I | | | 1.07 | |
Class R4 | | �� | 1.37 | |
Class Z | | | 1.27 | |
Prior to January 1, 2012, the Investment Manager and its affiliates contractually agreed to waive fees and/or reimburse expenses (excluding certain fees and expenses described below), so that the Fund’s net operating expenses, after giving effect to fees waived/expenses reimbursed and any balance credits and/or overdraft charges from the Fund’s custodian, did not exceed the following annual rates as a percentage of the class’ average daily net assets:
| | | | |
Class A | | | 1.53 | % |
Class B | | | 2.28 | |
Class C | | | 2.28 | |
Class I | | | 1.08 | |
Class R4 | | | 1.38 | |
Class Z | | | 1.28 | |
Under the agreement, the following fees and expenses are excluded from the waiver/reimbursement commitment, and therefore will be paid by the Fund, if applicable: taxes (including foreign transaction taxes), expenses associated with investments in affiliated and non-affiliated pooled investment vehicles (including mutual funds and exchange traded funds), transaction costs and brokerage commissions, costs related to any securities lending program, dividend expenses associated with securities sold short, inverse floater program fees and expenses, transaction charges and interest on borrowed money, interest, extraordinary expenses and any other expenses the exclusion of which is specifically approved by the Fund’s Board. This agreement may be modified or amended only with approval from all parties.
| Note 4. Federal | Tax Information |
The timing and character of income and capital gain distributions are determined in accordance with income tax regulations, which may differ from GAAP because of temporary or permanent book to tax differences.
| | |
| 34 | | COLUMBIA EUROPEAN EQUITY FUND — 2012 SEMIANNUAL REPORT |
At April 30, 2012, the cost of investments for federal income tax purposes was approximately $304,557,000 and the aggregate gross approximate unrealized appreciation and depreciation based on that cost was:
| | | | |
Unrealized appreciation | | $ | 25,332,000 | |
Unrealized depreciation | | | (5,524,000 | ) |
Net unrealized appreciation | | $ | 19,808,000 | |
The following capital loss carryforward, determined as of October 31, 2011 may be available to reduce taxable income arising from future net realized gains on investments, if any, to the extent permitted by the Internal Revenue Code:
| | | | |
| Year of Expiration | | Amount | |
2016 | | $ | 4,272,956 | |
2017 | | | 18,724,480 | |
Total | | $ | 22,997,436 | |
On December 22, 2010, the Regulated Investment Company Modernization Act of 2010 (the Act) was enacted, which changed various technical rules governing the tax treatment of regulated investment companies. The changes are generally effective for taxable years beginning after the date of enactment. Under the Act, the Fund will be permitted to carry forward capital losses incurred in taxable years beginning after the date of enactment for an unlimited period. However, any losses incurred during those future taxable years will be required to be utilized prior to the losses incurred in pre-enactment taxable years, which carry an expiration date. As a result of this ordering rule, pre-enactment capital loss carryforwards may be more likely to expire unused.
Management of the Fund has concluded that there are no significant uncertain tax positions that would require recognition in the financial statements. However, management’s conclusion may be subject to review and adjustment at a later date based on factors including, but not limited to, new tax laws, regulations, and administrative interpretations (including relevant court decisions). Generally, the Fund’s federal tax returns for the prior three fiscal years remain subject to examination by the Internal Revenue Service.
| Note 5. Portfolio | Information |
The cost of purchases and proceeds from sales of securities, excluding short-term obligations, aggregated to $209,130,471 and $301,754,228, respectively, for the six months ended April 30, 2012.
| | | | |
| COLUMBIA EUROPEAN EQUITY FUND — 2012 SEMIANNUAL REPORT | | | 35 | |
| | |
| Notes to Financial Statements (continued) | | |
| Note 6. Lending | of Portfolio Securities |
The Fund has entered into a Master Securities Lending Agreement (the Agreement) with JPMorgan Chase Bank, N.A. (JPMorgan). The Agreement authorizes JPMorgan as lending agent to lend securities to authorized borrowers in order to generate additional income on behalf of the Fund. Pursuant to the Agreement, the securities loaned are secured by cash or U.S. government securities equal to at least 100% of the market value of the loaned securities. Any additional collateral required to maintain those levels due to market fluctuations of the loaned securities is requested to be delivered the following business day. Cash collateral received is invested by the lending agent on behalf of the Fund into authorized investments pursuant to the Agreement. The investments made with the cash collateral are listed in the Portfolio of Investments. The values of such investments and any uninvested cash collateral are disclosed in the Statement of Assets and Liabilities along with the related obligation to return the collateral upon the return of the securities loaned.
Risks of delay in recovery of securities or even loss of rights in the securities may occur should the borrower of the securities fail financially. Risks may also arise to the extent that the value of the securities loaned increases above the value of the collateral received. JPMorgan will indemnify the Fund from losses resulting from a borrower’s failure to return a loaned security when due. Such indemnification does not extend to losses associated with declines in the value of cash collateral investments. The Investment Manager is not responsible for any losses incurred by the Fund in connection with the securities lending program. Loans are subject to termination by the Fund or the borrower at any time, and are, therefore, not considered to be illiquid investments.
Pursuant to the Agreement, the Fund receives income for lending its securities either in the form of fees or by earning interest on invested cash collateral, net of negotiated rebates paid to borrowers and fees paid to the lending agent for services provided and any other securities lending expenses. Net income earned from securities lending for the six months ended April 30, 2012 is disclosed in the Statement of Operations. The Fund continues to earn and accrue interest and dividends on the securities loaned.
At April 30, 2012, securities valued at $21,018,398 were on loan, secured by cash collateral of $22,447,378 (which does not reflect calls for collateral made to borrowers by JPMorgan at period end) that is partially or fully invested in short-term securities or other cash equivalents.
| Note 7. Affiliated | Money Market Fund |
The Fund may invest its daily cash balances in Columbia Short-Term Cash Fund, an affiliated money market fund established for the exclusive use by the Fund
| | |
| 36 | | COLUMBIA EUROPEAN EQUITY FUND — 2012 SEMIANNUAL REPORT |
and other affiliated funds. The income earned by the Fund from such investments is included as “Dividends from affiliates” in the Statement of Operations. As an investing fund, the Fund indirectly bears its proportionate share of the expenses of Columbia Short-Term Cash Fund.
| Note 8. Shareholder | Concentration |
At April 30, 2012, affiliated shareholder accounts owned 80.2% of the outstanding shares of the Fund. Subscription and redemption activity by concentrated accounts may have a significant effect on the operations of the Fund.
The Fund has entered into a revolving credit facility with a syndicate of banks led by JPMorgan, whereby the Fund may borrow for the temporary funding of shareholder redemptions or for other temporary or emergency purposes. The credit facility agreement, as amended, which is a collective agreement between the Fund and certain other funds managed by the Investment Manager, severally and not jointly, permits collective borrowings up to $500 million. Pursuant to a December 13, 2011 amendment to the credit facility agreement, interest is charged to each participating fund based on its borrowings at a rate equal to the higher of (i) the overnight federal funds rate plus 1.00% or (i) the one-month LIBOR rate plus 1.00%. Each borrowing under the credit facility matures no later than 60 days after the date of borrowing. The Fund also pays a commitment fee equal to its pro rata share of the amount of the credit facility at a rate of 0.08% per annum.
Prior to December 13, 2011, interest was charged to each participating fund based on its borrowings at a rate equal to the sum of the federal funds rate plus (i) 1.25% per annum plus (ii) if one-month LIBOR exceeds the federal funds rate, the amount of such excess. The Fund also paid a commitment fee equal to its pro rata share of the amount of the credit facility at a rate of 0.10% per annum.
For the six months ended April 30, 2012, the average daily loan balance outstanding on days when borrowing existed was $8,966,667 at a weighted average interest rate of 1.24%.
| Note 10. Significant | Risks |
Foreign Securities Risk
Investing in foreign securities may include certain risks and considerations not typically associated with investing in U.S. securities, such as fluctuating currency
| | | | |
| COLUMBIA EUROPEAN EQUITY FUND — 2012 SEMIANNUAL REPORT | | | 37 | |
| | |
| Notes to Financial Statements (continued) | | |
values and changing local and regional economic, political and social conditions, which may result in greater market volatility. In addition, certain foreign securities may not be as liquid as U.S. securities. Investing in emerging markets may accentuate these risks.
Investments in emerging market countries are subject to additional risk. The risk of foreign investments is typically increased in less developed countries. These countries are also more likely to experience high levels of inflation, deflation or currency devaluation which could hurt their economies and securities markets.
Geographic Concentration Risk
Because the Fund concentrates its investments in Europe, the Fund may be particularly susceptible to economic, political, regulatory or other events or conditions affecting issuers and countries in Europe. Most developed countries in Western Europe are members of the European Union (EU), and many are also members of the European Economic and Monetary Union (EMU). European countries can be significantly affected by the tight fiscal and monetary controls that the EMU imposes on its members and with which candidates for EMU membership are required to comply. In addition, the private and public sectors’ debt problems of a single EU country can pose economic risks to the EU as a whole. Unemployment in Europe has historically been higher than in the United States and public deficits are an ongoing concern in many European countries. Currency devaluations could occur in countries that have not yet experienced currency devaluation to date, or could continue to occur in countries that have already experienced such devaluations. As a result, the Fund may be more volatile than a more geographically diversified fund. If securities of issuers in Europe fall out of favor, it may cause the Fund to underperform other funds that do not concentrate in this region of the world.
| Note 11. Subsequent | Events |
Management has evaluated the events and transactions that have occurred through the date the financial statements were issued and noted no items requiring adjustment of the financial statements or additional disclosure.
| Note 12. Information | Regarding Pending and Settled Legal Proceedings |
In December 2005, without admitting or denying the allegations, American Express Financial Corporation (AEFC, which is now known as Ameriprise Financial, Inc. (Ameriprise Financial)) entered into settlement agreements with the Securities and Exchange Commission (SEC) and Minnesota Department of Commerce (MDOC) related to market timing activities. As a result, AEFC was censured and ordered to cease and desist from committing or causing any violations of certain provisions of the Investment Advisers Act of 1940, the
| | |
| 38 | | COLUMBIA EUROPEAN EQUITY FUND — 2012 SEMIANNUAL REPORT |
Investment Company Act of 1940, and various Minnesota laws. AEFC agreed to pay disgorgement of $10 million and civil money penalties of $7 million. AEFC also agreed to retain an independent distribution consultant to assist in developing a plan for distribution of all disgorgement and civil penalties ordered by the SEC in accordance with various undertakings detailed at www.sec.gov/litigation/admin/ia-2451.pdf. Ameriprise Financial and its affiliates have cooperated with the SEC and the MDOC in these legal proceedings, and have made regular reports to the funds’ Boards of Trustees.
Ameriprise Financial and certain of its affiliates have historically been involved in a number of legal, arbitration and regulatory proceedings, including routine litigation, class actions, and governmental actions, concerning matters arising in connection with the conduct of their business activities. Ameriprise Financial believes that the Funds are not currently the subject of, and that neither Ameriprise Financial nor any of its affiliates are the subject of, any pending legal, arbitration or regulatory proceedings that are likely to have a material adverse effect on the Funds or the ability of Ameriprise Financial or its affiliates to perform under their contracts with the Funds. Ameriprise Financial is required to make 10-Q, 10-K and, as necessary, 8-K filings with the Securities and Exchange Commission on legal and regulatory matters that relate to Ameriprise Financial and its affiliates. Copies of these filings may be obtained by accessing the SEC website at www.sec.gov.
There can be no assurance that these matters, or the adverse publicity associated with them, will not result in increased fund redemptions, reduced sale of fund shares or other adverse consequences to the Funds. Further, although we believe proceedings are not likely to have a material adverse effect on the Funds or the ability of Ameriprise Financial or its affiliates to perform under their contracts with the Funds, these proceedings are subject to uncertainties and, as such, we are unable to estimate the possible loss or range of loss that may result. An adverse outcome in one or more of these proceedings could result in adverse judgments, settlements, fines, penalties or other relief that could have a material adverse effect on the consolidated financial condition or results of operations of Ameriprise Financial.
| | | | |
| COLUMBIA EUROPEAN EQUITY FUND — 2012 SEMIANNUAL REPORT | | | 39 | |
The policy of the Board is to vote the proxies of the companies in which the Fund holds investments consistent with the procedures as stated in the Statement of Additional Information (SAI). You may obtain a copy of the SAI without charge by calling 800.345.6611; contacting your financial intermediary; visiting columbiamanagement.com; or searching the website of the Securities and Exchange Commission (SEC) at www.sec.gov. Information regarding how the Fund voted proxies relating to portfolio securities is filed with the SEC by August 31 for the most recent 12-month period ending June 30 of that year, and is available without charge by visiting columbiamanagement.com; or searching the website of the SEC at www.sec.gov.
| | |
Approval of Investment Management Services |
| |
and Subadvisory Agreements | | |
Columbia Management Investment Advisers, LLC (“Columbia Management” or the “investment manager”), a wholly-owned subsidiary of Ameriprise Financial, Inc. (“Ameriprise Financial”), serves as the investment manager to Columbia European Equity Fund (the “Fund”). Under an investment management services agreement (the “IMS Agreement”), Columbia Management provides investment advice and other services to the Fund and all funds distributed by Columbia Management Investment Distributors, Inc. (collectively, the “Funds”). In addition, under a Subadvisory Agreement (the “Subadvisory Agreement”) between Columbia Management and Threadneedle International Limited (the “Subadviser”), an affiliate of Columbia Management, the Subadviser has provided portfolio management and related services for the Fund.
On an annual basis, the Fund’s Board of Trustees (the “Board”), including the independent Board members (the “Independent Trustees”), considers renewal of the IMS Agreement and the Subadvisory Agreement (together, the “Advisory Agreements”). Columbia Management prepared detailed reports for the Board and its Contracts Committee in March and April 2012, including reports based on analyses of data provided by an independent organization and a comprehensive response to each item of information requested by independent legal counsel to the Independent Trustees (“Independent Legal Counsel”) in a letter to the investment manager, to assist the Board in making this determination. All of the materials presented in March and April were first supplied in draft form to designated representatives of the Independent Trustees, i.e., Independent Legal Counsel, the Chair of the Board and the Chair of the Contracts Committee (including materials relating to the Fund’s expense cap), and the final materials were revised to reflect comments provided by these Board representatives. In addition, throughout the year, the Board (or its committees) regularly meets with portfolio management teams and senior management
| | |
| 40 | | COLUMBIA EUROPEAN EQUITY FUND — 2012 SEMIANNUAL REPORT |
personnel and reviews information prepared by Columbia Management addressing the services Columbia Management provides and Fund performance. The Board accords particular weight to the work, deliberations and conclusions of the Contracts Committee, the Investment Review Committee and the Compliance Committee in determining whether to continue the Advisory Agreements.
The Board, at its April 10-12, 2012 in-person Board meeting (the “April Meeting”), considered the renewal of the Advisory Agreements for an additional one-year term. At the April Meeting, Independent Legal Counsel reviewed with the Independent Trustees various factors relevant to the Board’s consideration of advisory and subadvisory agreements and the Board’s legal responsibilities related to such consideration. Following an analysis and discussion of the factors identified below, the Board, including all of the Independent Trustees, approved the renewal of each of the Advisory Agreements.
Nature, Extent and Quality of Services Provided by Columbia Management and the Subadviser: The Board considered its analysis of various reports and presentations received by it or one of its committees detailing the services performed by Columbia Management and the Subadviser, as well as their history, reputation, expertise, resources and relative capabilities, and the qualifications of their personnel.
With respect to Columbia Management, the Board specifically considered many developments during the past year concerning the services provided by Columbia Management, including, in particular, the continued investment in, and resources dedicated to, the Funds’ operations and the successful completion of various integration initiatives and the consolidation of dozens of Funds. The Board noted the information it received concerning Columbia Management’s ability to retain key portfolio management personnel. In that connection, the Board took into account its meetings with Columbia Management’s Chief Investment Officer (the “CIO”) and considered the CIO’s successful execution of additional risk and portfolio management oversight applied to the Funds. The Board also assessed Columbia Management’s significant investment in upgrading technology (such as an equity trading system) and considered management’s commitments to enhance existing resources in this area.
In connection with the Board’s evaluation of the overall package of services provided by Columbia Management, the Board also considered the quality of administrative services provided to the Fund by Columbia Management. The Board also reviewed the financial condition of Columbia Management and its affiliates and their ability to carry out their responsibilities under the IMS
| | | | |
| COLUMBIA EUROPEAN EQUITY FUND — 2012 SEMIANNUAL REPORT | | | 41 | |
| | |
| Approval of Investment Management Services |
| |
| and Subadvisory Agreements (continued) | | |
Agreement and the Fund’s other service agreements with affiliates of Ameriprise Financial. In addition, the Board discussed the acceptability of the terms of the IMS Agreement (including the relatively broad scope of services required to be performed by Columbia Management). The Board concluded that the services being performed under the IMS Agreement were of a reasonably high quality.
Based on the foregoing, and based on other information received (both oral and written, including the information on investment performance referenced below) and other considerations, the Board concluded that Columbia Management and its affiliates were in a position to continue to provide a high quality and level of services to the Fund.
With respect to the Subadviser, the Board observed that it had previously approved the Subadviser’s code of ethics and compliance program, that the Chief Compliance Officer of the Fund continues to monitor the code and the program, and that no material issues have been reported. The Board also considered the Subadviser’s investment strategy/style, including particularly as it relates to the Fund, as well as the experience of the personnel that manage the Fund. The Board also considered the financial condition of the Subadviser and its capability and wherewithal to carry out its responsibilities under the Subadvisory Agreement. In addition, the Board discussed the acceptability of the terms of the Subadvisory Agreement including the scope of services required to be performed. The Board noted that the terms of the Subadvisory Agreement are generally consistent with the terms of other subadviser agreements for subadvisers who manage other funds managed by the investment manager. It was observed that no changes were recommended to the Subadvisory Agreement. Based on the foregoing, and based on other information received (both oral and written) and other considerations, including, in particular, the performance of the Fund (discussed below) as well as the investment manager’s recommendation that the Board approve renewal of the Subadvisory Agreement with the Subadviser, the Board concluded that the services being performed under the Subadvisory Agreement were of a reasonably high quality.
Based on the foregoing, and based on other information received (both oral and written, including the information on investment performance referenced below) and other considerations, the Board concluded that the Subadviser was in a position to continue to provide a high quality and level of services to the Fund.
Investment Performance: For purposes of evaluating the nature, extent and quality of services provided under the Advisory Agreements, the Board reviewed the investment performance of the Fund. In this regard, the Board considered detailed reports providing the results of analyses performed by an independent
| | |
| 42 | | COLUMBIA EUROPEAN EQUITY FUND — 2012 SEMIANNUAL REPORT |
organization showing, for various periods, the performance of the Fund, the performance of a benchmark index, the percentage ranking of the Fund among its comparison group and the net assets of the Fund. The Board observed that the Fund’s investment performance met expectations.
Additionally, the Board reviewed the performance of the Subadviser and Columbia Management’s process for monitoring the Subadviser. The Board considered, in particular, management’s rationale for recommending the continued retention of the Subadviser.
Comparative Fees, Costs of Services Provided and the Profits Realized By Columbia Management, its Affiliates and the Subadviser from their Relationships with the Fund: The Board reviewed comparative fees and the costs of services provided under each of the Advisory Agreements. The Board members considered detailed comparative information set forth in an annual report on fees and expenses, including, among other things, data (based on analyses conducted by an independent organization) showing a comparison of the Fund’s expenses with median expenses paid by funds in its comparative peer universe, as well as data showing the Fund’s contribution to Columbia Management’s profitability.
The Board accorded particular weight to the notion that the level of fees should reflect a rational pricing model applied consistently across the various product lines in the Fund family, while assuring that the overall fees for each Fund (with few defined exceptions) are generally in line with the “pricing philosophy” (i.e., that the total expense ratio of the Fund is at, or below, the median expense ratio of funds in the same comparison universe of the Fund). The Board took into account that the Fund’s total expense ratio (after considering proposed expense caps/waivers) approximated the peer universe’s median expense ratio. Additionally, the Board reviewed the level of subadvisory fees paid to the Subadviser, noting that the fees are paid by the investment manager and do not impact the fees paid by the Fund. The Board observed that the subadvisory fee level for the Subadviser was generally comparable to those charged by other subadvisers to similar funds managed by the investment manager. The Board also reviewed fee rates charged by the Subadviser to other client accounts. Based on its review, the Board concluded that the Fund’s management and subadvisory fees were fair and reasonable in light of the extent and quality of services that the Fund receives.
The Board also considered the profitability of Columbia Management and its affiliates in connection with Columbia Management providing investment management services to the Fund. In this regard, the Board referred to a detailed
| | | | |
| COLUMBIA EUROPEAN EQUITY FUND — 2012 SEMIANNUAL REPORT | | | 43 | |
| | |
| Approval of Investment Management Services |
| |
| and Subadvisory Agreements (continued) | | |
profitability report, discussing the profitability to Columbia Management and Ameriprise Financial from managing, operating and distributing the Funds. In this regard, the Board observed that 2011 profitability, while slightly lower than 2010, was generally in line with the reported profitability of other asset management firms. The Board also considered the indirect economic benefits flowing to Columbia Management or its affiliates in connection with managing or distributing the Funds, such as the enhanced ability to offer various other financial products to Ameriprise Financial customers, soft dollar benefits and overall reputational advantages. The Board noted that the fees paid by the Fund should permit the investment manager to offer competitive compensation to its personnel, make necessary investments in its business and earn an appropriate profit. The Board concluded that profitability levels were reasonable.
Economies of Scale to be Realized: The Board also considered the economies of scale that might be realized by Columbia Management as the Fund grows and took note of the extent to which Fund shareholders might also benefit from such growth.
Based on the foregoing, the Board, including all of the Independent Trustees, concluded that fees payable under the Advisory Agreements were fair and reasonable in light of the extent and quality of services provided. In reaching this conclusion, no single factor was determinative. At the April Meeting, the Board, including all of the Independent Trustees, approved the renewal of the Advisory Agreements.
| | |
| 44 | | COLUMBIA EUROPEAN EQUITY FUND — 2012 SEMIANNUAL REPORT |
Columbia European Equity Fund
P.O. Box 8081
Boston, MA 02266-8081
columbiamanagement.com
| | | | |
 | | This report must be accompanied or preceded by the Fund’s current prospectus. The
Fund is distributed by Columbia Management Investment Distributors, Inc., member
FINRA, and managed by Columbia Management Investment Advisers, LLC. ©2012 Columbia Management Investment Advisers, LLC. All rights reserved. | | S-6016 N (6/12) |
Semiannual Report

Columbia Frontier Fund
Semiannual Report for the Period Ended April 30, 2012
Columbia Frontier Fund seeks to provide shareholders with growth of capital.
Not FDIC insured ¡ No bank guarantee ¡ May lose value
| | | | |
| |
Your Fund at a Glance | | | 2 | |
| |
Fund Expense Example | | | 6 | |
| |
Portfolio of Investments | | | 8 | |
| |
Statement of Assets and Liabilities | | | 16 | |
| |
Statement of Operations | | | 18 | |
| |
Statement of Changes in Net Assets | | | 19 | |
| |
Financial Highlights | | | 21 | |
| |
Notes to Financial Statements | | | 29 | |
| |
Proxy Voting | | | 43 | |
| |
Approval of Investment Management Services Agreement | | | 43 | |
See the Fund’s prospectus for risks associated with investing in the Fund.
| | | | |
| COLUMBIA FRONTIER FUND — 2012 SEMIANNUAL REPORT | | | 1 | |
FUND SUMMARY
| > | | Columbia Frontier Fund (the Fund) Class A shares returned 15.29% (excluding sales charge) for the six months ended April 30, 2012. |
| > | | The Fund outperformed its benchmark, the Russell 2000® Growth Index, which rose 10.58% during the same period. |
ANNUALIZED TOTAL RETURNS (for period ended April 30, 2012)
| | | | | | | | | | | | | | | | | | |
| | | | | 6 months* | | | 1 year | | | 5 years | | | 10 years | |
Columbia Frontier Fund
Class A (excluding sales charge) | | | +15.29% | | | | -7.25% | | | | -1.36% | | | | +2.65% | |
Russell 2000 Growth Index (1) (unmanaged) | | | +10.58% | | | | -4.42% | | | | +3.27% | | | | +6.06% | |
The performance information shown represents past performance and is not a guarantee of future results. The investment return and principal value of your investment will fluctuate so that your shares, when redeemed, may be worth more or less than their original cost. Current performance may be lower or higher than the performance information shown. You may obtain performance information current to the most recent month-end by contacting your financial intermediary, visiting columbiamanagement.com or calling 800.345.6611.
The 5.75% sales charge applicable to Class A shares of the Fund is not reflected in the table above. If reflected, returns would be lower than those shown. The performance of other classes may vary from that shown because of differences in fees and expenses. The Fund’s returns reflect the effect of fee waivers/expense reimbursements, if any. Without such waivers/reimbursements, the Fund’s returns would be lower. See the Average Annual Total Returns table for performance of other share classes of the Fund.
The index does not reflect the effects of sales charges, expenses and taxes. It is not possible to invest directly in an index.
| (1) | | The Russell 2000 Growth Index, an unmanaged index, measures the performance of those Russell 2000 Index companies with higher price-to-book ratios and higher forecasted growth values. The index reflects reinvestment of all distributions and changes in market prices. |
| | |
| 2 | | COLUMBIA FRONTIER FUND — 2012 SEMIANNUAL REPORT |
AVERAGE ANNUAL TOTAL RETURNS
| | | | | | | | | | | | | | | | |
| at April 30, 2012 | | | | | | | | | | | | |
| Without sales charge | | 6 months* | | | 1 year | | | 5 years | | | 10 years | |
Class A (inception 12/10/84) | | | +15.29% | | | | -7.25% | | | | -1.36% | | | | +2.65% | |
Class B (inception 4/22/96) | | | +14.81% | | | | -7.95% | | | | -2.11% | | | | +1.87% | |
Class C (inception 5/27/99) | | | +15.02% | | | | -7.91% | | | | -2.01% | | | | +1.93% | |
Class I** (inception 8/3/09) | | | +15.67% | | | | -6.86% | | | | -1.13% | | | | +2.77% | |
Class R** (inception 4/30/03) | | | +15.24% | | | | -7.41% | | | | -1.65% | | | | +2.39% | |
Class R4** (inception 8/3/09) | | | +15.45% | | | | -7.05% | | | | -1.27% | | | | +2.70% | |
Class R5 (inception 11/30/01) | | | +15.56% | | | | -6.79% | | | | -0.92% | | | | +3.23% | |
Class Z** (inception 9/27/10) | | | +15.47% | | | | -6.95% | | | | -1.28% | | | | +2.69% | |
| | | | |
| With sales charge | | | | | | | | | | | | |
Class A (inception 12/10/84) | | | +8.69% | | | | -12.55% | | | | -2.52% | | | | +2.05% | |
Class B (inception 4/22/96) | | | +9.81% | | | | -12.56% | | | | -2.42% | | | | +1.87% | |
Class C (inception 5/27/99) | | | +14.02% | | | | -8.83% | | | | -2.01% | | | | +1.93% | |
The “Without sales charge” returns for Class A, Class B and Class C shares do not include applicable initial or contingent deferred sales charges. If included, returns would be lower than those shown. The “With sales charge” returns for Class A, Class B and Class C shares include: the maximum initial sales charge of 5.75% for Class A shares; the applicable contingent deferred sales charge (CDSC) for Class B shares (applied as follows: first year 5%; second year 4%; third and fourth years 3%; fifth year 2%; sixth year 1%; no sales charge thereafter); and a 1% CDSC for Class C shares sold within one year after purchase. The Fund’s other share classes are not subject to sales charges and have limited eligibility. See the Fund’s prospectuses for details.
| ** | The returns shown for periods prior to the share class inception date (including returns since inception, which are since Fund inception) include the returns of the Fund’s Class A shares. These returns are adjusted to reflect any higher class-related operating expenses of the newer share classes, as applicable. Please visit columbiamanagement.com/mutual-fund/appended-performance for more information. |
| | | | |
| COLUMBIA FRONTIER FUND — 2012 SEMIANNUAL REPORT | | | 3 | |
| | |
| Your Fund at a Glance (continued) | | |
| | | | |
| PORTFOLIO BREAKDOWN(1) (at April 30, 2012) | |
Stocks | | | 88.8 | % |
Consumer Discretionary | | | 17.0 | |
Consumer Staples | | | 6.9 | |
Energy | | | 4.8 | |
Financials | | | 3.6 | |
Health Care | | | 17.6 | |
Industrials | | | 11.4 | |
Information Technology | | | 22.8 | |
Materials | | | 3.2 | |
Telecommunication Services | | | 1.1 | |
Utilities | | | 0.4 | |
Exchange-Traded Funds | | | 6.1 | |
Other(2) | | | 5.1 | |
| (1) | | Percentages indicated are based upon total investments (excluding Investments of Cash Collateral Received for Securities on Loan). The Fund’s portfolio composition is subject to change. |
| (2) | | Includes investments in Money Market Funds. |
| | | | |
| TOP TEN HOLDINGS(1) (at April 30, 2012) | |
iShares S&P SmallCap 600/BARRA Growth Index Fund | | | 4.0 | % |
iShares Russell 2000 Growth Index Fund | | | 2.5 | |
Ciena Corp. | | | 2.0 | |
Silicon Graphics International Corp. | | | 1.6 | |
Cray, Inc. | | | 1.6 | |
Catalyst Health Solutions, Inc. | | | 1.5 | |
Vera Bradley, Inc. | | | 1.5 | |
Brunswick Corp. | | | 1.5 | |
Quidel Corp. | | | 1.4 | |
Tornier NV | | | 1.4 | |
(1) Percentages indicated are based upon total investments (excluding Investments of Cash Collateral Received for Securities on Loan and Money Market Funds).
For further detail about these holdings, please refer to the section entitled “Portfolio of Investments.”
| | |
| 4 | | COLUMBIA FRONTIER FUND — 2012 SEMIANNUAL REPORT |
MORNINGSTAR STYLE BOXTM
| | |
 | | The Morningstar Style BoxTM is based on the Fund’s portfolio holdings.
For equity funds, the vertical axis shows the market capitalization of the
stocks owned, and the horizontal axis shows investment style (value,
blend, or growth). Information shown is based on the most recent data
provided by Morningstar. |
©2012 Morningstar, Inc. All rights reserved. The Morningstar information contained herein: (1) is proprietary to Morningstar and/or its content providers; (2) may not be copied or distributed; and (3) is not warranted to be accurate, complete, or timely. Neither Morningstar nor its content providers are responsible for any damages or losses arising from any use of this information. Past performance is no guarantee of future results.
| | | | |
| COLUMBIA FRONTIER FUND — 2012 SEMIANNUAL REPORT | | | 5 | |
(Unaudited)
Understanding your expenses
As an investor, you incur two types of costs. There are transaction costs, which generally include sales charges on purchases and may include redemption fees. There are also ongoing costs, which generally include management fees, distribution and service (Rule 12b-1) fees, and other fund expenses. The following information is intended to help you understand your ongoing costs (in dollars) of investing in the Fund and to help you compare these costs with the ongoing costs of investing in other mutual funds.
Analyzing your fund’s expenses
To illustrate these ongoing costs, we have provided examples and calculated the expenses paid by investors in each share class of the Fund during the period. The actual and hypothetical information in the table is based on an initial investment of $1,000 at the beginning of the period indicated and held for the entire period. Expense information is calculated two ways and each method provides you with different information. The amount listed in the “Actual” column is calculated using the Fund’s actual operating expenses and total return for the period. You may use the Actual information, together with the amount invested, to estimate the expenses that you paid over the period. Simply divide your account value by $1,000 (for example, an $8,600 account value divided by $1,000 = 8.6), then multiply the results by the expenses paid during the period under the Actual column. The amount listed in the “Hypothetical” column assumes a 5% annual rate of return before expenses (which is not the Fund’s actual return) and then applies the Fund’s actual expense ratio for the period to the hypothetical return. You should not use the hypothetical account values and expenses to estimate either your actual account balance at the end of the period or the expenses you paid during the period. See “Compare with other funds” below for details on how to use the hypothetical data.
Compare with other funds
Since all mutual funds are required to include the same hypothetical calculations about expenses in shareholder reports, you can use this information to compare the ongoing cost of investing in the Fund with other funds. To do so, compare the hypothetical example with the 5% hypothetical examples that appear in the shareholder reports of other funds. As you compare hypothetical examples of other funds, it is important to note that hypothetical examples are meant to highlight the ongoing costs of investing in a fund only and do not reflect any transaction costs, such as sales charges, or redemption or exchange fees. Therefore, the hypothetical calculations are useful in comparing ongoing costs only, and will not help you determine the relative total costs of owning different funds. If transaction costs were included in these calculations, your costs would be higher.
| | |
| 6 | | COLUMBIA FRONTIER FUND — 2012 SEMIANNUAL REPORT |
November 1, 2011 — April 30, 2012
| | | | | | | | | | | | | | | | | | | | | | | | | | | | |
| | | Account value at the
beginning of the
period ($) | | | Account value at the
end of the period ($) | | | Expenses paid
during the period ($) | | | Fund’s
annualized
expense
ratio (%) | |
| | | Actual | | | Hypothetical | | | Actual | | | Hypothetical | | | Actual | | | Hypothetical | | | Actual | |
Class A | | | 1,000.00 | | | | 1,000.00 | | | | 1,152.90 | | | | 1,017.35 | | | | 8.08 | | | | 7.57 | | | | 1.51 | |
Class B | | | 1,000.00 | | | | 1,000.00 | | | | 1,148.10 | | | | 1,013.63 | | | | 12.07 | | | | 11.31 | | | | 2.26 | |
Class C | | | 1,000.00 | | | | 1,000.00 | | | | 1,150.20 | | | | 1,013.63 | | | | 12.08 | | | | 11.31 | | | | 2.26 | |
Class I | | | 1,000.00 | | | | 1,000.00 | | | | 1,156.70 | | | | 1,019.59 | | | | 5.68 | | | | 5.32 | | | | 1.06 | |
Class R | | | 1,000.00 | | | | 1,000.00 | | | | 1,152.40 | | | | 1,016.11 | | | | 9.42 | | | | 8.82 | | | | 1.76 | |
Class R4 | | | 1,000.00 | | | | 1,000.00 | | | | 1,154.50 | | | | 1,018.20 | | | | 7.18 | | | | 6.72 | | | | 1.34 | |
Class R5 | | | 1,000.00 | | | | 1,000.00 | | | | 1,155.60 | | | | 1,019.44 | | | | 5.84 | | | | 5.47 | | | | 1.09 | |
Class Z | | | 1,000.00 | | | | 1,000.00 | | | | 1,154.70 | | | | 1,018.55 | | | | 6.80 | | | | 6.37 | | | | 1.27 | |
Expenses paid during the period are equal to the annualized expense ratio for each class as indicated above, multiplied by the average account value over the period and then multiplied by the number of days in the Fund’s most recent fiscal half year and divided by 366.
Expenses do not include fees and expenses incurred indirectly by the Fund from the underlying funds in which the Fund may invest (also referred to as “acquired funds”), including affiliated and non-affiliated pooled investment vehicles (including mutual funds and exchange traded funds).
Had Columbia Management Investment Advisers, LLC and/or certain of its affiliates not waived/reimbursed certain fees and expenses, account value at the end of the period would have been reduced.
| | | | |
| COLUMBIA FRONTIER FUND — 2012 SEMIANNUAL REPORT | | | 7 | |
Columbia Frontier Fund
April 30, 2012 (Unaudited)
(Percentages represent value of investments compared to net assets)
| | | | | | | | |
| Issuer | | Shares | | | Value | |
| Common Stocks 85.1% | |
| | | | | | | | |
CONSUMER DISCRETIONARY 16.4% | |
Auto Components 0.5% | |
Amerigon, Inc.(a) | | | 27,471 | | | | $392,835 | |
Automobiles 0.2% | |
Tesla Motors, Inc.(a)(b) | | | 4,859 | | | | 160,979 | |
Diversified Consumer Services 1.4% | |
Grand Canyon Education, Inc.(a) | | | 28,642 | | | | 498,084 | |
Sotheby’s | | | 15,015 | | | | 590,390 | |
| | | | | | | | |
Total | | | | 1,088,474 | |
Hotels, Restaurants & Leisure 6.2% | |
BJ’s Restaurants, Inc.(a) | | | 18,210 | | | | 786,490 | |
Buffalo Wild Wings, Inc.(a) | | | 2,539 | | | | 212,895 | |
Caribou Coffee Co., Inc.(a) | | | 47,067 | | | | 772,369 | |
Domino’s Pizza, Inc. | | | 21,355 | | | | 807,433 | |
Famous Dave’s Of America, Inc.(a) | | | 30,943 | | | | 308,502 | |
Jamba, Inc.(a) | | | 261,247 | | | | 485,919 | |
Pinnacle Entertainment, Inc.(a) | | | 39,597 | | | | 439,527 | |
Scientific Games Corp., Class A(a) | | | 37,600 | | | | 382,016 | |
Shuffle Master, Inc.(a) | | | 37,118 | | | | 655,875 | |
| | | | | | | | |
Total | | | | 4,851,026 | |
Household Durables 0.4% | |
KB Home(b) | | | 31,950 | | | | 277,326 | |
Leisure Equipment & Products 1.3% | |
Brunswick Corp. | | | 39,766 | | | | 1,045,448 | |
Media 1.8% | |
IMAX Corp.(a) | | | 32,700 | | | | 783,819 | |
Lions Gate Entertainment Corp.(a)(b) | | | 28,042 | | | | 342,953 | |
Rentrak Corp.(a)(b) | | | 17,102 | | | | 323,570 | |
| | | | | | | | |
Total | | | | 1,450,342 | |
Specialty Retail 1.3% | |
Ascena Retail Group, Inc.(a) | | | 17,504 | | | | 358,482 | |
Genesco, Inc.(a) | | | 9,047 | | | | 678,525 | |
| | | | | | | | |
Total | | | | 1,037,007 | |
Textiles, Apparel & Luxury Goods 3.3% | |
Gildan Activewear, Inc. | | | 27,805 | | | | 800,228 | |
Maidenform Brands, Inc.(a)(b) | | | 30,928 | | | | 706,086 | |
Vera Bradley, Inc.(a)(b) | | | 40,577 | | | | 1,054,191 | |
| | | | | | | | |
Total | | | | 2,560,505 | |
TOTAL CONSUMER DISCRETIONARY | | | | 12,863,942 | |
| | | | | | | | |
| Issuer | | Shares | | | Value | |
| Common Stocks (continued) | |
| | | | | | | | |
|
CONSUMER STAPLES 6.7% | |
Food & Staples Retailing 3.5% | |
Andersons, Inc. (The) | | | 9,761 | | | | $491,955 | |
Casey’s General Stores, Inc. | | | 13,995 | | | | 788,618 | |
Chefs’ Warehouse Holdings, Inc. (The)(a) | | | 27,122 | | | | 655,810 | |
Fresh Market, Inc. (The)(a) | | | 9,324 | | | | 477,109 | |
United Natural Foods, Inc.(a)(b) | | | 7,120 | | | | 350,945 | |
| | | | | | | | |
Total | | | | 2,764,437 | |
Food Products 2.2% | |
Cal-Maine Foods, Inc. | | | 9,566 | | | | 344,663 | |
Darling International, Inc.(a) | | | 32,783 | | | | 536,985 | |
Hain Celestial Group, Inc. (The)(a)(b) | | | 16,819 | | | | 795,539 | |
| | | | | | | | |
Total | | | | 1,677,187 | |
Personal Products 1.0% | |
Elizabeth Arden, Inc.(a) | | | 20,200 | | | | 787,396 | |
| | | | | | | | |
TOTAL CONSUMER STAPLES | | | | 5,229,020 | |
|
ENERGY 4.1% | |
Energy Equipment & Services 1.9% | |
Cal Dive International, Inc.(a)(b) | | | 79,156 | | | | 306,334 | |
Ocean Rig UDW, Inc.(a) | | | 1,704 | | | | 29,701 | |
Patterson-UTI Energy, Inc.(b) | | | 35,867 | | | | 579,969 | |
Superior Energy Services, Inc.(a) | | | 9,231 | | | | 248,499 | |
Tetra Technologies, Inc.(a) | | | 39,503 | | | | 344,071 | |
| | | | | | | | |
Total | | | | 1,508,574 | |
Oil, Gas & Consumable Fuels 2.2% | |
Clean Energy Fuels Corp.(a)(b) | | | 18,117 | | | | 348,571 | |
CVR Energy, Inc.(a) | | | 11,473 | | | | 348,320 | |
Rosetta Resources, Inc.(a) | | | 7,248 | | | | 364,357 | |
Solazyme, Inc.(a)(b) | | | 58,891 | | | | 647,801 | |
| | | | | | | | |
Total | | | | 1,709,049 | |
TOTAL ENERGY | | | | 3,217,623 | |
|
FINANCIALS 3.1% | |
Commercial Banks 1.9% | |
CapitalSource, Inc. | | | 133,523 | | | | 861,223 | |
PrivateBancorp, Inc. | | | 40,540 | | | | 637,694 | |
| | | | | | | | |
Total | | | | 1,498,917 | |
The accompanying Notes to Financial Statements are an integral part of this statement.
| | |
| 8 | | COLUMBIA FRONTIER FUND — 2012 SEMIANNUAL REPORT |
| | | | | | | | |
| Issuer | | Shares | | | Value | |
| Common Stocks (continued) | |
| | | | | | | | |
|
FINANCIALS (cont.) | |
Real Estate Investment Trusts (REITs) 1.2% | |
FelCor Lodging Trust, Inc.(a) | | | 56,414 | | | | $238,067 | |
Home Properties, Inc. | | | 6,500 | | | | 396,825 | |
Kilroy Realty Corp.(b) | | | 6,239 | | | | 296,041 | |
| | | | | | | | |
Total | | | | 930,933 | |
TOTAL FINANCIALS | | | | 2,429,850 | |
|
HEALTH CARE 17.1% | |
Biotechnology 5.7% | |
Alkermes PLC(a) | | | 44,139 | | | | 763,605 | |
Amarin Corp. PLC, ADR(a)(b) | | | 79,852 | | | | 974,993 | |
Cepheid, Inc.(a) | | | 15,400 | | | | 591,514 | |
Cubist Pharmaceuticals, Inc.(a)(b) | | | 7,647 | | | | 323,315 | |
Halozyme Therapeutics, Inc.(a) | | | 93,519 | | | | 756,569 | |
Human Genome Sciences, Inc.(a)(b) | | | 27,126 | | | | 399,023 | |
Rigel Pharmaceuticals, Inc.(a)(b) | | | 80,706 | | | | 623,857 | |
| | | | | | | | |
Total | | | | 4,432,876 | |
Health Care Equipment & Supplies 5.0% | |
Antares Pharma, Inc.(a)(b) | | | 152,887 | | | | 481,594 | |
Endologix, Inc.(a) | | | 12,044 | | | | 180,419 | |
OraSure Technologies, Inc.(a)(b) | | | 73,148 | | | | 839,008 | |
Quidel Corp.(a)(b) | | | 62,233 | | | | 1,028,089 | |
Tornier NV(a) | | | 42,319 | | | | 1,004,653 | |
Uroplasty, Inc.(a) | | | 140,187 | | | | 426,169 | |
| | | | | | | | |
Total | | | | 3,959,932 | |
Health Care Providers & Services 3.4% | |
Catalyst Health Solutions, Inc.(a) | | | 12,895 | | | | 1,113,741 | |
Health Management Associates, Inc., Class A(a) | | | 78,917 | | | | 568,202 | |
HMS Holdings Corp.(a) | | | 25,831 | | | | 621,494 | |
WellCare Health Plans, Inc.(a) | | | 5,954 | | | | 364,266 | |
| | | | | | | | |
Total | | | | 2,667,703 | |
Life Sciences Tools & Services 0.9% | |
Techne Corp.(b) | | | 10,268 | | | | 687,340 | |
Pharmaceuticals 2.1% | |
Akorn, Inc.(a)(b) | | | 21,008 | | | | 254,827 | |
Auxilium Pharmaceuticals, Inc.(a) | | | 26,866 | | | | 481,439 | |
Jazz Pharmaceuticals PLC(a) | | | 2,525 | | | | 128,851 | |
Questcor Pharmaceuticals, Inc.(a)(b) | | | 16,893 | | | | 758,495 | |
| | | | | | | | |
Total | | | | 1,623,612 | |
TOTAL HEALTH CARE | | | | 13,371,463 | |
| | | | | | | | |
| Issuer | | Shares | | | Value | |
| Common Stocks (continued) | |
| | | | | | | | |
|
INDUSTRIALS 11.0% | |
Aerospace & Defense 1.5% | |
HEICO Corp. | | | 8,858 | | | | $357,185 | |
Hexcel Corp.(a)(b) | | | 28,838 | | | | 789,584 | |
| | | | | | | | |
Total | | | | 1,146,769 | |
Airlines 1.0% | |
U.S. Airways Group, Inc.(a)(b) | | | 77,288 | | | | 792,975 | |
Commercial Services & Supplies 1.4% | |
Clean Harbors, Inc.(a) | | | 7,565 | | | | 516,235 | |
Steelcase, Inc., Class A(b) | | | 67,409 | | | | 582,414 | |
| | | | | | | | |
Total | | | | 1,098,649 | |
Construction & Engineering 1.0% | |
Granite Construction, Inc. | | | 10,458 | | | | 291,151 | |
MYR Group, Inc.(a) | | | 28,926 | | | | 483,642 | |
| | | | | | | | |
Total | | | | 774,793 | |
Electrical Equipment 0.4% | |
Acuity Brands, Inc. | | | 5,772 | | | | 320,750 | |
Machinery 3.8% | |
Chart Industries, Inc.(a) | | | 12,177 | | | | 930,688 | |
China Valves Technology, Inc.(a)(b) | | | 42,661 | | | | 84,042 | |
Clarcor, Inc. | | | 6,300 | | | | 302,526 | |
Manitowoc Co., Inc. (The) | | | 28,798 | | | | 398,852 | |
Proto Labs, Inc.(a) | | | 1,659 | | | | 61,549 | |
Terex Corp.(a)(b) | | | 20,976 | | | | 474,897 | |
Woodward, Inc. | | | 17,775 | | | | 739,262 | |
| | | | | | | | |
Total | | | | 2,991,816 | |
Professional Services 1.0% | |
Acacia Research Corp.(a) | | | 12,873 | | | | 527,793 | |
Navigant Consulting, Inc.(a) | | | 19,003 | | | | 264,522 | |
| | | | | | | | |
Total | | | | 792,315 | |
Road & Rail 0.9% | |
Knight Transportation, Inc. | | | 25,459 | | | | 418,037 | |
Quality Distribution, Inc.(a) | | | 29,022 | | | | 324,176 | |
| | | | | | | | |
Total | | | | 742,213 | |
TOTAL INDUSTRIALS | | | | 8,660,280 | |
|
INFORMATION TECHNOLOGY 22.1% | |
Communications Equipment 2.9% | |
Aruba Networks, Inc.(a)(b) | | | 17,362 | | | | 366,685 | |
Ciena Corp.(a)(b) | | | 96,856 | | | | 1,435,406 | |
Emulex Corp.(a) | | | 36,710 | | | | 318,643 | |
InterDigital, Inc.(b) | | | 5,809 | | | | 161,026 | |
| | | | | | | | |
Total | | | | 2,281,760 | |
The accompanying Notes to Financial Statements are an integral part of this statement.
| | | | |
| COLUMBIA FRONTIER FUND — 2012 SEMIANNUAL REPORT | | | 9 | |
| | |
| Portfolio of Investments (continued) | | |
| | | | | | | | |
| Issuer | | Shares | | | Value | |
| Common Stocks (continued) | |
| | | | | | | | |
INFORMATION TECHNOLOGY (cont.) | |
Computers & Peripherals 4.8% | |
Cray, Inc.(a) | | | 102,473 | | | | $1,142,574 | |
QLogic Corp.(a) | | | 33,905 | | | | 584,861 | |
Silicon Graphics International Corp.(a)(b) | | | 125,419 | | | | 1,183,956 | |
Stratasys, Inc.(a)(b) | | | 5,482 | | | | 280,733 | |
Synaptics, Inc.(a)(b) | | | 18,527 | | | | 568,964 | |
| | | | | | | | |
Total | | | | 3,761,088 | |
Electronic Equipment, Instruments & Components 1.5% | |
Coherent, Inc.(a) | | | 2,533 | | | | 133,236 | |
Fabrinet(a)(b) | | | 45,479 | | | | 764,957 | |
Plexus Corp.(a) | | | 5,000 | | | | 161,850 | |
Universal Display Corp.(a)(b) | | | 3,424 | | | | 153,977 | |
| | | | | | | | |
Total | | | | 1,214,020 | |
Internet Software & Services 2.6% | |
DealerTrack Holdings, Inc.(a) | | | 13,275 | | | | 395,993 | |
LogMeIn, Inc.(a) | | | 11,791 | | | | 424,594 | |
Open Text Corp.(a) | | | 6,845 | | | | 383,251 | |
OpenTable, Inc.(a)(b) | | | 18,742 | | | | 838,330 | |
| | | | | | | | |
Total | | | | 2,042,168 | |
IT Services 1.0% | |
Jack Henry & Associates, Inc.(b) | | | 12,255 | | | | 416,180 | |
Sapient Corp.(b) | | | 31,870 | | | | 381,484 | |
| | | | | | | | |
Total | | | | 797,664 | |
Semiconductors & Semiconductor Equipment 6.4% | |
Cavium, Inc.(a) | | | 32,230 | | | | 943,050 | |
Cirrus Logic, Inc.(a)(b) | | | 17,510 | | | | 479,424 | |
Inphi Corp.(a)(b) | | | 39,877 | | | | 404,752 | |
Mellanox Technologies Ltd.(a) | | | 12,568 | | | | 736,359 | |
OmniVision Technologies, Inc.(a)(b) | | | 24,437 | | | | 450,130 | |
ON Semiconductor Corp.(a) | | | 71,935 | | | | 594,183 | |
Semtech Corp.(a) | | | 28,817 | | | | 785,551 | |
TriQuint Semiconductor, Inc.(a)(b) | | | 125,788 | | | | 613,845 | |
| | | | | | | | |
Total | | | | 5,007,294 | |
Software 2.9% | |
CommVault Systems, Inc.(a) | | | 10,366 | | | | 539,758 | |
Concur Technologies, Inc.(a)(b) | | | 5,920 | | | | 334,835 | |
NetSuite, Inc.(a)(b) | | | 4,389 | | | | 194,784 | |
Quest Software, Inc.(a) | | | 27,538 | | | | 640,809 | |
SolarWinds, Inc.(a) | | | 7,607 | | | | 356,844 | |
TiVo, Inc.(a) | | | 15,528 | | | | 167,547 | |
| | | | | | | | |
Total | | | | 2,234,577 | |
TOTAL INFORMATION TECHNOLOGY | | | | 17,338,571 | |
| | | | | | | | |
| Issuer | | Shares | | | Value | |
| Common Stocks (continued) | |
| | | | | | | | |
MATERIALS 3.1% | |
Chemicals 1.1% | |
Huntsman Corp. | | | 15,000 | | | | $212,400 | |
Intrepid Potash, Inc.(a) | | | 24,630 | | | | 612,055 | |
| | | | | | | | |
Total | | | | 824,455 | |
Construction Materials 0.6% | |
Martin Marietta Materials, Inc. | | | 5,725 | | | | 474,488 | |
Metals & Mining 1.4% | |
Horsehead Holding Corp.(a)(b) | | | 23,579 | | | | 264,792 | |
RTI International Metals, Inc.(a)(b) | | | 6,876 | | | | 168,806 | |
Steel Dynamics, Inc. | | | 52,744 | | | | 673,541 | |
| | | | | | | | |
Total | | | | 1,107,139 | |
TOTAL MATERIALS | | | | 2,406,082 | |
TELECOMMUNICATION SERVICES 1.1% | |
Diversified Telecommunication Services 1.1% | |
ORBCOMM, Inc.(a)(b) | | | 258,786 | | | | 843,642 | |
| | | | | | | | |
TOTAL TELECOMMUNICATION SERVICES | | | | 843,642 | |
UTILITIES 0.4% | |
Water Utilities 0.4% | |
American Water Works Co., Inc. | | | 9,736 | | | | 333,361 | |
| | | | | | | | |
TOTAL UTILITIES | | | | 333,361 | |
Total Common Stocks (Cost: $60,406,820) | | | | $66,693,834 | |
| | | | | | | | |
| Exchange-Traded Funds 5.9% | |
iShares Russell 2000 Growth Index Fund (b) | | | 18,971 | | | | $1,777,583 | |
iShares S&P SmallCap 600/BARRA Growth Index Fund | | | 34,762 | | | | 2,846,660 | |
Total Exchange-Traded Funds (Cost: $4,698,686) | | | | $4,624,243 | |
| | | | | | | | |
| Limited Partnerships 0.9% | |
ENERGY 0.5% | |
Oil, Gas & Consumable Fuels 0.5% | |
Capital Product Partners LP Unit (c) | | | 47,478 | | | | $414,958 | |
| | | | | | | | |
TOTAL ENERGY | | | | 414,958 | |
The accompanying Notes to Financial Statements are an integral part of this statement.
| | |
| 10 | | COLUMBIA FRONTIER FUND — 2012 SEMIANNUAL REPORT |
| | | | | | | | |
| Issuer | | Shares | | | Value | |
| Limited Partnerships (continued) | |
| | | | | | | | |
FINANCIALS 0.4% | |
Capital Markets 0.4% | |
Fortress Investment Group LLC, Class A(c) | | | 82,571 | | | | $295,604 | |
| | | | | | | | |
TOTAL FINANCIALS | | | | 295,604 | |
Total Limited Partnerships (Cost: $819,234) | | | | $710,562 | |
| | | | | | | | |
| | | Shares | | | Value | |
| Money Market Funds 4.9% | |
Columbia Short-Term
Cash Fund, 0.144%(d)(e) | | | 3,847,677 | | | | $3,847,677 | |
Total Money Market Funds (Cost: $3,847,677) | | | | $3,847,677 | |
| | | | | | | | | | | | |
| Issuer | | Effective
Yield | | | Par/
Principal/
Shares | | | Value | |
Investments of Cash Collateral Received
for Securities on Loan 22.7% | |
| | | | | | | | | | | | |
Repurchase Agreements 22.7% | |
BNP Paribas Securities Corp.
dated 4/30/12, matures 5/01/12,
repurchase price $4,757,490(f) | |
| | | 0.180 | % | | | $4,757,466 | | | | $4,757,466 | |
Mizuho Securities USA, Inc.
dated 4/30/12, matures 5/01/12,
repurchase price $5,000,033(f) | |
| | | 0.240 | % | | | 5,000,000 | | | | 5,000,000 | |
| | | | | | | | | | | | |
| Issuer | | Effective
Yield | | | Par/
Principal/
Shares | | | Value | |
Investments of Cash Collateral Received
for Securities on Loan (continued) | |
Repurchase Agreements (cont.) | |
Natixis Financial Products, Inc.
dated 4/30/12, matures 5/01/12,
repurchase price $2,000,013(f) | |
| | | 0.240 | % | | | $2,000,000 | | | | $2,000,000 | |
Nomura Securities
dated 4/30/12, matures 5/01/12,
repurchase price $5,000,033(f) | |
| | | 0.240 | % | | | 5,000,000 | | | | 5,000,000 | |
Pershing LLC
dated 4/30/12, matures 5/01/12,
repurchase price $1,000,009(f) | |
| | | | 0.330 | % | | | 1,000,000 | | | | 1,000,000 | |
Total | | | | | | | | | | | 17,757,466 | |
Total Investments of Cash Collateral Received for Securities on Loan | |
(Cost: $17,757,466) | | | | $17,757,466 | |
Total Investments | |
(Cost: $87,529,883) | | | | $93,633,782 | |
Other Assets & Liabilities, Net | | | | (15,297,081 | ) |
Net Assets | | | | $78,336,701 | |
| | |
| Notes to Portfolio of Investments |
| (a) | Non-income producing. |
| (b) | At April 30, 2012, security was partially or fully on loan. |
| (c) | At April 30, 2012, there was no capital committed to the LLC or LP for future investment. |
| (d) | The rate shown is the seven-day current annualized yield at April 30, 2012. |
The accompanying Notes to Financial Statements are an integral part of this statement.
| | | | |
| COLUMBIA FRONTIER FUND — 2012 SEMIANNUAL REPORT | | | 11 | |
| | |
| Portfolio of Investments (continued) | | |
| | |
| Notes to Portfolio of Investments (continued) |
| (e) | Investments in affiliates during the period ended April 30, 2012: |
| | | | | | | | | | | | | | | | | | | | | | | | | | | | |
| Issuer | | Beginning Cost | | | Purchase Cost | | | Sales Cost/ Proceeds from Sales | | | Realized
Gain/Loss | | | Ending Cost | | | Dividends or Interest Income | | | Value | |
Columbia Short-Term Cash Fund | | | $2,718,112 | | | | $13,388,085 | | | | $(12,258,520 | ) | | | $— | | | | $3,847,677 | | | | $2,564 | | | | $3,847,677 | |
| (f) | The table below represents securities received as collateral for repurchase agreements. This collateral is deposited with the Fund’s custodian and, pursuant to the terms of the repurchase agreement, must have an aggregate value greater than or equal to the repurchase price plus accrued interest at all times. The value of securities and/or cash held as collateral for repurchase agreements is monitored on a daily basis to ensure the proper level of collateral. |
| | | | |
| BNP Paribas Securities Corp. (0.180%) | | | | |
| |
| Security Description | | Value | |
| United States Treasury Note/Bond | | | $4,852,615 | |
| Total Market Value of Collateral Securities | | | $4,852,615 | |
| |
| Mizuho Securities USA, Inc. (0.240%) | | | | |
| |
| Security Description | | Value | |
| Fannie Mae REMICS | | | $2,530,245 | |
| Freddie Mac REMICS | | | 2,569,755 | |
| Total Market Value of Collateral Securities | | | $5,100,000 | |
| |
| Natixis Financial Products, Inc. (0.240%) | | | | |
| |
| Security Description | | Value | |
| Fannie Mae Pool | | | $70,680 | |
| Fannie Mae REMICS | | | 524,641 | |
| Fannie Mae Whole Loan | | | 16,483 | |
| Freddie Mac Gold Pool | | | 148,043 | |
| Freddie Mac Non Gold Pool | | | 38,299 | |
| Freddie Mac REMICS | | | 458,253 | |
| Government National Mortgage Association | | | 326,613 | |
| United States Treasury Note/Bond | | | 457,002 | |
| Total Market Value of Collateral Securities | | | $2,040,014 | |
The accompanying Notes to Financial Statements are an integral part of this statement.
| | |
| 12 | | COLUMBIA FRONTIER FUND — 2012 SEMIANNUAL REPORT |
| | |
| Notes to Portfolio of Investments (continued) |
| | | | |
| Nomura Securities (0.240%) | | | | |
| |
| Security Description | | Value | |
| Fannie Mae Pool | | | $1,020,291 | |
| Freddie Mac Gold Pool | | | 1,171,975 | |
| Ginnie Mae II Pool | | | 2,907,734 | |
| Total Market Value of Collateral Securities | | | $5,100,000 | |
| |
| Pershing LLC (0.330%) | | | | |
| |
| Security Description | | Value | |
| Fannie Mae Pool | | | $207,499 | |
| Fannie Mae REMICS | | | 54,310 | |
| Fannie Mae-Aces | | | 5,960 | |
| Federal Farm Credit Bank | | | 37,671 | |
| Federal Home Loan Banks | | | 9,851 | |
| Federal Home Loan Mortgage Corp | | | 8,055 | |
| Federal National Mortgage Association | | | 11,410 | |
| Freddie Mac Coupon Strips | | | 7,871 | |
| Freddie Mac Gold Pool | | | 80,142 | |
| Freddie Mac Non Gold Pool | | | 30,216 | |
| Freddie Mac Reference REMIC | | | 9,609 | |
| Freddie Mac REMICS | | | 62,538 | |
| Ginnie Mae I Pool | | | 103,173 | |
| Ginnie Mae II Pool | | | 288,015 | |
| Government National Mortgage Association | | | 34,224 | |
| United States Treasury Note/Bond | | | 69,456 | |
| Total Market Value of Collateral Securities | | | $1,020,000 | |
| | |
| Abbreviation Legend |
| ADR | | American Depositary Receipt |
The accompanying Notes to Financial Statements are an integral part of this statement.
| | | | |
| COLUMBIA FRONTIER FUND — 2012 SEMIANNUAL REPORT | | | 13 | |
| | |
| Portfolio of Investments (continued) | | |
Generally accepted accounting principles (GAAP) require disclosure regarding the inputs and valuation techniques used to measure fair value and any changes in valuation inputs or techniques. In addition, investments shall be disclosed by major category.
The Fund categorizes its fair value measurements according to a three-level hierarchy that maximizes the use of observable inputs and minimizes the use of unobservable inputs by prioritizing that the most observable input be used when available. Observable inputs are those that market participants would use in pricing an investment based on market data obtained from sources independent of the reporting entity. Unobservable inputs are those that reflect the Fund’s assumptions about the information market participants would use in pricing an investment. An investment’s level within the fair value hierarchy is based on the lowest level of any input that is deemed significant to the asset or liability’s fair value measurement. The input levels are not necessarily an indication of the risk or liquidity associated with investments at that level. For example, certain U.S. government securities are generally high quality and liquid, however, they are reflected as Level 2 because the inputs used to determine fair value may not always be quoted prices in an active market.
Fair value inputs are summarized in the three broad levels listed below:
| | Ÿ | | Level 1 — Valuations based on quoted prices for investments in active markets that the Fund has the ability to access at the measurement date (including NAV for open-end mutual funds). Valuation adjustments are not applied to Level 1 investments. |
| | Ÿ | | Level 2 — Valuations based on other significant observable inputs (including quoted prices for similar securities, interest rates, prepayment speeds, credit risks, etc.). |
| | Ÿ | | Level 3 — Valuations based on significant unobservable inputs (including the Fund’s own assumptions and judgment in determining the fair value of investments). |
Inputs that are used in determining fair value of an investment may include price information, credit data, volatility statistics, and other factors. These inputs can be either observable or unobservable. The availability of observable inputs can vary between investments, and is affected by various factors such as the type of investment, and the volume and level of activity for that investment or similar investments in the marketplace. The inputs will be considered by the Investment Manager, along with any other relevant factors in the calculation of an investment’s fair value. The Fund uses prices and inputs that are current as of the measurement date, which may include periods of market dislocations. During these periods, the availability of prices and inputs may be reduced for many investments. This condition could cause an investment to be reclassified between the various levels within the hierarchy.
Investments falling into the Level 3 category are primarily supported by quoted prices from brokers and dealers participating in the market for those investments. However, these may be classified as Level 3 investments due to lack of market transparency and corroboration to support these quoted prices. Additionally, valuation models may be used as the pricing source for any remaining investments classified as Level 3. These models rely on one or more significant unobservable inputs and/or significant assumptions by the Investment Manager. Inputs used in valuations may include, but are not limited to,financial statement analysis, capital account balances, discount rates and estimated cash flows, and comparable company data.
The accompanying Notes to Financial Statements are an integral part of this statement.
| | |
| 14 | | COLUMBIA FRONTIER FUND — 2012 SEMIANNUAL REPORT |
| | |
| Fair Value Measurements (continued) |
The following table is a summary of the inputs used to value the Fund’s investments as of April 30, 2012:
| | | | | | | | | | | | | | | | |
| | | Fair Value at April 30, 2012 | |
| Description | | Level 1
Quoted Prices
in Active
Markets for
Identical Assets | | | Level 2
Other
Significant
Observable
Inputs | | | Level 3
Significant
Unobservable
Inputs | | | Total | |
| Equity Securities | | | | | | | | | | | | | | | | |
Common Stocks | | | | | | | | | | | | | | | | |
Consumer Discretionary | | | $12,863,942 | | | | $— | | | | $— | | | | $12,863,942 | |
Consumer Staples | | | 5,229,020 | | | | — | | | | — | | | | 5,229,020 | |
Energy | | | 3,217,623 | | | | — | | | | — | | | | 3,217,623 | |
Financials | | | 2,429,850 | | | | — | | | | — | | | | 2,429,850 | |
Health Care | | | 13,371,463 | | | | — | | | | — | | | | 13,371,463 | |
Industrials | | | 8,660,280 | | | | — | | | | — | | | | 8,660,280 | |
Information Technology | | | 17,338,571 | | | | — | | | | — | | | | 17,338,571 | |
Materials | | | 2,406,082 | | | | — | | | | — | | | | 2,406,082 | |
Telecommunication Services | | | 843,642 | | | | — | | | | — | | | | 843,642 | |
Utilities | | | 333,361 | | | | — | | | | — | | | | 333,361 | |
Exchange-Traded Funds | | | 4,624,243 | | | | — | | | | — | | | | 4,624,243 | |
| Total Equity Securities | | | 71,318,077 | | | | — | | | | — | | | | 71,318,077 | |
| Other | | | | | | | | | | | | | | | | |
Limited Partnerships | | | 710,562 | | | | — | | | | — | | | | 710,562 | |
Money Market Funds | | | 3,847,677 | | | | — | | | | — | | | | 3,847,677 | |
Investments of Cash Collateral Received for Securities on Loan | | | — | | | | 17,757,466 | | | | — | | | | 17,757,466 | |
| Total Other | | | 4,558,239 | | | | 17,757,466 | | | | — | | | | 22,315,705 | |
| Total | | | $75,876,316 | | | | $17,757,466 | | | | $— | | | | $93,633,782 | |
See the Portfolio of Investments for all investment classifications not indicated in the table.
The Fund’s assets assigned to the Level 2 input category are generally valued using the market approach, in which a security’s value is determined through reference to prices and information from market transactions for similar or identical assets.
There were no transfers of financial assets between Levels 1 and 2 during the period.
How to find information about the Fund’s quarterly portfolio holdings
| (i) | The Fund files its complete schedule of portfolio holdings with the Securities and Exchange Commission (SEC) for the first and third quarters of each fiscal year on Form N-Q; |
| (ii) | The Fund’s Forms N-Q are available on the SEC’s website at www.sec.gov; |
| (iii) | The Fund’s Forms N-Q may be reviewed and copied at the SEC’s Public Reference Room in Washington, DC (information on the operations of the Public Reference Room may be obtained by calling 800.SEC.0330); and |
| (iv) | The Fund’s complete schedule of portfolio holdings, as filed on Form N-Q, can be obtained without charge, upon request, by calling 800.345.6611. |
The accompanying Notes to Financial Statements are an integral part of this statement.
| | | | |
| COLUMBIA FRONTIER FUND — 2012 SEMIANNUAL REPORT | | | 15 | |
| | |
| Statement of Assets and Liabilities | | |
April 30, 2012 (Unaudited)
| | | | | |
Assets | | | | | |
Investments, at value* | | | | | |
Unaffiliated issuers (identified cost $65,924,740) | | | $ | 72,028,639 | |
Affiliated issuers (identified cost $3,847,677) | | | | 3,847,677 | |
Investment of cash collateral received for securities on loan | | | | | |
Repurchase agreements (identified cost $17,757,466) | | | | 17,757,466 | |
Total investments (identified cost $87,529,883) | | | | 93,633,782 | |
Receivable for: | | | | | |
Investments sold | | | | 8,368,706 | |
Capital shares sold | | | | 30,242 | |
Dividends | | | | 7,026 | |
Interest | | | | 12,945 | |
Expense reimbursement due from Investment Manager | | | | 1,185 | |
Prepaid expense | | | | 1,034 | |
Total assets | | | | 102,054,920 | |
Liabilities | | | | | |
Due upon return of securities on loan | | | | 17,757,466 | |
Payable for: | | | | | |
Investments purchased | | | | 5,799,143 | |
Capital shares purchased | | | | 78,271 | |
Investment management fees | | | | 5,143 | |
Distribution fees | | | | 2,474 | |
Transfer agent fees | | | | 15,447 | |
Administration fees | | | | 521 | |
Plan administration fees | | | | 1 | |
Compensation of board members | | | | 7,398 | |
Other expenses | | | | 52,355 | |
Total liabilities | | | | 23,718,219 | |
Net assets applicable to outstanding capital stock | | | $ | 78,336,701 | |
The accompanying Notes to Financial Statements are an integral part of this statement.
| | |
| 16 | | COLUMBIA FRONTIER FUND — 2012 SEMIANNUAL REPORT |
April 30, 2012 (Unaudited)
| | | | | |
Represented by | | | | | |
Paid-in capital | | | $ | 91,755,533 | |
Excess of distributions over net investment income | | | | (359,842 | ) |
Accumulated net realized loss | | | | (19,162,889 | ) |
Unrealized appreciation (depreciation) on: | | | | | |
Investments | | | | 6,103,899 | |
Total — representing net assets applicable to outstanding capital stock | | | $ | 78,336,701 | |
*Value of securities on loan | | | $ | 16,785,045 | |
Net assets applicable to outstanding shares | | | | | |
Class A | | | $ | 61,197,068 | |
Class B | | | $ | 3,636,095 | |
Class C | | | $ | 10,773,617 | |
Class I | | | $ | 15,907 | |
Class R | | | $ | 120,122 | |
Class R4 | | | $ | 58,047 | |
Class R5 | | | $ | 931,161 | |
Class Z | | | $ | 1,604,684 | |
Shares outstanding | | | | | |
Class A | | | | 5,556,661 | |
Class B | | | | 418,763 | |
Class C | | | | 1,234,432 | |
Class I | | | | 1,347 | |
Class R | | | | 11,185 | |
Class R4 | | | | 4,950 | |
Class R5 | | | | 78,840 | |
Class Z | | | | 136,081 | |
Net asset value per share | | | | | |
Class A(a) | | | $ | 11.01 | |
Class B | | | $ | 8.68 | |
Class C | | | $ | 8.73 | |
Class I | | | $ | 11.81 | |
Class R | | | $ | 10.74 | |
Class R4 | | | $ | 11.73 | |
Class R5 | | | $ | 11.81 | |
Class Z | | | $ | 11.79 | |
| (a) | The maximum offering price per share for Class A is $11.68. The offering price is calculated by dividing the net asset value by 1.0 minus the maximum sales charge of 5.75%. |
The accompanying Notes to Financial Statements are an integral part of this statement.
| | | | |
| COLUMBIA FRONTIER FUND — 2012 SEMIANNUAL REPORT | | | 17 | |
Six months ended April 30, 2012 (Unaudited)
| | | | | |
Net investment income | |
Income: | | | | | |
Dividends | | | $ | 117,523 | |
Dividends from affiliates | | | | 2,564 | |
Income from securities lending — net | | | | 160,178 | |
Total income | | | | 280,265 | |
Expenses: | | | | | |
Investment management fees | | | | 298,601 | |
Distribution fees | | | | | |
Class A | | | | 75,162 | |
Class B | | | | 18,255 | |
Class C | | | | 50,209 | |
Class R | | | | 289 | |
Transfer agent fees | | | | | |
Class A | | | | 113,719 | |
Class B | | | | 7,731 | |
Class C | | | | 18,881 | |
Class R | | | | 214 | |
Class R4 | | | | 7 | |
Class R5 | | | | 128 | |
Class Z | | | | 1,195 | |
Administration fees | | | | 30,238 | |
Plan administration fees | | | | | |
Class R4 | | | | 68 | |
Compensation of board members | | | | 5,634 | |
Custodian fees | | | | 3,762 | |
Printing and postage fees | | | | 39,476 | |
Registration fees | | | | 35,946 | |
Professional fees | | | | 17,365 | |
Other | | | | 14,233 | |
Total expenses | | | | 731,113 | |
Fees waived or expenses reimbursed by Investment Manager and its affiliates | | | | (111,599 | ) |
Total net expenses | | | | 619,514 | |
Net investment loss | | | | (339,249 | ) |
Realized and unrealized gain (loss) — net | | | | | |
Net realized gain (loss) on: | | | | | |
Investments | | | | 2,489,593 | |
Net realized gain | | | | 2,489,593 | |
Net change in unrealized appreciation (depreciation) on: | | | | | |
Investments | | | | 8,441,956 | |
Net change in unrealized appreciation | | | | 8,441,956 | |
Net realized and unrealized gain | | | | 10,931,549 | |
Net increase in net assets resulting from operations | | | $ | 10,592,300 | |
The accompanying Notes to Financial Statements are an integral part of this statement.
| | |
| 18 | | COLUMBIA FRONTIER FUND — 2012 SEMIANNUAL REPORT |
| | |
| Statement of Changes in Net Assets | | |
| | | | | | | | | | |
| | | Six months ended
April 30, 2012 (Unaudited) | | Year ended
October 31, 2011
|
Operations | | | | | | | | | | |
Net investment loss | | | $ | (339,249 | ) | | | $ | (879,651 | ) |
Net realized gain | | | | 2,489,593 | | | | | 17,177,577 | |
Net change in unrealized appreciation (depreciation) | | | | 8,441,956 | | | | | (9,577,081 | ) |
Net increase in net assets resulting from operations | | | | 10,592,300 | | | | | 6,720,845 | |
Increase (decrease) in net assets from share transactions | | | | (5,104,375 | ) | | | | (71,158,551 | ) |
Total increase (decrease) in net assets | | | | 5,487,925 | | | | | (64,437,706 | ) |
Net assets at beginning of period | | | | 72,848,776 | | | | | 137,286,482 | |
Net assets at end of period | | | $ | 78,336,701 | | | | $ | 72,848,776 | |
Excess of distributions over net investment income | | | $ | (359,842 | ) | | | $ | (20,593 | ) |
The accompanying Notes to Financial Statements are an integral part of this statement.
| | | | |
| COLUMBIA FRONTIER FUND — 2012 SEMIANNUAL REPORT | | | 19 | |
| | |
| Statement of Changes in Net Assets (continued) | | |
| | | | | | | | | | | | | | | | | | | | |
| | | Six months ended
April 30, 2012
(Unaudited) | | Year ended
October 31, 2011 |
| | | Shares | | Dollars ($) | | Shares | | Dollars ($) |
Capital stock activity | | | | | | | | | | | | | | | | | | | | |
Class A shares | | | | | | | | | | | | | | | | | | | | |
Subscriptions(a) | | | | 163,450 | | | | | 1,727,523 | | | | | 461,271 | | | | | 5,033,840 | |
Redemptions | | | | (765,532 | ) | | | | (7,875,433 | ) | | | | (1,561,186 | ) | | | | (16,438,748 | ) |
Net decrease | | | | (602,082 | ) | | | | (6,147,910 | ) | | | | (1,099,915 | ) | | | | (11,404,908 | ) |
Class B shares | | | | | | | | | | | | | | | | | | | | |
Subscriptions | | | | 1,479 | | | | | 12,535 | | | | | 4,928 | | | | | 46,308 | |
Redemptions(a) | | | | (49,797 | ) | | | | (415,244 | ) | | | | (442,060 | ) | | | | (3,841,259 | ) |
Net decrease | | | | (48,318 | ) | | | | (402,709 | ) | | | | (437,132 | ) | | | | (3,794,951 | ) |
Class C shares | | | | | | | | | | | | | | | | | | | | |
Subscriptions | | | | 86,437 | | | | | 738,026 | | | | | 42,783 | | | | | 375,723 | |
Redemptions | | | | (81,996 | ) | | | | (675,507 | ) | | | | (224,461 | ) | | | | (1,879,560 | ) |
Net increase (decrease) | | | | 4,441 | | | | | 62,519 | | | | | (181,678 | ) | | | | (1,503,837 | ) |
Class I shares | | | | | | | | | | | | | | | | | | | | |
Subscriptions | | | | — | | | | | — | | | | | 84,843 | | | | | 1,019,190 | |
Redemptions | | | | — | | | | | — | | | | | (4,708,397 | ) | | | | (55,709,801 | ) |
Net decrease | | | | — | | | | | — | | | | | (4,623,554 | ) | | | | (54,690,611 | ) |
Class R shares | | | | | | | | | | | | | | | | | | | | |
Subscriptions | | | | 1,505 | | | | | 15,144 | | | | | 3,879 | | | | | 40,734 | |
Redemptions | | | | (2,395 | ) | | | | (24,182 | ) | | | | (3,024 | ) | | | | (33,000 | ) |
Net increase (decrease) | | | | (890 | ) | | | | (9,038 | ) | | | | 855 | | | | | 7,734 | |
Class R4 shares | | | | | | | | | | | | | | | | | | | | |
Subscriptions | | | | 9 | | | | | 97 | | | | | 20 | | | | | 241 | |
Redemptions | | | | — | | | | | — | | | | | (838 | ) | | | | (9,737 | ) |
Net increase (decrease) | | | | 9 | | | | | 97 | | | | | (818 | ) | | | | (9,496 | ) |
Class R5 shares | | | | | | | | | | | | | | | | | | | | |
Redemptions | | | | — | | | | | — | | | | | (82 | ) | | | | (549 | ) |
Net decrease | | | | — | | | | | — | | | | | (82 | ) | | | | (549 | ) |
Class Z shares | | | | | | | | | | | | | | | | | | | | |
Subscriptions | | | | 122,985 | | | | | 1,464,551 | | | | | 26,515 | | | | | 321,069 | |
Redemptions | | | | (6,105 | ) | | | | (71,885 | ) | | | | (7,568 | ) | | | | (83,002 | ) |
Net increase | | | | 116,880 | | | | | 1,392,666 | | | | | 18,947 | | | | | 238,067 | |
Total net decrease | | | | (529,960 | ) | | | | (5,104,375 | ) | | | | (6,323,377 | ) | | | | (71,158,551 | ) |
| (a) | Includes conversions of Class B shares to Class A shares, if any. The line items from the prior year have been combined to conform to the current year presentation. |
The accompanying Notes to Financial Statements are an integral part of this statement.
| | |
| 20 | | COLUMBIA FRONTIER FUND — 2012 SEMIANNUAL REPORT |
The following tables are intended to help you understand the Fund’s financial performance. Certain information reflects financial results for a single share of a class held for the periods shown. Per share net investment income (loss) amounts are calculated based on average shares outstanding during the period. Total returns assume reinvestment of all dividends and distributions. Total returns do not reflect payment of sales charges, if any, and are not annualized for periods of less than one year.
| | | | | | | | | | | | | | | | | | | | | | | | | | | | | | |
| | | Six months
ended April 30, 2012 | | Year ended Oct. 31, |
| | | | 2011 | | 2010 | | 2009 | | 2008 | | 2007 |
| | | (Unaudited) | | | | | | | | | | |
Class A | | | | | | | | | | | | | | | | | | | | | | | | | | | | | | |
Per share data | | | | | | | | | | | | | | | | | | | | | | | | | | | | | | |
Net asset value, beginning of period | | | | $9.55 | | | | | $9.71 | | | | | $8.21 | | | | | $7.29 | | | | | $15.63 | | | | | $14.29 | |
Income from investment operations: | | | | | | | | | | | | | | | | | | | | | | | | | | | | | | |
Net investment loss | | | | (0.04 | ) | | | | (0.08 | ) | | | | (0.08 | ) | | | | (0.08 | ) | | | | (0.12 | ) | | | | (0.21 | ) |
Net realized and unrealized gain (loss) | | | | 1.50 | | | | | (0.08 | )(a) | | | | 1.58 | | | | | 1.00 | | | | | (5.93 | ) | | | | 3.18 | |
Total from investment operations | | | | 1.46 | | | | | (0.16 | ) | | | | 1.50 | | | | | 0.92 | | | | | (6.05 | ) | | | | 2.97 | |
Less distributions to shareholders from: | | | | | | | | | | | | | | | | | | | | | | | | | | | | | | |
Net realized gains | | | | — | | | | | — | | | | | — | | | | | — | | | | | (2.41 | ) | | | | (1.63 | ) |
Total distributions to shareholders | | | | — | | | | | — | | | | | — | | | | | — | | | | | (2.41 | ) | | | | (1.63 | ) |
Proceeds from regulatory settlements | | | | — | | | | | — | | | | | — | | | | | — | | | | | 0.12 | | | | | — | |
Net asset value, end of period | | | | $11.01 | | | | | $9.55 | | | | | $9.71 | | | | | $8.21 | | | | | $7.29 | | | | | $15.63 | |
Total return | | | | 15.29% | | | | | (1.65% | ) | | | | 18.27% | | | | | 12.62% | | | | | (44.19% | )(b) | | | | 22.93% | |
Ratios to average net assets(c) | | | | | | | | | | | | | | | | | | | | | | | | | | | | | | |
Expenses prior to fees waived or expenses reimbursed | | | | 1.81% | (d) | | | | 1.73% | | | | | 1.88% | | | | | 2.62% | | | | | 2.05% | | | | | 1.90% | |
Net expenses after fees waived or expenses reimbursed(e) | | | | 1.51% | (d) | | | | 1.48% | (f) | | | | 1.51% | | | | | 1.86% | | | | | 1.97% | | | | | 1.90% | |
Net investment loss | | | | (0.77% | )(d) | | | | (0.72% | )(f) | | | | (0.91% | ) | | | | (0.91% | ) | | | | (1.13% | ) | | | | (1.47% | ) |
Supplemental data | | | | | | | | | | | | | | | | | | | | | | | | | | | | | | |
Net assets, end of period (in thousands) | | | | $61,197 | | | | | $58,800 | | | | | $70,460 | | | | | $23,380 | | | | | $25,209 | | | | | $52,441 | |
Portfolio turnover | | | | 45% | | | | | 72% | | | | | 160% | | | | | 162% | | | | | 156% | | | | | 116% | |
Notes to Financial Highlights
| (a) | Calculation of the net gain/loss per share (both realized and unrealized) does not correlate to the aggregate realized and unrealized gain/loss presented in the Statement of Operations due to the timing of sales and repurchases of Fund shares in relation to fluctuations in the market value of the portfolio. |
| (b) | During the year ended October 31, 2008, the Fund received proceeds from regulatory settlements. Had the Fund not received these proceeds, the total return would have been lower by 0.74%. |
| (c) | In addition to the fees and expenses which the Fund bears directly, the Fund indirectly bears a pro rata share of the fees and expenses of the acquired funds in which it invests. Such indirect expenses are not included in the reported expense ratios. |
| (e) | The Investment Manager and certain of its affiliates agreed to waive/reimburse certain fees and expenses, if applicable. |
| (f) | The benefits derived from expense reductions had an impact of less than 0.01%. |
The accompanying Notes to Financial Statements are an integral part of this statement.
| | | | |
| COLUMBIA FRONTIER FUND — 2012 SEMIANNUAL REPORT | | | 21 | |
| | |
| Financial Highlights (continued) | | |
| | | | | | | | | | | | | | | | | | | | | | | | | | | | | | |
| | | Six months
ended April 30, 2012 | | Year ended Oct. 31, |
| | | | 2011 | | 2010 | | 2009 | | 2008 | | 2007 |
| | | (Unaudited) | | | | | | | | | | |
Class B | | | | | | | | | | | | | | | | | | | | | | | | | | | | | | |
Per share data | | | | | | | | | | | | | | | | | | | | | | | | | | | | | | |
Net asset value, beginning of period | | | | $7.56 | | | | | $7.74 | | | | | $6.60 | | | | | $5.90 | | | | | $13.22 | | | | | $12.42 | |
Income from investment operations: | | | | | | | | | | | | | | | | | | | | | | | | | | | | | | |
Net investment loss | | | | (0.06 | ) | | | | (0.13 | ) | | | | (0.12 | ) | | | | (0.12 | ) | | | | (0.16 | ) | | | | (0.27 | ) |
Net realized and unrealized gain (loss) | | | | 1.18 | | | | | (0.05 | )(a) | | | | 1.26 | | | | | 0.82 | | | | | (4.85 | ) | | | | 2.70 | |
Total from investment operations | | | | 1.12 | | | | | (0.18 | ) | | | | 1.14 | | | | | 0.70 | | | | | (5.01 | ) | | | | 2.43 | |
Less distributions to shareholders from: | | | | | | | | | | | | | | | | | | | | | | | | | | | | | | |
Net realized gains | | | | — | | | | | — | | | | | — | | | | | — | | | | | (2.41 | ) | | | | (1.63 | ) |
Total distributions to shareholders | | | | — | | | | | — | | | | | — | | | | | — | | | | | (2.41 | ) | | | | (1.63 | ) |
Proceeds from regulatory settlements | | | | — | | | | | — | | | | | — | | | | | — | | | | | 0.10 | | | | | — | |
Net asset value, end of period | | | | $8.68 | | | | | $7.56 | | | | | $7.74 | | | | | $6.60 | | | | | $5.90 | | | | | $13.22 | |
Total return | | | | 14.81% | | | | | (2.33% | ) | | | | 17.27% | | | | | 11.86% | | | | | (44.62% | )(b) | | | | 21.90% | |
Ratios to average net assets(c) | | | | | | | | | | | | | | | | | | | | | | | | | | | | | | |
Expenses prior to fees waived or
expenses reimbursed | | | | 2.60% | (d) | | | | 2.47% | | | | | 2.61% | | | | | 3.38% | | | | | 2.81% | | | | | 2.66% | |
Net expenses after fees waived or expenses reimbursed(e) | | | | 2.26% | (d) | | | | 2.23% | (f) | | | | 2.29% | | | | | 2.63% | | | | | 2.73% | | | | | 2.66% | |
Net investment loss | | | | (1.52% | )(d) | | | | (1.49% | )(f) | | | | (1.69% | ) | | | | (1.65% | ) | | | | (1.89% | ) | | | | (2.23% | ) |
Supplemental data | | | | | | | | | | | | | | | | | | | | | | | | | | | | | | |
Net assets, end of period (in thousands) | | | | $3,636 | | | | | $3,529 | | | | | $7,000 | | | | | $1,118 | | | | | $1,302 | | | | | $3,365 | |
Portfolio turnover | | | | 45% | | | | | 72% | | | | | 160% | | | | | 162% | | | | | 156% | | | | | 116% | |
Notes to Financial Highlights
| (a) | Calculation of the net gain/loss per share (both realized and unrealized) does not correlate to the aggregate realized and unrealized gain/loss presented in the Statement of Operations due to the timing of sales and repurchases of Fund shares in relation to fluctuations in the market value of the portfolio. |
| (b) | During the year ended October 31, 2008, the Fund received proceeds from regulatory settlements. Had the Fund not received these proceeds, the total return would have been lower by 0.71%. |
| (c) | In addition to the fees and expenses which the Fund bears directly, the Fund indirectly bears a pro rata share of the fees and expenses of the acquired funds in which it invests. Such indirect expenses are not included in the reported expense ratios. |
| (e) | The Investment Manager and certain of its affiliates agreed to waive/reimburse certain fees and expenses, if applicable. |
| (f) | The benefits derived from expense reductions had an impact of less than 0.01%. |
The accompanying Notes to Financial Statements are an integral part of this statement.
| | |
| 22 | | COLUMBIA FRONTIER FUND — 2012 SEMIANNUAL REPORT |
| | | | | | | | | | | | | | | | | | | | | | | | | | | | | | |
| | | Six months
ended April 30, 2012 | | Year ended Oct. 31, |
| | | | 2011 | | 2010 | | 2009 | | 2008 | | 2007 |
| | | (Unaudited) | | | | | | | | | | |
Class C | | | | | | | | | | | | | | | | | | | | | | | | | | | | | | |
Per share data | | | | | | | | | | | | | | | | | | | | | | | | | | | | | | |
Net asset value, beginning of period | | | | $7.59 | | | | | $7.78 | | | | | $6.63 | | | | | $5.93 | | | | | $13.23 | | | | | $12.42 | |
Income from investment operations: | | | | | | | | | | | | | | | | | | | | | | | | | | | | | | |
Net investment loss | | | | (0.06 | ) | | | | (0.12 | ) | | | | (0.12 | ) | | | | (0.12 | ) | | | | (0.15 | ) | | | | (0.27 | ) |
Net realized and unrealized gain (loss) | | | | 1.20 | | | | | (0.07 | )(a) | | | | 1.27 | | | | | 0.82 | | | | | (4.84 | ) | | | | 2.71 | |
Total from investment operations | | | | 1.14 | | | | | (0.19 | ) | | | | 1.15 | | | | | 0.70 | | | | | (4.99 | ) | | | | 2.44 | |
Less distributions to shareholders from: | | | | | | | | | | | | | | | | | | | | | | | | | | | | | | |
Net realized gains | | | | — | | | | | — | | | | | — | | | | | — | | | | | (2.41 | ) | | | | (1.63 | ) |
Total distributions to shareholders | | | | — | | | | | — | | | | | — | | | | | — | | | | | (2.41 | ) | | | | (1.63 | ) |
Proceeds from regulatory settlements | | | | — | | | | | — | | | | | — | | | | | — | | | | | 0.10 | | | | | — | |
Net asset value, end of period | | | | $8.73 | | | | | $7.59 | | | | | $7.78 | | | | | $6.63 | | | | | $5.93 | | | | | $13.23 | |
Total return | | | | 15.02% | | | | | (2.44% | ) | | | | 17.35% | | | | | 11.80% | | | | | (44.38% | )(b) | | | | 22.00% | |
Ratios to average net assets(c) | | | | | | | | | | | | | | | | | | | | | | | | | | | | | | |
Expenses prior to fees waived or
expenses reimbursed | | | | 2.56% | (d) | | | | 2.48% | | | | | 2.68% | | | | | 3.36% | | | | | 2.81% | | | | | 2.66% | |
Net expenses after fees waived or expenses reimbursed(e) | | | | 2.26% | (d) | | | | 2.23% | (f) | | | | 2.27% | | | | | 2.61% | | | | | 2.73% | | | | | 2.66% | |
Net investment loss | | | | (1.53% | )(d) | | | | (1.47% | )(f) | | | | (1.66% | ) | | | | (1.66% | ) | | | | (1.89% | ) | | | | (2.23% | ) |
Supplemental data | | | | | | | | | | | | | | | | | | | | | | | | | | | | | | |
Net assets, end of period (in thousands) | | | | $10,774 | | | | | $9,341 | | | | | $10,983 | | | | | $8,899 | | | | | $9,493 | | | | | $3,173 | |
Portfolio turnover | | | | 45% | | | | | 72% | | | | | 160% | | | | | 162% | | | | | 156% | | | | | 116% | |
Notes to Financial Highlights
| (a) | Calculation of the net gain/loss per share (both realized and unrealized) does not correlate to the aggregate realized and unrealized gain/loss presented in the Statement of Operations due to the timing of sales and repurchases of Fund shares in relation to fluctuations in the market value of the portfolio. |
| (b) | During the year ended October 31, 2008, the Fund received proceeds from regulatory settlements. Had the Fund not received these proceeds, the total return would have been lower by 0.72%. |
| (c) | In addition to the fees and expenses which the Fund bears directly, the Fund indirectly bears a pro rata share of the fees and expenses of the acquired funds in which it invests. Such indirect expenses are not included in the reported expense ratios. |
| (e) | The Investment Manager and certain of its affiliates agreed to waive/reimburse certain fees and expenses, if applicable. |
| (f) | The benefits derived from expense reductions had an impact of less than 0.01%. |
The accompanying Notes to Financial Statements are an integral part of this statement.
| | | | |
| COLUMBIA FRONTIER FUND — 2012 SEMIANNUAL REPORT | | | 23 | |
| | |
| Financial Highlights (continued) | | |
| | | | | | | | | | | | | | | | | | | | |
| | | Six months
ended April 30, 2012 | | Year ended Oct. 31, |
| | | | 2011 | | 2010 | | 2009(a) |
| | | (Unaudited) | | | | | | |
Class I | | | | | | | | | | | | | | | | | | | | |
Per share data | | | | | | | | | | | | | | | | | | | | |
Net asset value, beginning of period | | | | $10.21 | | | | | $10.35 | | | | | $8.71 | | | | | $8.65 | |
Income from investment operations: | | | | | | | | | | | | | | | | | | | | |
Net investment loss | | | | (0.02 | ) | | | | (0.04 | ) | | | | (0.05 | ) | | | | (0.01 | ) |
Net realized and unrealized gain (loss) | | | | 1.62 | | | | | (0.10 | )(b) | | | | 1.69 | | | | | 0.07 | |
Total from investment operations | | | | 1.60 | | | | | (0.14 | ) | | | | 1.64 | | | | | 0.06 | |
Net asset value, end of period | | | | $11.81 | | | | | $10.21 | | | | | $10.35 | | | | | $8.71 | |
Total return | | | | 15.67% | | | | | (1.35% | ) | | | | 18.83% | | | | | 0.69% | |
Ratios to average net assets(c) | | | | | | | | | | | | | | | | | | | | |
Expenses prior to fees waived or
expenses reimbursed | | | | 1.18% | (d) | | | | 1.08% | | | | | 1.13% | | | | | 1.30% | (d) |
Net expenses after fees waived or
expenses reimbursed(e) | | | | 1.06% | (d) | | | | 1.03% | | | | | 1.06% | | | | | 1.06% | (d) |
Net investment loss | | | | (0.33% | )(d) | | | | (0.33% | ) | | | | (0.49% | ) | | | | (0.39% | )(d) |
Supplemental data | | | | | | | | | | | | | | | | | | | | |
Net assets, end of period (in thousands) | | | | $16 | | | | | $14 | | | | | $47,859 | | | | | $1,000 | |
Portfolio turnover | | | | 45% | | | | | 72% | | | | | 160% | | | | | 162% | |
Notes to Financial Highlights
| (a) | For the period from August 3, 2009 (commencement of operations) to October 31, 2009. |
| (b) | Calculation of the net gain/loss per share (both realized and unrealized) does not correlate to the aggregate realized and unrealized gain/loss presented in the Statement of Operations due to the timing of sales and repurchases of Fund shares in relation to fluctuations in the market value of the portfolio. |
| (c) | In addition to the fees and expenses which the Fund bears directly, the Fund indirectly bears a pro rata share of the fees and expenses of the acquired funds in which it invests. Such indirect expenses are not included in the reported expense ratios. |
| (e) | The Investment Manager and certain of its affiliates agreed to waive/reimburse certain fees and expenses, if applicable. |
The accompanying Notes to Financial Statements are an integral part of this statement.
| | |
| 24 | | COLUMBIA FRONTIER FUND — 2012 SEMIANNUAL REPORT |
| | | | | | | | | | | | | | | | | | | | | | | | | | | | | | |
| | | Six months
ended April 30, 2012 | | Year ended Oct. 31, |
| | | | 2011 | | 2010 | | 2009 | | 2008 | | 2007 |
| | | (Unaudited) | | | | | | | | | | |
Class R | | | | | | | | | | | | | | | | | | | | | | | | | | | | | | |
Per share data | | | | | | | | | | | | | | | | | | | | | | | | | | | | | | |
Net asset value, beginning of period | | | | $9.32 | | | | | $9.50 | | | | | $8.06 | | | | | $7.18 | | | | | $15.47 | | | | | $14.20 | |
Income from investment operations: | | | | | | | | | | | | | | | | | | | | | | | | | | | | | | |
Net investment loss | | | | (0.05 | ) | | | | (0.10 | ) | | | | (0.11 | ) | | | | (0.10 | ) | | | | (0.14 | ) | | | | (0.24 | ) |
Net realized and unrealized gain (loss) | | | | 1.47 | | | | | (0.08 | )(a) | | | | 1.55 | | | | | 0.98 | | | | | (5.86 | ) | | | | 3.14 | |
Total from investment operations | | | | 1.42 | | | | | (0.18 | ) | | | | 1.44 | | | | | 0.88 | | | | | (6.00 | ) | | | | 2.90 | |
Less distributions to shareholders from: | | | | | | | | | | | | | | | | | | | | | | | | | | | | | | |
Net realized gains | | | | — | | | | | — | | | | | — | | | | | — | | | | | (2.41 | ) | | | | (1.63 | ) |
Total distributions to shareholders | | | | — | | | | | — | | | | | — | | | | | — | | | | | (2.41 | ) | | | | (1.63 | ) |
Proceeds from regulatory settlements | | | | — | | | | | — | | | | | — | | | | | — | | | | | 0.12 | | | | | — | |
Net asset value, end of period | | | | $10.74 | | | | | $9.32 | | | | | $9.50 | | | | | $8.06 | | | | | $7.18 | | | | | $15.47 | |
Total return | | | | 15.24% | | | | | (1.89% | ) | | | | 17.87% | | | | | 12.26% | | | | | (44.36% | )(b) | | | | 22.53% | |
Ratios to average net assets(c) | | | | | | | | | | | | | | | | | | | | | | | | | | | | | | |
Expenses prior to fees waived or
expenses reimbursed | | | | 2.05% | (d) | | | | 1.98% | | | | | 2.02% | | | | | 2.90% | | | | | 2.31% | | | | | 2.15% | |
Net expenses after fees waived or expenses reimbursed(e) | | | | 1.76% | (d) | | | | 1.74% | (f) | | | | 1.86% | | | | | 2.14% | | | | | 2.23% | | | | | 2.15% | |
Net investment loss | | | | (1.02% | )(d) | | | | (0.99% | )(f) | | | | (1.24% | ) | | | | (1.21% | ) | | | | (1.39% | ) | | | | (1.72% | ) |
Supplemental data | | | | | | | | | | | | | | | | | | | | | | | | | | | | | | |
Net assets, end of period (in thousands) | | | | $120 | | | | | $113 | | | | | $107 | | | | | $82 | | | | | $79 | | | | | $93 | |
Portfolio turnover | | | | 45% | | | | | 72% | | | | | 160% | | | | | 162% | | | | | 156% | | | | | 116% | |
Notes to Financial Highlights
| (a) | Calculation of the net gain/loss per share (both realized and unrealized) does not correlate to the aggregate realized and unrealized gain/loss presented in the Statement of Operations due to the timing of sales and repurchases of Fund shares in relation to fluctuations in the market value of the portfolio. |
| (b) | During the year ended October 31, 2008, the Fund received proceeds from regulatory settlements. Had the Fund not received these proceeds, the total return would have been lower by 0.74%. |
| (c) | In addition to the fees and expenses which the Fund bears directly, the Fund indirectly bears a pro rata share of the fees and expenses of the acquired funds in which it invests. Such indirect expenses are not included in the reported expense ratios. |
| (e) | The Investment Manager and certain of its affiliates agreed to waive/reimburse certain fees and expenses, if applicable. |
| (f) | The benefits derived from expense reductions had an impact of less than 0.01%. |
The accompanying Notes to Financial Statements are an integral part of this statement.
| | | | |
| COLUMBIA FRONTIER FUND — 2012 SEMIANNUAL REPORT | | | 25 | |
| | |
| Financial Highlights (continued) | | |
| | | | | | | | | | | | | | | | | | | | |
| | | Six months
ended April 30, 2012 | | Year ended Oct. 31, |
| | | | 2011 | | 2010 | | 2009(a) |
| | | (Unaudited) | | | | | | |
Class R4 | | | | | | | | | | | | | | | | | | | | |
Per share data | | | | | | | | | | | | | | | | | | | | |
Net asset value, beginning of period | | | | $10.16 | | | | | $10.31 | | | | | $8.70 | | | | | $8.65 | |
Income from investment operations: | | | | | | | | | | | | | | | | | | | | |
Net investment loss | | | | (0.03 | ) | | | | (0.06 | ) | | | | (0.07 | ) | | | | (0.01 | ) |
Net realized and unrealized gain (loss) | | | | 1.60 | | | | | (0.09 | )(b) | | | | 1.68 | | | | | 0.06 | |
Total from investment operations | | | | 1.57 | | | | | (0.15 | ) | | | | 1.61 | | | | | 0.05 | |
Net asset value, end of period | | | | $11.73 | | | | | $10.16 | | | | | $10.31 | | | | | $8.70 | |
Total return | | | | 15.45% | | | | | (1.46% | ) | | | | 18.51% | | | | | 0.58% | |
Ratios to average net assets(c) | | | | | | | | | | | | | | | | | | | | |
Expenses prior to fees waived or
expenses reimbursed | | | | 1.46% | (d) | | | | 1.38% | | | | | 1.41% | | | | | 1.53% | (d) |
Net expenses after fees waived or
expenses reimbursed(e) | | | | 1.34% | (d) | | | | 1.30% | | | | | 1.36% | | | | | 1.37% | (d) |
Net investment loss | | | | (0.60% | )(d) | | | | (0.54% | ) | | | | (0.74% | ) | | | | (0.56% | )(d) |
Supplemental data | | | | | | | | | | | | | | | | | | | | |
Net assets, end of period (in thousands) | | | | $58 | | | | | $50 | | | | | $59 | | | | | $10 | |
Portfolio turnover | | | | 45% | | | | | 72% | | | | | 160% | | | | | 162% | |
Notes to Financial Highlights
| (a) | For the period from August 3, 2009 (commencement of operations) to October 31, 2009. |
| (b) | Calculation of the net gain/loss per share (both realized and unrealized) does not correlate to the aggregate realized and unrealized gain/loss presented in the Statement of Operations due to the timing of sales and repurchases of Fund shares in relation to fluctuations in the market value of the portfolio. |
| (c) | In addition to the fees and expenses which the Fund bears directly, the Fund indirectly bears a pro rata share of the fees and expenses of the acquired funds in which it invests. Such indirect expenses are not included in the reported expense ratios. |
| (e) | The Investment Manager and certain of its affiliates agreed to waive/reimburse certain fees and expenses, if applicable. |
The accompanying Notes to Financial Statements are an integral part of this statement.
| | |
| 26 | | COLUMBIA FRONTIER FUND — 2012 SEMIANNUAL REPORT |
| | | | | | | | | | | | | | | | | | | | | | | | | | | | | | |
| | | Six months
ended April 30, 2012 | | Year ended Oct. 31, |
| | | | 2011 | | 2010 | | 2009 | | 2008 | | 2007 |
| | | (Unaudited) | | | | | | | | | | |
Class R5 | | | | | | | | | | | | | | | | | | | | | | | | | | | | | | |
Per share data | | | | | | | | | | | | | | | | | | | | | | | | | | | | | | |
Net asset value, beginning of period | | | | $10.22 | | | | | $10.34 | | | | | $8.71 | | | | | $7.71 | | | | | $16.30 | | | | | $14.76 | |
Income from investment operations: | | | | | | | | | | | | | | | | | | | | | | | | | | | | | | |
Net investment loss | | | | (0.02 | ) | | | | (0.03 | ) | | | | (0.05 | ) | | | | (0.06 | ) | | | | (0.06 | ) | | | | (0.13 | ) |
Net realized and unrealized gain (loss) | | | | 1.61 | | | | | (0.09 | )(a) | | | | 1.68 | | | | | 1.06 | | | | | (6.24 | ) | | | | 3.30 | |
Total from investment operations | | | | 1.59 | | | | | (0.12 | ) | | | | 1.63 | | | | | 1.00 | | | | | (6.30 | ) | | | | 3.17 | |
Less distributions to shareholders from: | | | | | | | | | | | | | | | | | | | | | | | | | | | | | | |
Net realized gains | | | | — | | | | | — | | | | | — | | | | | — | | | | | (2.41 | ) | | | | (1.63 | ) |
Total distributions to shareholders | | | | — | | | | | — | | | | | — | | | | | — | | | | | (2.41 | ) | | | | (1.63 | ) |
Proceeds from regulatory settlements | | | | — | | | | | — | | | | | — | | | | | — | | | | | 0.12 | | | | | — | |
Net asset value, end of period | | | | $11.81 | | | | | $10.22 | | | | | $10.34 | | | | | $8.71 | | | | | $7.71 | | | | | $16.30 | |
Total return | | | | 15.56% | | | | | (1.16% | ) | | | | 18.71% | | | | | 12.97% | | | | | (43.87% | )(b) | | | | 23.62% | |
Ratios to average net assets(c) | | | | | | | | | | | | | | | | | | | | | | | | | | | | | | |
Expenses prior to fees waived or
expenses reimbursed | | | | 1.21% | (d) | | | | 1.12% | | | | | 1.27% | | | | | 1.88% | | | | | 1.39% | | | | | 1.29% | |
Net expenses after fees waived or expenses reimbursed(e) | | | | 1.09% | (d) | | | | 1.03% | | | | | 1.11% | | | | | 1.68% | | | | | 1.39% | | | | | 1.29% | |
Net investment loss | | | | (0.35% | )(d) | | | | (0.27% | ) | | | | (0.50% | ) | | | | (0.55% | ) | | | | (0.55% | ) | | | | (0.86% | ) |
Supplemental data | | | | | | | | | | | | | | | | | | | | | | | | | | | | | | |
Net assets, end of period (in thousands) | | | | $931 | | | | | $806 | | | | | $816 | | | | | $626 | | | | | $3,229 | | | | | $5,467 | |
Portfolio turnover | | | | 45% | | | | | 72% | | | | | 160% | | | | | 162% | | | | | 156% | | | | | 116% | |
Notes to Financial Highlights
| (a) | Calculation of the net gain/loss per share (both realized and unrealized) does not correlate to the aggregate realized and unrealized gain/loss presented in the Statement of Operations due to the timing of sales and repurchases of Fund shares in relation to fluctuations in the market value of the portfolio. |
| (b) | During the year ended October 31, 2008, the Fund received proceeds from regulatory settlements. Had the Fund not received these proceeds, the total return would have been lower by 0.75%. |
| (c) | In addition to the fees and expenses which the Fund bears directly, the Fund indirectly bears a pro rata share of the fees and expenses of the acquired funds in which it invests. Such indirect expenses are not included in the reported expense ratios. |
| (e) | The Investment Manager and certain of its affiliates agreed to waive/reimburse certain fees and expenses, if applicable. |
The accompanying Notes to Financial Statements are an integral part of this statement.
| | | | |
| COLUMBIA FRONTIER FUND — 2012 SEMIANNUAL REPORT | | | 27 | |
| | |
| Financial Highlights (continued) | | |
| | | | | | | | | | | | | | | |
| | | Six months
ended April 30, 2012 | | Year ended Oct. 31, |
| | | | 2011 | | 2010(a) |
| | | (Unaudited) | | | | |
Class Z | | | | | | | | | | | | | | | |
Per share data | | | | | | | | | | | | | | | |
Net asset value, beginning of period | | | | $10.21 | | | | | $10.35 | | | | | $9.84 | |
Income from investment operations: | | | | | | | | | | | | | | | |
Net investment loss | | | | (0.04 | ) | | | | (0.04 | ) | | | | (0.02 | ) |
Net realized and unrealized gain (loss) | | | | 1.62 | | | | | (0.10 | )(b) | | | | 0.53 | |
Total from investment operations | | | | 1.58 | | | | | (0.14 | ) | | | | 0.51 | |
Net asset value, end of period | | | | $11.79 | | | | | $10.21 | | | | | $10.35 | |
Total return | | | | 15.47% | | | | | (1.35% | ) | | | | 5.18% | |
Ratios to average net assets(c) | | | | | | | | | | | | | | | |
Expenses prior to fees waived or
expenses reimbursed | | | | 1.44% | (d) | | | | 1.48% | | | | | 2.03% | (d) |
Net expenses after fees waived or
expenses reimbursed(e) | | | | 1.27% | (d) | | | | 1.22% | (f) | | | | 1.26% | (d) |
Net investment loss | | | | (0.73% | )(d) | | | | (0.38% | )(f) | | | | (2.06% | )(d) |
Supplemental data | | | | | | | | | | | | | | | |
Net assets, end of period (in thousands) | | | | $1,605 | | | | | $196 | | | | | $3 | |
Portfolio turnover | | | | 45% | | | | | 72% | | | | | 160% | |
Notes to Financial Highlights
| (a) | For the period from September 27, 2010 (commencement of operations) to October 31, 2010. |
| (b) | Calculation of the net gain/loss per share (both realized and unrealized) does not correlate to the aggregate realized and unrealized gain/loss presented in the Statement of Operations due to the timing of sales and repurchases of Fund shares in relation to fluctuations in the market value of the portfolio. |
| (c) | In addition to the fees and expenses which the Fund bears directly, the Fund indirectly bears a pro rata share of the fees and expenses of the acquired funds in which it invests. Such indirect expenses are not included in the reported expense ratios. |
| (e) | The Investment Manager and certain of its affiliates agreed to waive/reimburse certain fees and expenses, if applicable. |
| (f) | The benefits derived from expense reductions had an impact of 0.01%. |
The accompanying Notes to Financial Statements are an integral part of this statement.
| | |
| 28 | | COLUMBIA FRONTIER FUND — 2012 SEMIANNUAL REPORT |
| | |
| Notes to Financial Statements | | |
April 30, 2012 (Unaudited)
Columbia Frontier Fund (the Fund), a series of Columbia Funds Series Trust II (the Trust), is a diversified fund. The Trust is registered under the Investment Company Act of 1940, as amended (the 1940 Act), as an open-end management investment company organized as a Massachusetts business trust.
Fund Shares
The Trust may issue an unlimited number of shares (without par value). The Fund offers Class A, Class B, Class C, Class I, Class R, Class R4, Class R5 and Class Z shares. All share classes have identical voting, dividend and liquidation rights. Each share class has its own expense structure and sales charges, as applicable.
Effective May 31, 2012, the Fund is closed to new investors and new accounts, subject to certain limited exceptions.
Class A shares are subject to a maximum front-end sales charge of 5.75% based on the initial investment amount. Class A shares purchased without an initial sales charge in accounts aggregating $1 million to $50 million at the time of purchase are subject to a contingent deferred sales charge (CDSC) if the shares are sold within 18 months of purchase, charged as follows: 1.00% CDSC if redeemed within 12 months of purchase, and 0.50% CDSC if redeemed more than 12, but less than 18, months after purchase.
Class B shares may be subject to a maximum CDSC of 5.00% based upon the holding period after purchase. Class B shares will generally convert to Class A shares eight years after purchase. The Fund no longer accepts investments by new or existing investors in the Fund’s Class B shares, except in connection with the reinvestment of any dividend and/or capital gain distributions in Class B shares of the Fund and exchanges by existing Class B shareholders of certain other funds within the Columbia Family of Funds.
Class C shares are subject to a 1.00% CDSC on shares redeemed within one year of purchase.
Class I shares are not subject to sales charges and are only available to the Columbia Family of Funds.
Class R shares are not subject to sales charges and are only available to qualifying institutional investors.
Class R4 shares are not subject to sales charges.
Class R5 shares are not subject to sales charges.
| | | | |
| COLUMBIA FRONTIER FUND — 2012 SEMIANNUAL REPORT | | | 29 | |
| | |
| Notes to Financial Statements (continued) | | |
Class Z shares are not subject to sales charges, and are only available to certain investors, as described in the Fund’s prospectus.
| Note | 2. Summary of Significant Accounting Policies |
Use of Estimates
The preparation of financial statements in accordance with U.S. generally accepted accounting principles (GAAP) requires management to make certain estimates and assumptions that affect the reported amounts of assets and liabilities, the disclosure of contingent assets and liabilities at the date of the financial statements and the reported amounts of revenue and expenses during the reporting period. Actual results could differ from those estimates.
The following is a summary of significant accounting policies consistently followed by the Fund in the preparation of its financial statements.
Security Valuation
All equity securities are valued at the close of business of the New York Stock Exchange (NYSE). Equity securities are valued at the last quoted sales price on the principal exchange or market on which they trade, except for securities traded on the NASDAQ Stock Market, which are valued at the NASDAQ official close price. Unlisted securities or listed securities for which there were no sales during the day are valued at the mean of the latest quoted bid and asked prices on such exchanges or markets.
Debt securities generally are valued by pricing services approved by the Board of Trustees (the Board) based upon market transactions for normal, institutional-size trading units of similar securities. The services may use various pricing techniques which take into account appropriate factors such as yield, quality, coupon rate, maturity, type of issue, trading characteristics and other data, as well as broker quotes. Debt securities for which quotations are readily available may also be valued based upon an over-the-counter or exchange bid quotation.
Foreign securities are valued based on quotations from the principal market in which such securities are normally traded. If any foreign share prices are not readily available as a result of limited share activity the securities are valued at the mean of the latest quoted bid and asked prices on such exchanges or markets. Foreign currency exchange rates are generally determined at 4:00 p.m. Eastern (U.S.) time. However, many securities markets and exchanges outside the U.S. close prior to the close of the NYSE; therefore, the closing prices for securities in such markets or on such exchanges may not fully reflect events that occur after such close but before the close of the NYSE. In those situations, foreign securities will be fair valued pursuant to the policy adopted by the Board, including utilizing a third party pricing service to determine these fair values.
| | |
| 30 | | COLUMBIA FRONTIER FUND — 2012 SEMIANNUAL REPORT |
The third party pricing service takes into account multiple factors, including, but not limited to, movements in the U.S. securities markets, certain depositary receipts, futures contracts and foreign exchange rates that have occurred subsequent to the close of the foreign exchange, to determine a good faith estimate that reasonably reflects the current market conditions as of the close of the NYSE. The fair value of a security is likely to be different from the quoted or published price, if available.
Investments in other open-end investment companies, including money market funds, are valued at net asset value.
Short-term securities purchased within 60 days to maturity are valued at amortized cost, which approximates market value. The value of short-term securities originally purchased with maturities greater than 60 days is determined based on an amortized value to par upon reaching 60 days to maturity. Short-term securities maturing in more than 60 days from the valuation date are valued at the market price or approximate market value based on current interest rates.
Investments for which market quotations are not readily available, or that have quotations which management believes are not reliable, are valued at fair value as determined in good faith under consistently applied procedures established by and under the general supervision of the Board. If a security or class of securities (such as foreign securities) is valued at fair value, such value is likely to be different from the last quoted market price for the security. The determination of fair value often requires significant judgment. To determine fair value, management may use assumptions including but not limited to future cash flows and estimated risk premiums. Multiple inputs from various sources may be used to determine value.
Foreign Currency Transactions and Translation
The values of all assets and liabilities denominated in foreign currencies are translated into U.S. dollars at that day’s exchange rates. Net realized and unrealized gains (losses) on foreign currency transactions and translations include gains (losses) arising from the fluctuation in exchange rates between trade and settlement dates on securities transactions, gains (losses) arising from the disposition of foreign currency and currency gains (losses) between the accrual and payment dates on dividends, interest income and foreign withholding taxes.
For financial statement purposes, the Fund does not distinguish that portion of gains (losses) on investments which is due to changes in foreign exchange rates from that which is due to changes in market prices of the investments. Such fluctuations are included with the net realized and unrealized gains (losses) on investments in the Statement of Operations.
| | | | |
| COLUMBIA FRONTIER FUND — 2012 SEMIANNUAL REPORT | | | 31 | |
| | |
| Notes to Financial Statements (continued) | | |
Repurchase Agreements
The Fund may engage in repurchase agreement transactions with institutions that management has determined are creditworthy. The Fund, through the custodian, receives delivery of the underlying securities collateralizing a repurchase agreement. Management is responsible for determining that the collateral is at least equal, at all times, to the value of the repurchase obligation including interest. A repurchase agreement transaction involves certain risks in the event of default or insolvency of the counterparty. These risks include possible delays in or restrictions on a Fund’s ability to dispose of the underlying securities and a possible decline in the value of the underlying securities during the period while the Fund seeks to assert its rights.
Security Transactions
Security transactions are accounted for on the trade date. Cost is determined and gains (losses) are based upon the specific identification method for both financial statement and federal income tax purposes.
Income Recognition
Corporate actions and dividend income are recorded net of any non-reclaimable tax withholdings, on the ex-dividend date or upon receipt of ex-dividend notification in the case of certain foreign securities.
Interest income is recorded on the accrual basis.
The Fund receives distributions from holdings in real estate investment trusts (REITs) which report information on the character of their distributions annually. REIT distributions are allocated to dividend income, capital gain and return of capital based on estimates made by the Fund’s management if actual information has not yet been reported. Return of capital is recorded as a reduction of the cost basis of securities held. Management’s estimates are subsequently adjusted when the actual character of the distributions is disclosed by the REITs which could result in a proportionate change in return of capital to shareholders.
Awards from class action litigation are recorded as a reduction of cost basis if the Fund still owns the applicable securities on the payment date. If the Fund no longer owns the applicable securities, the proceeds are recorded as realized gains.
Expenses
General expenses of the Trust are allocated to the Fund and other funds of the Trust based upon relative net assets or other expense allocation methodologies determined by the nature of the expense. Expenses directly attributable to the Fund are charged to the Fund. Expenses directly attributable to a specific class of shares are charged to that share class.
| | |
| 32 | | COLUMBIA FRONTIER FUND — 2012 SEMIANNUAL REPORT |
Determination of Class Net Asset Value
All income, expenses (other than class-specific expenses, which are charged to that share class, as shown in the Statement of Operations) and realized and unrealized gains (losses) are allocated to each class of the Fund on a daily basis, based on the relative net assets of each class, for purposes of determining the net asset value of each class.
Federal Income Tax Status
The Fund intends to qualify each year as a regulated investment company under Subchapter M of the Internal Revenue Code, as amended, and will distribute substantially all of its taxable income (including net short-term capital gains), if any, for its tax year, and as such will not be subject to federal income taxes. In addition, the Fund intends to distribute in each calendar year substantially all of its net investment income, capital gains and certain other amounts, if any, such that the Fund should not be subject to federal excise tax. Therefore, no federal income or excise tax provision is recorded.
Foreign Taxes
The Fund may be subject to foreign taxes on income, gains on investments or currency repatriation, a portion of which may be recoverable. The Fund will accrue such taxes and recoveries, as applicable, based upon its current interpretation of tax rules and regulations that exist in the markets in which it invests.
Realized gains in certain countries may be subject to foreign taxes at the Fund level, based on statutory rates. The Fund accrues for such foreign taxes on net realized and unrealized gains at the appropriate rate for each jurisdiction, as applicable.
Distributions to Shareholders
Distributions from net investment income are declared and paid annually. Net realized capital gains, if any, are distributed along with the income dividend. Income distributions and capital gain distributions are determined in accordance with federal income tax regulations which may differ from GAAP.
Guarantees and Indemnifications
Under the Trust’s organizational documents and, in some cases, by contract, its officers and trustees are indemnified against certain liabilities arising out of the performance of their duties to the Trust or its funds. In addition, certain of the Fund’s contracts with its service providers contain general indemnification clauses. The Fund’s maximum exposure under these arrangements is unknown since the amount of any future claims that may be made against the Fund cannot be determined, and the Fund has no historical basis for predicting the likelihood of any such claims.
| | | | |
| COLUMBIA FRONTIER FUND — 2012 SEMIANNUAL REPORT | | | 33 | |
| | |
| Notes to Financial Statements (continued) | | |
Recent Accounting Pronouncement
Fair Value Measurements and Disclosures
In May 2011, the Financial Accounting Standards Board (FASB) issued ASU No. 2011-04 modifying Topic 820, Fair Value Measurements and Disclosures. At the same time, the International Accounting Standards Board (IASB) issued International Financial Reporting Standard 13, Fair Value Measurement. The objective of the FASB and IASB is convergence of their guidance on fair value measurements and disclosures.
Specifically, ASU No. 2011-04 requires reporting entities to disclose i) the amounts of any transfers between Level 1 and Level 2, and the reasons for the transfers, ii) for Level 3 fair value measurements, a) quantitative information about significant unobservable inputs used, b) a description of the valuation processes used by the reporting entity and c) a narrative description of the sensitivity of the fair value measurement to changes in unobservable inputs if a change in those inputs might result in a significantly higher or lower fair value measurement. The effective date of ASU No. 2011-04 is for interim and annual periods beginning after December 15, 2011. At this time, management is evaluating the implications of this guidance and the impact it will have on the financial statement amounts and footnote disclosures, if any.
| Note | 3. Fees and Compensation Paid to Affiliates |
Investment Management Fees
Under an Investment Management Services Agreement, Columbia Management Investment Advisers, LLC (the Investment Manager), a wholly-owned subsidiary of Ameriprise Financial, Inc. (Ameriprise Financial), determines which securities will be purchased, held or sold. The management fee is an annual fee that is equal to a percentage of the Fund’s average daily net assets that declines from 0.79% to 0.70% as the Fund’s net assets increase. The annualized effective management fee rate for the six months ended April 30, 2012 was 0.79% of the Fund’s average daily net assets.
Administration Fees
Under an Administrative Services Agreement, the Investment Manager serves as the Fund Administrator. The Fund pays the Fund Administrator an annual fee for administration and accounting services equal to a percentage of the Fund’s average daily net assets that declines from 0.08% to 0.05% as the Fund’s net assets increase. The annualized effective administration fee rate for the six months ended April 30, 2012 was 0.08% of the Fund’s average daily net assets.
| | |
| 34 | | COLUMBIA FRONTIER FUND — 2012 SEMIANNUAL REPORT |
Other Expenses
Other expenses are for, among other things, certain expenses of the Fund or the Board, including: Fund boardroom and office expense, employee compensation, employee health and retirement benefits, and certain other expenses. Payment of these Fund and Board expenses is facilitated by a company providing limited administrative services to the Fund and the Board. For the six months ended April 30, 2012, other expenses paid to this company were $905.
Compensation of Board Members
Board members are compensated for their services to the Fund as disclosed in the Statement of Operations. Under a Deferred Compensation Plan (the Plan), the Board members who are not “interested persons” of the Fund, as defined under the 1940 Act, may elect to defer payment of up to 100% of their compensation. Deferred amounts are treated as though equivalent dollar amounts had been invested in shares of certain funds managed by the Investment Manager. The Fund’s liability for these amounts is adjusted for market value changes and remains in the Fund until distributed in accordance with the Plan.
Transfer Agent Fees
Under a Transfer and Dividend Disbursing Agent Agreement, Columbia Management Investment Services Corp. (the Transfer Agent), an affiliate of the Investment Manager and a wholly-owned subsidiary of Ameriprise Financial, is responsible for providing transfer agency services to the Fund. The Transfer Agent has contracted with Boston Financial Data Services (BFDS) to serve as sub-transfer agent.
The Transfer Agent receives monthly account-based service fees based on the number of open accounts and is reimbursed by the Fund for the fees and expenses the Transfer Agent pays to financial intermediaries that maintain omnibus accounts with the Fund that is a percentage of the average aggregate value of the Fund’s shares maintained in each such omnibus account (other than omnibus accounts for which American Enterprise Investment Services Inc. is the broker of record or accounts where the beneficial shareholder is a customer of Ameriprise Financial Services, Inc., which are paid a per account fee). The Transfer Agent pays the fees of BFDS for services as sub-transfer agent and is not entitled to reimbursement for such fees from the Fund (with the exception of out-of-pocket fees).
The Transfer Agent also receives compensation from fees for various shareholder services and reimbursements for certain out-of-pocket expenses. Class I shares do not pay transfer agent fees. Total transfer agent fees for Class R4 and Class R5 shares are subject to an annual limitation of not more than 0.05% of the average daily net assets attributable to each share class.
| | | | |
| COLUMBIA FRONTIER FUND — 2012 SEMIANNUAL REPORT | | | 35 | |
| | |
| Notes to Financial Statements (continued) | | |
For the six months ended April 30, 2012, the Fund’s annualized effective transfer agent fee rates as a percentage of average daily net assets of each class were as follows:
| | | | |
Class A | | | 0.38 | % |
Class B | | | 0.42 | |
Class C | | | 0.38 | |
Class R | | | 0.37 | |
Class R4 | | | 0.03 | |
Class R5 | | | 0.03 | |
Class Z | | | 0.33 | |
The Fund and certain other associated investment companies (together, the Guarantors), have severally, but not jointly, guaranteed the performance and observance of all the terms and conditions of a lease entered into by Seligman Data Corp. (SDC), the former transfer agent, including the payment of rent by SDC (the Guaranty). The lease and the Guaranty expire in January 2019. At April 30, 2012, the Fund’s total potential future obligation over the life of the Guaranty is $40,186. The liability remaining at April 30, 2012 for non-recurring charges associated with the lease amounted to $28,487 and is included within other accrued expenses in the Statement of Assets and Liabilities.
An annual minimum account balance fee of $20 may apply to certain accounts with a value below the Fund’s initial minimum investment requirements to reduce the impact of small accounts on transfer agent fees. These minimum account balance fees are recorded as part of expense reductions in the Statement of Operations. For the six months ended April 30, 2012, no minimum account balance fees were charged by the Fund.
Plan Administration Fees
Under a Plan Administration Services Agreement with the Transfer Agent, the Fund pays an annual fee at a rate of 0.25% of the Fund’s average daily net assets attributable to Class R4 shares for the provision of various administrative, recordkeeping, communication and educational services.
Distribution Fees
The Fund has an agreement with Columbia Management Investment Distributors, Inc. (the Distributor), an affiliate of the Investment Manager and a wholly-owned subsidiary of Ameriprise Financial, for distribution and shareholder services. Under a Plan and Agreement of Distribution pursuant to Rule 12b-1, the Fund pays a fee at an annual rate of up to 0.25% of the Fund’s average daily net assets attributable to Class A shares, a fee at an annual rate of up to 0.50% of the Fund’s average daily net assets attributable to Class R shares (of which up to 0.25% may be used for shareholder services) and a fee at an
| | |
| 36 | | COLUMBIA FRONTIER FUND — 2012 SEMIANNUAL REPORT |
annual rate of up to 1.00% of the Fund’s average daily net assets attributable to Class B and Class C shares. For Class B and Class C shares, of the 1.00% fee, up to 0.75% is reimbursed for distribution expenses.
The amount of distribution expenses incurred by the Distributor and not yet reimbursed (unreimbursed expense) was approximately $327,000 and $1,311,000 for Class B and Class C shares, respectively. These amounts are based on the most recent information available as of March 31, 2012, and may be recovered from future payments under the distribution plan or CDSCs. To the extent the unreimbursed expense has been fully recovered, the distribution fee is reduced.
Sales Charges
Sales charges, including front-end charges and CDSCs, received by the Distributor for distributing Fund shares were $20,549 for Class A, $937 for Class B and $68 for Class C shares for the six months ended April 30, 2012.
Expenses Waived/Reimbursed by the Investment Manager and its Affiliates
Effective January 1, 2012, the Investment Manager and certain of its affiliates have contractually agreed to waive fees and/or reimburse expenses (excluding certain fees and expenses described below), through February 28, 2013, unless sooner terminated at the sole discretion of the Board, so that the Fund’s net operating expenses, after giving effect to fees waived/expenses reimbursed and any balance credits and/or overdraft charges from the Fund’s custodian, do not exceed the following annual rates as a percentage of the class’ average daily net assets:
| | | | |
Class A | | | 1.53 | % |
Class B | | | 2.28 | |
Class C | | | 2.28 | |
Class I | | | 1.08 | |
Class R | | | 1.78 | |
Class R4 | | | 1.38 | |
Class R5 | | | 1.13 | |
Class Z | | | 1.28 | |
Prior to January 1, 2012, the Investment Manager and its affiliates contractually agreed to waive fees and/or reimburse expenses (excluding certain fees and expenses described below), so that the Fund’s net operating expenses, after giving effect to fees waived/expenses reimbursed and any balance credits and/or
| | | | |
| COLUMBIA FRONTIER FUND — 2012 SEMIANNUAL REPORT | | | 37 | |
| | |
| Notes to Financial Statements (continued) | | |
overdraft charges from the Fund’s custodian, did not exceed the following annual rates as a percentage of the class’ average daily net assets:
| | | | |
Class A | | | 1.47 | % |
Class B | | | 2.22 | |
Class C | | | 2.22 | |
Class I | | | 1.02 | |
Class R | | | 1.72 | |
Class R4 | | | 1.32 | |
Class R5 | | | 1.07 | |
Class Z | | | 1.22 | |
Under the agreement, the following fees and expenses are excluded from the waiver/reimbursement commitment, and therefore will be paid by the Fund, if applicable: taxes (including foreign transaction taxes), expenses associated with investments in affiliated and non-affiliated pooled investment vehicles (including mutual funds and exchange traded funds), transaction costs and brokerage commissions, costs related to any securities lending program, dividend expenses associated with securities sold short, inverse floater program fees and expenses, transaction charges and interest on borrowed money, interest, extraordinary expenses and any other expenses the exclusion of which is specifically approved by the Fund’s Board. This agreement may be modified or amended only with approval from all parties.
| Note | 4. Federal Tax Information |
The timing and character of income and capital gain distributions are determined in accordance with income tax regulations, which may differ from GAAP because of temporary or permanent book to tax differences.
At April 30, 2012, the cost of investments for federal income tax purposes was approximately $87,530,000 and the aggregate gross approximate unrealized appreciation and depreciation based on that cost was:
| | | | |
Unrealized appreciation | | $ | 10,155,000 | |
Unrealized depreciation | | | (4,051,000 | ) |
Net unrealized appreciation | | $ | 6,104,000 | |
| | |
| 38 | | COLUMBIA FRONTIER FUND — 2012 SEMIANNUAL REPORT |
The following capital loss carryforward, determined as of October 31, 2011, may be available to reduce taxable income arising from future net realized gains on investments, if any, to the extent permitted by the Internal Revenue Code:
| | | | |
| Year of Expiration | | Amount | |
2017 | | $ | 3,472,677 | |
2018 | | | 17,530,532 | |
Total | | $ | 21,003,209 | |
On December 22, 2010, the Regulated Investment Company Modernization Act of 2010 (the Act) was enacted, which changed various technical rules governing the tax treatment of regulated investment companies. The changes are generally effective for taxable years beginning after the date of enactment. Under the Act, the Fund will be permitted to carry forward capital losses incurred in taxable years beginning after the date of enactment for an unlimited period. However, any losses incurred during those future taxable years will be required to be utilized prior to the losses incurred in pre-enactment taxable years, which carry an expiration date. As a result of this ordering rule, pre-enactment capital loss carryforwards may be more likely to expire unused.
Management of the Fund has concluded that there are no significant uncertain tax positions that would require recognition in the financial statements. However, management’s conclusion may be subject to review and adjustment at a later date based on factors including, but not limited to, new tax laws, regulations, and administrative interpretations (including relevant court decisions). Generally, the Fund’s federal tax returns for the prior three fiscal years remain subject to examination by the Internal Revenue Service.
| Note | 5. Portfolio Information |
The cost of purchases and proceeds from sales of securities, excluding short-term obligations, aggregated to $32,832,260 and $42,433,314, respectively, for the six months ended April 30, 2012.
| Note | 6. Lending of Portfolio Securities |
The Fund has entered into a Master Securities Lending Agreement (the Agreement) with JPMorgan Chase Bank, N.A. (JPMorgan). The Agreement authorizes JPMorgan as lending agent to lend securities to authorized borrowers in order to generate additional income on behalf of the Fund. Pursuant to the Agreement, the securities loaned are secured by cash or U.S. government securities equal to at least 100% of the market value of the loaned securities. Any additional collateral required to maintain those levels due to market fluctuations of the loaned securities is requested to be delivered the following business day.
| | | | |
| COLUMBIA FRONTIER FUND — 2012 SEMIANNUAL REPORT | | | 39 | |
| | |
| Notes to Financial Statements (continued) | | |
Cash collateral received is invested by the lending agent on behalf of the Fund into authorized investments pursuant to the Agreement. The investments made with the cash collateral are listed in the Portfolio of Investments. The values of such investments and any uninvested cash collateral are disclosed in the Statement of Assets and Liabilities along with the related obligation to return the collateral upon the return of the securities loaned.
Risks of delay in recovery of securities or even loss of rights in the securities may occur should the borrower of the securities fail financially. Risks may also arise to the extent that the value of the securities loaned increases above the value of the collateral received. JPMorgan will indemnify the Fund from losses resulting from a borrower’s failure to return a loaned security when due. Such indemnification does not extend to losses associated with declines in the value of cash collateral investments. The Investment Manager is not responsible for any losses incurred by the Fund in connection with the securities lending program. Loans are subject to termination by the Fund or the borrower at any time, and are, therefore, not considered to be illiquid investments.
Pursuant to the Agreement, the Fund receives income for lending its securities either in the form of fees or by earning interest on invested cash collateral, net of negotiated rebates paid to borrowers and fees paid to the lending agent for services provided and any other securities lending expenses. Net income earned from securities lending for the six months ended April 30, 2012 is disclosed in the Statement of Operations. The Fund continues to earn and accrue interest and dividends on the securities loaned.
At April 30, 2012, securities valued at $16,785,045 were on loan, secured by cash collateral of $17,757,466 that is partially or fully invested in short-term securities or other cash equivalents.
| Note | 7. Affiliated Money Market Fund |
The Fund may invest its daily cash balances in Columbia Short-Term Cash Fund, an affiliated money market fund established for the exclusive use by the Fund and other affiliated funds. The income earned by the Fund from such investments is included as “Dividends from affiliates” in the Statement of Operations. As an investing fund, the Fund indirectly bears its proportionate share of the expenses of Columbia Short-Term Cash Fund.
The Fund has entered into a revolving credit facility with a syndicate of banks led by JPMorgan, whereby the Fund may borrow for the temporary funding of shareholder redemptions or for other temporary or emergency purposes. The
| | |
| 40 | | COLUMBIA FRONTIER FUND — 2012 SEMIANNUAL REPORT |
credit facility agreement, as amended, which is a collective agreement between the Fund and certain other funds managed by the Investment Manager, severally and not jointly, permits collective borrowings up to $500 million. Pursuant to a December 13, 2011 amendment to the credit facility agreement, interest is charged to each participating fund based on its borrowings at a rate equal to the higher of (i) the overnight federal funds rate plus 1.00% or (i) the one-month LIBOR rate plus 1.00%. Each borrowing under the credit facility matures no later than 60 days after the date of borrowing. The Fund also pays a commitment fee equal to its pro rata share of the amount of the credit facility at a rate of 0.08% per annum.
Prior to December 13, 2011, interest was charged to each participating fund based on its borrowings at a rate equal to the sum of the federal funds rate plus (i) 1.25% per annum plus (ii) if one-month LIBOR exceeds the federal funds rate, the amount of such excess. The Fund also paid a commitment fee equal to its pro rata share of the amount of the credit facility at a rate of 0.10% per annum.
The Fund had no borrowings during the six months ended April 30, 2012.
Foreign Securities Risk
Investing in foreign securities may include certain risks and considerations not typically associated with investing in U.S. securities, such as fluctuating currency values and changing local and regional economic, political and social conditions, which may result in greater market volatility. In addition, certain foreign securities may not be as liquid as U.S. securities.
| Note | 10. Subsequent Events |
Management has evaluated the events and transactions that have occurred through the date the financial statements were issued. Other than as noted in Note 1 above, there were no items requiring adjustment of the financial statements or additional disclosure.
| Note | 11. Information Regarding Pending and Settled Legal Proceedings |
In December 2005, without admitting or denying the allegations, American Express Financial Corporation (AEFC, which is now known as Ameriprise Financial, Inc. (Ameriprise Financial)) entered into settlement agreements with the Securities and Exchange Commission (SEC) and Minnesota Department of Commerce (MDOC) related to market timing activities. As a result, AEFC was censured and ordered to cease and desist from committing or causing any violations of certain provisions of the Investment Advisers Act of 1940, the
| | | | |
| COLUMBIA FRONTIER FUND — 2012 SEMIANNUAL REPORT | | | 41 | |
| | |
| Notes to Financial Statements (continued) | | |
Investment Company Act of 1940, and various Minnesota laws. AEFC agreed to pay disgorgement of $10 million and civil money penalties of $7 million. AEFC also agreed to retain an independent distribution consultant to assist in developing a plan for distribution of all disgorgement and civil penalties ordered by the SEC in accordance with various undertakings detailed at www.sec.gov/litigation/admin/ia-2451.pdf. Ameriprise Financial and its affiliates have cooperated with the SEC and the MDOC in these legal proceedings, and have made regular reports to the funds’ Boards of Trustees.
Ameriprise Financial and certain of its affiliates have historically been involved in a number of legal, arbitration and regulatory proceedings, including routine litigation, class actions, and governmental actions, concerning matters arising in connection with the conduct of their business activities. Ameriprise Financial believes that the Funds are not currently the subject of, and that neither Ameriprise Financial nor any of its affiliates are the subject of, any pending legal, arbitration or regulatory proceedings that are likely to have a material adverse effect on the Funds or the ability of Ameriprise Financial or its affiliates to perform under their contracts with the Funds. Ameriprise Financial is required to make 10-Q, 10-K and, as necessary, 8-K filings with the Securities and Exchange Commission on legal and regulatory matters that relate to Ameriprise Financial and its affiliates. Copies of these filings may be obtained by accessing the SEC website at www.sec.gov.
There can be no assurance that these matters, or the adverse publicity associated with them, will not result in increased fund redemptions, reduced sale of fund shares or other adverse consequences to the Funds. Further, although we believe proceedings are not likely to have a material adverse effect on the Funds or the ability of Ameriprise Financial or its affiliates to perform under their contracts with the Funds, these proceedings are subject to uncertainties and, as such, we are unable to estimate the possible loss or range of loss that may result. An adverse outcome in one or more of these proceedings could result in adverse judgments, settlements, fines, penalties or other relief that could have a material adverse effect on the consolidated financial condition or results of operations of Ameriprise Financial.
| | |
| 42 | | COLUMBIA FRONTIER FUND — 2012 SEMIANNUAL REPORT |
The policy of the Board is to vote the proxies of the companies in which the Fund holds investments consistent with the procedures as stated in the Statement of Additional Information (SAI). You may obtain a copy of the SAI without charge by calling 800.345.6611; contacting your financial intermediary; visiting columbiamanagement.com; or searching the website of the Securities and Exchange Commission (SEC) at www.sec.gov. Information regarding how the Fund voted proxies relating to portfolio securities is filed with the SEC by August 31 for the most recent 12-month period ending June 30 of that year, and is available without charge by visiting columbiamanagement.com; or searching the website of the SEC at www.sec.gov.
| | |
| Approval of Investment Management Services |
| |
| Agreement | | |
Columbia Management Investment Advisers, LLC (“Columbia Management” or the “investment manager”), a wholly-owned subsidiary of Ameriprise Financial, Inc. (“Ameriprise Financial”), serves as the investment manager to Columbia Frontier Fund (the “Fund”). Under an investment management services agreement (the “IMS Agreement”), Columbia Management provides investment advice and other services to the Fund and all funds distributed by Columbia Management Investment Distributors, Inc. (collectively, the “Funds”).
On an annual basis, the Fund’s Board of Trustees (the “Board”), including the independent Board members (the “Independent Trustees”), considers renewal of the IMS Agreement. Columbia Management prepared detailed reports for the Board and its Contracts Committee in March and April 2012, including reports based on analyses of data provided by an independent organization and a comprehensive response to each item of information requested by independent legal counsel to the Independent Trustees (“Independent Legal Counsel”) in a letter to the investment manager, to assist the Board in making this determination. All of the materials presented in March and April were first supplied in draft form to designated representatives of the Independent Trustees, i.e., Independent Legal Counsel, the Chair and the Chair of the Contracts Committee (including materials relating to the Fund’s expense cap), and the final materials were revised to reflect comments provided by these Board representatives. In addition, throughout the year, the Board (or its committees) regularly meets with portfolio management teams and senior management personnel, and reviews information prepared by Columbia Management addressing the services Columbia Management provides and Fund performance. The Board accords particular weight to the work, deliberations and conclusions
| | | | |
| COLUMBIA FRONTIER FUND — 2012 SEMIANNUAL REPORT | | | 43 | |
| | |
| Approval of Investment Management Services |
| |
| Agreement (continued) | | |
of the Contracts Committee, the Investment Review Committee and the Compliance Committee in determining whether to continue the IMS Agreement.
The Board, at its April 10-12, 2012 in-person Board meeting (the “April Meeting”), considered the renewal of the IMS Agreement for an additional one-year term. At the April Meeting, Independent Legal Counsel reviewed with the Independent Trustees various factors relevant to the Board’s consideration of advisory agreements and the Board’s legal responsibilities related to such consideration. Following an analysis and discussion of the factors identified below, the Board, including all of the Independent Trustees, approved the renewal of the IMS Agreement.
Nature, Extent and Quality of Services Provided by Columbia Management: The Independent Trustees analyzed various reports and presentations they had received detailing the services performed by Columbia Management, as well as its expertise, resources and capabilities. The Independent Trustees specifically considered many developments during the past year concerning the services provided by Columbia Management, including, in particular, the continued investment in, and resources dedicated to, the Funds’ operations and the successful completion of various integration initiatives and the consolidation of dozens of Funds. The Independent Trustees noted the information they received concerning Columbia Management’s ability to retain key portfolio management personnel. In that connection, the Independent Trustees took into account their meetings with Columbia Management’s Chief Investment Officer (the “CIO”) and considered the CIO’s successful execution of additional risk and portfolio management oversight applied to the Funds. The Independent Trustees also assessed Columbia Management’s significant investment in upgrading technology (such as an equity trading system) and considered management’s commitments to enhance existing resources in this area.
In connection with the Board’s evaluation of the overall package of services provided by Columbia Management, the Board also considered the quality of administrative services provided to the Fund by Columbia Management. In addition, the Board also reviewed the financial condition of Columbia Management (and its affiliates) and each entity’s ability to carry out its responsibilities under the IMS Agreement and the Fund’s other services agreements with affiliates of Ameriprise Financial. The Board also discussed the acceptability of the terms of the IMS Agreement (including the relatively broad scope of services required to be performed by Columbia Management). The Board concluded that the services being performed under the IMS Agreement were of a reasonably high quality.
| | |
| 44 | | COLUMBIA FRONTIER FUND — 2012 SEMIANNUAL REPORT |
Based on the foregoing, and based on other information received (both oral and written, including the information on investment performance referenced below) and other considerations, the Board concluded that Columbia Management and its affiliates were in a position to continue to provide a high quality and level of services to the Fund.
Investment Performance: For purposes of evaluating the nature, extent and quality of services provided under the IMS Agreement, the Board carefully reviewed the investment performance of the Fund. In this regard, the Board considered detailed reports providing the results of analyses performed by an independent organization showing, for various periods, the performance of the Fund, the performance of a benchmark index, the percentage ranking of the Fund among its comparison group and the net assets of the Fund. The Board observed that the Fund’s investment performance reflected the interrelationship of market conditions with the particular investment strategies employed by the portfolio management team.
Comparative Fees, Costs of Services Provided and the Profits Realized By Columbia Management and its Affiliates from their Relationships with the Fund: The Board reviewed comparative fees and the costs of services to be provided under the IMS Agreement. The Board members considered detailed comparative information set forth in an annual report on fees and expenses, including, among other things, data (based on analyses conducted by an independent organization) showing a comparison of the Fund’s expenses with median expenses paid by funds in its comparative peer universe, as well as data showing the Fund’s contribution to Columbia Management’s profitability. The Board reviewed the fees charged to comparable institutional or other accounts/vehicles managed by Columbia Management and discussed differences in how the products are managed and operated, noting no unreasonable differences in the levels of contractual fees.
The Board accorded particular weight to the notion that the level of fees should reflect a rational pricing model applied consistently across the various product lines in the Fund family, while assuring that the overall fees for each Fund (with few defined exceptions) are generally in line with the “pricing philosophy” (i.e., that the total expense ratio of the Fund is at, or below, the median expense ratio of funds in the same comparison universe of the Fund). The Board took into account that the Fund’s total expense ratio (after considering proposed expense caps/waivers) approximated the peer universe’s median expense ratio. Based on its review, the Board concluded that the Fund’s management fee was fair and reasonable in light of the extent and quality of services that the Fund receives.
| | | | |
| COLUMBIA FRONTIER FUND — 2012 SEMIANNUAL REPORT | | | 45 | |
| | |
| Approval of Investment Management Services |
| |
| Agreement (continued) | | |
The Board also considered the expected profitability of Columbia Management and its affiliates in connection with Columbia Management providing investment management services to the Fund. In this regard, the Board referred to a detailed profitability report, discussing the profitability to Columbia Management and Ameriprise Financial from managing, operating and distributing the Funds. In this regard, the Board observed that 2011 profitability, while slightly lower than 2010, was generally in line with the reported profitability of other asset management firms. The Board also considered the indirect economic benefits flowing to Columbia Management or its affiliates in connection with managing or distributing the Funds, such as the enhanced ability to offer various other financial products to Ameriprise Financial customers, soft dollar benefits and overall reputational advantages. The Board noted that the fees paid by the Fund should permit the investment manager to offer competitive compensation to its personnel, make necessary investments in its business and earn an appropriate profit. The Board concluded that profitability levels were reasonable.
Economies of Scale to be Realized: The Board also considered the economies of scale that might be realized by Columbia Management as the Fund grows and took note of the extent to which Fund shareholders might also benefit from such growth.
Based on the foregoing, the Board, including all of the Independent Trustees, concluded that the investment management service fees were fair and reasonable in light of the extent and quality of services provided. In reaching this conclusion, no single factor was determinative. On April 12, 2012, the Board, including all of the Independent Trustees, approved the renewal of the IMS Agreement.
| | |
| 46 | | COLUMBIA FRONTIER FUND — 2012 SEMIANNUAL REPORT |
Columbia Frontier Fund
P.O. Box 8081
Boston, MA 02266-8081
columbiamanagement.com
| | | | |
 | | This report must be accompanied or preceded by the Fund’s current prospectus. The
Fund is distributed by Columbia Management Investment Distributors, Inc., member
FINRA, and managed by Columbia Management Investment Advisers, LLC. ©2012 Columbia Management Investment Advisers, LLC. All rights reserved. | | SL-9959 D (6/12) |
Semiannual Report

Columbia
Global Bond Fund
Semiannual Report for the Period Ended April 30, 2012
Columbia Global Bond Fund seeks to provide shareholders with high total return through income and growth of capital.
Not FDIC insured ¡ No bank guarantee ¡ May lose value
| | | | |
| |
Your Fund at a Glance | | | 2 | |
| |
Fund Expense Example | | | 6 | |
| |
Portfolio of Investments | | | 8 | |
| |
Statement of Assets and Liabilities | | | 27 | |
| |
Statement of Operations | | | 29 | |
| |
Statement of Changes in Net Assets | | | 31 | |
| |
Financial Highlights | | | 33 | |
| |
Notes to Financial Statements | | | 41 | |
| |
Proxy Voting | | | 59 | |
| |
Approval of Investment Management Services Agreement | | | 59 | |
See the Fund’s prospectus for risks associated with investing in the Fund.
| | | | |
| COLUMBIA GLOBAL BOND FUND — 2012 SEMIANNUAL REPORT | | | 1 | |
FUND SUMMARY
| > | | Columbia Global Bond Fund (the Fund) Class A shares returned 2.27% (excluding sales charge) for the six months ended April 30, 2012. |
| > | | The Fund outperformed its benchmark, the Barclays Global Aggregate Index, which returned 0.96% for the same period. |
ANNUALIZED TOTAL RETURNS (for period ended April 30, 2012)
| | | | | | | | | | | | | | | | |
| | | 6 months* | | | 1 year | | | 5 years | | | 10 years | |
Columbia Global Bond Fund Class A (excluding sales charge) | | | +2.27% | | | | +2.52% | | | | +5.87% | | | | +6.83% | |
Barclays Global Aggregate Index (1) (unmanaged) | | | +0.96% | | | | +3.30% | | | | +6.39% | | | | +7.15% | |
The performance information shown represents past performance and is not a guarantee of future results. The investment return and principal value of your investment will fluctuate so that your shares, when redeemed, may be worth more or less than their original cost. Current performance may be lower or higher than the performance information shown. You may obtain performance information current to the most recent month-end by contacting your financial intermediary, visiting columbiamanagement.com or calling 800.345.6611.
The 4.75% sales charge applicable to Class A shares of the Fund is not reflected in the table above. If reflected, returns would be lower than those shown. The performance of other classes may vary from that shown because of differences in fees and expenses. The Fund’s returns reflect the effect of fee waivers/expense reimbursements, if any. Without such waivers/reimbursements, the Fund’s returns would be lower. See the Average Annual Total Returns table for performance of other share classes of the Fund.
The index does not reflect the effects of sales charges, expenses and taxes. It is not possible to invest directly in an index.
| (1) | | The Barclays Global Aggregate Index, an unmanaged market capitalization weighted benchmark, tracks the performance of investment grade fixed income securities denominated in 13 currencies. The index reflects reinvestment of all distributions and changes in market prices. |
| | |
| 2 | | COLUMBIA GLOBAL BOND FUND — 2012 SEMIANNUAL REPORT |
AVERAGE ANNUAL TOTAL RETURNS
| | | | | | | | | | | | | | | | |
| at April 30, 2012 | |
| Without sales charge | | 6 months* | | | 1 year | | | 5 years | | | 10 years | |
Class A (inception 3/20/89) | | | +2.27% | | | | +2.52% | | | | +5.87% | | | | +6.83% | |
Class B (inception 3/20/95) | | | +1.91% | | | | +1.84% | | | | +5.08% | | | | +6.03% | |
Class C (inception 6/26/00) | | | +1.95% | | | | +1.82% | | | | +5.11% | | | | +6.04% | |
Class I** (inception 3/4/04) | | | +2.37% | | | | +2.99% | | | | +6.33% | | | | +7.20% | |
Class R** (inception 3/15/10) | | | +2.05% | | | | +2.30% | | | | +5.53% | | | | +6.47% | |
Class R4 (inception 3/20/95) | | | +2.23% | | | | +2.69% | | | | +6.10% | | | | +7.07% | |
Class W** (inception 12/1/06) | | | +2.11% | | | | +2.48% | | | | +5.87% | | | | +6.81% | |
Class Z** (inception 9/27/10) | | | +2.27% | | | | +2.86% | | | | +5.98% | | | | +6.88% | |
| | | | |
| With sales charge | | | | | | | | | | | | |
Class A (inception 3/20/89) | | | -2.63% | | | | -2.35% | | | | +4.86% | | | | +6.31% | |
Class B (inception 3/20/95) | | | -2.88% | | | | -2.91% | | | | +4.75% | | | | +6.03% | |
Class C (inception 6/26/00) | | | +0.99% | | | | +0.87% | | | | +5.11% | | | | +6.04% | |
The “Without sales charge” returns for Class A, Class B and Class C shares do not include applicable initial or contingent deferred sales charges. If included, returns would be lower than those shown. The “With sales charge” returns for Class A, Class B and Class C shares include: the maximum initial sales charge of 4.75% for Class A shares; the applicable contingent deferred sales charge (CDSC) for Class B shares (applied as follows: first year 5%; second year 4%; third and fourth years 3%; fifth year 2%; sixth year 1%; no sales charge thereafter); and a 1% CDSC for Class C shares sold within one year after purchase. The Fund’s other share classes are not subject to sales charges and have limited eligibility. See the Fund’s prospectuses for details.
| ** | The returns shown for periods prior to the share class inception date (including returns since inception, which are since Fund inception) include the returns of the Fund’s Class A shares. These returns are adjusted to reflect any higher class-related operating expenses of the newer share class, as applicable. Please visit columbiamanagement.com/mutual-fund/appended-performance for more information. |
| | | | |
| COLUMBIA GLOBAL BOND FUND — 2012 SEMIANNUAL REPORT | | | 3 | |
| | |
| Your Fund at a Glance (continued) | | |
| | | | |
| PORTFOLIO BREAKDOWN(1) (at April 30, 2012) | |
Asset-Backed Securities — Non-Agency | | | 0.4 | % |
Commercial Mortgage-Backed Securities — Agency | | | 0.2 | |
Commercial Mortgage-Backed Securities — Non-Agency | | | 2.1 | |
Corporate Bonds & Notes | | | 24.8 | |
Foreign Government Obligations | | | 54.7 | |
Inflation-Indexed Bonds | | | 0.9 | |
Residential Mortgage-Backed Securities — Agency | | | 4.8 | |
Residential Mortgage-Backed Securities — Non-Agency | | | 0.2 | |
U.S. Treasury Obligations | | | 3.9 | |
Senior Loans | | | 0.1 | |
Other(2) | | | 7.9 | |
| (1) | | Percentages indicated are based upon total investments (excluding Investments of Cash Collateral Received for Securities on Loan). The Fund’s portfolio composition is subject to change. |
| (2) | | Includes investments in Money Market Funds. |
| | | | |
| QUALITY BREAKDOWN(1) (at April 30, 2012) | |
AAA rating | | | 45.1 | % |
AA rating | | | 17.0 | |
A rating | | | 10.0 | |
BBB rating | | | 20.8 | |
Non-investment grade | | | 6.9 | |
Not rated | | | 0.2 | |
| (1) | | Percentages indicated are based upon total fixed income securities (excluding Investments of Cash Collateral Received for Securities on Loan and Money Market Funds). |
Bond ratings apply to the underlying holdings of the Fund and not the Fund itself and are divided into categories ranging from AAA (highest) to D (lowest), and are subject to change. The ratings shown are determined by using the middle rating of Moody’s, S&P, and Fitch after dropping the highest and lowest available ratings. When a rating from only two agencies is available, the lower rating is used. When a rating from only one agency is available, that rating is used. When a bond is not rated by one of these agencies, it is designated as Not rated. Credit ratings are subjective to opinions and not statements of fact.
| | |
| 4 | | COLUMBIA GLOBAL BOND FUND — 2012 SEMIANNUAL REPORT |
| | | | |
| TOP TEN COUNTRIES(1) (at April 30, 2012) | |
United States | | | 31.1 | % |
Japan | | | 12.4 | |
Germany | | | 7.7 | |
Netherlands | | | 7.5 | |
Canada | | | 6.4 | |
United Kingdom | | | 6.0 | |
France | | | 5.7 | |
Brazil | | | 2.7 | |
Australia | | | 2.0 | |
Mexico | | | 2.0 | |
(1) Percentages indicated are based upon total investments (excluding Investments of Cash Collateral Received for Securities on Loan and Money Market Funds).
| | | | |
| COLUMBIA GLOBAL BOND FUND — 2012 SEMIANNUAL REPORT | | | 5 | |
(Unaudited)
Understanding your expenses
As an investor, you incur two types of costs. There are transaction costs, which generally include sales charges on purchases and may include redemption fees. There are also ongoing costs, which generally include management fees, distribution and service (Rule 12b-1) fees, and other fund expenses. The following information is intended to help you understand your ongoing costs (in dollars) of investing in the Fund and to help you compare these costs with the ongoing costs of investing in other mutual funds.
Analyzing your fund’s expenses
To illustrate these ongoing costs, we have provided examples and calculated the expenses paid by investors in each share class of the Fund during the period. The actual and hypothetical information in the table is based on an initial investment of $1,000 at the beginning of the period indicated and held for the entire period. Expense information is calculated two ways and each method provides you with different information. The amount listed in the “Actual” column is calculated using the Fund’s actual operating expenses and total return for the period. You may use the Actual information, together with the amount invested, to estimate the expenses that you paid over the period. Simply divide your account value by $1,000 (for example, an $8,600 account value divided by $1,000 = 8.6), then multiply the results by the expenses paid during the period under the Actual column. The amount listed in the “Hypothetical” column assumes a 5% annual rate of return before expenses (which is not the Fund’s actual return) and then applies the Fund’s actual expense ratio for the period to the hypothetical return. You should not use the hypothetical account values and expenses to estimate either your actual account balance at the end of the period or the expenses you paid during the period. See “Compare with other funds” below for details on how to use the hypothetical data.
Compare with other funds
Since all mutual funds are required to include the same hypothetical calculations about expenses in shareholder reports, you can use this information to compare the ongoing cost of investing in the Fund with other funds. To do so, compare the hypothetical example with the 5% hypothetical examples that appear in the shareholder reports of other funds. As you compare hypothetical examples of other funds, it is important to note that hypothetical examples are meant to highlight the ongoing costs of investing in a fund only and do not reflect any transaction costs, such as sales charges, or redemption or exchange fees. Therefore, the hypothetical calculations are useful in comparing ongoing costs only, and will not help you determine the relative total costs of owning different funds. If transaction costs were included in these calculations, your costs would be higher.
| | |
| 6 | | COLUMBIA GLOBAL BOND FUND — 2012 SEMIANNUAL REPORT |
November 1, 2011 — April 30, 2012
| | | | | | | | | | | | | | | | | | | | | | | | | | | | |
| | | Account value at the
beginning of the
period ($) | | | Account value at the
end of the period ($) | | | Expenses paid
during the period ($) | | | Fund’s
annualized
expense
ratio (%) | |
| | | Actual | | | Hypothetical | | | Actual | | | Hypothetical | | | Actual | | | Hypothetical | | | Actual | |
Class A | | | 1,000.00 | | | | 1,000.00 | | | | 1,022.70 | | | | 1,019.10 | | | | 5.83 | | | | 5.82 | | | | 1.16 | |
Class B | | | 1,000.00 | | | | 1,000.00 | | | | 1,019.10 | | | | 1,015.37 | | | | 9.59 | | | | 9.57 | | | | 1.91 | |
Class C | | | 1,000.00 | | | | 1,000.00 | | | | 1,019.50 | | | | 1,015.37 | | | | 9.59 | | | | 9.57 | | | | 1.91 | |
Class I | | | 1,000.00 | | | | 1,000.00 | | | | 1,023.70 | | | | 1,021.33 | | | | 3.57 | | | | 3.57 | | | | 0.71 | |
Class R | | | 1,000.00 | | | | 1,000.00 | | | | 1,020.50 | | | | 1,017.85 | | | | 7.08 | | | | 7.07 | | | | 1.41 | |
Class R4 | | | 1,000.00 | | | | 1,000.00 | | | | 1,022.30 | | | | 1,019.84 | | | | 5.08 | | | | 5.07 | | | | 1.01 | |
Class W | | | 1,000.00 | | | | 1,000.00 | | | | 1,021.10 | | | | 1,019.05 | | | | 5.88 | | | | 5.87 | | | | 1.17 | |
Class Z | | | 1,000.00 | | | | 1,000.00 | | | | 1,022.70 | | | | 1,020.44 | | | | 4.48 | | | | 4.47 | | | | 0.89 | |
Expenses paid during the period are equal to the annualized expense ratio for each class as indicated above, multiplied by the average account value over the period and then multiplied by the number of days in the Fund’s most recent fiscal half year and divided by 366.
Expenses do not include fees and expenses incurred indirectly by the Fund from the underlying funds in which the Fund may invest (also referred to as “acquired funds”), including affiliated and non-affiliated pooled investment vehicles (including mutual funds and exchange traded funds).
Had Columbia Management Investment Advisers, LLC and/or certain of its affiliates not waived/reimbursed certain fees and expenses, account value at the end of the period would have been reduced.
| | | | |
| COLUMBIA GLOBAL BOND FUND — 2012 SEMIANNUAL REPORT | | | 7 | |
Columbia Global Bond Fund
April 30, 2012 (Unaudited)
(Percentages represent value of investments compared to net assets)
| | | | | | | | | | | | |
| Issuer | | Coupon
Rate | | | Principal
Amount | | | Value | |
| Corporate Bonds & Notes(a) 23.9% | |
| | | | | | | | | | | | |
AUSTRALIA 0.6% | |
FMG Resources August 2006 Proprietary Ltd.(b) | |
11/01/19 | | | 8.250 | % | | | $40,000 | | | | $43,100 | |
FMG Resources August 2006 Proprietary Ltd.(b)(c)
Senior Unsecured | |
04/01/22 | | | 6.875 | % | | | 57,000 | | | | 57,855 | |
Westpac Banking Corp.
Senior Unsecured | |
09/24/12 | | | 7.250 | % | | | AUD 300,000 | | | | 316,130 | |
Woodside Finance Ltd.(b) | |
05/10/21 | | | 4.600 | % | | | $1,105,000 | | | | 1,166,345 | |
| | | | | | | | | | | | |
Total | | | | 1,583,430 | |
BERMUDA 0.1% | |
Bacardi Ltd.(b) | |
04/01/14 | | | 7.450 | % | | | 245,000 | | | | 273,534 | |
CANADA 2.6% | |
Bank of Montreal(b)(c) | |
10/31/14 | | | 1.300 | % | | �� | 830,000 | | | | 840,705 | |
Bank of Nova Scotia(b) | |
01/30/17 | | | 1.950 | % | | | 3,000,000 | | | | 3,067,470 | |
Cascades, Inc. | |
12/15/17 | | | 7.750 | % | | | 54,000 | | | | 53,460 | |
Novelis, Inc. | |
12/15/20 | | | 8.750 | % | | | 23,000 | | | | 25,358 | |
Royal Bank of Canada
Senior Unsecured | |
01/18/13 | | | 3.250 | % | | | EUR 480,000 | | | | 646,747 | |
Toronto-Dominion Bank (The)
Senior Unsecured | |
05/14/15 | | | 5.375 | % | | | EUR 350,000 | | | | 518,123 | |
Toronto-Dominion Bank (The)(b) | |
09/14/16 | | | 1.625 | % | | | $1,878,000 | | | | 1,900,220 | |
Videotron Ltee(b) | |
07/15/22 | | | 5.000 | % | | | 16,000 | | | | 15,960 | |
| | | | | | | | | | | | |
Total | | | | 7,068,043 | |
FRANCE 0.4% | |
Cie de Financement Foncier SA(b) | |
09/16/15 | | | 2.500 | % | | | 600,000 | | | | 607,559 | |
France Telecom SA
Senior Unsecured | |
02/21/17 | | | 4.750 | % | | | EUR 205,000 | | | | 303,680 | |
Veolia Environnement SA
Senior Unsecured | |
01/16/17 | | | 4.375 | % | | | EUR 110,000 | | | | 158,187 | |
| | | | | | | | | | | | |
Total | | | | 1,069,426 | |
| | | | | | | | | | | | |
| Issuer | | Coupon
Rate | | | Principal
Amount | | | Value | |
Corporate Bonds &
Notes(a) (continued) | |
| | | | | | | | | | | | |
GERMANY 0.3% | |
E.ON International Finance BV | |
05/29/12 | | | 6.375 | % | | | GBP 265,000 | | | | $431,602 | |
10/02/17 | | | 5.500 | % | | | EUR 275,000 | | | | 432,166 | |
| | | | | | | | | | | | |
Total | | | | 863,768 | |
IRELAND 0.1% | |
Ardagh Packaging Finance PLC
Senior Secured(b) | |
10/15/17 | | | 7.375 | % | | | $129,000 | | | | 139,643 | |
ITALY —% | |
Wind Acquisition Finance SA(b)
Secured | |
07/15/17 | | | 11.750 | % | | | 1,000 | | | | 983 | |
Senior Secured | |
02/15/18 | | | 7.250 | % | | | 17,000 | | | | 16,107 | |
| | | | | | | | | | | | |
Total | | | | 17,090 | |
JAPAN 0.1% | |
Bayer Holding Ltd. | |
06/28/12 | | | 1.955 | % | | | JPY 20,000,000 | | | | 251,002 | |
LUXEMBOURG 0.4% | |
ArcelorMittal
Senior Unsecured(c) | |
03/01/21 | | | 5.500 | % | | | 740,000 | | | | 728,879 | |
Calcipar SA
Senior Secured(b) | |
05/01/18 | | | 6.875 | % | | | 175,000 | | | | 179,375 | |
Intelsat Jackson Holdings SA(b) | |
10/15/20 | | | 7.250 | % | | | 212,000 | | | | 221,010 | |
| | | | | | | | | | | | |
Total | | | | | | | | | | | 1,129,264 | |
NETHERLANDS 1.2% | |
Allianz Finance II BV | |
11/23/16 | | | 4.000 | % | | | EUR 400,000 | | | | 582,822 | |
Cooperatieve Centrale Raiffeisen-Boerenleenbank BA
Senior Unsecured | |
07/03/14 | | | 6.750 | % | | | AUD 300,000 | | | | 323,592 | |
Deutsche Telekom International Finance BV | |
09/26/12 | | | 7.125 | % | | | GBP 405,000 | | | | 671,645 | |
01/19/15 | | | 4.000 | % | | | EUR 275,000 | | | | 388,450 | |
ING Groep NV
Senior Unsecured | |
05/31/17 | | | 4.750 | % | | | EUR 505,000 | | | | 712,917 | |
The accompanying Notes to Financial Statements are an integral part of this statement.
| | |
| 8 | | COLUMBIA GLOBAL BOND FUND — 2012 SEMIANNUAL REPORT |
| | | | | | | | | | | | |
| Issuer | | Coupon
Rate | | | Principal
Amount | | | Value | |
Corporate Bonds &
Notes(a) (continued) | |
| | | | | | | | | | | | |
NETHERLANDS (cont.) | |
LyondellBasell Industries NV(b) | |
11/15/21 | | | 6.000 | % | | | $277,000 | | | | $299,160 | |
NXP BV/Funding LLC
Senior Secured(b) | |
08/01/18 | | | 9.750 | % | | | 26,000 | | | | 29,510 | |
Schaeffler Finance BV
Senior Secured(b) | |
02/15/19 | | | 8.500 | % | | | 115,000 | | | | 121,613 | |
| | | | | | | | | | | | |
Total | | | | 3,129,709 | |
NEW ZEALAND 0.2% | |
ANZ National International Ltd.
Senior Unsecured(b) | |
08/10/15 | | | 3.125 | % | | | 475,000 | | | | 487,864 | |
SPAIN 0.5% | |
Telefonica Emisiones SAU | |
01/15/15 | | | 4.949 | % | | | 1,300,000 | | | | 1,303,845 | |
SUPRA-NATIONAL 0.2% | |
Council of Europe Development Bank
Senior Unsecured | |
09/16/14 | | | 5.750 | % | | | AUD 425,000 | | | | 454,583 | |
UNITED KINGDOM 0.6% | |
Ineos Finance PLC(b)
Senior Secured | |
05/15/15 | | | 9.000 | % | | | $137,000 | | | | 146,590 | |
02/15/19 | | | 8.375 | % | | | 16,000 | | | | 17,160 | |
Ineos Finance PLC(b)(d) | |
05/01/20 | | | 7.500 | % | | | 24,000 | | | | 24,660 | |
MetLife of Connecticut(e) | |
05/24/12 | | | 0.536 | % | | | JPY 100,000,000 | | | | 1,250,977 | |
SABMiller PLC
Senior Unsecured(b) | |
07/15/18 | | | 6.500 | % | | | $225,000 | | | | 274,237 | |
| | | | | | | | | | | | |
Total | | | | 1,713,624 | |
UNITED STATES 16.6% | |
ADS Tactical, Inc.
Senior Secured(b)(c) | |
04/01/18 | | | 11.000 | % | | | 150,000 | | | | 153,750 | |
AES Corp. (The)
Senior Unsecured(b) | |
07/01/21 | | | 7.375 | % | | | 68,000 | | | | 75,650 | |
AMC Networks, Inc.(b) | |
07/15/21 | | | 7.750 | % | | | 60,000 | | | | 67,050 | |
AMERIGROUP Corp.
Senior Unsecured | |
11/15/19 | | | 7.500 | % | | | 39,000 | | | | 42,510 | |
| | | | | | | | | | | | |
| Issuer | | Coupon
Rate | | | Principal
Amount | | | Value | |
Corporate Bonds &
Notes(a) (continued) | |
| | | | | | | | | | | | |
UNITED STATES (cont.) | |
ARAMARK Holdings Corp.
Senior Unsecured PIK(b) | |
05/01/16 | | | 8.625 | % | | | $53,000 | | | | $54,259 | |
Actuant Corp.(b) | |
06/15/22 | | | 5.625 | % | | | 36,000 | | | | 37,080 | |
Alliance Data Systems Corp.(b) | |
04/01/20 | | | 6.375 | % | | | 31,000 | | | | 31,504 | |
Ally Financial, Inc. | |
02/15/17 | | | 5.500 | % | | | 8,000 | | | | 8,176 | |
03/15/20 | | | 8.000 | % | | | 50,000 | | | | 57,276 | |
09/15/20 | | | 7.500 | % | | | 105,000 | | | | 117,075 | |
Alpha Natural Resources, Inc.(c) | |
06/01/19 | | | 6.000 | % | | | 24,000 | | | | 22,380 | |
06/01/21 | | | 6.250 | % | | | 6,000 | | | | 5,595 | |
Amkor Technology, Inc.
Senior Unsecured | |
06/01/21 | | | 6.625 | % | | | 164,000 | | | | 168,100 | |
Anixter, Inc. | |
05/01/19 | | | 5.625 | % | | | 18,000 | | | | 18,405 | |
Antero Resources Finance Corp. | |
12/01/17 | | | 9.375 | % | | | 5,000 | | | | 5,463 | |
Antero Resources Finance Corp.(b) | |
08/01/19 | | | 7.250 | % | | | 19,000 | | | | 19,570 | |
Appalachian Power Co.
Senior Unsecured | |
03/30/21 | | | 4.600 | % | | | 135,000 | | | | 149,932 | |
Arch Coal, Inc.(b)(c) | |
06/15/21 | | | 7.250 | % | | | 31,000 | | | | 27,668 | |
Atwood Oceanics, Inc.
Senior Unsecured | |
02/01/20 | | | 6.500 | % | | | 192,000 | | | | 202,080 | |
AutoNation, Inc. | |
02/01/20 | | | 5.500 | % | | | 19,000 | | | | 19,380 | |
Avis Budget Car Rental LLC/Finance, Inc. | |
03/15/20 | | | 9.750 | % | | | 97,000 | | | | 106,700 | |
BE Aerospace, Inc.
Senior Unsecured | |
04/01/22 | | | 5.250 | % | | | 64,000 | | | | 64,960 | |
Ball Corp. | |
09/15/20 | | | 6.750 | % | | | 94,000 | | | | 103,870 | |
Bank of America Corp.
Senior Unsecured | |
05/13/21 | | | 5.000 | % | | | 1,000,000 | | | | 995,320 | |
Best Buy Co., Inc.
Senior Unsecured(c) | |
03/15/21 | | | 5.500 | % | | | 180,000 | | | | 168,400 | |
Brocade Communications Systems, Inc.
Senior Secured | |
01/15/18 | | | 6.625 | % | | | 159,000 | | | | 166,950 | |
The accompanying Notes to Financial Statements are an integral part of this statement.
| | | | |
| COLUMBIA GLOBAL BOND FUND — 2012 SEMIANNUAL REPORT | | | 9 | |
| | |
| Portfolio of Investments (continued) | | |
| | | | | | | | | | | | |
| Issuer | | Coupon
Rate | | | Principal
Amount | | | Value | |
Corporate Bonds &
Notes(a) (continued) | |
| | | | | | | | | | | | |
UNITED STATES (cont.) | |
Building Materials Corp. of America
Senior Notes(b) | |
05/01/21 | | | 6.750 | % | | | $76,000 | | | | $79,135 | |
CC Holdings GS V LLC/Crown Castle GS III Corp.
Senior Secured(b) | |
05/01/17 | | | 7.750 | % | | | 65,000 | | | | 70,850 | |
CCO Holdings LLC/Capital Corp. | |
01/31/22 | | | 6.625 | % | | | 41,000 | | | | 42,896 | |
CF Industries, Inc. | |
05/01/20 | | | 7.125 | % | | | 56,000 | | | | 66,780 | |
CHS/Community Health Systems, Inc.(b)(c) | |
11/15/19 | | | 8.000 | % | | | 30,000 | | | | 31,725 | |
CIT Group, Inc.(b)
Senior Secured | |
04/01/18 | | | 6.625 | % | | | 115,000 | | | | 124,200 | |
Senior Unsecured | |
02/15/19 | | | 5.500 | % | | | 43,000 | | | | 44,183 | |
CMS Energy Corp.
Senior Unsecured | |
12/15/15 | | | 6.875 | % | | | 320,000 | | | | 356,627 | |
CNH Capital LLC(b) | |
11/01/16 | | | 6.250 | % | | | 109,000 | | | | 116,221 | |
CONSOL Energy, Inc. | |
04/01/20 | | | 8.250 | % | | | 51,000 | | | | 53,550 | |
03/01/21 | | | 6.375 | % | | | 70,000 | | | | 65,800 | |
CSC Holdings LLC
Senior Unsecured(b) | |
11/15/21 | | | 6.750 | % | | | 89,000 | | | | 92,337 | |
Cardtronics, Inc. | |
09/01/18 | | | 8.250 | % | | | 190,000 | | | | 209,950 | |
Carrizo Oil & Gas, Inc. | |
10/15/18 | | | 8.625 | % | | | 51,000 | | | | 54,060 | |
Case New Holland, Inc. | |
12/01/17 | | | 7.875 | % | | | 65,000 | | | | 75,725 | |
Celanese U.S. Holdings LLC | |
06/15/21 | | | 5.875 | % | | | 55,000 | | | | 58,988 | |
Chaparral Energy, Inc.(b)(d) | |
11/15/22 | | | 7.625 | % | | | 57,000 | | | | 57,214 | |
Chesapeake Energy Corp.(c) | |
08/15/20 | | | 6.625 | % | | | 142,000 | | | | 138,450 | |
Chester Downs & Marina LLC
Senior Secured(b)(c) | |
02/01/20 | | | 9.250 | % | | | 55,000 | | | | 57,888 | |
Chrysler Group LLC/Co-Issuer, Inc.
Secured | |
06/15/21 | | | 8.250 | % | | | 27,000 | | | | 27,945 | |
Cimarex Energy Co. | |
05/01/22 | | | 5.875 | % | | | 44,000 | | | | 45,540 | |
| | | | | | | | | | | | |
| Issuer | | Coupon
Rate | | | Principal
Amount | | | Value | |
Corporate Bonds &
Notes(a) (continued) | |
| | | | | | | | | | | | |
UNITED STATES (cont.) | |
Citigroup, Inc.
Senior Unsecured | |
08/02/19 | | | 5.000 | % | | | EUR 195,000 | | | | $271,523 | |
Cleveland Electric Illuminating Co. (The)
1st Mortgage | |
11/15/18 | | | 8.875 | % | | | $750,000 | | | | 1,001,167 | |
Colorado Interstate Gas Co. LLC
Senior Unsecured | |
11/15/15 | | | 6.800 | % | | | 1,920,000 | | | | 2,209,601 | |
Columbus McKinnon Corp. | |
02/01/19 | | | 7.875 | % | | | 55,000 | | | | 58,300 | |
Comcast Corp. | |
08/15/37 | | | 6.950 | % | | | 370,000 | | | | 470,408 | |
CommScope, Inc.(b)(c) | |
01/15/19 | | | 8.250 | % | | | 22,000 | | | | 23,485 | |
Concho Resources, Inc. | |
01/15/21 | | | 7.000 | % | | | 109,000 | | | | 118,537 | |
Continental Resources, Inc. | |
10/01/20 | | | 7.375 | % | | | 10,000 | | | | 11,150 | |
04/01/21 | | | 7.125 | % | | | 29,000 | | | | 32,299 | |
Continental Resources, Inc.(b) | |
09/15/22 | | | 5.000 | % | | | 47,000 | | | | 47,705 | |
Cott Beverages, Inc. | |
09/01/18 | | | 8.125 | % | | | 34,000 | | | | 36,805 | |
Crown Americas LLC/Capital Corp. III | |
02/01/21 | | | 6.250 | % | | | 100,000 | | | | 108,750 | |
DISH DBS Corp. | |
06/01/21 | | | 6.750 | % | | | 102,000 | | | | 111,690 | |
DPL, Inc.
Senior Unsecured(b) | |
10/15/16 | | | 6.500 | % | | | 60,000 | | | | 65,100 | |
Delphi Corp.(b) | |
05/15/21 | | | 6.125 | % | | | 43,000 | | | | 45,795 | |
Delphi Corp.(b)(c) | |
05/15/19 | | | 5.875 | % | | | 64,000 | | | | 67,520 | |
Duke Energy Corp.
Senior Unsecured | |
06/15/18 | | | 6.250 | % | | | 455,000 | | | | 553,771 | |
ERAC U.S.A. Finance LLC(b) | |
10/15/37 | | | 7.000 | % | | | 855,000 | | | | 995,769 | |
El Paso Corp.
Senior Unsecured | |
09/15/20 | | | 6.500 | % | | | 238,000 | | | | 262,990 | |
01/15/32 | | | 7.750 | % | | | 10,000 | | | | 11,426 | |
Embarq Corp.
Senior Unsecured | |
06/01/36 | | | 7.995 | % | | | 1,200,000 | | | | 1,204,476 | |
The accompanying Notes to Financial Statements are an integral part of this statement.
| | |
| 10 | | COLUMBIA GLOBAL BOND FUND — 2012 SEMIANNUAL REPORT |
| | | | | | | | | | | | |
| Issuer | | Coupon
Rate | | | Principal
Amount | | | Value | |
Corporate Bonds &
Notes(a) (continued) | |
| | | | | | | | | | | | |
UNITED STATES (cont.) | |
Endo Pharmaceuticals Holdings, Inc. | |
01/15/22 | | | 7.250 | % | | | $24,000 | | | | $25,740 | |
Enterprise Products Operating LLC | |
02/15/42 | | | 5.700 | % | | | 385,000 | | | | 425,909 | |
Equinix, Inc.
Senior Unsecured | |
07/15/21 | | | 7.000 | % | | | 120,000 | | | | 131,100 | |
Everest Acquisition LLC/Finance, Inc.
Senior Secured(b) | |
05/01/19 | | | 6.875 | % | | | 44,000 | | | | 46,200 | |
First Data Corp.
Senior Secured(b) | |
06/15/19 | | | 7.375 | % | | | 93,000 | | | | 95,557 | |
Fresenius Medical Care U.S. Finance II, Inc.(b) | |
01/31/22 | | | 5.875 | % | | | 20,000 | | | | 20,325 | |
Fresenius Medical Care U.S. Finance, Inc.(b) | |
09/15/18 | | | 6.500 | % | | | 16,000 | | | | 17,120 | |
Frontier Communications Corp.
Senior Unsecured | |
04/15/20 | | | 8.500 | % | | | 10,000 | | | | 10,400 | |
Frontier Communications Corp.(c)
Senior Unsecured | |
04/15/22 | | | 8.750 | % | | | 27,000 | | | | 28,350 | |
General Electric Capital Corp.
Senior Unsecured | |
05/17/12 | | | 6.125 | % | | | GBP 474,000 | | | | 770,888 | |
10/17/21 | | | 4.650 | % | | | 1,100,000 | | | | 1,195,991 | |
Goldman Sachs Group, Inc. (The)
Senior Unsecured | |
05/02/18 | | | 6.375 | % | | | EUR 350,000 | | | | 505,095 | |
06/15/20 | | | 6.000 | % | | | 1,410,000 | | | | 1,508,371 | |
Graphic Packaging International, Inc. | |
10/01/18 | | | 7.875 | % | | | 38,000 | | | | 42,180 | |
Greif, Inc.
Senior Unsecured | |
02/01/17 | | | 6.750 | % | | | 127,000 | | | | 137,160 | |
Grifols, Inc. | |
02/01/18 | | | 8.250 | % | | | 161,000 | | | | 172,471 | |
HCA, Inc.
Senior Secured | |
09/15/20 | | | 7.250 | % | | | 130,000 | | | | 143,975 | |
Healthsouth Corp. | |
09/15/22 | | | 7.750 | % | | | 63,000 | | | | 67,883 | |
Hexion US Finance Corp.
Senior Unsecured(b) | |
04/15/20 | | | 6.625 | % | | | 56,000 | | | | 58,520 | |
Huntington Ingalls Industries, Inc. | |
03/15/21 | | | 7.125 | % | | | 77,000 | | | | 81,524 | |
| | | | | | | | | | | | |
| Issuer | | Coupon
Rate | | | Principal
Amount | | | Value | |
Corporate Bonds &
Notes(a) (continued) | |
| | | | | | | | | | | | |
UNITED STATES (cont.) | |
Indiana Michigan Power Co.
Senior Unsecured | |
03/15/37 | | | 6.050 | % | | | $935,000 | | | | $1,087,188 | |
Interface, Inc. | |
12/01/18 | | | 7.625 | % | | | 43,000 | | | | 46,440 | |
Interline Brands, Inc. | |
11/15/18 | | | 7.000 | % | | | 73,000 | | | | 77,289 | |
International Lease Finance Corp.
Senior Unsecured | |
04/01/19 | | | 5.875 | % | | | 23,000 | | | | 22,589 | |
International Lease Finance Corp.(c)
Senior Unsecured | |
12/15/20 | | | 8.250 | % | | | 65,000 | | | | 72,800 | |
Ipalco Enterprises, Inc.
Senior Secured | |
05/01/18 | | | 5.000 | % | | | 60,000 | | | | 59,700 | |
JM Huber Corp.
Senior Unsecured(b) | |
11/01/19 | | | 9.875 | % | | | 80,000 | | | | 84,000 | |
JMC Steel Group
Senior Notes(b) | |
03/15/18 | | | 8.250 | % | | | 137,000 | | | | 141,795 | |
KB Home(c) | |
03/15/20 | | | 8.000 | % | | | 13,000 | | | | 12,691 | |
Kinder Morgan Energy Partners LP
Senior Unsecured | |
09/01/41 | | | 5.625 | % | | | 975,000 | | | | 1,025,126 | |
Kratos Defense & Security Solutions, Inc.
Senior Secured | |
06/01/17 | | | 10.000 | % | | | 55,000 | | | | 59,125 | |
Lamar Media Corp.(b) | |
02/01/22 | | | 5.875 | % | | | 63,000 | | | | 64,733 | |
Laredo Petroleum, Inc.(b) | |
05/01/22 | | | 7.375 | % | | | 20,000 | | | | 20,600 | |
Lear Corp. | |
03/15/18 | | | 7.875 | % | | | 99,000 | | | | 107,415 | |
Level 3 Financing, Inc.(c) | |
04/01/19 | | | 9.375 | % | | | 52,000 | | | | 56,680 | |
Limited Brands, Inc. | |
04/01/21 | | | 6.625 | % | | | 95,000 | | | | 102,600 | |
MGM Resorts International
Senior Secured | |
03/15/20 | | | 9.000 | % | | | 61,000 | | | | 68,167 | |
Manitowoc Co., Inc. (The)(c) | |
11/01/20 | | | 8.500 | % | | | 90,000 | | | | 99,900 | |
Marathon Petroleum Corp.
Senior Unsecured | |
03/01/41 | | | 6.500 | % | | | 395,000 | | | | 433,839 | |
The accompanying Notes to Financial Statements are an integral part of this statement.
| | | | |
| COLUMBIA GLOBAL BOND FUND — 2012 SEMIANNUAL REPORT | | | 11 | |
| | |
| Portfolio of Investments (continued) | | |
| | | | | | | | | | | | |
| Issuer | | Coupon
Rate | | | Principal
Amount | | | Value | |
Corporate Bonds &
Notes(a) (continued) | |
| | | | | | | | | | | | |
UNITED STATES (cont.) | |
MarkWest Energy Partners LP/Finance Corp. | |
06/15/22 | | | 6.250 | % | | | $113,000 | | | | $118,367 | |
Meritage Homes Corp.
Senior Unsecured(b) | |
04/01/22 | | | 7.000 | % | | | 22,000 | | | | 22,330 | |
MetroPCS Wireless, Inc. | |
11/15/20 | | | 6.625 | % | | | 48,000 | | | | 46,200 | |
Monaco SpinCo, Inc.(b)(d) | |
04/30/20 | | | 6.750 | % | | | 27,000 | | | | 27,810 | |
Morgan Stanley
Senior Unsecured | |
10/02/17 | | | 5.500 | % | | | EUR 395,000 | | | | 537,930 | |
Mylan, Inc.(b) | |
11/15/18 | | | 6.000 | % | | | $80,000 | | | | 84,000 | |
National CineMedia LLC
Senior Unsecured | |
07/15/21 | | | 7.875 | % | | | 97,000 | | | | 104,517 | |
National CineMedia LLC(b)
Senior Secured | |
04/15/22 | | | 6.000 | % | | | 68,000 | | | | 69,190 | |
Neuberger Berman Group LLC/Finance Corp.(b)
Senior Unsecured | |
03/15/20 | | | 5.625 | % | | | 30,000 | | | | 30,375 | |
03/15/22 | | | 5.875 | % | | | 45,000 | | | | 45,675 | |
Nevada Power Co. | |
05/15/18 | | | 6.500 | % | | | 365,000 | | | | 449,486 | |
News America, Inc. | |
02/15/41 | | | 6.150 | % | | | 840,000 | | | | 964,031 | |
Nextel Communications, Inc. | |
08/01/15 | | | 7.375 | % | | | 185,000 | | | | 179,450 | |
NiSource Finance Corp. | |
09/15/17 | | | 5.250 | % | | | 2,000,000 | | | | 2,241,356 | |
09/15/20 | | | 5.450 | % | | | 270,000 | | | | 304,445 | |
Northwest Pipeline GP
Senior Unsecured | |
04/15/17 | | | 5.950 | % | | | 460,000 | | | | 537,680 | |
Omnicare, Inc. | |
06/01/20 | | | 7.750 | % | | | 99,000 | | | | 109,395 | |
Oshkosh Corp. | |
03/01/17 | | | 8.250 | % | | | 146,000 | | | | 158,410 | |
PSS World Medical, Inc.(b) | |
03/01/22 | | | 6.375 | % | | | 11,000 | | | | 11,275 | |
Pacific Gas & Electric Co.
Senior Unsecured(c) | |
10/01/20 | | | 3.500 | % | | | 305,000 | | | | 324,072 | |
Peabody Energy Corp.(c) | |
09/15/20 | | | 6.500 | % | | | 150,000 | | | | 154,125 | |
Penn National Gaming, Inc.
Senior Subordinated Notes | |
08/15/19 | | | 8.750 | % | | | 43,000 | | | | 47,945 | |
| | | | | | | | | | | | |
| Issuer | | Coupon
Rate | | | Principal
Amount | | | Value | |
Corporate Bonds &
Notes(a) (continued) | |
| | | | | | | | | | | | |
UNITED STATES (cont.) | |
Phillips 66(b) | |
05/01/17 | | | 2.950 | % | | | $85,000 | | | | $87,220 | |
Physio-Control International, Inc.
Senior Secured(b) | |
01/15/19 | | | 9.875 | % | | | 62,000 | | | | 65,875 | |
Polypore International, Inc. | |
11/15/17 | | | 7.500 | % | | | 145,000 | | | | 152,250 | |
Prudential Financial, Inc.
Senior Unsecured | |
05/12/16 | | | 3.000 | % | | | 190,000 | | | | 195,964 | |
12/01/17 | | | 6.000 | % | | | 195,000 | | | | 229,313 | |
QEP Resources, Inc.
Senior Unsecured | |
10/01/22 | | | 5.375 | % | | | 57,000 | | | | 57,000 | |
Rain CII Carbon LLC/Corp.
Senior Secured(b) | |
12/01/18 | | | 8.000 | % | | | 164,000 | | | | 173,840 | |
Range Resources Corp. | |
05/15/19 | | | 8.000 | % | | | 65,000 | | | | 71,500 | |
Regency Energy Partners LP/Finance Corp. | |
06/01/16 | | | 9.375 | % | | | 3,000 | | | | 3,285 | |
07/15/21 | | | 6.500 | % | | | 94,000 | | | | 99,640 | |
Reynolds Group Issuer, Inc./LLC
Senior Secured(b) | |
08/15/19 | | | 7.875 | % | | | 83,000 | | | | 89,640 | |
SBA Telecommunications, Inc. | |
08/15/16 | | | 8.000 | % | | | 29,000 | | | | 31,066 | |
08/15/19 | | | 8.250 | % | | | 55,000 | | | | 60,638 | |
SM Energy Co.
Senior Unsecured | |
11/15/21 | | | 6.500 | % | | | 68,000 | | | | 71,740 | |
STHI Holding Corp.
Secured(b) | |
03/15/18 | | | 8.000 | % | | | 51,000 | | | | 54,315 | |
Sally Holdings LLC/Capital, Inc.(b)(c) | |
11/15/19 | | | 6.875 | % | | | 21,000 | | | | 22,418 | |
Southern Natural Gas Co. LLC
Senior Unsecured(b) | |
04/01/17 | | | 5.900 | % | | | 2,131,000 | | | | 2,430,934 | |
Southern Star Central Corp.
Senior Unsecured | |
03/01/16 | | | 6.750 | % | | | 138,000 | | | | 139,380 | |
Spectrum Brands, Inc.
Senior Secured | |
06/15/18 | | | 9.500 | % | | | 41,000 | | | | 46,433 | |
Spectrum Brands, Inc.(b)(c)
Senior Unsecured | |
03/15/20 | | | 6.750 | % | | | 18,000 | | | | 18,405 | |
The accompanying Notes to Financial Statements are an integral part of this statement.
| | |
| 12 | | COLUMBIA GLOBAL BOND FUND — 2012 SEMIANNUAL REPORT |
| | | | | | | | | | | | |
| Issuer | | Coupon
Rate | | | Principal
Amount | | | Value | |
Corporate Bonds &
Notes(a) (continued) | |
| | | | | | | | | | | | |
UNITED STATES (cont.) | |
Sprint Nextel Corp.(b) | |
11/15/18 | | | 9.000 | % | | | $115,000 | | | | $126,787 | |
03/01/20 | | | 7.000 | % | | | 35,000 | | | | 35,700 | |
Synovus Financial Corp.
Senior Unsecured | |
02/15/19 | | | 7.875 | % | | | 53,000 | | | | 56,048 | |
Tampa Electric Co.
Senior Unsecured | |
05/15/18 | | | 6.100 | % | | | 620,000 | | | | 753,530 | |
Taylor Morrison Communities, Inc./Monarch
Senior Unsecured(b) | |
04/15/20 | | | 7.750 | % | | | 93,000 | | | | 95,790 | |
Terex Corp. | |
04/01/20 | | | 6.500 | % | | | 50,000 | | | | 51,375 | |
Time Warner Cable, Inc. | |
07/01/18 | | | 6.750 | % | | | 1,000,000 | | | | 1,220,727 | |
Time Warner, Inc. | |
03/29/41 | | | 6.250 | % | | | 250,000 | | | | 290,726 | |
Toledo Edison Co. (The)
Senior Secured | |
05/15/37 | | | 6.150 | % | | | 1,600,000 | | | | 1,923,546 | |
Tomkins LLC/Inc.
Secured | |
10/01/18 | | | 9.000 | % | | | 149,000 | | | | 165,762 | |
TransDigm, Inc. | |
12/15/18 | | | 7.750 | % | | | 24,000 | | | | 26,160 | |
Transcontinental Gas Pipe Line Co. LLC
Senior Unsecured | |
04/15/16 | | | 6.400 | % | | | 3,255,000 | | | | 3,815,107 | |
UPCB Finance VI Ltd.
Senior Secured(b) | |
01/15/22 | | | 6.875 | % | | | 83,000 | | | | 85,291 | |
UR Financing Escrow Corp.(b)
Secured | |
07/15/18 | | | 5.750 | % | | | 49,000 | | | | 50,715 | |
Senior Unsecured | |
05/15/20 | | | 7.375 | % | | | 41,000 | | | | 42,948 | |
04/15/22 | | | 7.625 | % | | | 103,000 | | | | 108,665 | |
United States Cellular Corp.
Senior Unsecured | |
12/15/33 | | | 6.700 | % | | | 165,000 | | | | 164,257 | |
Univision Communications, Inc.
Senior Secured (b) | |
05/15/19 | | | 6.875 | % | | | 37,000 | | | | 37,416 | |
Vail Resorts, Inc. | |
05/01/19 | | | 6.500 | % | | | 86,000 | | | | 90,730 | |
Verizon New York, Inc.
Senior Unsecured | |
04/01/32 | | | 7.375 | % | | | 1,235,000 | | | | 1,520,043 | |
| | | | | | | | | | | | |
| Issuer | | Coupon
Rate | | | Principal
Amount | | | Value | |
Corporate Bonds &
Notes(a) (continued) | |
| | | | | | | | | | | | |
UNITED STATES (cont.) | |
Visteon Corp. | |
04/15/19 | | | 6.750 | % | | | $91,000 | | | | $93,730 | |
Wells Fargo & Co.
Senior Unsecured | |
11/03/16 | | | 4.125 | % | | | EUR 330,000 | | | | 474,762 | |
Whiting Petroleum Corp. | |
10/01/18 | | | 6.500 | % | | | 5,000 | | | | 5,325 | |
Windstream Corp. | |
03/15/19 | | | 7.000 | % | | | 40,000 | | | | 40,800 | |
10/15/20 | | | 7.750 | % | | | 100,000 | | | | 107,000 | |
WireCo WorldGroup, Inc. | |
05/15/17 | | | 9.500 | % | | | 104,000 | | | | 107,380 | |
tw telecom holdings, inc. | |
03/01/18 | | | 8.000 | % | | | 106,000 | | | | 116,070 | |
| | | | | | | | | | | | |
Total | | | | 43,870,180 | |
Total Corporate Bonds & Notes | |
(Cost: $58,976,941) | | | | $63,355,005 | |
| | | | | | | | | | | | |
Residential Mortgage-Backed
Securities - Agency 4.6% | |
| | | | | | | | | | | | |
UNITED STATES 4.6% | |
Federal Home Loan Mortgage Corp.(d)(f) | |
04/01/42 | | | 3.500 | % | | | $2,640,000 | | | | $2,750,498 | |
Federal Home Loan Mortgage Corp.(f) | |
10/01/18 | | | 5.000 | % | | | 234,639 | | | | 255,881 | |
09/01/17-08/01/33 | | | 6.500 | % | | | 168,405 | | | | 189,479 | |
Federal National Mortgage Association(f) | |
08/01/18 | | | 4.500 | % | | | 472,102 | | | | 506,956 | |
12/01/18- 06/01/33 | | | 5.000 | % | | | 2,120,736 | | | | 2,334,515 | |
11/01/18- 06/01/33 | | | 5.500 | % | | | 1,217,949 | | | | 1,354,141 | |
03/01/17- 04/01/33 | | | 6.000 | % | | | 526,497 | | | | 583,524 | |
04/01/17- 11/01/33 | | | 6.500 | % | | | 964,932 | | | | 1,097,576 | |
05/01/32- 06/01/32 | | | 7.000 | % | | | 570,563 | | | | 673,852 | |
05/01/32- 11/01/32 | | | 7.500 | % | | | 367,458 | | | | 449,545 | |
Federal National Mortgage Association(f)(g) | |
09/01/40 | | | 4.500 | % | | | 418,123 | | | | 457,086 | |
01/01/37 | | | 5.500 | % | | | 906,418 | | | | 1,009,700 | |
The accompanying Notes to Financial Statements are an integral part of this statement.
| | | | |
| COLUMBIA GLOBAL BOND FUND — 2012 SEMIANNUAL REPORT | | | 13 | |
| | |
| Portfolio of Investments (continued) | | |
| | | | | | | | | | | | |
| Issuer | | Coupon
Rate | | | Principal
Amount | | | Value | |
Residential Mortgage-Backed
Securities - Agency (continued) | |
| | | | | | | | | | | | |
UNITED STATES (cont.) | |
Government National Mortgage Association(f) | |
10/15/33 | | | 5.500 | % | | | $540,198 | | | | $609,148 | |
| | | | | | | | | | | | |
Total | | | | 12,271,901 | |
Total Residential Mortgage-Backed Securities - Agency | |
(Cost: $11,394,101) | | | | $12,271,901 | |
| | | | | | | | | | | | |
Residential Mortgage-Backed
Securities - Non-Agency 0.2% | |
| | | | | | | | | | | | |
UNITED STATES 0.2% | |
Harborview Mortgage Loan Trust CMO
Series 2004-1 Class 4A(e)(f) | |
04/19/34 | | | 4.676 | % | | | $611,905 | | | | $589,898 | |
Total Residential Mortgage-Backed Securities - Non-Agency | |
(Cost: $549,944) | | | | $589,898 | |
| | | | | | | | | | | | |
Commercial Mortgage-Backed
Securities - Agency 0.2% | |
| | | | | | | | | | | | |
UNITED STATES 0.2% | |
Federal National Mortgage Association(f) | |
09/01/13 | | | 5.322 | % | | | $579,048 | | | | $602,488 | |
Total Commercial Mortgage-Backed Securities - Agency | |
(Cost: $582,618) | | | | $602,488 | |
| | | | | | | | | | | | |
Commercial Mortgage-Backed
Securities - Non-Agency 2.0% | |
| | | | | | | | | | | | |
UNITED STATES 2.0% | |
Citigroup/Deutsche Bank Commercial Mortgage Trust
Series 2007-CD4 Class A4(f) | |
12/11/49 | | | 5.322 | % | | | $250,000 | | | | $277,323 | |
Credit Suisse First Boston Mortgage Securities Corp.
Series 2004-C2 Class A1(f) | |
05/15/36 | | | 3.819 | % | | | 297,267 | | | | 301,558 | |
GS Mortgage Securities Corp. II
Series 2007-GG10 Class F(e)(f)(h) | |
08/10/45 | | | 5.980 | % | | | 775,000 | | | | 75,872 | |
General Electric Capital Assurance Co. Series 2003-1 Class A4(b)(e)(f) | |
05/12/35 | | | 5.254 | % | | | 217,951 | | | | 233,221 | |
Greenwich Capital Commercial Funding Corp.
Series 2007-GG9 Class A4(f) | |
03/10/39 | | | 5.444 | % | | | 800,000 | | | | 885,274 | |
| | | | | | | | | | | | |
| Issuer | | Coupon
Rate | | | Principal
Amount | | | Value | |
Commercial Mortgage-Backed
Securities - Non-Agency (continued) | |
| | | | | | | | | | | | |
UNITED STATES 2.0% | |
JPMorgan Chase Commercial Mortgage Securities Corp.(e)(f)
Series 2005-LDP3 Class ASB | |
08/15/42 | | | 4.893 | % | | | $719,678 | | | | $757,030 | |
JPMorgan Chase Commercial Mortgage Securities Corp.(f)
Series 2003-LN1 Class A1 | |
10/15/37 | | | 4.134 | % | | | 51,310 | | | | 52,135 | |
Series 2003-ML1A Class A1 | |
03/12/39 | | | 3.972 | % | | | 21,565 | | | | 21,578 | |
LB-UBS Commercial Mortgage Trust(e)(f)
Series 2007-C7 Class A3 | |
09/15/45 | | | 5.866 | % | | | 835,000 | | | | 958,254 | |
LB-UBS Commercial Mortgage Trust (f)
Series 2004-C2 Class A3 | |
03/15/29 | | | 3.973 | % | | | 285,991 | | | | 290,694 | |
Morgan Stanley Capital I
Series 2011-C1 Class A4(b)(e)(f) | |
09/15/47 | | | 5.033 | % | | | 750,000 | | | | 865,609 | |
Wachovia Bank Commercial Mortgage Trust
Series 2006-C27 Class APB(f) | |
07/15/45 | | | 5.727 | % | | | 526,273 | | | | 534,619 | |
| | | | | | | | | | | | |
Total | | | | 5,253,167 | |
Total Commercial Mortgage-Backed Securities - Non-Agency | |
(Cost: $5,515,259) | | | | $5,253,167 | |
| | | | | | | | | | | | |
Asset-Backed Securities -
Non-Agency(a) 0.4% | |
| | | | | | | | | | | | |
DENMARK 0.2% | |
Nykredit Realkredit A/S Mortgage | |
04/01/28 | | | 5.000 | % | | | DKK 2,632,084 | | | | $493,595 | |
UNITED STATES 0.2% | |
GTP Towers Issuer LLC(b) | |
02/15/15 | | | 4.436 | % | | | $450,000 | | | | 464,406 | |
Total Asset-Backed Securities - Non-Agency | |
(Cost: $946,368) | | | | $958,001 | |
| | | | | | | | | | | | |
| Inflation-Indexed Bonds(a) 0.9% | |
| | | | | | | | | | | | |
JAPAN 0.9% | |
Japanese Government CPI-Linked Bond
Senior Unsecured | |
03/10/18 | | | 1.400 | % | | | JPY 167,450,000 | | | | $2,287,966 | |
Total Inflation-Indexed Bonds | |
(Cost: $1,547,331) | | | | $2,287,966 | |
The accompanying Notes to Financial Statements are an integral part of this statement.
| | |
| 14 | | COLUMBIA GLOBAL BOND FUND — 2012 SEMIANNUAL REPORT |
| | | | | | | | | | | | |
| Issuer | | Coupon
Rate | | | Principal
Amount | | | Value | |
| U.S. Treasury Obligations 3.7% | |
| | | | | | | | | | | | |
UNITED STATES 3.7% | |
U.S. Treasury | |
03/15/14 | | | 1.250 | % | | | $235,000 | | | | $239,370 | |
11/15/41 | | | 3.125 | % | | | 2,865,000 | | | | 2,873,953 | |
U.S. Treasury(c) | |
03/31/17 | | | 1.000 | % | | | 5,405,000 | | | | 5,459,050 | |
02/15/22 | | | 2.000 | % | | | 1,250,000 | | | | 1,259,375 | |
| | | | | | | | | | | | |
Total | | | | 9,831,748 | |
Total U.S. Treasury Obligations | |
(Cost: $9,707,773) | | | | $9,831,748 | |
| | | | | | | | | | | | |
Foreign Government
Obligations(a) 52.7% | |
| | | | | | | | | | | | |
ARGENTINA 0.3% | |
Argentina Bonar Bonds
Senior Unsecured | |
09/12/13 | | | 7.000 | % | | | $383,000 | | | | $381,278 | |
Argentina Republic Government International Bond
Senior Unsecured(e) | |
12/15/35 | | | 4.383 | % | | | 2,900,000 | | | | 348,000 | |
| | | | | | | | | | | | |
Total | | | | 729,278 | |
AUSTRALIA 1.2% | |
New South Wales Treasury Corp.
Local Government Guaranteed | |
05/01/12 | | | 6.000 | % | | | AUD 3,090,000 | | | | 3,219,760 | |
BELGIUM 0.4% | |
Belgium Government Bond | |
03/28/14 | | | 4.000 | % | | | EUR 750,000 | | | | 1,046,256 | |
BRAZIL 2.4% | |
Banco Nacional de Desenvolvimento Economico e Social
Senior Unsecured(b) | |
06/10/19 | | | 6.500 | % | | | 210,000 | | | | 247,828 | |
Brazil Notas do Tesouro Nacional | |
01/01/13 | | | 10.000 | % | | | BRL 5,870,000 | | | | 3,210,640 | |
01/01/17 | | | 10.000 | % | | | BRL 3,908,000 | | | | 2,108,946 | |
Brazilian Government International Bond
Senior Unsecured | |
01/22/21 | | | 4.875 | % | | | 300,000 | | | | 344,172 | |
01/07/41 | | | 5.625 | % | | | 270,000 | | | | 321,300 | |
Petrobras International Finance Co. | |
01/27/21 | | | 5.375 | % | | | 100,000 | | | | 109,043 | |
| | | | | | | | | | | | |
Total | | | | 6,341,929 | |
CANADA 3.0% | |
Bank of Montreal(b) | |
01/30/17 | | | 1.950 | % | | | 810,000 | | | | 826,766 | |
| | | | | | | | | | | | |
| Issuer | | Coupon
Rate | | | Principal
Amount | | | Value | |
Foreign Government
Obligations(a) (continued) | |
| | | | | | | | | | | | |
CANADA (cont.) | |
Canadian Government Bond | |
06/01/18 | | | 4.250 | % | | | CAD 180,000 | | | | $208,478 | |
06/01/19 | | | 3.750 | % | | | CAD 1,195,000 | | | | 1,363,160 | |
National Bank of Canada(b) | |
10/19/16 | | | 2.200 | % | | | $1,000,000 | | | | 1,036,915 | |
Province of British Columbia | |
06/18/14 | | | 5.300 | % | | | CAD 1,070,000 | | | | 1,169,109 | |
Province of Ontario | |
03/08/14 | | | 5.000 | % | | | CAD 1,490,000 | | | | 1,602,537 | |
Province of Quebec | |
12/01/17 | | | 4.500 | % | | | CAD 1,628,000 | | | | 1,834,679 | |
| | | | | | | | | | | | |
Total | | | | 8,041,644 | |
COLOMBIA 0.5% | |
Colombia Government International Bond
Senior Unsecured | |
01/18/41 | | | 6.125 | % | | | 235,000 | | | | 295,973 | |
Corp. Andina de Fomento
Senior Unsecured | |
06/04/19 | | | 8.125 | % | | | 730,000 | | | | 912,677 | |
| | | | | | | | | | | | |
Total | | | | 1,208,650 | |
CZECH REPUBLIC 0.2% | |
Czech Republic Government Bond | |
06/16/13 | | | 3.700 | % | | | CZK 7,230,000 | | | | 394,094 | |
DENMARK 0.2% | |
Nordea Kredit Realkreditaktieselsk | |
01/01/13 | | | 2.000 | % | | | DKK 3,000,000 | | | | 538,666 | |
FINLAND 0.8% | |
Finland Government Bond
Senior Unsecured | |
04/15/21 | | | 3.500 | % | | | EUR 1,380,000 | | | | 2,036,778 | |
FRANCE 4.7% | |
Electricite de France SA
Senior Unsecured | |
02/05/18 | | | 5.000 | % | | | EUR 350,000 | | | | 532,196 | |
France Government Bond OAT | |
04/25/13 | | | 4.000 | % | | | EUR 3,620,000 | | | | 4,967,415 | |
10/25/16 | | | 5.000 | % | | | EUR 1,305,000 | | | | 1,981,361 | |
10/25/17 | | | 4.250 | % | | | EUR 1,500,000 | | | | 2,224,400 | |
10/25/19 | | | 3.750 | % | | | EUR 975,000 | | | | 1,401,342 | |
France Government Bond OAT(c) | |
10/25/21 | | | 3.250 | % | | | EUR 630,000 | | | | 858,799 | |
French Treasury Note BTAN | |
01/12/14 | | | 2.500 | % | | | EUR 300,000 | | | | 410,315 | |
| | | | | | | | | | | | |
Total | | | | 12,375,828 | |
The accompanying Notes to Financial Statements are an integral part of this statement.
| | | | |
| COLUMBIA GLOBAL BOND FUND — 2012 SEMIANNUAL REPORT | | | 15 | |
| | |
| Portfolio of Investments (continued) | | |
| | | | | | | | | | | | |
Issuer | | Coupon
Rate | | | Principal
Amount | | | Value | |
Foreign Government
Obligations(a) (continued) | |
| | | | | | | | | | | | |
GERMANY 6.5% | |
Bayerische Landesbank
Senior Unsecured | |
04/22/13 | | | 1.400 | % | | | JPY 82,000,000 | | | | $1,035,119 | |
Bundesrepublik Deutschland | |
07/04/14 | | | 4.250 | % | | | EUR 1,615,000 | | | | 2,329,156 | |
01/04/15 | | | 3.750 | % | | | EUR 900,000 | | | | 1,305,120 | |
07/04/19 | | | 3.500 | % | | | EUR 1,940,000 | | | | 2,989,548 | |
07/04/27 | | | 6.500 | % | | | EUR 2,045,001 | | | | 4,178,210 | |
07/04/28 | | | 4.750 | % | | | EUR 1,035,000 | | | | 1,804,044 | |
07/04/34 | | | 4.750 | % | | | EUR 1,960,000 | | | | 3,620,559 | |
| | | | | | | | | | | | |
Total | | | | 17,261,756 | |
GREECE 0.1% | |
Hellenic Republic Government Bond(e)
Government Guaranteed | |
10/15/42 | | | 0.000 | % | | | EUR 488,200 | | | | 3,328 | |
Senior Unsecured | | | | | | | | | | | | |
02/24/23 | | | 2.000 | % | | | EUR 23,250 | | | | 7,400 | |
02/24/24 | | | 2.000 | % | | | EUR 23,250 | | | | 6,730 | |
02/24/25 | | | 2.000 | % | | | EUR 23,250 | | | | 6,417 | |
02/24/26 | | | 2.000 | % | | | EUR 23,250 | | | | 6,015 | |
02/24/27 | | | 2.000 | % | | | EUR 23,250 | | | | 5,775 | |
02/24/28 | | | 2.000 | % | | | EUR 24,800 | | | | 6,062 | |
02/24/29 | | | 2.000 | % | | | EUR 24,800 | | | | 5,920 | |
02/24/30 | | | 2.000 | % | | | EUR 24,800 | | | | 5,838 | |
02/24/31 | | | 2.000 | % | | | EUR 24,800 | | | | 5,832 | |
02/24/32 | | | 2.000 | % | | | EUR 24,800 | | | | 5,846 | |
02/24/33 | | | 2.000 | % | | | EUR 24,800 | | | | 5,829 | |
02/24/34 | | | 2.000 | % | | | EUR 24,800 | | | | 5,815 | |
02/24/35 | | | 2.000 | % | | | EUR 24,800 | | | | 5,811 | |
02/24/36 | | | 2.000 | % | | | EUR 24,800 | | | | 5,863 | |
02/24/37 | | | 2.000 | % | | | EUR 24,800 | | | | 5,806 | |
02/24/38 | | | 2.000 | % | | | EUR 24,800 | | | | 5,803 | |
02/24/39 | | | 2.000 | % | | | EUR 24,800 | | | | 5,810 | |
02/24/40 | | | 2.000 | % | | | EUR 24,800 | | | | 5,788 | |
02/24/41 | | | 2.000 | % | | | EUR 24,800 | | | | 5,809 | |
02/24/42 | | | 2.000 | % | | | EUR 24,800 | | | | 5,813 | |
| | | | | | | | | | | | |
Total | | | | 123,310 | |
INDONESIA 1.7% | |
Indonesia Government International Bond(b)
Senior Unsecured | |
01/17/18 | | | 6.875 | % | | | $500,000 | | | | 590,000 | |
10/12/35 | | | 8.500 | % | | | 190,000 | | | | 275,975 | |
01/17/38 | | | 7.750 | % | | | 140,000 | | | | 189,700 | |
| | | | | | | | | | | | |
| Issuer | | Coupon
Rate | | | Principal
Amount | | | Value | |
Foreign Government
Obligations(a) (continued) | |
| | | | | | | | | | | | |
INDONESIA (cont.) | |
Indonesia Treasury Bond
Senior Unsecured | |
05/15/16 | | | 10.750 | % | | | IDR 3,620,000,000 | | | | $473,685 | |
11/15/20 | | | 11.000 | % | | | IDR 10,840,000,000 | | | | 1,579,762 | |
07/15/22 | | | 10.250 | % | | | IDR 10,594,000,000 | | | | 1,496,529 | |
| | | | | | | | | | | | |
Total | | | | 4,605,651 | |
ITALY —% | |
Italy Buoni Poliennali Del Tesoro | |
11/01/26 | | | 7.250 | % | | | EUR 283 | | | | 421 | |
JAPAN 10.0% | |
Development Bank of Japan
Government Guaranteed | |
06/20/12 | | | 1.400 | % | | | JPY 212,000,000 | | | | 2,659,600 | |
Japan Government 10-Year Bond
Senior Unsecured | |
12/20/12 | | | 1.000 | % | | | JPY 130,000,000 | | | | 1,637,362 | |
09/20/17 | | | 1.700 | % | | | JPY 392,000,000 | | | | 5,274,732 | |
Japan Government 20-Year Bond
Senior Unsecured | |
03/20/20 | | | 2.400 | % | | | JPY 111,000,000 | | | | 1,579,564 | |
12/20/22 | | | 1.400 | % | | | JPY 424,000,000 | | | | 5,538,192 | |
12/20/26 | | | 2.100 | % | | | JPY 366,000,000 | | | | 5,017,766 | |
09/20/29 | | | 2.100 | % | | | JPY 146,000,000 | | | | 1,972,858 | |
Japan Government 30-Year Bond
Senior Unsecured | |
12/20/34 | | | 2.400 | % | | | JPY 144,000,000 | | | | 2,013,738 | |
03/20/39 | | | 2.300 | % | | | JPY 64,500,000 | | | | 884,051 | |
| | | | | | | | | | | | |
Total | | | | 26,577,863 | |
KAZAKHSTAN 0.1% | |
KazMunayGas National Co.
Senior Unsecured(b) | |
07/02/18 | | | 9.125 | % | | | $250,000 | | | | 310,938 | |
LITHUANIA 0.1% | |
Lithuania Government International Bond
Senior Unsecured(b)(c) | |
09/14/17 | | | 5.125 | % | | | 210,000 | | | | 219,262 | |
MALAYSIA 0.7% | |
Petronas Capital Ltd.(b) | |
08/12/19 | | | 5.250 | % | | | 1,620,000 | | | | 1,835,120 | |
MEXICO 1.8% | |
Mexican Bonos | |
12/19/13 | | | 8.000 | % | | | MXN 2,007,600 | | | | 1,621,626 | |
12/17/15 | | | 8.000 | % | | | MXN 2,668,260 | | | | 2,248,562 | |
The accompanying Notes to Financial Statements are an integral part of this statement.
| | |
| 16 | | COLUMBIA GLOBAL BOND FUND — 2012 SEMIANNUAL REPORT |
| | | | | | | | | | | | |
| Issuer | | Coupon
Rate | | | Principal
Amount | | | Value | |
Foreign Government
Obligations(a) (continued) | |
| | | | | | | | | | | | |
MEXICO (cont.) | |
Mexican Government International Bond
Senior Unsecured | |
09/27/34 | | | 6.750 | % | | | $270,000 | | | | $359,775 | |
Pemex Project Funding Master Trust(b) | |
01/24/22 | | | 4.875 | % | | | 500,000 | | | | 533,064 | |
| | | | | | | | | | | | |
Total | | | | 4,763,027 | |
NETHERLANDS 5.5% | |
Bank Nederlandse Gemeenten(b) | |
03/23/15 | | | 1.375 | % | | | 960,000 | | | | 958,695 | |
Netherlands Government Bond | |
07/15/12 | | | 5.000 | % | | | EUR 2,185,000 | | | | 2,919,970 | |
07/15/13 | | | 4.250 | % | | | EUR 1,505,000 | | | | 2,090,110 | |
07/15/16 | | | 4.000 | % | | | EUR 2,030,000 | | | | 3,014,402 | |
07/15/20 | | | 3.500 | % | | | EUR 3,705,000 | | | | 5,469,139 | |
| | | | | | | | | | | | |
Total | | | | 14,452,316 | |
NEW ZEALAND 0.9% | |
New Zealand Government Bond
Senior Unsecured | |
04/15/13 | | | 6.500 | % | | | NZD 2,900,000 | | | | 2,460,096 | |
NORWAY 1.1% | | | | | | | | | | | | |
Norway Government Bond | |
05/15/13 | | | 6.500 | % | | | NOK 15,750,000 | | | | 2,888,305 | |
PERU 0.1% | |
Peruvian Government International Bond
Senior Unsecured | |
07/21/25 | | | 7.350 | % | | | 150,000 | | | | 207,750 | |
PHILIPPINES 0.1% | |
Power Sector Assets & Liabilities Management Corp.
Government Guaranteed(b) | |
05/27/19 | | | 7.250 | % | | | 290,000 | | | | 356,700 | |
POLAND 1.5% | |
Poland Government Bond | |
04/25/13 | | | 5.250 | % | | | PLN 3,590,000 | | | | 1,144,638 | |
10/25/17 | | | 5.250 | % | | | PLN 8,585,000 | | | | 2,760,652 | |
| | | | | | | | | | | | |
Total | | | | 3,905,290 | |
RUSSIAN FEDERATION 0.7% | |
AK Transneft OJSC Via TransCapitalInvest Ltd.
Senior Unsecured(b) | |
08/07/18 | | | 8.700 | % | | | $100,000 | | | | 123,500 | |
Gazprom OAO Via Gaz Capital SA(b)
Senior Unsecured | |
11/22/16 | | | 6.212 | % | | | 100,000 | | | | 109,125 | |
| | | | | | | | | | | | |
| Issuer | | Coupon
Rate | | | Principal
Amount | | | Value | |
Foreign Government
Obligations(a) (continued) | |
| | | | | | | | | | | | |
RUSSIAN FEDERATION (cont.) | |
Gazprom OAO Via Gaz Capital SA (b)(c)
Senior Unsecured | |
08/16/37 | | | 7.288 | % | | | $230,000 | | | | $265,363 | |
Russian Foreign Bond — Eurobond
Senior Unsecured(b)(e) | |
03/31/30 | | | 7.500 | % | | | 1,122,975 | | | | 1,346,166 | |
| | | | | | | | | | | | |
Total | | | | 1,844,154 | |
SOUTH AFRICA 0.5% | |
South Africa Government Bond
Senior Unsecured | |
12/21/14 | | | 8.750 | % | | | ZAR 9,575,000 | | | | 1,318,613 | |
SOUTH KOREA 0.5% | |
Export-Import Bank of Korea
Senior Unsecured | |
01/21/14 | | | 8.125 | % | | | 360,000 | | | | 395,669 | |
01/14/15 | | | 5.875 | % | | | 450,000 | | | | 491,707 | |
04/11/22 | | | 5.000 | % | | | 500,000 | | | | 537,052 | |
| | | | | | | | | | | | |
Total | | | | 1,424,428 | |
SWEDEN 1.2% | |
Sweden Government Bond | |
05/05/14 | | | 6.750 | % | | | SEK 19,480,000 | | | | 3,216,766 | |
TURKEY 0.2% | |
Turkey Government International Bond
Senior Unsecured | |
03/17/36 | | | 6.875 | % | | | 540,000 | | | | 611,550 | |
UNITED KINGDOM 4.7% | |
United Kingdom Gilt | |
09/07/16 | | | 4.000 | % | | | GBP 1,070,000 | | | | 1,963,498 | |
03/07/19 | | | 4.500 | % | | | GBP 1,170,000 | | | | 2,271,176 | |
09/07/21 | | | 3.750 | % | | | GBP 190,000 | | | | 353,894 | |
03/07/25 | | | 5.000 | % | | | GBP 500,000 | | | | 1,039,192 | |
12/07/27 | | | 4.250 | % | | | GBP 840,000 | | | | 1,620,342 | |
03/07/36 | | | 4.250 | % | | | GBP 665,000 | | | | 1,259,028 | |
12/07/38 | | | 4.750 | % | | | GBP 795,000 | | | | 1,626,304 | |
12/07/40 | | | 4.250 | % | | | GBP 630,000 | | | | 1,194,808 | |
12/07/49 | | | 4.250 | % | | | GBP 555,000 | | | | 1,070,917 | |
| | | | | | | | | | | | |
Total | | | | 12,399,159 | |
URUGUAY 0.1% | |
Uruguay Government International Bond
Senior Unsecured | |
03/21/36 | | | 7.625 | % | | | 275,000 | | | | 386,238 | |
The accompanying Notes to Financial Statements are an integral part of this statement.
| | | | |
| COLUMBIA GLOBAL BOND FUND — 2012 SEMIANNUAL REPORT | | | 17 | |
| | |
| Portfolio of Investments (continued) | | |
| | | | | | | | | | | | |
| Issuer | | Coupon
Rate | | | Principal
Amount | | | Value | |
Foreign Government Obligations(a) (continued) | |
| | | | | | | | | | | | |
VENEZUELA 0.9% | |
Petroleos de Venezuela SA | |
04/12/17 | | | 5.250 | % | | | $1,190,000 | | | | $923,738 | |
Venezuela Government International Bond
Senior Unsecured | |
02/26/16 | | | 5.750 | % | | | 620,000 | | | | 561,100 | |
05/07/23 | | | 9.000 | % | | | 931,000 | | | | 809,970 | |
| | | | | | | | | | | | |
Total | | | | 2,294,808 | |
Total Foreign Government Obligations | |
(Cost: $126,272,687) | | | | $139,396,404 | |
| | | | | | | | | | | | |
| Borrower | | Weighted
Average
Coupon | | | Principal
Amount | | |
Value | |
| Senior Loans 0.1% | |
| | | | | | | | | | | | |
GERMANY —% | |
Schaeffler AG
Tranche C2 Term Loan(d)(e)(i) | |
01/27/17 | | | 6.000 | % | | | $29,000 | | | | $29,093 | |
UNITED STATES 0.1% | |
Cumulus Media Holdings, Inc.
2nd Lien Term Loan(e)(i) | |
03/18/19 | | | 7.500 | % | | | 129,000 | | | | 130,999 | |
Lonestar Intermediate Super Holdings LLC
Term Loan(e)(i) | |
09/02/19 | | | 11.000 | % | | | 95,000 | | | | 97,454 | |
| | | | | | | | | | | | |
Total | | | | 228,453 | |
Total Senior Loans | |
(Cost: $248,453) | | | | $257,546 | |
| | | | | | | | | | | | |
| | | | | | | | |
| | | Shares | | | Value | |
| Money Market Funds 7.6% | |
| | | | | | | | |
Columbia Short-Term Cash Fund, 0.144% (j)(k) | | | 20,183,398 | | | | $20,183,398 | |
Total Money Market Funds | | | | | |
(Cost: $20,183,398) | | | | $20,183,398 | |
| | | | | | | | | | | | |
| Issuer | | Effective
Yield | | | Par/
Principal/
Shares | | | Value | |
Investments of Cash Collateral
Received for Securities on Loan 1.4% | |
| | | | | | | | | | | | |
Repurchase Agreements 1.4% | |
Natixis Financial Products, Inc.
dated 04/30/12, matures 05/01/12,
repurchase price $1,000,007(l) | |
| | | 0.240 | % | | | $1,000,000 | | | | $1,000,000 | |
Pershing LLC
dated 04/30/12, matures 05/01/12,
repurchase price $500,005(l) | |
| | | 0.330 | % | | | 500,000 | | | | 500,000 | |
Societe Generale
dated 04/30/12, matures 05/01/12,
repurchase price $2,128,509 (l) | |
| | | 0.210 | % | | | 2,128,497 | | | | 2,128,497 | |
| | | | | | | | | | | | |
Total | | | | 3,628,497 | |
Total Investments of Cash Collateral Received for Securities on Loan | |
(Cost: $3,628,497) | | | | $3,628,497 | |
Total Investments | |
(Cost: $239,553,370) | | | | $258,616,019 | |
Other Assets & Liabilities, Net | | | | 5,987,361 | |
Net Assets | | | | $264,603,380 | |
The accompanying Notes to Financial Statements are an integral part of this statement.
| | |
| 18 | | COLUMBIA GLOBAL BOND FUND — 2012 SEMIANNUAL REPORT |
Investments in Derivatives
| | | | | | | | | | | | | | | | | | |
| Futures Contracts Outstanding at April 30, 2012 | |
| Contract Description | | Number of
Contracts
Long (Short) | | | Notional
Market Value | | | Expiration
Date | | Unrealized Appreciation | | | Unrealized
Depreciation | |
| Canada Government Bond, 10-year | | | (148 | ) | | | $(19,783,773 | ) | | June 2012 | | | $2,072 | | | | $— | |
| Euro-Bobl, 5-year | | | (5 | ) | | | (829,298 | ) | | June 2012 | | | — | | | | (7,328 | ) |
| Euro-Bund, 10-year | | | (2 | ) | | | (373,522 | ) | | June 2012 | | | — | | | | (6,764 | ) |
| Japanese Government Bond, 10-year | | | 4 | | | | 7,170,341 | | | June 2012 | | | 35,067 | | | | — | |
| United Kingdom Long GILT, 10-year | | | 106 | | | | 19,888,085 | | | June 2012 | | | | | | | (5,364 | ) |
| U.S. Treasury Note, 5-year | | | (10 | ) | | | (1,237,969 | ) | | July 2012 | | | — | | | | (7,765 | ) |
| U.S. Treasury Note, 10-year | | | (64 | ) | | | (8,466,000 | ) | | June 2012 | | | — | | | | (75,408 | ) |
| Total | | | | | | | | | | | | | $37,139 | | | | $(102,629 | ) |
| | | | | | | | | | | | | | | | | | | | |
| Forward Foreign Currency Exchange Contracts Open at April 30, 2012 | |
| Counterparty | | Exchange
Date | | | Currency to
be Delivered | | | Currency to
be Received | | | Unrealized
Appreciation | | | Unrealized
Depreciation | |
| Barclays Bank PLC | | | May 8, 2012 | | |
| 2,188,000
(GBP |
) | |
| 2,621,521
(EUR |
) | | | $— | | | | $(80,560 | ) |
| J.P. Morgan Securities, Inc. | | | May 8, 2012 | | |
| 17,769,642
(USD |
) | |
| 1,466,779,000
(JPY |
) | | | 602,841 | | | | — | |
| Citigroup Global Markets, Inc. | | | May 10, 2012 | | |
| 7,101,000
(BRL |
) | |
| 3,851,077
(USD |
) | | | 132,367 | | | | — | |
| UBS Securities | | | May 14, 2012 | | |
| 2,195,971
(USD |
) | |
| 1,377,000
(GBP |
) | | | 38,569 | | | | — | |
| UBS Securities | | | May 15, 2012 | | |
| 2,711,000
(NZD |
) | |
| 2,234,839
(USD |
) | | | 20,058 | | | | — | |
| State Street Bank & Trust Co. | | | May 16, 2012 | | |
| 5,271,000
(EUR |
) | |
| 6,950,657
(USD |
) | | | — | | | | (26,960 | ) |
| Barclays Bank PLC | | | May 17, 2012 | | |
| 19,703,000
(ILS |
) | |
| 5,246,997
(USD |
) | | | 17,682 | | | | — | |
| J.P. Morgan Securities, Inc. | | | May 17, 2012 | | |
| 5,060,000
(PLN |
) | |
| 1,571,673
(USD |
) | | | — | | | | (30,302 | ) |
| HSBC Securities (USA), Inc. | | | May 18, 2012 | | |
| 1,577,000
(AUD |
) | |
| 1,625,650
(USD |
) | | | — | | | | (14,435 | ) |
| Deutsche Bank | | | May 18, 2012 | | |
| 6,029,160,000
(KRW |
) | |
| 5,297,101
(USD |
) | | | — | | | | (31,694 | ) |
| Citigroup Global Markets, Inc. | | | May 18, 2012 | | |
| 155,817,000
(TWD |
) | |
| 5,276,566
(USD |
) | | | — | | | | (58,469 | ) |
| Citigroup Global Markets, Inc. | | | May 18, 2012 | | |
| 2,628,978
(USD |
) | |
| 1,285,570,000
(CLP |
) | | | 15,391 | | | | — | |
| Morgan Stanley | | | May 18, 2012 | | |
| 5,262,692
(USD |
) | |
| 155,031,000
(RUB |
) | | | — | | | | (572 | ) |
The accompanying Notes to Financial Statements are an integral part of this statement.
| | | | |
| COLUMBIA GLOBAL BOND FUND — 2012 SEMIANNUAL REPORT | | | 19 | |
| | |
| Portfolio of Investments (continued) | | |
| | | | | | | | | | | | | | | | | | | | |
| Forward Foreign Currency Exchange Contracts Open at April 30, 2012 (continued) | |
| Counterparty | | Exchange
Date | | | Currency to
be Delivered | | | Currency to
be Received | | | Unrealized
Appreciation | | | Unrealized
Depreciation | |
| UBS Securities | | | May 18, 2012 | | |
| 5,143,769
(USD |
) | |
| 9,415,000
(TRY |
) | | | $196,719 | | | | $— | |
| Citigroup Global Markets, Inc. | | | May 18, 2012 | | |
| 2,640,597
(USD |
) | |
| 77,825,000
(TWD |
) | | | 24,062 | | | | — | |
| Standard Chartered Bank | | | May 21, 2012 | | |
| 2,663,358
(USD |
) | |
| 138,721,000
(INR |
) | | | — | | | | (42,743 | ) |
| UBS Securities | | | May 22, 2012 | | |
| 24,397,000
(MXN |
) | |
| 1,837,303
(USD |
) | | | — | | | | (31,823 | ) |
| Goldman, Sachs & Co. | | | May 23, 2012 | | |
| 22,546,000
(EUR |
) | |
| 29,846,676
(USD |
) | | | — | | | | (392,582 | ) |
| State Street Bank & Trust Co. | | | May 23, 2012 | | |
| 7,342,000
(GBP |
) | |
| 11,913,532
(USD |
) | | | — | | | | (284,905 | ) |
| HSBC Securities (USA), Inc. | | | May 23, 2012 | | |
| 1,430,591,000
(JPY |
) | |
| 17,919,095
(USD |
) | | | — | | | | (129,910 | ) |
| J.P. Morgan Securities, Inc. | | | May 23, 2012 | | |
| 17,924,358
(USD |
) | |
| 102,668,000
(NOK |
) | | | 215,163 | | | | — | |
| Citigroup Global Markets, Inc. | | | May 23, 2012 | | |
| 5,793,712
(USD |
) | |
| 7,096,000
(NZD |
) | | | — | | | | (6,345 | ) |
| Citigroup Global Markets, Inc. | | | May 23, 2012 | | |
| 6,040,666
(USD |
) | |
| 7,466,000
(NZD |
) | | | 55,145 | | | | — | |
| Deutsche Bank | | | May 23, 2012 | | |
| 29,901,210
(USD |
) | |
| 200,975,000
(SEK |
) | | | 46,195 | | | | — | |
| Deutsche Bank | | | May 24, 2012 | | |
| 291,000
(CAD |
) | |
| 294,437
(USD |
) | | | — | | | | (625 | ) |
| Deutsche Bank | | | May 24, 2012 | | |
| 2,005,000
(CHF |
) | |
| 2,209,554
(USD |
) | | | — | | | | (28,819 | ) |
| Deutsche Bank | | | May 24, 2012 | | |
| 1,336,000
(EUR |
) | |
| 1,768,620
(USD |
) | | | — | | | | (23,091 | ) |
| Deutsche Bank | | | May 24, 2012 | | |
| 544,000
(GBP |
) | |
| 882,717
(USD |
) | | | — | | | | (20,935 | ) |
| Deutsche Bank | | | May 24, 2012 | | |
| 176,511,000
(JPY |
) | |
| 2,211,911
(USD |
) | | | — | | | | (15,903 | ) |
| Deutsche Bank | | | May 24, 2012 | | |
| 1,469,532
(USD |
) | |
| 1,414,000
(AUD |
) | | | 18,753 | | | | — | |
| Deutsche Bank | | | May 24, 2012 | | |
| 1,472,395
(USD |
) | |
| 8,434,000
(NOK |
) | | | 8,632 | | | | — | |
| Deutsche Bank | | | May 24, 2012 | | |
| 1,467,098
(USD |
) | |
| 1,797,000
(NZD |
) | | | 12,840 | | | | — | |
| Deutsche Bank | | | May 24, 2012 | | |
| 1,473,179
(USD |
) | |
| 9,911,000
(SEK |
) | | | 12,100 | | | | — | |
| HSBC Securities (USA), Inc. | | | May 25, 2012 | | |
| 693,820
(USD |
) | |
| 686,000
(CAD |
) | | | 267 | | | | — | |
| Total | | | | | | | | | | | | | | | $1,416,784 | | | | $(1,220,673 | ) |
The accompanying Notes to Financial Statements are an integral part of this statement.
| | |
| 20 | | COLUMBIA GLOBAL BOND FUND — 2012 SEMIANNUAL REPORT |
| | |
| Notes to Portfolio of Investments |
| (a) | Principal amounts are denominated in United States Dollars unless otherwise noted. |
| (b) | Security exempt from registration pursuant to Rule 144A under the Securities Act of 1933. This security may be resold in transactions exempt from registration, normally to qualified institutional buyers. At April 30, 2012, the value of these securities amounted to $27,470,135 or 10.38% of net assets. |
| (c) | At April 30, 2012, security was partially or fully on loan. |
| (d) | Represents a security purchased on a when-issued or delayed delivery basis. |
| (e) | Variable rate security. The interest rate shown reflects the rate as of April 30, 2012. |
| (f) | The maturity dates shown represent the original maturity of the underlying obligation. Actual maturity may vary based upon prepayment activity on these obligations. Unless otherwise noted, the coupon rates presented are fixed rates. |
| (g) | At April 30, 2012, investments in securities included securities valued at $630,465 that were partially pledged as collateral to cover initial margin deposits on open interest rate futures contracts. |
| (h) | Represents securities that have defaulted on payment of interest. The Fund has stopped accruing interest on these securities. At April 30, 2012, the value of these securities amounted to $75,872, which represents 0.03% of net assets. |
| (i) | Senior loans have rates of interest that float periodically based primarily on the London Interbank Offered Rate (“LIBOR”) and other short-term rates. The interest rate shown reflects the weighted average coupon as of April 30, 2012. The interest rate shown for senior loans purchased on a when-issued or delayed delivery basis, if any, reflects an estimated average coupon. Remaining maturities of senior loans may be less than the stated maturities shown as a result of contractual or optional prepayments by the borrower. Such prepayments cannot be predicted with certainty. |
| (j) | The rate shown is the seven-day current annualized yield at April 30, 2012. |
| (k) | Investments in affiliates during the period ended April 30, 2012: |
| | | | | | | | | | | | | | | | | | | | | | | | | | | | |
| Issuer | | Beginning
Cost | | | Purchase
Cost | | | Sales Cost/
Proceeds
from Sales | | | Realized
Gain/Loss | | | Ending
Cost | | | Dividends
or
Interest
Income | | | Value | |
Columbia Short-Term Cash Fund | | | $14,432,698 | | | | $48,931,837 | | | | $(43,181,137 | ) | | | $— | | | | $20,183,398 | | | | $12,654 | | | | $20,183,398 | |
The accompanying Notes to Financial Statements are an integral part of this statement.
| | | | |
| COLUMBIA GLOBAL BOND FUND — 2012 SEMIANNUAL REPORT | | | 21 | |
| | |
| Portfolio of Investments (continued) | | |
| | |
| Notes to Portfolio of Investments (continued) |
| (l) | The table below represents securities received as collateral for repurchase agreements. This collateral is deposited with the Fund’s custodian and, pursuant to the terms of the repurchase agreement, must have an aggregate value greater than or equal to the repurchase price plus accrued interest at all times. The value of securities and/or cash held as collateral for repurchase agreements is monitored on a daily basis to ensure the proper level of collateral. |
| | | | |
| Natixis Financial Products, Inc. (0.240%) | | | | |
| |
| Security Description | | Value | |
| Fannie Mae Pool | | | $35,340 | |
| Fannie Mae REMICS | | | 262,320 | |
| Fannie Mae Whole Loan | | | 8,241 | |
| Freddie Mac Gold Pool | | | 74,022 | |
| Freddie Mac Non Gold Pool | | | 19,150 | |
| Freddie Mac REMICS | | | 229,127 | |
| Government National Mortgage Association | | | 163,306 | |
| United States Treasury Note/Bond | | | 228,501 | |
| Total Market Value of Collateral Securities | | | $1,020,007 | |
| |
| Pershing LLC (0.330%) | | | | |
| |
| Security Description | | Value | |
| Fannie Mae Pool | | | $103,749 | |
| Fannie Mae REMICS | | | 27,155 | |
| Fannie Mae-Aces | | | 2,980 | |
| Federal Farm Credit Bank | | | 18,836 | |
| Federal Home Loan Banks | | | 4,926 | |
| Federal Home Loan Mortgage Corp | | | 4,027 | |
| Federal National Mortgage Association | | | 5,705 | |
| Freddie Mac Coupon Strips | | | 3,935 | |
| Freddie Mac Gold Pool | | | 40,071 | |
| Freddie Mac Non Gold Pool | | | 15,108 | |
| Freddie Mac Reference REMIC | | | 4,805 | |
| Freddie Mac REMICS | | | 31,269 | |
| Ginnie Mae I Pool | | | 51,586 | |
| Ginnie Mae II Pool | | | 144,008 | |
| Government National Mortgage Association | | | 17,112 | |
| United States Treasury Note/Bond | | | 34,728 | |
| Total Market Value of Collateral Securities | | | $510,000 | |
The accompanying Notes to Financial Statements are an integral part of this statement.
| | |
| 22 | | COLUMBIA GLOBAL BOND FUND — 2012 SEMIANNUAL REPORT |
| | |
| Notes to Portfolio of Investments (continued) |
| | | | |
| |
| Societe Generale (0.210%) | | | | |
| |
| Security Description | | Value | |
| Fannie Mae Pool | | | $1,479,300 | |
| Freddie Mac Gold Pool | | | 691,767 | |
| Total Market Value of Collateral Securities | | | $2,171,067 | |
| | |
| Abbreviation Legend |
| CMO | | Collateralized Mortgage Obligation |
| PIK | | Payment-in-Kind |
| | |
| Currency Legend |
| AUD | | Australian Dollar |
| BRL | | Brazilian Real |
| CAD | | Canadian Dollar |
| CHF | | Swiss Franc |
| CLP | | Chilean Peso |
| CZK | | Czech Koruna |
| DKK | | Danish Krone |
| EUR | | Euro |
| GBP | | British Pound |
| IDR | | Indonesian Rupiah |
| ILS | | Israeli Shekel |
| INR | | Indian Rupee |
| JPY | | Japanese Yen |
| KRW | | Korean Won |
| MXN | | Mexican Peso |
| NOK | | Norwegian Krone |
| NZD | | New Zealand Dollar |
| PLN | | Polish Zloty |
| RUB | | Russian Rouble |
| SEK | | Swedish Krona |
| TRY | | Turkish Lira |
| TWD | | Taiwan Dollar |
| USD | | US Dollar |
| ZAR | | South African Rand |
The accompanying Notes to Financial Statements are an integral part of this statement.
| | | | |
| COLUMBIA GLOBAL BOND FUND — 2012 SEMIANNUAL REPORT | | | 23 | |
| | |
| Portfolio of Investments (continued) | | |
Generally accepted accounting principles (GAAP) require disclosure regarding the inputs and valuation techniques used to measure fair value and any changes in valuation inputs or techniques. In addition, investments shall be disclosed by major category.
The Fund categorizes its fair value measurements according to a three-level hierarchy that maximizes the use of observable inputs and minimizes the use of unobservable inputs by prioritizing that the most observable input be used when available. Observable inputs are those that market participants would use in pricing an investment based on market data obtained from sources independent of the reporting entity. Unobservable inputs are those that reflect the Fund’s assumptions about the information market participants would use in pricing an investment. An investment’s level within the fair value hierarchy is based on the lowest level of any input that is deemed significant to the asset or liability’s fair value measurement. The input levels are not necessarily an indication of the risk or liquidity associated with investments at that level. For example, certain U.S. government securities are generally high quality and liquid, however, they are reflected as Level 2 because the inputs used to determine fair value may not always be quoted prices in an active market.
Fair value inputs are summarized in the three broad levels listed below:
| | Ÿ | | Level 1 — Valuations based on quoted prices for investments in active markets that the Fund has the ability to access at the measurement date (including NAV for open-end mutual funds). Valuation adjustments are not applied to Level 1 investments. |
| | Ÿ | | Level 2 — Valuations based on other significant observable inputs (including quoted prices for similar securities, interest rates, prepayment speeds, credit risks, etc.). |
| | Ÿ | | Level 3 — Valuations based on significant unobservable inputs (including the Fund’s own assumptions and judgment in determining the fair value of investments). |
Inputs that are used in determining fair value of an investment may include price information, credit data, volatility statistics, and other factors. These inputs can be either observable or unobservable. The availability of observable inputs can vary between investments, and is affected by various factors such as the type of investment, and the volume and level of activity for that investment or similar investments in the marketplace. The inputs will be considered by the Investment Manager, along with any other relevant factors in the calculation of an investment’s fair value. The Fund uses prices and inputs that are current as of the measurement date, which may include periods of market dislocations. During these periods, the availability of prices and inputs may be reduced for many investments. This condition could cause an investment to be reclassified between the various levels within the hierarchy.
Investments falling into the Level 3 category are primarily supported by quoted prices from brokers and dealers participating in the market for those investments. However, these may be classified as Level 3 investments due to lack of market transparency and corroboration to support these quoted prices. Additionally, valuation models may be used as the pricing source for any remaining investments classified as Level 3. These models rely on one or more significant unobservable inputs and/or significant assumptions by the Investment Manager. Inputs used in valuations may include, but are not limited to, financial statement analysis, capital account balances, discount rates and estimated cash flows, and comparable company data.
The accompanying Notes to Financial Statements are an integral part of this statement.
| | |
| 24 | | COLUMBIA GLOBAL BOND FUND — 2012 SEMIANNUAL REPORT |
| | |
| Fair Value Measurements (continued) |
The following table is a summary of the inputs used to value the Fund’s investments as of April 30, 2012:
| | | | | | | | | | | | | | | | |
| | | Fair value at April 30, 2012 | |
| Description | | Level 1
Quoted Prices
in Active
Markets for
Identical Assets | | | Level 2
Other
Significant
Observable
Inputs | | | Level 3
Significant
Unobservable
Inputs | | | Total | |
| Bonds | | | | | | | | | | | | | | | | |
Corporate Bonds & Notes | | | | | | | | | | | | | | | | |
Life Insurance | | | $— | | | | $1,138,194 | | | | $1,250,977 | | | | $2,389,171 | |
All other Industries | | | — | | | | 60,965,834 | | | | — | | | | 60,965,834 | |
Residential Mortgage-Backed
Securities - Agency | | | — | | | | 12,271,901 | | | | — | | | | 12,271,901 | |
Residential Mortgage-Backed
Securities - Non-Agency | | | — | | | | 589,898 | | | | — | | | | 589,898 | |
Commercial Mortgage-Backed
Securities - Agency | | | — | | | | 602,488 | | | | — | | | | 602,488 | |
Commercial Mortgage-Backed
Securities - Non-Agency | | | — | | | | 5,253,167 | | | | — | | | | 5,253,167 | |
Asset-Backed Securities - Non-Agency | | | — | | | | 958,001 | | | | — | | | | 958,001 | |
Inflation-Indexed Bonds | | | — | | | | 2,287,966 | | | | — | | | | 2,287,966 | |
U.S. Treasury Obligations | | | 9,831,748 | | | | — | | | | — | | | | 9,831,748 | |
Foreign Government Obligations | | | — | | | | 139,396,404 | | | | — | | | | 139,396,404 | |
| Total Bonds | | | 9,831,748 | | | | 223,463,853 | | | | 1,250,977 | | | | 234,546,578 | |
| Other | | | | | | | | | | | | | | | | |
Senior Loans | | | — | | | | 257,546 | | | | — | | | | 257,546 | |
Money Market Funds | | | 20,183,398 | | | | — | | | | — | | | | 20,183,398 | |
Investments of Cash Collateral Received for Securities on Loan | | | — | | | | 3,628,497 | | | | — | | | | 3,628,497 | |
| Total Other | | | 20,183,398 | | | | 3,886,043 | | | | — | | | | 24,069,441 | |
| Investments in Securities | | | 30,015,146 | | | | 227,349,896 | | | | 1,250,977 | | | | 258,616,019 | |
| Derivatives | | | | | | | | | | | | | | | | |
Assets | | | | | | | | | | | | | | | | |
Futures Contracts | | | 37,139 | | | | — | | | | — | | | | 37,139 | |
Forward Foreign Currency Exchange Contracts | | | — | | | | 1,416,784 | | | | — | | | | 1,416,784 | |
Liabilities | | | | | | | | | | | | | | | | |
Futures Contracts | | | (102,629 | ) | | | — | | | | — | | | | (102,629 | ) |
Forward Foreign Currency Exchange Contracts | | | — | | | | (1,220,673 | ) | | | — | | | | (1,220,673 | ) |
| Total | | | $29,949,656 | | | | $227,546,007 | | | | $1,250,977 | | | | $258,746,640 | |
See the Portfolio of Investments for all investment classifications not indicated in the table.
The accompanying Notes to Financial Statements are an integral part of this statement.
| | | | |
| COLUMBIA GLOBAL BOND FUND — 2012 SEMIANNUAL REPORT | | | 25 | |
| | |
| Portfolio of Investments (continued) | | |
| | |
| Fair Value Measurements (continued) |
The Fund’s assets assigned to the Level 2 input category are generally valued using the market approach, in which a security’s value is determined through reference to prices and information from market transactions for similar or identical assets.
The Fund’s assets assigned to the Level 3 category are valued utilizing the valuation technique deemed the most appropriate in the circumstances. Certain Corporate Bonds classified as Level 3 are valued using the market approach and utilize single market quotations from broker dealers.
There were no transfers of financial assets between Levels 1 and 2 during the period.
Derivative instruments are valued at unrealized appreciation (depreciation).
The following table is a reconciliation of Level 3 assets for which significant unobservable inputs were used to determine fair value.
| | | | |
| | | Corporate
Bonds &
Notes | |
| Balance as of October 31, 2011 | | | $1,368,098 | |
Accrued discounts/premiums | | | 17,184 | |
Realized gain (loss) | | | (3,705 | ) |
Change in unrealized appreciation (depreciation)* | | | (36,996 | ) |
Sales | | | (93,604 | ) |
Purchases | | | — | |
Transfers into Level 3 | | | — | |
Transfers out of Level 3 | | | — | |
| Balance as of April 30, 2012 | | | $1,250,977 | |
| * | Change in unrealized appreciation (depreciation) relating to securities held at April 30, 2012 was $(36,697). |
Transfers in and/or out of Level 3 are determined based on the fair value at the beginning of the period for security positions held throughout the period.
How to find information about the Fund’s quarterly portfolio holdings
| (i) | The Fund files its complete schedule of portfolio holdings with the Securities and Exchange Commission (SEC) for the first and third quarters of each fiscal year on Form N-Q; |
| (ii) | The Fund’s Forms N-Q are available on the SEC’s website at www.sec.gov; |
| (iii) | The Fund’s Forms N-Q may be reviewed and copied at the SEC’s Public Reference Room in Washington, DC (information on the operations of the Public Reference Room may be obtained by calling 800.SEC.0330); and |
| (iv) | The Fund’s complete schedule of portfolio holdings, as filed on Form N-Q, can be obtained without charge, upon request, by calling 800.345.6611. |
The accompanying Notes to Financial Statements are an integral part of this statement.
| | |
| 26 | | COLUMBIA GLOBAL BOND FUND — 2012 SEMIANNUAL REPORT |
| | |
| Statement of Assets and Liabilities | | |
| | | | | |
| April 30, 2012 (Unaudited) | | |
Assets | | | | | |
Investments, at value* | | | | | |
Unaffiliated issuers (identified cost $215,741,475) | | | $ | 234,804,124 | |
Affiliated issuers (identified cost $20,183,398) | | | | 20,183,398 | |
Investment of cash collateral received for securities on loan | | | | | |
Repurchase agreements (identified cost $3,628,497) | | | | 3,628,497 | |
Total investments (identified cost $239,553,370) | | | | 258,616,019 | |
Cash | | | | 216,711 | |
Foreign currency (identified cost $5,603,795) | | | | 5,678,431 | |
Margin deposits on futures contracts | | | | 866,828 | |
Unrealized appreciation on forward foreign currency exchange contracts | | | | 1,416,784 | |
Receivable for: | | | | | |
Investments sold | | | | 2,574,924 | |
Capital shares sold | | | | 541,721 | |
Dividends | | | | 2,703 | |
Interest | | | | 3,479,855 | |
Reclaims | | | | 107,917 | |
Expense reimbursement due from Investment Manager | | | | 3,612 | |
Prepaid expense | | | | 1,469 | |
Total assets | | | | 273,506,974 | |
Liabilities | | | | | |
Due upon return of securities on loan | | | | 3,628,497 | |
Unrealized depreciation on forward foreign currency exchange contracts | | | | 1,220,673 | |
Payable for: | | | | | |
Investments purchased | | | | 171,719 | |
Investments purchased on a delayed delivery basis | | | | 2,888,024 | |
Capital shares purchased | | | | 636,862 | |
Variation margin on futures contracts | | | | 40,364 | |
Foreign capital gains taxes deferred | | | | 158,118 | |
Investment management fees | | | | 12,364 | |
Distribution fees | | | | 6,263 | |
Transfer agent fees | | | | 50,772 | |
Administration fees | | | | 1,735 | |
Plan administration fees | | | | 8 | |
Compensation of board members | | | | 25,987 | |
Other expenses | | | | 62,208 | |
Total liabilities | | | | 8,903,594 | |
Net assets applicable to outstanding capital stock | | | $ | 264,603,380 | |
The accompanying Notes to Financial Statements are an integral part of this statement.
| | | | |
| COLUMBIA GLOBAL BOND FUND — 2012 SEMIANNUAL REPORT | | | 27 | |
| | | | | |
| April 30, 2012 (Unaudited) | | |
Represented by | | | | | |
Paid-in capital | | | $ | 245,990,120 | |
Excess of distributions over net investment income | | | | (2,527,772 | ) |
Accumulated net realized gain | | | | 2,044,491 | |
Unrealized appreciation (depreciation) on: | | | | | |
Investments | | | | 19,062,649 | |
Foreign currency translations | | | | 61,389 | |
Forward foreign currency exchange contracts | | | | 196,111 | |
Futures contracts | | | | (65,490 | ) |
Foreign capital gains tax | | | | (158,118 | ) |
Total — representing net assets applicable to outstanding capital stock | | | $ | 264,603,380 | |
*Value of securities on loan | | | $ | 10,172,975 | |
Net assets applicable to outstanding shares | | | | | |
Class A | | | $ | 212,579,506 | |
Class B | | | $ | 8,645,453 | |
Class C | | | $ | 6,862,294 | |
Class I | | | $ | 3,653,961 | |
Class R | | | $ | 5,028 | |
Class R4 | | | $ | 395,062 | |
Class W | | | $ | 31,108,908 | |
Class Z | | | $ | 1,353,168 | |
Shares outstanding | | | | | |
Class A | | | | 30,203,525 | |
Class B | | | | 1,218,152 | |
Class C | | | | 978,171 | |
Class I | | | | 518,661 | |
Class R | | | | 716 | |
Class R4 | | | | 56,083 | |
Class W | | | | 4,422,651 | |
Class Z | | | | 192,225 | |
Net asset value per share | | | | | |
Class A(a) | | | $ | 7.04 | |
Class B | | | $ | 7.10 | |
Class C | | | $ | 7.02 | |
Class I | | | $ | 7.04 | |
Class R | | | $ | 7.02 | |
Class R4 | | | $ | 7.04 | |
Class W | | | $ | 7.03 | |
Class Z | | | $ | 7.04 | |
| (a) | The maximum offering price per share for Class A is $7.39. The offering price is calculated by dividing the net asset value by 1.0 minus the maximum sales charge of 4.75%. |
The accompanying Notes to Financial Statements are an integral part of this statement.
| | |
| 28 | | COLUMBIA GLOBAL BOND FUND — 2012 SEMIANNUAL REPORT |
| | | | | |
| Six months ended April 30, 2012 (Unaudited) | | |
Net investment income | | | | | |
Income: | | | | | |
Interest | | | $ | 5,271,430 | |
Dividends from affiliates | | | | 12,654 | |
Income from securities lending — net | | | | 8,848 | |
Foreign taxes withheld | | | | (28,226 | ) |
Total income | | | | 5,264,706 | |
Expenses: | | | | | |
Investment management fees | | | | 782,848 | |
Distribution fees | | | | | |
Class A | | | | 267,578 | |
Class B | | | | 45,632 | |
Class C | | | | 30,642 | |
Class R | | | | 13 | |
Class W | | | | 50,757 | |
Transfer agent fees | | | | | |
Class A | | | | 308,954 | |
Class B | | | | 14,858 | |
Class C | | | | 8,718 | |
Class R | | | | 8 | |
Class R4 | | | | 88 | |
Class W | | | | 61,211 | |
Class Z | | | | 1,179 | |
Administration fees | | | | 109,873 | |
Plan administration fees | | | | | |
Class R4 | | | | 461 | |
Compensation of board members | | | | 8,566 | |
Custodian fees | | | | 35,676 | |
Printing and postage fees | | | | 54,362 | |
Registration fees | | | | 32,505 | |
Professional fees | | | | 23,366 | |
Other | | | | 14,255 | |
Total expenses | | | | 1,851,550 | |
Fees waived or expenses reimbursed by Investment Manager and its affiliates | | | | (206,630 | ) |
Total net expenses | | | | 1,644,920 | |
Net investment income | | | | 3,619,786 | |
The accompanying Notes to Financial Statements are an integral part of this statement.
| | | | |
| COLUMBIA GLOBAL BOND FUND — 2012 SEMIANNUAL REPORT | | | 29 | |
| | | | | |
Realized and unrealized gain (loss) — net | | | | | |
Net realized gain (loss) on: | | | | | |
Investments | | | $ | 1,102,386 | |
Foreign currency translations | | | | (166,094 | ) |
Forward foreign currency exchange contracts | | | | 3,167,284 | |
Futures contracts | | | | (314,194 | ) |
Net realized gain | | | | 3,789,382 | |
Net change in unrealized appreciation (depreciation) on: | | | | | |
Investments | | | | (1,915,494 | ) |
Foreign currency translations | | | | 87,015 | |
Forward foreign currency exchange contracts | | | | 398,006 | |
Futures contracts | | | | (78,127 | ) |
Foreign capital gains tax | | | | 37,354 | |
Net change in unrealized depreciation | | | | (1,471,246 | ) |
Net realized and unrealized gain | | | | 2,318,136 | |
Net increase in net assets resulting from operations | | | $ | 5,937,922 | |
The accompanying Notes to Financial Statements are an integral part of this statement.
| | |
| 30 | | COLUMBIA GLOBAL BOND FUND — 2012 SEMIANNUAL REPORT |
| | |
| Statement of Changes in Net Assets | | |
| | | | | | | | | | |
| | | Six months ended
April 30, 2012 (Unaudited) | | Year ended
October 31, 2011 |
| | | | |
Operations | | | | | | | | | | |
Net investment income | | | $ | 3,619,786 | | | | $ | 14,739,711 | |
Net realized gain | | | | 3,789,382 | | | | | 22,973,994 | |
Net change in unrealized depreciation | | | | (1,471,246 | ) | | | | (27,446,893 | ) |
Net increase in net assets resulting from operations | | | | 5,937,922 | | | | | 10,266,812 | |
Distributions to shareholders from: | | | | | | | | | | |
Net investment income | | | | | | | | | | |
Class A | | | | (12,904,400 | ) | | | | (9,200,711 | ) |
Class B | | | | (525,693 | ) | | | | (495,637 | ) |
Class C | | | | (333,563 | ) | | | | (190,844 | ) |
Class I | | | | (203,384 | ) | | | | (7,489,753 | ) |
Class R | | | | (306 | ) | | | | (195 | ) |
Class R4 | | | | (22,984 | ) | | | | (14,475 | ) |
Class W | | | | (2,887,520 | ) | | | | (2,561,714 | ) |
Class Z | | | | (51,197 | ) | | | | (8,628 | ) |
Net realized gains | | | | | | | | | | |
Class A | | | | (905,617 | ) | | | | — | |
Class B | | | | (39,090 | ) | | | | — | |
Class C | | | | (24,734 | ) | | | | — | |
Class I | | | | (13,695 | ) | | | | — | |
Class R | | | | (22 | ) | | | | — | |
Class R4 | | | | (1,586 | ) | | | | — | |
Class W | | | | (205,051 | ) | | | | — | |
Class Z | | | | (3,453 | ) | | | | — | |
Total distributions to shareholders | | | | (18,122,295 | ) | | | | (19,961,957 | ) |
Decrease in net assets from share transactions | | | | (19,399,965 | ) | | | | (231,596,485 | ) |
Total decrease in net assets | | | | (31,584,338 | ) | | | | (241,291,630 | ) |
Net assets at beginning of period | | | | 296,187,718 | | | | | 537,479,348 | |
Net assets at end of period | | | $ | 264,603,380 | | | | $ | 296,187,718 | |
Undistributed (excess of distributions over) net investment income | | | $ | (2,527,772 | ) | | | $ | 10,781,489 | |
The accompanying Notes to Financial Statements are an integral part of this statement.
| | | | |
| COLUMBIA GLOBAL BOND FUND — 2012 SEMIANNUAL REPORT | | | 31 | |
| | | | | | | | | | | | | | | | |
| | | Six months ended
April 30, 2012
(Unaudited) | | | Year ended
October 31, 2011 | |
| | | Shares | | | Dollars ($) | | | Shares | | | Dollars ($) | |
Capital stock activity | | | | | | | | | | | | | | | | |
Class A shares | | | | | | | | | | | | | | | | |
Subscriptions(a) | | | 1,589,338 | | | | 11,162,705 | | | | 4,164,423 | | | | 30,474,856 | |
Distributions reinvested | | | 1,791,792 | | | | 12,277,406 | | | | 1,150,249 | | | | 8,161,033 | |
Redemptions | | | (3,563,605 | ) | | | (25,070,202 | ) | | | (7,976,676 | ) | | | (58,041,360 | ) |
Net decrease | | | (182,475 | ) | | | (1,630,091 | ) | | | (2,662,004 | ) | | | (19,405,471 | ) |
Class B shares | | | | | | | | | | | | | | | | |
Subscriptions | | | 20,826 | | | | 146,631 | | | | 240,686 | | | | 1,778,975 | |
Distributions reinvested | | | 75,354 | | | | 520,694 | | | | 64,521 | | | | 459,127 | |
Redemptions(a) | | | (204,633 | ) | | | (1,449,582 | ) | | | (1,439,224 | ) | | | (10,634,013 | ) |
Net decrease | | | (108,453 | ) | | | (782,257 | ) | | | (1,134,017 | ) | | | (8,395,911 | ) |
Class C shares | | | | | | | | | | | | | | | | |
Subscriptions | | | 219,771 | | | | 1,532,724 | | | | 227,138 | | | | 1,657,291 | |
Distributions reinvested | | | 47,828 | | | | 326,664 | | | | 24,725 | | | | 174,532 | |
Redemptions | | | (97,360 | ) | | | (681,667 | ) | | | (270,945 | ) | | | (1,959,893 | ) |
Net increase (decrease) | | | 170,239 | | | | 1,177,721 | | | | (19,082 | ) | | | (128,070 | ) |
Class I shares | | | | | | | | | | | | | | | | |
Subscriptions | | | 99,095 | | | | 693,972 | | | | 1,650,156 | | | | 11,953,911 | |
Distributions reinvested | | | 31,571 | | | | 216,385 | | | | 1,054,721 | | | | 7,489,284 | |
Redemptions | | | (69,719 | ) | | | (492,476 | ) | | | (28,404,814 | ) | | | (207,731,335 | ) |
Net increase (decrease) | | | 60,947 | | | | 417,881 | | | | (25,699,937 | ) | | | (188,288,140 | ) |
Class R4 shares | | | | | | | | | | | | | | | | |
Subscriptions | | | 14,481 | | | | 105,738 | | | | 2,016 | | | | 14,637 | |
Distributions reinvested | | | 3,585 | | | | 24,569 | | | | 2,042 | | | | 14,475 | |
Redemptions | | | (1,501 | ) | | | (10,944 | ) | | | (19,006 | ) | | | (136,927 | ) |
Net increase (decrease) | | | 16,565 | | | | 119,363 | | | | (14,948 | ) | | | (107,815 | ) |
Class W shares | | | | | | | | | | | | | | | | |
Subscriptions | | | 1,208,017 | | | | 8,675,680 | | | | 2,179,782 | | | | 15,803,657 | |
Distributions reinvested | | | 452,011 | | | | 3,092,231 | | | | 361,929 | | | | 2,561,501 | |
Redemptions | | | (4,387,701 | ) | | | (31,084,296 | ) | | | (4,749,298 | ) | | | (34,407,634 | ) |
Net decrease | | | (2,727,673 | ) | | | (19,316,385 | ) | | | (2,207,587 | ) | | | (16,042,476 | ) |
Class Z shares | | | | | | | | | | | | | | | | |
Subscriptions | | | 91,845 | | | | 642,417 | | | | 117,047 | | | | 871,715 | |
Distributions reinvested | | | 7,889 | | | | 54,069 | | | | 1,165 | | | | 8,433 | |
Redemptions | | | (11,872 | ) | | | (82,683 | ) | | | (14,855 | ) | | | (108,750 | ) |
Net increase | | | 87,862 | | | | 613,803 | | | | 103,357 | | | | 771,398 | |
Total net decrease | | | (2,682,988 | ) | | | (19,399,965 | ) | | | (31,634,218 | ) | | | (231,596,485 | ) |
| (a) | Includes conversions of Class B shares to Class A shares, if any. The line items from the prior year have been combined to conform to the current year presentation. |
The accompanying Notes to Financial Statements are an integral part of this statement.
| | |
| 32 | | COLUMBIA GLOBAL BOND FUND — 2012 SEMIANNUAL REPORT |
The following tables are intended to help you understand the Fund’s financial performance. Certain information reflects financial results for a single share of a class held for the periods shown. Per share net investment income (loss) amounts are calculated based on average shares outstanding during the period. Total returns assume reinvestment of all dividends and distributions. Total returns do not reflect payments of sales charges, if any, and are not annualized for periods of less than one year.
| | | | | | | | | | | | | | | | | | | | | | | | | | | | | | |
| | | Six months
ended April 30, 2012 | | Year ended Oct. 31, |
| | | | 2011 | | 2010 | | 2009 | | 2008 | | 2007 |
| | | (Unaudited) | | | | | | | | | | |
Class A | | | | | | | | | | | | | | | | | | | | | | | | | | | | | | |
Per share data | | | | | | | | | | | | | | | | | | | | | | | | | | | | | | |
Net asset value, beginning of period | | | | $7.35 | | | | | $7.47 | | | | | $7.10 | | | | | $6.16 | | | | | $6.89 | | | | | $6.60 | |
Income from investment operations: | | | | | | | | | | | | | | | | | | | | | | | | | | | | | | |
Net investment income | | | | 0.09 | | | | | 0.22 | | | | | 0.23 | | | | | 0.17 | | | | | 0.22 | | | | | 0.20 | |
Net realized and unrealized gain (loss) | | | | 0.06 | | | | | (0.05 | ) | | | | 0.31 | | | | | 1.15 | | | | | (0.73 | ) | | | | 0.35 | |
Total from investment operations | | | | 0.15 | | | | | 0.17 | | | | | 0.54 | | | | | 1.32 | | | | | (0.51 | ) | | | | 0.55 | |
Less distributions to shareholders from: | | | | | | | | | | | | | | | | | | | | | | | | | | | | | | |
Net investment income | | | | (0.43 | ) | | | | (0.29 | ) | | | | (0.17 | ) | | | | (0.38 | ) | | | | (0.22 | ) | | | | (0.26 | ) |
Net realized gains | | | | (0.03 | ) | | | | — | | | | | — | | | | | — | | | | | — | | | | | — | |
Total distributions to shareholders | | | | (0.46 | ) | | | | (0.29 | ) | | | | (0.17 | ) | | | | (0.38 | ) | | | | (0.22 | ) | | | | (0.26 | ) |
Net asset value, end of period | | | | $7.04 | | | | | $7.35 | | | | | $7.47 | | | | | $7.10 | | | | | $6.16 | | | | | $6.89 | |
Total return | | | | 2.27% | | | | | 2.46% | | | | | 7.70% | | | | | 22.12% | | | | | (7.66% | ) | | | | 8.63% | |
Ratios to average net assets(a) | | | | | | | | | | | | | | | | | | | | | | | | | | | | | | |
Expenses prior to fees waived or expenses reimbursed | | | | 1.31% | (b) | | | | 1.35% | | | | | 1.34% | | | | | 1.36% | | | | | 1.32% | | | | | 1.37% | |
Net expenses after fees waived or expenses reimbursed(c) | | | | 1.16% | (b) | | | | 1.21% | (d) | | | | 1.25% | | | | | 1.25% | | | | | 1.25% | | | | | 1.25% | |
Net investment income | | | | 2.66% | (b) | | | | 2.95% | (d) | | | | 3.31% | | | | | 2.72% | | | | | 3.26% | | | | | 3.08% | |
Supplemental data | | | | | | | | | | | | | | | | | | | | | | | | | | | | | | |
Net assets, end of period (in thousands) | | | | $212,580 | | | | | $223,462 | | | | | $246,929 | | | | | $252,773 | | | | | $248,748 | | | | | $258,703 | |
Portfolio turnover | | | | 19% | | | | | 57% | | | | | 62% | | | | | 69% | | | | | 75% | | | | | 77% | |
Notes to Financial Highlights
| (a) | In addition to the fees and expenses which the Fund bears directly, the Fund indirectly bears a pro rata share of the fees and expenses of the acquired funds in which it invests. Such indirect expenses are not included in the reported expense ratios. |
| (c) | The Investment Manager and certain of its affiliates agreed to waive/reimburse certain fees and expenses, if applicable. |
| (d) | The benefits derived from expense reductions had an impact of less than 0.01%. |
The accompanying Notes to Financial Statements are an integral part of this statement.
| | | | |
| COLUMBIA GLOBAL BOND FUND — 2012 SEMIANNUAL REPORT | | | 33 | |
| | |
| Financial Highlights (continued) | | |
| | | | | | | | | | | | | | | | | | | | | | | | | | | | | | |
| | | Six months
ended April 30, 2012 | | Year ended Oct. 31, |
| | | | 2011 | | 2010 | | 2009 | | 2008 | | 2007 |
| | | (Unaudited) | | | | | | | | | | |
Class B | | | | | | | | | | | | | | | | | | | | | | | | | | | | | | |
Per share data | | | | | | | | | | | | | | | | | | | | | | | | | | | | | | |
Net asset value, beginning of period | | | | $7.41 | | | | | $7.52 | | | | | $7.14 | | | | | $6.23 | | | | | $6.96 | | | | | $6.67 | |
Income from investment
operations: | | | | | | | | | | | | | | | | | | | | | | | | | | | | | | |
Net investment income | | | | 0.07 | | | | | 0.16 | | | | | 0.18 | | | | | 0.13 | | | | | 0.17 | | | | | 0.15 | |
Net realized and unrealized gain (loss) | | | | 0.06 | | | | | (0.04 | ) | | | | 0.31 | | | | | 1.15 | | | | | (0.73 | ) | | | | 0.35 | |
Total from investment operations | | | | 0.13 | | | | | 0.12 | | | | | 0.49 | | | | | 1.28 | | | | | (0.56 | ) | | | | 0.50 | |
Less distributions to shareholders from: | | | | | | | | | | | | | | | | | | | | | | | | | | | | | | |
Net investment income | | | | (0.41 | ) | | | | (0.23 | ) | | | | (0.11 | ) | | | | (0.37 | ) | | | | (0.17 | ) | | | | (0.21 | ) |
Net realized gains | | | | (0.03 | ) | | | | — | | | | | — | | | | | — | | | | | — | | | | | — | |
Total distributions to shareholders | | | | (0.44 | ) | | | | (0.23 | ) | | | | (0.11 | ) | | | | (0.37 | ) | | | | (0.17 | ) | | | | (0.21 | ) |
Net asset value, end of period | | | | $7.10 | | | | | $7.41 | | | | | $7.52 | | | | | $7.14 | | | | | $6.23 | | | | | $6.96 | |
Total return | | | | 1.91% | | | | | 1.72% | | | | | 6.89% | | | | | 21.14% | | | | | (8.28% | ) | | | | 7.68% | |
Ratios to average net assets(a) | | | | | | | | | | | | | | | | | | | | | | | | | | | | | | |
Expenses prior to fees waived or expenses reimbursed | | | | 2.10% | (b) | | | | 2.12% | | | | | 2.10% | | | | | 2.13% | | | | | 2.09% | | | | | 2.13% | |
Net expenses after fees waived or expenses reimbursed(c) | | | | 1.91% | (b) | | | | 1.96% | (d) | | | | 2.02% | | | | | 2.01% | | | | | 2.01% | | | | | 2.01% | |
Net investment income | | | | 1.92% | (b) | | | | 2.22% | (d) | | | | 2.58% | | | | | 2.00% | | | | | 2.49% | | | | | 2.30% | |
Supplemental data | | | | | | | | | | | | | | | | | | | | | | | | | | | | | | |
Net assets, end of period (in thousands) | | | | $8,645 | | | | | $9,836 | | | | | $18,513 | | | | | $29,977 | | | | | $42,400 | | | | | $46,948 | |
Portfolio turnover | | | | 19% | | | | | 57% | | | | | 62% | | | | | 69% | | | | | 75% | | | | | 77% | |
Notes to Financial Highlights
| (a) | In addition to the fees and expenses which the Fund bears directly, the Fund indirectly bears a pro rata share of the fees and expenses of the acquired funds in which it invests. Such indirect expenses are not included in the reported expense ratios. |
| (c) | The Investment Manager and certain of its affiliates agreed to waive/reimburse certain fees and expenses, if applicable. |
| (d) | The benefits derived from expense reductions had an impact of less than 0.01%. |
The accompanying Notes to Financial Statements are an integral part of this statement.
| | |
| 34 | | COLUMBIA GLOBAL BOND FUND — 2012 SEMIANNUAL REPORT |
| | | | | | | | | | | | | | | | | | | | | | | | | | | | | | |
| | | Six months
ended April 30, 2012 | | Year ended Oct. 31, |
| | | | 2011 | | 2010 | | 2009 | | 2008 | | 2007 |
| | | (Unaudited) | | | | | | | | | | |
Class C | | | | | | | | | | | | | | | | | | | | | | | | | | | | | | |
Per share data | | | | | | | | | | | | | | | | | | | | | | | | | | | | | | |
Net asset value, beginning of period | | | | $7.33 | | | | | $7.45 | | | | | $7.08 | | | | | $6.18 | | | | | $6.91 | | | | | $6.62 | |
Income from investment
operations: | | | | | | | | | | | | | | | | | | | | | | | | | | | | | | |
Net investment income | | | | 0.07 | �� | | | | 0.16 | | | | | 0.18 | | | | | 0.13 | | | | | 0.17 | | | | | 0.15 | |
Net realized and unrealized gain (loss) | | | | 0.06 | | | | | (0.04 | ) | | | | 0.31 | | | | | 1.14 | | | | | (0.73 | ) | | | | 0.35 | |
Total from investment operations | | | | 0.13 | | | | | 0.12 | | | | | 0.49 | | | | | 1.27 | | | | | (0.56 | ) | | | | 0.50 | |
Less distributions to shareholders
from: | | | | | | | | | | | | | | | | | | | | | | | | | | | | | | |
Net investment income | | | | (0.41 | ) | | | | (0.24 | ) | | | | (0.12 | ) | | | | (0.37 | ) | | | | (0.17 | ) | | | | (0.21 | ) |
Net realized gains | | | | (0.03 | ) | | | | — | | | | | — | | | | | — | | | | | — | | | | | — | |
Total distributions to shareholders | | | | (0.44 | ) | | | | (0.24 | ) | | | | (0.12 | ) | | | | (0.37 | ) | | | | (0.17 | ) | | | | (0.21 | ) |
Net asset value, end of period | | | | $7.02 | | | | | $7.33 | | | | | $7.45 | | | | | $7.08 | | | | | $6.18 | | | | | $6.91 | |
Total return | | | | 1.95% | | | | | 1.70% | | | | | 6.95% | | | | | 21.15% | | | | | (8.27% | ) | | | | 7.75% | |
Ratios to average net
assets(a) | | | | | | | | | | | | | | | | | | | | | | | | | | | | | | |
Expenses prior to fees waived or expenses reimbursed | | | | 2.06% | (b) | | | | 2.10% | | | | | 2.10% | | | | | 2.12% | | | | | 2.08% | | | | | 2.13% | |
Net expenses after fees waived or expenses reimbursed(c) | | | | 1.91% | (b) | | | | 1.95% | (d) | | | | 2.01% | | | | | 2.01% | | | | | 2.01% | | | | | 2.01% | |
Net investment income | | | | 1.90% | (b) | | | | 2.21% | (d) | | | | 2.58% | | | | | 1.94% | | | | | 2.51% | | | | | 2.32% | |
Supplemental data | | | | | | | | | | | | | | | | | | | | | | | | | | | | | | |
Net assets, end of period (in thousands) | | | | $6,862 | | | | | $5,926 | | | | | $6,162 | | | | | $5,557 | | | | | $4,295 | | | | | $2,541 | |
Portfolio turnover | | | | 19% | | | | | 57% | | | | | 62% | | | | | 69% | | | | | 75% | | | | | 77% | |
Notes to Financial Highlights
| (a) | In addition to the fees and expenses which the Fund bears directly, the Fund indirectly bears a pro rata share of the fees and expenses of the acquired funds in which it invests. Such indirect expenses are not included in the reported expense ratios. |
| (c) | The Investment Manager and certain of its affiliates agreed to waive/reimburse certain fees and expenses, if applicable. |
| (d) | The benefits derived from expense reductions had an impact of less than 0.01%. |
The accompanying Notes to Financial Statements are an integral part of this statement.
| | | | |
| COLUMBIA GLOBAL BOND FUND — 2012 SEMIANNUAL REPORT | | | 35 | |
| | |
| Financial Highlights (continued) | | |
| | | | | | | | | | | | | | | | | | | | | | | | | | | | | | |
| | | Six months
ended April 30, 2012 | | Year ended Oct. 31, |
| | | | 2011 | | 2010 | | 2009 | | 2008 | | 2007 |
| | | (Unaudited) | | | | | | | | | | |
Class I | | | | | | | | | | | | | | | | | | | | | | | | | | | | | | |
Per share data | | | | | | | | | | | | | | | | | | | | | | | | | | | | | | |
Net asset value, beginning of period | | | | $7.36 | | | | | $7.48 | | | | | $7.11 | | | | | $6.14 | | | | | $6.87 | | | | | $6.59 | |
Income from investment
operations: | | | | | | | | | | | | | | | | | | | | | | | | | | | | | | |
Net investment income | | | | 0.11 | | | | | 0.25 | | | | | 0.26 | | | | | 0.20 | | | | | 0.25 | | | | | 0.23 | |
Net realized and unrealized gain (loss) | | | | 0.05 | | | | | (0.05 | ) | | | | 0.31 | | | | | 1.15 | | | | | (0.73 | ) | | | | 0.34 | |
Total from investment operations | | | | 0.16 | | | | | 0.20 | | | | | 0.57 | | | | | 1.35 | | | | | (0.48 | ) | | | | 0.57 | |
Less distributions to shareholders from: | | | | | | | | | | | | | | | | | | | | | | | | | | | | | | |
Net investment income | | | | (0.45 | ) | | | | (0.32 | ) | | | | (0.20 | ) | | | | (0.38 | ) | | | | (0.25 | ) | | | | (0.29 | ) |
Net realized gains | | | | (0.03 | ) | | | | — | | | | | — | | | | | — | | | | | — | | | | | — | |
Total distributions to shareholders | | | | (0.48 | ) | | | | (0.32 | ) | | | | (0.20 | ) | | | | (0.38 | ) | | | | (0.25 | ) | | | | (0.29 | ) |
Net asset value, end of period | | | | $7.04 | | | | | $7.36 | | | | | $7.48 | | | | | $7.11 | | | | | $6.14 | | | | | $6.87 | |
Total return | | | | 2.37% | | | | | 2.94% | | | | | 8.16% | | | | | 22.83% | | | | | (7.30% | ) | | | | 8.91% | |
Ratios to average net assets(a) | | | | | | | | | | | | | | | | | | | | | | | | | | | | | | |
Expenses prior to fees waived or expenses reimbursed | | | | 0.78% | (b) | | | | 0.82% | | | | | 0.86% | | | | | 0.86% | | | | | 0.85% | | | | | 0.87% | |
Net expenses after fees waived or expenses reimbursed(c) | | | | 0.71% | (b) | | | | 0.76% | | | | | 0.82% | | | | | 0.82% | | | | | 0.82% | | | | | 0.87% | |
Net investment income | | | | 3.10% | (b) | | | | 3.40% | | | | | 3.70% | | | | | 3.16% | | | | | 3.68% | | | | | 3.47% | |
Supplemental data | | | | | | | | | | | | | | | | | | | | | | | | | | | | | | |
Net assets, end of period (in thousands) | | | | $3,654 | | | | | $3,369 | | | | | $195,613 | | | | | $169,717 | | | | | $205,798 | | | | | $157,401 | |
Portfolio turnover | | | | 19% | | | | | 57% | | | | | 62% | | | | | 69% | | | | | 75% | | | | | 77% | |
Notes to Financial Highlights
| (a) | In addition to the fees and expenses which the Fund bears directly, the Fund indirectly bears a pro rata share of the fees and expenses of the acquired funds in which it invests. Such indirect expenses are not included in the reported expense ratios. |
| (c) | The Investment Manager and certain of its affiliates agreed to waive/reimburse certain fees and expenses, if applicable. |
The accompanying Notes to Financial Statements are an integral part of this statement.
| | |
| 36 | | COLUMBIA GLOBAL BOND FUND — 2012 SEMIANNUAL REPORT |
| | | | | | | | | | | | | | | |
| | | Six months
ended April 30, | | Year ended Oct. 31, |
| | | 2012 | | 2011 | | 2010(a) |
| | | (Unaudited) | | | | |
Class R | | | | | | | | | | | | | | | |
Per share data | | | | | | | | | | | | | | | |
Net asset value, beginning of period | | | | $7.34 | | | | | $7.46 | | | | | $6.98 | |
Income from investment
operations: | | | | | | | | | | | | | | | |
Net investment income | | | | 0.08 | | | | | 0.20 | | | | | 0.16 | |
Net realized and unrealized gain (loss) | | | | 0.06 | | | | | (0.05 | ) | | | | 0.40 | |
Total from investment operations | | | | 0.14 | | | | | 0.15 | | | | | 0.56 | |
Less distributions to shareholders
from: | | | | | | | | | | | | | | | |
Net investment income | | | | (0.43 | ) | | | | (0.27 | ) | | | | (0.08 | ) |
Net realized gains | | | | (0.03 | ) | | | | — | | | | | — | |
Total distributions to shareholders | | | | (0.46 | ) | | | | (0.27 | ) | | | | (0.08 | ) |
Net asset value, end of period | | | | $7.02 | | | | | $7.34 | | | | | $7.46 | |
Total return | | | | 2.05% | | | | | 2.21% | | | | | 8.15% | |
Ratios to average net
assets(b) | | | | | | | | | | | | | | | |
Expenses prior to fees waived or
expenses reimbursed | | | | 1.61% | (c) | | | | 1.59% | | | | | 1.66% | (c) |
Net expenses after fees waived or
expenses reimbursed(d) | | | | 1.41% | (c) | | | | 1.46% | | | | | 1.59% | (c) |
Net investment income | | | | 2.38% | (c) | | | | 2.69% | | | | | 3.58% | (c) |
Supplemental data | | | | | | | | | | | | | | | |
Net assets, end of period (in thousands) | | | | $5 | | | | | $5 | | | | | $5 | |
Portfolio turnover | | | | 19% | | | | | 57% | | | | | 62% | |
Notes to Financial Highlights
| (a) | For the period from March 15, 2010 (commencement of operations) to October 31, 2010. |
| (b) | In addition to the fees and expenses which the Fund bears directly, the Fund indirectly bears a pro rata share of the fees and expenses of the acquired funds in which it invests. Such indirect expenses are not included in the reported expense ratios. |
| (d) | The Investment Manager and certain of its affiliates agreed to waive/reimburse certain fees and expenses, if applicable. |
The accompanying Notes to Financial Statements are an integral part of this statement.
| | | | |
| COLUMBIA GLOBAL BOND FUND — 2012 SEMIANNUAL REPORT | | | 37 | |
| | |
| Financial Highlights (continued) | | |
| | | | | | | | | | | | | | | | | | | | | | | | | | | | | | |
| | | Six months
ended April 30, 2012 | | Year ended Oct. 31, |
| | | | 2011 | | 2010 | | 2009 | | 2008 | | 2007 |
| | | (Unaudited) | | | | | | | | | | |
Class R4 | | | | | | | | | | | | | | | | | | | | | | | | | | | | | | |
Per share data | | | | | | | | | | | | | | | | | | | | | | | | | | | | | | |
Net asset value, beginning of period | | | | $7.36 | | | | | $7.48 | | | | | $7.11 | | | | | $6.16 | | | | | $6.89 | | | | | $6.60 | |
Income from investment
operations: | | | | | | | | | | | | | | | | | | | | | | | | | | | | | | |
Net investment income | | | | 0.10 | | | | | 0.23 | | | | | 0.24 | | | | | 0.18 | | | | | 0.25 | | | | | 0.22 | |
Net realized and unrealized gain (loss) | | | | 0.05 | | | | | (0.05 | ) | | | | 0.31 | | | | | 1.15 | | | | | (0.72 | ) | | | | 0.35 | |
Total from investment operations | | | | 0.15 | | | | | 0.18 | | | | | 0.55 | | | | | 1.33 | | | | | (0.47 | ) | | | | 0.57 | |
Less distributions to shareholders
from: | | | | | | | | | | | | | | | | | | | | | | | | | | | | | | |
Net investment income | | | | (0.44 | ) | | | | (0.30 | ) | | | | (0.18 | ) | | | | (0.38 | ) | | | | (0.26 | ) | | | | (0.28 | ) |
Net realized gains | | | | (0.03 | ) | | | | — | | | | | — | | | | | — | | | | | — | | | | | — | |
Total distributions to shareholders | | | | (0.47 | ) | | | | (0.30 | ) | | | | (0.18 | ) | | | | (0.38 | ) | | | | (0.26 | ) | | | | (0.28 | ) |
Net asset value, end of period | | | | $7.04 | | | | | $7.36 | | | | | $7.48 | | | | | $7.11 | | | | | $6.16 | | | | | $6.89 | |
Total return | | | | 2.23% | | | | | 2.60% | | | | | 7.85% | | | | | 22.42% | | | | | (7.19% | ) | | | | 8.84% | |
Ratios to average net
assets(a) | | | | | | | | | | | | | | | | | | | | | | | | | | | | | | |
Expenses prior to fees waived or expenses reimbursed | | | | 1.07% | (b) | | | | 1.12% | | | | | 1.18% | | | | | 1.16% | | | | | 1.14% | | | | | 1.17% | |
Net expenses after fees waived or expenses reimbursed(c) | | | | 1.01% | (b) | | | | 1.06% | | | | | 1.12% | | | | | 1.06% | | | | | 0.87% | | | | | 1.08% | |
Net investment income | | | | 2.82% | (b) | | | | 3.10% | | | | | 3.35% | | | | | 2.86% | | | | | 3.64% | | | | | 3.27% | |
Supplemental data | | | | | | | | | | | | | | | | | | | | | | | | | | | | | | |
Net assets, end of period (in thousands) | | | | $395 | | | | | $291 | | | | | $407 | | | | | $169 | | | | | $118 | | | | | $112 | |
Portfolio turnover | | | | 19% | | | | | 57% | | | | | 62% | | | | | 69% | | | | | 75% | | | | | 77% | |
Notes to Financial Highlights
| (a) | In addition to the fees and expenses which the Fund bears directly, the Fund indirectly bears a pro rata share of the fees and expenses of the acquired funds in which it invests. Such indirect expenses are not included in the reported expense ratios. |
| (c) | The Investment Manager and certain of its affiliates agreed to waive/reimburse certain fees and expenses, if applicable. |
The accompanying Notes to Financial Statements are an integral part of this statement.
| | |
| 38 | | COLUMBIA GLOBAL BOND FUND — 2012 SEMIANNUAL REPORT |
| | | | | | | | | | | | | | | | | | | | | | | | | | | | | | |
| | | Six months
ended April 30, 2012 | | Year ended Oct. 31, |
| | | | 2011 | | 2010 | | 2009 | | 2008 | | 2007(a) |
| | | (Unaudited) | | | | | | | | | | |
Class W | | | | | | | | | | | | | | | | | | | | | | | | | | | | | | |
Per share data | | | | | | | | | | | | | | | | | | | | | | | | | | | | | | |
Net asset value, beginning of period | | | | $7.35 | | | | | $7.46 | | | | | $7.09 | | | | | $6.15 | | | | | $6.88 | | | | | $6.79 | |
Income from investment
operations: | | | | | | | | | | | | | | | | | | | | | | | | | | | | | | |
Net investment income | | | | 0.10 | | | | | 0.22 | | | | | 0.22 | | | | | 0.17 | | | | | 0.22 | | | | | 0.20 | |
Net realized and unrealized gain (loss) | | | | 0.04 | | | | | (0.04 | ) | | | | 0.31 | | | | | 1.14 | | | | | (0.73 | ) | | | | 0.17 | |
Total from investment operations | | | | 0.14 | | | | | 0.18 | | | | | 0.53 | | | | | 1.31 | | | | | (0.51 | ) | | | | 0.37 | |
Less distributions to shareholders from: | | | | | | | | | | | | | | | | | | | | | | | | | | | | | | |
Net investment income | | | | (0.43 | ) | | | | (0.29 | ) | | | | (0.16 | ) | | | | (0.37 | ) | | | | (0.22 | ) | | | | (0.28 | ) |
Net realized gains | | | | (0.03 | ) | | | | — | | | | | — | | | | | — | | | | | — | | | | | — | |
Total distributions to shareholders | | | | (0.46 | ) | | | | (0.29 | ) | | | | (0.16 | ) | | | | (0.37 | ) | | | | (0.22 | ) | | | | (0.28 | ) |
Net asset value, end of period | | | | $7.03 | | | | | $7.35 | | | | | $7.46 | | | | | $7.09 | | | | | $6.15 | | | | | $6.88 | |
Total return | | | | 2.11% | | | | | 2.59% | | | | | 7.66% | | | | | 22.04% | | | | | (7.62% | ) | | | | 5.71% | |
Ratios to average net
assets(b) | | | | | | | | | | | | | | | | | | | | | | | | | | | | | | |
Expenses prior to fees waived or expenses reimbursed | | | | 1.32% | (c) | | | | 1.36% | | | | | 1.31% | | | | | 1.30% | | | | | 1.30% | | | | | 1.35% | (c) |
Net expenses after fees waived or expenses reimbursed(d) | | | | 1.17% | (c) | | | | 1.21% | (e) | | | | 1.27% | | | | | 1.27% | | | | | 1.27% | | | | | 1.26% | (c) |
Net investment income | | | | 2.73% | (c) | | | | 2.95% | (e) | | | | 3.15% | | | | | 2.70% | | | | | 3.27% | | | | | 3.34% | (c) |
Supplemental data | | | | | | | | | | | | | | | | | | | | | | | | | | | | | | |
Net assets, end of period (in thousands) | | | | $31,109 | | | | | $52,531 | | | | | $69,842 | | | | | $60,278 | | | | | $135,157 | | | | | $54,191 | |
Portfolio turnover | | | | 19% | | | | | 57% | | | | | 62% | | | | | 69% | | | | | 75% | | | | | 77% | |
Notes to Financial Highlights
| (a) | For the period from December 1, 2006 (commencement of operations) to October 31, 2007. |
| (b) | In addition to the fees and expenses which the Fund bears directly, the Fund indirectly bears a pro rata share of the fees and expenses of the acquired funds in which it invests. Such indirect expenses are not included in the reported expense ratios. |
| (d) | The Investment Manager and certain of its affiliates agreed to waive/reimburse certain fees and expenses, if applicable. |
| (e) | The benefits derived from expense reductions had an impact of less than 0.01%. |
The accompanying Notes to Financial Statements are an integral part of this statement.
| | | | |
| COLUMBIA GLOBAL BOND FUND — 2012 SEMIANNUAL REPORT | | | 39 | |
| | |
| Financial Highlights (continued) | | |
| | | | | | | | | | | | | | | |
| | | Six months
ended April 30, 2012 | | Year ended Oct. 31, |
| | | | 2011 | | 2010(a) |
| | | (Unaudited) | | | | |
Class Z | | | | | | | | | | | | | | | |
Per share data | | | | | | | | | | | | | | | |
Net asset value, beginning of period | | | | $7.36 | | | | | $7.48 | | | | | $7.33 | |
Income from investment
operations: | | | | | | | | | | | | | | | |
Net investment income | | | | 0.10 | | | | | 0.23 | | | | | 0.01 | |
Net realized and unrealized gain (loss) | | | | 0.05 | | | | | (0.03 | ) | | | | 0.14 | |
Total from investment operations | | | | 0.15 | | | | | 0.20 | | | | | 0.15 | |
Less distributions to shareholders
from: | | | | | | | | | | | | | | | |
Net investment income | | | | (0.44 | ) | | | | (0.32 | ) | | | | — | |
Net realized gains | | | | (0.03 | ) | | | | — | | | | | — | |
Total distributions to shareholders | | | | (0.47 | ) | | | | (0.32 | ) | | | | — | |
Net asset value, end of period | | | | $7.04 | | | | | $7.36 | | | | | $7.48 | |
Total return | | | | 2.27% | | | | | 2.83% | | | | | 2.05% | |
Ratios to average net
assets(b) | | | | | | | | | | | | | | | |
Expenses prior to fees waived or
expenses reimbursed | | | | 1.02% | (c) | | | | 0.96% | | | | | 1.13% | (c) |
Net expenses after fees waived or
expenses reimbursed(d) | | | | 0.89% | (c) | | | | 0.94% | (e) | | | | 0.95% | (c) |
Net investment income | | | | 2.88% | (c) | | | | 3.19% | (e) | | | | 2.31% | (c) |
Supplemental data | | | | | | | | | | | | | | | |
Net assets, end of period (in thousands) | | | | $1,353 | | | | | $768 | | | | | $8 | |
Portfolio turnover | | | | 19% | | | | | 57% | | | | | 62% | |
Notes to Financial Highlights
| (a) | For the period from September 27, 2010 (commencement of operations) to October 31, 2010. |
| (b) | In addition to the fees and expenses which the Fund bears directly, the Fund indirectly bears a pro rata share of the fees and expenses of the acquired funds in which it invests. Such indirect expenses are not included in the reported expense ratios. |
| (d) | The Investment Manager and certain of its affiliates agreed to waive/reimburse certain fees and expenses, if applicable. |
| (e) | The benefits derived from expense reductions had an impact of less than 0.01%. |
The accompanying Notes to Financial Statements are an integral part of this statement.
| | |
| 40 | | COLUMBIA GLOBAL BOND FUND — 2012 SEMIANNUAL REPORT |
| | |
| Notes to Financial Statements | | |
April 30, 2012 (Unaudited)
Columbia Global Bond Fund (the Fund), a series of Columbia Funds Series Trust II (the Trust), is a non-diversified fund. The Trust is registered under the Investment Company Act of 1940, as amended (the 1940 Act), as an open-end management investment company organized as a Massachusetts business trust.
Fund Shares
The Trust may issue an unlimited number of shares (without par value). The Fund offers Class A, Class B, Class C, Class I, Class R, Class R4, Class W and Class Z shares. All share classes have identical voting, dividend and liquidation rights. Each share class has its own expense structure and sales charges, as applicable.
Class A shares are subject to a maximum front-end sales charge of 4.75% based on the initial investment amount. Class A shares purchased without an initial sales charge in accounts aggregating $1 million to $50 million at the time of purchase are subject to a contingent deferred sales charge (CDSC) if the shares are sold within 18 months of purchase, charged as follows: 1.00% CDSC if redeemed within 12 months of purchase, and 0.50% CDSC if redeemed more than 12, but less than 18, months after purchase.
Class B shares may be subject to a maximum CDSC of 5.00% based upon the holding period after purchase. Class B shares will generally convert to Class A shares eight years after purchase. The Fund no longer accepts investments by new or existing investors in the Fund’s Class B shares, except in connection with the reinvestment of any dividend and/or capital gain distributions in Class B shares of the Fund and exchanges by existing Class B shareholders of certain other funds within the Columbia Family of Funds.
Class C shares are subject to a 1.00% CDSC on shares redeemed within one year of purchase.
Class I shares are not subject to sales charges and are only available to the Columbia Family of Funds.
Class R shares are not subject to sales charges and are only available to qualifying institutional investors.
Class R4 shares are not subject to sales charges; however, this share class is closed to new investors.
Class W shares are not subject to sales charges and are only available to investors purchasing through authorized investment programs managed by investment professionals, including discretionary managed account programs.
| | | | |
| COLUMBIA GLOBAL BOND FUND — 2012 SEMIANNUAL REPORT | | | 41 | |
| | |
| Notes to Financial Statements (continued) | | |
Class Z shares are not subject to sales charges, and are only available to certain investors, as described in the Fund’s prospectus.
Note 2. Summary of Significant Accounting Policies
Use of Estimates
The preparation of financial statements in accordance with U.S. generally accepted accounting principles (GAAP) requires management to make certain estimates and assumptions that affect the reported amounts of assets and liabilities, the disclosure of contingent assets and liabilities at the date of the financial statements and the reported amounts of revenue and expenses during the reporting period. Actual results could differ from those estimates.
The following is a summary of significant accounting policies consistently followed by the Fund in the preparation of its financial statements.
Security Valuation
All equity securities are valued at the close of business of the New York Stock Exchange (NYSE). Equity securities are valued at the last quoted sales price on the principal exchange or market on which they trade, except for securities traded on the NASDAQ Stock Market, which are valued at the NASDAQ official close price. Unlisted securities or listed securities for which there were no sales during the day are valued at the mean of the latest quoted bid and asked prices on such exchanges or markets.
Debt securities generally are valued by pricing services approved by the Board of Trustees (the Board) based upon market transactions for normal, institutional-size trading units of similar securities. The services may use various pricing techniques which take into account appropriate factors such as yield, quality, coupon rate, maturity, type of issue, trading characteristics and other data, as well as broker quotes. Debt securities for which quotations are readily available may also be valued based upon an over-the-counter or exchange bid quotation.
Asset and mortgage-backed securities are generally valued by pricing services, which utilize pricing models that incorporate the securities’ cash flow and loan performance data. These models also take into account available market data, including trades, market quotations, and benchmark yield curves for identical or similar securities. Factors used to identify similar securities may include, but are not limited to, issuer, collateral type, vintage, prepayment speeds, collateral performance, credit ratings, credit enhancement and expected life. Asset-backed securities for which quotations are readily available may also be valued based upon an over-the-counter or exchange bid quotation.
| | |
| 42 | | COLUMBIA GLOBAL BOND FUND — 2012 SEMIANNUAL REPORT |
Foreign securities are valued based on quotations from the principal market in which such securities are normally traded. If any foreign share prices are not readily available as a result of limited share activity the securities are valued at the mean of the latest quoted bid and asked prices on such exchanges or markets. Foreign currency exchange rates are generally determined at 4:00 p.m. Eastern (U.S.) time. However, many securities markets and exchanges outside the U.S. close prior to the close of the NYSE; therefore, the closing prices for securities in such markets or on such exchanges may not fully reflect events that occur after such close but before the close of the NYSE. In those situations, foreign securities will be fair valued pursuant to the policy adopted by the Board, including utilizing a third party pricing service to determine these fair values. The third party pricing service takes into account multiple factors, including, but not limited to, movements in the U.S. securities markets, certain depositary receipts, futures contracts and foreign exchange rates that have occurred subsequent to the close of the foreign exchange, to determine a good faith estimate that reasonably reflects the current market conditions as of the close of the NYSE. The fair value of a security is likely to be different from the quoted or published price, if available.
Investments in other open-end investment companies, including money market funds, are valued at net asset value.
Short-term securities purchased within 60 days to maturity are valued at amortized cost, which approximates market value. The value of short-term securities originally purchased with maturities greater than 60 days is determined based on an amortized value to par upon reaching 60 days to maturity. Short-term securities maturing in more than 60 days from the valuation date are valued at the market price or approximate market value based on current interest rates.
Forward foreign currency exchange contracts are marked-to-market based upon foreign currency exchange rates provided by a pricing service.
Futures and options on futures contracts are valued based upon the settlement price established each day by the board of trade or exchange on which they are traded.
Investments for which market quotations are not readily available, or that have quotations which management believes are not reliable, are valued at fair value as determined in good faith under consistently applied procedures established by and under the general supervision of the Board. If a security or class of securities (such as foreign securities) is valued at fair value, such value is likely to be different from the last quoted market price for the security. The determination of fair value often requires significant judgment. To determine fair value, management may use assumptions including but not limited to future cash flows
| | | | |
| COLUMBIA GLOBAL BOND FUND — 2012 SEMIANNUAL REPORT | | | 43 | |
| | |
| Notes to Financial Statements (continued) | | |
and estimated risk premiums. Multiple inputs from various sources may be used to determine value.
Foreign Currency Transactions and Translation
The values of all assets and liabilities denominated in foreign currencies are translated into U.S. dollars at that day’s exchange rates. Net realized and unrealized gains (losses) on foreign currency transactions and translations include gains (losses) arising from the fluctuation in exchange rates between trade and settlement dates on securities transactions, gains (losses) arising from the disposition of foreign currency and currency gains (losses) between the accrual and payment dates on dividends, interest income and foreign withholding taxes.
For financial statement purposes, the Fund does not distinguish that portion of gains (losses) on investments which is due to changes in foreign exchange rates from that which is due to changes in market prices of the investments. Such fluctuations are included with the net realized and unrealized gains (losses) on investments in the Statement of Operations.
Derivative Instruments
The Fund invests in certain derivative instruments as detailed below to meet its investment objectives. Derivatives are instruments whose values depend on, or are derived from, in whole or in part, the value of one or more other assets, such as securities, currencies, commodities or indices. Derivative instruments may be used to maintain cash reserves while maintaining exposure to certain other assets, to offset anticipated declines in values of investments, to facilitate trading, to reduce transaction costs and to pursue higher investment returns. The Fund may also use derivative instruments to mitigate certain investment risks, such as foreign currency exchange rate risk, interest rate risk and credit risk. Derivatives may involve various risks, including the potential inability of the counterparty to fulfill its obligation under the terms of the contract, the potential for an illiquid secondary market and the potential for market movements which may expose the Fund to gains or losses in excess of the amount shown in the Statement of Assets and Liabilities.
The Fund and any counterparty are required to maintain an agreement that requires the Fund and that counterparty to monitor (on a daily basis) the net fair value of all derivatives entered into pursuant to the agreement between the Fund and such counterparty. If the net fair value of such derivatives between the Fund and that counterparty exceeds a certain threshold (as defined in the agreement), the Fund or the counterparty (as the case may be) is required to post cash and/or securities as collateral. Fair values of derivatives presented in the financial statements are not netted with the fair value of other derivatives or with any collateral amounts posted by the Fund or any counterparty.
| | |
| 44 | | COLUMBIA GLOBAL BOND FUND — 2012 SEMIANNUAL REPORT |
Forward Foreign Currency Exchange Contracts
Forward foreign currency exchange contracts are agreements between two parties to buy and sell a currency at a set price on a future date. These contracts are intended to be used to minimize the exposure to foreign exchange rate fluctuations during the period between the trade and settlement dates of the contract. The Fund utilized forward foreign currency exchange contracts to hedge the currency exposure associated with some or all of the Fund’s securities, to shift foreign currency exposure back to U.S. dollars, to shift investment exposure from one currency to another, to shift U.S. dollar exposure to achieve a representative weighted mix of major currencies in its benchmark, to recover an underweight country exposure in its portfolio and/or to go long and short foreign currencies versus the U.S. dollar as a way to generate returns.
The values of forward foreign currency exchange contracts fluctuate with changes in foreign currency exchange rates. The Fund will record a realized gain or loss when the forward foreign currency exchange contract is closed.
The use of forward foreign currency exchange contracts does not eliminate fluctuations in the prices of the Fund’s portfolio securities. The risks of forward foreign currency exchange contracts include movement in the values of the foreign currencies relative to the U.S. dollar (or other foreign currencies) and the possibility that counterparties will not complete their contractual obligations, which may be in excess of the amount reflected, if any, in the Statement of Assets and Liabilities.
Futures Contracts
Futures contracts represent commitments for the future purchase or sale of an asset at a specified price on a specified date. The Fund bought and sold futures contracts to produce incremental earnings, manage the duration and yield curve exposure of the Fund versus its benchmark index, manage exposure to movements in interest rates and to go long and short bond futures to generate returns. Upon entering into futures contracts, the Fund bears risks which may include interest rates, exchange rates or securities prices moving unexpectedly, in which case the Fund may not achieve the anticipated benefits of the futures contracts and may realize a loss. Additional risks include counterparty credit risk, the possibility of an illiquid market, and that a change in the value of the contract or option may not correlate with changes in the value of the underlying asset.
Upon entering into a futures contract, the Fund pledges cash or securities with the broker in an amount sufficient to meet the initial margin requirement. Subsequent payments (variation margin) are made or received by the Fund each day. The variation margin payments are equal to the daily change in the contract
| | | | |
| COLUMBIA GLOBAL BOND FUND — 2012 SEMIANNUAL REPORT | | | 45 | |
| | |
| Notes to Financial Statements (continued) | | |
value and are recorded as variation margin receivable or payable and are offset in unrealized gains or losses. The Fund recognizes a realized gain or loss when the contract is closed or expires. Futures contracts involve, to varying degrees, risk of loss in excess of the variation margin disclosed in the Statement of Assets and Liabilities.
Effects of Derivative Transactions in the Financial Statements
The following tables are intended to provide additional information about the effect of derivatives on the financial statements of the Fund, including: the fair value of derivatives by risk category and the location of those fair values in the Statement of Assets and Liabilities; the impact of derivative transactions on the Fund’s operations over the period including realized gains or losses and unrealized gains or losses. The derivative schedules following the Portfolio of Investments present additional information regarding derivative instruments outstanding at the end of the period, if any.
Fair Values of Derivative Instruments at April 30, 2012
| | | | | | | | | | | | |
Risk Exposure
Category | | Asset derivatives | | | Liability derivatives | |
| | Statement of Assets
and Liabilities
Location | | Fair Value | | | Statement of Assets
and Liabilities
Location | | Fair Value | |
Foreign exchange contracts | | Unrealized appreciation on forward foreign currency exchange contracts | | $ | 1,416,784 | | | Unrealized
depreciation on
forward foreign
currency exchange
contracts | | $ | 1,220,673 | |
Interest rate contracts | | Net assets — unrealized appreciation on futures contracts | | | 37,139 | * | | Net assets —
unrealized
depreciation on
futures contracts | | | 102,629 | * |
Total | | | | $ | 1,453,923 | | | | | $ | 1,323,302 | |
| * | Includes cumulative appreciation (depreciation) of futures contracts as reported in the Futures Contracts Outstanding table following the Portfolio of Investments. Only the current day’s variation margin is reported in receivables or payables in the Statement of Assets and Liabilities. |
| | |
| 46 | | COLUMBIA GLOBAL BOND FUND — 2012 SEMIANNUAL REPORT |
Effect of Derivative Instruments in the Statement of Operations for the Six Months Ended April 30, 2012
| | | | | | | | | | | | |
| Amount of Realized Gain (Loss) on Derivatives Recognized in Income | |
| Risk Exposure Category | | Forward Foreign
Currency Exchange
Contracts | | | Futures Contracts | | | Total | |
Foreign exchange contracts | | $ | 3,167,284 | | | $ | — | | | $ | 3,167,284 | |
Interest rate contracts | | | — | | | | (314,194 | ) | | $ | (314,194 | ) |
Total | | $ | 3,167,284 | | | $ | (314,194 | ) | | $ | 2,853,090 | |
| | | | | | | | | | | | |
|
| Change in Unrealized Appreciation (Depreciation) on Derivatives Recognized in Income | |
| Risk Exposure Category | | Forward Foreign
Currency Exchange
Contracts | | | Futures Contracts | | | Total | |
Foreign exchange contracts | | $ | 398,006 | | | $ | — | | | $ | 398,006 | |
Interest rate contracts | | | — | | | | (78,127 | ) | | $ | (78,127 | ) |
Total | | $ | 398,006 | | | $ | (78,127 | ) | | $ | 319,879 | |
Volume of Derivative Instruments for the Six Months Ended April 30, 2012
| | | | | | | | | | |
| | | Contracts Opened | |
Forward Foreign Currency Exchange Contracts | | | 402 | |
Futures Contracts | | | 1,838 | |
Repurchase Agreements
The Fund may engage in repurchase agreement transactions with institutions that management has determined are creditworthy. The Fund, through the custodian, receives delivery of the underlying securities collateralizing a repurchase agreement. Management is responsible for determining that the collateral is at least equal, at all times, to the value of the repurchase obligation including interest. A repurchase agreement transaction involves certain risks in the event of default or insolvency of the counterparty. These risks include possible delays in or restrictions on a Fund’s ability to dispose of the underlying securities and a possible decline in the value of the underlying securities during the period while the Fund seeks to assert its rights.
Delayed Delivery Securities and Forward Sale Commitments
The Fund may trade securities on other than normal settlement terms, including securities purchased or sold on a “when-issued” basis. This may increase the risk if the other party to the transaction fails to deliver and causes the Fund to subsequently invest at less advantageous prices. The Fund designates cash or liquid securities in an amount equal to the delayed delivery commitment.
| | | | |
| COLUMBIA GLOBAL BOND FUND — 2012 SEMIANNUAL REPORT | | | 47 | |
| | |
| Notes to Financial Statements (continued) | | |
The Fund may enter into forward sale commitments to hedge its portfolio positions or to sell mortgage-backed securities it owns under delayed delivery arrangements. Proceeds of forward sale commitments are not received until the contractual settlement date. While a forward sale commitment is outstanding, equivalent deliverable securities or an offsetting forward purchase commitment deliverable on or before the sale commitment date, are used to satisfy the commitment.
Unsettled forward sale commitments are valued at the current market value of the underlying securities, generally according to the procedures described under “Security Valuation” above. The forward sale commitment is “marked-to-market” daily and the change in market value is recorded by the Fund as an unrealized gain or loss. If the forward sale commitment is closed through the acquisition of an offsetting purchase commitment, the Fund realizes a gain or loss. If the Fund delivers securities under the commitment, the Fund realizes a gain or a loss from the sale of the securities based upon the market price established at the date the commitment was entered into.
Treasury Inflation Protected Securities
The Fund may invest in treasury inflation protected securities (TIPS). The principal amount of TIPS is adjusted periodically and is increased for inflation or decreased for deflation based on a monthly published index. Interest payments are based on the adjusted principal at the time the interest is paid. These adjustments are recorded as interest income in the Statement of Operations.
Interest Only Securities
The Fund may invest in Interest Only Securities (IOs). IOs are stripped mortgage backed securities entitled to receive all of the security’s interest, but none of its principal. Interest is accrued daily. The daily accrual factor is adjusted each month to reflect the paydown of principal.
Security Transactions
Security transactions are accounted for on the trade date. Cost is determined and gains (losses) are based upon the specific identification method for both financial statement and federal income tax purposes.
Income Recognition
Interest income is recorded on the accrual basis. Market premium and discount are amortized and accreted, respectively, on all debt securities, unless otherwise noted. Original issue discount is accreted to interest income over the life of the security with a corresponding increase in the cost basis, if any. For convertible securities, premiums attributable to the conversion feature are not amortized.
| | |
| 48 | | COLUMBIA GLOBAL BOND FUND — 2012 SEMIANNUAL REPORT |
Inflation adjustments to the principal amount and cost basis of inflation-indexed securities are included in interest income.
Dividend income is recorded on the ex-dividend date.
The value of additional securities received as an income payment is recorded as income and increases the cost basis of such securities.
Expenses
General expenses of the Trust are allocated to the Fund and other funds of the Trust based upon relative net assets or other expense allocation methodologies determined by the nature of the expense. Expenses directly attributable to the Fund are charged to the Fund. Expenses directly attributable to a specific class of shares are charged to that share class.
Determination of Class Net Asset Value
All income, expenses (other than class-specific expenses, which are charged to that share class, as shown in the Statement of Operations) and realized and unrealized gains (losses) are allocated to each class of the Fund on a daily basis, based on the relative net assets of each class, for purposes of determining the net asset value of each class.
Federal Income Tax Status
The Fund intends to qualify each year as a regulated investment company under Subchapter M of the Internal Revenue Code, as amended, and will distribute substantially all of its tax exempt income (including net short-term capital gains), if any, for its tax year, and as such will not be subject to federal income taxes. In addition, the Fund intends to distribute in each calendar year substantially all of its net investment income, capital gains and certain other amounts, if any, such that the Fund should not be subject to federal excise tax. Therefore, no federal income or excise tax provision is recorded.
Foreign Taxes
The Fund may be subject to foreign taxes on income, gains on investments or currency repatriation, a portion of which may be recoverable. The Fund will accrue such taxes and recoveries, as applicable, based upon its current interpretation of tax rules and regulations that exist in the markets in which it invests.
Realized gains in certain countries may be subject to foreign taxes at the Fund level, based on statutory rates. The Fund accrues for such foreign taxes on net realized and unrealized gains at the appropriate rate for each jurisdiction, as applicable.
Distributions to Shareholders
Distributions from net investment income, if any, are declared and paid each calendar quarter. Net realized capital gains, if any, are distributed along with the
| | | | |
| COLUMBIA GLOBAL BOND FUND — 2012 SEMIANNUAL REPORT | | | 49 | |
| | |
| Notes to Financial Statements (continued) | | |
income dividend. Income distributions and capital gain distributions are determined in accordance with federal income tax regulations which may differ from GAAP.
Guarantees and Indemnifications
Under the Trust’s organizational documents and, in some cases, by contract, its officers and trustees are indemnified against certain liabilities arising out of the performance of their duties to the Trust or its funds. In addition, certain of the Fund’s contracts with its service providers contain general indemnification clauses. The Fund’s maximum exposure under these arrangements is unknown since the amount of any future claims that may be made against the Fund cannot be determined, and the Fund has no historical basis for predicting the likelihood of any such claims.
Recent Accounting Pronouncement
Fair Value Measurements and Disclosures
In May 2011, the Financial Accounting Standards Board (FASB) issued ASU No. 2011-04 modifying Topic 820, Fair Value Measurements and Disclosures. At the same time, the International Accounting Standards Board (IASB) issued International Financial Reporting Standard 13, Fair Value Measurement. The objective of the FASB and IASB is convergence of their guidance on fair value measurements and disclosures.
Specifically, ASU No. 2011-04 requires reporting entities to disclose i) the amounts of any transfers between Level 1 and Level 2, and the reasons for the transfers, ii) for Level 3 fair value measurements, a) quantitative information about significant unobservable inputs used, b) a description of the valuation processes used by the reporting entity and c) a narrative description of the sensitivity of the fair value measurement to changes in unobservable inputs if a change in those inputs might result in a significantly higher or lower fair value measurement. The effective date of ASU No. 2011-04 is for interim and annual periods beginning after December 15, 2011. At this time, management is evaluating the implications of this guidance and the impact it will have on the financial statement amounts and footnote disclosures, if any.
| Note | 3. Fees and Compensation Paid to Affiliates |
Investment Management Fees
Under an Investment Management Services Agreement, Columbia Management Investment Advisers, LLC (the Investment Manager), a wholly-owned subsidiary of Ameriprise Financial, Inc. (Ameriprise Financial), determines which securities will be purchased, held or sold. The management fee is an annual fee that is equal to a percentage of the Fund’s average daily net assets that declines from
| | |
| 50 | | COLUMBIA GLOBAL BOND FUND — 2012 SEMIANNUAL REPORT |
0.57% to 0.47% as the Fund’s net assets increase. The annualized effective management fee rate for the six months ended April 30, 2012 was 0.57% of the Fund’s average daily net assets.
Administration Fees
Under an Administrative Services Agreement, the Investment Manager serves as the Fund Administrator. The Fund pays the Fund Administrator an annual fee for administration and accounting services equal to a percentage of the Fund’s average daily net assets that declines from 0.08% to 0.05% as the Fund’s net assets increase. The annualized effective administration fee rate for the six months ended April 30, 2012 was 0.08% of the Fund’s average daily net assets.
Other Expenses
Other expenses are for, among other things, certain expenses of the Fund or the Board, including: Fund boardroom and office expense, employee compensation, employee health and retirement benefits, and certain other expenses. Payment of these Fund and Board expenses is facilitated by a company providing limited administrative services to the Fund and the Board. For the six months ended April 30, 2012, other expenses paid to this company were $1,312.
Compensation of Board Members
Board members are compensated for their services to the Fund as disclosed in the Statement of Operations. Under a Deferred Compensation Plan (the Plan), the Board members who are not “interested persons” of the Fund, as defined under the 1940 Act, may elect to defer payment of up to 100% of their compensation. Deferred amounts are treated as though equivalent dollar amounts had been invested in shares of certain funds managed by the Investment Manager. The Fund’s liability for these amounts is adjusted for market value changes and remains in the Fund until distributed in accordance with the Plan.
Transfer Agent Fees
Under a Transfer and Dividend Disbursing Agent Agreement, Columbia Management Investment Services Corp. (the Transfer Agent), an affiliate of the Investment Manager and a wholly-owned subsidiary of Ameriprise Financial, is responsible for providing transfer agency services to the Fund. The Transfer Agent has contracted with Boston Financial Data Services (BFDS) to serve as sub-transfer agent.
The Transfer Agent receives monthly account-based service fees based on the number of open accounts and is reimbursed by the Fund for the fees and expenses the Transfer Agent pays to financial intermediaries that maintain omnibus accounts with the Fund that is a percentage of the average aggregate value of the Fund’s shares maintained in each such omnibus account (other than omnibus accounts for which American Enterprise Investment Services Inc. is the
| | | | |
| COLUMBIA GLOBAL BOND FUND — 2012 SEMIANNUAL REPORT | | | 51 | |
| | |
| Notes to Financial Statements (continued) | | |
broker of record or accounts where the beneficial shareholder is a customer of Ameriprise Financial Services, Inc., which are paid a per account fee). The Transfer Agent pays the fees of BFDS for services as sub-transfer agent and is not entitled to reimbursement for such fees from the Fund (with the exception of out-of-pocket fees).
The Transfer Agent also receives compensation from fees for various shareholder services and reimbursements for certain out-of-pocket expenses. Class I shares do not pay transfer agent fees. Total transfer agent fees for Class R4 shares are subject to an annual limitation of not more than 0.05% of the average daily net assets attributable to the share class.
For the six months ended April 30, 2012, the Fund’s annualized effective transfer agent fee rates as a percentage of average daily net assets of each class were as follows:
| | | | |
Class A | | | 0.29 | % |
Class B | | | 0.33 | |
Class C | | | 0.28 | |
Class R | | | 0.31 | |
Class R4 | | | 0.05 | |
Class W | | | 0.30 | |
Class Z | | | 0.25 | |
An annual minimum account balance fee of $20 may apply to certain accounts with a value below the Fund’s initial minimum investment requirements to reduce the impact of small accounts on transfer agent fees. These minimum account balance fees are recorded as part of expense reductions in the Statement of Operations. For the six months ended April 30, 2012, no minimum account balance fees were charged by the Fund.
Plan Administration Fees
Under a Plan Administration Services Agreement with the Transfer Agent, the Fund pays an annual fee at a rate of 0.25% of the Fund’s average daily net assets attributable to Class R4 shares for the provision of various administrative, recordkeeping, communication and educational services.
Distribution Fees
The Fund has an agreement with Columbia Management Investment Distributors, Inc. (the Distributor), an affiliate of the Investment Manager and a wholly-owned subsidiary of Ameriprise Financial, for distribution and shareholder services. Under a Plan and Agreement of Distribution pursuant to Rule 12b-1, the Fund pays a fee at an annual rate of up to 0.25% of the Fund’s average daily net assets attributable to Class A and Class W shares, a fee at an annual rate of up to 0.50% of the Fund’s average daily net assets attributable to
| | |
| 52 | | COLUMBIA GLOBAL BOND FUND — 2012 SEMIANNUAL REPORT |
Class R shares (of which up to 0.25% may be used for shareholder services) and a fee at an annual rate of up to 1.00% of the Fund’s average daily net assets attributable to Class B and Class C shares. For Class B and Class C shares, of the 1.00% fee, up to 0.75% is reimbursed for distribution expenses.
The amount of distribution expenses incurred by the Distributor and not yet reimbursed (unreimbursed expense) was approximately $885,000 and $90,000 for Class B and Class C shares, respectively. These amounts are based on the most recent information available as of March 31, 2012, and may be recovered from future payments under the distribution plan or CDSCs. To the extent the unreimbursed expense has been fully recovered, the distribution fee is reduced.
Sales Charges
Sales charges, including front-end charges and CDSCs, received by the Distributor for distributing Fund shares were $88,852 for Class A, $1,638 for Class B and $336 for Class C shares for the six months ended April 30, 2012.
Expenses Waived/Reimbursed by the Investment Manager and its Affiliates
Effective January 1, 2012, the Investment Manager and certain of its affiliates have contractually agreed to waive fees and/or reimburse expenses (excluding certain fees and expenses described below), through February 28, 2013, unless sooner terminated at the sole discretion of the Board, so that the Fund’s net operating expenses, after giving effect to fees waived/expenses reimbursed and any balance credits and/or overdraft charges from the Fund’s custodian, do not exceed the following annual rates as a percentage of the class’ average daily net assets:
| | | | |
Class A | | | 1.14 | % |
Class B | | | 1.89 | |
Class C | | | 1.89 | |
Class I | | | 0.69 | |
Class R | | | 1.39 | |
Class R4 | | | 0.99 | |
Class W | | | 1.14 | |
Class Z | | | 0.89 | |
Prior to January 1, 2012, the Investment Manager and its affiliates contractually agreed to waive fees and/or reimburse expenses (excluding certain fees and expenses described below), so that the Fund’s net operating expenses, after giving effect to fees waived/expenses reimbursed and any balance credits and/or
| | | | |
| COLUMBIA GLOBAL BOND FUND — 2012 SEMIANNUAL REPORT | | | 53 | |
| | |
| Notes to Financial Statements (continued) | | |
overdraft charges from the Fund’s custodian, did not exceed the following annual rates as a percentage of the class’ average daily net assets:
| | | | |
Class A | | | 1.21 | % |
Class B | | | 1.96 | |
Class C | | | 1.96 | |
Class I | | | 0.76 | |
Class R | | | 1.46 | |
Class R4 | | | 1.06 | |
Class W | | | 1.21 | |
Class Z | | | 0.96 | |
Under the agreement, the following fees and expenses are excluded from the waiver/reimbursement commitment, and therefore will be paid by the Fund, if applicable: taxes (including foreign transaction taxes), expenses associated with investments in affiliated and non-affiliated pooled investment vehicles (including mutual funds and exchange traded funds), transaction costs and brokerage commissions, costs related to any securities lending program, dividend expenses associated with securities sold short, inverse floater program fees and expenses, transaction charges and interest on borrowed money, interest, extraordinary expenses and any other expenses the exclusion of which is specifically approved by the Fund’s Board. This agreement may be modified or amended only with approval from all parties.
| Note | 4. Federal Tax Information |
The timing and character of income and capital gain distributions are determined in accordance with income tax regulations, which may differ from GAAP because of temporary or permanent book to tax differences.
At April 30, 2012, the cost of investments for federal income tax purposes was approximately $239,553,000 and the aggregate gross approximate unrealized appreciation and depreciation based on that cost was:
| | | | |
Unrealized appreciation | | $ | 21,294,000 | |
Unrealized depreciation | | | (2,231,000 | ) |
Net unrealized appreciation | | $ | 19,063,000 | |
Management of the Fund has concluded that there are no significant uncertain tax positions that would require recognition in the financial statements. However, management’s conclusion may be subject to review and adjustment at a later date based on factors including, but not limited to, new tax laws, regulations, and administrative interpretations (including relevant court decisions). Generally, the Fund’s federal tax returns for the prior three fiscal years remain subject to examination by the Internal Revenue Service.
| | |
| 54 | | COLUMBIA GLOBAL BOND FUND — 2012 SEMIANNUAL REPORT |
| Note | 5. Portfolio Information |
The cost of purchases and proceeds from sales of securities, excluding short-term obligations, aggregated to $48,150,312 and $88,475,672, respectively, for the six months ended April 30, 2012, of which $20,819,419 and $13,665,542, respectively, were U.S. government securities.
| Note | 6. Lending of Portfolio Securities |
The Fund has entered into a Master Securities Lending Agreement (the Agreement) with JPMorgan Chase Bank, N.A. (JPMorgan). The Agreement authorizes JPMorgan as lending agent to lend securities to authorized borrowers in order to generate additional income on behalf of the Fund. Pursuant to the Agreement, the securities loaned are secured by cash or U.S. government securities equal to at least 100% of the market value of the loaned securities. Any additional collateral required to maintain those levels due to market fluctuations of the loaned securities is requested to be delivered the following business day. Cash collateral received is invested by the lending agent on behalf of the Fund into authorized investments pursuant to the Agreement. The investments made with the cash collateral are listed in the Portfolio of Investments. The values of such investments and any uninvested cash collateral are disclosed in the Statement of Assets and Liabilities along with the related obligation to return the collateral upon the return of the securities loaned.
Risks of delay in recovery of securities or even loss of rights in the securities may occur should the borrower of the securities fail financially. Risks may also arise to the extent that the value of the securities loaned increases above the value of the collateral received. JPMorgan will indemnify the Fund from losses resulting from a borrower’s failure to return a loaned security when due. Such indemnification does not extend to losses associated with declines in the value of cash collateral investments. The Investment Manager is not responsible for any losses incurred by the Fund in connection with the securities lending program. Loans are subject to termination by the Fund or the borrower at any time, and are, therefore, not considered to be illiquid investments.
Pursuant to the Agreement, the Fund receives income for lending its securities either in the form of fees or by earning interest on invested cash collateral, net of negotiated rebates paid to borrowers and fees paid to the lending agent for services provided and any other securities lending expenses. Net income earned from securities lending for the six months ended April 30, 2012 is disclosed in the Statement of Operations. The Fund continues to earn and accrue interest and dividends on the securities loaned.
| | | | |
| COLUMBIA GLOBAL BOND FUND — 2012 SEMIANNUAL REPORT | | | 55 | |
| | |
| Notes to Financial Statements (continued) | | |
At April 30, 2012, securities valued at $10,172,975 were on loan, secured by U.S. government securities valued at $6,657,451 and by cash collateral of $3,628,497 (which does not reflect calls for collateral made to borrowers by JPMorgan at period end) that is partially or fully invested in short-term securities or other cash equivalents.
| Note | 7. Affiliated Money Market Fund |
The Fund may invest its daily cash balances in Columbia Short-Term Cash Fund, an affiliated money market fund established for the exclusive use by the Fund and other affiliated funds. The income earned by the Fund from such investments is included as “Dividends from affiliates” in the Statement of Operations. As an investing fund, the Fund indirectly bears its proportionate share of the expenses of Columbia Short-Term Cash Fund.
| Note | 8. Shareholder Concentration |
At April 30, 2012, one unaffiliated shareholder account owned 29.6% of the outstanding shares of the Fund. The Fund has no knowledge about whether any portion of those shares was owned beneficially by such accounts. Subscription and redemption activity by concentrated accounts may have a significant effect on the operations of the Fund.
The Fund has entered into a revolving credit facility with a syndicate of banks led by JPMorgan, whereby the Fund may borrow for the temporary funding of shareholder redemptions or for other temporary or emergency purposes. The credit facility agreement, as amended, which is a collective agreement between the Fund and certain other funds managed by the Investment Manager, severally and not jointly, permits collective borrowings up to $500 million. Pursuant to a December 13, 2011 amendment to the credit facility agreement, interest is charged to each participating fund based on its borrowings at a rate equal to the higher of (i) the overnight federal funds rate plus 1.00% or (i) the one-month LIBOR rate plus 1.00%. Each borrowing under the credit facility matures no later than 60 days after the date of borrowing. The Fund also pays a commitment fee equal to its pro rata share of the amount of the credit facility at a rate of 0.08% per annum.
Prior to December 13, 2011, interest was charged to each participating fund based on its borrowings at a rate equal to the sum of the federal funds rate plus (i) 1.25% per annum plus (ii) if one-month LIBOR exceeds the federal funds rate, the amount of such excess. The Fund also paid a commitment fee equal to its pro rata share of the amount of the credit facility at a rate of 0.10% per annum.
| | |
| 56 | | COLUMBIA GLOBAL BOND FUND — 2012 SEMIANNUAL REPORT |
The Fund had no borrowings during the six months ended April 30, 2012.
| Note | 10. Significant Risks |
Non-Diversification Risk
A non-diversified fund is permitted to invest a greater percentage of its total assets in fewer issuers than a diversified fund. The Fund may, therefore, have a greater risk of loss from a few issuers than a similar fund that invests more broadly.
Foreign Securities Risk
Investing in foreign securities may include certain risks and considerations not typically associated with investing in U.S. securities, such as fluctuating currency values and changing local and regional economic, political and social conditions, which may result in greater market volatility. In addition, certain foreign securities may not be as liquid as U.S. securities. Investing in emerging markets may accentuate these risks.
Investments in emerging market countries are subject to additional risk. The risk of foreign investments is typically increased in less developed countries. These countries are also more likely to experience high levels of inflation, deflation or currency devaluation which could hurt their economies and securities markets.
Geographic Concentration Risk
The Fund may be particularly susceptible to political, regulatory and economic events affecting companies and countries within the specific geographic region in which the Fund focuses its investments. Currency devaluation could occur in countries that have not yet experienced currency devaluations to date, or could continue to occur in countries that have already experienced such devaluations. As a result, the Fund may be more volatile than a more geographically diversified fund.
| Note | 11. Subsequent Events |
Management has evaluated the events and transactions that have occurred through the date the financial statements were issued and noted no items requiring adjustment of the financial statements or additional disclosure.
| Note | 12. Information Regarding Pending and Settled Legal Proceedings |
In December 2005, without admitting or denying the allegations, American Express Financial Corporation (AEFC, which is now known as Ameriprise Financial, Inc. (Ameriprise Financial)) entered into settlement agreements with the Securities and Exchange Commission (SEC) and Minnesota Department of Commerce (MDOC) related to market timing activities. As a result, AEFC was
| | | | |
| COLUMBIA GLOBAL BOND FUND — 2012 SEMIANNUAL REPORT | | | 57 | |
| | |
| Notes to Financial Statements (continued) | | |
censured and ordered to cease and desist from committing or causing any violations of certain provisions of the Investment Advisers Act of 1940, the Investment Company Act of 1940, and various Minnesota laws. AEFC agreed to pay disgorgement of $10 million and civil money penalties of $7 million. AEFC also agreed to retain an independent distribution consultant to assist in developing a plan for distribution of all disgorgement and civil penalties ordered by the SEC in accordance with various undertakings detailed at www.sec.gov/litigation/admin/ia-2451.pdf. Ameriprise Financial and its affiliates have cooperated with the SEC and the MDOC in these legal proceedings, and have made regular reports to the funds’ Boards of Trustees.
Ameriprise Financial and certain of its affiliates have historically been involved in a number of legal, arbitration and regulatory proceedings, including routine litigation, class actions, and governmental actions, concerning matters arising in connection with the conduct of their business activities. Ameriprise Financial believes that the Funds are not currently the subject of, and that neither Ameriprise Financial nor any of its affiliates are the subject of, any pending legal, arbitration or regulatory proceedings that are likely to have a material adverse effect on the Funds or the ability of Ameriprise Financial or its affiliates to perform under their contracts with the Funds. Ameriprise Financial is required to make 10-Q, 10-K and, as necessary, 8-K filings with the Securities and Exchange Commission on legal and regulatory matters that relate to Ameriprise Financial and its affiliates. Copies of these filings may be obtained by accessing the SEC website at www.sec.gov.
There can be no assurance that these matters, or the adverse publicity associated with them, will not result in increased fund redemptions, reduced sale of fund shares or other adverse consequences to the Funds. Further, although we believe proceedings are not likely to have a material adverse effect on the Funds or the ability of Ameriprise Financial or its affiliates to perform under their contracts with the Funds, these proceedings are subject to uncertainties and, as such, we are unable to estimate the possible loss or range of loss that may result. An adverse outcome in one or more of these proceedings could result in adverse judgments, settlements, fines, penalties or other relief that could have a material adverse effect on the consolidated financial condition or results of operations of Ameriprise Financial.
| | |
| 58 | | COLUMBIA GLOBAL BOND FUND — 2012 SEMIANNUAL REPORT |
The policy of the Board is to vote the proxies of the companies in which the Fund holds investments consistent with the procedures as stated in the Statement of Additional Information (SAI). You may obtain a copy of the SAI without charge by calling 800.345.6611; contacting your financial intermediary; visiting columbiamanagement.com; or searching the website of the Securities and Exchange Commission (SEC) at www.sec.gov. Information regarding how the Fund voted proxies relating to portfolio securities is filed with the SEC by August 31 for the most recent 12-month period ending June 30 of that year, and is available without charge by visiting columbiamanagement.com; or searching the website of the SEC at www.sec.gov.
| | |
| Approval of Investment Management Services |
| |
| Agreement | | |
Columbia Management Investment Advisers, LLC (“Columbia Management” or the “investment manager”), a wholly-owned subsidiary of Ameriprise Financial, Inc. (“Ameriprise Financial”), serves as the investment manager to Columbia Global Bond Fund (the “Fund”). Under an investment management services agreement (the “IMS Agreement”), Columbia Management provides investment advice and other services to the Fund and all funds distributed by Columbia Management Investment Distributors, Inc. (collectively, the “Funds”).
On an annual basis, the Fund’s Board of Trustees (the “Board”), including the independent Board members (the “Independent Trustees”), considers renewal of the IMS Agreement. Columbia Management prepared detailed reports for the Board and its Contracts Committee in March and April 2012, including reports based on analyses of data provided by an independent organization and a comprehensive response to each item of information requested by independent legal counsel to the Independent Trustees (“Independent Legal Counsel”) in a letter to the investment manager, to assist the Board in making this determination. All of the materials presented in March and April were first supplied in draft form to designated representatives of the Independent Trustees, i.e., Independent Legal Counsel, the Chair and the Chair of the Contracts Committee (including materials relating to the Fund’s expense cap), and the final materials were revised to reflect comments provided by these Board representatives. In addition, throughout the year, the Board (or its committees) regularly meets with portfolio management teams and senior management personnel, and reviews information prepared by Columbia Management addressing the services Columbia Management provides and Fund performance. The Board accords particular weight to the work, deliberations and conclusions of the Contracts Committee, the Investment Review Committee and the Compliance Committee in determining whether to continue the IMS Agreement.
| | | | |
| COLUMBIA GLOBAL BOND FUND — 2012 SEMIANNUAL REPORT | | | 59 | |
| | |
| Approval of Investment Management Services |
| |
| Agreement (continued) | | |
The Board, at its April 10-12, 2012 in-person Board meeting (the “April Meeting”), considered the renewal of the IMS Agreement for an additional one-year term. At the April Meeting, Independent Legal Counsel reviewed with the Independent Trustees various factors relevant to the Board’s consideration of advisory agreements and the Board’s legal responsibilities related to such consideration. Following an analysis and discussion of the factors identified below, the Board, including all of the Independent Trustees, approved the renewal of the IMS Agreement.
Nature, Extent and Quality of Services Provided by Columbia Management: The Independent Trustees analyzed various reports and presentations they had received detailing the services performed by Columbia Management, as well as its expertise, resources and capabilities. The Independent Trustees specifically considered many developments during the past year concerning the services provided by Columbia Management, including, in particular, the continued investment in, and resources dedicated to, the Funds’ operations and the successful completion of various integration initiatives and the consolidation of dozens of Funds. The Independent Trustees noted the information they received concerning Columbia Management’s ability to retain key portfolio management personnel. In that connection, the Independent Trustees took into account their meetings with Columbia Management’s Chief Investment Officer (the “CIO”) and considered the CIO’s successful execution of additional risk and portfolio management oversight applied to the Funds. The Independent Trustees also assessed Columbia Management’s significant investment in upgrading technology (such as an equity trading system) and considered management’s commitments to enhance existing resources in this area.
In connection with the Board’s evaluation of the overall package of services provided by Columbia Management, the Board also considered the quality of administrative services provided to the Fund by Columbia Management. In addition, the Board also reviewed the financial condition of Columbia Management (and its affiliates) and each entity’s ability to carry out its responsibilities under the IMS Agreement and the Fund’s other services agreements with affiliates of Ameriprise Financial. The Board also discussed the acceptability of the terms of the IMS Agreement (including the relatively broad scope of services required to be performed by Columbia Management). The Board concluded that the services being performed under the IMS Agreement were of a reasonably high quality.
| | |
| 60 | | COLUMBIA GLOBAL BOND FUND — 2012 SEMIANNUAL REPORT |
Based on the foregoing, and based on other information received (both oral and written, including the information on investment performance referenced below) and other considerations, the Board concluded that Columbia Management and its affiliates were in a position to continue to provide a high quality and level of services to the Fund.
Investment Performance: For purposes of evaluating the nature, extent and quality of services provided under the IMS Agreement, the Board carefully reviewed the investment performance of the Fund. In this regard, the Board considered detailed reports providing the results of analyses performed by an independent organization showing, for various periods, the performance of the Fund, the performance of a benchmark index, the percentage ranking of the Fund among its comparison group and the net assets of the Fund. The Board observed that the Fund’s investment performance met expectations.
Comparative Fees, Costs of Services Provided and the Profits Realized By Columbia Management and its Affiliates from their Relationships with the Fund: The Board reviewed comparative fees and the costs of services to be provided under the IMS Agreement. The Board members considered detailed comparative information set forth in an annual report on fees and expenses, including, among other things, data (based on analyses conducted by an independent organization) showing a comparison of the Fund’s expenses with median expenses paid by funds in its comparative peer universe, as well as data showing the Fund’s contribution to Columbia Management’s profitability. The Board reviewed the fees charged to comparable institutional or other accounts/vehicles managed by Columbia Management and discussed differences in how the products are managed and operated, noting no unreasonable differences in the levels of contractual fees.
The Board accorded particular weight to the notion that the level of fees should reflect a rational pricing model applied consistently across the various product lines in the Fund family, while assuring that the overall fees for each Fund (with few defined exceptions) are generally in line with the “pricing philosophy” (i.e., that the total expense ratio of the Fund is at, or below, the median expense ratio of funds in the same comparison universe of the Fund). The Board took into account that the Fund’s total expense ratio (after considering proposed expense caps/waivers) approximated the peer universe’s median expense ratio. Based on its review, the Board concluded that the Fund’s management fee was fair and reasonable in light of the extent and quality of services that the Fund receives.
The Board also considered the expected profitability of Columbia Management and its affiliates in connection with Columbia Management providing investment
| | | | |
| COLUMBIA GLOBAL BOND FUND — 2012 SEMIANNUAL REPORT | | | 61 | |
| | |
| Approval of Investment Management Services |
| |
| Agreement (continued) | | |
management services to the Fund. In this regard, the Board referred to a detailed profitability report, discussing the profitability to Columbia Management and Ameriprise Financial from managing, operating and distributing the Funds. In this regard, the Board observed that 2011 profitability, while slightly lower than 2010, was generally in line with the reported profitability of other asset management firms. The Board also considered the indirect economic benefits flowing to Columbia Management or its affiliates in connection with managing or distributing the Funds, such as the enhanced ability to offer various other financial products to Ameriprise Financial customers, soft dollar benefits and overall reputational advantages. The Board noted that the fees paid by the Fund should permit the investment manager to offer competitive compensation to its personnel, make necessary investments in its business and earn an appropriate profit. The Board concluded that profitability levels were reasonable.
Economies of Scale to be Realized: The Board also considered the economies of scale that might be realized by Columbia Management as the Fund grows and took note of the extent to which Fund shareholders might also benefit from such growth.
Based on the foregoing, the Board, including all of the Independent Trustees, concluded that the investment management service fees were fair and reasonable in light of the extent and quality of services provided. In reaching this conclusion, no single factor was determinative. On April 12, 2012, the Board, including all of the Independent Trustees, approved the renewal of the IMS Agreement.
| | |
| 62 | | COLUMBIA GLOBAL BOND FUND — 2012 SEMIANNUAL REPORT |
Columbia Global Bond Fund
P.O. Box 8081
Boston, MA 02266-8081
columbiamanagement.com
| | | | |
 | | This report must be accompanied or preceded by the Fund’s current prospectus. The
Fund is distributed by Columbia Management Investment Distributors, Inc., member
FINRA, and managed by Columbia Management Investment Advisers, LLC. ©2012 Columbia Management Investment Advisers, LLC. All rights reserved. | | S-6339 AC (6/12) |
Semiannual Report

Columbia
Global Equity Fund
Semiannual Report for the Period Ended April 30, 2012
Columbia Global Equity Fund seeks to provide shareholders with long-term capital growth.
Not FDIC insured ¡ No bank guarantee ¡ May lose value
| | | | |
| |
Your Fund at a Glance | | | 2 | |
| |
Fund Expense Example | | | 6 | |
| |
Portfolio of Investments | | | 8 | |
| |
Statement of Assets and Liabilities | | | 16 | |
| |
Statement of Operations | | | 18 | |
| |
Statement of Changes in Net Assets | | | 20 | |
| |
Financial Highlights | | | 22 | |
| |
Notes to Financial Statements | | | 31 | |
| |
Proxy Voting | | | 48 | |
| |
Approval of Investment Management Services and Subadvisory Agreements | | | 48 | |
See the Fund’s prospectus for risks associated with investing in the Fund.
| | | | |
| COLUMBIA GLOBAL EQUITY FUND — 2012 SEMIANNUAL REPORT | | | 1 | |
FUND SUMMARY
| > | | Columbia Global Equity Fund (the Fund) Class A shares gained 8.93% (excluding sales charge) for the six months ended April 30, 2012. |
| > | | The Fund outperformed its benchmark, the MSCI All Country World Index (Net), which gained 7.07% during the same six-month period. |
ANNUALIZED TOTAL RETURNS (for period ended April 30, 2012)
| | | | | | | | | | | | | | | | |
| | | 6 months* | | | 1 year | | | 5 years | | | 10 years | |
Columbia Global Equity Fund
Class A (excluding sales charge) | | | +8.93% | | | | -6.31% | | | | -1.38% | | | | +5.09% | |
MSCI All Country World Index (Net) (1) (unmanaged) | | | +7.07% | | | | -5.73% | | | | -1.28% | | | | +5.55% | |
MSCI All Country World Index (Gross) (1) (unmanaged) | | | +7.36% | | | | -5.21% | | | | -0.75% | | | | +6.09% | |
The performance information shown represents past performance and is not a guarantee of future results. The investment return and principal value of your investment will fluctuate so that your shares, when redeemed, may be worth more or less than their original cost. Current performance may be lower or higher than the performance information shown. You may obtain performance information current to the most recent month-end by contacting your financial intermediary, visiting columbiamanagement.com or calling 800.345.6611.
The 5.75% sales charge applicable to Class A shares of the Fund is not reflected in the table above. If reflected, returns would be lower than those shown. The performance of other classes may vary from that shown because of differences in fees and expenses. The Fund’s returns reflect the effect of fee waivers/ expense reimbursements, if any. Without such waivers/reimbursements, the Fund’s returns would be lower. See the Average Annual Total Returns table for performance of other share classes of the Fund.
The indices do not reflect the effects of sales charges, expenses and taxes (except the MSCI All Country World Index (Net), which reflects reinvested dividends net of withholding taxes). It is not possible to invest directly in an index.
| (1) | | The MSCI All Country World Index (Net) and the MSCI All Country World Index (Gross), each an unmanaged index of equity securities, are designed to measure equity market performance in the global developed and emerging markets. Each index reflects reinvestment of all distributions and changes in market prices. On September 30, 2011, the MSCI All Country World Index (Net) replaced the MSCI All Country World Index (Gross) as the Fund’s primary benchmark. The Fund’s Investment Manager made this recommendation to the Fund’s Board because the Investment Manager believes that the Net version of the index better reflects how dividends paid to the Fund |
| | |
| 2 | | COLUMBIA GLOBAL EQUITY FUND — 2012 SEMIANNUAL REPORT |
| | on foreign securities generally are treated for tax purposes and, therefore, provides a more appropriate basis for comparing the Fund’s performance. Information on both versions of the index will be included for a one-year transition period. Thereafter, only the Net version will be included. |
AVERAGE ANNUAL TOTAL RETURNS
| | | | | | | | | | | | | | | | |
| at April 30, 2012 | | | | | | | | | | | | |
| Without sales charge | | 6 months* | | | 1 year | | | 5 years | | | 10 years | |
Class A (inception 5/29/90) | | | +8.93% | | | | -6.31% | | | | -1.38% | | | | +5.09% | |
Class B (inception 3/20/95) | | | +8.50% | | | | -7.14% | | | | -2.16% | | | | +4.28% | |
Class C (inception 6/26/00) | | | +8.59% | | | | -6.96% | | | | -2.15% | | | | +4.28% | |
Class I** (inception 8/1/08) | | | +9.30% | | | | -5.87% | | | | -0.99% | | | | +5.30% | |
Class R** (inception 12/11/06) | | | +8.80% | | | | -6.55% | | | | -1.45% | | | | +4.91% | |
Class R4 (inception 3/20/95) | | | +9.02% | | | | -6.23% | | | | -1.21% | | | | +5.27% | |
Class R5** (inception 12/11/06) | | | +9.16% | | | | -6.10% | | | | -0.94% | | | | +5.34% | |
Class W** (inception 12/1/06) | | | +9.05% | | | | -6.28% | | | | -1.35% | | | | +5.10% | |
Class Z** (inception 9/27/10) | | | +9.04% | | | | -6.23% | | | | -1.32% | | | | +5.12% | |
| | | | |
| With sales charge | | | | | | | | | | | | |
Class A (inception 5/29/90) | | | +2.72% | | | | -11.66% | | | | -2.55% | | | | +4.48% | |
Class B (inception 3/20/95) | | | +3.50% | | | | -11.79% | | | | -2.55% | | | | +4.28% | |
Class C (inception 6/26/00) | | | +7.59% | | | | -7.89% | | | | -2.15% | | | | +4.28% | |
The “Without sales charge” returns for Class A, Class B and Class C shares do not include applicable initial or contingent deferred sales charges. If included, returns would be lower than those shown. The “With sales charge” returns for Class A, Class B and Class C shares include: the maximum initial sales charge of 5.75% for Class A shares; the applicable contingent deferred sales charge (CDSC) for Class B shares (applied as follows: first year 5%; second year 4%; third and fourth years 3%; fifth year 2%; sixth year 1%; no sales charge thereafter); and a 1% CDSC for Class C shares sold within one year after purchase. The Fund’s other share classes are not subject to sales charges and have limited eligibility. See the Fund’s prospectuses for details.
| ** | The returns shown for periods prior to the share class inception date (including returns since inception, which are since Fund inception) include the returns of the Fund’s Class A shares. These returns are adjusted to reflect any higher class-related operating expenses of the newer share classes, as applicable. Please visit columbiamanagement.com/mutual-fund/appended-performance for more information. |
| | | | |
| COLUMBIA GLOBAL EQUITY FUND — 2012 SEMIANNUAL REPORT | | | 3 | |
| | |
| Your Fund at a Glance (continued) | | |
| | | | |
| COUNTRY BREAKDOWN(1) (at April 30, 2012) | |
Australia | | | 2.0 | % |
Brazil | | | 3.1 | |
Canada | | | 1.1 | |
Cyprus | | | 0.7 | |
France | | | 1.7 | |
Germany | | | 4.4 | |
Hong Kong | | | 1.9 | |
Indonesia | | | 0.7 | |
Ireland | | | 2.3 | |
Japan | | | 8.2 | |
Netherlands | | | 3.1 | |
Panama | | | 1.0 | |
Russia Federation | | | 0.6 | |
Singapore | | | 0.5 | |
South Africa | | | 0.8 | |
South Korea | | | 3.5 | |
Switzerland | | | 6.6 | |
United Kingdom | | | 9.1 | |
United States | | | 47.9 | |
Other(2) | | | 0.8 | |
| (1) | | Percentages indicated are based upon total investments (excluding Investments of Cash Collateral Received for Securities on Loan). The Fund’s portfolio composition is subject to change. |
| (2) | | Includes investments in Money Market Funds. |
| | |
| 4 | | COLUMBIA GLOBAL EQUITY FUND — 2012 SEMIANNUAL REPORT |
| | | | |
| TOP TEN HOLDINGS(1) (at April 30, 2012) | |
Apple, Inc. (United States) | | | 3.5 | % |
JPMorgan Chase & Co. (United States) | | | 2.8 | |
Novartis AG, Registered Shares (Switzerland) | | | 2.3 | |
BG Group PLC (United Kingdom) | | | 2.0 | |
Google, Inc., Class A (United States) | | | 1.9 | |
Samsung Electronics Co., Ltd. (South Korea) | | | 1.9 | |
Airgas, Inc. (United States) | | | 1.8 | |
Kraft Foods, Inc., Class A (United States) | | | 1.8 | |
PepsiCo, Inc. (United States) | | | 1.7 | |
Advance Auto Parts, Inc. (United States) | | | 1.7 | |
| (1) | | Percentages indicated are based upon total investments (excluding Investments of Cash Collateral Received for Securities on Loan and Money Market Funds). |
For further detail about these holdings, please refer to the section entitled “Portfolio of Investments.”
Fund holdings are as of the date given, are subject to change at any time, and are not recommendations to buy or sell any security.
MORNINGSTAR STYLE BOXTM
| | |
 | | The Morningstar Style BoxTM is based on the Fund’s portfolio holdings.
For equity funds, the vertical axis shows the market capitalization of the
stocks owned, and the horizontal axis shows investment style (value,
blend, or growth). Information shown is based on the most recent data
provided by Morningstar. |
©2012 Morningstar, Inc. All rights reserved. The Morningstar information contained herein: (1) is proprietary to Morningstar and/or its content providers; (2) may not be copied or distributed; and (3) is not warranted to be accurate, complete, or timely. Neither Morningstar nor its content providers are responsible for any damages or losses arising from any use of this information. Past performance is no guarantee of future results.
| | | | |
| COLUMBIA GLOBAL EQUITY FUND — 2012 SEMIANNUAL REPORT | | | 5 | |
(Unaudited)
Understanding your expenses
As an investor, you incur two types of costs. There are transaction costs, which generally include sales charges on purchases and may include redemption fees. There are also ongoing costs, which generally include management fees, distribution and service (Rule 12b-1) fees, and other fund expenses. The following information is intended to help you understand your ongoing costs (in dollars) of investing in the Fund and to help you compare these costs with the ongoing costs of investing in other mutual funds.
Analyzing your fund’s expenses
To illustrate these ongoing costs, we have provided examples and calculated the expenses paid by investors in each share class of the Fund during the period. The actual and hypothetical information in the table is based on an initial investment of $1,000 at the beginning of the period indicated and held for the entire period. Expense information is calculated two ways and each method provides you with different information. The amount listed in the “Actual” column is calculated using the Fund’s actual operating expenses and total return for the period. You may use the Actual information, together with the amount invested, to estimate the expenses that you paid over the period. Simply divide your account value by $1,000 (for example, an $8,600 account value divided by $1,000 = 8.6), then multiply the results by the expenses paid during the period under the Actual column. The amount listed in the “Hypothetical” column assumes a 5% annual rate of return before expenses (which is not the Fund’s actual return) and then applies the Fund’s actual expense ratio for the period to the hypothetical return. You should not use the hypothetical account values and expenses to estimate either your actual account balance at the end of the period or the expenses you paid during the period. See “Compare with other funds” below for details on how to use the hypothetical data.
Compare with other funds
Since all mutual funds are required to include the same hypothetical calculations about expenses in shareholder reports, you can use this information to compare the ongoing cost of investing in the Fund with other funds. To do so, compare the hypothetical example with the 5% hypothetical examples that appear in the shareholder reports of other funds. As you compare hypothetical examples of other funds, it is important to note that hypothetical examples are meant to highlight the ongoing costs of investing in a fund only and do not reflect any transaction costs, such as sales charges, or redemption or exchange fees. Therefore, the hypothetical calculations are useful in comparing ongoing costs only, and will not help you determine the relative total costs of owning different funds. If transaction costs were included in these calculations, your costs would be higher.
| | |
| 6 | | COLUMBIA GLOBAL EQUITY FUND — 2012 SEMIANNUAL REPORT |
November 1, 2011—April 30, 2012
| | | | | | | | | | | | | | | | | | | | | | | | | | | | |
| | | Account value at the
beginning of the
period ($) | | | Account value at the
end of the period ($) | | | Expenses paid
during the period ($) | | | Fund's
annualized
expense
ratio (%) | |
| | | Actual | | | Hypothetical | | | Actual | | | Hypothetical | | | Actual | | | Hypothetical | | | Actual | |
Class A | | | 1,000.00 | | | | 1,000.00 | | | | 1,089.30 | | | | 1,018.10 | | | | 7.06 | | | | 6.82 | | | | 1.36 | |
Class B | | | 1,000.00 | | | | 1,000.00 | | | | 1,085.00 | | | | 1,014.37 | | | | 10.94 | | | | 10.57 | | | | 2.11 | |
Class C | | | 1,000.00 | | | | 1,000.00 | | | | 1,085.90 | | | | 1,014.37 | | | | 10.94 | | | | 10.57 | | | | 2.11 | |
Class I | | | 1,000.00 | | | | 1,000.00 | | | | 1,093.00 | | | | 1,020.34 | | | | 4.74 | | | | 4.57 | | | | 0.91 | |
Class R | | | 1,000.00 | | | | 1,000.00 | | | | 1,088.00 | | | | 1,016.86 | | | | 8.36 | | | | 8.07 | | | | 1.61 | |
Class R4 | | | 1,000.00 | | | | 1,000.00 | | | | 1,090.20 | | | | 1,018.85 | | | | 6.29 | | | | 6.07 | | | | 1.21 | |
Class R5 | | | 1,000.00 | | | | 1,000.00 | | | | 1,091.60 | | | | 1,020.09 | | | | 4.99 | | | | 4.82 | | | | 0.96 | |
Class W | | | 1,000.00 | | | | 1,000.00 | | | | 1,090.50 | | | | 1,018.10 | | | | 7.07 | | | | 6.82 | | | | 1.36 | |
Class Z | | | 1,000.00 | | | | 1,000.00 | | | | 1,090.40 | | | | 1,019.34 | | | | 5.77 | | | | 5.57 | | | | 1.11 | |
Expenses paid during the period are equal to the annualized expense ratio for each class as indicated above, multiplied by the average account value over the period and then multiplied by the number of days in the Fund's most recent fiscal half year and divided by 366.
Expenses do not include fees and expenses incurred indirectly by the Fund from the underlying funds in which the Fund may invest (also referred to as "acquired funds"), including affiliated and non-affiliated pooled investment vehicles (including mutual funds and exchange traded funds).
Had Columbia Management Investment Advisers, LLC and/or certain of its affiliates not waived/reimbursed certain fees and expenses, account value at the end of the period would have been reduced.
| | | | |
| COLUMBIA GLOBAL EQUITY FUND — 2012 SEMIANNUAL REPORT | | | 7 | |
Columbia Global Equity Fund
April 30, 2012 (Unaudited)
(Percentages represent value of investments compared to net assets)
| | | | | | | | |
| Issuer | | Shares | | | Value | |
| Common Stocks 98.0% | |
| | | | | | | | |
AUSTRALIA 2.0% | |
Fortescue Metals Group Ltd.(a) | | | 540,307 | | | | $3,138,841 | |
Iluka Resources Ltd.(a) | | | 184,048 | | | | 3,215,030 | |
Whitehaven Coal Ltd.(a) | | | 358,500 | | | | 1,973,648 | |
| | | | | | | | |
Total | | | | 8,327,519 | |
BRAZIL 3.1% | |
Cia Energetica de Minas Gerais, ADR | | | 103,087 | | | | 2,543,156 | |
Itaú Unibanco Holding SA, ADR | | | 314,444 | | | | 4,933,626 | |
MRV Engenharia e Participacoes SA | | | 458,200 | | | | 2,677,831 | |
Multiplan Empreendimentos Imobiliarios SA | | | 122,500 | | | | 2,885,529 | |
| | | | | | | | |
Total | | | | 13,040,142 | |
CANADA 1.1% | |
First Quantum Minerals Ltd. | | | 97,500 | | | | 2,025,307 | |
Methanex Corp. | | | 71,600 | | | | 2,520,877 | |
| | | | | | | | |
Total | | | | 4,546,184 | |
CYPRUS 0.7% | |
ProSafe SE | | | 353,139 | | | | 2,755,162 | |
FRANCE 1.7% | |
Euler Hermes SA | | | 44,278 | | | | 3,136,264 | |
Renault SA | | | 91,608 | | | | 4,162,302 | |
| | | | | | | | |
Total | | | | 7,298,566 | |
GERMANY 4.4% | |
Bayerische Motoren Werke AG | | | 46,020 | | | | 4,374,428 | |
Kabel Deutschland Holding AG(b) | | | 83,254 | | | | 5,245,679 | |
Linde AG | | | 34,476 | | | | 5,900,721 | |
MTU Aero Engines Holding AG(a) | | | 35,596 | | | | 2,997,675 | |
| | | | | | | | |
Total | | | | 18,518,503 | |
HONG KONG 1.9% | |
Great Eagle Holdings Ltd. | | | 807,377 | | | | 2,371,226 | |
Hongkong & Shanghai Hotels (The) | | | 1,241,500 | | | | 1,621,422 | |
Sun Hung Kai Properties Ltd. | | | 335,000 | | | | 4,012,596 | |
| | | | | | | | |
Total | | | | 8,005,244 | |
INDONESIA 0.7% | |
PT Bank Rakyat Indonesia Persero Tbk | | | 4,272,000 | | | | 3,075,553 | |
| | | | | | | | |
| Issuer | | Shares | | | Value | |
| Common Stocks (continued) | |
| | | | | | | | |
IRELAND 2.3% | |
Accenture PLC, Class A | | | 65,020 | | | | $4,223,049 | |
Covidien PLC | | | 100,814 | | | | 5,567,957 | |
| | | | | | | | |
Total | | | | 9,791,006 | |
JAPAN 8.2% | |
Asahi Group Holdings Ltd. | | | 289,600 | | | | 6,520,992 | |
Canon, Inc. | | | 69,500 | | | | 3,150,286 | |
Hoya Corp. | | | 219,800 | | | | 5,041,578 | |
Makita Corp.(a) | | | 136,200 | | | | 5,213,554 | |
Nikon Corp.(a) | | | 164,400 | | | | 4,872,537 | |
Nippon Electric Glass Co., Ltd.(a) | | | 265,000 | | | | 2,141,138 | |
THK Co., Ltd. | | | 116,300 | | | | 2,325,746 | |
Toyota Motor Corp. | | | 123,200 | | | | 5,048,461 | |
| | | | | | | | |
Total | | | | 34,314,292 | |
NETHERLANDS 3.0% | |
Fugro NV-CVA | | | 82,334 | | | | 6,000,744 | |
ING Groep NV-CVA(b) | | | 455,636 | | | | 3,212,849 | |
LyondellBasell Industries NV, Class A | | | 83,319 | | | | 3,481,068 | |
| | | | | | | | |
Total | | | | 12,694,661 | |
PANAMA 1.0% | |
Copa Holdings SA, Class A | | | 50,418 | | | | 4,099,488 | |
RUSSIAN FEDERATION 0.6% | |
Sberbank of Russia ADR | | | 184,604 | | | | 2,383,238 | |
SINGAPORE 0.5% | |
Mapletree Industrial Trust | | | 2,182,000 | | | | 1,991,472 | |
SOUTH AFRICA 0.8% | |
MTN Group Ltd. | | | 186,232 | | | | 3,255,619 | |
SOUTH KOREA 3.5% | |
Hyundai Department Store Co., Ltd. | | | 13,890 | | | | 1,953,393 | |
Hyundai Home Shopping Network Corp. | | | 19,820 | | | | 2,406,176 | |
Kangwon Land, Inc. | | | 120,900 | | | | 2,588,246 | |
Samsung Electronics Co., Ltd. | | | 6,285 | | | | 7,692,597 | |
| | | | | | | | |
Total | | | | 14,640,412 | |
SWITZERLAND 6.6% | |
Nestlé SA, Registered Shares | | | 70,912 | | | | 4,343,863 | |
The accompanying Notes to Financial Statements are an integral part of this statement.
| | |
| 8 | | COLUMBIA GLOBAL EQUITY FUND — 2012 SEMIANNUAL REPORT |
| | | | | | | | |
| Issuer | | Shares | | | Value | |
| Common Stocks (continued) | |
| | | | | | | | |
SWITZERLAND (cont.) | | | | | | | | |
Novartis AG, Registered Shares | | | 170,370 | | | | $9,394,611 | |
Swatch Group AG (The) | | | 13,452 | | | | 6,203,941 | |
TE Connectivity Ltd. | | | 100,856 | | | | 3,677,210 | |
Tyco International Ltd. | | | 68,622 | | | | 3,851,753 | |
| | | | | | | | |
Total | | | | 27,471,378 | |
UNITED KINGDOM 9.0% | |
Aggreko PLC | | | 78,614 | | | | 2,871,885 | |
Aon PLC | | | 67,300 | | | | 3,486,140 | |
BG Group PLC | | | 352,879 | | | | 8,306,828 | |
Intercontinental Hotels Group PLC | | | 113,898 | | | | 2,711,677 | |
Rio Tinto PLC | | | 39,808 | | | | 2,217,546 | |
Tullow Oil PLC | | | 230,516 | | | | 5,738,761 | |
Ultra Electronics Holdings PLC | | | 92,741 | | | | 2,534,577 | |
Vodafone Group PLC | | | 2,277,536 | | | | 6,302,043 | |
Weir Group PLC (The) | | | 133,870 | | | | 3,704,242 | |
| | | | | | | | |
Total | | | | 37,873,699 | |
UNITED STATES 46.9% | |
Advance Auto Parts, Inc. | | | 76,972 | | | | 7,066,030 | |
Aetna, Inc. | | | 157,789 | | | | 6,949,028 | |
Airgas, Inc. | | | 79,989 | | | | 7,330,192 | |
American Express Co. | | | 92,456 | | | | 5,566,776 | |
American International Group, Inc.(b) | | | 140,047 | | | | 4,765,799 | |
Annaly Capital Management, Inc. | | | 121,870 | | | | 1,988,918 | |
Apple, Inc.(b) | | | 24,728 | | | | 14,447,087 | |
Citigroup, Inc. | | | 190,756 | | | | 6,302,578 | |
Cummins, Inc. | | | 27,229 | | | | 3,153,935 | |
Discover Financial Services | | | 105,970 | | | | 3,592,383 | |
Dresser-Rand Group, Inc.(b) | | | 64,637 | | | | 3,146,529 | |
eBay, Inc.(b) | | | 164,597 | | | | 6,756,707 | |
EMC Corp.(b) | | | 142,379 | | | | 4,016,512 | |
Google, Inc., Class A(b) | | | 12,966 | | | | 7,847,412 | |
Henry Schein, Inc.(b) | | | 74,101 | | | | 5,686,511 | |
International Business Machines Corp. | | | 31,381 | | | | 6,498,377 | |
JPMorgan Chase & Co. | | | 268,972 | | | | 11,560,417 | |
Kraft Foods, Inc., Class A | | | 181,846 | | | | 7,250,200 | |
Laboratory Corp. of America Holdings(b) | | | 7,645 | | | | 671,919 | |
Lam Research Corp.(b) | | | 105,125 | | | | 4,378,456 | |
Marathon Petroleum Corp. | | | 98,465 | | | | 4,097,129 | |
McDonald’s Corp. | | | 65,663 | | | | 6,398,859 | |
Micron Technology, Inc.(b) | | | 397,904 | | | | 2,622,187 | |
Microsoft Corp. | | | 182,331 | | | | 5,838,239 | |
Oracle Corp. | | | 208,886 | | | | 6,139,160 | |
| | | | | | | | |
| Issuer | | Shares | | | Value | |
| Common Stocks (continued) | |
| | | | | | | | |
UNITED STATES (cont.) | |
PepsiCo, Inc. | | | 108,917 | | | | $7,188,522 | |
Pfizer, Inc. | | | 182,698 | | | | 4,189,265 | |
QUALCOMM, Inc. | | | 74,179 | | | | 4,735,587 | |
Sirona Dental Systems, Inc.(b) | | | 128,233 | | | | 6,477,049 | |
Tidewater, Inc. | | | 101,049 | | | | 5,560,726 | |
Union Pacific Corp. | | | 47,587 | | | | 5,350,682 | |
Walt Disney Co. (The) | | | 139,645 | | | | 6,020,096 | |
Waste Connections, Inc. | | | 90,000 | | | | 2,900,700 | |
WESCO International, Inc.(b) | | | 71,544 | | | | 4,749,806 | |
World Fuel Services Corp. | | | 119,830 | | | | 5,279,710 | |
| | | | | | | | |
Total | | | | 196,523,483 | |
Total Common Stocks | | | | | | | | |
(Cost: $362,554,400) | | | | $410,605,621 | |
| | | | | | | | |
| Limited Partnerships 0.8% | |
UNITED STATES 0.8% | |
Enterprise Products Partners LP(c) | | | 63,063 | | | | $3,250,267 | |
Total Limited Partnerships (Cost: $2,866,912) | | | | $3,250,267 | |
| | | | | | | | |
| | | Shares | | | Value | |
| Money Market Funds 0.8% | |
Columbia Short-Term Cash Fund, 0.144%(d)(e) | | | 3,213,475 | | | | $3,213,475 | |
Total Money Market Funds (Cost: $3,213,475) | | | | $3,213,475 | |
| | | | | | | | |
| | | | | | | | | | | | |
| Issuer | | Effective
Yield | | | Par/
Principal/
Shares | | | Value | |
Investments of Cash Collateral Received
for Securities on Loan 4.8% | |
| | | | | | | | | | | | |
Repurchase Agreements 4.8% | |
Citigroup Global Markets, Inc.
dated 04/30/12, matures 05/01/12,
repurchase price $5,000,029(f) | |
| | | 0.210 | % | | | $5,000,000 | | | | $5,000,000 | |
Mizuho Securities USA, Inc.
dated 04/30/12, matures 05/01/12,
repurchase price $10,000,067(f) | |
| | | 0.240 | % | | | 10,000,000 | | | | 10,000,000 | |
The accompanying Notes to Financial Statements are an integral part of this statement.
| | | | |
| COLUMBIA GLOBAL EQUITY FUND — 2012 SEMIANNUAL REPORT | | | 9 | |
| | |
| Portfolio of Investments (continued) | | |
| | | | | | | | | | | | |
| Issuer | | Effective
Yield | | | Par/
Principal/
Shares | | | Value | |
Investments of Cash Collateral Received
for Securities on Loan (continued) | |
| | | | | | | | | | | | |
Repurchase Agreements (cont.) | |
Nomura Securities
dated 04/30/12, matures 05/01/12,
repurchase price $1,000,007(f) | |
| | | 0.240% | | | | $1,000,000 | | | | $1,000,000 | |
Societe Generale
dated 04/30/12, matures 05/01/12,
repurchase price $3,894,308(f) | |
| | | 0.210 | % | | | 3,894,286 | | | | 3,894,286 | |
| | | | | | | | | | | | |
Total | | | | 19,894,286 | |
Total Investments of Cash Collateral Received for Securities on Loan | |
(Cost: $19,894,286) | | | | $19,894,286 | |
Total Investments | |
(Cost: $388,529,073) | | | | $436,963,649 | |
Other Assets & Liabilities, Net | | | | (18,269,977 | ) |
Net Assets | | | | $418,693,672 | |
Summary of Investments in Securities by Industry
The following table represents the portfolio investments of the Fund by industry classifications as a percentage of net assets at April 30, 2012:
| | | | | | | | |
| Industry | | Percentage of
Net Assets | | | Value | |
| Aerospace & Defense | | | 1.3 | % | | | $5,532,252 | |
| Airlines | | | 1.0 | | | | 4,099,488 | |
| Automobiles | | | 3.2 | | | | 13,585,191 | |
| Beverages | | | 3.3 | | | | 13,709,514 | |
| Chemicals | | | 4.6 | | | | 19,232,857 | |
| Commercial Banks | | | 2.5 | | | | 10,392,417 | |
| Commercial Services & Supplies | | | 1.4 | | | | 5,772,585 | |
| Communications Equipment | | | 1.1 | | | | 4,735,587 | |
| Computers & Peripherals | | | 4.4 | | | | 18,463,598 | |
| Consumer Finance | | | 2.2 | | | | 9,159,159 | |
| Diversified Financial Services | | | 5.0 | | | | 21,075,844 | |
| Electrical Utilities | | | 0.6 | | | | 2,543,156 | |
| Electronic Equipment, Instruments & Components | | | 2.6 | | | | 10,859,925 | |
| Energy Equipment & Services | | | 4.2 | | | | 17,463,162 | |
| Food Products | | | 2.8 | | | | 11,594,063 | |
| Health Care Equipment & Supplies | | | 2.9 | | | | 12,045,006 | |
| Health Care Providers & Services | | | 3.2 | | | | 13,307,457 | |
| Hotels, Restaurants & Leisure | | | 3.2 | | | | 13,320,204 | |
The accompanying Notes to Financial Statements are an integral part of this statement.
| | |
| 10 | | COLUMBIA GLOBAL EQUITY FUND — 2012 SEMIANNUAL REPORT |
Summary of Investments in Securities by Industry (continued)
| | | | | | | | |
| Industry | | Percentage of
Net Assets | | | Value | |
| Household Durables | | | 0.6 | % | | | $2,677,831 | |
| Industrial Conglomerates | | | 0.9 | | | | 3,851,753 | |
| Insurance | | | 2.7 | | | | 11,388,203 | |
| Internet & Catalog Retail | | | 0.6 | | | | 2,406,176 | |
| Internet Software & Services | | | 3.5 | | | | 14,604,119 | |
| IT Services | | | 2.6 | | | | 10,721,427 | |
| Leisure Equipment & Products | | | 1.2 | | | | 4,872,538 | |
| Machinery | | | 3.4 | | | | 14,397,477 | |
| Media | | | 2.7 | | | | 11,265,775 | |
| Metals & Mining | | | 2.5 | | | | 10,596,725 | |
| Multiline Retail | | | 0.4 | | | | 1,953,393 | |
| Office Electronics | | | 0.8 | | | | 3,150,286 | |
| Oil, Gas & Consumable Fuels | | | 6.8 | | | | 28,646,341 | |
| Pharmaceuticals | | | 3.2 | | | | 13,583,876 | |
| Real Estate Investment Trust (REITs) | | | 0.9 | | | | 3,980,391 | |
| Real Estate Management & Development | | | 2.2 | | | | 9,269,351 | |
| Road & Rail | | | 1.3 | | | | 5,350,682 | |
| Semiconductors & Semiconductor Equipment | | | 3.5 | | | | 14,693,241 | |
| Software | | | 2.9 | | | | 11,977,398 | |
| Specialty Retail | | | 1.7 | | | | 7,066,030 | |
| Textiles, Apparel & Luxury Goods | | | 1.5 | | | | 6,203,941 | |
| Trading Companies & Distributors | | | 1.1 | | | | 4,749,806 | |
| Wireless Telecommunication Services | | | 2.3 | | | | 9,557,663 | |
| Other(1) | | | 5.6 | | | | 23,107,761 | |
| Total | | | | | | | $436,963,649 | |
| (1) | Includes Investments of Cash Collateral Received for Securities on Loan and Money Market Funds. |
| | |
| Notes to Portfolio of Investments |
| (a) | At April 30, 2012, security was partially or fully on loan. |
| (b) | Non-income producing. |
| (c) | At April 30, 2012, there was no capital committed to the LLC or LP for future investment. |
| (d) | The rate shown is the seven-day current annualized yield at April 30, 2012. |
| (e) | Investments in affiliates during the period ended April 30, 2012: |
| | | | | | | | | | | | | | | | | | | | | | | | | | | | |
| Issuer | | Beginning
Cost | | | Purchase
Cost | | | Sales Cost/ Proceeds
from Sales | | | Realized
Gain/Loss | | | Ending
Cost | | | Dividends
or
Interest
Income | | | Value | |
Columbia Short-Term Cash Fund | | | $3,487,463 | | | | $55,786,477 | | | | $(56,060,465 | ) | | | $— | | | | $3,213,475 | | | | $2,869 | | | | $3,213,475 | |
The accompanying Notes to Financial Statements are an integral part of this statement.
| | | | |
| COLUMBIA GLOBAL EQUITY FUND — 2012 SEMIANNUAL REPORT | | | 11 | |
| | |
| Portfolio of Investments (continued) | | |
| (f) | The table below represents securities received as collateral for repurchase agreements. This collateral is deposited with the Fund’s custodian and, pursuant to the terms of the repurchase agreement, must have an aggregate value greater than or equal to the repurchase price plus accrued interest at all times. The value of securities and/or cash held as collateral for repurchase agreements is monitored on a daily basis to ensure the proper level of collateral. |
| | | | |
| Citigroup Global Markets, Inc. (0.210%) | | | | |
| |
| Security Description | | Value | |
| Fannie Mae REMICS | | | $1,832,624 | |
| Fannie Mae-Aces | | | 344,487 | |
| Freddie Mac REMICS | | | 1,795,352 | |
| Government National Mortgage Association | | | 1,127,537 | |
| Total Market Value of Collateral Securities | | | $5,100,000 | |
| |
| Mizuho Securities USA, Inc. (0.240%) | | | | |
| |
| Security Description | | Value | |
| Fannie Mae REMICS | | | $5,060,489 | |
| Freddie Mac REMICS | | | 5,139,511 | |
| Total Market Value of Collateral Securities | | | $10,200,000 | |
| |
| Nomura Securities (0.240%) | | | | |
| |
| Security Description | | Value | |
| Fannie Mae Pool | | | $204,058 | |
| Freddie Mac Gold Pool | | | 234,395 | |
| Ginnie Mae II Pool | | | 581,547 | |
| Total Market Value of Collateral Securities | | | $1,020,000 | |
| |
| Societe Generale (0.210%) | | | | |
| |
| Security Description | | Value | |
| Fannie Mae Pool | | | $2,706,518 | |
| Freddie Mac Gold Pool | | | 1,265,653 | |
| Total Market Value of Collateral Securities | | | $3,972,171 | |
| | |
| Abbreviation Legend |
| ADR | | American Depositary Receipt |
The accompanying Notes to Financial Statements are an integral part of this statement.
| | |
| 12 | | COLUMBIA GLOBAL EQUITY FUND — 2012 SEMIANNUAL REPORT |
Generally accepted accounting principles (GAAP) require disclosure regarding the inputs and valuation techniques used to measure fair value and any changes in valuation inputs or techniques. In addition, investments shall be disclosed by major category.
The Fund categorizes its fair value measurements according to a three-level hierarchy that maximizes the use of observable inputs and minimizes the use of unobservable inputs by prioritizing that the most observable input be used when available. Observable inputs are those that market participants would use in pricing an investment based on market data obtained from sources independent of the reporting entity. Unobservable inputs are those that reflect the Fund’s assumptions about the information market participants would use in pricing an investment. An investment’s level within the fair value hierarchy is based on the lowest level of any input that is deemed significant to the asset or liability’s fair value measurement. The input levels are not necessarily an indication of the risk or liquidity associated with investments at that level. For example, certain U.S. government securities are generally high quality and liquid, however, they are reflected as Level 2 because the inputs used to determine fair value may not always be quoted prices in an active market.
Fair value inputs are summarized in the three broad levels listed below:
| | Ÿ | | Level 1 — Valuations based on quoted prices for investments in active markets that the Fund has the ability to access at the measurement date (including NAV for open-end mutual funds). Valuation adjustments are not applied to Level 1 investments. |
| | Ÿ | | Level 2 — Valuations based on other significant observable inputs (including quoted prices for similar securities, interest rates, prepayment speeds, credit risks, etc.). |
| | Ÿ | | Level 3 — Valuations based on significant unobservable inputs (including the Fund’s own assumptions and judgment in determining the fair value of investments). |
Inputs that are used in determining fair value of an investment may include price information, credit data, volatility statistics, and other factors. These inputs can be either observable or unobservable. The availability of observable inputs can vary between investments, and is affected by various factors such as the type of investment, and the volume and level of activity for that investment or similar investments in the marketplace. The inputs will be considered by the Investment Manager, along with any other relevant factors in the calculation of an investment’s fair value. The Fund uses prices and inputs that are current as of the measurement date, which may include periods of market dislocations. During these periods, the availability of prices and inputs may be reduced for many investments. This condition could cause an investment to be reclassified between the various levels within the hierarchy.
Foreign equity securities actively traded in markets where there is a significant delay in the local close relative to the New York Stock Exchange (NYSE) are classified as Level 2. The values of these securities may include an adjustment to reflect the impact of significant market movements following the close of local trading, as described in Note 2 to the financial statements — Security Valuation.
Investments falling into the Level 3 category are primarily supported by quoted prices from brokers and dealers participating in the market for those investments. However, these may be classified as Level 3 investments due to lack of market transparency and corroboration to support these quoted
The accompanying Notes to Financial Statements are an integral part of this statement.
| | | | |
| COLUMBIA GLOBAL EQUITY FUND — 2012 SEMIANNUAL REPORT | | | 13 | |
| | |
| Portfolio of Investments (continued) | | |
| | |
| Fair Value Measurements (continued) |
prices. Additionally, valuation models may be used as the pricing source for any remaining investments classified as Level 3. These models rely on one or more significant unobservable inputs
and/or significant assumptions by the Investment Manager. Inputs used in valuations may include, but are not limited to, financial statement analysis, capital account balances, discount rates and estimated cash flows, and comparable company data.
The following table is a summary of the inputs used to value the Fund’s investments as of April 30, 2012:
| | | | | | | | | | | | | | | | |
| | | Fair Value at April 30, 2012 | |
| Description | | Level 1
Quoted Prices
in Active
Markets for
Identical Assets | | | Level 2
Other
Significant
Observable
Inputs | | | Level 3
Significant
Unobservable
Inputs | | | Total | |
| Equity Securities | | | | | | | | | | | | | | | | |
Common Stocks | | | | | | | | | | | | | | | | |
Consumer Discretionary | | | $22,162,815 | | | | $41,188,263 | | | | $— | | | | $63,351,078 | |
Consumer Staples | | | 14,438,721 | | | | 10,864,855 | | | | — | | | | 25,303,576 | |
Energy | | | 18,084,094 | | | | 24,775,143 | | | | — | | | | 42,859,237 | |
Financials | | | 45,082,166 | | | | 20,183,199 | | | | — | | | | 65,265,365 | |
Health Care | | | 29,541,729 | | | | 9,394,611 | | | | — | | | | 38,936,340 | |
Industrials | | | 24,106,364 | | | | 19,647,680 | | | | — | | | | 43,754,044 | |
Information Technology | | | 71,179,983 | | | | 18,025,598 | | | | — | | | | 89,205,581 | |
Materials | | | 15,357,444 | | | | 14,472,138 | | | | — | | | | 29,829,582 | |
Telecommunication Services | | | — | | | | 9,557,662 | | | | — | | | | 9,557,662 | |
Utilities | | | 2,543,156 | | | | — | | | | — | | | | 2,543,156 | |
| Total Equity Securities | | | 242,496,472 | | | | 168,109,149 | | | | — | | | | 410,605,621 | |
| Other | | | | | | | | | | | | | | | | |
Limited Partnerships | | | 3,250,267 | | | | — | | | | — | | | | 3,250,267 | |
Money Market Funds | | | 3,213,475 | | | | — | | | | — | | | | 3,213,475 | |
Investments of Cash Collateral Received for Securities on Loan | | | — | | | | 19,894,286 | | | | — | | | | 19,894,286 | |
| Total Other | | | 6,463,742 | | | | 19,894,286 | | | | — | | | | 26,358,028 | |
| Total | | | $248,960,214 | | | | $188,003,435 | | | | $— | | | | $436,963,649 | |
See the Portfolio of Investments for all investment classifications not indicated in the table.
The Fund’s assets assigned to the Level 2 input category are generally valued using the market approach, in which a security’s value is determined through reference to prices and information from market transactions for similar or identical assets. These assets include certain foreign securities for which a third party statistical pricing service may be employed for purposes of fair market valuation. The models utilized by the third party statistical pricing service take into account a security’s correlation to available market data including, but not limited to, intraday index, ADR, and ETF movements.
There were no transfers of financial assets between Levels 1 and 2 during the period.
The accompanying Notes to Financial Statements are an integral part of this statement.
| | |
| 14 | | COLUMBIA GLOBAL EQUITY FUND — 2012 SEMIANNUAL REPORT |
How to find information about the Fund’s quarterly portfolio holdings
| (i) | The Fund files its complete schedule of portfolio holdings with the Securities and Exchange Commission (SEC) for the first and third quarters of each fiscal year on Form N-Q; |
| (ii) | The Fund’s Forms N-Q are available on the SEC’s website at www.sec.gov; |
| (iii) | The Fund’s Forms N-Q may be reviewed and copied at the SEC’s Public Reference Room in Washington, DC (information on the operations of the Public Reference Room may be obtained by calling 800.SEC.0330); and |
| (iv) | The Fund’s complete schedule of portfolio holdings, as filed on Form N-Q, can be obtained without charge, upon request, by calling 800.345.6611. |
The accompanying Notes to Financial Statements are an integral part of this statement.
| | | | |
| COLUMBIA GLOBAL EQUITY FUND — 2012 SEMIANNUAL REPORT | | | 15 | |
| | |
| Statement of Assets and Liabilities | | |
| | | | | |
| April 30, 2012 (Unaudited) | | |
Assets | | | | | |
Investments, at value* | | | | | |
Unaffiliated issuers (identified cost $365,421,312) | | | $ | 413,855,888 | |
Affiliated issuers (identified cost $3,213,475) | | | | 3,213,475 | |
Investment of cash collateral received for securities on loan | | | | | |
Repurchase agreements (identified cost $19,894,286) | | | | 19,894,286 | |
Total investments (identified cost $388,529,073) | | | | 436,963,649 | |
Foreign currency (identified cost $443,043) | | | | 441,491 | |
Receivable for: | | | | | |
Investments sold | | | | 5,867,340 | |
Capital shares sold | | | | 64,554 | |
Dividends | | | | 1,076,447 | |
Interest | | | | 10,180 | |
Reclaims | | | | 649,245 | |
Expense reimbursement due from Investment Manager | | | | 2,374 | |
Prepaid expense | | | | 1,266 | |
Trustees’ deferred compensation plan | | | | 29,943 | |
Total assets | | | | 445,106,489 | |
Liabilities | | | | | |
Due upon return of securities on loan | | | | 19,894,286 | |
Payable for: | | | | | |
Investments purchased | | | | 5,687,089 | |
Capital shares purchased | | | | 570,344 | |
Investment management fees | | | | 27,374 | |
Distribution fees | | | | 10,756 | |
Transfer agent fees | | | | 66,531 | |
Administration fees | | | | 2,773 | |
Plan administration fees | | | | 104 | |
Compensation of board members | | | | 63,652 | |
Chief compliance officer expenses | | | | 19 | |
Other expenses | | | | 56,385 | |
Trustees’ deferred compensation plan | | | | 29,942 | |
Other liabilities | | | | 3,562 | |
Total liabilities | | | | 26,412,817 | |
Net assets applicable to outstanding capital stock | | | $ | 418,693,672 | |
The accompanying Notes to Financial Statements are an integral part of this statement.
| | |
| 16 | | COLUMBIA GLOBAL EQUITY FUND — 2012 SEMIANNUAL REPORT |
| | | | | |
| April 30, 2012 (Unaudited) | | |
Represented by | | | | | |
Paid-in capital | | | $ | 555,782,101 | |
Undistributed net investment income | | | | 51,423 | |
Accumulated net realized loss | | | | (185,699,068 | ) |
Unrealized appreciation (depreciation) on: | | | | | |
Investments | | | | 48,434,576 | |
Foreign currency translations | | | | 124,640 | |
Total — representing net assets applicable to outstanding capital stock | | | $ | 418,693,672 | |
*Value of securities on loan | | | $ | 18,945,104 | |
Net assets applicable to outstanding shares | | | | | |
Class A | | | $ | 374,353,586 | |
Class B | | | $ | 16,022,500 | |
Class C | | | $ | 20,355,305 | |
Class I | | | $ | 2,800 | |
Class R | | | $ | 63,154 | |
Class R4 | | | $ | 5,027,737 | |
Class R5 | | | $ | 2,798 | |
Class W | | | $ | 2,818 | |
Class Z | | | $ | 2,862,974 | |
Shares outstanding | | | | | |
Class A | | | | 49,585,627 | |
Class B | | | | 2,281,601 | |
Class C | | | | 2,930,775 | |
Class I | | | | 368 | |
Class R | | | | 8,303 | |
Class R4 | | | | 660,243 | |
Class R5 | | | | 368 | |
Class W | | | | 371 | |
Class Z | | | | 377,004 | |
Net asset value per share | | | | | |
Class A(a) | | | $ | 7.55 | |
Class B | | | $ | 7.02 | |
Class C | | | $ | 6.95 | |
Class I | | | $ | 7.61 | |
Class R | | | $ | 7.61 | |
Class R4 | | | $ | 7.61 | |
Class R5 | | | $ | 7.60 | |
Class W | | | $ | 7.60 | |
Class Z | | | $ | 7.59 | |
| (a) | The maximum offering price per share for Class A is $8.01. The offering price is calculated by dividing the net asset value by 1.0 minus the maximum sales charge of 5.75%. |
The accompanying Notes to Financial Statements are an integral part of this statement.
| | | | |
| COLUMBIA GLOBAL EQUITY FUND — 2012 SEMIANNUAL REPORT | | | 17 | |
Six months ended April 30, 2012 (Unaudited)
| | | | | |
Net investment income | | | | | |
Income: | | | | | |
Dividends | | | $ | 4,718,087 | |
Interest | | | | 172 | |
Dividends from affiliates | | | | 2,869 | |
Income from securities lending — net | | | | 28,432 | |
Foreign taxes withheld | | | | (326,795 | ) |
Total income | | | | 4,422,765 | |
Expenses: | | | | | |
Investment management fees | | | | 1,648,178 | |
Distribution fees | | | | | |
Class A | | | | 466,160 | |
Class B | | | | 80,974 | |
Class C | | | | 102,568 | |
Class R | | | | 168 | |
Class W | | | | 4 | |
Transfer agent fees | | | | | |
Class A | | | | 488,529 | |
Class B | | | | 22,365 | |
Class C | | | | 26,042 | |
Class R | | | | 86 | |
Class R4 | | | | 1,103 | |
Class R5 | | | | 1 | |
Class W | | | | 4 | |
Class Z | | | | 3,612 | |
Administration fees | | | | 166,923 | |
Plan administration fees | | | | | |
Class R4 | | | | 5,891 | |
Compensation of board members | | | | 10,932 | |
Custodian fees | | | | 25,191 | |
Printing and postage fees | | | | 55,847 | |
Registration fees | | | | 38,887 | |
Professional fees | | | | 42,657 | |
Other | | | | 19,853 | |
Total expenses | | | | 3,205,975 | |
Fees waived or expenses reimbursed by Investment Manager and its affiliates | | | | (240,374 | ) |
Total net expenses | | | | 2,965,601 | |
Net investment income | | | | 1,457,164 | |
The accompanying Notes to Financial Statements are an integral part of this statement.
| | |
| 18 | | COLUMBIA GLOBAL EQUITY FUND — 2012 SEMIANNUAL REPORT |
| | | | | |
Realized and unrealized gain (loss) — net | | | | | |
Net realized gain (loss) on: | | | | | |
Investments | | | $ | 2,532,362 | |
Foreign currency translations | | | | (47,702 | ) |
Forward foreign currency exchange contracts | | | | (40,241 | ) |
Net realized gain | | | | 2,444,419 | |
Net change in unrealized appreciation (depreciation) on: | | | | | |
Investments | | | | 30,943,708 | |
Foreign currency translations | | | | 106,997 | |
Net change in unrealized appreciation | | | | 31,050,705 | |
Net realized and unrealized gain | | | | 33,495,124 | |
Net increase in net assets resulting from operations | | | $ | 34,952,288 | |
The accompanying Notes to Financial Statements are an integral part of this statement.
| | | | |
| COLUMBIA GLOBAL EQUITY FUND — 2012 SEMIANNUAL REPORT | | | 19 | |
| | |
| Statement of Changes in Net Assets | | |
| | | | | | | | | | |
| | | Six months ended
April 30, 2012
(Unaudited) | | Year ended
October 31, 2011 |
| | | | |
Operations | | | | | | | | | | |
Net investment income | | | $ | 1,457,164 | | | | $ | 542,477 | |
Net realized gain | | | | 2,444,419 | | | | | 50,843,347 | |
Net change in unrealized appreciation (depreciation) | | | | 31,050,705 | | | | | (63,696,559 | ) |
Net increase (decrease) in net assets resulting from operations | | | | 34,952,288 | | | | | (12,310,735 | ) |
Distributions to shareholders from: | | | | | | | | | | |
Net investment income | | | | | | | | | | |
Class A | | | | (967,039 | ) | | | | (1,144,928 | ) |
Class B | | | | — | | | | | (36,159 | ) |
Class C | | | | — | | | | | (15,924 | ) |
Class I | | | | (17 | ) | | | | (136,477 | ) |
Class R | | | | (53 | ) | | | | (128 | ) |
Class R4 | | | | (18,326 | ) | | | | (26,416 | ) |
Class R5 | | | | (17 | ) | | | | (83 | ) |
Class W | | | | — | | | | | (15 | ) |
Class Z | | | | (15,014 | ) | | | | (26 | ) |
Total distributions to shareholders | | | | (1,000,466 | ) | | | | (1,360,156 | ) |
Increase (decrease) in net assets from share transactions | | | | (50,028,355 | ) | | | | 688,960 | |
Proceeds from regulatory settlements (Note 6) | | | | 444,107 | | | | | — | |
Total decrease in net assets | | | | (15,632,426 | ) | | | | (12,981,931 | ) |
Net assets at beginning of period | | | | 434,326,098 | | | | | 447,308,029 | |
Net assets at end of period | | | $ | 418,693,672 | | | | $ | 434,326,098 | |
Undistributed (excess of distributions over) net investment income | | | $ | 51,423 | | | | $ | (405,275 | ) |
| | | | | | | | | | | | | | | | | | | | |
| | | Six months ended
April 30, 2012
(Unaudited) | | Year ended
October 31, 2011 |
| | | Shares | | Dollars ($) | | Shares | | Dollars ($) |
Capital stock activity | | | | | | | | | | | | | | | | | | | | |
Class A shares | | | | | | | | | | | | | | | | | | | | |
Subscriptions(a) | | | | 1,131,935 | | | | | 8,032,506 | | | | | 3,180,320 | | | | | 23,659,606 | |
Fund merger | | | | — | | | | | — | | | | | 13,727,671 | | | | | 106,143,396 | |
Distributions reinvested | | | | 137,922 | | | | | 911,662 | | | | | 150,334 | | | | | 1,088,415 | |
Redemptions | | | | (7,473,024 | ) | | | | (53,113,713 | ) | | | | (14,311,973 | ) | | | | (104,903,280 | ) |
Net increase (decrease) | | | | (6,203,167 | ) | | | | (44,169,545 | ) | | | | 2,746,352 | | | | | 25,988,137 | |
Class B shares | | | | | | | | | | | | | | | | | | | | |
Subscriptions | | | | 18,592 | | | | | 121,765 | | | | | 86,680 | | | | | 600,968 | |
Fund merger | | | | — | | | | | — | | | | | 644,004 | | | | | 4,649,364 | |
Distributions reinvested | | | | — | | | | | — | | | | | 5,216 | | | | | 35,418 | |
Redemptions(a) | | | | (417,782 | ) | | | | (2,748,960 | ) | | | | (1,660,310 | ) | | | | (11,683,070 | ) |
Net decrease | | | | (399,190 | ) | | | | (2,627,195 | ) | | | | (924,410 | ) | | | | (6,397,320 | ) |
| (a) | Includes conversions of Class B shares to Class A shares, if any. The line items from the prior year have been combined to conform to the current year presentation. |
The accompanying Notes to Financial Statements are an integral part of this statement.
| | |
| 20 | | COLUMBIA GLOBAL EQUITY FUND — 2012 SEMIANNUAL REPORT |
| | | | | | | | | | | | | | | | | | | | |
| | | Six months ended
April 30, 2012
(Unaudited) | | Year ended
October 31, 2011 |
| | | Shares | | Dollars ($) | | Shares | | Dollars ($) |
Class C shares | | | | | | | | | | | | | | | | | | | | |
Subscriptions | | | | 69,790 | | | | | 458,400 | | | | | 173,489 | | | | | 1,169,523 | |
Fund merger | | | | — | | | | | — | | | | | 2,275,909 | | | | | 16,267,451 | |
Distributions reinvested | | | | — | | | | | — | | | | | 2,135 | | | | | 14,328 | |
Redemptions | | | | (507,847 | ) | | | | (3,315,424 | ) | | | | (630,939 | ) | | | | (4,243,010 | ) |
Net increase (decrease) | | | | (438,057 | ) | | | | (2,857,024 | ) | | | | 1,820,594 | | | | | 13,208,292 | |
Class I shares | | | | | | | | | | | | | | | | | | | | |
Subscriptions | | | | — | | | | | — | | | | | 63,165 | | | | | 477,162 | |
Fund merger | | | | — | | | | | — | | | | | 656,911 | | | | | 5,116,331 | |
Distributions reinvested | | | | — | | | | | — | | | | | 18,744 | | | | | 136,456 | |
Redemptions | | | | — | | | | | — | | | | | (5,097,889 | ) | | | | (38,789,914 | ) |
Net decrease | | | | — | | | | | — | | | | | (4,359,069 | ) | | | | (33,059,965 | ) |
Class R shares | | | | | | | | | | | | | | | | | | | | |
Subscriptions | | | | 864 | | | | | 6,179 | | | | | 6,124 | | | | | 46,251 | |
Fund merger | | | | — | | | | | — | | | | | 1,403 | | | | | 10,933 | |
Distributions reinvested | | | | 7 | | | | | 47 | | | | | 16 | | | | | 116 | |
Redemptions | | | | (2,622 | ) | | | | (19,405 | ) | | | | (3,235 | ) | | | | (23,457 | ) |
Net increase (decrease) | | | | (1,751 | ) | | | | (13,179 | ) | | | | 4,308 | | | | | 33,843 | |
Class R4 shares | | | | | | | | | | | | | | | | | | | | |
Subscriptions | | | | 82,380 | | | | | 588,883 | | | | | 156,187 | | | | | 1,162,237 | |
Fund merger | | | | — | | | | | — | | | | | 4,271 | | | | | 33,313 | |
Distributions reinvested | | | | 2,750 | | | | | 18,316 | | | | | 3,619 | | | | | 26,416 | |
Redemptions | | | | (84,554 | ) | | | | (596,764 | ) | | | | (488,373 | ) | | | | (3,676,363 | ) |
Net increase (decrease) | | | | 576 | | | | | 10,435 | | | | | (324,296 | ) | | | | (2,454,397 | ) |
Class R5 shares | | | | | | | | | | | | | | | | | | | | |
Distributions reinvested | | | | — | | | | | — | | | | | 9 | | | | | 65 | |
Redemptions | | | | — | | | | | — | | | | | (2,368 | ) | | | | (17,653 | ) |
Net decrease | | | | — | | | | | — | | | | | (2,359 | ) | | | | (17,588 | ) |
Class W shares | | | | | | | | | | | | | | | | | | | | |
Redemptions | | | | — | | | | | — | | | | | (268 | ) | | | | (1,810 | ) |
Net decrease | | | | — | | | | | — | | | | | (268 | ) | | | | (1,810 | ) |
Class Z shares | | | | | | | | | | | | | | | | | | | | |
Subscriptions | | | | 41,463 | | | | | 304,118 | | | | | 62,601 | | | | | 472,730 | |
Fund merger | | | | – | | | | | – | | | | | 527,305 | | | | | 4,102,117 | |
Distributions reinvested | | | | 1,443 | | | | | 9,583 | | | | | 2 | | | | | 15 | |
Redemptions | | | | (94,919 | ) | | | | (685,548 | ) | | | | (161,256 | ) | | | | (1,185,094 | ) |
Net increase (decrease) | | | | (52,013 | ) | | | | (371,847 | ) | | | | 428,652 | | | | | 3,389,768 | |
Total net decrease | | | | (7,093,602 | ) | | | | (50,028,355 | ) | | | | (610,496 | ) | | | | 688,960 | |
The accompanying Notes to Financial Statements are an integral part of this statement.
| | | | |
| COLUMBIA GLOBAL EQUITY FUND — 2012 SEMIANNUAL REPORT | | | 21 | |
The following tables are intended to help you understand the Fund’s financial performance. Certain information reflects financial results for a single share of a class held for the periods shown. Per share net investment income (loss) amounts are calculated based on average shares outstanding during the period. Total returns assume reinvestment of all dividends and distributions. Total returns do not reflect payment of sales charges, if any, and are not annualized for periods of less than one year.
| | | | | | | | | | | | | | | | | | | | | | | | | | | | | | |
| | | Six months
ended April 30,
2012 | | Year ended Oct. 31, |
| | | | 2011 | | 2010 | | 2009 | | 2008 | | 2007 |
| | | (Unaudited) | | | | | | | | | | |
Class A | | | | | | | | | | | | | | | | | | | | | | | | | | | | | | |
Per share data | | | | | | | | | | | | | | | | | | | | | | | | | | | | | | |
Net asset value, beginning of period | | | | $6.95 | | | | | $7.07 | | | | | $6.13 | | | | | $5.21 | | | | | $9.61 | | | | | $7.52 | |
Income from investment operations: | | | | | | | | | | | | | | | | | | | | | | | | | | | | | | |
Net investment income | | | | 0.03 | | | | | 0.01 | | | | | 0.00 | (a) | | | | 0.05 | | | | | 0.05 | | | | | 0.02 | |
Net realized and unrealized gain (loss) | | | | 0.58 | | | | | (0.11 | ) | | | | 0.96 | | | | | 0.95 | | | | | (4.41 | ) | | | | 2.13 | |
Total from investment operations | | | | 0.61 | | | | | (0.10 | ) | | | | 0.96 | | | | | 1.00 | | | | | (4.36 | ) | | | | 2.15 | |
Less distributions to shareholders from: | | | | | | | | | | | | | | | | | | | | | | | | | | |
Net investment income | | | | (0.02 | ) | | | | (0.02 | ) | | | | (0.03 | ) | | | | (0.08 | ) | | | | (0.04 | ) | | | | (0.06 | ) |
Total distributions to shareholders | | | | (0.02 | ) | | | | (0.02 | ) | | | | (0.03 | ) | | | | (0.08 | ) | | | | (0.04 | ) | | | | (0.06 | ) |
Proceeds from regulatory settlements | | | | 0.01 | | | | | — | | | | | 0.01 | | | | | 0.00 | (a) | | | | — | | | | | — | |
Net asset value, end of period | | | | $7.55 | | | | | $6.95 | | | | | $7.07 | | | | | $6.13 | | | | | $5.21 | | | | | $9.61 | |
Total return | | | | 8.93% | (b) | | | | (1.40% | ) | | | | 15.78% | (c) | | | | 19.39% | (d) | | | | (45.55% | ) | | | | 28.82% | |
Ratios to average net assets(e) | | | | | | | | | | | | | | | | | | | | | | | | | | | | | | |
Expenses prior to fees waived or expenses reimbursed | | | | 1.48% | (f) | | | | 1.46% | | | | | 1.45% | | | | | 1.44% | | | | | 1.46% | | | | | 1.39% | |
Net expenses after fees waived or expenses reimbursed(g) | | | | 1.36% | (f) | | | | 1.36% | (h) | | | | 1.45% | | | | | 1.44% | | | | | 1.46% | | | | | 1.39% | |
Net investment income | | | | 0.76% | (f) | | | | 0.18% | (h) | | | | 0.03% | | | | | 0.92% | | | | | 0.65% | | | | | 0.28% | |
Supplemental data | | | | | | | | | | | | | | | | | | | | | | | | | | | | | | |
Net assets, end of period (in thousands) | | | | $374,354 | | | | | $387,709 | | | | | $375,169 | | | | | $394,511 | | | | | $380,430 | | | | | $736,862 | |
Portfolio turnover | | | | 25% | | | | | 44% | | | | | 54% | | | | | 81% | | | | | 97% | | | | | 100% | |
Notes to Financial Highlights
| (a) | Rounds to less than $0.01. |
| (b) | During the six months ended April 30, 2012, the Fund received proceeds from a regulatory settlement. Had the Fund not received these proceeds, the total return would have been lower by 0.11%. |
| (c) | During the year ended October 31, 2010, the Fund received proceeds from a regulatory settlement. Had the Fund not received these proceeds, the total return would have been lower by 0.09%. |
| (d) | During the year ended October 31, 2009, the Fund received proceeds from a regulatory settlement. Had the Fund not received these proceeds, the total return would have been lower by 0.02%. |
| (e) | Expense ratios include the impact of a performance incentive adjustment, if any. In addition to the fees and expenses which the Fund bears directly, the Fund indirectly bears a pro rata share of the fees and expenses of the acquired funds in which it invests. Such indirect expenses are not included in the reported expense ratios. |
| (g) | The Investment Manager and certain of its affiliates agreed to waive/reimburse certain fees and expenses, before giving effect to any performance incentive adjustment, if applicable. |
| (h) | The benefits derived from expense reductions had an impact of less than 0.01%. |
The accompanying Notes to Financial Statements are an integral part of this statement.
| | |
| 22 | | COLUMBIA GLOBAL EQUITY FUND — 2012 SEMIANNUAL REPORT |
| | | | | | | | | | | | | | | | | | | | | | | | | | | | | | |
| | | Six months
ended April 30, 2012 | | Year ended Oct. 31, |
| | | | 2011 | | 2010 | | 2009 | | 2008 | | 2007 |
| | | (Unaudited) | | | | | | | | | | |
Class B | | | | | | | | | | | | | | | | | | | | | | | | | | | | | | |
Per share data | | | | | | | | | | | | | | | | | | | | | | | | | | | | | | |
Net asset value, beginning of period | | | | $6.47 | | | | | $6.63 | | | | | $5.77 | | | | | $4.87 | | | | | $9.02 | | | | | $7.06 | |
Income from investment operations: | | | | | | | | | | | | | | | | | | | | | | | | | | | | | | |
Net investment income (loss) | | | | 0.00 | (a) | | | | (0.04 | ) | | | | (0.04 | ) | | | | 0.01 | | | | | (0.01 | ) | | | | (0.04 | ) |
Net realized and unrealized gain (loss) | | | | 0.54 | | | | | (0.11 | ) | | | | 0.90 | | | | | 0.89 | | | | | (4.14 | ) | | | | 2.00 | |
Total from investment operations | | | | 0.54 | | | | | (0.15 | ) | | | | 0.86 | | | | | 0.90 | | | | | (4.15 | ) | | | | 1.96 | |
Less distributions to shareholders from: | | | | | | | | | | | | | | | | | | | | | | | | | | |
Net investment income | | | | — | | | | | (0.01 | ) | | | | (0.01 | ) | | | | — | | | | | — | | | | | (0.00 | )(a) |
Total distributions to shareholders | | | | — | | | | | (0.01 | ) | | | | (0.01 | ) | | | | — | | | | | — | | | | | (0.00 | )(a) |
Proceeds from regulatory settlements | | | | 0.01 | | | | | — | | | | | 0.01 | | | | | 0.00 | (a) | | | | — | | | | | — | |
Net asset value, end of period | | | | $7.02 | | | | | $6.47 | | | | | $6.63 | | | | | $5.77 | | | | | $4.87 | | | | | $9.02 | |
Total return | | | | 8.50% | (b) | | | | (2.26% | ) | | | | 15.03% | (c) | | | | 18.48% | (d) | | | | (46.01% | ) | | | | 27.81% | |
Ratios to average net assets(e) | | | | | | | | | | | | | | | | | | | | | | | | | | | | | | |
Expenses prior to fees waived or expenses reimbursed | | | | 2.24% | (f) | | | | 2.22% | | | | | 2.21% | | | | | 2.21% | | | | | 2.23% | | | | | 2.15% | |
Net expenses after fees waived or expenses reimbursed(g) | | | | 2.11% | (f) | | | | 2.12% | (h) | | | | 2.21% | | | | | 2.21% | | | | | 2.23% | | | | | 2.15% | |
Net investment income (loss) | | | | 0.01% | (f) | | | | (0.56% | )(h) | | | | (0.69% | ) | | | | 0.22% | | | | | (0.11% | ) | | | | (0.45% | ) |
Supplemental data | | | | | | | | | | | | | | | | | | | | | | | | | | | | | | |
Net assets, end of period (in thousands) | | | | $16,023 | | | | | $17,347 | | | | | $23,894 | | | | | $33,009 | | | | | $42,166 | | | | | $103,846 | |
Portfolio turnover | | | | 25% | | | | | 44% | | | | | 54% | | | | | 81% | | | | | 97% | | | | | 100% | |
Notes to Financial Highlights
| (a) | Rounds to less than $0.01. |
| (b) | During the six months ended April 30, 2012, the Fund received proceeds from a regulatory settlement. Had the Fund not received these proceeds, the total return would have been lower by 0.11%. |
| (c) | During the year ended October 31, 2010, the Fund received proceeds from a regulatory settlement. Had the Fund not received these proceeds, the total return would have been lower by 0.09%. |
| (d) | During the year ended October 31, 2009, the Fund received proceeds from a regulatory settlement. Had the Fund not received these proceeds, the total return would have been lower by 0.02%. |
| (e) | Expense ratios include the impact of a performance incentive adjustment, if any. In addition to the fees and expenses which the Fund bears directly, the Fund indirectly bears a pro rata share of the fees and expenses of the acquired funds in which it invests. Such indirect expenses are not included in the reported expense ratios. |
| (g) | The Investment Manager and certain of its affiliates agreed to waive/reimburse certain fees and expenses, before giving effect to any performance incentive adjustment, if applicable. |
| (h) | The benefits derived from expense reductions had an impact of less than 0.01%. |
The accompanying Notes to Financial Statements are an integral part of this statement.
| | | | |
| COLUMBIA GLOBAL EQUITY FUND — 2012 SEMIANNUAL REPORT | | | 23 | |
| | |
| Financial Highlights (continued) | | |
| | | | | | | | | | | | | | | | | | | | | | | | | | | | | | |
| | | Six months
ended April 30, 2012 | | Year ended Oct. 31, |
| | | | 2011 | | 2010 | | 2009 | | 2008 | | 2007 |
| | | (Unaudited) | | | | | | | | | | |
Class C | | | | | | | | | | | | | | | | | | | | | | | | | | | | | | |
Per share data | | | | | | | | | | | | | | | | | | | | | | | | | | | | | | |
Net asset value, beginning of period | | | | $6.40 | | | | | $6.55 | | | | | $5.71 | | | | | $4.83 | | | | | $8.93 | | | | | $7.02 | |
Income from investment operations: | | | | | | | | | | | | | | | | | | | | | | | | | | | | | | |
Net investment income (loss) | | | | 0.00 | (a) | | | | (0.04 | ) | | | | (0.04 | ) | | | | (0.00 | )(a) | | | | (0.01 | ) | | | | (0.04 | ) |
Net realized and unrealized gain (loss) | | | | 0.54 | | | | | (0.10 | ) | | | | 0.88 | | | | | 0.89 | | | | | (4.09 | ) | | | | 1.98 | |
Total from investment operations | | | | 0.54 | | | | | (0.14 | ) | | | | 0.84 | | | | | 0.89 | | | | | (4.10 | ) | | | | 1.94 | |
Less distributions to shareholders from: | | | | | | | | | | | | | | | | | | | | | | | | | | | | | | |
Net investment income | | | | — | | | | | (0.01 | ) | | | | (0.01 | ) | | | | (0.01 | ) | | | | — | | | | | (0.03 | ) |
Total distributions to shareholders | | | | — | | | | | (0.01 | ) | | | | (0.01 | ) | | | | (0.01 | ) | | | | — | | | | | (0.03 | ) |
Proceeds from regulatory settlements | | | | 0.01 | | | | | — | | | | | 0.01 | | | | | 0.00 | (a) | | | | — | | | | | — | |
Net asset value, end of period | | | | $6.95 | | | | | $6.40 | | | | | $6.55 | | | | | $5.71 | | | | | $4.83 | | | | | $8.93 | |
Total return | | | | 8.59% | (b) | | | | (2.14% | ) | | | | 14.86% | (c) | | | | 18.39% | (d) | | | | (45.91% | ) | | | | 27.76% | |
Ratios to average net assets(e) | | | | | | | | | | | | | | | | | | | | | | | | | | | | | | |
Expenses prior to fees waived or expenses reimbursed | | | | 2.22% | (f) | | | | 2.22% | | | | | 2.21% | | | | | 2.20% | | | | | 2.22% | | | | | 2.15% | |
Net expenses after fees waived or expenses reimbursed(g) | | | | 2.11% | (f) | | | | 2.11% | (h) | | | | 2.21% | | | | | 2.20% | | | | | 2.22% | | | | | 2.15% | |
Net investment income (loss) | | | | 0.01% | (f) | | | | (0.62% | )(h) | | | | (0.72% | ) | | | | (0.08% | ) | | | | (0.09% | ) | | | | (0.48% | ) |
Supplemental data | | | | | | | | | | | | | | | | | | | | | | | | | | | | | | |
Net assets, end of period (in thousands) | | | | $20,355 | | | | | $21,560 | | | | | $10,147 | | | | | $10,570 | | | | | $4,755 | | | | | $8,245 | |
Portfolio turnover | | | | 25% | | | | | 44% | | | | | 54% | | | | | 81% | | | | | 97% | | | | | 100% | |
Notes to Financial Highlights
| (a) | Rounds to less than $0.01. |
| (b) | During the six months ended April 30. 2012, the Fund received proceeds from a regulatory settlement. Had the Fund not received these proceeds, the total return would have been lower by 0.11%. |
| (c) | During the year ended October 31, 2010, the Fund received proceeds from a regulatory settlement. Had the Fund not received these proceeds, the total return would have been lower by 0.09%. |
| (d) | During the year ended October 31, 2009, the Fund received proceeds from a regulatory settlement. Had the Fund not received these proceeds, the total return would have been lower by 0.02%. |
| (e) | Expense ratios include the impact of a performance incentive adjustment, if any. In addition to the fees and expenses which the Fund bears directly, the Fund indirectly bears a pro rata share of the fees and expenses of the acquired funds in which it invests. Such indirect expenses are not included in the reported expense ratios. |
| (g) | The Investment Manager and certain of its affiliates agreed to waive/reimburse certain fees and expenses, before giving effect to any performance incentive adjustment, if applicable. |
| (h) | The benefits derived from expense reductions had an impact of less than 0.01%. |
The accompanying Notes to Financial Statements are an integral part of this statement.
| | |
| 24 | | COLUMBIA GLOBAL EQUITY FUND — 2012 SEMIANNUAL REPORT |
| | | | | | | | | | | | | | | | | | | | | | | | | |
| | | Six months
ended April 30, 2012 | | Year ended Oct. 31, |
| | | | 2011 | | 2010 | | 2009 | | 2008 (a) |
| | | (Unaudited) | | | | | | | | |
Class I | | | | | | | | | | | | | | | | | | | | | | | | | |
Per share data | | | | | | | | | | | | | | | | | | | | | | | | | |
Net asset value, beginning of period | | | | $7.01 | | | | | $7.11 | | | | | $6.16 | | | | | $5.25 | | | | | $7.47 | |
Income from investment operations: | | | | | | | | | | | | | | | | | | | | | | | | | |
Net investment income | | | | 0.04 | | | | | 0.01 | | | | | 0.04 | | | | | 0.09 | | | | | 0.03 | |
Net realized and unrealized gain (loss) | | | | 0.60 | | | | | (0.08 | ) | | | | 0.95 | | | | | 0.95 | | | | | (2.25 | ) |
Total from investment operations | | | | 0.64 | | | | | (0.07 | ) | | | | 0.99 | | | | | 1.04 | | | | | (2.22 | ) |
Less distributions to shareholders
from: | | | | | | | | | | | | | | | | | | | | | | | | | |
Net investment income | | | | (0.05 | ) | | | | (0.03 | ) | | | | (0.05 | ) | | | | (0.13 | ) | | | | — | |
Total distributions to shareholders | | | | (0.05 | ) | | | | (0.03 | ) | | | | (0.05 | ) | | | | (0.13 | ) | | | | — | |
Proceeds from regulatory settlements | | | | 0.01 | | | | | — | | | | | 0.01 | | | | | 0.00 | (b) | | | | — | |
Net asset value, end of period | | | | $7.61 | | | | | $7.01 | | | | | $7.11 | | | | | $6.16 | | | | | $5.25 | |
Total return | | | | 9.30% | (c) | | | | (0.98% | ) | | | | 16.32% | (d) | | | | 20.21% | (e) | | | | (29.72% | ) |
Ratios to average net assets(f) | | | | | | | | | | | | | | | | | | | | | | | | | |
Expenses prior to fees waived or
expenses reimbursed | | | | 1.03% | (g) | | | | 0.93% | | | | | 0.91% | | | | | 0.84% | | | | | 0.85% | (g) |
Net expenses after fees waived or
expenses reimbursed(h) | | | | 0.91% | (g) | | | | 0.92% | | | | | 0.91% | | | | | 0.84% | | | | | 0.85% | (g) |
Net investment income | | | | 1.23% | (g) | | | | 0.15% | | | | | 0.55% | | | | | 1.56% | | | | | 1.55% | (g) |
Supplemental data | | | | | | | | | | | | | | | | | | | | | | | | | |
Net assets, end of period (in thousands) | | | | $3 | | | | | $3 | | | | | $31,015 | | | | | $32,596 | | | | | $3 | |
Portfolio turnover | | | | 25% | | | | | 44% | | | | | 54% | | | | | 81% | | | | | 97% | |
Notes to Financial Highlights
| (a) | For the period from August 1, 2008 (commencement of operations) to October 31, 2008. |
| (b) | Rounds to less than $0.01. |
| (c) | During the six months ended April 30, 2012, the Fund received proceeds from a regulatory settlement. Had the Fund not received these proceeds, the total return would have been lower by 0.11%. |
| (d) | During the year ended October 31, 2010, the Fund received proceeds from a regulatory settlement. Had the Fund not received these proceeds, the total return would have been lower by 0.09%. |
| (e) | During the year ended October 31, 2009, the Fund received proceeds from a regulatory settlement. Had the Fund not received these proceeds, the total return would have been lower by 0.02%. |
| (f) | Expense ratios include the impact of a performance incentive adjustment, if any. In addition to the fees and expenses which the Fund bears directly, the Fund indirectly bears a pro rata share of the fees and expenses of the acquired funds in which it invests. Such indirect expenses are not included in the reported expense ratios. |
| (h) | The Investment Manager and certain of its affiliates agreed to waive/reimburse certain fees and expenses, before giving effect to any performance incentive adjustment, if applicable. |
The accompanying Notes to Financial Statements are an integral part of this statement.
| | | | |
| COLUMBIA GLOBAL EQUITY FUND — 2012 SEMIANNUAL REPORT | | | 25 | |
| | |
| Financial Highlights (continued) | | |
| | | | | | | | | | | | | | | | | | | | | | | | | | | | | | |
| | | Six months
ended April 30, 2012 | | Year ended Oct. 31, |
| | | | 2011 | | 2010 | | 2009 | | 2008 | | 2007(a) |
| | | (Unaudited) | | | | | | | | | | |
Class R | | | | | | | | | | | | | | | | | | | | | | | | | | | | | | |
Per share data | | | | | | | | | | | | | | | | | | | | | | | | | | | | | | |
Net asset value, beginning of period | | | | $7.00 | | | | | $7.14 | | | | | $6.14 | | | | | $5.23 | | | | | $9.62 | | | | | $7.89 | |
Income from investment operations: | | | | | | | | | | | | | | | | | | | | | | | | | | | | | | |
Net investment income (loss) | | | | 0.02 | | | | | (0.00 | )(b) | | | | (0.02 | ) | | | | (0.01 | ) | | | | 0.05 | | | | | (0.01 | ) |
Net realized and unrealized gain (loss) | | | | 0.59 | | | | | (0.12 | ) | | | | 1.01 | | | | | 1.00 | | | | | (4.42 | ) | | | | 1.84 | |
Total from investment operations | | | | 0.61 | | | | | (0.12 | ) | | | | 0.99 | | | | | 0.99 | | | | | (4.37 | ) | | | | 1.83 | |
Less distributions to shareholders from: | | | | | | | | | | | | | | | | | | | | | | | | | | |
Net investment income | | | | (0.01 | ) | | | | (0.02 | ) | | | | — | | | | | (0.08 | ) | | | | (0.02 | ) | | | | (0.10 | ) |
Total distributions to shareholders | | | | (0.01 | ) | | | | (0.02 | ) | | | | — | | | | | (0.08 | ) | | | | (0.02 | ) | | | | (0.10 | ) |
Proceeds from regulatory settlements | | | | 0.01 | | | | | — | | | | | 0.01 | | | | | 0.00 | (b) | | | | — | | | | | — | |
Net asset value, end of period | | | | $7.61 | | | | | $7.00 | | | | | $7.14 | | | | | $6.14 | | | | | $5.23 | | | | | $9.62 | |
Total return | | | | 8.80% | (c) | | | | (1.70% | ) | | | | 16.29% | (d) | | | | 19.13% | (e) | | | | (45.48% | ) | | | | 23.41% | |
Ratios to average net assets(f) | | | | | | | | | | | | | | | | | | | | | | | | | | | | | | |
Expenses prior to fees waived or expenses reimbursed | | | | 1.72% | (g) | | | | 1.72% | | | | | 1.71% | | | | | 1.69% | | | | | 1.79% | | | | | 1.74% | (g) |
Net expenses after fees waived or expenses reimbursed(h) | | | | 1.61% | (g) | | | | 1.61% | (i) | | | | 1.71% | | | | | 1.69% | | | | | 1.54% | | | | | 1.74% | (g) |
Net investment income (loss) | | | | 0.48% | (g) | | | | (0.01% | )(i) | | | | (0.24% | ) | | | | (0.16% | ) | | | | 0.57% | | | | | (0.13% | )(g) |
Supplemental data | | | | | | | | | | | | | | | | | | | | | | | | | | | | | | |
Net assets, end of period (in thousands) | | | | $63 | | | | | $70 | | | | | $41 | | | | | $46 | | | | | $3 | | | | | $6 | |
Portfolio turnover | | | | 25% | | | | | 44% | | | | | 54% | | | | | 81% | | | | | 97% | | | | | 100% | |
Notes to Financial Highlights
| (a) | For the period from December 11, 2006 (commencement of operations) to October 31, 2007. |
| (b) | Rounds to less than $0.01. |
| (c) | During the six months ended April 31, 2012, the Fund received proceeds from a regulatory settlement. Had the Fund not received these proceeds, the total return would have been lower by 0.11%. |
| (d) | During the year ended October 31, 2010, the Fund received proceeds from a regulatory settlement. Had the Fund not received these proceeds, the total return would have been lower by 0.09. |
| (e) | During the year ended October 31, 2009, the Fund received proceeds from a regulatory settlement. Had the Fund not received these proceeds, the total return would have been lower by 0.02%. |
| (f) | Expense ratios include the impact of a performance incentive adjustment, if any. In addition to the fees and expenses which the Fund bears directly, the Fund indirectly bears a pro rata share of the fees and expenses of the acquired funds in which it invests. Such indirect expenses are not included in the reported expense ratios. |
| (h) | The Investment Manager and certain of its affiliates agreed to waive/reimburse certain fees and expenses, before giving effect to any performance incentive adjustment, if applicable. |
| (i) | The benefits derived from expense reductions had an impact of less than 0.01%. |
The accompanying Notes to Financial Statements are an integral part of this statement.
| | |
| 26 | | COLUMBIA GLOBAL EQUITY FUND — 2012 SEMIANNUAL REPORT |
| | | | | | | | | | | | | | | | | | | | | | | | | | | | | | |
| | | Six months
ended April 30, 2012 | | Year ended Oct. 31, |
| | | | 2011 | | 2010 | | 2009 | | 2008 | | 2007 |
| | | (Unaudited) | | | | | | | | | | |
Class R4 | | | | | | | | | | | | | | | | | | | | | | | | | | | | | | |
Per share data | | | | | | | | | | | | | | | | | | | | | | | | | | | | | | |
Net asset value, beginning of period | | | | $7.01 | | | | | $7.13 | | | | | $6.18 | | | | | $5.26 | | | | | $9.70 | | | | | $7.60 | |
Income from investment operations: | | | | | | | | | | | | | | | | | | | | | | | | | | | | | | |
Net investment income | | | | 0.03 | | | | | 0.02 | | | | | 0.02 | | | | | 0.06 | | | | | 0.07 | | | | | 0.04 | |
Net realized and unrealized gain (loss) | | | | 0.59 | | | | | (0.11 | ) | | | | 0.96 | | | | | 0.96 | | | | | (4.46 | ) | | | | 2.13 | |
Total from investment operations | | | | 0.62 | | | | | (0.09 | ) | | | | 0.98 | | | | | 1.02 | | | | | (4.39 | ) | | | | 2.17 | |
Less distributions to shareholders from: | | | | | | | | | | | | | | | | | | | | | | | | | | | | | | |
Net investment income | | | | (0.03 | ) | | | | (0.03 | ) | | | | (0.04 | ) | | | | (0.10 | ) | | | | (0.05 | ) | | | | (0.07 | ) |
Total distributions to shareholders | | | | (0.03 | ) | | | | (0.03 | ) | | | | (0.04 | ) | | | | (0.10 | ) | | | | (0.05 | ) | | | | (0.07 | ) |
Proceeds from regulatory settlements | | | | 0.01 | | | | | — | | | | | 0.01 | | | | | 0.00 | (a) | | | | — | | | | | — | |
Net asset value, end of period | | | | $7.61 | | | | | $7.01 | | | | | $7.13 | | | | | $6.18 | | | | | $5.26 | | | | | $9.70 | |
Total return | | | | 9.02% | (b) | | | | (1.33% | ) | | | | 16.03% | (c) | | | | 19.72% | (d) | | | | (45.47% | ) | | | | 28.85% | |
Ratios to average net assets(e) | | | | | | | | | | | | | | | | | | | | | | | | | | | | | | |
Expenses prior to fees waived or expenses reimbursed | | | | 1.26% | (f) | | | | 1.24% | | | | | 1.21% | | | | | 1.15% | | | | | 1.29% | | | | | 1.23% | |
Net expenses after fees waived or expenses reimbursed(g) | | | | 1.21% | (f) | | | | 1.17% | | | | | 1.21% | | | | | 1.15% | | | | | 1.28% | | | | | 1.23% | |
Net investment income | | | | 0.94% | (f) | | | | 0.32% | | | | | 0.27% | | | | | 1.22% | | | | | 0.83% | | | | | 0.45% | |
Supplemental data | | | | | | | | | | | | | | | | | | | | | | | | | | | | | | |
Net assets, end of period (in thousands) | | | | $5,028 | | | | | $4,627 | | | | | $7,016 | | | | | $6,059 | | | | | $5,067 | | | | | $9,828 | |
Portfolio turnover | | | | 25% | | | | | 44% | | | | | 54% | | | | | 81% | | | | | 97% | | | | | 100% | |
Notes to Financial Highlights
| (a) | Rounds to less than $0.01. |
| (b) | During the six months ended April 30, 2012, the Fund received proceeds from a regulatory settlement. Had the Fund not received these proceeds, the total return would have been lower by 0.11%. |
| (c) | During the year ended October 31, 2010, the Fund received proceeds from a regulatory settlement. Had the Fund not received these proceeds, the total return would have been lower by 0.09%. |
| (d) | During the year ended October 31, 2009, the Fund received proceeds from a regulatory settlement. Had the Fund not received these proceeds, the total return would have been lower by 0.02%. |
| (e) | Expense ratios include the impact of a performance incentive adjustment, if any. In addition to the fees and expenses which the Fund bears directly, the Fund indirectly bears a pro rata share of the fees and expenses of the acquired funds in which it invests. Such indirect expenses are not included in the reported expense ratios. |
| (g) | The Investment Manager and certain of its affiliates agreed to waive/reimburse certain fees and expenses, before giving effect to any performance incentive adjustment, if applicable. |
The accompanying Notes to Financial Statements are an integral part of this statement.
| | | | |
| COLUMBIA GLOBAL EQUITY FUND — 2012 SEMIANNUAL REPORT | | | 27 | |
| | |
| Financial Highlights (continued) | | |
| | | | | | | | | | | | | | | | | | | | | | | | | | | | | | |
| | | Six months
ended April 30, 2012 | | Year ended Oct. 31, |
| | | | 2011 | | 2010 | | 2009 | | 2008 | | 2007(a) |
| | | (Unaudited) | | | | | | | | | | |
Class R5 | | | | | | | | | | | | | | | | | | | | | | | | | | | | | | |
Per share data | | | | | | | | | | | | | | | | | | | | | | | | | | | | | | |
Net asset value, beginning of period | | | | $7.01 | | | | | $7.12 | | | | | $6.16 | | | | | $5.25 | | | | | $9.69 | | | | | $7.89 | |
Income from investment operations: | | | | | | | | | | | | | | | | | | | | | | | | | | | | | | |
Net investment income | | | | 0.04 | | | | | 0.02 | | | | | 0.03 | | | | | 0.08 | | | | | 0.08 | | | | | 0.05 | |
Net realized and unrealized gain (loss) | | | | 0.59 | | | | | (0.10 | ) | | | | 0.97 | | | | | 0.96 | | | | | (4.45 | ) | | | | 1.85 | |
Total from investment operations | | | | 0.63 | | | | | (0.08 | ) | | | | 1.00 | | | | | 1.04 | | | | | (4.37 | ) | | | | 1.90 | |
Less distributions to shareholders from: | | | | | | | | | | | | | | | | | | | | | | | | | | | | | | |
Net investment income | | | | (0.05 | ) | | | | (0.03 | ) | | | | (0.05 | ) | | | | (0.13 | ) | | | | (0.07 | ) | | | | (0.10 | ) |
Total distributions to shareholders | | | | (0.05 | ) | | | | (0.03 | ) | | | | (0.05 | ) | | | | (0.13 | ) | | | | (0.07 | ) | | | | (0.10 | ) |
Proceeds from regulatory settlements | | | | 0.01 | | | | | — | | | | | 0.01 | | | | | 0.00 | (b) | | | | — | | | | | — | |
Net asset value, end of period | | | | $7.60 | | | | | $7.01 | | | | | $7.12 | | | | | $6.16 | | | | | $5.25 | | | | | $9.69 | |
Total return | | | | 9.16% | (c) | | | | (1.13% | ) | | | | 16.44% | (d) | | | | 20.20% | (e) | | | | (45.40% | ) | | | | 24.33% | |
Ratios to average net assets(f) | | | | | | | | | | | | | | | | | | | | | | | | | | | | | | |
Expenses prior to fees waived or expenses reimbursed | | | | 1.08% | (g) | | | | 0.94% | | | | | 0.96% | | | | | 0.90% | | | | | 1.04% | | | | | 0.99% | (g) |
Net expenses after fees waived or expenses reimbursed(h) | | | | 0.96% | (g) | | | | 0.92% | | | | | 0.96% | | | | | 0.90% | | | | | 1.04% | | | | | 0.99% | (g) |
Net investment income | | | | 1.17% | (g) | | | | 0.32% | | | | | 0.50% | | | | | 1.39% | | | | | 1.07% | | | | | 0.62% | (g) |
Supplemental data | | | | | | | | | | | | | | | | | | | | | | | | | | | | | | |
Net assets, end of period (in thousands) | | | | $3 | | | | | $3 | | | | | $19 | | | | | $18 | | | | | $3 | | | | | $6 | |
Portfolio turnover | | | | 25% | | | | | 44% | | | | | 54% | | | | | 81% | | | | | 97% | | | | | 100% | |
Notes to Financial Highlights
| (a) | For the period from December 11, 2006 (commencement of operations) to October 31, 2007. |
| (b) | Rounds to less than $0.01. |
| (c) | During the six months ended April 30, 2012, the Fund received proceeds from a regulatory settlement. Had the Fund not received these proceeds, the total return would have been lower by 0.11%. |
| (d) | During the year ended October 31, 2010, the Fund received proceeds from a regulatory settlement. Had the Fund not received these proceeds, the total return would have been lower by 0.09%. |
| (e) | During the year ended October 31, 2009, the Fund received proceeds from a regulatory settlement. Had the Fund not received these proceeds, the total return would have been lower by 0.02%. |
| (f) | Expense ratios include the impact of a performance incentive adjustment, if any. In addition to the fees and expenses which the Fund bears directly, the Fund indirectly bears a pro rata share of the fees and expenses of the acquired funds in which it invests. Such indirect expenses are not included in the reported expense ratios. |
| (h) | The Investment Manager and certain of its affiliates agreed to waive/reimburse certain fees and expenses, before giving effect to any performance incentive adjustment, if applicable. |
The accompanying Notes to Financial Statements are an integral part of this statement.
| | |
| 28 | | COLUMBIA GLOBAL EQUITY FUND — 2012 SEMIANNUAL REPORT |
| | | | | | | | | | | | | | | | | | | | | | | | | | | | | | |
| | | Six months
ended April 30, 2012 | | Year ended Oct. 31, |
| | | | 2011 | | 2010 | | 2009 | | 2008 | | 2007(a) |
| | | (Unaudited) | | | | | | | | | | |
Class W | | | | | | | | | | | | | | | | | | | | | | | | | | | | | | |
Per share data | | | | | | | | | | | | | | | | | | | | | | | | | | | | | | |
Net asset value, beginning of period | | | | $6.97 | | | | | $7.10 | | | | | $6.16 | | | | | $5.23 | | | | | $9.66 | | | | | $7.83 | |
Income from investment operations: | | | | | | | | | | | | | | | | | | | | | | | | | | | | | | |
Net investment income | | | | 0.03 | | | | | 0.02 | | | | | 0.01 | | | | | 0.06 | | | | | 0.05 | | | | | 0.02 | |
Net realized and unrealized gain (loss) | | | | 0.59 | | | | | (0.13 | ) | | | | 0.95 | | | | | 0.96 | | | | | (4.44 | ) | | | | 1.91 | |
Total from investment operations | | | | 0.62 | | | | | (0.11 | ) | | | | 0.96 | | | | | 1.02 | | | | | (4.39 | ) | | | | 1.93 | |
Less distributions to shareholders from: | | | | | | | | | | | | | | | | | | | | | | | | | | | | | | |
Net investment income | | | | (0.00 | )(b) | | | | (0.02 | ) | | | | (0.03 | ) | | | | (0.09 | ) | | | | (0.04 | ) | | | | (0.10 | ) |
Total distributions to shareholders | | | | (0.00 | )(b) | | | | (0.02 | ) | | | | (0.03 | ) | | | | (0.09 | ) | | | | (0.04 | ) | | | | (0.10 | ) |
Proceeds from regulatory settlements | | | | 0.01 | | | | | — | | | | | 0.01 | | | | | 0.00 | (b) | | | | — | | | | | — | |
Net asset value, end of period | | | | $7.60 | | | | | $6.97 | | | | | $7.10 | | | | | $6.16 | | | | | $5.23 | | | | | $9.66 | |
Total return | | | | 9.05% | (c) | | | | (1.52% | ) | | | | 15.80% | (d) | | | | 19.70% | (e) | | | | (45.62% | ) | | | | 24.87% | |
Ratios to average net assets(f) | | | | | | | | | | | | | | | | | | | | | | | | | | | | | | |
Expenses prior to fees waived or expenses reimbursed | | | | 1.57% | (g) | | | | 1.48% | | | | | 1.38% | | | | | 1.30% | | | | | 1.43% | | | | | 1.39% | (g) |
Net expenses after fees waived or expenses reimbursed(h) | | | | 1.36% | (g) | | | | 1.37% | (i) | | | | 1.38% | | | | | 1.30% | | | | | 1.43% | | | | | 1.39% | (g) |
Net investment income | | | | 0.78% | (g) | | | | 0.21% | (i) | | | | 0.08% | | | | | 1.05% | | | | | 0.68% | | | | | 0.20% | (g) |
Supplemental data | | | | | | | | | | | | | | | | | | | | | | | | | | | | | | |
Net assets, end of period (in thousands) | | | | $3 | | | | | $3 | | | | | $5 | | | | | $4 | | | | | $3 | | | | | $6 | |
Portfolio turnover | | | | 25% | | | | | 44% | | | | | 54% | | | | | 81% | | | | | 97% | | | | | 100% | |
Notes to Financial Highlights
| (a) | For the period from December 1, 2006 (commencement of operations) to October 31, 2007. |
| (b) | Rounds to less than $0.01. |
| (c) | During the six months ended April 31, 2012, the Fund received proceeds from a regulatory settlement. Had the Fund not received these proceeds, the total return would have been lower by 0.11%. |
| (d) | During the year ended October 31, 2010, the Fund received proceeds from a regulatory settlement. Had the Fund not received these proceeds, the total return would have been lower by 0.09%. |
| (e) | During the year ended October 31, 2009, the Fund received proceeds from a regulatory settlement. Had the Fund not received these proceeds, the total return would have been lower by 0.02%. |
| (f) | Expense ratios include the impact of a performance incentive adjustment, if any. In addition to the fees and expenses which the Fund bears directly, the Fund indirectly bears a pro rata share of the fees and expenses of the acquired funds in which it invests. Such indirect expenses are not included in the reported expense ratios. |
| (h) | The Investment Manager and certain of its affiliates agreed to waive/reimburse certain fees and expenses, before giving effect to any performance incentive adjustment, if applicable. |
| (i) | The benefits derived from expense reductions had an impact of less than 0.01%. |
The accompanying Notes to Financial Statements are an integral part of this statement.
| | | | |
| COLUMBIA GLOBAL EQUITY FUND — 2012 SEMIANNUAL REPORT | | | 29 | |
| | |
| Financial Highlights (continued) | | |
| | | | | | | | | | | | | | | |
| | | Six months
ended April 30, 2012 | | Year ended Oct. 31, |
| | | | 2011 | | 2010(a) |
| | | (Unaudited) | | | | |
Class Z | | | | | | | | | | | | | | | |
Per share data | | | | | | | | | | | | | | | |
Net asset value, beginning of period | | | | $7.00 | | | | | $7.12 | | | | | $6.85 | |
Income from investment operations: | | | | | | | | | | | | | | | |
Net investment income (loss) | | | | 0.04 | | | | | 0.02 | | | | | (0.01 | ) |
Net realized and unrealized gain (loss) | | | | 0.58 | | | | | (0.11 | ) | | | | 0.28 | |
Total from investment operations | | | | 0.62 | | | | | (0.09 | ) | | | | 0.27 | |
Less distributions to shareholders
from: | | | | | | | | | | | | | | | |
Net investment income | | | | (0.04 | ) | | | | (0.03 | ) | | | | — | |
Total distributions to shareholders | | | | (0.04 | ) | | | | (0.03 | ) | | | | — | |
Proceeds from regulatory settlements | | | | 0.01 | | | | | — | | | | | — | |
Net asset value, end of period | | | | $7.59 | | | | | $7.00 | | | | | $7.12 | |
Total return | | | | 9.04% | (b) | | | | (1.29% | ) | | | | 3.94% | |
Ratios to average net assets(c) | | | | | | | | | | | | | | | |
Expenses prior to fees waived or
expenses reimbursed | | | | 1.21% | (d) | | | | 1.23% | | | | | 1.37% | (d) |
Net expenses after fees waived or
expenses reimbursed(e) | | | | 1.11% | (d) | | | | 1.11% | (f) | | | | 1.37% | (d) |
Net investment income (loss) | | | | 1.02% | (d) | | | | 0.24% | (f) | | | | (1.52% | )(d) |
Supplemental data | | | | | | | | | | | | | | | |
Net assets, end of period (in thousands) | | | | $2,863 | | | | | $3,004 | | | | | $3 | |
Portfolio turnover | | | | 25% | | | | | 44% | | | | | 54% | |
Notes to Financial Highlights
| (a) | For the period from September 27, 2010 (commencement of operations) to October 31, 2010. |
| (b) | During the six months ended April 30, 2012, the Fund received proceeds from a regulatory settlement. Had the Fund not received these proceeds, the total return would have been lower by 0.11%. |
| (c) | Expense ratios include the impact of a performance incentive adjustment, if any. In addition to the fees and expenses which the Fund bears directly, the Fund indirectly bears a pro rata share of the fees and expenses of the acquired funds in which it invests. Such indirect expenses are not included in the reported expense ratios. |
| (e) | The Investment Manager and certain of its affiliates agreed to waive/reimburse certain fees and expenses, before giving effect to any performance incentive adjustment, if applicable. |
| (f) | The benefits derived from expense reductions had an impact of 0.01%. |
The accompanying Notes to Financial Statements are an integral part of this statement.
| | |
| 30 | | COLUMBIA GLOBAL EQUITY FUND — 2012 SEMIANNUAL REPORT |
| | |
| Notes to Financial Statements | | |
April 30, 2012 (Unaudited)
Columbia Global Equity Fund (the Fund), a series of Columbia Funds Series Trust II (the Trust), is a diversified fund. The Trust is registered under the Investment Company Act of 1940, as amended (the 1940 Act), as an open-end management investment company organized as a Massachusetts business trust.
Fund Shares
The Trust may issue an unlimited number of shares (without par value). The Fund offers Class A, Class B, Class C, Class I, Class R, Class R4, Class R5, Class W and Class Z shares. All share classes have identical voting, dividend and liquidation rights. Each share class has its own expense structure and sales charges, as applicable.
Class A shares are subject to a maximum front-end sales charge of 5.75% based on the initial investment amount. Class A shares purchased without an initial sales charge in accounts aggregating $1 million to $50 million at the time of purchase are subject to a contingent deferred sales charge (CDSC) if the shares are sold within 18 months of purchase, charged as follows: 1.00% CDSC if redeemed within 12 months of purchase, and 0.50% CDSC if redeemed more than 12, but less than 18, months after purchase.
Class B shares may be subject to a maximum CDSC of 5.00% based upon the holding period after purchase. Class B shares will generally convert to Class A shares eight years after purchase. The Fund no longer accepts investments by new or existing investors in the Fund’s Class B shares, except in connection with the reinvestment of any dividend and/or capital gain distributions in Class B shares of the Fund and exchanges by existing Class B shareholders of certain other funds within the Columbia Family of Funds.
Class C shares are subject to a 1.00% CDSC on shares redeemed within one year of purchase.
Class I shares are not subject to sales charges and are only available to the Columbia Family of Funds.
Class R shares are not subject to sales charges and are only available to qualifying institutional investors.
Class R4 shares are not subject to sales charges; however, this share class is closed to new investors.
Class R5 shares are not subject to sales charges; however, this share class is closed to new investors.
| | | | |
| COLUMBIA GLOBAL EQUITY FUND — 2012 SEMIANNUAL REPORT | | | 31 | |
| | |
| Notes to Financial Statements (continued) | | |
Class W shares are not subject to sales charges and are only available to investors purchasing through authorized investment programs managed by investment professionals, including discretionary managed account programs.
Class Z shares are not subject to sales charges, and are only available to certain investors, as described in the Fund’s prospectus.
| Note 2. Summary | of Significant Accounting Policies |
Use of Estimates
The preparation of financial statements in accordance with U.S. generally accepted accounting principles (GAAP) requires management to make certain estimates and assumptions that affect the reported amounts of assets and liabilities, the disclosure of contingent assets and liabilities at the date of the financial statements and the reported amounts of revenue and expenses during the reporting period. Actual results could differ from those estimates.
The following is a summary of significant accounting policies consistently followed by the Fund in the preparation of its financial statements.
Security Valuation
All equity securities are valued at the close of business of the New York Stock Exchange (NYSE). Equity securities are valued at the last quoted sales price on the principal exchange or market on which they trade, except for securities traded on the NASDAQ Stock Market, which are valued at the NASDAQ official close price. Unlisted securities or listed securities for which there were no sales during the day are valued at the mean of the latest quoted bid and asked prices on such exchanges or markets.
Debt securities generally are valued by pricing services approved by the Board of Trustees (the Board) based upon market transactions for normal, institutional-size trading units of similar securities. The services may use various pricing techniques which take into account appropriate factors such as yield, quality, coupon rate, maturity, type of issue, trading characteristics and other data, as well as broker quotes. Debt securities for which quotations are readily available may also be valued based upon an over-the-counter or exchange bid quotation.
Foreign securities are valued based on quotations from the principal market in which such securities are normally traded. If any foreign share prices are not readily available as a result of limited share activity the securities are valued at the mean of the latest quoted bid and asked prices on such exchanges or markets. Foreign currency exchange rates are generally determined at 4:00 p.m. Eastern (U.S.) time. However, many securities markets and exchanges outside the U.S. close prior to the close of the NYSE; therefore, the closing prices for securities in
| | |
| 32 | | COLUMBIA GLOBAL EQUITY FUND — 2012 SEMIANNUAL REPORT |
such markets or on such exchanges may not fully reflect events that occur after such close but before the close of the NYSE. In those situations, foreign securities will be fair valued pursuant to the policy adopted by the Board, including utilizing a third party pricing service to determine these fair values. The third party pricing service takes into account multiple factors, including, but not limited to, movements in the U.S. securities markets, certain depositary receipts, futures contracts and foreign exchange rates that have occurred subsequent to the close of the foreign exchange, to determine a good faith estimate that reasonably reflects the current market conditions as of the close of the NYSE. The fair value of a security is likely to be different from the quoted or published price, if available.
Investments in other open-end investment companies, including money market funds, are valued at net asset value.
Short-term securities purchased within 60 days to maturity are valued at amortized cost, which approximates market value. The value of short-term securities originally purchased with maturities greater than 60 days is determined based on an amortized value to par upon reaching 60 days to maturity. Short-term securities maturing in more than 60 days from the valuation date are valued at the market price or approximate market value based on current interest rates.
Investments for which market quotations are not readily available, or that have quotations which management believes are not reliable, are valued at fair value as determined in good faith under consistently applied procedures established by and under the general supervision of the Board. If a security or class of securities (such as foreign securities) is valued at fair value, such value is likely to be different from the last quoted market price for the security. The determination of fair value often requires significant judgment. To determine fair value, management may use assumptions including but not limited to future cash flows and estimated risk premiums. Multiple inputs from various sources may be used to determine value.
Foreign Currency Transactions and Translation
The values of all assets and liabilities denominated in foreign currencies are translated into U.S. dollars at that day’s exchange rates. Net realized and unrealized gains (losses) on foreign currency transactions and translations include gains (losses) arising from the fluctuation in exchange rates between trade and settlement dates on securities transactions, gains (losses) arising from the disposition of foreign currency and currency gains (losses) between the accrual and payment dates on dividends, interest income and foreign withholding taxes.
For financial statement purposes, the Fund does not distinguish that portion of gains (losses) on investments which is due to changes in foreign exchange rates
| | | | |
| COLUMBIA GLOBAL EQUITY FUND — 2012 SEMIANNUAL REPORT | | | 33 | |
| | |
| Notes to Financial Statements (continued) | | |
from that which is due to changes in market prices of the investments. Such fluctuations are included with the net realized and unrealized gains (losses) on investments in the Statement of Operations.
Repurchase Agreements
The Fund may engage in repurchase agreement transactions with institutions that management has determined are creditworthy. The Fund, through the custodian, receives delivery of the underlying securities collateralizing a repurchase agreement. Management is responsible for determining that the collateral is at least equal, at all times, to the value of the repurchase obligation including interest. A repurchase agreement transaction involves certain risks in the event of default or insolvency of the counterparty. These risks include possible delays in or restrictions on a Fund’s ability to dispose of the underlying securities and a possible decline in the value of the underlying securities during the period while the Fund seeks to assert its rights.
Security Transactions
Security transactions are accounted for on the trade date. Cost is determined and gains (losses) are based upon the specific identification method for both financial statement and federal income tax purposes.
Income Recognition
Corporate actions and dividend income are recorded net of any non-reclaimable tax withholdings, on the ex-dividend date or upon receipt of ex-dividend notification in the case of certain foreign securities.
The Fund receives distributions from holdings in real estate investment trusts (REITs) which report information on the character of their distributions annually. REIT distributions are allocated to dividend income, capital gain and return of capital based on estimates made by the Fund’s management if actual information has not yet been reported. Return of capital is recorded as a reduction of the cost basis of securities held. Management’s estimates are subsequently adjusted when the actual character of the distributions is disclosed by the REITs which could result in a proportionate increase in return of capital to shareholders.
Interest income is recorded on the accrual basis.
Awards from class action litigation are recorded as a reduction of cost basis if the Fund still owns the applicable securities on the payment date. If the Fund no longer owns the applicable securities, the proceeds are recorded as realized gains.
Expenses
General expenses of the Trust are allocated to the Fund and other funds of the Trust based upon relative net assets or other expense allocation methodologies
| | |
| 34 | | COLUMBIA GLOBAL EQUITY FUND — 2012 SEMIANNUAL REPORT |
determined by the nature of the expense. Expenses directly attributable to the Fund are charged to the Fund. Expenses directly attributable to a specific class of shares are charged to that share class.
Determination of Class Net Asset Value
All income, expenses (other than class-specific expenses, which are charged to that share class, as shown in the Statement of Operations) and realized and unrealized gains (losses) are allocated to each class of the Fund on a daily basis, based on the relative net assets of each class, for purposes of determining the net asset value of each class.
Federal Income Tax Status
The Fund intends to qualify each year as a regulated investment company under Subchapter M of the Internal Revenue Code, as amended, and will distribute substantially all of its taxable income (including net short-term capital gains), if any, for its tax year, and as such will not be subject to federal income taxes. In addition, the Fund intends to distribute in each calendar year substantially all of its net investment income, capital gains and certain other amounts, if any, such that the Fund should not be subject to federal excise tax. Therefore, no federal income or excise tax provision is recorded.
Foreign Taxes
The Fund may be subject to foreign taxes on income, gains on investments or currency repatriation, a portion of which may be recoverable. The Fund will accrue such taxes and recoveries, as applicable, based upon its current interpretation of tax rules and regulations that exist in the markets in which it invests.
Realized gains in certain countries may be subject to foreign taxes at the Fund level, based on statutory rates. The Fund accrues for such foreign taxes on net realized and unrealized gains at the appropriate rate for each jurisdiction, as applicable.
Distributions to Shareholders
Distributions from net investment income are declared and paid annually. Net realized capital gains, if any, are distributed along with the income dividend. Income distributions and capital gain distributions are determined in accordance with federal income tax regulations which may differ from GAAP.
Guarantees and Indemnifications
Under the Trust’s organizational documents and, in some cases, by contract, its officers and trustees are indemnified against certain liabilities arising out of the performance of their duties to the Trust or its funds. In addition, certain of the Fund’s contracts with its service providers contain general indemnification
| | | | |
| COLUMBIA GLOBAL EQUITY FUND — 2012 SEMIANNUAL REPORT | | | 35 | |
| | |
| Notes to Financial Statements (continued) | | |
clauses. The Fund’s maximum exposure under these arrangements is unknown since the amount of any future claims that may be made against the Fund cannot be determined, and the Fund has no historical basis for predicting the likelihood of any such claims.
Recent Accounting Pronouncement
Fair Value Measurements and Disclosures
In May 2011, the Financial Accounting Standards Board (FASB) issued ASU No. 2011-04 modifying Topic 820, Fair Value Measurements and Disclosures. At the same time, the International Accounting Standards Board (IASB) issued International Financial Reporting Standard 13, Fair Value Measurement. The objective of the FASB and IASB is convergence of their guidance on fair value measurements and disclosures.
Specifically, ASU No. 2011-04 requires reporting entities to disclose i) the amounts of any transfers between Level 1 and Level 2, and the reasons for the transfers, ii) for Level 3 fair value measurements, a) quantitative information about significant unobservable inputs used, b) a description of the valuation processes used by the reporting entity and c) a narrative description of the sensitivity of the fair value measurement to changes in unobservable inputs if a change in those inputs might result in a significantly higher or lower fair value measurement. The effective date of ASU No. 2011-04 is for interim and annual periods beginning after December 15, 2011. At this time, management is evaluating the implications of this guidance and the impact it will have on the financial statement amounts and footnote disclosures, if any.
Note 3. Fees and Compensation Paid to Affiliates
Investment Management Fees
Under an Investment Management Services Agreement, Columbia Management Investment Advisers, LLC (the Investment Manager), a wholly-owned subsidiary of Ameriprise Financial, Inc. (Ameriprise Financial), is responsible for the ultimate oversight of investments made by the Fund. The Fund’s subadviser (see Subadvisory Agreement below) has the primary responsibility for the day-to-day portfolio management of the Fund. The management fee is an annual fee that is equal to a percentage of the Fund’s average daily net assets that declines from 0.80% to 0.57% as the Fund’s net assets increase. The annualized effective management fee rate for the six months ended April 30, 2012 was 0.79% of the Fund’s average daily net assets.
Subadvisory Agreement
The Investment Manager has entered into a Subadvisory Agreement with Threadneedle International Limited (Threadneedle), an affiliate of the Investment Manager and wholly-owned subsidiary of Ameriprise Financial, the subadviser
| | |
| 36 | | COLUMBIA GLOBAL EQUITY FUND — 2012 SEMIANNUAL REPORT |
of the Fund. The Investment Manager compensates Threadneedle to manage the investments of the Fund’s assets.
Administration Fees
Under an Administrative Services Agreement, the Investment Manager serves as the Fund Administrator. The Fund pays the Fund Administrator an annual fee for administration and accounting services equal to a percentage of the Fund’s average daily net assets that declines from 0.08% to 0.05% as the Fund’s net assets increase. The annualized effective administration fee rate for the six months ended April 30, 2012 was 0.08% of the Fund’s average daily net assets.
Other Expenses
Other expenses are for, among other things, certain expenses of the Fund or the Board, including: Fund boardroom and office expense, employee compensation, employee health and retirement benefits, and certain other expenses. Payment of these Fund and Board expenses is facilitated by a company providing limited administrative services to the Fund and the Board. For the six months ended April 30, 2012, other expenses paid to this company were $1,505.
Compensation of Board Members
Board members are compensated for their services to the Fund as disclosed in the Statement of Operations. Under a Deferred Compensation Plan (the Plan), the Board members who are not “interested persons” of the Fund, as defined under the 1940 Act, may elect to defer payment of up to 100% of their compensation. Deferred amounts are treated as though equivalent dollar amounts had been invested in shares of certain funds managed by the Investment Manager. The Fund’s liability for these amounts is adjusted for market value changes and remains in the Fund until distributed in accordance with the Plan.
Transfer Agent Fees
Under a Transfer and Dividend Disbursing Agent Agreement, Columbia Management Investment Services Corp. (the Transfer Agent), an affiliate of the Investment Manager and a wholly-owned subsidiary of Ameriprise Financial, is responsible for providing transfer agency services to the Fund. The Transfer Agent has contracted with Boston Financial Data Services (BFDS) to serve as sub-transfer agent.
The Transfer Agent receives monthly account-based service fees based on the number of open accounts and is reimbursed by the Fund for the fees and expenses the Transfer Agent pays to financial intermediaries that maintain omnibus accounts with the Fund that is a percentage of the average aggregate value of the Fund’s shares maintained in each such omnibus account (other than omnibus accounts for which American Enterprise Investment Services Inc. is the broker of record or accounts where the beneficial shareholder is a customer of
| | | | |
| COLUMBIA GLOBAL EQUITY FUND — 2012 SEMIANNUAL REPORT | | | 37 | |
| | |
| Notes to Financial Statements (continued) | | |
Ameriprise Financial Services, Inc., which are paid a per account fee). The Transfer Agent pays the fees of BFDS for services as sub-transfer agent and is not entitled to reimbursement for such fees from the Fund (with the exception of out-of-pocket fees).
The Transfer Agent also receives compensation from fees for various shareholder services and reimbursements for certain out-of-pocket expenses. Class I shares do not pay transfer agent fees. Total transfer agent fees for Class R4 and Class R5 shares are subject to an annual limitation of not more than 0.05% of the average daily net assets attributable to each share class.
For the six months ended April 30, 2012, the Fund’s annualized effective transfer agent fee rates as a percentage of average daily net assets of each class were as follows:
| | | | |
Class A | | | 0.26 | % |
Class B | | | 0.28 | |
Class C | | | 0.25 | |
Class R | | | 0.26 | |
Class R4 | | | 0.05 | |
Class R5 | | | 0.05 | |
Class W | | | 0.28 | |
Class Z | | | 0.25 | |
The Fund and certain other associated investment companies (together, the Guarantors), have severally, but not jointly, guaranteed the performance and observance of all the terms and conditions of a lease entered into by Seligman Data Corp. (SDC), the former transfer agent, including the payment of rent by SDC (the Guaranty). The lease and the Guaranty expire in January 2019. At April 30, 2012, the Fund’s total potential future obligation over the life of the Guaranty is $19,521. The liability remaining at April 30, 2012 for non-recurring charges associated with the lease amounted to $13,097 and is included within other accrued expenses in the Statement of Assets and Liabilities.
An annual minimum account balance fee of $20 may apply to certain accounts with a value below the Fund’s initial minimum investment requirements to reduce the impact of small accounts on transfer agent fees. These minimum account balance fees are recorded as part of expense reductions in the Statement of Operations. For the six months ended April 30, 2012, no minimum account balance fees were charged by the Fund.
Plan Administration Fees
Under a Plan Administration Services Agreement with the Transfer Agent, the Fund pays an annual fee at a rate of 0.25% of the Fund’s average daily net assets
| | |
| 38 | | COLUMBIA GLOBAL EQUITY FUND — 2012 SEMIANNUAL REPORT |
attributable to Class R4 shares for the provision of various administrative, recordkeeping, communication and educational services.
Distribution Fees
The Fund has an agreement with Columbia Management Investment Distributors, Inc. (the Distributor), an affiliate of the Investment Manager and a wholly-owned subsidiary of Ameriprise Financial, for distribution and shareholder services. Under a Plan and Agreement of Distribution pursuant to Rule 12b-1, the Fund pays a fee at an annual rate of up to 0.25% of the Fund’s average daily net assets attributable to Class A and Class W shares, a fee at an annual rate of up to 0.50% of the Fund’s average daily net assets attributable to Class R shares (of which up to 0.25% may be used for shareholder services) and a fee at an annual rate of up to 1.00% of the Fund’s average daily net assets attributable to Class B and Class C shares. For Class B and Class C shares, of the 1.00% fee, up to 0.75% is reimbursed for distribution expenses.
The amount of distribution expenses incurred by the Distributor and not yet reimbursed (unreimbursed expense) was approximately $942,000 and $1,453,000 for Class B and Class C shares, respectively. These amounts are based on the most recent information available as of March 31, 2012, and may be recovered from future payments under the distribution plan or CDSCs. To the extent the unreimbursed expense has been fully recovered, the distribution fee is reduced.
Sales Charges
Sales charges, including front-end charges and CDSCs, received by the Distributor for distributing Fund shares were $92,239 for Class A, $3,373 for Class B and $636 for Class C shares for the six months ended April 30, 2012.
Expenses Waived/Reimbursed by the Investment Manager and its Affiliates
The Investment Manager and certain of its affiliates have contractually agreed to waive fees and/or reimburse expenses (excluding certain fees and expenses described below), through February 28, 2013, unless sooner terminated at the sole discretion of the Board, so that the Fund’s net operating expenses, after giving effect to fees waived/expenses reimbursed and any balance credits and/or overdraft
| | | | |
| COLUMBIA GLOBAL EQUITY FUND — 2012 SEMIANNUAL REPORT | | | 39 | |
| | |
| Notes to Financial Statements (continued) | | |
charges from the Fund’s custodian, do not exceed the following annual rates as a percentage of the class’ average daily net assets:
| | | | |
Class A | | | 1.36 | % |
Class B | | | 2.11 | |
Class C | | | 2.11 | |
Class I | | | 0.91 | |
Class R | | | 1.61 | |
Class R4 | | | 1.21 | |
Class R5 | | | 0.96 | |
Class W | | | 1.36 | |
Class Z | | | 1.11 | |
Under the agreement, the following fees and expenses are excluded from the waiver/reimbursement commitment, and therefore will be paid by the Fund, if applicable: taxes (including foreign transaction taxes), expenses associated with investments in affiliated and non-affiliated pooled investment vehicles (including mutual funds and exchange traded funds), transaction costs and brokerage commissions, costs related to any securities lending program, dividend expenses associated with securities sold short, inverse floater program fees and expenses, transaction charges and interest on borrowed money, interest, extraordinary expenses and any other expenses the exclusion of which is specifically approved by the Board. This agreement may be modified or amended only with approval from all parties.
| Note 4. Federal | Tax Information |
The timing and character of income and capital gain distributions are determined in accordance with income tax regulations, which may differ from GAAP because of temporary or permanent book to tax differences.
At April 30, 2012, the cost of investments for federal income tax purposes was approximately $388,529,000 and the aggregate gross approximate unrealized appreciation and depreciation based on that cost was:
| | | | |
Unrealized appreciation | | $ | 60,728,000 | |
Unrealized depreciation | | $ | (12,293,000 | ) |
Net unrealized appreciation | | $ | 48,435,000 | |
| | |
| 40 | | COLUMBIA GLOBAL EQUITY FUND — 2012 SEMIANNUAL REPORT |
The following capital loss carryforward, determined as of October 31, 2011 may be available to reduce taxable income arising from future net realized gains on investments, if any, to the extent permitted by the Internal Revenue Code:
| | | | |
| Year of expiration | | Amount | |
2015 | | $ | 939,646 | |
2016 | | | 47,035,460 | |
2017 | | | 120,508,636 | |
2018 | | | 1,645,663 | |
2019 | | | 10,827,238 | |
Unlimited long-term | | | 1,143,069 | |
Total | | $ | 182,099,712 | |
On December 22, 2010, the Regulated Investment Company Modernization Act of 2010 (the Act) was enacted, which changed various technical rules governing the tax treatment of regulated investment companies. The changes are generally effective for taxable years beginning after the date of enactment. Under the Act, the Fund will be permitted to carry forward capital losses incurred in taxable years beginning after the date of enactment for an unlimited period. However, any losses incurred during those future taxable years will be required to be utilized prior to the losses incurred in pre-enactment taxable years, which carry an expiration date. As a result of this ordering rule, pre-enactment capital loss carryforwards may be more likely to expire unused.
The Fund acquired $27,273,232 of capital loss carryforward in connection with the Threadneedle Global Equity Income Fund, Columbia Global Value Fund and Columbia World Equity Fund mergers (Note 11). In addition to the acquired capital loss carryforward, the Fund also acquired unrealized capital gains as a result of the mergers. The yearly utilization of the acquired capital loss carryforward may be limited by the Internal Revenue Code.
Management of the Fund has concluded that there are no significant uncertain tax positions that would require recognition in the financial statements. However, management’s conclusion may be subject to review and adjustment at a later date based on factors including, but not limited to, new tax laws, regulations, and administrative interpretations (including relevant court decisions). Generally, the Fund’s federal tax returns for the prior three fiscal years remain subject to examination by the Internal Revenue Service.
| | | | |
| COLUMBIA GLOBAL EQUITY FUND — 2012 SEMIANNUAL REPORT | | | 41 | |
| | |
| Notes to Financial Statements (continued) | | |
| Note 5. Portfolio | Information |
The cost of purchases and proceeds from sales of securities, excluding short-term obligations, aggregated to $103,837,492 and $152,769,364, respectively, for the six months ended April 30, 2012.
| Note 6. Regulatory | Settlements |
During the six months ended April 30, 2012, the Fund received $447,107 as a result of a regulatory settlement proceeding brought by the Securities and Exchange Commission against an unaffiliated third party relating to market timing and/or late trading of mutual funds. This amount represented the Fund’s portion of the proceeds from the settlement (the Fund was not a party to the proceeding). The payments have been included in “Proceeds from regulatory settlements” in the Statement of Changes in Net Assets.
| Note 7. Lending | of Portfolio Securities |
The Fund has entered into a Master Securities Lending Agreement (the Agreement) with JPMorgan Chase Bank, N.A. (JPMorgan). The Agreement authorizes JPMorgan as lending agent to lend securities to authorized borrowers in order to generate additional income on behalf of the Fund. Pursuant to the Agreement, the securities loaned are secured by cash or U.S. government securities equal to at least 100% of the market value of the loaned securities. Any additional collateral required to maintain those levels due to market fluctuations of the loaned securities is requested to be delivered the following business day. Cash collateral received is invested by the lending agent on behalf of the Fund into authorized investments pursuant to the Agreement. The investments made with the cash collateral are listed in the Portfolio of Investments. The values of such investments and any uninvested cash collateral are disclosed in the Statement of Assets and Liabilities along with the related obligation to return the collateral upon the return of the securities loaned.
Risks of delay in recovery of securities or even loss of rights in the securities may occur should the borrower of the securities fail financially. Risks may also arise to the extent that the value of the securities loaned increases above the value of the collateral received. JPMorgan will indemnify the Fund from losses resulting from a borrower’s failure to return a loaned security when due. Such indemnification does not extend to losses associated with declines in the value of cash collateral investments. The Investment Manager is not responsible for any losses incurred by the Fund in connection with the securities lending program. Loans are subject to termination by the Fund or the borrower at any time, and are, therefore, not considered to be illiquid investments.
| | |
| 42 | | COLUMBIA GLOBAL EQUITY FUND — 2012 SEMIANNUAL REPORT |
Pursuant to the Agreement, the Fund receives income for lending its securities either in the form of fees or by earning interest on invested cash collateral, net of negotiated rebates paid to borrowers and fees paid to the lending agent for services provided and any other securities lending expenses. Net income earned from securities lending for the six months ended April 30, 2012 is disclosed in the Statement of Operations. The Fund continues to earn and accrue interest and dividends on the securities loaned.
At April 30, 2012, securities valued at $18,945,104 were on loan, secured by cash collateral of $19,894,286 (which does not reflect calls for collateral made to borrowers by JPMorgan at period end) that is partially or fully invested in short-term securities or other cash equivalents.
| Note 8. Affiliated | Money Market Fund |
The Fund may invest its daily cash balances in Columbia Short-Term Cash Fund, an affiliated money market fund established for the exclusive use by the Fund and other affiliated funds. The income earned by the Fund from such investments is included as “Dividends from affiliates” in the Statement of Operations. As an investing fund, the Fund indirectly bears its proportionate share of the expenses of Columbia Short-Term Cash Fund.
| Note 9. Shareholder | Concentration |
At April 30, 2012, one unaffiliated shareholder account owned 10.1% of the outstanding shares of the Fund. The Fund has no knowledge about whether any portion of those shares was owned beneficially by such accounts. Subscription and redemption activity by concentrated accounts may have a significant effect on the operations of the Fund.
The Fund has entered into a revolving credit facility with a syndicate of banks led by JPMorgan Chase Bank, N.A. (the Administrative Agent), whereby the Fund may borrow for the temporary funding of shareholder redemptions or for other temporary or emergency purposes. The credit facility agreement, as amended, which is a collective agreement between the Fund and certain other funds managed by the Investment Manager, severally and not jointly, permits collective borrowings up to $500 million. Pursuant to a December 13, 2011 amendment to the credit facility agreement, interest is charged to each participating fund based on its borrowings at a rate equal to the higher of (i) the overnight federal funds rate plus 1.00% or (i) the one-month LIBOR rate plus 1.00%. Each borrowing under the credit facility matures no later than 60 days
| | | | |
| COLUMBIA GLOBAL EQUITY FUND — 2012 SEMIANNUAL REPORT | | | 43 | |
| | |
| Notes to Financial Statements (continued) | | |
after the date of borrowing. The Fund also pays a commitment fee equal to its pro rata share of the amount of the credit facility at a rate of 0.08% per annum.
Prior to December 13, 2011, interest was charged to each participating fund based on its borrowings at a rate equal to the sum of the federal funds rate plus (i) 1.25% per annum plus (ii) if one-month LIBOR exceeds the federal funds rate, the amount of such excess. The Fund also paid a commitment fee equal to its pro rata share of the amount of the credit facility at a rate of 0.10% per annum.
The Fund had no borrowings during the six months ended April 30, 2012.
At the close of business on June 3, 2011, the Fund acquired the assets and assumed the identified liabilities of Threadneedle Global Equity Income Fund, a series of RiverSource Global Series, Inc., Columbia Global Value Fund, a series of Columbia Funds Series Trust and Columbia World Equity Fund, a series of Columbia Funds Series Trust I. The reorganization was completed after shareholders approved the plan on February 15, 2011. The purpose of the transaction was to combine four funds managed by the Investment Manager with comparable investment objectives and strategies.
The aggregate net assets of the Fund immediately before the acquisition were $407,776,097 and the combined net assets immediately after the acquisition were $544,099,002.
The merger was accomplished by a tax-free exchange of 4,853,643 shares of Threadneedle Global Equity Income Fund valued at $50,294,044 (including $10,101,864 of unrealized appreciation), 5,219,514 shares of Columbia Global Value Fund valued at $32,759,335 (including $9,178,884 of unrealized depreciation) and 4,157,724 shares of Columbia World Equity Fund valued at $53,269,526 (including $11,443,207 of unrealized appreciation).
| | |
| 44 | | COLUMBIA GLOBAL EQUITY FUND — 2012 SEMIANNUAL REPORT |
In exchange for shares of Threadneedle Global Equity Income Fund, Columbia Global Value Fund and Columbia World Equity Fund, the Fund issued the following number of shares:
| | | | | | | | | | | | |
| | | Threadneedle
Global Equity
Income Fund | | | Columbia
Global Value
Fund | | | Columbia
World Equity
Fund | |
Class A | | | 5,366,091 | | | | 1,655,671 | | | | 6,705,909 | |
Class B | | | 308,970 | | | | 261,837 | | | | 73,197 | |
Class C | | | 197,899 | | | | 1,954,100 | | | | 123,910 | |
Class I | | | 656,911 | | | | NA | | | | NA | |
Class R | | | 1,403 | | | | NA | | | | NA | |
Class R4 | | | 4,271 | | | | NA | | | | NA | |
Class Z | | | NA | | | | 527,305 | | | | NA | |
For financial reporting purposes, net assets received and shares issued by the Fund were recorded at fair value; however, Threadneedle Global Equity Income Fund, Columbia Global Value Fund and Columbia World Equity Fund’s cost of investments was carried forward.
The financial statements reflect the operations of the Fund for the period prior to the merger and the combined fund for the period subsequent to the merger. Because the combined investment portfolios have been managed as a single integrated portfolio since the merger was completed, it is not practicable to separate the amounts of revenue and earnings of Threadneedle Global Equity Income Fund, Columbia Global Value Fund and Columbia World Equity Fund that have been included in the combined Fund’s Statement of Operations since the merger was completed.
Assuming the merger had been completed on November 1, 2010, the Fund’s pro-forma net investment income (loss), net gain (loss) on investments, net change in unrealized appreciation (depreciation) and net increase in net assets from operations for the year ended October 31, 2011 would have been approximately $2.5 million, $55.5 million, $(57.0) million and $1.0 million, respectively.
| Note 12. Significant | Risks |
Foreign Securities Risk
Investing in foreign securities may include certain risks and considerations not typically associated with investing in U.S. securities, such as fluctuating currency values and changing local and regional economic, political and social conditions, which may result in greater market volatility. In addition, certain foreign securities may not be as liquid as U.S. securities. Investing in emerging markets may accentuate these risks.
| | | | |
| COLUMBIA GLOBAL EQUITY FUND — 2012 SEMIANNUAL REPORT | | | 45 | |
| | |
| Notes to Financial Statements (continued) | | |
Investments in emerging market countries are subject to additional risk. The risk of foreign investments is typically increased in less developed countries. These countries are also more likely to experience high levels of inflation, deflation or currency devaluation which could hurt their economies and securities markets.
Geographic Concentration Risk
The Fund may be particularly susceptible to economic, political, regulatory or other events or conditions affecting issuers and countries within the specific geographic regions in which the Fund invests. Currency devaluation could occur in countries that have not yet experienced currency devaluation to date, or could continue to occur in countries that have already experienced such devaluations. As a result, the Fund may be more volatile than a more geographically diversified fund.
| Note 13. Subsequent | Events |
Management has evaluated the events and transactions that have occurred through the date the financial statements were issued and noted no items requiring adjustment of the financial statements or additional disclosure.
| Note | 14. Information Regarding Pending and Settled Legal Proceedings |
In December 2005, without admitting or denying the allegations, American Express Financial Corporation (AEFC, which is now known as Ameriprise Financial, Inc. (Ameriprise Financial)) entered into settlement agreements with the Securities and Exchange Commission (SEC) and Minnesota Department of Commerce (MDOC) related to market timing activities. As a result, AEFC was censured and ordered to cease and desist from committing or causing any violations of certain provisions of the Investment Advisers Act of 1940, the Investment Company Act of 1940, and various Minnesota laws. AEFC agreed to pay disgorgement of $10 million and civil money penalties of $7 million. AEFC also agreed to retain an independent distribution consultant to assist in developing a plan for distribution of all disgorgement and civil penalties ordered by the SEC in accordance with various undertakings detailed at www.sec.gov/litigation/admin/ia-2451.pdf. Ameriprise Financial and its affiliates have cooperated with the SEC and the MDOC in these legal proceedings, and have made regular reports to the funds’ Boards of Trustees.
Ameriprise Financial and certain of its affiliates have historically been involved in a number of legal, arbitration and regulatory proceedings, including routine litigation, class actions, and governmental actions, concerning matters arising in connection with the conduct of their business activities. Ameriprise Financial believes that the Funds are not currently the subject of, and that neither Ameriprise Financial nor any of its affiliates are the subject of, any pending
| | |
| 46 | | COLUMBIA GLOBAL EQUITY FUND — 2012 SEMIANNUAL REPORT |
legal, arbitration or regulatory proceedings that are likely to have a material adverse effect on the Funds or the ability of Ameriprise Financial or its affiliates to perform under their contracts with the Funds. Ameriprise Financial is required to make 10-Q, 10-K and, as necessary, 8-K filings with the Securities and Exchange Commission on legal and regulatory matters that relate to Ameriprise Financial and its affiliates. Copies of these filings may be obtained by accessing the SEC website at www.sec.gov.
There can be no assurance that these matters, or the adverse publicity associated with them, will not result in increased fund redemptions, reduced sale of fund shares or other adverse consequences to the Funds. Further, although we believe proceedings are not likely to have a material adverse effect on the Funds or the ability of Ameriprise Financial or its affiliates to perform under their contracts with the Funds, these proceedings are subject to uncertainties and, as such, we are unable to estimate the possible loss or range of loss that may result. An adverse outcome in one or more of these proceedings could result in adverse judgments, settlements, fines, penalties or other relief that could have a material adverse effect on the consolidated financial condition or results of operations of Ameriprise Financial.
| | | | |
| COLUMBIA GLOBAL EQUITY FUND — 2012 SEMIANNUAL REPORT | | | 47 | |
The policy of the Board is to vote the proxies of the companies in which the Fund holds investments consistent with the procedures as stated in the Statement of Additional Information (SAI). You may obtain a copy of the SAI without charge by calling 800.345.6611; contacting your financial intermediary; visiting columbiamanagement.com; or searching the website of the Securities and Exchange Commission (SEC) at www.sec.gov. Information regarding how the Fund voted proxies relating to portfolio securities is filed with the SEC by August 31 for the most recent 12-month period ending June 30 of that year, and is available without charge by visiting columbiamanagement.com; or searching the website of the SEC at www.sec.gov.
| | |
| Approval of Investment Management Services |
| |
| and Subadvisory Agreements | | |
Columbia Management Investment Advisers, LLC (“Columbia Management” or the “investment manager”), a wholly-owned subsidiary of Ameriprise Financial, Inc. (“Ameriprise Financial”), serves as the investment manager to Columbia Global Equity Fund (the “Fund”). Under an investment management services agreement (the “IMS Agreement”), Columbia Management provides investment advice and other services to the Fund and all funds distributed by Columbia Management Investment Distributors, Inc. (collectively, the “Funds”). In addition, under a Subadvisory Agreement (the “Subadvisory Agreement”) between Columbia Management and Threadneedle International Limited (the “Subadviser”), an affiliate of Columbia Management, the Subadviser has provided portfolio management and related services for the Fund.
On an annual basis, the Fund’s Board of Trustees (the “Board”), including the independent Board members (the “Independent Trustees”), considers renewal of the IMS Agreement and the Subadvisory Agreement (together, the “Advisory Agreements”). Columbia Management prepared detailed reports for the Board and its Contracts Committee in March and April 2012, including reports based on analyses of data provided by an independent organization and a comprehensive response to each item of information requested by independent legal counsel to the Independent Trustees (“Independent Legal Counsel”) in a letter to the investment manager, to assist the Board in making this determination. All of the materials presented in March and April were first supplied in draft form to designated representatives of the Independent Trustees, i.e., Independent Legal Counsel, the Chair of the Board and the Chair of the Contracts Committee (including materials relating to the Fund’s expense cap), and the final materials were revised to reflect comments provided by these Board representatives. In addition, throughout the year, the Board (or its committees) regularly meets with portfolio management teams and senior management
| | |
| 48 | | COLUMBIA GLOBAL EQUITY FUND — 2012 SEMIANNUAL REPORT |
personnel and reviews information prepared by Columbia Management addressing the services Columbia Management provides and Fund performance. The Board accords particular weight to the work, deliberations and conclusions of the Contracts Committee, the Investment Review Committee and the Compliance Committee in determining whether to continue the Advisory Agreements.
The Board, at its April 10-12, 2012 in-person Board meeting (the “April Meeting”), considered the renewal of the Advisory Agreements for an additional one-year term. At the April Meeting, Independent Legal Counsel reviewed with the Independent Trustees various factors relevant to the Board’s consideration of advisory and subadvisory agreements and the Board’s legal responsibilities related to such consideration. Following an analysis and discussion of the factors identified below, the Board, including all of the Independent Trustees, approved the renewal of each of the Advisory Agreements.
Nature, Extent and Quality of Services Provided by Columbia Management and the Subadviser: The Board considered its analysis of various reports and presentations received by it or one of its committees detailing the services performed by Columbia Management and the Subadviser, as well as their history, reputation, expertise, resources and relative capabilities, and the qualifications of their personnel.
With respect to Columbia Management, the Board specifically considered many developments during the past year concerning the services provided by Columbia Management, including, in particular, the continued investment in, and resources dedicated to, the Funds’ operations and the successful completion of various integration initiatives and the consolidation of dozens of Funds. The Board noted the information it received concerning Columbia Management’s ability to retain key portfolio management personnel. In that connection, the Board took into account its meetings with Columbia Management’s Chief Investment Officer (the “CIO”) and considered the CIO’s successful execution of additional risk and portfolio management oversight applied to the Funds. The Board also assessed Columbia Management’s significant investment in upgrading technology (such as an equity trading system) and considered management’s commitments to enhance existing resources in this area.
In connection with the Board’s evaluation of the overall package of services provided by Columbia Management, the Board also considered the quality of administrative services provided to the Fund by Columbia Management. The Board also reviewed the financial condition of Columbia Management and its affiliates and their ability to carry out their responsibilities under the IMS Agreement and the Fund’s other service agreements with affiliates of Ameriprise Financial. In addition, the Board discussed the acceptability of the terms of the
| | | | |
| COLUMBIA GLOBAL EQUITY FUND — 2012 SEMIANNUAL REPORT | | | 49 | |
IMS Agreement (including the relatively broad scope of services required to be performed by Columbia Management). The Board concluded that the services being performed under the IMS Agreement were of a reasonably high quality.
Based on the foregoing, and based on other information received (both oral and written, including the information on investment performance referenced below) and other considerations, the Board concluded that Columbia Management and its affiliates were in a position to continue to provide a high quality and level of services to the Fund.
With respect to the Subadviser, the Board observed that it had previously approved the Subadviser’s code of ethics and compliance program, that the Chief Compliance Officer of the Fund continues to monitor the code and the program, and that no material issues have been reported. The Board also considered the Subadviser’s investment strategy/style, including particularly as it relates to the Fund, as well as the experience of the personnel that manage the Fund. The Board also considered the financial condition of the Subadviser and its capability and wherewithal to carry out its responsibilities under the Subadvisory Agreement. In addition, the Board discussed the acceptability of the terms of the Subadvisory Agreement including the scope of services required to be performed. The Board noted that the terms of the Subadvisory Agreement are generally consistent with the terms of other subadviser agreements for subadvisers who manage other funds managed by the investment manager. It was observed that no changes were recommended to the Subadvisory Agreement. Based on the foregoing, and based on other information received (both oral and written) and other considerations, including, in particular, the performance of the Fund (discussed below) as well as the investment manager’s recommendation that the Board approve renewal of the Subadvisory Agreement with the Subadviser, the Board concluded that the services being performed under the Subadvisory Agreement were of a reasonably high quality.
Based on the foregoing, and based on other information received (both oral and written, including the information on investment performance referenced below) and other considerations, the Board concluded that the Subadviser was in a position to continue to provide a high quality and level of services to the Fund.
Investment Performance: For purposes of evaluating the nature, extent and quality of services provided under the Advisory Agreements, the Board reviewed the investment performance of the Fund. In this regard, the Board considered detailed reports providing the results of analyses performed by an independent organization showing, for various periods, the performance of the Fund, the performance of a benchmark index, the percentage ranking of the Fund among its comparison group and the net assets of the Fund. The Board observed that the Fund’s investment performance met expectations.
| | |
| 50 | | COLUMBIA GLOBAL EQUITY FUND — 2012 SEMIANNUAL REPORT |
Additionally, the Board reviewed the performance of the Subadviser and Columbia Management’s process for monitoring the Subadviser. The Board considered, in particular, management’s rationale for recommending the continued retention of the Subadviser.
Comparative Fees, Costs of Services Provided and the Profits Realized By Columbia Management, its Affiliates and the Subadviser from their Relationships with the Fund: The Board reviewed comparative fees and the costs of services provided under each of the Advisory Agreements. The Board members considered detailed comparative information set forth in an annual report on fees and expenses, including, among other things, data (based on analyses conducted by an independent organization) showing a comparison of the Fund’s expenses with median expenses paid by funds in its comparative peer universe, as well as data showing the Fund’s contribution to Columbia Management’s profitability.
The Board accorded particular weight to the notion that the level of fees should reflect a rational pricing model applied consistently across the various product lines in the Fund family, while assuring that the overall fees for each Fund (with few defined exceptions) are generally in line with the “pricing philosophy” (i.e., that the total expense ratio of the Fund is at, or below, the median expense ratio of funds in the same comparison universe of the Fund). The Board took into account that the Fund’s total expense ratio (after considering proposed expense caps/waivers) was slightly below the peer universe’s median expense ratio shown in the reports. Additionally, the Board reviewed the level of subadvisory fees paid to the Subadviser, noting that the fees are paid by the investment manager and do not impact the fees paid by the Fund. The Board observed that the subadvisory fee level for the Subadviser was generally comparable to those charged by other subadvisers to similar funds managed by the investment manager. The Board also reviewed fee rates charged by the Subadviser to other client accounts. Based on its review, the Board concluded that the Fund’s management and subadvisory fees were fair and reasonable in light of the extent and quality of services that the Fund receives.
The Board also considered the profitability of Columbia Management and its affiliates in connection with Columbia Management providing investment management services to the Fund. In this regard, the Board referred to a detailed profitability report, discussing the profitability to Columbia Management and Ameriprise Financial from managing, operating and distributing the Funds. In this regard, the Board observed that 2011 profitability, while slightly lower than 2010, was generally in line with the reported profitability of other asset management firms. The Board also considered the indirect economic benefits flowing to Columbia Management or its affiliates in connection with managing or distributing the Funds, such as the enhanced ability to offer various other
| | | | |
| COLUMBIA GLOBAL EQUITY FUND — 2012 SEMIANNUAL REPORT | | | 51 | |
financial products to Ameriprise Financial customers, soft dollar benefits and overall reputational advantages. The Board noted that the fees paid by the Fund should permit the investment manager to offer competitive compensation to its personnel, make necessary investments in its business and earn an appropriate profit. The Board concluded that profitability levels were reasonable.
Economies of Scale to be Realized: The Board also considered the economies of scale that might be realized by Columbia Management as the Fund grows and took note of the extent to which Fund shareholders might also benefit from such growth.
Based on the foregoing, the Board, including all of the Independent Trustees, concluded that fees payable under the Advisory Agreements were fair and reasonable in light of the extent and quality of services provided. In reaching this conclusion, no single factor was determinative. At the April Meeting, the Board, including all of the Independent Trustees, approved the renewal of the Advisory Agreements.
| | |
| 52 | | COLUMBIA GLOBAL EQUITY FUND — 2012 SEMIANNUAL REPORT |
Columbia Global Equity Fund
P.O. Box 8081
Boston, MA 02266-8081
columbiamanagement.com
| | | | |
 | | This report must be accompanied or preceded by the Fund’s current prospectus. The
Fund is distributed by Columbia Management Investment Distributors, Inc., member
FINRA, and managed by Columbia Management Investment Advisers, LLC. ©2012 Columbia Management Investment Advisers, LLC. All rights reserved. | | S-6451 AA (6/12) |
Semiannual Report

Columbia
Global Extended Alpha Fund
Semiannual Report for the Period Ended April 30, 2012
Columbia Global Extended Alpha Fund seeks to provide shareholders with long-term capital growth.
Not FDIC insured ¡ No bank guarantee ¡ May lose value
| | | | |
| |
Your Fund at a Glance | | | 2 | |
| |
Fund Expense Example | | | 6 | |
| |
Portfolio of Investments | | | 8 | |
| |
Statement of Assets and Liabilities | | | 16 | |
| |
Statement of Operations | | | 18 | |
| |
Statement of Changes in Net Assets | | | 20 | |
| |
Financial Highlights | | | 22 | |
| |
Notes to Financial Statements | | | 29 | |
| |
Proxy Voting | | | 47 | |
| |
Approval of Investment Management Services and Subadvisory Agreements | | | 47 | |
See the Fund’s prospectus for risks associated with investing in the Fund.
| | | | |
| COLUMBIA GLOBAL EXTENDED ALPHA FUND — 2012 SEMIANNUAL REPORT | | | 1 | |
FUND SUMMARY
| > | | Columbia Global Extended Alpha Fund (the Fund) Class A shares gained 8.49% (excluding sales charge) for the six months ended April 30, 2012. |
| > | | The Fund outperformed its benchmark, the MSCI All Country World Index (Net), which gained 7.07% during the same six-month period. |
ANNUALIZED TOTAL RETURNS (for period ended April 30, 2012)
| | | | | | | | | | | | |
| | | 6 months* | | | 1 year | | | Since
inception
08/01/08 | |
Columbia Global Extended Alpha Fund
Class A (excluding sales charge) | | | +8.49% | | | | -1.90% | | | | +5.45% | |
MSCI All Country World Index (Net)(1) (unmanaged) | | | +7.07% | | | | -5.73% | | | | +1.17% | |
MSCI All Country World Index (Gross)(1) (unmanaged) | | | +7.36% | | | | -5.21% | | | | +1.71% | |
The performance information shown represents past performance and is not a guarantee of future results. The investment return and principal value of your investment will fluctuate so that your shares, when redeemed, may be worth more or less than their original cost. Current performance may be lower or higher than the performance information shown. You may obtain performance information current to the most recent month-end by contacting your financial intermediary, visiting columbiamanagement.com or calling 800.345.6611.
The 5.75% sales charge applicable to Class A shares of the Fund is not reflected in the table above. If reflected, returns would be lower than those shown. The performance of other classes may vary from that shown because of differences in fees and expenses. The Fund’s returns reflect the effect of fee waivers/expense reimbursements, if any. Without such waivers/reimbursements, the Fund’s returns would be lower. See the Average Annual Total Returns table for performance of other share classes of the Fund.
The indices do not reflect the effects of sales charges, expenses and taxes (except the MSCI All Country World Index (Net), which reflects reinvested dividends net of withholding taxes). It is not possible to invest directly in an index.
| (1) | | The MSCI All Country World Index (Net) and the MSCI All Country World Index (Gross), each an unmanaged index of equity securities, are designed to measure equity market performance of developed and emerging markets. Each index reflects reinvestment of all distributions and changes in market prices. On September 30, 2011, the MSCI All Country World Index (Net) replaced the MSCI All Country World Index (Gross) as the Fund’s primary benchmark. The Fund’s |
| | |
| 2 | | COLUMBIA GLOBAL EXTENDED ALPHA FUND — 2012 SEMIANNUAL REPORT |
| | Investment Manager made this recommendation to the Fund’s Board because the Investment Manager believes that the Net version of the index better reflects how dividends paid to the Fund on foreign securities generally are treated for tax purposes and, therefore, provides a more appropriate basis for comparing the Fund’s performance. Information on both versions of the index will be included for a one-year transition period. Thereafter, only the Net version will be included. |
AVERAGE ANNUAL TOTAL RETURNS
| | | | | | | | | | | | |
| at April 30, 2012 | | | | | | | | | |
| Without sales charge | | 6 months* | | | 1 year | | | Since inception | |
Class A (inception 8/1/08) | | | +8.49% | | | | -1.90% | | | | +5.45% | |
Class B (inception 8/1/08) | | | +8.09% | | | | -2.68% | | | | +4.64% | |
Class C (inception 8/1/08) | | | +8.07% | | | | -2.67% | | | | +4.64% | |
Class I (inception 8/1/08) | | | +8.64% | | | | -1.60% | | | | +5.80% | |
Class R (inception 8/1/08) | | | +8.34% | | | | -2.16% | | | | +5.08% | |
Class R4 (inception 8/1/08) | | | +8.53% | | | | -1.86% | | | | +5.53% | |
Class Z** (inception 9/27/10) | | | +8.63% | | | | -1.70% | | | | +5.56% | |
| | | |
| With sales charge | | | | | | | | | |
Class A (inception 8/1/08) | | | +2.27% | | | | -7.53% | | | | +3.80% | |
Class B (inception 8/1/08) | | | +3.09% | | | | -7.34% | | | | +3.92% | |
Class C (inception 8/1/08) | | | +7.07% | | | | -3.60% | | | | +4.64% | |
The “Without sales charge” returns for Class A, Class B and Class C shares do not include applicable initial or contingent deferred sales charges. If included, returns would be lower than those shown. The “With sales charge” returns for Class A, Class B and Class C shares include: the maximum initial sales charge of 5.75% for Class A shares; the applicable contingent deferred sales charge (CDSC) for Class B shares (applied as follows: first year 5%; second year 4%; third and fourth years 3%; fifth year 2%; sixth year 1%; no sales charge thereafter); and a 1% CDSC for Class C shares sold within one year after purchase. The Fund’s other share classes are not subject to sales charges and have limited eligibility. See the Fund’s prospectuses for details.
| ** | The returns shown for periods prior to the share class inception date (including returns since inception, which are since Fund inception) include the returns of the Fund’s Class A shares. These returns are adjusted to reflect any higher class-related operating expenses of the newer share class, as applicable. Please visit columbiamanagement.com/mutual-fund/appended-performance for more information. |
| | | | |
| COLUMBIA GLOBAL EXTENDED ALPHA FUND — 2012 SEMIANNUAL REPORT | | | 3 | |
| | |
| Your Fund at a Glance (continued) | | |
| | | | | | | | | | | | |
PORTFOLIO BREAKDOWN BY COUNTRY(1)
(at April 30, 2012; % of portfolio and portfolio swaps(2)) | |
| | | Long | | | Short(3) | | | Net | |
Australia | | | 3.5 | % | | | 0.0 | % | | | 3.5 | % |
Belgium | | | 1.0 | | | | 0.0 | | | | 1.0 | |
Brazil | | | 2.6 | | | | 0.0 | | | | 2.6 | |
Canada | | | 2.2 | | | | -1.4 | | | | 0.8 | |
Cyprus | | | 1.3 | | | | 0.0 | | | | 1.3 | |
France | | | 1.4 | | | | 0.0 | | | | 1.4 | |
Germany | | | 4.9 | | | | 0.0 | | | | 4.9 | |
Hong Kong | | | 1.7 | | | | 0.0 | | | | 1.7 | |
India | | | 0.4 | | | | 0.0 | | | | 0.4 | |
Ireland | | | 4.0 | | | | 0.0 | | | | 4.0 | |
Japan | | | 6.7 | | | | 0.0 | | | | 6.7 | |
Luxembourg | | | 0.0 | | | | -9.5 | | | | -9.5 | |
Netherlands | | | 4.2 | | | | 0.0 | | | | 4.2 | |
Norway | | | 0.0 | | | | -0.7 | | | | -0.7 | |
Singapore | | | 0.7 | | | | 0.0 | | | | 0.7 | |
South Africa | | | 1.4 | | | | 0.0 | | | | 1.4 | |
South Korea | | | 2.7 | | | | 0.0 | | | | 2.7 | |
Switzerland | | | 9.2 | | | | -0.8 | | | | 8.4 | |
United Kingdom | | | 12.5 | | | | -0.9 | | | | 11.6 | |
United States | | | 58.8 | | | | -8.5 | | | | 50.3 | |
Other(4) | | | 2.6 | | | | 0.0 | | | | 2.6 | |
| | | | 121.8 | % | | | -21.8 | % | | | 100.0 | % |
| (1) | | Percentages indicated are based upon total investments (excluding Investments of Cash Collateral Received for Securities on Loan). The Fund’s portfolio composition is subject to change. |
| (2) | | The Fund has entered into a portfolio swap agreement. A portfolio swap allows the Fund to obtain exposure to a custom basket of securities and foreign markets (both long and short exposures) without owning or taking physical custody of such securities. The portfolio breakdown by country for each underlying position in the custom basket has been estimated by multiplying the notional amount of each security by its April 30, 2012 closing market price as obtained from an authorized pricing source. The notional amounts and the market values of the positions in the custom basket are not presented in the financial statements. |
| (3) | | At April 30, 2012, the Fund had no short positions. However, the Fund had entered into a portfolio swap agreement in order to gain short exposure to foreign equity markets. See Portfolio Swap Outstanding at April 30, 2012 following the Portfolio of Investments, and Note 2 to the financial statements. |
| (4) | | Includes investments in Money Market Funds. |
| | |
| 4 | | COLUMBIA GLOBAL EXTENDED ALPHA FUND — 2012 SEMIANNUAL REPORT |
| | | | |
| TOP TEN HOLDINGS(1) (at April 30, 2012) | |
Aon PLC (United Kingdom) | | | 2.8 | % |
Covidien PLC (Ireland) | | | 2.7 | |
Google, Inc., Class A (United States) | | | 2.7 | |
Nestlé SA, Registered Shares (Switzerland) | | | 2.6 | |
Airgas, Inc. (United States) | | | 2.6 | |
Toyota Motor Corp. (Japan) | | | 2.4 | |
BG Group PLC (United Kingdom) | | | 2.4 | |
eBay, Inc. (United States) | | | 2.2 | |
Kraft Foods, Inc., Class A (United States) | | | 2.1 | |
Vodafone Group PLC (United Kingdom) | | | 2.1 | |
| (1) | | Percentages indicated are based upon total investments (excluding Investments of Cash Collateral Received for Securities on Loan and money market funds). |
Top ten holdings do not include notional exposure to holdings the Fund has through its use of a portfolio swap. For more information regarding the Fund’s portfolio swap, see Portfolio Swap Outstanding at April 30, 2012 following the Portfolio of Investments.
For further detail about these holdings, please refer to the section entitled “Portfolio of Investments.”
Fund holdings are as of the date given, are subject to change at any time, and are not recommendations to buy or sell any security.
MORNINGSTAR STYLE BOXTM
| | |
 | | The Morningstar Style BoxTM is based on the Fund’s portfolio holdings.
For equity funds, the vertical axis shows the market capitalization of the
stocks owned, and the horizontal axis shows investment style (value,
blend, or growth). Information shown is based on the most recent data
provided by Morningstar. |
©2012 Morningstar, Inc. All rights reserved. The Morningstar information contained herein: (1) is proprietary to Morningstar and/or its content providers; (2) may not be copied or distributed; and (3) is not warranted to be accurate, complete, or timely. Neither Morningstar nor its content providers are responsible for any damages or losses arising from any use of this information. Past performance is no guarantee of future results.
| | | | |
| COLUMBIA GLOBAL EXTENDED ALPHA FUND — 2012 SEMIANNUAL REPORT | | | 5 | |
(Unaudited)
Understanding your expenses
As an investor, you incur two types of costs. There are transaction costs, which generally include sales charges on purchases and may include redemption fees. There are also ongoing costs, which generally include management fees, distribution and service (Rule 12b-1) fees, and other fund expenses. The following information is intended to help you understand your ongoing costs (in dollars) of investing in the Fund and to help you compare these costs with the ongoing costs of investing in other mutual funds.
Analyzing your fund’s expenses
To illustrate these ongoing costs, we have provided examples and calculated the expenses paid by investors in each share class of the Fund during the period. The actual and hypothetical information in the table is based on an initial investment of $1,000 at the beginning of the period indicated and held for the entire period. Expense information is calculated two ways and each method provides you with different information. The amount listed in the “Actual” column is calculated using the Fund’s actual operating expenses and total return for the period. You may use the Actual information, together with the amount invested, to estimate the expenses that you paid over the period. Simply divide your account value by $1,000 (for example, an $8,600 account value divided by $1,000 = 8.6), then multiply the results by the expenses paid during the period under the Actual column. The amount listed in the “Hypothetical” column assumes a 5% annual rate of return before expenses (which is not the Fund’s actual return) and then applies the Fund’s actual expense ratio for the period to the hypothetical return. You should not use the hypothetical account values and expenses to estimate either your actual account balance at the end of the period or the expenses you paid during the period. See “Compare with other funds” below for details on how to use the hypothetical data.
Compare with other funds
Since all mutual funds are required to include the same hypothetical calculations about expenses in shareholder reports, you can use this information to compare the ongoing cost of investing in the Fund with other funds. To do so, compare the hypothetical example with the 5% hypothetical examples that appear in the shareholder reports of other funds. As you compare hypothetical examples of other funds, it is important to note that hypothetical examples are meant to highlight the ongoing costs of investing in a fund only and do not reflect any transaction costs, such as sales charges, or redemption or exchange fees. Therefore, the hypothetical calculations are useful in comparing ongoing costs only, and will not help you determine the relative total costs of owning different funds. If transaction costs were included in these calculations, your costs would be higher.
| | |
| 6 | | COLUMBIA GLOBAL EXTENDED ALPHA FUND — 2012 SEMIANNUAL REPORT |
November 1, 2011 — April 30, 2012
| | | | | | | | | | | | | | | | | | | | | | | | | | | | |
| | | Account value at the
beginning of the
period ($) | | | Account value at the
end of the period ($) | | | Expenses paid
during the period ($) | | | Fund’s
annualized
expense
ratio (%) | |
| | | Actual | | | Hypothetical | | | Actual | | | Hypothetical | | | Actual | | | Hypothetical | | | Actual | |
Class A | | | 1,000.00 | | | | 1,000.00 | | | | 1,084.90 | | | | 1,017.50 | | | | 7.67 | | | | 7.42 | | | | 1.48 | |
Class B | | | 1,000.00 | | | | 1,000.00 | | | | 1,080.90 | | | | 1,013.72 | | | | 11.59 | | | | 11.22 | | | | 2.24 | |
Class C | | | 1,000.00 | | | | 1,000.00 | | | | 1,080.70 | | | | 1,013.77 | | | | 11.54 | | | | 11.17 | | | | 2.23 | |
Class I | | | 1,000.00 | | | | 1,000.00 | | | | 1,086.40 | | | | 1,019.24 | | | | 5.86 | | | | 5.67 | | | | 1.13 | |
Class R | | | 1,000.00 | | | | 1,000.00 | | | | 1,083.40 | | | | 1,016.31 | | | | 8.91 | | | | 8.62 | | | | 1.72 | |
Class R4 | | | 1,000.00 | | | | 1,000.00 | | | | 1,085.30 | | | | 1,017.80 | | | | 7.36 | | | | 7.12 | | | | 1.42 | |
Class Z | | | 1,000.00 | | | | 1,000.00 | | | | 1,086.30 | | | | 1,018.75 | | | | 6.38 | | | | 6.17 | | | | 1.23 | |
Expenses paid during the period are equal to the annualized expense ratio for each class as indicated above, multiplied by the average account value over the period and then multiplied by the number of days in the Fund’s most recent fiscal half year and divided by 366.
Expenses do not include fees and expenses incurred indirectly by the Fund from the underlying funds in which the Fund may invest (also referred to as “acquired funds”), including affiliated and non-affiliated pooled investment vehicles (including mutual funds and exchange traded funds).
Had Columbia Management Investment Advisers, LLC and/or certain of its affiliates not waived/reimbursed certain fees and expenses, account value at the end of the period would have been reduced.
| | | | |
| COLUMBIA GLOBAL EXTENDED ALPHA FUND — 2012 SEMIANNUAL REPORT | | | 7 | |
Columbia Global Extended Alpha Fund
April 30, 2012 (Unaudited)
(Percentages represent value of investments compared to net assets)
| | | | | | | | |
| Issuer | | Shares | | | Value | |
| | | | | | | | |
| Common Stocks 94.3% | |
AUSTRALIA 3.6% | |
Fortescue Metals Group Ltd.(a) | | | 32,619 | | | | $189,496 | |
Iluka Resources Ltd.(a) | | | 15,700 | | | | 274,254 | |
Whitehaven Coal Ltd.(a) | | | 46,423 | | | | 255,572 | |
| | | | | | | | |
Total | | | | 719,322 | |
BELGIUM 1.0% | |
Anheuser-Busch InBev NV(a) | | | 2,725 | | | | 196,406 | |
BRAZIL 2.7% | |
Itaú Unibanco Holding SA, ADR | | | 17,163 | | | | 269,287 | |
MRV Engenharia e Participacoes SA | | | 45,201 | | | | 264,166 | |
| | | | | | | | |
Total | | | | 533,453 | |
CANADA 2.2% | |
First Quantum Minerals Ltd. | | | 10,400 | | | | 216,033 | |
Methanex Corp. | | | 6,600 | | | | 232,371 | |
| | | | | | | | |
Total | | | | 448,404 | |
CYPRUS 1.4% | |
ProSafe SE | | | 34,984 | | | | 272,942 | |
FRANCE 1.4% | |
Renault SA(a) | | | 6,235 | | | | 283,294 | |
GERMANY 4.9% | |
Bayerische Motoren Werke AG | | | 2,184 | | | | 207,600 | |
Kabel Deutschland Holding AG(b) | | | 3,200 | | | | 201,626 | |
Linde AG | | | 1,849 | | | | 316,464 | |
MTU Aero Engines Holding AG(a) | | | 3,099 | | | | 260,979 | |
| | | | | | | | |
Total | | | | 986,669 | |
HONG KONG 1.8% | |
Great Eagle Holdings Ltd. | | | 79,882 | | | | 234,610 | |
Sun Hung Kai Properties Ltd. | | | 10,000 | | | | 119,779 | |
| | | | | | | | |
Total | | | | 354,389 | |
INDIA 0.4% | |
Jaiprakash Associates Ltd. | | | 57,053 | | | | 80,662 | |
IRELAND 4.1% | |
Accenture PLC, Class A | | | 4,400 | | | | 285,780 | |
Covidien PLC | | | 9,500 | | | | 524,685 | |
| | | | | | | | |
Total | | | | 810,465 | |
JAPAN 6.8% | |
Asahi Group Holdings Ltd. | | | 15,800 | | | | 355,772 | |
Makita Corp.(a) | | | 9,100 | | | | 348,336 | |
| | | | | | | | |
| Issuer | | Shares | | | Value | |
| | | | | | | | |
| Common Stocks (continued) | |
JAPAN (cont.) | |
Nikon Corp.(a) | | | 6,600 | | | | $195,613 | |
Toyota Motor Corp. | | | 11,300 | | | | 463,049 | |
| | | | | | | | |
Total | | | | 1,362,770 | |
NETHERLANDS 2.8% | |
Fugro NV-CVA | | | 3,550 | | | | 258,734 | |
LyondellBasell Industries NV, Class A | | | 7,000 | | | | 292,460 | |
| | | | | | | | |
Total | | | | 551,194 | |
SINGAPORE 0.7% | |
Mapletree Industrial Trust | | | 151,000 | | | | 137,815 | |
SOUTH AFRICA 1.4% | |
MTN Group Ltd. | | | 15,921 | | | | 278,323 | |
SWITZERLAND 8.7% | |
Nestlé SA, Registered Shares | | | 8,159 | | | | 499,797 | |
Novartis AG, Registered Shares | | | 7,150 | | | | 394,268 | |
Swatch Group AG (The) | | | 430 | | | | 198,312 | |
TE Connectivity Ltd. | | | 9,558 | | | | 348,485 | |
Tyco International Ltd. | | | 5,503 | | | | 308,883 | |
| | | | | | | | |
Total | | | | 1,749,745 | |
UNITED KINGDOM 11.5% | |
Aon PLC | | | 10,487 | | | | 543,227 | |
BG Group PLC | | | 19,429 | | | | 457,362 | |
Intercontinental Hotels Group PLC | | | 8,500 | | | | 202,980 | |
Tullow Oil PLC | | | 14,744 | | | | 367,056 | |
Vodafone Group PLC | | | 142,692 | | | | 394,835 | |
Weir Group PLC (The) | | | 12,070 | | | | 333,982 | |
| | | | | | | | |
Total | | | | 2,299,442 | |
UNITED STATES 38.9% | |
Advance Auto Parts, Inc. | | | 2,632 | | | | 241,618 | |
Aetna, Inc. | | | 3,945 | | | | 173,738 | |
Airgas, Inc. | | | 5,374 | | | | 492,473 | |
American International Group, Inc.(b) | | | 9,056 | | | | 308,176 | |
Apple, Inc.(b) | | | 334 | | | | 195,136 | |
Atwood Oceanics, Inc.(b) | | | 4,550 | | | | 201,701 | |
CBS Corp., Class B Non Voting | | | 3,000 | | | | 100,050 | |
CF Industries Holdings, Inc. | | | 1,600 | | | | 308,896 | |
Citigroup, Inc. | | | 3,754 | | | | 124,032 | |
DIRECTV, Class A(b) | | | 3,978 | | | | 195,996 | |
Dresser-Rand Group, Inc.(b) | | | 4,100 | | | | 199,588 | |
eBay, Inc.(b) | | | 10,268 | | | | 421,501 | |
EMC Corp.(b) | | | 6,566 | | | | 185,227 | |
The accompanying Notes to Financial Statements are an integral part of this statement.
| | |
| 8 | | COLUMBIA GLOBAL EXTENDED ALPHA FUND — 2012 SEMIANNUAL REPORT |
| | | | | | | | |
| Issuer | | Shares | | | Value | |
| | | | | | | | |
| Common Stocks (continued) | |
UNITED STATES (cont.) | |
Google, Inc., Class A(b) | | | 844 | | | | $510,814 | |
Henry Schein, Inc.(b) | | | 2,783 | | | | 213,567 | |
JPMorgan Chase & Co. | | | 5,827 | | | | 250,444 | |
Kraft Foods, Inc., Class A | | | 9,972 | | | | 397,584 | |
Laboratory Corp. of America Holdings(b) | | | 414 | | | | 36,386 | |
Lam Research Corp.(b) | | | 8,004 | | | | 333,367 | |
Marathon Petroleum Corp. | | | 2,839 | | | | 118,131 | |
McDonald’s Corp. | | | 3,636 | | | | 354,328 | |
PepsiCo, Inc. | | | 5,974 | | | | 394,284 | |
QUALCOMM, Inc. | | | 4,353 | | | | 277,896 | |
Sirona Dental Systems, Inc.(b) | | | 2,000 | | | | 101,020 | |
Tidewater, Inc. | | | 6,174 | | | | 339,755 | |
Time Warner Cable, Inc. | | | 2,350 | | | | 189,058 | |
Union Pacific Corp. | | | 2,600 | | | | 292,344 | |
Waste Connections, Inc. | | | 9,400 | | | | 302,962 | |
WESCO International, Inc.(b) | | | 3,012 | | | | 199,967 | |
World Fuel Services Corp. | | | 7,426 | | | | 327,190 | |
| | | | | | | | |
Total | | | | | | | 7,787,229 | |
Total Common Stocks (Cost: $17,137,975) | | | | $18,852,524 | |
| | | | | | | | |
| | | Shares | | | Value | |
| Money Market Funds 2.7% | |
Columbia Short-Term Cash Fund, 0.144% (c)(d) | | | 532,786 | | | | $532,786 | |
Total Money Market Funds (Cost: $532,786) | | | | $532,786 | |
| | | | | | | | |
| Issuer | | Shares | | | Value | |
| | | | | | | | |
| Limited Partnerships 1.8% | |
UNITED STATES 1.8% | |
Blackstone Group LP(e) | | | 12,284 | | | | $166,571 | |
Enterprise Products Partners LP(e) | | | 4,000 | | | | 206,160 | |
| | | | | | | | |
Total | | | | | | | 372,731 | |
Total Limited Partnerships (Cost: $335,707) | | | | $372,731 | |
| | | | | | | | | | | | |
| Issuer | | Effective
Yield | | | Par/
Principal/
Shares | | | Value | |
Investments of Cash Collateral
Received for Securities on Loan 6.3% | |
Repurchase Agreements 6.3% | |
UBS Securities LLC
dated 04/30/12, matures 05/01/12,
repurchase price $1,267,004 (f) | |
| | | | 0.210 | % | | | $1,266,997 | | | | $1,266,997 | |
Total Investments of Cash Collateral Received for Securities on Loan | |
(Cost: $1,266,997) | | | | $1,266,997 | |
Total Investments | |
(Cost: $19,273,465) | | | | $21,025,038 | |
Other Assets & Liabilities, Net | | | | (1,027,907 | ) |
Net Assets | | | | $19,997,131 | |
Investment in Derivatives
| | | | | | | | | | |
| Portfolio Swap(1) Outstanding at April 30, 2012 | |
| Counterparty | | Description | | Next
Reset Date | | | Net Unrealized
Depreciation | |
| UBS | | The Fund receives (pays) the total return on a custom basket of long (short) equity positions and pays (receives) a floating rate based on the 1-day LIBOR which is denominated in various foreign currencies based on the local currencies of the securities underlying the custom basket. | | | May 8, 2012 | | | | ($77,846 | ) |
| Total | | | | | | | | | ($77,846 | ) |
The accompanying Notes to Financial Statements are an integral part of this statement.
| | | | |
| COLUMBIA GLOBAL EXTENDED ALPHA FUND — 2012 SEMIANNUAL REPORT | | | 9 | |
| | |
| Portfolio of Investments (continued) | | |
Summary of Portfolio Swap Exposure by Industry
The following table represents the exposure of the custom basket of equity securities underlying the portfolio swap by industry classifications as a percentage of net assets at April 30, 2012:
| | | | | | | | | | | | | | | | |
| | | Percentage
of Net
Assets | | | Value | |
| | | | Long | | | Short | | | Net | |
| Chemicals | | | (0.8 | )% | | | $— | | | | $(152,049 | ) | | | $(152,049 | ) |
| Computers & Peripherals | | | 2.1 | | | | 573,880 | | | | (157,025 | ) | | | 416,855 | |
| Diversified Financial Services | | | 5.0 | | | | 1,006,795 | | | | — | | | | 1,006,795 | |
| Financial | | | (9.7 | ) | | | — | | | | (1,931,100 | ) | | | (1,931,100 | ) |
| Food Products | | | (0.4 | ) | | | — | | | | (85,263 | ) | | | (85,263 | ) |
| Health Care Equipment & Supplies | | | 1.0 | | | | 198,100 | | | | — | | | | 198,100 | |
| Health Care Providers & Services | | | 0.7 | | | | 138,132 | | | | — | | | | 138,132 | |
| Hotels, Restaurants & Leisure | | | (1.0 | ) | | | 78,935 | | | | (269,249 | ) | | | (190,314 | ) |
| Insurance | | | 0.7 | | | | 136,120 | | | | — | | | | 136,120 | |
| Internet Software & Services | | | 0.5 | | | | 90,785 | | | | — | | | | 90,785 | |
| Leisure Equipment & Products | | | (0.5 | ) | | | — | | | | (104,160 | ) | | | (104,160 | ) |
| Machinery | | | 1.6 | | | | 324,324 | | | | — | | | | 324,324 | |
| Marine | | | (0.5 | ) | | | — | | | | (97,218 | ) | | | (97,218 | ) |
| Media | | | 0.9 | | | | 514,450 | | | | (331,044 | ) | | | 183,406 | |
| Metals & Mining | | | (1.0 | ) | | | — | | | | (191,300 | ) | | | (191,300 | ) |
| Multiline Retail | | | (0.5 | ) | | | — | | | | (91,124 | ) | | | (91,124 | ) |
| Mullti-Utilities | | | (0.4 | ) | | | — | | | | (81,447 | ) | | | (81,447 | ) |
| Oil, Gas & Consumable Fuels | | | 1.6 | | | | 414,523 | | | | (92,820 | ) | | | 321,703 | |
| Personal Products | | | (0.6 | ) | | | — | | | | (120,244 | ) | | | (120,244 | ) |
| Professional Services | | | (0.4 | ) | | | — | | | | (84,045 | ) | | | (84,045 | ) |
| Real Estate Investment Trusts (REITs) | | | (0.6 | ) | | | — | | | | (110,022 | ) | | | (110,022 | ) |
| Semiconductors | | | 2.8 | | | | 666,592 | | | | (101,400 | ) | | | 565,192 | |
| Software | | | 2.7 | | | | 630,957 | | | | (92,752 | ) | | | 538,205 | |
| Speciality Retail | | | 0.1 | | | | 119,340 | | | | (101,524 | ) | | | 17,816 | |
| Textiles, Apparel & Luxury Goods | | | 0.2 | | | | 120,371 | | | | (77,550 | ) | | | 42,821 | |
| Water Utilities | | | (0.4 | ) | | | — | | | | (79,485 | ) | | | (79,485 | ) |
| Wireless Telecommunication Services | | | (0.4 | ) | | | — | | | | (86,800 | ) | | | (86,800 | ) |
| (1) | The Fund has entered into a portfolio swap agreement. A portfolio swap allows the Fund to obtain exposure to a custom basket of securities and foreign markets (both long and short exposures) without owning or taking physical custody of such securities. Under the terms of the agreement, payments made by the Fund or the counterparty are based on the total return of the reference assets within the basket. That is, one party agrees to pay another party the return on the basket in return for a specified interest rate. The agreement allows the Investment Manager of the Fund to alter the composition of the custom basket by trading in and out of the notional security positions at its discretion. |
| | The notional amounts of the security positions held in the basket are not recorded in the financial statements. The portfolio swap is valued daily, and the change in value is recorded as unrealized appreciation (depreciation). The swap resets monthly at which time the Fund settles in cash with the counterparty. Payments received or made are recorded as realized gains (losses). |
The accompanying Notes to Financial Statements are an integral part of this statement.
| | |
| 10 | | COLUMBIA GLOBAL EXTENDED ALPHA FUND — 2012 SEMIANNUAL REPORT |
Summary of Investments in Securities by Industry
The following table represents the portfolio investments of the Fund by industry classifications as a percentage of net assets at April 30, 2012:
| | | | | | | | |
| Industry | | Percentage of
Net Assets | | | Value | |
| Aerospace & Defense | | | 1.3 | % | | | $260,979 | |
| Automobiles | | | 4.8 | | | | 953,942 | |
| Beverages | | | 4.7 | | | | 946,462 | |
| Capital Markets | | | 0.8 | | | | 166,571 | |
| Chemicals | | | 8.2 | | | | 1,642,665 | |
| Commercial Banks | | | 1.3 | | | | 269,287 | |
| Commercial Services & Supplies | | | 1.5 | | | | 302,962 | |
| Communications Equipment | | | 1.4 | | | | 277,896 | |
| Computers & Peripherals | | | 1.9 | | | | 380,363 | |
| Diversified Financial Services | | | 1.9 | | | | 374,477 | |
| Electrical Equipment, Instruments & Components | | | 1.7 | | | | 348,485 | |
| Energy Equipment & Services | | | 6.4 | | | | 1,272,720 | |
| Food Products | | | 4.5 | | | | 897,380 | |
| Health Care Equipment & Supplies | | | 3.1 | | | | 625,705 | |
| Health Care Providers & Services | | | 2.1 | | | | 423,692 | |
| Hotels, Restaurants & Leisure | | | 2.8 | | | | 557,308 | |
| Household Durables | | | 1.3 | | | | 264,166 | |
| Industrial Conglomerates | | | 1.9 | | | | 389,546 | |
| Insurance | | | 4.2 | | | | 851,402 | |
| Internet Software & Services | | | 4.7 | | | | 932,316 | |
| IT Services | | | 1.4 | | | | 285,780 | |
| Leisure Equipment & Products | | | 1.0 | | | | 195,613 | |
| Machinery | | | 3.4 | | | | 682,318 | |
| Media | | | 3.4 | | | | 686,730 | |
| Metals & Mining | | | 3.4 | | | | 679,783 | |
| Oil, Gas & Consumable Fuels | | | 8.7 | | | | 1,731,470 | |
| Pharmaceuticals | | | 2.0 | | | | 394,268 | |
| Real Estate Investment Trust (REITs) | | | 0.7 | | | | 137,815 | |
| Real Estate Management & Development | | | 1.8 | | | | 354,388 | |
| Road & Rail | | | 1.5 | | | | 292,344 | |
| Semiconductors & Semiconductor Equipment | | | 1.7 | | | | 333,367 | |
| Speciality Retail | | | 1.2 | | | | 241,618 | |
| Textiles, Apparel & Luxury Goods | | | 1.0 | | | | 198,312 | |
| Trading Companies & Distributors | | | 1.0 | | | | 199,967 | |
| Wireless Telecommunication Services | | | 3.4 | | | | 673,158 | |
| Other(1) | | | 9.0 | | | | 1,799,783 | |
| Total | | | | | | | $21,025,038 | |
| (1) | Includes Money Market Funds and Investments of Cash Collateral Received for Securities on Loan. |
The accompanying Notes to Financial Statements are an integral part of this statement.
| | | | |
| COLUMBIA GLOBAL EXTENDED ALPHA FUND — 2012 SEMIANNUAL REPORT | | | 11 | |
| | |
| Portfolio of Investments (continued) | | |
|
| Notes to Portfolio of Investments |
| (a) | At April 30, 2012, security was partially or fully on loan. |
| (b) | Non-income producing. |
| (c) | The rate shown is the seven-day current annualized yield at April 30, 2012. |
| (d) | Investments in affiliates during the period ended April 30, 2012: |
| | | | | | | | | | | | | | | | | | | | | | | | | | | | | | |
| Issuer | | Beginning
Cost | | | Purchase
Cost | | | Sales Cost/
Proceeds
from Sales | | | Realized
Gain/Loss | | | Ending Cost | | | Dividends
or
Interest
Income | | | Value | |
Columbia Short-Term Cash Fund | | | $400,809 | | | | $6,522,248 | | | | $(6,390,271 | ) | | | $— | | | | $532,786 | | | | $ 830 | | | | $532,786 | |
| (e) | At April 30, 2012, there was no capital committed to the LLC or LP for future investment. |
| (f) | The table below represents securities received as collateral for repurchase agreements. This collateral is deposited with the Fund’s custodian and, pursuant to the terms of the repurchase agreement, must have an aggregate market value greater than or equal to the repurchase price plus accrued interest at all times. The value of securities and/or cash held as collateral for repurchase agreements is monitored on a daily basis to ensure the proper level of collateral. |
| | | | |
| UBS Securities LLC (0.210%) | | | | |
| |
| Security Description | | Value | |
| Fannie Mae Pool | | | $906,235 | |
| Freddie Mac Gold Pool | | | 386,102 | |
| Total Market Value of Collateral Securities | | | $1,292,337 | |
| | |
| Abbreviation Legend |
| ADR | | American Depositary Receipt |
The accompanying Notes to Financial Statements are an integral part of this statement.
| | |
| 12 | | COLUMBIA GLOBAL EXTENDED ALPHA FUND — 2012 SEMIANNUAL REPORT |
Generally accepted accounting principles (GAAP) require disclosure regarding the inputs and valuation techniques used to measure fair value and any changes in valuation inputs or techniques. In addition, investments shall be disclosed by major category.
The Fund categorizes its fair value measurements according to a three-level hierarchy that maximizes the use of observable inputs and minimizes the use of unobservable inputs by prioritizing that the most observable input be used when available. Observable inputs are those that market participants would use in pricing an investment based on market data obtained from sources independent of the reporting entity. Unobservable inputs are those that reflect the Fund’s assumptions about the information market participants would use in pricing an investment. An investment’s level within the fair value hierarchy is based on the lowest level of any input that is deemed significant to the asset or liability’s fair value measurement. The input levels are not necessarily an indication of the risk or liquidity associated with investments at that level. For example, certain U.S. government securities are generally high quality and liquid, however, they are reflected as Level 2 because the inputs used to determine fair value may not always be quoted prices in an active market.
Fair value inputs are summarized in the three broad levels listed below:
| | Ÿ | | Level 1 — Valuations based on quoted prices for investments in active markets that the Fund has the ability to access at the measurement date (including NAV for open-end mutual funds). Valuation adjustments are not applied to Level 1 investments. |
| | Ÿ | | Level 2 — Valuations based on other significant observable inputs (including quoted prices for similar securities, interest rates, prepayment speeds, credit risks, etc.). |
| | Ÿ | | Level 3 — Valuations based on significant unobservable inputs (including the Fund’s own assumptions and judgment in determining the fair value of investments). |
Inputs that are used in determining fair value of an investment may include price information, credit data, volatility statistics, and other factors. These inputs can be either observable or unobservable. The availability of observable inputs can vary between investments, and is affected by various factors such as the type of investment, and the volume and level of activity for that investment or similar investments in the marketplace. The inputs will be considered by the Investment Manager, along with any other relevant factors in the calculation of an investment’s fair value. The Fund uses prices and inputs that are current as of the measurement date, which may include periods of market dislocations. During these periods, the availability of prices and inputs may be reduced for many investments. This condition could cause an investment to be reclassified between the various levels within the hierarchy.
Foreign equity securities actively traded in markets where there is a significant delay in the local close relative to the New York Stock Exchange (NYSE) are classified as Level 2. The values of these securities may include an adjustment to reflect the impact of significant market movements following the close of local trading, as described in Note 2 to the financial statements – Security Valuation.
Investments falling into the Level 3 category are primarily supported by quoted prices from brokers and dealers participating in the market for those investments. However, these may be classified as Level 3 investments due to lack of market transparency and corroboration to support these quoted
The accompanying Notes to Financial Statements are an integral part of this statement.
| | | | |
| COLUMBIA GLOBAL EXTENDED ALPHA FUND — 2012 SEMIANNUAL REPORT | | | 13 | |
| | |
| Portfolio of Investments (continued) | | |
| | |
| Fair Value Measurements (continued) |
prices. Additionally, valuation models may be used as the pricing source for any remaining investments classified as Level 3. These models rely on one or more significant unobservable inputs and/or significant assumptions by the Investment Manager. Inputs used in valuations may include, but are not limited to, financial statement analysis, capital account balances, discount rates and estimated cash flows, and comparable company data.
The following table is a summary of the inputs used to value the Fund’s investments as of April 30, 2012:
| | | | | | | | | | | | | | | | |
| | | Fair Value at April 30, 2012 | |
| Description | | Level 1
Quoted Prices
in Active
Markets for
Identical Assets | | | Level 2
Other
Significant
Observable
Inputs | | | Level 3
Significant
Unobservable
Inputs | | | Total | |
| Equity Securities | | | | | | | | | | | | | | | | |
Common Stocks | | | | | | | | | | | | | | | | |
Consumer Discretionary | | | $1,548,195 | | | | $1,549,494 | | | | $— | | | | $3,097,689 | |
Consumer Staples | | | 791,868 | | | | 1,051,975 | | | | — | | | | 1,843,843 | |
Energy | | | 1,186,365 | | | | 1,611,667 | | | | — | | | | 2,798,032 | |
Financials | | | 1,495,166 | | | | 492,203 | | | | — | | | | 1,987,369 | |
Health Care | | | 1,049,397 | | | | 394,268 | | | | — | | | | 1,443,665 | |
Industrials | | | 1,104,156 | | | | 1,023,959 | | | | — | | | | 2,128,115 | |
Information Technology | | | 2,558,205 | | | | — | | | | — | | | | 2,558,205 | |
Materials | | | 1,542,233 | | | | 780,215 | | | | — | | | | 2,322,448 | |
Telecommunication Services | | | — | | | | 673,158 | | | | — | | | | 673,158 | |
| Total Equity Securities | | | 11,275,585 | | | | 7,576,939 | | | | — | | | | 18,852,524 | |
| Other | | | | | | | | | | | | | | | | |
Limited Partnerships | | | 372,731 | | | | — | | | | — | | | | 372,731 | |
Money Market Funds | | | 532,786 | | | | — | | | | — | | | | 532,786 | |
Investments of Cash Collateral Received for Securities on Loan | | | — | | | | 1,266,997 | | | | — | | | | 1,266,997 | |
| Total Other | | | 905,517 | | | | 1,266,997 | | | | — | | | | 2,172,514 | |
| Investments in Securities | | | 12,181,102 | | | | 8,843,936 | | | | — | | | | 21,025,038 | |
| Derivatives | | | | | | | | | | | | | | | | |
Liabilities | | | | | | | | | | | | | | | | |
Swap Contracts | | | — | | | | (77,846 | ) | | | — | | | | (77,846 | ) |
| Total | | | $12,181,102 | | | | $8,766,090 | | | | $— | | | | $20,947,192 | |
See the Portfolio of Investments for all investment classifications not indicated in the table.
The Fund’s assets assigned to the Level 2 input category are generally valued using the market approach, in which a security’s value is determined through reference to prices and information from market transactions for similar or identical assets. These assets include certain foreign securities for which a third party statistical pricing service may be employed for purposes of fair market valuation. The models utilized by the third party statistical pricing service take into account a security’s correlation to available market data including, but not limited to, intraday index, ADR, and ETF movements.
The accompanying Notes to Financial Statements are an integral part of this statement.
| | |
| 14 | | COLUMBIA GLOBAL EXTENDED ALPHA FUND — 2012 SEMIANNUAL REPORT |
| | |
| Fair Value Measurements (continued) |
There were no transfers of financial assets between Levels 1 and 2 during the period.
Derivative instruments are valued at unrealized appreciation (depreciation).
How to find information about the Fund’s quarterly portfolio holdings
| (i) | The Fund files its complete schedule of portfolio holdings with the Securities and Exchange Commission (SEC) for the first and third quarters of each fiscal year on Form N-Q; |
| (ii) | The Fund’s Forms N-Q are available on the SEC’s website at www.sec.gov; |
| (iii) | The Fund’s Forms N-Q may be reviewed and copied at the SEC’s Public Reference Room in Washington, DC (information on the operations of the Public Reference Room may be obtained by calling 800.SEC.0330); and |
| (iv) | The Fund’s complete schedule of portfolio holdings, as filed on Form N-Q, can be obtained without charge, upon request, by calling 800.345.6611. |
The accompanying Notes to Financial Statements are an integral part of this statement.
| | | | |
| COLUMBIA GLOBAL EXTENDED ALPHA FUND — 2012 SEMIANNUAL REPORT | | | 15 | |
| | |
| Statement of Assets and Liabilities | | |
April 30, 2012 (Unaudited)
| | | | | |
Assets | | | | | |
Investments, at value* | | | | | |
Unaffiliated issuers (identified cost $17,473,682) | | | $ | 19,225,255 | |
Affiliated issuers (identified cost $532,786) | | | | 532,786 | |
Investment of cash collateral received for securities on loan | | | | | |
Repurchase agreements (identified cost $1,266,997) | | | | 1,266,997 | |
Total investments (identified cost $19,273,465) | | | | 21,025,038 | |
Cash | | | | 1,824 | |
Foreign currency (identified cost $25,365) | | | | 26,003 | |
Receivable for: | | | | | |
Investments sold | | | | 317,828 | |
Capital shares sold | | | | 84,933 | |
Dividends | | | | 56,868 | |
Interest | | | | 706 | |
Reclaims | | | | 18,959 | |
Expense reimbursement due from Investment Manager | | | | 1,374 | |
Prepaid expenses | | | | 526 | |
Total assets | | | | 21,534,059 | |
Liabilities | | | | | |
Due upon return of securities on loan | | | | 1,266,997 | |
Unrealized depreciation on swap contracts | | | | 77,846 | |
Payable for: | | | | | |
Investments purchased | | | | 50,443 | |
Capital shares purchased | | | | 101,787 | |
Investment management fees | | | | 1,731 | |
Distribution fees | | | | 375 | |
Transfer agent fees | | | | 1,651 | |
Administration fees | | | | 132 | |
Plan administration fees | | | | 2 | |
Compensation of board members | | | | 3,235 | |
Other expenses | | | | 32,483 | |
Other liabilities | | | | 246 | |
Total liabilities | | | | 1,536,928 | |
Net assets applicable to outstanding capital stock | | | $ | 19,997,131 | |
The accompanying Notes to Financial Statements are an integral part of this statement.
| | |
| 16 | | COLUMBIA GLOBAL EXTENDED ALPHA FUND — 2012 SEMIANNUAL REPORT |
April 30, 2012 (Unaudited)
| | | | | |
Represented by | | | | | |
Paid-in capital | | | $ | 18,143,119 | |
Undistributed net investment income | | | | 85,423 | |
Accumulated net realized gain | | | | 92,583 | |
Unrealized appreciation (depreciation) on: | | | | | |
Investments | | | | 1,751,573 | |
Foreign currency translations | | | | 2,279 | |
Swap contracts | | | | (77,846 | ) |
Total — representing net assets applicable to outstanding capital stock | | | $ | 19,997,131 | |
*Value of securities on loan | | | $ | 1,198,712 | |
Net assets applicable to outstanding shares | | | | | |
Class A | | | $ | 13,027,233 | |
Class B | | | $ | 276,374 | |
Class C | | | $ | 1,002,216 | |
Class I | | | $ | 5,477,875 | |
Class R | | | $ | 37,440 | |
Class R4 | | | $ | 88,816 | |
Class Z | | | $ | 87,177 | |
Shares outstanding | | | | | |
Class A | | | | 588,936 | |
Class B | | | | 12,517 | |
Class C | | | | 46,033 | |
Class I | | | | 246,500 | |
Class R | | | | 1,696 | |
Class R4 | | | | 4,007 | |
Class Z | | | | 3,927 | |
Net asset value per share | | | | | |
Class A(a) | | | $ | 22.12 | |
Class B | | | $ | 22.08 | |
Class C | | | $ | 21.77 | |
Class I | | | $ | 22.22 | |
Class R | | | $ | 22.08 | |
Class R4 | | | $ | 22.17 | |
Class Z | | | $ | 22.20 | |
| (a) | The maximum offering price per share for Class A is $23.47. The offering price is calculated by dividing the net asset value by 1.0 minus the maximum sales charge of 5.75%. |
The accompanying Notes to Financial Statements are an integral part of this statement.
| | | | |
| COLUMBIA GLOBAL EXTENDED ALPHA FUND — 2012 SEMIANNUAL REPORT | | | 17 | |
Six months ended April 30, 2012 (Unaudited)
| | | | | |
Net investment income | |
Income: | | | | | |
Dividends | | | $ | 235,665 | |
Dividends from affiliates | | | | 830 | |
Income from securities lending — net | | | | 3,424 | |
Foreign taxes withheld | | | | (19,049 | ) |
Total income | | | | 220,870 | |
Expenses: | | | | | |
Investment management fees | | | | 86,231 | |
Distribution fees | | | | | |
Class A | | | | 12,607 | |
Class B | | | | 1,213 | |
Class C | | | | 3,423 | |
Class R | | | | 57 | |
Transfer agent fees | | | | | |
Class A | | | | 8,302 | |
Class B | | | | 219 | |
Class C | | | | 555 | |
Class R | | | | 19 | |
Class R4 | | | | 21 | |
Class Z | | | | 46 | |
Administration fees | | | | 6,570 | |
Plan administration fees | | | | | |
Class R4 | | | | 107 | |
Compensation of board members | | | | 5,146 | |
Custodian fees | | | | 5,389 | |
Printing and postage fees | | | | 23,019 | |
Registration fees | | | | 25,969 | |
Professional fees | | | | 25,043 | |
Other | | | | 7,415 | |
Total expenses | | | | 211,351 | |
Fees waived or expenses reimbursed by Investment Manager and its affiliates | | | | (95,444 | ) |
Total net expenses | | | | 115,907 | |
Net investment income | | | | 104,963 | |
The accompanying Notes to Financial Statements are an integral part of this statement.
| | |
| 18 | | COLUMBIA GLOBAL EXTENDED ALPHA FUND — 2012 SEMIANNUAL REPORT |
| | | | | |
Realized and unrealized gain (loss) — net | |
Net realized gain (loss) on: | | | | | |
Investments | | | $ | 90,468 | |
Foreign currency translations | | | | (1,537 | ) |
Forward foreign currency exchange contracts | | | | (3,725 | ) |
Swap contracts | | | | 47,450 | |
Net realized gain | | | | 132,656 | |
Net change in unrealized appreciation (depreciation) on: | | | | | |
Investments | | | | 1,180,611 | |
Foreign currency translations | | | | 532 | |
Swap contracts | | | | (48,773 | ) |
Net change in unrealized appreciation | | | | 1,132,370 | |
Net realized and unrealized gain | | | | 1,265,026 | |
Net increase in net assets resulting from operations | | | $ | 1,369,989 | |
The accompanying Notes to Financial Statements are an integral part of this statement.
| | | | |
| COLUMBIA GLOBAL EXTENDED ALPHA FUND — 2012 SEMIANNUAL REPORT | | | 19 | |
| | |
| Statement of Changes in Net Assets | | |
| | | | | | | | | | |
| | | Six months ended
April 30, 2012 | | Year ended
October 31, 2011 |
| | | (Unaudited) | | |
Operations | |
Net investment income | | | $ | 104,963 | | | | $ | 696 | |
Net realized gain | | | | 132,656 | | | | | 1,245,440 | |
Net change in unrealized appreciation (depreciation) | | | | 1,132,370 | | | | | (786,900 | ) |
Net increase in net assets resulting from operations | | | | 1,369,989 | | | | | 459,236 | |
Distributions to shareholders from: | | | | | | | | | | |
Net investment income | | | | | | | | | | |
Class A | | | | (306,303 | ) | | | | (83,476 | ) |
Class B | | | | (6,134 | ) | | | | (2,742 | ) |
Class C | | | | (16,677 | ) | | | | (3,386 | ) |
Class I | | | | (197,843 | ) | | | | (111,706 | ) |
Class R | | | | (335 | ) | | | | (156 | ) |
Class R4 | | | | (2,801 | ) | | | | (1,693 | ) |
Class Z | | | | (1,895 | ) | | | | (579 | ) |
Net realized gains | | | | | | | | | | |
Class A | | | | (135,201 | ) | | | | — | |
Class B | | | | (3,835 | ) | | | | — | |
Class C | | | | (8,164 | ) | | | | — | |
Class I | | | | (81,653 | ) | | | | — | |
Class R | | | | (166 | ) | | | | — | |
Class R4 | | | | (1,267 | ) | | | | — | |
Class Z | | | | (795 | ) | | | | — | |
Total distributions to shareholders | | | | (763,069 | ) | | | | (203,738 | ) |
Increase in net assets from share transactions | | | | 5,559,032 | | | | | 3,477,201 | |
Total increase in net assets | | | | 6,165,952 | | | | | 3,732,699 | |
Net assets at beginning of period | | | | 13,831,179 | | | | | 10,098,480 | |
Net assets at end of period | | | $ | 19,997,131 | | | | $ | 13,831,179 | |
Undistributed net investment income | | | $ | 85,423 | | | | $ | 512,448 | |
The accompanying Notes to Financial Statements are an integral part of this statement.
| | |
| 20 | | COLUMBIA GLOBAL EXTENDED ALPHA FUND — 2012 SEMIANNUAL REPORT |
| | | | | | | | | | | | | | | | | | | | |
| | | Six months ended
April 30, 2012
(Unaudited) | | Year ended
October 31, 2011 |
| | | Shares | | Dollars ($) | | Shares | | Dollars ($) |
Capital stock activity | | | | | | | | | | | | | | | | | | | | |
Class A shares | | | | | | | | | | | | | | | | | | | | |
Subscriptions(a) | | | | 261,011 | | | | | 5,593,235 | | | | | 212,976 | | | | | 4,679,949 | |
Distributions reinvested | �� | | | 20,335 | | | | | 396,128 | | | | | 2,998 | | | | | 62,518 | |
Redemptions | | | | (50,394 | ) | | | | (1,084,903 | ) | | | | (65,156 | ) | | | | (1,399,539 | ) |
Net increase | | | | 230,952 | | | | | 4,904,460 | | | | | 150,818 | | | | | 3,342,928 | |
Class B shares | | | | | | | | | | | | | | | | | | | | |
Subscriptions | | | | 5,221 | | | | | 108,959 | | | | | 2,397 | | | | | 52,567 | |
Distributions reinvested | | | | 484 | | | | | 9,443 | | | | | 106 | | | | | 2,215 | |
Redemptions(a) | | | | (2,151 | ) | | | | (44,459 | ) | | | | (8,261 | ) | | | | (186,154 | ) |
Net increase (decrease) | | | | 3,554 | | | | | 73,943 | | | | | (5,758 | ) | | | | (131,372 | ) |
Class C shares | | | | | | | | | | | | | | | | | | | | |
Subscriptions | | | | 24,508 | | | | | 522,106 | | | | | 20,741 | | | | | 426,743 | |
Distributions reinvested | | | | 1,247 | | | | | 23,985 | | | | | 127 | | | | | 2,619 | |
Redemptions | | | | (2,596 | ) | | | | (56,517 | ) | | | | (6,795 | ) | | | | (147,157 | ) |
Net increase | | | | 23,159 | | | | | 489,574 | | | | | 14,073 | | | | | 282,205 | |
Class R shares | | | | | | | | | | | | | | | | | | | | |
Subscriptions | | | | 1,316 | | | | | 28,591 | | | | | — | | | | | — | |
Redemptions | | | | (120 | ) | | | | (2,657 | ) | | | | — | | | | | — | |
Net increase | | | | 1,196 | | | | | 25,934 | | | | | — | | | | | — | |
Class R4 shares | | | | | | | | | | | | | | | | | | | | |
Distributions reinvested | | | | 181 | | | | | 3,536 | | | | | 72 | | | | | 1,500 | |
Redemptions | | | | (277 | ) | | | | (5,608 | ) | | | | (300 | ) | | | | (6,920 | ) |
Net decrease | | | | (96 | ) | | | | (2,072 | ) | | | | (228 | ) | | | | (5,420 | ) |
Class Z shares | | | | | | | | | | | | | | | | | | | | |
Subscriptions | | | | 3,281 | | | | | 71,090 | | | | | 710 | | | | | 15,583 | |
Distributions reinvested | | | | 104 | | | | | 2,031 | | | | | 25 | | | | | 522 | |
Redemptions | | | | (292 | ) | | | | (5,928 | ) | | | | (1,249 | ) | | | | (27,245 | ) |
Net increase (decrease) | | | | 3,093 | | | | | 67,193 | | | | | (514 | ) | | | | (11,140 | ) |
Total net increase | | | | 261,858 | | | | | 5,559,032 | | | | | 158,391 | | | | | 3,477,201 | |
| (a) | Includes conversions of Class B shares to Class A shares, if any. The line items from the prior year have been combined to conform to the current year presentation. |
The accompanying Notes to Financial Statements are an integral part of this statement.
| | | | |
| COLUMBIA GLOBAL EXTENDED ALPHA FUND — 2012 SEMIANNUAL REPORT | | | 21 | |
The following tables are intended to help you understand the Fund’s financial performance. Certain information reflects financial results for a single share of a class held for the periods shown. Per share net investment income (loss) amounts are calculated based on average shares outstanding during the period. Total returns assume reinvestment of all dividends and distributions. Total returns do not reflect payment of sales charges, if any, and are not annualized for periods of less than one year.
| | | | | | | | | | | | | | | | | | | | | | | | | |
| | | Six months
ended April 30, 2012 | | Year ended Oct. 31, |
| | | | 2011 | | 2010 | | 2009 | | 2008(a) |
| | | (Unaudited) | | | | | | | | |
Class A | | | | | | | | | | | | | | | | | | | | | | | | | |
Per share data | | | | | | | | | | | | | | | | | | | | | | | | | |
Net asset value, beginning of period | | | | $21.52 | | | | | $20.86 | | | | | $17.65 | | | | | $13.97 | | | | | $20.00 | |
Income from investment operations: | | | | | | | | | | | | | | | | | | | | | | | | | |
Net investment income (loss) | | | | 0.14 | | | | | (0.03 | ) | | | | (0.03 | ) | | | | 0.09 | | | | | 0.00 | (b) |
Net realized and unrealized gain (loss) | | | | 1.54 | | | | | 1.08 | | | | | 3.71 | | | | | 3.59 | | | | | (6.03 | ) |
Total from investment operations | | | | 1.68 | | | | | 1.05 | | | | | 3.68 | | | | | 3.68 | | | | | (6.03 | ) |
Less distributions to shareholders from: | | | | | | | | | | | | | | | | | | | | | | | | | |
Net investment income | | | | (0.75 | ) | | | | (0.39 | ) | | | | (0.47 | ) | | | | — | | | | | — | |
Net realized gains | | | | (0.33 | ) | | | | — | | | | | — | | | | | — | | | | | — | |
Total distributions to shareholders | | | | (1.08 | ) | | | | (0.39 | ) | | | | (0.47 | ) | | | | — | | | | | — | |
Net asset value, end of period | | | | $22.12 | | | | | $21.52 | | | | | $20.86 | | | | | $17.65 | | | | | $13.97 | |
Total return | | | | 8.49% | | | | | 5.12% | | | | | 21.21% | | | | | 26.34% | | | | | (30.15% | ) |
Ratios to average net assets(c) | | | | | | | | | | | | | | | | | | | | | | | | | |
Expenses prior to fees waived or expenses reimbursed | | | | 2.67% | (d) | | | | 3.21% | | | | | 3.73% | | | | | 3.78% | | | | | 5.55% | (d) |
Net expenses after fees waived or expenses reimbursed(e) | | | | 1.48% | (d) | | | | 1.77% | (f) | | | | 1.63% | | | | | 1.55% | | | | | 1.55% | (d) |
Net investment income (loss) | | | | 1.37% | (d) | | | | (0.12% | )(f) | | | | (0.14% | ) | | | | 0.59% | | | | | (0.07% | )(d) |
Supplemental data | | | | | | | | | | | | | | | | | | | | | | | | | |
Net assets, end of period (in thousands) | | | | $13,027 | | | | | $7,704 | | | | | $4,321 | | | | | $2,648 | | | | | $2,208 | |
Portfolio turnover | | | | 55% | | | | | 59% | | | | | 128% | | | | | 133% | | | | | 36% | |
Notes to Financial Highlights
| (a) | For the period from August 1, 2008 (commencement of operations) to October 31, 2008. |
| (b) | Rounds to less than $0.01. |
| (c) | In addition to the fees and expenses which the Fund bears directly, the Fund indirectly bears a pro rata share of the fees and expenses of the acquired funds in which it invests. Such indirect expenses are not included in the reported expense ratios. |
| (e) | The Investment Manager and certain of its affiliates agreed to waive/reimburse certain fees and expenses, if applicable. |
| (f) | The benefits derived from expense reductions had an impact of less than 0.01%. |
The accompanying Notes to Financial Statements are an integral part of this statement.
| | |
| 22 | | COLUMBIA GLOBAL EXTENDED ALPHA FUND — 2012 SEMIANNUAL REPORT |
| | | | | | | | | | | | | | | | | | | | | | | | | |
| | | Six months
ended April 30, 2012 | | Year ended Oct. 31, |
| | | | 2011 | | 2010 | | 2009 | | 2008(a) |
| | | (Unaudited) | | | | | | | | |
Class B | | | | | | | | | | | | | | | | | | | | | | | | | |
Per share data | | | | | | | | | | | | | | | | | | | | | | | | | |
Net asset value, beginning of period | | | | $21.33 | | | | | $20.63 | | | | | $17.47 | | | | | $13.94 | | | | | $20.00 | |
Income from investment operations: | | | | | | | | | | | | | | | | | | | | | | | | | |
Net investment income (loss) | | | | 0.00 | (b) | | | | (0.19 | ) | | | | (0.16 | ) | | | | (0.01 | ) | | | | (0.02 | ) |
Net realized and unrealized gain (loss) | | | | 1.61 | | | | | 1.08 | | | | | 3.66 | | | | | 3.54 | | | | | (6.04 | ) |
Total from investment operations | | | | 1.61 | | | | | 0.89 | | | | | 3.50 | | | | | 3.53 | | | | | (6.06 | ) |
Less distributions to shareholders from: | | | | | | | | | | | | | | | | | | | | | | | | | |
Net investment income | | | | (0.53 | ) | | | | (0.19 | ) | | | | (0.34 | ) | | | | — | | | | | — | |
Net realized gains | | | | (0.33 | ) | | | | — | | | | | — | | | | | — | | | | | — | |
Total distributions to shareholders | | | | (0.86 | ) | | | | (0.19 | ) | | | | (0.34 | ) | | | | — | | | | | — | |
Net asset value, end of period | | | | $22.08 | | | | | $21.33 | | | | | $20.63 | | | | | $17.47 | | | | | $13.94 | |
Total return | | | | 8.09% | | | | | 4.32% | | | | | 20.32% | | | | | 25.32% | | | | | (30.30% | ) |
Ratios to average net assets(c) | | | | | | | | | | | | | | | | | | | | | | | | | |
Expenses prior to fees waived or expenses reimbursed | | | | 3.43% | (d) | | | | 3.91% | | | | | 4.15% | | | | | 4.52% | | | | | 6.33% | (d) |
Net expenses after fees waived or expenses reimbursed(e) | | | | 2.24% | (d) | | | | 2.56% | (f) | | | | 2.36% | | | | | 2.31% | | | | | 2.31% | (d) |
Net investment income (loss) | | | | 0.04% | (d) | | | | (0.86% | )(f) | | | | (0.84% | ) | | | | (0.05% | ) | | | | (0.55% | )(d) |
Supplemental data | | | | | | | | | | | | | | | | | | | | | | | | | |
Net assets, end of period (in thousands) | | | | $276 | | | | | $191 | | | | | $304 | | | | | $258 | | | | | $239 | |
Portfolio turnover | | | | 55% | | | | | 59% | | | | | 128% | | | | | 133% | | | | | 36% | |
Notes to Financial Highlights
| (a) | For the period from August 1, 2008 (commencement of operations) to October 31, 2008. |
| (b) | Rounds to less than $0.01. |
| (c) | In addition to the fees and expenses which the Fund bears directly, the Fund indirectly bears a pro rata share of the fees and expenses of the acquired funds in which it invests. Such indirect expenses are not included in the reported expense ratios. |
| (e) | The Investment Manager and certain of its affiliates agreed to waive/reimburse certain fees and expenses, if applicable. |
| (f) | The benefits derived from expense reductions had an impact of less than 0.01%. |
The accompanying Notes to Financial Statements are an integral part of this statement.
| | | | |
| COLUMBIA GLOBAL EXTENDED ALPHA FUND — 2012 SEMIANNUAL REPORT | | | 23 | |
| | |
| Financial Highlights (continued) | | |
| | | | | | | | | | | | | | | | | | | | | | | | | |
| | | Six months
ended April 30, 2012 | | Year ended Oct. 31, |
| | | | 2011 | | 2010 | | 2009 | | 2008(a) |
| | | (Unaudited) | | | | | | | | |
Class C | | | | | | | | | | | | | | | | | | | | | | | | | |
Per share data | | | | | | | | | | | | | | | | | | | | | | | | | |
Net asset value, beginning of period | | | | $21.20 | | | | | $20.61 | | | | | $17.48 | | | | | $13.94 | | | | | $20.00 | |
Income from investment operations: | | | | | | | | | | | | | | | | | | | | | | | | | |
Net investment income (loss) | | | | 0.12 | | | | | (0.19 | ) | | | | (0.17 | ) | | | | (0.02 | ) | | | | (0.03 | ) |
Net realized and unrealized gain (loss) | | | | 1.46 | | | | | 1.08 | | | | | 3.66 | | | | | 3.56 | | | | | (6.03 | ) |
Total from investment operations | | | | 1.58 | | | | | 0.89 | | | | | 3.49 | | | | | 3.54 | | | | | (6.06 | ) |
Less distributions to shareholders from: | | | | | | | | | | | | | | | | | | | | | | | | | |
Net investment income | | | | (0.68 | ) | | | | (0.30 | ) | | | | (0.36 | ) | | | | — | | | | | — | |
Net realized gains | | | | (0.33 | ) | | | | — | | | | | — | | | | | — | | | | | — | |
Total distributions to shareholders | | | | (1.01 | ) | | | | (0.30 | ) | | | | (0.36 | ) | | | | — | | | | | — | |
Net asset value, end of period | | | | $21.77 | | | | | $21.20 | | | | | $20.61 | | | | | $17.48 | | | | | $13.94 | |
Total return | | | | 8.07% | | | | | 4.34% | | | | | 20.27% | | | | | 25.39% | | | | | (30.30% | ) |
Ratios to average net assets(b) | | | | | | | | | | | | | | | | | | | | | | | | | |
Expenses prior to fees waived or expenses reimbursed | | | | 3.42% | (c) | | | | 4.05% | | | | | 4.42% | | | | | 4.58% | | | | | 6.22% | (c) |
Net expenses after fees waived or expenses reimbursed(d) | | | | 2.23% | (c) | | | | 2.54% | (e) | | | | 2.37% | | | | | 2.30% | | | | | 2.30% | (c) |
Net investment income (loss) | | | | 1.13% | (c) | | | | (0.90% | )(e) | | | | (0.89% | ) | | | | (0.12% | ) | | | | (0.79% | )(c) |
Supplemental data | |
Net assets, end of period (in thousands) | | | | $1,002 | | | | | $485 | | | | | $181 | | | | | $125 | | | | | $94 | |
Portfolio turnover | | | | 55% | | | | | 59% | | | | | 128% | | | | | 133% | | | | | 36% | |
Notes to Financial Highlights
| (a) | For the period from August 1, 2008 (commencement of operations) to October 31, 2008. |
| (b) | In addition to the fees and expenses which the Fund bears directly, the Fund indirectly bears a pro rata share of the fees and expenses of the acquired funds in which it invests. Such indirect expenses are not included in the reported expense ratios. |
| (d) | The Investment Manager and certain of its affiliates agreed to waive/reimburse certain fees and expenses, if applicable. |
| (e) | The benefits derived from expense reductions had an impact of less than 0.01%. |
The accompanying Notes to Financial Statements are an integral part of this statement.
| | |
| 24 | | COLUMBIA GLOBAL EXTENDED ALPHA FUND — 2012 SEMIANNUAL REPORT |
| | | | | | | | | | | | | | | | | | | | | | | | | |
| | | Six months
ended April 30, 2012 | | Year ended Oct. 31, |
| | | | 2011 | | 2010 | | 2009 | | 2008(a) |
| | | (Unaudited) | | | | | | | | |
Class I | | | | | | | | | | | | | | | | | | | | | | | | | |
Per share data | | | | | | | | | | | | | | | | | | | | | | | | | |
Net asset value, beginning of period | | | | $21.64 | | | | | $20.95 | | | | | $17.72 | | | | | $13.98 | | | | | $20.00 | |
Income from investment operations: | | | | | | | | | | | | | | | | | | | | | | | | | |
Net investment income | | | | 0.13 | | | | | 0.05 | | | | | 0.04 | | | | | 0.14 | | | | | 0.03 | |
Net realized and unrealized gain (loss) | | | | 1.58 | | | | | 1.09 | | | | | 3.71 | | | | | 3.60 | | | | | (6.05 | ) |
Total from investment operations | | | | 1.71 | | | | | 1.14 | | | | | 3.75 | | | | | 3.74 | | | | | (6.02 | ) |
Less distributions to shareholders from: | | | | | | | | | | | | | | | | | | | | | | | | | |
Net investment income | | | | (0.80 | ) | | | | (0.45 | ) | | | | (0.52 | ) | | | | — | | | | | — | |
Net realized gains | | | | (0.33 | ) | | | | — | | | | | — | | | | | — | | | | | — | |
Total distributions to shareholders | | | | (1.13 | ) | | | | (0.45 | ) | | | | (0.52 | ) | | | | — | | | | | — | |
Net asset value, end of period | | | | $22.22 | | | | | $21.64 | | | | | $20.95 | | | | | $17.72 | | | | | $13.98 | |
Total return | | | | 8.64% | | | | | 5.53% | | | | | 21.58% | | | | | 26.75% | | | | | (30.10% | ) |
Ratios to average net assets(b) | | | | | | | | | | | | | | | | | | | | | | | | | |
Expenses prior to fees waived or expenses reimbursed | | | | 2.25% | (c) | | | | 2.80% | | | | | 3.23% | | | | | 3.42% | | | | | 4.94% | (c) |
Net expenses after fees waived or expenses reimbursed(d) | | | | 1.13% | (c) | | | | 1.45% | | | | | 1.28% | | | | | 1.22% | | | | | 1.21% | (c) |
Net investment income | | | | 1.18% | (c) | | | | 0.22% | | | | | 0.19% | | | | | 0.94% | | | | | 0.63% | (c) |
Supplemental data | | | | | | | | | | | | | | | | | | | | | | | | | |
Net assets, end of period (in thousands) | | | | $5,478 | | | | | $5,333 | | | | | $5,164 | | | | | $4,367 | | | | | $3,446 | |
Portfolio turnover | | | | 55% | | | | | 59% | | | | | 128% | | | | | 133% | | | | | 36% | |
Notes to Financial Highlights
| (a) | For the period from August 1, 2008 (commencement of operations) to October 31, 2008. |
| (b) | In addition to the fees and expenses which the Fund bears directly, the Fund indirectly bears a pro rata share of the fees and expenses of the acquired funds in which it invests. Such indirect expenses are not included in the reported expense ratios. |
| (d) | The Investment Manager and certain of its affiliates agreed to waive/reimburse certain fees and expenses, if applicable. |
The accompanying Notes to Financial Statements are an integral part of this statement.
| | | | |
| COLUMBIA GLOBAL EXTENDED ALPHA FUND — 2012 SEMIANNUAL REPORT | | | 25 | |
| | |
| Financial Highlights (continued) | | |
| | | | | | | | | | | | | | | | | | | | | | | | | |
| | | Six months
ended April 30, 2012 | | Year ended Oct. 31, |
| | | | 2011 | | 2010 | | 2009 | | 2008(a) |
| | | (Unaudited) | | | | | | | | |
Class R | | | | | | | | | | | | | | | | | | | | | | | | | |
Per share data | | | | | | | | | | | | | | | | | | | | | | | | | |
Net asset value, beginning of period | | | | $21.43 | | | | | $20.74 | | | | | $17.56 | | | | | $13.96 | | | | | $20.00 | |
Income from investment operations: | | | | | | | | | | | | | | | | | | | | | | | | | |
Net investment income (loss) | | | | 0.36 | | | | | (0.09 | ) | | | | (0.11 | ) | | | | 0.03 | | | | | 0.00 | (b) |
Net realized and unrealized gain (loss) | | | | 1.29 | | | | | 1.09 | | | | | 3.69 | | | | | 3.57 | | | | | (6.04 | ) |
Total from investment operations | | | | 1.65 | | | | | 1.00 | | | | | 3.58 | | | | | 3.60 | | | | | (6.04 | ) |
Less distributions to shareholders from: | | | | | | | | | | | | | | | | | | | | | | | | | |
Net investment income | | | | (0.67 | ) | | | | (0.31 | ) | | | | (0.40 | ) | | | | — | | | | | — | |
Net realized gains | | | | (0.33 | ) | | | | — | | | | | — | | | | | — | | | | | — | |
Total distributions to shareholders | | | | (1.00 | ) | | | | (0.31 | ) | | | | (0.40 | ) | | | | — | | | | | — | |
Net asset value, end of period | | | | $22.08 | | | | | $21.43 | | | | | $20.74 | | | | | $17.56 | | | | | $13.96 | |
Total return | | | | 8.34% | | | | | 4.88% | | | | | 20.69% | | | | | 25.79% | | | | | (30.20% | ) |
Ratios to average net assets(c) | | | | | | | | | | | | | | | | | | | | | | | | | |
Expenses prior to fees waived or expenses reimbursed | | | | 2.91% | (d) | | | | 3.44% | | | | | 3.99% | | | | | 4.22% | | | | | 5.74% | (d) |
Net expenses after fees waived or expenses reimbursed(e) | | | | 1.72% | (d) | | | | 2.06% | (f) | | | | 2.04% | | | | | 1.96% | | | | | 1.81% | (d) |
Net investment income (loss) | | | | 3.39% | (d) | | | | (0.40% | )(f) | | | | (0.58% | ) | | | | 0.19% | | | | | 0.03% | (d) |
Supplemental data | | | | | | | | | | | | | | | | | | | | | | | | | |
Net assets, end of period (in thousands) | | | | $37 | | | | | $11 | | | | | $10 | | | | | $9 | | | | | $7 | |
Portfolio turnover | | | | 55% | | | | | 59% | | | | | 128% | | | | | 133% | | | | | 36% | |
Notes to Financial Highlights
| (a) | For the period from August 1, 2008 (commencement of operations) to October 31, 2008. |
| (b) | Rounds to less than $0.01. |
| (c) | In addition to the fees and expenses which the Fund bears directly, the Fund indirectly bears a pro rata share of the fees and expenses of the acquired funds in which it invests. Such indirect expenses are not included in the reported expense ratios. |
| (e) | The Investment Manager and certain of its affiliates agreed to waive/reimburse certain fees and expenses, if applicable. |
| (f) | The benefits derived from expense reductions had an impact of less than 0.01%. |
The accompanying Notes to Financial Statements are an integral part of this statement.
| | |
| 26 | | COLUMBIA GLOBAL EXTENDED ALPHA FUND — 2012 SEMIANNUAL REPORT |
| | | | | | | | | | | | | | | | | | | | | | | | | |
| | | Six months
ended April 30, 2012 | | Year ended Oct. 31, |
| | | | 2011 | | 2010 | | 2009 | | 2008(a) |
| | | (Unaudited) | | | | | | | | |
Class R4 | | | | | | | | | | | | | | | | | | | | | | | | | |
Per share data | | | | | | | | | | | | | | | | | | | | | | | | | |
Net asset value, beginning of period | | | | $21.54 | | | | | $20.86 | | | | | $17.67 | | | | | $13.98 | | | | | $20.00 | |
Income from investment operations: | | | | | | | | | | | | | | | | | | | | | | | | | |
Net investment income (loss) | | | | 0.09 | | | | | (0.02 | ) | | | | (0.01 | ) | | | | 0.08 | | | | | 0.01 | |
Net realized and unrealized gain (loss) | | | | 1.60 | | | | | 1.09 | | | | | 3.70 | | | | | 3.61 | | | | | (6.03 | ) |
Total from investment operations | | | | 1.69 | | | | | 1.07 | | | | | 3.69 | | | | | 3.69 | | | | | (6.02 | ) |
Less distributions to shareholders from: | | | | | | | | | | | | | | | | | | | | | | | | | |
Net investment income | | | | (0.73 | ) | | | | (0.39 | ) | | | | (0.50 | ) | | | | — | | | | | — | |
Net realized gains | | | | (0.33 | ) | | | | — | | | | | — | | | | | — | | | | | — | |
Total distributions to shareholders | | | | (1.06 | ) | | | | (0.39 | ) | | | | (0.50 | ) | | | | — | | | | | — | |
Net asset value, end of period | | | | $22.17 | | | | | $21.54 | | | | | $20.86 | | | | | $17.67 | | | | | $13.98 | |
Total return | | | | 8.53% | | | | | 5.19% | | | | | 21.26% | | | | | 26.40% | | | | | (30.10% | ) |
Ratios to average net assets(b) | | | | | | | | | | | | | | | | | | | | | | | | | |
Expenses prior to fees waived or expenses reimbursed | | | | 2.55% | (c) | | | | 3.10% | | | | | 3.49% | | | | | 3.92% | | | | | 5.38% | (c) |
Net expenses after fees waived or expenses reimbursed(d) | | | | 1.42% | (c) | | | | 1.74% | | | | | 1.57% | | | | | 1.47% | | | | | 1.36% | (c) |
Net investment income (loss) | | | | 0.87% | (c) | | | | (0.08% | ) | | | | (0.06% | ) | | | | 0.52% | | | | | 0.30% | (c) |
Supplemental data | | | | | | | | | | | | | | | | | | | | | | | | | |
Net assets, end of period (in thousands) | | | | $89 | | | | | $88 | | | | | $90 | | | | | $59 | | | | | $23 | |
Portfolio turnover | | | | 55% | | | | | 59% | | | | | 128% | | | | | 133% | | | | | 36% | |
Notes to Financial Highlights
| (a) | For the period from August 1, 2008 (commencement of operations) to October 31, 2008. |
| (b) | In addition to the fees and expenses which the Fund bears directly, the Fund indirectly bears a pro rata share of the fees and expenses of the acquired funds in which it invests. Such indirect expenses are not included in the reported expense ratios. |
| (d) | The Investment Manager and certain of its affiliates agreed to waive/reimburse certain fees and expenses, if applicable. |
The accompanying Notes to Financial Statements are an integral part of this statement.
| | | | |
| COLUMBIA GLOBAL EXTENDED ALPHA FUND — 2012 SEMIANNUAL REPORT | | | 27 | |
| | |
| Financial Highlights (continued) | | |
| | | | | | | | | | | | | | | |
| | | Six months
ended April 30, 2012 | | Year ended Oct. 31, |
| | | | 2011 | | 2010(a) |
| | | (Unaudited) | | | | |
Class Z | | | | | | | | | | | | | | | |
Per share data | | | | | | | | | | | | | | | |
Net asset value, beginning of period | | | | $21.61 | | | | | $20.95 | | | | | $19.93 | |
Income from investment operations: | | | | | | | | | | | | | | | |
Net investment income (loss) | | | | 0.19 | | | | | 0.05 | | | | | (0.01 | ) |
Net realized and unrealized gain | | | | 1.52 | | | | | 1.06 | | | | | 1.03 | |
Total from investment operations | | | | 1.71 | | | | | 1.11 | | | | | 1.02 | |
Less distributions to shareholders from: | | | | | | | | | | | | | | | |
Net investment income | | | | (0.79 | ) | | | | (0.45 | ) | | | | — | |
Net realized gains | | | | (0.33 | ) | | | | — | | | | | — | |
Total distributions to shareholders | | | | (1.12 | ) | | | | (0.45 | ) | | | | — | |
Net asset value, end of period | | | | $22.20 | | | | | $21.61 | | | | | $20.95 | |
Total return | | | | 8.63% | | | | | 5.37% | | | | | 5.12% | |
Ratios to average net assets(b) | | | | | | | | | | | | | | | |
Expenses prior to fees waived or expenses
reimbursed | | | | 2.43% | (c) | | | | 2.96% | | | | | 55.17% | (c) |
Net expenses after fees waived or expenses
reimbursed(d) | | | | 1.23% | (c) | | | | 1.59% | (e) | | | | 1.52% | (c) |
Net investment income (loss) | | | | 1.81% | (c) | | | | 0.21% | (e) | | | | (0.48% | )(c) |
Supplemental data | | | | | | | | | | | | | | | |
Net assets, end of period (in thousands) | | | | $87 | | | | | $18 | | | | | $28 | |
Portfolio turnover | | | | 55% | | | | | 59% | | | | | 128% | |
Notes to Financial Highlights
| (a) | For the period from September 27, 2010 (commencement of operations) to October 31, 2010. |
| (b) | In addition to the fees and expenses which the Fund bears directly, the Fund indirectly bears a pro rata share of the fees and expenses of the acquired funds in which it invests. Such indirect expenses are not included in the reported expense ratios. |
| (d) | The Investment Manager and certain of its affiliates agreed to waive/reimburse certain fees and expenses, if applicable. |
| (e) | The benefits derived from expense reductions had an impact of less than 0.01%. |
The accompanying Notes to Financial Statements are an integral part of this statement.
| | |
| 28 | | COLUMBIA GLOBAL EXTENDED ALPHA FUND — 2012 SEMIANNUAL REPORT |
| | |
| Notes to Financial Statements | | |
April 30, 2012 (Unaudited)
Columbia Global Extended Alpha Fund (the Fund), a series of Columbia Funds Series Trust II (the Trust), is a diversified fund. The Trust is registered under the Investment Company Act of 1940, as amended (the 1940 Act), as an open-end management investment company organized as a Massachusetts business trust.
Fund Shares
The Trust may issue an unlimited number of shares (without par value). The Fund offers Class A, Class B, Class C, Class I, Class R, Class R4 and Class Z shares. All share classes have identical voting, dividend and liquidation rights. Each share class has its own expense structure and sales charges, as applicable.
Class A shares are subject to a maximum front-end sales charge of 5.75% based on the initial investment amount. Class A shares purchased without an initial sales charge in accounts aggregating $1 million to $50 million at the time of purchase are subject to a contingent deferred sales charge (CDSC) if the shares are sold within 18 months of purchase, charged as follows: 1.00% CDSC if redeemed within 12 months of purchase, and 0.50% CDSC if redeemed more than 12, but less than 18, months after purchase.
Class B shares may be subject to a maximum CDSC of 5.00% based upon the holding period after purchase. Class B shares will generally convert to Class A shares eight years after purchase. The Fund no longer accepts investments by new or existing investors in the Fund’s Class B shares, except in connection with the reinvestment of any dividend and/or capital gain distributions in Class B shares of the Fund and exchanges by existing Class B shareholders of certain other funds within the Columbia Family of Funds.
Class C shares are subject to a 1.00% CDSC on shares redeemed within one year of purchase.
Class I shares are not subject to sales charges and are only available to the Columbia Family of Funds.
Class R shares are not subject to sales charges and are only available to qualifying institutional investors.
Class R4 shares are not subject to sales charges; however, this share class is closed to new investors.
Class Z shares are not subject to sales charges, and are only available to certain investors, as described in the Fund’s prospectus.
| | | | |
| COLUMBIA GLOBAL EXTENDED ALPHA FUND — 2012 SEMIANNUAL REPORT | | | 29 | |
| | |
| Notes to Financial Statements (continued) | | |
| Note | 2. Summary of Significant Accounting Policies |
Use of Estimates
The preparation of financial statements in accordance with U.S. generally accepted accounting principles (GAAP) requires management to make certain estimates and assumptions that affect the reported amounts of assets and liabilities, the disclosure of contingent assets and liabilities at the date of the financial statements and the reported amounts of revenue and expenses during the reporting period. Actual results could differ from those estimates.
The following is a summary of significant accounting policies consistently followed by the Fund in the preparation of its financial statements.
Security Valuation
All equity securities are valued at the close of business of the New York Stock Exchange (NYSE). Equity securities are valued at the last quoted sales price on the principal exchange or market on which they trade, except for securities traded on the NASDAQ Stock Market, which are valued at the NASDAQ official close price. Unlisted securities or listed securities for which there were no sales during the day are valued at the mean of the latest quoted bid and asked prices on such exchanges or markets.
Debt securities generally are valued by pricing services approved by the Board of Trustees (the Board) based upon market transactions for normal, institutional-size trading units of similar securities. The services may use various pricing techniques which take into account appropriate factors such as yield, quality, coupon rate, maturity, type of issue, trading characteristics and other data, as well as broker quotes. Debt securities for which quotations are readily available may also be valued based upon an over-the-counter or exchange bid quotation.
Foreign securities are valued based on quotations from the principal market in which such securities are normally traded. If any foreign share prices are not readily available as a result of limited share activity the securities are valued at the mean of the latest quoted bid and asked prices on such exchanges or markets. Foreign currency exchange rates are generally determined at 4:00 p.m. Eastern (U.S.) time. However, many securities markets and exchanges outside the U.S. close prior to the close of the NYSE; therefore, the closing prices for securities in such markets or on such exchanges may not fully reflect events that occur after such close but before the close of the NYSE. In those situations, foreign securities will be fair valued pursuant to the policy adopted by the Board, including utilizing a third party pricing service to determine these fair values. The third party pricing service takes into account multiple factors, including, but not limited to, movements in the U.S. securities markets, certain depositary
receipts, futures contracts and foreign exchange rates that have occurred
| | |
| 30 | | COLUMBIA GLOBAL EXTENDED ALPHA FUND — 2012 SEMIANNUAL REPORT |
subsequent to the close of the foreign exchange, to determine a good faith estimate that reasonably reflects the current market conditions as of the close of the NYSE. The fair value of a security is likely to be different from the quoted or published price, if available.
Investments in other open-end investment companies, including money market funds, are valued at net asset value.
Short-term securities purchased within 60 days to maturity are valued at amortized cost, which approximates market value. The value of short-term securities originally purchased with maturities greater than 60 days is determined based on an amortized value to par upon reaching 60 days to maturity. Short-term securities maturing in more than 60 days from the valuation date are valued at the market price or approximate market value based on current interest rates.
Forward foreign currency exchange contracts are marked-to-market based upon foreign currency exchange rates provided by a pricing service.
Swap transactions are valued through an independent pricing service or broker, or if neither is available, through an internal model based upon observable inputs.
Investments for which market quotations are not readily available, or that have quotations which management believes are not reliable, are valued at fair value as determined in good faith under consistently applied procedures established by and under the general supervision of the Board. If a security or class of securities (such as foreign securities) is valued at fair value, such value is likely to be different from the last quoted market price for the security. The determination of fair value often requires significant judgment. To determine fair value, management may use assumptions including but not limited to future cash flows and estimated risk premiums. Multiple inputs from various sources may be used to determine value.
Foreign Currency Transactions and Translation
The values of all assets and liabilities denominated in foreign currencies are translated into U.S. dollars at that day’s exchange rates. Net realized and unrealized gains (losses) on foreign currency transactions and translations include gains (losses) arising from the fluctuation in exchange rates between trade and settlement dates on securities transactions, gains (losses) arising from the disposition of foreign currency and currency gains (losses) between the accrual and payment dates on dividends, interest income and foreign withholding taxes.
For financial statement purposes, the Fund does not distinguish that portion of gains (losses) on investments which is due to changes in foreign exchange rates from that which is due to changes in market prices of the investments. Such fluctuations are included with the net realized and unrealized gains (losses) on investments in the Statement of Operations.
| | | | |
| COLUMBIA GLOBAL EXTENDED ALPHA FUND — 2012 SEMIANNUAL REPORT | | | 31 | |
| | |
| Notes to Financial Statements (continued) | | |
Derivative Instruments
The Fund invests in certain derivative instruments as detailed below to meet its investment objectives. Derivatives are instruments whose values depend on, or are derived from, in whole or in part, the value of one or more other assets, such as securities, currencies, commodities or indices. Derivative instruments may be used to maintain cash reserves while maintaining exposure to certain other assets, to offset anticipated declines in values of investments, to facilitate trading, to reduce transaction costs and to pursue higher investment returns. The Fund may also use derivative instruments to mitigate certain investment risks, such as foreign currency exchange rate risk, interest rate risk and credit risk. Derivatives may involve various risks, including the potential inability of the counterparty to fulfill its obligation under the terms of the contract, the potential for an illiquid secondary market and the potential for market movements which may expose the Fund to gains or losses in excess of the amount shown in the Statement of Assets and Liabilities.
The Fund and any counterparty are required to maintain an agreement that requires the Fund and that counterparty to monitor (on a daily basis) the net fair value of all derivatives entered into pursuant to the agreement between the Fund and such counterparty. If the net fair value of such derivatives between the Fund and that counterparty exceeds a certain threshold (as defined in the agreement), the Fund or the counterparty (as the case may be) is required to post cash and/or securities as collateral. Fair values of derivatives presented in the financial statements are not netted with the fair value of other derivatives or with any collateral amounts posted by the Fund or any counterparty.
Forward Foreign Currency Exchange Contracts
Forward foreign currency exchange contracts are agreements between two parties to buy and sell a currency at a set price on a future date. These contracts are intended to be used to minimize the exposure to foreign exchange rate fluctuations during the period between the trade and settlement dates of the contract. The Fund utilized forward foreign currency exchange contracts to hedge the currency exposure associated with some or all of the Fund’s securities.
The values of forward foreign currency exchange contracts fluctuate with changes in foreign currency exchange rates. The Fund will record a realized gain or loss when the forward foreign currency exchange contract is closed.
The use of forward foreign currency exchange contracts does not eliminate fluctuations in the prices of the Fund’s portfolio securities. The risks of forward foreign currency exchange contracts include movement in the values of the foreign currencies relative to the U.S. dollar (or other foreign currencies) and the possibility that counterparties will not complete their contractual obligations,
| | |
| 32 | | COLUMBIA GLOBAL EXTENDED ALPHA FUND — 2012 SEMIANNUAL REPORT |
which may be in excess of the amount reflected, if any, in the Statement of Assets and Liabilities.
Portfolio Swaps
The Fund entered into a portfolio swap transaction. A portfolio swap allows the Fund to obtain exposure to a custom basket of securities and foreign markets (both long and short exposures) without owning or taking physical custody of such securities. Under the terms of the contract, payments made by the Fund or the counterparty are based on the total return of the reference assets within the basket in return for a specified interest rate. The contract allows the Investment Manager of the Fund to alter the composition of the custom basket by trading in and out of the notional reference security positions at its discretion.
The notional amounts of the swap transactions are not recorded in the financial statements. The portfolio swap is valued daily, and the change in value is recorded as unrealized appreciation (depreciation). The swap resets monthly at which time the Fund settles in cash with the counterparty. Payments received (or made) by the Fund are recorded as realized gains (losses). See the Portfolio Swap Outstanding table following the Portfolio of Investments for additional information.
Portfolio swap transactions may be subject to liquidity risk, which exists when a particular swap is difficult to purchase or sell. It may not be possible for the Fund to initiate a transaction or liquidate a position at an advantageous time or price, which may result in significant losses. Portfolio swaps are subject to the risk associated with the investment in the reference securities within the basket. The risk in the case of short portfolio swap transactions is unlimited based on the potential for unlimited increases in the market value of the reference securities in the basket. This risk may be offset if the Fund holds any of the reference securities. The risk in the case of long portfolio swap transactions is limited to the current notional amount of the portfolio swap.
Portfolio swap transactions are also subject to the risk of the counterparty not fulfilling its obligations under the contract (counterparty credit risk). The Fund attempts to mitigate counterparty credit risk by entering into portfolio swap transactions only with counterparties that meet prescribed levels of creditworthiness, as determined by the Investment Manager. The Fund and any counterparty are required to maintain an agreement that requires the Fund and that counterparty to monitor (on a daily basis) the net market value of all derivative transactions entered into pursuant to the contract between the Fund and such counterparty. If the net market value of such derivatives transactions between the Fund and that counterparty exceeds a certain threshold (as defined in the agreement), the Fund or the counterparty is required to post cash and/or securities as collateral. Market values of derivatives transactions presented in the financial statements are not netted with the
| | | | |
| COLUMBIA GLOBAL EXTENDED ALPHA FUND — 2012 SEMIANNUAL REPORT | | | 33 | |
| | |
| Notes to Financial Statements (continued) | | |
market values of other derivatives transactions or with any collateral amounts posted by the Fund or any counterparty.
At April 30, 2012, no collateral had been posted by either the Fund or the counterparty.
Effects of Derivative Transactions in the Financial Statements
The following tables are intended to provide additional information about the effect of derivatives on the financial statements of the Fund, including: the fair value of derivatives by risk category and the location of those fair values in the Statement of Assets and Liabilities; the impact of derivative transactions on the Fund’s operations over the period including realized gains or losses and unrealized gains or losses. The derivative schedules following the Portfolio of Investments present additional information regarding derivative instruments outstanding at the end of the period, if any.
Fair Values of Derivative Instruments at April 30, 2012
| | | | | | |
Risk Exposure
Category | | Liability derivatives | |
| | Statement of Assets and Liabilities
Location | | Fair Value | |
Equity contracts | | Unrealized depreciation on swap contracts | | $ | 77,846 | |
Effect of Derivative Instruments in the Statement of Operations
for the Six Months Ended April 30, 2012
| | | | | | | | | | | | |
| Amount of Realized Gain (Loss) on Derivatives Recognized in Income | |
| Risk Exposure Category | | Forward Foreign
Currency Exchange
Contracts | | | Swap Contracts | | | Total | |
Foreign exchange contracts | | $ | (3,725 | ) | | $ | — | | | $ | (3,725 | ) |
Equity contracts | | | — | | | | 47,450 | | | $ | 47,450 | |
Total | | $ | (3,725 | ) | | $ | 47,450 | | | $ | 43,725 | |
|
| Change in Unrealized Appreciation (Depreciation) on Derivatives Recognized in Income | |
Risk Exposure Category | | | | | | Swap Contracts | |
Equity contracts | | | | | | | $ | (48,773 | ) |
Volume of Derivative Instruments for the Six Months Ended April 30, 2012
| | | | |
| | | Contracts
Opened | |
Forward Foreign Currency Exchange Contracts | | | 2 | |
Swap Contracts | | | — | |
| | |
| 34 | | COLUMBIA GLOBAL EXTENDED ALPHA FUND — 2012 SEMIANNUAL REPORT |
Repurchase Agreements
The Fund may engage in repurchase agreement transactions with institutions that management has determined are creditworthy. The Fund, through the custodian, receives delivery of the underlying securities collateralizing a repurchase agreement. Management is responsible for determining that the collateral is at least equal, at all times, to the value of the repurchase obligation including interest. A repurchase agreement transaction involves certain risks in the event of default or insolvency of the counterparty. These risks include possible delays in or restrictions on a Fund’s ability to dispose of the underlying securities and a possible decline in the value of the underlying securities during the period while the Fund seeks to assert its rights.
Short Sales
The Fund may sell a security it does not own in anticipation of a decline in the fair value of the security. When the Fund sells a security short, it must borrow the security sold short and deliver it to the broker-dealer through which it made the short sale. The Fund is required to maintain a margin account with the broker and to pledge assets to the broker as collateral for the borrowed security. The Fund can purchase the same security at the current market price and deliver it to the broker to close out the short sale. The Fund is obligated to pay the broker a fee for borrowing the security. The fee is recorded as interest expense in the Statement of Operations and a short position is reported as a liability at fair value in the Statement of Asset and Liabilities. The Fund must also pay the broker for any dividends accrued (recognized on ex-date) on the borrowed security. This amount is recorded as an expense in the Statement of Operations. The Fund will record a gain if the security declines in value, and will realize a loss if the value of the security appreciates. Such gain, limited to the price at which the Fund sold the security short, or such loss, potentially unlimited in size because the short position loses value as the market price of the security sold short increases, will be recognized upon the termination of a short sale. The Fund’s potential losses could exceed those of other mutual funds which hold only long security positions if the value of the securities held long decreases and the value of the securities sold short increases. As the Fund intends to use the cash proceeds from the short sales to invest in additional long securities, the Fund’s use of short sales in effect “leverages” the Fund. Leveraging potentially exposes the Fund to greater risks due to unanticipated market movements, which may magnify losses and increase volatility of returns. There is no assurance that a leveraging strategy will be successful. There is also the risk that the broker may fail to honor its contract terms, causing a loss to the Fund. During the six-months ended April 30, 2012, the Fund did not enter into any short sales.
| | | | |
| COLUMBIA GLOBAL EXTENDED ALPHA FUND — 2012 SEMIANNUAL REPORT | | | 35 | |
| | |
| Notes to Financial Statements (continued) | | |
Security Transactions
Security transactions are accounted for on the trade date. Cost is determined and gains (losses) are based upon the specific identification method for both financial statement and federal income tax purposes.
Income Recognition
Corporate actions and dividend income are recorded net of any non-reclaimable tax withholdings, on the ex-dividend date or upon receipt of ex-dividend notification in the case of certain foreign securities.
Interest income is recorded on the accrual basis.
Awards from class action litigation are recorded as a reduction of cost basis if the Fund still owns the applicable securities on the payment date. If the Fund no longer owns the applicable securities, the proceeds are recorded as realized gains.
Expenses
General expenses of the Trust are allocated to the Fund and other funds of the Trust based upon relative net assets or other expense allocation methodologies determined by the nature of the expense. Expenses directly attributable to the Fund are charged to the Fund. Expenses directly attributable to a specific class of shares are charged to that share class.
Determination of Class Net Asset Value
All income, expenses (other than class-specific expenses, which are charged to that share class, as shown in the Statement of Operations) and realized and unrealized gains (losses) are allocated to each class of the Fund on a daily basis, based on the relative net assets of each class, for purposes of determining the net asset value of each class.
Federal Income Tax Status
The Fund intends to qualify each year as a regulated investment company under Subchapter M of the Internal Revenue Code, as amended, and will distribute substantially all of its taxable income (including net short-term capital gains), if any, for its tax year, and as such will not be subject to federal income taxes. In addition, the Fund intends to distribute in each calendar year substantially all of its net investment income, capital gains and certain other amounts, if any, such that the Fund should not be subject to federal excise tax. Therefore, no federal income or excise tax provision is recorded.
Foreign Taxes
The Fund may be subject to foreign taxes on income, gains on investments or currency repatriation, a portion of which may be recoverable. The Fund will accrue such taxes and recoveries, as applicable, based upon its current interpretation of tax rules and regulations that exist in the markets in which it invests.
| | |
| 36 | | COLUMBIA GLOBAL EXTENDED ALPHA FUND — 2012 SEMIANNUAL REPORT |
Realized gains in certain countries may be subject to foreign taxes at the Fund level, based on statutory rates. The Fund accrues for such foreign taxes on net realized and unrealized gains at the appropriate rate for each jurisdiction, as applicable.
Distributions to Shareholders
Distributions from net investment income are declared and paid annually. Net realized capital gains, if any, are distributed along with the income dividend.
Income distributions and capital gain distributions are determined in accordance with federal income tax regulations which may differ from GAAP.
Guarantees and Indemnifications
Under the Trust’s organizational documents and, in some cases, by contract, its officers and trustees are indemnified against certain liabilities arising out of the performance of their duties to the Trust or its funds. In addition, certain of the Fund’s contracts with its service providers contain general indemnification clauses. The Fund’s maximum exposure under these arrangements is unknown since the amount of any future claims that may be made against the Fund cannot be determined, and the Fund has no historical basis for predicting the likelihood of any such claims.
Recent Accounting Pronouncement
Fair Value Measurements and Disclosures
In May 2011, the Financial Accounting Standards Board (FASB) issued ASU No. 2011-04 modifying Topic 820, Fair Value Measurements and Disclosures. At the same time, the International Accounting Standards Board (IASB) issued International Financial Reporting Standard 13, Fair Value Measurement. The objective of the FASB and IASB is convergence of their guidance on fair value measurements and disclosures.
Specifically, ASU No. 2011-04 requires reporting entities to disclose i) the amounts of any transfers between Level 1 and Level 2, and the reasons for the transfers, ii) for Level 3 fair value measurements, a) quantitative information about significant unobservable inputs used, b) a description of the valuation processes used by the reporting entity and c) a narrative description of the sensitivity of the fair value measurement to changes in unobservable inputs if a change in those inputs might result in a significantly higher or lower fair value measurement. The effective date of ASU No. 2011-04 is for interim and annual periods beginning after December 15, 2011. At this time, management is evaluating the implications of this guidance and the impact it will have on the financial statement amounts and footnote disclosures, if any.
| | | | |
| COLUMBIA GLOBAL EXTENDED ALPHA FUND — 2012 SEMIANNUAL REPORT | | | 37 | |
| | |
| Notes to Financial Statements (continued) | | |
| Note 3. Fees | and Compensation Paid to Affiliates |
Investment Management Fees
Under an Investment Management Services Agreement, Columbia Management Investment Advisers, LLC (the Investment Manager), a wholly-owned subsidiary of Ameriprise Financial, Inc. (Ameriprise Financial), is responsible for the ultimate oversight of investments made by the Fund. The Fund’s subadviser (see Subadvisory Agreement below) has the primary responsibility for the day-to-day portfolio management of the Fund. The management fee is an annual fee that is equal to a percentage of the Fund’s average daily net assets that declines from 1.050% to 0.990% as the Fund’s net assets increase. The annualized effective management fee rate for the six months ended April 30, 2012 was 1.05% of the Fund’s average daily net assets.
Subadvisory Agreement
The Investment Manager has entered into a Subadvisory Agreement with Threadneedle International Limited (Threadneedle), an affiliate of the Investment Manager and wholly-owned subsidiary of Ameriprise Financial, the subadviser of the Fund. The Investment Manager compensates Threadneedle to manage the investments of the Fund’s assets.
Administration Fees
Under an Administrative Services Agreement, the Investment Manager serves as the Fund Administrator. The Fund pays the Fund Administrator an annual fee for administration and accounting services equal to a percentage of the Fund’s average daily net assets that declines from 0.08% to 0.05% as the Fund’s net assets increase. The annualized effective administration fee rate for the six months ended April 30, 2012 was 0.08% of the Fund’s average daily net assets.
Other Expenses
Other expenses are for, among other things, certain expenses of the Fund or the Board, including: Fund boardroom and office expense, employee compensation, employee health and retirement benefits, and certain other expenses. Payment of these Fund and Board expenses is facilitated by a company providing limited administrative services to the Fund and the Board. For the six months ended April 30, 2012, other expenses paid to this company were $803.
Compensation of Board Members
Board members are compensated for their services to the Fund as disclosed in the Statement of Operations. Under a Deferred Compensation Plan (the Plan), the Board members who are not “interested persons” of the Fund, as defined under the 1940 Act, may elect to defer payment of up to 100% of their compensation. Deferred amounts are treated as though equivalent dollar amounts had been invested in shares of certain funds managed by the Investment Manager. The
| | |
| 38 | | COLUMBIA GLOBAL EXTENDED ALPHA FUND — 2012 SEMIANNUAL REPORT |
Fund’s liability for these amounts is adjusted for market value changes and remains in the Fund until distributed in accordance with the Plan.
Transfer Agent Fees
Under a Transfer and Dividend Disbursing Agent Agreement, Columbia Management Investment Services Corp. (the Transfer Agent), an affiliate of the Investment Manager and a wholly-owned subsidiary of Ameriprise Financial, is responsible for providing transfer agency services to the Fund. The Transfer Agent has contracted with Boston Financial Data Services (BFDS) to serve as sub-transfer agent.
The Transfer Agent receives monthly account-based service fees based on the number of open accounts and is reimbursed by the Fund for the fees and expenses the Transfer Agent pays to financial intermediaries that maintain omnibus accounts with the Fund that is a percentage of the average aggregate value of the Fund’s shares maintained in each such omnibus account (other than omnibus accounts for which American Enterprise Investment Services Inc. is the broker of record or accounts where the beneficial shareholder is a customer of Ameriprise Financial Services, Inc., which are paid a per account fee). The Transfer Agent pays the fees of BFDS for services as sub-transfer agent and is not entitled to reimbursement for such fees from the Fund (with the exception of out-of-pocket fees).
The Transfer Agent also receives compensation from fees for various shareholder services and reimbursements for certain out-of-pocket expenses. Class I shares do not pay transfer agent fees. Total transfer agent fees for Class R4 shares are subject to an annual limitation of not more than 0.05% of the average daily net assets attributable to the share class.
For the six months ended April 30, 2012, the Fund’s annualized effective transfer agent fee rates as a percentage of average daily net assets of each class were as follows:
| | | | |
Class A | | | 0.16 | % |
Class B | | | 0.18 | |
Class C | | | 0.16 | |
Class R | | | 0.17 | |
Class R4 | | | 0.05 | |
Class Z | | | 0.16 | |
An annual minimum account balance fee of $20 may apply to certain accounts with a value below the Fund’s initial minimum investment requirements to reduce the impact of small accounts on transfer agent fees. These minimum account balance fees are recorded as part of expense reductions in the Statement
| | | | |
| COLUMBIA GLOBAL EXTENDED ALPHA FUND — 2012 SEMIANNUAL REPORT | | | 39 | |
| | |
| Notes to Financial Statements (continued) | | |
of Operations. For the six months ended April 30, 2012, no minimum account balance fees were charged by the Fund.
Plan Administration Fees
Under a Plan Administration Services Agreement with the Transfer Agent, the Fund pays an annual fee at a rate of 0.25% of the Fund’s average daily net assets attributable to Class R4 shares for the provision of various administrative, recordkeeping, communication and educational services.
Distribution Fees
The Fund has an agreement with Columbia Management Investment Distributors, Inc. (the Distributor), an affiliate of the Investment Manager and a wholly-owned subsidiary of Ameriprise Financial, for distribution and shareholder services. Under a Plan and Agreement of Distribution pursuant to Rule 12b-1, the Fund pays a fee at an annual rate of up to 0.25% of the Fund’s average daily net assets attributable to Class A shares, a fee at an annual rate of up to 0.50% of the Fund’s average daily net assets attributable to Class R shares (of which up to 0.25% may be used for shareholder services) and a fee at an annual rate of up to 1.00% of the Fund’s average daily net assets attributable to Class B and Class C shares. For Class B and Class C shares, of the 1.00% fee, up to 0.75% is reimbursed for distribution expenses.
The amount of distribution expenses incurred by the Distributor and not yet reimbursed (unreimbursed expense) was approximately $26,000 and $12,000 for Class B and Class C shares, respectively. These amounts are based on the most recent information available as of March 31, 2012, and may be recovered from future payments under the distribution plan or CDSCs. To the extent the unreimbursed expense has been fully recovered, the distribution fee is reduced.
Sales Charges
Sales charges, including front-end charges and CDSCs, received by the Distributor for distributing Fund shares were $13,288 for Class A shares for the six months ended April 30, 2012.
Expenses Waived/Reimbursed by the Investment Manager and its Affiliates
Effective January 1, 2012, the Investment Manager and certain of its affiliates have contractually agreed to waive fees and/or reimburse expenses (excluding certain fees and expenses described below), through February 28, 2013, unless sooner terminated at the sole discretion of the Board, so that the Fund’s net operating expenses, after giving effect to fees waived/expenses reimbursed and any balance
| | |
| 40 | | COLUMBIA GLOBAL EXTENDED ALPHA FUND — 2012 SEMIANNUAL REPORT |
credits and/or overdraft charges from the Fund’s custodian, do not exceed the following annual rates as a percentage of the class’ average daily net assets:
| | | | |
Class A | | | 1.46 | % |
Class B | | | 2.21 | |
Class C | | | 2.21 | |
Class I | | | 1.11 | |
Class R | | | 1.71 | |
Class R4 | | | 1.41 | |
Class Z | | | 1.21 | |
Prior to January 1, 2012, the Investment Manager and its affiliates contractually agreed to waive fees and/or reimburse expenses (excluding certain fees and expenses described below), so that the Fund’s net operating expenses, after giving effect to fees waived/expenses reimbursed and any balance credits and/or overdraft charges from the Fund’s custodian, did not exceed the following annual rates as a percentage of the class’ average daily net assets:
| | | | |
Class A | | | 1.55 | % |
Class B | | | 2.30 | |
Class C | | | 2.30 | |
Class I | | | 1.18 | |
Class R | | | 1.80 | |
Class R4 | | | 1.48 | |
Class Z | | | 1.30 | |
Under the agreement, the following fees and expenses are excluded from the waiver/reimbursement commitment, and therefore will be paid by the Fund, if applicable: taxes (including foreign transaction taxes), expenses associated with investments in affiliated and non-affiliated pooled investment vehicles (including mutual funds and exchange traded funds), transaction costs and brokerage commissions, costs related to any securities lending program, dividend expenses associated with securities sold short, inverse floater program fees and expenses, transaction charges and interest on borrowed money, interest, extraordinary expenses and any other expenses the exclusion of which is specifically approved by the Board. This agreement may be modified or amended only with approval from all parties.
| Note 4. Federal | Tax Information |
The timing and character of income and capital gain distributions are determined in accordance with income tax regulations, which may differ from GAAP because of temporary or permanent book to tax differences.
| | | | |
| COLUMBIA GLOBAL EXTENDED ALPHA FUND — 2012 SEMIANNUAL REPORT | | | 41 | |
| | |
| Notes to Financial Statements (continued) | | |
At April 30, 2012, the cost of investments for federal income tax purposes was approximately $19,273,000 and the aggregate gross approximate unrealized appreciation and depreciation based on that cost was:
| | | | |
Unrealized appreciation | | $ | 2,056,000 | |
Unrealized depreciation | | $ | (304,000 | ) |
Net unrealized appreciation | | $ | 1,752,000 | |
Management of the Fund has concluded that there are no significant uncertain tax positions that would require recognition in the financial statements. However, management’s conclusion may be subject to review and adjustment at a later date based on factors including, but not limited to, new tax laws, regulations, and administrative interpretations (including relevant court decisions). Generally, the Fund’s federal tax returns for the prior three fiscal years remain subject to examination by the Internal Revenue Service.
| Note 5. Portfolio | Information |
The cost of purchases and proceeds from sales of securities, excluding short-term obligations, aggregated to $13,232,666 and $8,603,489, respectively, for the six months ended April 30, 2012.
| Note 6. Lending | of Portfolio Securities |
The Fund has entered into a Master Securities Lending Agreement (the Agreement) with JPMorgan Chase Bank, N.A. (JPMorgan). The Agreement authorizes JPMorgan as lending agent to lend securities to authorized borrowers in order to generate additional income on behalf of the Fund. Pursuant to the Agreement, the securities loaned are secured by cash or U.S. government securities equal to at least 100% of the market value of the loaned securities. Any additional collateral required to maintain those levels due to market fluctuations of the loaned securities is requested to be delivered the following business day. Cash collateral received is invested by the lending agent on behalf of the Fund into authorized investments pursuant to the Agreement. The investments made with the cash collateral are listed in the Portfolio of Investments. The values of such investments and any uninvested cash collateral are disclosed in the Statement of Assets and Liabilities along with the related obligation to return the collateral upon the return of the securities loaned.
Risks of delay in recovery of securities or even loss of rights in the securities may occur should the borrower of the securities fail financially. Risks may also arise to the extent that the value of the securities loaned increases above the value of the collateral received. JPMorgan will indemnify the Fund from losses resulting from a borrower’s failure to return a loaned security when due. Such
| | |
| 42 | | COLUMBIA GLOBAL EXTENDED ALPHA FUND — 2012 SEMIANNUAL REPORT |
indemnification does not extend to losses associated with declines in the value of cash collateral investments. The Investment Manager is not responsible for any losses incurred by the Fund in connection with the securities lending program. Loans are subject to termination by the Fund or the borrower at any time, and are, therefore, not considered to be illiquid investments.
Pursuant to the Agreement, the Fund receives income for lending its securities either in the form of fees or by earning interest on invested cash collateral, net of negotiated rebates paid to borrowers and fees paid to the lending agent for services provided and any other securities lending expenses. Net income earned from securities lending for the six months ended April 30, 2012 is disclosed in the Statement of Operations. The Fund continues to earn and accrue interest and dividends on the securities loaned.
At April 30, 2012, securities valued at $1,198,712 were on loan, secured by cash collateral of $1,266,997 (which does not reflect calls for collateral made to borrowers by JPMorgan at period end) that is partially or fully invested in short-term securities or other cash equivalents.
| Note 7. Affiliated | Money Market Fund |
The Fund may invest its daily cash balances in Columbia Short-Term Cash Fund, an affiliated money market fund established for the exclusive use by the Fund and other affiliated funds. The income earned by the Fund from such investments is included as “Dividends from affiliates” in the Statement of Operations. As an investing fund, the Fund indirectly bears its proportionate share of the expenses of Columbia Short-Term Cash Fund.
| Note 8. Shareholder | Concentration |
At April 30, 2012, one unaffiliated shareholder account owned 36.7% of the outstanding shares of the Fund. The Fund has no knowledge about whether any portion of those shares was owned beneficially by such account. Affiliated shareholder accounts owned 27.3% of the outstanding shares of the Fund. Subscription and redemption activity by concentrated accounts may have a significant effect on the operations of the Fund.
The Fund has entered into a revolving credit facility with a syndicate of banks led by JPMorgan Chase Bank, N.A. (the Administrative Agent), whereby the Fund may borrow for the temporary funding of shareholder redemptions or for other temporary or emergency purposes. The credit facility agreement, as amended, which is a collective agreement between the Fund and certain other funds managed by the Investment Manager, severally and not jointly, permits
| | | | |
| COLUMBIA GLOBAL EXTENDED ALPHA FUND — 2012 SEMIANNUAL REPORT | | | 43 | |
| | |
| Notes to Financial Statements (continued) | | |
collective borrowings up to $500 million. Pursuant to a December 13, 2011 amendment to the credit facility agreement, interest is charged to each participating fund based on its borrowings at a rate equal to the higher of (i) the overnight federal funds rate plus 1.00% or (i) the one-month LIBOR rate plus 1.00%. Each borrowing under the credit facility matures no later than 60 days after the date of borrowing. The Fund also pays a commitment fee equal to its pro rata share of the amount of the credit facility at a rate of 0.08% per annum.
Prior to December 13, 2011, interest was charged to each participating fund based on its borrowings at a rate equal to the sum of the federal funds rate plus (i) 1.25% per annum plus (ii) if one-month LIBOR exceeds the federal funds rate, the amount of such excess. The Fund also paid a commitment fee equal to its pro rata share of the amount of the credit facility at a rate of 0.10% per annum.
The Fund had no borrowings during the six months ended April 30, 2012.
| Note 10. Significant | Risks |
Foreign Securities Risk
Investing in foreign securities may include certain risks and considerations not typically associated with investing in U.S. securities, such as fluctuating currency values and changing local and regional economic, political and social conditions, which may result in greater market volatility. In addition, certain foreign securities may not be as liquid as U.S. securities. Investing in emerging markets may accentuate these risks.
Investments in emerging market countries are subject to additional risk. The risk of foreign investments is typically increased in less developed countries. These countries are also more likely to experience high levels of inflation, deflation or currency devaluation which could hurt their economies and securities markets.
Geographic Concentration Risk
The Fund may be particularly susceptible to economic, political, regulatory or other events or conditions affecting issuers and countries within the specific geographic regions in which the Fund invests. Currency devaluation could occur in countries that have not yet experienced currency devaluation to date, or could continue to occur in countries that have already experienced such devaluations. As a result, the Fund may be more volatile than a more geographically diversified fund.
Short Selling Risk
The Fund may make short sales, which involves selling a security the Fund does not own in anticipation that the security’s price will decline. The Fund’s potential losses could exceed those of other mutual funds which hold only long security positions if
| | |
| 44 | | COLUMBIA GLOBAL EXTENDED ALPHA FUND — 2012 SEMIANNUAL REPORT |
the value of the securities held long decreases and the value of the securities sold short increases. The Fund’s use of short sales in effect “leverages” the Fund, as the Fund intends to use the cash proceeds from the short sales to invest in additional long securities. Leveraging potentially exposes the Fund to greater risks due to unanticipated market movements, which may magnify losses and increase volatility of returns. There is no assurance that a leveraging strategy will be successful.
| Note 11. Subsequent | Events |
Management has evaluated the events and transactions that have occurred through the date the financial statements were issued and noted no items requiring adjustment of the financial statements or additional disclosure.
| Note 12. Information | Regarding Pending and Settled Legal Proceedings |
In December 2005, without admitting or denying the allegations, American Express Financial Corporation (AEFC, which is now known as Ameriprise Financial, Inc. (Ameriprise Financial)) entered into settlement agreements with the Securities and Exchange Commission (SEC) and Minnesota Department of Commerce (MDOC) related to market timing activities. As a result, AEFC was censured and ordered to cease and desist from committing or causing any violations of certain provisions of the Investment Advisers Act of 1940, the Investment Company Act of 1940, and various Minnesota laws. AEFC agreed to pay disgorgement of $10 million and civil money penalties of $7 million. AEFC also agreed to retain an independent distribution consultant to assist in developing a plan for distribution of all disgorgement and civil penalties ordered by the SEC in accordance with various undertakings detailed at www.sec.gov/litigation/admin/ia-2451.pdf. Ameriprise Financial and its affiliates have cooperated with the SEC and the MDOC in these legal proceedings, and have made regular reports to the funds’ Boards of Trustees.
Ameriprise Financial and certain of its affiliates have historically been involved in a number of legal, arbitration and regulatory proceedings, including routine litigation, class actions, and governmental actions, concerning matters arising in connection with the conduct of their business activities. Ameriprise Financial believes that the Funds are not currently the subject of, and that neither Ameriprise Financial nor any of its affiliates are the subject of, any pending legal, arbitration or regulatory proceedings that are likely to have a material adverse effect on the Funds or the ability of Ameriprise Financial or its affiliates to perform under their contracts with the Funds. Ameriprise Financial is required to make 10-Q, 10-K and, as necessary, 8-K filings with the Securities and Exchange Commission on legal and regulatory matters that relate to Ameriprise
| | | | |
| COLUMBIA GLOBAL EXTENDED ALPHA FUND — 2012 SEMIANNUAL REPORT | | | 45 | |
| | |
| Notes to Financial Statements (continued) | | |
Financial and its affiliates. Copies of these filings may be obtained by accessing the SEC website at www.sec.gov.
There can be no assurance that these matters, or the adverse publicity associated with them, will not result in increased fund redemptions, reduced sale of fund shares or other adverse consequences to the Funds. Further, although we believe proceedings are not likely to have a material adverse effect on the Funds or the ability of Ameriprise Financial or its affiliates to perform under their contracts with the Funds, these proceedings are subject to uncertainties and, as such, we are unable to estimate the possible loss or range of loss that may result. An adverse outcome in one or more of these proceedings could result in adverse judgments, settlements, fines, penalties or other relief that could have a material adverse effect on the consolidated financial condition or results of operations of Ameriprise Financial.
| | |
| 46 | | COLUMBIA GLOBAL EXTENDED ALPHA FUND — 2012 SEMIANNUAL REPORT |
The policy of the Board is to vote the proxies of the companies in which the Fund holds investments consistent with the procedures as stated in the Statement of Additional Information (SAI). You may obtain a copy of the SAI without charge by calling 800.345.6611; contacting your financial intermediary; visiting columbiamanagement.com; or searching the website of the Securities and Exchange Commission (SEC) at www.sec.gov. Information regarding how the Fund voted proxies relating to portfolio securities is filed with the SEC by August 31 for the most recent 12-month period ending June 30 of that year, and is available without charge by visiting columbiamanagement.com; or searching the website of the SEC at www.sec.gov.
| | |
| Approval of Investment Management Services |
| |
| and Subadvisory Agreements | | |
Columbia Management Investment Advisers, LLC (“Columbia Management” or the “investment manager”), a wholly-owned subsidiary of Ameriprise Financial, Inc. (“Ameriprise Financial”), serves as the investment manager to Columbia Global Extended Alpha Fund (the “Fund”). Under an investment management services agreement (the “IMS Agreement”), Columbia Management provides investment advice and other services to the Fund and all funds distributed by Columbia Management Investment Distributors, Inc. (collectively, the “Funds”). In addition, under a Subadvisory Agreement (the “Subadvisory Agreement”) between Columbia Management and Threadneedle International Limited (the “Subadviser”), an affiliate of Columbia Management, the Subadviser has provided portfolio management and related services for the Fund.
On an annual basis, the Fund’s Board of Trustees (the “Board”), including the independent Board members (the “Independent Trustees”), considers renewal of the IMS Agreement and the Subadvisory Agreement (together, the “Advisory Agreements”). Columbia Management prepared detailed reports for the Board and its Contracts Committee in March and April 2012, including reports based on analyses of data provided by an independent organization and a comprehensive response to each item of information requested by independent legal counsel to the Independent Trustees (“Independent Legal Counsel”) in a letter to the investment manager, to assist the Board in making this determination. All of the materials presented in March and April were first supplied in draft form to designated representatives of the Independent Trustees, i.e., Independent Legal Counsel, the Chair of the Board and the Chair of the Contracts Committee (including materials relating to the Fund’s expense cap), and the final materials were revised to reflect comments provided by these Board representatives. In addition, throughout the year, the Board (or its committees) regularly meets with portfolio management teams and senior management
| | | | |
| COLUMBIA GLOBAL EXTENDED ALPHA FUND — 2012 SEMIANNUAL REPORT | | | 47 | |
| | |
Approval of Investment Management Services |
| |
| and Subadvisory Agreements (continued) | | |
personnel and reviews information prepared by Columbia Management addressing the services Columbia Management provides and Fund performance. The Board accords particular weight to the work, deliberations and conclusions of the Contracts Committee, the Investment Review Committee and the Compliance Committee in determining whether to continue the Advisory Agreements.
The Board, at its April 10-12, 2012 in-person Board meeting (the “April Meeting”), considered the renewal of the Advisory Agreements for an additional one-year term. At the April Meeting, Independent Legal Counsel reviewed with the Independent Trustees various factors relevant to the Board’s consideration of advisory and subadvisory agreements and the Board’s legal responsibilities related to such consideration. Following an analysis and discussion of the factors identified below, the Board, including all of the Independent Trustees, approved the renewal of each of the Advisory Agreements.
Nature, Extent and Quality of Services Provided by Columbia Management and the Subadviser: The Board considered its analysis of various reports and presentations received by it or one of its committees detailing the services performed by Columbia Management and the Subadviser, as well as their history, reputation, expertise, resources and relative capabilities, and the qualifications of their personnel.
With respect to Columbia Management, the Board specifically considered many developments during the past year concerning the services provided by Columbia Management, including, in particular, the continued investment in, and resources dedicated to, the Funds’ operations and the successful completion of various integration initiatives and the consolidation of dozens of Funds. The Board noted the information it received concerning Columbia Management’s ability to retain key portfolio management personnel. In that connection, the Board took into account its meetings with Columbia Management’s Chief Investment Officer (the “CIO”) and considered the CIO’s successful execution of additional risk and portfolio management oversight applied to the Funds. The Board also assessed Columbia Management’s significant investment in upgrading technology (such as an equity trading system) and considered management’s commitments to enhance existing resources in this area.
In connection with the Board’s evaluation of the overall package of services provided by Columbia Management, the Board also considered the quality of administrative services provided to the Fund by Columbia Management. The Board also reviewed the financial condition of Columbia Management and its affiliates and their ability to carry out their responsibilities under the IMS
| | |
| 48 | | COLUMBIA GLOBAL EXTENDED ALPHA FUND — 2012 SEMIANNUAL REPORT |
Agreement and the Fund’s other service agreements with affiliates of Ameriprise Financial. In addition, the Board discussed the acceptability of the terms of the IMS Agreement (including the relatively broad scope of services required to be performed by Columbia Management). The Board concluded that the services being performed under the IMS Agreement were of a reasonably high quality.
Based on the foregoing, and based on other information received (both oral and written, including the information on investment performance referenced below) and other considerations, the Board concluded that Columbia Management and its affiliates were in a position to continue to provide a high quality and level of services to the Fund.
With respect to the Subadviser, the Board observed that it had previously approved the Subadviser’s code of ethics and compliance program, that the Chief Compliance Officer of the Fund continues to monitor the code and the program, and that no material issues have been reported. The Board also considered the Subadviser’s investment strategy/style, including particularly as it relates to the Fund, as well as the experience of the personnel that manage the Fund. The Board also considered the financial condition of the Subadviser and its capability and wherewithal to carry out its responsibilities under the Subadvisory Agreement. In addition, the Board discussed the acceptability of the terms of the Subadvisory Agreement including the scope of services required to be performed. The Board noted that the terms of the Subadvisory Agreement are generally consistent with the terms of other subadviser agreements for subadvisers who manage other funds managed by the investment manager. It was observed that no changes were recommended to the Subadvisory Agreement. Based on the foregoing, and based on other information received (both oral and written) and other considerations, including, in particular, the performance of the Fund (discussed below) as well as the investment manager’s recommendation that the Board approve renewal of the Subadvisory Agreement with the Subadviser the Board concluded that the services being performed under the Subadvisory Agreement were of a reasonably high quality.
Based on the foregoing, and based on other information received (both oral and written, including the information on investment performance referenced below) and other considerations, the Board concluded that the Subadviser was in a position to continue to provide a high quality and level of services to the Fund.
Investment Performance: For purposes of evaluating the nature, extent and quality of services provided under the Advisory Agreements, the Board reviewed the investment performance of the Fund. In this regard, the Board carefully
| | | | |
| COLUMBIA GLOBAL EXTENDED ALPHA FUND — 2012 SEMIANNUAL REPORT | | | 49 | |
| | |
Approval of Investment Management Services |
| |
| and Subadvisory Agreements (continued) | | |
considered detailed reports providing the results of analyses performed by an independent organization showing, for various periods, the performance of the Fund, the performance of a benchmark index, the percentage ranking of the Fund among its comparison group and the net assets of the Fund. The Board observed that the Fund’s investment performance met expectations.
Additionally, the Board reviewed the performance of the Subadviser and Columbia Management’s process for monitoring the Subadviser. The Board considered, in particular, management’s rationale for recommending the continued retention of the Subadviser.
Comparative Fees, Costs of Services Provided and the Profits Realized By Columbia Management, its Affiliates and the Subadviser from their Relationships with the Fund: The Board reviewed comparative fees and the costs of services provided under each of the Advisory Agreements. The Board members considered detailed comparative information set forth in an annual report on fees and expenses, including, among other things, data (based on analyses conducted by an independent organization) showing a comparison of the Fund’s expenses with median expenses paid by funds in its comparative peer universe, as well as data showing the Fund’s contribution to Columbia Management’s profitability. The Board reviewed the fees charged to comparable institutional or other accounts/vehicles managed by Columbia Management and discussed differences in how the products are managed and operated, noting no unreasonable differences in the levels of contractual fees.
The Board accorded particular weight to the notion that the level of fees should reflect a rational pricing model applied consistently across the various product lines in the Fund family, while assuring that the overall fees for each Fund (with few defined exceptions) are generally in line with the “pricing philosophy” (i.e., that the total expense ratio of the Fund is at, or below, the median expense ratio of funds in the same comparison universe of the Fund). The Board took into account that the Fund’s total expense ratio (after considering proposed expense caps/waivers) approximated the peer universe’s median expense ratio. Additionally, the Board reviewed the level of subadvisory fees paid to the Subadviser, noting that the fees are paid by the investment manager and do not impact the fees paid by the Fund. The Board observed that the subadvisory fee level for the Subadviser was generally comparable to those charged by other subadvisers to similar funds managed by the investment manager. The Board also reviewed fee rates charged by the Subadviser to other client accounts. Based on its review, the Board concluded that the Fund’s management and subadvisory fees were fair and reasonable in light of the extent and quality of services that the Fund receives.
| | |
| 50 | | COLUMBIA GLOBAL EXTENDED ALPHA FUND — 2012 SEMIANNUAL REPORT |
The Board also considered the expected profitability of Columbia Management and its affiliates in connection with Columbia Management providing investment management services to the Fund. In this regard, the Board referred to a detailed profitability report, discussing the profitability to Columbia Management and Ameriprise Financial from managing, operating and distributing the Funds. In this regard, the Board observed that 2011 profitability, while slightly lower than 2010, was generally in line with the reported profitability of other asset management firms. The Board also considered the indirect economic benefits flowing to Columbia Management or its affiliates in connection with managing or distributing the Funds, such as the enhanced ability to offer various other
financial products to Ameriprise Financial customers, soft dollar benefits and overall reputational advantages. The Board noted that the fees paid by the Fund should permit the investment manager to offer competitive compensation to its personnel, make necessary investments in its business and earn an appropriate profit. The Board concluded that profitability levels were reasonable.
Economies of Scale to be Realized: The Board also considered the economies of scale that might be realized by Columbia Management as the Fund grows and took note of the extent to which Fund shareholders might also benefit from such growth.
Based on the foregoing, the Board, including all of the Independent Trustees, concluded that fees payable under the Advisory Agreements were fair and reasonable in light of the extent and quality of services provided. In reaching this conclusion, no single factor was determinative. At the April Meeting, the Board, including all of the Independent Trustees, approved the renewal of the Advisory Agreements.
| | | | |
| COLUMBIA GLOBAL EXTENDED ALPHA FUND — 2012 SEMIANNUAL REPORT | | | 51 | |
Columbia Global Extended Alpha Fund
P.O. Box 8081
Boston, MA 02266-8081
columbiamanagement.com
| | | | |
 | | This report must be accompanied or preceded by the Fund’s current prospectus. The
Fund is distributed by Columbia Management Investment Distributors, Inc., member
FINRA, and managed by Columbia Management Investment Advisers, LLC. ©2012 Columbia Management Investment Advisers, LLC. All rights reserved. | | S-6528 E (6/12) |
Semiannual Report

Columbia
Multi-Advisor International Value Fund
Semiannual Report for the Period Ended April 30, 2012
Columbia Multi-Advisor International Value Fund seeks to provide shareholders with long-term capital growth.
Not FDIC insured ¡ No bank guarantee ¡ May lose value
| | | | |
| |
Your Fund at a Glance | | | 2 | |
| |
Fund Expense Example | | | 8 | |
| |
Portfolio of Investments | | | 10 | |
| |
Statement of Assets and Liabilities | | | 24 | |
| |
Statement of Operations | | | 26 | |
| |
Statement of Changes in Net Assets | | | 28 | |
| |
Financial Highlights | | | 30 | |
| |
Notes to Financial Statements | | | 36 | |
| |
Proxy Voting | | | 53 | |
| |
Approval of Investment Management Services and Subadvisory Agreements | | | 53 | |
See the Fund’s prospectus for risks associated with investing in the Fund.
| | | | |
| COLUMBIA MULTI-ADVISOR INTERNATIONAL VALUE FUND — 2012 SEMIANNUAL REPORT | | | 1 | |
FUND SUMMARY
| > | | Columbia Multi-Advisor International Value Fund (the Fund) Class A shares returned -0.41% (excluding sales charge) for the six month period ended April 30, 2012. |
| > | | The Fund underperformed its benchmark, the MSCI Europe, Australasia and Far East (EAFE) Value Index (Net), which returned 0.10% for the same period. |
ANNUALIZED TOTAL RETURNS (for period ended April 30, 2012)
| | | | | | | | | | | | | | | | |
| | | 6 months* | | | 1 year | | | 5 years | | | 10 years | |
Columbia Multi-Advisor International Value Fund
Class A (excluding sales charge) | | | -0.41% | | | | -18.27% | | | | -9.09% | | | | +4.08% | |
MSCI EAFE Value Index (Net)(1) (unmanaged) | | | +0.10% | | | | -15.59% | | | | -6.61% | | | | +5.39% | |
MSCI EAFE Value Index (Gross)(1) (unmanaged) | | | +0.41% | | | | -15.02% | | | | -6.04% | | | | +5.96% | |
The performance information shown represents past performance and is not a guarantee of future results. The investment return and principal value of your investment will fluctuate so that your shares, when redeemed, may be worth more or less than their original cost. Current performance may be lower or higher than the performance information shown. You may obtain performance information current to the most recent month-end by contacting your financial intermediary, visiting columbiamanagement.com or calling 800.345.6611.
The 5.75% sales charge applicable to Class A shares of the Fund is not reflected in the table above. If reflected, returns would be lower than those shown. The performance of other classes may vary from that shown because of differences in fees and expenses. The Fund’s returns reflect the effect of fee waivers/expense reimbursements, if any. Without such waivers/reimbursements, the Fund’s returns would be lower. See the Average Annual Total Returns table for performance of other share classes of the Fund.
The indices do not reflect the effects of sales charges, expenses and taxes (except the MSCI EAFE Value Index (Net)) which reflects reinvested dividends net of withholding taxes. It is not possible to invest directly in an index.
| (1) | | The MSCI EAFE Value Index (Net) and the MSCI EAFE Value Index (Gross), each an unmanaged index and subset of the MSCI EAFE Value Index, measure the performance of value stocks in the MSCI EAFE Value Index. The style characteristics used for index construction include book value to price ratio, 12-month forward earnings to price ratio, and dividend yield. Each index reflects reinvestment of all distributions and changes in market prices. On September 30, 2011, the MSCI EAFE Value Index (Net) replaced the MSCI EAFE Value Index (Gross) as the Fund’s primary benchmark. The Fund’s Investment |
| | |
| 2 | | COLUMBIA MULTI-ADVISOR INTERNATIONAL VALUE FUND — 2012 SEMIANNUAL REPORT |
| | Manager made this recommendation to the Fund’s Board because the Investment Manager believes that the Net version of the index better reflects how dividends paid to the Fund on foreign securities generally are treated for tax purposes and, therefore, provides a more appropriate basis for comparing the Fund’s performance. Information on both versions of the Index will be included for a one-year transition period. Thereafter, only the Net version will be included. |
| | | | |
| COLUMBIA MULTI-ADVISOR INTERNATIONAL VALUE FUND — 2012 SEMIANNUAL REPORT | | | 3 | |
| | |
| Your Fund at a Glance (continued) | | |
AVERAGE ANNUAL TOTAL RETURNS
| | | | | | | | | | | | | | | | |
| at April 30, 2012 | | | | | | | | | | | | |
| Without sales charge | | 6 months* | | | 1 year | | | 5 years | | | 10 years | |
Class A (inception 9/28/01) | | | -0.41% | | | | -18.27% | | | | -9.09% | | | | +4.08% | |
Class B (inception 9/28/01) | | | -0.74% | | | | -18.96% | | | | -9.79% | | | | +3.28% | |
Class C (inception 9/28/01) | | | -0.83% | | | | -19.02% | | | | -9.77% | | | | +3.28% | |
Class I** (inception 3/4/04) | | | -0.13% | | | | -17.89% | | | | -8.58% | | | | +4.51% | |
Class R4 (inception 9/28/01) | | | -0.20% | | | | -18.05% | | | | -8.72% | | | | +4.36% | |
Class Z** (inception 9/27/10) | | | -0.18% | | | | -18.10% | | | | -9.03% | | | | +4.11% | |
| | | | |
| With sales charge | | | | | | | | | | | | |
Class A (inception 9/28/01) | | | -6.15% | | | | -22.96% | | | | -10.15% | | | | +3.47% | |
Class B (inception 9/28/01) | | | -5.59% | | | | -22.92% | | | | -10.06% | | | | +3.28% | |
Class C (inception 9/28/01) | | | -1.80% | | | | -19.81% | | | | -9.77% | | | | +3.28% | |
The “Without sales charge” returns for Class A, Class B and Class C shares do not include applicable initial or contingent deferred sales charges. If included, returns would be lower than those shown. The “With sales charge” returns for Class A, Class B and Class C shares include: the maximum initial sales charge of 5.75% for Class A shares; the applicable contingent deferred sales charge (CDSC) for Class B shares (applied as follows: first year 5%; second year 4%; third and fourth years 3%; fifth year 2%; sixth year 1%; no sales charge thereafter); and a 1% CDSC for Class C shares sold within one year after purchase. The Fund’s other share classes are not subject to sales charges and have limited eligibility. See the Fund’s prospectuses for details.
| ** | The returns shown for periods prior to the share class inception date (including returns since inception, which are since Fund inception) include the returns of the Fund’s Class A shares. These returns are adjusted to reflect any higher class-related operating expenses of the newer share classes, as applicable. Please visit columbiamanagement.com/mutual-fund/appended-performance for more information. |
| | |
| 4 | | COLUMBIA MULTI-ADVISOR INTERNATIONAL VALUE FUND — 2012 SEMIANNUAL REPORT |
| | | | |
| COUNTRY BREAKDOWN(1) (at April 30, 2012) | |
Australia | | | 6.4 | % |
Austria | | | 0.0 | * |
Belgium | | | 0.6 | |
Brazil | | | 0.3 | |
Canada | | | 7.2 | |
China | | | 0.7 | |
Denmark | | | 1.1 | |
Finland | | | 0.2 | |
France | | | 9.7 | |
Germany | | | 8.3 | |
Greece | | | 0.0 | * |
Hong Kong | | | 2.1 | |
Ireland | | | 1.4 | |
Israel | | | 0.4 | |
Italy | | | 1.1 | |
Japan | | | 18.3 | |
Netherlands | | | 2.7 | |
New Zealand | | | 0.6 | |
Norway | | | 1.4 | |
Philippines | | | 0.2 | |
Portugal | | | 0.0 | * |
Singapore | | | 3.4 | |
South Korea | | | 0.9 | |
Spain | | | 2.1 | |
Sweden | | | 2.1 | |
Switzerland | | | 2.9 | |
Taiwan | | | 0.2 | |
Thailand | | | 0.4 | |
United Kingdom | | | 24.0 | |
United States | | | 0.3 | |
Other(2) | | | 1.0 | |
| * | | Rounds to less than 0.1% |
| (1) | | Percentages indicated are based upon total investments (excluding Investments of Cash Collateral Received for Securities on Loan). The Fund’s portfolio composition is subject to change. |
| (2) | | Includes investments in Money Market Funds. |
| | | | |
| COLUMBIA MULTI-ADVISOR INTERNATIONAL VALUE FUND — 2012 SEMIANNUAL REPORT | | | 5 | |
| | |
| Your Fund at a Glance (continued) | | |
| | | | |
| TOP TEN HOLDINGS(1) (at April 30, 2012) | |
BP PLC (United Kingdom) | | | 2.7 | % |
HSBC Holdings PLC, ADR (United Kingdom) | | | 2.0 | |
Vodafone Group PLC (United Kingdom) | | | 1.9 | |
Royal Dutch Shell PLC, Class A (United Kingdom) | | | 1.6 | |
Banco Santander SA (Spain) | | | 1.6 | |
Toyota Motor Corp. (Japan) | | | 1.5 | |
Sanofi (France) | | | 1.4 | |
Royal Dutch Shell PLC, Class B (United Kingdom) | | | 1.4 | |
Mitsubishi UFJ Financial Group, Inc. (Japan) | | | 1.3 | |
Suncor Energy, Inc. (Canada) | | | 1.2 | |
(1) Percentages indicated are based upon total investments (excluding Investments of Cash Collateral Received for Securities on Loan and Money Market Funds).
For further detail about these holdings, please refer to the section entitled “Portfolio of Investments.”
Fund holdings are as of the date given, are subject to change at any time, and are not recommendations to buy or sell any security.
| | |
| 6 | | COLUMBIA MULTI-ADVISOR INTERNATIONAL VALUE FUND — 2012 SEMIANNUAL REPORT |
MORNINGSTAR STYLE BOXTM
| | |
 | | The Morningstar Style BoxTM is based on the Fund’s portfolio holdings.
For equity funds, the vertical axis shows the market capitalization of the
stocks owned, and the horizontal axis shows investment style (value,
blend, or growth). Information shown is based on the most recent data
provided by Morningstar. |
©2012 Morningstar, Inc. All rights reserved. The Morningstar information contained herein: (1) is proprietary to Morningstar and/or its content providers; (2) may not be copied or distributed; and (3) is not warranted to be accurate, complete, or timely. Neither Morningstar nor its content providers are responsible for any damages or losses arising from any use of this information. Past performance is no guarantee of future results.
| | | | |
| COLUMBIA MULTI-ADVISOR INTERNATIONAL VALUE FUND — 2012 SEMIANNUAL REPORT | | | 7 | |
(Unaudited)
Understanding your expenses
As an investor, you incur two types of costs. There are transaction costs, which generally include sales charges on purchases and may include redemption fees. There are also ongoing costs, which generally include management fees, distribution and service (Rule 12b-1) fees, and other fund expenses. The following information is intended to help you understand your ongoing costs (in dollars) of investing in the Fund and to help you compare these costs with the ongoing costs of investing in other mutual funds.
Analyzing your fund’s expenses
To illustrate these ongoing costs, we have provided examples and calculated the expenses paid by investors in each share class of the Fund during the period. The actual and hypothetical information in the table is based on an initial investment of $1,000 at the beginning of the period indicated and held for the entire period. Expense information is calculated two ways and each method provides you with different information. The amount listed in the “Actual” column is calculated using the Fund’s actual operating expenses and total return for the period. You may use the Actual information, together with the amount invested, to estimate the expenses that you paid over the period. Simply divide your account value by $1,000 (for example, an $8,600 account value divided by $1,000 = 8.6), then multiply the results by the expenses paid during the period under the Actual column. The amount listed in the “Hypothetical” column assumes a 5% annual rate of return before expenses (which is not the Fund’s actual return) and then applies the Fund’s actual expense ratio for the period to the hypothetical return. You should not use the hypothetical account values and expenses to estimate either your actual account balance at the end of the period or the expenses you paid during the period. See “Compare with other funds” below for details on how to use the hypothetical data.
Compare with other funds
Since all mutual funds are required to include the same hypothetical calculations about expenses in shareholder reports, you can use this information to compare the ongoing cost of investing in the Fund with other funds. To do so, compare the hypothetical example with the 5% hypothetical examples that appear in the shareholder reports of other funds. As you compare hypothetical examples of other funds, it is important to note that hypothetical examples are meant to highlight the ongoing costs of investing in a fund only and do not reflect any transaction costs, such as sales charges, or redemption or exchange fees. Therefore, the hypothetical calculations are useful in comparing ongoing costs only, and will not help you determine the relative total costs of owning different funds. If transaction costs were included in these calculations, your costs would be higher.
| | |
| 8 | | COLUMBIA MULTI-ADVISOR INTERNATIONAL VALUE FUND — 2012 SEMIANNUAL REPORT |
November 1, 2011 — April 30, 2012
| | | | | | | | | | | | | | | | | | | | | | | | | | | | |
| | | Account value at the
beginning of the
period ($) | | | Account value at the
end of the period ($) | | | Expenses paid
during the period ($) | | | Fund’s
annualized
expense
ratio (%) | |
| | | Actual | | | Hypothetical | | | Actual | | | Hypothetical | | | Actual | | | Hypothetical | | | Actual | |
Class A | | | 1,000.00 | | | | 1,000.00 | | | | 995.90 | | | | 1,017.26 | | | | 7.59 | | | | 7.67 | | | | 1.53 | |
Class B | | | 1,000.00 | | | | 1,000.00 | | | | 992.60 | | | | 1,013.53 | | | | 11.30 | | | | 11.41 | | | | 2.28 | |
Class C | | | 1,000.00 | | | | 1,000.00 | | | | 991.70 | | | | 1,013.58 | | | | 11.24 | | | | 11.36 | | | | 2.27 | |
Class I | | | 1,000.00 | | | | 1,000.00 | | | | 998.70 | | | | 1,019.64 | | | | 5.22 | | | | 5.27 | | | | 1.05 | |
Class R4 | | | 1,000.00 | | | | 1,000.00 | | | | 998.00 | | | | 1,018.20 | | | | 6.66 | | | | 6.72 | | | | 1.34 | |
Class Z | | | 1,000.00 | | | | 1,000.00 | | | | 998.20 | | | | 1,018.60 | | | | 6.26 | | | | 6.32 | | | | 1.26 | |
Expenses paid during the period are equal to the annualized expense ratio for each class as indicated above, multiplied by the average account value over the period and then multiplied by the number of days in the Fund’s most recent fiscal half year and divided by 366.
Expenses do not include fees and expenses incurred indirectly by the Fund from the underlying funds in which the Fund may invest (also referred to as “acquired funds”), including affiliated and non-affiliated pooled investment vehicles (including mutual funds and exchange traded funds).
Had Columbia Management Investment Advisers, LLC and/or certain of its affiliates not waived/reimbursed certain fees and expenses, account value at the end of the period would have been reduced.
Columbia Management Investment Advisers, LLC and/or certain of its affiliates have contractually agreed to waive certain fees and to absorb certain expenses until February 28, 2013, unless sooner terminated at the sole discretion of the Fund’s Board, such that net expenses (excluding fees and expenses of acquired funds) will not exceed 1.46% for Class A, 2.21% for Class B and 2.21% for Class C. Any amounts waived will not be reimbursed by the Fund. This change was effective January 1, 2012. If this change had been in place for the entire six month period ended April 30, 2012, the actual expenses paid would have been $7.25 for Class A, $10.95 for Class B and $10.94 for Class C; the hypothetical expenses paid would have been $7.32 for Class A, $11.07 for Class B and $11.07 for Class C.
| | | | |
| COLUMBIA MULTI-ADVISOR INTERNATIONAL VALUE FUND — 2012 SEMIANNUAL REPORT | | | 9 | |
Columbia Multi-Advisor International Value Fund
April 30, 2012 (Unaudited)
(Percentages represent value of investments compared to net assets)
| | | | | | | | |
| Issuer | | Shares | | | Value | |
| | | | | | | | |
| Common Stocks 98.8% | |
| | | | | | | | |
AUSTRALIA 6.4% | |
AGL Energy Ltd. | | | 43,253 | | | | $673,073 | |
Alumina Ltd.(a) | | | 88,251 | | | | 105,412 | |
Asciano Group | | | 44,461 | | | | 217,600 | |
Australia & New Zealand Banking Group Ltd. | | | 77,868 | | | | 1,929,045 | |
Bank of Queensland Ltd.(a) | | | 10,906 | | | | 84,244 | |
Bendigo and Adelaide Bank Ltd.(a) | | | 18,495 | | | | 144,626 | |
Boral Ltd. (a) | | | 34,337 | | | | 134,291 | |
Caltex Australia Ltd. | | | 5,317 | | | | 75,750 | |
Commonwealth Bank of Australia | | | 23,918 | | | | 1,290,208 | |
Commonwealth Property
Office Fund | | | 1,472,015 | | | | 1,593,307 | |
David Jones Ltd.(a) | | | 118,495 | | | | 305,105 | |
Echo Entertainment Group Ltd. | | | 29,129 | | | | 135,692 | |
Fairfax Media Ltd.(a) | | | 190,781 | | | | 136,143 | |
Harvey Norman Holdings Ltd.(a) | | | 19,263 | | | | 40,391 | |
Iluka Resources Ltd. | | | 22,902 | | | | 400,062 | |
Incitec Pivot Ltd. | | | 47,295 | | | | 159,844 | |
Lend Lease Group | | | 20,682 | | | | 159,296 | |
Macmahon Holdings Ltd. | | | 491,487 | | | | 355,861 | |
Macquarie Group Ltd.(a) | | | 24,900 | | | | 750,499 | |
Monadelphous Group Ltd. | | | 48,801 | | | | 1,174,025 | |
National Australia Bank Ltd. | | | 50,738 | | | | 1,326,256 | |
Newcrest Mining Ltd. | | | 3,282 | | | | 89,435 | |
Origin Energy Ltd. | | | 47,379 | | | | 650,938 | |
OZ Minerals Ltd. | | | 14,764 | | | | 142,156 | |
Qantas Airways Ltd.(b) | | | 43,725 | | | | 74,122 | |
Santos Ltd. | | | 40,615 | | | | 589,201 | |
Seven Group Holdings Ltd. | | | 4,854 | | | | 50,894 | |
Sims Metal Management Ltd. | | | 7,154 | | | | 105,202 | |
Suncorp-Metway Ltd. | | | 60,837 | | | | 512,998 | |
Tatts Group Ltd. | | | 45,901 | | | | 123,271 | |
Telstra Corp., Ltd. | | | 241,085 | | | | 888,878 | |
Toll Holdings Ltd. | | | 31,055 | | | | 188,229 | |
Transfield Services Ltd.(a) | | | 378,869 | | | | 893,494 | |
Treasury Wine Estates Ltd. | | | 25,449 | | | | 113,705 | |
Wesfarmers Ltd. | | | 27,636 | | | | 867,821 | |
Westpac Banking Corp. | | | 14,896 | | | | 351,042 | |
| | | | | | | | |
Total | | | | 16,832,116 | |
AUSTRIA —% | | | | | | | | |
OMV AG | | | 1,092 | | | | 36,968 | |
| | | | | | | | |
| Issuer | | Shares | | | Value | |
| | | | | | | | |
| Common Stocks (continued) | |
| | | | | | | | |
BELGIUM 0.6% | | | | | | | | |
Ageas(a) | | | 81,094 | | | | $147,598 | |
D’ieteren SA/NV | | | 1 | | | | 44 | |
Delhaize Group SA | | | 8,721 | | | | 424,530 | |
KBC Groep NV(a) | | | 19,436 | | | | 375,878 | |
Solvay SA | | | 3,286 | | | | 399,866 | |
UCB SA(a) | | | 3,984 | | | | 186,080 | |
| | | | | | | | |
Total | | | | 1,533,996 | |
BRAZIL 0.3% | | | | | | | | |
Cia de Saneamento Basico do Estado de Sao Paulo | | | 13,800 | | | | 543,269 | |
Telefonica Brasil SA, ADR | | | 13,034 | | | | 371,078 | |
| | | | | | | | |
Total | | | | 914,347 | |
CANADA 7.2% | | | | | | | | |
Bell Aliant, Inc. | | | 765 | | | | 20,258 | |
Cameco Corp. | | | 22,200 | | | | 491,261 | |
Canadian Natural Resources Ltd. | | | 3,564 | | | | 123,849 | |
Canadian Tire Corp., Class A(a) | | | 3,622 | | | | 253,322 | |
Centerra Gold, Inc. | | | 33,137 | | | | 429,035 | |
Cott Corp.(b) | | | 87,440 | | | | 572,732 | |
Eastern Platinum Ltd.(b) | | | 460,000 | | | | 176,950 | |
Empire Co., Ltd. | | | 1,369 | | | | 80,573 | |
EnCana Corp.(a) | | | 36,869 | | | | 772,202 | |
Enerplus Corp.(a) | | | 10,200 | | | | 188,749 | |
Ensign Energy Services, Inc. | | | 4,423 | | | | 63,937 | |
First Quantum Minerals Ltd. | | | 10,751 | | | | 223,324 | |
Goldcorp, Inc. | | | 8,323 | | | | 318,438 | |
Groupe Aeroplan, Inc. | | | 140 | | | | 1,800 | |
Husky Energy, Inc. | | | 14,937 | | | | 389,661 | |
Inmet Mining Corp. | | | 1,751 | | | | 96,320 | |
Katanga Mining Ltd.(b) | | | 82 | | | | 68 | |
Kinross Gold Corp. | | | 68,400 | | | | 612,785 | |
Loblaw Companies Ltd. | | | 5,500 | | | | 185,681 | |
Magna International, Inc.(a) | | | 16,749 | | | | 733,982 | |
Manulife Financial Corp. | | | 95,216 | | | | 1,302,190 | |
Methanex Corp. | | | 4,138 | | | | 145,690 | |
Morguard Real Estate Investment Trust(a) | | | 19,800 | | | | 338,535 | |
Nexen, Inc.(a) | | | 45,182 | | | | 873,133 | |
Northern Property REIT(a) | | | 20,400 | | | | 677,969 | |
Pason Systems Corp.(a) | | | 73,300 | | | | 954,974 | |
Pengrowth Energy Corp.(a) | | | 15,793 | | | | 141,967 | |
Penn West Petroleum Ltd. | | | 18,493 | | | | 316,937 | |
Precision Drilling Corp.(b) | | | 13,100 | | | | 120,676 | |
The accompanying Notes to Financial Statements are an integral part of this statement.
| | |
| 10 | | COLUMBIA MULTI-ADVISOR INTERNATIONAL VALUE FUND — 2012 SEMIANNUAL REPORT |
| | | | | | | | |
| Issuer | | Shares | | | Value | |
| Common Stocks (continued) | |
| | | | | | | | |
CANADA (cont.) | | | | | | | | |
Progress Energy Resources Corp. | | | 6,250 | | | | $68,773 | |
Progressive Waste Solutions Ltd. | | | 4,534 | | | | 98,359 | |
Quebecor, Inc., Class B | | | 302 | | | | 11,871 | |
Research In Motion Ltd.(b) | | | 16,600 | | | | 237,443 | |
Sun Life Financial, Inc. | | | 30,982 | | | | 759,613 | |
Suncor Energy, Inc. | | | 94,700 | | | | 3,128,067 | |
Talisman Energy, Inc. | | | 52,300 | | | | 684,027 | |
Teck Resources Ltd., Class B | | | 35,000 | | | | 1,305,967 | |
Thomson Reuters Corp. | | | 19,961 | | | | 596,496 | |
TransAlta Corp. | | | 10,398 | | | | 172,414 | |
Uranium One, Inc.(b) | | | 16,678 | | | | 48,455 | |
Viterra, Inc. | | | 100 | | | | 1,611 | |
Yamana Gold, Inc. | | | 32,088 | | | | 471,694 | |
Yamana Gold, Inc. | | | 44,900 | | | | 658,603 | |
| | | | | | | | |
Total | | | | 18,850,391 | |
CHINA 0.7% | | | | | | | | |
AAC Technologies Holdings, Inc. | | | 158,000 | | | | 463,958 | |
AMVIG Holdings Ltd. | | | 885,000 | | | | 494,589 | |
China Communications Construction Co., Ltd., Class H | | | 576,000 | | | | 573,928 | |
Spreadtrum Communications, Inc., ADR | | | 21,762 | | | | 300,316 | |
| | | | | | | | |
Total | | | | 1,832,791 | |
DENMARK 1.1% | | | | | | | | |
A P Moller — Maersk A/S, Class A | | | 12 | | | | 89,420 | |
AP Moller — Maersk A/S, Class B | | | 80 | | | | 625,743 | |
Carlsberg A/S, Class B | | | 6,070 | | | | 523,168 | |
Christian Hansen Holding A/S | | | 46,927 | | | | 1,300,884 | |
Danske Bank AS(b) | | | 10,286 | | | | 167,004 | |
H Lundbeck A/S | | | 3,022 | | | | 60,492 | |
TDC A/S | | | 14,834 | | | | 106,368 | |
Vestas Wind Systems A/S(a)(b) | | | 828 | | | | 7,309 | |
| | | | | | | | |
Total | | | | 2,880,388 | |
FINLAND 0.2% | | | | | | | | |
Kesko OYJ, Class A | | | 199 | | | | 5,769 | |
Kesko OYJ, Class B(a) | | | 1,633 | | | | 43,621 | |
Neste Oil OYJ | | | 3,598 | | | | 42,531 | |
Stora Enso OYJ, Class R(a) | | | 21,785 | | | | 148,509 | |
UPM-Kymmene OYJ | | | 24,152 | | | | 309,150 | |
| | | | | | | | |
Total | | | | 549,580 | |
FRANCE 9.4% | | | | | | | | |
Alcatel-Lucent(b) | | | 150,172 | | | | 231,383 | |
ArcelorMittal | | | 28,793 | | | | 497,950 | |
Arkema SA | | | 2,190 | | | | 193,966 | |
BNP Paribas SA | | | 53,974 | | | | 2,168,368 | |
Boiron SA | | | 12,758 | | | | 393,992 | |
Bollore(a) | | | 379 | | | | 82,276 | |
Bouygues SA(a) | | | 17,685 | | | | 480,366 | |
| | | | | | | | |
| Issuer | | Shares | | | Value | |
| Common Stocks (continued) | |
| | | | | | | | |
FRANCE (cont.) | | | | | | | | |
Cap Gemini SA | | | 7,538 | | | | $294,253 | |
Casino Guichard Perrachon SA(b) | | | 2,182 | | | | 214,284 | |
Cie de St. Gobain | | | 28,290 | | | | 1,185,026 | |
Cie Generale de Geophysique-Veritas(b) | | | 7,299 | | | | 207,823 | |
Cie Generale des Etablissements Michelin | | | 9,154 | | | | 683,650 | |
Credit Agricole SA | | | 29,668 | | | | 152,491 | |
Electricite de France SA | | | 12,008 | | | | 254,082 | |
France Telecom SA | | | 101,689 | | | | 1,391,151 | |
GDF Suez(a) | | | 67,901 | | | | 1,563,023 | |
Groupe Eurotunnel SA | | | 634 | | | | 5,335 | |
Ingenico | | | 14,034 | | | | 738,242 | |
IPSOS | | | 16,492 | | | | 535,283 | |
Lafarge SA | | | 10,100 | | | | 393,795 | |
Lagardere SCA | | | 4,736 | | | | 143,561 | |
Medica SA | | | 18,891 | | | | 292,070 | |
Mersen | | | 16,689 | | | | 552,723 | |
Natixis | | | 36,184 | | | | 110,258 | |
Neopost SA(a) | | | 20,003 | | | | 1,150,071 | |
Nexans SA | | | 11,272 | | | | 563,482 | |
Peugeot SA | | | 5,014 | | | | 60,198 | |
Renault SA(a) | | | 16,915 | | | | 768,550 | |
Rexel SA | | | 3,759 | | | | 78,617 | |
Rubis | | | 13,243 | | | | 720,210 | |
Sanofi | | | 48,167 | | | | 3,676,325 | |
Societe Generale SA | | | 58,310 | | | | 1,378,524 | |
STMicroelectronics NV | | | 32,466 | | | | 184,149 | |
Thales SA | | | 834 | | | | 28,896 | |
Total SA | | | 51,694 | | | | 2,468,175 | |
Vivendi SA | | | 87,762 | | | | 1,622,322 | |
| | | | | | | | |
Total | | | | 25,464,870 | |
GERMANY 8.0% | | | | | | | | |
Allianz SE, Registered Shares | | | 18,218 | | | | 2,030,015 | |
Aurubis AG | | | 8,603 | | | | 477,433 | |
BASF SE | | | 6,255 | | | | 514,917 | |
Bayerische Motoren Werke AG | | | 8,006 | | | | 761,010 | |
Bilfinger Berger SE | | | 10,626 | | | | 971,795 | |
Celesio AG | | | 44 | | | | 759 | |
Commerzbank AG(b) | | | 75,790 | | | | 164,028 | |
Daimler AG, Registered Shares | | | 31,315 | | | | 1,731,229 | |
Deutsche Bank AG, Registered Shares | | | 45,502 | | | | 1,979,793 | |
Deutsche Lufthansa AG, Registered Shares | | | 17,199 | | | | 223,816 | |
Deutsche Telekom AG, Registered Shares | | | 6,826 | | | | 76,956 | |
E.ON AG(a) | | | 103,990 | | | | 2,355,907 | |
ElringKlinger AG(a) | | | 22,885 | | | | 662,657 | |
Fielmann AG | | | 9,258 | | | | 896,930 | |
Freenet AG | | | 57,784 | | | | 1,004,297 | |
The accompanying Notes to Financial Statements are an integral part of this statement.
| | | | |
| COLUMBIA MULTI-ADVISOR INTERNATIONAL VALUE FUND — 2012 SEMIANNUAL REPORT | | | 11 | |
| | |
| Portfolio of Investments (continued) | | |
| | | | | | | | |
| Issuer | | Shares | | | Value | |
| Common Stocks (continued) | |
| | | | | | | | |
GERMANY (cont.) | | | | | | | | |
GFK SE | | | 11,481 | | | | $609,872 | |
HeidelbergCement AG(a) | | | 4,307 | | | | 236,798 | |
KHD Humboldt Wedag International AG(b) | | | 70,470 | | | | 546,068 | |
Kloeckner & Co. SE | | | 29,938 | | | | 406,197 | |
MTU Aero Engines Holding AG(a) | | | 10,706 | | | | 901,593 | |
Muenchener Rueckversicherungs AG, Registered Shares(a) | | | 5,697 | | | | 826,884 | |
QIAGEN NV(b) | | | 33,709 | | | | 557,312 | |
Rational AG(a) | | | 1,690 | | | | 431,751 | |
RWE AG(a) | | | 12,862 | | | | 552,901 | |
Salzgitter AG | | | 551 | | | | 28,766 | |
Symrise AG | | | 65,159 | | | | 1,888,897 | |
ThyssenKrupp AG | | | 29,339 | | | | 695,165 | |
Volkswagen AG(a) | | | 982 | | | | 167,619 | |
| | | | | | | | |
Total | | | | 21,701,365 | |
GREECE —% | | | | | | | | |
Coca Cola Hellenic Bottling Co. SA(b) | | | 3,335 | | | | 66,218 | |
HONG KONG 2.1% | | | | | | | | |
Asian Citrus Holdings Ltd. | | | 894,000 | | | | 531,611 | |
ASM Pacific Technology Ltd.(a) | | | 39,700 | | | | 536,356 | |
Cheung Kong Holdings Ltd. | | | 61,000 | | | | 806,729 | |
Dah Sing Banking Group Ltd. | | | 3,200 | | | | 3,307 | |
Emperor Watch & Jewellery, Ltd. | | | 2,940,000 | | | | 414,226 | |
Henderson Land Development Co., Ltd. | | | 45,000 | | | | 255,336 | |
Hongkong & Shanghai Hotels (The) | | | 6,250 | | | | 8,163 | |
Hongkong Land Holdings Ltd. | | | 105,000 | | | | 650,059 | |
Hopewell Holdings Ltd. | | | 20,000 | | | | 53,602 | |
Hutchison Whampoa Ltd. | | | 103,000 | | | | 986,744 | |
New World Development Co., Ltd. | | | 299,000 | | | | 370,653 | |
Orient Overseas International Ltd. | | | 10,000 | | | | 68,135 | |
Pacific Basin Shipping Ltd. | | | 1,203,000 | | | | 629,541 | |
Wharf Holdings Ltd. | | | 18,000 | | | | 106,747 | |
Wheelock & Co., Ltd. | | | 30,000 | | | | 101,076 | |
| | | | | | | | |
Total | | | | 5,522,285 | |
IRELAND 1.3% | | | | | | | | |
DCC PLC | | | 26,470 | | | | 669,232 | |
Dragon Oil PLC | | | 51,069 | | | | 486,090 | |
Glanbia PLC | | | 84,998 | | | | 645,818 | |
Governor & Co. of the Bank of Ireland (The)(b) | | | 85,594 | | | | 12,690 | |
Jazz Pharmaceuticals PLC(b) | | | 13,485 | | | | 688,140 | |
Smurfit Kappa Group PLC | | | 61,424 | | | | 516,950 | |
WPP PLC, ADR | | | 6,684 | | | | 453,309 | |
| | | | | | | | |
Total | | | | 3,472,229 | |
ISRAEL 0.4% | | | | | | | | |
Bank Hapoalim BM | | | 60,386 | | | | 224,558 | |
| | | | | | | | |
| Issuer | | Shares | | | Value | |
| Common Stocks (continued) | |
| | | | | | | | |
ISRAEL (cont.) | | | | | | | | |
Israel Discount Bank Ltd., Class A(b) | | | 110,427 | | | | $143,433 | |
Teva Pharmaceutical Industries Ltd., ADR | | | 15,226 | | | | 696,437 | |
| | | | | | | | |
Total | | | | 1,064,428 | |
ITALY 1.1% | | | | | | | | |
ENI SpA | | | 43,955 | | | | 975,733 | |
Fiat SpA (b) | | | 13,409 | | | | 64,750 | |
Parmalat SpA | | | 209 | | | | 473 | |
Recordati SpA | | | 83,601 | | | | 581,532 | |
Telecom Italia SpA (b) | | | 801,956 | | | | 911,340 | |
UniCredit SpA | | | 91,923 | | | | 365,766 | |
Unione di Banche Italiane SCPA | | | 6,692 | | | | 24,856 | |
| | | | | | | | |
Total | | | | 2,924,450 | |
JAPAN 18.2% | | | | | | | | |
77 Bank Ltd. (The) | | | 12,000 | | | | 47,851 | |
Aeon Co., Ltd. | | | 62,700 | | | | 818,548 | |
Aeon Delight Co., Ltd. | | | 28,400 | | | | 661,193 | |
Alfresa Holdings Corp. | | | 1,500 | | | | 69,270 | |
Amada Co., Ltd. | | | 15,000 | | | | 101,810 | |
Ariake Japan Co., Ltd. | | | 21,300 | | | | 429,758 | |
Arnest One Corp. | | | 64,000 | | | | 726,432 | |
Asahi Glass Co., Ltd. | | | 47,000 | | | | 369,540 | |
Asahi Kasei Corp. | | | 10,000 | | | | 61,807 | |
Autobacs Seven Co., Ltd. (a) | | | 800 | | | | 38,395 | |
Canon Marketing Japan, Inc. | | | 1,500 | | | | 19,350 | |
Canon, Inc. | | | 15,900 | | | | 720,713 | |
Casio Computer Co., Ltd.(a) | | | 7,500 | | | | 49,825 | |
Citizen Holdings Co., Ltd. | | | 9,700 | | | | 60,918 | |
Coca-Cola West Co., Ltd. | | | 2,100 | | | | 37,906 | |
Cosmo Oil Company Ltd.(a) | | | 26,000 | | | | 72,104 | |
CyberAgent, Inc. | | | 95 | | | | 292,579 | |
Dai Nippon Printing Co., Ltd.(a) | | | 22,000 | | | | 195,248 | |
Daicel Corp. | | | 13,000 | | | | 82,404 | |
Daihatsu Motor Co., Ltd. | | | 27,000 | | | | 509,676 | |
Daiichikosho Co., Ltd. | | | 45,700 | | | | 922,607 | |
FCC Co., Ltd. | | | 46,100 | | | | 941,330 | |
Fuji Heavy Industries Ltd. | | | 23,000 | | | | 173,478 | |
Fuji Machine Manufacturing Co., Ltd. | | | 32,200 | | | | 661,925 | |
Fuji Media Holdings, Inc. | | | 14 | | | | 23,616 | |
FUJIFILM Holdings Corp. | | | 21,800 | | | | 462,387 | |
Fukuoka Financial Group, Inc. | | | 27,000 | | | | 112,333 | |
Fukuyama Transporting Co., Ltd.(a) | | | 6,000 | | | | 32,767 | |
Fuyo General Lease Co., Ltd. | | | 24,600 | | | | 800,298 | |
H2O Retailing Corp. | | | 4,000 | | | | 35,207 | |
Hachijuni Bank Ltd. (The) | | | 14,000 | | | | 76,192 | |
Hakuhodo DY Holdings, Inc. | | | 770 | | | | 48,083 | |
Hankyu Hanshin Holdings, Inc. | | | 31,000 | | | | 144,635 | |
Hitachi Capital Corp. | | | 1,600 | | | | 26,449 | |
The accompanying Notes to Financial Statements are an integral part of this statement.
| | |
| 12 | | COLUMBIA MULTI-ADVISOR INTERNATIONAL VALUE FUND — 2012 SEMIANNUAL REPORT |
| | | | | | | | |
| Issuer | | Shares | | | Value | |
| Common Stocks (continued) | |
| | | | | | | | |
JAPAN (cont.) | | | | | | | | |
Hitachi Ltd. | | | 173,000 | | | | $1,101,879 | |
Hogy Medical Co., Ltd. | | | 18,800 | | | | 866,654 | |
Horiba Ltd. | | | 17,100 | | | | 599,601 | |
House Foods Corp. | | | 2,800 | | | | 47,158 | |
Idemitsu Kosan Co., Ltd. | | | 1,000 | | | | 92,076 | |
Inpex Corp. | | | 26 | | | | 171,665 | |
Isetan Mitsukoshi Holdings Ltd. | | | 14,600 | | | | 159,027 | |
ITOCHU Corp. | | | 76,700 | | | | 867,800 | |
J Front Retailing Co., Ltd. | | | 16,000 | | | | 82,211 | |
Japan Petroleum Exploration Co. | | | 12,400 | | | | 565,710 | |
JFE Holdings, Inc. | | | 35,100 | | | | 656,423 | |
JS Group Corp. | | | 2,200 | | | | 43,200 | |
JTEKT Corp. | | | 9,600 | | | | 105,216 | |
JX Holdings, Inc. | | | 175,900 | | | | 992,233 | |
K’s Holdings Corp. | | | 15,100 | | | | 454,258 | |
Kamigumi Co., Ltd. | | | 10,000 | | | | 80,370 | |
Kaneka Corp.(a) | | | 9,000 | | | | 55,619 | |
Kato Sangyo Co., Ltd. | | | 23,600 | | | | 485,309 | |
Kinden Corp. | | | 5,000 | | | | 34,724 | |
Kinki Sharyo Co., Ltd. | | | 132,000 | | | | 470,215 | |
Kobe Steel Ltd.(a) | | | 68,000 | | | | 96,981 | |
Konica Minolta Holdings, Inc. | | | 39,000 | | | | 316,413 | |
Kyocera Corp. | | | 1,900 | | | | 185,231 | |
Mandom Corp. | | | 21,900 | | | | 554,101 | |
Marui Group Co., Ltd. | | | 8,400 | | | | 66,675 | |
Mazda Motor Corp.(b) | | | 118,000 | | | | 191,754 | |
Medipal Holdings Corp. | | | 4,800 | | | | 60,718 | |
Miraca Holdings, Inc. | | | 20,000 | | | | 787,674 | |
Mitsubishi Chemical Holdings Corp. | | | 50,000 | | | | 263,504 | |
Mitsubishi Corp. | | | 65,200 | | | | 1,413,012 | |
Mitsubishi Gas Chemical Co., Inc. | | | 31,000 | | | | 203,093 | |
Mitsubishi Heavy Industries Ltd. | | | 25,000 | | | | 113,376 | |
Mitsubishi Logistics Corp.(a) | | | 4,000 | | | | 43,877 | |
Mitsubishi Materials Corp. | | | 38,000 | | | | 113,336 | |
Mitsubishi UFJ Financial Group, Inc. | | | 714,800 | | | | 3,432,121 | |
Mitsui & Co., Ltd. | | | 26,400 | | | | 412,252 | |
Mitsui Chemicals, Inc. | | | 31,000 | | | | 89,562 | |
Mitsui OSK Lines Ltd. | | | 47,000 | | | | 182,168 | |
Miura Co., Ltd. | | | 13,100 | | | | 339,275 | |
Nagase & Co., Ltd. | | | 2,000 | | | | 24,214 | |
NEC Corp.(b) | | | 97,000 | | | | 175,120 | |
NGK Spark Plug Co., Ltd. | | | 5,000 | | | | 71,382 | |
Nifco, Inc.(a) | | | 49,500 | | | | 1,331,541 | |
Nippon Electric Glass Co., Ltd. | | | 17,000 | | | | 137,356 | |
Nippon Express Co., Ltd. | | | 90,000 | | | | 339,750 | |
Nippon Meat Packers, Inc. | | | 8,000 | | | | 102,191 | |
Nippon Paper Group, Inc. | | | 4,200 | | | | 84,084 | |
Nippon Sheet Glass Co., Ltd. | | | 28,000 | | | | 36,266 | |
Nippon Steel Corp. | | | 209,000 | | | | 520,805 | |
| | | | | | | | |
| Issuer | | Shares | | | Value | |
| Common Stocks (continued) | |
| | | | | | | | |
JAPAN (cont.) | | | | | | | | |
Nippon Television Network Corp. | | | 150 | | | | $23,230 | |
Nippon Yusen KK(a) | | | 59,000 | | | | 174,406 | |
Nissan Motor Co., Ltd. | | | 116,700 | | | | 1,213,334 | |
Nissan Shatai Co., Ltd. | | | 3,000 | | | | 31,664 | |
Nisshin Seifun Group, Inc. | | | 7,000 | | | | 85,409 | |
Nisshinbo Holdings, Inc. | | | 4,000 | | | | 35,168 | |
Nomura Holdings, Inc. | | | 133,500 | | | | 547,233 | |
NTN Corp. | | | 17,000 | | | | 64,309 | |
NTT DoCoMo, Inc. | | | 570 | | | | 973,275 | |
Obayashi Corp. | | | 26,000 | | | | 110,054 | |
Otsuka Holdings Co., Ltd. | | | 16,800 | | | | 506,312 | |
Panasonic Corp. | | | 94,600 | | | | 725,266 | |
Ricoh Co., Ltd.(a) | | | 24,000 | | | | 214,994 | |
Rohm Co., Ltd. | | | 3,600 | | | | 162,355 | |
Santen Pharmaceutical Co., Ltd. | | | 9,700 | | | | 405,935 | |
SBI Holdings, Inc. | | | 848 | | | | 68,241 | |
Seiko Epson Corp.(a) | | | 4,800 | | | | 64,034 | |
Seino Holdings Corp. | | | 4,000 | | | | 27,708 | |
Sekisui House Ltd. | | | 22,000 | | | | 203,948 | |
Sharp Corp.(a) | | | 70,000 | | | | 447,804 | |
Shinko Plantech Co., Ltd. | | | 79,500 | | | | 671,360 | |
Shinsei Bank Ltd. | | | 49,000 | | | | 63,232 | |
Showa Shell Sekiyu KK | | | 8,000 | | | | 50,345 | |
SKY Perfect JSAT Holdings, Inc.(a) | | | 55 | | | | 23,954 | |
SoftBank Corp. | | | 15,900 | | | | 474,559 | |
Sojitz Corp.(a) | | | 44,200 | | | | 74,439 | |
Sony Corp. | | | 60,900 | | | | 984,984 | |
Sumitomo Chemical Co., Ltd. | | | 21,000 | | | | 86,349 | |
Sumitomo Corp. | | | 52,900 | | | | 751,772 | |
Sumitomo Electric Industries Ltd. | | | 57,700 | | | | 778,330 | |
Sumitomo Forestry Co., Ltd. | �� | | 3,500 | | | | 30,458 | |
Sumitomo Metal Mining Co., Ltd. | | | 2,000 | | | | 26,235 | |
Sumitomo Mitsui Financial Group, Inc. | | | 79,600 | | | | 2,547,103 | |
Sumitomo Mitsui Trust Holdings, Inc. | | | 26,000 | | | | 76,168 | |
Suzuken Co., Ltd. | | | 3,000 | | | | 90,741 | |
Taisei Corp. | | | 41,000 | | | | 104,140 | |
Taiyo Holdings Co., Ltd. | | | 14,600 | | | | 387,150 | |
Takashimaya Co., Ltd. | | | 10,000 | | | | 75,800 | |
Teijin Ltd.(a) | | | 32,000 | | | | 107,612 | |
Tokyo Broadcasting System Holdings, Inc. | | | 1,900 | | | | 25,763 | |
Toppan Printing Co Ltd. | | | 22,000 | | | | 149,007 | |
Tosoh Corp. | | | 20,000 | | | | 55,292 | |
Toyo Seikan Kaisha Ltd. | | | 5,800 | | | | 77,180 | |
Toyoda Gosei Co., Ltd. | | | 1,700 | | | | 34,649 | |
Toyota Motor Corp. | | | 94,200 | | | | 3,860,106 | |
Toyota Tsusho Corp. | | | 8,400 | | | | 166,578 | |
The accompanying Notes to Financial Statements are an integral part of this statement.
| | | | |
| COLUMBIA MULTI-ADVISOR INTERNATIONAL VALUE FUND — 2012 SEMIANNUAL REPORT | | | 13 | |
| | |
| Portfolio of Investments (continued) | | |
| | | | | | | | |
| Issuer | | Shares | | | Value | |
| Common Stocks (continued) | |
| | | | | | | | |
JAPAN (cont.) | | | | | | | | |
UNY Co., Ltd. | | | 5,400 | | | | $62,753 | |
Ushio, Inc. | | | 31,800 | | | | 414,841 | |
Wacoal Holdings Corp.(a) | | | 3,000 | | | | 34,797 | |
Yamaguchi Financial Group, Inc. | | | 4,000 | | | | 34,358 | |
Yamaha Corp. | | | 5,300 | | | | 51,383 | |
Yamato Kogyo Co., Ltd. | | | 1,300 | | | | 36,992 | |
Yokohama Rubber Co., Ltd. (The) | | | 8,000 | | | | 58,480 | |
| | | | | | | | |
Total | | | | 47,997,403 | |
NETHERLANDS 2.9% | | | | | | | | |
Aegon NV(b) | | | 147,391 | | | | 680,709 | |
Akzo Nobel NV(a) | | | 9,136 | | | | 489,599 | |
ING Groep NV-CVA(b) | | | 255,674 | | | | 1,802,847 | |
Koninklijke Ahold NV | | | 68,697 | | | | 871,332 | |
Koninklijke Boskalis Westminster NV | | | 52,937 | | | | 1,931,204 | |
Koninklijke DSM NV | | | 10,903 | | | | 625,135 | |
Randstad Holding NV | | | 3,806 | | | | 131,794 | |
SBM Offshore NV | | | 18,078 | | | | 328,437 | |
Wereldhave NV | | | 4,850 | | | | 341,220 | |
| | | | | | | | |
Total | | | | 7,202,277 | |
NEW ZEALAND 0.6% | | | | | | | | |
Auckland International Airport Ltd. | | | 262,250 | | | | 541,721 | |
Fisher & Paykel Healthcare Corp., Ltd. | | | 200,259 | | | | 363,346 | |
Fletcher Building Ltd.(a) | | | 32,477 | | | | 165,685 | |
SKYCITY Entertainment Group Ltd. | | | 178,952 | | | | 561,563 | |
| | | | | | | | |
Total | | | | 1,632,315 | |
NORWAY 1.4% | | | | | | | | |
Archer Ltd.(b) | | | 4,926 | | | | 10,286 | |
Atea ASA | | | 60,408 | | | | 643,879 | |
BW Offshore Ltd. | | | 7,888 | | | | 10,958 | |
DNB ASA(a) | | | 70,075 | | | | 755,489 | |
Electromagnetic GeoServices AS(b) | | | 189,264 | | | | 598,586 | |
Farstad Shipping ASA | | | 13,342 | | | | 396,323 | |
Kongsberg Automotive Holding ASA(b) | | | 910,752 | | | | 318,281 | |
Marine Harvest ASA | | | 717,805 | | | | 368,250 | |
Norsk Hydro ASA | | | 40,880 | | | | 198,866 | |
Orkla ASA | | | 30,627 | | | | 224,982 | |
Petroleum Geo-Services ASA(b) | | | 8,044 | | | | 121,371 | |
Stolt-Nielsen Ltd. | | | 474 | | | | 8,489 | |
Subsea 7 SA(b) | | | 1,834 | | | | 47,525 | |
Telenor ASA | | | 1,629 | | | | 29,944 | |
| | | | | | | | |
Total | | | | 3,733,229 | |
| | | | | | | | |
PHILIPPINES 0.2% | | | | | | | | |
Energy Development Corp. | | | 2,876,800 | | | | 400,973 | |
| | | | | | | | |
| Issuer | | Shares | | | Value | |
| Common Stocks (continued) | |
| | | | | | | | |
PORTUGAL —% | | | | | | | | |
EDP Renovaveis SA(b) | | | 2,909 | | | | $12,391 | |
Portugal Telecom SGPS SA, Registered Shares | | | 16,238 | | | | 87,396 | |
| | | | | | | | |
Total | | | | | | | 99,787 | |
SINGAPORE 3.3% | | | | | | | | |
Ascendas Real Estate Investment Trust | | | 533,000 | | | | 894,151 | |
CapitaLand Ltd. | | | 168,000 | | | | 397,098 | |
CapitaMall Trust | | | 1,143,099 | | | | 1,659,621 | |
DBS Group Holdings Ltd. | | | 78,000 | | | | 876,279 | |
Ezra Holdings Ltd.(b) | | | 490,000 | | | | 398,087 | |
Golden Agri-Resources Ltd. | | | 287,000 | | | | 169,887 | |
Hyflux Ltd.(a) | | | 478,000 | | | | 552,796 | |
Indofood Agri Resources Ltd.(a)(b) | | | 21,000 | | | | 24,066 | |
Neptune Orient Lines Ltd.(a)(b) | | | 45,000 | | | | 44,700 | |
Overseas Union Enterprise Ltd.(a) | | | 8,000 | | | | 15,162 | |
SATS Ltd. | | | 501,000 | | | | 1,054,772 | |
SIA Engineering Co., Ltd. | | | 415,000 | | | | 1,318,956 | |
Singapore Airlines Ltd. | | | 36,000 | | | | 310,524 | |
SMRT Corp., Ltd.(a) | | | 223,000 | | | | 302,350 | |
StarHub Ltd. | | | 316,000 | | | | 813,889 | |
| | | | | | | | |
Total | | | | 8,832,338 | |
SOUTH KOREA 0.9% | | | | | | | | |
Capro Corp. | | | 18,320 | | | | 316,217 | |
Hyundai Home Shopping Network Corp. | | | 6,798 | | | | 825,287 | |
LG Fashon Corp. | | | 9,070 | | | | 301,053 | |
Youngone Holdings Co., Ltd. | | | 16,158 | | | | 806,698 | |
| | | | | | | | |
Total | | | | 2,249,255 | |
SPAIN 2.2% | | | | | | | | |
Acciona SA | | | 786 | | | | 48,276 | |
Banco de Sabadell SA | | | 35,091 | | | | 82,867 | |
Banco Popular Espanol SA | | | 32,880 | | | | 105,109 | |
Banco Santander SA | | | 1,865 | | | | 11,652 | |
Banco Santander SA | | | 646,500 | | | | 4,039,245 | |
CaixaBank | | | 12,833 | | | | 44,234 | |
Gas Natural SDG SA | | | 177 | | | | 2,465 | |
Prosegur Cia de Seguridad SA, Registered Shares | | | 11,631 | | | | 664,182 | |
Telefonica SA | | | 27,771 | | | | 404,733 | |
| | | | | | | | |
Total | | | | 5,402,763 | |
SWEDEN 2.1% | | | | | | | | |
AF AB, Class B | | | 27,104 | | | | 547,419 | |
Boliden AB | | | 29,332 | | | | 469,570 | |
Meda AB, Class A | | | 3,656 | | | | 36,145 | |
MQ Holding AB | | | 147,398 | | | | 550,443 | |
Nordea Bank AB | | | 157,286 | | | | 1,394,707 | |
Saab AB, Class B | | | 41,706 | | | | 694,966 | |
The accompanying Notes to Financial Statements are an integral part of this statement.
| | |
| 14 | | COLUMBIA MULTI-ADVISOR INTERNATIONAL VALUE FUND — 2012 SEMIANNUAL REPORT |
| | | | | | | | |
| Issuer | | Shares | | | Value | |
| Common Stocks (continued) | |
| | | | | | | | |
SWEDEN (cont.) | | | | | | | | |
Skandinaviska Enskilda Banken AB, Class A | | | 119,856 | | | | $808,872 | |
SSAB AB, Class A | | | 5,139 | | | | 52,450 | |
SSAB AB, Class B | | | 2,115 | | | | 18,691 | |
Svenska Cellulosa AB, Class A | | | 2,420 | | | | 38,381 | |
Svenska Cellulosa AB, Class B | | | 38,561 | | | | 611,005 | |
Telefonaktiebolaget LM Ericsson, Class B(b) | | | 33,652 | | | | 333,451 | |
| | | | | | | | |
Total | | | | 5,556,100 | |
SWITZERLAND 3.3% | | | | | | | | |
Adecco SA, Registered Shares(b) | | | 6,601 | | | | 321,450 | |
Alpiq Holding AG, Registered Shares(a) | | | 90 | | | | 16,113 | |
Aryzta AG(b) | | | 2,775 | | | | 139,721 | |
Baloise Holding AG, Registered Shares | | | 8,965 | | | | 693,870 | |
Clariant AG, Registered Shares(b) | | | 988 | | | | 12,561 | |
Holcim Ltd., Registered Shares(b) | | | 12,968 | | | | 807,241 | |
Lonza Group AG, Registered Shares(b) | | | 18 | | | | 812 | |
Nestlé SA, Registered Shares | | | 7,817 | | | | 478,847 | |
Novartis AG, Registered Shares | | | 46,130 | | | | 2,543,719 | |
Sulzer AG, Registered Shares | | | 577 | | | | 82,960 | |
Swiss Re AG(b) | | | 3,465 | | | | 217,219 | |
UBS AG, Registered Shares(b) | | | 90,910 | | | | 1,134,810 | |
Zurich Insurance Group AG(b) | | | 5,496 | | | | 1,344,254 | |
| | | | | | | | |
Total | | | | 7,793,577 | |
TAIWAN 0.2% | | | | | | | | |
Huaku Development Co., Ltd. | | | 199,000 | | | | 475,702 | |
THAILAND 0.4% | | | | | | | | |
Bangkok Bank PCL, Foreign Registered Shares | | | 99,700 | | | | 617,496 | |
PTT PCL, Foreign Registered Shares | | | 49,200 | | | | 561,108 | |
| | | | | | | | |
Total | | | | 1,178,604 | |
UNITED KINGDOM 24.0% | | | | | | | | |
Anglo American PLC | | | 783 | | | | 30,091 | |
AstraZeneca PLC | | | 25,606 | | | | 1,121,803 | |
Aviva PLC | | | 387,787 | | | | 1,938,995 | |
AZ Electronic Materials SA | | | 198,983 | | | | 1,027,885 | |
Barclays PLC | | | 723,326 | | | | 2,562,005 | |
Bodycote PLC | | | 83,028 | | | | 573,210 | |
BP PLC | | | 990,171 | | | | 7,150,920 | |
BP PLC, ADR | | | 4,854 | | | | 210,712 | |
Bwin.Party Digital Entertainment PLC | | | 175,449 | | | | 438,494 | |
Carnival PLC, ADR(a) | | | 7,128 | | | | 231,803 | |
Centrica PLC | | | 174,895 | | | | 871,096 | |
Cobham PLC | | | 191,649 | | | | 704,476 | |
CPP Group PLC | | | 145,049 | | | | 111,227 | |
| | | | | | | | |
| Issuer | | Shares | | | Value | |
| Common Stocks (continued) | |
| | | | | | | | |
UNITED KINGDOM (cont.) | | | | | | | | |
Croda International PLC | | | 60,006 | | | | $2,173,605 | |
De La Rue PLC | | | 80,243 | | | | 1,270,358 | |
Diploma PLC | | | 97,808 | | | | 727,948 | |
Domino Printing Sciences PLC | | | 78,196 | | | | 760,157 | |
Eurasian Natural Resources Corp., PLC | | | 8,331 | | | | 75,647 | |
Evraz PLC(b) | | | 163 | | | | 977 | |
GlaxoSmithKline PLC | | | 15,266 | | | | 353,046 | |
Greene King PLC | | | 41,178 | | | | 341,156 | |
Halma PLC | | | 109,847 | | | | 722,175 | |
HSBC Holdings PLC | | | 260,645 | | | | 2,348,077 | |
HSBC Holdings PLC, ADR(a) | | | 113,930 | | | | 5,146,218 | |
ICAP PLC | | | 98,948 | | | | 609,732 | |
Intermediate Capital Group PLC | | | 102,577 | | | | 427,501 | |
International Consolidated Airlines Group SA(b) | | | 26,992 | | | | 77,272 | |
Interserve PLC | | | 105,301 | | | | 489,096 | |
Investec PLC | | | 17,542 | | | | 101,122 | |
J Sainsbury PLC | | | 46,796 | | | | 233,835 | |
Kazakhmys PLC | | | 6,808 | | | | 95,129 | |
Kingfisher PLC | | | 87,679 | | | | 413,365 | |
Laird PLC | | | 234,793 | | | | 824,201 | |
Lancashire Holdings Ltd. | | | 43,591 | | | | 569,488 | |
Lloyds Banking Group PLC(b) | | | 2,922,900 | | | | 1,470,982 | |
Mondi PLC | | | 1,923 | | | | 17,836 | |
Old Mutual PLC | | | 174,727 | | | | 419,108 | |
Resolution Ltd. | | | 51,687 | | | | 187,730 | |
Rexam PLC | | | 224,014 | | | | 1,563,275 | |
Rotork PLC | | | 70,452 | | | | 2,523,407 | |
Royal Bank of Scotland Group PLC, ADR(a)(b) | | | 16,770 | | | | 132,818 | |
Royal Dutch Shell PLC, Class A | | | 119,457 | | | | 4,248,826 | |
Royal Dutch Shell PLC, Class B | | | 100,759 | | | | 3,673,516 | |
Serco Group PLC | | | 52,737 | | | | 464,309 | |
Spectris PLC | | | 36,685 | | | | 1,122,850 | |
Spirax-Sarco Engineering PLC | | | 19,684 | | | | 736,655 | |
TT electronics PLC | | | 147,376 | | | | 454,435 | |
Ultra Electronics Holdings PLC | | | 40,003 | | | | 1,093,267 | |
Victrex PLC | | | 40,879 | | | | 963,293 | |
Vodafone Group PLC | | | 1,757,775 | | | | 4,863,841 | |
Vodafone Group PLC, ADR | | | 93,380 | | | | 2,598,765 | |
Xstrata PLC | | | 98,150 | | | | 1,875,611 | |
| | | | | | | | |
Total | | | | 63,143,346 | |
UNITED STATES 0.1% | | | | | | | | |
Regeneron Pharmaceuticals, Inc.(b) | | | 2,038 | | | | 275,660 | |
Tyco International Ltd. | | | 9,427 | | | | 529,137 | |
| | | | | | | | |
Total | | | | 804,797 | |
Total Common Stocks (Cost: $253,107,842) | | | | $260,148,888 | |
The accompanying Notes to Financial Statements are an integral part of this statement.
| | | | |
| COLUMBIA MULTI-ADVISOR INTERNATIONAL VALUE FUND — 2012 SEMIANNUAL REPORT | | | 15 | |
| | |
| Portfolio of Investments (continued) | | |
| | | | | | | | |
| Issuer | | Shares | | | Value | |
| | | | | | | | |
| Rights —% | | | | |
SPAIN —% | | | | | | | | |
Banco Santander SA(b) | | | 402,924 | | | | $105,070 | |
Total Rights (Cost: $—) | | | | | | | $105,070 | |
| | | Shares | | | Value | |
| Money Market Funds 1.0% | | | | |
Columbia Short-Term Cash Fund, 0.144%(c)(d) | | | 2,625,130 | | | | $2,625,130 | |
Total Money Market Funds (Cost: $2,625,130) | | | | | | | $2,625,130 | |
| | | | | | | | | | | | |
| Issuer | | Effective
Yield | | | Par/
Principal/
Shares | | | Value | |
Investments of Cash Collateral
Received for Securities on Loan 7.0% | |
| | | | | | | | | | | | |
Repurchase Agreements 7.0% | |
Mizuho Securities USA, Inc.
dated 04/30/12, matures 05/01/12,
repurchase price $5,000,033(e) | |
| | | 0.240 | % | | | $5,000,000 | | | | $5,000,000 | |
Natixis Financial Products, Inc.
dated 04/30/12, matures 05/01/12,
repurchase price $2,000,013(e) | |
| | | 0.240 | % | | | 2,000,000 | | | | 2,000,000 | |
| | | | | | | | | | | | |
| Issuer | | Effective
Yield | | | Par/
Principal/
Shares | | | Value | |
Investments of Cash Collateral
Received for Securities on Loan
(continued) | |
| | | | | | | | | | | | |
Nomura Securities
dated 04/30/12, matures 05/01/12,
repurchase price $3,000,020(e) | |
| | | 0.240 | % | | | 3,000,000 | | | | 3,000,000 | |
Pershing LLC
dated 04/30/12, matures 05/01/12,
repurchase price $4,000,037(e) | |
| | | 0.330 | % | | | 4,000,000 | | | | 4,000,000 | |
UBS Securities LLC dated 04/30/12, matures 05/01/12, repurchase price $4,509,914(e) | |
| | | 0.210 | % | | | 4,509,888 | | | | 4,509,888 | |
| | | | | | | | | | | | |
Total | | | | 18,509,888 | |
Total Investments of Cash Collateral Received for Securities on Loan | |
(Cost: $18,509,888) | | | | | | | | | | | $18,509,888 | |
Total Investments | |
(Cost: $274,242,860) | | | | $281,388,976 | |
Other Assets & Liabilities, Net | | | | (17,936,190) | |
Net Assets | | | | $263,452,786 | |
The accompanying Notes to Financial Statements are an integral part of this statement.
| | |
| 16 | | COLUMBIA MULTI-ADVISOR INTERNATIONAL VALUE FUND — 2012 SEMIANNUAL REPORT |
Investments in Derivatives
| | | | | | | | | | | | | | | | | | |
| Forward Foreign Currency Exchange Contracts Open at April 30, 2012 | |
| Counterparty | | Exchange Date | | | Currency to
be Delivered | | | Currency to be Received | | Unrealized Appreciation | | | Unrealized Depreciation | |
| | | | | |
Jackson Partners & Associates, Inc. | | | July 31, 2012 | | | | 1,898,000 (AUD | ) | | 1,943,163 (USD) | | | $— | | | | $(15,972 | ) |
Jackson Partners & Associates, Inc. | | | July 31, 2012 | | | | 1,367,500 (NZD | ) | | 1,105,049 (USD) | | | — | | | | (6,441 | ) |
Total | | | | | | | | | | | | | $— | | | | $(22,413 | ) |
Summary of Investments in Securities by Industry
The following table represents the portfolio investments of the Fund by industry classifications as a percentage of net assets at April 30, 2012:
| | | | | | | | |
| Industry | | Percentage of Net Assets | | | Value | |
| Aerospace & Defense | | | 1.3 | % | | | $3,423,199 | |
| Air Freight & Logistics | | | 0.1 | | | | 270,504 | |
| Airlines | | | 0.3 | | | | 685,735 | |
| Auto Components | | | 1.8 | | | | 4,867,615 | |
| Automobiles | | | 3.6 | | | | 9,501,704 | |
| Beverages | | | 0.5 | | | | 1,313,728 | |
| Biotechnology | | | 0.1 | | | | 275,660 | |
| Building Products | | | 0.6 | | | | 1,634,032 | |
| Capital Markets | | | 2.1 | | | | 5,618,931 | |
| Chemicals | | | 4.4 | | | | 11,604,751 | |
| Commercial Banks | | | 14.1 | | | | 37,307,062 | |
| Commercial Services & Supplies | | | 1.7 | | | | 4,507,376 | |
| Communications Equipment | | | 0.5 | | | | 1,266,235 | |
| Computers & Peripherals | | | 0.1 | | | | 239,154 | |
| Construction & Engineering | | | 2.6 | | | | 6,771,260 | |
| Construction Materials | | | 0.7 | | | | 1,737,810 | |
| Consumer Finance | | | 0.0 | * | | | 26,449 | |
| Containers & Packaging | | | 1.0 | | | | 2,651,994 | |
| Distributors | | | 0.0 | * | | | 19,395 | |
| Diversified Financial Services | | | 1.0 | | | | 2,603,145 | |
| Diversified Telecommunication Services | | | 2.2 | | | | 5,910,425 | |
| Electric Utilities | | | 1.0 | | | | 2,674,377 | |
| Electrical Equipment | | | 0.9 | | | | 2,316,685 | |
| Electronic Equipment, Instruments & Components | | | 3.0 | | | | 7,897,380 | |
| Energy Equipment & Services | | | 1.5 | | | | 3,930,344 | |
| Food & Staples Retailing | | | 1.6 | | | | 4,294,057 | |
| Food Products | | | 1.1 | | | | 3,024,798 | |
| Gas Utilities | | | 0.3 | | | | 722,675 | |
| Health Care Equipment & Supplies | | | 0.5 | | | | 1,230,000 | |
The accompanying Notes to Financial Statements are an integral part of this statement.
| | | | |
| COLUMBIA MULTI-ADVISOR INTERNATIONAL VALUE FUND — 2012 SEMIANNUAL REPORT | | | 17 | |
| | |
| Portfolio of Investments (continued) | | |
Summary of Investments in Securities by Industry (continued)
| | | | | | | | |
| Industry | | Percentage of Net Assets | | | Value | |
| Health Care Providers & Services | | | 0.5 | % | | | $1,301,232 | |
| Hotels, Restaurants & Leisure | | | 0.7 | | | | 1,855,302 | |
| Household Durables | | | 1.2 | | | | 3,168,717 | |
| Independent Power Producers & Energy Traders | | | 0.2 | | | | 585,779 | |
| Industrial Conglomerates | | | 0.9 | | | | 2,498,866 | |
| Insurance | | | 4.4 | | | | 11,630,671 | |
| Internet & Catalog Retail | | | 0.3 | | | | 825,287 | |
| IT Services | | | 0.4 | | | | 938,132 | |
| Leisure Equipment & Products | | | 0.0 | * | | | 51,383 | |
| Life Sciences Tools & Services | | | 0.2 | | | | 558,123 | |
| Machinery | | | 2.4 | | | | 6,204,108 | |
| Marine | | | 0.7 | | | | 1,822,603 | |
| Media | | | 1.5 | | | | 3,848,166 | |
| Metals & Mining | | | 4.2 | | | | 11,102,571 | |
| Multiline Retail | | | 0.4 | | | | 1,017,737 | |
| Multi-Utilities | | | 1.4 | | | | 3,660,093 | |
| Office Electronics | | | 0.9 | | | | 2,402,191 | |
| Oil, Gas & Consumable Fuels | | | 11.5 | | | | 30,341,683 | |
| Paper & Forest Products | | | 0.5 | | | | 1,208,965 | |
| Personal Products | | | 0.2 | | | | 554,101 | |
| Pharmaceuticals | | | 4.3 | | | | 11,249,958 | |
| Professional Services | | | 0.4 | | | | 1,000,663 | |
| Real Estate Investment Trusts (REITs) | | | 2.1 | | | | 5,504,804 | |
| Real Estate Management & Development | | | 1.3 | | | | 3,322,695 | |
| Road & Rail | | | 0.4 | | | | 1,064,811 | |
| Semiconductors & Semiconductor Equipment | | | 0.4 | | | | 1,183,176 | |
| Specialty Retail | | | 1.1 | | | | 2,767,615 | |
| Textiles, Apparel & Luxury Goods | | | 0.4 | | | | 1,142,548 | |
| Trading Companies & Distributors | | | 1.6 | | | | 4,245,775 | |
| Transportation Infrastructure | | | 1.2 | | | | 3,045,032 | |
| Water Utilities | | | 0.4 | | | | 1,096,065 | |
| Wireless Telecommunication Services | | | 4.1 | | | | 10,728,626 | |
| Other(1) | | | 8.0 | | | | 21,135,018 | |
| Total | | | | | | | $281,388,976 | |
| * | Rounds to less than 0.1%. |
| (1) | Includes Money Market Funds and Investments of Cash Collateral Received for Securities on Loan. |
| | |
| Notes to Portfolio of Investments |
| (a) | At April 30, 2012, security was partially or fully on loan. |
| (b) | Non-income producing. |
| (c) | The rate shown is the seven-day current annualized yield at April 30, 2012. |
The accompanying Notes to Financial Statements are an integral part of this statement.
| | |
| 18 | | COLUMBIA MULTI-ADVISOR INTERNATIONAL VALUE FUND — 2012 SEMIANNUAL REPORT |
| | |
| Notes to Portfolio of Investments (continued) |
(d) Investments in affiliates during the period ended April 30, 2012:
| | | | | | | | | | | | | | | | | | | | | | | | | | | | |
| Issuer | | Beginning
Cost | | | Purchase
Cost | | | Sales Cost/
Proceeds
from Sales | | | Realized
Gain/Loss | | | Ending
Cost | | | Dividends
or
Interest
Income | | | Value | |
Columbia Short-Term Cash Fund | | | $4,331,412 | | | | $68,174,186 | | | | $(69,880,468 | ) | | | $— | | | | $2,625,130 | | | | $2,368 | | | | $2,625,130 | |
| (e) | The table below represents securities received as collateral for repurchase agreements. This collateral is deposited with the Fund’s custodian and, pursuant to the terms of the repurchase agreement, must have an aggregate value greater than or equal to the repurchase price plus accrued interest at all times. The value of securities and/or cash held as collateral for repurchase agreements is monitored on a daily basis to ensure the proper level of collateral. |
| | | | |
| Mizuho Securities USA, Inc. (0.240%) | | | | |
| |
| Security Description | | Value | |
| Fannie Mae REMICS | | | $ 2,530,245 | |
| Freddie Mac REMICS | | | 2,569,755 | |
| Total Market Value of Collateral Securities | | | $ 5,100,000 | |
| |
| Natixis Financial Products, Inc. (0.240%) | | | | |
| |
| Security Description | | Value | |
| Fannie Mae Pool | | | $ 70,679 | |
| Fannie Mae REMICS | | | 524,641 | |
| Fannie Mae Whole Loan | | | 16,483 | |
| Freddie Mac Gold Pool | | | 148,043 | |
| Freddie Mac Non Gold Pool | | | 38,299 | |
| Freddie Mac REMICS | | | 458,253 | |
| Government National Mortgage Association | | | 326,613 | |
| United States Treasury Note/Bond | | | 457,002 | |
| Total Market Value of Collateral Securities | | | $ 2,040,013 | |
| |
| Nomura Securities (0.240%) | | | | |
| |
| Security Description | | Value | |
| Fannie Mae Pool | | | $ 612,174 | |
| Freddie Mac Gold Pool | | | 703,185 | |
| Ginnie Mae II Pool | | | 1,744,641 | |
| Total Market Value of Collateral Securities | | | $ 3,060,000 | |
The accompanying Notes to Financial Statements are an integral part of this statement.
| | | | |
| COLUMBIA MULTI-ADVISOR INTERNATIONAL VALUE FUND — 2012 SEMIANNUAL REPORT | | | 19 | |
| | |
| Portfolio of Investments (continued) | | |
| | |
| Notes to Portfolio of Investments (continued) |
| | | | |
| |
| Pershing LLC (0.330%) | | | | |
| |
| Security Description | | Value | |
| Fannie Mae Pool | | | $ 829,994 | |
| Fannie Mae REMICS | | | 217,239 | |
| Fannie Mae-Aces | | | 23,840 | |
| Federal Farm Credit Bank | | | 150,688 | |
| Federal Home Loan Banks | | | 39,404 | |
| Federal Home Loan Mortgage Corp | | | 32,224 | |
| Federal National Mortgage Association | | | 45,639 | |
| Freddie Mac Coupon Strips | | | 31,482 | |
| Freddie Mac Gold Pool | | | 320,566 | |
| Freddie Mac Non Gold Pool | | | 120,863 | |
| Freddie Mac Reference REMIC | | | 38,436 | |
| Freddie Mac REMICS | | | 250,152 | |
| Ginnie Mae I Pool | | | 412,692 | |
| Ginnie Mae II Pool | | | 1,152,062 | |
| Government National Mortgage Association | | | 136,896 | |
| United States Treasury Note/Bond | | | 277,823 | |
| Total Market Value of Collateral Securities | | | $ 4,080,000 | |
| |
| UBS Securities LLC (0.210%) | | | | |
| |
| Security Description | | Value | |
| Fannie Mae Pool | | | $ 3,225,753 | |
| Freddie Mac Gold Pool | | | 1,374,333 | |
| Total Market Value of Collateral Securities | | | $ 4,600,086 | |
| | | | |
| Abbreviation Legend |
| ADR | | American Depositary Receipt |
| | | | |
| Currency Legend | | |
| AUD | | Australian Dollar |
| NZD | | New Zealand Dollar |
| USD | | US Dollar |
The accompanying Notes to Financial Statements are an integral part of this statement.
| | |
| 20 | | COLUMBIA MULTI-ADVISOR INTERNATIONAL VALUE FUND — 2012 SEMIANNUAL REPORT |
Generally accepted accounting principles (GAAP) require disclosure regarding the inputs and valuation techniques used to measure fair value and any changes in valuation inputs or techniques. In addition, investments shall be disclosed by major category.
The Fund categorizes its fair value measurements according to a three-level hierarchy that maximizes the use of observable inputs and minimizes the use of unobservable inputs by prioritizing that the most observable input be used when available. Observable inputs are those that market participants would use in pricing an investment based on market data obtained from sources independent of the reporting entity. Unobservable inputs are those that reflect the Fund’s assumptions about the information market participants would use in pricing an investment. An investment’s level within the fair value hierarchy is based on the lowest level of any input that is deemed significant to the asset or liability’s fair value measurement. The input levels are not necessarily an indication of the risk or liquidity associated with investments at that level. For example, certain U.S. government securities are generally high quality and liquid, however, they are reflected as Level 2 because the inputs used to determine fair value may not always be quoted prices in an active market.
Fair value inputs are summarized in the three broad levels listed below:
| | Ÿ | | Level 1 — Valuations based on quoted prices for investments in active markets that the Fund has the ability to access at the measurement date (including NAV for open-end mutual funds). Valuation adjustments are not applied to Level 1 investments. |
| | Ÿ | | Level 2 — Valuations based on other significant observable inputs (including quoted prices for similar securities, interest rates, prepayment speeds, credit risks, etc.). |
| | Ÿ | | Level 3 — Valuations based on significant unobservable inputs (including the Fund’s own assumptions and judgment in determining the fair value of investments). |
Inputs that are used in determining fair value of an investment may include price information, credit data, volatility statistics, and other factors. These inputs can be either observable or unobservable. The availability of observable inputs can vary between investments, and is affected by various factors such as the type of investment, and the volume and level of activity for that investment or similar investments in the marketplace. The inputs will be considered by the Investment Manager, along with any other relevant factors in the calculation of an investment’s fair value. The Fund uses prices and inputs that are current as of the measurement date, which may include periods of market dislocations. During these periods, the availability of prices and inputs may be reduced for many investments. This condition could cause an investment to be reclassified between the various levels within the hierarchy.
Foreign equity securities actively traded in markets where there is a significant delay in the local close relative to the New York Stock Exchange (NYSE) are classified as Level 2. The values of these securities may include an adjustment to reflect the impact of significant market movements following the close of local trading, as described in Note 2 to the financial statements – Security Valuation.
Investments falling into the Level 3 category are primarily supported by quoted prices from brokers and dealers participating in the market for those investments. However, these may be classified as Level 3 investments due to lack of market transparency and corroboration to support these quoted prices. Additionally, valuation models may be used as the pricing source for any remaining
The accompanying Notes to Financial Statements are an integral part of this statement.
| | | | |
| COLUMBIA MULTI-ADVISOR INTERNATIONAL VALUE FUND — 2012 SEMIANNUAL REPORT | | | 21 | |
| | |
| Portfolio of Investments (continued) | | |
| | |
| Fair Value Measurements (continued) |
investments classified as Level 3. These models rely on one or more significant unobservable inputs and/or significant assumptions by the Investment Manager. Inputs used in valuations may include, but are not limited to, financial statement analysis, capital account balances, discount rates and estimated cash flows, and comparable company data.
The following table is a summary of the inputs used to value the Fund’s investments as of April 30, 2012:
| | | | | | | | | | | | | | | | |
| | | Fair value at April 30, 2012 | |
| Description | | Level 1
Quoted Prices
in Active
Markets for
Identical Assets | | | Level 2
Other
Significant
Observable
Inputs | | | Level 3
Significant
Unobservable
Inputs | | | Total | |
| Equity Securities | | | | | | | | | | | | | | | | |
Common Stocks | | | | | | | | | | | | | | | | |
Consumer Discretionary | | | $2,282,582 | | | | $26,782,887 | | | | $— | | | | $29,065,469 | |
Consumer Staples | | | 840,596 | | | | 8,346,088 | | | | — | | | | 9,186,684 | |
Energy | | | 8,577,380 | | | | 25,694,646 | | | | — | | | | 34,272,026 | |
Financials | | | 8,357,344 | | | | 57,551,343 | | | | — | | | | 65,908,687 | |
Health Care | | | 1,660,237 | | | | 12,954,737 | | | | — | | | | 14,614,974 | |
Industrials | | | 627,496 | | | | 38,863,153 | | | | — | | | | 39,490,649 | |
Information Technology | | | 537,759 | | | | 13,388,509 | | | | — | | | | 13,926,268 | |
Materials | | | 4,438,874 | | | | 23,867,217 | | | | — | | | | 28,306,091 | |
Telecommunication Services | | | 2,990,102 | | | | 13,648,949 | | | | — | | | | 16,639,051 | |
Utilities | | | 715,683 | | | | 8,023,306 | | | | — | | | | 8,738,989 | |
Rights | | | | | | | | | | | | | | | | |
Financials | | | — | | | | 105,070 | | | | — | | | | 105,070 | |
| Total Equity Securities | | | 31,028,053 | | | | 229,225,905 | | | | — | | | | 260,253,958 | |
| Other | | | | | | | | | | | | | | | | |
Money Market Funds | | | 2,625,130 | | | | — | | | | — | | | | 2,625,130 | |
Investments of Cash Collateral Received for Securities on Loan | | | — | | | | 18,509,888 | | | | — | | | | 18,509,888 | |
| Total Other | | | 2,625,130 | | | | 18,509,888 | | | | — | | | | 21,135,018 | |
| Investments in Securities | | | 33,653,183 | | | | 247,735,793 | | | | — | | | | 281,388,976 | |
| Derivatives | | | | | | | | | | | | | | | | |
Liabilities | | | | | | | | | | | | | | | | |
Forward Foreign Currency
Exchange Contracts | | | — | | | | (22,413 | ) | | | — | | | | (22,413 | ) |
| Total | | | $33,653,183 | | | | $247,713,380 | | | | $— | | | | $281,366,563 | |
See the Portfolio of Investments for all investment classifications not indicated in the table.
The Fund’s assets assigned to the Level 2 input category are generally valued using the market approach, in which a security’s value is determined through reference to prices and information from market transactions for similar or identical assets. These assets include certain foreign securities for which a third party statistical pricing service may be employed for purposes of fair market valuation. The models utilized by the third party statistical pricing service take into account a security’s correlation to available market data including, but not limited to, intraday index, ADR, and ETF movements.
The accompanying Notes to Financial Statements are an integral part of this statement.
| | |
| 22 | | COLUMBIA MULTI-ADVISOR INTERNATIONAL VALUE FUND — 2012 SEMIANNUAL REPORT |
| | |
| Fair Value Measurements (continued) |
There were no transfers of financial assets between Levels 1 and 2 during the period.
Derivative instruments are valued at unrealized appreciation (depreciation).
How to find information about the Fund’s quarterly portfolio holdings
| (i) | The Fund files its complete schedule of portfolio holdings with the Securities and Exchange Commission (SEC) for the first and third quarters of each fiscal year on Form N-Q; |
| (ii) | The Fund’s Forms N-Q are available on the SEC’s website at www.sec.gov; |
| (iii) | The Fund’s Forms N-Q may be reviewed and copied at the SEC’s Public Reference Room in Washington, DC (information on the operations of the Public Reference Room may be obtained by calling 800.SEC.0330); and |
| (iv) | The Fund’s complete schedule of portfolio holdings, as filed on Form N-Q, can be obtained without charge, upon request, by calling 800.345.6611. |
The accompanying Notes to Financial Statements are an integral part of this statement.
| | | | |
| COLUMBIA MULTI-ADVISOR INTERNATIONAL VALUE FUND — 2012 SEMIANNUAL REPORT | | | 23 | |
| | |
| Statement of Assets and Liabilities | | |
April 30, 2012 (Unaudited)
| | | | | |
Assets | | | | | |
Investments, at value* | | | | | |
Unaffiliated issuers (identified cost $253,107,842) | | | $ | 260,253,958 | |
Affiliated issuers (identified cost $2,625,130) | | | | 2,625,130 | |
Investment of cash collateral received for securities on loan | | | | | |
Repurchase agreements (identified cost $18,509,888) | | | | 18,509,888 | |
Total investments (identified cost $274,242,860) | | | | 281,388,976 | |
Cash | | | | 226,946 | |
Receivable for: | | | | | |
Investments sold | | | | 5,373,728 | |
Capital shares sold | | | | 70,146 | |
Dividends | | | | 1,378,114 | |
Interest | | | | 44,511 | |
Reclaims | | | | 362,453 | |
Expense reimbursement due from Investment Manager | | | | 5,822 | |
Prepaid expense | | | | 831 | |
Total assets | | | | 288,851,527 | |
Liabilities | | | | | |
Foreign currency (cost $677,525) | | | | 677,349 | |
Due upon return of securities on loan | | | | 18,509,888 | |
Unrealized depreciation on forward foreign currency exchange contracts | | | | 22,413 | |
Payable for: | | | | | |
Investments purchased | | | | 5,521,586 | |
Capital shares purchased | | | | 453,184 | |
Foreign capital gains taxes deferred | | | | 943 | |
Investment management fees | | | | 19,563 | |
Distribution fees | | | | 6,984 | |
Transfer agent fees | | | | 75,343 | |
Administration fees | | | | 1,742 | |
Plan administration fees | | | | 4 | |
Compensation of board members | | | | 29,087 | |
Other expenses | | | | 77,023 | |
Other liabilities | | | | 3,632 | |
Total liabilities | | | | 25,398,741 | |
Net assets applicable to outstanding capital stock | | | $ | 263,452,786 | |
The accompanying Notes to Financial Statements are an integral part of this statement.
| | |
| 24 | | COLUMBIA MULTI-ADVISOR INTERNATIONAL VALUE FUND — 2012 SEMIANNUAL REPORT |
April 30, 2012 (Unaudited)
| | | | | |
Represented by | | | | | |
Paid-in capital | | | $ | 603,629,378 | |
Excess of distributions over net investment income | | | | (294,297 | ) |
Accumulated net realized loss | | | | (347,033,847 | ) |
Unrealized appreciation (depreciation) on: | | | | | |
Investments | | | | 7,146,116 | |
Foreign currency translations | | | | 28,792 | |
Forward foreign currency exchange contracts | | | | (22,413 | ) |
Foreign capital gains tax | | | | (943 | ) |
Total — representing net assets applicable to outstanding capital stock | | | $ | 263,452,786 | |
*Value of securities on loan | | | $ | 18,241,743 | |
Net assets applicable to outstanding shares | | | | | |
Class A | | | $ | 238,184,627 | |
Class B | | | $ | 19,817,571 | |
Class C | | | $ | 5,138,907 | |
Class I | | | $ | 7,365 | |
Class R4 | | | $ | 214,432 | |
Class Z | | | $ | 89,884 | |
Shares outstanding | | | | | |
Class A | | | | 45,903,633 | |
Class B | | | | 4,028,222 | |
Class C | | | | 1,059,188 | |
Class I | | | | 1,387 | |
Class R4 | | | | 40,547 | |
Class Z | | | | 16,965 | |
Net asset value per share | | | | | |
Class A(a) | | | $ | 5.19 | |
Class B | | | $ | 4.92 | |
Class C | | | $ | 4.85 | |
Class I | | | $ | 5.31 | |
Class R4 | | | $ | 5.29 | |
Class Z | | | $ | 5.30 | |
| (a) | The maximum offering price per share for Class A is $5.51. The offering price is calculated by dividing the net asset value by 1.0 minus the maximum sales charge of 5.75%. |
The accompanying Notes to Financial Statements are an integral part of this statement.
| | | | |
| COLUMBIA MULTI-ADVISOR INTERNATIONAL VALUE FUND — 2012 SEMIANNUAL REPORT | | | 25 | |
Six months ended April 30, 2012 (Unaudited)
| | | | | |
Net investment income | |
Income: | | | | | |
Dividends | | | $ | 4,369,737 | |
Interest | | | | 113 | |
Dividends from affiliates | | | | 2,368 | |
Income from securities lending — net | | | | 152,093 | |
Foreign taxes withheld | | | | (465,030 | ) |
Total income | | | | 4,059,281 | |
Expenses: | | | | | |
Investment management fees | | | | 1,275,867 | |
Distribution fees | | | | | |
Class A | | | | 322,144 | |
Class B | | | | 105,415 | |
Class C | | | | 27,143 | |
Transfer agent fees | | | | | |
Class A | | | | 548,675 | |
Class B | | | | 44,748 | |
Class C | | | | 11,503 | |
Class R4 | | | | 52 | |
Class Z | | | | 142 | |
Administration fees | | | | 113,807 | |
Plan administration fees | | | | | |
Class R4 | | | | 267 | |
Compensation of board members | | | | 8,493 | |
Custodian fees | | | | 54,674 | |
Printing and postage fees | | | | 60,999 | |
Registration fees | | | | 33,349 | |
Professional fees | | | | 22,425 | |
Other | | | | 22,545 | |
Total expenses | | | | 2,652,248 | |
Fees waived or expenses reimbursed by Investment Manager and its affiliates | | | | (385,357 | ) |
Total net expenses | | | | 2,266,891 | |
Net investment income | | | | 1,792,390 | |
The accompanying Notes to Financial Statements are an integral part of this statement.
| | |
| 26 | | COLUMBIA MULTI-ADVISOR INTERNATIONAL VALUE FUND — 2012 SEMIANNUAL REPORT |
| | | | | |
Realized and unrealized gain (loss) — net | |
Net realized gain (loss) on: | | | | | |
Investments | | | $ | (18,962,090 | ) |
Foreign currency translations | | | | (323,876 | ) |
Forward foreign currency exchange contracts | | | | 152,150 | |
Futures contracts | | | | 143,667 | |
Net realized loss | | | | (18,990,149 | ) |
Net change in unrealized appreciation (depreciation) on: | | | | | |
Investments | | | | 15,429,144 | |
Foreign currency translations | | | | (2,003 | ) |
Forward foreign currency exchange contracts | | | | 65,458 | |
Futures contracts | | | | (181,128 | ) |
Foreign capital gains tax | | | | 3,413 | |
Net change in unrealized appreciation | | | | 15,314,884 | |
Net realized and unrealized loss | | | | (3,675,265 | ) |
Net decrease in net assets from operations | | | $ | (1,882,875 | ) |
The accompanying Notes to Financial Statements are an integral part of this statement.
| | | | |
| COLUMBIA MULTI-ADVISOR INTERNATIONAL VALUE FUND — 2012 SEMIANNUAL REPORT | | | 27 | |
| | |
| Statement of Changes in Net Assets | | |
| | | | | | | | | | |
| | | Six months ended
April 30, 2012 | | Year ended
October 31, 2011 |
| | | (Unaudited) | | |
Operations | |
Net investment income | | | $ | 1,792,390 | | | | $ | 8,743,336 | |
Net realized gain (loss) | | | | (18,990,149 | ) | | | | 26,337,674 | |
Net change in unrealized appreciation (depreciation) | | | | 15,314,884 | | | | | (57,378,899 | ) |
Net decrease in net assets resulting from operations | | | | (1,882,875 | ) | | | | (22,297,889 | ) |
Distributions to shareholders from: | | | | | | | | | | |
Net investment income | | | | | | | | | | |
Class A | | | | (8,809,021 | ) | | | | (12,527,546 | ) |
Class B | | | | (458,582 | ) | | | | (998,877 | ) |
Class C | | | | (145,101 | ) | | | | (220,987 | ) |
Class I | | | | (299 | ) | | | | (6,811,007 | ) |
Class R4 | | | | (7,634 | ) | | | | (12,836 | ) |
Class Z | | | | (2,110 | ) | | | | (93 | ) |
Total distributions to shareholders | | | | (9,422,747 | ) | | | | (20,571,346 | ) |
Decrease in net assets from share transactions | | | | (41,901,379 | ) | | | | (311,771,877 | ) |
Total decrease in net assets | | | | (53,207,001 | ) | | | | (354,641,112 | ) |
Net assets at beginning of period | | | | 316,659,787 | | | | | 671,300,899 | |
Net assets at end of period | | | $ | 263,452,786 | | | | $ | 316,659,787 | |
Undistributed (excess of distributions over) net investment income | | | $ | (294,297 | ) | | | $ | 7,336,060 | |
The accompanying Notes to Financial Statements are an integral part of this statement.
| | |
| 28 | | COLUMBIA MULTI-ADVISOR INTERNATIONAL VALUE FUND — 2012 SEMIANNUAL REPORT |
| | | | | | | | | | | | | | | | |
| | | Six months ended
April 30, 2012
(Unaudited) | | | Year ended
October 31, 2011 | |
| | | Shares | | | Dollars ($) | | | Shares | | | Dollars ($) | |
Capital stock activity | | | | | | | | | | | | | | | | |
Class A shares | | | | | | | | | | | | | | | | |
Subscriptions | | | 766,600 | | | | 3,973,147 | | | | 1,878,203 | | | | 11,320,549 | |
Conversions from Class B | | | 524 | | | | 2,582 | | | | 1,978,888 | | | | 12,091,029 | |
Distributions reinvested | | | 1,755,689 | | | | 8,462,423 | | | | 2,000,699 | | | | 11,984,187 | |
Redemptions | | | (9,868,675 | ) | | | (51,249,784 | ) | | | (22,281,486 | ) | | | (134,506,798 | ) |
Net decrease | | | (7,345,862 | ) | | | (38,811,632 | ) | | | (16,423,696 | ) | | | (99,111,033 | ) |
Class B shares | | | | | | | | | | | | | | | | |
Subscriptions | | | 15,736 | | | | 77,284 | | | | 63,365 | | | | 358,914 | |
Distributions reinvested | | | 97,261 | | | | 445,457 | | | | 171,626 | | | | 973,120 | |
Conversions to Class A | | | (558 | ) | | | (2,582 | ) | | | (2,099,138 | ) | | | (12,091,029 | ) |
Redemptions | | | (627,863 | ) | | | (3,090,038 | ) | | | (1,991,636 | ) | | | (11,395,860 | ) |
Net decrease | | | (515,424 | ) | | | (2,569,879 | ) | | | (3,855,783 | ) | | | (22,154,855 | ) |
Class C shares | | | | | | | | | | | | | | | | |
Subscriptions | | | 33,084 | | | | 160,523 | | | | 88,817 | | | | 499,657 | |
Distributions reinvested | | | 30,557 | | | | 138,119 | | | | 37,292 | | | | 209,578 | |
Redemptions | | | (176,875 | ) | | | (859,822 | ) | | | (563,600 | ) | | | (3,190,086 | ) |
Net decrease | | | (113,234 | ) | | | (561,180 | ) | | | (437,491 | ) | | | (2,480,851 | ) |
Class I shares | | | | | | | | | | | | | | | | |
Subscriptions | | | — | | | | — | | | | 856,013 | | | | 5,431,784 | |
Distributions reinvested | | | — | | | | — | | | | 1,111,042 | | | | 6,810,686 | |
Redemptions | | | — | | | | — | | | | (31,445,200 | ) | | | (200,189,095 | ) |
Net decrease | | | — | | | | — | | | | (29,478,145 | ) | | | (187,946,625 | ) |
Class R4 shares | | | | | | | | | | | | | | | | |
Subscriptions | | | — | | | | — | | | | 569 | | | | 3,539 | |
Distributions reinvested | | | 1,518 | | | | 7,452 | | | | 2,072 | | | | 12,640 | |
Redemptions | | | (358 | ) | | | (1,980 | ) | | | (24,714 | ) | | | (157,566 | ) |
Net increase (decrease) | | | 1,160 | | | | 5,472 | | | | (22,073 | ) | | | (141,387 | ) |
Class Z shares | | | | | | | | | | | | | | | | |
Subscriptions | | | 11,854 | | | | 62,014 | | | | 12,144 | | | | 78,648 | |
Distributions reinvested | | | 340 | | | | 1,673 | | | | — | | | | — | |
Redemptions | | | (5,321 | ) | | | (27,847 | ) | | | (2,463 | ) | | | (15,774 | ) |
Net increase | | | 6,873 | | | | 35,840 | | | | 9,681 | | | | 62,874 | |
Total net decrease | | | (7,966,487 | ) | | | (41,901,379 | ) | | | (50,207,507 | ) | | | (311,771,877 | ) |
The accompanying Notes to Financial Statements are an integral part of this statement.
| | | | |
| COLUMBIA MULTI-ADVISOR INTERNATIONAL VALUE FUND — 2012 SEMIANNUAL REPORT | | | 29 | |
The following tables are intended to help you understand the Fund’s financial performance. Certain information reflects financial results for a single share of a class held for the periods shown. Per share net investment income (loss) amounts are calculated based on average shares outstanding during the period. Total returns assume reinvestment of all dividends and distributions. Total returns do not reflect payment of sales charges, if any, and are not annualized for periods of less than one year.
| | | | | | | | | | | | | | | | | | | | | | | | | | | | | | |
| | | Six months
ended April 30, 2012 | | Year ended Oct. 31, |
| | | | 2011 | | 2010 | | 2009 | | 2008 | | 2007 |
| | | (Unaudited) | | | | | | | | | | |
Class A | | | | | | | | | | | | | | | | | | | | | | | | | | | | | | |
Per share data | | | | | | | | | | | | | | | | | | | | | | | | | | | | | | |
Net asset value, beginning of period | | | | $5.40 | | | | | $6.13 | | | | | $5.67 | | | | | $5.02 | | | | | $12.14 | | | | | $11.00 | |
Income from investment operations: | | | | | | | | | | | | | | | | | | | | | | | | | | | | | | |
Net investment income | | | | 0.03 | | | | | 0.09 | | | | | 0.08 | | | | | 0.08 | | | | | 0.22 | | | | | 0.18 | |
Net realized and unrealized gain (loss) | | | | (0.07 | ) | | | | (0.63 | ) | | | | 0.50 | | | | | 1.04 | | | | | (6.16 | ) | | | | 2.10 | |
Total from investment operations | | | | (0.04 | ) | | | | (0.54 | ) | | | | 0.58 | | | | | 1.12 | | | | | (5.94 | ) | | | | 2.28 | |
Less distributions to shareholders from: | | | | | | | | | | | | | | | | | | | | | | | | | | | | | | |
Net investment income | | | | (0.17 | ) | | | | (0.19 | ) | | | | (0.12 | ) | | | | — | | | | | — | | | | | (0.13 | ) |
Net realized gains | | | | — | | | | | — | | | | | — | | | | | (0.47 | ) | | | | (1.18 | ) | | | | (1.01 | ) |
Total distributions to shareholders | | | | (0.17 | ) | | | | (0.19 | ) | | | | (0.12 | ) | | | | (0.47 | ) | | | | (1.18 | ) | | | | (1.14 | ) |
Net asset value, end of period | | | | $5.19 | | | | | $5.40 | | | | | $6.13 | | | | | $5.67 | | | | | $5.02 | | | | | $12.14 | |
Total return | | | | (0.41% | ) | | | | (9.12% | ) | | | | 10.36% | | | | | 24.97% | (a) | | | | (53.60% | ) | | | | 22.31% | |
Ratios to average net assets(b) | | | | | | | | | | | | | | | | | | | | | | | | | | | | | | |
Expenses prior to fees waived or expenses reimbursed | | | | 1.80% | (c) | | | | 1.63% | | | | | 1.57% | | | | | 1.48% | | | | | 1.29% | | | | | 1.38% | |
Net expenses after fees waived or expenses reimbursed(d) | | | | 1.53% | (c) | | | | 1.63% | (e) | | | | 1.57% | | | | | 1.48% | | | | | 1.29% | | | | | 1.38% | |
Net investment income | | | | 1.33% | (c) | | | | 1.50% | (e) | | | | 1.37% | | | | | 1.73% | | | | | 2.42% | | | | | 1.54% | |
Supplemental data | | | | | | | | | | | | | | | | | | | | | | | | | | | | | | |
Net assets, end of period (in thousands) | | | | $238,185 | | | | | $287,441 | | | | | $427,389 | | | | | $710,323 | | | | | $659,381 | | | | | $2,032,189 | |
Portfolio turnover | | | | 62% | | | | | 21% | | | | | 34% | | | | | 63% | | | | | 40% | | | | | 28% | |
Notes to Financial Highlights
| (a) | During the year ended October 31, 2009, the Investment Manager reimbursed the Fund for a loss on a trading error. Had the Fund not received this reimbursement, total return would have been lower by 0.08%. |
| (b) | In addition to the fees and expenses which the Fund bears directly, the Fund indirectly bears a pro rata share of the fees and expenses of the acquired funds in which it invests. Such indirect expenses are not included in the reported expense ratios. |
| (d) | The Investment Manager and certain of its affiliates agreed to waive/reimburse certain fees and expenses, if applicable. |
| (e) | The benefits derived from expense reductions had an impact of less than 0.01%. |
The accompanying Notes to Financial Statements are an integral part of this statement.
| | |
| 30 | | COLUMBIA MULTI-ADVISOR INTERNATIONAL VALUE FUND — 2012 SEMIANNUAL REPORT |
| | | | | | | | | | | | | | | | | | | | | | | | | | | | | | |
| | | Six months
ended April 30, 2012 | | Year ended Oct. 31, |
| | | | 2011 | | 2010 | | 2009 | | 2008 | | 2007 |
| | | (Unaudited) | | | | | | | | | | |
Class B | | | | | | | | | | | | | | | | | | | | | | | | | | | | | | |
Per share data | | | | | | | | | | | | | | | | | | | | | | | | | | | | | | |
Net asset value, beginning of period | | | | $5.07 | | | | | $5.75 | | | | | $5.32 | | | | | $4.78 | | | | | $11.69 | | | | | $10.63 | |
Income from investment operations: | | | | | | | | | | | | | | | | | | | | | | | | | | | | | | |
Net investment income | | | | 0.01 | | | | | 0.05 | | | | | 0.03 | | | | | 0.05 | | | | | 0.15 | | | | | 0.09 | |
Net realized and unrealized gain (loss) | | | | (0.06 | ) | | | | (0.61 | ) | | | | 0.48 | | | | | 0.96 | | | | | (5.88 | ) | | | | 2.03 | |
Total from investment operations | | | | (0.05 | ) | | | | (0.56 | ) | | | | 0.51 | | | | | 1.01 | | | | | (5.73 | ) | | | | 2.12 | |
Less distributions to shareholders from: | | | | | | | | | | | | | | | | | | | | | | | | | | | | | | |
Net investment income | | | | (0.10 | ) | | | | (0.12 | ) | | | | (0.08 | ) | | | | — | | | | | — | | | | | (0.05 | ) |
Net realized gains | | | | — | | | | | — | | | | | — | | | | | (0.47 | ) | | | | (1.18 | ) | | | | (1.01 | ) |
Total distributions to shareholders | | | | (0.10 | ) | | | | (0.12 | ) | | | | (0.08 | ) | | | | (0.47 | ) | | | | (1.18 | ) | | | | (1.06 | ) |
Net asset value, end of period | | | | $4.92 | | | | | $5.07 | | | | | $5.75 | | | | | $5.32 | | | | | $4.78 | | | | | $11.69 | |
Total return | | | | (0.74% | ) | | | | (9.90% | ) | | | | 9.63% | | | | | 23.82% | (a) | | | | (53.90% | ) | | | | 21.37% | |
Ratios to average net assets(b) | | | | | | | | | | | | | | | | | | | | | | | | | | | | | | |
Expenses prior to fees waived or expenses reimbursed | | | | 2.55% | (c) | | | | 2.38% | | | | | 2.35% | | | | | 2.25% | | | | | 2.05% | | | | | 2.14% | |
Net expenses after fees waived or expenses reimbursed(d) | | | | 2.28% | (c) | | | | 2.38% | (e) | | | | 2.35% | | | | | 2.25% | | | | | 2.05% | | | | | 2.14% | |
Net investment income | | | | 0.59% | (c) | | | | 0.84% | (e) | | | | 0.62% | | | | | 1.03% | | | | | 1.69% | | | | | 0.80% | |
Supplemental data | | | | | | | | | | | | | | | | | | | | | | | | | | | | | | |
Net assets, end of period (in thousands) | | | | $19,818 | | | | | $23,042 | | | | | $48,327 | | | | | $80,458 | | | | | $112,548 | | | | | $394,631 | |
Portfolio turnover | | | | 62% | | | | | 21% | | | | | 34% | | | | | 63% | | | | | 40% | | | | | 28% | |
Notes to Financial Highlights
| (a) | During the year ended October 31, 2009, the Investment Manager reimbursed the Fund for a loss on a trading error. Had the Fund not received this reimbursement, total return would have been lower by 0.08%. |
| (b) | In addition to the fees and expenses which the Fund bears directly, the Fund indirectly bears a pro rata share of the fees and expenses of the acquired funds in which it invests. Such indirect expenses are not included in the reported expense ratios. |
| (d) | The Investment Manager and certain of its affiliates agreed to waive/reimburse certain fees and expenses, if applicable. |
| (e) | The benefits derived from expense reductions had an impact of less than 0.01%. |
The accompanying Notes to Financial Statements are an integral part of this statement.
| | | | |
| COLUMBIA MULTI-ADVISOR INTERNATIONAL VALUE FUND — 2012 SEMIANNUAL REPORT | | | 31 | |
| | |
| Financial Highlights (continued) | | |
| | | | | | | | | | | | | | | | | | | | | | | | | | | | | | |
| | | Six months
ended April 30, 2012 | | Year ended Oct. 31, |
| | | | 2011 | | 2010 | | 2009 | | 2008 | | 2007 |
| | | (Unaudited) | | | | | | | | | | |
Class C | | | | | | | | | | | | | | | | | | | | | | | | | | | | | | |
Per share data | | | | | | | | | | | | | | | | | | | | | | | | | | | | | | |
Net asset value, beginning of period | | | | $5.03 | | | | | $5.73 | | | | | $5.31 | | | | | $4.76 | | | | | $11.66 | | | | | $10.62 | |
Income from investment operations: | | | | | | | | | | | | | | | | | | | | | | | | | | | | | | |
Net investment income | | | | 0.01 | | | | | 0.04 | | | | | 0.03 | | | | | 0.04 | | | | | 0.14 | | | | | 0.09 | |
Net realized and unrealized gain (loss) | | | | (0.06 | ) | | | | (0.59 | ) | | | | 0.48 | | | | | 0.98 | | | | | (5.86 | ) | | | | 2.03 | |
Total from investment operations | | | | (0.05 | ) | | | | (0.55 | ) | | | | 0.51 | | | | | 1.02 | | | | | (5.72 | ) | | | | 2.12 | |
Less distributions to shareholders from: | | | | | | | | | | | | | | | | | | | | | | | | | | | | | | |
Net investment income | | | | (0.13 | ) | | | | (0.15 | ) | | | | (0.09 | ) | | | | — | | | | | — | | | | | (0.07 | ) |
Net realized gains | | | | — | | | | | — | | | | | — | | | | | (0.47 | ) | | | | (1.18 | ) | | | | (1.01 | ) |
Total distributions to shareholders | | | | (0.13 | ) | | | | (0.15 | ) | | | | (0.09 | ) | | | | (0.47 | ) | | | | (1.18 | ) | | | | (1.08 | ) |
Net asset value, end of period | | | | $4.85 | | | | | $5.03 | | | | | $5.73 | | | | | $5.31 | | | | | $4.76 | | | | | $11.66 | |
Total return | | | | (0.83% | ) | | | | (9.94% | ) | | | | 9.66% | | | | | 24.14% | (a) | | | | (53.96% | ) | | | | 21.35% | |
Ratios to average net assets(b) | | | | | | | | | | | | | | | | | | | | | | | | | | | | | | |
Expenses prior to fees waived or
expenses reimbursed | | | | 2.55% | (c) | | | | 2.38% | | | | | 2.33% | | | | | 2.24% | | | | | 2.04% | | | | | 2.13% | |
Net expenses after fees waived or
expenses reimbursed(d) | | | | 2.27% | (c) | | | | 2.38% | (e) | | | | 2.33% | | | | | 2.24% | | | | | 2.04% | | | | | 2.13% | |
Net investment income | | | | 0.60% | (c) | | | | 0.76% | (e) | | | | 0.60% | | | | | 1.01% | | | | | 1.68% | | | | | 0.82% | |
Supplemental data | | | | | | | | | | | | | | | | | | | | | | | | | | | | | | |
Net assets, end of period (in thousands) | | | | $5,139 | | | | | $5,896 | | | | | $9,218 | | | | | $10,917 | | | | | $12,610 | | | | | $37,691 | |
Portfolio turnover | | | | 62% | | | | | 21% | | | | | 34% | | | | | 63% | | | | | 40% | | | | | 28% | |
Notes to Financial Highlights
| (a) | During the year ended October 31, 2009, the Investment Manager reimbursed the Fund for a loss on a trading error. Had the Fund not received this reimbursement, total return would have been lower by 0.08%. |
| (b) | In addition to the fees and expenses which the Fund bears directly, the Fund indirectly bears a pro rata share of the fees and expenses of the acquired funds in which it invests. Such indirect expenses are not included in the reported expense ratios. |
| (d) | The Investment Manager and certain of its affiliates agreed to waive/reimburse certain fees and expenses, if applicable. |
| (e) | The benefits derived from expense reductions had an impact of less than 0.01%. |
The accompanying Notes to Financial Statements are an integral part of this statement.
| | |
| 32 | | COLUMBIA MULTI-ADVISOR INTERNATIONAL VALUE FUND — 2012 SEMIANNUAL REPORT |
| | | | | | | | | | | | | | | | | | | | | | | | | | | | | | |
| | | Six months
ended April 30, 2012 | | Year ended Oct. 31, |
| | | | 2011 | | 2010 | | 2009 | | 2008 | | 2007 |
| | | (Unaudited) | | | | | | | | | | |
Class I | | | | | | | | | | | | | | | | | | | | | | | | | | | | | | |
Per share data | | | | | | | | | | | | | | | | | | | | | | | | | | | | | | |
Net asset value, beginning of period | | | | $5.55 | | | | | $6.31 | | | | | $5.83 | | | | | $5.12 | | | | | $12.30 | | | | | $11.13 | |
Income from investment operations: | | | | | | | | | | | | | | | | | | | | | | | | | | | | | | |
Net investment income | | | | 0.05 | | | | | 0.15 | | | | | 0.11 | | | | | 0.12 | | | | | 0.27 | | | | | 0.26 | |
Net realized and unrealized gain (loss) | | | | (0.07 | ) | | | | (0.68 | ) | | | | 0.53 | | | | | 1.06 | | | | | (6.27 | ) | | | | 2.09 | |
Total from investment operations | | | | (0.02 | ) | | | | (0.53 | ) | | | | 0.64 | | | | | 1.18 | | | | | (6.00 | ) | | | | 2.35 | |
Less distributions to shareholders from: | | | | | | | | | | | | | | | | | | | | | | | | | | | | | | |
Net investment income | | | | (0.22 | ) | | | | (0.23 | ) | | | | (0.16 | ) | | | | — | | | | | — | | | | | (0.17 | ) |
Net realized gains | | | | — | | | | | — | | | | | — | | | | | (0.47 | ) | | | | (1.18 | ) | | | | (1.01 | ) |
Total distributions to shareholders | | | | (0.22 | ) | | | | (0.23 | ) | | | | (0.16 | ) | | | | (0.47 | ) | | | | (1.18 | ) | | | | (1.18 | ) |
Net asset value, end of period | | | | $5.31 | | | | | $5.55 | | | | | $6.31 | | | | | $5.83 | | | | | $5.12 | | | | | $12.30 | |
Total return | | | | (0.13% | ) | | | | (8.72% | ) | | | | 11.25% | | | | | 25.72% | (a) | | | | (53.37% | ) | | | | 22.79% | |
Ratios to average net assets(b) | | | | | | | | | | | | | | | | | | | | | | | | | | | | | | |
Expenses prior to fees waived or expenses reimbursed | | | | 1.13% | (c) | | | | 1.00% | | | | | 0.95% | | | | | 0.83% | | | | | 0.84% | | | | | 0.97% | |
Net expenses after fees waived or expenses reimbursed(d) | | | | 1.05% | (c) | | | | 1.00% | | | | | 0.95% | | | | | 0.83% | | | | | 0.84% | | | | | 0.97% | |
Net investment income | | | | 1.85% | (c) | | | | 2.31% | | | | | 1.96% | | | | | 2.49% | | | | | 3.02% | | | | | 2.18% | |
Supplemental data | | | | | | | | | | | | | | | | | | | | | | | | | | | | | | |
Net assets, end of period (in thousands) | | | | $7 | | | | | $8 | | | | | $185,979 | | | | | $182,889 | | | | | $95,736 | | | | | $196,111 | |
Portfolio turnover | | | | 62% | | | | | 21% | | | | | 34% | | | | | 63% | | | | | 40% | | | | | 28% | |
Notes to Financial Highlights
| (a) | During the year ended October 31, 2009, the Investment Manager reimbursed the Fund for a loss on a trading error. Had the Fund not received this reimbursement, total return would have been lower by 0.08%. |
| (b) | In addition to the fees and expenses which the Fund bears directly, the Fund indirectly bears a pro rata share of the fees and expenses of the acquired funds in which it invests. Such indirect expenses are not included in the reported expense ratios. |
| (d) | The Investment Manager and certain of its affiliates agreed to waive/reimburse certain fees and expenses, if applicable. |
The accompanying Notes to Financial Statements are an integral part of this statement.
| | | | |
| COLUMBIA MULTI-ADVISOR INTERNATIONAL VALUE FUND — 2012 SEMIANNUAL REPORT | | | 33 | |
| | |
| Financial Highlights (continued) | | |
| | | | | | | | | | | | | | | | | | | | | | | | | | | | | | |
| | | Six months
ended April 30, 2012 | | Year ended Oct. 31, |
| | | | 2011 | | 2010 | | 2009 | | 2008 | | 2007 |
| | | (Unaudited) | | | | | | | | | | |
Class R4 | | | | | | | | | | | | | | | | | | | | | | | | | | | | | | |
Per share data | | | | | | | | | | | | | | | | | | | | | | | | | | | | | | |
Net asset value, beginning of period | | | | $5.51 | | | | | $6.26 | | | | | $5.80 | | | | | $5.10 | | | | | $12.23 | | | | | $11.08 | |
Income from investment operations: | | | | | | | | | | | | | | | | | | | | | | | | | | | | | | |
Net investment income | | | | 0.04 | | | | | 0.12 | | | | | 0.10 | | | | | 0.10 | | | | | 0.25 | | | | | 0.19 | |
Net realized and unrealized gain (loss) | | | | (0.07 | ) | | | | (0.66 | ) | | | | 0.51 | | | | | 1.07 | | | | | (6.20 | ) | | | | 2.12 | |
Total from investment operations | | | | (0.03 | ) | | | | (0.54 | ) | | | | 0.61 | | | | | 1.17 | | | | | (5.95 | ) | | | | 2.31 | |
Less distributions to shareholders from: | | | | | | | | | | | | | | | | | | | | | | | | | | | | | | |
Net investment income | | | | (0.19 | ) | | | | (0.21 | ) | | | | (0.15 | ) | | | | — | | | | | — | | | | | (0.15 | ) |
Net realized gains | | | | — | | | | | — | | | | | — | | | | | (0.47 | ) | | | | (1.18 | ) | | | | (1.01 | ) |
Total distributions to shareholders | | | | (0.19 | ) | | | | (0.21 | ) | | | | (0.15 | ) | | | | (0.47 | ) | | | | (1.18 | ) | | | | (1.16 | ) |
Net asset value, end of period | | | | $5.29 | | | | | $5.51 | | | | | $6.26 | | | | | $5.80 | | | | | $5.10 | | | | | $12.23 | |
Total return | | | | (0.20% | ) | | | | (8.97% | ) | | | | 10.77% | | | | | 25.61% | (a) | | | | (53.27% | ) | | | | 22.42% | |
Ratios to average net assets(b) | | | | | | | | | | | | | | | | | | | | | | | | | | | | | | |
Expenses prior to fees waived or expenses reimbursed | | | | 1.42% | (c) | | | | 1.31% | | | | | 1.27% | | | | | 1.14% | | | | | 1.13% | | | | | 1.26% | |
Net expenses after fees waived or expenses reimbursed(d) | | | | 1.34% | (c) | | | | 1.31% | | | | | 1.27% | | | | | 1.00% | | | | | 0.87% | | | | | 1.26% | |
Net investment income | | | | 1.57% | (c) | | | | 1.85% | | | | | 1.67% | | | | | 2.14% | | | | | 2.75% | | | | | 1.68% | |
Supplemental data | | | | | | | | | | | | | | | | | | | | | | | | | | | | | | |
Net assets, end of period (in thousands) | | | | $214 | | | | | $217 | | | | | $385 | | | | | $493 | | | | | $558 | | | | | $2,167 | |
Portfolio turnover | | | | 62% | | | | | 21% | | | | | 34% | | | | | 63% | | | | | 40% | | | | | 28% | |
Notes to Financial Highlights
| (a) | During the year ended October 31, 2009, the Investment Manager reimbursed the Fund for a loss on a trading error. Had the Fund not received this reimbursement, total return would have been lower by 0.08%. |
| (b) | In addition to the fees and expenses which the Fund bears directly, the Fund indirectly bears a pro rata share of the fees and expenses of the acquired funds in which it invests. Such indirect expenses are not included in the reported expense ratios. |
| (d) | The Investment Manager and certain of its affiliates agreed to waive/reimburse certain fees and expenses, if applicable. |
The accompanying Notes to Financial Statements are an integral part of this statement.
| | |
| 34 | | COLUMBIA MULTI-ADVISOR INTERNATIONAL VALUE FUND — 2012 SEMIANNUAL REPORT |
| | | | | | | | | | | | | | | |
| | | Six months
ended April 30, 2012 | | Year ended Oct. 31, |
| | | | 2011 | | 2010(a) |
| | | (Unaudited) | | | | |
Class Z | | | | | | | | | | | | | | | |
Per share data | | | | | | | | | | | | | | | |
Net asset value, beginning of period | | | | $5.53 | | | | | $6.31 | | | | | $6.09 | |
Income from investment operations: | | | | | | | | | | | | | | | |
Net investment income | | | | 0.05 | | | | | 0.13 | | | | | 0.01 | |
Net realized and unrealized gain (loss) | | | | (0.08 | ) | | | | (0.68 | ) | | | | 0.21 | |
Total from investment operations | | | | (0.03 | ) | | | | (0.55 | ) | | | | 0.22 | |
Less distributions to shareholders from: | | | | | | | | | | | | | | | |
Net investment income | | | | (0.20 | ) | | | | (0.23 | ) | | | | — | |
Total distributions to shareholders | | | | (0.20 | ) | | | | (0.23 | ) | | | | — | |
Net asset value, end of period | | | | $5.30 | | | | | $5.53 | | | | | $6.31 | |
Total return | | | | (0.18% | ) | | | | (9.11% | ) | | | | 3.61% | |
Ratios to average net assets(b) | | | | | | | | | | | | | | | |
Expenses prior to fees waived or
expenses reimbursed | | | | 1.53% | (c) | | | | 1.44% | | | | | 1.21% | (c) |
Net expenses after fees waived or
expenses reimbursed(d) | | | | 1.26% | (c) | | | | 1.42% | (e) | | | | 1.21% | (c) |
Net investment income | | | | 1.71% | (c) | | | | 2.21% | (e) | | | | 1.70% | (c) |
Supplemental data | | | | | | | | | | | | | | | |
Net assets, end of period (in thousands) | | | | $90 | | | | | $56 | | | | | $3 | |
Portfolio turnover | | | | 62% | | | | | 21% | | | | | 34% | |
Notes to Financial Highlights
| (a) | For the period from September 27, 2010 (commencement of operations) to October 31, 2010. |
| (b) | In addition to the fees and expenses which the Fund bears directly, the Fund indirectly bears a pro rata share of the fees and expenses of the acquired funds in which it invests. Such indirect expenses are not included in the reported expense ratios. |
| (d) | The Investment Manager and certain of its affiliates agreed to waive/reimburse certain fees and expenses, if applicable. |
| (e) | The benefits derived from expense reductions had an impact of less than 0.01%. |
The accompanying Notes to Financial Statements are an integral part of this statement.
| | | | |
| COLUMBIA MULTI-ADVISOR INTERNATIONAL VALUE FUND — 2012 SEMIANNUAL REPORT | | | 35 | |
| | |
| Notes to Financial Statements | | |
April 30, 2012 (Unaudited)
Columbia Multi-Advisor International Value Fund (the Fund), a series of Columbia Funds Series Trust II (the Trust), is a diversified fund. The Trust is registered under the Investment Company Act of 1940, as amended (the 1940 Act), as an open-end management investment company organized as a Massachusetts business trust.
Fund Shares
The Trust may issue an unlimited number of shares (without par value). The Fund offers Class A, Class B, Class C, Class I, Class R4 and Class Z shares. All share classes have identical voting, dividend and liquidation rights. Each share class has its own expense structure and sales charges, as applicable.
Class A shares are subject to a maximum front-end sales charge of 5.75% based on the initial investment amount. Class A shares purchased without an initial sales charge in accounts aggregating $1 million to $50 million at the time of purchase are subject to a contingent deferred sales charge (CDSC) if the shares are sold within 18 months of purchase, charged as follows: 1.00% CDSC if redeemed within 12 months of purchase, and 0.50% CDSC if redeemed more than 12, but less than 18, months after purchase.
Class B shares may be subject to a maximum CDSC of 5.00% based upon the holding period after purchase. Class B shares will generally convert to Class A shares eight years after purchase. The Fund no longer accepts investments by new or existing investors in the Fund's Class B shares, except in connection with the reinvestment of any dividend and/or capital gain distributions in Class B shares of the Fund and exchanges by existing Class B shareholders of certain other funds within the Columbia Family of Funds.
Class C shares are subject to a 1.00% CDSC on shares redeemed within one year of purchase.
Class I shares are not subject to sales charges and are only available to the Columbia Family of Funds.
Class R4 shares are not subject to sales charges; however, this share class is closed to new investors.
Class Z shares are not subject to sales charges, and are only available to certain investors, as described in the Fund's prospectus.
| | |
| 36 | | COLUMBIA MULTI-ADVISOR INTERNATIONAL VALUE FUND — 2012 SEMIANNUAL REPORT |
| Note 2. Summary | of Significant Accounting Policies |
Use of Estimates
The preparation of financial statements in accordance with U.S. generally accepted accounting principles (GAAP) requires management to make certain estimates and assumptions that affect the reported amounts of assets and liabilities, the disclosure of contingent assets and liabilities at the date of the financial statements and the reported amounts of revenue and expenses during the reporting period. Actual results could differ from those estimates.
The following is a summary of significant accounting policies consistently followed by the Fund in the preparation of its financial statements.
Security Valuation
All equity securities are valued at the close of business of the New York Stock Exchange (NYSE). Equity securities are valued at the last quoted sales price on the principal exchange or market on which they trade, except for securities traded on the NASDAQ Stock Market, which are valued at the NASDAQ official close price. Unlisted securities or listed securities for which there were no sales during the day are valued at the mean of the latest quoted bid and asked prices on such exchanges or markets.
Debt securities generally are valued by pricing services approved by the Board of Trustees (the Board) based upon market transactions for normal, institutional-size trading units of similar securities. The services may use various pricing techniques which take into account appropriate factors such as yield, quality, coupon rate, maturity, type of issue, trading characteristics and other data, as well as broker quotes. Debt securities for which quotations are readily available may also be valued based upon an over-the-counter or exchange bid quotation.
Foreign securities are valued based on quotations from the principal market in which such securities are normally traded. If any foreign share prices are not readily available as a result of limited share activity the securities are valued at the mean of the latest quoted bid and asked prices on such exchanges or markets. Foreign currency exchange rates are generally determined at 4:00 p.m. Eastern (U.S.) time. However, many securities markets and exchanges outside the U.S. close prior to the close of the NYSE; therefore, the closing prices for securities in such markets or on such exchanges may not fully reflect events that occur after such close but before the close of the NYSE. In those situations, foreign securities will be fair valued pursuant to the policy adopted by the Board, including utilizing a third party pricing service to determine these fair values. The third party pricing service takes into account multiple factors, including, but not limited to, movements in the U.S. securities markets, certain depositary receipts, futures contracts and foreign exchange rates that have occurred
| | | | |
| COLUMBIA MULTI-ADVISOR INTERNATIONAL VALUE FUND — 2012 SEMIANNUAL REPORT | | | 37 | |
| | |
| Notes to Financial Statements (continued) | | |
subsequent to the close of the foreign exchange, to determine a good faith estimate that reasonably reflects the current market conditions as of the close of the NYSE. The fair value of a security is likely to be different from the quoted or published price, if available.
Investments in other open-end investment companies, including money market funds, are valued at net asset value.
Short-term securities purchased within 60 days to maturity are valued at amortized cost, which approximates market value. The value of short-term securities originally purchased with maturities greater than 60 days is determined based on an amortized value to par upon reaching 60 days to maturity. Short-term securities maturing in more than 60 days from the valuation date are valued at the market price or approximate market value based on current interest rates.
Forward foreign currency exchange contracts are marked-to-market based upon foreign currency exchange rates provided by a pricing service.
Futures and options on futures contracts are valued based upon the settlement price established each day by the board of trade or exchange on which they are traded.
Investments for which market quotations are not readily available, or that have quotations which management believes are not reliable, are valued at fair value as determined in good faith under consistently applied procedures established by and under the general supervision of the Board. If a security or class of securities (such as foreign securities) is valued at fair value, such value is likely to be different from the last quoted market price for the security. The determination of fair value often requires significant judgment. To determine fair value, management may use assumptions including but not limited to future cash flows and estimated risk premiums. Multiple inputs from various sources may be used to determine value.
Foreign Currency Transactions and Translation
The values of all assets and liabilities denominated in foreign currencies are translated into U.S. dollars at that day’s exchange rates. Net realized and unrealized gains (losses) on foreign currency transactions and translations include gains (losses) arising from the fluctuation in exchange rates between trade and settlement dates on securities transactions, gains (losses) arising from the disposition of foreign currency and currency gains (losses) between the accrual and payment dates on dividends, interest income and foreign withholding taxes.
For financial statement purposes, the Fund does not distinguish that portion of gains (losses) on investments which is due to changes in foreign exchange rates
| | |
| 38 | | COLUMBIA MULTI-ADVISOR INTERNATIONAL VALUE FUND — 2012 SEMIANNUAL REPORT |
from that which is due to changes in market prices of the investments. Such fluctuations are included with the net realized and unrealized gains (losses) on investments in the Statement of Operations.
Derivative Instruments
The Fund invests in certain derivative instruments as detailed below to meet its investment objectives. Derivatives are instruments whose values depend on, or are derived from, in whole or in part, the value of one or more other assets, such as securities, currencies, commodities or indices. Derivative instruments may be used to maintain cash reserves while maintaining exposure to certain other assets, to offset anticipated declines in values of investments, to facilitate trading, to reduce transaction costs and to pursue higher investment returns. The Fund may also use derivative instruments to mitigate certain investment risks, such as foreign currency exchange rate risk, interest rate risk and credit risk. Derivatives may involve various risks, including the potential inability of the counterparty to fulfill its obligation under the terms of the contract, the potential for an illiquid secondary market and the potential for market movements which may expose the Fund to gains or losses in excess of the amount shown in the Statement of Assets and Liabilities.
The Fund and any counterparty are required to maintain an agreement that requires the Fund and that counterparty to monitor (on a daily basis) the net fair value of all derivatives entered into pursuant to the agreement between the Fund and such counterparty. If the net fair value of such derivatives between the Fund and that counterparty exceeds a certain threshold (as defined in the agreement), the Fund or the counterparty (as the case may be) is required to post cash and/or securities as collateral. Fair values of derivatives presented in the financial statements are not netted with the fair value of other derivatives or with any collateral amounts posted by the Fund or any counterparty.
Forward Foreign Currency Exchange Contracts
Forward foreign currency exchange contracts are agreements between two parties to buy and sell a currency at a set price on a future date. These contracts are intended to be used to minimize the exposure to foreign exchange rate fluctuations during the period between the trade and settlement dates of the contract. The Fund utilized forward foreign currency exchange contracts to hedge the currency exposure associated with some or all of the Fund’s securities and to shift investment exposure from one currency to another.
The values of forward foreign currency exchange contracts fluctuate with changes in foreign currency exchange rates. The Fund will record a realized gain or loss when the forward foreign currency exchange contract is closed.
| | | | |
| COLUMBIA MULTI-ADVISOR INTERNATIONAL VALUE FUND — 2012 SEMIANNUAL REPORT | | | 39 | |
| | |
| Notes to Financial Statements (continued) | | |
The use of forward foreign currency exchange contracts does not eliminate fluctuations in the prices of the Fund’s portfolio securities. The risks of forward foreign currency exchange contracts include movement in the values of the foreign currencies relative to the U.S. dollar (or other foreign currencies) and the possibility that counterparties will not complete their contractual obligations, which may be in excess of the amount reflected, if any, in the Statement of Assets and Liabilities.
Futures Contracts
Futures contracts represent commitments for the future purchase or sale of an asset at a specified price on a specified date. The Fund bought and sold futures contracts to maintain appropriate equity market exposure while keeping sufficient cash to accommodate daily redemptions. Upon entering into futures contracts, the Fund bears risks which may include interest rates, exchange rates or securities prices moving unexpectedly, in which case, the Fund may not achieve the anticipated benefits of the futures contracts and may realize a loss. Additional risks include counterparty credit risk, the possibility of an illiquid market, and that a change in the value of the contract or option may not correlate with changes in the value of the underlying asset.
Upon entering into a futures contract, the Fund pledges cash or securities with the broker in an amount sufficient to meet the initial margin requirement. Subsequent payments (variation margin) are made or received by the Fund each day. The variation margin payments are equal to the daily change in the contract value and are recorded as variation margin receivable or payable and are offset in unrealized gains or losses. The Fund recognizes a realized gain or loss when the contract is closed or expires. Futures contracts involve, to varying degrees, risk of loss in excess of the variation margin disclosed in the Statement of Assets and Liabilities.
Effects of Derivative Transactions in the Financial Statements
The following tables are intended to provide additional information about the effect of derivatives on the financial statements of the Fund, including: the fair value of derivatives by risk category and the location of those fair values in the Statement of Assets and Liabilities; the impact of derivative transactions on the Fund's operations over the period including realized gains or losses and unrealized gains or losses. The derivative schedules following the Portfolio of
| | |
| 40 | | COLUMBIA MULTI-ADVISOR INTERNATIONAL VALUE FUND — 2012 SEMIANNUAL REPORT |
Investments present additional information regarding derivative instruments outstanding at the end of the period, if any.
Fair Values of Derivative Instruments at April 30, 2012
| | | | | | |
Risk Exposure
Category | | Asset Derivatives | | Liability Derivatives | |
| | Statement of Assets
and Liabilities
Location | | Fair Value | |
Foreign Exchange Contracts | | Unrealized appreciation on forward foreign currency exchange contracts | | $ | 22,413 | |
Effect of Derivative Instruments in the Statement of Operations
for the Six Months Ended April 30, 2012
| | | | | | | | | | | | |
| Amount of Realized Gain (Loss) on Derivatives Recognized in Income | |
| Risk Exposure Category | | Forward Foreign
Currency Exchange
Contracts | | | Futures
Contracts | | | Total | |
Foreign exchange contracts | | $ | 152,150 | | | $ | — | | | $ | 152,150 | |
Interest rate contracts | | | — | | | | 143,667 | | | $ | 143,667 | |
Total | | $ | 152,150 | | | $ | 143,667 | | | $ | 295,817 | |
|
| Change in Unrealized Appreciation (Depreciation) on Derivatives Recognized in Income | |
| Risk Exposure Category | | Forward Foreign
Currency Exchange
Contracts | | | Futures
Contracts | | | Total | |
Foreign exchange contracts | | $ | 65,458 | | | $ | — | | | $ | 65,458 | |
Interest rate contracts | | | — | | | | (181,128 | ) | | $ | (181,128 | ) |
Total | | $ | 65,458 | | | $ | (181,128 | ) | | $ | (115,670 | ) |
Volume of Derivative Instruments for the Six Months Ended April 30, 2012
| | | | |
| | | Contracts
Opened | |
Forward Foreign Currency Exchange Contracts | | | 8 | |
Futures Contracts | | | — | |
| | | | |
| COLUMBIA MULTI-ADVISOR INTERNATIONAL VALUE FUND — 2012 SEMIANNUAL REPORT | | | 41 | |
| | |
| Notes to Financial Statements (continued) | | |
Repurchase Agreements
The Fund may engage in repurchase agreement transactions with institutions that management has determined are creditworthy. The Fund, through the custodian, receives delivery of the underlying securities collateralizing a repurchase agreement. Management is responsible for determining that the collateral is at least equal, at all times, to the value of the repurchase obligation including interest. A repurchase agreement transaction involves certain risks in the event of default or insolvency of the counterparty. These risks include possible delays in or restrictions on a Fund’s ability to dispose of the underlying securities and a possible decline in the value of the underlying securities during the period while the Fund seeks to assert its rights.
Security Transactions
Security transactions are accounted for on the trade date. Cost is determined and gains (losses) are based upon the specific identification method for both financial statement and federal income tax purposes.
Income Recognition
Corporate actions and dividend income are recorded net of any non-reclaimable tax withholdings, on the ex-dividend date or upon receipt of ex-dividend notification in the case of certain foreign securities.
Interest income is recorded on the accrual basis.
Awards from class action litigation are recorded as a reduction of cost basis if the Fund still owns the applicable securities on the payment date. If the Fund no longer owns the applicable securities, the proceeds are recorded as realized gains.
Expenses
General expenses of the Trust are allocated to the Fund and other funds of the Trust based upon relative net assets or other expense allocation methodologies determined by the nature of the expense. Expenses directly attributable to the Fund are charged to the Fund. Expenses directly attributable to a specific class of shares are charged to that share class.
Determination of Class Net Asset Value
All income, expenses (other than class-specific expenses, which are charged to that share class, as shown in the Statement of Operations) and realized and unrealized gains (losses) are allocated to each class of the Fund on a daily basis, based on the relative net assets of each class, for purposes of determining the net asset value of each class.
Federal Income Tax Status
The Fund intends to qualify each year as a regulated investment company under Subchapter M of the Internal Revenue Code, as amended, and will distribute substantially all of its taxable income (including net short-term capital gains), if
| | |
| 42 | | COLUMBIA MULTI-ADVISOR INTERNATIONAL VALUE FUND — 2012 SEMIANNUAL REPORT |
any, for its tax year, and as such will not be subject to federal income taxes. In addition, the Fund intends to distribute in each calendar year substantially all of its net investment income, capital gains and certain other amounts, if any, such that the Fund should not be subject to federal excise tax. Therefore, no federal income or excise tax provision is recorded.
Foreign Taxes
The Fund may be subject to foreign taxes on income, gains on investments or currency repatriation, a portion of which may be recoverable. The Fund will accrue such taxes and recoveries, as applicable, based upon its current interpretation of tax rules and regulations that exist in the markets in which it invests.
Realized gains in certain countries may be subject to foreign taxes at the Fund level, based on statutory rates. The Fund accrues for such foreign taxes on net realized and unrealized gains at the appropriate rate for each jurisdiction, as applicable.
Distributions to Shareholders
Distributions from net investment income are declared and paid annually. Net realized capital gains, if any, are distributed along with the income dividend. Income distributions and capital gain distributions are determined in accordance with federal income tax regulations which may differ from GAAP.
Guarantees and Indemnifications
Under the Trust’s organizational documents and, in some cases, by contract, its officers and trustees are indemnified against certain liabilities arising out of the performance of their duties to the Trust or its funds. In addition, certain of the Fund’s contracts with its service providers contain general indemnification clauses. The Fund’s maximum exposure under these arrangements is unknown since the amount of any future claims that may be made against the Fund cannot be determined, and the Fund has no historical basis for predicting the likelihood of any such claims.
Recent Accounting Pronouncement
Fair Value Measurements and Disclosures
In May 2011, the Financial Accounting Standards Board (FASB) issued ASU No. 2011-04 modifying Topic 820, Fair Value Measurements and Disclosures. At the same time, the International Accounting Standards Board (IASB) issued International Financial Reporting Standard 13, Fair Value Measurement. The objective of the FASB and IASB is convergence of their guidance on fair value measurements and disclosures.
| | | | |
| COLUMBIA MULTI-ADVISOR INTERNATIONAL VALUE FUND — 2012 SEMIANNUAL REPORT | | | 43 | |
| | |
| Notes to Financial Statements (continued) | | |
Specifically, ASU No. 2011-04 requires reporting entities to disclose i) the amounts of any transfers between Level 1 and Level 2, and the reasons for the transfers, ii) for Level 3 fair value measurements, a) quantitative information about significant unobservable inputs used, b) a description of the valuation processes used by the reporting entity and c) a narrative description of the sensitivity of the fair value measurement to changes in unobservable inputs if a change in those inputs might result in a significantly higher or lower fair value measurement. The effective date of ASU No. 2011-04 is for interim and annual periods beginning after December 15, 2011. At this time, management is evaluating the implications of this guidance and the impact it will have on the financial statement amounts and footnote disclosures, if any.
| Note 3. Fees | and Compensation Paid to Affiliates |
Investment Management Fees
Under an Investment Management Services Agreement, Columbia Management Investment Advisers, LLC (the Investment Manager), a wholly-owned subsidiary of Ameriprise Financial, Inc. (Ameriprise Financial), is responsible for the ultimate oversight of investments made by the Fund. The Fund's subadvisers (see Subadvisory Agreements below) has the primary responsibility for the day-to-day portfolio management of the Fund. The management fee is an annual fee that is equal to a percentage of the Fund’s average daily net assets that declines from 0.900% to 0.775% as the Fund’s net assets increase. The annualized effective management fee rate for the six months ended April 30, 2012 was 0.90% of the Fund’s average daily net assets.
Subadvisory Agreements
The Investment Manager has entered into Subadvisory Agreements with Mondrian Investment Partners Limited and Dimensional Fund Advisors, L.P. each of which subadvises a portion of the assets of the Fund. New investments in the Fund, net of any redemptions, are allocated in accordance with the Investment Manager's determination, subject to the oversight of the Fund’s Board, of the allocation that is in the best interests of the shareholders. Each subadviser's proportionate share of investments in the Fund will vary due to market fluctuations. The Investment Manager compensates each subadviser to manage the investment of the Fund's assets.
Prior to April 20, 2012, the Investment Manager had a Subadvisory Agreement with Tradewinds Global Investors, LLC. This agreement was terminated April 20, 2012.
Prior to November 16, 2011, the Investment Manager had a Subadvisory Agreement with AllianceBernstein L.P. to manage a portion of the assets of the
| | |
| 44 | | COLUMBIA MULTI-ADVISOR INTERNATIONAL VALUE FUND — 2012 SEMIANNUAL REPORT |
Fund. This agreement was terminated November 16, 2011. Effective November 16, 2011, the Investment Manager entered into the Subadvisory Agreement with Dimensional Fund Advisors, L.P.
Administration Fees
Under an Administrative Services Agreement, the Investment Manager serves as the Fund Administrator. The Fund pays the Fund Administrator an annual fee for administration and accounting services equal to a percentage of the Fund’s average daily net assets that declines from 0.08% to 0.05% as the Fund’s net assets increase. The annualized effective administration fee rate for the six months ended April 30, 2012 was 0.08% of the Fund's average daily net assets.
Other Expenses
Other expenses are for, among other things, certain expenses of the Fund or the Board, including: Fund boardroom and office expense, employee compensation, employee health and retirement benefits, and certain other expenses. Payment of these Fund and Board expenses is facilitated by a company providing limited administrative services to the Fund and the Board. For the six months ended April 30, 2012, other expenses paid to this company were $1,287.
Compensation of Board Members
Board members are compensated for their services to the Fund as disclosed in the Statement of Operations. Under a Deferred Compensation Plan (the Plan), the Board members who are not “interested persons” of the Fund, as defined under the 1940 Act, may elect to defer payment of up to 100% of their compensation. Deferred amounts are treated as though equivalent dollar amounts had been invested in shares of certain funds managed by the Investment Manager. The Fund’s liability for these amounts is adjusted for market value changes and remains in the Fund until distributed in accordance with the Plan.
Transfer Agent Fees
Under a Transfer and Dividend Disbursing Agent Agreement, Columbia Management Investment Services Corp. (the Transfer Agent), an affiliate of the Investment Manager and a wholly-owned subsidiary of Ameriprise Financial, is responsible for providing transfer agency services to the Fund. The Transfer Agent has contracted with Boston Financial Data Services (BFDS) to serve as sub-transfer agent.
The Transfer Agent receives monthly account-based service fees based on the number of open accounts and is reimbursed by the Fund for the fees and expenses the Transfer Agent pays to financial intermediaries that maintain omnibus accounts with the Fund that is a percentage of the average aggregate value of the Fund’s shares maintained in each such omnibus account (other than omnibus accounts for which American Enterprise Investment Services Inc. is the
| | | | |
| COLUMBIA MULTI-ADVISOR INTERNATIONAL VALUE FUND — 2012 SEMIANNUAL REPORT | | | 45 | |
| | |
| Notes to Financial Statements (continued) | | |
broker of record or accounts where the beneficial shareholder is a customer of Ameriprise Financial Services, Inc., which are paid a per account fee). The Transfer Agent pays the fees of BFDS for services as sub-transfer agent and is not entitled to reimbursement for such fees from the Fund (with the exception of out-of-pocket fees).
The Transfer Agent also receives compensation from fees for various shareholder services and reimbursements for certain out-of-pocket expenses. Class I shares do not pay transfer agent fees. Total transfer agent fees for Class R4 shares are subject to an annual limitation of not more than 0.05% of the average daily net assets attributable to the share class.
For the six months ended April 30, 2012, the Fund's annualized effective transfer agent fee rates as a percentage of average daily net assets of each class were as follows:
| | | | |
Class A | | | 0.43 | % |
Class B | | | 0.42 | |
Class C | | | 0.42 | |
Class R4 | | | 0.05 | |
Class Z | | | 0.41 | |
An annual minimum account balance fee of $20 may apply to certain accounts with a value below the Fund’s initial minimum investment requirements to reduce the impact of small accounts on transfer agent fees. These minimum account balance fees are recorded as part of expense reductions in the Statement of Operations. For the six months ended April 30, 2012, no minimum account balance fees were charged by the Fund.
Plan Administration Fees
Under a Plan Administration Services Agreement with the Transfer Agent, the Fund pays an annual fee at a rate of 0.25% of the Fund's average daily net assets attributable to Class R4 shares for the provision of various administrative, recordkeeping, communication and educational services.
Distribution Fees
The Fund has an agreement with Columbia Management Investment Distributors, Inc. (the Distributor), an affiliate of the Investment Manager and a wholly-owned subsidiary of Ameriprise Financial, for distribution and shareholder services. Under a Plan and Agreement of Distribution pursuant to Rule 12b-1, the Fund pays a fee at an annual rate of up to 0.25% of the Fund’s average daily net assets attributable to Class A and a fee at an annual rate of up to 1.00% of the Fund’s average daily net assets attributable to Class B and Class C shares. For Class B and Class C shares, of the 1.00% fee, up to 0.75% is reimbursed for distribution expenses.
| | |
| 46 | | COLUMBIA MULTI-ADVISOR INTERNATIONAL VALUE FUND — 2012 SEMIANNUAL REPORT |
The amount of distribution expenses incurred by the Distributor and not yet reimbursed (unreimbursed expense) was approximately $2,653,000 and $150,000 for Class B and Class C shares, respectively. These amounts are based on the most recent information available as of March 31, 2012, and may be recovered from future payments under the distribution plan or CDSCs. To the extent the unreimbursed expense has been fully recovered, the distribution fee is reduced.
Sales Charges
Sales charges, including front-end charges and CDSCs, received by the Distributor for distributing Fund shares were $83,216 for Class A, $5,619 for Class B and $228 for Class C shares for the six months ended April 30, 2012.
Expenses Waived/Reimbursed by the Investment Manager and its Affiliates
Effective January 1, 2012, the Investment Manager and certain of its affiliates have contractually agreed to waive fees and/or reimburse expenses (excluding certain fees and expenses described below), through February 28, 2013, unless sooner terminated at the sole discretion of the Board, so that the Fund's net operating expenses, after giving effect to fees waived/expenses reimbursed and any balance credits and/or overdraft charges from the Fund's custodian, do not exceed the following annual rates as a percentage of the class' average daily net assets:
| | | | |
Class A | | | 1.46 | % |
Class B | | | 2.21 | |
Class C | | | 2.21 | |
Class I | | | 1.01 | |
Class R4 | | | 1.31 | |
Class Z | | | 1.21 | |
Prior to January 1, 2012, the Investment Manager and its affiliates contractually agreed to waive fees and/or reimburse expenses (excluding certain fees and expenses described below), so that the Fund's net operating expenses, after giving effect to fees waived/expenses reimbursed and any balance credits and/or overdraft charges from the Fund's custodian, did not exceed the following annual rates as a percentage of the class' average daily net assets:
| | | | |
Class A | | | 1.65 | % |
Class B | | | 2.40 | |
Class C | | | 2.40 | |
Class I | | | 1.20 | |
Class R4 | | | 1.50 | |
Class Z | | | 1.40 | |
Under the agreement, the following fees and expenses are excluded from the waiver/reimbursement commitment, and therefore will be paid by the Fund, if applicable: taxes (including foreign transaction taxes), expenses associated with
| | | | |
| COLUMBIA MULTI-ADVISOR INTERNATIONAL VALUE FUND — 2012 SEMIANNUAL REPORT | | | 47 | |
| | |
| Notes to Financial Statements (continued) | | |
investments in affiliated and non-affiliated pooled investment vehicles (including mutual funds and exchange traded funds), transaction costs and brokerage commissions, costs related to any securities lending program, dividend expenses associated with securities sold short, inverse floater program fees and expenses, transaction charges and interest on borrowed money, interest, extraordinary expenses and any other expenses the exclusion of which is specifically approved by the Fund’s Board. This agreement may be modified or amended only with approval from all parties.
| Note 4. Federal | Tax Information |
The timing and character of income and capital gain distributions are determined in accordance with income tax regulations, which may differ from GAAP because of temporary or permanent book to tax differences.
At April 30, 2012, the cost of investments for federal income tax purposes was approximately $274,243,000 and the aggregate gross approximate unrealized appreciation and depreciation based on that cost was:
| | | | |
Unrealized appreciation | | $ | 27,240,000 | |
Unrealized depreciation | | $ | (20,094,000 | ) |
Net unrealized appreciation | | $ | 7,146,000 | |
The following capital loss carryforward, determined as of October 31, 2011, may be available to reduce taxable income arising from future net realized gains on investments, if any, to the extent permitted by the Internal Revenue Code:
| | | | |
| Year of Expiration | | Amount | |
2017 | | $ | 320,913,280 | |
2018 | | | 2,168,950 | |
Total | | $ | 323,082,230 | |
On December 22, 2010, the Regulated Investment Company Modernization Act of 2010 (the Act) was enacted, which changed various technical rules governing the tax treatment of regulated investment companies. The changes are generally effective for taxable years beginning after the date of enactment. Under the Act, the Fund will be permitted to carry forward capital losses incurred in taxable years beginning after the date of enactment for an unlimited period. However, any losses incurred during those future taxable years will be required to be utilized prior to the losses incurred in pre-enactment taxable years, which carry an expiration date. As a result of this ordering rule, pre-enactment capital loss carryforwards may be more likely to expire unused.
| | |
| 48 | | COLUMBIA MULTI-ADVISOR INTERNATIONAL VALUE FUND — 2012 SEMIANNUAL REPORT |
Management of the Fund has concluded that there are no significant uncertain tax positions that would require recognition in the financial statements. However, management’s conclusion may be subject to review and adjustment at a later date based on factors including, but not limited to, new tax laws, regulations, and administrative interpretations (including relevant court decisions). Generally, the Fund’s federal tax returns for the prior three fiscal years remain subject to examination by the Internal Revenue Service.
| Note 5. Portfolio | Information |
The cost of purchases and proceeds from sales of securities, excluding short-term obligations, aggregated to $175,307,683 and $221,860,591, respectively, for the six months ended April 30, 2012.
| Note 6. Lending | of Portfolio Securities |
The Fund has entered into a Master Securities Lending Agreement (the Agreement) with JPMorgan Chase Bank, N.A. (JPMorgan). The Agreement authorizes JPMorgan as lending agent to lend securities to authorized borrowers in order to generate additional income on behalf of the Fund. Pursuant to the Agreement, the securities loaned are secured by cash or U.S. government securities equal to at least 100% of the market value of the loaned securities. Any additional collateral required to maintain those levels due to market fluctuations of the loaned securities is requested to be delivered the following business day. Cash collateral received is invested by the lending agent on behalf of the Fund into authorized investments pursuant to the Agreement. The investments made with the cash collateral are listed in the Portfolio of Investments. The values of such investments and any uninvested cash collateral are disclosed in the Statement of Assets and Liabilities along with the related obligation to return the collateral upon the return of the securities loaned.
Risks of delay in recovery of securities or even loss of rights in the securities may occur should the borrower of the securities fail financially. Risks may also arise to the extent that the value of the securities loaned increases above the value of the collateral received. JPMorgan will indemnify the Fund from losses resulting from a borrower’s failure to return a loaned security when due. Such indemnification does not extend to losses associated with declines in the value of cash collateral investments. The Investment Manager is not responsible for any losses incurred by the Fund in connection with the securities lending program. Loans are subject to termination by the Fund or the borrower at any time, and are, therefore, not considered to be illiquid investments.
Pursuant to the Agreement, the Fund receives income for lending its securities either in the form of fees or by earning interest on invested cash collateral, net of
| | | | |
| COLUMBIA MULTI-ADVISOR INTERNATIONAL VALUE FUND — 2012 SEMIANNUAL REPORT | | | 49 | |
| | |
| Notes to Financial Statements (continued) | | |
negotiated rebates paid to borrowers and fees paid to the lending agent for services provided and any other securities lending expenses. Net income earned from securities lending for the six months ended April 30, 2012 is disclosed in the Statement of Operations. The Fund continues to earn and accrue interest and dividends on the securities loaned.
At April 30, 2012, securities valued at $18,241,743 were on loan, secured by U.S. government securities valued at $879,318 and by cash collateral of $18,509,888 (which does not reflect calls for collateral made to borrowers by JPMorgan at period end) that is partially or fully invested in short-term securities or other cash equivalents.
| Note 7. Affiliated | Money Market Fund |
The Fund may invest its daily cash balances in Columbia Short-Term Cash Fund, an affiliated money market fund established for the exclusive use by the Fund and other affiliated funds. The income earned by the Fund from such investments is included as “Dividends from affiliates” in the Statement of Operations. As an investing fund, the Fund indirectly bears its proportionate share of the expenses of Columbia Short-Term Cash Fund.
| Note 8. Shareholder | Concentration |
At April 30, 2012, one unaffiliated shareholder account owned 18.4% of the outstanding shares of the Fund. The Fund has no knowledge about whether any portion of those shares was owned beneficially by such account. Subscription and redemption activity by concentrated accounts may have a significant effect on the operations of the Fund.
The Fund has entered into a revolving credit facility with a syndicate of banks led by JPMorgan, whereby the Fund may borrow for the temporary funding of shareholder redemptions or for other temporary or emergency purposes. The credit facility agreement, as amended, which is a collective agreement between the Fund and certain other funds managed by the Investment Manager, severally and not jointly, permits collective borrowings up to $500 million. Pursuant to a December 13, 2011 amendment to the credit facility agreement, interest is charged to each participating fund based on its borrowings at a rate equal to the higher of (i) the overnight federal funds rate plus 1.00% or (i) the one-month LIBOR rate plus 1.00%. Each borrowing under the credit facility matures no later than 60 days after the date of borrowing. The Fund also pays a commitment fee equal to its pro rata share of the amount of the credit facility at a rate of 0.08% per annum.
| | |
| 50 | | COLUMBIA MULTI-ADVISOR INTERNATIONAL VALUE FUND — 2012 SEMIANNUAL REPORT |
Prior to December 13, 2011, interest was charged to each participating fund based on its borrowings at a rate equal to the sum of the federal funds rate plus (i) 1.25% per annum plus (ii) if one-month LIBOR exceeds the federal funds rate, the amount of such excess. The Fund also paid a commitment fee equal to its pro rata share of the amount of the credit facility at a rate of 0.10% per annum.
The Fund had no borrowings during the six months ended April 30, 2012.
| Note 10. Significant | Risks |
Foreign Securities Risk
Investing in foreign securities may include certain risks and considerations not typically associated with investing in U.S. securities, such as fluctuating currency values and changing local and regional economic, political and social conditions, which may result in greater market volatility. In addition, certain foreign securities may not be as liquid as U.S. securities. Investing in emerging markets may accentuate these risks.
Investments in emerging market countries are subject to additional risk. The risk of foreign investments is typically increased in less developed countries. These countries are also more likely to experience high levels of inflation, deflation or currency devaluation which could hurt their economies and securities markets.
Geographic Concentration Risk
The Fund may be particularly susceptible to economic, political, regulatory or other events or conditions affecting issuers and countries within the specific geographic regions in which the Fund invests. Currency devaluation could occur in countries that have not yet experienced currency devaluation to date, or could continue to occur in countries that have already experienced such devaluations. As a result, the Fund may be more volatile than a more geographically diversified fund.
| Note 11. Subsequent | Events |
Management has evaluated the events and transactions that have occurred through the date the financial statements were issued and noted no items requiring adjustment of the financial statements or additional disclosure.
| Note 12. Information | Regarding Pending and Settled Legal Proceedings |
In December 2005, without admitting or denying the allegations, American Express Financial Corporation (AEFC, which is now known as Ameriprise Financial, Inc. (Ameriprise Financial)) entered into settlement agreements with the Securities and Exchange Commission (SEC) and Minnesota Department of
| | | | |
| COLUMBIA MULTI-ADVISOR INTERNATIONAL VALUE FUND — 2012 SEMIANNUAL REPORT | | | 51 | |
| | |
| Notes to Financial Statements (continued) | | |
Commerce (MDOC) related to market timing activities. As a result, AEFC was censured and ordered to cease and desist from committing or causing any violations of certain provisions of the Investment Advisers Act of 1940, the Investment Company Act of 1940, and various Minnesota laws. AEFC agreed to pay disgorgement of $10 million and civil money penalties of $7 million. AEFC also agreed to retain an independent distribution consultant to assist in developing a plan for distribution of all disgorgement and civil penalties ordered by the SEC in accordance with various undertakings detailed at www.sec.gov/litigation/admin/ia-2451.pdf. Ameriprise Financial and its affiliates have cooperated with the SEC and the MDOC in these legal proceedings, and have made regular reports to the funds’ Boards of Trustees.
Ameriprise Financial and certain of its affiliates have historically been involved in a number of legal, arbitration and regulatory proceedings, including routine litigation, class actions, and governmental actions, concerning matters arising in connection with the conduct of their business activities. Ameriprise Financial believes that the Funds are not currently the subject of, and that neither Ameriprise Financial nor any of its affiliates are the subject of, any pending legal, arbitration or regulatory proceedings that are likely to have a material adverse effect on the Funds or the ability of Ameriprise Financial or its affiliates to perform under their contracts with the Funds. Ameriprise Financial is required to make 10-Q, 10-K and, as necessary, 8-K filings with the Securities and Exchange Commission on legal and regulatory matters that relate to Ameriprise Financial and its affiliates. Copies of these filings may be obtained by accessing the SEC website at www.sec.gov.
There can be no assurance that these matters, or the adverse publicity associated with them, will not result in increased fund redemptions, reduced sale of fund shares or other adverse consequences to the Funds. Further, although we believe proceedings are not likely to have a material adverse effect on the Funds or the ability of Ameriprise Financial or its affiliates to perform under their contracts with the Funds, these proceedings are subject to uncertainties and, as such, we are unable to estimate the possible loss or range of loss that may result. An adverse outcome in one or more of these proceedings could result in adverse judgments, settlements, fines, penalties or other relief that could have a material adverse effect on the consolidated financial condition or results of operations of Ameriprise Financial.
| | |
| 52 | | COLUMBIA MULTI-ADVISOR INTERNATIONAL VALUE FUND — 2012 SEMIANNUAL REPORT |
The policy of the Board is to vote the proxies of the companies in which the Fund holds investments consistent with the procedures as stated in the Statement of Additional Information (SAI). You may obtain a copy of the SAI without charge by calling 800.345.6611; contacting your financial intermediary; visiting columbiamanagement.com; or searching the website of the Securities and Exchange Commission (SEC) at www.sec.gov. Information regarding how the Fund voted proxies relating to portfolio securities is filed with the SEC by August 31 for the most recent 12-month period ending June 30 of that year, and is available without charge by visiting columbiamanagement.com; or searching the website of the SEC at www.sec.gov.
| | |
| Approval of Investment Management Services |
| |
and Subadvisory Agreements | | |
Columbia Management Investment Advisers, LLC (“Columbia Management” or the “investment manager”), a wholly-owned subsidiary of Ameriprise Financial, Inc. (“Ameriprise Financial”), serves as the investment manager to Columbia Multi-Advisor International Value Fund (the “Fund”). Under an investment management services agreement (the “IMS Agreement”), Columbia Management provides investment advice and other services to the Fund and all funds distributed by Columbia Management Investment Distributors, Inc. (collectively, the “Funds”). In addition, under the subadvisory agreements (the “Subadvisory Agreements”) between Columbia Management and each of Dimensional Fund Advisors, L.P. and Mondrian Investment Partners Limited (collectively, the “Subadvisers”), an affiliate of Columbia Management, the Subadvisers perform portfolio management and related services for the Fund.
On an annual basis, the Fund’s Board of Trustees (the “Board”), including the independent Board members (the “Independent Trustees”), considers renewal of the IMS Agreement and the Subadvisory Agreements (together, the “Advisory Agreements”). Columbia Management prepared detailed reports for the Board and its Contracts Committee in March and April 2012, including reports based on analyses of data provided by an independent organization and a comprehensive response to each item of information requested by independent legal counsel to the Independent Trustees (“Independent Legal Counsel”) in a letter to the investment manager, to assist the Board in making this determination. All of the materials presented in March and April were first supplied in draft form to designated representatives of the Independent Trustees, i.e., Independent Legal Counsel, the Chair of the Board and the Chair of the Contracts Committee (including materials relating to the Fund’s expense cap), and the final materials were revised to reflect comments provided by these Board representatives. In addition, throughout the year, the Board (or its committees)
| | | | |
| COLUMBIA MULTI-ADVISOR INTERNATIONAL VALUE FUND — 2012 SEMIANNUAL REPORT | | | 53 | |
| | |
Approval of Investment Management Services |
| |
| and Subadvisory Agreements (continued) | | |
regularly meets with portfolio management teams and senior management personnel and reviews information prepared by Columbia Management addressing the services Columbia Management provides and Fund performance. The Board accords particular weight to the work, deliberations and conclusions of the Contracts Committee, the Investment Review Committee and the Compliance Committee in determining whether to continue the Advisory Agreements.
The Board, at its April 10-12, 2012 in-person Board meeting (the “April Meeting”), considered the renewal of the Advisory Agreements for an additional one-year term. At the April Meeting, Independent Legal Counsel reviewed with the Independent Trustees various factors relevant to the Board’s consideration of advisory and subadvisory agreements and the Board’s legal responsibilities related to such consideration. Following an analysis and discussion of the factors identified below, the Board, including all of the Independent Trustees, approved the renewal of each of the Advisory Agreements.
Nature, Extent and Quality of Services Provided by Columbia Management and the Subadvisers: The Board considered its analysis of various reports and presentations received by it or one of its committees detailing the services performed by Columbia Management and the Subadvisers, as well as their history, reputation, expertise, resources and relative capabilities, and the qualifications of their personnel.
With respect to Columbia Management, the Board specifically considered many developments during the past year concerning the services provided by Columbia Management, including, in particular, the continued investment in, and resources dedicated to, the Funds’ operations and the successful completion of various integration initiatives and the consolidation of dozens of Funds. The Board noted the information it received concerning Columbia Management’s ability to retain key portfolio management personnel. In that connection, the Board took into account its meetings with Columbia Management’s Chief Investment Officer (the “CIO”) and considered the CIO’s successful execution of additional risk and portfolio management oversight applied to the Funds. The Board also assessed Columbia Management’s significant investment in upgrading technology (such as an equity trading system) and considered management’s commitments to enhance existing resources in this area.
In connection with the Board’s evaluation of the overall package of services provided by Columbia Management, the Board also considered the quality of administrative services provided to the Fund by Columbia Management. The Board also reviewed the financial condition of Columbia Management and its
| | |
| 54 | | COLUMBIA MULTI-ADVISOR INTERNATIONAL VALUE FUND — 2012 SEMIANNUAL REPORT |
affiliates and their ability to carry out their responsibilities under the IMS Agreement and the Fund’s other service agreements with affiliates of Ameriprise Financial. In addition, the Board discussed the acceptability of the terms of the IMS Agreement (including the relatively broad scope of services required to be performed by Columbia Management). The Board concluded that the services being performed under the IMS Agreement were of a reasonably high quality.
Based on the foregoing, and based on other information received (both oral and written, including the information on investment performance referenced below) and other considerations, the Board concluded that Columbia Management and its affiliates were in a position to continue to provide a high quality and level of services to the Fund.
With respect to the Subadvisers, the Board observed that it had previously approved each Subadviser’s code of ethics and compliance program, that the Chief Compliance Officer of the Fund continues to monitor the code and the program, and that no material issues have been reported. The Board also considered each Subadviser’s investment strategy/style, including particularly as it relates to the Fund, as well as the experience of the personnel that manage the Fund. The Board also considered the financial condition of each Subadviser and its capability and wherewithal to carry out its responsibilities under the applicable Subadvisory Agreement. In addition, the Board discussed the acceptability of the terms of the Subadvisory Agreements including the scope of services required to be performed. The Board noted that the terms of the Subadvisory Agreements are generally consistent with the terms of other subadviser agreements for subadvisers who manage other funds managed by the investment manager. It was observed that no changes were recommended to the Subadvisory Agreements. Based on the foregoing, and based on other information received (both oral and written) and other considerations, including, in particular, the performance of the Fund (discussed below) as well as the investment manager’s recommendation that the Board approve renewal of the Subadvisory Agreements with each Subadviser, which is unaffiliated with the investment manager, the Board concluded that the services being performed under each Subadvisory Agreement were of a reasonably high quality.
Based on the foregoing, and based on other information received (both oral and written, including the information on investment performance referenced below) and other considerations, the Board concluded that the Subadvisers were in a position to continue to provide a high quality and level of services to the Fund.
Investment Performance: For purposes of evaluating the nature, extent and quality of services provided under the Advisory Agreements, the Board reviewed
| | | | |
| COLUMBIA MULTI-ADVISOR INTERNATIONAL VALUE FUND — 2012 SEMIANNUAL REPORT | | | 55 | |
| | |
Approval of Investment Management Services |
| |
| and Subadvisory Agreements (continued) | | |
the investment performance of the Fund. In this regard, the Board considered detailed reports providing the results of analyses performed by an independent organization showing, for various periods, the performance of the Fund, the performance of a benchmark index, the percentage ranking of the Fund among its comparison group and the net assets of the Fund. The Board observed that the Fund’s investment performance reflected the interrelationship of market conditions with the particular investment strategies employed by the portfolio management team. The Board observed that the relatively recent subadvisor change was intended to help improve the Fund’s performance.
Additionally, the Board reviewed the performance of each of the Subadvisers and Columbia Management’s process for monitoring each Subadviser. The Board considered, in particular, management’s rationale for recommending the continued retention of each Subadviser.
Comparative Fees, Costs of Services Provided and the Profits Realized By Columbia Management, its Affiliates and the Subadvisers from their Relationships with the Fund: The Board reviewed comparative fees and the costs of services provided under each of the Advisory Agreements. The Board members considered detailed comparative information set forth in an annual report on fees and expenses, including, among other things, data (based on analyses conducted by an independent organization) showing a comparison of the Fund’s expenses with median expenses paid by funds in its comparative peer universe, as well as data showing the Fund’s contribution to Columbia Management’s profitability. The Board reviewed the fees charged to comparable institutional or other accounts/vehicles managed by Columbia Management and discussed differences in how the products are managed and operated, noting no unreasonable differences in the levels of contractual fees.
The Board accorded particular weight to the notion that the level of fees should reflect a rational pricing model applied consistently across the various product lines in the Fund family, while assuring that the overall fees for each Fund (with few defined exceptions) are generally in line with the “pricing philosophy” (i.e., that the total expense ratio of the Fund is at, or below, the median expense ratio of funds in the same comparison universe of the Fund). The Board took into account that the Fund’s total expense ratio (after considering proposed expense caps/waivers) approximated the peer universe’s median expense ratio. Additionally, the Board reviewed the level of subadvisory fees paid to each Subadviser, noting that the fees are paid by the investment manager and do not impact the fees paid by the Fund. The Board observed that the subadvisory fee level for each Subadviser was generally comparable to those charged by other
| | |
| 56 | | COLUMBIA MULTI-ADVISOR INTERNATIONAL VALUE FUND — 2012 SEMIANNUAL REPORT |
subadvisers to similar funds managed by the investment manager. The Board also reviewed fee rates charged by the Subadvisers to other client accounts. Based on its review, the Board concluded that the Fund’s management and subadvisory fees were fair and reasonable in light of the extent and quality of services that the Fund receives.
The Board also considered the profitability of Columbia Management and its affiliates in connection with Columbia Management providing investment management services to the Fund. In this regard, the Board referred to a detailed profitability report, discussing the profitability to Columbia Management and Ameriprise Financial from managing, operating and distributing the Funds. In this regard, the Board observed that 2011 profitability, while slightly lower than 2010, was generally in line with the reported profitability of other asset management firms. The Board also considered the indirect economic benefits flowing to Columbia Management or its affiliates in connection with managing or distributing the Funds, such as the enhanced ability to offer various other financial products to Ameriprise Financial customers, soft dollar benefits and overall reputational advantages. The Board noted that the fees paid by the Fund should permit the investment manager to offer competitive compensation to its personnel, make necessary investments in its business and earn an appropriate profit. The Board concluded that profitability levels were reasonable.
Economies of Scale to be Realized: The Board also considered the economies of scale that might be realized by Columbia Management as the Fund grows and took note of the extent to which Fund shareholders might also benefit from such growth.
Based on the foregoing, the Board, including all of the Independent Trustees, concluded that fees payable under the Advisory Agreements were fair and reasonable in light of the extent and quality of services provided. In reaching this conclusion, no single factor was determinative. At the April Meeting, the Board, including all of the Independent Trustees, approved the renewal of the Advisory Agreements.
| | | | |
| COLUMBIA MULTI-ADVISOR INTERNATIONAL VALUE FUND — 2012 SEMIANNUAL REPORT | | | 57 | |
Columbia Multi-Advisor International Value Fund
P.O. Box 8081
Boston, MA 02266-8081
columbiamanagement.com
| | | | |
 | | This report must be accompanied or preceded by the Fund’s current prospectus. The
Fund is distributed by Columbia Management Investment Distributors, Inc., member
FINRA, and managed by Columbia Management Investment Advisers, LLC. ©2012 Columbia Management Investment Advisers, LLC. All rights reserved. | | S-6253 M (6/12) |
Semiannual Report

Columbia
Seligman Global Technology Fund
Semiannual Report for the Period Ended April 30, 2012
Columbia Seligman Global Technology Fund seeks to provide long-term capital appreciation.
Not FDIC insured ¡ No bank guarantee ¡ May lose value
| | | | |
| |
Your Fund at a Glance | | | 2 | |
| |
Fund Expense Example | | | 6 | |
| |
Portfolio of Investments | | | 8 | |
| |
Statement of Assets and Liabilities | | | 14 | |
| |
Statement of Operations | | | 16 | |
| |
Statement of Changes in Net Assets | | | 17 | |
| |
Financial Highlights | | | 19 | |
| |
Notes to Financial Statements | | | 28 | |
| |
Proxy Voting | | | 43 | |
| |
Approval of Investment Management Services Agreement | | | 43 | |
See the Fund’s prospectus for risks associated with investing in the Fund.
| | | | |
| COLUMBIA SELIGMAN GLOBAL TECHNOLOGY FUND — 2012 SEMIANNUAL REPORT | | | 1 | |
FUND SUMMARY
| > | | Columbia Seligman Global Technology Fund (the Fund) Class A shares gained 12.40% (excluding sales charge) for the six months ended April 30, 2012. |
| > | | The Fund underperformed its benchmark, the MSCI World Information Technology (IT) Index (Net), which increased 12.81% for the same time frame. |
ANNUALIZED TOTAL RETURNS (for period ended April 30, 2012)
| | | | | | | | | | | | | | | | |
| | | 6 months* | | | 1 year | | | 5 years | | | 10 years | |
Columbia Seligman Global Technology Fund
Class A (excluding sales charge) | | | +12.40% | | | | +3.09% | | | | +5.91% | | | | +6.70% | |
MSCI World IT Index (Net)(1) (unmanaged) | | | +12.81% | | | | +8.28% | | | | +3.53% | | | | +4.87% | |
MSCI World IT Index (Gross)(1) (unmanaged) | | | +12.98% | | | | +8.64% | | | | +3.83% | | | | +5.11% | |
The performance information shown represents past performance and is not a guarantee of future results. The investment return and principal value of your investment will fluctuate so that your shares, when redeemed, may be worth more or less than their original cost. Current performance may be lower or higher than the performance information shown. You may obtain performance information current to the most recent month-end by contacting your financial intermediary, visiting columbiamanagement.com or calling 800.345.6611.
The 5.75% sales charge applicable to Class A shares of the Fund is not reflected in the table above. If reflected, returns would be lower than those shown. The performance of other classes may vary from that shown because of differences in fees and expenses. The Fund’s returns reflect the effect of fee waivers/expense reimbursements, if any. Without such waivers/reimbursements, the Fund’s returns would be lower. See the Average Annual Total Returns table for performance of other share classes of the Fund.
The indices do not reflect the effects of sales charges, expenses and taxes (except the MSCI World IT Index (Net) which reflects reinvested dividends net of withholding taxes). It is not possible to invest directly in an index.
| (1) | | The MSCI World Information Technology (IT) Index (Net) and the MSCI World IT Index (Gross), each is an unmanaged benchmark that assumes reinvestment of all distributions, if any and excludes the effect of expenses, fees, sales charges and taxes. The MSCI World IT Index is a free float-adjusted market capitalization index designed to measure information technology stock performance in the global developed equity market. |
| | |
| 2 | | COLUMBIA SELIGMAN GLOBAL TECHNOLOGY FUND — 2012 SEMIANNUAL REPORT |
AVERAGE ANNUAL TOTAL RETURNS
| | | | | | | | | | | | | | | | |
| at April 30, 2012 | | | | | | | | | | | | |
| Without sales charge | | 6 months* | | | 1 year | | | 5 years | | | 10 years | |
Class A (inception 5/23/94) | | | +12.40% | | | | +3.09% | | | | +5.91% | | | | +6.70% | |
Class B (inception 4/22/96) | | | +11.93% | | | | +2.28% | | | | +5.11% | | | | +5.90% | |
Class C (inception 5/27/99) | | | +11.93% | | | | +2.28% | | | | +5.11% | | | | +5.89% | |
Class I** (inception 8/3/09) | | | +12.61% | | | | +3.58% | | | | +6.19% | | | | +6.84% | |
Class R** (inception 4/30/03) | | | +12.28% | | | | +2.82% | | | | +5.63% | | | | +6.43% | |
Class R4** (inception 8/3/09) | | | +12.56% | | | | +3.36% | | | | +6.04% | | | | +6.76% | |
Class R5** (inception 8/3/09) | | | +12.53% | | | | +3.40% | | | | +6.13% | | | | +6.81% | |
Class Z** (inception 9/27/10) | | | +12.59% | | | | +3.40% | | | | +6.01% | | | | +6.75% | |
| | | | |
| With sales charge | | | | | | | | | | | | |
Class A (inception 5/23/94) | | | +5.94% | | | | -2.83% | | | | +4.66% | | | | +6.06% | |
Class B (inception 4/22/96) | | | +6.93% | | | | -2.72% | | | | +4.78% | | | | +5.90% | |
Class C (inception 5/27/99) | | | +10.93% | | | | +1.28% | | | | +5.11% | | | | +5.89% | |
The “Without sales charge” returns for Class A, Class B and Class C shares do not include applicable initial or contingent deferred sales charges. If included, returns would be lower than those shown. The “With sales charge” returns for Class A, Class B and Class C shares include: the maximum initial sales charge of 5.75% for Class A shares; the applicable contingent deferred sales charge (CDSC) for Class B shares (applied as follows: first year 5%; second year 4%; third and fourth years 3%; fifth year 2%; sixth year 1%; no sales charge thereafter); and a 1% CDSC for Class C shares sold within one year after purchase. The Fund’s other share classes are not subject to sales charges and have limited eligibility. See the Fund’s prospectuses for details.
| ** | The returns shown for periods prior to the share class inception date (including returns since inception, which are since Fund inception) include the returns of the Fund’s Class A shares. These returns are adjusted to reflect any higher class-related operating expenses of the newer share classes, as applicable. Please visit columbiamanagement.com/mutual-fund/appended-performance for more information. |
| | | | |
| COLUMBIA SELIGMAN GLOBAL TECHNOLOGY FUND — 2012 SEMIANNUAL REPORT | | | 3 | |
| | | | |
| | Your Fund at a Glance (continued) | | |
| | | | |
| PORTFOLIO BREAKDOWN(1) (at April 30, 2012) | |
Consumer Discretionary | | | 0.7 | % |
Health Care | | | 2.6 | |
Information Technology | | | 89.2 | |
Telecommunication Services | | | 0.9 | |
Other(2) | | | 6.6 | |
| (1) | | Percentages indicated are based upon total investments (excluding Investments of Cash Collateral Received for Securities on Loan). The Fund’s portfolio composition is subject to change. |
| (2) | | Includes investments in Money Market Funds. |
| | | | |
| TOP TEN HOLDINGS(1) (at April 30, 2012) | |
Apple, Inc. | | | 7.0 | % |
Synopsys, Inc. | | | 5.9 | |
Symantec Corp. | | | 5.1 | |
Advanced Micro Devices, Inc. | | | 4.9 | |
Microsoft Corp. | | | 4.4 | |
QUALCOMM, Inc. | | | 4.3 | |
Amdocs Ltd. | | | 4.3 | |
Nuance Communications, Inc. | | | 4.0 | |
KLA-Tencor Corp. | | | 3.7 | |
Novellus Systems, Inc. | | | 3.6 | |
(1) Percentages indicated are based upon total investments (excluding Investments of Cash Collateral Received for Securities on Loan and Money Market Funds).
For further detail about these holdings, please refer to the section entitled “Portfolio of Investments.”
Fund holdings are as of the date given, are subject to change at any time, and are not recommendations to buy or sell any security.
| | |
| 4 | | COLUMBIA SELIGMAN GLOBAL TECHNOLOGY FUND — 2012 SEMIANNUAL REPORT |
MORNINGSTAR STYLE BOXTM
| | |
 | | The Morningstar Style BoxTM is based on the Fund’s portfolio holdings.
For equity funds, the vertical axis shows the market capitalization of the
stocks owned, and the horizontal axis shows investment style (value,
blend, or growth). Information shown is based on the most recent data
provided by Morningstar. |
©2012 Morningstar, Inc. All rights reserved. The Morningstar information contained herein: (1) is proprietary to Morningstar and/or its content providers; (2) may not be copied or distributed; and (3) is not warranted to be accurate, complete, or timely. Neither Morningstar nor its content providers are responsible for any damages or losses arising from any use of this information. Past performance is no guarantee of future results.
| | | | |
| COLUMBIA SELIGMAN GLOBAL TECHNOLOGY FUND — 2012 SEMIANNUAL REPORT | | | 5 | |
(Unaudited)
Understanding your expenses
As an investor, you incur two types of costs. There are transaction costs, which generally include sales charges on purchases and may include redemption fees. There are also ongoing costs, which generally include management fees, distribution and service (Rule 12b-1) fees, and other fund expenses. The following information is intended to help you understand your ongoing costs (in dollars) of investing in the Fund and to help you compare these costs with the ongoing costs of investing in other mutual funds.
Analyzing your fund’s expenses
To illustrate these ongoing costs, we have provided examples and calculated the expenses paid by investors in each share class of the Fund during the period. The actual and hypothetical information in the table is based on an initial investment of $1,000 at the beginning of the period indicated and held for the entire period. Expense information is calculated two ways and each method provides you with different information. The amount listed in the “Actual” column is calculated using the Fund’s actual operating expenses and total return for the period. You may use the Actual information, together with the amount invested, to estimate the expenses that you paid over the period. Simply divide your account value by $1,000 (for example, an $8,600 account value divided by $1,000 = 8.6), then multiply the results by the expenses paid during the period under the Actual column. The amount listed in the “Hypothetical” column assumes a 5% annual rate of return before expenses (which is not the Fund’s actual return) and then applies the Fund’s actual expense ratio for the period to the hypothetical return. You should not use the hypothetical account values and expenses to estimate either your actual account balance at the end of the period or the expenses you paid during the period. See “Compare with other funds” below for details on how to use the hypothetical data.
Compare with other funds
Since all mutual funds are required to include the same hypothetical calculations about expenses in shareholder reports, you can use this information to compare the ongoing cost of investing in the Fund with other funds. To do so, compare the hypothetical example with the 5% hypothetical examples that appear in the shareholder reports of other funds. As you compare hypothetical examples of other funds, it is important to note that hypothetical examples are meant to highlight the ongoing costs of investing in a fund only and do not reflect any transaction costs, such as sales charges, or redemption or exchange fees. Therefore, the hypothetical calculations are useful in comparing ongoing costs only, and will not help you determine the relative total costs of owning different funds. If transaction costs were included in these calculations, your costs would be higher.
| | |
| 6 | | COLUMBIA SELIGMAN GLOBAL TECHNOLOGY FUND — 2012 SEMIANNUAL REPORT |
November 1, 2011 — April 30, 2012
| | | | | | | | | | | | | | | | | | | | | | | | | | | | |
| | | Account value at the
beginning of the
period ($) | | | Account value at the
end of the period ($) | | | Expenses paid
during the period ($) | | | Fund’s
annualized
expense
ratio (%) | |
| | | Actual | | | Hypothetical | | | Actual | | | Hypothetical | | | Actual | | | Hypothetical | | | Actual | |
Class A | | | 1,000.00 | | | | 1,000.00 | | | | 1,124.00 | | | | 1,017.80 | | | | 7.50 | | | | 7.12 | | | | 1.42 | |
Class B | | | 1,000.00 | | | | 1,000.00 | | | | 1,119.30 | | | | 1,013.92 | | | | 11.59 | | | | 11.02 | | | | 2.20 | |
Class C | | | 1,000.00 | | | | 1,000.00 | | | | 1,119.30 | | | | 1,014.07 | | | | 11.43 | | | | 10.87 | | | | 2.17 | |
Class I | | | 1,000.00 | | | | 1,000.00 | | | | 1,126.10 | | | | 1,020.04 | | | | 5.13 | | | | 4.87 | | | | 0.97 | |
Class R | | | 1,000.00 | | | | 1,000.00 | | | | 1,122.80 | | | | 1,016.56 | | | | 8.81 | | | | 8.37 | | | | 1.67 | |
Class R4 | | | 1,000.00 | | | | 1,000.00 | | | | 1,125.60 | | | | 1,019.54 | | | | 5.65 | | | | 5.37 | | | | 1.07 | |
Class R5 | | | 1,000.00 | | | | 1,000.00 | | | | 1,125.30 | | | | 1,020.34 | | | | 4.81 | | | | 4.57 | | | | 0.91 | |
Class Z | | | 1,000.00 | | | | 1,000.00 | | | | 1,125.90 | | | | 1,019.24 | | | | 5.97 | | | | 5.67 | | | | 1.13 | |
Expenses paid during the period are equal to the annualized expense ratio for each class as indicated above, multiplied by the average account value over the period and then multiplied by the number of days in the Fund’s most recent fiscal half year and divided by 366.
Expenses do not include fees and expenses incurred indirectly by the Fund from the underlying funds in which the Fund may invest (also referred to as “acquired funds”), including affiliated and non-affiliated pooled investment vehicles (including mutual funds and exchange traded funds).
Had Columbia Management Investment Advisers, LLC and/or certain of its affiliates not waived/reimbursed certain fees and expenses, account value at the end of the period would have been reduced.
Columbia Management Investment Advisers, LLC and/or certain of its affiliates have contractually agreed to waive certain fees and to absorb certain expenses until February 28, 2013, unless sooner terminated at the sole discretion of the Fund’s Board, such that net expenses (excluding fees and expenses of acquired funds) will not exceed 2.13% for Class B. Any amounts waived will not be reimbursed by the Fund. This change was effective January 1, 2012. If this change had been in place for the entire six month period ended April 30, 2012, the actual expenses paid would have been $11.22 for Class B: the hypothetical expenses paid would have been $10.67 for Class B.
| | | | |
| COLUMBIA SELIGMAN GLOBAL TECHNOLOGY FUND — 2012 SEMIANNUAL REPORT | | | 7 | |
Columbia Seligman Global Technology Fund
April 30, 2012 (Unaudited)
(Percentages represent value of investments compared to net assets)
| | | | | | | | |
| Issuer | | Shares | | | Value | |
| Common Stocks 91.9% | |
| | | | | | | | |
CONSUMER DISCRETIONARY 0.7% | |
Household Durables 0.4% | |
Panasonic Corp. | | | 277,200 | | | | $2,125,197 | |
Internet & Catalog Retail 0.3% | |
Expedia, Inc. | | | 31,800 | | | | 1,355,634 | |
TOTAL CONSUMER DISCRETIONARY | | | | 3,480,831 | |
|
HEALTH CARE 2.6% | |
Health Care Equipment & Supplies 0.5% | |
Baxter International, Inc. | | | 44,700 | | | | 2,476,827 | |
Life Sciences Tools & Services 2.1% | |
Agilent Technologies, Inc. | | | 84,200 | | | | 3,551,556 | |
Life Technologies Corp.(a) | | | 41,800 | | | | 1,937,848 | |
Thermo Fisher Scientific, Inc. | | | 88,200 | | | | 4,908,330 | |
| | | | | | | | |
Total | | | | 10,397,734 | |
TOTAL HEALTH CARE | | | | 12,874,561 | |
|
INFORMATION TECHNOLOGY 87.7% | |
Communications Equipment 6.3% | |
Cisco Systems, Inc. | | | 528,500 | | | | 10,649,275 | |
Comverse Technology, Inc.(a) | | | 11,989 | | | | 77,329 | |
QUALCOMM, Inc. | | | 315,771 | | | | 20,158,821 | |
Radware, Ltd.(a)(b) | | | 27,800 | | | | 1,069,744 | |
| | | | | | | | |
Total | | | | 31,955,169 | |
Computers & Peripherals 15.9% | |
Apple, Inc.(a) | | | 56,255 | | | | 32,866,421 | |
Dell, Inc.(a) | | | 761,200 | | | | 12,460,844 | |
Electronics for Imaging, Inc.(a)(b) | | | 266,803 | | | | 4,762,434 | |
EMC Corp.(a) | | | 488,300 | | | | 13,774,943 | |
NetApp, Inc.(a) | | | 313,000 | | | | 12,153,790 | |
Western Digital Corp.(a) | | | 123,100 | | | | 4,777,511 | |
| | | | | | | | |
Total | | | | 80,795,943 | |
Electronic Equipment, Instruments & Components 4.2% | |
Avnet, Inc.(a) | | | 194,100 | | | | 7,003,128 | |
Flextronics International Ltd.(a) | | | 544,300 | | | | 3,625,038 | |
InvenSense, Inc.(a) | | | 20,400 | | | | 328,032 | |
IPG Photonics Corp.(a)(b) | | | 54,025 | | | | 2,614,810 | |
Kyocera Corp. | | | 40,200 | | | | 3,919,101 | |
| | | | | | | | |
| Issuer | | Shares | | | Value | |
| Common Stocks (continued) | |
| | | | | | | | |
INFORMATION TECHNOLOGY (cont.) | |
Electronic Equipment, Instruments & Components (cont.) | |
Murata Manufacturing Co., Ltd. | | | 64,900 | | | | $3,709,012 | |
Tripod Technology Corp. | | | 80 | | | | 234 | |
| | | | | | | | |
Total | | | | 21,199,355 | |
Internet Software & Services 1.6% | |
Constant Contact, Inc.(a)(b) | | | 84,000 | | | | 2,030,280 | |
Gree, Inc.(b) | | | 127,500 | | | | 3,448,447 | |
LogMeIn, Inc.(a)(b) | | | 75,800 | | | | 2,729,558 | |
| | | | | | | | |
Total | | | | 8,208,285 | |
IT Services 8.3% | |
Amdocs Ltd.(a) | | | 629,077 | | | | 20,130,464 | |
FleetCor Technologies, Inc.(a)(b) | | | 72,600 | | | | 2,871,330 | |
Logica PLC | | | 1,853,700 | | | | 2,343,519 | |
Visa, Inc., Class A | | | 104,200 | | | | 12,814,516 | |
WNS Holdings Ltd., ADR(a) | | | 369,444 | | | | 4,111,912 | |
| | | | | | | | |
Total | | | | 42,271,741 | |
Office Electronics 2.1% | | | | | | | | |
Canon, Inc. | | | 56,500 | | | | 2,561,023 | |
Xerox Corp. | | | 1,086,800 | | | | 8,455,304 | |
| | | | | | | | |
Total | | | | 11,016,327 | |
Semiconductors & Semiconductor Equipment 18.0% | |
Advanced Micro Devices, Inc.(a) | | | 3,123,511 | | | | 22,989,041 | |
Advanced Semiconductor
Engineering, Inc. | | | 11 | | | | 11 | |
Atmel Corp.(a)(b) | | | 371,000 | | | | 3,290,770 | |
Broadcom Corp., Class A(a) | | | 141,800 | | | | 5,189,880 | |
KLA-Tencor Corp. | | | 333,300 | | | | 17,381,595 | |
Marvell Technology Group Ltd.(a) | | | 442,100 | | | | 6,635,921 | |
Microsemi Corp.(a)(b) | | | 235,600 | | | | 5,070,112 | |
Novellus Systems, Inc.(a) | | | 356,100 | | | | 16,647,675 | |
Semtech Corp.(a)(b) | | | 92,000 | | | | 2,507,920 | |
Shinko Electric Industries Co., Ltd.(b) | | | 400,900 | | | | 3,747,349 | |
Teradyne, Inc.(a)(b) | | | 308,300 | | | | 5,305,843 | |
United Microelectronics Corp. | | | 5,342,000 | | | | 2,794,257 | |
| | | | | | | | |
Total | | | | 91,560,374 | |
The accompanying Notes to Financial Statements are an integral part of this statement.
| | |
| 8 | | COLUMBIA SELIGMAN GLOBAL TECHNOLOGY FUND — 2012 SEMIANNUAL REPORT |
| | | | | | | | |
| Issuer | | Shares | | | Value | |
| Common Stocks (continued) | |
| | | | | | | | |
INFORMATION TECHNOLOGY (cont.) | |
Software 31.3% | |
Application Software 15.4% | |
Cadence Design Systems, Inc.(a)(b) | | | 240,300 | | | | $2,804,301 | |
Citrix Systems, Inc.(a) | | | 32,400 | | | | 2,773,764 | |
JDA Software Group, Inc.(a)(b) | | | 168,000 | | | | 4,851,840 | |
NICE Systems Ltd., ADR(a)(b) | | | 211,728 | | | | 8,134,590 | |
Nuance Communications, Inc.(a)(b) | | | 756,499 | | | | 18,488,836 | |
Parametric Technology Corp.(a) | | | 643,836 | | | | 13,893,981 | |
Synopsys, Inc.(a) | | | 917,449 | | | | 27,532,644 | |
| | | | | | | | |
Total | | | | 78,479,956 | |
Systems Software 15.9% | |
BMC Software, Inc.(a) | | | 177,256 | | | | 7,313,583 | |
Check Point Software Technologies Ltd.(a)(b) | | | 133,105 | | | | 7,737,394 | |
Infoblox, Inc.(a) | | | 14,393 | | | | 293,617 | |
Microsoft Corp. | | | 637,116 | | | | 20,400,454 | |
Oracle Corp. | | | 387,000 | | | | 11,373,930 | |
Rovi Corp.(a) | | | 345,700 | | | | 9,887,020 | |
Symantec Corp.(a) | | | 1,445,562 | | | | 23,880,684 | |
| | | | | | | | |
Total | | | | 80,886,682 | |
TOTAL SOFTWARE | | | | 159,366,638 | |
TOTAL INFORMATION TECHNOLOGY | | | | 446,373,832 | |
|
TELECOMMUNICATION SERVICES 0.9% | |
Diversified Telecommunication Services 0.9% | |
AT&T, Inc. | | | 141,600 | | | | 4,660,056 | |
TOTAL TELECOMMUNICATION SERVICES | | | | 4,660,056 | |
Total Common Stocks (Cost: $397,370,814) | | | | $467,389,280 | |
| | | | | | | | |
| | | Shares | | | Value | |
| Money Market Funds 6.5% | |
| | | | | | | | |
Columbia Short-Term Cash Fund, 0.144%(c)(d) | | | 32,999,033 | | | | $32,999,033 | |
Total Money Market Funds (Cost: $32,999,033) | | | | $32,999,033 | |
| | | | | | | | | | | | |
| Issuer | | Effective
Yield | | | Par/
Principal/
Shares | | | Value | |
Investments of Cash Collateral
Received for Securities on Loan 10.6% | |
| | | | | | | | | | | | |
Other Short-Term Obligations 0.4% | |
Natixis Financial Products LLC | |
05/01/12 | | | 0.510 | % | | | $2,000,000 | | | | $2,000,000 | |
Repurchase Agreements 10.2% | |
BNP Paribas Securities Corp.
dated 04/30/12, matures 05/01/12,
repurchase price $15,135,360(e) | |
| | | | 0.180 | % | | | 15,135,284 | | | | 15,135,284 | |
Mizuho Securities USA, Inc.
dated 04/30/12, matures 05/01/12,
repurchase price $10,000,067(e) | |
| | | | 0.240 | % | | | 10,000,000 | | | | 10,000,000 | |
Natixis Financial Products, Inc.
dated 04/30/12, matures 05/01/12,
repurchase price $2,000,013(e) | |
| | | | 0.240 | % | | | 2,000,000 | | | | 2,000,000 | |
Nomura Securities
dated 04/30/12, matures 05/01/12,
repurchase price $5,000,056(e) | |
| | | | 0.240 | % | | | 5,000,000 | | | | 5,000,000 | |
RBS Securities, Inc.
dated 04/30/12, matures 05/01/12,
repurchase price $10,000,003(e) | |
| | | | 0.210% | | | | 10,000,000 | | | | 10,000,000 | |
Royal Bank of Canada
dated 04/30/12, matures 05/01/12,
repurchase price $10,000,058(e) | |
| | | 0.200 | % | | | 10,000,000 | | | | 10,000,000 | |
| | | | | | | | | | | | |
Total | | | | | | | | 52,135,284 | |
Total Investments of Cash Collateral Received for Securities on Loan | |
(Cost: $54,135,284) | | | | $54,135,284 | |
Total Investments | |
(Cost: $484,505,131) | | | | $554,523,597 | |
Other Assets & Liabilities, Net | | | | (45,701,107 | ) |
Net Assets | | | | $508,822,490 | |
The accompanying Notes to Financial Statements are an integral part of this statement.
| | | | |
| COLUMBIA SELIGMAN GLOBAL TECHNOLOGY FUND — 2012 SEMIANNUAL REPORT | | | 9 | |
| | |
| Portfolio of Investments (continued) | | |
| | |
| Notes to Portfolio of Investments |
| (a) | Non-income producing. |
| (b) | At April 30, 2012, security was partially or fully on loan. |
| (c) | The rate shown is the seven-day current annualized yield at April 30, 2012. |
| (d) | Investments in affiliates during the period ended April 30, 2012: |
| | | | | | | | | | | | | | | | | | | | | | | | | | | | |
| Issuer | | Beginning
Cost | | | Purchase
Cost | | | Sales Cost/
Proceeds
from Sales | | | Realized
Gain/Loss | | | Ending
Cost | | | Dividends
or
Interest
Income | | | Value | |
Columbia Short-Term Cash Fund | | | $6,222,343 | | | | $133,006,193 | | | | $(106,229,503 | ) | | | $— | | | | $32,999,033 | | | | $25,235 | | | | $32,999,033 | |
| (e) | The table below represents securities received as collateral for repurchase agreements. This collateral is deposited with the Fund’s custodian and, pursuant to the terms of the repurchase agreement, must have an aggregate value greater than or equal to the repurchase price plus accrued interest at all times. The value of securities and/or cash held as collateral for repurchase agreements is monitored on a daily basis to ensure the proper level of collateral. |
| | | | |
| BNP Paribas Securities Corp. (0.180%) | | | | |
| |
| Security Description | | Value | |
| United States Treasury Note/Bond | | | $15,437,992 | |
| Total Market Value of Collateral Securities | | | $15,437,992 | |
| |
| Mizuho Securities USA, Inc. (0.240%) | | | | |
| |
| Security Description | | Value | |
| Fannie Mae REMICS | | | $5,060,489 | |
| Freddie Mac REMICS | | | 5,139,511 | |
| Total Market Value of Collateral Securities | | | $10,200,000 | |
| |
| Natixis Financial Products, Inc. (0.240%) | | | | |
| |
| Security Description | | Value | |
| Fannie Mae Pool | | | $70,680 | |
| Fannie Mae REMICS | | | 524,641 | |
| Fannie Mae Whole Loan | | | 16,483 | |
| Freddie Mac Gold Pool | | | 148,043 | |
| Freddie Mac Non Gold Pool | | | 38,299 | |
| Freddie Mac REMICS | | | 458,253 | |
| Government National Mortgage Association | | | 326,613 | |
| United States Treasury Note/Bond | | | 457,002 | |
| Total Market Value of Collateral Securities | | | $2,040,014 | |
The accompanying Notes to Financial Statements are an integral part of this statement.
| | |
| 10 | | COLUMBIA SELIGMAN GLOBAL TECHNOLOGY FUND — 2012 SEMIANNUAL REPORT |
| | |
| Notes to Portfolio of Investments (continued) |
| | | | |
| Nomura Securities (0.240%) | | | | |
| |
| Security Description | | Value | |
| Fannie Mae Pool | | | $1,020,291 | |
| Freddie Mac Gold Pool | | | 1,171,975 | |
| Ginnie Mae II Pool | | | 2,907,734 | |
| Total Market Value of Collateral Securities | | | $5,100,000 | |
| |
| RBS Securities, Inc. (0.210%) | | | | |
| |
| Security Description | | Value | |
| United States Treasury Note/Bond | | | $10,200,049 | |
| Total Market Value of Collateral Securities | | | $10,200,049 | |
| |
| Royal Bank of Canada (0.200%) | | | | |
| |
| Security Description | | Value | |
| Fannie Mae Pool | | | $8,815,349 | |
| Freddie Mac Gold Pool | | | 455,047 | |
| Freddie Mac Non Gold Pool | | | 452,826 | |
| Ginnie Mae II Pool | | | 476,778 | |
| Total Market Value of Collateral Securities | | | $10,200,000 | |
| | |
| Abbreviation Legend |
| ADR | | American Depositary Receipt |
The accompanying Notes to Financial Statements are an integral part of this statement.
| | | | |
| COLUMBIA SELIGMAN GLOBAL TECHNOLOGY FUND — 2012 SEMIANNUAL REPORT | | | 11 | |
| | |
| Portfolio of Investments (continued) | | |
Generally accepted accounting principles (GAAP) require disclosure regarding the inputs and valuation techniques used to measure fair value and any changes in valuation inputs or techniques. In addition, investments shall be disclosed by major category.
The Fund categorizes its fair value measurements according to a three-level hierarchy that maximizes the use of observable inputs and minimizes the use of unobservable inputs by prioritizing that the most observable input be used when available. Observable inputs are those that market participants would use in pricing an investment based on market data obtained from sources independent of the reporting entity. Unobservable inputs are those that reflect the Fund’s assumptions about the information market participants would use in pricing an investment. An investment’s level within the fair value hierarchy is based on the lowest level of any input that is deemed significant to the asset or liability’s fair value measurement. The input levels are not necessarily an indication of the risk or liquidity associated with investments at that level. For example, certain U.S. government securities are generally high quality and liquid, however, they are reflected as Level 2 because the inputs used to determine fair value may not always be quoted prices in an active market.
Fair value inputs are summarized in the three broad levels listed below:
| | Ÿ | | Level 1 — Valuations based on quoted prices for investments in active markets that the Fund has the ability to access at the measurement date (including NAV for open-end mutual funds). Valuation adjustments are not applied to Level 1 investments. |
| | Ÿ | | Level 2 — Valuations based on other significant observable inputs (including quoted prices for similar securities, interest rates, prepayment speeds, credit risks, etc.). |
| | Ÿ | | Level 3 — Valuations based on significant unobservable inputs (including the Fund’s own assumptions and judgment in determining the fair value of investments). |
Inputs that are used in determining fair value of an investment may include price information, credit data, volatility statistics, and other factors. These inputs can be either observable or unobservable. The availability of observable inputs can vary between investments, and is affected by various factors such as the type of investment, and the volume and level of activity for that investment or similar investments in the marketplace. The inputs will be considered by the Investment Manager, along with any other relevant factors in the calculation of an investment’s fair value. The Fund uses prices and inputs that are current as of the measurement date, which may include periods of market dislocations. During these periods, the availability of prices and inputs may be reduced for many investments. This condition could cause an investment to be reclassified between the various levels within the hierarchy.
Foreign equity securities actively traded in markets where there is a significant delay in the local close relative to the New York Stock Exchange (NYSE) are classified as Level 2. The values of these securities may include an adjustment to reflect the impact of significant market movements following the close of local trading, as described in Note 2 to the financial statements — Security Valuation.
Investments falling into the Level 3 category are primarily supported by quoted prices from brokers and dealers participating in the market for those investments. However, these may be classified as Level 3 investments due to lack of market transparency and corroboration to support these quoted prices. Additionally, valuation models may be used as the pricing source for any remaining investments classified as Level 3. These models rely on one or more significant unobservable inputs
The accompanying Notes to Financial Statements are an integral part of this statement.
| | |
| 12 | | COLUMBIA SELIGMAN GLOBAL TECHNOLOGY FUND — 2012 SEMIANNUAL REPORT |
and/or significant assumptions by the Investment Manager. Inputs used in valuations may include, but are not limited to financial statement analysis, capital account balances, discount rates and estimated cash flows, and comparable company data.
The following table is a summary of the inputs used to value the Fund’s investments as of April 30, 2012:
| | | | | | | | | | | | | | | | |
| | | Fair Value at April 30, 2012 | |
| Description | | Level 1
Quoted Prices
in Active
Markets for
Identical Assets | | | Level 2
Other
Significant
Observable
Inputs | | | Level 3
Significant
Unobservable
Inputs | | | Total | |
| Equity Securities | | | | | | | | | | | | | | | | |
Common Stocks | | | | | | | | | | | | | | | | |
Consumer Discretionary | | | $1,355,634 | | | | $2,125,197 | | | | $— | | | | $3,480,831 | |
Health Care | | | 12,874,561 | | | | — | | | | — | | | | 12,874,561 | |
Information Technology | | | 423,850,877 | | | | 22,522,955 | | | | — | | | | 446,373,832 | |
Telecommunication Services | | | 4,660,056 | | | | — | | | | — | | | | 4,660,056 | |
| Total Equity Securities | | | 442,741,128 | | | | 24,648,152 | | | | — | | | | 467,389,280 | |
| Other | | | | | | | | | | | | | | | | |
Money Market Funds | | | 32,999,033 | | | | — | | | | — | | | | 32,999,033 | |
Investments of Cash Collateral Received
for Securities on Loan | | | — | | | | 54,135,284 | | | | — | | | | 54,135,284 | |
| Total Other | | | 32,999,033 | | | | 54,135,284 | | | | — | | | | 87,134,317 | |
| Total | | | $475,740,161 | | | | $78,783,436 | | | | $— | | | | $554,523,597 | |
See the Portfolio of Investments for all investment classifications not indicated in the table.
The Fund’s assets assigned to the Level 2 input category are generally valued using the market approach, in which a security’s value is determined through reference to prices and information from market transactions for similar or identical assets. These assets include certain foreign securities for which a third party statistical pricing service may be employed for purposes of fair market valuation. The models utilized by the third party statistical pricing service take into account a security’s correlation to available market data including, but not limited to, intraday index, ADR, and ETF movements.
There were no transfers of financial assets between Levels 1 and 2 during the period.
How to find information about the Fund’s quarterly portfolio holdings
| (i) | The Fund files its complete schedule of portfolio holdings with the Securities and Exchange Commission (SEC) for the first and third quarters of each fiscal year on Form N-Q; |
| (ii) | The Fund’s Forms N-Q are available on the SEC’s website at www.sec.gov; |
| (iii) | The Fund’s Forms N-Q may be reviewed and copied at the SEC’s Public Reference Room in Washington, DC (information on the operations of the Public Reference Room may be obtained by calling 800.SEC.0330); and |
| (iv) | The Fund’s complete schedule of portfolio holdings, as filed on Form N-Q, can be obtained without charge, upon request, by calling 800.345.6611. |
The accompanying Notes to Financial Statements are an integral part of this statement.
| | | | |
| COLUMBIA SELIGMAN GLOBAL TECHNOLOGY FUND — 2012 SEMIANNUAL REPORT | | | 13 | |
| | |
| Statement of Assets and Liabilities | | |
April 30, 2012 (Unaudited)
| | | | | |
Assets | | | | | |
Investments, at value* | | | | | |
Unaffiliated issuers (identified cost $397,370,814) | | | $ | 467,389,280 | |
Affiliated issuers (identified cost $32,999,033) | | | | 32,999,033 | |
Investment of cash collateral received for securities on loan | | | | | |
Short-term securities (identified cost $2,000,000) | | | | 2,000,000 | |
Repurchase agreements (identified cost $52,135,284) | | | | 52,135,284 | |
Total investments (identified cost $484,505,131) | | | | 554,523,597 | |
Foreign currency (identified cost $61) | | | | 61 | |
Receivable for: | | | | | |
Investments sold | | | | 13,188,812 | |
Capital shares sold | | | | 422,875 | |
Dividends | | | | 294,559 | |
Interest | | | | 6,922 | |
Reclaims | | | | 4,018 | |
Expense reimbursement due from Investment Manager | | | | 1,688 | |
Total assets | | | | 568,442,532 | |
Liabilities | | | | | |
Due upon return of securities on loan | | | | 54,135,284 | |
Payable for: | | | | | |
Investments purchased | | | | 4,053,020 | |
Capital shares purchased | | | | 1,058,752 | |
Investment management fees | | | | 35,952 | |
Distribution fees | | | | 15,723 | |
Transfer agent fees | | | | 89,317 | |
Administration fees | | | | 2,518 | |
Plan administration fees | | | | 8 | |
Compensation of board members | | | | 22,219 | |
Other expenses | | | | 207,249 | |
Total liabilities | | | | 59,620,042 | |
Net assets applicable to outstanding capital stock | | | $ | 508,822,490 | |
The accompanying Notes to Financial Statements are an integral part of this statement.
| | |
| 14 | | COLUMBIA SELIGMAN GLOBAL TECHNOLOGY FUND — 2012 SEMIANNUAL REPORT |
April 30, 2012 (Unaudited)
| | | | | |
Represented by | | | | | |
Paid-in capital | | | $ | 454,091,993 | |
Excess of distributions over net investment income | | | | (2,353,372 | ) |
Accumulated net realized loss | | | | (12,941,067 | ) |
Unrealized appreciation (depreciation) on: | | | | | |
Investments | | | | 70,018,466 | |
Foreign currency translations | | | | 6,470 | |
Total — representing net assets applicable to outstanding capital stock | | | $ | 508,822,490 | |
*Value of securities on loan | | | $ | 52,189,052 | |
Net assets applicable to outstanding shares | | | | | |
Class A | | | $ | 379,261,386 | |
Class B | | | $ | 12,473,841 | |
Class C | | | $ | 77,822,380 | |
Class I | | | $ | 12,443 | |
Class R | | | $ | 10,493,076 | |
Class R4 | | | $ | 396,172 | |
Class R5 | | | $ | 173,913 | |
Class Z | | | $ | 28,189,279 | |
Shares outstanding | | | | | |
Class A | | | | 16,739,201 | |
Class B | | | | 645,336 | |
Class C | | | | 4,027,501 | |
Class I | | | | 544 | |
Class R | | | | 472,534 | |
Class R4 | | | | 17,404 | |
Class R5 | | | | 7,623 | |
Class Z | | | | 1,235,938 | |
Net asset value per share | | | | | |
Class A(a) | | | $ | 22.66 | |
Class B | | | $ | 19.33 | |
Class C | | | $ | 19.32 | |
Class I | | | $ | 22.87 | |
Class R | | | $ | 22.21 | |
Class R4 | | | $ | 22.76 | |
Class R5 | | | $ | 22.81 | |
Class Z | | | $ | 22.81 | |
| (a) | The maximum offering price per share for Class A is $24.04. The offering price is calculated by dividing the net asset value by 1.0 minus the maximum sales charge of 5.75%. |
The accompanying Notes to Financial Statements are an integral part of this statement.
| | | | |
| COLUMBIA SELIGMAN GLOBAL TECHNOLOGY FUND — 2012 SEMIANNUAL REPORT | | | 15 | |
Six months ended April 30, 2012 (Unaudited)
| | | | | |
Net investment income | | | | | |
Income: | | | | | |
Dividends | | | $ | 1,381,498 | |
Dividends from affiliates | | | | 25,235 | |
Income from securities lending—net | | | | 46,357 | |
Foreign taxes withheld | | | | (15,113 | ) |
Total income | | | | 1,437,977 | |
Expenses: | | | | | |
Investment management fees | | | | 2,087,946 | |
Distribution fees | | | | | |
Class A | | | | 459,577 | |
Class B | | | | 62,414 | |
Class C | | | | 370,866 | |
Class R | | | | 23,853 | |
Transfer agent fees | | | | | |
Class A | | | | 457,508 | |
Class B | | | | 16,996 | |
Class C | | | | 91,481 | |
Class R | | | | 11,537 | |
Class R4 | | | | 92 | |
Class R5 | | | | 13 | |
Class Z | | | | 24,741 | |
Administration fees | | | | 146,298 | |
Plan administration fees | | | | | |
Class R4 | | | | 506 | |
Compensation of board members | | | | 10,007 | |
Custodian fees | | | | 11,940 | |
Printing and postage fees | | | | 60,897 | |
Registration fees | | | | 45,214 | |
Professional fees | | | | 18,952 | |
Other | | | | 34,319 | |
Total expenses | | | | 3,935,157 | |
Fees waived or expenses reimbursed by Investment Manager and its affiliates | | | | (161,069 | ) |
Total net expenses | | | | 3,774,088 | |
Net investment loss | | | | (2,336,111 | ) |
Realized and unrealized gain (loss) — net | | | | | |
Net realized gain (loss) on: | | | | | |
Investments | | | | 27,801,157 | |
Foreign currency translations | | | | (45,695 | ) |
Net realized gain | | | | 27,755,462 | |
Net change in unrealized appreciation (depreciation) on: | | | | | |
Investments | | | | 30,873,086 | |
Foreign currency translations | | | | 44,175 | |
Forward foreign currency exchange contracts | | | | (33,231 | ) |
Net change in unrealized appreciation | | | | 30,884,030 | |
Net realized and unrealized gain | | | | 58,639,492 | |
Net increase in net assets resulting from operations | | | $ | 56,303,381 | |
The accompanying Notes to Financial Statements are an integral part of this statement.
| | |
| 16 | | COLUMBIA SELIGMAN GLOBAL TECHNOLOGY FUND — 2012 SEMIANNUAL REPORT |
| | |
| Statement of Changes in Net Assets | | |
| | | | | | | | | | |
| | | Six months ended
April 30, 2012
(Unaudited) | | Year ended
October 31, 2011
|
Operations | | | | | | | | | | |
Net investment loss | | | $ | (2,336,111 | ) | | | $ | (4,472,602 | ) |
Net realized gain | | | | 27,755,462 | | | | | 49,740,622 | |
Net change in unrealized appreciation (depreciation) | | | | 30,884,030 | | | | | (45,215,225 | ) |
Net increase in net assets resulting from operations | | | | 56,303,381 | | | | | 52,795 | |
Distributions to shareholders from: | | | | | | | | | | |
Net investment income | | | | | | | | | | |
Class A | | | | — | | | | | (2,822,547 | ) |
Class C | | | | — | | | | | (100,505 | ) |
Class I | | | | — | | | | | (310,825 | ) |
Class R | | | | — | | | | | (45,820 | ) |
Class R4 | | | | — | | | | | (4,568 | ) |
Class R5 | | | | — | | | | | (389,846 | ) |
Class Z | | | | — | | | | | (200 | ) |
Total distributions to shareholders | | | | — | | | | | (3,674,311 | ) |
Decrease in net assets from share transactions | | | | (27,145,944 | ) | | | | (99,544,763 | ) |
Proceeds from regulatory settlements (Note 6) | | | | 355,461 | | | | | — | |
Total increase (decrease) in net assets | | | | 29,512,898 | | | | | (103,166,279 | ) |
Net assets at beginning of period | | | | 479,309,592 | | | | | 582,475,871 | |
Net assets at end of period | | | $ | 508,822,490 | | | | $ | 479,309,592 | |
Excess of distributions over net investment income | | | $ | (2,353,372 | ) | | | $ | (17,261 | ) |
The accompanying Notes to Financial Statements are an integral part of this statement.
| | | | |
| COLUMBIA SELIGMAN GLOBAL TECHNOLOGY FUND — 2012 SEMIANNUAL REPORT | | | 17 | |
| | |
| Statement of Changes in Net Assets (continued) | | |
| | | | | | | | | | | | | | | | | | | | |
| | | Six months ended
April 30, 2012
(Unaudited) | | Year ended
October 31, 2011 |
| | | Shares | | Dollars ($) | | Shares | | Dollars ($) |
Capital stock activity | | | | | | | | | | | | | | | | | | | | |
Class A shares | | | | | | | | | | | | | | | | | | | | |
Subscriptions(a) | | | | 883,018 | | | | | 19,290,210 | | | | | 3,111,145 | | | | | 65,652,650 | |
Distributions reinvested | | | | — | | | | | — | | | | | 116,237 | | | | | 2,420,055 | |
Redemptions | | | | (2,217,852 | ) | | | | (47,043,272 | ) | | | | (5,833,406 | ) | | | | (120,999,563 | ) |
Net decrease | | | | (1,334,834 | ) | | | | (27,753,062 | ) | | | | (2,606,024 | ) | | | | (52,926,858 | ) |
Class B shares | | | | | | | | | | | | | | | | | | | | |
Subscriptions | | | | 10,707 | | | | | 200,663 | | | | | 52,341 | | | | | 977,629 | |
Redemptions(a) | | | | (89,321 | ) | | | | (1,652,897 | ) | | | | (455,534 | ) | | | | (8,153,908 | ) |
Net decrease | | | | (78,614 | ) | | | | (1,452,234 | ) | | | | (403,193 | ) | | | | (7,176,279 | ) |
Class C shares | | | | | | | | | | | | | | | | | | | | |
Subscriptions | | | | 134,014 | | | | | 2,473,229 | | | | | 358,859 | | | | | 6,487,199 | |
Distributions reinvested | | | | — | | | | | — | | | | | 4,260 | | | | | 76,431 | |
Redemptions | | | | (288,053 | ) | | | | (5,199,195 | ) | | | | (795,812 | ) | | | | (14,084,206 | ) |
Net decrease | | | | (154,039 | ) | | | | (2,725,966 | ) | | | | (432,693 | ) | | | | (7,520,576 | ) |
Class I shares | | | | | | | | | | | | | | | | | | | | |
Subscriptions | | | | — | | | | | — | | | | | 13,858 | | | | | 310,495 | |
Distributions reinvested | | | | — | | | | | — | | | | | 14,880 | | | | | 310,704 | |
Redemptions | | | | — | | | | | — | | | | | (1,430,698 | ) | | | | (31,266,877 | ) |
Net decrease | | | | — | | | | | — | | | | | (1,401,960 | ) | | | | (30,645,678 | ) |
Class R shares | | | | | | | | | | | | | | | | | | | | |
Subscriptions | | | | 116,215 | | | | | 2,517,397 | | | | | 222,666 | | | | | 4,500,421 | |
Distributions reinvested | | | | — | | | | | — | | | | | 1,949 | | | | | 39,924 | |
Redemptions | | | | (138,381 | ) | | | | (2,839,001 | ) | | | | (190,688 | ) | | | | (3,851,316 | ) |
Net increase (decrease) | | | | (22,166 | ) | | | | (321,604 | ) | | | | 33,927 | | | | | 689,029 | |
Class R4 shares | | | | | | | | | | | | | | | | | | | | |
Subscriptions | | | | 57 | | | | | 1,276 | | | | | 379 | | | | | 7,987 | |
Distributions reinvested | | | | — | | | | | — | | | | | 217 | | | | | 4,535 | |
Redemptions | | | | (4,042 | ) | | | | (82,677 | ) | | | | (5,501 | ) | | | | (115,862 | ) |
Net decrease | | | | (3,985 | ) | | | | (81,401 | ) | | | | (4,905 | ) | | | | (103,340 | ) |
Class R5 shares | | | | | | | | | | | | | | | | | | | | |
Subscriptions | | | | 6,019 | | | | | 141,537 | | | | | 936,760 | | | | | 20,037,728 | |
Distributions reinvested | | | | — | | | | | — | | | | | 18,676 | | | | | 389,775 | |
Redemptions | | | | (6 | ) | | | | (127 | ) | | | | (2,227,954 | ) | | | | (43,719,338 | ) |
Net increase (decrease) | | | | 6,013 | | | | | 141,410 | | | | | (1,272,518 | ) | | | | (23,291,835 | ) |
Class Z shares | | | | | | | | | | | | | | | | | | | | |
Subscriptions | | | | 511,658 | | | | | 10,694,834 | | | | | 1,398,010 | | | | | 29,793,167 | |
Distributions reinvested | | | | — | | | | | — | | | | | 8 | | | | | 172 | |
Redemptions | | | | (263,710 | ) | | | | (5,647,921 | ) | | | | (410,158 | ) | | | | (8,362,565 | ) |
Net increase | | | | 247,948 | | | | | 5,046,913 | | | | | 987,860 | | | | | 21,430,774 | |
Total net decrease | | | | (1,339,677 | ) | | | | (27,145,944 | ) | | | | (5,099,506 | ) | | | | (99,544,763 | ) |
| (a) | Includes conversions of Class B shares to Class A shares, if any. The line items from the prior year have been combined to conform to the current year presentation. |
The accompanying Notes to Financial Statements are an integral part of this statement.
| | |
| 18 | | COLUMBIA SELIGMAN GLOBAL TECHNOLOGY FUND — 2012 SEMIANNUAL REPORT |
The following tables are intended to help you understand the Fund’s financial performance. Certain information reflects financial results for a single share of a class held for the periods shown. Per share net investment income (loss) amounts are calculated based on average shares outstanding during the period. Total returns assume reinvestment of all dividends and distributions. Total returns do not reflect payment of sales charges, if any, and are not annualized for periods of less than one year.
| | | | | | | | | | | | | | | | | | | | | | | | | | | | | | |
| | | Six months
ended April 30, 2012 | | Year ended Oct. 31, |
| | | | 2011 | | 2010 | | 2009 | | 2008 | | 2007 |
| | | (Unaudited) | | | | | | | | | | |
Class A | | | | | | | | | | | | | | | | | | | | | | | | | | | | | | |
Per share data | | | | | | | | | | | | | | | | | | | | | | | | | | | | | | |
Net asset value, beginning of period | | | | $20.16 | | | | | $20.24 | | | | | $16.50 | | | | | $11.77 | | | | | $19.82 | | | | | $15.42 | |
Income from investment operations: | | | | | | | | | | | | | | | | | | | | | | | | | | | | | | |
Net investment loss | | | | (0.09 | ) | | | | (0.15 | ) | | | | (0.16 | ) | | | | (0.20 | ) | | | | (0.21 | ) | | | | (0.21 | ) |
Net realized and unrealized gain (loss) | | | | 2.57 | | | | | 0.21 | | | | | 3.87 | | | | | 4.74 | | | | | (7.84 | ) | | | | 4.61 | |
Total from investment operations | | | | 2.48 | | | | | 0.06 | | | | | 3.71 | | | | | 4.54 | | | | | (8.05 | ) | | | | 4.40 | |
Less distributions to shareholders from: | | | | | | | | | | | | | | | | | | | | | | | | | | | | | | |
Net investment income | | | | — | | | | | (0.14 | ) | | | | — | | | | | — | | | | | — | | | | | — | |
Total distributions to shareholders | | | | — | | | | | (0.14 | ) | | | | — | | | | | — | | | | | — | | | | | — | |
Proceeds from regulatory settlements | | | | 0.02 | | | | | — | | | | | 0.03 | | | | | 0.19 | | | | | — | | | | | — | |
Net asset value, end of period | | | | $22.66 | | | | | $20.16 | | | | | $20.24 | | | | | $16.50 | | | | | $11.77 | | | | | $19.82 | |
Total return | | | | 12.40% | (a) | | | | 0.26% | | | | | 22.67% | (b) | | | | 40.19% | (c) | | | | (40.62% | ) | | | | 28.53% | |
Ratios to average net assets(d) | | | | | | | | | | | | | | | | | | | | | | | | | | | | | | |
Expenses prior to fees waived or expenses reimbursed | | | | 1.49% | (e) | | | | 1.49% | | | | | 1.67% | | | | | 1.92% | | | | | 1.76% | | | | | 1.75% | |
Net expenses after fees waived or expenses reimbursed(f) | | | | 1.42% | (e) | | | | 1.49% | (g) | | | | 1.57% | | | | | 1.91% | | | | | 1.76% | | | | | 1.75% | |
Net investment loss | | | | (0.83% | )(e) | | | | (0.70% | )(g) | | | | (0.89% | ) | | | | (1.46% | ) | | | | (1.23% | ) | | | | (1.21% | ) |
Supplemental data | | | | | | | | | | | | | | | | | | | | | | | | | | | | | | |
Net assets, end of period (in thousands) | | | | $379,261 | | | | | $364,366 | | | | | $418,600 | | | | | $325,790 | | | | | $165,249 | | | | | $305,156 | |
Portfolio turnover | | | | 49% | | | | | 95% | | | | | 111% | | | | | 150% | | | | | 171% | | | | | 208% | |
The accompanying Notes to Financial Statements are an integral part of this statement.
| | | | |
| COLUMBIA SELIGMAN GLOBAL TECHNOLOGY FUND — 2012 SEMIANNUAL REPORT | | | 19 | |
| | |
| Financial Highlights (continued) | | |
Notes to Financial Highlights
| (a) | During the six months ended April 30, 2012, the Fund received proceeds from a regulatory settlement. Had the Fund not received these proceeds, the total return would have been lower by 0.07%. |
| (b) | During the year ended October 31, 2010, the Fund received proceeds from a regulatory settlement. Had the Fund not received these proceeds, the total return would have been lower by 0.16%. |
| (c) | During the year ended October 31, 2009, the Fund received proceeds from a regulatory settlement. Had the Fund not received these proceeds, the total return would have been lower by 1.61%. |
| (d) | In addition to the fees and expenses which the Fund bears directly, the Fund indirectly bears a pro rata share of the fees and expenses of the acquired funds in which it invests. Such indirect expenses are not included in the reported expense ratios. |
| (f) | The Investment Manager and certain of its affiliates agreed to waive/reimburse certain fees and expenses, if applicable. |
| (g) | The benefits derived from expense reductions had an impact of less than 0.01%. |
The accompanying Notes to Financial Statements are an integral part of this statement.
| | |
| 20 | | COLUMBIA SELIGMAN GLOBAL TECHNOLOGY FUND — 2012 SEMIANNUAL REPORT |
| | | | | | | | | | | | | | | | | | | | | | | | | | | | | | |
| | | Six months
ended April 30, 2012 | | Year ended Oct. 31, |
| | | | 2011 | | 2010 | | 2009 | | 2008 | | 2007 |
| | | (Unaudited) | | | | | | | | | | |
Class B | | | | | | | | | | | | | | | | | | | | | | | | | | | | | | |
Per share data | | | | | | | | | | | | | | | | | | | | | | | | | | | | | | |
Net asset value, beginning of period | | | | $17.27 | | | | | $17.35 | | | | | $14.25 | | | | | $10.24 | | | | | $17.38 | | | | | $13.62 | |
Income from investment
operations: | | | | | | | | | | | | | | | | | | | | | | | | | | | | | | |
Net investment loss | | | | (0.15 | ) | | | | (0.26 | ) | | | | (0.26 | ) | | | | (0.26 | ) | | | | (0.29 | ) | | | | (0.30 | ) |
Net realized and unrealized gain (loss) | | | | 2.20 | | | | | 0.18 | | | | | 3.33 | | | | | 4.11 | | | | | (6.85 | ) | | | | 4.06 | |
Total from investment operations | | | | 2.05 | | | | | (0.08 | ) | | | | 3.07 | | | | | 3.85 | | | | | (7.14 | ) | | | | 3.76 | |
Proceeds from regulatory settlements | | | | 0.01 | | | | | — | | | | | 0.03 | | | | | 0.16 | | | | | — | | | | | — | |
Net asset value, end of period | | | | $19.33 | | | | | $17.27 | | | | | $17.35 | | | | | $14.25 | | | | | $10.24 | | | | | $17.38 | |
Total return | | | | 11.93% | (a) | | | | (0.46% | ) | | | | 21.75% | (b) | | | | 39.16% | (c) | | | | (41.08% | ) | | | | 27.61% | |
Ratios to average net assets(d) | | | | | | | | | | | | | | | | | | | | | | | | | | | | | | |
Expenses prior to fees waived or expenses reimbursed | | | | 2.26% | (e) | | | | 2.25% | | | | | 2.44% | | | | | 2.64% | | | | | 2.51% | | | | | 2.50% | |
Net expenses after fees waived or expenses reimbursed(f) | | | | 2.20% | (e) | | | | 2.25% | (g) | | | | 2.34% | | | | | 2.63% | | | | | 2.51% | | | | | 2.50% | |
Net investment loss | | | | (1.60% | )(e) | | | | (1.47% | )(g) | | | | (1.66% | ) | | | | (2.21% | ) | | | | (1.98% | ) | | | | (1.96% | ) |
Supplemental data | | | | | | | | | | | | | | | | | | | | | | | | | | | | | | |
Net assets, end of period
(in thousands) | | | | $12,474 | | | | | $12,499 | | | | | $19,558 | | | | | $21,966 | | | | | $7,086 | | | | | $28,767 | |
Portfolio turnover | | | | 49% | | | | | 95% | | | | | 111% | | | | | 150% | | | | | 171% | | | | | 208% | |
Notes to Financial Highlights
| (a) | During the six months ended April 30, 2012, the Fund received proceeds from a regulatory settlement. Had the Fund not received these proceeds, the total return would have been lower by 0.07%. |
| (b) | During the year ended October 31, 2010, the Fund received proceeds from a regulatory settlement. Had the Fund not received these proceeds, the total return would have been lower by 0.18%. |
| (c) | During the year ended October 31, 2009, the Fund received proceeds from a regulatory settlement. Had the Fund not received these proceeds, the total return would have been lower by 1.61%. |
| (d) | In addition to the fees and expenses which the Fund bears directly, the Fund indirectly bears a pro rata share of the fees and expenses of the acquired funds in which it invests. Such indirect expenses are not included in the reported expense ratios. |
| (f) | The Investment Manager and certain of its affiliates agreed to waive/reimburse certain fees and expenses, if applicable. |
| (g) | The benefits derived from expense reductions had an impact of less than 0.01%. |
The accompanying Notes to Financial Statements are an integral part of this statement.
| | | | |
| COLUMBIA SELIGMAN GLOBAL TECHNOLOGY FUND — 2012 SEMIANNUAL REPORT | | | 21 | |
| | |
| Financial Highlights (continued) | | |
| | | | | | | | | | | | | | | | | | | | | | | | | | | | | | |
| | | Six months
ended April 30, 2012 | | Year ended Oct. 31, |
| | | | 2011 | | 2010 | | 2009 | | 2008 | | 2007 |
| | | (Unaudited) | | | | | | | | | | |
Class C | | | | | | | | | | | | | | | | | | | | | | | | | | | | | | |
Per share data | | | | | | | | | | | | | | | | | | | | | | | | | | | | | | |
Net asset value, beginning of period | | | | $17.26 | | | | | $17.37 | | | | | $14.25 | | | | | $10.25 | | | | | $17.39 | | | | | $13.63 | |
Income from investment
operations: | | | | | | | | | | | | | | | | | | | | | | | | | | | | | | |
Net investment loss | | | | (0.14 | ) | | | | (0.26 | ) | | | | (0.26 | ) | | | | (0.26 | ) | | | | (0.28 | ) | | | | (0.30 | ) |
Net realized and unrealized gain (loss) | | | | 2.19 | | | | | 0.17 | | | | | 3.35 | | | | | 4.10 | | | | | (6.86 | ) | | | | 4.06 | |
Total from investment operations | | | | 2.05 | | | | | (0.09 | ) | | | | 3.09 | | | | | 3.84 | | | | | (7.14 | ) | | | | 3.76 | |
Less distributions to shareholders
from: | | | | | | | | | | | | | | | | | | | | | | | | | | | | | | |
Net investment income | | | | — | | | | | (0.02 | ) | | | | — | | | | | — | | | | | — | | | | | — | |
Total distributions to shareholders | | | | — | | | | | (0.02 | ) | | | | — | | | | | — | | | | | — | | | | | — | |
Proceeds from regulatory settlements | | | | 0.01 | | | | | — | | | | | 0.03 | | | | | 0.16 | | | | | — | | | | | — | |
Net asset value, end of period | | | | $19.32 | | | | | $17.26 | | | | | $17.37 | | | | | $14.25 | | | | | $10.25 | | | | | $17.39 | |
Total return | | | | 11.93% | (a) | | | | (0.51% | ) | | | | 21.89% | (b) | | | | 39.02% | (c) | | | | (41.06% | ) | | | | 27.59% | |
Ratios to average net assets(d) | | | | | | | | | | | | | | | | | | | | | | | | | | | | | | |
Expenses prior to fees waived or expenses reimbursed | | | | 2.24% | (e) | | | | 2.25% | | | | | 2.43% | | | | | 2.70% | | | | | 2.51% | | | | | 2.50% | |
Net expenses after fees waived or expenses reimbursed(f) | | | | 2.17% | (e) | | | | 2.25% | (g) | | | | 2.33% | | | | | 2.69% | | | | | 2.51% | | | | | 2.50% | |
Net investment loss | | | | (1.58% | )(e) | | | | (1.45% | )(g) | | | | (1.65% | ) | | | | (2.24% | ) | | | | (1.98% | ) | | | | (1.96% | ) |
Supplemental data | | | | | | | | | | | | | | | | | | | | | | | | | | | | | | |
Net assets, end of period
(in thousands) | | | | $77,822 | | | | | $72,162 | | | | | $80,128 | | | | | $69,849 | | | | | $53,538 | | | | | $27,633 | |
Portfolio turnover | | | | 49% | | | | | 95% | | | | | 111% | | | | | 150% | | | | | 171% | | | | | 208% | |
Notes to Financial Highlights
| (a) | During the six months ended April 30, 2012, the Fund received proceeds from a regulatory settlement. Had the Fund not received these proceeds, the total return would have been lower by 0.07%. |
| (b) | During the year ended October 31, 2010, the Fund received proceeds from a regulatory settlement. Had the Fund not received these proceeds, the total return would have been lower by 0.18%. |
| (c) | During the year ended October 31, 2009, the Fund received proceeds from a regulatory settlement. Had the Fund not received these proceeds, the total return would have been lower by 1.61%. |
| (d) | In addition to the fees and expenses which the Fund bears directly, the Fund indirectly bears a pro rata share of the fees and expenses of the acquired funds in which it invests. Such indirect expenses are not included in the reported expense ratios. |
| (f) | The Investment Manager and certain of its affiliates agreed to waive/reimburse certain fees and expenses, if applicable. |
| (g) | The benefits derived from expense reductions had an impact of less than 0.01%. |
The accompanying Notes to Financial Statements are an integral part of this statement.
| | |
| 22 | | COLUMBIA SELIGMAN GLOBAL TECHNOLOGY FUND — 2012 SEMIANNUAL REPORT |
| | | | | | | | | | | | | | | | | | | | |
| | | Six months
ended April 30, 2012 | | Year ended Oct. 31, |
| | | | 2011 | | 2010 | | 2009(a) |
| | | (Unaudited) | | | | | | |
Class I | | | | | | | | | | | | | | | | | | | | |
Per share data | | | | | | | | | | | | | | | | | | | | |
Net asset value, beginning of period | | | | $20.31 | | | | | $20.37 | | | | | $16.52 | | | | | $15.56 | |
Income from investment
operations: | | | | | | | | | | | | | | | | | | | | |
Net investment loss | | | | (0.04 | ) | | | | (0.06 | ) | | | | (0.08 | ) | | | | (0.03 | ) |
Net realized and unrealized gain | | | | 2.58 | | | | | 0.22 | | | | | 3.90 | | | | | 0.99 | |
Total from investment operations | | | | 2.54 | | | | | 0.16 | | | | | 3.82 | | | | | 0.96 | |
Less distributions to shareholders
from: | | | | | | | | | | | | | | | | | | | | |
Net investment income | | | | — | | | | | (0.22 | ) | | | | — | | | | | — | |
Total distributions to shareholders | | | | — | | | | | (0.22 | ) | | | | — | | | | | — | |
Proceeds from regulatory settlements | | | | 0.02 | | | | | — | | | | | 0.03 | | | | | — | |
Net asset value, end of period | | | | $22.87 | | | | | $20.31 | | | | | $20.37 | | | | | $16.52 | |
Total return | | | | 12.61% | (b) | | | | 0.77% | | | | | 23.31% | (c) | | | | 6.17% | |
Ratios to average net assets(d) | | | | | | | | | | | | | | | | | | | | |
Expenses prior to fees waived or
expenses reimbursed | | | | 0.99% | (e) | | | | 1.09% | | | | | 1.17% | | | | | 1.07% | (e) |
Net expenses after fees waived or
expenses reimbursed(f) | | | | 0.97% | (e) | | | | 1.09% | | | | | 1.12% | | | | | 1.07% | (e) |
Net investment loss | | | | (0.38% | )(e) | | | | (0.28% | ) | | | | (0.45% | ) | | | | (0.76% | )(e) |
Supplemental data | | | | | | | | | | | | | | | | | | | | |
Net assets, end of period
(in thousands) | | | | $12 | | | | | $11 | | | | | $28,563 | | | | | $23,827 | |
Portfolio turnover | | | | 49% | | | | | 95% | | | | | 111% | | | | | 150% | |
Notes to Financial Highlights
| (a) | For the period from August 3, 2009 (commencement of operations) to October 31, 2009. |
| (b) | During the six months ended April 30, 2012, the Fund received proceeds from a regulatory settlement. Had the Fund not received these proceeds, the total return would have been lower by 0.07%. |
| (c) | During the year ended October 31, 2010, the Fund received proceeds from a regulatory settlement. Had the Fund not received these proceeds, the total return would have been lower by 0.16%. |
| (d) | In addition to the fees and expenses which the Fund bears directly, the Fund indirectly bears a pro rata share of the fees and expenses of the acquired funds in which it invests. Such indirect expenses are not included in the reported expense ratios. |
| (f) | The Investment Manager and certain of its affiliates agreed to waive/reimburse certain fees and expenses, if applicable. |
The accompanying Notes to Financial Statements are an integral part of this statement.
| | | | |
| COLUMBIA SELIGMAN GLOBAL TECHNOLOGY FUND — 2012 SEMIANNUAL REPORT | | | 23 | |
| | |
| Financial Highlights (continued) | | |
| | | | | | | | | | | | | | | | | | | | | | | | | | | | | | |
| | | Six months
ended April 30, 2012 | | Year ended Oct. 31, |
| | | | 2011 | | 2010 | | 2009 | | 2008 | | 2007 |
| | | (Unaudited) | | | | | | | | | | |
Class R | | | | | | | | | | | | | | | | | | | | | | | | | | | | | | |
Per share data | | | | | | | | | | | | | | | | | | | | | | | | | | | | | | |
Net asset value, beginning of period | | | | $19.78 | | | | | $19.88 | | | | | $16.25 | | | | | $11.62 | | | | | $19.62 | | | | | $15.30 | |
Income from investment
operations: | | | | | | | | | | | | | | | | | | | | | | | | | | | | | | |
Net investment loss | | | | (0.11 | ) | | | | (0.19 | ) | | | | (0.22 | ) | | | | (0.23 | ) | | | | (0.24 | ) | | | | (0.25 | ) |
Net realized and unrealized gain (loss) | | | | 2.52 | | | | | 0.19 | | | | | 3.82 | | | | | 4.68 | | | | | (7.76 | ) | | | | 4.57 | |
Total from investment operations | | | | 2.41 | | | | | — | | | | | 3.60 | | | | | 4.45 | | | | | (8.00 | ) | | | | 4.32 | |
Less distributions to shareholders
from: | | | | | | | | | | | | | | | | | | | | | | | | | | | | | | |
Net investment income | | | | — | | | | | (0.10 | ) | | | | — | | | | | — | | | | | — | | | | | — | |
Total distributions to shareholders | | | | — | | | | | (0.10 | ) | | | | — | | | | | — | | | | | — | | | | | — | |
Proceeds from regulatory settlements | | | | 0.02 | | | | | — | | | | | 0.03 | | | | | 0.18 | | | | | — | | | | | — | |
Net asset value, end of period | | | | $22.21 | | | | | $19.78 | | | | | $19.88 | | | | | $16.25 | | | | | $11.62 | | | | | $19.62 | |
Total return | | | | 12.28% | (a) | | | | (0.04% | ) | | | | 22.34% | (b) | | | | 39.85% | (c) | | | | (40.77% | ) | | | | 28.23% | |
Ratios to average net assets(d) | | | | | | | | | | | | | | | | | | | | | | | | | | | | | | |
Expenses prior to fees waived or expenses reimbursed | | | | 1.73% | (e) | | | | 1.74% | | | | | 1.95% | | | | | 2.17% | | | | | 2.01% | | | | | 2.00% | |
Net expenses after fees waived or expenses reimbursed(f) | | | | 1.67% | (e) | | | | 1.74% | (g) | | | | 1.90% | | | | | 2.17% | | | | | 2.01% | | | | | 2.00% | |
Net investment loss | | | | (1.07% | )(e) | | | | (0.95% | )(g) | | | | (1.22% | ) | | | | (1.70% | ) | | | | (1.48% | ) | | | | (1.46% | ) |
Supplemental data | | | | | | | | | | | | | | | | | | | | | | | | | | | | | | |
Net assets, end of period
(in thousands) | | | | $10,493 | | | | | $9,787 | | | | | $9,158 | | | | | $5,131 | | | | | $2,067 | | | | | $1,282 | |
Portfolio turnover | | | | 49% | | | | | 95% | | | | | 111% | | | | | 150% | | | | | 171% | | | | | 208% | |
Notes to Financial Highlights
| (a) | During the six months ended April 30, 2012, the Fund received proceeds from a regulatory settlement. Had the Fund not received these proceeds, the total return would have been lower by 0.07%. |
| (b) | During the year ended October 31, 2010, the Fund received proceeds from a regulatory settlement. Had the Fund not received these proceeds, the total return would have been lower by 0.16%. |
| (c) | During the year ended October 31, 2009, the Fund received proceeds from a regulatory settlement. Had the Fund not received these proceeds, the total return would have been lower by 1.61%. |
| (d) | In addition to the fees and expenses which the Fund bears directly, the Fund indirectly bears a pro rata share of the fees and expenses of the acquired funds in which it invests. Such indirect expenses are not included in the reported expense ratios. |
| (f) | The Investment Manager and certain of its affiliates agreed to waive/reimburse certain fees and expenses, if applicable. |
| (g) | The benefits derived from expense reductions had an impact of less than 0.01%. |
The accompanying Notes to Financial Statements are an integral part of this statement.
| | |
| 24 | | COLUMBIA SELIGMAN GLOBAL TECHNOLOGY FUND — 2012 SEMIANNUAL REPORT |
| | | | | | | | | | | | | | | | | | | | |
| | | Six months
ended April 30, 2012 | | Year ended Oct. 31, |
| | | | 2011 | | 2010 | | 2009(a) |
| | | (Unaudited) | | | | | | |
Class R4 | | | | | | | | | | | | | | | | | | | | |
Per share data | | | | | | | | | | | | | | | | | | | | |
Net asset value, beginning of period | | | | $20.22 | | | | | $20.29 | | | | | $16.51 | | | | | $15.56 | |
Income from investment
operations: | | | | | | | | | | | | | | | | | | | | |
Net investment loss | | | | (0.05 | ) | | | | (0.10 | ) | | | | (0.14 | ) | | | | (0.04 | ) |
Net realized and unrealized gain | | | | 2.57 | | | | | 0.20 | | | | | 3.89 | | | | | 0.99 | |
Total from investment operations | | | | 2.52 | | | | | 0.10 | | | | | 3.75 | | | | | 0.95 | |
Less distributions to shareholders
from: | | | | | | | | | | | | | | | | | | | | |
Net investment income | | | | — | | | | | (0.17 | ) | | | | — | | | | | — | |
Total distributions to shareholders | | | | — | | | | | (0.17 | ) | | | | — | | | | | — | |
Proceeds from regulatory settlements | | | | 0.02 | | | | | — | | | | | 0.03 | | | | | — | |
Net asset value, end of period | | | | $22.76 | | | | | $20.22 | | | | | $20.29 | | | | | $16.51 | |
Total return | | | | 12.56% | (b) | | | | 0.48% | | | | | 22.89% | (c) | | | | 6.10% | |
Ratios to average net assets(d) | | | | | | | | | | | | | | | | | | | | |
Expenses prior to fees waived or
expenses reimbursed | | | | 1.28% | (e) | | | | 1.29% | | | | | 1.48% | | | | | 1.38% | (e) |
Net expenses after fees waived or
expenses reimbursed(f) | | | | 1.07% | (e) | | | | 1.29% | | | | | 1.42% | | | | | 1.38% | (e) |
Net investment loss | | | | (0.46% | )(e) | | | | (0.50% | ) | | | | (0.75% | ) | | | | (1.07% | )(e) |
Supplemental data | | | | | | | | | | | | | | | | | | | | |
Net assets, end of period
(in thousands) | | | | $396 | | | | | $432 | | | | | $534 | | | | | $289 | |
Portfolio turnover | | | | 49% | | | | | 95% | | | | | 111% | | | | | 150% | |
Notes to Financial Highlights
| (a) | For the period from August 3, 2009 (commencement of operations) to October 31, 2009. |
| (b) | During the six months ended April 30, 2012, the Fund received proceeds from a regulatory settlement. Had the Fund not received these proceeds, the total return would have been lower by 0.07%. |
| (c) | During the year ended October 31, 2010, the Fund received proceeds from a regulatory settlement. Had the Fund not received these proceeds, the total return would have been lower by 0.16%. |
| (d) | In addition to the fees and expenses which the Fund bears directly, the Fund indirectly bears a pro rata share of the fees and expenses of the acquired funds in which it invests. Such indirect expenses are not included in the reported expense ratios. |
| (f) | The Investment Manager and certain of its affiliates agreed to waive/reimburse certain fees and expenses, if applicable. |
The accompanying Notes to Financial Statements are an integral part of this statement.
| | | | |
| COLUMBIA SELIGMAN GLOBAL TECHNOLOGY FUND — 2012 SEMIANNUAL REPORT | | | 25 | |
| | |
| Financial Highlights (continued) | | |
| | | | | | | | | | | | | | | | | | | | |
| | | Six months
ended April 30, 2012 | | Year ended Oct. 31, |
| | | | 2011 | | 2010 | | 2009(a) |
| | | (Unaudited) | | | | | | |
Class R5 | | | | | | | | | | | | | | | | | | | | |
Per share data | | | | | | | | | | | | | | | | | | | | |
Net asset value, beginning of period | | | | $20.27 | | | | | $20.35 | | | | | $16.52 | | | | | $15.56 | |
Income from investment
operations: | | | | | | | | | | | | | | | | | | | | |
Net investment loss | | | | (0.04 | ) | | | | (0.05 | ) | | | | (0.42 | ) | | | | (0.02 | ) |
Net realized and unrealized gain | | | | 2.56 | | | | | 0.19 | | | | | 4.22 | | | | | 0.98 | |
Total from investment operations | | | | 2.52 | | | | | 0.14 | | | | | 3.80 | | | | | 0.96 | |
Less distributions to shareholders
from: | | | | | | | | | | | | | | | | | | | | |
Net investment income | | | | — | | | | | (0.22 | ) | | | | — | | | | | — | |
Total distributions to shareholders | | | | — | | | | | (0.22 | ) | | | | — | | | | | — | |
Proceeds from regulatory settlements | | | | 0.02 | | | | | — | | | | | 0.03 | | | | | — | |
Net asset value, end of period | | | | $22.81 | | | | | $20.27 | | | | | $20.35 | | | | | $16.52 | |
Total return | | | | 12.53% | (b) | | | | 0.66% | | | | | 23.18% | (c) | | | | 6.17% | |
Ratios to average net assets(d) | | | | | | | | | | | | | | | | | | | | |
Expenses prior to fees waived or
expenses reimbursed | | | | 1.05% | (e) | | | | 1.03% | | | | | 1.28% | | | | | 1.18% | (e) |
Net expenses after fees waived or
expenses reimbursed(f) | | | | 0.91% | (e) | | | | 1.03% | | | | | 1.13% | | | | | 1.18% | (e) |
Net investment loss | | | | (0.32% | )(e) | | | | (0.21% | ) | | | | (2.23% | ) | | | | (0.56% | )(e) |
Supplemental data | | | | | | | | | | | | | | | | | | | | |
Net assets, end of period
(in thousands) | | | | $174 | | | | | $33 | | | | | $25,932 | | | | | $5 | |
Portfolio turnover | | | | 49% | | | | | 95% | | | | | 111% | | | | | 150% | |
Notes to Financial Highlights
| (a) | For the period from August 3, 2009 (commencement of operations) to October 31, 2009. |
| (b) | During the six months ended April 30, 2012, the Fund received proceeds from a regulatory settlement. Had the Fund not received these proceeds, the total return would have been lower by 0.07%. |
| (c) | During the year ended October 31, 2010, the Fund received proceeds from a regulatory settlement. Had the Fund not received these proceeds, the total return would have been lower by 0.16%. |
| (d) | In addition to the fees and expenses which the Fund bears directly, the Fund indirectly bears a pro rata share of the fees and expenses of the acquired funds in which it invests. Such indirect expenses are not included in the reported expense ratios. |
| (f) | The Investment Manager and certain of its affiliates agreed to waive/reimburse certain fees and expenses, if applicable. |
The accompanying Notes to Financial Statements are an integral part of this statement.
| | |
| 26 | | COLUMBIA SELIGMAN GLOBAL TECHNOLOGY FUND — 2012 SEMIANNUAL REPORT |
| | | | | | | | | | | | | | | |
| | | Six months
ended April 30, 2012 | | Year ended Oct. 31, |
| | | | 2011 | | 2010(a) |
| | | (Unaudited) | | | | |
Class Z | | | | | | | | | | | | | | | |
Per share data | | | | | | | | | | | | | | | |
Net asset value, beginning of period | | | | $20.26 | | | | | $20.36 | | | | | $19.28 | |
Income from investment
operations: | | | | | | | | | | | | | | | |
Net investment loss | | | | (0.06 | ) | | | | (0.06 | ) | | | | (0.03 | ) |
Net realized and unrealized gain | | | | 2.59 | | | | | 0.18 | | | | | 1.11 | |
Total from investment operations | | | | 2.53 | | | | | 0.12 | | | | | 1.08 | |
Less distributions to shareholders
from: | | | | | | | | | | | | | | | |
Net investment income | | | | — | | | | | (0.22 | ) | | | | — | |
Total distributions to shareholders | | | | — | | | | | (0.22 | ) | | | | — | |
Proceeds from regulatory settlements | | | | 0.02 | | | | | — | | | | | — | |
Net asset value, end of period | | | | $22.81 | | | | | $20.26 | | | | | $20.36 | |
Total return | | | | 12.59% | (b) | | | | 0.55% | | | | | 5.60% | |
Ratios to average net assets(c) | | | | | | | | | | | | | | | |
Expenses prior to fees waived or
expenses reimbursed | | | | 1.20% | (d) | | | | 1.14% | | | | | 1.31% | (d) |
Net expenses after fees waived or
expenses reimbursed(e) | | | | 1.13% | (d) | | | | 1.14% | (f) | | | | 1.28% | (d) |
Net investment loss | | | | (0.56% | )(d) | | | | (0.30% | )(f) | | | | (1.57% | )(d) |
Supplemental data | | | | | | | | | | | | | | | |
Net assets, end of period
(in thousands) | | | | $28,189 | | | | | $20,020 | | | | | $3 | |
Portfolio turnover | | | | 49% | | | | | 95% | | | | | 111% | |
Notes to Financial Highlights
| (a) | For the period from September 27, 2010 (commencement of operations) to October 31, 2010. |
| (b) | During the six months April 30, 2012, the Fund received proceeds from a regulatory settlement. Had the Fund not received these proceeds, the total return would have been lower by 0.07%. |
| (c) | In addition to the fees and expenses which the Fund bears directly, the Fund indirectly bears a pro rata share of the fees and expenses of the acquired funds in which it invests. Such indirect expenses are not included in the reported expense ratios. |
| (e) | The Investment Manager and certain of its affiliates agreed to waive/reimburse certain fees and expenses, if applicable. |
| (f) | The benefits derived from expense reductions had an impact of less than 0.01%. |
The accompanying Notes to Financial Statements are an integral part of this statement.
| | | | |
| COLUMBIA SELIGMAN GLOBAL TECHNOLOGY FUND — 2012 SEMIANNUAL REPORT | | | 27 | |
| | |
| Notes to Financial Statements | | |
April 30, 2012 (Unaudited)
Columbia Seligman Global Technology Fund (the Fund), a series of Columbia Funds Series Trust II (the Trust), is a diversified fund. The Trust is registered under the Investment Company Act of 1940, as amended (the 1940 Act), as an open-end management investment company organized as a Massachusetts business trust.
Fund Shares
The Trust may issue an unlimited number of shares (without par value). The Fund offers Class A, Class B, Class C, Class I, Class R, Class R4, Class R5 and Class Z shares. All share classes have identical voting, dividend and liquidation rights. Each share class has its own expense structure and sales charges, as applicable.
Class A shares are subject to a maximum front-end sales charge of 5.75% based on the initial investment amount. Class A shares purchased without an initial sales charge in accounts aggregating $1 million to $50 million at the time of purchase are subject to a contingent deferred sales charge (CDSC) if the shares are sold within 18 months of purchase, charged as follows: 1.00% CDSC if redeemed within 12 months of purchase, and 0.50% CDSC if redeemed more than 12, but less than 18, months after purchase.
Class B shares may be subject to a maximum CDSC of 5.00% based upon the holding period after purchase. Class B shares will generally convert to Class A shares eight years after purchase. The Fund no longer accepts investments by new or existing investors in the Fund’s Class B shares, except in connection with the reinvestment of any dividend and/or capital gain distributions in Class B shares of the Fund and exchanges by existing Class B shareholders of certain other funds within the Columbia Family of Funds.
| • | | Class C shares are subject to a 1.00% CDSC on shares redeemed within one year of purchase. |
| • | | Class I shares are not subject to sales charges and are only available to the Columbia Family of Funds. |
| • | | Class R shares are not subject to sales charges and are only available to qualifying institutional investors. |
| • | | Class R4 shares are not subject to sales charges; however, this share class is closed to new investors. |
| • | | Class R5 shares are not subject to sales charges; however, this share class is closed to new investors. |
| | |
| 28 | | COLUMBIA SELIGMAN GLOBAL TECHNOLOGY FUND — 2012 SEMIANNUAL REPORT |
| • | | Class Z shares are not subject to sales charges, and are only available to certain investors, as described in the Fund’s prospectus. |
| Note | 2. Summary of Significant Accounting Policies |
Use of Estimates
The preparation of financial statements in accordance with U.S. generally accepted accounting principles (GAAP) requires management to make certain estimates and assumptions that affect the reported amounts of assets and liabilities, the disclosure of contingent assets and liabilities at the date of the financial statements and the reported amounts of revenue and expenses during the reporting period. Actual results could differ from those estimates.
The following is a summary of significant accounting policies consistently followed by the Fund in the preparation of its financial statements.
Security Valuation
All equity securities are valued at the close of business of the New York Stock Exchange (NYSE). Equity securities are valued at the last quoted sales price on the principal exchange or market on which they trade, except for securities traded on the NASDAQ Stock Market, which are valued at the NASDAQ official close price. Unlisted securities or listed securities for which there were no sales during the day are valued at the mean of the latest quoted bid and asked prices on such exchanges or markets.
Debt securities generally are valued by pricing services approved by the Board of Trustees (the Board) based upon market transactions for normal, institutional-size trading units of similar securities. The services may use various pricing techniques which take into account appropriate factors such as yield, quality, coupon rate, maturity, type of issue, trading characteristics and other data, as well as broker quotes. Debt securities for which quotations are readily available may also be valued based upon an over-the-counter or exchange bid quotation.
Foreign securities are valued based on quotations from the principal market in which such securities are normally traded. If any foreign share prices are not readily available as a result of limited share activity the securities are valued at the mean of the latest quoted bid and asked prices on such exchanges or markets. Foreign currency exchange rates are generally determined at 4:00 p.m. Eastern (U.S.) time. However, many securities markets and exchanges outside the U.S. close prior to the close of the NYSE; therefore, the closing prices for securities in such markets or on such exchanges may not fully reflect events that occur after such close but before the close of the NYSE. In those situations, foreign securities will be fair valued pursuant to the policy adopted by the Board,
| | | | |
| COLUMBIA SELIGMAN GLOBAL TECHNOLOGY FUND — 2012 SEMIANNUAL REPORT | | | 29 | |
| | |
| Notes to Financial Statements (continued) | | |
including utilizing a third party pricing service to determine these fair values. The third party pricing service takes into account multiple factors, including, but not limited to, movements in the U.S. securities markets, certain depositary receipts, futures contracts and foreign exchange rates that have occurred subsequent to the close of the foreign exchange, to determine a good faith estimate that reasonably reflects the current market conditions as of the close of the NYSE. The fair value of a security is likely to be different from the quoted or published price, if available.
Investments in other open-end investment companies, including money market funds, are valued at net asset value.
Short-term securities purchased within 60 days to maturity are valued at amortized cost, which approximates market value. The value of short-term securities originally purchased with maturities greater than 60 days is determined based on an amortized value to par upon reaching 60 days to maturity. Short-term securities maturing in more than 60 days from the valuation date are valued at the market price or approximate market value based on current interest rates.
Investments for which market quotations are not readily available, or that have quotations which management believes are not reliable, are valued at fair value as determined in good faith under consistently applied procedures established by and under the general supervision of the Board. If a security or class of securities (such as foreign securities) is valued at fair value, such value is likely to be different from the last quoted market price for the security. The determination of fair value often requires significant judgment. To determine fair value, management may use assumptions including but not limited to future cash flows and estimated risk premiums. Multiple inputs from various sources may be used to determine value.
Foreign Currency Transactions and Translation
The values of all assets and liabilities denominated in foreign currencies are translated into U.S. dollars at that day’s exchange rates. Net realized and unrealized gains (losses) on foreign currency transactions and translations include gains (losses) arising from the fluctuation in exchange rates between trade and settlement dates on securities transactions, gains (losses) arising from the disposition of foreign currency and currency gains (losses) between the accrual and payment dates on dividends, interest income and foreign withholding taxes.
For financial statement purposes, the Fund does not distinguish that portion of gains (losses) on investments which is due to changes in foreign exchange rates from that which is due to changes in market prices of the investments. Such fluctuations are included with the net realized and unrealized gains (losses) on investments in the Statement of Operations.
| | |
| 30 | | COLUMBIA SELIGMAN GLOBAL TECHNOLOGY FUND — 2012 SEMIANNUAL REPORT |
Repurchase Agreements
The Fund may engage in repurchase agreement transactions with institutions that management has determined are creditworthy. The Fund, through the custodian, receives delivery of the underlying securities collateralizing a repurchase agreement. Management is responsible for determining that the collateral is at least equal, at all times, to the value of the repurchase obligation including interest. A repurchase agreement transaction involves certain risks in the event of default or insolvency of the counterparty. These risks include possible delays in or restrictions on a Fund’s ability to dispose of the underlying securities and a possible decline in the value of the underlying securities during the period while the Fund seeks to assert its rights.
Security Transactions
Security transactions are accounted for on the trade date. Cost is determined and gains (losses) are based upon the specific identification method for both financial statement and federal income tax purposes.
Income Recognition
Corporate actions and dividend income are recorded net of any non-reclaimable tax withholdings, on the ex-dividend date or upon receipt of ex-dividend notification in the case of certain foreign securities.
Interest income is recorded on the accrual basis.
Awards from class action litigation are recorded as a reduction of cost basis if the Fund still owns the applicable securities on the payment date. If the Fund no longer owns the applicable securities, the proceeds are recorded as realized gains.
Expenses
General expenses of the Trust are allocated to the Fund and other funds of the Trust based upon relative net assets or other expense allocation methodologies determined by the nature of the expense. Expenses directly attributable to the Fund are charged to the Fund. Expenses directly attributable to a specific class of shares are charged to that share class.
Determination of Class Net Asset Value
All income, expenses (other than class-specific expenses, which are charged to that share class, as shown in the Statement of Operations) and realized and unrealized gains (losses) are allocated to each class of the Fund on a daily basis, based on the relative net assets of each class, for purposes of determining the net asset value of each class.
| | | | |
| COLUMBIA SELIGMAN GLOBAL TECHNOLOGY FUND — 2012 SEMIANNUAL REPORT | | | 31 | |
| | |
| Notes to Financial Statements (continued) | | |
Federal Income Tax Status
The Fund intends to qualify each year as a regulated investment company under Subchapter M of the Internal Revenue Code, as amended, and will distribute substantially all of its tax exempt or taxable income (including net short-term capital gains), if any, for its tax year, and as such will not be subject to federal income taxes. In addition, the Fund intends to distribute in each calendar year substantially all of its net investment income, capital gains and certain other amounts, if any, such that the Fund should not be subject to federal excise tax. Therefore, no federal income or excise tax provision is recorded.
Foreign Taxes
The Fund may be subject to foreign taxes on income, gains on investments or currency repatriation, a portion of which may be recoverable. The Fund will accrue such taxes and recoveries, as applicable, based upon its current interpretation of tax rules and regulations that exist in the markets in which it invests.
Realized gains in certain countries may be subject to foreign taxes at the Fund level, based on statutory rates. The Fund accrues for such foreign taxes on net realized and unrealized gains at the appropriate rate for each jurisdiction, as applicable.
Distributions to Shareholders
Distributions from net investment income are declared and paid annually. Net realized capital gains, if any, are distributed along with the income dividend. Income distributions and capital gain distributions are determined in accordance with federal income tax regulations which may differ from GAAP.
Guarantees and Indemnifications
Under the Trust’s organizational documents and, in some cases, by contract, its officers and trustees are indemnified against certain liabilities arising out of the performance of their duties to the Trust or its funds. In addition, certain of the Fund’s contracts with its service providers contain general indemnification clauses. The Fund’s maximum exposure under these arrangements is unknown since the amount of any future claims that may be made against the Fund cannot be determined, and the Fund has no historical basis for predicting the likelihood of any such claims.
Recent Accounting Pronouncement
Fair Value Measurements and Disclosures
In May 2011, the Financial Accounting Standards Board (FASB) issued ASU No. 2011-04 modifying Topic 820, Fair Value Measurements and Disclosures. At the same time, the International Accounting Standards Board (IASB) issued International Financial Reporting Standard 13, Fair Value Measurement. The
| | |
| 32 | | COLUMBIA SELIGMAN GLOBAL TECHNOLOGY FUND — 2012 SEMIANNUAL REPORT |
objective of the FASB and IASB is convergence of their guidance on fair value measurements and disclosures.
Specifically, ASU No. 2011-04 requires reporting entities to disclose i) the amounts of any transfers between Level 1 and Level 2, and the reasons for the transfers and ii) for Level 3 fair value measurements, a) quantitative information about significant unobservable inputs used, b) a description of the valuation processes used by the reporting entity and c) a narrative description of the sensitivity of the fair value measurement to changes in unobservable inputs if a change in those inputs might result in a significantly higher or lower fair value measurement. The effective date of ASU No. 2011-04 is for interim and annual periods beginning after December 15, 2011. At this time, management is evaluating the implications of this guidance and the impact it will have on the financial statement amounts and footnote disclosures, if any.
| Note | 3. Fees and Compensation Paid to Affiliates |
Investment Management Fees
Under an Investment Management Services Agreement, Columbia Management Investment Advisers, LLC (the Investment Manager), a wholly-owned subsidiary of Ameriprise Financial, Inc. (Ameriprise Financial), determines which securities will be purchased, held or sold. The management fee is an annual fee that is equal to a percentage of the Fund’s average daily net assets that declines from 0.855% to 0.725% as the Fund’s net assets increase. The annualized effective management fee rate for the six months ended April 30, 2012 was 0.855% of the Fund’s average daily net assets.
Administration Fees
Under an Administrative Services Agreement, the Investment Manager serves as the Fund Administrator. The Fund pays the Fund Administrator an annual fee for administration and accounting services equal to a percentage of the Fund’s average daily net assets that declines from 0.06% to 0.03% as the Fund’s net assets increase. The annualized effective administration fee rate for the six months ended April 30, 2012 was 0.06% of the Fund’s average daily net assets.
Other Expenses
Other expenses are for, among other things, certain expenses of the Fund or the Board, including: Fund boardroom and office expense, employee compensation, employee health and retirement benefits, and certain other expenses. Payment of these Fund and Board expenses is facilitated by a company providing limited administrative services to the Fund and the Board. For the six months ended April 30, 2012, other expenses paid to this company were $1,604.
| | | | |
| COLUMBIA SELIGMAN GLOBAL TECHNOLOGY FUND — 2012 SEMIANNUAL REPORT | | | 33 | |
| | |
| Notes to Financial Statements (continued) | | |
Compensation of Board Members
Board members are compensated for their services to the Fund as disclosed in the Statement of Operations. Under a Deferred Compensation Plan (the Plan), the Board members who are not “interested persons” of the Fund, as defined under the 1940 Act, may elect to defer payment of up to 100% of their compensation. Deferred amounts are treated as though equivalent dollar amounts had been invested in shares of certain funds managed by the Investment Manager. The Fund’s liability for these amounts is adjusted for market value changes and remains in the Fund until distributed in accordance with the Plan.
Transfer Agent Fees
Under a Transfer and Dividend Disbursing Agent Agreement, Columbia Management Investment Services Corp. (the Transfer Agent), an affiliate of the Investment Manager and a wholly-owned subsidiary of Ameriprise Financial, is responsible for providing transfer agency services to the Fund. The Transfer Agent has contracted with Boston Financial Data Services (BFDS) to serve as sub-transfer agent.
The Transfer Agent receives monthly account-based service fees based on the number of open accounts and is reimbursed by the Fund for the fees and expenses the Transfer Agent pays to financial intermediaries that maintain omnibus accounts with the Fund that is a percentage of the average aggregate value of the Fund’s shares maintained in each such omnibus account (other than omnibus accounts for which American Enterprise Investment Services Inc. is the broker of record or accounts where the beneficial shareholder is a customer of Ameriprise Financial Services, Inc., which are paid a per account fee). The Transfer Agent pays the fees of BFDS for services as sub-transfer agent and is not entitled to reimbursement for such fees from the Fund (with the exception of out-of-pocket fees).
The Transfer Agent also receives compensation from fees for various shareholder services and reimbursements for certain out-of-pocket expenses. Class I shares do not pay transfer agent fees. Total transfer agent fees for Class R4 and Class R5 shares are subject to an annual limitation of not more than 0.05% of the average daily net assets attributable to each share class.
| | |
| 34 | | COLUMBIA SELIGMAN GLOBAL TECHNOLOGY FUND — 2012 SEMIANNUAL REPORT |
For the six months ended April 30, 2012, the Fund’s annualized effective transfer agent fee rates as a percentage of average daily net assets of each class were as follows:
| | | | |
Class A | | | 0.25 | % |
Class B | | | 0.27 | |
Class C | | | 0.25 | |
Class R | | | 0.24 | |
Class R4 | | | 0.05 | |
Class R5 | | | 0.04 | |
Class Z | | | 0.21 | |
The Fund and certain other associated investment companies (together, the Guarantors), have severally, but not jointly, guaranteed the performance and observance of all the terms and conditions of a lease entered into by Seligman Data Corp. (SDC), the former transfer agent, including the payment of rent by SDC (the Guaranty). The lease and the Guaranty expire in January 2019. At April 30, 2012, the Fund’s total potential future obligation over the life of the Guaranty is $279,443. The liability remaining at April 30, 2012 for non-recurring charges associated with the lease amounted to $187,109 and is included within other expenses in the Statement of Assets and Liabilities.
An annual minimum account balance fee of $20 may apply to certain accounts with a value below the Fund’s initial minimum investment requirements to reduce the impact of small accounts on transfer agent fees. These minimum account balance fees are recorded as part of expense reductions in the Statement of Operations. For the six months ended April 30, 2012, no minimum account balance fees were charged by the Fund.
Plan Administration Fees
Under a Plan Administration Services Agreement with the Transfer Agent, the Fund pays an annual fee at a rate of 0.25% of the Fund’s average daily net assets attributable to Class R4 shares for the provision of various administrative, recordkeeping, communication and educational services.
Distribution Fees
The Fund has an agreement with Columbia Management Investment Distributors, Inc. (the Distributor), an affiliate of the Investment Manager and a wholly-owned subsidiary of Ameriprise Financial, for distribution and shareholder services. Under a Plan and Agreement of Distribution pursuant to Rule 12b-1, the Fund pays a fee at an annual rate of up to 0.25% of the Fund’s average daily net assets attributable to Class A shares, a fee at an annual rate of up to 0.50% of the Fund’s average daily net assets attributable to Class R shares (of which up to 0.25% may be used for shareholder services) and a fee at an
| | | | |
| COLUMBIA SELIGMAN GLOBAL TECHNOLOGY FUND — 2012 SEMIANNUAL REPORT | | | 35 | |
| | |
| Notes to Financial Statements (continued) | | |
annual rate of up to 1.00% of the Fund’s average daily net assets attributable to Class B and Class C shares. For Class B and Class C shares, of the 1.00% fee, up to 0.75% is reimbursed for distribution expenses.
The amount of distribution expenses incurred by the Distributor and not yet reimbursed (unreimbursed expense) was approximately $301,000 and $4,547,000 for Class B and Class C shares, respectively. These amounts are based on the most recent information available as of March 31, 2012, and may be recovered from future payments under the distribution plan or CDSCs. To the extent the unreimbursed expense has been fully recovered, the distribution fee is reduced.
Sales Charges
Sales charges, including front-end charges and CDSCs, received by the Distributor for distributing Fund shares were $149,339 for Class A, $5,152 for Class B and $1,833 for Class C shares for the six months ended April 30, 2012.
Expenses Waived/Reimbursed by the Investment Manager and its Affiliates
Effective January 1, 2012, the Investment Manager and certain of its affiliates have contractually agreed to waive fees and/or reimburse expenses (excluding certain fees and expenses described below), through February 28, 2013, unless sooner terminated at the sole discretion of the Board, so that the Fund’s net operating expenses, after giving effect to fees waived/expenses reimbursed and any balance credits and/or overdraft charges from the Fund’s custodian, do not exceed the following annual rates as a percentage of the class’ average daily net assets:
| | | | |
Class A | | | 1.38 | % |
Class B | | | 2.13 | |
Class C | | | 2.13 | |
Class I | | | 0.97 | |
Class R | | | 1.63 | |
Class R4 | | | 1.27 | |
Class R5 | | | 1.02 | |
Class Z | | | 1.13 | |
Prior to January 1, 2012, the Investment Manager and its affiliates contractually agreed to waive fees and/or reimburse expenses (excluding certain fees and expenses described below), so that the Fund’s net operating expenses, after giving effect to fees waived/expenses reimbursed and any balance credits and/or
| | |
| 36 | | COLUMBIA SELIGMAN GLOBAL TECHNOLOGY FUND — 2012 SEMIANNUAL REPORT |
overdraft charges from the Fund’s custodian, did not exceed the following annual rates as a percentage of the class’ average daily net assets:
| | | | |
Class A | | | 1.77 | % |
Class B | | | 2.52 | |
Class C | | | 2.52 | |
Class I | | | 1.34 | |
Class R | | | 2.02 | |
Class R4 | | | 1.64 | |
Class R5 | | | 1.39 | |
Class Z | | | 1.52 | |
Under the agreement, the following fees and expenses are excluded from the waiver/reimbursement commitment, and therefore will be paid by the Fund, if applicable: taxes (including foreign transaction taxes), expenses associated with investments in affiliated and non-affiliated pooled investment vehicles (including mutual funds and exchange traded funds), transaction costs and brokerage commissions, costs related to any securities lending program, dividend expenses associated with securities sold short, inverse floater program fees and expenses, transaction charges and interest on borrowed money, interest, extraordinary expenses and any other expenses the exclusion of which is specifically approved by the Board. This agreement may be modified or amended only with approval from all parties.
| Note | 4. Federal Tax Information |
The timing and character of income and capital gain distributions are determined in accordance with income tax regulations, which may differ from GAAP because of temporary or permanent book to tax differences.
At April 30, 2012, the cost of investments for federal income tax purposes was approximately $484,505,000 and the aggregate gross approximate unrealized appreciation and depreciation based on that cost was:
| | | | |
Unrealized appreciation | | $ | 77,523,000 | |
Unrealized depreciation | | | (7,504,000 | ) |
Net unrealized appreciation | | $ | 70,019,000 | |
The following capital loss carryforward, determined as of October 31, 2011, may be available to reduce taxable income arising from future net realized gains on investments, if any, to the extent permitted by the Internal Revenue Code:
| | | | |
| Year of expiration | | Amount | |
2016 | | $ | 18,425,978 | |
2017 | | | 19,724,415 | |
Total | | $ | 38,150,393 | |
| | | | |
| COLUMBIA SELIGMAN GLOBAL TECHNOLOGY FUND — 2012 SEMIANNUAL REPORT | | | 37 | |
| | |
| Notes to Financial Statements (continued) | | |
On December 22, 2010, the Regulated Investment Company Modernization Act of 2010 (the Act) was enacted, which changed various technical rules governing the tax treatment of regulated investment companies. The changes are generally effective for taxable years beginning after the date of enactment. Under the Act, the Fund will be permitted to carry forward capital losses incurred in taxable years beginning after the date of enactment for an unlimited period. However, any losses incurred during those future taxable years will be required to be utilized prior to the losses incurred in pre-enactment taxable years, which carry an expiration date. As a result of this ordering rule, pre-enactment capital loss carryforwards may be more likely to expire unused.
Management of the Fund has concluded that there are no significant uncertain tax positions that would require recognition in the financial statements. However, management’s conclusion may be subject to review and adjustment at a later date based on factors including, but not limited to, new tax laws, regulations, and administrative interpretations (including relevant court decisions). Generally, the Fund’s federal tax returns for the prior three fiscal years remain subject to examination by the Internal Revenue Service.
| Note | 5. Portfolio Information |
The cost of purchases and proceeds from sales of securities, excluding short-term obligations, aggregated to $223,799,916 and $275,300,999, respectively, for the six months ended April 30, 2012.
| Note | 6. Regulatory Settlements |
During the six months ended April 30, 2012, the Fund received $355,461 as a result of a settlement of an administrative proceeding brought by the Securities and Exchange Commission against an unaffiliated third party relating to market timing and/or late trading of mutual funds. This amount represented the Fund’s portion of the proceeds from the settlement (the Fund was not a party to the proceeding). The proceeds received by the Fund were recorded as an increase to additional paid-in capital.
| Note | 7. Lending of Portfolio Securities |
The Fund has entered into a Master Securities Lending Agreement (the Agreement) with JPMorgan Chase Bank, N.A. (JPMorgan). The Agreement authorizes JPMorgan as lending agent to lend securities to authorized borrowers in order to generate additional income on behalf of the Fund. Pursuant to the Agreement, the securities loaned are secured by cash or U.S. government securities equal to at least 100% of the market value of the loaned securities. Any additional collateral required to maintain those levels due to market fluctuations
| | |
| 38 | | COLUMBIA SELIGMAN GLOBAL TECHNOLOGY FUND — 2012 SEMIANNUAL REPORT |
of the loaned securities is requested to be delivered the following business day. Cash collateral received is invested by the lending agent on behalf of the Fund into authorized investments pursuant to the Agreement. The investments made with the cash collateral are listed in the Portfolio of Investments. The values of such investments and any uninvested cash collateral are disclosed in the Statement of Assets and Liabilities along with the related obligation to return the collateral upon the return of the securities loaned.
Risks of delay in recovery of securities or even loss of rights in the securities may occur should the borrower of the securities fail financially. Risks may also arise to the extent that the value of the securities loaned increases above the value of the collateral received. JPMorgan will indemnify the Fund from losses resulting from a borrower’s failure to return a loaned security when due. Such indemnification does not extend to losses associated with declines in the value of cash collateral investments. The Investment Manager is not responsible for any losses incurred by the Fund in connection with the securities lending program. Loans are subject to termination by the Fund or the borrower at any time, and are, therefore, not considered to be illiquid investments.
Pursuant to the Agreement, the Fund receives income for lending its securities either in the form of fees or by earning interest on invested cash collateral, net of negotiated rebates paid to borrowers and fees paid to the lending agent for services provided and any other securities lending expenses. Net income earned from securities lending for the six months ended April 30, 2012 is disclosed in the Statement of Operations. The Fund continues to earn and accrue interest and dividends on the securities loaned.
At April 30, 2012, securities valued at $52,189,052 were on loan, and by cash collateral of $54,135,284 (which does not reflect calls for collateral made to borrowers by JPMorgan at period end) that is partially or fully invested in short-term securities or other cash equivalents.
| Note | 8. Affiliated Money Market Fund |
The Fund may invest its daily cash balances in Columbia Short-Term Cash Fund, an affiliated money market fund established for the exclusive use by the Fund and other affiliated funds. The income earned by the Fund from such investments is included as “Dividends from affiliates” in the Statement of Operations. As an investing fund, the Fund indirectly bears its proportionate share of the expenses of Columbia Short-Term Cash Fund.
| | | | |
| COLUMBIA SELIGMAN GLOBAL TECHNOLOGY FUND — 2012 SEMIANNUAL REPORT | | | 39 | |
| | |
| Notes to Financial Statements (continued) | | |
| Note | 9. Shareholder Concentration |
At April 30, 2012, one unaffiliated shareholder account owned 12.5% of the outstanding shares of the Fund. The Fund has no knowledge about whether any portion of those shares was owned beneficially by such account. Subscription and redemption activity by concentrated accounts may have a significant effect on the operations of the Fund.
The Fund has entered into a revolving credit facility with a syndicate of banks led by JPMorgan, whereby the Fund may borrow for the temporary funding of shareholder redemptions or for other temporary or emergency purposes. The credit facility agreement, as amended, which is a collective agreement between the Fund and certain other funds managed by the Investment Manager, severally and not jointly, permits collective borrowings up to $500 million. Pursuant to a December 13, 2011 amendment to the credit facility agreement, interest is charged to each participating fund based on its borrowings at a rate equal to the higher of (i) the overnight federal funds rate plus 1.00% or (i) the one-month LIBOR rate plus 1.00%. Each borrowing under the credit facility matures no later than 60 days after the date of borrowing. The Fund also pays a commitment fee equal to its pro rata share of the amount of the credit facility at a rate of 0.08% per annum.
Prior to December 13, 2011, interest was charged to each participating fund based on its borrowings at a rate equal to the sum of the federal funds rate plus (i) 1.25% per annum plus (ii) if one-month LIBOR exceeds the federal funds rate, the amount of such excess. The Fund also paid a commitment fee equal to its pro rata share of the amount of the credit facility at a rate of 0.10% per annum.
The Fund had no borrowings during the six months ended April 30, 2012.
| Note | 11. Significant Risks |
Technology and Technology-related Investment Risk
The Fund will invest a substantial portion of its assets in technology and technology-related companies. The market prices of technology and technology-related stocks tend to exhibit a greater degree of market risk and price volatility than other types of investments.
Foreign Securities Risk
Investing in foreign securities may include certain risks and considerations not typically associated with investing in U.S. securities, such as fluctuating currency values and changing local and regional economic, political and social conditions,
| | |
| 40 | | COLUMBIA SELIGMAN GLOBAL TECHNOLOGY FUND — 2012 SEMIANNUAL REPORT |
which may result in greater market volatility. In addition, certain foreign securities may not be as liquid as U.S. securities.
| Note | 12. Subsequent Events |
Management has evaluated the events and transactions that have occurred through the date the financial statements were issued and noted no items requiring adjustment of the financial statements or additional disclosure.
| Note | 13. Information Regarding Pending and Settled Legal Proceedings |
In December 2005, without admitting or denying the allegations, American Express Financial Corporation (AEFC, which is now known as Ameriprise Financial, Inc. (Ameriprise Financial)) entered into settlement agreements with the Securities and Exchange Commission (SEC) and Minnesota Department of Commerce (MDOC) related to market timing activities. As a result, AEFC was censured and ordered to cease and desist from committing or causing any violations of certain provisions of the Investment Advisers Act of 1940, the Investment Company Act of 1940, and various Minnesota laws. AEFC agreed to pay disgorgement of $10 million and civil money penalties of $7 million. AEFC also agreed to retain an independent distribution consultant to assist in developing a plan for distribution of all disgorgement and civil penalties ordered by the SEC in accordance with various undertakings detailed at www.sec.gov/litigation/admin/ia-2451.pdf. Ameriprise Financial and its affiliates have cooperated with the SEC and the MDOC in these legal proceedings, and have made regular reports to the funds’ Boards of Trustees.
Ameriprise Financial and certain of its affiliates have historically been involved in a number of legal, arbitration and regulatory proceedings, including routine litigation, class actions, and governmental actions, concerning matters arising in connection with the conduct of their business activities. Ameriprise Financial believes that the Funds are not currently the subject of, and that neither Ameriprise Financial nor any of its affiliates are the subject of, any pending legal, arbitration or regulatory proceedings that are likely to have a material adverse effect on the Funds or the ability of Ameriprise Financial or its affiliates to perform under their contracts with the Funds. Ameriprise Financial is required to make 10-Q, 10-K and, as necessary, 8-K filings with the Securities and Exchange Commission on legal and regulatory matters that relate to Ameriprise Financial and its affiliates. Copies of these filings may be obtained by accessing the SEC website at www.sec.gov.
There can be no assurance that these matters, or the adverse publicity associated with them, will not result in increased fund redemptions, reduced sale of fund shares or other adverse consequences to the Funds. Further, although we believe
| | | | |
| COLUMBIA SELIGMAN GLOBAL TECHNOLOGY FUND — 2012 SEMIANNUAL REPORT | | | 41 | |
| | |
| Notes to Financial Statements (continued) | | |
proceedings are not likely to have a material adverse effect on the Funds or the ability of Ameriprise Financial or its affiliates to perform under their contracts with the Funds, these proceedings are subject to uncertainties and, as such, we are unable to estimate the possible loss or range of loss that may result. An adverse outcome in one or more of these proceedings could result in adverse judgments, settlements, fines, penalties or other relief that could have a material adverse effect on the consolidated financial condition or results of operations of Ameriprise Financial.
| | |
| 42 | | COLUMBIA SELIGMAN GLOBAL TECHNOLOGY FUND — 2012 SEMIANNUAL REPORT |
The policy of the Board is to vote the proxies of the companies in which the Fund holds investments consistent with the procedures as stated in the Statement of Additional Information (SAI). You may obtain a copy of the SAI without charge by calling 800.345.6611; contacting your financial intermediary; visiting columbiamanagement.com; or searching the website of the Securities and Exchange Commission (SEC) at www.sec.gov. Information regarding how the Fund voted proxies relating to portfolio securities is filed with the SEC by August 31 for the most recent 12-month period ending June 30 of that year, and is available without charge by visiting columbiamanagement.com; or searching the website of the SEC at www.sec.gov.
| | |
| Approval of Investment Management Services |
| |
| Agreement | | |
Columbia Management Investment Advisers, LLC (“Columbia Management” or the “investment manager”), a wholly-owned subsidiary of Ameriprise Financial, Inc. (“Ameriprise Financial”), serves as the investment manager to Columbia Seligman Global Technology Fund (the “Fund”). Under an investment management services agreement (the “IMS Agreement”), Columbia Management provides investment advice and other services to the Fund and all funds distributed by Columbia Management Investment Distributors, Inc. (collectively, the “Funds”).
On an annual basis, the Fund’s Board of Trustees (the “Board”), including the independent Board members (the “Independent Trustees”), considers renewal of the IMS Agreement. Columbia Management prepared detailed reports for the Board and its Contracts Committee in March and April 2012, including reports based on analyses of data provided by an independent organization and a comprehensive response to each item of information requested by independent legal counsel to the Independent Trustees (“Independent Legal Counsel”) in a letter to the investment manager, to assist the Board in making this determination. All of the materials presented in March and April were first supplied in draft form to designated representatives of the Independent Trustees, i.e., Independent Legal Counsel, the Chair and the Chair of the Contracts Committee (including materials relating to the Fund’s expense cap), and the final materials were revised to reflect comments provided by these Board representatives. In addition, throughout the year, the Board (or its committees) regularly meets with portfolio management teams and senior management personnel, and reviews information prepared by Columbia Management addressing the services Columbia Management provides and Fund performance. The Board accords particular weight to the work, deliberations and conclusions of the Contracts Committee, the Investment Review Committee and the Compliance Committee in determining whether to continue the IMS Agreement.
| | | | |
| COLUMBIA SELIGMAN GLOBAL TECHNOLOGY FUND — 2012 SEMIANNUAL REPORT | | | 43 | |
| | |
| Approval of Investment Management Services |
| |
| Agreement (continued) | | |
The Board, at its April 10-12, 2012 in-person Board meeting (the “April Meeting”), considered the renewal of the IMS Agreement for an additional one-year term. At the April Meeting, Independent Legal Counsel reviewed with the Independent Trustees various factors relevant to the Board’s consideration of advisory agreements and the Board’s legal responsibilities related to such consideration. Following an analysis and discussion of the factors identified below, the Board, including all of the Independent Trustees, approved the renewal of the IMS Agreement.
Nature, Extent and Quality of Services Provided by Columbia Management: The Independent Trustees analyzed various reports and presentations they had received detailing the services performed by Columbia Management, as well as its expertise, resources and capabilities. The Independent Trustees specifically considered many developments during the past year concerning the services provided by Columbia Management, including, in particular, the continued investment in, and resources dedicated to, the Funds’ operations and the successful completion of various integration initiatives and the consolidation of dozens of Funds. The Independent Trustees noted the information they received concerning Columbia Management’s ability to retain key portfolio management personnel. In that connection, the Independent Trustees took into account their meetings with Columbia Management’s Chief Investment Officer (the “CIO”) and considered the CIO’s successful execution of additional risk and portfolio management oversight applied to the Funds. The Independent Trustees also assessed Columbia Management’s significant investment in upgrading technology (such as an equity trading system) and considered management’s commitments to enhance existing resources in this area.
In connection with the Board’s evaluation of the overall package of services provided by Columbia Management, the Board also considered the quality of administrative services provided to the Fund by Columbia Management. In addition, the Board also reviewed the financial condition of Columbia Management (and its affiliates) and each entity’s ability to carry out its responsibilities under the IMS Agreement and the Fund’s other services agreements with affiliates of Ameriprise Financial. The Board also discussed the acceptability of the terms of the IMS Agreement (including the relatively broad scope of services required to be performed by Columbia Management). The Board concluded that the services being performed under the IMS Agreement were of a reasonably high quality.
| | |
| 44 | | COLUMBIA SELIGMAN GLOBAL TECHNOLOGY FUND — 2012 SEMIANNUAL REPORT |
Based on the foregoing, and based on other information received (both oral and written, including the information on investment performance referenced below) and other considerations, the Board concluded that Columbia Management and its affiliates were in a position to continue to provide a high quality and level of services to the Fund.
Investment Performance: For purposes of evaluating the nature, extent and quality of services provided under the IMS Agreement, the Board carefully reviewed the investment performance of the Fund. In this regard, the Board considered detailed reports providing the results of analyses performed by an independent organization showing, for various periods, the performance of the Fund, the performance of a benchmark index, the percentage ranking of the Fund among its comparison group and the net assets of the Fund. The Board observed that the Fund’s investment performance met expectations.
Comparative Fees, Costs of Services Provided and the Profits Realized By Columbia Management and its Affiliates from their Relationships with the Fund: The Board reviewed comparative fees and the costs of services to be provided under the IMS Agreement. The Board members considered detailed comparative information set forth in an annual report on fees and expenses, including, among other things, data (based on analyses conducted by an independent organization) showing a comparison of the Fund’s expenses with median expenses paid by funds in its comparative peer universe, as well as data showing the Fund’s contribution to Columbia Management’s profitability. The Board reviewed the fees charged to comparable institutional or other accounts/vehicles managed by Columbia Management and discussed differences in how the products are managed and operated, noting no unreasonable differences in the levels of contractual fees.
The Board accorded particular weight to the notion that the level of fees should reflect a rational pricing model applied consistently across the various product lines in the Fund family, while assuring that the overall fees for each Fund (with few defined exceptions) are generally in line with the “pricing philosophy” (i.e., that the total expense ratio of the Fund is at, or below, the median expense ratio of funds in the same comparison universe of the Fund). The Board took into account that the Fund’s total expense ratio (after considering proposed expense caps/waivers) was below the peer universe’s median expense ratio shown in the reports. Based on its review, the Board concluded that the Fund’s management fee was fair and reasonable in light of the extent and quality of services that the Fund receives.
| | | | |
| COLUMBIA SELIGMAN GLOBAL TECHNOLOGY FUND — 2012 SEMIANNUAL REPORT | | | 45 | |
| | |
| Approval of Investment Management Services |
| |
| Agreement (continued) | | |
The Board also considered the expected profitability of Columbia Management and its affiliates in connection with Columbia Management providing investment management services to the Fund. In this regard, the Board referred to a detailed profitability report, discussing the profitability to Columbia Management and Ameriprise Financial from managing, operating and distributing the Funds. In this regard, the Board observed that 2011 profitability, while slightly lower than 2010, was generally in line with the reported profitability of other asset management firms. The Board also considered the indirect economic benefits flowing to Columbia Management or its affiliates in connection with managing or distributing the Funds, such as the enhanced ability to offer various other financial products to Ameriprise Financial customers, soft dollar benefits and overall reputational advantages. The Board noted that the fees paid by the Fund should permit the investment manager to offer competitive compensation to its personnel, make necessary investments in its business and earn an appropriate profit. The Board concluded that profitability levels were reasonable.
Economies of Scale to be Realized: The Board also considered the economies of scale that might be realized by Columbia Management as the Fund grows and took note of the extent to which Fund shareholders might also benefit from such growth.
Based on the foregoing, the Board, including all of the Independent Trustees, concluded that the investment management service fees were fair and reasonable in light of the extent and quality of services provided. In reaching this conclusion, no single factor was determinative. On April 12, 2012, the Board, including all of the Independent Trustees, approved the renewal of the IMS Agreement.
| | |
| 46 | | COLUMBIA SELIGMAN GLOBAL TECHNOLOGY FUND — 2012 SEMIANNUAL REPORT |
Columbia Seligman Global Technology Fund
P.O. Box 8081
Boston, MA 02266-8081
columbiamanagement.com
| | | | |
 | | This report must be accompanied or preceded by the Fund’s current prospectus. The
Fund is distributed by Columbia Management Investment Distributors, Inc., member
FINRA, and managed by Columbia Management Investment Advisers, LLC. ©2012 Columbia Management Investment Advisers, LLC. All rights reserved. | | SL-9958 D (6/12) |
| Item 2. | Code of Ethics. Not applicable for semi-annual reports. |
| Item 3. | Audit Committee Financial Expert. Not applicable for semi-annual reports. |
| Item 4. | Principal Accountant Fees and Services. Not applicable for semi-annual reports. |
| Item 5. | Audit Committee of Listed Registrants. Not applicable. |
| (a) | The registrant’s “Schedule 1 – Investments in securities of unaffiliated issuers” (as set forth in 17 CFR 210.12-12) is included in Item 1 of this Form N-CSR. |
| Item 7. | Disclosure of Proxy Voting Policies and Procedures for Closed-End Management Investment Companies. Not applicable. |
| Item 8. | Portfolio Managers of Closed-End Management Investment Companies. Not applicable. |
| Item 9. | Purchases of Equity Securities by Closed-End Management Investment Company and Affiliated Purchasers. Not applicable. |
| Item 10. | Submission of Matters to a Vote of Security Holders. |
There were no material changes to the procedure by which shareholders may recommend nominees to the registrant’s board of directors.
| Item 11. | Controls and Procedures. |
(a) The registrant’s principal executive officer and principal financial officer, based on their evaluation of the registrant’s disclosure controls and procedures as of a date within 90 days of the filing of this report, have concluded that such controls and procedures are adequately designed to ensure that information required to be disclosed by the registrant in Form N-CSR is accumulated and communicated to the registrant’s management, including the principal executive officer and principal financial officer, or persons performing similar functions, as appropriate to allow timely decisions regarding required disclosure.
(b) There was no change in the registrant's internal controls over financial reporting that occurred during the registrant's second fiscal quarter of the period covered by this report that has materially affected, or is reasonably likely to materially affect, the registrant’s internal control over financial reporting.
(a)(1) Code of ethics required to be disclosed under Item 2 of Form N-CSR: Not applicable for semi annual reports.
(a)(2) Certifications pursuant to Rule 30a-2(a) under the Investment Company Act of 1940 (17 CFR 270.30a-2(a)) attached hereto as Exhibit 99.CERT.
(a)(3) Not applicable.
(b) Certification pursuant to Rule 30a-2(b) under the Investment Company Act of 1940 (17 CFR 270.30a-2(b)) attached hereto as Exhibit 99.906CERT.
SIGNATURES
Pursuant to the requirements of the Securities Exchange Act of 1934 and the Investment Company Act of 1940, the registrant has duly caused this report to be signed on its behalf by the undersigned, thereunto duly authorized.
| | | | | | |
| (registrant) | | | | Columbia Funds Series Trust II |
| | |
| By (Signature and Title) | | | | /s/ J. Kevin Connaughton |
| | | | J. Kevin Connaughton, President and Principal Executive Officer |
| Date June 22, 2012 | | | | | | |
Pursuant to the requirements of the Securities Exchange Act of 1934 and the Investment Company Act of 1940, this report has been signed below by the following persons on behalf of the registrant and in the capacities and on the dates indicated.
| | | | | | |
| | |
| By (Signature and Title) | | | | /s/ J. Kevin Connaughton |
| | | | J. Kevin Connaughton, President and Principal Executive Officer |
| Date June 22, 2012 | | | | | | |
| | | | | | |
| | | | |
| | |
| By (Signature and Title) | | | | /s/ Michael G. Clarke |
| | | | Michael G. Clarke, Treasurer and Chief Financial Officer |
| Date June 22, 2012 | | | | | | |