UNITED STATES
SECURITIES AND EXCHANGE COMMISSION
Washington, D.C. 20549
FORM N-CSR
CERTIFIED SHAREHOLDER REPORT OF REGISTERED
MANAGEMENT INVESTMENT COMPANIES
Investment Company Act file number 811-21852
Columbia Funds Series Trust II
(Exact name of registrant as specified in charter)
50606 Ameriprise Financial Center, Minneapolis, MN 55474
(Address of principal executive offices) (Zip code)
Scott R. Plummer
5228 Ameriprise Financial Center
Minneapolis, MN 55474
(Name and address of agent for service)
Registrant’s telephone number, including area code: 1-612-671-1947
Date of fiscal year end: February 28
Date of reporting period: August 31, 2012
Form N-CSR is to be used by management investment companies to file reports with the Commission not later than 10 days after the transmission to stockholders of any report that is required to be transmitted to stockholders under Rule 30e-1 under the Investment Company Act of 1940 (17 CFR 270.30e-1). The Commission may use the information provided on Form N-CSR in its regulatory, disclosure review, inspection, and policymaking roles.
A registrant is required to disclose the information specified by Form N-CSR, and the Commission will make this information public. A registrant is not required to respond to the collection of information contained in Form N-CSR unless the Form displays a currently valid Office of Management and Budget (“OMB”) control number. Please direct comments concerning the accuracy of the information collection burden estimate and any suggestions for reducing the burden to Secretary, Securities and Exchange Commission, 450 Fifth Street, NW, Washington, DC 20549-0609. The OMB has reviewed this collection of information under the clearance requirements of 44 U.S.C. § 3507.
Item 1. Reports to Stockholders.
| | |
Semiannual Report August 31, 2012 | |  |
| | |
Columbia Equity Value Fund | | |

| | |
| |
| | Columbia Equity Value Fund |
President’s Message

Dear Shareholders,
On the heels of solid gains for stocks during the first quarter, U.S. stock market averages fell in the second quarter as uncertainty mounted regarding the fate of the eurozone and other real concerns. On the last day of the quarter, an announcement that European leaders had agreed to relieve short-term funding pressure on Italy and Spain and to back a plan heading toward a banking union raised hopes that a longer term solution was achievable. The announcement lifted stocks around the world. However, it was a losing quarter for most stock markets as economic data disappointed in the United States and growth in Europe and emerging markets slowed. China, which has been a key driver of worldwide growth over the past decade, has experienced a significant slowdown, and its declining demand for raw materials has had a chilling effect on world commodity markets.
Against a backdrop of rising uncertainty and a declining stock market, bond investors turned cautious. U.S. Treasuries were the quarter’s strongest performers. Total returns on long-dated Treasuries surged late last year, sank from mid-December to mid-March then soared through the end of the quarter. By contrast, European sovereign bonds lost value as interest rates rose and concerns about the eurozone’s fiscal health mounted.
Despite these continued challenges, we see pockets of strength — and as a result, attractive opportunities — both here and abroad for 2012. We hope to help you capitalize on these opportunities with various articles in our 2012 Perspectives, which is available via the Market Insights tab at columbiamanagement.com. This publication showcases the strong research capabilities and experienced investment teams of Columbia Management and offers a diverse array of investment ideas based on our five key themes for 2012.
Other information and resources available at columbiamanagement.com include:
| > | | detailed up-to-date fund performance and portfolio information |
| > | | economic analysis and market commentary |
| > | | quarterly fund commentaries |
| > | | Columbia Management Investor, our award-winning quarterly newsletter for shareholders |
Thank you for your continued support of the Columbia Funds. We look forward to serving your investment needs for many years to come.
Best Regards,

J. Kevin Connaughton
President, Columbia Funds
Investors should consider the investment objectives, risks, charges and expenses of a mutual fund carefully before investing. For a free prospectus, which contains this and other important information about the funds, visit columbiamanagement.com. The prospectus should be read carefully before investing.
Columbia Funds are distributed by Columbia Management Investment Distributors, Inc., member FINRA, and managed by Columbia Management Investment Advisers, LLC.
© 2012 Columbia Management Investment Advisers, LLC. All rights reserved.
Semiannual Report 2012
| | |
| |
| Columbia Equity Value Fund | | |
Table of Contents
Fund Investment Manager
Columbia Management Investment
Advisers, LLC
225 Franklin Street
Boston, MA 02110
Fund Distributor
Columbia Management Investment
Distributors, Inc.
225 Franklin Street
Boston, MA 02110
Fund Transfer Agent
Columbia Management Investment
Services Corp.
P.O. Box 8081
Boston, MA 02266-8081
For more information about any of the funds, please visit columbiamanagement.com or call 800.345.6611. Customer Service Representatives are available to answer your questions Monday through Friday from 8 a.m. to 8 p.m. Eastern time.
The views expressed in this report reflect the current views of the respective parties. These views are not guarantees of future performance and involve certain risks, uncertainties and assumptions that are difficult to predict, so actual outcomes and results may differ significantly from the views expressed. These views are subject to change at any time based upon economic, market or other conditions and the respective parties disclaim any responsibility to update such views. These views may not be relied on as investment advice and, because investment decisions for a Columbia Fund are based on numerous factors, may not be relied on as an indication of trading intent on behalf of any particular Columbia Fund. References to specific securities should not be construed as a recommendation or investment advice.
Semiannual Report 2012
| | |
| |
| | Columbia Equity Value Fund |
Performance Overview
(Unaudited)
Performance Summary
| > | | Columbia Equity Value Fund (the Fund) Class A shares increased 0.10% excluding sales charges for the six months ended August 31, 2012. |
| > | | The Fund’s return underperformed its benchmark, the Russell 1000 Value Index, which rose 3.95% for the same time period. |
| | | | | | | | | | | | | | | | | | |
Average Annual Total Returns (%) (for period ended August 31, 2012) | |
| | | Inception | | 6 Months
cumulative | | | 1 Year | | | 5 Years | | | 10 Years | |
Class A | | 03/20/95 | | | | | | | | | | | | | | | | |
Excluding sales charges | | | | | 0.10 | | | | 10.59 | | | | -1.49 | | | | 6.62 | |
Including sales charges | | | | | -5.63 | | | | 4.19 | | | | -2.65 | | | | 5.99 | |
Class B | | 05/14/84 | | | | | | | | | | | | | | | | |
Excluding sales charges | | | | | -0.31 | | | | 9.72 | | | | -2.25 | | | | 5.81 | |
Including sales charges | | | | | -5.28 | | | | 4.72 | | | | -2.58 | | | | 5.81 | |
Class C | | 06/26/00 | | | | | | | | | | | | | | | | |
Excluding sales charges | | | | | -0.20 | | | | 9.82 | | | | -2.22 | | | | 5.81 | |
Including sales charges | | | | | -1.20 | | | | 8.82 | | | | -2.22 | | | | 5.81 | |
Class I * | | 03/04/04 | | | 0.32 | | | | 10.89 | | | | -1.07 | | | | 7.00 | |
Class R * | | 12/11/06 | | | -0.03 | | | | 10.44 | | | | -1.68 | | | | 6.36 | |
Class R3 * | | 12/11/06 | | | 0.13 | | | | 10.53 | | | | -1.46 | | | | 6.60 | |
Class R4 | | 03/20/95 | | | 0.16 | | | | 10.71 | | | | -1.32 | | | | 6.80 | |
Class R5 * | | 12/11/06 | | | 0.29 | | | | 11.02 | | | | -1.09 | | | | 6.86 | |
Class W * | | 12/01/06 | | | 0.07 | | | | 10.32 | | | | -1.54 | | | | 6.57 | |
Class Z * | | 09/27/10 | | | 0.24 | | | | 10.90 | | | | -1.38 | | | | 6.68 | |
Russell 1000 Value Index | | | | | 3.95 | | | | 17.30 | | | | -0.85 | | | | 6.57 | |
Returns for Class A are shown with and without the maximum initial sales charge of 5.75%. Returns for Class B are shown with and without the applicable contingent deferred sales charge (CDSC) of 5.00% in the first year, declining to 1.00% in the sixth year and eliminated thereafter. Returns for Class C are shown with and without the 1.00% CDSC for the first year only. The Fund’s other classes are not subject to sales charges and have limited eligibility. Please see the Fund’s prospectuses for details. Performance for different share classes will vary based on differences in sales charges and fees associated with each class. All results shown assume reinvestment of distributions during the period. Returns do not reflect the deduction of taxes that a shareholder may pay on Fund distributions or on the redemption of Fund shares. Performance results reflect the effect of any fee waivers or reimbursements of Fund expenses by Columbia Management Investment Advisers, LLC and/or any of its affiliates. Absent these fee waivers or expense reimbursement arrangements, performance results would have been lower.
The performance information shown represents past performance and is not a guarantee of future results. The investment return and principal value of your investment will fluctuate so that your shares, when redeemed, may be worth more or less than their original cost. Current performance may be lower or higher than the performance information shown. You may obtain performance information current to the most recent month-end by contacting your financial intermediary, visiting columbiamanagement.com or calling 800.345.6611.
| * | The returns shown for periods prior to the share class inception date (including returns since inception if shown, which are since Fund inception) include the returns of the Fund’s Class A shares. These returns are adjusted to reflect any higher class-related operating expenses of the newer share classes, as applicable. Please visit columbiamanagement.com/mutual-funds/appended-performance for more information. |
The Russell 1000 Value Index, an unmanaged index, measures the performance of those stocks in the Russell 1000 Index with lower price-to-book ratios and lower forecasted growth values.
Indices are not available for investment, are not professionally managed and do not reflect sales charges, fees, brokerage commissions, taxes or other expenses of investing. Securities in the Fund may not match those in an index.
| | |
| |
| Columbia Equity Value Fund | | |
Portfolio Overview
(Unaudited)
| | | | |
Top Ten Holdings (%)
(at August 31, 2012) | |
Pfizer, Inc. | | | 3.0 | |
Target Corp. | | | 2.9 | |
AT&T, Inc. | | | 2.6 | |
ACE Ltd. | | | 2.5 | |
Merck & Co., Inc. | | | 2.5 | |
JPMorgan Chase & Co. | | | 2.4 | |
Philip Morris International, Inc. | | | 2.3 | |
General Electric Co. | | | 2.3 | |
Bank of America Corp. | | | 2.3 | |
Chevron Corp. | | | 2.2 | |
Percentages indicated are based upon total investments (excluding Money Market Funds and Investments of Cash Collateral Received for Securities on Loan).
For further detail about these holdings, please refer to the section entitled “Portfolio of Investments.”
Fund holdings are as of the date given, are subject to change at any time, and are not recommendations to buy or sell any security.
| | | | |
Portfolio Breakdown (%)
(at August 31, 2012) | | | | |
Common Stocks | | | 96.9 | |
Consumer Discretionary | | | 10.5 | |
Consumer Staples | | | 8.4 | |
Energy | | | 11.0 | |
Financials | | | 17.9 | |
Health Care | | | 16.0 | |
Industrials | | | 13.8 | |
Information Technology | | | 9.7 | |
Materials | | | 3.0 | |
Telecommunication Services | | | 4.3 | |
Utilities | | | 2.3 | |
Equity-Linked Notes | | | 1.7 | |
Money Market Funds | | | 1.4 | |
Total | | | 100.0 | |
Percentages indicated are based upon total investments (excluding Investments of Cash Collateral Received for Securities on Loan). The Fund’s portfolio composition is subject to change.
Portfolio Management
Steve Schroll
Laton Spahr, CFA
Paul Stocking
Morningstar Style Box™
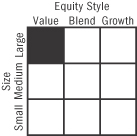
The Morningstar Style Box™ is based on the fund’s portfolio holdings. For equity funds, the vertical axis shows the market capitalization of the stocks owned, and the horizontal axis shows investment style (value, blend, or growth). Information shown is based on the most recent data provided by Morningstar.
©2012 Morningstar, Inc. All rights reserved. The Morningstar information contained herein: (1) is proprietary to Morningstar and/or its content providers; (2) may not be copied or distributed; and (3) is not warranted to be accurate, complete or timely. Neither Morningstar nor its content providers are responsible for any damages or losses arising from any use of this information.
| | |
| |
| | Columbia Equity Value Fund |
Understanding Your Fund’s Expenses
(Unaudited)
As an investor, you incur two types of costs. There are transaction costs, which generally include sales charges on purchases and may include redemption fees. There are also ongoing costs, which generally include management fees, distribution and service (Rule 12b-1) fees, and other fund expenses. The following information is intended to help you understand your ongoing costs (in dollars) of investing in the Fund and to help you compare these costs with the ongoing costs of investing in other mutual funds.
Analyzing Your Fund’s Expenses
To illustrate these ongoing costs, we have provided examples and calculated the expenses paid by investors in each share class of the Fund during the period. The actual and hypothetical information in the table is based on an initial investment of $1,000 at the beginning of the period indicated and held for the entire period. Expense information is calculated two ways and each method provides you with different information. The amount listed in the “Actual” column is calculated using the Fund’s actual operating expenses and total return for the period. You may use the Actual information, together with the amount invested, to estimate the expenses that you paid over the period. Simply divide your account value by $1,000 (for example, an $8,600 account value divided by $1,000 = 8.6), then multiply the results by the expenses paid during the period under the Actual column. The amount listed in the “Hypothetical” column assumes a 5% annual rate of return before expenses (which is not the Fund’s actual return) and then applies the Fund’s actual expense ratio for the period to the hypothetical return. You should not use the hypothetical account values and expenses to estimate either your actual account balance at the end of the period or the expenses you paid during the period. See “Compare With Other Funds” below for details on how to use the hypothetical data.
Compare With Other Funds
Since all mutual funds are required to include the same hypothetical calculations about expenses in shareholder reports, you can use this information to compare the ongoing cost of investing in the Fund with other funds. To do so, compare the hypothetical example with the 5% hypothetical examples that appear in the shareholder reports of other funds. As you compare hypothetical examples of other funds, it is important to note that hypothetical examples are meant to highlight the ongoing costs of investing in a fund only and do not reflect any transaction costs, such as sales charges, or redemption or exchange fees. Therefore, the hypothetical calculations are useful in comparing ongoing costs only, and will not help you determine the relative total costs of owning different funds. If transaction costs were included in these calculations, your costs would be higher.
March 1, 2012 – August 31, 2012
| | | | | | | | | | | | | | | | | | | | | | | | | | | | |
| | | Account Value at the
Beginning of the
Period ($) | | | Account Value at the
End of the
Period ($) | | | Expenses Paid During
the Period ($) | | | Fund’s Annualized
Expense Ratio (%) | |
| | | | Actual | | | | Hypothetical | | | | Actual | | | | Hypothetical | | | | Actual | | | | Hypothetical | | | | Actual | |
Class A | | | 1,000.00 | | | | 1,000.00 | | | | 1,001.00 | | | | 1,019.46 | | | | 5.75 | | | | 5.80 | | | | 1.14 | |
Class B | | | 1,000.00 | | | | 1,000.00 | | | | 996.90 | | | | 1,015.68 | | | | 9.51 | | | | 9.60 | | | | 1.89 | |
Class C | | | 1,000.00 | | | | 1,000.00 | | | | 998.00 | | | | 1,015.68 | | | | 9.52 | | | | 9.60 | | | | 1.89 | |
Class I | | | 1,000.00 | | | | 1,000.00 | | | | 1,003.20 | | | | 1,021.53 | | | | 3.69 | | | | 3.72 | | | | 0.73 | |
Class R | | | 1,000.00 | | | | 1,000.00 | | | | 999.70 | | | | 1,018.20 | | | | 7.01 | | | | 7.07 | | | | 1.39 | |
Class R3 | | | 1,000.00 | | | | 1,000.00 | | | | 1,001.30 | | | | 1,018.80 | | | | 6.41 | | | | 6.46 | | | | 1.27 | |
Class R4 | | | 1,000.00 | | | | 1,000.00 | | | | 1,001.60 | | | | 1,020.01 | | | | 5.20 | | | | 5.24 | | | | 1.03 | |
Class R5 | | | 1,000.00 | | | | 1,000.00 | | | | 1,002.90 | | | | 1,021.27 | | | | 3.94 | | | | 3.97 | | | | 0.78 | |
Class W | | | 1,000.00 | | | | 1,000.00 | | | | 1,000.70 | | | | 1,019.46 | | | | 5.75 | | | | 5.80 | | | | 1.14 | |
Class Z | | | 1,000.00 | | | | 1,000.00 | | | | 1,002.40 | | | | 1,020.67 | | | | 4.54 | | | | 4.58 | | | | 0.90 | |
Expenses paid during the period are equal to the annualized expense ratio for each class as indicated above, multiplied by the average account value over the period and then multiplied by the number of days in the Fund’s most recent fiscal half year and divided by 365.
Expenses do not include fees and expenses incurred indirectly by the Fund from the underlying funds in which the Fund may invest (also referred to as “acquired funds”), including affiliated and non-affiliated pooled investment vehicles (including mutual funds and exchange-traded funds).
Had Columbia Management Investment Advisers, LLC and/or certain of its affiliates not waived/reimbursed certain fees and expenses, account value at the end of the period would have been reduced.
| | |
| |
| Columbia Equity Value Fund | | |
Portfolio of Investments
August 31, 2012 (Unaudited)
(Percentages represent value of investments compared to net assets)
| | | | | | | | |
| Common Stocks 95.9% | |
| Issuer | | Shares | | | Value ($) | |
| | | | | | | | |
Consumer Discretionary 10.4% | |
Auto Components 0.7% | |
| | |
Johnson Controls, Inc.(a) | | | 155,707 | | | | 4,236,788 | |
| | |
Automobiles 1.2% | | | | | | | | |
| | |
Ford Motor Co. | | | 770,304 | | | | 7,194,639 | |
| | |
Hotels, Restaurants & Leisure 0.5% | | | | | | | | |
| | |
Carnival Corp. | | | 88,205 | | | | 3,058,949 | |
| | |
Media 2.9% | | | | | | | | |
| | |
Comcast Corp., Class A | | | 182,427 | | | | 6,116,778 | |
| | |
Time Warner, Inc. | | | 56,800 | | | | 2,360,040 | |
| | |
Viacom, Inc., Class B | | | 77,426 | | | | 3,872,074 | |
| | |
Walt Disney Co. (The) | | | 93,679 | | | | 4,634,300 | |
| | | | | | | | | |
Total | | | | | | | 16,983,192 | |
| | |
Multiline Retail 3.4% | | | | | | | | |
| | |
Kohl’s Corp. | | | 61,087 | | | | 3,188,741 | |
| | |
Target Corp. | | | 259,676 | | | | 16,642,635 | |
| | | | | | | | | |
Total | | | | | | | 19,831,376 | |
| | |
Specialty Retail 1.7% | | | | | | | | |
| | |
Home Depot, Inc. (The) | | | 178,036 | | | | 10,103,543 | |
| | | | | | | | | |
Total Consumer Discretionary | | | | | | | 61,408,487 | |
| | |
| | | | | | | | |
Consumer Staples 8.3% | |
Beverages 0.6% | | | | | | | | |
| | |
PepsiCo, Inc. | | | 46,631 | | | | 3,377,483 | |
| | |
Food & Staples Retailing 1.7% | | | | | | | | |
| | |
Wal-Mart Stores, Inc. | | | 142,095 | | | | 10,316,097 | |
| | |
Food Products 0.9% | | | | | | | | |
| | |
Hershey Co. (The) | | | 21,000 | | | | 1,508,220 | |
| | |
Kraft Foods, Inc., Class A | | | 87,991 | | | | 3,654,266 | |
| | | | | | | | | |
Total | | | | | | | 5,162,486 | |
| | |
Household Products 1.1% | | | | | | | | |
| | |
Procter & Gamble Co. (The) | | | 93,166 | | | | 6,259,824 | |
| | |
Tobacco 4.0% | | | | | | | | |
| | |
Lorillard, Inc. | | | 82,840 | | | | 10,397,248 | |
| | |
Philip Morris International, Inc. | | | 148,455 | | | | 13,257,032 | |
| | | | | | | | | |
Total | | | | | | | 23,654,280 | |
| | | | | | | | | |
Total Consumer Staples | | | | | | | 48,770,170 | |
| | |
| | | | | | | | |
Energy 10.9% | |
Energy Equipment & Services 1.8% | |
| | |
Cameron International Corp.(b) | | | 32,700 | | | | 1,789,017 | |
| | |
Halliburton Co. | | | 76,648 | | | | 2,510,988 | |
| | |
National Oilwell Varco, Inc. | | | 50,221 | | | | 3,957,415 | |
| | |
Schlumberger Ltd. | | | 32,291 | | | | 2,337,223 | |
| | | | | | | | |
| Common Stocks (continued) | |
| Issuer | | Shares | | | Value ($) | |
Seadrill Ltd. | | | 7,474 | | | | 308,078 | |
| | | | | | | | | |
Total | | | | | | | 10,902,721 | |
|
Oil, Gas & Consumable Fuels 9.1% | |
| | |
Anadarko Petroleum Corp. | | | 102,402 | | | | 7,093,387 | |
| | |
Apache Corp. | | | 54,037 | | | | 4,633,673 | |
| | |
Chevron Corp. | | | 113,947 | | | | 12,780,295 | |
| | |
Exxon Mobil Corp. | | | 136,250 | | | | 11,894,625 | |
| | |
Occidental Petroleum Corp. | | | 109,606 | | | | 9,317,606 | |
| | |
Royal Dutch Shell PLC, ADR | | | 109,977 | | | | 7,695,091 | |
| | | | | | | | | |
Total | | | | | | | 53,414,677 | |
| | | | | | | | | |
Total Energy | | | | | | | 64,317,398 | |
| | |
| | | | | | | | |
Financials 17.6% | |
Capital Markets 2.6% | |
| | |
Goldman Sachs Group, Inc. (The) | | | 113,146 | | | | 11,961,795 | |
| | |
Morgan Stanley | | | 244,804 | | | | 3,672,060 | |
| | | | | | | | | |
Total | | | | | | | 15,633,855 | |
| | |
Commercial Banks 1.7% | | | | | | | | |
| | |
CIT Group, Inc.(b) | | | 96,070 | | | | 3,627,603 | |
| | |
Wells Fargo & Co. | | | 181,224 | | | | 6,167,053 | |
| | | | | | | | | |
Total | | | | | | | 9,794,656 | |
| | |
Diversified Financial Services 5.1% | | | | | | | | |
| | |
Bank of America Corp. | | | 1,619,852 | | | | 12,942,617 | |
| | |
Citigroup, Inc. | | | 108,844 | | | | 3,233,755 | |
| | |
JPMorgan Chase & Co. | | | 369,098 | | | | 13,708,300 | |
| | | | | | | | | |
Total | | | | | | | 29,884,672 | |
| | |
Insurance 8.2% | | | | | | | | |
| | |
ACE Ltd. | | | 197,960 | | | | 14,595,591 | |
| | |
Allstate Corp. (The) | | | 208,117 | | | | 7,758,602 | |
| | |
Everest Re Group Ltd. | | | 42,784 | | | | 4,434,989 | |
| | |
MetLife, Inc. | | | 182,690 | | | | 6,235,210 | |
| | |
Travelers Companies, Inc. (The) | | | 46,526 | | | | 3,012,093 | |
| | |
XL Group PLC | | | 544,574 | | | | 12,590,551 | |
| | | | | | | | | |
Total | | | | | | | 48,627,036 | |
| | | | | | | | | |
Total Financials | | | | | | | 103,940,219 | |
| | |
| | | | | | | | |
Health Care 15.9% | |
Health Care Equipment & Supplies 0.9% | |
| | |
Boston Scientific Corp.(b) | | | 269,863 | | | | 1,457,260 | |
| | |
Medtronic, Inc. | | | 93,498 | | | | 3,801,629 | |
| | | | | | | | | |
Total | | | | | | | 5,258,889 | |
|
Health Care Providers & Services 2.3% | |
| | |
Express Scripts Holding Co.(b) | | | 56,438 | | | | 3,534,148 | |
| | |
UnitedHealth Group, Inc. | | | 183,164 | | | | 9,945,805 | |
| | | | | | | | | |
Total | | | | | | | 13,479,953 | |
The accompanying Notes to Financial Statements are an integral part of this statement.
| | |
| |
| | Columbia Equity Value Fund |
Portfolio of Investments (continued)
August 31, 2012 (Unaudited)
| | | | | | | | |
| Common Stocks (continued) | |
| Issuer | | Shares | | | Value ($) | |
Life Sciences Tools & Services 2.0% | |
| | |
Agilent Technologies, Inc. | | | 112,250 | | | | 4,171,210 | |
| | |
Thermo Fisher Scientific, Inc. | | | 128,650 | | | | 7,378,078 | |
| | | | | | | | | |
Total | | | | | | | 11,549,288 | |
|
Pharmaceuticals 10.7% | |
| | |
Abbott Laboratories | | | 75,745 | | | | 4,964,327 | |
| | |
AstraZeneca PLC, ADR(a) | | | 62,872 | | | | 2,941,781 | |
| | |
Bristol-Myers Squibb Co. | | | 195,846 | | | | 6,464,876 | |
| | |
Johnson & Johnson | | | 179,323 | | | | 12,091,750 | |
| | |
Merck & Co., Inc. | | | 329,760 | | | | 14,196,168 | |
| | |
Novartis AG, ADR | | | 47,620 | | | | 2,810,056 | |
| | |
Pfizer, Inc. | | | 733,188 | | | | 17,493,866 | |
| | |
Roche Holding AG, ADR | | | 46,000 | | | | 2,093,000 | |
| | | | | | | | | |
Total | | | | | | | 63,055,824 | |
| | | | | | | | | |
Total Health Care | | | | | | | 93,343,954 | |
| | |
| | | | | | | | |
Industrials 13.7% | |
Aerospace & Defense 4.5% | |
| | |
Boeing Co. (The) | | | 125,682 | | | | 8,973,695 | |
| | |
Honeywell International, Inc. | | | 108,693 | | | | 6,353,106 | |
| | |
Lockheed Martin Corp. | | | 50,325 | | | | 4,586,621 | |
| | |
United Technologies Corp. | | | 78,650 | | | | 6,280,202 | |
| | | | | | | | | |
Total | | | | | | | 26,193,624 | |
|
Air Freight & Logistics 0.5% | |
| | |
United Parcel Service, Inc., Class B | | | 38,450 | | | | 2,837,995 | |
|
Airlines 0.5% | |
| | |
Delta Air Lines, Inc.(b) | | | 143,196 | | | | 1,238,645 | |
| | |
United Continental Holdings, Inc.(a)(b) | | | 103,828 | | | | 1,915,627 | |
| | | | | | | | | |
Total | | | | | | | 3,154,272 | |
|
Electrical Equipment 0.3% | |
| | |
ABB Ltd., ADR(a) | | | 111,023 | | | | 1,922,918 | |
|
Industrial Conglomerates 3.6% | |
| | |
General Electric Co. | | | 634,072 | | | | 13,131,631 | |
| | |
Tyco International Ltd. | | | 143,077 | | | | 8,066,681 | |
| | | | | | | | | |
Total | | | | | | | 21,198,312 | |
|
Machinery 3.9% | |
| | |
Caterpillar, Inc. | | | 67,663 | | | | 5,773,684 | |
| | |
Eaton Corp.(a) | | | 99,552 | | | | 4,451,965 | |
| | |
Illinois Tool Works, Inc. | | | 148,404 | | | | 8,798,873 | |
| | |
Parker Hannifin Corp.(a) | | | 44,563 | | | | 3,564,149 | |
| | | | | | | | | |
Total | | | | | | | 22,588,671 | |
|
Road & Rail 0.4% | |
| | |
CSX Corp. | | | 113,763 | | | | 2,555,117 | |
| | | | | | | | | |
Total Industrials | | | | | | | 80,450,909 | |
| | | | | | | | |
| Common Stocks (continued) | |
| Issuer | | Shares | | | Value ($) | |
Information Technology 9.6% | |
Communications Equipment 1.7% | |
| | |
Cisco Systems, Inc. | | | 527,237 | | | | 10,059,682 | |
|
Computers & Peripherals 1.1% | |
| | |
Apple, Inc. | | | 9,523 | | | | 6,335,081 | |
|
Electronic Equipment, Instruments & Components 0.5% | |
| | |
TE Connectivity Ltd. | | | 80,401 | | | | 2,827,703 | |
|
Internet Software & Services 0.4% | |
| | |
eBay, Inc.(b) | | | 50,847 | | | | 2,413,707 | |
|
IT Services 1.6% | |
| | |
Accenture PLC, Class A | | | 102,096 | | | | 6,289,113 | |
| | |
Mastercard, Inc., Class A | | | 6,972 | | | | 2,948,459 | |
| | | | | | | | | |
Total | | | | | | | 9,237,572 | |
|
Semiconductors & Semiconductor Equipment 1.3% | |
| | |
Intel Corp. | | | 260,609 | | | | 6,470,921 | |
| | |
Microchip Technology, Inc.(a) | | | 44,960 | | | | 1,562,360 | |
| | | | | | | | | |
Total | | | | | | | 8,033,281 | |
|
Software 3.0% | |
| | |
Microsoft Corp. | | | 341,497 | | | | 10,524,938 | |
| | |
Oracle Corp. | | | 223,471 | | | | 7,072,857 | |
| | | | | | | | | |
Total | | | | | | | 17,597,795 | |
| | | | | | | | | |
Total Information Technology | | | | | | | 56,504,821 | |
| | |
| | | | | | | | |
Materials 3.0% | |
Chemicals 2.6% | |
| | |
Air Products & Chemicals, Inc. | | | 24,006 | | | | 1,982,416 | |
| | |
Dow Chemical Co. (The) | | | 9,501 | | | | 278,474 | |
| | |
EI du Pont de Nemours & Co. | | | 160,224 | | | | 7,971,144 | |
| | |
Mosaic Co. (The) | | | 84,986 | | | | 4,921,539 | |
| | | | | | | | | |
Total | | | | | | | 15,153,573 | |
|
Metals & Mining 0.4% | |
| | |
Freeport-McMoRan Copper & Gold, Inc. | | | 59,212 | | | | 2,138,145 | |
| | |
Nucor Corp. | | | 7,906 | | | | 297,661 | |
| | | | | | | | | |
Total | | | | | | | 2,435,806 | |
| | | | | | | | | |
Total Materials | | | | | | | 17,589,379 | |
| | |
| | | | | | | | |
Telecommunication Services 4.3% | |
Diversified Telecommunication Services 4.3% | |
| | |
AT&T, Inc. | | | 413,541 | | | | 15,152,142 | |
| | |
Deutsche Telekom AG, ADR(a) | | | 240,176 | | | | 2,868,903 | |
| | |
Verizon Communications, Inc. | | | 165,686 | | | | 7,114,557 | |
| | | | | | | | | |
Total | | | | | | | 25,135,602 | |
| | | | | | | | | |
Total Telecommunication Services | | | | | | | 25,135,602 | |
| | |
| | | | | | | | |
The accompanying Notes to Financial Statements are an integral part of this statement.
| | |
| |
| Columbia Equity Value Fund | | |
Portfolio of Investments (continued)
August 31, 2012 (Unaudited)
| | | | | | | | |
| Common Stocks (continued) | |
| Issuer | | Shares | | | Value ($) | |
Utilities 2.2% | |
Electric Utilities 0.5% | |
| | |
Duke Energy Corp. | | | 44,595 | | | | 2,888,864 | |
| | |
Multi-Utilities 1.7% | | | | | | | | |
| | |
Dominion Resources, Inc. | | | 55,321 | | | | 2,903,246 | |
| | |
PG&E Corp. | | | 68,815 | | | | 2,987,259 | |
| | |
Sempra Energy | | | 65,933 | | | | 4,364,765 | |
| | | | | | | | | |
Total | | | | | | | 10,255,270 | |
| | | | | | | | | |
Total Utilities | | | | | | | 13,144,134 | |
| | | | | | | | | |
Total Common Stocks
(Cost: $493,128,710) | | | | | | | 564,605,073 | |
| | |
| | | | | | | | |
| | | | | | | | | | | | |
| Equity-Linked Notes 1.7% | |
| Issuer | | Coupon
Rate | | | Shares | | | Value ($) | |
Goldman Sachs Group, Inc. (The)
Mandatory Exchangeable Notes
(linked to common stock of Dow Chemical Co. (The))(c) | |
10/19/12 | | | 0.000% | | | | 285,961 | | | | 9,794,430 | |
| | | | | | | | | | | | | |
Total Equity-Linked Notes
(Cost: $10,000,057) | | | | | | | | | | | 9,794,430 | |
| | | | | | | | | | |
| Money Market Funds 1.4% | |
| | | | | Shares | | | Value ($) | |
Columbia Short-Term Cash Fund, 0.164%(d)(e) | | | | | 8,128,010 | | | | 8,128,010 | |
| | | | | | | | | | | |
Total Money Market Funds
(Cost: $8,128,010) | | | | | | | 8,128,010 | |
| | | | | | | | | | | | |
| Investments of Cash Collateral Received for Securities on Loan 3.2% | |
| Issuer | | Effective
Yield | | | Par ($)/
Principal ($)/
Shares | | | Value ($) | |
Repurchase Agreements 3.2% | |
Natixis Financial Products, Inc.
dated 08/31/12, matures 09/04/12,
repurchase price $10,000,267(f) | | | | | |
| | | 0.240% | | | | 10,000,000 | | | | 10,000,000 | |
| |
Societe Generale
dated 08/31/12, matures 09/04/12,
repurchase price $9,125,878(f) | | | | | |
| | | 0.180% | | | | 9,125,695 | | | | 9,125,695 | |
| | | | | | | | | | | | | |
Total | | | | | | | | | | | 19,125,695 | |
| | | | | | | | | | | | | |
Total Investments of Cash Collateral Received for Securities on Loan
(Cost: $19,125,695) | | | | 19,125,695 | |
| | | | | | | | | | | | | |
Total Investments
(Cost: $530,382,472) | | | | 601,653,208 | |
| | | | | | | | | | | | | |
Other Assets & Liabilities, Net | | | | (12,955,244 | ) |
| | | | | | | | | | | | | |
Net Assets | | | | 588,697,964 | |
| | | | | | | | | | | | | |
Notes to Portfolio of Investments
| (a) | At August 31, 2012, security was partially or fully on loan. |
| (c) | Security exempt from registration pursuant to Rule 144A under the Securities Act of 1933. This security may be resold in transactions exempt from registration, normally to qualified institutional buyers. At August 31, 2012, the value of these securities amounted to $9,794,430 or 1.66% of net assets. |
| (d) | The rate shown is the seven-day current annualized yield at August 31, 2012. |
| (e) | As defined in the Investment Company Act of 1940, an affiliated company is one in which the Fund owns 5% or more of its outstanding voting securities, or a company which is under common ownership or control with the Fund. Holdings and transactions in these affiliated companies during the period ended August 31, 2012, are as follows: |
| | | | | | | | | | | | | | | | | | | | | | | | |
| Issuer | | Beginning
Cost ($) | | | Purchase
Cost ($) | | | Proceeds
From Sales ($) | | | Ending
Cost ($) | | | Dividends
or Interest
Income ($) | | | Value ($) | |
Columbia Short-Term Cash Fund | | | 13,995,300 | | | | 64,786,678 | | | | (70,653,968 | ) | | | 8,128,010 | | | | 10,324 | | | | 8,128,010 | |
The accompanying Notes to Financial Statements are an integral part of this statement.
| | |
| |
| | Columbia Equity Value Fund |
Portfolio of Investments (continued)
August 31, 2012 (Unaudited)
Notes to Portfolio of Investments (continued)
| (f) | The table below represents securities received as collateral for repurchase agreements. This collateral is deposited with the Fund’s custodian and, pursuant to the terms of the repurchase agreement, must have an aggregate value greater than or equal to the repurchase price plus accrued interest at all times. The value of securities and/or cash held as collateral for repurchase agreements is monitored on a daily basis to ensure the proper level of collateral. |
| | | | |
| Security Description | | Value ($) | |
Natixis Financial Products, Inc. (0.240%) | | | | |
Fannie Mae Pool | | | 1,201,723 | |
| |
Fannie Mae REMICS | | | 3,129,012 | |
| |
Freddie Mac Non Gold Pool | | | 340,748 | |
| |
Freddie Mac Reference REMIC | | | 84 | |
| |
Freddie Mac REMICS | | | 1,814,456 | |
| |
Ginnie Mae I Pool | | | 9,499 | |
| |
Ginnie Mae II Pool | | | 109,410 | |
| |
Government National Mortgage Association | | | 3,595,340 | |
| | | | | |
Total Market Value of Collateral Securities | | | 10,200,272 | |
| | | | |
| Security Description | | Value ($) | |
Societe Generale (0.180%) | | | | |
United States Treasury Inflation Indexed Bonds | | | 9,308,209 | |
| | | | | |
Total Market Value of Collateral Securities | | | 9,308,209 | |
Abbreviation Legend
| | |
| ADR | | American Depositary Receipt |
| REMIC(S) | | Real Estate Mortgage Investment Conduit(s) |
Fair Value Measurements
Generally accepted accounting principles (GAAP) require disclosure regarding the inputs and valuation techniques used to measure fair value and any changes in valuation inputs or techniques. In addition, investments shall be disclosed by major category.
The Fund categorizes its fair value measurements according to a three-level hierarchy that maximizes the use of observable inputs and minimizes the use of unobservable inputs by prioritizing that the most observable input be used when available. Observable inputs are those that market participants would use in pricing an investment based on market data obtained from sources independent of the reporting entity. Unobservable inputs are those that reflect the Fund’s assumptions about the information market participants would use in pricing an investment. An investment’s level within the fair value hierarchy is based on the lowest level of any input that is deemed significant to the asset or liability’s fair value measurement. The input levels are not necessarily an indication of the risk or liquidity associated with investments at that level. For example, certain U.S. government securities are generally high quality and liquid, however, they are reflected as Level 2 because the inputs used to determine fair value may not always be quoted prices in an active market.
Fair value inputs are summarized in the three broad levels listed below:
| > | | Level 1 — Valuations based on quoted prices for investments in active markets that the Fund has the ability to access at the measurement date (including NAV for open-end mutual funds). Valuation adjustments are not applied to Level 1 investments. |
| > | | Level 2 — Valuations based on other significant observable inputs (including quoted prices for similar securities, interest rates, prepayment speeds, credit risks, etc.). |
| > | | Level 3 — Valuations based on significant unobservable inputs (including the Fund’s own assumptions and judgment in determining the fair value of investments). |
Inputs that are used in determining fair value of an investment may include price information, credit data, volatility statistics, and other factors. These inputs can be either observable or unobservable. The availability of observable inputs can vary between investments, and is affected by various factors such as the type of investment, and the volume and level of activity for that investment or similar investments in the marketplace. The inputs will be considered by the Investment Manager, along with any other relevant factors in the calculation of an investment’s fair value. The Fund uses prices and inputs that are current as of the measurement date, which may include periods of market dislocations. During these periods, the availability of prices and inputs may be reduced for many investments. This condition could cause an investment to be reclassified between the various levels within the hierarchy.
Investments falling into the Level 3 category are primarily supported by quoted prices from brokers and dealers participating in the market for those investments. However, these may be classified as Level 3 investments due to lack of market transparency and corroboration to support these quoted prices. Additionally, valuation models may be used as the pricing source for any remaining investments classified as Level 3. These models rely on one or more significant unobservable inputs and/or significant assumptions by the Investment Manager. Inputs used in valuations may include, but are not limited to, financial statement analysis, capital account balances, discount rates and estimated cash flows, and comparable company data.
The accompanying Notes to Financial Statements are an integral part of this statement.
| | |
| |
| Columbia Equity Value Fund | | |
Portfolio of Investments (continued)
August 31, 2012 (Unaudited)
Fair Value Measurements (continued)
Under the direction of the Fund’s Board of Trustees (the Board), the Investment Manager’s Valuation Committee (the Committee) is responsible for carrying out the valuation procedures approved by the Board. The Committee consists of voting and non-voting members from various groups within the Investment Manager’s organization, including operations and accounting, trading and investments, compliance, risk management and legal.
The Committee meets at least monthly to review and approve valuation matters, which may include a description of specific valuation determinations, data regarding pricing information received from approved pricing vendors and brokers and the results of Board-approved valuation control policies and procedures (the Policies). The Policies address, among other things, instances when market quotations are readily available, including recommendation of third party pricing vendors and a determination of appropriate pricing methodologies; events that require specific valuation determinations and assessment of fair value techniques; securities with a potential for stale pricing, including those that are illiquid, restricted, or in default; and the effectiveness of third- party pricing vendors, including periodic reviews of vendors. The Committee meets more frequently, as needed, to discuss additional valuation matters, which may include the need to review back-testing results, review time-sensitive information or approve related valuation actions. The Committee reports to the Board, with members of the Committee meeting with the Board at each of its regularly scheduled meetings to discuss valuation matters and actions during the period, similar to those described earlier.
For investments categorized as Level 3, the Committee monitors information similar to that described above, which may include: (i) data specific to the issuer or comparable issuers, (ii) general market or specific sector news and (iii) quoted prices and specific or similar security transactions. The Committee considers this data and any changes from prior periods in order to assess the reasonableness of observable and unobservable inputs, any assumptions or internal models used to value those securities and changes in fair value. This data is also used to corroborate, when available, information received from approved pricing vendors and brokers. Various factors impact the frequency of monitoring this information (which may occur as often as daily). However, the Committee may determine that changes to inputs, assumptions and models are not required as a result of the monitoring procedures performed.
The following table is a summary of the inputs used to value the Fund’s investments at August 31, 2012:
| | | | | | | | | | | | | | | | |
| Description | | Level 1 Quoted Prices in Active
Markets for Identical
Assets ($) | | | Level 2 Other Significant
Observable Inputs ($) | | | Level 3 Significant
Unobservable Inputs ($) | | | Total ($) | |
Equity Securities | | | | | | | | | | | | | | | | |
| | | | |
Common Stocks | | | | | | | | | | | | | | | | |
| | | | |
Consumer Discretionary | | | 61,408,487 | | | | — | | | | — | | | | 61,408,487 | |
| | | | |
Consumer Staples | | | 48,770,170 | | | | — | | | | — | | | | 48,770,170 | |
| | | | |
Energy | | | 64,317,398 | | | | — | | | | — | | | | 64,317,398 | |
| | | | |
Financials | | | 103,940,219 | | | | — | | | | — | | | | 103,940,219 | |
| | | | |
Health Care | | | 93,343,954 | | | | — | | | | — | | | | 93,343,954 | |
| | | | |
Industrials | | | 80,450,909 | | | | — | | | | — | | | | 80,450,909 | |
| | | | |
Information Technology | | | 56,504,821 | | | | — | | | | — | | | | 56,504,821 | |
| | | | |
Materials | | | 17,589,379 | | | | — | | | | — | | | | 17,589,379 | |
| | | | |
Telecommunication Services | | | 25,135,602 | | | | — | | | | — | | | | 25,135,602 | |
| | | | |
Utilities | | | 13,144,134 | | | | — | | | | — | | | | 13,144,134 | |
| | | | | | | | | | | | | | | | | |
Total Equity Securities | | | 564,605,073 | | | | — | | | | — | | | | 564,605,073 | |
| | | | | | | | | | | | | | | | | |
Other | | | | | | | | | | | | | | | | |
| | | | |
Equity-Linked Notes | | | — | | | | 9,794,430 | | | | — | | | | 9,794,430 | |
| | | | |
Money Market Funds | | | 8,128,010 | | | | — | | | | — | | | | 8,128,010 | |
| | | | |
Investments of Cash Collateral Received for Securities on Loan | | | — | | | | 19,125,695 | | | | — | | | | 19,125,695 | |
| | | | | | | | | | | | | | | | | |
Total Other | | | 8,128,010 | | | | 28,920,125 | | | | — | | | | 37,048,135 | |
| | | | | | | | | | | | | | | | | |
Total | | | 572,733,083 | | | | 28,920,125 | | | | — | | | | 601,653,208 | |
| | | | | | | | | | | | | | | | | |
See the Portfolio of Investments for all investment classifications not indicated in the table.
The Fund’s assets assigned to the Level 2 input category are generally valued using the market approach, in which a security’s value is determined through reference to prices and information from market transactions for similar or identical assets.
There were no transfers of financial assets between Levels 1 and 2 during the period.
The accompanying Notes to Financial Statements are an integral part of this statement.
| | |
| |
| | Columbia Equity Value Fund |
Statement of Assets and Liabilities
August 31, 2012 (Unaudited)
| | | | |
Assets | | | | |
| |
Investments, at value* | | | | |
| |
Unaffiliated issuers (identified cost $503,128,767) | | | $574,399,503 | |
| |
Affiliated issuers (identified cost $8,128,010) | | | 8,128,010 | |
| |
Investment of cash collateral received for securities on loan | | | | |
| |
Repurchase agreements (identified cost $19,125,695) | | | 19,125,695 | |
| |
Total investments (identified cost $530,382,472) | | | 601,653,208 | |
| |
Receivable for: | | | | |
| |
Investments sold | | | 9,304,497 | |
| |
Capital shares sold | | | 426,828 | |
| |
Dividends | | | 1,725,801 | |
| |
Interest | | | 1,927 | |
| |
Reclaims | | | 12,161 | |
| |
Expense reimbursement due from Investment Manager | | | 1,150 | |
| |
Total assets | | | 613,125,572 | |
| |
| |
Liabilities | | | | |
| |
Due upon return of securities on loan | | | 19,125,695 | |
| |
Payable for: | | | | |
| |
Investments purchased | | | 4,460,625 | |
| |
Capital shares purchased | | | 681,764 | |
| |
Investment management fees | | | 10,476 | |
| |
Distribution fees | | | 4,311 | |
| |
Transfer agent fees | | | 80,082 | |
| |
Administration fees | | | 950 | |
| |
Plan administration fees | | | 613 | |
| |
Compensation of board members | | | 36,840 | |
| |
Other expenses | | | 26,252 | |
| |
Total liabilities | | | 24,427,608 | |
| |
Net assets applicable to outstanding capital stock | | | $588,697,964 | |
| |
| |
Represented by | | | | |
| |
Paid-in capital | | | $567,721,040 | |
| |
Undistributed net investment income | | | 1,882,274 | |
| |
Accumulated net realized loss | | | (52,176,086 | ) |
| |
Unrealized appreciation (depreciation) on: | | | | |
| |
Investments | | | 71,270,736 | |
| |
Total — representing net assets applicable to outstanding capital stock | | | $588,697,964 | |
| |
* Value of securities on loan | | | $18,816,378 | |
| |
The accompanying Notes to Financial Statements are an integral part of this statement.
| | |
| 10 | | Semiannual Report 2012 |
| | |
| |
| Columbia Equity Value Fund | | |
Statement of Assets and Liabilities (continued)
August 31, 2012 (Unaudited)
| | | | |
Class A | | | | |
| |
Net assets | | | $567,829,549 | |
| |
Shares outstanding | | | 53,317,732 | |
| |
Net asset value per share | | | $10.65 | |
| |
Maximum offering price per share(a) | | | $11.30 | |
| |
Class B | | | | |
| |
Net assets | | | $12,395,429 | |
| |
Shares outstanding | | | 1,158,061 | |
| |
Net asset value per share | | | $10.70 | |
| |
Class C | | | | |
| |
Net assets | | | $3,910,638 | |
| |
Shares outstanding | | | 370,454 | |
| |
Net asset value per share | | | $10.56 | |
| |
Class I | | | | |
| |
Net assets | | | $9,301 | |
| |
Shares outstanding | | | 891 | |
| |
Net asset value per share | | | $10.44 | |
| |
Class R | | | | |
| |
Net assets | | | $29,580 | |
| |
Shares outstanding | | | 2,778 | |
| |
Net asset value per share | | | $10.65 | |
| |
Class R3 | | | | |
| |
Net assets | | | $7,638 | |
| |
Shares outstanding | | | 716 | |
| |
Net asset value per share(b) | | | $10.68 | |
| |
Class R4 | | | | |
| |
Net assets | | | $2,833,162 | |
| |
Shares outstanding | | | 265,241 | |
| |
Net asset value per share | | | $10.68 | |
| |
Class R5 | | | | |
| |
Net assets | | | $1,066,405 | |
| |
Shares outstanding | | | 100,074 | |
| |
Net asset value per share | | | $10.66 | |
| |
Class W | | | | |
| |
Net assets | | | $14,278 | |
| |
Shares outstanding | | | 1,333 | |
| |
Net asset value per share | | | $10.71 | |
| |
Class Z | | | | |
| |
Net assets | | | $601,984 | |
| |
Shares outstanding | | | 56,465 | |
| |
Net asset value per share | | | $10.66 | |
| |
| (a) | The maximum offering price per share is calculated by dividing the net asset value by 1.0 minus the maximum sales charge of 5.75%. |
| (b) | Net asset value per share rounds to this amount due to fractional shares outstanding. |
The accompanying Notes to Financial Statements are an integral part of this statement.
| | | | |
| Semiannual Report 2012 | | | 11 | |
| | |
| |
| | Columbia Equity Value Fund |
Statement of Operations
Six months ended August 31, 2012 (Unaudited)
| | | | |
Net investment income | | | | |
Income: | | | | |
Dividends | | | 7,474,292 | |
Interest | | | 10 | |
Dividends — affiliated issuers | | | 10,324 | |
Income from securities lending — net | | | 43,196 | |
Foreign taxes withheld | | | (65,615 | ) |
| |
Total income | | | 7,462,207 | |
| |
Expenses: | | | | |
Investment management fees | | | 1,957,094 | |
Distribution fees | | | | |
Class A | | | 718,257 | |
Class B | | | 83,246 | |
Class C | | | 20,135 | |
Class R | | | 72 | |
Class R3 | | | 9 | |
Class W | | | 23 | |
Transfer agent fees | | | | |
Class A | | | 643,748 | |
Class B | | | 18,385 | |
Class C | | | 4,509 | |
Class R | | | 32 | |
Class R3 | | | 2 | |
Class R4 | | | 684 | |
Class R5 | | | 265 | |
Class W | | | 20 | |
Class Z | | | 635 | |
Administration fees | | | 177,477 | |
Plan administration fees | | | | |
Class R3 | | | 9 | |
Class R4 | | | 3,384 | |
Compensation of board members | | | 11,530 | |
Custodian fees | | | 4,499 | |
Printing and postage fees | | | 63,932 | |
Registration fees | | | 72,617 | |
Professional fees | | | 17,316 | |
Other | | | 16,775 | |
| |
Total expenses | | | 3,814,655 | |
Fees waived or expenses reimbursed by Investment Manager and its affiliates | | | (301,053 | ) |
Expense reductions | | | (40 | ) |
| |
Total net expenses | | | 3,513,562 | |
| |
Net investment income | | | 3,948,645 | |
| |
| |
Realized and unrealized gain (loss) — net | | | | |
Net realized gain (loss) on: | | | | |
Investments | | | 23,144,309 | |
| |
Net realized gain | | | 23,144,309 | |
Net change in unrealized appreciation (depreciation) on: | | | | |
Investments | | | (27,194,149 | ) |
| |
Net change in unrealized appreciation (depreciation) | | | (27,194,149 | ) |
| |
Net realized and unrealized loss | | | (4,049,840 | ) |
| |
Net decrease in net assets from operations | | | $(101,195 | ) |
| |
The accompanying Notes to Financial Statements are an integral part of this statement.
| | |
| 12 | | Semiannual Report 2012 |
| | |
| |
| Columbia Equity Value Fund | | |
Statement of Changes in Net Assets
| | | | | | | | | | | | |
| | | Six Months Ended
August 31,
2012
(Unaudited) | | | Year Ended
February 29,
2012(a) | | | Year Ended
March 31,
2011(b) | |
Operations | | | | | | | | | | | | |
| | | |
Net investment income | | | $3,948,645 | | | | $7,340,381 | | | | $7,661,143 | |
| | | |
Net realized gain | | | 23,144,309 | | | | 46,680,899 | | | | 18,221,361 | |
| | | |
Net change in unrealized appreciation (depreciation) | | | (27,194,149 | ) | | | (81,721,461 | ) | | | 84,205,396 | |
| |
Net increase (decrease) in net assets resulting from operations | | | (101,195 | ) | | | (27,700,181 | ) | | | 110,087,900 | |
| |
| | | |
Distributions to shareholders from: | | | | | | | | | | | | |
| | | |
Net investment income | | | | | | | | | | | | |
| | | |
Class A | | | (4,319,131 | ) | | | (5,269,081 | ) | | | (7,179,224 | ) |
| | | |
Class B | | | (62,687 | ) | | | (48,235 | ) | | | (77,999 | ) |
| | | |
Class C | | | (14,900 | ) | | | (11,345 | ) | | | (15,019 | ) |
| | | |
Class I | | | (91 | ) | | | (126,995 | ) | | | (201,744 | ) |
| | | |
Class R | | | (178 | ) | | | (161 | ) | | | (252 | ) |
| | | |
Class R3 | | | (52 | ) | | | (88 | ) | | | (1,339 | ) |
| | | |
Class R4 | | | (22,012 | ) | | | (22,500 | ) | | | (143,049 | ) |
| | | |
Class R5 | | | (9,828 | ) | | | (11,406 | ) | | | (13,912 | ) |
| | | |
Class W | | | (81 | ) | | | (52,773 | ) | | | (62,989 | ) |
| | | |
Class Z | | | (5,026 | ) | | | (1,893 | ) | | | (19 | ) |
| |
Total distributions to shareholders | | | (4,433,986 | ) | | | (5,544,477 | ) | | | (7,695,546 | ) |
| |
Increase (decrease) in net assets from capital stock activity | | | (29,657,966 | ) | | | (145,579,134 | ) | | | (65,457,158 | ) |
| |
Total increase (decrease) in net assets | | | (34,193,147 | ) | | | (178,823,792 | ) | | | 36,935,196 | |
| | | |
Net assets at beginning of period | | | 622,891,111 | | | | 801,714,903 | | | | 764,779,707 | |
| |
Net assets at end of period | | | $588,697,964 | | | | $622,891,111 | | | | $801,714,903 | |
| |
Undistributed net investment income | | | $1,882,274 | | | | $2,367,615 | | | | $576,103 | |
| |
| (a) | For the period from April 1, 2011 to February 29, 2012. During the period, the Fund’s fiscal year end was changed from March 31 to February 29. |
| (b) | Class Z shares are for the period from September 27, 2010 (commencement of operations) to March 31, 2011. |
The accompanying Notes to Financial Statements are an integral part of this statement.
| | | | |
| Semiannual Report 2012 | | | 13 | |
| | |
| |
| | Columbia Equity Value Fund |
Statement of Changes in Net Assets (continued)
| | | | | | | | | | | | | | | | | | | | | | | | |
| | | Six Months Ended
August 31, 2012 (Unaudited) | | | Year Ended
February 29, 2012(a) | | | Year Ended
March 31, 2011(b) | |
| | | Shares | | | Dollars ($) | | | Shares | | | Dollars ($) | | | Shares | | | Dollars ($) | |
Capital stock activity | | | | | | | | | | | | | | | | | | | | | | | | |
| | | | | | |
Class A shares | | | | | | | | | | | | | | | | | | | | | | | | |
| | | | | | |
Subscriptions(c) | | | 3,235,449 | | | | 33,808,214 | | | | 9,404,750 | | | | 96,086,104 | | | | 11,863,039 | | | | 114,231,427 | |
| | | | | | |
Distributions reinvested | | | 405,081 | | | | 4,251,836 | | | | 534,248 | | | | 5,105,936 | | | | 704,553 | | | | 6,924,170 | |
| | | | | | |
Redemptions | | | (5,853,642 | ) | | | (61,299,740 | ) | | | (20,560,206 | ) | | | (205,662,642 | ) | | | (17,157,384 | ) | | | (166,372,781 | ) |
| |
Net decrease | | | (2,213,112 | ) | | | (23,239,690 | ) | | | (10,621,208 | ) | | | (104,470,602 | ) | | | (4,589,792 | ) | | | (45,217,184 | ) |
| |
Class B shares | | | | | | | | | | | | | | | | | | | | | | | | |
| | | | | | |
Subscriptions | | | 8,334 | | | | 85,099 | | | | 26,343 | | | | 263,114 | | | | 105,380 | | | | 991,166 | |
| | | | | | |
Distributions reinvested | | | 5,832 | | | | 62,067 | | | | 4,754 | | | | 47,022 | | | | 7,640 | | | | 76,165 | |
| | | | | | |
Redemptions(c) | | | (620,613 | ) | | | (6,458,807 | ) | | | (1,182,811 | ) | | | (12,595,998 | ) | | | (2,381,711 | ) | | | (21,961,103 | ) |
| |
Net decrease | | | (606,447 | ) | | | (6,311,641 | ) | | | (1,151,714 | ) | | | (12,285,862 | ) | | | (2,268,691 | ) | | | (20,893,772 | ) |
| |
Class C shares | | | | | | | | | | | | | | | | | | | | | | | | |
| | | | | | |
Subscriptions | | | 14,769 | | | | 153,336 | | | | 40,027 | | | | 408,988 | | | | 67,039 | | | | 644,739 | |
| | | | | | |
Distributions reinvested | | | 1,376 | | | | 14,443 | | | | 1,144 | | | | 10,882 | | | | 1,474 | | | | 14,407 | |
| | | | | | |
Redemptions | | | (41,251 | ) | | | (431,467 | ) | | | (100,734 | ) | | | (1,008,372 | ) | | | (125,852 | ) | | | (1,214,784 | ) |
| |
Net decrease | | | (25,106 | ) | | | (263,688 | ) | | | (59,563 | ) | | | (588,502 | ) | | | (57,339 | ) | | | (555,638 | ) |
| |
Class I shares | | | | | | | | | | | | | | | | | | | | | | | | |
| | | | | | |
Subscriptions | | | — | | | | — | | | | 2,671,286 | | | | 28,362,782 | | | | 62,165 | | | | 607,271 | |
| | | | | | |
Distributions reinvested | | | — | | | | — | | | | 13,097 | | | | 126,725 | | | | 21,274 | | | | 201,610 | |
| | | | | | |
Redemptions | | | — | | | | — | | | | (2,684,383 | ) | | | (26,076,569 | ) | | | (1,987,819 | ) | | | (21,509,209 | ) |
| |
Net increase (decrease) | | | — | | | | — | | | | — | | | | 2,412,938 | | | | (1,904,380 | ) | | | (20,700,328 | ) |
| |
Class R shares | | | | | | | | | | | | | | | | | | | | | | | | |
| | | | | | |
Subscriptions | | | 130 | | | | 1,371 | | | | 309 | | | | 3,138 | | | | 272 | | | | 2,650 | |
| | | | | | |
Distributions reinvested | | | 13 | | | | 134 | | | | 13 | | | | 120 | | | | 20 | | | | 199 | |
| | | | | | |
Redemptions | | | (83 | ) | | | (873 | ) | | | (722 | ) | | | (7,961 | ) | | | (303 | ) | | | (3,233 | ) |
| |
Net increase (decrease) | | | 60 | | | | 632 | | | | (400 | ) | | | (4,703 | ) | | | (11 | ) | | | (384 | ) |
| |
Class R3 shares | | | | | | | | | | | | | | | | | | | | | | | | |
| | | | | | |
Subscriptions | | | — | | | | — | | | | — | | | | — | | | | 1,835 | | | | 17,760 | |
| | | | | | |
Distributions reinvested | | | 1 | | | | 3 | | | | — | | | | 6 | | | | 136 | | | | 1,293 | |
| | | | | | |
Redemptions | | | — | | | | — | | | | — | | | | — | | | | (20,270 | ) | | | (219,097 | ) |
| |
Net increase (decrease) | | | 1 | | | | 3 | | | | — | | | | 6 | | | | (18,299 | ) | | | (200,044 | ) |
| |
Class R4 shares | | | | | | | | | | | | | | | | | | | | | | | | |
| | | | | | |
Subscriptions | | | 34,310 | | | | 358,661 | | | | 66,523 | | | | 697,791 | | | | 440,763 | | | | 4,323,275 | |
| | | | | | |
Distributions reinvested | | | 2,087 | | | | 21,945 | | | | 2,355 | | | | 22,431 | | | | 14,430 | | | | 142,954 | |
| | | | | | |
Redemptions | | | (28,080 | ) | | | (298,039 | ) | | | (1,063,581 | ) | | | (11,798,258 | ) | | | (249,592 | ) | | | (2,426,986 | ) |
| |
Net increase (decrease) | | | 8,317 | | | | 82,567 | | | | (994,703 | ) | | | (11,078,036 | ) | | | 205,601 | | | | 2,039,243 | |
| |
Class R5 shares | | | | | | | | | | | | | | | | | | | | | | | | |
| | | | | | |
Subscriptions | | | 5,243 | | | | 55,697 | | | | 6,876 | | | | 67,009 | | | | 100,930 | | | | 880,332 | |
| | | | | | |
Distributions reinvested | | | 932 | | | | 9,761 | | | | 1,182 | | | | 11,327 | | | | 1,403 | | | | 13,813 | |
| | | | | | |
Redemptions | | | (3,375 | ) | | | (35,174 | ) | | | (7,418 | ) | | | (72,500 | ) | | | (6,375 | ) | | | (59,507 | ) |
| |
Net increase | | | 2,800 | | | | 30,284 | | | | 640 | | | | 5,836 | | | | 95,958 | | | | 834,638 | |
| |
The accompanying Notes to Financial Statements are an integral part of this statement.
| | |
| 14 | | Semiannual Report 2012 |
| | |
| |
| Columbia Equity Value Fund | | |
Statement of Changes in Net Assets (continued)
| | | | | | | | | | | | | | | | | | | | | | | | |
| | | Six Months Ended
August 31, 2012 (Unaudited) | | | Year Ended
February 29, 2012(a) | | | Year Ended
March 31, 2011(b) | |
| | | Shares | | | Dollars ($) | | | Shares | | | Dollars ($) | | | Shares | | | Dollars ($) | |
Class W shares | | | | | | | | | | | | | | | | | | | | | | | | |
| | | | | | |
Subscriptions | | | 1 | | | | 7 | | | | 149,473 | | | | 1,638,148 | | | | 1,969,543 | | | | 20,517,725 | |
| | | | | | |
Distributions reinvested | | | 6 | | | | 61 | | | | 4,992 | | | | 52,762 | | | | 5,791 | | | | 62,947 | |
| | | | | | |
Redemptions | | | (1,036 | ) | | | (10,956 | ) | | | (2,002,364 | ) | | | (21,784,983 | ) | | | (125,453 | ) | | | (1,346,861 | ) |
| |
Net increase (decrease) | | | (1,029 | ) | | | (10,888 | ) | | | (1,847,899 | ) | | | (20,094,073 | ) | | | 1,849,881 | | | | 19,233,811 | |
| |
Class Z shares | | | | | | | | | | | | | | | | | | | | | | | | |
| | | | | | |
Subscriptions | | | 17,973 | | | | 188,841 | | | | 57,289 | | | | 585,632 | | | | 268 | | | | 2,500 | |
| | | | | | |
Distributions reinvested | | | 375 | | | | 3,915 | | | | 108 | | | | 1,012 | | | | — | | | | — | |
| | | | | | |
Redemptions | | | (13,355 | ) | | | (138,301 | ) | | | (6,193 | ) | | | (62,780 | ) | | | — | | | | — | |
| |
Net increase | | | 4,993 | | | | 54,455 | | | | 51,204 | | | | 523,864 | | | | 268 | | | | 2,500 | |
| |
Total net decrease | | | (2,829,523 | ) | | | (29,657,966 | ) | | | (14,623,643 | ) | | | (145,579,134 | ) | | | (6,686,804 | ) | | | (65,457,158 | ) |
| |
| (a) | For the period from April 1, 2011 to February 29, 2012. During the period, the Fund’s fiscal year end was changed from March 31 to February 29. |
| (b) | Class Z shares are for the period from September 27, 2010 (commencement of operations) to March 31, 2011. |
| (c) | Includes conversions of Class B shares to Class A shares, if any. |
The accompanying Notes to Financial Statements are an integral part of this statement.
| | | | |
| Semiannual Report 2012 | | | 15 | |
| | |
| |
| | Columbia Equity Value Fund |
Financial Highlights
The following tables are intended to help you understand the Fund’s financial performance. Certain information reflects financial results for a single share of a class held for the periods shown. For periods ended 2008 and after, per share net investment income (loss) amounts are calculated based on average shares outstanding during the period. Total return assumes reinvestment of all dividends and distributions. Total return does not reflect payment of sales charges, if any, and is not annualized for periods of less than one year.
| | | | | | | | | | | | | | | | | | | | | | | | | | | | |
| |
| Six Months Ended
August 31,
2012 (Unaudited) |
| |
| Year Ended
February 29, |
| | | Year Ended March 31, | |
Class A | | | | 2012(a) | | | | 2011 | | | | 2010 | | | | 2009 | | | | 2008 | | | | 2007 | |
Per share data | | | | | | | | | | | | | | | | | | | | | | | | | | | | |
Net asset value, beginning of period | | | $10.72 | | | | $11.02 | | | | $9.63 | | | | $6.54 | | | | $11.97 | | | | $13.43 | | | | $12.16 | |
| | | | | | | | | | | | | | | | | | | | | | | | | | | | | |
Income from investment operations: | | | | | | | | | | | | | | | | | | | | | | | | | | | | |
| | | | | | | |
Net investment income | | | 0.07 | | | | 0.11 | | | | 0.10 | | | | 0.12 | | | | 0.16 | | | | 0.15 | | | | 0.14 | |
| | | | | | | | | | | | | | | | | | | | | | | | | | | | | |
Net realized and unrealized gain (loss) | | | (0.06 | ) | | | (0.33 | ) | | | 1.40 | | | | 3.10 | | | | (4.79 | ) | | | (0.66 | ) | | | 1.27 | |
| | | | | | | | | | | | | | | | | | | | | | | | | | | | | |
Total from investment operations | | | 0.01 | | | | (0.22 | ) | | | 1.50 | | | | 3.22 | | | | (4.63 | ) | | | (0.51 | ) | | | 1.41 | |
| | | | | | | | | | | | | | | | | | | | | | | | | | | | | |
Less distributions to shareholders: | | | | | | | | | | | | | | | | | | | | | | | | | | | | |
| | | | | | | |
Net investment income | | | (0.08 | ) | | | (0.08 | ) | | | (0.11 | ) | | | (0.13 | ) | | | (0.15 | ) | | | (0.18 | ) | | | (0.14 | ) |
| | | | | | | | | | | | | | | | | | | | | | | | | | | | | |
Net realized gains | | | — | | | | — | | | | — | | | | — | | | | (0.65 | ) | | | (0.77 | ) | | | — | |
| | | | | | | | | | | | | | | | | | | | | | | | | | | | | |
Total distributions to shareholders | | | (0.08 | ) | | | (0.08 | ) | | | (0.11 | ) | | | (0.13 | ) | | | (0.80 | ) | | | (0.95 | ) | | | (0.14 | ) |
| | | | | | | | | | | | | | | | | | | | | | | | | | | | | |
Net asset value, end of period | | | $10.65 | | | | $10.72 | | | | $11.02 | | | | $9.63 | | | | $6.54 | | | | $11.97 | | | | $13.43 | |
| | | | | | | | | | | | | | | | | | | | | | | | | | | | | |
Total return | | | 0.10 | % | | | (1.87 | %) | | | 15.67 | % | | | 49.52 | % | | | (39.50 | %) | | | (4.39 | %) | | | 11.67 | % |
| | | | | | | | | | | | | | | | | | | | | | | | | | | | | |
Ratios to average net assets(b) | | | | | | | | | | | | | | | | | | | | | | | | | | | | |
| | | | | | | |
Expenses prior to fees waived or expenses reimbursed | | | 1.24 | %(c) | | | 1.22 | %(c) | | | 1.11 | % | | | 1.09 | % | | | 1.11 | % | | | 1.06 | % | | | 1.09 | % |
| | | | | | | | | | | | | | | | | | | | | | | | | | | | | |
Net expenses after fees waived or expenses reimbursed(d) | | | 1.14 | %(c)(e) | | | 1.12 | %(c)(e) | | | 1.11 | % | | | 1.09 | % | | | 1.11 | % | | | 1.06 | %(f) | | | 1.09 | % |
| | | | | | | | | | | | | | | | | | | | | | | | | | | | | |
Net investment income | | | 1.34 | %(c)(e) | | | 1.18 | %(c)(e) | | | 1.07 | % | | | 1.39 | % | | | 1.68 | % | | | 1.09 | % | | | 1.13 | % |
| | | | | | | | | | | | | | | | | | | | | | | | | | | | | |
Supplemental data | | | | | | | | | | | | | | | | | | | | | | | | | | | | |
| | | | | | | |
Net assets, end of period (in thousands) | | | $567,830 | | | | $595,255 | | | | $729,078 | | | | $681,073 | | | | $450,713 | | | | $862,727 | | | | $1,038,420 | |
| | | | | | | | | | | | | | | | | | | | | | | | | | | | | |
Portfolio turnover | | | 22 | % | | | 21 | % | | | 37 | % | | | 30 | % | | | 21 | % | | | 25 | % | | | 37 | % |
| | | | | | | | | | | | | | | | | | | | | | | | | | | | | |
Notes to Financial Highlights
| (a) | For the period from April 1, 2011 to February 29, 2012. During the period, the Fund’s fiscal year end was changed from March 31 to February 29. |
| (b) | In addition to the fees and expenses which the Fund bears directly, the Fund indirectly bears a pro rata share of the fees and expenses of the acquired funds in which it invests. Such indirect expenses are not included in the reported expense ratios. |
| (d) | The Investment Manager and certain of its affiliates agreed to waive/reimburse certain fees and expenses, if applicable. |
| (e) | The benefits derived from expense reductions had an impact of less than 0.01%. |
| (f) | For the year ended March 31, 2008, the ratio of net expenses after reduction for earnings and bank fee credits was 1.05% for Class A. |
The accompanying Notes to Financial Statements are an integral part of this statement.
| | |
| 16 | | Semiannual Report 2012 |
| | |
| |
| Columbia Equity Value Fund | | |
Financial Highlights (continued)
| | | | | | | | | | | | | | | | | | | | | | | | | | | | |
| |
| Six Months Ended
August 31,
2012 (Unaudited) |
| |
| Year Ended
February 29, |
| | | Year Ended March 31, | |
Class B | | | | 2012(a) | | | | 2011 | | | | 2010 | | | | 2009 | | | | 2008 | | | | 2007 | |
Per share data | | | | | | | | | | | | | | | | | | | | | | | | | | | | |
Net asset value, beginning of period | | | $10.77 | | | | $11.08 | | | | $9.67 | | | | $6.57 | | | | $12.01 | | | | $13.46 | | | | $12.19 | |
| | | | | | | | | | | | | | | | | | | | | | | | | | | | | |
Income from investment operations: | | | | | | | | | | | | | | | | | | | | | | | | | | | | |
| | | | | | | |
Net investment income | | | 0.03 | | | | 0.04 | | | | 0.03 | | | | 0.06 | | | | 0.09 | | | | 0.05 | | | | 0.04 | |
| | | | | | | | | | | | | | | | | | | | | | | | | | | | | |
Net realized and unrealized gain (loss) | | | (0.06 | ) | | | (0.33 | ) | | | 1.40 | | | | 3.10 | | | | (4.80 | ) | | | (0.66 | ) | | | 1.27 | |
| | | | | | | | | | | | | | | | | | | | | | | | | | | | | |
Total from investment operations | | | (0.03 | ) | | | (0.29 | ) | | | 1.43 | | | | 3.16 | | | | (4.71 | ) | | | (0.61 | ) | | | 1.31 | |
| | | | | | | | | | | | | | | | | | | | | | | | | | | | | |
Less distributions to shareholders: | | | | | | | | | | | | | | | | | | | | | | | | | | | | |
| | | | | | | |
Net investment income | | | (0.04 | ) | | | (0.02 | ) | | | (0.02 | ) | | | (0.06 | ) | | | (0.08 | ) | | | (0.07 | ) | | | (0.04 | ) |
| | | | | | | | | | | | | | | | | | | | | | | | | | | | | |
Net realized gains | | | — | | | | — | | | | — | | | | — | | | | (0.65 | ) | | | (0.77 | ) | | | — | |
| | | | | | | | | | | | | | | | | | | | | | | | | | | | | |
Total distributions to shareholders | | | (0.04 | ) | | | (0.02 | ) | | | (0.02 | ) | | | (0.06 | ) | | | (0.73 | ) | | | (0.84 | ) | | | (0.04 | ) |
| | | | | | | | | | | | | | | | | | | | | | | | | | | | | |
Net asset value, end of period | | | $10.70 | | | | $10.77 | | | | $11.08 | | | | $9.67 | | | | $6.57 | | | | $12.01 | | | | $13.46 | |
| | | | | | | | | | | | | | | | | | | | | | | | | | | | | |
Total return | | | (0.31 | %) | | | (2.58 | %) | | | 14.84 | % | | | 48.26 | % | | | (39.94 | %) | | | (5.07 | %) | | | 10.77 | % |
| | | | | | | | | | | | | | | | | | | | | | | | | | | | | |
Ratios to average net assets(b) | | | | | | | | | | | | | | | | | | | | | | | | | | | | |
| | | | | | | |
Expenses prior to fees waived or expenses reimbursed | | | 1.98 | %(c) | | | 1.96 | %(c) | | | 1.86 | % | | | 1.85 | % | | | 1.88 | % | | | 1.82 | % | | | 1.86 | % |
| | | | | | | | | | | | | | | | | | | | | | | | | | | | | |
Net expenses after fees waived or expenses reimbursed(d) | | | 1.89 | %(c)(e) | | | 1.88 | %(c)(e) | | | 1.86 | % | | | 1.85 | % | | | 1.88 | % | | | 1.82 | %(f) | | | 1.86 | % |
| | | | | | | | | | | | | | | | | | | | | | | | | | | | | |
Net investment income | | | 0.57 | %(c)(e) | | | 0.41 | %(c)(e) | | | 0.30 | % | | | 0.68 | % | | | 0.88 | % | | | 0.33 | % | | | 0.35 | % |
| | | | | | | | | | | | | | | | | | | | | | | | | | | | | |
Supplemental data | | | | | | | | | | | | | | | | | | | | | | | | | | | | |
| | | | | | | |
Net assets, end of period (in thousands) | | | $12,395 | | | | $19,003 | | | | $32,311 | | | | $50,132 | | | | $50,135 | | | | $120,950 | | | | $185,259 | |
| | | | | | | | | | | | | | | | | | | | | | | | | | | | | |
Portfolio turnover | | | 22 | % | | | 21 | % | | | 37 | % | | | 30 | % | | | 21 | % | | | 25 | % | | | 37 | % |
| | | | | | | | | | | | | | | | | | | | | | | | | | | | | |
Notes to Financial Highlights
| (a) | For the period from April 1, 2011 to February 29, 2012. During the period, the Fund’s fiscal year end was changed from March 31 to February 29. |
| (b) | In addition to the fees and expenses which the Fund bears directly, the Fund indirectly bears a pro rata share of the fees and expenses of the acquired funds in which it invests. Such indirect expenses are not included in the reported expense ratios. |
| (d) | The Investment Manager and certain of its affiliates agreed to waive/reimburse certain fees and expenses, if applicable. |
| (e) | The benefits derived from expense reductions had an impact of less than 0.01%. |
| (f) | For the year ended March 31, 2008, the ratio of net expenses after reduction for earnings and bank fee credits was 1.81% for Class B. |
The accompanying Notes to Financial Statements are an integral part of this statement.
| | | | |
| Semiannual Report 2012 | | | 17 | |
| | |
| |
| | Columbia Equity Value Fund |
Financial Highlights (continued)
| | | | | | | | | | | | | | | | | | | | | | | | | | | | |
| |
| Six Months Ended
August 31,
2012 (Unaudited) |
| |
| Year Ended
February 29, |
| | | Year Ended March 31, | |
Class C | | | | 2012(a) | | | | 2011 | | | | 2010 | | | | 2009 | | | | 2008 | | | | 2007 | |
Per share data | | | | | | | | | | | | | | | | | | | | | | | | | | | | |
Net asset value, beginning of period | | | $10.62 | | | | $10.93 | | | | $9.55 | | | | $6.49 | | | | $11.89 | | | | $13.34 | | | | $12.09 | |
| | | | | | | | | | | | | | | | | | | | | | | | | | | | | |
Income from investment operations: | | | | | | | | | | | | | | | | | | | | | | | | | | | | |
| | | | | | | |
Net investment income | | | 0.03 | | | | 0.04 | | | | 0.03 | | | | 0.05 | | | | 0.09 | | | | 0.05 | | | | 0.06 | |
| | | | | | | | | | | | | | | | | | | | | | | | | | | | | |
Net realized and unrealized gain (loss) | | | (0.05 | ) | | | (0.32 | ) | | | 1.38 | | | | 3.08 | | | | (4.76 | ) | | | (0.66 | ) | | | 1.24 | |
| | | | | | | | | | | | | | | | | | | | | | | | | | | | | |
Total from investment operations | | | (0.02 | ) | | | (0.28 | ) | | | 1.41 | | | | 3.13 | | | | (4.67 | ) | | | (0.61 | ) | | | 1.30 | |
| | | | | | | | | | | | | | | | | | | | | | | | | | | | | |
Less distributions to shareholders: | | | | | | | | | | | | | | | | | | | | | | | | | | | | |
| | | | | | | |
Net investment income | | | (0.04 | ) | | | (0.03 | ) | | | (0.03 | ) | | | (0.07 | ) | | | (0.08 | ) | | | (0.07 | ) | | | (0.05 | ) |
| | | | | | | | | | | | | | | | | | | | | | | | | | | | | |
Net realized gains | | | — | | | | — | | | | — | | | | — | | | | (0.65 | ) | | | (0.77 | ) | | | — | |
| | | | | | | | | | | | | | | | | | | | | | | | | | | | | |
Total distributions to shareholders | | | (0.04 | ) | | | (0.03 | ) | | | (0.03 | ) | | | (0.07 | ) | | | (0.73 | ) | | | (0.84 | ) | | | (0.05 | ) |
| | | | | | | | | | | | | | | | | | | | | | | | | | | | | |
Net asset value, end of period | | | $10.56 | | | | $10.62 | | | | $10.93 | | | | $9.55 | | | | $6.49 | | | | $11.89 | | | | $13.34 | |
| | | | | | | | | | | | | | | | | | | | | | | | | | | | | |
Total return | | | (0.20 | %) | | | (2.56 | %) | | | 14.82 | % | | | 48.35 | % | | | (39.97 | %) | | | (5.07 | %) | | | 10.81 | % |
| | | | | | | | | | | | | | | | | | | | | | | | | | | | | |
Ratios to average net assets(b) | | | | | | | | | | | | | | | | | | | | | | | | | | | | |
| | | | | | | |
Expenses prior to fees waived or expenses reimbursed | | | 1.99 | %(c) | | | 1.97 | %(c) | | | 1.86 | % | | | 1.85 | % | | | 1.87 | % | | | 1.82 | % | | | 1.84 | % |
| | | | | | | | | | | | | | | | | | | | | | | | | | | | | |
Net expenses after fees waived or expenses reimbursed(d) | | | 1.89 | %(c)(e) | | | 1.88 | %(c)(e) | | | 1.86 | % | | | 1.85 | % | | | 1.87 | % | | | 1.82 | %(f) | | | 1.84 | % |
| | | | | | | | | | | | | | | | | | | | | | | | | | | | | |
Net investment income | | | 0.59 | %(c)(e) | | | 0.44 | %(c)(e) | | | 0.32 | % | | | 0.62 | % | | | 0.94 | % | | | 0.34 | % | | | 0.38 | % |
| | | | | | | | | | | | | | | | | | | | | | | | | | | | | |
Supplemental data | | | | | | | | | | | | | | | | | | | | | | | | | | | | |
| | | | | | | |
Net assets, end of period (in thousands) | | | $3,911 | | | | $4,203 | | | | $4,977 | | | | $4,895 | | | | $3,103 | | | | $5,339 | | | | $6,275 | |
| | | | | | | | | | | | | | | | | | | | | | | | | | | | | |
Portfolio turnover | | | 22 | % | | | 21 | % | | | 37 | % | | | 30 | % | | | 21 | % | | | 25 | % | | | 37 | % |
| | | | | | | | | | | | | | | | | | | | | | | | | | | | | |
Notes to Financial Highlights
| (a) | For the period from April 1, 2011 to February 29, 2012. During the period, the Fund’s fiscal year end was changed from March 31 to February 29. |
| (b) | In addition to the fees and expenses which the Fund bears directly, the Fund indirectly bears a pro rata share of the fees and expenses of the acquired funds in which it invests. Such indirect expenses are not included in the reported expense ratios. |
| (d) | The Investment Manager and certain of its affiliates agreed to waive/reimburse certain fees and expenses, if applicable. |
| (e) | The benefits derived from expense reductions had an impact of less than 0.01%. |
| (f) | For the year ended March 31, 2008, the ratio of net expenses after reduction for earnings and bank fee credits was 1.81% for Class C. |
The accompanying Notes to Financial Statements are an integral part of this statement.
| | |
| 18 | | Semiannual Report 2012 |
| | |
| |
| Columbia Equity Value Fund | | |
Financial Highlights (continued)
| | | | | | | | | | | | | | | | | | | | | | | | | | | | |
| |
| Six Months Ended
August 31,
2012 (Unaudited) |
| |
| Year Ended
February 29, |
| | | Year Ended March 31, | |
Class I | | | | 2012(a) | | | | 2011 | | | | 2010 | | | | 2009 | | | | 2008 | | | | 2007 | |
Per share data | | | | | | | | | | | | | | | | | | | | | | | | | | | | |
Net asset value, beginning of period | | | $10.51 | | | | $11.03 | | | | $9.64 | | | | $6.55 | | | | $11.99 | | | | $13.45 | | | | $12.18 | |
| | | | | | | | | | | | | | | | | | | | | | | | | | | | | |
Income from investment operations: | | | | | | | | | | | | | | | | | | | | | | | | | | | | |
| | | | | | | |
Net investment income | | | 0.09 | | | | 0.14 | | | | 0.14 | | | | 0.14 | | | | 0.21 | | | | 0.21 | | | | 0.20 | |
| | | | | | | | | | | | | | | | | | | | | | | | | | | | | |
Net realized and unrealized gain (loss) | | | (0.06 | ) | | | (0.36 | ) | | | 1.40 | | | | 3.12 | | | | (4.80 | ) | | | (0.67 | ) | | | 1.26 | |
| | | | | | | | | | | | | | | | | | | | | | | | | | | | | |
Total from investment operations | | | 0.03 | | | | (0.22 | ) | | | 1.54 | | | | 3.26 | | | | (4.59 | ) | | | (0.46 | ) | | | 1.46 | |
| | | | | | | | | | | | | | | | | | | | | | | | | | | | | |
Less distributions to shareholders: | | | | | | | | | | | | | | | | | | | | | | | | | | | | |
| | | | | | | |
Net investment income | | | (0.10 | ) | | | (0.30 | ) | | | (0.15 | ) | | | (0.17 | ) | | | (0.20 | ) | | | (0.23 | ) | | | (0.19 | ) |
| | | | | | | | | | | | | | | | | | | | | | | | | | | | | |
Net realized gains | | | — | | | | — | | | | — | | | | — | | | | (0.65 | ) | | | (0.77 | ) | | | — | |
| | | | | | | | | | | | | | | | | | | | | | | | | | | | | |
Total distributions to shareholders | | | (0.10 | ) | | | (0.30 | ) | | | (0.15 | ) | | | (0.17 | ) | | | (0.85 | ) | | | (1.00 | ) | | | (0.19 | ) |
| | | | | | | | | | | | | | | | | | | | | | | | | | | | | |
Net asset value, end of period | | | $10.44 | | | | $10.51 | | | | $11.03 | | | | $9.64 | | | | $6.55 | | | | $11.99 | | | | $13.45 | |
| | | | | | | | | | | | | | | | | | | | | | | | | | | | | |
Total return | | | 0.32 | % | | | (1.59 | %) | | | 16.18 | % | | | 50.13 | % | | | (39.22 | %) | | | (3.99 | %) | | | 12.11 | % |
| | | | | | | | | | | | | | | | | | | | | | | | | | | | | |
Ratios to average net assets(b) | | | | | | | | | | | | | | | | | | | | | | | | | | | | |
| | | | | | | |
Expenses prior to fees waived or expenses reimbursed | | | 0.77 | %(c) | | | 0.74 | %(c) | | | 0.63 | % | | | 0.66 | % | | | 0.69 | % | | | 0.65 | % | | | 0.67 | % |
| | | | | | | | | | | | | | | | | | | | | | | | | | | | | |
Net expenses after fees waived or expenses reimbursed(d) | | | 0.73 | %(c) | | | 0.69 | %(c) | | | 0.63 | % | | | 0.66 | % | | | 0.69 | % | | | 0.65 | % | | | 0.67 | % |
| | | | | | | | | | | | | | | | | | | | | | | | | | | | | |
Net investment income | | | 1.76 | %(c) | | | 1.52 | %(c) | | | 1.50 | % | | | 1.50 | % | | | 2.00 | % | | | 1.50 | % | | | 1.54 | % |
| | | | | | | | | | | | | | | | | | | | | | | | | | | | | |
Supplemental data | | | | | | | | | | | | | | | | | | | | | | | | | | | | |
| | | | | | | |
Net assets, end of period (in thousands) | | | $9 | | | | $9 | | | | $10 | | | | $18,363 | | | | $4 | | | | $13 | | | | $14 | |
| | | | | | | | | | | | | | | | | | | | | | | | | | | | | |
Portfolio turnover | | | 22 | % | | | 21 | % | | | 37 | % | | | 30 | % | | | 21 | % | | | 25 | % | | | 37 | % |
| | | | | | | | | | | | | | | | | | | | | | | | | | | | | |
Notes to Financial Highlights
| (a) | For the period from April 1, 2011 to February 29, 2012. During the period, the Fund’s fiscal year end was changed from March 31 to February 29. |
| (b) | In addition to the fees and expenses which the Fund bears directly, the Fund indirectly bears a pro rata share of the fees and expenses of the acquired funds in which it invests. Such indirect expenses are not included in the reported expense ratios. |
| (d) | The Investment Manager and certain of its affiliates agreed to waive/reimburse certain fees and expenses, if applicable. |
The accompanying Notes to Financial Statements are an integral part of this statement.
| | | | |
| Semiannual Report 2012 | | | 19 | |
| | |
| |
| | Columbia Equity Value Fund |
Financial Highlights (continued)
| | | | | | | | | | | | | | | | | | | | | | | | | | | | |
| |
| Six Months Ended
August 31,
2012 (Unaudited)
|
| |
| Year Ended
February 29, |
| | | Year Ended March 31, | |
Class R | | | | 2012(a) | | | | 2011 | | | | 2010 | | | | 2009 | | | | 2008 | | | | 2007(b) | |
Per share data | | | | | | | | | | | | | | | | | | | | | | | | | | | | |
Net asset value, beginning of period | | | $10.72 | | | | $11.02 | | | | $9.63 | | | | $6.54 | | | | $11.98 | | | | $13.43 | | | | $13.36 | |
| | | | | | | | | | | | | | | | | | | | | | | | | | | | | |
Income from investment operations: | | | | | | | | | | | | | | | | | | | | | | | | | | | | |
| | | | | | | |
Net investment income | | | 0.06 | | | | 0.09 | | | | 0.08 | | | | 0.08 | | | | 0.15 | | | | 0.13 | | | | 0.10 | |
| | | | | | | | | | | | | | | | | | | | | | | | | | | | | |
Net realized and unrealized gain (loss) | | | (0.06 | ) | | | (0.33 | ) | | | 1.39 | | | | 3.12 | | | | (4.79 | ) | | | (0.65 | ) | | | 0.04 | |
| | | | | | | | | | | | | | | | | | | | | | | | | | | | | |
Total from investment operations | | | — | | | | (0.24 | ) | | | 1.47 | | | | 3.20 | | | | (4.64 | ) | | | (0.52 | ) | | | 0.14 | |
| | | | | | | | | | | | | | | | | | | | | | | | | | | | | |
Less distributions to shareholders: | | | | | | | | | | | | | | | | | | | | | | | | | | | | |
| | | | | | | |
Net investment income | | | (0.07 | ) | | | (0.06 | ) | | | (0.08 | ) | | | (0.11 | ) | | | (0.15 | ) | | | (0.16 | ) | | | (0.07 | ) |
| | | | | | | | | | | | | | | | | | | | | | | | | | | | | |
Net realized gains | | | — | | | | — | | | | — | | | | — | | | | (0.65 | ) | | | (0.77 | ) | | | — | |
| | | | | | | | | | | | | | | | | | | | | | | | | | | | | |
Total distributions to shareholders | | | (0.07 | ) | | | (0.06 | ) | | | (0.08 | ) | | | (0.11 | ) | | | (0.80 | ) | | | (0.93 | ) | | | (0.07 | ) |
| | | | | | | | | | | | | | | | | | | | | | | | | | | | | |
Net asset value, end of period | | | $10.65 | | | | $10.72 | | | | $11.02 | | | | $9.63 | | | | $6.54 | | | | $11.98 | | | | $13.43 | |
| | | | | | | | | | | | | | | | | | | | | | | | | | | | | |
Total return | | | (0.03 | %) | | | (2.08 | %) | | | 15.35 | % | | | 49.13 | % | | | (39.60 | %) | | | (4.45 | %) | | | 1.04 | % |
| | | | | | | | | | | | | | | | | | | | | | | | | | | | | |
Ratios to average net assets(c) | | | | | | | | | | | | | | | | | | | | | | | | | | | | |
| | | | | | | |
Expenses prior to fees waived or expenses reimbursed | | | 1.49 | %(d) | | | 1.47 | %(d) | | | 1.39 | % | | | 1.45 | % | | | 1.50 | % | | | 1.46 | % | | | 1.38 | %(d) |
| | | | | | | | | | | | | | | | | | | | | | | | | | | | | |
Net expenses after fees waived or expenses reimbursed(e) | | | 1.39 | %(d) | | | 1.38 | %(d) | | | 1.39 | % | | | 1.45 | % | | | 1.25 | % | | | 1.21 | % | | | 1.38 | %(d) |
| | | | | | | | | | | | | | | | | | | | | | | | | | | | | |
Net investment income | | | 1.10 | %(d) | | | 0.95 | %(d) | | | 0.78 | % | | | 0.88 | % | | | 1.55 | % | | | 0.94 | % | | | 0.81 | %(d) |
| | | | | | | | | | | | | | | | | | | | | | | | | | | | | |
Supplemental data | | | | | | | | | | | | | | | | | | | | | | | | | | | | |
| | | | | | | |
Net assets, end of period (in thousands) | | | $30 | | | | $29 | | | | $34 | | | | $30 | | | | $2 | | | | $4 | | | | $5 | |
| | | | | | | | | | | | | | | | | | | | | | | | | | | | | |
Portfolio turnover | | | 22 | % | | | 21 | % | | | 37 | % | | | 30 | % | | | 21 | % | | | 25 | % | | | 37 | % |
| | | | | | | | | | | | | | | | | | | | | | | | | | | | | |
Notes to Financial Highlights
| (a) | For the period from April 1, 2011 to February 29, 2012. During the period, the Fund’s fiscal year end was changed from March 31 to February 29. |
| (b) | For the period from December 11, 2006 (commencement of operations) to March 31, 2007. |
| (c) | In addition to the fees and expenses which the Fund bears directly, the Fund indirectly bears a pro rata share of the fees and expenses of the acquired funds in which it invests. Such indirect expenses are not included in the reported expense ratios. |
| (e) | The Investment Manager and certain of its affiliates agreed to waive/reimburse certain fees and expenses, if applicable. |
The accompanying Notes to Financial Statements are an integral part of this statement.
| | |
| 20 | | Semiannual Report 2012 |
| | |
| |
| Columbia Equity Value Fund | | |
Financial Highlights (continued)
| | | | | | | | | | | | | | | | | | | | | | | | | | | | |
| |
| Six Months Ended
August 31,
2012 (Unaudited) |
| |
| Year Ended
February 29, |
| | | Year Ended March 31, | |
Class R3 | | | | 2012(a) | | | | 2011 | | | | 2010 | | | | 2009 | | | | 2008 | | | | 2007(b) | |
Per share data | | | | | | | | | | | | | | | | | | | | | | | | | | | | |
Net asset value, beginning of period | | | $10.74 | | | | $11.07 | | | | $9.64 | | | | $6.55 | | | | $11.98 | | | | $13.43 | | | | $13.36 | |
| | | | | | | | | | | | | | | | | | | | | | | | | | | | | |
Income from investment operations: | | | | | | | | | | | | | | | | | | | | | | | | | | | | |
| | | | | | | |
Net investment income | | | 0.06 | | | | 0.13 | | | | 0.10 | | | | 0.11 | | | | 0.15 | | | | 0.12 | | | | 0.11 | |
| | | | | | | | | | | | | | | | | | | | | | | | | | | | | |
Net realized and unrealized gain (loss) | | | (0.05 | ) | | | (0.34 | ) | | | 1.40 | | | | 3.10 | | | | (4.78 | ) | | | (0.61 | ) | | | 0.04 | |
| | | | | | | | | | | | | | | | | | | | | | | | | | | | | |
Total from investment operations | | | 0.01 | | | | (0.21 | ) | | | 1.50 | | | | 3.21 | | | | (4.63 | ) | | | (0.49 | ) | | | 0.15 | |
| | | | | | | | | | | | | | | | | | | | | | | | | | | | | |
Less distributions to shareholders: | | | | | | | | | | | | | | | | | | | | | | | | | | | | |
| | | | | | | |
Net investment income | | | (0.07 | ) | | | (0.12 | ) | | | (0.07 | ) | | | (0.12 | ) | | | (0.15 | ) | | | (0.19 | ) | | | (0.08 | ) |
| | | | | | | | | | | | | | | | | | | | | | | | | | | | | |
Net realized gains | | | — | | | | — | | | | — | | | | — | | | | (0.65 | ) | | | (0.77 | ) | | | — | |
| | | | | | | | | | | | | | | | | | | | | | | | | | | | | |
Total distributions to shareholders | | | (0.07 | ) | | | (0.12 | ) | | | (0.07 | ) | | | (0.12 | ) | | | (0.80 | ) | | | (0.96 | ) | | | (0.08 | ) |
| | | | | | | | | | | | | | | | | | | | | | | | | | | | | |
Net asset value, end of period | | | $10.68 | | | | $10.74 | | | | $11.07 | | | | $9.64 | | | | $6.55 | | | | $11.98 | | | | $13.43 | |
| | | | | | | | | | | | | | | | | | | | | | | | | | | | | |
Total return | | | 0.13 | % | | | (1.77 | %) | | | 15.67 | % | | | 49.35 | % | | | (39.51 | %) | | | (4.22 | %) | | | 1.11 | % |
| | | | | | | | | | | | | | | | | | | | | | | | | | | | | |
Ratios to average net assets(c) | | | | | | | | | | | | | | | | | | | | | | | | | | | | |
| | | | | | | |
Expenses prior to fees waived or expenses reimbursed | | | 1.31 | %(d) | | | 1.29 | %(d) | | | 1.18 | % | | | 1.17 | % | | | 1.20 | % | | | 1.37 | % | | | 1.12 | %(d) |
| | | | | | | | | | | | | | | | | | | | | | | | | | | | | |
Net expenses after fees waived or expenses reimbursed(e) | | | 1.27 | %(d) | | | 0.92 | %(d) | | | 1.18 | % | | | 1.17 | % | | | 1.19 | % | | | 1.12 | %(f) | | | 1.12 | %(d) |
| | | | | | | | | | | | | | | | | | | | | | | | | | | | | |
Net investment income | | | 1.22 | %(d) | | | 1.40 | %(d) | | | 1.07 | % | | | 1.32 | % | | | 1.71 | % | | | 1.06 | % | | | 1.08 | %(d) |
| | | | | | | | | | | | | | | | | | | | | | | | | | | | | |
Supplemental data | | | | | | | | | | | | | | | | | | | | | | | | | | | | |
| | | | | | | |
Net assets, end of period (in thousands) | | | $8 | | | | $8 | | | | $8 | | | | $183 | | | | $107 | | | | $138 | | | | $5 | |
| | | | | | | | | | | | | | | | | | | | | | | | | | | | | |
Portfolio turnover | | | 22 | % | | | 21 | % | | | 37 | % | | | 30 | % | | | 21 | % | | | 25 | % | | | 37 | % |
| | | | | | | | | | | | | | | | | | | | | | | | | | | | | |
Notes to Financial Highlights
| (a) | For the period from April 1, 2011 to February 29, 2012. During the period, the Fund’s fiscal year end was changed from March 31 to February 29. |
| (b) | For the period from December 11, 2006 (commencement of operations) to March 31, 2007. |
| (c) | In addition to the fees and expenses which the Fund bears directly, the Fund indirectly bears a pro rata share of the fees and expenses of the acquired funds in which it invests. Such indirect expenses are not included in the reported expense ratios. |
| (e) | The Investment Manager and certain of its affiliates agreed to waive/reimburse certain fees and expenses, if applicable. |
| (f) | For the year ended March 31, 2008, the ratio of net expenses after reduction for earnings and bank fee credits was 1.10% for Class R3. |
The accompanying Notes to Financial Statements are an integral part of this statement.
| | | | |
| Semiannual Report 2012 | | | 21 | |
| | |
| |
| | Columbia Equity Value Fund |
Financial Highlights (continued)
| | | | | | | | | | | | | | | | | | | | | | | | | | | | |
| |
| Six Months Ended
August 31,
2012 (Unaudited) |
| |
| Year Ended
February 29, |
| | | Year Ended March 31, | |
Class R4 | | | | 2012(a) | | | | 2011 | | | | 2010 | | | | 2009 | | | | 2008 | | | | 2007 | |
Per share data | | | | | | | | | | | | | | | | | | | | | | | | | | | | |
Net asset value, beginning of period | | | $10.75 | | | | $11.05 | | | | $9.65 | | | | $6.56 | | | | $11.98 | | | | $13.44 | | | | $12.17 | |
| | | | | | | | | | | | | | | | | | | | | | | | | | | | | |
Income from investment operations: | | | | | | | | | | | | | | | | | | | | | | | | | | | | |
| | | | | | | |
Net investment income | | | 0.08 | | | | 0.11 | | | | 0.12 | | | | 0.13 | | | | 0.19 | | | | 0.17 | | | | 0.16 | |
| | | | | | | | | | | | | | | | | | | | | | | | | | | | | |
Net realized and unrealized gain (loss) | | | (0.06 | ) | | | (0.32 | ) | | | 1.40 | | | | 3.10 | | | | (4.79 | ) | | | (0.66 | ) | | | 1.27 | |
| | | | | | | | | | | | | | | | | | | | | | | | | | | | | |
Total from investment operations | | | 0.02 | | | | (0.21 | ) | | | 1.52 | | | | 3.23 | | | | (4.60 | ) | | | (0.49 | ) | | | 1.43 | |
| | | | | | | | | | | | | | | | | | | | | | | | | | | | | |
Less distributions to shareholders: | | | | | | | | | | | | | | | | | | | | | | | | | | | | |
| | | | | | | |
Net investment income | | | (0.09 | ) | | | (0.09 | ) | | | (0.12 | ) | | | (0.14 | ) | | | (0.17 | ) | | | (0.20 | ) | | | (0.16 | ) |
| | | | | | | | | | | | | | | | | | | | | | | | | | | | | |
Net realized gains | | | — | | | | — | | | | — | | | | — | | | | (0.65 | ) | | | (0.77 | ) | | | — | |
| | | | | | | | | | | | | | | | | | | | | | | | | | | | | |
Total distributions to shareholders | | | (0.09 | ) | | | (0.09 | ) | | | (0.12 | ) | | | (0.14 | ) | | | (0.82 | ) | | | (0.97 | ) | | | (0.16 | ) |
| | | | | | | | | | | | | | | | | | | | | | | | | | | | | |
Net asset value, end of period | | | $10.68 | | | | $10.75 | | | | $11.05 | | | | $9.65 | | | | $6.56 | | | | $11.98 | | | | $13.44 | |
| | | | | | | | | | | | | | | | | | | | | | | | | | | | | |
Total return | | | 0.16 | % | | | (1.81 | %) | | | 15.94 | % | | | 49.64 | % | | | (39.30 | %) | | | (4.24 | %) | | | 11.83 | % |
| | | | | | | | | | | | | | | | | | | | | | | | | | | | | |
Ratios to average net assets(b) | | | | | | | | | | | | | | | | | | | | | | | | | | | | |
| | | | | | | |
Expenses prior to fees waived or expenses reimbursed | | | 1.07 | %(c) | | | 1.03 | %(c) | | | 0.92 | % | | | 0.92 | % | | | 0.97 | % | | | 0.97 | % | | | 0.94 | % |
| | | | | | | | | | | | | | | | | | | | | | | | | | | | | |
Net expenses after fees waived or expenses reimbursed(d) | | | 1.03 | %(c) | | | 0.97 | %(c) | | | 0.92 | % | | | 0.92 | % | | | 0.93 | % | | | 0.93 | % | | | 0.93 | % |
| | | | | | | | | | | | | | | | | | | | | | | | | | | | | |
Net investment income | | | 1.46 | %(c) | | | 1.14 | %(c) | | | 1.26 | % | | | 1.53 | % | | | 1.83 | % | | | 1.22 | % | | | 1.28 | % |
| | | | | | | | | | | | | | | | | | | | | | | | | | | | | |
Supplemental data | | | | | | | | | | | | | | | | | | | | | | | | | | | | |
| | | | | | | |
Net assets, end of period (in thousands) | | | $2,833 | | | | $2,762 | | | | $13,828 | | | | $10,093 | | | | $4,173 | | | | $12,092 | | | | $11,834 | |
| | | | | | | | | | | | | | | | | | | | | | | | | | | | | |
Portfolio turnover | | | 22 | % | | | 21 | % | | | 37 | % | | | 30 | % | | | 21 | % | | | 25 | % | | | 37 | % |
| | | | | | | | | | | | | | | | | | | | | | | | | | | | | |
Notes to Financial Highlights
| (a) | For the period from April 1, 2011 to February 29, 2012. During the period, the Fund’s fiscal year end was changed from March 31 to February 29. |
| (b) | In addition to the fees and expenses which the Fund bears directly, the Fund indirectly bears a pro rata share of the fees and expenses of the acquired funds in which it invests. Such indirect expenses are not included in the reported expense ratios. |
| (d) | The Investment Manager and certain of its affiliates agreed to waive/reimburse certain fees and expenses, if applicable. |
The accompanying Notes to Financial Statements are an integral part of this statement.
| | |
| 22 | | Semiannual Report 2012 |
| | |
| |
| Columbia Equity Value Fund | | |
Financial Highlights (continued)
| | | | | | | | | | | | | | | | | | | | | | | | | | | | |
| |
| Six Months Ended
August 31,
2012 (Unaudited) |
| |
| Year Ended
February 29,
|
| | | Year Ended March 31, | |
Class R5 | | | | 2012(a) | | | | 2011 | | | | 2010 | | | | 2009 | | | | 2008 | | | | 2007(b) | |
Per share data | | | | | | | | | | | | | | | | | | | | | | | | | | | | |
Net asset value, beginning of period | | | $10.73 | | | | $11.03 | | | | $9.63 | | | | $6.54 | | | | $11.98 | | | | $13.43 | | | | $13.36 | |
| | | | | | | | | | | | | | | | | | | | | | | | | | | | | |
Income from investment operations: | | | | | | | | | | | | | | | | | | | | | | | | | | | | |
| | | | | | | |
Net investment income | | | 0.09 | | | | 0.15 | | | | 0.14 | | | | 0.15 | | | | 0.20 | | | | 0.20 | | | | 0.13 | |
| | | | | | | | | | | | | | | | | | | | | | | | | | | | | |
Net realized and unrealized gain (loss) | | | (0.06 | ) | | | (0.33 | ) | | | 1.41 | | | | 3.10 | | | | (4.80 | ) | | | (0.65 | ) | | | 0.04 | |
| | | | | | | | | | | | | | | | | | | | | | | | | | | | | |
Total from investment operations | | | 0.03 | | | | (0.18 | ) | | | 1.55 | | | | 3.25 | | | | (4.60 | ) | | | (0.45 | ) | | | 0.17 | |
| | | | | | | | | | | | | | | | | | | | | | | | | | | | | |
Less distributions to shareholders: | | | | | | | | | | | | | | | | | | | | | | | | | | | | |
| | | | | | | |
Net investment income | | | (0.10 | ) | | | (0.12 | ) | | | (0.15 | ) | | | (0.16 | ) | | | (0.19 | ) | | | (0.23 | ) | | | (0.10 | ) |
| | | | | | | | | | | | | | | | | | | | | | | | | | | | | |
Net realized gains | | | — | | | | — | | | | — | | | | — | | | | (0.65 | ) | | | (0.77 | ) | | | — | |
| | | | | | | | | | | | | | | | | | | | | | | | | | | | | |
Total distributions to shareholders | | | (0.10 | ) | | | (0.12 | ) | | | (0.15 | ) | | | (0.16 | ) | | | (0.84 | ) | | | (1.00 | ) | | | (0.10 | ) |
| | | | | | | | | | | | | | | | | | | | | | | | | | | | | |
Net asset value, end of period | | | $10.66 | | | | $10.73 | | | | $11.03 | | | | $9.63 | | | | $6.54 | | | | $11.98 | | | | $13.43 | |
| | | | | | | | | | | | | | | | | | | | | | | | | | | | | |
Total return | | | 0.29 | % | | | (1.53 | %) | | | 16.26 | % | | | 50.15 | % | | | (39.29 | %) | | | (3.98 | %) | | | 1.25 | % |
| | | | | | | | | | | | | | | | | | | | | | | | | | | | | |
Ratios to average net assets(c) | | | | | | | | | | | | | | | | | | | | | | | | | | | | |
| | | | | | | |
Expenses prior to fees waived or expenses reimbursed | | | 0.82 | %(d) | | | 0.79 | %(d) | | | 0.67 | % | | | 0.67 | % | | | 0.75 | % | | | 0.71 | % | | | 0.70 | %(d) |
| | | | | | | | | | | | | | | | | | | | | | | | | | | | | |
Net expenses after fees waived or expenses reimbursed(e) | | | 0.78 | %(d) | | | 0.73 | %(d) | | | 0.67 | % | | | 0.67 | % | | | 0.75 | % | | | 0.71 | % | | | 0.70 | %(d) |
| | | | | | | | | | | | | | | | | | | | | | | | | | | | | |
Net investment income | | | 1.71 | %(d) | | | 1.59 | %(d) | | | 1.49 | % | | | 1.72 | % | | | 2.05 | % | | | 1.44 | % | | | 1.55 | %(d) |
| | | | | | | | | | | | | | | | | | | | | | | | | | | | | |
Supplemental data | | | | | | | | | | | | | | | | | | | | | | | | | | | | |
| | | | | | | |
Net assets, end of period (in thousands) | | | $1,066 | | | | $1,043 | | | | $1,066 | | | | $7 | | | | $2 | | | | $4 | | | | $5 | |
| | | | | | | | | | | | | | | | | | | | | | | | | | | | | |
Portfolio turnover | | | 22 | % | | | 21 | % | | | 37 | % | | | 30 | % | | | 21 | % | | | 25 | % | | | 37 | % |
| | | | | | | | | | | | | | | | | | | | | | | | | | | | | |
Notes to Financial Highlights
| (a) | For the period from April 1, 2011 to February 29, 2012. During the period, the Fund’s fiscal year end was changed from March 31 to February 29. |
| (b) | For the period from December 11, 2006 (commencement of operations) to March 31, 2007. |
| (c) | In addition to the fees and expenses which the Fund bears directly, the Fund indirectly bears a pro rata share of the fees and expenses of the acquired funds in which it invests. Such indirect expenses are not included in the reported expense ratios. |
| (e) | The Investment Manager and certain of its affiliates agreed to waive/reimburse certain fees and expenses, if applicable. |
The accompanying Notes to Financial Statements are an integral part of this statement.
| | | | |
| Semiannual Report 2012 | | | 23 | |
| | |
| |
| | Columbia Equity Value Fund |
Financial Highlights (continued)
| | | | | | | | | | | | | | | | | | | | | | | | | | | | |
| |
| Six Months Ended
August 31,
2012 (Unaudited) |
| |
| Year Ended
February 29, |
| | | Year Ended March 31, | |
Class W | | | | 2012(a) | | | | 2011 | | | | 2010 | | | | 2009 | | | | 2008 | | | | 2007(b) | |
Per share data | | | | | | | | | | | | | | | | | | | | | | | | | | | | |
Net asset value, beginning of period | | | $10.76 | | | | $11.03 | | | | $9.63 | | | | $6.54 | | | | $11.98 | | | | $13.43 | | | | $13.17 | |
| | | | | | | | | | | | | | | | | | | | | | | | | | | | | |
Income from investment operations: | | | | | | | | | | | | | | | | | | | | | | | | | | | | |
| | | | | | | |
Net investment income | | | 0.07 | | | | 0.09 | | | | 0.11 | | | | 0.12 | | | | 0.16 | | | | 0.14 | | | | 0.12 | |
| | | | | | | | | | | | | | | | | | | | | | | | | | | | | |
Net realized and unrealized gain (loss) | | | (0.07 | ) | | | (0.33 | ) | | | 1.40 | | | | 3.10 | | | | (4.80 | ) | | | (0.65 | ) | | | 0.22 | |
| | | | | | | | | | | | | | | | | | | | | | | | | | | | | |
Total from investment operations | | | — | | | | (0.24 | ) | | | 1.51 | | | | 3.22 | | | | (4.64 | ) | | | (0.51 | ) | | | 0.34 | |
| | | | | | | | | | | | | | | | | | | | | | | | | | | | | |
Less distributions to shareholders: | | | | | | | | | | | | | | | | | | | | | | | | | | | | |
| | | | | | | |
Net investment income | | | (0.05 | ) | | | (0.03 | ) | | | (0.11 | ) | | | (0.13 | ) | | | (0.15 | ) | | | (0.17 | ) | | | (0.08 | ) |
| | | | | | | | | | | | | | | | | | | | | | | | | | | | | |
Net realized gains | | | — | | | | — | | | | — | | | | — | | | | (0.65 | ) | | | (0.77 | ) | | | — | |
| | | | | | | | | | | | | | | | | | | | | | | | | | | | | |
Total distributions to shareholders | | | (0.05 | ) | | | (0.03 | ) | | | (0.11 | ) | | | (0.13 | ) | | | (0.80 | ) | | | (0.94 | ) | | | (0.08 | ) |
| | | | | | | | | | | | | | | | | | | | | | | | | | | | | |
Net asset value, end of period | | | $10.71 | | | | $10.76 | | | | $11.03 | | | | $9.63 | | | | $6.54 | | | | $11.98 | | | | $13.43 | |
| | | | | | | | | | | | | | | | | | | | | | | | | | | | | |
Total return | | | 0.07 | % | | | (2.19 | %) | | | 15.82 | % | | | 49.56 | % | | | (39.54 | %) | | | (4.36 | %) | | | 2.59 | % |
| | | | | | | | | | | | | | | | | | | | | | | | | | | | | |
Ratios to average net assets(c) | | | | | | | | | | | | | | | | | | | | | | | | | | | | |
| | | | | | | |
Expenses prior to fees waived or expenses reimbursed | | | 1.24 | %(d) | | | 1.13 | %(d) | | | 1.14 | % | | | 1.03 | % | | | 1.15 | % | | | 1.12 | % | | | 1.03 | %(d) |
| | | | | | | | | | | | | | | | | | | | | | | | | | | | | |
Net expenses after fees waived or expenses reimbursed(e) | | | 1.14 | %(d) | | | 1.10 | %(d)(f) | | | 1.14 | % | | | 1.03 | % | | | 1.15 | % | | | 1.12 | % | | | 1.03 | %(d) |
| | | | | | | | | | | | | | | | | | | | | | | | | | | | | |
Net investment income | | | 1.30 | %(d) | | | 0.89 | %(d)(f) | | | 1.04 | % | | | 1.45 | % | | | 1.66 | % | | | 1.03 | % | | | 1.14 | %(d) |
| | | | | | | | | | | | | | | | | | | | | | | | | | | | | |
Supplemental data | | | | | | | | | | | | | | | | | | | | | | | | | | | | |
| | | | | | | |
Net assets, end of period (in thousands) | | | $14 | | | | $25 | | | | $20,400 | | | | $4 | | | | $2 | | | | $5 | | | | $5 | |
| | | | | | | | | | | | | | | | | | | | | | | | | | | | | |
Portfolio turnover | | | 22 | % | | | 21 | % | | | 37 | % | | | 30 | % | | | 21 | % | | | 25 | % | | | 37 | % |
| | | | | | | | | | | | | | | | | | | | | | | | | | | | | |
Notes to Financial Highlights
| (a) | For the period from April 1, 2011 to February 29, 2012. During the period, the Fund’s fiscal year end was changed from March 31 to February 29. |
| (b) | For the period from December 1, 2006 (commencement of operations) to March 31, 2007. |
| (c) | In addition to the fees and expenses which the Fund bears directly, the Fund indirectly bears a pro rata share of the fees and expenses of the acquired funds in which it invests. Such indirect expenses are not included in the reported expense ratios. |
| (e) | The Investment Manager and certain of its affiliates agreed to waive/reimburse certain fees and expenses, if applicable. |
| (f) | The benefits derived from expense reductions had an impact of less than 0.01%. |
The accompanying Notes to Financial Statements are an integral part of this statement.
| | |
| 24 | | Semiannual Report 2012 |
| | |
| |
| Columbia Equity Value Fund | | |
Financial Highlights (continued)
| | | | | | | | | | | | |
| |
| Six Months Ended
August 31,
2012 (Unaudited) |
| |
| Year Ended
February 29, |
| |
| Year Ended
March 31, |
|
Class Z | | | | 2012(a) | | | | 2011(b) | |
Per share data | | | | | | | | | | | | |
Net asset value, beginning of period | | | $10.73 | | | | $11.03 | | | | $9.32 | |
| | | | | | | | | | | | | |
Income from investment operations: | | | | | | | | | | | | |
| | | |
Net investment income | | | 0.08 | | | | 0.15 | | | | 0.06 | |
| | | | | | | | | | | | | |
Net realized and unrealized gain (loss) | | | (0.06 | ) | | | (0.34 | ) | | | 1.72 | |
| | | | | | | | | | | | | |
Total from investment operations | | | 0.02 | | | | (0.19 | ) | | | 1.78 | |
| | | | | | | | | | | | | |
Less distributions to shareholders: | | | | | | | | | | | | |
| | | |
Net investment income | | | (0.09 | ) | | | (0.11 | ) | | | (0.07 | ) |
| | | | | | | | | | | | | |
Total distributions to shareholders | | | (0.09 | ) | | | (0.11 | ) | | | (0.07 | ) |
| | | | | | | | | | | | | |
Net asset value, end of period | | | $10.66 | | | | $10.73 | | | | $11.03 | |
| | | | | | | | | | | | | |
Total return | | | 0.24 | % | | | (1.62 | %) | | | 19.16 | % |
| | | | | | | | | | | | | |
Ratios to average net assets(c) | | | | | | | | | | | | |
| | | |
Expenses prior to fees waived or expenses reimbursed | | | 1.00 | %(d) | | | 0.96 | %(d) | | | 0.87 | %(d) |
| | | | | | | | | | | | | |
Net expenses after fees waived or expenses reimbursed(e) | | | 0.90 | %(d)(f) | | | 0.86 | %(d)(f) | | | 0.87 | %(d) |
| | | | | | | | | | | | | |
Net investment income | | | 1.59 | %(d)(f) | | | 1.67 | %(d)(f) | | | 1.35 | %(d) |
| | | | | | | | | | | | | |
Supplemental data | | | | | | | | | | | | |
| | | |
Net assets, end of period (in thousands) | | | $602 | | | | $552 | | | | $3 | |
| | | | | | | | | | | | | |
Portfolio turnover | | | 22 | % | | | 21 | % | | | 37 | % |
| | | | | | | | | | | | | |
Notes to Financial Highlights
| (a) | For the period from April 1, 2011 to February 29, 2012. During the period, the Fund’s fiscal year end was changed from March 31 to February 29. |
| (b) | For the period from September 27, 2010 (commencement of operations) to March 31, 2011. |
| (c) | In addition to the fees and expenses which the Fund bears directly, the Fund indirectly bears a pro rata share of the fees and expenses of the acquired funds in which it invests. Such indirect expenses are not included in the reported expense ratios. |
| (e) | The Investment Manager and certain of its affiliates agreed to waive/reimburse certain fees and expenses, if applicable. |
| (f) | The benefits derived from expense reductions had an impact of less than 0.01%. |
The accompanying Notes to Financial Statements are an integral part of this statement.
| | | | |
| Semiannual Report 2012 | | | 25 | |
| | |
| |
| | Columbia Equity Value Fund |
Notes to Financial Statements
August 31, 2012 (Unaudited)
Note 1. Organization
Columbia Equity Value Fund (the Fund), a series of Columbia Funds Series Trust II (the Trust), is a diversified fund. The Trust is registered under the Investment Company Act of 1940, as amended (the 1940 Act), as an open-end management investment company organized as a Massachusetts business trust.
Fund Shares
The Trust may issue an unlimited number of shares (without par value). The Fund offers Class A, Class B, Class C, Class I, Class R, Class R3, Class R4, Class R5, Class W and Class Z shares. All share classes have identical voting, dividend and liquidation rights. Each share class has its own expense structure and sales charges, as applicable.
Class A shares are subject to a maximum front-end sales charge of 5.75% based on the initial investment amount. Class A shares purchased without an initial sales charge in accounts aggregating $1 million to $50 million at the time of purchase are subject to a contingent deferred sales charge (CDSC) if the shares are sold within 18 months of purchase, charged as follows: 1.00% CDSC if redeemed within 12 months of purchase, and 0.50% CDSC if redeemed more than 12, but less than 18, months after purchase.
Class B shares may be subject to a maximum CDSC of 5.00% based upon the holding period after purchase. Class B shares will generally convert to Class A shares eight years after purchase. The Fund no longer accepts investments by new or existing investors in the Fund's Class B shares, except in connection with the reinvestment of any dividend and/or capital gain distributions in Class B shares of the Fund and exchanges by existing Class B shareholders of certain other funds within the Columbia Family of Funds.
Class C shares are subject to a 1.00% CDSC on shares redeemed within one year of purchase.
Class I shares are not subject to sales charges and are only available to the Columbia Family of Funds.
Class R shares are not subject to sales charges and are only available to qualifying institutional investors.
Class R3 shares are not subject to sales charges; however, this share class is closed to new investors.
Class R4 shares are not subject to sales charges; however, this share class is closed to new investors.
Class R5 shares are not subject to sales charges; however, this share class is closed to new investors.
Class W shares are not subject to sales charges and are only available to investors purchasing through authorized investment programs managed by investment professionals, including discretionary managed account programs.
Class Z shares are not subject to sales charges, and are only available to certain investors.
Note 2. Summary of Significant Accounting Policies
Use of Estimates
The preparation of financial statements in accordance with U.S. generally accepted accounting principles (GAAP) requires management to make certain estimates and assumptions that affect the reported amounts of assets and liabilities, the disclosure of contingent assets and liabilities at the date of the financial statements and the reported amounts of revenue and expenses during the reporting period. Actual results could differ from those estimates.
The following is a summary of significant accounting policies consistently followed by the Fund in the preparation of its financial statements.
Security Valuation
All equity securities are valued at the close of business of the New York Stock Exchange (NYSE). Equity securities are valued at the last quoted sales price on the principal exchange or market on which they trade, except for securities traded on the NASDAQ Stock Market, which are valued at the NASDAQ official close price. Unlisted securities or listed securities for which there were no sales during the day are valued at the mean of the latest quoted bid and ask prices on such exchanges or markets.
Debt securities generally are valued by pricing services approved by the Board of Trustees (the Board) based upon market transactions for normal, institutional-size trading units of similar securities. The services may use various pricing techniques which take into account appropriate factors such as yield, quality, coupon rate, maturity, type of issue, trading characteristics and other data, as well as broker quotes. Debt securities for which quotations are readily available may also be valued based upon an over-the-counter or exchange bid quotation.
Foreign securities are valued based on quotations from the principal market in which such securities are normally traded. If any foreign share prices are not readily available as a result of limited share activity the securities are valued at the mean of the latest quoted bid and ask prices on such exchanges or
| | |
| 26 | | Semiannual Report 2012 |
| | |
| |
| Columbia Equity Value Fund | | |
Notes to Financial Statements (continued)
August 31, 2012 (Unaudited)
markets. Foreign currency exchange rates are generally determined at 4:00 p.m. Eastern (U.S.) time. However, many securities markets and exchanges outside the U.S. close prior to the close of the NYSE; therefore, the closing prices for securities in such markets or on such exchanges may not fully reflect events that occur after such close but before the close of the NYSE. In those situations, foreign securities will be fair valued pursuant to the policy adopted by the Board, including utilizing a third party pricing service to determine these fair values. The third party pricing service takes into account multiple factors, including, but not limited to, movements in the U.S. securities markets, certain depositary receipts, futures contracts and foreign exchange rates that have occurred subsequent to the close of the foreign exchange or market, to determine a good faith estimate that reasonably reflects the current market conditions as of the close of the NYSE. The fair value of a security is likely to be different from the quoted or published price, if available.
Investments in other open-end investment companies, including money market funds, are valued at net asset value.
Short-term securities purchased within 60 days to maturity are valued at amortized cost, which approximates market value. The value of short-term securities originally purchased with maturities greater than 60 days is determined based on an amortized value to par upon reaching 60 days to maturity. Short-term securities maturing in more than 60 days from the valuation date are valued at the market price or approximate market value based on current interest rates.
Investments for which market quotations are not readily available, or that have quotations which management believes are not reliable, are valued at fair value as determined in good faith under consistently applied procedures established by and under the general supervision of the Board. If a security or class of securities (such as foreign securities) is valued at fair value, such value is likely to be different from the last quoted market price for the security.
The determination of fair value often requires significant judgment. To determine fair value, management may use assumptions including but not limited to future cash flows and estimated risk premiums. Multiple inputs from various sources may be used to determine fair value.
Foreign Currency Transactions and Translations
The values of all assets and liabilities denominated in foreign currencies are translated into U.S. dollars at that day’s exchange rates. Net realized and unrealized gains (losses) on foreign currency transactions and translations include gains (losses) arising from the fluctuation in exchange rates between
trade and settlement dates on securities transactions, gains (losses) arising from the disposition of foreign currency and currency gains (losses) between the accrual and payment dates on dividends, interest income and foreign withholding taxes.
For financial statement purposes, the Fund does not distinguish that portion of gains (losses) on investments which is due to changes in foreign exchange rates from that which is due to changes in market prices of the investments. Such fluctuations are included with the net realized and unrealized gains (losses) on investments in the Statement of Operations.
Repurchase Agreements
The Fund may engage in repurchase agreement transactions with institutions that management has determined are creditworthy. The Fund, through the custodian, receives delivery of the underlying securities collateralizing a repurchase agreement. Management is responsible for determining that the collateral is at least equal, at all times, to the value of the repurchase obligation including interest. A repurchase agreement transaction involves certain risks in the event of default or insolvency of the counterparty. These risks include possible delays in or restrictions on the Fund’s ability to dispose of the underlying securities and a possible decline in the value of the underlying securities during the period while the Fund seeks to assert its rights.
Equity-Linked Notes
The Fund may invest in equity-linked notes (ELNs). An ELN is a debt instrument whose value is based on the value of a single equity security, basket of equity securities or an index of equity securities (each, an Underlying Equity). An ELN typically provides interest income, thereby offering a yield advantage over investing directly in an Underlying Equity. However, the holder of an ELN may have limited or no benefit from any appreciation in the Underlying Equity, but is exposed to various risks, including, without limitation, volatility, issuer and market risk. The Fund may purchase ELNs that trade on a securities exchange or those that trade on the over-the-counter markets, including securities offered and sold under Rule 144A of the Securities Act of 1933, as amended. The Fund may also purchase an ELN in a privately negotiated transaction with the issuer of the ELN (or its broker-dealer affiliate).
Security Transactions
Security transactions are accounted for on the trade date. Cost is determined and gains (losses) are based upon the specific identification method for both financial statement and federal income tax purposes.
| | | | |
| Semiannual Report 2012 | | | 27 | |
| | |
| |
| | Columbia Equity Value Fund |
Notes to Financial Statements (continued)
August 31, 2012 (Unaudited)
Income Recognition
Corporate actions and dividend income are recorded net of any non-reclaimable tax withholdings, on the ex-dividend date or upon receipt of ex-dividend notification in the case of certain foreign securities.
Interest income is recorded on an accrual basis.
Awards from class action litigation are recorded as a reduction of cost basis if the Fund still owns the applicable securities on the payment date. If the Fund no longer owns the applicable securities, the proceeds are recorded as realized gains.
Expenses
General expenses of the Trust are allocated to the Fund and other funds of the Trust based upon relative net assets or other expense allocation methodologies determined by the nature of the expense. Expenses directly attributable to the Fund are charged to the Fund. Expenses directly attributable to a specific class of shares are charged to that share class.
Determination of Class Net Asset Value
All income, expenses (other than class-specific expenses, which are charged to that share class, as shown in the Statement of Operations) and realized and unrealized gains (losses) are allocated to each class of the Fund on a daily basis, based on the relative net assets of each class, for purposes of determining the net asset value of each class.
Federal Income Tax Status
The Fund intends to qualify each year as a regulated investment company under Subchapter M of the Internal Revenue Code, as amended, and will distribute substantially all of its income (including net short-term capital gains), if any, for its tax year, and as such will not be subject to federal income taxes. In addition, the Fund intends to distribute in each calendar year substantially all of its net investment income, capital gains and certain other amounts, if any, such that the Fund should not be subject to federal excise tax. Therefore, no federal income or excise tax provision is recorded.
Foreign Taxes
The Fund may be subject to foreign taxes on income, gains on investments or currency repatriation, a portion of which may be recoverable. The Fund will accrue such taxes and recoveries, as applicable, based upon its current interpretation of tax rules and regulations that exist in the markets in which it invests.
Realized gains in certain countries may be subject to foreign taxes at the Fund level, based on statutory rates. The Fund accrues for such foreign taxes on net realized and unrealized
gains at the appropriate rate for each jurisdiction, as applicable. The amount, if any, is disclosed as a liability on the Statement of Assets and Liabilities.
Distributions to Shareholders
Distributions from net investment income, if any, are declared and paid each calendar quarter. Net realized capital gains, if any, are distributed at least annually. Income distributions and capital gain distributions are determined in accordance with federal income tax regulations, which may differ from GAAP.
Guarantees and Indemnifications
Under the Trust’s organizational documents and, in some cases, by contract, its officers and trustees are indemnified against certain liabilities arising out of the performance of their duties to the Trust or its funds. In addition, certain of the Fund’s contracts with its service providers contain general indemnification clauses. The Fund’s maximum exposure under these arrangements is unknown since the amount of any future claims that may be made against the Fund cannot be determined, and the Fund has no historical basis for predicting the likelihood of any such claims.
Recent Accounting Pronouncement
Disclosures about Offsetting Assets and Liabilities
In December 2011, the Financial Accounting Standards Board (FASB) issued ASU No. 2011-11, Disclosures about Offsetting Assets and Liabilities. The objective of the FASB is to enhance current disclosure requirements on offsetting of certain assets and liabilities and to enable financial statement users to compare financial statements prepared under GAAP and International Financial Reporting Standards.
Specifically, ASU No. 2011-11 requires an entity to disclose both gross and net information for derivatives and other financial instruments that are subject to a master netting arrangement or similar agreement. The standard requires disclosure of collateral received in connection with the master netting agreements or similar agreements. The effective date of ASU No. 2011-11 is for interim and annual periods beginning on or after January 1, 2013. At this time, management is evaluating the implications of this guidance and the impact it will have on the financial statement amounts and footnote disclosures, if any.
Note 3. Fees and Compensation Paid to Affiliates
Investment Management Fees
Under an Investment Management Services Agreement, Columbia Management Investment Advisers, LLC (the Investment Manager), a wholly-owned subsidiary of
| | |
| 28 | | Semiannual Report 2012 |
| | |
| |
| Columbia Equity Value Fund | | |
Notes to Financial Statements (continued)
August 31, 2012 (Unaudited)
Ameriprise Financial, Inc. (Ameriprise Financial), determines which securities will be purchased, held or sold. The investment management fee is an annual fee that is equal to a percentage of the Fund’s average daily net assets that declines from 0.66% to 0.49% as the Fund’s net assets increase. The annualized effective investment management fee rate for the six months ended August 31, 2012 was 0.65% of the Fund’s average daily net assets.
Administration Fees
Under an Administrative Services Agreement, the Investment Manager serves as the Fund Administrator. The Fund pays the Fund Administrator an annual fee for administration and accounting services equal to a percentage of the Fund’s average daily net assets that declines from 0.06% to 0.03% as the Fund’s net assets increase. The annualized effective administration fee rate for the six months ended August 31, 2012 was 0.06% of the Fund's average daily net assets.
Other Expenses
Other expenses are for, among other things, certain expenses of the Fund or the Board, including: Fund boardroom and office expense, employee compensation, employee health and retirement benefits, and certain other expenses. Payment of these Fund and Board expenses is facilitated by a company providing limited administrative services to the Fund and the Board. For the six months ended August 31, 2012, other expenses paid to this company were $1,546.
Compensation of Board Members
Board members are compensated for their services to the Fund as disclosed in the Statement of Operations. Under a Deferred Compensation Plan (the Plan), the Board members who are not "interested persons" of the Fund, as defined under the 1940 Act, may elect to defer payment of up to 100% of their compensation. Deferred amounts are treated as though equivalent dollar amounts had been invested in shares of certain funds managed by the Investment Manager. The Fund’s liability for these amounts is adjusted for market value changes and remains in the Fund until distributed in accordance with the Plan.
Transfer Agent Fees
Under a Transfer and Dividend Disbursing Agent Agreement, Columbia Management Investment Services Corp. (the Transfer Agent), an affiliate of the Investment Manager and a wholly-owned subsidiary of Ameriprise Financial, is responsible for providing transfer agency services to the Fund. The Transfer Agent has contracted with Boston Financial Data Services (BFDS) to serve as sub-transfer agent.
The Transfer Agent receives monthly account-based service fees based on the number of open accounts and is reimbursed by the Fund for the fees and expenses the Transfer Agent pays to financial intermediaries that maintain omnibus accounts with the Fund that is a percentage of the average aggregate value of the Fund’s shares maintained in each such omnibus account (other than omnibus accounts for which American Enterprise Investment Services Inc. is the broker of record or accounts where the beneficial shareholder is a customer of Ameriprise Financial Services, Inc., which are paid a per account fee). The Transfer Agent pays the fees of BFDS for services as sub-transfer agent and is not entitled to reimbursement for such fees from the Fund (with the exception of out-of-pocket fees).
The Transfer Agent also receives compensation from fees for various shareholder services and reimbursements for certain out-of-pocket fees. Class I shares do not pay transfer agent fees. Total transfer agent fees for Class R3, Class R4 and Class R5 shares are subject to an annual limitation of not more than 0.05% of the average daily net assets attributable to each share class.
For the six months ended August 31, 2012, the Fund's annualized effective transfer agent fee rates as a percentage of average daily net assets of each class were as follows:
| | | | |
Class A | | | 0.22 | % |
Class B | | | 0.22 | |
Class C | | | 0.22 | |
Class R | | | 0.22 | |
Class R3 | | | 0.05 | |
Class R4 | | | 0.05 | |
Class R5 | | | 0.05 | |
Class W | | | 0.22 | |
Class Z | | | 0.22 | |
An annual minimum account balance fee of $20 may apply to certain accounts with a value below the Fund’s initial minimum investment requirements to reduce the impact of small accounts on transfer agent fees. These minimum account balance fees are recorded as part of expense reductions in the Statement of Operations. For the six months ended August 31, 2012, these minimum account balance fees reduced total expenses by $40.
Plan Administration Fees
Under a Plan Administration Services Agreement with the Transfer Agent, the Fund pays an annual fee at a rate of 0.25% of the Fund's average daily net assets attributable to Class R3
| | | | |
| Semiannual Report 2012 | | | 29 | |
| | |
| |
| | Columbia Equity Value Fund |
Notes to Financial Statements (continued)
August 31, 2012 (Unaudited)
and Class R4 shares for the provision of various administrative, recordkeeping, communication and educational services.
Distribution Fees
The Fund has an agreement with Columbia Management Investment Distributors, Inc. (the Distributor), an affiliate of the Investment Manager and a wholly-owned subsidiary of Ameriprise Financial, for distribution and shareholder services. Under a Plan and Agreement of Distribution pursuant to Rule 12b-1, the Fund pays a fee at an annual rate of up to 0.25% of the Fund’s average daily net assets attributable to Class A, Class R3 and Class W shares, a fee at an annual rate of up to 0.50% of the Fund’s average daily net assets attributable to Class R shares (of which up to 0.25% may be used for shareholder services) and a fee at an annual rate of up to 1.00% of the Fund’s average daily net assets attributable to Class B and Class C shares. For Class B and Class C shares, of the 1.00% fee, up to 0.75% is reimbursed for distribution expenses.
The amount of distribution expenses incurred by the Distributor and not yet reimbursed (unreimbursed expense) was approximately $1,004,000 and $54,000 for Class B and Class C shares, respectively. These amounts are based on the most recent information available as of June 30, 2012, and may be recovered from future payments under the distribution plan or CDSCs. To the extent the unreimbursed expense has been fully recovered, the distribution fee is reduced.
Sales Charges
Sales charges, including front-end charges and CDSCs, received by the Distributor for distributing Fund shares were $69,797 for Class A, $4,057 for Class B and $116 for Class C shares for the six months ended August 31, 2012.
Expenses Waived/Reimbursed by the Investment Manager and its Affiliates
Effective June 1, 2012, the Investment Manager and certain of its affiliates have contractually agreed to waive fees and/or reimburse expenses (excluding certain fees and expenses described below), through June 30, 2013, unless sooner terminated at the sole discretion of the Board, so that the Fund's net operating expenses, after giving effect to fees waived/expenses reimbursed and/or overdraft charges from the Fund's custodian, do not exceed the following annual rates as a percentage of the class' average daily net assets:
| | | | |
Class A | | | 1.18 | % |
Class B | | | 1.93 | |
Class C | | | 1.93 | |
Class I | | | 0.77 | |
Class R | | | 1.43 | |
Class R3 | | | 1.32 | |
Class R4 | | | 1.07 | |
Class R5 | | | 0.82 | |
Class W | | | 1.18 | |
Class Z | | | 0.93 | |
Prior to June 1, 2012, the Investment Manager and certain of its affiliates contractually agreed to waive fees and/or reimburse expenses (excluding certain fees and expenses described below), so that the Fund's net operating expenses, after giving effect to fees waived/expenses reimbursed and any balance credits and/or overdraft charges from the Fund's custodian, did not exceed the following annual rates as a percentage of the class' average daily net assets:
| | | | |
Class A | | | 1.11 | % |
Class B | | | 1.86 | |
Class C | | | 1.86 | |
Class I | | | 0.69 | |
Class R | | | 1.36 | |
Class R3 | | | 1.24 | |
Class R4 | | | 0.99 | |
Class R5 | | | 0.74 | |
Class W | | | 1.11 | |
Class Z | | | 0.86 | |
Under the agreement, the following fees and expenses are excluded from the waiver/reimbursement commitment, and therefore will be paid by the Fund, if applicable: taxes (including foreign transaction taxes), expenses associated with investments in affiliated and non-affiliated pooled investment vehicles (including mutual funds and exchange traded funds), transaction costs and brokerage commissions, costs related to any securities lending program, dividend expenses associated with securities sold short, inverse floater program fees and expenses, transaction charges and interest on borrowed money, interest, extraordinary expenses and any other expenses the exclusion of which is specifically approved by the Board. This agreement may be modified or amended only with approval from all parties.
Note 4. Federal Tax Information
The timing and character of income and capital gain distributions are determined in accordance with income tax
| | |
| 30 | | Semiannual Report 2012 |
| | |
| |
| Columbia Equity Value Fund | | |
Notes to Financial Statements (continued)
August 31, 2012 (Unaudited)
regulations, which may differ from GAAP because of temporary or permanent book to tax differences.
At August 31, 2012, the cost of investments for federal income tax purposes was approximately $530,382,000 and the aggregate gross approximate unrealized appreciation and depreciation based on that cost was:
| | | | |
Unrealized appreciation | | | $97,211,000 | |
Unrealized depreciation | | | (25,940,000 | ) |
Net unrealized appreciation | | | $71,271,000 | |
The following capital loss carryforward, determined as of February 29, 2012 may be available to reduce taxable income arising from future net realized gains on investments, if any, to the extent permitted by the Internal Revenue Code:
| | | | |
| Year of Expiration | | Amount ($) | |
2017 | | | 9,606,310 | |
2018 | | | 56,780,428 | |
Total | | | 66,386,738 | |
Under current tax rules, regulated investment companies can elect to treat certain late-year ordinary losses incurred and post-October capital losses (capital losses realized after October 31) as arising on the first day of the following taxable year. The Fund has elected to treat post-October capital losses of $3,893,787 at February 29, 2012 as arising on March 1, 2012.
Management of the Fund has concluded that there are no significant uncertain tax positions that would require recognition in the financial statements. However, management’s conclusion may be subject to review and adjustment at a later date based on factors including, but not limited to, new tax laws, regulations, and administrative interpretations (including relevant court decisions). Generally, the Fund’s federal tax returns for the prior three fiscal years remain subject to examination by the Internal Revenue Service.
Note 5. Portfolio Information
The cost of purchases and proceeds from sales of securities, excluding short-term obligations, aggregated to $126,856,382 and $155,733,639, respectively, for the six months ended August 31, 2012.
Note 6. Lending of Portfolio Securities
The Fund has entered into a Master Securities Lending Agreement (the Agreement) with JPMorgan Chase Bank, N.A. (JPMorgan). The Agreement authorizes JPMorgan as lending agent to lend securities to authorized borrowers in order to generate additional income on behalf of the Fund. Pursuant to
the Agreement, the securities loaned are secured by cash or securities that either are issued or guaranteed as to principal and interest by the U.S. government, its agencies, authorities or instrumentalities with value equal to at least 100% of the market value of the loaned securities. Any additional collateral required to maintain those levels due to market fluctuations of the loaned securities is requested to be delivered the following business day. Cash collateral received is invested by the lending agent on behalf of the Fund into authorized investments pursuant to the Agreement. The investments made with the cash collateral are listed in the Portfolio of Investments. The values of such investments and any uninvested cash collateral are disclosed in the Statement of Assets and Liabilities along with the related obligation to return the collateral upon the return of the securities loaned.
Risks of delay in recovery of securities or even loss of rights in the securities may occur should the borrower of the securities fail financially. Risks may also arise to the extent that the value of the securities loaned increases above the value of the collateral received. JPMorgan will indemnify the Fund from losses resulting from a borrower’s failure to return a loaned security when due. Such indemnification does not extend to losses associated with declines in the value of cash collateral investments. The Investment Manager is not responsible for any losses incurred by the Fund in connection with the securities lending program. Loans are subject to termination by the Fund or the borrower at any time, and are, therefore, not considered to be illiquid investments.
Pursuant to the Agreement, the Fund receives income for lending its securities either in the form of fees or by earning interest on invested cash collateral, net of negotiated rebates paid to borrowers and fees paid to the lending agent for services provided and any other securities lending expenses. Net income earned from securities lending for the six months ended August 31, 2012 is disclosed in the Statement of Operations. The Fund continues to earn and accrue interest and dividends on the securities loaned.
At August 31, 2012, securities valued at $18,816,378 were on loan, secured by cash collateral of $19,125,695 (which does not reflect calls for collateral made to borrowers by JPMorgan at period end) that is partially or fully invested in short-term securities or other cash equivalents.
In September 2012, the Board voted to cease securities lending by or on December 31, 2012.
Note 7. Affiliated Money Market Fund
The Fund may invest its daily cash balances in Columbia Short-Term Cash Fund, an affiliated money market fund established for the exclusive use by the Fund and other
| | | | |
| Semiannual Report 2012 | | | 31 | |
| | |
| |
| | Columbia Equity Value Fund |
Notes to Financial Statements (continued)
August 31, 2012 (Unaudited)
affiliated funds. The income earned by the Fund from such investments is included as “Dividends — affiliated issuers” in the Statement of Operations. As an investing fund, the Fund indirectly bears its proportionate share of the expenses of Columbia Short-Term Cash Fund.
Note 8. Shareholder Concentration
At August 31, 2012, one unaffiliated shareholder account owned 28.5% of the outstanding shares of the Fund. The Fund has no knowledge about whether any portion of those shares was owned beneficially by such account. Subscription and redemption activity by concentrated accounts may have a significant effect on the operations of the Fund.
Note 9. Line of Credit
The Fund has entered into a revolving credit facility with a syndicate of banks led by JPMorgan whereby the Fund may borrow for the temporary funding of shareholder redemptions or for other temporary or emergency purposes. The credit facility agreement, as amended, which is a collective agreement between the Fund and certain other funds managed by the Investment Manager, severally and not jointly, permits collective borrowings up to $500 million. Interest is charged to each participating fund based on its borrowings at a rate equal to the higher of (i) the overnight federal funds rate plus 1.00% or (ii) the one-month LIBOR rate plus 1.00%. Each borrowing under the credit facility matures no later than 60 days after the date of borrowing. The Fund also pays a commitment fee equal to its pro rata share of the amount of the credit facility at a rate of 0.08% per annum.
The Fund had no borrowings during the six months ended August 31, 2012.
Note 10. Subsequent Events
Management has evaluated the events and transactions that have occurred through the date the financial statements were issued and noted no items requiring adjustment of the financial statements or additional disclosure.
Note 11. Information Regarding Pending and Settled Legal Proceedings
In December 2005, without admitting or denying the allegations, American Express Financial Corporation (AEFC, which is now known as Ameriprise Financial, Inc. (Ameriprise Financial)) entered into settlement agreements with the Securities and Exchange Commission (SEC) and
Minnesota Department of Commerce (MDOC) related to market timing activities. As a result, AEFC was censured and ordered to cease and desist from committing or causing any violations of certain provisions of the Investment Advisers Act of 1940, the Investment Company Act of 1940, and various Minnesota laws. AEFC agreed to pay disgorgement of $10 million and civil money penalties of $7 million. AEFC also agreed to retain an independent distribution consultant to assist in developing a plan for distribution of all disgorgement and civil penalties ordered by the SEC in accordance with various undertakings detailed at www.sec.gov/litigation/admin/ia-2451.pdf. Ameriprise Financial and its affiliates have cooperated with the SEC and the MDOC in these legal proceedings, and have made regular reports to the funds’ Boards of Trustees.
Ameriprise Financial and certain of its affiliates have historically been involved in a number of legal, arbitration and regulatory proceedings, including routine litigation, class actions, and governmental actions, concerning matters arising in connection with the conduct of their business activities. Ameriprise Financial believes that the Funds are not currently the subject of, and that neither Ameriprise Financial nor any of its affiliates are the subject of, any pending legal, arbitration or regulatory proceedings that are likely to have a material adverse effect on the Funds or the ability of Ameriprise Financial or its affiliates to perform under their contracts with the Funds. Ameriprise Financial is required to make 10-Q, 10-K and, as necessary, 8-K filings with the Securities and Exchange Commission on legal and regulatory matters that relate to Ameriprise Financial and its affiliates. Copies of these filings may be obtained by accessing the SEC website at www.sec.gov.
There can be no assurance that these matters, or the adverse publicity associated with them, will not result in increased fund redemptions, reduced sale of fund shares or other adverse consequences to the Funds. Further, although we believe proceedings are not likely to have a material adverse effect on the Funds or the ability of Ameriprise Financial or its affiliates to perform under their contracts with the Funds, these proceedings are subject to uncertainties and, as such, we are unable to estimate the possible loss or range of loss that may result. An adverse outcome in one or more of these proceedings could result in adverse judgments, settlements, fines, penalties or other relief that could have a material adverse effect on the consolidated financial condition or results of operations of Ameriprise Financial.
| | |
| 32 | | Semiannual Report 2012 |
| | |
| |
| Columbia Equity Value Fund | | |
Supplemental Information
(Unaudited)
Change in Independent Registered Public Accounting Firm
At a meeting held on June 14, 2012, the Board, upon recommendation of the Audit Committee, approved the replacement of Ernst & Young LLP (Ernst & Young) as the independent registered public accounting firm for the Fund and certain other funds in the Columbia Family of Funds (collectively, the Funds) and appointed PricewaterhouseCoopers LLP (PwC). PwC’s engagement was effective at the completion of Ernst & Young’s audits of the financial statements of the Funds with fiscal years ending July 31, 2012. The Fund did not consult with PwC during the fiscal period ended February 29, 2012 and year ended March 31, 2011 and through the June meeting.
Ernst & Young’s reports on the financial statements of the Fund as of and for the fiscal period ended February 29, 2012 and year ended March 31, 2011 contained no adverse opinion or disclaimer of opinion and were not qualified or modified as to uncertainty, audit scope or accounting principles. During such fiscal periods and through the June meeting, there were no: (1) disagreements between the Fund and Ernst & Young on any matter of accounting principles or practices, financial statement disclosure, or auditing scope or procedure which, if not resolved to Ernst & Young’s satisfaction, would have caused them to make reference to the subject matter of the disagreement in connection with their reports, or (2) reportable events.
| | | | |
| Semiannual Report 2012 | | | 33 | |
| | |
| |
| | Columbia Equity Value Fund |
Approval of Investment Management Services Agreement
Columbia Management Investment Advisers, LLC (Columbia Management or the Investment Manager), a wholly-owned subsidiary of Ameriprise Financial, Inc. (Ameriprise Financial), serves as the investment manager to Columbia Equity Value Fund (the Fund). Under an investment management services agreement (the IMS Agreement), Columbia Management provides investment advice and other services to the Fund and other funds distributed by Columbia Management Investment Distributors, Inc. (collectively, the Funds).
On an annual basis, the Fund’s Board of Trustees (the Board), including the independent Board members (the Independent Trustees), considers renewal of the IMS Agreement. Columbia Management prepared detailed reports for the Board and its Contracts Committee in March and April 2012, including reports based on analyses of data provided by an independent organization and a comprehensive response to each item of information requested by independent legal counsel to the Independent Trustees (Independent Legal Counsel) in a letter to the Investment Manager, to assist the Board in making this determination. All of the materials presented in March and April were first supplied in draft form to designated representatives of the Independent Trustees, i.e., Independent Legal Counsel, the Chair of the Board and the Chair of the Contracts Committee (including materials relating to the Fund’s expense cap), and the final materials were revised to reflect comments provided by these Board representatives. In addition, throughout the year, the Board (or its committees) regularly meets with portfolio management teams and senior management personnel, and reviews information prepared by Columbia Management addressing the services Columbia Management provides and Fund performance. The Board accords particular weight to the work, deliberations and conclusions of the Contracts Committee, the Investment Review Committee and the Compliance Committee in determining whether to continue the IMS Agreement.
The Board, at its April 10-12, 2012 in-person Board meeting (the April Meeting), considered the renewal of the IMS Agreement for an additional one-year term. At the April Meeting, Independent Legal Counsel reviewed with the Independent Trustees various factors relevant to the Board’s consideration of advisory agreements and the Board’s legal responsibilities related to such consideration. Following an analysis and discussion of the factors identified below, the Board, including all of the Independent Trustees, approved the renewal of the IMS Agreement.
Nature, Extent and Quality of Services Provided by Columbia Management
The Independent Trustees analyzed various reports and presentations they had received detailing the services performed by Columbia Management, as well as its expertise, resources and capabilities. The Independent Trustees specifically considered many developments during the past year concerning the services provided by Columbia Management, including, in particular, the continued investment in, and resources dedicated to, the Funds’ operations and the successful completion of various integration initiatives and the consolidation of dozens of Funds. The Independent Trustees noted the information they received concerning Columbia Management’s ability to retain key portfolio management personnel. In that connection, the Independent Trustees took into account their meetings with Columbia Management’s Chief Investment Officer (the CIO) and considered the CIO’s successful execution of additional risk and portfolio management oversight applied to the Funds. The Independent Trustees also assessed Columbia Management’s significant investment in upgrading technology (such as an equity trading system) and considered management’s commitments to enhance existing resources in this area.
In connection with the Board’s evaluation of the overall package of services provided by Columbia Management, the Board also considered the quality of administrative services provided to the Fund by Columbia Management. In addition, the Board also reviewed the financial condition of Columbia Management (and its affiliates) and each entity’s ability to carry out its responsibilities under the IMS Agreement and the Fund’s other services agreements with affiliates of Ameriprise Financial. The Board also discussed the acceptability of the terms of the IMS Agreement (including the relatively broad scope of services required to be performed by Columbia Management). The Board concluded that the services being performed under the IMS Agreement were of a reasonably high quality.
Based on the foregoing, and based on other information received (both oral and written, including the information on investment performance referenced below) and other considerations, the Board concluded that Columbia Management and its affiliates were in a position to continue to provide a high quality and level of services to the Fund.
Investment Performance
For purposes of evaluating the nature, extent and quality of services provided under the IMS Agreement, the Board carefully reviewed the investment performance of the Fund. In this regard, the Board considered detailed reports providing the results of analyses performed by an independent organization showing, for various periods, the performance of the Fund, the performance of a benchmark index, the percentage ranking of the Fund among its comparison group and the net assets of the Fund. The Board
| | |
| 34 | | Semiannual Report 2012 |
| | |
| |
| Columbia Equity Value Fund | | |
Approval of Investment Management Services Agreement (continued)
observed that the Fund’s investment performance reflected the interrelationship of market conditions with the particular investment strategies employed by the portfolio management team.
Comparative Fees, Costs of Services Provided and the Profits Realized By Columbia Management and its Affiliates from their Relationships with the Fund
The Board reviewed comparative fees and the costs of services to be provided under the IMS Agreement. The Board members considered detailed comparative information set forth in an annual report on fees and expenses, including, among other things, data (based on analyses conducted by an independent organization) showing a comparison of the Fund’s expenses with median expenses paid by funds in its comparative peer universe, as well as data showing the Fund’s contribution to Columbia Management’s profitability.
The Board accorded particular weight to the notion that the level of fees should reflect a rational pricing model applied consistently across the various product lines in the Fund family, while assuring that the overall fees for each Fund (with few defined exceptions) are generally in line with the “pricing philosophy” (i.e., that the total expense ratio of the Fund is at, or below, the median expense ratio of funds in the same comparison universe of the Fund). The Board took into account that the Fund’s total expense ratio (after considering proposed expense caps/waivers) approximated the peer universe’s median expense ratio. Based on its review, the Board concluded that the Fund’s management fee was fair and reasonable in light of the extent and quality of services that the Fund receives.
The Board also considered the expected profitability of Columbia Management and its affiliates in connection with Columbia Management providing investment management services to the Fund. In this regard, the Board referred to a detailed profitability report, discussing the profitability to Columbia Management and Ameriprise Financial from managing, operating and distributing the Funds. In this regard, the Board observed that 2011 profitability, while slightly lower than 2010, was generally in line with the reported profitability of other asset management firms. The Board also considered the indirect economic benefits flowing to Columbia Management or its affiliates in connection with managing or distributing the Funds, such as the enhanced ability to offer various other financial products to Ameriprise Financial customers, soft dollar benefits and overall reputational advantages. The Board noted that the fees paid by the Funds should permit the Investment Manager to offer competitive compensation to its personnel, make necessary investments in its business and earn an appropriate profit. The Board concluded that profitability levels were reasonable.
Economies of Scale to be Realized
The Board also considered the economies of scale that might be realized by Columbia Management as the Fund grows and took note of the extent to which Fund shareholders might also benefit from such growth.
Based on the foregoing, the Board, including all of the Independent Trustees, concluded that the investment management service fees were fair and reasonable in light of the extent and quality of services provided. In reaching this conclusion, no single factor was determinative. On April 12, 2012, the Board, including all of the Independent Trustees, approved the renewal of the IMS Agreement.
| | | | |
| Semiannual Report 2012 | | | 35 | |
| | |
| |
| | Columbia Equity Value Fund |
[THIS PAGE INTENTIONALLY LEFT BLANK]
| | |
| 36 | | Semiannual Report 2012 |
| | |
| |
| Columbia Equity Value Fund | | |
Important Information About This Report
Each fund mails one shareholder report to each shareholder address. If you would like more than one report, please call shareholder services at 800.345.6611 and additional reports will be sent to you.
The policy of the Board is to vote the proxies of the companies in which each fund holds investments consistent with the procedures as stated in the Statement of Additional Information (SAI). You may obtain a copy of the SAI without charge by calling 800.345.6611; contacting your financial intermediary; visiting columbiamanagement.com; or searching the website of the Securities and Exchange Commission (SEC) at sec.gov. Information regarding how each fund voted proxies relating to portfolio securities is filed with the SEC by August 31 for the most recent 12-month period ending June 30 of that year, and is available without charge by visiting columbiamanagement.com; or searching the website of the SEC at sec.gov.
Each fund files a complete schedule of portfolio holdings with the SEC for the first and third quarters of each fiscal year on Form N-Q. Each fund’s Form N-Q is available on the SEC’s website at sec.gov and may be reviewed and copied at the SEC’s Public Reference Room in Washington, D.C. Information on the operation of the Public Reference Room may be obtained by calling 800.SEC.0330. Each fund’s complete schedule of portfolio holdings, as filed on Form N-Q, can also be obtained without charge, upon request, by calling 800.345.6611.
| | | | |
| Semiannual Report 2012 | | | 37 | |

Columbia Equity Value Fund
P.O. Box 8081
Boston, MA 02266-8081
columbiamanagement.com
This information is for use with concurrent or prior delivery of a fund prospectus. Please read and consider the investment objectives, risks, charges and expenses for any fund carefully before investing. For a prospectus which contains this and other important information about the Fund, go to columbiamanagement.com. The Fund is distributed by Columbia Management Investment Distributors, Inc., member FINRA, and managed by Columbia Management Investment Advisers, LLC.
© 2012 Columbia Management Investment Advisers, LLC. All rights reserved.
S-6481 W (10/12)
Item 2. Code of Ethics.
Not applicable for semiannual reports.
Item 3. Audit Committee Financial Expert.
Not applicable for semiannual reports.
Item 4. Principal Accountant Fees and Services.
Not applicable for semiannual reports.
Item 5. Audit Committee of Listed Registrants.
Not applicable.
Item 6. Investments
| | (a) | The registrant’s “Schedule I – Investments in securities of unaffiliated issuers” (as set forth in 17 CFR 210.12-12) is included in Item 1 of this Form N-CSR. |
Item 7. Disclosure of Proxy Voting Policies and Procedures for Closed-End Management Investment Companies.
Not applicable.
Item 8. Portfolio Managers of Closed-End Management Investment Companies.
Not applicable.
Item 9. Purchases of Equity Securities by Closed-End Management Investment Company and Affiliated Purchasers.
Not applicable.
Item 10. Submission of Matters to a Vote of Security Holders.
There were no material changes to the procedures by which shareholders may recommend nominees to the registrant’s board of directors.
Item 11. Controls and Procedures.
| | (a) | The registrant’s principal executive officer and principal financial officers, based on their evaluation of the registrant’s disclosure controls and procedures as of a date within 90 days of the filing of this report, have concluded that such controls and procedures are adequately designed to ensure that material information required to be disclosed by the registrant in Form N-CSR is accumulated and communicated to the registrant’s management, including the principal executive officer and principal financial officer, or persons performing similar functions, as appropriate to allow timely decisions regarding required disclosure. |
| | (b) | There was no change in the registrant’s internal control over financial reporting that occurred during the registrant’s second fiscal quarter of the period covered by this report that has materially affected, or is reasonably likely to materially affect, the registrant’s internal control over financial reporting. |
Item 12. Exhibits.
(a)(1) Code of ethics required to be disclosed under Item 2 of Form N-CSR: Not applicable for semiannual reports.
(a)(2) Certifications pursuant to Rule 30a-2(a) under the Investment Company Act of 1940 (17 CFR 270.30a-2(a)) attached hereto as Exhibit 99.CERT.
(a)(3) Not applicable.
(b) Certification pursuant to Rule 30a-2(b) under the Investment Company Act of 1940 (17 CFR 270.30a-2(b)) attached hereto as Exhibit 99.906CERT.
SIGNATURES
Pursuant to the requirements of the Securities Exchange Act of 1934 and the Investment Company Act of 1940, the registrant has duly caused this report to be signed on its behalf by the undersigned, thereunto duly authorized.
| | |
| |
| (registrant) | | Columbia Funds Series Trust II |
| | |
| |
| By (Signature and Title) | | /s/ J. Kevin Connaughton |
| | J. Kevin Connaughton, President and Principal Executive Officer |
|
| Date October 22, 2012 |
Pursuant to the requirements of the Securities Exchange Act of 1934 and the Investment Company Act of 1940, this report has been signed below by the following persons on behalf of the registrant and in the capacities and on the dates indicated.
| | |
| |
| By (Signature and Title) | | /s/ J. Kevin Connaughton |
| | J. Kevin Connaughton, President and Principal Executive Officer |
|
| Date October 22, 2012 |
| | |
| |
| By (Signature and Title) | | /s/ Michael G. Clarke |
| | Michael G. Clarke, Treasurer and Chief Financial Officer |
|
| Date October 22, 2012 |