UNITED STATES
SECURITIES AND EXCHANGE COMMISSION
Washington, D.C. 20549
FORM N-CSR
CERTIFIED SHAREHOLDER REPORT OF REGISTERED
MANAGEMENT INVESTMENT COMPANIES
Investment Company Act file number 811-21852
Columbia Funds Series Trust II
(Exact name of registrant as specified in charter)
225 Franklin Street, Boston, Massachusetts 02110
(Address of principal executive offices) (Zip code)
Scott R. Plummer
5228 Ameriprise Financial Center
Minneapolis, MN 55474
(Name and address of agent for service)
Registrant’s telephone number, including area code: 1-612-671-1947
Date of fiscal year end: October 31
Date of reporting period: April 30, 2013
Form N-CSR is to be used by management investment companies to file reports with the Commission not later than 10 days after the transmission to stockholders of any report that is required to be transmitted to stockholders under Rule 30e-1 under the Investment Company Act of 1940 (17 CFR 270.30e-1). The Commission may use the information provided on Form N-CSR in its regulatory, disclosure review, inspection, and policymaking roles.
A registrant is required to disclose the information specified by Form N-CSR, and the Commission will make this information public. A registrant is not required to respond to the collection of information contained in Form N-CSR unless the Form displays a currently valid Office of Management and Budget (“OMB”) control number. Please direct comments concerning the accuracy of the information collection burden estimate and any suggestions for reducing the burden to Secretary, Securities and Exchange Commission, 450 Fifth Street, NW, Washington, DC 20549-0609. The OMB has reviewed this collection of information under the clearance requirements of 44 U.S.C. § 3507.
Item 1. Reports to Stockholders.
| | |
Semiannual Report April 30, 2013 | |  |
| | |
Columbia Global Equity Fund | | |

| | |
| |
| | Columbia Global Equity Fund |
President’s Message

Dear Shareholders,
U.S. equities had a strong first quarter
Similar to 2012, equities once again were the best performing asset class in the first quarter of 2013. The S&P 500 Index reached an all-time closing high on the last trading day of the quarter and pushed through its October 2007 peak. Although global equities have performed well year-to-date, there is significant performance divergence among regions. In local currency terms, Japanese equities were the best performing developed market globally, and U.S. stocks outperformed most other global equity markets. European equities rose in the first quarter but trailed U.S. stocks and had a turbulent March, as investors were reminded of instability in the eurozone with news of a banking crisis in Cyprus.
Although all 10 sectors of the S&P 500 Index delivered positive returns, this was a rally led by defensive stocks such as those in health care, consumer staples and utilities. Materials and technology stocks were the weakest sectors.
High yield leads fixed income; most sectors flat to down
The fixed-income markets lagged equities with modest, single-digit returns coming from municipals and high-yield sectors in the United States. Most government and investment-grade credit sectors were
roughly flat to down for the first quarter of 2013. Emerging market bonds were the biggest disappointment with single-digit losses.
Columbia Management to begin delivering summary prospectuses
Each Columbia fund is required to update its prospectus on an annual basis. Beginning with June 2013 prospectus updates, shareholders of Columbia retail mutual funds will start to receive a summary prospectus, rather than the full length (statutory) mutual fund prospectus they have received in the past.
Each fund’s summary prospectus will include the following key information:
| > | | Portfolio turnover rate information |
| > | | Principal investment strategies, principal risks and performance information |
| > | | Purchase and sale information |
| > | | Financial intermediary compensation information |
Each fund’s statutory prospectus will contain additional information about the fund and its risks. Both the statutory and summary prospectus will be updated each year, and will be available at columbiamanagement.com. Shareholders may request a printed version of a statutory prospectus at no cost by calling 800.345.6611 or sending an email to serviceinquiries@columbiamanagement.com.
Stay on track with Columbia Management
Backed by more than 100 years of experience, Columbia Management is one of the nation’s largest asset managers. At the heart of our success — and, most importantly, that of our investors — are highly talented industry professionals, brought together by a unique way of working. We are dedicated to helping you take advantage of today’s opportunities and anticipate tomorrow’s. We stay abreast of the latest investment trends and ideas, using our collective insight to evaluate events and transform them into solutions you can use.
Visit columbiamanagement.com for:
| > | | The Columbia Management Perspectives blog, featuring timely posts by our investment teams |
| > | | Detailed up-to-date fund performance and portfolio information |
| > | | Economic analysis and market commentary |
| > | | Quarterly fund commentaries |
| > | | Columbia Management Investor, our award-winning quarterly newsletter for shareholders |
Thank you for your continued support of the Columbia Funds. We look forward to serving your investment needs for many years to come.
Best Regards,

J. Kevin Connaughton
President, Columbia Funds
The S&P 500 Index, an unmanaged index, measures the performance of 500 large-capitalization U.S. stocks and is frequently used as a general measure of market performance. Indices are not available for investment, are not professionally managed and do not reflect sales charges, fees, brokerage commissions, taxes or other expenses of investing.
Investors should consider the investment objectives, risks, charges and expenses of a mutual fund carefully before investing. For a free prospectus, which contains this and other important information about a fund, visit columbiamanagement.com. The prospectus should be read carefully before investing.
Columbia Funds are distributed by Columbia Management Investment Distributors, Inc., member FINRA, and managed by Columbia Management Investment Advisers, LLC.
© 2013 Columbia Management Investment Advisers, LLC. All rights reserved.
Semiannual Report 2013
| | |
| |
| Columbia Global Equity Fund | | |
Table of Contents
Fund Investment Manager
Columbia Management Investment
Advisers, LLC
225 Franklin Street
Boston, MA 02110
Fund Distributor
Columbia Management Investment
Distributors, Inc.
225 Franklin Street
Boston, MA 02110
Fund Transfer Agent
Columbia Management Investment
Services Corp.
P.O. Box 8081
Boston, MA 02266-8081
For more information about any of the funds, please visit columbiamanagement.com or call 800.345.6611. Customer Service Representatives are available to answer your questions Monday through Friday from 8 a.m. to 8 p.m. Eastern time.
The views expressed in this report reflect the current views of the respective parties. These views are not guarantees of future performance and involve certain risks, uncertainties and assumptions that are difficult to predict, so actual outcomes and results may differ significantly from the views expressed. These views are subject to change at any time based upon economic, market or other conditions and the respective parties disclaim any responsibility to update such views. These views may not be relied on as investment advice and, because investment decisions for a Columbia Fund are based on numerous factors, may not be relied on as an indication of trading intent on behalf of any particular Columbia Fund. References to specific securities should not be construed as a recommendation or investment advice.
Semiannual Report 2013
| | |
| |
| | Columbia Global Equity Fund |
Performance Overview
(Unaudited)
Performance Summary
| > | | Columbia Global Equity Fund (the Fund) Class A shares returned 14.25% excluding sales charges for the six months ended April 30, 2013. |
| > | | The Fund outperformed its benchmark, the MSCI All Country World Index (Net), which returned 13.46% during the same six-month period. |
| | | | | | | | | | | | | | | | | | |
Average Annual Total Returns (%) (for period ended April 30, 2013) | |
| | | Inception | | 6 Months
cumulative | | | 1 Year | | | 5 Years | | | 10 Years | |
Class A | | 05/29/90 | | | | | | | | | | | | | | | | |
Excluding sales charges | | | | | 14.25 | | | | 11.83 | | | | 0.52 | | | | 8.28 | |
Including sales charges | | | | | 7.69 | | | | 5.41 | | | | -0.66 | | | | 7.64 | |
Class B | | 03/20/95 | | | | | | | | | | | | | | | | |
Excluding sales charges | | | | | 13.83 | | | | 11.07 | | | | -0.23 | | | | 7.46 | |
Including sales charges | | | | | 8.83 | | | | 6.07 | | | | -0.63 | | | | 7.46 | |
Class C | | 06/26/00 | | | | | | | | | | | | | | | | |
Excluding sales charges | | | | | 13.70 | | | | 10.92 | | | | -0.25 | | | | 7.45 | |
Including sales charges | | | | | 12.70 | | | | 9.92 | | | | -0.25 | | | | 7.45 | |
Class I* | | 08/01/08 | | | 14.52 | | | | 12.26 | | | | 1.00 | | | | 8.53 | |
Class K | | 03/20/95 | | | 14.32 | | | | 12.07 | | | | 0.72 | | | | 8.47 | |
Class R* | | 12/11/06 | | | 14.16 | | | | 11.61 | | | | 0.44 | | | | 8.10 | |
Class R5* | | 12/11/06 | | | 14.48 | | | | 12.37 | | | | 1.00 | | | | 8.58 | |
Class W* | | 12/01/06 | | | 14.21 | | | | 11.81 | | | | 0.55 | | | | 8.29 | |
Class Z* | | 09/27/10 | | | 14.30 | | | | 12.19 | | | | 0.65 | | | | 8.35 | |
MSCI All Country World Index (Net) | | | | | 13.46 | | | | 15.02 | | | | 1.53 | | | | 8.74 | |
Returns for Class A are shown with and without the maximum initial sales charge of 5.75%. Returns for Class B are shown with and without the applicable contingent deferred sales charge (CDSC) of 5.00% in the first year, declining to 1.00% in the sixth year and eliminated thereafter. Returns for Class C are shown with and without the 1.00% CDSC for the first year only. The Fund’s other classes are not subject to sales charges and have limited eligibility. Please see the Fund’s prospectus for details. Performance for different share classes will vary based on differences in sales charges and fees associated with each class. All results shown assume reinvestment of distributions during the period. Returns do not reflect the deduction of taxes that a shareholder may pay on Fund distributions or on the redemption of Fund shares. Performance results reflect the effect of any fee waivers or reimbursements of Fund expenses by Columbia Management Investment Advisers, LLC and/or any of its affiliates. Absent these fee waivers or expense reimbursement arrangements, performance results would have been lower.
The performance information shown represents past performance and is not a guarantee of future results. The investment return and principal value of your investment will fluctuate so that your shares, when redeemed, may be worth more or less than their original cost. Current performance may be lower or higher than the performance information shown. You may obtain performance information current to the most recent month-end by contacting your financial intermediary, visiting columbiamanagement.com or calling 800.345.6611.
| * | The returns shown for periods prior to the share class inception date (including returns for the Life of the Fund, if shown, which are since Fund inception) include the returns of the Fund’s oldest share class. These returns are adjusted to reflect any higher class-related operating expenses of the newer share classes, as applicable. Please visit columbiamanagement.com/mutual-funds/appended-performance for more information. |
The MSCI All Country World Index (Net) is a free float-adjusted market capitalization weighted index that is designed to measure the equity market performance of developed and emerging markets. The index consists of 45 country indices comprising 24 developed and 21 emerging market country indices.
Indices are not available for investment, are not professionally managed and do not reflect sales charges, fees, brokerage commissions, taxes or other expenses of investing. Securities in the Fund may not match those in an index.
| | |
| |
| Columbia Global Equity Fund | | |
Portfolio Overview
(Unaudited)
| | | | |
Top Ten Holdings (%) (at April 30, 2013) | |
Toyota Motor Corp. (Japan) | | | 2.5 | |
Novartis AG, Registered Shares (Switzerland) | | | 2.2 | |
Samsung Electronics Co., Ltd. (South Korea) | | | 2.1 | |
Pfizer, Inc. (United States) | | | 2.1 | |
Google, Inc., Class A (United States) | | | 2.0 | |
Walt Disney Co. (The) (United States) | | | 2.0 | |
Unilever PLC (United Kingdom) | | | 1.9 | |
JPMorgan Chase & Co. (United States) | | | 1.9 | |
Nestlé SA, Registered Shares (Switzerland) | | | 1.8 | |
Covidien PLC (Ireland) | | | 1.8 | |
Percentages indicated are based upon total investments (excluding Money Market Funds).
For further detail about these holdings, please refer to the section entitled “Portfolio of Investments.”
Fund holdings are as of the date given, are subject to change at any time, and are not recommendations to buy or sell any security.
| | | | |
Country Breakdown (%) (at April 30, 2013) | |
Belgium | | | 1.5 | |
Canada | | | 2.4 | |
France | | | 1.3 | |
Germany | | | 4.8 | |
Hong Kong | | | 1.5 | |
Indonesia | | | 1.4 | |
Ireland | | | 1.8 | |
Japan | | | 9.0 | |
Norway | | | 0.8 | |
Panama | | | 1.1 | |
South Korea | | | 2.1 | |
Switzerland | | | 6.5 | |
United Kingdom | | | 10.7 | |
United States(a) | | | 55.1 | |
Total | | | 100.0 | |
Percentages indicated are based upon total investments. The Fund’s portfolio composition is subject to change.
| (a) | Includes investments in Money Market Funds. |
Portfolio Management
Threadneedle International Limited
Neil Robson*
Esther Perkins, CFA
* Effective April 12, 2013, Neil Robson replaced Stephen Thornber as Lead Manager of the Fund.
Morningstar Style Box™

The Morningstar Style Box™ is based on a fund’s portfolio holdings. For equity funds, the vertical axis shows the market capitalization of the stocks owned, and the horizontal axis shows investment style (value, blend, or growth). Information shown is based on the most recent data provided by Morningstar.
© 2013 Morningstar, Inc. All rights reserved. The Morningstar information contained herein: (1) is proprietary to Morningstar and/or its content providers; (2) may not be copied or distributed; and (3) is not warranted to be accurate, complete or timely. Neither Morningstar nor its content providers are responsible for any damages or losses arising from any use of this information.
| | |
| |
| | Columbia Global Equity Fund |
Portfolio Overview (continued)
(Unaudited)
| | | | |
Summary of Investments in Securities by Industry (%) (at April 30, 2013) | | | | |
Aerospace & Defense | | | 0.9 | |
Airlines | | | 1.1 | |
Automobiles | | | 3.8 | |
Beverages | | | 2.9 | |
Capital Markets | | | 2.4 | |
Chemicals | | | 5.0 | |
Commercial Banks | | | 4.3 | |
Commercial Services & Supplies | | | 1.1 | |
Communications Equipment | | | 2.2 | |
Computers & Peripherals | | | 2.3 | |
Consumer Finance | | | 2.4 | |
Diversified Financial Services | | | 1.9 | |
Electronic Equipment, Instruments & Components | | | 1.2 | |
Energy Equipment & Services | | | 2.4 | |
Food & Staples Retailing | | | 0.7 | |
Food Products | | | 5.3 | |
Health Care Equipment & Supplies | | | 4.0 | |
Health Care Providers & Services | | | 2.0 | |
Hotels, Restaurants & Leisure | | | 2.8 | |
Insurance | | | 4.6 | |
Internet & Catalog Retail | | | 1.5 | |
Internet Software & Services | | | 4.1 | |
Machinery | | | 3.3 | |
Media | | | 5.9 | |
Metals & Mining | | | 1.8 | |
Oil, Gas & Consumable Fuels | | | 5.2 | |
Pharmaceuticals | | | 5.6 | |
Professional Services | | | 0.9 | |
Real Estate Management & Development | | | 1.5 | |
Road & Rail | | | 1.5 | |
Semiconductors & Semiconductor Equipment | | | 3.4 | |
Software | | | 2.6 | |
Textiles, Apparel & Luxury Goods | | | 1.4 | |
Tobacco | | | 1.1 | |
Trading Companies & Distributors | | | 3.8 | |
Wireless Telecommunication Services | | | 1.6 | |
Money Market Funds | | | 0.9 | |
Total | | | 99.4 | |
Percentages indicated are based upon net assets. The Fund’s portfolio composition is subject to change.
| | |
| |
| Columbia Global Equity Fund | | |
Understanding Your Fund’s Expenses
(Unaudited)
As an investor, you incur two types of costs. There are transaction costs, which generally include sales charges on purchases and may include redemption fees. There are also ongoing costs, which generally include management fees, distribution and service (Rule 12b-1) fees, and other fund expenses. The following information is intended to help you understand your ongoing costs (in dollars) of investing in the Fund and to help you compare these costs with the ongoing costs of investing in other mutual funds.
Analyzing Your Fund’s Expenses
To illustrate these ongoing costs, we have provided examples and calculated the expenses paid by investors in each share class of the Fund during the period. The actual and hypothetical information in the table is based on an initial investment of $1,000 at the beginning of the period indicated and held for the entire period. Expense information is calculated two ways and each method provides you with different information. The amount listed in the “Actual” column is calculated using the Fund’s actual operating expenses and total return for the period. You may use the Actual information, together with the amount invested, to estimate the expenses that you paid over the period. Simply divide your account value by $1,000 (for example, an $8,600 account value divided by $1,000 = 8.6), then multiply the results by the expenses paid during the period under the Actual column. The amount listed in the “Hypothetical” column assumes a 5% annual rate of return before expenses (which is not the Fund’s actual return) and then applies the Fund’s actual expense ratio for the period to the hypothetical return. You should not use the hypothetical account values and expenses to estimate either your actual account balance at the end of the period or the expenses you paid during the period. See “Compare With Other Funds” below for details on how to use the hypothetical data.
Compare With Other Funds
Since all mutual funds are required to include the same hypothetical calculations about expenses in shareholder reports, you can use this information to compare the ongoing cost of investing in the Fund with other funds. To do so, compare the hypothetical example with the 5% hypothetical examples that appear in the shareholder reports of other funds. As you compare hypothetical examples of other funds, it is important to note that hypothetical examples are meant to highlight the ongoing costs of investing in a fund only and do not reflect any transaction costs, such as sales charges, or redemption or exchange fees. Therefore, the hypothetical calculations are useful in comparing ongoing costs only, and will not help you determine the relative total costs of owning different funds. If transaction costs were included in these calculations, your costs would be higher.
November 1, 2012 – April 30, 2013
| | | | | | | | | | | | | | | | | | | | | | | | | | | | |
| | | Account Value at the
Beginning of the
Period ($) | | | Account Value at the
End of the
Period ($) | | | Expenses Paid During
the Period ($) | | | Fund’s Annualized
Expense Ratio (%) | |
| | | | Actual | | | | Hypothetical | | | | Actual | | | | Hypothetical | | | | Actual | | | | Hypothetical | | | | Actual | |
Class A | | | 1,000.00 | | | | 1,000.00 | | | | 1,142.50 | | | | 1,017.85 | | | | 7.44 | | | | 7.00 | | | | 1.40 | |
Class B | | | 1,000.00 | | | | 1,000.00 | | | | 1,138.30 | | | | 1,014.13 | | | | 11.40 | | | | 10.74 | | | | 2.15 | |
Class C | | | 1,000.00 | | | | 1,000.00 | | | | 1,137.00 | | | | 1,014.13 | | | | 11.39 | | | | 10.74 | | | | 2.15 | |
Class I | | | 1,000.00 | | | | 1,000.00 | | | | 1,145.20 | | | | 1,020.18 | | | | 4.95 | | | | 4.66 | | | | 0.93 | |
Class K | | | 1,000.00 | | | | 1,000.00 | | | | 1,143.20 | | | | 1,018.65 | | | | 6.59 | | | | 6.21 | | | | 1.24 | |
Class R | | | 1,000.00 | | | | 1,000.00 | | | | 1,141.60 | | | | 1,016.56 | | | | 8.81 | | | | 8.30 | | | | 1.66 | |
Class R5 | | | 1,000.00 | | | | 1,000.00 | | | | 1,144.80 | | | | 1,019.93 | | | | 5.21 | | | | 4.91 | | | | 0.98 | |
Class W | | | 1,000.00 | | | | 1,000.00 | | | | 1,142.10 | | | | 1,017.80 | | | | 7.49 | | | | 7.05 | | | | 1.41 | |
Class Z | | | 1,000.00 | | | | 1,000.00 | | | | 1,143.00 | | | | 1,019.09 | | | | 6.11 | | | | 5.76 | | | | 1.15 | |
Expenses paid during the period are equal to the annualized expense ratio for each class as indicated above, multiplied by the average account value over the period and then multiplied by the number of days in the Fund’s most recent fiscal half year and divided by 365.
Expenses do not include fees and expenses incurred indirectly by the Fund from the underlying funds in which the Fund may invest (also referred to as “acquired funds”), including affiliated and non-affiliated pooled investment vehicles (including mutual funds and exchange-traded funds).
Had Columbia Management Investment Advisers, LLC and/or certain of its affiliates not waived/reimbursed certain fees and expenses, account value at the end of the period would have been reduced.
Columbia Management Investment Advisers, LLC and/or certain of its affiliates have contractually agreed to waive certain fees and to absorb certain expenses until February 28, 2014, unless sooner terminated at the sole discretion of the Fund’s Board, such that net expenses, subject to applicable exclusions, will not exceed 1.49% for Class A, 2.24% for Class B, 2.24% for Class C, 1.04% for Class I, 1.34% for Class K, 1.74% for Class R, 1.09% for Class R5, 1.49% for Class W and 1.24% for Class Z. Any amounts waived will not be reimbursed by the Fund. This change was effective March 1, 2013. If this change had been in place for the entire six month period ended April 30, 2013, the actual expenses paid would have been $7.92 for Class A, $11.88 for Class B, $11.87 for Class C, $5.53 for Class I, $7.12 for Class Class K, $9.24 for Class R, $5.80 for Class R5, $7.91 for Class W and $6.59 for Class Z; the hypothetical expenses paid would have been $7.45 for Class A, $11.18 for Class B, $11.18 for Class C, $5.21 for Class I, $6.71 for Class K, $8.70 for Class R, $5.46 for Class R5, $7.45 for Class W and $6.21 for Class Z.
| | |
| |
| | Columbia Global Equity Fund |
Portfolio of Investments
April 30, 2013 (Unaudited)
(Percentages represent value of investments compared to net assets)
| | | | | | | | |
| Common Stocks 96.5% | |
| Issuer | | Shares | | | Value ($) | |
| | | | | | | | |
Belgium 1.6% | |
Anheuser-Busch InBev NV | | | 62,326 | | | | 5,930,298 | |
| | |
| | | | | | | | |
Canada 2.4% | |
Aimia, Inc. | | | 122,200 | | | | 1,928,612 | |
| | |
First Quantum Minerals Ltd. | | | 201,100 | | | | 3,511,190 | |
| | |
Methanex Corp. | | | 88,000 | | | | 3,729,813 | |
| | | | | | | | | |
Total | | | | | | | 9,169,615 | |
| | |
| | | | | | | | |
France 1.3% | |
Renault SA | | | 71,232 | | | | 4,908,088 | |
| | |
| | | | | | | | |
Germany 4.7% | |
Brenntag AG | | | 27,163 | | | | 4,630,727 | |
| | |
Fresenius Medical Care AG & Co. KGaA | | | 39,208 | | | | 2,705,674 | |
| | |
Kabel Deutschland Holding AG | | | 47,103 | | | | 4,476,872 | |
| | |
Linde AG | | | 15,324 | | | | 2,897,984 | |
| | |
MTU Aero Engines Holding AG | | | 35,596 | | | | 3,367,728 | |
| | | | | | | | | |
Total | | | | | | | 18,078,985 | |
| | |
| | | | | | | | |
Hong Kong 1.5% | |
Great Eagle Holdings Ltd. | | | 456,377 | | | | 1,937,520 | |
| | |
Sun Hung Kai Properties Ltd. | | | 271,000 | | | | 3,918,684 | |
| | | | | | | | | |
Total | | | | | | | 5,856,204 | |
| | |
| | | | | | | | |
Indonesia 1.4% | |
PT Bank Rakyat Indonesia Persero Tbk | | | 5,615,000 | | | | 5,438,269 | |
| | |
| | | | | | | | |
Ireland 1.8% | |
Covidien PLC | | | 104,446 | | | | 6,667,833 | |
| | |
| | | | | | | | |
Japan 8.9% | |
Aeon Co., Ltd. | | | 184,300 | | | | 2,609,200 | |
| | |
Aozora Bank Ltd. | | | 1,423,000 | | | | 4,458,402 | |
| | |
Asahi Group Holdings Ltd. | | | 211,100 | | | | 5,249,545 | |
| | |
Konami Corp. | | | 147,800 | | | | 3,371,551 | |
| | |
Makita Corp. | | | 84,400 | | | | 5,148,234 | |
| | |
Nomura Holdings, Inc. | | | 468,300 | | | | 3,827,277 | |
| | |
Toyota Motor Corp. | | | 163,000 | | | | 9,460,170 | |
| | | | | | | | | |
Total | | | | | | | 34,124,379 | |
| | |
| | | | | | | | |
Norway 0.8% | |
ProSafe SE | | | 314,321 | | | | 3,022,742 | |
| | |
| | | | | | | | |
Panama 1.1% | |
Copa Holdings SA, Class A | | | 33,724 | | | | 4,235,060 | |
| | | | | | | | |
| Common Stocks (continued) | |
| Issuer | | Shares | | | Value ($) | |
| | | | | | | | |
South Korea 2.1% | |
Samsung Electronics Co., Ltd. | | | 5,762 | | | | 7,968,964 | |
| | |
| | | | | | | | |
Switzerland 6.4% | |
Nestlé SA, Registered Shares | | | 96,122 | | | | 6,864,380 | |
| | |
Novartis AG, Registered Shares | | | 110,268 | | | | 8,188,864 | |
| | |
Swatch Group AG (The) | | | 9,003 | | | | 5,156,052 | |
| | |
TE Connectivity Ltd. | | | 100,856 | | | | 4,392,279 | |
| | | | | | | | | |
Total | | | | | | | 24,601,575 | |
| | |
| | | | | | | | |
United Kingdom 10.6% | |
BG Group PLC | | | 309,075 | | | | 5,206,702 | |
| | |
GlaxoSmithKline PLC | | | 199,163 | | | | 5,137,086 | |
| | |
HSBC Holdings PLC | | | 609,762 | | | | 6,663,367 | |
| | |
Rio Tinto PLC | | | 70,055 | | | | 3,176,453 | |
| | |
Tullow Oil PLC | | | 210,084 | | | | 3,266,603 | |
| | |
Unilever PLC | | | 169,134 | | | | 7,319,498 | |
| | |
Vodafone Group PLC | | | 2,053,155 | | | | 6,257,344 | |
| | |
Weir Group PLC (The) | | | 102,780 | | | | 3,518,758 | |
| | | | | | | | | |
Total | | | | | | | 40,545,811 | |
| | |
| | | | | | | | |
United States 51.9% | |
Affiliated Managers Group, Inc.(a) | | | 13,117 | | | | 2,042,055 | |
| | |
Airgas, Inc. | | | 51,556 | | | | 4,982,887 | |
| | |
American Express Co. | | | 95,452 | | | | 6,529,871 | |
| | |
American International Group, Inc.(a) | | | 159,759 | | | | 6,617,218 | |
| | |
Aon PLC | | | 103,662 | | | | 6,256,002 | |
| | |
Apple, Inc. | | | 11,053 | | | | 4,893,716 | |
| | |
CF Industries Holdings, Inc. | | | 16,131 | | | | 3,008,593 | |
| | |
Comcast Corp., Class A | | | 119,313 | | | | 4,927,627 | |
| | |
Cummins, Inc. | | | 35,210 | | | | 3,745,992 | |
| | |
Discover Financial Services | | | 57,515 | | | | 2,515,706 | |
| | |
Dresser-Rand Group, Inc.(a) | | | 56,117 | | | | 3,120,666 | |
| | |
eBay, Inc.(a) | | | 106,754 | | | | 5,592,842 | |
| | |
EMC Corp.(a) | | | 169,684 | | | | 3,806,012 | |
| | |
Equifax, Inc. | | | 55,234 | | | | 3,380,321 | |
| | |
Facebook, Inc., Class A(a) | | | 95,624 | | | | 2,654,522 | |
| | |
Fidelity National Financial, Inc., Class A | | | 178,753 | | | | 4,799,518 | |
| | |
Google, Inc., Class A(a) | | | 9,184 | | | | 7,572,851 | |
| | |
Henry Schein, Inc.(a) | | | 55,715 | | | | 5,036,636 | |
| | |
JPMorgan Chase & Co. | | | 146,674 | | | | 7,188,493 | |
| | |
Lam Research Corp.(a) | | | 104,421 | | | | 4,826,339 | |
| | |
Las Vegas Sands Corp. | | | 95,593 | | | | 5,377,106 | |
| | |
Liberty Global, Inc., Class A(a) | | | 51,211 | | | | 3,706,140 | |
| | |
LyondellBasell Industries NV, Class A | | | 75,381 | | | | 4,575,627 | |
The accompanying Notes to Financial Statements are an integral part of this statement.
| | |
| |
| Columbia Global Equity Fund | | |
Portfolio of Investments (continued)
April 30, 2013 (Unaudited)
| | | | | | | | |
| Common Stocks (continued) | |
| Issuer | | Shares | | | Value ($) | |
| | | | | | | | |
| | |
Marathon Petroleum Corp. | | | 49,370 | | | | 3,868,633 | |
| | |
McDonald’s Corp. | | | 52,918 | | | | 5,405,044 | |
| | |
Mead Johnson Nutrition Co. | | | 76,346 | | | | 6,190,897 | |
| | |
Microsoft Corp. | | | 109,260 | | | | 3,616,506 | |
| | |
National Oilwell Varco, Inc. | | | 47,712 | | | | 3,111,777 | |
| | |
Pfizer, Inc. | | | 271,693 | | | | 7,898,115 | |
| | |
Philip Morris International, Inc. | | | 44,847 | | | | 4,286,925 | |
| | |
priceline.com, Inc.(a) | | | 8,061 | | | | 5,610,375 | |
| | |
QUALCOMM, Inc. | | | 95,877 | | | | 5,907,941 | |
| | |
Riverbed Technology, Inc.(a) | | | 173,013 | | | | 2,570,973 | |
| | |
Sirona Dental Systems, Inc.(a) | | | 63,438 | | | | 4,665,231 | |
| | |
Solera Holdings, Inc. | | | 53,338 | | | | 3,071,202 | |
| | |
Tyco International Ltd. | | | 132,276 | | | | 4,248,705 | |
| | |
Union Pacific Corp. | | | 39,870 | | | | 5,899,165 | |
| | |
United Rentals, Inc.(a) | | | 92,520 | | | | 4,867,477 | |
| | |
Walt Disney Co. (The) | | | 120,295 | | | | 7,559,338 | |
| | |
WESCO International, Inc.(a) | | | 67,399 | | | | 4,831,834 | |
| | |
World Fuel Services Corp. | | | 81,904 | | | | 3,321,207 | |
| | |
Zimmer Holdings, Inc. | | | 51,682 | | | | 3,951,089 | |
| | | | | | | | | |
Total | | | | | | | 198,039,174 | |
| | | | | | | | | |
Total Common Stocks | | | | | | | | |
(Cost: $301,963,580) | | | | | | | 368,586,997 | |
| | | | | | | | |
| Limited Partnerships 2.0% | | | | | | | | |
| Issuer | | Shares | | | Value ($) | |
| | | | | | | | |
United States 2.0% | |
Blackstone Group LP | | | 168,486 | | | | 3,462,387 | |
| | |
Enterprise Products Partners LP | | | 67,500 | | | | 4,093,875 | |
| | | | | | | | | |
Total | | | | | | | 7,556,262 | |
| | | | | | | | | |
Total Limited Partnerships | | | | | | | | |
(Cost: $6,236,969) | | | | | | | 7,556,262 | |
| | |
| | | | | | | | |
| Money Market Funds 0.9% | | | | | | | | |
| | | Shares | | | Value ($) | |
| | |
Columbia Short-Term Cash Fund, 0.126%(b)(c) | | | 3,391,552 | | | | 3,391,552 | |
| | | | | | | | | |
Total Money Market Funds | | | | | | | | |
(Cost: $3,391,552) | | | | | | | 3,391,552 | |
| | | | | | | | | |
Total Investments | | | | | | | | |
(Cost: $311,592,101) | | | | | | | 379,534,811 | |
| | | | | | | | | |
Other Assets & Liabilities, Net | | | | | | | 2,387,557 | |
| | | | | | | | | |
Net Assets | | | | | | | 381,922,368 | |
| | | | | | | | | |
Notes to Portfolio of Investments
| (b) | The rate shown is the seven-day current annualized yield at April 30, 2013. |
| (c) | As defined in the Investment Company Act of 1940, an affiliated company is one in which the Fund owns 5% or more of its outstanding voting securities, or a company which is under common ownership or control with the Fund. Holdings and transactions in these affiliated companies during the period ended April 30, 2013, are as follows: |
| | | | | | | | | | | | | | | | | | | | | | | | |
| Issuer | | Beginning
Cost ($) | | | Purchase
Cost ($) | | | Proceeds
From Sales ($) | | | Ending
Cost ($) | | | Dividends –
Affiliated
Issuers ($) | | | Value ($) | |
Columbia Short-Term Cash Fund | | | 3,088,083 | | | | 59,112,902 | | | | (58,809,433 | ) | | | 3,391,552 | | | | 3,442 | | | | 3,391,552 | |
Fair Value Measurements
Generally accepted accounting principles (GAAP) require disclosure regarding the inputs and valuation techniques used to measure fair value and any changes in valuation inputs or techniques. In addition, investments shall be disclosed by major category.
The Fund categorizes its fair value measurements according to a three-level hierarchy that maximizes the use of observable inputs and minimizes the use of unobservable inputs by prioritizing that the most observable input be used when available. Observable inputs are those that market participants would use in pricing an investment based on market data obtained from sources independent of the reporting entity. Unobservable inputs are those that reflect the Fund’s assumptions about the information market participants would use in pricing an investment. An investment’s level within the fair value hierarchy is based on the lowest level of any input that is deemed significant to the asset or liability’s fair value measurement. The input levels are not necessarily an indication of the risk or liquidity associated with investments at that level. For example, certain U.S. government securities are generally high quality and liquid, however, they are reflected as Level 2 because the inputs used to determine fair value may not always be quoted prices in an active market.
Fair value inputs are summarized in the three broad levels listed below:
| > | | Level 1 — Valuations based on quoted prices for investments in active markets that the Fund has the ability to access at the measurement date (including NAV for open-end mutual funds). Valuation adjustments are not applied to Level 1 investments. |
| > | | Level 2 — Valuations based on other significant observable inputs (including quoted prices for similar securities, interest rates, prepayment speeds, credit risks, etc.). |
The accompanying Notes to Financial Statements are an integral part of this statement.
| | |
| |
| | Columbia Global Equity Fund |
Portfolio of Investments (continued)
April 30, 2013 (Unaudited)
Fair Value Measurements (continued)
| > | | Level 3 — Valuations based on significant unobservable inputs (including the Fund’s own assumptions and judgment in determining the fair value of investments). |
Inputs that are used in determining fair value of an investment may include price information, credit data, volatility statistics, and other factors. These inputs can be either observable or unobservable. The availability of observable inputs can vary between investments, and is affected by various factors such as the type of investment, and the volume and level of activity for that investment or similar investments in the marketplace. The inputs will be considered by the Investment Manager, along with any other relevant factors in the calculation of an investment’s fair value. The Fund uses prices and inputs that are current as of the measurement date, which may include periods of market dislocations. During these periods, the availability of prices and inputs may be reduced for many investments. This condition could cause an investment to be reclassified between the various levels within the hierarchy.
Foreign equity securities actively traded in markets where there is a significant delay in the local close relative to the New York Stock Exchange (NYSE) are classified as Level 2. The values of these securities may include an adjustment to reflect the impact of significant market movements following the close of local trading, as described in Note 2 to the financial statements — Security Valuation.
Investments falling into the Level 3 category are primarily supported by quoted prices from brokers and dealers participating in the market for those investments. However, these may be classified as Level 3 investments due to lack of market transparency and corroboration to support these quoted prices. Additionally, valuation models may be used as the pricing source for any remaining investments classified as Level 3. These models may rely on one or more significant unobservable inputs and/or significant assumptions by the Investment Manager. Inputs used in valuations may include, but are not limited to, financial statement analysis, capital account balances, discount rates and estimated cash flows, and comparable company data.
Under the direction of the Fund’s Board of Trustees (the Board), the Investment Manager’s Valuation Committee (the Committee) is responsible for carrying out the valuation procedures approved by the Board. The Committee consists of voting and non-voting members from various groups within the Investment Manager’s organization, including operations and accounting, trading and investments, compliance, risk management and legal.
The Committee meets at least monthly to review and approve valuation matters, which may include a description of specific valuation determinations, data regarding pricing information received from approved pricing vendors and brokers and the results of Board-approved valuation control policies and procedures (the Policies). The Policies address, among other things, instances when market quotations are readily available, including recommendations of third party pricing vendors and a determination of appropriate pricing methodologies; events that require specific valuation determinations and assessment of fair value techniques; securities with a potential for stale pricing, including those that are illiquid, restricted, or in default; and the effectiveness of third- party pricing vendors, including periodic reviews of vendors. The Committee meets more frequently, as needed, to discuss additional valuation matters, which may include the need to review back-testing results, review time-sensitive information or approve related valuation actions. The Committee reports to the Board, with members of the Committee meeting with the Board at each of its regularly scheduled meetings to discuss valuation matters and actions during the period, similar to those described earlier.
For investments categorized as Level 3, the Committee monitors information similar to that described above, which may include: (i) data specific to the issuer or comparable issuers, (ii) general market or specific sector news and (iii) quoted prices and specific or similar security transactions. The Committee considers this data and any changes from prior periods in order to assess the reasonableness of observable and unobservable inputs, any assumptions or internal models used to value those securities and changes in fair value. This data is also used to corroborate, when available, information received from approved pricing vendors and brokers. Various factors impact the frequency of monitoring this information (which may occur as often as daily). However, the Committee may determine that changes to inputs, assumptions and models are not required as a result of the monitoring procedures performed.
The following table is a summary of the inputs used to value the Fund’s investments at April 30, 2013:
| | | | | | | | | | | | | | | | |
| Description | | Level 1
Quoted Prices in Active
Markets for Identical
Assets ($) | | | Level 2
Other Significant
Observable Inputs ($) | | | Level 3
Significant
Unobservable Inputs ($) | | | Total ($) | |
Equity Securities | | | | | | | | | | | | | | | | |
| | | | |
Common Stocks | | | | | | | | | | | | | | | | |
| | | | |
Consumer Discretionary | | | 34,514,243 | | | | 24,001,183 | | | | — | | | | 58,515,426 | |
| | | | |
Consumer Staples | | | 10,477,822 | | | | 27,972,921 | | | | — | | | | 38,450,743 | |
| | | | |
Energy | | | 13,422,283 | | | | 11,496,046 | | | | — | | | | 24,918,329 | |
| | | | |
Financials | | | 35,948,862 | | | | 26,243,519 | | | | — | | | | 62,192,381 | |
| | | | |
Health Care | | | 28,218,904 | | | | 16,031,623 | | | | — | | | | 44,250,527 | |
| | | | |
Industrials | | | 31,208,554 | | | | 16,665,448 | | | | — | | | | 47,874,002 | |
| | | | |
Information Technology | | | 48,905,183 | | | | 11,340,514 | | | | — | | | | 60,245,697 | |
| | | | |
Materials | | | 19,808,110 | | | | 6,074,438 | | | | — | | | | 25,882,548 | |
| | | | |
Telecommunication Services | | | — | | | | 6,257,344 | | | | — | | | | 6,257,344 | |
| | | | | | | | | | | | | | | | | |
Total Equity Securities | | | 222,503,961 | | | | 146,083,036 | | | | — | | | | 368,586,997 | |
| | | | | | | | | | | | | | | | | |
The accompanying Notes to Financial Statements are an integral part of this statement.
| | |
| |
| Columbia Global Equity Fund | | |
Portfolio of Investments (continued)
April 30, 2013 (Unaudited)
Fair Value Measurements (continued)
| | | | | | | | | | | | | | | | |
| Description | | Level 1
Quoted Prices in Active
Markets for Identical
Assets ($) | | | Level 2
Other Significant
Observable Inputs ($) | | | Level 3
Significant
Unobservable Inputs ($) | | | Total ($) | |
Other | | | | | | | | | | | | | | | | |
| | | | |
Limited Partnerships | | | 7,556,262 | | | | — | | | | — | | | | 7,556,262 | |
| | | | |
Money Market Funds | | | 3,391,552 | | | | — | | | | — | | | | 3,391,552 | |
| | | | | | | | | | | | | | | | | |
Total Other | | | 10,947,814 | | | | — | | | | — | | | | 10,947,814 | |
| | | | | | | | | | | | | | | | | |
Total | | | 233,451,775 | | | | 146,083,036 | | | | — | | | | 379,534,811 | |
| | | | | | | | | | | | | | | | | |
See the Portfolio of Investments for all investment classifications not indicated in the table.
The Fund’s assets assigned to the Level 2 input category are generally valued using the market approach, in which a security’s value is determined through reference to prices and information from market transactions for similar or identical assets. These assets include certain foreign securities for which a third party statistical pricing service may be employed for purposes of fair market valuation. The models utilized by the third party statistical pricing service take into account a security’s correlation to available market data including, but not limited to, intraday index, ADR, and ETF movements.
There were no transfers of financial assets between Levels 1 and 2 during the period.
The accompanying Notes to Financial Statements are an integral part of this statement.
| | |
| |
| | Columbia Global Equity Fund |
Statement of Assets and Liabilities
April 30, 2013 (Unaudited)
| | | | |
| |
Assets | | | | |
| |
Investments, at value | | | | |
| |
Unaffiliated issuers (identified cost $308,200,549) | | | $376,143,259 | |
| |
Affiliated issuers (identified cost $3,391,552) | | | 3,391,552 | |
| |
Total investments (identified cost $311,592,101) | | | 379,534,811 | |
| |
Foreign currency (identified cost $145,256) | | | 146,022 | |
| |
Receivable for: | | | | |
| |
Investments sold | | | 1,467,533 | |
| |
Capital shares sold | | | 21,344 | |
| |
Dividends | | | 873,060 | |
| |
Reclaims | | | 465,722 | |
| |
Expense reimbursement due from Investment Manager | | | 478 | |
| |
Prepaid expenses | | | 1,013 | |
| |
Trustees’ deferred compensation plan | | | 23,475 | |
| |
Total assets | | | 382,533,458 | |
| |
| |
Liabilities | | | | |
| |
Payable for: | | | | |
| |
Investments purchased | | | 321 | |
| |
Capital shares purchased | | | 369,475 | |
| |
Investment management fees | | | 8,263 | |
| |
Distribution and/or service fees | | | 3,139 | |
| |
Transfer agent fees | | | 45,325 | |
| |
Administration fees | | | 835 | |
| |
Plan administration fees | | | 41 | |
| |
Compensation of board members | | | 76,467 | |
| |
Other expenses | | | 83,749 | |
| |
Trustees’ deferred compensation plan | | | 23,475 | |
| |
Total liabilities | | | 611,090 | |
| |
Net assets applicable to outstanding capital stock | | | $381,922,368 | |
| |
| |
Represented by | | | | |
| |
Paid-in capital | | | $483,045,643 | |
| |
Excess of distributions over net investment income | | | (293,282 | ) |
| |
Accumulated net realized loss | | | (168,799,796 | ) |
| |
Unrealized appreciation (depreciation) on: | | | | |
| |
Investments | | | 67,942,710 | |
| |
Foreign currency translations | | | 27,093 | |
| |
Total — representing net assets applicable to outstanding capital stock | | | $381,922,368 | |
| |
The accompanying Notes to Financial Statements are an integral part of this statement.
| | |
| 10 | | Semiannual Report 2013 |
| | |
| |
| Columbia Global Equity Fund | | |
Statement of Assets and Liabilities (continued)
April 30, 2013 (Unaudited)
| | | | |
Class A | | | | |
| |
Net assets | | | $344,773,235 | |
| |
Shares outstanding | | | 41,321,212 | |
| |
Net asset value per share | | | $8.34 | |
| |
Maximum offering price per share(a) | | | $8.85 | |
| |
Class B | | | | |
| |
Net assets | | | $11,140,704 | |
| |
Shares outstanding | | | 1,433,424 | |
| |
Net asset value per share | | | $7.77 | |
| |
Class C | | | | |
| |
Net assets | | | $17,405,310 | |
| |
Shares outstanding | | | 2,268,164 | |
| |
Net asset value per share | | | $7.67 | |
| |
Class I | | | | |
| |
Net assets | | | $3,095 | |
| |
Shares outstanding | | | 368 | |
| |
Net asset value per share(b) | | | $8.40 | |
| |
Class K | | | | |
| |
Net assets | | | $5,972,287 | |
| |
Shares outstanding | | | 709,735 | |
| |
Net asset value per share | | | $8.41 | |
| |
Class R | | | | |
| |
Net assets | | | $128,936 | |
| |
Shares outstanding | | | 15,374 | |
| |
Net asset value per share | | | $8.39 | |
| |
Class R5 | | | | |
| |
Net assets | | | $3,093 | |
| |
Shares outstanding | | | 368 | |
| |
Net asset value per share | | | $8.40 | |
| |
Class W | | | | |
| |
Net assets | | | $3,108 | |
| |
Shares outstanding | | | 370 | |
| |
Net asset value per share(b) | | | $8.39 | |
| |
Class Z | | | | |
| |
Net assets | | | $2,492,600 | |
| |
Shares outstanding | | | 296,998 | |
| |
Net asset value per share | | | $8.39 | |
| |
| (a) | The maximum offering price per share is calculated by dividing the net asset value by 1.0 minus the maximum sales charge of 5.75%. |
| (b) | Net asset value per share rounds to this amount due to fractional shares outstanding. |
The accompanying Notes to Financial Statements are an integral part of this statement.
| | | | |
| Semiannual Report 2013 | | | 11 | |
| | |
| |
| | Columbia Global Equity Fund |
Statement of Operations
Six Months Ended April 30, 2013 (Unaudited)
| | | | |
Net investment income | | | | |
Income: | | | | |
Dividends — unaffiliated issuers | | | $4,492,405 | |
Dividends — affiliated issuers | | | 3,442 | |
Interest | | | 14,260 | |
Income from securities lending — net | | | 134 | |
Foreign taxes withheld | | | (287,404 | ) |
| |
Total income | | | 4,222,837 | |
| |
Expenses: | | | | |
Investment management fees | | | 1,469,057 | |
Distribution and/or service fees | | | | |
Class A | | | 418,839 | |
Class B | | | 54,770 | |
Class C | | | 85,456 | |
Class R | | | 269 | |
Class W | | | 4 | |
Transfer agent fees | | | | |
Class A | | | 548,013 | |
Class B | | | 17,916 | |
Class C | | | 27,962 | |
Class K | | | 1,363 | |
Class R | | | 176 | |
Class R5 | | | 1 | |
Class W | | | 5 | |
Class Z | | | 3,991 | |
Administration fees | | | 148,448 | |
Plan administration fees | | | | |
Class K | | | 6,809 | |
Compensation of board members | | | 19,088 | |
Custodian fees | | | 18,150 | |
Printing and postage fees | | | 76,008 | |
Registration fees | | | 49,631 | |
Professional fees | | | 22,782 | |
Other | | | 9,639 | |
| |
Total expenses | | | 2,978,377 | |
Fees waived or expenses reimbursed by Investment Manager and its affiliates | | | (272,589 | ) |
| |
Total net expenses | | | 2,705,788 | |
| |
Net investment income | | | 1,517,049 | |
| |
| |
Realized and unrealized gain (loss) — net | | | | |
Net realized gain (loss) on: | | | | |
Investments | | | 14,952,728 | |
Foreign currency translations | | | 22,508 | |
| |
Net realized gain | | | 14,975,236 | |
Net change in unrealized appreciation (depreciation) on: | | | | |
Investments | | | 33,219,129 | |
Foreign currency translations | | | (20,365 | ) |
| |
Net change in unrealized appreciation (depreciation) | | | 33,198,764 | |
| |
Net realized and unrealized gain | | | 48,174,000 | |
| |
Net increase in net assets resulting from operations | | | $49,691,049 | |
| |
The accompanying Notes to Financial Statements are an integral part of this statement.
| | |
| 12 | | Semiannual Report 2013 |
| | |
| |
| Columbia Global Equity Fund | | |
Statement of Changes in Net Assets
| | | | | | | | |
| | | Six Months Ended
April 30, 2013
(Unaudited) | | | Year Ended
October 31, 2012 | |
Operations | | | | | | | | |
| | |
Net investment income | | | $1,517,049 | | | | $2,743,410 | |
| | |
Net realized gain | | | 14,975,236 | | | | 5,108,675 | |
| | |
Net change in unrealized appreciation (depreciation) | | | 33,198,764 | | | | 17,262,528 | |
| |
Net increase in net assets resulting from operations | | | 49,691,049 | | | | 25,114,613 | |
| |
| | |
Distributions to shareholders | | | | | | | | |
| | |
Net investment income | | | | | | | | |
| | |
Class A | | | (4,113,962 | ) | | | (967,038 | ) |
| | |
Class B | | | (38,557 | ) | | | — | |
| | |
Class C | | | (86,094 | ) | | | — | |
| | |
Class I | | | (48 | ) | | | (17 | ) |
| | |
Class K | | | (72,812 | ) | | | (18,326 | ) |
| | |
Class R | | | (1,245 | ) | | | (53 | ) |
| | |
Class R5 | | | (47 | ) | | | (17 | ) |
| | |
Class W | | | (37 | ) | | | — | |
| | |
Class Z | | | (37,305 | ) | | | (15,014 | ) |
| |
Total distributions to shareholders | | | (4,350,107 | ) | | | (1,000,465 | ) |
| |
Increase (decrease) in net assets from capital stock activity | | | (32,598,310 | ) | | | (89,704,617 | ) |
| |
Proceeds from regulatory settlements (Note 6) | | | — | | | | 444,107 | |
| |
Total increase (decrease) in net assets | | | 12,742,632 | | | | (65,146,362 | ) |
| | |
Net assets at beginning of period | | | 369,179,736 | | | | 434,326,098 | |
| |
Net assets at end of period | | | $381,922,368 | | | | $369,179,736 | |
| |
Undistributed (excess of distributions over) net investment income | | | $(293,282 | ) | | | $2,539,776 | |
| |
The accompanying Notes to Financial Statements are an integral part of this statement.
| | | | |
| Semiannual Report 2013 | | | 13 | |
| | |
| |
| | Columbia Global Equity Fund |
Statement of Changes in Net Assets (continued)
| | | | | | | | | | | | | | | | |
| | | Six Months Ended
April 30, 2013 (Unaudited) | | | Year Ended October 31, 2012 | |
| | | Shares | | | Dollars ($) | | | Shares | | | Dollars ($) | |
Capital stock activity | | | | | | | | | | | | | | | | |
| | | | |
Class A shares | | | | | | | | | | | | | | | | |
| | | | |
Subscriptions(a) | | | 836,073 | | | | 6,570,395 | | | | 2,280,396 | | | | 16,181,626 | |
| | | | |
Distributions reinvested | | | 520,304 | | | | 3,990,734 | | | | 137,922 | | | | 911,662 | |
| | | | |
Redemptions | | | (5,104,704 | ) | | | (39,834,835 | ) | | | (13,137,573 | ) | | | (93,897,107 | ) |
| |
Net decrease | | | (3,748,327 | ) | | | (29,273,706 | ) | | | (10,719,255 | ) | | | (76,803,819 | ) |
| |
Class B shares | | | | | | | | | | | | | | | | |
| | | | |
Subscriptions | | | 21,881 | | | | 161,275 | | | | 38,926 | | | | 258,507 | |
| | | | |
Distributions reinvested | | | 5,339 | | | | 38,228 | | | | — | | | | — | |
| | | | |
Redemptions(a) | | | (196,187 | ) | | | (1,430,252 | ) | | | (1,117,326 | ) | | | (7,315,461 | ) |
| |
Net decrease | | | (168,967 | ) | | | (1,230,749 | ) | | | (1,078,400 | ) | | | (7,056,954 | ) |
| |
Class C shares | | | | | | | | | | | | | | | | |
| | | | |
Subscriptions | | | 66,961 | | | | 485,744 | | | | 124,579 | | | | 820,073 | |
| | | | |
Distributions reinvested | | | 10,028 | | | | 70,901 | | | | — | | | | — | |
| | | | |
Redemptions | | | (393,936 | ) | | | (2,807,927 | ) | | | (908,300 | ) | | | (5,969,340 | ) |
| |
Net decrease | | | (316,947 | ) | | | (2,251,282 | ) | | | (783,721 | ) | | | (5,149,267 | ) |
| |
Class K shares | | | | | | | | | | | | | | | | |
| | | | |
Subscriptions | | | 83,819 | | | | 670,847 | | | | 133,607 | | | | 950,181 | |
| | | | |
Distributions reinvested | | | 9,414 | | | | 72,772 | | | | 2,750 | | | | 18,316 | |
| | | | |
Redemptions | | | (57,779 | ) | | | (454,641 | ) | | | (121,743 | ) | | | (864,349 | ) |
| |
Net increase | | | 35,454 | | | | 288,978 | | | | 14,614 | | | | 104,148 | |
| |
Class R shares | | | | | | | | | | | | | | | | |
| | | | |
Subscriptions | | | 7,761 | | | | 60,016 | | | | 1,140 | | | | 8,153 | |
| | | | |
Distributions reinvested | | | 102 | | | | 787 | | | | 7 | | | | 47 | |
| | | | |
Redemptions | | | (975 | ) | | | (7,897 | ) | | | (2,715 | ) | | | (20,039 | ) |
| |
Net increase (decrease) | | | 6,888 | | | | 52,906 | | | | (1,568 | ) | | | (11,839 | ) |
| |
Class W shares | | | | | | | | | | | | | | | | |
| | | | |
Redemptions | | | — | | | | — | | | | (1 | ) | | | (1 | ) |
| |
Net decrease | | | — | | | | — | | | | (1 | ) | | | (1 | ) |
| |
Class Z shares | | | | | | | | | | | | | | | | |
| | | | |
Subscriptions | | | 51,422 | | | | 398,789 | | | | 82,107 | | | | 593,927 | |
| | | | |
Distributions reinvested | | | 3,260 | | | | 25,099 | | | | 1,443 | | | | 9,583 | |
| | | | |
Redemptions | | | (78,209 | ) | | | (608,345 | ) | | | (192,042 | ) | | | (1,390,395 | ) |
| |
Net decrease | | | (23,527 | ) | | | (184,457 | ) | | | (108,492 | ) | | | (786,885 | ) |
| |
Total net decrease | | | (4,215,426 | ) | | | (32,598,310 | ) | | | (12,676,823 | ) | | | (89,704,617 | ) |
| |
| (a) | Includes conversions of Class B shares to Class A shares, if any. |
The accompanying Notes to Financial Statements are an integral part of this statement.
| | |
| 14 | | Semiannual Report 2013 |
| | |
| |
| Columbia Global Equity Fund | | |
Financial Highlights
The following tables are intended to help you understand the Fund’s financial performance. Certain information reflects financial results for a single share of a class held for the periods shown. Per share net investment income (loss) amounts are calculated based on average shares outstanding during the period. Total return assumes reinvestment of all dividends and distributions, if any. Total return does not reflect payment of sales charges, if any, and is not annualized for periods of less than one year.
| | | | | | | | | | | | | | | | | | | | | | | | |
| |
| Six Months Ended
April 30, 2013 |
| | | Year Ended October 31, | |
Class A | | | (Unaudited) | | | | 2012 | | | | 2011 | | | | 2010 | | | | 2009 | | | | 2008 | |
Per share data | | | | | | | | | | | | | | | | | | | | | | | | |
Net asset value, beginning of period | | | $7.39 | | | | $6.95 | | | | $7.07 | | | | $6.13 | | | | $5.21 | | | | $9.61 | |
| | | | | | | | | | | | | | | | | | | | | | | | | |
Income from investment operations: | | | | | | | | | | | | | | | | | | | | | | | | |
| | | | | | |
Net investment income | | | 0.03 | | | | 0.05 | | | | 0.01 | | | | 0.00 | (a) | | | 0.05 | | | | 0.05 | |
| | | | | | | | | | | | | | | | | | | | | | | | | |
Net realized and unrealized gain (loss) | | | 1.01 | | | | 0.40 | | | | (0.11 | ) | | | 0.96 | | | | 0.95 | | | | (4.41 | ) |
| | | | | | | | | | | | | | | | | | | | | | | | | |
Total from investment operations | | | 1.04 | | | | 0.45 | | | | (0.10 | ) | | | 0.96 | | | | 1.00 | | | | (4.36 | ) |
| | | | | | | | | | | | | | | | | | | | | | | | | |
Less distributions to shareholders: | | | | | | | | | | | | | | | | | | | | | | | | |
| | | | | | |
Net investment income | | | (0.09 | ) | | | (0.02 | ) | | | (0.02 | ) | | | (0.03 | ) | | | (0.08 | ) | | | (0.04 | ) |
| | | | | | | | | | | | | | | | | | | | | | | | | |
Total distributions to shareholders | | | (0.09 | ) | | | (0.02 | ) | | | (0.02 | ) | | | (0.03 | ) | | | (0.08 | ) | | | (0.04 | ) |
| | | | | | | | | | | | | | | | | | | | | | | | | |
Proceeds from regulatory settlements | | | — | | | | 0.01 | | | | — | | | | 0.01 | | | | 0.00 | (a) | | | — | |
| | | | | | | | | | | | | | | | | | | | | | | | | |
Net asset value, end of period | | | $8.34 | | | | $7.39 | | | | $6.95 | | | | $7.07 | | | | $6.13 | | | | $5.21 | |
| | | | | | | | | | | | | | | | | | | | | | | | | |
Total return | | | 14.25 | % | | | 6.62 | %(b) | | | (1.40 | %) | | | 15.78 | %(c) | | | 19.39 | %(d) | | | (45.55 | %) |
| | | | | | | | | | | | | | | | | | | | | | | | | |
Ratios to average net assets(e) | | | | | | | | | | | | | | | | | | | | | | | | |
| | | | | | |
Total gross expenses | | | 1.55 | %(f) | | | 1.51 | % | | | 1.46 | % | | | 1.45 | % | | | 1.44 | % | | | 1.46 | % |
| | | | | | | | | | | | | | | | | | | | | | | | | |
Total net expenses(g) | | | 1.40 | %(f) | | | 1.36 | %(h) | | | 1.36 | %(h) | | | 1.45 | % | | | 1.44 | % | | | 1.46 | % |
| | | | | | | | | | | | | | | | | | | | | | | | | |
Net investment income | | | 0.87 | %(f) | | | 0.75 | % | | | 0.18 | % | | | 0.03 | % | | | 0.92 | % | | | 0.65 | % |
| | | | | | | | | | | | | | | | | | | | | | | | | |
Supplemental data | | | | | | | | | | | | | | | | | | | | | | | | |
| | | | | | |
Net assets, end of period (in thousands) | | | $344,773 | | | | $333,196 | | | | $387,709 | | | | $375,169 | | | | $394,511 | | | | $380,430 | |
| | | | | | | | | | | | | | | | | | | | | | | | | |
Portfolio turnover | | | 19 | % | | | 50 | % | | | 44 | % | | | 54 | % | | | 81 | % | | | 97 | % |
| | | | | | | | | | | | | | | | | | | | | | | | | |
Notes to Financial Highlights
| (b) | The Fund received proceeds from regulatory settlements. Had the Fund not received these proceeds, the total return would have been lower by 0.11%. |
| (c) | The Fund received proceeds from regulatory settlements. Had the Fund not received these proceeds, the total return would have been lower by 0.09%. |
| (d) | The Fund received proceeds from regulatory settlements. Had the Fund not received these proceeds, the total return would have been lower by 0.02%. |
| (e) | In addition to the fees and expenses which the Fund bears directly, the Fund indirectly bears a pro rata share of the fees and expenses of the acquired funds in which it invests. Such indirect expenses are not included in the reported expense ratios. |
| (g) | Total net expenses include the impact of certain waivers/reimbursements made by the Investment Manager and certain of its affiliates, if applicable. |
| (h) | The benefits derived from expense reductions had an impact of less than 0.01%. |
The accompanying Notes to Financial Statements are an integral part of this statement.
| | | | |
| Semiannual Report 2013 | | | 15 | |
| | |
| |
| | Columbia Global Equity Fund |
Financial Highlights (continued)
| | | | | | | | | | | | | | | | | | | | | | | | |
| |
| Six Months Ended
April 30, 2013 |
| | | Year Ended October 31, | |
Class B | | | (Unaudited) | | | | 2012 | | | | 2011 | | | | 2010 | | | | 2009 | | | | 2008 | |
Per share data | | | | | | | | | | | | | | | | | | | | | | | | |
Net asset value, beginning of period | | | $6.85 | | | | $6.47 | | | | $6.63 | | | | $5.77 | | | | $4.87 | | | | $9.02 | |
| | | | | | | | | | | | | | | | | | | | | | | | | |
Income from investment operations: | | | | | | | | | | | | | | | | | | | | | | | | |
| | | | | | |
Net investment income (loss) | | | 0.00 | (a) | | | 0.00 | (a) | | | (0.04 | ) | | | (0.04 | ) | | | 0.01 | | | | (0.01 | ) |
| | | | | | | | | | | | | | | | | | | | | | | | | |
Net realized and unrealized gain (loss) | | | 0.95 | | | | 0.37 | | | | (0.11 | ) | | | 0.90 | | | | 0.89 | | | | (4.14 | ) |
| | | | | | | | | | | | | | | | | | | | | | | | | |
Total from investment operations | | | 0.95 | | | | 0.37 | | | | (0.15 | ) | | | 0.86 | | | | 0.90 | | | | (4.15 | ) |
| | | | | | | | | | | | | | | | | | | | | | | | | |
Less distributions to shareholders: | | | | | | | | | | | | | | | | | | | | | | | | |
| | | | | | |
Net investment income | | | (0.03 | ) | | | — | | | | (0.01 | ) | | | (0.01 | ) | | | — | | | | — | |
| | | | | | | | | | | | | | | | | | | | | | | | | |
Total distributions to shareholders | | | (0.03 | ) | | | — | | | | (0.01 | ) | | | (0.01 | ) | | | — | | | | — | |
| | | | | | | | | | | | | | | | | | | | | | | | | |
Proceeds from regulatory settlements | | | — | | | | 0.01 | | | | — | | | | 0.01 | | | | 0.00 | (a) | | | — | |
| | | | | | | | | | | | | | | | | | | | | | | | | |
Net asset value, end of period | | | $7.77 | | | | $6.85 | | | | $6.47 | | | | $6.63 | | | | $5.77 | | | | $4.87 | |
| | | | | | | | | | | | | | | | | | | | | | | | | |
Total return | | | 13.83 | % | | | 5.87 | %(b) | | | (2.26 | %) | | | 15.03 | %(c) | | | 18.48 | %(d) | | | (46.01 | %) |
| | | | | | | | | | | | | | | | | | | | | | | | | |
Ratios to average net assets(e) | | | | | | | | | | | | | | | | | | | | | | | | |
| | | | | | |
Total gross expenses | | | 2.30 | %(f) | | | 2.26 | % | | | 2.22 | % | | | 2.21 | % | | | 2.21 | % | | | 2.23 | % |
| | | | | | | | | | | | | | | | | | | | | | | | | |
Total net expenses(g) | | | 2.15 | %(f) | | | 2.11 | %(h) | | | 2.12 | %(h) | | | 2.21 | % | | | 2.21 | % | | | 2.23 | % |
| | | | | | | | | | | | | | | | | | | | | | | | | |
Net investment income (loss) | | | 0.12 | %(f) | | | 0.02 | % | | | (0.56 | %) | | | (0.69 | %) | | | 0.22 | % | | | (0.11 | %) |
| | | | | | | | | | | | | | | | | | | | | | | | | |
Supplemental data | | | | | | | | | | | | | | | | | | | | | | | | |
| | | | | | |
Net assets, end of period (in thousands) | | | $11,141 | | | | $10,979 | | | | $17,347 | | | | $23,894 | | | | $33,009 | | | | $42,166 | |
| | | | | | | | | | | | | | | | | | | | | | | | | |
Portfolio turnover | | | 19 | % | | | 50 | % | | | 44 | % | | | 54 | % | | | 81 | % | | | 97 | % |
| | | | | | | | | | | | | | | | | | | | | | | | | |
Notes to Financial Highlights
| (b) | The Fund received proceeds from regulatory settlements. Had the Fund not received these proceeds, the total return would have been lower by 0.11%. |
| (c) | The Fund received proceeds from regulatory settlements. Had the Fund not received these proceeds, the total return would have been lower by 0.09%. |
| (d) | The Fund received proceeds from regulatory settlements. Had the Fund not received these proceeds, the total return would have been lower by 0.02%. |
| (e) | In addition to the fees and expenses which the Fund bears directly, the Fund indirectly bears a pro rata share of the fees and expenses of the acquired funds in which it invests. Such indirect expenses are not included in the reported expense ratios. |
| (g) | Total net expenses include the impact of certain waivers/reimbursements made by the Investment Manager and certain of its affiliates, if applicable. |
| (h) | The benefits derived from expense reductions had an impact of less than 0.01%. |
The accompanying Notes to Financial Statements are an integral part of this statement.
| | |
| 16 | | Semiannual Report 2013 |
| | |
| |
| Columbia Global Equity Fund | | |
Financial Highlights (continued)
| | | | | | | | | | | | | | | | | | | | | | | | |
| |
| Six Months Ended
April 30, 2013 |
| | | Year Ended October 31, | |
Class C | | | (Unaudited) | | | | 2012 | | | | 2011 | | | | 2010 | | | | 2009 | | | | 2008 | |
Per share data | | | | | | | | | | | | | | | | | | | | | | | | |
Net asset value, beginning of period | | | $6.78 | | | | $6.40 | | | | $6.55 | | | | $5.71 | | | | $4.83 | | | | $8.93 | |
| | | | | | | | | | | | | | | | | | | | | | | | | |
Income from investment operations: | | | | | | | | | | | | | | | | | | | | | | | | |
| | | | | | |
Net investment income (loss) | | | 0.00 | (a) | | | (0.00 | )(a) | | | (0.04 | ) | | | (0.04 | ) | | | (0.00 | )(a) | | | (0.01 | ) |
| | | | | | | | | | | | | | | | | | | | | | | | | |
Net realized and unrealized gain (loss) | | | 0.93 | | | | 0.37 | | | | (0.10 | ) | | | 0.88 | | | | 0.89 | | | | (4.09 | ) |
| | | | | | | | | | | | | | | | | | | | | | | | | |
Total from investment operations | | | 0.93 | | | | 0.37 | | | | (0.14 | ) | | | 0.84 | | | | 0.89 | | | | (4.10 | ) |
| | | | | | | | | | | | | | | | | | | | | | | | | |
Less distributions to shareholders: | | | | | | | | | | | | | | | | | | | | | | | | |
| | | | | | |
Net investment income | | | (0.04 | ) | | | — | | | | (0.01 | ) | | | (0.01 | ) | | | (0.01 | ) | | | — | |
| | | | | | | | | | | | | | | | | | | | | | | | | |
Total distributions to shareholders | | | (0.04 | ) | | | — | | | | (0.01 | ) | | | (0.01 | ) | | | (0.01 | ) | | | — | |
| | | | | | | | | | | | | | | | | | | | | | | | | |
Proceeds from regulatory settlements | | | — | | | | 0.01 | | | | — | | | | 0.01 | | | | 0.00 | (a) | | | — | |
| | | | | | | | | | | | | | | | | | | | | | | | | |
Net asset value, end of period | | | $7.67 | | | | $6.78 | | | | $6.40 | | | | $6.55 | | | | $5.71 | | | | $4.83 | |
| | | | | | | | | | | | | | | | | | | | | | | | | |
Total return | | | 13.70 | % | | | 5.94 | %(b) | | | (2.14 | %) | | | 14.86 | %(c) | | | 18.39 | %(d) | | | (45.91 | %) |
| | | | | | | | | | | | | | | | | | | | | | | | | |
Ratios to average net assets(e) | | | | | | | | | | | | | | | | | | | | | | | | |
| | | | | | |
Total gross expenses | | | 2.30 | %(f) | | | 2.25 | % | | | 2.22 | % | | | 2.21 | % | | | 2.20 | % | | | 2.22 | % |
| | | | | | | | | | | | | | | | | | | | | | | | | |
Total net expenses(g) | | | 2.15 | %(f) | | | 2.11 | %(h) | | | 2.11 | %(h) | | | 2.21 | % | | | 2.20 | % | | | 2.22 | % |
| | | | | | | | | | | | | | | | | | | | | | | | | |
Net investment income (loss) | | | 0.13 | %(f) | | | (0.00 | %)(a) | | | (0.62 | %) | | | (0.72 | %) | | | (0.08 | %) | | | (0.09 | %) |
| | | | | | | | | | | | | | | | | | | | | | | | | |
Supplemental data | | | | | | | | | | | | | | | | | | | | | | | | |
| | | | | | |
Net assets, end of period (in thousands) | | | $17,405 | | | | $17,516 | | | | $21,560 | | | | $10,147 | | | | $10,570 | | | | $4,755 | |
| | | | | | | | | | | | | | | | | | | | | | | | | |
Portfolio turnover | | | 19 | % | | | 50 | % | | | 44 | % | | | 54 | % | | | 81 | % | | | 97 | % |
| | | | | | | | | | | | | | | | | | | | | | | | | |
Notes to Financial Highlights
| (b) | The Fund received proceeds from regulatory settlements. Had the Fund not received these proceeds, the total return would have been lower by 0.11%. |
| (c) | The Fund received proceeds from regulatory settlements. Had the Fund not received these proceeds, the total return would have been lower by 0.09%. |
| (d) | The Fund received proceeds from regulatory settlements. Had the Fund not received these proceeds, the total return would have been lower by 0.02%. |
| (e) | In addition to the fees and expenses which the Fund bears directly, the Fund indirectly bears a pro rata share of the fees and expenses of the acquired funds in which it invests. Such indirect expenses are not included in the reported expense ratios. |
| (g) | Total net expenses include the impact of certain waivers/reimbursements made by the Investment Manager and certain of its affiliates, if applicable. |
| (h) | The benefits derived from expense reductions had an impact of less than 0.01%. |
The accompanying Notes to Financial Statements are an integral part of this statement.
| | | | |
| Semiannual Report 2013 | | | 17 | |
| | |
| |
| | Columbia Global Equity Fund |
Financial Highlights (continued)
| | | | | | | | | | | | | | | | | | | | | | | | |
| |
| Six Months Ended
April 30, 2013 |
| | | Year Ended October 31, | |
Class I | | | (Unaudited) | | | | 2012 | | | | 2011 | | | | 2010 | | | | 2009 | | | | 2008(a) | |
Per share data | | | | | | | | | | | | | | | | | | | | | | | | |
Net asset value, beginning of period | | | $7.46 | | | | $7.01 | | | | $7.11 | | | | $6.16 | | | | $5.25 | | | | $7.47 | |
| | | | | | | | | | | | | | | | | | | | | | | | | |
Income from investment operations: | | | | | | | | | | | | | | | | | | | | | | | | |
| | | | | | |
Net investment income | | | 0.05 | | | | 0.09 | | | | 0.01 | | | | 0.04 | | | | 0.09 | | | | 0.03 | |
| | | | | | | | | | | | | | | | | | | | | | | | | |
Net realized and unrealized gain (loss) | | | 1.02 | | | | 0.40 | | | | (0.08 | ) | | | 0.95 | | | | 0.95 | | | | (2.25 | ) |
| | | | | | | | | | | | | | | | | | | | | | | | | |
Total from investment operations | | | 1.07 | | | | 0.49 | | | | (0.07 | ) | | | 0.99 | | | | 1.04 | | | | (2.22 | ) |
| | | | | | | | | | | | | | | | | | | | | | | | | |
Less distributions to shareholders: | | | | | | | | | | | | | | | | | | | | | | | | |
| | | | | | |
Net investment income | | | (0.13 | ) | | | (0.05 | ) | | | (0.03 | ) | | | (0.05 | ) | | | (0.13 | ) | | | — | |
| | | | | | | | | | | | | | | | | | | | | | | | | |
Total distributions to shareholders | | | (0.13 | ) | | | (0.05 | ) | | | (0.03 | ) | | | (0.05 | ) | | | (0.13 | ) | | | — | |
| | | | | | | | | | | | | | | | | | | | | | | | | |
Proceeds from regulatory settlements | | | — | | | | 0.01 | | | | — | | | | 0.01 | | | | 0.00 | (b) | | | — | |
| | | | | | | | | | | | | | | | | | | | | | | | | |
Net asset value, end of period | | | $8.40 | | | | $7.46 | | | | $7.01 | | | | $7.11 | | | | $6.16 | | | | $5.25 | |
| | | | | | | | | | | | | | | | | | | | | | | | | |
Total return | | | 14.52 | % | | | 7.15 | %(c) | | | (0.98 | %) | | | 16.32 | %(d) | | | 20.21 | %(e) | | | (29.72 | %) |
| | | | | | | | | | | | | | | | | | | | | | | | | |
Ratios to average net assets(f) | | | | | | | | | | | | | | | | | | | | | | | | |
| | | | | | |
Total gross expenses | | | 1.00 | %(g) | | | 1.02 | % | | | 0.93 | % | | | 0.91 | % | | | 0.84 | % | | | 0.85 | %(g) |
| | | | | | | | | | | | | | | | | | | | | | | | | |
Total net expenses(h) | | | 0.93 | %(g) | | | 0.91 | % | | | 0.92 | % | | | 0.91 | % | | | 0.84 | % | | | 0.85 | %(g) |
| | | | | | | | | | | | | | | | | | | | | | | | | |
Net investment income | | | 1.35 | %(g) | | | 1.20 | % | | | 0.15 | % | | | 0.55 | % | | | 1.56 | % | | | 1.55 | %(g) |
| | | | | | | | | | | | | | | | | | | | | | | | | |
Supplemental data | | | | | | | | | | | | | | | | | | | | | | | | |
| | | | | | |
Net assets, end of period (in thousands) | | | $3 | | | | $3 | | | | $3 | | | | $31,015 | | | | $32,596 | | | | $3 | |
| | | | | | | | | | | | | | | | | | | | | | | | | |
Portfolio turnover | | | 19 | % | | | 50 | % | | | 44 | % | | | 54 | % | | | 81 | % | | | 97 | % |
| | | | | | | | | | | | | | | | | | | | | | | | | |
Notes to Financial Highlights
| (a) | For the period from August 1, 2008 (commencement of operations) to October 31, 2008. |
| (c) | The Fund received proceeds from regulatory settlements. Had the Fund not received these proceeds, the total return would have been lower by 0.11%. |
| (d) | The Fund received proceeds from regulatory settlements. Had the Fund not received these proceeds, the total return would have been lower by 0.09%. |
| (e) | The Fund received proceeds from regulatory settlements. Had the Fund not received these proceeds, the total return would have been lower by 0.02%. |
| (f) | In addition to the fees and expenses which the Fund bears directly, the Fund indirectly bears a pro rata share of the fees and expenses of the acquired funds in which it invests. Such indirect expenses are not included in the reported expense ratios. |
| (h) | Total net expenses include the impact of certain waivers/reimbursements made by the Investment Manager and certain of its affiliates, if applicable. |
The accompanying Notes to Financial Statements are an integral part of this statement.
| | |
| 18 | | Semiannual Report 2013 |
| | |
| |
| Columbia Global Equity Fund | | |
Financial Highlights (continued)
| | | | | | | | | | | | | | | | | | | | | | | | |
| |
| Six Months Ended
April 30, 2013 |
| | | Year Ended October 31, | |
Class K | | | (Unaudited) | | | | 2012 | | | | 2011 | | | | 2010 | | | | 2009 | | | | 2008 | |
Per share data | | | | | | | | | | | | | | | | | | | | | | | | |
Net asset value, beginning of period | | | $7.46 | | | | $7.01 | | | | $7.13 | | | | $6.18 | | | | $5.26 | | | | $9.70 | |
| | | | | | | | | | | | | | | | | | | | | | | | | |
Income from investment operations: | | | | | | | | | | | | | | | | | | | | | | | | |
| | | | | | |
Net investment income | | | 0.04 | | | | 0.07 | | | | 0.02 | | | | 0.02 | | | | 0.06 | | | | 0.07 | |
| | | | | | | | | | | | | | | | | | | | | | | | | |
Net realized and unrealized gain (loss) | | | 1.02 | | | | 0.40 | | | | (0.11 | ) | | | 0.96 | | | | 0.96 | | | | (4.46 | ) |
| | | | | | | | | | | | | | | | | | | | | | | | | |
Total from investment operations | | | 1.06 | | | | 0.47 | | | | (0.09 | ) | | | 0.98 | | | | 1.02 | | | | (4.39 | ) |
| | | | | | | | | | | | | | | | | | | | | | | | | |
Less distributions to shareholders: | | | | | | | | | | | | | | | | | | | | | | | | |
| | | | | | |
Net investment income | | | (0.11 | ) | | | (0.03 | ) | | | (0.03 | ) | | | (0.04 | ) | | | (0.10 | ) | | | (0.05 | ) |
| | | | | | | | | | | | | | | | | | | | | | | | | |
Total distributions to shareholders | | | (0.11 | ) | | | (0.03 | ) | | | (0.03 | ) | | | (0.04 | ) | | | (0.10 | ) | | | (0.05 | ) |
| | | | | | | | | | | | | | | | | | | | | | | | | |
Proceeds from regulatory settlements | | | — | | | | 0.01 | | | | — | | | | 0.01 | | | | 0.00 | (a) | | | — | |
| | | | | | | | | | | | | | | | | | | | | | | | | |
Net asset value, end of period | | | $8.41 | | | | $7.46 | | | | $7.01 | | | | $7.13 | | | | $6.18 | | | | $5.26 | |
| | | | | | | | | | | | | | | | | | | | | | | | | |
Total return | | | 14.32 | % | | | 6.87 | %(b) | | | (1.33 | %) | | | 16.03 | %(c) | | | 19.72 | %(d) | | | (45.47 | %) |
| | | | | | | | | | | | | | | | | | | | | | | | | |
Ratios to average net assets(e) | | | | | | | | | | | | | | | | | | | | | | | | |
| | | | | | |
Total gross expenses | | | 1.28 | %(f) | | | 1.28 | % | | | 1.24 | % | | | 1.21 | % | | | 1.15 | % | | | 1.29 | % |
| | | | | | | | | | | | | | | | | | | | | | | | | |
Total net expenses(g) | | | 1.24 | %(f) | | | 1.21 | % | | | 1.17 | % | | | 1.21 | % | | | 1.15 | % | | | 1.28 | % |
| | | | | | | | | | | | | | | | | | | | | | | | | |
Net investment income | | | 1.04 | %(f) | | | 0.90 | % | | | 0.32 | % | | | 0.27 | % | | | 1.22 | % | | | 0.83 | % |
| | | | | | | | | | | | | | | | | | | | | | | | | |
Supplemental data | | | | | | | | | | | | | | | | | | | | | | | | |
| | | | | | |
Net assets, end of period (in thousands) | | | $5,972 | | | | $5,032 | | | | $4,627 | | | | $7,016 | | | | $6,059 | | | | $5,067 | |
| | | | | | | | | | | | | | | | | | | | | | | | | |
Portfolio turnover | | | 19 | % | | | 50 | % | | | 44 | % | | | 54 | % | | | 81 | % | | | 97 | % |
| | | | | | | | | | | | | | | | | | | | | | | | | |
Notes to Financial Highlights
| (b) | The Fund received proceeds from regulatory settlements. Had the Fund not received these proceeds, the total return would have been lower by 0.11%. |
| (c) | The Fund received proceeds from regulatory settlements. Had the Fund not received these proceeds, the total return would have been lower by 0.09%. |
| (d) | The Fund received proceeds from regulatory settlements. Had the Fund not received these proceeds, the total return would have been lower by 0.02%. |
| (e) | In addition to the fees and expenses which the Fund bears directly, the Fund indirectly bears a pro rata share of the fees and expenses of the acquired funds in which it invests. Such indirect expenses are not included in the reported expense ratios. |
| (g) | Total net expenses include the impact of certain waivers/reimbursements made by the Investment Manager and certain of its affiliates, if applicable. |
The accompanying Notes to Financial Statements are an integral part of this statement.
| | | | |
| Semiannual Report 2013 | | | 19 | |
| | |
| |
| | Columbia Global Equity Fund |
Financial Highlights (continued)
| | | | | | | | | | | | | | | | | | | | | | | | |
| |
| Six Months Ended
April 30, 2013 |
| | | Year Ended October 31, | |
Class R | | | (Unaudited) | | | | 2012 | | | | 2011 | | | | 2010 | | | | 2009 | | | | 2008 | |
Per share data | | | | | | | | | | | | | | | | | | | | | | | | |
Net asset value, beginning of period | | | $7.44 | | | | $7.00 | | | | $7.14 | | | | $6.14 | | | | $5.23 | | | | $9.62 | |
| | | | | | | | | | | | | | | | | | | | | | | | | |
Income from investment operations: | | | | | | | | | | | | | | | | | | | | | | | | |
| | | | | | |
Net investment income (loss) | | | 0.03 | | | | 0.03 | | | | (0.00 | )(a) | | | (0.02 | ) | | | (0.01 | ) | | | 0.05 | |
| | | | | | | | | | | | | | | | | | | | | | | | | |
Net realized and unrealized gain (loss) | | | 1.02 | | | | 0.41 | | | | (0.12 | ) | | | 1.01 | | | | 1.00 | | | | (4.42 | ) |
| | | | | | | | | | | | | | | | | | | | | | | | | |
Total from investment operations | | | 1.05 | | | | 0.44 | | | | (0.12 | ) | | | 0.99 | | | | 0.99 | | | | (4.37 | ) |
| | | | | | | | | | | | | | | | | | | | | | | | | |
Less distributions to shareholders: | | | | | | | | | | | | | | | | | | | | | | | | |
| | | | | | |
Net investment income | | | (0.10 | ) | | | (0.01 | ) | | | (0.02 | ) | | | — | | | | (0.08 | ) | | | (0.02 | ) |
| | | | | | | | | | | | | | | | | | | | | | | | | |
Total distributions to shareholders | | | (0.10 | ) | | | (0.01 | ) | | | (0.02 | ) | | | — | | | | (0.08 | ) | | | (0.02 | ) |
| | | | | | | | | | | | | | | | | | | | | | | | | |
Proceeds from regulatory settlements | | | — | | | | 0.01 | | | | — | | | | 0.01 | | | | 0.00 | (a) | | | — | |
| | | | | | | | | | | | | | | | | | | | | | | | | |
Net asset value, end of period | | | $8.39 | | | | $7.44 | | | | $7.00 | | | | $7.14 | | | | $6.14 | | | | $5.23 | |
| | | | | | | | | | | | | | | | | | | | | | | | | |
Total return | | | 14.16 | % | | | 6.37 | %(b) | | | (1.70 | %) | | | 16.29 | %(c) | | | 19.13 | %(d) | | | (45.48 | %) |
| | | | | | | | | | | | | | | | | | | | | | | | | |
Ratios to average net assets(e) | | | | | | | | | | | | | | | | | | | | | | | | |
| | | | | | |
Total gross expenses | | | 1.80 | %(f) | | | 1.76 | % | | | 1.72 | % | | | 1.71 | % | | | 1.69 | % | | | 1.79 | % |
| | | | | | | | | | | | | | | | | | | | | | | | | |
Total net expenses(g) | | | 1.66 | %(f) | | | 1.61 | %(h) | | | 1.61 | %(h) | | | 1.71 | % | | | 1.69 | % | | | 1.54 | % |
| | | | | | | | | | | | | | | | | | | | | | | | | |
Net investment income (loss) | | | 0.64 | %(f) | | | 0.48 | % | | | (0.01 | %) | | | (0.24 | %) | | | (0.16 | %) | | | 0.57 | % |
| | | | | | | | | | | | | | | | | | | | | | | | | |
Supplemental data | | | | | | | | | | | | | | | | | | | | | | | | |
| | | | | | |
Net assets, end of period (in thousands) | | | $129 | | | | $63 | | | | $70 | | | | $41 | | | | $46 | | | | $3 | |
| | | | | | | | | | | | | | | | | | | | | | | | | |
Portfolio turnover | | | 19 | % | | | 50 | % | | | 44 | % | | | 54 | % | | | 81 | % | | | 97 | % |
| | | | | | | | | | | | | | | | | | | | | | | | | |
Notes to Financial Highlights
| (b) | The Fund received proceeds from regulatory settlements. Had the Fund not received these proceeds, the total return would have been lower by 0.11%. |
| (c) | The Fund received proceeds from regulatory settlements. Had the Fund not received these proceeds, the total return would have been lower by 0.09%. |
| (d) | The Fund received proceeds from regulatory settlements. Had the Fund not received these proceeds, the total return would have been lower by 0.02%. |
| (e) | In addition to the fees and expenses which the Fund bears directly, the Fund indirectly bears a pro rata share of the fees and expenses of the acquired funds in which it invests. Such indirect expenses are not included in the reported expense ratios. |
| (g) | Total net expenses include the impact of certain waivers/reimbursements made by the Investment Manager and certain of its affiliates, if applicable. |
| (h) | The benefits derived from expense reductions had an impact of less than 0.01%. |
The accompanying Notes to Financial Statements are an integral part of this statement.
| | |
| 20 | | Semiannual Report 2013 |
| | |
| |
| Columbia Global Equity Fund | | |
Financial Highlights (continued)
| | | | | | | | | | | | | | | | | | | | | | | | |
| |
| Six Months Ended
April 30, 2013 |
| | | Year Ended October 31, | |
Class R5 | | | (Unaudited) | | | | 2012 | | | | 2011 | | | | 2010 | | | | 2009 | | | | 2008 | |
Per share data | | | | | | | | | | | | | | | | | | | | | | | | |
Net asset value, beginning of period | | | $7.46 | | | | $7.01 | | | | $7.12 | | | | $6.16 | | | | $5.25 | | | | $9.69 | |
| | | | | | | | | | | | | | | | | | | | | | | | | |
Income from investment operations: | | | | | | | | | | | | | | | | | | | | | | | | |
| | | | | | |
Net investment income | | | 0.05 | | | | 0.08 | | | | 0.02 | | | | 0.03 | | | | 0.08 | | | | 0.08 | |
| | | | | | | | | | | | | | | | | | | | | | | | | |
Net realized and unrealized gain (loss) | | | 1.02 | | | | 0.41 | | | | (0.10 | ) | | | 0.97 | | | | 0.96 | | | | (4.45 | ) |
| | | | | | | | | | | | | | | | | | | | | | | | | |
Total from investment operations | | | 1.07 | | | | 0.49 | | | | (0.08 | ) | | | 1.00 | | | | 1.04 | | | | (4.37 | ) |
| | | | | | | | | | | | | | | | | | | | | | | | | |
Less distributions to shareholders: | | | | | | | | | | | | | | | | | | | | | | | | |
| | | | | | |
Net investment income | | | (0.13 | ) | | | (0.05 | ) | | | (0.03 | ) | | | (0.05 | ) | | | (0.13 | ) | | | (0.07 | ) |
| | | | | | | | | | | | | | | | | | | | | | | | | |
Total distributions to shareholders | | | (0.13 | ) | | | (0.05 | ) | | | (0.03 | ) | | | (0.05 | ) | | | (0.13 | ) | | | (0.07 | ) |
| | | | | | | | | | | | | | | | | | | | | | | | | |
Proceeds from regulatory settlements | | | — | | | | 0.01 | | | | — | | | | 0.01 | | | | 0.00 | (a) | | | — | |
| | | | | | | | | | | | | | | | | | | | | | | | | |
Net asset value, end of period | | | $8.40 | | | | $7.46 | | | | $7.01 | | | | $7.12 | | | | $6.16 | | | | $5.25 | |
| | | | | | | | | | | | | | | | | | | | | | | | | |
Total return | | | 14.48 | % | | | 7.15 | %(b) | | | (1.13 | %) | | | 16.44 | %(c) | | | 20.20 | %(d) | | | (45.40 | %) |
| | | | | | | | | | | | | | | | | | | | | | | | | |
Ratios to average net assets(e) | | | | | | | | | | | | | | | | | | | | | | | | |
| | | | | | |
Total gross expenses | | | 1.05 | %(f) | | | 1.07 | % | | | 0.94 | % | | | 0.96 | % | | | 0.90 | % | | | 1.04 | % |
| | | | | | | | | | | | | | | | | | | | | | | | | |
Total net expenses(g) | | | 0.98 | %(f) | | | 0.96 | % | | | 0.92 | % | | | 0.96 | % | | | 0.90 | % | | | 1.04 | % |
| | | | | | | | | | | | | | | | | | | | | | | | | |
Net investment income | | | 1.30 | %(f) | | | 1.15 | % | | | 0.32 | % | | | 0.50 | % | | | 1.39 | % | | | 1.07 | % |
| | | | | | | | | | | | | | | | | | | | | | | | | |
Supplemental data | | | | | | | | | | | | | | | | | | | | | | | | |
| | | | | | |
Net assets, end of period (in thousands) | | | $3 | | | | $3 | | | | $3 | | | | $19 | | | | $18 | | | | $3 | |
| | | | | | | | | | | | | | | | | | | | | | | | | |
Portfolio turnover | | | 19 | % | | | 50 | % | | | 44 | % | | | 54 | % | | | 81 | % | | | 97 | % |
| | | | | | | | | | | | | | | | | | | | | | | | | |
Notes to Financial Highlights
| (b) | The Fund received proceeds from regulatory settlements. Had the Fund not received these proceeds, the total return would have been lower by 0.11%. |
| (c) | The Fund received proceeds from regulatory settlements. Had the Fund not received these proceeds, the total return would have been lower by 0.09%. |
| (d) | The Fund received proceeds from regulatory settlements. Had the Fund not received these proceeds, the total return would have been lower by 0.02%. |
| (e) | In addition to the fees and expenses which the Fund bears directly, the Fund indirectly bears a pro rata share of the fees and expenses of the acquired funds in which it invests. Such indirect expenses are not included in the reported expense ratios. |
| (g) | Total net expenses include the impact of certain waivers/reimbursements made by the Investment Manager and certain of its affiliates, if applicable. |
The accompanying Notes to Financial Statements are an integral part of this statement.
| | | | |
| Semiannual Report 2013 | | | 21 | |
| | |
| |
| | Columbia Global Equity Fund |
Financial Highlights (continued)
| | | | | | | | | | | | | | | | | | | | | | | | |
| |
| Six Months Ended
April 30, 2013 |
| | | Year Ended October 31, | |
Class W | | | (Unaudited) | | | | 2012 | | | | 2011 | | | | 2010 | | | | 2009 | | | | 2008 | |
Per share data | | | | | | | | | | | | | | | | | | | | | | | | |
Net asset value, beginning of period | | | $7.44 | | | | $6.97 | | | | $7.10 | | | | $6.16 | | | | $5.23 | | | | $9.66 | |
| | | | | | | | | | | | | | | | | | | | | | | | | |
Income from investment operations: | | | | | | | | | | | | | | | | | | | | | | | | |
| | | | | | |
Net investment income | | | 0.03 | | | | 0.05 | | | | 0.02 | | | | 0.01 | | | | 0.06 | | | | 0.05 | |
| | | | | | | | | | | | | | | | | | | | | | | | | |
Net realized and unrealized gain (loss) | | | 1.02 | | | | 0.41 | | | | (0.13 | ) | | | 0.95 | | | | 0.96 | | | | (4.44 | ) |
| | | | | | | | | | | | | | | | | | | | | | | | | |
Total from investment operations | | | 1.05 | | | | 0.46 | | | | (0.11 | ) | | | 0.96 | | | | 1.02 | | | | (4.39 | ) |
| | | | | | | | | | | | | | | | | | | | | | | | | |
Less distributions to shareholders: | | | | | | | | | | | | | | | | | | | | | | | | |
| | | | | | |
Net investment income | | | (0.10 | ) | | | (0.00 | )(a) | | | (0.02 | ) | | | (0.03 | ) | | | (0.09 | ) | | | (0.04 | ) |
| | | | | | | | | | | | | | | | | | | | | | | | | |
Total distributions to shareholders | | | (0.10 | ) | | | (0.00 | )(a) | | | (0.02 | ) | | | (0.03 | ) | | | (0.09 | ) | | | (0.04 | ) |
| | | | | | | | | | | | | | | | | | | | | | | | | |
Proceeds from regulatory settlements | | | — | | | | 0.01 | | | | — | | | | 0.01 | | | | 0.00 | (a) | | | — | |
| | | | | | | | | | | | | | | | | | | | | | | | | |
Net asset value, end of period | | | $8.39 | | | | $7.44 | | | | $6.97 | | | | $7.10 | | | | $6.16 | | | | $5.23 | |
| | | | | | | | | | | | | | | | | | | | | | | | | |
Total return | | | 14.21 | % | | | 6.76 | %(b) | | | (1.52 | %) | | | 15.80 | %(c) | | | 19.70 | %(d) | | | (45.62 | %) |
| | | | | | | | | | | | | | | | | | | | | | | | | |
Ratios to average net assets(e) | | | | | | | | | | | | | | | | | | | | | | | | |
| | | | | | |
Total gross expenses | | | 1.60 | %(f) | | | 1.59 | % | | | 1.48 | % | | | 1.38 | % | | | 1.30 | % | | | 1.43 | % |
| | | | | | | | | | | | | | | | | | | | | | | | | |
Total net expenses(g) | | | 1.41 | %(f) | | | 1.36 | %(h) | | | 1.37 | %(h) | | | 1.38 | % | | | 1.30 | % | | | 1.43 | % |
| | | | | | | | | | | | | | | | | | | | | | | | | |
Net investment income | | | 0.87 | %(f) | | | 0.75 | % | | | 0.21 | % | | | 0.08 | % | | | 1.05 | % | | | 0.68 | % |
| | | | | | | | | | | | | | | | | | | | | | | | | |
Supplemental data | | | | | | | | | | | | | | | | | | | | | | | | |
| | | | | | |
Net assets, end of period (in thousands) | | | $3 | | | | $3 | | | | $3 | | | | $5 | | | | $4 | | | | $3 | |
| | | | | | | | | | | | | | | | | | | | | | | | | |
Portfolio turnover | | | 19 | % | | | 50 | % | | | 44 | % | | | 54 | % | | | 81 | % | | | 97 | % |
| | | | | | | | | | | | | | | | | | | | | | | | | |
Notes to Financial Highlights
| (b) | The Fund received proceeds from regulatory settlements. Had the Fund not received these proceeds, the total return would have been lower by 0.11%. |
| (c) | The Fund received proceeds from regulatory settlements. Had the Fund not received these proceeds, the total return would have been lower by 0.09%. |
| (d) | The Fund received proceeds from regulatory settlements. Had the Fund not received these proceeds, the total return would have been lower by 0.02%. |
| (e) | In addition to the fees and expenses which the Fund bears directly, the Fund indirectly bears a pro rata share of the fees and expenses of the acquired funds in which it invests. Such indirect expenses are not included in the reported expense ratios. |
| (g) | Total net expenses include the impact of certain waivers/reimbursements made by the Investment Manager and certain of its affiliates, if applicable. |
| (h) | The benefits derived from expense reductions had an impact of less than 0.01%. |
The accompanying Notes to Financial Statements are an integral part of this statement.
| | |
| 22 | | Semiannual Report 2013 |
| | |
| |
| Columbia Global Equity Fund | | |
Financial Highlights (continued)
| | | | | | | | | | | | | | | | |
| |
| Six Months Ended
April 30, 2013 |
| | | Year Ended October 31, | |
Class Z | | | (Unaudited) | | | | 2012 | | | | 2011 | | | | 2010(a) | |
Per share data | | | | | | | | | | | | | | | | |
Net asset value, beginning of period | | | $7.45 | | | | $7.00 | | | | $7.12 | | | | $6.85 | |
| | | | | | | | | | | | | | | | | |
Income from investment operations: | | | | | | | | | | | | | | | | |
| | | | |
Net investment income (loss) | | | 0.04 | | | | 0.07 | | | | 0.02 | | | | (0.01 | ) |
| | | | | | | | | | | | | | | | | |
Net realized and unrealized gain (loss) | | | 1.02 | | | | 0.41 | | | | (0.11 | ) | | | 0.28 | |
| | | | | | | | | | | | | | | | | |
Total from investment operations | | | 1.06 | | | | 0.48 | | | | (0.09 | ) | | | 0.27 | |
| | | | | | | | | | | | | | | | | |
Less distributions to shareholders: | | | | | | | | | | | | | | | | |
| | | | |
Net investment income | | | (0.12 | ) | | | (0.04 | ) | | | (0.03 | ) | | | — | |
| | | | | | | | | | | | | | | | | |
Total distributions to shareholders | | | (0.12 | ) | | | (0.04 | ) | | | (0.03 | ) | | | — | |
| | | | | | | | | | | | | | | | | |
Proceeds from regulatory settlements | | | — | | | | 0.01 | | | | — | | | | — | |
| | | | | | | | | | | | | | | | | |
Net asset value, end of period | | | $8.39 | | | | $7.45 | | | | $7.00 | | | | $7.12 | |
| | | | | | | | | | | | | | | | | |
Total return | | | 14.30 | % | | | 7.03 | %(b) | | | (1.29 | %) | | | 3.94 | % |
| | | | | | | | | | | | | | | | | |
Ratios to average net assets(c) | | | | | | | | | | | | | | | | |
| | | | |
Total gross expenses | | | 1.30 | %(d) | | | 1.25 | % | | | 1.23 | % | | | 1.37 | %(d) |
| | | | | | | | | | | | | | | | | |
Total net expenses(e) | | | 1.15 | %(d) | | | 1.11 | %(f) | | | 1.11 | %(g) | | | 1.37 | %(d) |
| | | | | | | | | | | | | | | | | |
Net investment income (loss) | | | 1.11 | %(d) | | | 1.00 | % | | | 0.24 | % | | | (1.52 | %)(d) |
| | | | | | | | | | | | | | | | | |
Supplemental data | | | | | | | | | | | | | | | | |
| | | | |
Net assets, end of period (in thousands) | | | $2,493 | | | | $2,387 | | | | $3,004 | | | | $3 | |
| | | | | | | | | | | | | | | | | |
Portfolio turnover | | | 19 | % | | | 50 | % | | | 44 | % | | | 54 | % |
| | | | | | | | | | | | | | | | | |
Notes to Financial Highlights
| (a) | For the period from September 27, 2010 (commencement of operations) to October 31, 2010. |
| (b) | The Fund received proceeds from regulatory settlements. Had the Fund not received these proceeds, the total return would have been lower by 0.11%. |
| (c) | In addition to the fees and expenses which the Fund bears directly, the Fund indirectly bears a pro rata share of the fees and expenses of the acquired funds in which it invests. Such indirect expenses are not included in the reported expense ratios. |
| (e) | Total net expenses include the impact of certain waivers/reimbursements made by the Investment Manager and certain of its affiliates, if applicable. |
| (f) | The benefits derived from expense reductions had an impact of less than 0.01%. |
| (g) | The benefits derived from expense reductions had an impact of 0.01%. |
The accompanying Notes to Financial Statements are an integral part of this statement.
| | | | |
| Semiannual Report 2013 | | | 23 | |
| | |
| |
| | Columbia Global Equity Fund |
Notes to Financial Statements
April 30, 2013 (Unaudited)
Note 1. Organization
Columbia Global Equity Fund (the Fund), a series of Columbia Funds Series Trust II (the Trust), is a diversified fund. The Trust is registered under the Investment Company Act of 1940, as amended (the 1940 Act), as an open-end management investment company organized as a Massachusetts business trust.
Fund Shares
The Trust may issue an unlimited number of shares (without par value). The Fund offers Class A, Class B, Class C, Class I, Class K, Class R, Class R5, Class W and Class Z shares. All share classes have identical voting, dividend and liquidation rights. Each share class has its own expense structure and sales charges, as applicable.
Class A shares are subject to a maximum front-end sales charge of 5.75% based on the initial investment amount. Class A shares purchased without an initial sales charge in accounts aggregating $1 million to $50 million at the time of purchase are subject to a contingent deferred sales charge (CDSC) if the shares are sold within 18 months of purchase, charged as follows: 1.00% CDSC if redeemed within 12 months of purchase, and 0.50% CDSC if redeemed more than 12, but less than 18, months after purchase.
Class B shares may be subject to a maximum CDSC of 5.00% based upon the holding period after purchase. Class B shares will generally convert to Class A shares eight years after purchase. The Fund no longer accepts investments by new or existing investors in the Fund’s Class B shares, except in connection with the reinvestment of any dividend and/or capital gain distributions in Class B shares of the Fund and exchanges by existing Class B shareholders of certain other funds within the Columbia Family of Funds.
Class C shares are subject to a 1.00% CDSC on shares redeemed within one year of purchase.
Class I shares are not subject to sales charges and are available only to the Columbia Family of Funds.
Class K shares are not subject to sales charges, however this share class is closed to new investors.
Class R shares are not subject to sales charges and are available only to certain retirement plans and other eligible investors.
Class R5 shares are not subject to sales charges. Effective November 8, 2012, Class R5 shares are generally available only to investors purchasing through authorized investment professionals and omnibus retirement plans. Prior to November 8, 2012, Class R5 shares were closed to new investors.
Class W shares are not subject to sales charges and are available only to investors purchasing through authorized investment programs managed by investment professionals, including discretionary managed account programs.
Class Z shares are not subject to sales charges, and are available only to certain investors.
Note 2. Summary of Significant Accounting Policies
Use of Estimates
The preparation of financial statements in accordance with U.S. generally accepted accounting principles (GAAP) requires management to make certain estimates and assumptions that affect the reported amounts of assets and liabilities, the disclosure of contingent assets and liabilities at the date of the financial statements and the reported amounts of revenue and expenses during the reporting period. Actual results could differ from those estimates.
The following is a summary of significant accounting policies consistently followed by the Fund in the preparation of its financial statements.
Security Valuation
All equity securities are valued at the close of business of the New York Stock Exchange (NYSE). Equity securities are valued at the last quoted sales price on the principal exchange or market on which they trade, except for securities traded on the NASDAQ Stock Market, which are valued at the NASDAQ official close price. Unlisted securities or listed securities for which there were no sales during the day are valued at the mean of the latest quoted bid and ask prices on such exchanges or markets.
Foreign equity securities are valued based on quotations from the principal market in which such securities are normally traded. If any foreign share prices are not readily available as a result of limited share activity the securities are valued at the mean of the latest quoted bid and ask prices on such exchanges or markets. Foreign currency exchange rates are generally determined at 4:00 p.m. Eastern (U.S.) time. However, many securities markets and exchanges outside the U.S. close prior to the close of the NYSE; therefore, the closing prices for securities in such markets or on such exchanges may not fully reflect events that occur after such close but before the close of the NYSE. In those situations, foreign securities will be fair valued pursuant to the policy adopted by the Board of Trustees (the Board), including utilizing a third party pricing service to determine these fair values. The third party pricing service takes into account multiple factors, including, but not limited to, movements in
| | |
| 24 | | Semiannual Report 2013 |
| | |
| |
| Columbia Global Equity Fund | | |
Notes to Financial Statements (continued)
April 30, 2013 (Unaudited)
the U.S. securities markets, certain depositary receipts, futures contracts and foreign exchange rates that have occurred subsequent to the close of the foreign exchange or market, to determine a good faith estimate that reasonably reflects the current market conditions as of the close of the NYSE. The fair value of a security is likely to be different from the quoted or published price, if available.
Investments in other open-end investment companies, including money market funds, are valued at net asset value.
Investments for which market quotations are not readily available, or that have quotations which management believes are not reliable, are valued at fair value as determined in good faith under consistently applied procedures established by and under the general supervision of the Board. If a security or class of securities (such as foreign securities) is valued at fair value, such value is likely to be different from the last quoted market price for the security.
The determination of fair value often requires significant judgment. To determine fair value, management may use assumptions including but not limited to future cash flows and estimated risk premiums. Multiple inputs from various sources may be used to determine fair value.
Foreign Currency Transactions and Translations
The values of all assets and liabilities denominated in foreign currencies are translated into U.S. dollars at that day’s exchange rates. Net realized and unrealized gains (losses) on foreign currency transactions and translations include gains (losses) arising from the fluctuation in exchange rates between trade and settlement dates on securities transactions, gains (losses) arising from the disposition of foreign currency and currency gains (losses) between the accrual and payment dates on dividends, interest income and foreign withholding taxes.
For financial statement purposes, the Fund does not distinguish that portion of gains (losses) on investments which is due to changes in foreign exchange rates from that which is due to changes in market prices of the investments. Such fluctuations are included with the net realized and unrealized gains (losses) on investments in the Statement of Operations.
Security Transactions
Security transactions are accounted for on the trade date. Cost is determined and gains (losses) are based upon the specific identification method for both financial statement and federal income tax purposes.
Income Recognition
Corporate actions and dividend income are recorded net of any non-reclaimable tax withholdings, on the ex-dividend date
or upon receipt of ex-dividend notification in the case of certain foreign securities.
Awards from class action litigation are recorded as a reduction of cost basis if the Fund still owns the applicable securities on the payment date. If the Fund no longer owns the applicable securities, the proceeds are recorded as realized gains.
Expenses
General expenses of the Trust are allocated to the Fund and other funds of the Trust based upon relative net assets or other expense allocation methodologies determined by the nature of the expense. Expenses directly attributable to the Fund are charged to the Fund. Expenses directly attributable to a specific class of shares are charged to that share class.
Determination of Class Net Asset Value
All income, expenses (other than class-specific expenses, which are charged to that share class, as shown in the Statement of Operations) and realized and unrealized gains (losses) are allocated to each class of the Fund on a daily basis, based on the relative net assets of each class, for purposes of determining the net asset value of each class.
Federal Income Tax Status
The Fund intends to qualify each year as a regulated investment company under Subchapter M of the Internal Revenue Code, as amended, and will distribute substantially all of its taxable income (including net short-term capital gains), if any, for its tax year, and as such will not be subject to federal income taxes. In addition, the Fund intends to distribute in each calendar year substantially all of its net investment income, capital gains and certain other amounts, if any, such that the Fund should not be subject to federal excise tax. Therefore, no federal income or excise tax provision is recorded.
Foreign Taxes
The Fund may be subject to foreign taxes on income, gains on investments or currency repatriation, a portion of which may be recoverable. The Fund will accrue such taxes and recoveries, as applicable, based upon its current interpretation of tax rules and regulations that exist in the markets in which it invests.
Realized gains in certain countries may be subject to foreign taxes at the Fund level, based on statutory rates. The Fund accrues for such foreign taxes on net realized and unrealized gains at the appropriate rate for each jurisdiction, as applicable. The amount, if any, is disclosed as a liability on the Statement of Assets and Liabilities.
| | | | |
| Semiannual Report 2013 | | | 25 | |
| | |
| |
| | Columbia Global Equity Fund |
Notes to Financial Statements (continued)
April 30, 2013 (Unaudited)
Distributions to Shareholders
Distributions from net investment income, if any, are declared and paid annually. Net realized capital gains, if any, are distributed along with the income distribution. Income distributions and capital gain distributions are determined in accordance with federal income tax regulations, which may differ from GAAP.
Guarantees and Indemnifications
Under the Trust’s organizational documents and, in some cases, by contract, its officers and trustees are indemnified against certain liabilities arising out of the performance of their duties to the Trust or its funds. In addition, certain of the Fund’s contracts with its service providers contain general indemnification clauses. The Fund’s maximum exposure under these arrangements is unknown since the amount of any future claims that may be made against the Fund cannot be determined, and the Fund has no historical basis for predicting the likelihood of any such claims.
Recent Accounting Pronouncement
Disclosures about Offsetting Assets and Liabilities
In December 2011, the Financial Accounting Standards Board (FASB) issued Accounting Standards Update (ASU) No. 2011-11, Disclosures about Offsetting Assets and Liabilities and in January 2013, ASU No. 2013-1, Clarifying the Scope of Disclosures about Offsetting Assets and Liabilities (collectively, the ASUs). Specifically, the ASUs require an entity to disclose both gross and net information for derivatives and other financial instruments that are subject to a master netting arrangement or similar agreement. The ASUs require disclosure of collateral received in connection with the master netting agreements or similar agreements. The disclosure requirements are effective for interim and annual periods beginning on or after January 1, 2013. At this time, management is evaluating the implications of this guidance and the impact it will have on the financial statement amounts and footnote disclosures, if any.
Note 3. Fees and Compensation Paid to Affiliates
Investment Management Fees
Under an Investment Management Services Agreement, Columbia Management Investment Advisers, LLC (the Investment Manager), a wholly-owned subsidiary of Ameriprise Financial, Inc. (Ameriprise Financial), is responsible for the ultimate oversight of investments made by the Fund. The Fund’s subadviser (see Subadvisory Agreement below) has the primary responsibility for the day-to-day
portfolio management of the Fund. The investment management fee is an annual fee that is equal to a percentage of the Fund’s average daily net assets that declines from 0.80% to 0.57% as the Fund’s net assets increase. The annualized effective investment management fee rate for the six months ended April 30, 2013 was 0.79% of the Fund’s average daily net assets.
The Investment Manager has voluntarily agreed to waive the investment management fee charged to the Fund on its assets that are invested in other Columbia Funds. The Investment Manager, in its discretion, may revise or discontinue this arrangement at any time.
Subadvisory Agreement
The Investment Manager has entered into a Subadvisory Agreement with Threadneedle International Limited (Threadneedle), an affiliate of the Investment Manager and wholly-owned subsidiary of Ameriprise Financial, the subadviser of the Fund. The Investment Manager compensates Threadneedle to manage the investment of the Fund’s assets.
Administration Fees
Under an Administrative Services Agreement, the Investment Manager also serves as the Fund Administrator. The Fund pays the Fund Administrator an annual fee for administration and accounting services equal to a percentage of the Fund’s average daily net assets that declines from 0.08% to 0.05% as the Fund’s net assets increase. The annualized effective administration fee rate for the six months ended April 30, 2013 was 0.08% of the Fund’s average daily net assets. The Investment Manager has voluntarily agreed to waive the administration fee charged to the Fund on its assets that are invested in other Columbia Funds. The Investment Manager, in its discretion, may revise or discontinue this arrangement at any time.
Other Expenses
Other expenses are for, among other things, certain expenses of the Fund or the Board, including: Fund boardroom and office expense, employee compensation, employee health and retirement benefits, and certain other expenses. Payment of these Fund and Board expenses is facilitated by a company providing limited administrative services to the Fund and the Board. For the six months ended April 30, 2013, other expenses paid to this company were $900.
Compensation of Board Members
Board members are compensated for their services to the Fund as disclosed in the Statement of Operations. Under a Deferred Compensation Plan (the Plan), the Board members who are not “interested persons” of the Fund, as defined under the
| | |
| 26 | | Semiannual Report 2013 |
| | |
| |
| Columbia Global Equity Fund | | |
Notes to Financial Statements (continued)
April 30, 2013 (Unaudited)
1940 Act, may elect to defer payment of up to 100% of their compensation. Deferred amounts are treated as though equivalent dollar amounts had been invested in shares of certain funds managed by the Investment Manager. The Fund’s liability for these amounts is adjusted for market value changes and remains in the Fund until distributed in accordance with the Plan.
Transfer Agent Fees
Under a Transfer and Dividend Disbursing Agent Agreement, Columbia Management Investment Services Corp. (the Transfer Agent), an affiliate of the Investment Manager and a wholly-owned subsidiary of Ameriprise Financial, is responsible for providing transfer agency services to the Fund. The Transfer Agent has contracted with Boston Financial Data Services (BFDS) to serve as sub-transfer agent.
The Transfer Agent receives monthly account-based service fees based on the number of open accounts and also receives sub-transfer agency fees based on a percentage of the average aggregate value of the Fund’s shares maintained in omnibus accounts (other than omnibus accounts for which American Enterprise Investment Services Inc. is the broker of record or accounts where the beneficial shareholder is a customer of Ameriprise Financial Services, Inc., which are paid a per account fee). The Transfer Agent pays the fees of BFDS for services as sub-transfer agent and is not entitled to reimbursement for such fees from the Fund (with the exception of out-of-pocket fees).
The Transfer Agent also receives compensation from fees for various shareholder services and reimbursements for certain out-of-pocket fees. Class I shares do not pay transfer agent fees. Total transfer agent fees for Class K and Class R5 shares are subject to an annual limitation of not more than 0.05% of the average daily net assets attributable to each share class.
For the six months ended April 30, 2013, the Fund’s annualized effective transfer agent fee rates as a percentage of average daily net assets of each class were as follows:
| | | | |
Class A | | | 0.33 | % |
Class B | | | 0.33 | |
Class C | | | 0.33 | |
Class K | | | 0.05 | |
Class R | | | 0.33 | |
Class R5 | | | 0.05 | |
Class W | | | 0.35 | |
Class Z | | | 0.33 | |
The Fund and certain other associated investment companies, have severally, but not jointly, guaranteed the performance and observance of all the terms and conditions of a lease
entered into by Seligman Data Corp. (SDC), the former transfer agent, including the payment of rent by SDC (the Guaranty). The lease and the Guaranty expire in January 2019. At April 30, 2013, the Fund’s total potential future obligation over the life of the Guaranty is $17,075. The liability remaining at April 30, 2013 for non-recurring charges associated with the lease amounted to $8,873 and is recorded as a part of payable for other expenses in the Statement of Assets and Liabilities.
An annual minimum account balance fee of $20 may apply to certain accounts with a value below the Fund’s initial minimum investment requirements to reduce the impact of small accounts on transfer agent fees. These minimum account balance fees are recorded as part of expense reductions in the Statement of Operations. For the six months ended April 30, 2013, no minimum account balance fees were charged by the Fund.
Plan Administration Fees
Under a Plan Administration Services Agreement with the Transfer Agent, the Fund pays an annual fee at a rate of 0.25% of the Fund’s average daily net assets attributable to Class K shares for the provision of various administrative, recordkeeping, communication and educational services.
Distribution Fees
The Fund has an agreement with Columbia Management Investment Distributors, Inc. (the Distributor), an affiliate of the Investment Manager and a wholly-owned subsidiary of Ameriprise Financial, for distribution and shareholder services. Under a Plan and Agreement of Distribution pursuant to Rule 12b-1, the Fund pays a fee at an annual rate of up to 0.25% of the Fund’s average daily net assets attributable to Class A and Class W shares, a fee at an annual rate of up to 0.50% of the Fund’s average daily net assets attributable to Class R shares (of which up to 0.25% may be used for shareholder services) and a fee at an annual rate of up to 1.00% of the Fund’s average daily net assets attributable to Class B and Class C shares. For Class B and Class C shares, of the 1.00% fee, up to 0.75% is reimbursed for distribution expenses.
The amount of distribution expenses incurred by the Distributor and not yet reimbursed (unreimbursed expense) was approximately $877,000 and $1,420,000 for Class B and Class C shares, respectively. These amounts are based on the most recent information available as of March 31, 2013, and may be recovered from future payments under the distribution plan or CDSCs. To the extent the unreimbursed expense has been fully recovered, the distribution fee is reduced.
| | | | |
| Semiannual Report 2013 | | | 27 | |
| | |
| |
| | Columbia Global Equity Fund |
Notes to Financial Statements (continued)
April 30, 2013 (Unaudited)
Sales Charges
Sales charges, including front-end charges and CDSCs, received by the Distributor for distributing Fund shares were $90,297 for Class A, $848 for Class B and $410 for Class C shares for the six months ended April 30, 2013.
Expenses Waived/Reimbursed by the Investment Manager and its Affiliates
The Investment Manager and certain of its affiliates have contractually agreed to waive fees and/or reimburse expenses (excluding certain fees and expenses described below) for the periods disclosed below, unless sooner terminated at the sole discretion of the Board, so that the Fund’s net operating expenses, after giving effect to fees waived/expenses reimbursed and any balance credits and/or overdraft charges from the Fund’s custodian, do not exceed the following annual rates as a percentage of the class’ average daily net assets:
| | | | | | | | |
| | | March 1, 2013 through February 28, 2014 | | | Prior to March 1, 2013 | |
Class A | | | 1.49 | % | | | 1.36 | % |
Class B | | | 2.24 | | | | 2.11 | |
Class C | | | 2.24 | | | | 2.11 | |
Class I | | | 1.04 | | | | 0.91 | |
Class K | | | 1.34 | | | | 1.21 | |
Class R | | | 1.74 | | | | 1.61 | |
Class R5 | | | 1.09 | | | | 0.96 | |
Class W | | | 1.49 | | | | 1.36 | |
Class Z | | | 1.24 | | | | 1.11 | |
Under the agreement governing these fee waivers and/or expense reimbursement arrangements, the following fees and expenses are excluded from the waiver/reimbursement commitment, and therefore will be paid by the Fund, if applicable: taxes (including foreign transaction taxes), expenses associated with investments in affiliated and non-affiliated pooled investment vehicles (including mutual funds and exchange traded funds), transaction costs and brokerage commissions, costs related to any securities lending program, dividend expenses associated with securities sold short, inverse floater program fees and expenses, transaction charges and interest on borrowed money, interest, extraordinary expenses and any other expenses the exclusion of which is specifically approved by the Board. This agreement may be modified or amended only with approval from all parties.
Note 4. Federal Tax Information
The timing and character of income and capital gain distributions are determined in accordance with income tax regulations, which may differ from GAAP because of
temporary or permanent book to tax differences.
At April 30, 2013, the cost of investments for federal income tax purposes was approximately $311,592,000 and the aggregate gross approximate unrealized appreciation and depreciation based on that cost was:
| | | | |
Unrealized appreciation | | | $73,284,000 | |
Unrealized depreciation | | | (5,341,000 | ) |
Net unrealized appreciation | | | $67,943,000 | |
The following capital loss carryforward, determined as of October 31, 2012 may be available to reduce taxable income arising from future net realized gains on investments, if any, to the extent permitted by the Internal Revenue Code:
| | | | |
| Year of Expiration | | Amount ($) | |
2015 | | | 939,646 | |
2016 | | | 39,197,208 | |
2017 | | | 125,704,676 | |
2018 | | | 1,645,663 | |
2019 | | | 13,445,692 | |
Unlimited short-term | | | 1,351,530 | |
Unlimited long-term | | | 1,143,069 | |
Total | | | 183,427,484 | |
Unlimited capital loss carryforwards are required to be utilized prior to any capital losses which carry an expiration date. As a result of this ordering rule, capital loss carryforwards which carry an expiration date may be more likely to expire unused.
Management of the Fund has concluded that there are no significant uncertain tax positions that would require recognition in the financial statements. However, management’s conclusion may be subject to review and adjustment at a later date based on factors including, but not limited to, new tax laws, regulations, and administrative interpretations (including relevant court decisions). Generally, the Fund’s federal tax returns for the prior three fiscal years remain subject to examination by the Internal Revenue Service.
Note 5. Portfolio Information
The cost of purchases and proceeds from sales of securities, excluding short-term obligations, aggregated to $69,851,234 and $107,797,219, respectively, for the six months ended April 30, 2013.
Note 6. Regulatory Settlements
During the year ended October 31, 2012, the Fund received $444,107 as a result of a regulatory settlement proceeding brought by the Securities and Exchange Commission against
| | |
| 28 | | Semiannual Report 2013 |
| | |
| |
| Columbia Global Equity Fund | | |
Notes to Financial Statements (continued)
April 30, 2013 (Unaudited)
an unaffiliated third party relating to market timing and/or late trading of mutual funds. This amount represented the Fund’s portion of the proceeds from the settlement (the Fund was not a party to the proceeding). The payments have been included in “Proceeds from regulatory settlements” in the Statement of Changes in Net Assets.
Note 7. Lending of Portfolio Securities
Effective December 19, 2012, the Fund no longer participates in securities lending activity. Prior to that date, the Fund participated, or was eligible to participate, in securities lending activity pursuant to a Master Securities Lending Agreement (the Agreement) with JPMorgan Chase Bank, N.A. (JPMorgan). The Agreement authorized JPMorgan as lending agent to lend securities to authorized borrowers in order to generate additional income on behalf of the Fund. Pursuant to the Agreement, the securities loaned were secured by cash or securities that either were issued or guaranteed as to principal and interest by the U.S. government, its agencies, authorities or instrumentalities with value equal to at least 100% of the market value of the loaned securities. Any additional collateral required to maintain those levels due to market fluctuations of the loaned securities was requested to be delivered the following business day. Cash collateral received was invested by the lending agent on behalf of the Fund into authorized investments pursuant to the Agreement.
Pursuant to the Agreement, the Fund received income for lending its securities either in the form of fees or by earning interest on invested cash collateral, net of negotiated rebates paid to borrowers and fees paid to the lending agent for services provided and any other securities lending expenses. Net income earned from securities lending for the six months ended April 30, 2013 is disclosed in the Statement of Operations. The Fund continued to earn and accrue interest and dividends on the securities loaned.
Note 8. Affiliated Money Market Fund
The Fund invests its daily cash balances in Columbia Short-Term Cash Fund, an affiliated money market fund established for the exclusive use by the Fund and other affiliated funds. The income earned by the Fund from such investments is included as “Dividends — affiliated issuers” in the Statement of Operations. As an investing fund, the Fund indirectly bears its proportionate share of the expenses of Columbia Short-Term Cash Fund.
Note 9. Shareholder Concentration
At April 30, 2013, one unaffiliated shareholder account owned 12.6% of the outstanding shares of the Fund. The Fund has no knowledge about whether any portion of those shares was owned beneficially by such account.
Note 10. Line of Credit
The Fund has entered into a revolving credit facility with a syndicate of banks led by JPMorgan whereby the Fund may borrow for the temporary funding of shareholder redemptions or for other temporary or emergency purposes. The credit facility agreement, as amended, which is a collective agreement between the Fund and certain other funds managed by the Investment Manager, severally and not jointly, permits collective borrowings up to $500 million. Interest is charged to each participating fund based on its borrowings at a rate equal to the higher of (i) the overnight federal funds rate plus 1.00% or (ii) the one-month LIBOR rate plus 1.00%. Each borrowing under the credit facility matures no later than 60 days after the date of borrowing. The Fund also pays a commitment fee equal to its pro rata share of the amount of the credit facility at a rate of 0.08% per annum.
The Fund had no borrowings during the six months ended April 30, 2013.
Note 11. Significant Risks
Foreign Securities Risk
Investing in foreign securities may include certain risks and considerations not typically associated with investing in U.S. securities, such as fluctuating currency values and changing local and regional economic, political and social conditions, which may result in greater market volatility. In addition, certain foreign securities may not be as liquid as U.S. securities. Investing in emerging markets may accentuate these risks.
Investments in emerging market countries are subject to additional risk. The risk of foreign investments is typically increased in less developed countries. These countries are also more likely to experience high levels of inflation, deflation or currency devaluation which could hurt their economies and securities markets.
Note 12. Subsequent Events
Management has evaluated the events and transactions that have occurred through the date the financial statements were issued and noted no items requiring adjustment of the financial statements or additional disclosure.
Note 13. Information Regarding Pending and Settled Legal Proceedings
In December 2005, without admitting or denying the allegations, American Express Financial Corporation (AEFC, which is now known as Ameriprise Financial, Inc. (Ameriprise Financial)) entered into settlement agreements
| | | | |
| Semiannual Report 2013 | | | 29 | |
| | |
| |
| | Columbia Global Equity Fund |
Notes to Financial Statements (continued)
April 30, 2013 (Unaudited)
with the Securities and Exchange Commission (SEC) and Minnesota Department of Commerce (MDOC) related to market timing activities. As a result, AEFC was censured and ordered to cease and desist from committing or causing any violations of certain provisions of the Investment Advisers Act of 1940, the Investment Company Act of 1940, and various Minnesota laws. AEFC agreed to pay disgorgement of $10 million and civil money penalties of $7 million. AEFC also agreed to retain an independent distribution consultant to assist in developing a plan for distribution of all disgorgement and civil penalties ordered by the SEC in accordance with various undertakings detailed at www.sec.gov/litigation/admin/ia-2451.pdf. Ameriprise Financial and its affiliates have cooperated with the SEC and the MDOC in these legal proceedings, and have made regular reports to the funds’ Boards of Trustees.
Ameriprise Financial and certain of its affiliates have historically been involved in a number of legal, arbitration and regulatory proceedings, including routine litigation, class actions, and governmental actions, concerning matters arising in connection with the conduct of their business activities. Ameriprise Financial believes that the Funds are not currently the subject of, and that neither Ameriprise Financial nor any of its affiliates are the subject of, any pending legal, arbitration or regulatory proceedings that are likely to have a material adverse effect on the Funds or the ability of Ameriprise Financial or its affiliates to perform under their contracts with the Funds. Ameriprise Financial is required to make 10-Q, 10-K and, as necessary, 8-K filings with the Securities and Exchange Commission on legal and regulatory matters that relate to Ameriprise Financial and its affiliates. Copies of these filings may be obtained by accessing the SEC website at www.sec.gov.
There can be no assurance that these matters, or the adverse publicity associated with them, will not result in increased fund redemptions, reduced sale of fund shares or other adverse consequences to the Funds. Further, although we believe proceedings are not likely to have a material adverse effect on the Funds or the ability of Ameriprise Financial or its affiliates to perform under their contracts with the Funds, these proceedings are subject to uncertainties and, as such, we are unable to estimate the possible loss or range of loss that may result. An adverse outcome in one or more of these proceedings could result in adverse judgments, settlements, fines, penalties or other relief that could have a material adverse effect on the consolidated financial condition or results of operations of Ameriprise Financial.
| | |
| 30 | | Semiannual Report 2013 |
| | |
| |
| Columbia Global Equity Fund | | |
Approval of Investment Management Services and Subadvisory Agreements
Columbia Management Investment Advisers, LLC (Columbia Management or the Investment Manager), a wholly-owned subsidiary of Ameriprise Financial, Inc. (Ameriprise Financial), serves as the investment manager to Columbia Global Equity Fund (the Fund). Under an investment management services agreement (the IMS Agreement), Columbia Management provides investment advice and other services to the Fund and other funds distributed by Columbia Management Investment Distributors, Inc. (collectively, the Funds). In addition, under a Subadvisory Agreement (the Subadvisory Agreement) between Columbia Management and Threadneedle International Limited (the Subadviser), an affiliate of Columbia Management, the Subadviser has provided portfolio management and related services for the Fund.
On an annual basis, the Fund’s Board of Trustees (the Board), including the independent Board members (the Independent Trustees), considers renewal of the IMS Agreement and the Subadvisory Agreement (together, the Advisory Agreements). Columbia Management prepared detailed reports for the Board and its Contracts Committee in January, March and April 2013, including reports based on analyses of data provided by an independent organization and a comprehensive response to each item of information requested by independent legal counsel to the Independent Trustees (Independent Legal Counsel) in a letter to the Investment Manager, to assist the Board in making this determination. All of the materials presented in January, March and April were first supplied in draft form to designated representatives of the Independent Trustees, i.e., Independent Legal Counsel, the Chair of the Board and the Chair of the Contracts Committee, and the final materials (including proposed additional breakpoints in IMS fees for certain Funds) were revised to reflect discussion and subsequent requests made by the Contracts Committee. In addition, throughout the year, the Board (or its committees) regularly meets with portfolio management teams and senior management personnel and reviews information prepared by Columbia Management addressing the services Columbia Management provides and Fund performance. Further, the Board retained an independent consulting firm (the Independent Consultant) to assist the Independent Trustees in their review of IMS fees, expense caps and Ameriprise Financial’s profitability. The Board also accords particular weight to the work, deliberations and conclusions of the Contracts Committee, the Investment Review Committee and the Compliance Committee in determining whether to continue the Advisory Agreements.
The Board, at its April 15-17, 2013 in-person Board meeting (the April Meeting), considered the renewal of the Advisory Agreements for an additional one-year term. At the April Meeting, Independent Legal Counsel reviewed with the Independent Trustees various factors relevant to the Board’s consideration of advisory and subadvisory agreements and the Board’s legal responsibilities related to such consideration. Following an analysis and discussion of the factors identified below, the Board, including all of the Independent Trustees, approved the renewal of each of the Advisory Agreements.
Nature, Extent and Quality of Services Provided by Columbia Management and the Subadviser
The Board analyzed various reports and presentations it had received detailing the services performed by Columbia Management and the Subadviser, as well as their history, reputation, expertise, resources and relative capabilities, and the qualifications of their personnel.
With respect to Columbia Management, the Board specifically considered many developments during the past year concerning the services provided by Columbia Management, including, in particular, the recent globalization initiative, which fosters increased worldwide investment support of global products, continued investment in upgrading technology (such as the implementation of new systems and hardware), the hiring of a Chief Interest Rate Strategist as part of Columbia Management’s fixed income team and the addition of Columbia Management investment personnel to the Asset Allocation, Quantitative and Technology teams. The Board took into account the information it received and reviewed concerning Columbia Management’s ongoing oversight and monitoring of the subadvisers, observing the broad scope of services provided by Columbia Management to each subadvised Fund, including, among other noted services, investment, risk and compliance oversight. The Board also took into account the Subadviser oversight structure and the Columbia Management team dedicated thereto. The Board also noted the information it received concerning Columbia Management’s ability to retain its key portfolio management personnel. In this regard, the Board took into account its comprehensive discussions with Columbia Management’s Chief Investment Officer (the CIO), observing the organizational depth of Columbia Management and the capabilities of its investment personnel. The Board also recalled the information the CIO provided it identifying the strengths and areas for enhancement of each Columbia Management investment team, as well as the discussion with the CIO regarding the investment personnel talent being infused to enhance support for certain Funds. The Board also observed the materials demonstrating the strength and depth of Columbia Management’s equity and fixed income research departments.
In connection with the Board’s evaluation of the overall package of services provided by Columbia Management, the Board also considered the quality of administrative services provided to the Fund by Columbia Management, recalling the information it
| | | | |
| Semiannual Report 2013 | | | 31 | |
| | |
| |
| | Columbia Global Equity Fund |
Approval of Investment Management Services and Subadvisory Agreements (continued)
received highlighting significant achievements in 2012 in the performance of administrative services. In evaluating the quality of services provided under the IMS Agreement and the Fund’s Administrative Service Agreement, the Board also took into account the organization and strength of the Fund’s and its service providers’ compliance programs. The Board also reviewed the financial condition of Columbia Management and its affiliates and their ability to carry out their responsibilities under the IMS Agreement and the Fund’s other service agreements with affiliates of Ameriprise Financial, observing the financial strength of Ameriprise Financial, with its solid balance sheet. In addition, the Board discussed the acceptability of the terms of the IMS Agreement (including the relatively broad scope of services required to be performed by Columbia Management). The Board concluded that the services being performed under the IMS Agreement were of a reasonably high quality.
Based on the foregoing, and based on other information received (both oral and written, including the information on investment performance referenced below) and other considerations, the Board concluded that Columbia Management and its affiliates were in a position to continue to provide a high quality and level of services to the Fund.
With respect to the Subadviser, the Board observed that it had previously approved the Subadviser’s code of ethics and compliance program, that the Chief Compliance Officer of the Fund continues to monitor the code and the program, and that no material concerns have been reported. The Board also considered the Subadviser’s organizational strength and resources, portfolio management team depth and capabilities and investment process. The Board also considered the Subadviser’s capability and wherewithal to carry out its responsibilities under the Subadvisory Agreement. In addition, the Board discussed the acceptability of the terms of the Subadvisory Agreement including the scope of services required to be performed. The Board noted that the terms of the Subadvisory Agreement are generally consistent with the terms of other subadviser agreements for subadvisers who manage other funds managed by the Investment Manager. It was observed that no changes were recommended to the Subadvisory Agreement. Based on the foregoing, and based on other information received (both oral and written) and other considerations, including, in particular, the performance of the Fund (discussed below) as well as the Investment Manager’s recommendation that the Board approve renewal of the Subadvisory Agreement with the Subadviser, the Board concluded that the services being performed under the Subadvisory Agreement were of a reasonably high quality.
Based on the foregoing, and based on other information received (both oral and written, including the information on investment performance referenced below) and other considerations, the Board concluded that the Subadviser was in a position to continue to provide a high quality and level of services to the Fund.
Investment Performance
For purposes of evaluating the nature, extent and quality of services provided under the Advisory Agreements, the Board carefully reviewed the investment performance of the Fund. In this regard, the Board considered detailed reports providing the results of analyses performed by an independent organization showing, for various periods, the performance of the Fund, the performance of a benchmark index, the percentage ranking of the Fund among its comparison group and the net assets of the Fund. The Board observed that the Fund’s investment performance met expectations.
Additionally, the Board reviewed the performance of the Subadviser and Columbia Management’s process for monitoring the Subadviser. The Board considered, in particular, management’s rationale for recommending the continued retention of the Subadviser.
Comparative Fees, Costs of Services Provided and the Profits Realized by Columbia Management, its Affiliates and the Subadviser from their Relationships with the Fund
The Board reviewed comparative fees and the costs of services to be provided under each of the Advisory Agreements. The Board members considered detailed comparative information set forth in an annual report on fees and expenses, including, among other things, data (based on analyses conducted by an independent organization) showing a comparison of the Fund’s expenses with median expenses paid by funds in its comparative peer universe, as well as data showing the Fund’s contribution to Columbia Management’s profitability. The Board reviewed the fees charged to comparable institutional or other accounts/vehicles managed by Columbia Management and discussed differences in how the products are managed and operated, noting no unreasonable differences in the levels of contractual fees.
The Board accorded particular weight to the notion that the level of fees should reflect a rational pricing model applied consistently across the various product lines in the Fund family, while assuring that the overall fees for each Fund (with few defined exceptions) are generally in line with the “pricing philosophy” (i.e., that the total expense ratio of the Fund is no higher than the median expense ratio of funds in the same comparison universe of the Fund). In this connection, the Board also
| | |
| 32 | | Semiannual Report 2013 |
| | |
| |
| Columbia Global Equity Fund | | |
Approval of Investment Management Services and Subadvisory Agreements (continued)
considered the Independent Consultant’s report that concluded that the Funds’ expense cap philosophy of assuring that each Fund’s total expense ratio is not above its peer universe median ratio is reasonable. The Board took into account that the Fund’s total expense ratio (after considering proposed expense caps/waivers) approximated the peer universe’s median expense ratio. Additionally, the Board reviewed the level of subadvisory fees paid to the Subadviser, noting that the fees are paid by the Investment Manager and do not impact the fees paid by the Fund. The Board observed that the subadvisory fee level for the Subadviser was generally comparable to those charged by other subadvisers to similar funds managed by the Investment Manager. The Board also reviewed fee rates charged by the Subadviser to other client accounts. Based on its review, the Board concluded that the Fund’s management and subadvisory fees were fair and reasonable in light of the extent and quality of services that the Fund receives.
The Board also considered the expected profitability of Columbia Management and its affiliates in connection with Columbia Management providing investment management services to the Fund. In this regard, the Board referred to a detailed profitability report, discussing the profitability to Columbia Management and Ameriprise Financial from managing, operating and distributing the Funds. In this regard, the Board observed that 2012 profitability approximates 2011 profitability and that, as was the case in 2011, 2012 profitability remained generally in line with (and, in many cases, lower than) the reported profitability of other asset management firms. Further, the Board considered the Independent Consultant’s report that concluded that Columbia Management’s profitability, particularly in comparison to industry competitors, was reasonable and not excessive. It also took into account the indirect economic benefits flowing to Columbia Management or its affiliates in connection with managing or distributing the Funds, such as the enhanced ability to offer various other financial products to Ameriprise Financial customers, soft dollar benefits and overall reputational advantages. The Board noted that the fees paid by the Funds should permit the Investment Manager to offer competitive compensation to its personnel, make necessary investments in its business and earn an appropriate profit. The Board concluded that profitability levels were reasonable.
Economies of Scale to be Realized
The Board also considered the economies of scale that might be realized by Columbia Management as the Fund grows and took note of the extent to which Fund shareholders might also benefit from such growth. In this regard, the Board took into account that IMS fees decline as Fund assets exceed various breakpoints, all of which have not been surpassed.
Based on the foregoing, the Board, including all of the Independent Trustees, concluded that fees payable under the Advisory Agreements were fair and reasonable in light of the extent and quality of services provided. In reaching this conclusion, no single factor was determinative. On April 17, 2013, the Board, including all of the Independent Trustees, approved the renewal of the Advisory Agreements.
| | | | |
| Semiannual Report 2013 | | | 33 | |
| | |
| |
| | Columbia Global Equity Fund |
[THIS PAGE INTENTIONALLY LEFT BLANK]
| | |
| 34 | | Semiannual Report 2013 |
| | |
| |
| Columbia Global Equity Fund | | |
[THIS PAGE INTENTIONALLY LEFT BLANK]
| | | | |
| Semiannual Report 2013 | | | 35 | |
| | |
| |
| | Columbia Global Equity Fund |
[THIS PAGE INTENTIONALLY LEFT BLANK]
| | |
| 36 | | Semiannual Report 2013 |
| | |
| |
| Columbia Global Equity Fund | | |
Important Information About This Report
Each fund mails one shareholder report to each shareholder address. If you would like more than one report, please call shareholder services at 800.345.6611 and additional reports will be sent to you.
The policy of the Board is to vote the proxies of the companies in which each fund holds investments consistent with the procedures as stated in the Statement of Additional Information (SAI). You may obtain a copy of the SAI without charge by calling 800.345.6611; contacting your financial intermediary; visiting columbiamanagement.com; or searching the website of the Securities and Exchange Commission (SEC) at sec.gov. Information regarding how each fund voted proxies relating to portfolio securities is filed with the SEC by August 31 for the most recent 12-month period ending June 30 of that year, and is available without charge by visiting columbiamanagement.com; or searching the website of the SEC at sec.gov.
Each fund files a complete schedule of portfolio holdings with the SEC for the first and third quarters of each fiscal year on Form N-Q. Each fund’s Form N-Q is available on the SEC’s website at sec.gov and may be reviewed and copied at the SEC’s Public Reference Room in Washington, D.C. Information on the operation of the Public Reference Room may be obtained by calling 800.SEC.0330. Each fund’s complete schedule of portfolio holdings, as filed on Form N-Q, can also be obtained without charge, upon request, by calling 800.345.6611.
| | | | |
| Semiannual Report 2013 | | | 37 | |

Columbia Global Equity Fund
P.O. Box 8081
Boston, MA 02266-8081
columbiamanagement.com
This information is for use with concurrent or prior delivery of a fund prospectus. Please read and consider the investment objectives, risks, charges and expenses for any fund carefully before investing. For a prospectus which contains this and other important information about the Fund, go to columbiamanagement.com. The Fund is distributed by Columbia Management Investment Distributors, Inc., member FINRA, and managed by Columbia Management Investment Advisers, LLC.
© 2013 Columbia Management Investment Advisers, LLC. All rights reserved.
SAR155_10_C01_(06/13)
| | |
Semiannual Report April 30, 2013 | |  |
| | |
Columbia Seligman Global Technology Fund | | |

| | |
| |
| | Columbia Seligman Global Technology Fund |
President’s Message

Dear Shareholders,
U.S. equities had a strong first quarter
Similar to 2012, equities once again were the best performing asset class in the first quarter of 2013. The S&P 500 Index reached an all-time closing high on the last trading day of the quarter and pushed through its October 2007 peak. Although global equities have performed well year-to-date, there is significant performance divergence among regions. In local currency terms, Japanese equities were the best performing developed market globally, and U.S. stocks outperformed most other global equity markets. European equities rose in the first quarter but trailed U.S. stocks and had a turbulent March, as investors were reminded of instability in the eurozone with news of a banking crisis in Cyprus.
Although all 10 sectors of the S&P 500 Index delivered positive returns, this was a rally led by defensive stocks such as those in health care, consumer staples and utilities. Materials and technology stocks were the weakest sectors.
High yield leads fixed income; most sectors flat to down
The fixed-income markets lagged equities with modest, single-digit returns coming from municipals and high-yield sectors in the United States. Most government and investment-grade credit sectors were
roughly flat to down for the first quarter of 2013. Emerging market bonds were the biggest disappointment with single-digit losses.
Columbia Management to begin delivering summary prospectuses
Each Columbia fund is required to update its prospectus on an annual basis. Beginning with June 2013 prospectus updates, shareholders of Columbia retail mutual funds will start to receive a summary prospectus, rather than the full length (statutory) mutual fund prospectus they have received in the past.
Each fund’s summary prospectus will include the following key information:
| > | | Portfolio turnover rate information |
| > | | Principal investment strategies, principal risks and performance information |
| > | | Purchase and sale information |
| > | | Financial intermediary compensation information |
Each fund’s statutory prospectus will contain additional information about the fund and its risks. Both the statutory and summary prospectus will be updated each year, and will be available at columbiamanagement.com. Shareholders may request a printed version of a statutory prospectus at no cost by calling 800.345.6611 or sending an email to serviceinquiries@columbiamanagement.com.
Stay on track with Columbia Management
Backed by more than 100 years of experience, Columbia Management is one of the nation’s largest asset managers. At the heart of our success — and, most importantly, that of our investors — are highly talented industry professionals, brought together by a unique way of working. We are dedicated to helping you take advantage of today’s opportunities and anticipate tomorrow’s. We stay abreast of the latest investment trends and ideas, using our collective insight to evaluate events and transform them into solutions you can use.
Visit columbiamanagement.com for:
| > | | The Columbia Management Perspectives blog, featuring timely posts by our investment teams |
| > | | Detailed up-to-date fund performance and portfolio information |
| > | | Economic analysis and market commentary |
| > | | Quarterly fund commentaries |
| > | | Columbia Management Investor, our award-winning quarterly newsletter for shareholders |
Thank you for your continued support of the Columbia Funds. We look forward to serving your investment needs for many years to come.
Best Regards,

J. Kevin Connaughton
President, Columbia Funds
The S&P 500 Index, an unmanaged index, measures the performance of 500 large-capitalization U.S. stocks and is frequently used as a general measure of market performance. Indices are not available for investment, are not professionally managed and do not reflect sales charges, fees, brokerage commissions, taxes or other expenses of investing.
Investors should consider the investment objectives, risks, charges and expenses of a mutual fund carefully before investing. For a free prospectus, which contains this and other important information about a fund, visit columbiamanagement.com. The prospectus should be read carefully before investing.
Columbia Funds are distributed by Columbia Management Investment Distributors, Inc., member FINRA, and managed by Columbia Management Investment Advisers, LLC.
© 2013 Columbia Management Investment Advisers, LLC. All rights reserved.
Semiannual Report 2013
| | |
| |
| Columbia Seligman Global Technology Fund | | |
Table of Contents
Fund Investment Manager
Columbia Management Investment
Advisers, LLC
225 Franklin Street
Boston, MA 02110
Fund Distributor
Columbia Management Investment
Distributors, Inc.
225 Franklin Street
Boston, MA 02110
Fund Transfer Agent
Columbia Management Investment
Services Corp.
P.O. Box 8081
Boston, MA 02266-8081
For more information about any of the funds, please visit columbiamanagement.com or call 800.345.6611. Customer Service Representatives are available to answer your questions Monday through Friday from 8 a.m. to 8 p.m. Eastern time.
The views expressed in this report reflect the current views of the respective parties. These views are not guarantees of future performance and involve certain risks, uncertainties and assumptions that are difficult to predict, so actual outcomes and results may differ significantly from the views expressed. These views are subject to change at any time based upon economic, market or other conditions and the respective parties disclaim any responsibility to update such views. These views may not be relied on as investment advice and, because investment decisions for a Columbia Fund are based on numerous factors, may not be relied on as an indication of trading intent on behalf of any particular Columbia Fund. References to specific securities should not be construed as a recommendation or investment advice.
Semiannual Report 2013
| | |
| |
| | Columbia Seligman Global Technology Fund |
Performance Overview
(Unaudited)
Performance Summary
| > | | Columbia Seligman Global Technology Fund (the Fund) Class A shares returned 10.07% excluding sales charges for the six months ended April 30, 2013. |
| > | | The Fund outperformed its benchmark, the MSCI World Information Technology (IT) Index (Net), which returned 8.95% during the same six-month period. |
| | | | | | | | | | | | | | | | | | |
Average Annual Total Returns (%) (for period ended April 30, 2013) | |
| | | Inception | | 6 Months
cumulative | | | 1 Year | | | 5 Years | | | 10 Years | |
Class A | | 05/23/94 | | | | | | | | | | | | | | | | |
Excluding sales charges | | | | | 10.07 | | | | -2.51 | | | | 5.41 | | | | 9.43 | |
Including sales charges | | | | | 3.76 | | | | -8.11 | | | | 4.17 | | | | 8.79 | |
Class B | | 04/22/96 | | | | | | | | | | | | | | | | |
Excluding sales charges | | | | | 9.67 | | | | -3.21 | | | | 4.62 | | | | 8.61 | |
Including sales charges | | | | | 4.67 | | | | -8.05 | | | | 4.28 | | | | 8.61 | |
Class C | | 05/27/99 | | | | | | | | | | | | | | | | |
Excluding sales charges | | | | | 9.61 | | | | -3.21 | | | | 4.62 | | | | 8.61 | |
Including sales charges | | | | | 8.61 | | | | -4.18 | | | | 4.62 | | | | 8.61 | |
Class I* | | 08/03/09 | | | 10.34 | | | | -2.06 | | | | 5.78 | | | | 9.63 | |
Class K* | | 08/03/09 | | | 10.11 | | | | -2.37 | | | | 5.56 | | | | 9.51 | |
Class R | | 04/30/03 | | | 9.92 | | | | -2.75 | | | | 5.13 | | | | 9.16 | |
Class R4* | | 11/08/12 | | | 10.25 | | | | -2.35 | | | | 5.44 | | | | 9.45 | |
Class R5* | | 08/03/09 | | | 10.27 | | | | -2.11 | | | | 5.72 | | | | 9.59 | |
Class Z* | | 09/27/10 | | | 10.23 | | | | -2.24 | | | | 5.57 | | | | 9.51 | |
MSCI World IT Index (Net) | | | | | 8.95 | | | | 2.84 | | | | 3.95 | | | | 7.52 | |
Returns for Class A are shown with and without the maximum initial sales charge of 5.75%. Returns for Class B are shown with and without the applicable contingent deferred sales charge (CDSC) of 5.00% in the first year, declining to 1.00% in the sixth year and eliminated thereafter. Returns for Class C are shown with and without the 1.00% CDSC for the first year only. The Fund’s other classes are not subject to sales charges and have limited eligibility. Please see the Fund’s prospectus for details. Performance for different share classes will vary based on differences in sales charges and fees associated with each class. All results shown assume reinvestment of distributions during the period. Returns do not reflect the deduction of taxes that a shareholder may pay on Fund distributions or on the redemption of Fund shares. Performance results reflect the effect of any fee waivers or reimbursements of Fund expenses by Columbia Management Investment Advisers, LLC and/or any of its affiliates. Absent these fee waivers or expense reimbursement arrangements, performance results would have been lower.
The performance information shown represents past performance and is not a guarantee of future results. The investment return and principal value of your investment will fluctuate so that your shares, when redeemed, may be worth more or less than their original cost. Current performance may be lower or higher than the performance information shown. You may obtain performance information current to the most recent month-end by contacting your financial intermediary, visiting columbiamanagement.com or calling 800.345.6611.
| * | The returns shown for periods prior to the share class inception date (including returns for the Life of the Fund, if shown, which are since Fund inception) include the returns of the Fund’s oldest share class. These returns are adjusted to reflect any higher class-related operating expenses of the newer share classes, as applicable. Please visit columbiamanagement.com/mutual-funds/appended-performance for more information. |
The MSCI World IT Index (Net) is a free float-adjusted market capitalization index designed to measure information technology stock performance in the global developed equity market.
Indices are not available for investment, are not professionally managed and do not reflect sales charges, fees, brokerage commissions, taxes or other expenses of investing. Securities in the Fund may not match those in an index.
| | |
| |
| Columbia Seligman Global Technology Fund | | |
Portfolio Overview
(Unaudited)
| | | | |
Top Ten Holdings (%) (at April 30, 2013) | |
Synopsys, Inc. | | | 8.4 | |
Symantec Corp. | | | 8.2 | |
Lam Research Corp. | | | 5.3 | |
Apple, Inc. | | | 5.1 | |
Check Point Software Technologies Ltd. | | | 4.2 | |
Google, Inc., Class A | | | 4.0 | |
QUALCOMM, Inc. | | | 3.9 | |
Broadcom Corp., Class A | | | 3.7 | |
KLA-Tencor Corp. | | | 3.5 | |
NetApp, Inc. | | | 3.4 | |
Percentages indicated are based upon total investments (excluding Money Market Funds).
For further detail about these holdings, please refer to the section entitled “Portfolio of Investments.”
Fund holdings are as of the date given, are subject to change at any time, and are not recommendations to buy or sell any security.
| | | | |
Portfolio Breakdown (%) (at April 30, 2013) | |
Common Stocks | | | 100.0 | |
Consumer Discretionary | | | 0.7 | |
Industrials | | | 1.8 | |
Information Technology | | | 96.6 | |
Telecommunication Services | | | 0.9 | |
Total | | | 100.0 | |
Percentages indicated are based upon total investments. The Fund’s portfolio composition is subject to change.
Portfolio Management
Richard Parower, CFA
Paul Wick
Ajay Diwan
Benjamin Lu
Morningstar Style Box™

The Morningstar Style Box™ is based on a fund’s portfolio holdings. For equity funds, the vertical axis shows the market capitalization of the stocks owned, and the horizontal axis shows investment style (value, blend, or growth). Information shown is based on the most recent data provided by Morningstar.
©2013 Morningstar, Inc. All rights reserved. The Morningstar information contained herein: (1) is proprietary to Morningstar and/or its content providers; (2) may not be copied or distributed; and (3) is not warranted to be accurate, complete or timely. Neither Morningstar nor its content providers are responsible for any damages or losses arising from any use of this information.
| | |
| |
| | Columbia Seligman Global Technology Fund |
Understanding Your Fund’s Expenses
(Unaudited)
As an investor, you incur two types of costs. There are transaction costs, which generally include sales charges on purchases and may include redemption fees. There are also ongoing costs, which generally include management fees, distribution and service (Rule 12b-1) fees, and other fund expenses. The following information is intended to help you understand your ongoing costs (in dollars) of investing in the Fund and to help you compare these costs with the ongoing costs of investing in other mutual funds.
Analyzing Your Fund’s Expenses
To illustrate these ongoing costs, we have provided examples and calculated the expenses paid by investors in each share class of the Fund during the period. The actual and hypothetical information in the table is based on an initial investment of $1,000 at the beginning of the period indicated and held for the entire period. Expense information is calculated two ways and each method provides you with different information. The amount listed in the “Actual” column is calculated using the Fund’s actual operating expenses and total return for the period. You may use the Actual information, together with the amount invested, to estimate the expenses that you paid over the period. Simply divide your account value by $1,000 (for example, an $8,600 account value divided by $1,000 = 8.6), then multiply the results by the expenses paid during the period under the Actual column. The amount listed in the “Hypothetical” column assumes a 5% annual rate of return before expenses (which is not the Fund’s actual return) and then applies the Fund’s actual expense ratio for the period to the hypothetical return. You should not use the hypothetical account values and expenses to estimate either your actual account balance at the end of the period or the expenses you paid during the period. See “Compare With Other Funds” below for details on how to use the hypothetical data.
Compare With Other Funds
Since all mutual funds are required to include the same hypothetical calculations about expenses in shareholder reports, you can use this information to compare the ongoing cost of investing in the Fund with other funds. To do so, compare the hypothetical example with the 5% hypothetical examples that appear in the shareholder reports of other funds. As you compare hypothetical examples of other funds, it is important to note that hypothetical examples are meant to highlight the ongoing costs of investing in a fund only and do not reflect any transaction costs, such as sales charges, or redemption or exchange fees. Therefore, the hypothetical calculations are useful in comparing ongoing costs only, and will not help you determine the relative total costs of owning different funds. If transaction costs were included in these calculations, your costs would be higher.
| | |
| |
| Columbia Seligman Global Technology Fund | | |
Understanding Your Fund’s Expenses (continued)
(Unaudited)
November 1, 2012 – April 30, 2013
| | | | | | | | | | | | | | | | | | | | | | | | | | | | |
| | | Account Value at the
Beginning of the
Period ($) | | | Account Value at the
End of the
Period ($) | | | Expenses Paid During
the Period ($) | | | Fund’s Annualized
Expense Ratio (%) | |
| | | | Actual | | | | Hypothetical | | | | Actual | | | | Hypothetical | | | | Actual | | | | Hypothetical | | | | Actual | |
Class A | | | 1,000.00 | | | | 1,000.00 | | | | 1,100.70 | | | | 1,017.65 | | | | 7.50 | | | | 7.20 | | | | 1.44 | |
Class B | | | 1,000.00 | | | | 1,000.00 | | | | 1,096.70 | | | | 1,013.93 | | | | 11.39 | | | | 10.94 | | | | 2.19 | |
Class C | | | 1,000.00 | | | | 1,000.00 | | | | 1,096.10 | | | | 1,013.93 | | | | 11.38 | | | | 10.94 | | | | 2.19 | |
Class I | | | 1,000.00 | | | | 1,000.00 | | | | 1,103.40 | | | | 1,019.84 | | | | 5.22 | | | | 5.01 | | | | 1.00 | |
Class K | | | 1,000.00 | | | | 1,000.00 | | | | 1,101.10 | | | | 1,018.35 | | | | 6.77 | | | | 6.51 | | | | 1.30 | |
Class R | | | 1,000.00 | | | | 1,000.00 | | | | 1,099.20 | | | | 1,016.41 | | | | 8.80 | | | | 8.45 | | | | 1.69 | |
Class R4 | | | 1,000.00 | | | | 1,000.00 | | | | 1,115.80 | * | | | 1,018.65 | | | | 6.18 | * | | | 6.21 | | | | 1.24 | * |
Class R5 | | | 1,000.00 | | | | 1,000.00 | | | | 1,102.70 | | | | 1,019.69 | | | | 5.37 | | | | 5.16 | | | | 1.03 | |
Class Z | | | 1,000.00 | | | | 1,000.00 | | | | 1,102.30 | | | | 1,018.94 | | | | 6.15 | | | | 5.91 | | | | 1.18 | |
| * | For the period November 8, 2012 through April 30, 2013. Class R4 shares commenced operations on November 8, 2012. |
Expenses paid during the period are equal to the annualized expense ratio for each class as indicated above, multiplied by the average account value over the period and then multiplied by the number of days in the Fund’s most recent fiscal half year and divided by 365.
Expenses do not include fees and expenses incurred indirectly by the Fund from the underlying funds in which the Fund may invest (also referred to as “acquired funds”), including affiliated and non-affiliated pooled investment vehicles (including mutual funds and exchange-traded funds).
Had Columbia Management Investment Advisers, LLC and/or certain of its affiliates not waived/reimbursed certain fees and expenses, account value at the end of the period would have been reduced.
Columbia Management Investment Advisers, LLC and/or certain of its affiliates have contractually agreed to waive certain fees and to absorb certain expenses until February 28, 2014, unless sooner terminated at the sole discretion of the Fund’s Board, such that net expenses, subject to applicable exclusions, will not exceed 1.56% for Class A, 2.31% for Class B, 2.31% for Class C, 1.12% for Class I, 1.42% for Class K, 1.81% for Class R, 1.31% for Class R4, 1.17% for Class R5 and 1.31% for Class Z. Any amounts waived will not be reimbursed by the Fund. This change was effective March 1, 2013. If this change had been in place for the entire six month period ended April 30, 2013, the actual expenses paid would have been $8.13 for Class A, $12.01 for Class B, $12.01 for Class C, $5.84 for Class I, $7.40 for Class K, $9.42 for Class R, $6.53 for Class R4, $6.10 for Class R5 and $6.83 for Class Z; the hypothetical expenses paid would have been $7.80 for Class A, $11.53 for Class B, $11.53 for Class C, $5.61 for Class I, $7.10 for Class K, $9.05 for Class R, $6.56 for Class R4, $5.86 for Class R5 and $6.56 for Class Z.
| | |
| |
| | Columbia Seligman Global Technology Fund |
Portfolio of Investments
April 30, 2013 (Unaudited)
(Percentages represent value of investments compared to net assets)
| | | | | | | | |
| Common Stocks 96.3% | |
| Issuer | | Shares | | | Value ($) | |
Consumer Discretionary 0.7% | |
Diversified Consumer Services 0.2% | |
| | |
LifeLock, Inc.(a) | | | 90,709 | | | | 816,381 | |
|
Media 0.5% | |
| | |
News Corp., Class A | | | 64,800 | | | | 2,006,856 | |
| | | | | | | | | |
Total Consumer Discretionary | | | | | | | 2,823,237 | |
| | |
| | | | | | | | |
Industrials 1.7% | |
Building Products 0.3% | |
| | |
Asahi Glass Co., Ltd. | | | 139,900 | | | | 1,099,225 | |
|
Commercial Services & Supplies 0.7% | |
| | |
Performant Financial Corp.(a) | | | 276,535 | | | | 2,690,685 | |
|
Electrical Equipment 0.7% | |
| | |
Nidec Corp. | | | 44,400 | | | | 3,019,474 | |
| | | | | | | | | |
Total Industrials | | | | | | | 6,809,384 | |
| | |
| | | | | | | | |
Information Technology 93.0% | |
Communications Equipment 7.5% | |
| | |
Cisco Systems, Inc. | | | 610,700 | | | | 12,775,844 | |
| | |
HTC Corp. | | | 235,000 | | | | 2,402,088 | |
| | |
QUALCOMM, Inc. | | | 243,371 | | | | 14,996,521 | |
| | | | | | | | | |
Total | | | | | | | 30,174,453 | |
|
Computers & Peripherals 14.0% | |
| | |
Apple, Inc. | | | 44,655 | | | | 19,771,001 | |
| | |
Electronics for Imaging, Inc.(a) | | | 275,303 | | | | 7,356,096 | |
| | |
EMC Corp.(a) | | | 539,100 | | | | 12,092,013 | |
| | |
NCR Corp.(a) | | | 155,300 | | | | 4,235,031 | |
| | |
NetApp, Inc.(a) | | | 373,200 | | | | 13,020,948 | |
| | | | | | | | | |
Total | | | | | | | 56,475,089 | |
|
Electronic Equipment, Instruments & Components 2.3% | |
| | |
Flextronics International Ltd.(a) | | | 708,700 | | | | 5,067,205 | |
| | |
Kyocera Corp. | | | 41,400 | | | | 4,211,317 | |
| | | | | | | | | |
Total | | | | | | | 9,278,522 | |
|
Internet Software & Services 6.8% | |
| | |
Akamai Technologies, Inc.(a) | | | 47,223 | | | | 2,073,562 | |
| | |
Google, Inc., Class A(a) | | | 19,000 | | | | 15,666,830 | |
| | |
GREE, Inc. | | | 132,500 | | | | 1,698,314 | |
| | |
SINA Corp.(a) | | | 34,600 | | | | 1,948,672 | |
| | |
Tencent Holdings Ltd. | | | 66,400 | | | | 2,290,685 | |
| | |
Yahoo!, Inc.(a) | | | 143,700 | | | | 3,553,701 | |
| | | | | | | | | |
Total | | | | | | | 27,231,764 | |
|
IT Services 5.9% | |
| | |
Blackhawk Network Holdings, Inc.(a) | | | 24,622 | | | | 589,451 | |
| | |
Global Payments, Inc. | | | 50,200 | | | | 2,329,280 | |
| | | | | | | | |
| Common Stocks (continued) | | | | | | | | |
| Issuer | | Shares | | | Value ($) | |
International Business Machines Corp. | | | 32,300 | | | | 6,542,042 | |
| | |
InterXion Holding NV(a) | | | 100,800 | | | | 2,523,024 | |
| | |
Visa, Inc., Class A | | | 15,700 | | | | 2,644,822 | |
| | |
Western Union Co. (The) | | | 218,100 | | | | 3,230,061 | |
| | |
WNS Holdings Ltd., ADR(a) | | | 408,932 | | | | 6,109,444 | |
| | | | | | | | | |
Total | | | | | | | 23,968,124 | |
|
Semiconductors & Semiconductor Equipment 23.6% | |
| | |
Advanced Micro Devices, Inc.(a) | | | 311,663 | | | | 878,890 | |
| | |
Avago Technologies Ltd. | | | 229,100 | | | | 7,322,036 | |
| | |
Broadcom Corp., Class A | | | 402,400 | | | | 14,486,400 | |
| | |
Cirrus Logic, Inc.(a) | | | 63,500 | | | | 1,226,185 | |
| | |
KLA-Tencor Corp. | | | 252,600 | | | | 13,703,550 | |
| | |
Lam Research Corp.(a) | | | 447,337 | | | | 20,675,916 | |
| | |
Lattice Semiconductor Corp.(a) | | | 169,998 | | | | 790,491 | |
| | |
Marvell Technology Group Ltd. | | | 617,278 | | | | 6,641,911 | |
| | |
Microsemi Corp.(a) | | | 310,700 | | | | 6,462,560 | |
| | |
NXP Semiconductor NV(a) | | | 142,800 | | | | 3,934,140 | |
| | |
RDA Microelectronics, Inc. | | | 146,898 | | | | 1,401,407 | |
| | |
RF Micro Devices, Inc.(a) | | | 424,400 | | | | 2,380,884 | |
| | |
Samsung Electronics Co., Ltd. | | | 2,900 | | | | 4,010,759 | |
| | |
Skyworks Solutions, Inc.(a) | | | 142,294 | | | | 3,140,429 | |
| | |
Teradyne, Inc.(a) | | | 336,600 | | | | 5,533,704 | |
| | |
Tokyo Electron Ltd. | | | 46,800 | | | | 2,395,420 | |
| | | | | | | | | |
Total | | | | | | | 94,984,682 | |
|
Software 32.9% | |
Application Software 16.3% | |
| | |
Citrix Systems, Inc.(a) | | | 117,100 | | | | 7,280,107 | |
| | |
Nuance Communications, Inc.(a) | | | 505,699 | | | | 9,628,509 | |
| | |
PTC, Inc.(a) | | | 496,030 | | | | 11,909,680 | |
| | |
QLIK Technologies, Inc.(a) | | | 36,220 | | | | 942,082 | |
| | |
Salesforce.com, Inc.(a) | | | 30,000 | | | | 1,233,300 | |
| | |
SAP AG, ADR | | | 27,100 | | | | 2,163,935 | |
| | |
Synopsys, Inc.(a) | | | 913,849 | | | | 32,505,609 | |
| | | | | | | | | |
Total | | | | | | | 65,663,222 | |
| |
Home Entertainment Software 0.3% | | | | | |
| | |
Electronic Arts, Inc.(a) | | | 65,900 | | | | 1,160,499 | |
| |
Systems Software 16.3% | | | | | |
| | |
BMC Software, Inc.(a) | | | 133,700 | | | | 6,080,676 | |
| | |
Check Point Software Technologies Ltd.(a) | | | 349,405 | | | | 16,289,261 | |
| | |
Proofpoint, Inc.(a) | | | 264,300 | | | | 4,841,976 | |
| | |
Red Hat, Inc.(a) | | | 28,700 | | | | 1,375,591 | |
| | |
Symantec Corp.(a) | | | 1,310,062 | | | | 31,834,507 | |
The accompanying Notes to Financial Statements are an integral part of this statement.
| | |
| |
| Columbia Seligman Global Technology Fund | | |
Portfolio of Investments (continued)
April 30, 2013 (Unaudited)
| | | | | | | | |
| Common Stocks (continued) | | | | | | | | |
| Issuer | | Shares | | | Value ($) | |
VMware, Inc., Class A(a) | | | 37,500 | | | | 2,643,750 | |
| | |
Websense, Inc.(a) | | | 161,800 | | | | 2,886,512 | |
| | | | | | | | | |
Total | | | | | | | 65,952,273 | |
| | | | | | | | | |
Total Software | | | | | | | 132,775,994 | |
| | | | | | | | | |
Total Information Technology | | | | | | | 374,888,628 | |
| | | | | | | | | |
| | | | | | | | |
| Common Stocks (continued) | | | | | | | | |
| Issuer | | Shares | | | Value ($) | |
Telecommunication Services 0.9% | |
Wireless Telecommunication Services 0.9% | | | | | |
| | |
SBA Communications Corp., Class A(a) | | | 43,900 | | | | 3,467,661 | |
| | | | | | | | | |
Total Telecommunication Services | | | | | | | 3,467,661 | |
| | | | | | | | | |
Total Common Stocks | | | | | | | | |
(Cost: $324,761,478) | | | | | | | 387,988,910 | |
| | | | | | | | | |
Total Investments | | | | | | | | |
(Cost: $324,761,478) | | | | | | | 387,988,910 | (b) |
| | | | | | | | | |
Other Assets & Liabilities, Net | | | | | | | 14,932,014 | |
| | | | | | | | | |
Net Assets | | | | | | | 402,920,924 | |
| | | | | | | | | |
Notes to Portfolio of Investments
| (b) | As defined in the Investment Company Act of 1940, an affiliated company is one in which the Fund owns 5% or more of its outstanding voting securities, or a company which is under common ownership or control with the Fund. Holdings and transactions in these affiliated companies during the period ended April 30, 2013, are as follows: |
| | | | | | | | | | | | | | | | | | | | | | | | |
| Issuer | | Beginning
Cost ($) | | | Purchase
Cost ($) | | | Proceeds
From Sales ($) | | | Ending
Cost ($) | | | Dividends –
Affiliated
Issuers ($) | | | Value ($) | |
Columbia Short-Term Cash Fund | | | 29,174,963 | | | | 74,996,497 | | | | (104,171,460 | ) | | | — | | | | 12,136 | | | | — | |
Abbreviation Legend
| | |
| ADR | | American Depositary Receipt |
Fair Value Measurements
Generally accepted accounting principles (GAAP) require disclosure regarding the inputs and valuation techniques used to measure fair value and any changes in valuation inputs or techniques. In addition, investments shall be disclosed by major category.
The Fund categorizes its fair value measurements according to a three-level hierarchy that maximizes the use of observable inputs and minimizes the use of unobservable inputs by prioritizing that the most observable input be used when available. Observable inputs are those that market participants would use in pricing an investment based on market data obtained from sources independent of the reporting entity. Unobservable inputs are those that reflect the Fund’s assumptions about the information market participants would use in pricing an investment. An investment’s level within the fair value hierarchy is based on the lowest level of any input that is deemed significant to the asset or liability’s fair value measurement. The input levels are not necessarily an indication of the risk or liquidity associated with investments at that level. For example, certain U.S. government securities are generally high quality and liquid, however, they are reflected as Level 2 because the inputs used to determine fair value may not always be quoted prices in an active market.
Fair value inputs are summarized in the three broad levels listed below:
| > | | Level 1 — Valuations based on quoted prices for investments in active markets that the Fund has the ability to access at the measurement date (including NAV for open-end mutual funds). Valuation adjustments are not applied to Level 1 investments. |
| > | | Level 2 — Valuations based on other significant observable inputs (including quoted prices for similar securities, interest rates, prepayment speeds, credit risks, etc.). |
| > | | Level 3 — Valuations based on significant unobservable inputs (including the Fund’s own assumptions and judgment in determining the fair value of investments). |
Inputs that are used in determining fair value of an investment may include price information, credit data, volatility statistics, and other factors. These inputs can be either observable or unobservable. The availability of observable inputs can vary between investments, and is affected by various factors such as the type of investment, and the volume and level of activity for that investment or similar investments in the marketplace. The inputs will be considered by the Investment Manager, along with any other relevant factors in the calculation of an investment’s fair value. The Fund uses prices and inputs that are current as of the measurement date, which may include periods of market dislocations. During these periods, the availability of prices and inputs may be reduced for many investments. This condition could cause an investment to be reclassified between the various levels within the hierarchy.
Foreign equity securities actively traded in markets where there is a significant delay in the local close relative to the New York Stock Exchange (NYSE) are classified as Level 2. The values of these securities may include an adjustment to reflect the impact of significant market movements following the close of local trading, as described in Note 2 to the financial statements — Security Valuation.
Investments falling into the Level 3 category are primarily supported by quoted prices from brokers and dealers participating in the market for those investments. However, these may be classified as Level 3 investments due to lack of market transparency and corroboration to support these
The accompanying Notes to Financial Statements are an integral part of this statement.
| | |
| |
| | Columbia Seligman Global Technology Fund |
Portfolio of Investments (continued)
April 30, 2013 (Unaudited)
Fair Value Measurements (continued)
quoted prices. Additionally, valuation models may be used as the pricing source for any remaining investments classified as Level 3. These models may rely on one or more significant unobservable inputs and/or significant assumptions by the Investment Manager. Inputs used in valuations may include, but are not limited to, financial statement analysis, capital account balances, discount rates and estimated cash flows, and comparable company data.
Under the direction of the Fund’s Board of Trustees (the Board), the Investment Manager’s Valuation Committee (the Committee) is responsible for carrying out the valuation procedures approved by the Board. The Committee consists of voting and non-voting members from various groups within the Investment Manager’s organization, including operations and accounting, trading and investments, compliance, risk management and legal.
The Committee meets at least monthly to review and approve valuation matters, which may include a description of specific valuation determinations, data regarding pricing information received from approved pricing vendors and brokers and the results of Board-approved valuation control policies and procedures (the Policies). The Policies address, among other things, instances when market quotations are readily available, including recommendations of third party pricing vendors and a determination of appropriate pricing methodologies; events that require specific valuation determinations and assessment of fair value techniques; securities with a potential for stale pricing, including those that are illiquid, restricted, or in default; and the effectiveness of third- party pricing vendors, including periodic reviews of vendors. The Committee meets more frequently, as needed, to discuss additional valuation matters, which may include the need to review back-testing results, review time-sensitive information or approve related valuation actions. The Committee reports to the Board, with members of the Committee meeting with the Board at each of its regularly scheduled meetings to discuss valuation matters and actions during the period, similar to those described earlier.
For investments categorized as Level 3, the Committee monitors information similar to that described above, which may include: (i) data specific to the issuer or comparable issuers, (ii) general market or specific sector news and (iii) quoted prices and specific or similar security transactions. The Committee considers this data and any changes from prior periods in order to assess the reasonableness of observable and unobservable inputs, any assumptions or internal models used to value those securities and changes in fair value. This data is also used to corroborate, when available, information received from approved pricing vendors and brokers. Various factors impact the frequency of monitoring this information (which may occur as often as daily). However, the Committee may determine that changes to inputs, assumptions and models are not required as a result of the monitoring procedures performed.
The following table is a summary of the inputs used to value the Fund’s investments at April 30, 2013:
| | | | | | | | | | | | | | | | |
| Description | | Level 1
Quoted Prices in Active
Markets for Identical
Assets ($) | | | Level 2
Other Significant
Observable Inputs ($) | | | Level 3
Significant
Unobservable Inputs ($) | | | Total ($) | |
Equity Securities | | | | | | | | | | | | | | | | |
| | | | |
Common Stocks | | | | | | | | | | | | | | | | |
| | | | |
Consumer Discretionary | | | 2,823,237 | | | | — | | | | — | | | | 2,823,237 | |
| | | | |
Industrials | | | 2,690,686 | | | | 4,118,698 | | | | — | | | | 6,809,384 | |
| | | | |
Information Technology | | | 357,880,044 | | | | 17,008,584 | | | | — | | | | 374,888,628 | |
| | | | |
Telecommunication Services | | | 3,467,661 | | | | — | | | | — | | | | 3,467,661 | |
| | | | | | | | | | | | | | | | | |
Total Equity Securities | | | 366,861,628 | | | | 21,127,282 | | | | — | | | | 387,988,910 | |
| | | | | | | | | | | | | | | | | |
Total | | | 366,861,628 | | | | 21,127,282 | | | | — | | | | 387,988,910 | |
| | | | | | | | | | | | | | | | | |
See the Portfolio of Investments for all investment classifications not indicated in the table.
The Fund’s assets assigned to the Level 2 input category are generally valued using the market approach, in which a security’s value is determined through reference to prices and information from market transactions for similar or identical assets. These assets include certain foreign securities for which a third party statistical pricing service may be employed for purposes of fair market valuation. The models utilized by the third party statistical pricing service take into account a security’s correlation to available market data including, but not limited to, intraday index, ADR, and ETF movements.
There were no transfers of financial assets between Levels 1 and 2 during the period.
The accompanying Notes to Financial Statements are an integral part of this statement.
| | |
| |
| Columbia Seligman Global Technology Fund | | |
Statement of Assets and Liabilities
April 30, 2013 (Unaudited)
| | | | |
Assets | | | | |
| |
Investments, at value (identified cost $324,761,478) | | | $387,988,910 | |
| |
Receivable for: | | | | |
| |
Investments sold | | | 20,464,719 | |
| |
Capital shares sold | | | 155,093 | |
| |
Dividends | | | 23,825 | |
| |
Reclaims | | | 4,821 | |
| |
Expense reimbursement due from Investment Manager | | | 48 | |
| |
Prepaid expenses | | | 1,099 | |
| |
Total assets | | | 408,638,515 | |
| |
| |
Liabilities | | | | |
| |
Disbursements in excess of cash | | | 1,018,132 | |
| |
Payable for: | | | | |
| |
Investments purchased | | | 4,016,434 | |
| |
Capital shares purchased | | | 497,564 | |
| |
Investment management fees | | | 9,472 | |
| |
Distribution and/or service fees | | | 4,200 | |
| |
Transfer agent fees | | | 62,260 | |
| |
Administration fees | | | 665 | |
| |
Plan administration fees | | | 1 | |
| |
Compensation of board members | | | 14,961 | |
| |
Other expenses | | | 93,902 | |
| |
Total liabilities | | | 5,717,591 | |
| |
Net assets applicable to outstanding capital stock | | | $402,920,924 | |
| |
| |
Represented by | | | | |
| |
Paid-in capital | | | $364,534,347 | |
| |
Excess of distributions over net investment income | | | (4,326,850 | ) |
| |
Accumulated net realized loss | | | (20,510,826 | ) |
| |
Unrealized appreciation (depreciation) on: | | | | |
| |
Investments | | | 63,227,432 | |
| |
Foreign currency translations | | | (3,179 | ) |
| |
Total — representing net assets applicable to outstanding capital stock | | | $402,920,924 | |
| |
The accompanying Notes to Financial Statements are an integral part of this statement.
| | |
| |
| | Columbia Seligman Global Technology Fund |
Statement of Assets and Liabilities (continued)
April 30, 2013 (Unaudited)
| | | | |
Class A | | | | |
| |
Net assets | | | $307,369,215 | |
| |
Shares outstanding | | | 13,912,275 | |
| |
Net asset value per share | | | $22.09 | |
| |
Maximum offering price per share(a) | | | $23.44 | |
| |
Class B | | | | |
| |
Net assets | | | $7,280,012 | |
| |
Shares outstanding | | | 389,135 | |
| |
Net asset value per share | | | $18.71 | |
| |
Class C | | | | |
| |
Net assets | | | $65,019,381 | |
| |
Shares outstanding | | | 3,476,741 | |
| |
Net asset value per share | | | $18.70 | |
| |
Class I | | | | |
| |
Net assets | | | $12,187 | |
| |
Shares outstanding | | | 544 | |
| |
Net asset value per share | | | $22.40 | |
| |
Class K | | | | |
| |
Net assets | | | $215,283 | |
| |
Shares outstanding | | | 9,687 | |
| |
Net asset value per share | | | $22.22 | |
| |
Class R | | | | |
| |
Net assets | | | $7,264,148 | |
| |
Shares outstanding | | | 336,316 | |
| |
Net asset value per share | | | $21.60 | |
| |
Class R4 | | | | |
| |
Net assets | | | $12,652 | |
| |
Shares outstanding | | | 561 | |
| |
Net asset value per share(b) | | | $22.54 | |
| |
Class R5 | | | | |
| |
Net assets | | | $50,259 | |
| |
Shares outstanding | | | 2,251 | |
| |
Net asset value per share | | | $22.33 | |
| |
Class Z | | | | |
| |
Net assets | | | $15,697,787 | |
| |
Shares outstanding | | | 704,079 | |
| |
Net asset value per share | | | $22.30 | |
| |
| (a) | The maximum offering price per share is calculated by dividing the net asset value by 1.0 minus the maximum sales charge of 5.75%. |
| (b) | Net asset value per share rounds to this amount due to fractional shares outstanding. |
The accompanying Notes to Financial Statements are an integral part of this statement.
| | |
| 10 | | Semiannual Report 2013 |
| | |
| |
| Columbia Seligman Global Technology Fund | | |
Statement of Operations
Six Months Ended April 30, 2013 (Unaudited)
| | | | |
Net investment income | | | | |
Income: | | | | |
Dividends — unaffiliated issuers | | | $1,534,479 | |
Dividends — affiliated issuers | | | 12,136 | |
Income from securities lending — net | | | 4,888 | |
Foreign taxes withheld | | | (6,764 | ) |
| |
Total income | | | 1,544,739 | |
| |
Expenses: | | | | |
Investment management fees | | | 1,755,214 | |
Distribution and/or service fees | | | | |
Class A | | | 388,121 | |
Class B | | | 37,614 | |
Class C | | | 324,168 | |
Class R | | | 19,769 | |
Transfer agent fees | | | | |
Class A | | | 424,465 | |
Class B | | | 10,284 | |
Class C | | | 88,639 | |
Class K | | | 54 | |
Class R | | | 10,808 | |
Class R4(a) | | | 5 | |
Class R5 | | | 22 | |
Class Z | | | 26,646 | |
Administration fees | | | 123,173 | |
Plan administration fees | | | | |
Class K | | | 271 | |
Compensation of board members | | | 12,118 | |
Custodian fees | | | 6,585 | |
Printing and postage fees | | | 93,066 | |
Registration fees | | | 58,860 | |
Professional fees | | | 20,381 | |
Other | | | 22,491 | |
| |
Total expenses | | | 3,422,754 | |
Fees waived or expenses reimbursed by Investment Manager and its affiliates | | | (207,776 | ) |
| |
Total net expenses | | | 3,214,978 | |
| |
Net investment loss | | | (1,670,239 | ) |
| |
| |
Realized and unrealized gain (loss) — net | | | | |
Net realized gain (loss) on: | | | | |
Investments | | | (3,902,514 | ) |
Foreign currency translations | | | (87,493 | ) |
| |
Net realized loss | | | (3,990,007 | ) |
Net change in unrealized appreciation (depreciation) on: | | | | |
Investments | | | 45,224,076 | |
Foreign currency translations | | | (358 | ) |
| |
Net change in unrealized appreciation (depreciation) | | | 45,223,718 | |
| |
Net realized and unrealized gain | | | 41,233,711 | |
| |
Net increase in net assets resulting from operations | | | $39,563,472 | |
| |
| (a) | Class R4 Shares are for the period from November 8, 2012 (commencement of operations) to April 30, 2013. |
The accompanying Notes to Financial Statements are an integral part of this statement.
| | | | |
| Semiannual Report 2013 | | | 11 | |
| | |
| |
| | Columbia Seligman Global Technology Fund |
Statement of Changes in Net Assets
| | | | | | | | |
| | | Six Months Ended
April 30, 2013
(Unaudited) | | | Year Ended
October 31, 2012 | |
Operations | | | | | | | | |
| | |
Net investment loss | | | $(1,670,239 | ) | | | $(3,866,218 | ) |
| | |
Net realized gain (loss) | | | (3,990,007 | ) | | | 24,133,365 | |
| | |
Net change in unrealized appreciation (depreciation) | | | 45,223,718 | | | | (21,140,371 | ) |
| |
Net increase (decrease) in net assets resulting from operations | | | 39,563,472 | | | | (873,224 | ) |
| |
Increase (decrease) in net assets from capital stock activity | | | (51,029,705 | ) | | | (64,598,440 | ) |
| |
Proceeds from regulatory settlements (Note 6) | | | — | | | | 549,229 | |
| |
Total decrease in net assets | | | (11,466,233 | ) | | | (64,922,435 | ) |
| | |
Net assets at beginning of period | | | 414,387,157 | | | | 479,309,592 | |
| |
Net assets at end of period | | | $402,920,924 | | | | $414,387,157 | |
| |
Excess of distributions over net investment income | | | $(4,326,850 | ) | | | $(2,656,611 | ) |
| |
The accompanying Notes to Financial Statements are an integral part of this statement.
| | |
| 12 | | Semiannual Report 2013 |
| | |
| |
| Columbia Seligman Global Technology Fund | | |
Statement of Changes in Net Assets (continued)
| | | | | | | | | | | | | | | | |
| | | Six Months Ended
April 30, 2013(a) (Unaudited) | | | Year Ended October 31, 2012 | |
| | | Shares | | | Dollars ($) | | | Shares | | | Dollars ($) | |
Capital stock activity | | | | | | | | | | | | | | | | |
| | | | |
Class A shares | | | | | | | | | | | | | | | | |
| | | | |
Subscriptions(b) | | | 467,111 | | | | 9,989,403 | | | | 1,481,336 | | | | 31,709,659 | |
| | | | |
Redemptions | | | (2,073,066 | ) | | | (44,096,658 | ) | | | (4,037,141 | ) | | | (84,857,521 | ) |
| |
Net decrease | | | (1,605,955 | ) | | | (34,107,255 | ) | | | (2,555,805 | ) | | | (53,147,862 | ) |
| |
Class B shares | | | | | | | | | | | | | | | | |
| | | | |
Subscriptions | | | 11,542 | | | | 212,052 | | | | 18,371 | | | | 335,241 | |
| | | | |
Redemptions(b) | | | (82,962 | ) | | | (1,490,266 | ) | | | (281,766 | ) | | | (4,989,133 | ) |
| |
Net decrease | | | (71,420 | ) | | | (1,278,214 | ) | | | (263,395 | ) | | | (4,653,892 | ) |
| |
Class C shares | | | | | | | | | | | | | | | | |
| | | | |
Subscriptions | | | 72,811 | | | | 1,314,157 | | | | 207,136 | | | | 3,786,171 | |
| | | | |
Redemptions | | | (369,552 | ) | | | (6,673,645 | ) | | | (615,194 | ) | | | (10,998,545 | ) |
| |
Net decrease | | | (296,741 | ) | | | (5,359,488 | ) | | | (408,058 | ) | | | (7,212,374 | ) |
| |
Class K shares | | | | | | | | | | | | | | | | |
| | | | |
Subscriptions | | | 31 | | | | 665 | | | | 138 | | | | 3,012 | |
| | | | |
Redemptions | | | (1,792 | ) | | | (37,983 | ) | | | (10,079 | ) | | | (205,692 | ) |
| |
Net decrease | | | (1,761 | ) | | | (37,318 | ) | | | (9,941 | ) | | | (202,680 | ) |
| |
Class R shares | | | | | | | | | | | | | | | | |
| | | | |
Subscriptions | | | 54,672 | | | | 1,134,597 | | | | 194,558 | | | | 4,130,511 | |
| | | | |
Redemptions | | | (131,800 | ) | | | (2,755,909 | ) | | | (275,814 | ) | | | (5,663,081 | ) |
| |
Net decrease | | | (77,128 | ) | | | (1,621,312 | ) | | | (81,256 | ) | | | (1,532,570 | ) |
| |
Class R4 shares | | | | | | | | | | | | | | | | |
| | | | |
Subscriptions | | | 561 | | | | 12,202 | | | | — | | | | — | |
| |
Net increase | | | 561 | | | | 12,202 | | | | — | | | | — | |
| |
Class R5 shares | | | | | | | | | | | | | | | | |
| | | | |
Subscriptions | | | 555 | | | | 11,644 | | | | 6,708 | | | | 156,195 | |
| | | | |
Redemptions | | | (6,460 | ) | | | (135,170 | ) | | | (162 | ) | | | (3,317 | ) |
| |
Net increase (decrease) | | | (5,905 | ) | | | (123,526 | ) | | | 6,546 | | | | 152,878 | |
| |
Class Z shares | | | | | | | | | | | | | | | | |
| | | | |
Subscriptions | | | 244,211 | | | | 5,182,694 | | | | 697,655 | | | | 14,609,408 | |
| | | | |
Redemptions | | | (633,127 | ) | | | (13,697,488 | ) | | | (592,650 | ) | | | (12,611,348 | ) |
| |
Net increase (decrease) | | | (388,916 | ) | | | (8,514,794 | ) | | | 105,005 | | | | 1,998,060 | |
| |
Total net decrease | | | (2,447,265 | ) | | | (51,029,705 | ) | | | (3,206,904 | ) | | | (64,598,440 | ) |
| |
| (a) | Class R4 shares are for the period from November 8, 2012 (commencement of operations) to April 30, 2013 |
| (b) | Includes conversions of Class B shares to Class A shares, if any. |
The accompanying Notes to Financial Statements are an integral part of this statement.
| | | | |
| Semiannual Report 2013 | | | 13 | |
| | |
| |
| | Columbia Seligman Global Technology Fund |
Financial Highlights
The following tables are intended to help you understand the Fund’s financial performance. Certain information reflects financial results for a single share of a class held for the periods shown. Per share net investment income (loss) amounts are calculated based on average shares outstanding during the period. Total return assumes reinvestment of all dividends and distributions, if any. Total return does not reflect payment of sales charges, if any, and is not annualized for periods of less than one year.
| | | | | | | | | | | | | | | | | | | | | | | | |
| |
| Six Months Ended
April 30, 2013 |
| | | Year Ended October 31, | |
Class A | | | (Unaudited) | | | | 2012 | | | | 2011 | | | | 2010 | | | | 2009 | | | | 2008 | |
Per share data | | | | | | | | | | | | | | | | | | | | | | | | |
Net asset value, beginning of period | | | $20.07 | | | | $20.16 | | | | $20.24 | | | | $16.50 | | | | $11.77 | | | | $19.82 | |
| | | | | | | | | | | | | | | | | | | | | | | | | |
Income from investment operations: | | | | | | | | | | | | | | | | | | | | | | | | |
| | | | | | |
Net investment loss | | | (0.07 | ) | | | (0.15 | ) | | | (0.15 | ) | | | (0.16 | ) | | | (0.20 | ) | | | (0.21 | ) |
| | | | | | | | | | | | | | | | | | | | | | | | | |
Net realized and unrealized gain (loss) | | | 2.09 | | | | 0.04 | | | | 0.21 | | | | 3.87 | | | | 4.74 | | | | (7.84 | ) |
| | | | | | | | | | | | | | | | | | | | | | | | | |
Total from investment operations | | | 2.02 | | | | (0.11 | ) | | | 0.06 | | | | 3.71 | | | | 4.54 | | | | (8.05 | ) |
| | | | | | | | | | | | | | | | | | | | | | | | | |
Less distributions to shareholders: | | | | | | | | | | | | | | | | | | | | | | | | |
| | | | | | |
Net investment income | | | — | | | | — | | | | (0.14 | ) | | | — | | | | — | | | | — | |
| | | | | | | | | | | | | | | | | | | | | | | | | |
Total distributions to shareholders | | | — | | | | — | | | | (0.14 | ) | | | — | | | | — | | | | — | |
| | | | | | | | | | | | | | | | | | | | | | | | | |
Proceeds from regulatory settlements | | | — | | | | 0.02 | | | | — | | | | 0.03 | | | | 0.19 | | | | — | |
| | | | | | | | | | | | | | | | | | | | | | | | | |
Net asset value, end of period | | | $22.09 | | | | $20.07 | | | | $20.16 | | | | $20.24 | | | | $16.50 | | | | $11.77 | |
| | | | | | | | | | | | | | | | | | | | | | | | | |
Total return | | | 10.07 | % | | | (0.45 | %)(a) | | | 0.26 | % | | | 22.67 | %(b) | | | 40.19 | %(c) | | | (40.62 | %) |
| | | | | | | | | | | | | | | | | | | | | | | | | |
Ratios to average net assets(d) | | | | | | | | | | | | | | | | | | | | | | | | |
| | | | | | |
Total gross expenses | | | 1.54 | %(e) | | | 1.50 | % | | | 1.49 | % | | | 1.67 | % | | | 1.92 | % | | | 1.76 | % |
| | | | | | | | | | | | | | | | | | | | | | | | | |
Total net expenses(f) | | | 1.44 | %(e) | | | 1.40 | %(g) | | | 1.49 | %(g) | | | 1.57 | % | | | 1.91 | % | | | 1.76 | % |
| | | | | | | | | | | | | | | | | | | | | | | | | |
Net investment loss | | | (0.69 | %)(e) | | | (0.70 | %) | | | (0.70 | %) | | | (0.89 | %) | | | (1.46 | %) | | | (1.23 | %) |
| | | | | | | | | | | | | | | | | | | | | | | | | |
Supplemental data | | | | | | | | | | | | | | | | | | | | | | | | |
| | | | | | |
Net assets, end of period (in thousands) | | | $307,369 | | | | $311,523 | | | | $364,366 | | | | $418,600 | | | | $325,790 | | | | $165,249 | |
| | | | | | | | | | | | | | | | | | | | | | | | | |
Portfolio turnover | | | 36 | % | | | 88 | % | | | 95 | % | | | 111 | % | | | 150 | % | | | 171 | % |
| | | | | | | | | | | | | | | | | | | | | | | | | |
Notes to Financial Highlights
| (a) | The Fund received proceeds from regulatory settlements. Had the Fund not received these proceeds, the total return would have been lower by 0.11%. |
| (b) | The Fund received proceeds from regulatory settlements. Had the Fund not received these proceeds, the total return would have been lower by 0.16%. |
| (c) | The Fund received proceeds from regulatory settlements. Had the Fund not received these proceeds, the total return would have been lower by 1.61%. |
| (d) | In addition to the fees and expenses which the Fund bears directly, the Fund indirectly bears a pro rata share of the fees and expenses of the acquired funds in which it invests. Such indirect expenses are not included in the reported expense ratios. |
| (f) | Total net expenses include the impact of certain waivers/reimbursements made by the Investment Manager and certain of its affiliates, if applicable. |
| (g) | The benefits derived from expense reductions had an impact of less than 0.01%. |
The accompanying Notes to Financial Statements are an integral part of this statement.
| | |
| 14 | | Semiannual Report 2013 |
| | |
| |
| Columbia Seligman Global Technology Fund | | |
Financial Highlights (continued)
| | | | | | | | | | | | | | | | | | | | | | | | |
| |
| Six Months Ended
April 30, 2013 |
| | | Year Ended October 31, | |
Class B | | | (Unaudited) | | | | 2012 | | | | 2011 | | | | 2010 | | | | 2009 | | | | 2008 | |
Per share data | | | | | | | | | | | | | | | | | | | | | | | | |
Net asset value, beginning of period | | | $17.06 | | | | $17.27 | | | | $17.35 | | | | $14.25 | | | | $10.24 | | | | $17.38 | |
| | | | | | | | | | | | | | | | | | | | | | | | | |
Income from investment operations: | | | | | | | | | | | | | | | | | | | | | | | | |
| | | | | | |
Net investment loss | | | (0.13 | ) | | | (0.27 | ) | | | (0.26 | ) | | | (0.26 | ) | | | (0.26 | ) | | | (0.29 | ) |
| | | | | | | | | | | | | | | | | | | | | | | | | |
Net realized and unrealized gain (loss) | | | 1.78 | | | | 0.04 | | | | 0.18 | | | | 3.33 | | | | 4.11 | | | | (6.85 | ) |
| | | | | | | | | | | | | | | | | | | | | | | | | |
Total from investment operations | | | 1.65 | | | | (0.23 | ) | | | (0.08 | ) | | | 3.07 | | | | 3.85 | | | | (7.14 | ) |
| | | | | | | | | | | | | | | | | | | | | | | | | |
Proceeds from regulatory settlements | | | — | | | | 0.02 | | | | — | | | | 0.03 | | | | 0.16 | | | | — | |
| | | | | | | | | | | | | | | | | | | | | | | | | |
Net asset value, end of period | | | $18.71 | | | | $17.06 | | | | $17.27 | | | | $17.35 | | | | $14.25 | | | | $10.24 | |
| | | | | | | | | | | | | | | | | | | | | | | | | |
Total return | | | 9.67 | % | | | (1.22 | %)(a) | | | (0.46 | %) | | | 21.75 | %(b) | | | 39.16 | %(c) | | | (41.08 | %) |
| | | | | | | | | | | | | | | | | | | | | | | | | |
Ratios to average net assets(d) | | | | | | | | | | | | | | | | | | | | | | | | |
| | | | | | |
Total gross expenses | | | 2.29 | %(e) | | | 2.26 | % | | | 2.25 | % | | | 2.44 | % | | | 2.64 | % | | | 2.51 | % |
| | | | | | | | | | | | | | | | | | | | | | | | | |
Total net expenses(f) | | | 2.19 | %(e) | | | 2.17 | %(g) | | | 2.25 | %(g) | | | 2.34 | % | | | 2.63 | % | | | 2.51 | % |
| | | | | | | | | | | | | | | | | | | | | | | | | |
Net investment loss | | | (1.43 | %)(e) | | | (1.47 | %) | | | (1.47 | %) | | | (1.66 | %) | | | (2.21 | %) | | | (1.98 | %) |
| | | | | | | | | | | | | | | | | | | | | | | | | |
Supplemental data | | | | | | | | | | | | | | | | | | | | | | | | |
| | | | | | |
Net assets, end of period (in thousands) | | | $7,280 | | | | $7,858 | | | | $12,499 | | | | $19,558 | | | | $21,966 | | | | $7,086 | |
| | | | | | | | | | | | | | | | | | | | | | | | | |
Portfolio turnover | | | 36 | % | | | 88 | % | | | 95 | % | | | 111 | % | | | 150 | % | | | 171 | % |
| | | | | | | | | | | | | | | | | | | | | | | | | |
Notes to Financial Highlights
| (a) | The Fund received proceeds from regulatory settlements. Had the Fund not received these proceeds, the total return would have been lower by 0.11%. |
| (b) | The Fund received proceeds from regulatory settlements. Had the Fund not received these proceeds, the total return would have been lower by 0.18%. |
| (c) | The Fund received proceeds from regulatory settlements. Had the Fund not received these proceeds, the total return would have been lower by 1.61%. |
| (d) | In addition to the fees and expenses which the Fund bears directly, the Fund indirectly bears a pro rata share of the fees and expenses of the acquired funds in which it invests. Such indirect expenses are not included in the reported expense ratios. |
| (f) | Total net expenses include the impact of certain waivers/reimbursements made by the Investment Manager and certain of its affiliates, if applicable. |
| (g) | The benefits derived from expense reductions had an impact of less than 0.01%. |
The accompanying Notes to Financial Statements are an integral part of this statement.
| | | | |
| Semiannual Report 2013 | | | 15 | |
| | |
| |
| | Columbia Seligman Global Technology Fund |
Financial Highlights (continued)
| | | | | | | | | | | | | | | | | | | | | | | | |
| |
| Six Months Ended
April 30, 2013 |
| | | Year Ended October 31, | |
Class C | | | (Unaudited) | | | | 2012 | | | | 2011 | | | | 2010 | | | | 2009 | | | | 2008 | |
Per share data | | | | | | | | | | | | | | | | | | | | | | | | |
Net asset value, beginning of period | | | $17.06 | | | | $17.26 | | | | $17.37 | | | | $14.25 | | | | $10.25 | | | | $17.39 | |
| | | | | | | | | | | | | | | | | | | | | | | | | |
Income from investment operations: | | | | | | | | | | | | | | | | | | | | | | | | |
| | | | | | |
Net investment loss | | | (0.13 | ) | | | (0.26 | ) | | | (0.26 | ) | | | (0.26 | ) | | | (0.26 | ) | | | (0.28 | ) |
| | | | | | | | | | | | | | | | | | | | | | | | | |
Net realized and unrealized gain (loss) | | | 1.77 | | | | 0.04 | | | | 0.17 | | | | 3.35 | | | | 4.10 | | | | (6.86 | ) |
| | | | | | | | | | | | | | | | | | | | | | | | | |
Total from investment operations | | | 1.64 | | | | (0.22 | ) | | | (0.09 | ) | | | 3.09 | | | | 3.84 | | | | (7.14 | ) |
| | | | | | | | | | | | | | | | | | | | | | | | | |
Less distributions to shareholders: | | | | | | | | | | | | | | | | | | | | | | | | |
| | | | | | |
Net investment income | | | — | | | | — | | | | (0.02 | ) | | | — | | | | — | | | | — | |
| | | | | | | | | | | | | | | | | | | | | | | | | |
Total distributions to shareholders | | | — | | | | — | | | | (0.02 | ) | | | — | | | | — | | | | — | |
| | | | | | | | | | | | | | | | | | | | | | | | | |
Proceeds from regulatory settlements | | | — | | | | 0.02 | | | | — | | | | 0.03 | | | | 0.16 | | | | — | |
| | | | | | | | | | | | | | | | | | | | | | | | | |
Net asset value, end of period | | | $18.70 | | | | $17.06 | | | | $17.26 | | | | $17.37 | | | | $14.25 | | | | $10.25 | |
| | | | | | | | | | | | | | | | | | | | | | | | | |
Total return | | | 9.61 | % | | | (1.16 | %)(a) | | | (0.51 | %) | | | 21.89 | %(b) | | | 39.02 | %(c) | | | (41.06 | %) |
| | | | | | | | | | | | | | | | | | | | | | | | | |
Ratios to average net assets(d) | | | | | | | | | | | | | | | | | | | | | | | | |
| | | | | | |
Total gross expenses | | | 2.29 | %(e) | | | 2.25 | % | | | 2.25 | % | | | 2.43 | % | | | 2.70 | % | | | 2.51 | % |
| | | | | | | | | | | | | | | | | | | | | | | | | |
Total net expenses(f) | | | 2.19 | %(e) | | | 2.15 | %(g) | | | 2.25 | %(g) | | | 2.33 | % | | | 2.69 | % | | | 2.51 | % |
| | | | | | | | | | | | | | | | | | | | | | | | | |
Net investment loss | | | (1.44 | %)(e) | | | (1.45 | %) | | | (1.45 | %) | | | (1.65 | %) | | | (2.24 | %) | | | (1.98 | %) |
| | | | | | | | | | | | | | | | | | | | | | | | | |
Supplemental data | | | | | | | | | | | | | | | | | | | | | | | | |
| | | | | | |
Net assets, end of period (in thousands) | | | $65,019 | | | | $64,360 | | | | $72,162 | | | | $80,128 | | | | $69,849 | | | | $53,538 | |
| | | | | | | | | | | | | | | | | | | | | | | | | |
Portfolio turnover | | | 36 | % | | | 88 | % | | | 95 | % | | | 111 | % | | | 150 | % | | | 171 | % |
| | | | | | | | | | | | | | | | | | | | | | | | | |
Notes to Financial Highlights
| (a) | The Fund received proceeds from regulatory settlements. Had the Fund not received these proceeds, the total return would have been lower by 0.11%. |
| (b) | The Fund received proceeds from regulatory settlements. Had the Fund not received these proceeds, the total return would have been lower by 0.18%. |
| (c) | The Fund received proceeds from regulatory settlements. Had the Fund not received these proceeds, the total return would have been lower by 1.61%. |
| (d) | In addition to the fees and expenses which the Fund bears directly, the Fund indirectly bears a pro rata share of the fees and expenses of the acquired funds in which it invests. Such indirect expenses are not included in the reported expense ratios. |
| (f) | Total net expenses include the impact of certain waivers/reimbursements made by the Investment Manager and certain of its affiliates, if applicable. |
| (g) | The benefits derived from expense reductions had an impact of less than 0.01%. |
The accompanying Notes to Financial Statements are an integral part of this statement.
| | |
| 16 | | Semiannual Report 2013 |
| | |
| |
| Columbia Seligman Global Technology Fund | | |
Financial Highlights (continued)
| | | | | | | | | | | | | | | | | | | | |
| |
| Six Months Ended
April 30, 2013 |
| | | Year Ended October 31, | |
Class I | | | (Unaudited) | | | | 2012 | | | | 2011 | | | | 2010 | | | | 2009(a) | |
Per share data | | | | | | | | | | | | | | | | | | | | |
Net asset value, beginning of period | | | $20.30 | | | | $20.31 | | | | $20.37 | | | | $16.52 | | | | $15.56 | |
| | | | | | | | | | | | | | | | | | | | | |
Income from investment operations: | | | | | | | | | | | | | | | | | | | | |
| | | | | |
Net investment loss | | | (0.03 | ) | | | (0.06 | ) | | | (0.06 | ) | | | (0.08 | ) | | | (0.03 | ) |
| | | | | | | | | | | | | | | | | | | | | |
Net realized and unrealized gain | | | 2.13 | | | | 0.03 | | | | 0.22 | | | | 3.90 | | | | 0.99 | |
| | | | | | | | | | | | | | | | | | | | | |
Total from investment operations | | | 2.10 | | | | (0.03 | ) | | | 0.16 | | | | 3.82 | | | | 0.96 | |
| | | | | | | | | | | | | | | | | | | | | |
Less distributions to shareholders: | | | | | | | | | | | | | | | | | | | | |
| | | | | |
Net investment income | | | — | | | | — | | | | (0.22 | ) | | | — | | | | — | |
| | | | | | | | | | | | | | | | | | | | | |
Total distributions to shareholders | | | — | | | | — | | | | (0.22 | ) | | | — | | | | — | |
| | | | | | | | | | | | | | | | | | | | | |
Proceeds from regulatory settlements | | | — | | | | 0.02 | | | | — | | | | 0.03 | | | | — | |
| | | | | | | | | | | | | | | | | | | | | |
Net asset value, end of period | | | $22.40 | | | | $20.30 | | | | $20.31 | | | | $20.37 | | | | $16.52 | |
| | | | | | | | | | | | | | | | | | | | | |
Total return | | | 10.34 | % | | | (0.05 | %)(b) | | | 0.77 | % | | | 23.31 | %(c) | | | 6.17 | % |
| | | | | | | | | | | | | | | | | | | | | |
Ratios to average net assets(d) | | | | | | | | | | | | | | | | | | | | |
| | | | | |
Total gross expenses | | | 1.02 | %(e) | | | 1.00 | % | | | 1.09 | % | | | 1.17 | % | | | 1.07 | %(e) |
| | | | | | | | | | | | | | | | | | | | | |
Total net expenses(f) | | | 1.00 | %(e) | | | 0.97 | % | | | 1.09 | % | | | 1.12 | % | | | 1.07 | %(e) |
| | | | | | | | | | | | | | | | | | | | | |
Net investment loss | | | (0.26 | %)(e) | | | (0.26 | %) | | | (0.28 | %) | | | (0.45 | %) | | | (0.76 | %)(e) |
| | | | | | | | | | | | | | | | | | | | | |
Supplemental data | | | | | | | | | | | | | | | | | | | | |
| | | | | |
Net assets, end of period (in thousands) | | | $12 | | | | $11 | | | | $11 | | | | $28,563 | | | | $23,827 | |
| | | | | | | | | | | | | | | | | | | | | |
Portfolio turnover | | | 36 | % | | | 88 | % | | | 95 | % | | | 111 | % | | | 150 | % |
| | | | | | | | | | | | | | | | | | | | | |
Notes to Financial Highlights
| (a) | For the period from August 3, 2009 (commencement of operations) to October 31, 2009 |
| (b) | The Fund received proceeds from regulatory settlements. Had the Fund not received these proceeds, the total return would have been lower by 0.11%. |
| (c) | The Fund received proceeds from regulatory settlements. Had the Fund not received these proceeds, the total return would have been lower by 0.16%. |
| (d) | In addition to the fees and expenses which the Fund bears directly, the Fund indirectly bears a pro rata share of the fees and expenses of the acquired funds in which it invests. Such indirect expenses are not included in the reported expense ratios. |
| (f) | Total net expenses include the impact of certain waivers/reimbursements made by the Investment Manager and certain of its affiliates, if applicable. |
The accompanying Notes to Financial Statements are an integral part of this statement.
| | | | |
| Semiannual Report 2013 | | | 17 | |
| | |
| |
| | Columbia Seligman Global Technology Fund |
Financial Highlights (continued)
| | | | | | | | | | | | | | | | | | | | |
| |
| Six Months Ended
April 30, 2013 |
| | | Year Ended October 31, | |
Class K | | | (Unaudited) | | | | 2012 | | | | 2011 | | | | 2010 | | | | 2009(a) | |
Per share data | | | | | | | | | | | | | | | | | | | | |
Net asset value, beginning of period | | | $20.18 | | | | $20.22 | | | | $20.29 | | | | $16.51 | | | | $15.56 | |
| | | | | | | | | | | | | | | | | | | | | |
Income from investment operations: | | | | | | | | | | | | | | | | | | | | |
| | | | | |
Net investment loss | | | (0.06 | ) | | | (0.10 | ) | | | (0.10 | ) | | | (0.14 | ) | | | (0.04 | ) |
| | | | | | | | | | | | | | | | | | | | | |
Net realized and unrealized gain | | | 2.10 | | | | 0.04 | | | | 0.20 | | | | 3.89 | | | | 0.99 | |
| | | | | | | | | | | | | | | | | | | | | |
Total from investment operations | | | 2.04 | | | | (0.06 | ) | | | 0.10 | | | | 3.75 | | | | 0.95 | |
| | | | | | | | | | | | | | | | | | | | | |
Less distributions to shareholders: | | | | | | | | | | | | | | | | | | | | |
| | | | | |
Net investment income | | | — | | | | — | | | | (0.17 | ) | | | — | | | | — | |
| | | | | | | | | | | | | | | | | | | | | |
Total distributions to shareholders | | | — | | | | — | | | | (0.17 | ) | | | — | | | | — | |
| | | | | | | | | | | | | | | | | | | | | |
Proceeds from regulatory settlements | | | — | | | | 0.02 | | | | — | | | | 0.03 | | | | — | |
| | | | | | | | | | | | | | | | | | | | | |
Net asset value, end of period | | | $22.22 | | | | $20.18 | | | | $20.22 | | | | $20.29 | | | | $16.51 | |
| | | | | | | | | | | | | | | | | | | | | |
Total return | | | 10.11 | % | | | (0.20 | %)(b) | | | 0.48 | % | | | 22.89 | %(c) | | | 6.10 | % |
| | | | | | | | | | | | | | | | | | | | | |
Ratios to average net assets(d) | | | | | | | | | | | | | | | | | | | | |
| | | | | |
Total gross expenses | | | 1.32 | %(e) | | | 1.30 | % | | | 1.29 | % | | | 1.48 | % | | | 1.38 | %(e) |
| | | | | | | | | | | | | | | | | | | | | |
Total net expenses(f) | | | 1.30 | %(e) | | | 1.16 | % | | | 1.29 | % | | | 1.42 | % | | | 1.38 | %(e) |
| | | | | | | | | | | | | | | | | | | | | |
Net investment loss | | | (0.55 | %)(e) | | | (0.45 | %) | | | (0.50 | %) | | | (0.75 | %) | | | (1.07 | %)(e) |
| | | | | | | | | | | | | | | | | | | | | |
Supplemental data | | | | | | | | | | | | | | | | | | | | |
| | | | | |
Net assets, end of period (in thousands) | | | $215 | | | | $231 | | | | $432 | | | | $534 | | | | $289 | |
| | | | | | | | | | | | | | | | | | | | | |
Portfolio turnover | | | 36 | % | | | 88 | % | | | 95 | % | | | 111 | % | | | 150 | % |
| | | | | | | | | | | | | | | | | | | | | |
Notes to Financial Highlights
| (a) | For the period from August 3, 2009 (commencement of operations) to October 31,2009. |
| (b) | The Fund received proceeds from regulatory settlements. Had the Fund not received these proceeds, the total return would have been lower by 0.11%. |
| (c) | The Fund received proceeds from regulatory settlements. Had the Fund not received these proceeds, the total return would have been lower by 0.16%. |
| (d) | In addition to the fees and expenses which the Fund bears directly, the Fund indirectly bears a pro rata share of the fees and expenses of the acquired funds in which it invests. Such indirect expenses are not included in the reported expense ratios. |
| (f) | Total net expenses include the impact of certain waivers/reimbursements made by the Investment Manager and certain of its affiliates, if applicable. |
The accompanying Notes to Financial Statements are an integral part of this statement.
| | |
| 18 | | Semiannual Report 2013 |
| | |
| |
| Columbia Seligman Global Technology Fund | | |
Financial Highlights (continued)
| | | | | | | | | | | | | | | | | | | | | | | | |
| |
| Six Months Ended
April 30, 2013 |
| | | Year Ended October 31, | |
Class R | | | (Unaudited) | | | | 2012 | | | | 2011 | | | | 2010 | | | | 2009 | | | | 2008 | |
Per share data | | | | | | | | | | | | | | | | | | | | | | | | |
Net asset value, beginning of period | | | $19.65 | | | | $19.78 | | | | $19.88 | | | | $16.25 | | | | $11.62 | | | | $19.62 | |
| | | | | | | | | | | | | | | | | | | | | | | | | |
Income from investment operations: | | | | | | | | | | | | | | | | | | | | | | | | |
| | | | | | |
Net investment loss | | | (0.10 | ) | | | (0.19 | ) | | | (0.19 | ) | | | (0.22 | ) | | | (0.23 | ) | | | (0.24 | ) |
| | | | | | | | | | | | | | | | | | | | | | | | | |
Net realized and unrealized gain (loss) | | | 2.05 | | | | 0.04 | | | | 0.19 | | | | 3.82 | | | | 4.68 | | | | (7.76 | ) |
| | | | | | | | | | | | | | | | | | | | | | | | | |
Total from investment operations | | | 1.95 | | | | (0.15 | ) | | | — | | | | 3.60 | | | | 4.45 | | | | (8.00 | ) |
| | | | | | | | | | | | | | | | | | | | | | | | | |
Less distributions to shareholders: | | | | | | | | | | | | | | | | | | | | | | | | |
| | | | | | |
Net investment income | | | — | | | | — | | | | (0.10 | ) | | | — | | | | — | | | | — | |
| | | | | | | | | | | | | | | | | | | | | | | | | |
Total distributions to shareholders | | | — | | | | — | | | | (0.10 | ) | | | — | | | | — | | | | — | |
| | | | | | | | | | | | | | | | | | | | | | | | | |
Proceeds from regulatory settlements | | | — | | | | 0.02 | | | | — | | | | 0.03 | | | | 0.18 | | | | — | |
| | | | | | | | | | | | | | | | | | | | | | | | | |
Net asset value, end of period | | | $21.60 | | | | $19.65 | | | | $19.78 | | | | $19.88 | | | | $16.25 | | | | $11.62 | |
| | | | | | | | | | | | | | | | | | | | | | | | | |
Total return | | | 9.92 | % | | | (0.66 | %)(a) | | | (0.04 | %) | | | 22.34 | %(b) | | | 39.85 | %(c) | | | (40.77 | %) |
| | | | | | | | | | | | | | | | | | | | | | | | | |
Ratios to average net assets(d) | | | | | | | | | | | | | | | | | | | | | | | | |
| | | | | | |
Total gross expenses | | | 1.79 | %(e) | | | 1.75 | % | | | 1.74 | % | | | 1.95 | % | | | 2.17 | % | | | 2.01 | % |
| | | | | | | | | | | | | | | | | | | | | | | | | |
Total net expenses(f) | | | 1.69 | %(e) | | | 1.65 | %(g) | | | 1.74 | %(g) | | | 1.90 | % | | | 2.17 | % | | | 2.01 | % |
| | | | | | | | | | | | | | | | | | | | | | | | | |
Net investment loss | | | (0.93 | %)(e) | | | (0.94 | %) | | | (0.95 | %) | | | (1.22 | %) | | | (1.70 | %) | | | (1.48 | %) |
| | | | | | | | | | | | | | | | | | | | | | | | | |
Supplemental data | | | | | | | | | | | | | | | | | | | | | | | | |
| | | | | | |
Net assets, end of period (in thousands) | | | $7,264 | | | | $8,124 | | | | $9,787 | | | | $9,158 | | | | $5,131 | | | | $2,067 | |
| | | | | | | | | | | | | | | | | | | | | | | | | |
Portfolio turnover | | | 36 | % | | | 88 | % | | | 95 | % | | | 111 | % | | | 150 | % | | | 171 | % |
| | | | | | | | | | | | | | | | | | | | | | | | | |
Notes to Financial Highlights
| (a) | The Fund received proceeds from regulatory settlements. Had the Fund not received these proceeds, the total return would have been lower by 0.11%. |
| (b) | The Fund received proceeds from regulatory settlements. Had the Fund not received these proceeds, the total return would have been lower by 0.16%. |
| (c) | The Fund received proceeds from regulatory settlements. Had the Fund not received these proceeds, the total return would have been lower by 1.61%. |
| (d) | In addition to the fees and expenses which the Fund bears directly, the Fund indirectly bears a pro rata share of the fees and expenses of the acquired funds in which it invests. Such indirect expenses are not included in the reported expense ratios. |
| (f) | Total net expenses include the impact of certain waivers/reimbursements made by the Investment Manager and certain of its affiliates, if applicable. |
| (g) | The benefits derived from expense reductions had an impact of less than 0.01%. |
The accompanying Notes to Financial Statements are an integral part of this statement.
| | | | |
| Semiannual Report 2013 | | | 19 | |
| | |
| |
| | Columbia Seligman Global Technology Fund |
Financial Highlights (continued)
| | | | |
Class R4 | |
| Six Months Ended
April 30, 2013(a)
(Unaudited) |
|
Per share data | | | | |
Net asset value, beginning of period | | | $20.20 | |
| | | | | |
Income from investment operations: | | | | |
| |
Net investment loss | | | (0.07 | ) |
| | | | | |
Net realized and unrealized gain | | | 2.41 | |
| | | | | |
Total from investment operations | | | 2.34 | |
| | | | | |
Net asset value, end of period | | | $22.54 | |
| | | | | |
Total return | | | 11.58 | % |
| | | | | |
Ratios to average net assets(b) | | | | |
| |
Total gross expenses | | | 1.35 | %(c) |
| | | | | |
Total net expenses(d) | | | 1.24 | %(c) |
| | | | | |
Net investment loss | | | (0.65 | %)(c) |
| | | | | |
Supplemental data | | | | |
| |
Net assets, end of period (in thousands) | | | $13 | |
| | | | | |
Portfolio turnover | | | 36 | % |
| | | | | |
Notes to Financial Highlights
| (a) | For the period from November 8, 2012 (commencement of operations) to April 30, 2013. |
| (b) | In addition to the fees and expenses which the Fund bears directly, the Fund indirectly bears a pro rata share of the fees and expenses of the acquired funds in which it invests. Such indirect expenses are not included in the reported expense ratios. |
| (d) | Total net expenses include the impact of certain waivers/reimbursements made by the Investment Manager and certain of its affiliates, if applicable. |
The accompanying Notes to Financial Statements are an integral part of this statement.
| | |
| 20 | | Semiannual Report 2013 |
| | |
| |
| Columbia Seligman Global Technology Fund | | |
Financial Highlights (continued)
| | | | | | | | | | | | | | | | | | | | |
| |
| Six Months Ended
April 30, 2013 |
| | | Year Ended October 31, | |
Class R5 | | | (Unaudited) | | | | 2012 | | | | 2011 | | | | 2010 | | | | 2009(a) | |
Per share data | | | | | | | | | | | | | | | | | | | | |
Net asset value, beginning of period | | | $20.25 | | | | $20.27 | | | | $20.35 | | | | $16.52 | | | | $15.56 | |
| | | | | | | | | | | | | | | | | | | | | |
Income from investment operations: | | | | | | | | | | | | | | | | | | | | |
| | | | | |
Net investment loss | | | (0.01 | ) | | | (0.05 | ) | | | (0.05 | ) | | | (0.42 | ) | | | (0.02 | ) |
| | | | | | | | | | | | | | | | | | | | | |
Net realized and unrealized gain | | | 2.09 | | | | 0.01 | | | | 0.19 | | | | 4.22 | | | | 0.98 | |
| | | | | | | | | | | | | | | | | | | | | |
Total from investment operations | | | 2.08 | | | | (0.04 | ) | | | 0.14 | | | | 3.80 | | | | 0.96 | |
| | | | | | | | | | | | | | | | | | | | | |
Less distributions to shareholders: | | | | | | | | | | | | | | | | | | | | |
| | | | | |
Net investment income | | | — | | | | — | | | | (0.22 | ) | | | — | | | | — | |
| | | | | | | | | | | | | | | | | | | | | |
Total distributions to shareholders | | | — | | | | — | | | | (0.22 | ) | | | — | | | | — | |
| | | | | | | | | | | | | | | | | | | | | |
Proceeds from regulatory settlements | | | — | | | | 0.02 | | | | — | | | | 0.03 | | | | — | |
| | | | | | | | | | | | | | | | | | | | | |
Net asset value, end of period | | | $22.33 | | | | $20.25 | | | | $20.27 | | | | $20.35 | | | | $16.52 | |
| | | | | | | | | | | | | | | | | | | | | |
Total return | | | 10.27 | % | | | (0.10 | %)(b) | | | 0.66 | % | | | 23.18 | %(c) | | | 6.17 | % |
| | | | | | | | | | | | | | | | | | | | | |
Ratios to average net assets(d) | | | | | | | | | | | | | | | | | | | | |
| | | | | |
Total gross expenses | | | 1.05 | %(e) | | | 1.06 | % | | | 1.03 | % | | | 1.28 | % | | | 1.18 | %(e) |
| | | | | | | | | | | | | | | | | | | | | |
Total net expenses(f) | | | 1.03 | %(e) | | | 0.99 | % | | | 1.03 | % | | | 1.13 | % | | | 1.18 | %(e) |
| | | | | | | | | | | | | | | | | | | | | |
Net investment loss | | | (0.10 | %)(e) | | | (0.23 | %) | | | (0.21 | %) | | | (2.23 | %) | | | (0.56 | %)(e) |
| | | | | | | | | | | | | | | | | | | | | |
Supplemental data | | | | | | | | | | | | | | | | | | | | |
| | | | | |
Net assets, end of period (in thousands) | | | $50 | | | | $165 | | | | $33 | | | | $25,932 | | | | $5 | |
| | | | | | | | | | | | | | | | | | | | | |
Portfolio turnover | | | 36 | % | | | 88 | % | | | 95 | % | | | 111 | % | | | 150 | % |
| | | | | | | | | | | | | | | | | | | | | |
Notes to Financial Highlights
| (a) | For the period from August 3, 2009 (commencement of operations) to October 31, 2009 |
| (b) | The Fund received proceeds from regulatory settlements. Had the Fund not received these proceeds, the total return would have been lower by 0.11%. |
| (c) | The Fund received proceeds from regulatory settlements. Had the Fund not received these proceeds, the total return would have been lower by 0.16%. |
| (d) | In addition to the fees and expenses which the Fund bears directly, the Fund indirectly bears a pro rata share of the fees and expenses of the acquired funds in which it invests. Such indirect expenses are not included in the reported expense ratios. |
| (f) | Total net expenses include the impact of certain waivers/reimbursements made by the Investment Manager and certain of its affiliates, if applicable. |
The accompanying Notes to Financial Statements are an integral part of this statement.
| | | | |
| Semiannual Report 2013 | | | 21 | |
| | |
| |
| | Columbia Seligman Global Technology Fund |
Financial Highlights (continued)
| | | | | | | | | | | | | | | | |
| |
| Six Months Ended
April 30, 2013 |
| | | Year Ended October 31, | |
Class Z | | | (Unaudited) | | | | 2012 | | | | 2011 | | | | 2010(a) | |
Per share data | | | | | | | | | | | | | | | | |
Net asset value, beginning of period | | | $20.23 | | | | $20.26 | | | | $20.36 | | | | $19.28 | |
| | | | | | | | | | | | | | | | | |
Income from investment operations: | | | | | | | | | | | | | | | | |
| | | | |
Net investment loss | | | (0.04 | ) | | | (0.09 | ) | | | (0.06 | ) | | | (0.03 | ) |
| | | | | | | | | | | | | | | | | |
Net realized and unrealized gain | | | 2.11 | | | | 0.04 | | | | 0.18 | | | | 1.11 | |
| | | | | | | | | | | | | | | | | |
Total from investment operations | | | 2.07 | | | | (0.05 | ) | | | 0.12 | | | | 1.08 | |
| | | | | | | | | | | | | | | | | |
Less distributions to shareholders: | | | | | | | | | | | | | | | | |
| | | | |
Net investment income | | | — | | | | — | | | | (0.22 | ) | | | — | |
| | | | | | | | | | | | | | | | | |
Total distributions to shareholders | | | — | | | | — | | | | (0.22 | ) | | | — | |
| | | | | | | | | | | | | | | | | |
Proceeds from regulatory settlements | | | — | | | | 0.02 | | | | — | | | | — | |
| | | | | | | | | | | | | | | | | |
Net asset value, end of period | | | $22.30 | | | | $20.23 | | | | $20.26 | | | | $20.36 | |
| | | | | | | | | | | | | | | | | |
Total return | | | 10.23 | % | | | (0.15 | %)(b) | | | 0.55 | % | | | 5.60 | % |
| | | | | | | | | | | | | | | | | |
Ratios to average net assets(c) | | | | | | | | | | | | | | | | |
| | | | |
Total gross expenses | | | 1.29 | %(d) | | | 1.23 | % | | | 1.14 | % | | | 1.31 | %(d) |
| | | | | | | | | | | | | | | | | |
Total net expenses(e) | | | 1.18 | %(d) | | | 1.13 | %(f) | | | 1.14 | %(f) | | | 1.28 | %(d) |
| | | | | | | | | | | | | | | | | |
Net investment loss | | | (0.40 | %)(d) | | | (0.42 | %) | | | (0.30 | %) | | | (1.57 | %)(d) |
| | | | | | | | | | | | | | | | | |
Supplemental data | | | | | | | | | | | | | | | | |
| | | | |
Net assets, end of period (in thousands) | | | $15,698 | | | | $22,115 | | | | $20,020 | | | | $3 | |
| | | | | | | | | | | | | | | | | |
Portfolio turnover | | | 36 | % | | | 88 | % | | | 95 | % | | | 111 | % |
| | | | | | | | | | | | | | | | | |
Notes to Financial Highlights
| (a) | For the period from September 27, 2010 (commencement of operations) to October 31, 2010. |
| (b) | The Fund received proceeds from regulatory settlements. Had the Fund not received these proceeds, the total return would have been lower by 0.11%. |
| (c) | In addition to the fees and expenses which the Fund bears directly, the Fund indirectly bears a pro rata share of the fees and expenses of the acquired funds in which it invests. Such indirect expenses are not included in the reported expense ratios. |
| (e) | Total net expenses include the impact of certain waivers/reimbursements made by the Investment Manager and certain of its affiliates, if applicable. |
| (f) | The benefits derived from expense reductions had an impact of less than 0.01%. |
The accompanying Notes to Financial Statements are an integral part of this statement.
| | |
| 22 | | Semiannual Report 2013 |
| | |
| |
| Columbia Seligman Global Technology Fund | | |
Notes to Financial Statements
April 30, 2013 (Unaudited)
Note 1. Organization
Columbia Seligman Global Technology Fund (the Fund), a series of Columbia Funds Series Trust II (the Trust), is a non-diversified fund. The Trust is registered under the Investment Company Act of 1940, as amended (the 1940 Act), as an open-end management investment company organized as a Massachusetts business trust.
At a Special Meeting of Shareholders held on February 27, 2013, shareholders of the Fund approved a proposal to change the Fund’s classification from a diversified fund to a non-diversified fund.
Fund Shares
The Trust may issue an unlimited number of shares (without par value). The Fund offers Class A, Class B, Class C, Class I, Class K, Class R, Class R4, Class R5 and Class Z shares. All share classes have identical voting, dividend and liquidation rights. Each share class has its own expense structure and sales charges, as applicable.
Class A shares are subject to a maximum front-end sales charge of 5.75% based on the initial investment amount. Class A shares purchased without an initial sales charge in accounts aggregating $1 million to $50 million at the time of purchase are subject to a contingent deferred sales charge (CDSC) if the shares are sold within 18 months of purchase, charged as follows: 1.00% CDSC if redeemed within 12 months of purchase, and 0.50% CDSC if redeemed more than 12, but less than 18, months after purchase.
Class B shares may be subject to a maximum CDSC of 5.00% based upon the holding period after purchase. Class B shares will generally convert to Class A shares eight years after purchase. The Fund no longer accepts investments by new or existing investors in the Fund’s Class B shares, except in connection with the reinvestment of any dividend and/or capital gain distributions in Class B shares of the Fund and exchanges by existing Class B shareholders of certain other funds within the Columbia Family of Funds.
Class C shares are subject to a 1.00% CDSC on shares redeemed within one year of purchase.
Class I shares are not subject to sales charges and are available only to the Columbia Family of Funds.
Class K shares are not subject to sales charges, however this share class is closed to new investors.
Class R shares are not subject to sales charges and are available only to certain retirement plans and other eligible investors.
Class R4 shares are not subject to sales charges and are generally available only to omnibus retirement plans and certain other eligible investors. Class R4 shares commenced operations on November 8, 2012.
Class R5 shares are not subject to sales charges. Effective November 8, 2012, Class R5 shares are generally available only to investors purchasing through authorized investment professionals and omnibus retirement plans. Prior to November 8, 2012, Class R5 shares were closed to new investors.
Class Z shares are not subject to sales charges, and are available only to certain investors.
Note 2. Summary of Significant Accounting Policies
Use of Estimates
The preparation of financial statements in accordance with U.S. generally accepted accounting principles (GAAP) requires management to make certain estimates and assumptions that affect the reported amounts of assets and liabilities, the disclosure of contingent assets and liabilities at the date of the financial statements and the reported amounts of revenue and expenses during the reporting period. Actual results could differ from those estimates.
The following is a summary of significant accounting policies consistently followed by the Fund in the preparation of its financial statements.
Security Valuation
All equity securities are valued at the close of business of the New York Stock Exchange (NYSE). Equity securities are valued at the last quoted sales price on the principal exchange or market on which they trade, except for securities traded on the NASDAQ Stock Market, which are valued at the NASDAQ official close price. Unlisted securities or listed securities for which there were no sales during the day are valued at the mean of the latest quoted bid and ask prices on such exchanges or markets.
Foreign equity securities are valued based on quotations from the principal market in which such securities are normally traded. If any foreign share prices are not readily available as a result of limited share activity the securities are valued at the mean of the latest quoted bid and ask prices on such exchanges or markets. Foreign currency exchange rates are generally determined at 4:00 p.m. Eastern (U.S.) time. However, many securities markets and exchanges outside the U.S. close prior to the close of the NYSE; therefore, the closing prices for securities in such markets or on such
| | | | |
| Semiannual Report 2013 | | | 23 | |
| | |
| |
| | Columbia Seligman Global Technology Fund |
Notes to Financial Statements (continued)
April 30, 2013 (Unaudited)
exchanges may not fully reflect events that occur after such close but before the close of the NYSE. In those situations, foreign securities will be fair valued pursuant to the policy adopted by the Board of Trustees (the Board), including utilizing a third party pricing service to determine these fair values. The third party pricing service takes into account multiple factors, including, but not limited to, movements in the U.S. securities markets, certain depositary receipts, futures contracts and foreign exchange rates that have occurred subsequent to the close of the foreign exchange or market, to determine a good faith estimate that reasonably reflects the current market conditions as of the close of the NYSE. The fair value of a security is likely to be different from the quoted or published price, if available.
Investments in other open-end investment companies, including money market funds, are valued at net asset value.
Investments for which market quotations are not readily available, or that have quotations which management believes are not reliable, are valued at fair value as determined in good faith under consistently applied procedures established by and under the general supervision of the Board. If a security or class of securities (such as foreign securities) is valued at fair value, such value is likely to be different from the last quoted market price for the security.
The determination of fair value often requires significant judgment. To determine fair value, management may use assumptions including but not limited to future cash flows and estimated risk premiums. Multiple inputs from various sources may be used to determine fair value.
Foreign Currency Transactions and Translations
The values of all assets and liabilities denominated in foreign currencies are translated into U.S. dollars at that day’s exchange rates. Net realized and unrealized gains (losses) on foreign currency transactions and translations include gains (losses) arising from the fluctuation in exchange rates between trade and settlement dates on securities transactions, gains (losses) arising from the disposition of foreign currency and currency gains (losses) between the accrual and payment dates on dividends, interest income and foreign withholding taxes.
For financial statement purposes, the Fund does not distinguish that portion of gains (losses) on investments which is due to changes in foreign exchange rates from that which is due to changes in market prices of the investments. Such fluctuations are included with the net realized and unrealized gains (losses) on investments in the Statement of Operations.
Security Transactions
Security transactions are accounted for on the trade date. Cost is determined and gains (losses) are based upon the specific
identification method for both financial statement and federal income tax purposes.
Income Recognition
Corporate actions and dividend income are recorded net of any non-reclaimable tax withholdings, on the ex-dividend date or upon receipt of ex-dividend notification in the case of certain foreign securities.
Awards from class action litigation are recorded as a reduction of cost basis if the Fund still owns the applicable securities on the payment date. If the Fund no longer owns the applicable securities, the proceeds are recorded as realized gains.
Expenses
General expenses of the Trust are allocated to the Fund and other funds of the Trust based upon relative net assets or other expense allocation methodologies determined by the nature of the expense. Expenses directly attributable to the Fund are charged to the Fund. Expenses directly attributable to a specific class of shares are charged to that share class.
Determination of Class Net Asset Value
All income, expenses (other than class-specific expenses, which are charged to that share class, as shown in the Statement of Operations) and realized and unrealized gains (losses) are allocated to each class of the Fund on a daily basis, based on the relative net assets of each class, for purposes of determining the net asset value of each class.
Federal Income Tax Status
The Fund intends to qualify each year as a regulated investment company under Subchapter M of the Internal Revenue Code, as amended, and will distribute substantially all of its taxable income (including net short-term capital gains), if any, for its tax year, and as such will not be subject to federal income taxes. In addition, the Fund intends to distribute in each calendar year substantially all of its net investment income, capital gains and certain other amounts, if any, such that the Fund should not be subject to federal excise tax. Therefore, no federal income or excise tax provision is recorded.
Foreign Taxes
The Fund may be subject to foreign taxes on income, gains on investments or currency repatriation, a portion of which may be recoverable. The Fund will accrue such taxes and recoveries, as applicable, based upon its current interpretation of tax rules and regulations that exist in the markets in which it invests.
Realized gains in certain countries may be subject to foreign taxes at the Fund level, based on statutory rates. The Fund
| | |
| 24 | | Semiannual Report 2013 |
| | |
| |
| Columbia Seligman Global Technology Fund | | |
Notes to Financial Statements (continued)
April 30, 2013 (Unaudited)
accrues for such foreign taxes on net realized and unrealized gains at the appropriate rate for each jurisdiction, as applicable. The amount, if any, is disclosed as a liability on the Statement of Assets and Liabilities.
Distributions to Shareholders
Distributions from net investment income, if any, are declared and paid annually. Net realized capital gains, if any, are distributed along with the income distribution. Income distributions and capital gain distributions are determined in accordance with federal income tax regulations, which may differ from GAAP.
Guarantees and Indemnifications
Under the Trust’s organizational documents and, in some cases, by contract, its officers and trustees are indemnified against certain liabilities arising out of the performance of their duties to the Trust or its funds. In addition, certain of the Fund’s contracts with its service providers contain general indemnification clauses. The Fund’s maximum exposure under these arrangements is unknown since the amount of any future claims that may be made against the Fund cannot be determined, and the Fund has no historical basis for predicting the likelihood of any such claims.
Recent Accounting Pronouncement
Disclosures about Offsetting Assets and Liabilities
In December 2011, the Financial Accounting Standards Board (FASB) issued Accounting Standards Update (ASU) No. 2011-11, Disclosures about Offsetting Assets and Liabilities and in January 2013, ASU No. 2013-1, Clarifying the Scope of Disclosures about Offsetting Assets and Liabilities (collectively, the ASUs). Specifically, the ASUs require an entity to disclose both gross and net information for derivatives and other financial instruments that are subject to a master netting arrangement or similar agreement. The ASUs require disclosure of collateral received in connection with the master netting agreements or similar agreements. The disclosure requirements are effective for interim and annual periods beginning on or after January 1, 2013. At this time, management is evaluating the implications of this guidance and the impact it will have on the financial statement amounts and footnote disclosures, if any.
Note 3. Fees and Compensation Paid to Affiliates
Investment Management Fees
Under an Investment Management Services Agreement, Columbia Management Investment Advisers, LLC (the Investment Manager), a wholly-owned subsidiary of
Ameriprise Financial, Inc. (Ameriprise Financial), determines which securities will be purchased, held or sold. The investment management fee is an annual fee that is equal to a percentage of the Fund’s average daily net assets that declines from 0.855% to 0.725% as the Fund’s net assets increase. The annualized effective investment management fee rate for the six months ended April 30, 2013 was 0.854% of the Fund’s average daily net assets.
Administration Fees
Under an Administrative Services Agreement, the Investment Manager also serves as the Fund Administrator. The Fund pays the Fund Administrator an annual fee for administration and accounting services equal to a percentage of the Fund’s average daily net assets that declines from 0.06% to 0.03% as the Fund’s net assets increase. The annualized effective administration fee rate for the six months ended April 30, 2013 was 0.06% of the Fund’s average daily net assets.
Other Expenses
Other expenses are for, among other things, certain expenses of the Fund or the Board, including: Fund boardroom and office expense, employee compensation, employee health and retirement benefits, and certain other expenses. Payment of these Fund and Board expenses is facilitated by a company providing limited administrative services to the Fund and the Board. For the six months ended April 30, 2013, other expenses paid to this company were $948.
Compensation of Board Members
Board members are compensated for their services to the Fund as disclosed in the Statement of Operations. Under a Deferred Compensation Plan (the Plan), the Board members who are not “interested persons” of the Fund, as defined under the 1940 Act, may elect to defer payment of up to 100% of their compensation. Deferred amounts are treated as though equivalent dollar amounts had been invested in shares of certain funds managed by the Investment Manager. The Fund’s liability for these amounts is adjusted for market value changes and remains in the Fund until distributed in accordance with the Plan.
Transfer Agent Fees
Under a Transfer and Dividend Disbursing Agent Agreement, Columbia Management Investment Services Corp. (the Transfer Agent), an affiliate of the Investment Manager and a wholly-owned subsidiary of Ameriprise Financial, is responsible for providing transfer agency services to the Fund. The Transfer Agent has contracted with Boston Financial Data Services (BFDS) to serve as sub-transfer agent.
| | | | |
| Semiannual Report 2013 | | | 25 | |
| | |
| |
| | Columbia Seligman Global Technology Fund |
Notes to Financial Statements (continued)
April 30, 2013 (Unaudited)
The Transfer Agent receives monthly account-based service fees based on the number of open accounts and also receives sub-transfer agency fees based on percentage of the average aggregate value of the Fund’s shares maintained in omnibus accounts (other than omnibus accounts for which American Enterprise Investment Services Inc. is the broker of record or accounts where the beneficial shareholder is a customer of Ameriprise Financial Services, Inc., which are paid a per account fee). The Transfer Agent pays the fees of BFDS for services as sub-transfer agent and is not entitled to reimbursement for such fees from the Fund (with the exception of out-of-pocket fees).
The Transfer Agent also receives compensation from fees for various shareholder services and reimbursements for certain out-of-pocket fees. Class I shares do not pay transfer agent fees. Total transfer agent fees for Class K and Class R5 shares are subject to an annual limitation of not more than 0.05% of the average daily net assets attributable to each share class.
For the six months ended April 30, 2013, the Fund’s annualized effective transfer agent fee rates as a percentage of average daily net assets of each class were as follows:
| | | | |
Class A | | | 0.27 | % |
Class B | | | 0.27 | |
Class C | | | 0.27 | |
Class K | | | 0.05 | |
Class R | | | 0.27 | |
Class R4 | | | 0.27 | |
Class R5 | | | 0.05 | |
Class Z | | | 0.27 | |
The Fund and certain other associated investment companies, have severally, but not jointly, guaranteed the performance and observance of all the terms and conditions of a lease entered into by Seligman Data Corp. (SDC), the former transfer agent, including the payment of rent by SDC (the Guaranty). The lease and the Guaranty expire in January 2019. At April 30, 2013, the Fund’s total potential future obligation over the life of the Guaranty is $244,430. The liability remaining at April 30, 2013, for non-recurring charges associated with the lease amounted to $126,749 and is recorded as a part of payable for other expenses in the Statement of Assets and Liabilities.
An annual minimum account balance fee of $20 may apply to certain accounts with a value below the Fund’s initial minimum investment requirements to reduce the impact of small accounts on transfer agent fees. These minimum account balance fees are recorded as part of expense reductions in the Statement of Operations. For the six months ended April 30, 2013, no minimum account balance fees were charged by the Fund.
Plan Administration Fees
Under a Plan Administration Services Agreement with the Transfer Agent, the Fund pays an annual fee at a rate of 0.25% of the Fund’s average daily net assets attributable to Class K shares for the provision of various administrative, recordkeeping, communication and educational services.
Distribution Fees
The Fund has an agreement with Columbia Management Investment Distributors, Inc. (the Distributor), an affiliate of the Investment Manager and a wholly-owned subsidiary of Ameriprise Financial, for distribution and shareholder services. Under a Plan and Agreement of Distribution pursuant to Rule 12b-1, the Fund pays a fee at an annual rate of up to 0.25% of the Fund’s average daily net assets attributable to Class A shares, a fee at an annual rate of up to 0.50% of the Fund’s average daily net assets attributable to Class R shares (of which up to 0.25% may be used for shareholder services) and a fee at an annual rate of up to 1.00% of the Fund’s average daily net assets attributable to Class B and Class C shares. For Class B and Class C shares, of the 1.00% fee, up to 0.75% is reimbursed for distribution expenses.
The amount of distribution expenses incurred by the Distributor and not yet reimbursed (unreimbursed expense) was approximately $227,000 and $4,527,000 for Class B and Class C shares, respectively. These amounts are based on the most recent information available as of December 31, 2012, and may be recovered from future payments under the distribution plan or CDSCs. To the extent the unreimbursed expense has been fully recovered, the distribution fee is reduced.
Sales Charges
Sales charges, including front-end charges and CDSCs, received by the Distributor for distributing Fund shares were $86,502 for Class A, $4,198 for Class B and $1,425 for Class C shares for the six months ended April 30, 2013.
Expenses Waived/Reimbursed by the Investment Manager and its Affiliates
The Investment Manager and certain of its affiliates have contractually agreed to waive fees and/or reimburse expenses (excluding certain fees and expenses described below) for the periods disclosed below, unless sooner terminated at the sole discretion of the Board, so that the Fund’s net operating expenses, after giving effect to fees waived/expenses reimbursed and any balance credits and/or overdraft charges
| | |
| 26 | | Semiannual Report 2013 |
| | |
| |
| Columbia Seligman Global Technology Fund | | |
Notes to Financial Statements (continued)
April 30, 2013 (Unaudited)
from the Fund’s custodian, do not exceed the following annual rates as a percentage of the class’ average daily net assets:
| | | | | | | | |
| | | March 1, 2013
through
February 28, 2014 | | | Prior to
March 1, 2013 | |
Class A | | | 1.56 | % | | | 1.38 | % |
Class B | | | 2.31 | | | | 2.13 | |
Class C | | | 2.31 | | | | 2.13 | |
Class I | | | 1.12 | | | | 0.97 | |
Class K | | | 1.42 | | | | 1.27 | |
Class R | | | 1.81 | | | | 1.63 | |
Class R4 | | | 1.31 | | | | 1.13 | |
Class R5 | | | 1.17 | | | | 1.02 | |
Class Z | | | 1.31 | | | | 1.13 | |
Under the agreement governing these fee waivers and/or expense reimbursement arrangements, the following fees and expenses are excluded from the waiver/reimbursement commitment, and therefore will be paid by the Fund, if applicable: taxes (including foreign transaction taxes), expenses associated with investments in affiliated and non-affiliated pooled investment vehicles (including mutual funds and exchange traded funds), transaction costs and brokerage commissions, costs related to any securities lending program, dividend expenses associated with securities sold short, inverse floater program fees and expenses, transaction charges and interest on borrowed money, interest, extraordinary expenses and any other expenses the exclusion of which is specifically approved by the Board. This agreement may be modified or amended only with approval from all parties.
Note 4. Federal Tax Information
The timing and character of income and capital gain distributions are determined in accordance with income tax regulations, which may differ from GAAP because of temporary or permanent book to tax differences.
At April 30, 2013, the cost of investments for federal income tax purposes was approximately $324,761,000 and the aggregate gross approximate unrealized appreciation and depreciation based on that cost was:
| | | | |
Unrealized appreciation | | | $71,458,000 | |
Unrealized depreciation | | | (8,231,000 | ) |
Net unrealized appreciation | | | $63,227,000 | |
The following capital loss carryforward, determined as of October 31, 2012 may be available to reduce taxable income arising from future net realized gains on investments, if any, to the extent permitted by the Internal Revenue Code:
| | | | |
| Year of Expiration | | Amount ($) | |
2016 | | | 9,154,318 | |
2017 | | | 5,227,123 | |
Total | | | 14,381,441 | |
Under current tax rules, regulated investment companies can elect to treat certain late-year ordinary losses incurred and post-October capital losses (capital losses realized after October 31) as arising on the first day of the following taxable year. The Fund has elected to treat late year ordinary losses of $2,633,029 at October 31, 2012 as arising on November 1, 2012.
Management of the Fund has concluded that there are no significant uncertain tax positions that would require recognition in the financial statements. However, management’s conclusion may be subject to review and adjustment at a later date based on factors including, but not limited to, new tax laws, regulations, and administrative interpretations (including relevant court decisions). Generally, the Fund’s federal tax returns for the prior three fiscal years remain subject to examination by the Internal Revenue Service.
Note 5. Portfolio Information
The cost of purchases and proceeds from sales of securities, excluding short-term obligations, aggregated to $141,691,013 and $180,733,328, respectively, for the six months ended April 30, 2013.
Note 6. Regulatory Settlements
During the year ended October 31, 2012, the Fund received $549,229 as a result of a regulatory settlement proceeding brought by the Securities and Exchange Commission against an unaffiliated third party relating to market timing and/or late trading of mutual funds. This amount represented the Fund’s portion of the proceeds from the settlement (the Fund was not a party to the proceeding). The payments have been included in “Proceeds from regulatory settlements” in the Statement of Changes in Net Assets.
Note 7. Lending of Portfolio Securities
Effective December 19, 2012, the Fund no longer participates in securities lending activity. Prior to that date, the Fund participated, or was eligible to participate, in securities lending activity pursuant to a Master Securities Lending Agreement (the Agreement) with JPMorgan Chase Bank, N.A. (JPMorgan). The Agreement authorized JPMorgan as lending agent to lend securities to authorized borrowers in order to generate additional income on behalf of the Fund. Pursuant to the Agreement, the securities loaned were secured by cash or
| | | | |
| Semiannual Report 2013 | | | 27 | |
| | |
| |
| | Columbia Seligman Global Technology Fund |
Notes to Financial Statements (continued)
April 30, 2013 (Unaudited)
securities that either were issued or guaranteed as to principal and interest by the U.S. government, its agencies, authorities or instrumentalities with value equal to at least 100% of the market value of the loaned securities. Any additional collateral required to maintain those levels due to market fluctuations of the loaned securities was requested to be delivered the following business day. Cash collateral received was invested by the lending agent on behalf of the Fund into authorized investments pursuant to the Agreement.
Pursuant to the Agreement, the Fund received income for lending its securities either in the form of fees or by earning interest on invested cash collateral, net of negotiated rebates paid to borrowers and fees paid to the lending agent for services provided and any other securities lending expenses. Net income earned from securities lending for the six months ended April 30, 2013 is disclosed in the Statement of Operations. The Fund continued to earn and accrue interest and dividends on the securities loaned.
Note 8. Affiliated Money Market Fund
The Fund invests its daily cash balances in Columbia Short-Term Cash Fund, an affiliated money market fund established for the exclusive use by the Fund and other affiliated funds. The income earned by the Fund from such investments is included as “Dividends — affiliated issuers” in the Statement of Operations. As an investing fund, the Fund indirectly bears its proportionate share of the expenses of Columbia Short-Term Cash Fund.
Note 9. Shareholder Concentration
At April 30, 2013, one unaffiliated shareholder account owned 11.5% of the outstanding shares of the Fund. The Fund has no knowledge about whether any portion of those shares was owned beneficially by such account.
Note 10. Line of Credit
The Fund has entered into a revolving credit facility with a syndicate of banks led by JPMorgan whereby the Fund may borrow for the temporary funding of shareholder redemptions or for other temporary or emergency purposes. The credit facility agreement, as amended, which is a collective agreement between the Fund and certain other funds managed by the Investment Manager, severally and not jointly, permits collective borrowings up to $500 million. Interest is charged to each participating fund based on its borrowings at a rate equal to the higher of (i) the overnight federal funds rate plus 1.00% or (ii) the one-month LIBOR rate plus 1.00%. Each borrowing under the credit facility matures no later than 60 days after the date of borrowing. The Fund also pays a commitment fee equal to its pro rata share of the amount of the credit facility at a rate of 0.08% per annum.
The Fund had no borrowings during the six months ended April 30, 2013.
Note 11. Significant Risks
Non-Diversification Risk
A non-diversified fund is permitted to invest a greater percentage of its total assets in fewer issuers than a diversified fund. The Fund may, therefore, have a greater risk of loss from a few issuers than a similar fund that invests more broadly.
Technology and Technology-related Investment Risk
The Fund invested a substantial portion of its assets in technology and technology-related companies. The market prices of technology and technology-related stocks tend to exhibit a greater degree of market risk and price volatility than other types of investments.
Foreign Securities Risk
Investing in foreign securities may include certain risks and considerations not typically associated with investing in U.S. securities, such as fluctuating currency values and changing local and regional economic, political and social conditions, which may result in greater market volatility. In addition, certain foreign securities may not be as liquid as U.S. securities.
Note 12. Subsequent Events
Management has evaluated the events and transactions that have occurred through the date the financial statements were issued and noted no items requiring adjustment of the financial statements or additional disclosure.
Note 13. Information Regarding Pending and Settled Legal Proceedings
In December 2005, without admitting or denying the allegations, American Express Financial Corporation (AEFC, which is now known as Ameriprise Financial, Inc. (Ameriprise Financial)) entered into settlement agreements with the Securities and Exchange Commission (SEC) and Minnesota Department of Commerce (MDOC) related to market timing activities. As a result, AEFC was censured and ordered to cease and desist from committing or causing any violations of certain provisions of the Investment Advisers Act of 1940, the Investment Company Act of 1940, and various Minnesota laws. AEFC agreed to pay disgorgement of $10 million and civil money penalties of $7 million. AEFC also agreed to retain an independent distribution consultant to assist in developing a plan for distribution of all disgorgement
| | |
| 28 | | Semiannual Report 2013 |
| | |
| |
| Columbia Seligman Global Technology Fund | | |
Notes to Financial Statements (continued)
April 30, 2013 (Unaudited)
and civil penalties ordered by the SEC in accordance with various undertakings detailed at www.sec.gov/litigation/admin/ia-2451.pdf. Ameriprise Financial and its affiliates have cooperated with the SEC and the MDOC in these legal proceedings, and have made regular reports to the funds’ Boards of Trustees.
Ameriprise Financial and certain of its affiliates have historically been involved in a number of legal, arbitration and regulatory proceedings, including routine litigation, class actions, and governmental actions, concerning matters arising in connection with the conduct of their business activities. Ameriprise Financial believes that the Funds are not currently the subject of, and that neither Ameriprise Financial nor any of its affiliates are the subject of, any pending legal, arbitration or regulatory proceedings that are likely to have a material adverse effect on the Funds or the ability of Ameriprise Financial or its affiliates to perform under their contracts with the Funds. Ameriprise Financial is required to make 10-Q, 10-K and, as necessary, 8-K filings with the Securities and Exchange Commission on legal and regulatory matters that relate to Ameriprise Financial and its affiliates. Copies of these filings may be obtained by accessing the SEC website at www.sec.gov.
There can be no assurance that these matters, or the adverse publicity associated with them, will not result in increased fund redemptions, reduced sale of fund shares or other adverse consequences to the Funds. Further, although we believe proceedings are not likely to have a material adverse effect on the Funds or the ability of Ameriprise Financial or its affiliates to perform under their contracts with the Funds, these proceedings are subject to uncertainties and, as such, we are unable to estimate the possible loss or range of loss that may result. An adverse outcome in one or more of these proceedings could result in adverse judgments, settlements, fines, penalties or other relief that could have a material adverse effect on the consolidated financial condition or results of operations of Ameriprise Financial.
| | | | |
| Semiannual Report 2013 | | | 29 | |
| | |
| |
| | Columbia Seligman Global Technology Fund |
Approval of Investment Management Services Agreement
Columbia Management Investment Advisers, LLC (Columbia Management or the Investment Manager), a wholly-owned subsidiary of Ameriprise Financial, Inc. (Ameriprise Financial), serves as the investment manager to Columbia Seligman Global Technology Fund (the Fund). Under an investment management services agreement (the IMS Agreement), Columbia Management provides investment advice and other services to the Fund and other funds distributed by Columbia Management Investment Distributors, Inc. (collectively, the Funds).
On an annual basis, the Fund’s Board of Trustees (the Board), including the independent Board members (the Independent Trustees), considers renewal of the IMS Agreement. Columbia Management prepared detailed reports for the Board and its Contracts Committee in January, March and April 2013, including reports based on analyses of data provided by an independent organization and a comprehensive response to each item of information requested by independent legal counsel to the Independent Trustees (Independent Legal Counsel) in a letter to the Investment Manager, to assist the Board in making this determination. All of the materials presented in January, March and April were first supplied in draft form to designated representatives of the Independent Trustees, i.e., Independent Legal Counsel, the Chair of the Board and the Chair of the Contracts Committee, and the final materials (including proposed additional breakpoints in IMS fees for certain Funds) were revised to reflect discussion and subsequent requests made by the Contracts Committee. In addition, throughout the year, the Board (or its committees) regularly meets with portfolio management teams and senior management personnel, and reviews information prepared by Columbia Management addressing the services Columbia Management provides and Fund performance. Further, the Board retained an independent consulting firm (the Independent Consultant) to assist the Independent Trustees in their review of IMS fees, expense caps and Ameriprise Financial’s profitability. The Board also accords particular weight to the work, deliberations and conclusions of the Contracts Committee, the Investment Review Committee and the Compliance Committee in determining whether to continue the IMS Agreement.
The Board, at its April 15-17, 2013 in-person Board meeting (the April Meeting), considered the renewal of the IMS Agreement for an additional one-year term. At the April Meeting, Independent Legal Counsel reviewed with the Independent Trustees various factors relevant to the Board’s consideration of advisory agreements and the Board’s legal responsibilities related to such consideration. Following an analysis and discussion of the factors identified below, the Board, including all of the Independent Trustees, approved the renewal of the IMS Agreement.
Nature, Extent and Quality of Services Provided by Columbia Management
The Independent Trustees analyzed various reports and presentations they had received detailing the services performed by Columbia Management, as well as its expertise, resources and capabilities. The Independent Trustees specifically considered many developments during the past year concerning the services provided by Columbia Management, including, in particular, the recent globalization initiative, which fosters increased worldwide investment support of global products, continued investment in upgrading technology (such as the implementation of new systems and hardware), the hiring of a Chief Interest Rate Strategist as part of Columbia Management’s fixed income team and the addition of Columbia Management investment personnel to the Asset Allocation, Quantitative and Technology teams. The Independent Trustees noted the information they received concerning Columbia Management’s ability to retain its key portfolio management personnel. In this regard, the Independent Trustees took into account their comprehensive discussions with Columbia Management’s Chief Investment Officer (the CIO), observing the organizational depth of Columbia Management and the capabilities of its investment personnel. The Independent Trustees also recalled the information the CIO provided them identifying the strengths and areas for enhancement of each Columbia Management investment team, as well as the discussion with the CIO regarding the investment personnel talent being infused to enhance support for certain Funds. The Independent Trustees also observed the materials demonstrating the strength and depth of Columbia Management’s equity and fixed income research departments.
In connection with the Board’s evaluation of the overall package of services provided by Columbia Management, the Board also considered the quality of administrative services provided to the Fund by Columbia Management, recalling the information it received highlighting significant achievements in 2012 in the performance of administrative services (such as strong accounting performance measures, refined derivatives processing and enhancements to the electronic communications under the affiliated and unaffiliated service provider oversight program). In evaluating the quality of services provided under the IMS Agreement and the Fund’s Administrative Service Agreement, the Independent Trustees also took into account the organization and strength of the Fund’s and its service providers’ compliance programs. In addition, the Board also reviewed the financial condition of Columbia Management (and its affiliates) and each entity’s ability to carry out its responsibilities under the IMS Agreement and the Fund’s other services agreements with affiliates of Ameriprise Financial, observing the financial strength of Ameriprise Financial, with its solid balance sheet. The Board also discussed the acceptability of the terms of the IMS Agreement (including
| | |
| 30 | | Semiannual Report 2013 |
| | |
| |
| Columbia Seligman Global Technology Fund | | |
Approval of Investment Management Services Agreement (continued)
the relatively broad scope of services required to be performed by Columbia Management). The Board concluded that the services being performed under the IMS Agreement were of a reasonably high quality.
Based on the foregoing, and based on other information received (both oral and written, including the information on investment performance referenced below) and other considerations, the Board concluded that Columbia Management and its affiliates were in a position to continue to provide a high quality and level of services to the Fund.
Investment Performance
For purposes of evaluating the nature, extent and quality of services provided under the IMS Agreement, the Board carefully reviewed the investment performance of the Fund. In this regard, the Board considered detailed reports providing the results of analyses performed by an independent organization showing, for various periods, the performance of the Fund, the performance of a benchmark index, the percentage ranking of the Fund among its comparison group and the net assets of the Fund. The Board observed the Fund’s underperformance for certain periods, noting that appropriate steps (such as the addition of talent to the portfolio management team) had been taken or are contemplated to help improve the Fund’s performance.
Comparative Fees, Costs of Services Provided and the Profits Realized by Columbia Management and its Affiliates from their Relationships with the Fund
The Board reviewed comparative fees and the costs of services to be provided under the IMS Agreement. The Board members considered detailed comparative information set forth in an annual report on fees and expenses, including, among other things, data (based on analyses conducted by an independent organization) showing a comparison of the Fund’s expenses with median expenses paid by funds in its comparative peer universe, as well as data showing the Fund’s contribution to Columbia Management’s profitability.
The Board accorded particular weight to the notion that the level of fees should reflect a rational pricing model applied consistently across the various product lines in the Fund family, while assuring that the overall fees for each Fund (with few defined exceptions) are generally in line with the “pricing philosophy” (i.e., that the total expense ratio of the Fund is no higher than the median expense ratio of funds in the same comparison universe of the Fund). In this connection, the Board also considered the Independent Consultant’s report that concluded that: the Funds’ expense cap philosophy of assuring that each Fund’s total expense ratio is not above its peer universe median ratio is reasonable. The Board took into account that the Fund’s total expense ratio (after considering proposed expense caps/waivers) was slightly below the peer universe’s median expense ratio shown in the reports. Based on its review, the Board concluded that the Fund’s management fee was fair and reasonable in light of the extent and quality of services that the Fund receives.
The Board also considered the expected profitability of Columbia Management and its affiliates in connection with Columbia Management providing investment management services to the Fund. In this regard, the Board referred to a detailed profitability report, discussing the profitability to Columbia Management and Ameriprise Financial from managing, operating and distributing the Funds. In this regard, the Board observed that 2012 profitability approximates 2011 profitability and that, as was the case in 2011, 2012 profitability remained generally in line with (and, in many cases, lower than) the reported profitability of other asset management firms. Further, the Board considered the Independent Consultant’s report that concluded that Columbia Management’s profitability, particularly in comparison to industry competitors, was reasonable and not excessive. It also took into account the indirect economic benefits flowing to Columbia Management or its affiliates in connection with managing or distributing the Funds, such as the enhanced ability to offer various other financial products to Ameriprise Financial customers, soft dollar benefits and overall reputational advantages. The Board noted that the fees paid by the Funds should permit the Investment Manager to offer competitive compensation to its personnel, make necessary investments in its business and earn an appropriate profit. The Board concluded that profitability levels were reasonable.
Economies of Scale to be Realized
The Board also considered the economies of scale that might be realized by Columbia Management as the Fund grows and took note of the extent to which Fund shareholders might also benefit from such growth. In this regard, the Independent Trustees took into account that IMS fees decline as Fund assets exceed various breakpoints. The Independent Trustees also observed that the Board and management agreed to implement an additional breakpoint for the Fund.
Based on the foregoing, the Board, including all of the Independent Trustees, concluded that the investment management service fees were fair and reasonable in light of the extent and quality of services provided. In reaching this conclusion, no single factor was determinative. On April 17, 2013, the Board, including all of the Independent Trustees, approved the renewal of the IMS Agreement.
| | | | |
| Semiannual Report 2013 | | | 31 | |
| | |
| |
| Columbia Seligman Global Technology Fund | | |
Shareholder Meeting Results
(Unaudited)
Special Meeting of Shareholders Held on February 27, 2013
At a Joint Special Meeting of Shareholders held on February 27, 2013 (the “Meeting”), shareholders of the Fund approved two proposals. The first proposal was a change to the Fund’s policy regarding concentration to provide that the Fund will, under normal market conditions, invest at least 25% of its total assets in securities of companies in the technology and related group of industries. The second proposal was the reclassification of the Fund from a “diversified fund” to a “non-diversified fund,” as such terms are defined in the Investment Company Act of 1940, as amended. The votes cast for or against as well as the number of abstentions and broker non-votes as to the proposal are set forth below. A vote is based on total dollar interest in the Fund as of the record date of the Meeting.
Proposal 1: to change the Fund’s concentration policy
| | | | | | | | | | | | | | |
| Votes For | | | Votes Against | | | Abstentions | | | Broker
Non-Votes | |
| | 10,147,563 | | | | 456,747 | | | | 629,120 | | | | 0 | |
Proposal 2: to reclassify the Fund from a “diversified fund” to a “non-diversified fund”
| | | | | | | | | | | | | | |
| Votes For | | | Votes Against | | | Abstentions | | | Broker
Non-Votes | |
| | 10,071,614 | | | | 524,476 | | | | 637,341 | | | | 0 | |
| | |
| 32 | | Semiannual Report 2013 |
| | |
| |
| Columbia Seligman Global Technology Fund | | |
Important Information About This Report
Each fund mails one shareholder report to each shareholder address. If you would like more than one report, please call shareholder services at 800.345.6611 and additional reports will be sent to you.
The policy of the Board is to vote the proxies of the companies in which each fund holds investments consistent with the procedures as stated in the Statement of Additional Information (SAI). You may obtain a copy of the SAI without charge by calling 800.345.6611; contacting your financial intermediary; visiting columbiamanagement.com; or searching the website of the Securities and Exchange Commission (SEC) at sec.gov. Information regarding how each fund voted proxies relating to portfolio securities is filed with the SEC by August 31 for the most recent 12-month period ending June 30 of that year, and is available without charge by visiting columbiamanagement.com; or searching the website of the SEC at sec.gov.
Each fund files a complete schedule of portfolio holdings with the SEC for the first and third quarters of each fiscal year on Form N-Q. Each fund’s Form N-Q is available on the SEC’s website at sec.gov and may be reviewed and copied at the SEC’s Public Reference Room in Washington, D.C. Information on the operation of the Public Reference Room may be obtained by calling 800.SEC.0330. Each fund’s complete schedule of portfolio holdings, as filed on Form N-Q, can also be obtained without charge, upon request, by calling 800.345.6611.
| | | | |
| Semiannual Report 2013 | | | 33 | |

Columbia Seligman Global Technology Fund
P.O. Box 8081
Boston, MA 02266-8081
columbiamanagement.com
This information is for use with concurrent or prior delivery of a fund prospectus. Please read and consider the investment objectives, risks, charges and expenses for any fund carefully before investing. For a prospectus which contains this and other important information about the Fund, go to columbiamanagement.com. The Fund is distributed by Columbia Management Investment Distributors, Inc., member FINRA, and managed by Columbia Management Investment Advisers, LLC.
© 2013 Columbia Management Investment Advisers, LLC. All rights reserved.
SAR220_10_C01_(06/13)
| | |
Semiannual Report April 30, 2013 | |  |
| | |
Columbia Asia Pacific ex-Japan Fund | | |

| | |
| |
| | Columbia Asia Pacific ex-Japan Fund |
President’s Message

Dear Shareholders,
U.S. equities had a strong first quarter
Similar to 2012, equities once again were the best performing asset class in the first quarter of 2013. The S&P 500 Index reached an all-time closing high on the last trading day of the quarter and pushed through its October 2007 peak. Although global equities have performed well year-to-date, there is significant performance divergence among regions. In local currency terms, Japanese equities were the best performing developed market globally, and U.S. stocks outperformed most other global equity markets. European equities rose in the first quarter but trailed U.S. stocks and had a turbulent March, as investors were reminded of instability in the eurozone with news of a banking crisis in Cyprus.
Although all 10 sectors of the S&P 500 Index delivered positive returns, this was a rally led by defensive stocks such as those in health care, consumer staples and utilities. Materials and technology stocks were the weakest sectors.
High yield leads fixed income; most sectors flat to down
The fixed-income markets lagged equities with modest, single-digit returns coming from municipals and high-yield sectors in the United States. Most government and investment-grade credit sectors were
roughly flat to down for the first quarter of 2013. Emerging market bonds were the biggest disappointment with single-digit losses.
Columbia Management to begin delivering summary prospectuses
Each Columbia fund is required to update its prospectus on an annual basis. Beginning with June 2013 prospectus updates, shareholders of Columbia retail mutual funds will start to receive a summary prospectus, rather than the full length (statutory) mutual fund prospectus they have received in the past.
Each fund’s summary prospectus will include the following key information:
| > | | Portfolio turnover rate information |
| > | | Principal investment strategies, principal risks and performance information |
| > | | Purchase and sale information |
| > | | Financial intermediary compensation information |
Each fund’s statutory prospectus will contain additional information about the fund and its risks. Both the statutory and summary prospectus will be updated each year, and will be available at columbiamanagement.com. Shareholders may request a printed version of a statutory prospectus at no cost by calling 800.345.6611 or sending an email to serviceinquiries@columbiamanagement.com.
Stay on track with Columbia Management
Backed by more than 100 years of experience, Columbia Management is one of the nation’s largest asset managers. At the heart of our success — and, most importantly, that of our investors — are highly talented industry professionals, brought together by a unique way of working. We are dedicated to helping you take advantage of today’s opportunities and anticipate tomorrow’s. We stay abreast of the latest investment trends and ideas, using our collective insight to evaluate events and transform them into solutions you can use.
Visit columbiamanagement.com for:
| > | | The Columbia Management Perspectives blog, featuring timely posts by our investment teams |
| > | | Detailed up-to-date fund performance and portfolio information |
| > | | Economic analysis and market commentary |
| > | | Quarterly fund commentaries |
| > | | Columbia Management Investor, our award-winning quarterly newsletter for shareholders |
Thank you for your continued support of the Columbia Funds. We look forward to serving your investment needs for many years to come.
Best Regards,

J. Kevin Connaughton
President, Columbia Funds
The S&P 500 Index, an unmanaged index, measures the performance of 500 large-capitalization U.S. stocks and is frequently used as a general measure of market performance. Indices are not available for investment, are not professionally managed and do not reflect sales charges, fees, brokerage commissions, taxes or other expenses of investing.
Investors should consider the investment objectives, risks, charges and expenses of a mutual fund carefully before investing. For a free prospectus, which contains this and other important information about a fund, visit columbiamanagement.com. The prospectus should be read carefully before investing.
Columbia Funds are distributed by Columbia Management Investment Distributors, Inc., member FINRA, and managed by Columbia Management Investment Advisers, LLC.
© 2013 Columbia Management Investment Advisers, LLC. All rights reserved.
Semiannual Report 2013
| | |
| |
| Columbia Asia Pacific ex-Japan Fund | | |
Table of Contents
Fund Investment Manager
Columbia Management Investment
Advisers, LLC
225 Franklin Street
Boston, MA 02110
Fund Distributor
Columbia Management Investment
Distributors, Inc.
225 Franklin Street
Boston, MA 02110
Fund Transfer Agent
Columbia Management Investment
Services Corp.
P.O. Box 8081
Boston, MA 02266-8081
For more information about any of the funds, please visit columbiamanagement.com or call 800.345.6611. Customer Service Representatives are available to answer your questions Monday through Friday from 8 a.m. to 8 p.m. Eastern time.
The views expressed in this report reflect the current views of the respective parties. These views are not guarantees of future performance and involve certain risks, uncertainties and assumptions that are difficult to predict, so actual outcomes and results may differ significantly from the views expressed. These views are subject to change at any time based upon economic, market or other conditions and the respective parties disclaim any responsibility to update such views. These views may not be relied on as investment advice and, because investment decisions for a Columbia Fund are based on numerous factors, may not be relied on as an indication of trading intent on behalf of any particular Columbia Fund. References to specific securities should not be construed as a recommendation or investment advice.
Semiannual Report 2013
| | |
| |
| | Columbia Asia Pacific ex-Japan Fund |
Performance Overview
(Unaudited)
Performance Summary
| > | | Columbia Asia Pacific ex-Japan Fund (the Fund) Class R5 shares returned 12.43% for the six months ended April 30, 2013. |
| > | | The Fund outperformed its benchmark, the MSCI All Country (AC) Asia Pacific ex Japan Index (Net), which returned 10.30% during the same six-month period. |
| | | | | | | | | | | | | | |
Average Annual Total Returns (%) (for period ended April 30, 2013) | |
| | | Inception | | 6 Months
cumulative | | | 1 Year | | | Life | |
Class A* | | 09/27/10 | | | | | | | | | | | | |
Excluding sales charges | | | | | 12.19 | | | | 12.27 | | | | 10.91 | |
Including sales charges | | | | | 5.76 | | | | 5.84 | | | | 9.19 | |
Class C* | | 09/27/10 | | | | | | | | | | | | |
Excluding sales charges | | | | | 11.75 | | | | 11.48 | | | | 10.01 | |
Including sales charges | | | | | 10.75 | | | | 10.48 | | | | 10.01 | |
Class I* | | 09/27/10 | | | 12.41 | | | | 12.68 | | | | 11.31 | |
Class R* | | 09/27/10 | | | 12.01 | | | | 11.92 | | | | 10.55 | |
Class R5 | | 07/15/09 | | | 12.43 | | | | 12.70 | | | | 11.30 | |
Class Z* | | 09/27/10 | | | 12.29 | | | | 12.57 | | | | 11.12 | |
MSCI AC Asia Pacific ex Japan Index (Net) | | | | | 10.30 | | | | 13.12 | | | | 14.09 | |
Returns for Class A are shown with and without the maximum initial sales charge of 5.75%. Returns for Class C are shown with and without the 1.00% contingent deferred sales charge (CDSC) for the first year only. The Fund’s other classes are not subject to sales charges and have limited eligibility. Please see the Fund’s prospectus for details. Performance for different share classes will vary based on differences in sales charges and fees associated with each class. All results shown assume reinvestment of distributions during the period. Returns do not reflect the deduction of taxes that a shareholder may pay on Fund distributions or on the redemption of Fund shares. Performance results reflect the effect of any fee waivers or reimbursements of Fund expenses by Columbia Management Investment Advisers, LLC and/or any of its affiliates. Absent these fee waivers or expense reimbursement arrangements, performance results would have been lower.
The performance information shown represents past performance and is not a guarantee of future results. The investment return and principal value of your investment will fluctuate so that your shares, when redeemed, may be worth more or less than their original cost. Current performance may be lower or higher than the performance information shown. You may obtain performance information current to the most recent month-end by contacting your financial intermediary, visiting columbiamanagement.com or calling 800.345.6611.
| * | The returns shown for periods prior to the share class inception date (including returns for the Life of the Fund, if shown, which are since Fund inception) include the returns of the Fund’s oldest share class. These returns are adjusted to reflect any higher class-related operating expenses of the newer share classes, as applicable. Please visit columbiamanagement.com/mutual-funds/appended-performance for more information. |
The MSCI AC Asia Pacific ex Japan Index (Net) is a free float-adjusted market capitalization weighted index that is designed to measure the equity market performance of Asia, excluding Japan.
Indices are not available for investment, are not professionally managed and do not reflect sales charges, fees, brokerage commissions, taxes or other expenses of investing. Securities in the Fund may not match those in an index.
| | |
| |
| Columbia Asia Pacific ex-Japan Fund | | |
Portfolio Overview
(Unaudited)
| | | | |
Top Ten Holdings (%) (at April 30, 2013) | |
Samsung Electronics Co., Ltd. (South Korea) | | | 5.3 | |
Taiwan Semiconductor Manufacturing Co., Ltd., ADR (Taiwan) | | | 3.6 | |
Commonwealth Bank of Australia (Australia) | | | 2.6 | |
National Australia Bank Ltd. (Australia) | | | 2.4 | |
AIA Group Ltd. (Hong Kong) | | | 2.3 | |
Westpac Banking Corp. (Australia) | | | 2.2 | |
Australia and New Zealand Banking Group Ltd. (Australia) | | | 2.1 | |
Cheung Kong Holdings Ltd. (Hong Kong) | | | 2.0 | |
China Construction Bank Corp., Class H (China) | | | 1.9 | |
Wesfarmers Ltd. (Australia) | | | 1.8 | |
| Percentages | indicated are based upon total investments (excluding Money Market Funds). |
For further detail about these holdings, please refer to the section entitled “Portfolio of Investments”.
Fund holdings are as of the date given, are subject to change at any time, and are not recommendations to buy or sell any security.
| | | | |
Country Breakdown (%) (at April 30, 2013) | |
Australia | | | 21.1 | |
China | | | 17.1 | |
Hong Kong | | | 13.6 | |
India | | | 7.0 | |
Indonesia | | | 3.4 | |
Italy | | | 0.7 | |
Malaysia | | | 1.1 | |
Philippines | | | 3.2 | |
Singapore | | | 4.3 | |
South Korea | | | 11.9 | |
Taiwan | | | 8.9 | |
Thailand | | | 4.3 | |
United States(a) | | | 3.4 | |
Total | | | 100.0 | |
Percentages indicated are based upon total investments. The Fund’s portfolio composition is subject to change.
| (a) | Includes investments in Money Market Funds. |
Portfolio Management
Threadneedle International Limited
Vanessa Donegan
Rafael Polatinsky, CFA
Morningstar Style Box™
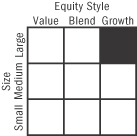
The Morningstar Style Box™ is based on a fund’s portfolio holdings. For equity funds, the vertical axis shows the market capitalization of the stocks owned, and the horizontal axis shows investment style (value, blend, or growth). Information shown is based on the most recent data provided by Morningstar.
© 2013 Morningstar, Inc. All rights reserved. The Morningstar information contained herein: (1) is proprietary to Morningstar and/or its content providers; (2) may not be copied or distributed; and (3) is not warranted to be accurate, complete or timely. Neither Morningstar nor its content providers are responsible for any damages or losses arising from any use of this information.
| | |
| |
| | Columbia Asia Pacific ex-Japan Fund |
Portfolio Overview (continued)
(Unaudited)
| | | | |
Summary of Investments in Securities by Industry (%) (at April 30, 2013) | |
Automobiles | | | 4.1 | |
Capital Markets | | | 0.9 | |
Chemicals | | | 1.3 | |
Commercial Banks | | | 23.5 | |
Commercial Services & Supplies | | | 0.5 | |
Communications Equipment | | | 0.7 | |
Computers & Peripherals | | | 0.5 | |
Construction & Engineering | | | 0.5 | |
Construction Materials | | | 0.8 | |
Consumer Finance | | | 0.6 | |
Containers & Packaging | | | 1.0 | |
Distributors | | | 0.3 | |
Diversified Financial Services | | | 0.8 | |
Diversified Telecommunication Services | | | 2.4 | |
Electric Utilities | | | 0.8 | |
Electrical Equipment | | | 0.6 | |
Electronic Equipment, Instruments & Components | | | 1.3 | |
Energy Equipment & Services | | | 0.5 | |
Food & Staples Retailing | | | 3.4 | |
Food Products | | | 0.7 | |
Gas Utilities | | | 2.7 | |
Health Care Equipment & Supplies | | | 1.4 | |
Health Care Providers & Services | | | 0.5 | |
Hotels, Restaurants & Leisure | | | 1.4 | |
Household Products | | | 1.0 | |
Independent Power Producers & Energy Traders | | | 0.7 | |
Industrial Conglomerates | | | 4.0 | |
Insurance | | | 3.2 | |
Internet Software & Services | | | 1.6 | |
IT Services | | | 0.4 | |
Machinery | | | 0.4 | |
Media | | | 0.9 | |
Metals & Mining | | | 3.0 | |
Multiline Retail | | | 0.4 | |
Oil, Gas & Consumable Fuels | | | 2.8 | |
Pharmaceuticals | | | 0.3 | |
Real Estate Investment Trusts (REITs) | | | 1.6 | |
Real Estate Management & Development | | | 7.8 | |
Semiconductors & Semiconductor Equipment | | | 10.0 | |
Specialty Retail | | | 0.4 | |
Textiles, Apparel & Luxury Goods | | | 1.1 | |
Tobacco | | | 1.1 | |
Transportation Infrastructure | | | 0.5 | |
Water Utilities | | | 1.2 | |
Wireless Telecommunication Services | | | 3.4 | |
Money Market Funds | | | 2.6 | |
Total | | | 99.6 | |
Percentages indicated are based upon net assets. The Fund’s portfolio composition is subject to change.
| | |
| |
| Columbia Asia Pacific ex-Japan Fund | | |
Understanding Your Fund’s Expenses
(Unaudited)
As an investor, you incur two types of costs. There are transaction costs, which generally include sales charges on purchases and may include redemption fees. There are also ongoing costs, which generally include management fees, distribution and service (Rule 12b-1) fees, and other fund expenses. The following information is intended to help you understand your ongoing costs (in dollars) of investing in the Fund and to help you compare these costs with the ongoing costs of investing in other mutual funds.
Analyzing Your Fund’s Expenses
To illustrate these ongoing costs, we have provided examples and calculated the expenses paid by investors in each share class of the Fund during the period. The actual and hypothetical information in the table is based on an initial investment of $1,000 at the beginning of the period indicated and held for the entire period. Expense information is calculated two ways and each method provides you with different information. The amount listed in the “Actual” column is calculated using the Fund’s actual operating expenses and total return for the period. You may use the Actual information, together with the amount invested, to estimate the expenses that you paid over the period. Simply divide your account value by $1,000 (for example, an $8,600 account value divided by $1,000 = 8.6), then multiply the results by the expenses paid during the period under the Actual column. The amount listed in the “Hypothetical” column assumes a 5% annual rate of return before expenses (which is not the Fund’s actual return) and then applies the Fund’s actual expense ratio for the period to the hypothetical return. You should not use the hypothetical account values and expenses to estimate either your actual account balance at the end of the period or the expenses you paid during the period. See “Compare With Other Funds” below for details on how to use the hypothetical data.
Compare With Other Funds
Since all mutual funds are required to include the same hypothetical calculations about expenses in shareholder reports, you can use this information to compare the ongoing cost of investing in the Fund with other funds. To do so, compare the hypothetical example with the 5% hypothetical examples that appear in the shareholder reports of other funds. As you compare hypothetical examples of other funds, it is important to note that hypothetical examples are meant to highlight the ongoing costs of investing in a fund only and do not reflect any transaction costs, such as sales charges, or redemption or exchange fees. Therefore, the hypothetical calculations are useful in comparing ongoing costs only, and will not help you determine the relative total costs of owning different funds. If transaction costs were included in these calculations, your costs would be higher.
November 1, 2012 – April 30, 2013
| | | | | | | | | | | | | | | | | | | | | | | | | | | | |
| | | Account Value at the
Beginning of the
Period ($) | | | Account Value at the
End of the
Period ($) | | | Expenses Paid During
the Period ($) | | | Fund’s Annualized
Expense Ratio (%) | |
| | | | Actual | | | | Hypothetical | | | | Actual | | | | Hypothetical | | | | Actual | | | | Hypothetical | | | | Actual | |
Class A | | | 1,000.00 | | | | 1,000.00 | | | | 1,121.90 | | | | 1,018.05 | | | | 7.16 | | | | 6.80 | | | | 1.36 | |
Class C | | | 1,000.00 | | | | 1,000.00 | | | | 1,117.50 | | | | 1,014.23 | | | | 11.18 | | | | 10.64 | | | | 2.13 | |
Class I | | | 1,000.00 | | | | 1,000.00 | | | | 1,124.10 | | | | 1,019.89 | | | | 5.21 | | | | 4.96 | | | | 0.99 | |
Class R | | | 1,000.00 | | | | 1,000.00 | | | | 1,120.10 | | | | 1,016.66 | | | | 8.62 | | | | 8.20 | | | | 1.64 | |
Class R5 | | | 1,000.00 | | | | 1,000.00 | | | | 1,124.30 | | | | 1,019.84 | | | | 5.27 | | | | 5.01 | | | | 1.00 | |
Class Z | | | 1,000.00 | | | | 1,000.00 | | | | 1,122.90 | | | | 1,019.19 | | | | 5.95 | | | | 5.66 | | | | 1.13 | |
Expenses paid during the period are equal to the annualized expense ratio for each class as indicated above, multiplied by the average account value over the period and then multiplied by the number of days in the Fund’s most recent fiscal half year and divided by 365.
Expenses do not include fees and expenses incurred indirectly by the Fund from the underlying funds in which the Fund may invest (also referred to as “acquired funds”), including affiliated and non-affiliated pooled investment vehicles (including mutual funds and exchange-traded funds).
| | |
| |
| | Columbia Asia Pacific ex-Japan Fund |
Portfolio of Investments
April 30, 2013 (Unaudited)
(Percentages represent value of investments compared to net assets)
| | | | | | | | |
| Common Stocks 97.0% | |
| Issuer | | Shares | | | Value ($) | |
Australia 20.9% | |
Amcor Ltd. | | | 484,707 | | | | 4,977,878 | |
| | |
Ansell Ltd. | | | 185,140 | | | | 3,035,638 | |
| | |
Australia and New Zealand Banking Group Ltd. | | | 316,120 | | | | 10,446,889 | |
| | |
BHP Billiton Ltd. | | | 251,703 | | | | 8,461,995 | |
| | |
Commonwealth Bank of Australia | | | 169,325 | | | | 12,906,108 | |
| | |
Iluka Resources Ltd. | | | 127,726 | | | | 1,186,620 | |
| | |
Macquarie Group Ltd. | | | 113,599 | | | | 4,621,405 | |
| | |
Mirvac Group | | | 2,091,090 | | | | 3,839,951 | |
| | |
National Australia Bank Ltd. | | | 331,700 | | | | 11,704,997 | |
| | |
Rio Tinto Ltd. | | | 98,710 | | | | 5,744,698 | |
| | |
Santos Ltd. | | | 170,203 | | | | 2,186,269 | |
| | |
Telstra Corp., Ltd. | | | 1,422,376 | | | | 7,346,224 | |
| | |
Wesfarmers Ltd. | | | 196,126 | | | | 8,823,384 | |
| | |
Westfield Retail Trust | | | 1,195,137 | | | | 4,086,531 | |
| | |
Westpac Banking Corp. | | | 317,996 | | | | 11,155,309 | |
| | |
Woolworths Ltd. | | | 100,508 | | | | 3,796,112 | |
| | |
WorleyParsons Ltd. | | | 113,996 | | | | 2,695,059 | |
| | | | | | | | | |
Total | | | | | | | 107,015,067 | |
| | |
| | | | | | | | |
China 17.1% | |
Baidu, Inc., ADR(a) | | | 26,533 | | | | 2,277,858 | |
| | |
Belle International Holdings Ltd. | | | 1,140,000 | | | | 1,863,710 | |
| | |
China Construction Bank Corp., Class H | | | 11,102,380 | | | | 9,318,345 | |
| | |
China Mobile Ltd. | | | 210,000 | | | | 2,309,709 | |
| | |
China Overseas Land & Investment Ltd. | | | 2,366,000 | | | | 7,224,017 | |
| | |
China Petroleum & Chemical Corp., Class H | | | 3,560,000 | | | | 3,928,690 | |
| | |
China Resources Power Holdings Co., Ltd. | | | 1,144,000 | | | | 3,745,814 | |
| | |
China Shenhua Energy Co., Ltd., Class H | | | 471,000 | | | | 1,670,102 | |
| | |
China Unicom Hong Kong Ltd. | | | 1,252,000 | | | | 1,805,250 | |
| | |
CNOOC Ltd. | | | 3,495,000 | | | | 6,546,380 | |
| | |
Dongfeng Motor Group Co., Ltd., Class H | | | 1,894,000 | | | | 2,829,609 | |
| | |
ENN Energy Holdings Ltd. | | | 1,122,000 | | | | 6,495,892 | |
| | |
Focus Media Holding Ltd., ADR | | | 91,338 | | | | 2,490,787 | |
| | |
Great Wall Motor Co., Ltd., Class H | | | 952,500 | | | | 4,138,591 | |
| | |
Guangdong Investment Ltd. | | | 6,546,000 | | | | 6,337,673 | |
| | |
Industrial & Commercial Bank of China Ltd., Class H | | | 11,158,000 | | | | 7,865,334 | |
| | |
Lenovo Group Ltd. | | | 2,714,000 | | | | 2,482,715 | |
| | | | | | | | |
| Common Stocks (continued) | |
| Issuer | | Shares | | | Value ($) | |
| | |
Ping An Insurance Group Co. of China Ltd., Class H | | | 680,000 | | | | 5,397,088 | |
| | |
Tencent Holdings Ltd. | | | 166,700 | | | | 5,750,861 | |
| | |
Zhuzhou CSR Times Electric Co., Ltd., Class H | | | 1,066,000 | | | | 2,955,042 | |
| | | | | | | | | |
Total | | | | | | | 87,433,467 | |
| | |
| | | | | | | | |
Hong Kong 13.5% | |
AAC Technologies Holdings, Inc. | | | 774,000 | | | | 3,788,629 | |
| | |
AIA Group Ltd. | | | 2,524,200 | | | | 11,228,801 | |
| | |
BOC Hong Kong Holdings Ltd. | | | 717,000 | | | | 2,470,913 | |
| | |
Cheung Kong Holdings Ltd. | | | 645,000 | | | | 9,734,155 | |
| | |
China Everbright International Ltd. | | | 3,414,000 | | | | 2,642,912 | |
| | |
Hutchison Whampoa Ltd. | | | 421,000 | | | | 4,580,154 | |
| | |
Jardine Strategic Holdings Ltd. | | | 176,500 | | | | 6,892,212 | |
| | |
Li & Fung Ltd. | | | 1,370,000 | | | | 1,778,067 | |
| | |
Samsonite International SA | | | 939,600 | | | | 2,317,270 | |
| | |
Sands China Ltd. | | | 1,336,800 | | | | 7,028,843 | |
| | |
Sun Hung Kai Properties Ltd. | | | 334,974 | | | | 4,843,754 | |
| | |
Towngas China Co., Ltd. | | | 3,968,000 | | | | 3,816,201 | |
| | |
Wharf Holdings Ltd. | | | 932,900 | | | | 8,332,757 | |
| | | | | | | | | |
Total | | | | | | | 69,454,668 | |
| | |
| | | | | | | | |
India 7.0% | |
Apollo Hospitals Enterprise Ltd. | | | 163,000 | | | | 2,523,890 | |
| | |
Bajaj Auto Ltd. | | | 77,008 | | | | 2,691,541 | |
| | |
HDFC Bank Ltd. | | | 431,920 | | | | 5,484,209 | |
| | |
ICICI Bank Ltd. | | | 115,162 | | | | 2,500,831 | |
| | |
ICICI Bank Ltd., ADR | | | 64,799 | | | | 3,033,889 | |
| | |
Infosys Ltd., ADR | | | 43,822 | | | | 1,829,130 | |
| | |
ITC Ltd. | | | 931,725 | | | | 5,693,281 | |
| | |
Larsen & Toubro Ltd. | | | 88,413 | | | | 2,485,818 | |
| | |
Mahindra & Mahindra Ltd. | | | 220,812 | | | | 3,793,676 | |
| | |
Shriram Transport Finance Co., Ltd. | | | 212,043 | | | | 2,935,859 | |
| | |
Sun Pharmaceutical Industries Ltd. | | | 78,538 | | | | 1,387,294 | |
| | |
Yes Bank Ltd. | | | 155,915 | | | | 1,453,845 | |
| | | | | | | | | |
Total | | | | | | | 35,813,263 | |
| | |
| | | | | | | | |
Indonesia 3.4% | |
PT Bank Mandiri Persero Tbk | | | 4,500,816 | | | | 4,869,117 | |
| | |
PT Indosiar Karya Media Tbk | | | 16,602,000 | | | | 2,312,549 | |
| | |
PT Jasa Marga Persero Tbk | | | 3,703,000 | | | | 2,555,422 | |
| | |
PT Perusahaan Gas Negara Persero Tbk | | | 5,220,500 | | | | 3,357,966 | |
| | |
PT Semen Indonesia Persero Tbk | | | 2,251,500 | | | | 4,267,105 | |
| | | | | | | | | |
Total | | | | | | | 17,362,159 | |
The accompanying Notes to Financial Statements are an integral part of this statement.
| | |
| |
| Columbia Asia Pacific ex-Japan Fund | | |
Portfolio of Investments (continued)
April 30, 2013 (Unaudited)
| | | | | | | | |
| Common Stocks (continued) | |
| Issuer | | Shares | | | Value ($) | |
Italy 0.7% | |
Prada SpA | | | 394,100 | | | | 3,558,574 | |
| | |
| | | | | | | | |
Malaysia 1.1% | |
CIMB Group Holdings Bhd | | | 1,409,200 | | | | 3,587,476 | |
| | |
Malayan Banking Bhd | | | 679,100 | | | | 2,148,375 | |
| | | | | | | | | |
Total | | | | | | | 5,735,851 | |
| | |
| | | | | | | | |
Philippines 3.2% | |
Alliance Global Group, Inc. | | | 9,269,000 | | | | 5,344,190 | |
| | |
Ayala Corp. | | | 255,452 | | | | 3,982,064 | |
| | |
Metropolitan Bank & Trust | | | 1,633,140 | | | | 4,943,155 | |
| | |
SM Prime Holdings, Inc. | | | 4,556,300 | | | | 2,217,152 | |
| | | | | | | | | |
Total | | | | | | | 16,486,561 | |
| | |
| | | | | | | | |
Singapore 4.3% | |
CapitaLand Ltd. | | | 1,464,000 | | | | 4,464,688 | |
| | |
DBS Group Holdings Ltd. | | | 420,000 | | | | 5,729,333 | |
| | |
K-REIT Asia | | | 105,000 | | | | 128,863 | |
| | |
Keppel Corp., Ltd. | | | 429,000 | | | | 3,742,058 | |
| | |
Oversea-Chinese Banking Corp., Ltd. | | | 548,196 | | | | 4,839,468 | |
| | |
Singapore Telecommunications Ltd. | | | 993,000 | | | | 3,171,944 | |
| | | | | | | | | |
Total | | | | | | | 22,076,354 | |
| | |
| | | | | | | | |
South Korea 11.9% | |
Hana Financial Group, Inc. | | | 82,050 | | | | 2,627,749 | |
| | |
Hyundai Department Store Co., Ltd. | | | 14,127 | | | | 2,054,622 | |
| | |
Hyundai Motor Co. | | | 40,265 | | | | 7,311,448 | |
| | |
Korea Electric Power Corp.(a) | | | 142,870 | | | | 4,119,263 | |
| | |
LG Chem Ltd. | | | 9,981 | | | | 2,362,074 | |
| | |
LG Household & Health Care Ltd. | | | 8,745 | | | | 4,917,498 | |
| | |
Orion Corp. | | | 3,254 | | | | 3,442,000 | |
| | |
Samsung Electronics Co., Ltd. | | | 18,895 | | | | 26,132,171 | |
| | |
Samsung Heavy Industries Co., Ltd. | | | 61,690 | | | | 1,968,184 | |
| | |
SK Hynix, Inc.(a) | | | 104,700 | | | | 2,851,645 | |
| | |
SK Telecom Co., Ltd. | | | 18,330 | | | | 3,226,536 | |
| | | | | | | | | |
Total | | | | | | | 61,013,190 | |
| | |
| | | | | | | | |
Taiwan 8.8% | |
Chinatrust Financial Holding Co., Ltd. | | | 6,928,017 | | | | 4,207,456 | |
| | |
Delta Electronics, Inc. | | | 1,078,000 | | | | 5,172,044 | |
| | |
E.Sun Financial Holding Co., Ltd. | | | 6,868,000 | | | | 4,150,496 | |
| | | | | | | | |
| Common Stocks (continued) | |
| Issuer | | Shares | | | Value ($) | |
| | |
Far EasTone Telecommunications Co., Ltd. | | | 1,210,000 | | | | 2,947,927 | |
| | |
Fubon Financial Holding Co., Ltd. | | | 915 | | | | 1,309 | |
| | |
Hon Hai Precision Industry Co., Ltd. | | | 644,966 | | | | 1,667,094 | |
| | |
Huaku Development Co., Ltd. | | | 1,088,000 | | | | 3,126,771 | |
| | |
President Chain Store Corp. | | | 258,000 | | | | 1,592,453 | |
| | |
Taiwan Semiconductor Manufacturing Co., Ltd. | | | 1,180,000 | | | | 4,379,489 | |
| | |
Taiwan Semiconductor Manufacturing Co., Ltd., ADR | | | 945,892 | | | | 18,047,620 | |
| | | | | | | | | |
Total | | | | | | | 45,292,659 | |
| | |
| | | | | | | | |
Thailand 4.3% | |
Advanced Information Service PCL, Foreign Registered Shares | | | 633,000 | | | | 5,833,968 | |
| | |
CP ALL PCL, Foreign Registered Shares | | | 2,301,600 | | | | 3,453,254 | |
| | |
PTT Global Chemical PCL | | | 1,686,500 | | | | 4,210,863 | |
| | |
Siam Commercial Bank PCL, Foreign Registered Shares | | | 855,400 | | | | 5,430,423 | |
| | |
Total Access Communication PCL, Foreign Registered Shares | | | 816,200 | | | | 3,259,166 | |
| | | | | | | | | |
Total | | | | | | | 22,187,674 | |
| | |
| | | | | | | | |
United States 0.8% | |
ResMed, Inc. | | | 816,866 | | | | 3,900,128 | |
| | | | | | | | | |
Total Common Stocks | | | | | | | | |
(Cost: $408,168,922) | | | | | | | 497,329,615 | |
| | |
| | | | | | | |
| Money Market Funds 2.6% | |
| | |
Columbia Short-Term Cash Fund, 0.126%(b)(c) | | | 13,391,104 | | | | 13,391,104 | |
| | | | | | | | | |
Total Money Market Funds | | | | | | | | |
(Cost: $13,391,104) | | | | | | | 13,391,104 | |
| | | | | | | | | |
Total Investments | | | | | | | | |
(Cost: $421,560,026) | | | | | | | 510,720,719 | |
| | | | | | | | | |
Other Assets & Liabilities, Net | | | | | | | 1,978,395 | |
| | | | | | | | | |
Net Assets | | | | | | | 512,699,114 | |
| | | | | | | | | |
The accompanying Notes to Financial Statements are an integral part of this statement.
| | |
| |
| | Columbia Asia Pacific ex-Japan Fund |
Portfolio of Investments (continued)
April 30, 2013 (Unaudited)
Notes to Portfolio of Investments
| (b) | The rate shown is the seven-day current annualized yield at April 30, 2013. |
| (c) | As defined in the Investment Company Act of 1940, an affiliated company is one in which the Fund owns 5% or more of its outstanding voting securities, or a company which is under common ownership or control with the Fund. Holdings and transactions in these affiliated companies during the period ended April 30, 2013, are as follows: |
| | | | | | | | | | | | | | | | | | | | | | | | | | | | |
| Issuer | | Beginning
Cost ($) | | | Purchase
Cost ($) | | | Proceeds
From Sales ($) | | | Realized
Gain (Loss) ($) | | | Ending
Cost ($) | | | Dividends –
Affiliated
Issuers ($) | | | Value ($) | |
Columbia Short-Term Cash Fund | | | 2,543,371 | | | | 96,675,357 | | | | (85,827,624 | ) | | | — | | | | 13,391,104 | | | | 6,570 | | | | 13,391,104 | |
Abbreviation Legend
| | |
| ADR | | American Depositary Receipt |
Fair Value Measurements
Generally accepted accounting principles (GAAP) require disclosure regarding the inputs and valuation techniques used to measure fair value and any changes in valuation inputs or techniques. In addition, investments shall be disclosed by major category.
The Fund categorizes its fair value measurements according to a three-level hierarchy that maximizes the use of observable inputs and minimizes the use of unobservable inputs by prioritizing that the most observable input be used when available. Observable inputs are those that market participants would use in pricing an investment based on market data obtained from sources independent of the reporting entity. Unobservable inputs are those that reflect the Fund’s assumptions about the information market participants would use in pricing an investment. An investment’s level within the fair value hierarchy is based on the lowest level of any input that is deemed significant to the asset or liability’s fair value measurement. The input levels are not necessarily an indication of the risk or liquidity associated with investments at that level. For example, certain U.S. government securities are generally high quality and liquid, however, they are reflected as Level 2 because the inputs used to determine fair value may not always be quoted prices in an active market.
Fair value inputs are summarized in the three broad levels listed below:
| > | | Level 1 — Valuations based on quoted prices for investments in active markets that the Fund has the ability to access at the measurement date (including NAV for open-end mutual funds). Valuation adjustments are not applied to Level 1 investments. |
| > | | Level 2 — Valuations based on other significant observable inputs (including quoted prices for similar securities, interest rates, prepayment speeds, credit risks, etc.). |
| > | | Level 3 — Valuations based on significant unobservable inputs (including the Fund’s own assumptions and judgment in determining the fair value of investments). |
Inputs that are used in determining fair value of an investment may include price information, credit data, volatility statistics, and other factors. These inputs can be either observable or unobservable. The availability of observable inputs can vary between investments, and is affected by various factors such as the type of investment, and the volume and level of activity for that investment or similar investments in the marketplace. The inputs will be considered by the Investment Manager, along with any other relevant factors in the calculation of an investment’s fair value. The Fund uses prices and inputs that are current as of the measurement date, which may include periods of market dislocations. During these periods, the availability of prices and inputs may be reduced for many investments. This condition could cause an investment to be reclassified between the various levels within the hierarchy.
Foreign equity securities actively traded in markets where there is a significant delay in the local close relative to the New York Stock Exchange (NYSE) are classified as Level 2. The values of these securities may include an adjustment to reflect the impact of significant market movements following the close of local trading, as described in Note 2 to the financial statements — Security Valuation.
Investments falling into the Level 3 category are primarily supported by quoted prices from brokers and dealers participating in the market for those investments. However, these may be classified as Level 3 investments due to lack of market transparency and corroboration to support these quoted prices. Additionally, valuation models may be used as the pricing source for any remaining investments classified as Level 3. These models may rely on one or more significant unobservable inputs and/or significant assumptions by the Investment Manager. Inputs used in valuations may include, but are not limited to, financial statement analysis, capital account balances, discount rates and estimated cash flows, and comparable company data.
Under the direction of the Fund’s Board of Trustees (the Board), the Investment Manager’s Valuation Committee (the Committee) is responsible for carrying out the valuation procedures approved by the Board. The Committee consists of voting and non-voting members from various groups within the Investment Manager’s organization, including operations and accounting, trading and investments, compliance, risk management and legal.
The Committee meets at least monthly to review and approve valuation matters, which may include a description of specific valuation determinations, data regarding pricing information received from approved pricing vendors and brokers and the results of Board-approved valuation control policies and procedures (the Policies). The Policies address, among other things, instances when market quotations are readily available, including recommendations of third party pricing vendors and a determination of appropriate pricing methodologies; events that require specific valuation determinations and assessment of fair value techniques; securities with a potential for stale pricing, including those that are illiquid, restricted, or in default; and the effectiveness of third- party pricing vendors, including periodic reviews of vendors. The Committee meets more frequently, as needed, to discuss additional valuation matters, which may include the need to review back-testing results, review time-sensitive information or approve related valuation actions. The Committee reports to the Board, with members of the Committee meeting with the Board at each of its regularly scheduled meetings to discuss valuation matters and actions during the period, similar to those described earlier.
The accompanying Notes to Financial Statements are an integral part of this statement.
| | |
| |
| Columbia Asia Pacific ex-Japan Fund | | |
Portfolio of Investments (continued)
April 30, 2013 (Unaudited)
Fair Value Measurements (continued)
For investments categorized as Level 3, the Committee monitors information similar to that described above, which may include: (i) data specific to the issuer or comparable issuers, (ii) general market or specific sector news and (iii) quoted prices and specific or similar security transactions. The Committee considers this data and any changes from prior periods in order to assess the reasonableness of observable and unobservable inputs, any assumptions or internal models used to value those securities and changes in fair value. This data is also used to corroborate, when available, information received from approved pricing vendors and brokers. Various factors impact the frequency of monitoring this information (which may occur as often as daily). However, the Committee may determine that changes to inputs, assumptions and models are not required as a result of the monitoring procedures performed.
The following table is a summary of the inputs used to value the Fund’s investments at April 30, 2013:
| | | | | | | | | | | | | | | | |
| Description | | Level 1
Quoted Prices in Active
Markets for Identical
Assets ($) | | | Level 2
Other Significant
Observable Inputs ($) | | | Level 3
Significant
Unobservable Inputs ($) | | | Total ($) | |
Equity Securities | | | | | | | | | | | | | | | | |
| | | | |
Common Stocks | | | | | | | | | | | | | | | | |
| | | | |
Consumer Discretionary | | | 2,490,787 | | | | 41,678,499 | | | | — | | | | 44,169,286 | |
| | | | |
Consumer Staples | | | — | | | | 31,717,983 | | | | — | | | | 31,717,983 | |
| | | | |
Energy | | | — | | | | 17,026,500 | | | | — | | | | 17,026,500 | |
| | | | |
Financials | | | 3,033,889 | | | | 194,004,992 | | | | — | | | | 197,038,881 | |
| | | | |
Health Care | | | — | | | | 10,846,950 | | | | — | | | | 10,846,950 | |
| | | | |
Industrials | | | — | | | | 33,165,992 | | | | — | | | | 33,165,992 | |
| | | | |
Information Technology | | | 22,154,608 | | | | 52,224,647 | | | | — | | | | 74,379,255 | |
| | | | |
Materials | | | — | | | | 31,211,234 | | | | — | | | | 31,211,234 | |
| | | | |
Telecommunication Services | | | — | | | | 29,900,724 | | | | — | | | | 29,900,724 | |
| | | | |
Utilities | | | — | | | | 27,872,810 | | | | — | | | | 27,872,810 | |
| | | | | | | | | | | | | | | | | |
Total Equity Securities | | | 27,679,284 | | | | 469,650,331 | | | | — | | | | 497,329,615 | |
| | | | | | | | | | | | | | | | | |
Other | | | | | | | | | | | | | | | | |
| | | | |
Money Market Funds | | | 13,391,104 | | | | — | | | | — | | | | 13,391,104 | |
| | | | | | | | | | | | | | | | | |
Total Other | | | 13,391,104 | | | | — | | | | — | | | | 13,391,104 | |
| | | | | | | | | | | | | | | | | |
Total | | | 41,070,388 | | | | 469,650,331 | | | | — | | | | 510,720,719 | |
| | | | | | | | | | | | | | | | | |
See the Portfolio of Investments for all investment classifications not indicated in the table.
The Fund’s assets assigned to the Level 2 input category are generally valued using the market approach, in which a security’s value is determined through reference to prices and information from market transactions for similar or identical assets. These assets include certain foreign securities for which a third party statistical pricing service may be employed for purposes of fair market valuation. The models utilized by the third party statistical pricing service take into account a security’s correlation to available market data including, but not limited to, intraday index, ADR, and ETF movements.
There were no transfers of financial assets between Levels 1 and 2 during the period.
The accompanying Notes to Financial Statements are an integral part of this statement.
| | |
| |
| | Columbia Asia Pacific ex-Japan Fund |
Statement of Assets and Liabilities
April 30, 2013 (Unaudited)
| | | | |
Assets | | | | |
| |
Investments, at value | | | | |
| |
Unaffiliated issuers (identified cost $408,168,922) | | | $497,329,615 | |
| |
Affiliated issuers (identified cost $13,391,104) | | | 13,391,104 | |
| |
Total investments (identified cost $421,560,026) | | | 510,720,719 | |
| |
Foreign currency (identified cost $723,903) | | | 731,843 | |
| |
Receivable for: | | | | |
| |
Investments sold | | | 835,658 | |
| |
Capital shares sold | | | 1,739,006 | |
| |
Dividends | | | 539,947 | |
| |
Reclaims | | | 22,256 | |
| |
Prepaid expenses | | | 1,060 | |
| |
Total assets | | | 514,590,489 | |
| |
| |
Liabilities | | | | |
| |
Payable for: | | | | |
| |
Investments purchased | | | 842,830 | |
| |
Capital shares purchased | | | 802,438 | |
| |
Investment management fees | | | 10,956 | |
| |
Distribution and/or service fees | | | 12 | |
| |
Foreign capital gains taxes deferred | | | 146,110 | |
| |
Administration fees | | | 1,113 | |
| |
Compensation of board members | | | 12,719 | |
| |
Other expenses | | | 75,197 | |
| |
Total liabilities | | | 1,891,375 | |
| |
Net assets applicable to outstanding capital stock | | | $512,699,114 | |
| |
| |
Represented by | | | | |
| |
Paid-in capital | | | $464,860,312 | |
| |
Undistributed net investment income | | | 351,813 | |
| |
Accumulated net realized loss | | | (41,535,577 | ) |
| |
Unrealized appreciation (depreciation) on: | | | | |
| |
Investments | | | 89,160,693 | |
| |
Foreign currency translations | | | 7,983 | |
| |
Foreign capital gains tax | | | (146,110 | ) |
| |
Total — representing net assets applicable to outstanding capital stock | | | $512,699,114 | |
| |
The accompanying Notes to Financial Statements are an integral part of this statement.
| | |
| 10 | | Semiannual Report 2013 |
| | |
| |
| Columbia Asia Pacific ex-Japan Fund | | |
Statement of Assets and Liabilities (continued)
April 30, 2013 (Unaudited)
| | | | |
Class A | | | | |
| |
Net assets | | | $579,078 | |
| |
Shares outstanding | | | 42,594 | |
| |
Net asset value per share | | | $13.60 | |
| |
Maximum offering price per share(a) | | | $14.43 | |
| |
Class C | | | | |
| |
Net assets | | | $117,016 | |
| |
Shares outstanding | | | 8,700 | |
| |
Net asset value per share | | | $13.45 | |
| |
Class I | | | | |
| |
Net assets | | | $2,560 | |
| |
Shares outstanding | | | 188 | |
| |
Net asset value per share(b) | | | $13.64 | |
| |
Class R | | | | |
| |
Net assets | | | $345,808 | |
| |
Shares outstanding | | | 25,598 | |
| |
Net asset value per share | | | $13.51 | |
| |
Class R5 | | | | |
| |
Net assets | | | $511,371,074 | |
| |
Shares outstanding | | | 37,468,418 | |
| |
Net asset value per share | | | $13.65 | |
| |
Class Z | | | | |
| |
Net assets | | | $283,578 | |
| |
Shares outstanding | | | 20,822 | |
| |
Net asset value per share | | | $13.62 | |
| |
| (a) | The maximum offering price per share is calculated by dividing the net asset value by 1.0 minus the maximum sales charge of 5.75%. |
| (b) | Net asset value per share rounds to this amount due to fractional shares outstanding. |
The accompanying Notes to Financial Statements are an integral part of this statement.
| | | | |
| Semiannual Report 2013 | | | 11 | |
| | |
| |
| | Columbia Asia Pacific ex-Japan Fund |
Statement of Operations
Six Months Ended April 30, 2013 (Unaudited)
| | | | |
Net investment income | | | | |
| |
Income: | | | | |
| |
Dividends — unaffiliated issuers | | | $3,291,877 | |
| |
Dividends — affiliated issuers | | | 6,570 | |
| |
Interest | | | 33 | |
| |
Income from securities lending — net | | | 676 | |
| |
Foreign taxes withheld | | | (143,007 | ) |
| |
Total income | | | 3,156,149 | |
| |
| |
Expenses: | | | | |
| |
Investment management fees | | | 1,680,620 | |
| |
Distribution and/or service fees | | | | |
| |
Class A | | | 1,157 | |
| |
Class C | | | 488 | |
| |
Class R | | | 550 | |
| |
Transfer agent fees | | | | |
| |
Class A | | | 752 | |
| |
Class C | | | 88 | |
| |
Class R | | | 199 | |
| |
Class R5 | | | 106,142 | |
| |
Class Z | | | 235 | |
| |
Administration fees | | | 170,286 | |
| |
Compensation of board members | | | 11,798 | |
| |
Custodian fees | | | 81,860 | |
| |
Printing and postage fees | | | 30,571 | |
| |
Registration fees | | | 28,658 | |
| |
Professional fees | | | 19,689 | |
| |
Line of credit interest expense | | | 789 | |
| |
Other | | | 8,713 | |
| |
Total expenses | | | 2,142,595 | |
| |
Net investment income | | | 1,013,554 | |
| |
| |
Realized and unrealized gain (loss) — net | | | | |
| |
Net realized gain (loss) on: | | | | |
| |
Investments | | | 4,845,618 | |
| |
Foreign currency translations | | | (63,700 | ) |
| |
Net realized gain | | | 4,781,918 | |
| |
Net change in unrealized appreciation (depreciation) on: | | | | |
| |
Investments | | | 44,018,366 | |
| |
Foreign currency translations | | | 3,507 | |
| |
Foreign capital gains tax | | | (126,626 | ) |
| |
Net change in unrealized appreciation (depreciation) | | | 43,895,247 | |
| |
Net realized and unrealized gain | | | 48,677,165 | |
| |
Net increase in net assets resulting from operations | | | $49,690,719 | |
| |
The accompanying Notes to Financial Statements are an integral part of this statement.
| | |
| 12 | | Semiannual Report 2013 |
| | |
| |
| Columbia Asia Pacific ex-Japan Fund | | |
Statement of Changes in Net Assets
| | | | | | | | |
| | | Six Months Ended
April 30, 2013
(Unaudited) | | | Year Ended
October 31, 2012 | |
Operations | | | | | | | | |
| | |
Net investment income | | | $1,013,554 | | | | $7,414,633 | |
| | |
Net realized gain (loss) | | | 4,781,918 | | | | (45,864,954 | ) |
| | |
Net change in unrealized appreciation (depreciation) | | | 43,895,247 | | | | 57,168,221 | |
| |
Net increase in net assets resulting from operations | | | 49,690,719 | | | | 18,717,900 | |
| |
| | |
Distributions to shareholders | | | | | | | | |
| | |
Net investment income | | | | | | | | |
| | |
Class A | | | (31,212 | ) | | | (6,071 | ) |
| | |
Class C | | | (1,255 | ) | | | (317 | ) |
| | |
Class I | | | (49 | ) | | | (35 | ) |
| | |
Class R | | | (3,383 | ) | | | (355 | ) |
| | |
Class R5 | | | (7,659,211 | ) | | | (5,950,962 | ) |
| | |
Class Z | | | (4,942 | ) | | | (1,257 | ) |
| | |
Net realized gains | | | | | | | | |
| | |
Class A | | | — | | | | (27,634 | ) |
| | |
Class C | | | — | | | | (2,240 | ) |
| | |
Class I | | | — | | | | (104 | ) |
| | |
Class R | | | — | | | | (1,429 | ) |
| | |
Class R5 | | | — | | | | (17,996,325 | ) |
| | |
Class Z | | | — | | | | (4,325 | ) |
| |
Total distributions to shareholders | | | (7,700,052 | ) | | | (23,991,054 | ) |
| |
Increase (decrease) in net assets from capital stock activity | | | 79,787,566 | | | | (108,994,364 | ) |
| |
Total increase (decrease) in net assets | | | 121,778,233 | | | | (114,267,518 | ) |
| | |
Net assets at beginning of period | | | 390,920,881 | | | | 505,188,399 | |
| |
Net assets at end of period | | | $512,699,114 | | | | $390,920,881 | |
| |
Undistributed net investment income | | | $351,813 | | | | $7,038,311 | |
| |
The accompanying Notes to Financial Statements are an integral part of this statement.
| | | | |
| Semiannual Report 2013 | | | 13 | |
| | |
| |
| | Columbia Asia Pacific ex-Japan Fund |
Statement of Changes in Net Assets (continued)
| | | | | | | | | | | | | | | | |
| | | Six Months Ended
April 30, 2013 (Unaudited) | | | Year Ended October 31, 2012 | |
| | | Shares | | | Dollars ($) | | | Shares | | | Dollars ($) | |
Capital stock activity | | | | | | | | | | | | | | | | |
| | | | |
Class A shares | | | | | | | | | | | | | | | | |
| | | | |
Subscriptions | | | 98,434 | | | | 1,254,503 | | | | 9,605 | | | | 116,970 | |
| | | | |
Distributions reinvested | | | 2,405 | | | | 31,166 | | | | 2,779 | | | | 30,151 | |
| | | | |
Redemptions | | | (94,848 | ) | | | (1,255,906 | ) | | | (27,152 | ) | | | (314,574 | ) |
| |
Net increase (decrease) | | | 5,991 | | | | 29,763 | | | | (14,768 | ) | | | (167,453 | ) |
| |
Class C shares | | | | | | | | | | | | | | | | |
| | | | |
Subscriptions | | | 4,537 | | | | 58,093 | | | | 3,809 | | | | 44,664 | |
| | | | |
Distributions reinvested | | | 95 | | | | 1,222 | | | | 224 | | | | 2,425 | |
| | | | |
Redemptions | | | (1,669 | ) | | | (21,752 | ) | | | (1,942 | ) | | | (22,639 | ) |
| |
Net increase | | | 2,963 | | | | 37,563 | | | | 2,091 | | | | 24,450 | |
| |
Class R shares | | | | | | | | | | | | | | | | |
| | | | |
Subscriptions | | | 11,717 | | | | 149,951 | | | | 11,692 | | | | 132,294 | |
| | | | |
Distributions reinvested | | | 259 | | | | 3,342 | | | | 153 | | | | 1,654 | |
| | | | |
Redemptions | | | (677 | ) | | | (8,829 | ) | | | (79 | ) | | | (970 | ) |
| |
Net increase | | | 11,299 | | | | 144,464 | | | | 11,766 | | | | 132,978 | |
| |
Class R5 shares | | | | | | | | | | | | | | | | |
| | | | |
Subscriptions | | | 11,053,131 | | | | 144,954,846 | | | | 17,913,488 | | | | 208,351,513 | |
| | | | |
Distributions reinvested | | | 38,431 | | | | 499,219 | | | | 709,038 | | | | 7,707,242 | |
| | | | |
Redemptions | | | (5,111,877 | ) | | | (65,893,083 | ) | | | (27,346,705 | ) | | | (325,179,464 | ) |
| |
Net increase (decrease) | | | 5,979,685 | | | | 79,560,982 | | | | (8,724,179 | ) | | | (109,120,709 | ) |
| |
Class Z shares | | | | | | | | | | | | | | | | |
| | | | |
Subscriptions | | | 1,070 | | | | 13,793 | | | | 11,915 | | | | 137,290 | |
| | | | |
Distributions reinvested | | | 377 | | | | 4,896 | | | | 502 | | | | 5,448 | |
| | | | |
Redemptions | | | (293 | ) | | | (3,895 | ) | | | (531 | ) | | | (6,368 | ) |
| |
Net increase | | | 1,154 | | | | 14,794 | | | | 11,886 | | | | 136,370 | |
| |
Total net increase (decrease) | | | 6,001,092 | | | | 79,787,566 | | | | (8,713,204 | ) | | | (108,994,364 | ) |
| |
The accompanying Notes to Financial Statements are an integral part of this statement.
| | |
| 14 | | Semiannual Report 2013 |
| | |
| |
| Columbia Asia Pacific ex-Japan Fund | | |
Financial Highlights
The following tables are intended to help you understand the Fund’s financial performance. Certain information reflects financial results for a single share of a class held for the periods shown. Per share net investment income (loss) amounts are calculated based on average shares outstanding during the period. Total return assumes reinvestment of all dividends and distributions, if any. Total return does not reflect payment of sales charges, if any, and is not annualized for periods of less than one year.
| | | | | | | | | | | | | | | | |
| |
| Six Months Ended
April 30, 2013 |
| | | Year Ended October 31, | |
Class A | | | (Unaudited) | | | | 2012 | | | | 2011 | | | | 2010(a) | |
Per share data | | | | | | | | | | | | | | | | |
Net asset value, beginning of period | | | $12.35 | | | | $12.49 | | | | $13.79 | | | | $13.32 | |
| | | | | | | | | | | | | | | | | |
Income from investment operations: | | | | | | | | | | | | | | | | |
| | | | |
Net investment income (loss) | | | (0.02 | ) | | | 0.15 | | | | 0.15 | | | | (0.01 | ) |
| | | | | | | | | | | | | | | | | |
Net realized and unrealized gain (loss) | | | 1.51 | | | | 0.41 | | | | (1.36 | ) | | | 0.48 | |
| | | | | | | | | | | | | | | | | |
Total from investment operations | | | 1.49 | | | | 0.56 | | | | (1.21 | ) | | | 0.47 | |
| | | | | | | | | | | | | | | | | |
Less distributions to shareholders: | | | | | | | | | | | | | | | | |
| | | | |
Net investment income | | | (0.24 | ) | | | (0.14 | ) | | | (0.07 | ) | | | — | |
| | | | | | | | | | | | | | | | | |
Net realized gains | | | — | | | | (0.56 | ) | | | (0.02 | ) | | | — | |
| | | | | | | | | | | | | | | | | |
Total distributions to shareholders | | | (0.24 | ) | | | (0.70 | ) | | | (0.09 | ) | | | — | |
| | | | | | | | | | | | | | | | | |
Net asset value, end of period | | | $13.60 | | | | $12.35 | | | | $12.49 | | | | $13.79 | |
| | | | | | | | | | | | | | | | | |
Total return | | | 12.19 | % | | | 5.23 | % | | | (8.82 | %) | | | 3.53 | % |
| | | | | | | | | | | | | | | | | |
Ratios to average net assets(b)(c) | | | | | | | | | | | | | | | | |
| | | | |
Total gross expenses | | | 1.36 | %(d)(e) | | | 1.42 | %(d) | | | 1.45 | %(d) | | | 1.50 | %(e) |
| | | | | | | | | | | | | | | | | |
Total net expenses(f) | | | 1.36 | %(d)(e) | | | 1.42 | %(d) | | | 1.45 | %(d)(g) | | | 1.50 | %(e) |
| | | | | | | | | | | | | | | | | |
Net investment income (loss) | | | (0.27 | %)(e) | | | 1.25 | % | | | 1.12 | % | | | (0.95 | %)(e) |
| | | | | | | | | | | | | | | | | |
Supplemental data | | | | | | | | | | | | | | | | |
| | | | |
Net assets, end of period (in thousands) | | | $579 | | | | $452 | | | | $642 | | | | $78 | |
| | | | | | | | | | | | | | | | | |
Portfolio turnover | | | 22 | % | | | 50 | % | | | 63 | % | | | 21 | % |
| | | | | | | | | | | | | | | | | |
Notes to Financial Highlights
| (a) | For the period from September 27, 2010 (commencement of operations) to October 31, 2010. |
| (b) | In addition to the fees and expenses which the Fund bears directly, the Fund indirectly bears a pro rata share of the fees and expenses of the acquired funds in which it invests. Such indirect expenses are not included in the reported expense ratios. |
| (c) | Certain line items from prior years have been reclassified to conform to the current presentation. |
| (d) | Ratios include line of credit interest expense which rounds to less than 0.01%. |
| (f) | Total net expenses include the impact of certain waivers/reimbursements made by the Investment Manager and certain of its affiliates, if applicable. |
| (g) | The benefits derived from expense reductions had an impact of less than 0.01%. |
The accompanying Notes to Financial Statements are an integral part of this statement.
| | | | |
| Semiannual Report 2013 | | | 15 | |
| | |
| |
| | Columbia Asia Pacific ex-Japan Fund |
Financial Highlights (continued)
| | | | | | | | | | | | | | | | |
| |
| Six Months Ended
April 30, 2013 |
| | | Year Ended October 31, | |
Class C | | | (Unaudited) | | | | 2012 | | | | 2011 | | | | 2010(a) | |
Per share data | | | | | | | | | | | | | | | | |
Net asset value, beginning of period | | | $12.20 | | | | $12.38 | | | | $13.78 | | | | $13.32 | |
| | | | | | | | | | | | | | | | | |
Income from investment operations: | | | | | | | | | | | | | | | | |
| | | | |
Net investment income (loss) | | | (0.04 | ) | | | 0.03 | | | | 0.06 | | | | (0.02 | ) |
| | | | | | | | | | | | | | | | | |
Net realized and unrealized gain (loss) | | | 1.47 | | | | 0.42 | | | | (1.38 | ) | | | 0.48 | |
| | | | | | | | | | | | | | | | | |
Total from investment operations | | | 1.43 | | | | 0.45 | | | | (1.32 | ) | | | 0.46 | |
| | | | | | | | | | | | | | | | | |
Less distributions to shareholders: | | | | | | | | | | | | | | | | |
| | | | |
Net investment income | | | (0.18 | ) | | | (0.07 | ) | | | (0.06 | ) | | | — | |
| | | | | | | | | | | | | | | | | |
Net realized gains | | | — | | | | (0.56 | ) | | | (0.02 | ) | | | — | |
| | | | | | | | | | | | | | | | | |
Total distributions to shareholders | | | (0.18 | ) | | | (0.63 | ) | | | (0.08 | ) | | | — | |
| | | | | | | | | | | | | | | | | |
Net asset value, end of period | | | $13.45 | | | | $12.20 | | | | $12.38 | | | | $13.78 | |
| | | | | | | | | | | | | | | | | |
Total return | | | 11.75 | % | | | 4.33 | % | | | (9.62 | %) | | | 3.45 | % |
| | | | | | | | | | | | | | | | | |
Ratios to average net assets(b)(c) | | | | | | | | | | | | | | | | |
| | | | |
Total gross expenses | | | 2.13 | %(d)(e) | | | 2.16 | %(d) | | | 2.19 | %(d) | | | 2.22 | %(e) |
| | | | | | | | | | | | | | | | | |
Total net expenses(f) | | | 2.13 | %(d)(e) | | | 2.16 | %(d) | | | 2.19 | %(d)(g) | | | 2.22 | %(e) |
| | | | | | | | | | | | | | | | | |
Net investment income (loss) | | | (0.63 | %)(e) | | | 0.25 | % | | | 0.44 | % | | | (1.93 | %)(e) |
| | | | | | | | | | | | | | | | | |
Supplemental data | | | | | | | | | | | | | | | | |
| | | | |
Net assets, end of period (in thousands) | | | $117 | | | | $70 | | | | $45 | | | | $3 | |
| | | | | | | | | | | | | | | | | |
Portfolio turnover | | | 22 | % | | | 50 | % | | | 63 | % | | | 21 | % |
| | | | | | | | | | | | | | | | | |
Notes to Financial Highlights
| (a) | For the period from September 27, 2010 (commencement of operations) to October 31, 2010. |
| (b) | In addition to the fees and expenses which the Fund bears directly, the Fund indirectly bears a pro rata share of the fees and expenses of the acquired funds in which it invests. Such indirect expenses are not included in the reported expense ratios. |
| (c) | Certain line items from prior years have been reclassified to conform to the current presentation. |
| (d) | Ratios include line of credit interest expense which rounds to less than 0.01%. |
| (f) | Total net expenses include the impact of certain waivers/reimbursements made by the Investment Manager and certain of its affiliates, if applicable. |
| (g) | The benefits derived from expense reductions had an impact of less than 0.01%. |
The accompanying Notes to Financial Statements are an integral part of this statement.
| | |
| 16 | | Semiannual Report 2013 |
| | |
| |
| Columbia Asia Pacific ex-Japan Fund | | |
Financial Highlights (continued)
| | | | | | | | | | | | | | | | |
| |
| Six Months Ended
April 30, 2013 |
| | | Year Ended October 31, | |
Class I | | | (Unaudited) | | | | 2012 | | | | 2011 | | | | 2010(a) | |
Per share data | | | | | | | | | | | | | | | | |
Net asset value, beginning of period | | | $12.38 | | | | $12.54 | | | | $13.79 | | | | $13.32 | |
| | | | | | | | | | | | | | | | | |
Income from investment operations: | | | | | | | | | | | | | | | | |
| | | | |
Net investment income (loss) | | | 0.03 | | | | 0.20 | | | | 0.18 | | | | (0.01 | ) |
| | | | | | | | | | | | | | | | | |
Net realized and unrealized gain (loss) | | | 1.49 | | | | 0.38 | | | | (1.33 | ) | | | 0.48 | |
| | | | | | | | | | | | | | | | | |
Total from investment operations | | | 1.52 | | | | 0.58 | | | | (1.15 | ) | | | 0.47 | |
| | | | | | | | | | | | | | | | | |
Less distributions to shareholders: | | | | | | | | | | | | | | | | |
| | | | |
Net investment income | | | (0.26 | ) | | | (0.18 | ) | | | (0.08 | ) | | | — | |
| | | | | | | | | | | | | | | | | |
Net realized gains | | | — | | | | (0.56 | ) | | | (0.02 | ) | | | — | |
| | | | | | | | | | | | | | | | | |
Total distributions to shareholders | | | (0.26 | ) | | | (0.74 | ) | | | (0.10 | ) | | | — | |
| | | | | | | | | | | | | | | | | |
Net asset value, end of period | | | $13.64 | | | | $12.38 | | | | $12.54 | | | | $13.79 | |
| | | | | | | | | | | | | | | | | |
Total return | | | 12.41 | % | | | 5.48 | % | | | (8.40 | %) | | | 3.53 | % |
| | | | | | | | | | | | | | | | | |
Ratios to average net assets(b)(c) | | | | | | | | | | | | | | | | |
| | | | |
Total gross expenses | | | 0.99 | %(d)(e) | | | 0.97 | %(d) | | | 0.99 | %(d) | | | 1.08 | %(e) |
| | | | | | | | | | | | | | | | | |
Total net expenses(f) | | | 0.99 | %(d)(e) | | | 0.97 | %(d) | | | 0.99 | %(d) | | | 1.08 | %(e) |
| | | | | | | | | | | | | | | | | |
Net investment income (loss) | | | 0.46 | %(e) | | | 1.70 | % | | | 1.31 | % | | | (0.78 | %)(e) |
| | | | | | | | | | | | | | | | | |
Supplemental data | | | | | | | | | | | | | | | | |
| | | | |
Net assets, end of period (in thousands) | | | $3 | | | | $2 | | | | $2 | | | | $3 | |
| | | | | | | | | | | | | | | | | |
Portfolio turnover | | | 22 | % | | | 50 | % | | | 63 | % | | | 21 | % |
| | | | | | | | | | | | | | | | | |
Notes to Financial Highlights
| (a) | For the period from September 27, 2010 (commencement of operations) to October 31, 2010. |
| (b) | In addition to the fees and expenses which the Fund bears directly, the Fund indirectly bears a pro rata share of the fees and expenses of the acquired funds in which it invests. Such indirect expenses are not included in the reported expense ratios. |
| (c) | Certain line items from prior years have been reclassified to conform to the current presentation. |
| (d) | Ratios include line of credit interest expense which rounds to less than 0.01%. |
| (f) | Total net expenses include the impact of certain waivers/reimbursements made by the Investment Manager and certain of its affiliates, if applicable. |
The accompanying Notes to Financial Statements are an integral part of this statement.
| | | | |
| Semiannual Report 2013 | | | 17 | |
| | |
| |
| | Columbia Asia Pacific ex-Japan Fund |
Financial Highlights (continued)
| | | | | | | | | | | | | | | | |
| |
| Six Months Ended
April 30, 2013 |
| | | Year Ended October 31, | |
Class R | | | (Unaudited) | | | | 2012 | | | | 2011 | | | | 2010(a) | |
Per share data | | | | | | | | | | | | | | | | |
Net asset value, beginning of period | | | $12.27 | | | | $12.46 | | | | $13.79 | | | | $13.32 | |
| | | | | | | | | | | | | | | | | |
Income from investment operations: | | | | | | | | | | | | | | | | |
| | | | |
Net investment income (loss) | | | (0.01 | ) | | | 0.13 | | | | 0.16 | | | | (0.02 | ) |
| | | | | | | | | | | | | | | | | |
Net realized and unrealized gain (loss) | | | 1.47 | | | | 0.37 | | | | (1.41 | ) | | | 0.49 | |
| | | | | | | | | | | | | | | | | |
Total from investment operations | | | 1.46 | | | | 0.50 | | | | (1.25 | ) | | | 0.47 | |
| | | | | | | | | | | | | | | | | |
Less distributions to shareholders: | | | | | | | | | | | | | | | | |
| | | | |
Net investment income | | | (0.22 | ) | | | (0.13 | ) | | | (0.06 | ) | | | — | |
| | | | | | | | | | | | | | | | | |
Net realized gains | | | — | | | | (0.56 | ) | | | (0.02 | ) | | | — | |
| | | | | | | | | | | | | | | | | |
Total distributions to shareholders | | | (0.22 | ) | | | (0.69 | ) | | | (0.08 | ) | | | — | |
| | | | | | | | | | | | | | | | | |
Net asset value, end of period | | | $13.51 | | | | $12.27 | | | | $12.46 | | | | $13.79 | |
| | | | | | | | | | | | | | | | | |
Total return | | | 12.01 | % | | | 4.78 | % | | | (9.15 | %) | | | 3.53 | % |
| | | | | | | | | | | | | | | | | |
Ratios to average net assets(b)(c) | | | | | | | | | | | | | | | | |
| | | | |
Total gross expenses | | | 1.64 | %(d)(e) | | | 1.63 | %(d) | | | 1.70 | %(d) | | | 1.73 | %(e) |
| | | | | | | | | | | | | | | | | |
Total net expenses(f) | | | 1.64 | %(d)(e) | | | 1.63 | %(d) | | | 1.68 | %(d)(g) | | | 1.73 | %(e) |
| | | | | | | | | | | | | | | | | |
Net investment income (loss) | | | (0.18 | %)(e) | | | 1.08 | % | | | 1.26 | % | | | (1.43 | %)(e) |
| | | | | | | | | | | | | | | | | |
Supplemental data | | | | | | | | | | | | | | | | |
| | | | |
Net assets, end of period (in thousands) | | | $346 | | | | $175 | | | | $32 | | | | $3 | |
| | | | | | | | | | | | | | | | | |
Portfolio turnover | | | 22 | % | | | 50 | % | | | 63 | % | | | 21 | % |
| | | | | | | | | | | | | | | | | |
Notes to Financial Highlights
| (a) | For the period from September 27, 2010 (commencement of operations) to October 31, 2010. |
| (b) | In addition to the fees and expenses which the Fund bears directly, the Fund indirectly bears a pro rata share of the fees and expenses of the acquired funds in which it invests. Such indirect expenses are not included in the reported expense ratios. |
| (c) | Certain line items from prior years have been reclassified to conform to the current presentation. |
| (d) | Ratios include line of credit interest expense which rounds to less than 0.01%. |
| (f) | Total net expenses include the impact of certain waivers/reimbursements made by the Investment Manager and certain of its affiliates, if applicable. |
| (g) | The benefits derived from expense reductions had an impact of less than 0.01%. |
The accompanying Notes to Financial Statements are an integral part of this statement.
| | |
| 18 | | Semiannual Report 2013 |
| | |
| |
| Columbia Asia Pacific ex-Japan Fund | | |
Financial Highlights (continued)
| | | | | | | | | | | | | | | | | | | | |
| |
| Six Months Ended
April 30, 2013 |
| | | Year Ended October 31, | |
Class R5 | | | (Unaudited) | | | | 2012 | | | | 2011 | | | | 2010 | | | | 2009(a) | |
Per share data | | | | | | | | | | | | | | | | | | | | |
Net asset value, beginning of period | | | $12.38 | | | | $12.54 | | | | $13.79 | | | | $11.42 | | | | $10.00 | |
| | | | | | | | | | | | | | | | | | | | | |
Income from investment operations: | | | | | | | | | | | | | | | | | | | | |
| | | | | |
Net investment income | | | 0.03 | | | | 0.21 | | | | 0.18 | | | | 0.13 | | | | 0.02 | |
| | | | | | | | | | | | | | | | | | | | | |
Net realized and unrealized gain (loss) | | | 1.50 | | | | 0.37 | | | | (1.33 | ) | | | 2.27 | | | | 1.40 | |
| | | | | | | | | | | | | | | | | | | | | |
Total from investment operations | | | 1.53 | | | | 0.58 | | | | (1.15 | ) | | | 2.40 | | | | 1.42 | |
| | | | | | | | | | | | | | | | | | | | | |
Less distributions to shareholders: | | | | | | | | | | | | | | | | | | | | |
| | | | | |
Net investment income | | | (0.26 | ) | | | (0.18 | ) | | | (0.08 | ) | | | (0.02 | ) | | | — | |
| | | | | | | | | | | | | | | | | | | | | |
Net realized gains | | | — | | | | (0.56 | ) | | | (0.02 | ) | | | (0.01 | ) | | | — | |
| | | | | | | | | | | | | | | | | | | | | |
Total distributions to shareholders | | | (0.26 | ) | | | (0.74 | ) | | | (0.10 | ) | | | (0.03 | ) | | | — | |
| | | | | | | | | | | | | | | | | | | | | |
Net asset value, end of period | | | $13.65 | | | | $12.38 | | | | $12.54 | | | | $13.79 | | | | $11.42 | |
| | | | | | | | | | | | | | | | | | | | | |
Total return | | | 12.43 | % | | | 5.44 | % | | | (8.42 | %) | | | 21.06 | % | | | 14.20 | % |
| | | | | | | | | | | | | | | | | | | | | |
Ratios to average net assets(b)(c) | | | | | | | | | | | | | | | | | | | | |
| | | | | |
Total gross expenses | | | 1.00 | %(d)(e) | | | 1.01 | %(d) | | | 0.98 | %(d) | | | 1.09 | % | | | 1.67 | %(e) |
| | | | | | | | | | | | | | | | | | | | | |
Total net expenses(f) | | | 1.00 | %(d)(e) | | | 1.01 | %(d) | | | 0.98 | %(d) | | | 1.09 | % | | | 1.15 | %(e) |
| | | | | | | | | | | | | | | | | | | | | |
Net investment income | | | 0.48 | %(e) | | | 1.76 | % | | | 1.31 | % | | | 1.09 | % | | | 0.47 | %(e) |
| | | | | | | | | | | | | | | | | | | | | |
Supplemental data | | | | | | | | | | | | | | | | | | | | |
| | | | | |
Net assets, end of period (in thousands) | | | $511,371 | | | | $389,978 | | | | $504,370 | | | | $512,721 | | | | $53,643 | |
| | | | | | | | | | | | | | | | | | | | | |
Portfolio turnover | | | 22 | % | | | 50 | % | | | 63 | % | | | 21 | % | | | 4 | % |
| | | | | | | | | | | | | | | | | | | | | |
Notes to Financial Highlights
| (a) | For the period from July 15, 2009 (commencement of operations) to October 31, 2009. |
| (b) | In addition to the fees and expenses which the Fund bears directly, the Fund indirectly bears a pro rata share of the fees and expenses of the acquired funds in which it invests. Such indirect expenses are not included in the reported expense ratios. |
| (c) | Certain line items from prior years have been reclassified to conform to the current presentation. |
| (d) | Ratios include line of credit interest expense which rounds to less than 0.01%. |
| (f) | Total net expenses include the impact of certain waivers/reimbursements made by the Investment Manager and certain of its affiliates, if applicable. |
The accompanying Notes to Financial Statements are an integral part of this statement.
| | | | |
| Semiannual Report 2013 | | | 19 | |
| | |
| |
| | Columbia Asia Pacific ex-Japan Fund |
Financial Highlights (continued)
| | | | | | | | | | | | | | | | |
| |
| Six Months Ended
April 30, 2013 |
| | | Year Ended October 31, | |
Class Z | | | (Unaudited) | | | | 2012 | | | | 2011 | | | | 2010(a) | |
Per share data | | | | | | | | | | | | | | | | |
Net asset value, beginning of period | | | $12.36 | | | | $12.51 | | | | $13.79 | | | | $13.32 | |
| | | | | | | | | | | | | | | | | |
Income from investment operations: | | | | | | | | | | | | | | | | |
| | | | |
Net investment income (loss) | | | 0.02 | | | | 0.17 | | | | 0.19 | | | | (0.01 | ) |
| | | | | | | | | | | | | | | | | |
Net realized and unrealized gain (loss) | | | 1.49 | | | | 0.40 | | | | (1.37 | ) | | | 0.48 | |
| | | | | | | | | | | | | | | | | |
Total from investment operations | | | 1.51 | | | | 0.57 | | | | (1.18 | ) | | | 0.47 | |
| | | | | | | | | | | | | | | | | |
Less distributions to shareholders: | | | | | | | | | | | | | | | | |
| | | | |
Net investment income | | | (0.25 | ) | | | (0.16 | ) | | | (0.08 | ) | | | — | |
| | | | | | | | | | | | | | | | | |
Net realized gains | | | — | | | | (0.56 | ) | | | (0.02 | ) | | | — | |
| | | | | | | | | | | | | | | | | |
Total distributions to shareholders | | | (0.25 | ) | | | (0.72 | ) | | | (0.10 | ) | | | — | |
| | | | | | | | | | | | | | | | | |
Net asset value, end of period | | | $13.62 | | | | $12.36 | | | | $12.51 | | | | $13.79 | |
| | | | | | | | | | | | | | | | | |
Total return | | | 12.29 | % | | | 5.33 | % | | | (8.63 | %) | | | 3.53 | % |
| | | | | | | | | | | | | | | | | |
Ratios to average net assets(b)(c) | | | | | | | | | | | | | | | | |
| | | | |
Total gross expenses | | | 1.13 | %(d)(e) | | | 1.15 | %(d) | | | 1.24 | %(d) | | | 1.23 | %(e) |
| | | | | | | | | | | | | | | | | |
Total net expenses(f) | | | 1.13 | %(d)(e) | | | 1.15 | %(d) | | | 1.24 | %(d)(g) | | | 1.23 | %(e) |
| | | | | | | | | | | | | | | | | |
Net investment income (loss) | | | 0.32 | %(e) | | | 1.41 | % | | | 1.35 | % | | | (0.93 | %)(e) |
| | | | | | | | | | | | | | | | | |
Supplemental data | | | | | | | | | | | | | | | | |
| | | | |
Net assets, end of period (in thousands) | | | $284 | | | | $243 | | | | $97 | | | | $3 | |
| | | | | | | | | | | | | | | | | |
Portfolio turnover | | | 22 | % | | | 50 | % | | | 63 | % | | | 21 | % |
| | | | | | | | | | | | | | | | | |
Notes to Financial Highlights
| (a) | For the period from September 27, 2010 (commencement of operations) to October 31, 2010. |
| (b) | In addition to the fees and expenses which the Fund bears directly, the Fund indirectly bears a pro rata share of the fees and expenses of the acquired funds in which it invests. Such indirect expenses are not included in the reported expense ratios. |
| (c) | Certain line items from prior years have been reclassified to conform to the current presentation. |
| (d) | Ratios include line of credit interest expense which rounds to less than 0.01%. |
| (f) | Total net expenses include the impact of certain waivers/reimbursements made by the Investment Manager and certain of its affiliates, if applicable. |
| (g) | The benefits derived from expense reductions had an impact of less than 0.01%. |
The accompanying Notes to Financial Statements are an integral part of this statement.
| | |
| 20 | | Semiannual Report 2013 |
| | |
| |
| Columbia Asia Pacific ex-Japan Fund | | |
Notes to Financial Statements
April 30, 2013 (Unaudited)
Note 1. Organization
Columbia Asia Pacific ex-Japan Fund (the Fund), a series of Columbia Funds Series Trust II (the Trust), is a diversified fund. The Trust is registered under the Investment Company Act of 1940, as amended (the 1940 Act), as an open-end management investment company organized as a Massachusetts business trust.
Fund Shares
The Trust may issue an unlimited number of shares (without par value). The Fund offers Class A, Class C, Class I, Class R, Class R5 and Class Z shares. All share classes have identical voting, dividend and liquidation rights. Each share class has its own expense structure and sales charges, as applicable.
Class A shares are subject to a maximum front-end sales charge of 5.75% based on the initial investment amount. Class A shares purchased without an initial sales charge in accounts aggregating $1 million to $50 million at the time of purchase are subject to a contingent deferred sales charge (CDSC) if the shares are sold within 18 months of purchase, charged as follows: 1.00% CDSC if redeemed within 12 months of purchase, and 0.50% CDSC if redeemed more than 12, but less than 18, months after purchase.
Class C shares are subject to a 1.00% CDSC on shares redeemed within one year of purchase.
Class I shares are not subject to sales charges and are available only to the Columbia Family of Funds.
Class R shares are not subject to sales charges and are available only to certain retirement plans and other eligible investors.
Class R5 shares are not subject to sales charges. Effective November 8, 2012, Class R5 shares are generally available only to investors purchasing through authorized investment professionals and omnibus retirement plans. Prior to November 8, 2012, Class R5 shares were closed to new investors.
Class Z shares are not subject to sales charges, and are available only to certain investors.
Note 2. Summary of Significant Accounting Policies
Use of Estimates
The preparation of financial statements in accordance with U.S. generally accepted accounting principles (GAAP) requires management to make certain estimates and assumptions that affect the reported amounts of assets and liabilities, the disclosure of contingent assets and liabilities at
the date of the financial statements and the reported amounts of revenue and expenses during the reporting period. Actual results could differ from those estimates.
The following is a summary of significant accounting policies consistently followed by the Fund in the preparation of its financial statements.
Security Valuation
All equity securities are valued at the close of business of the New York Stock Exchange (NYSE). Equity securities are valued at the last quoted sales price on the principal exchange or market on which they trade, except for securities traded on the NASDAQ Stock Market, which are valued at the NASDAQ official close price. Unlisted securities or listed securities for which there were no sales during the day are valued at the mean of the latest quoted bid and ask prices on such exchanges or markets.
Foreign equity securities are valued based on quotations from the principal market in which such securities are normally traded. If any foreign share prices are not readily available as a result of limited share activity the securities are valued at the mean of the latest quoted bid and ask prices on such exchanges or markets. Foreign currency exchange rates are generally determined at 4:00 p.m. Eastern (U.S.) time. However, many securities markets and exchanges outside the U.S. close prior to the close of the NYSE; therefore, the closing prices for securities in such markets or on such exchanges may not fully reflect events that occur after such close but before the close of the NYSE. In those situations, foreign securities will be fair valued pursuant to the policy adopted by the Board, including utilizing a third party pricing service to determine these fair values. The third party pricing service takes into account multiple factors, including, but not limited to, movements in the U.S. securities markets, certain depositary receipts, futures contracts and foreign exchange rates that have occurred subsequent to the close of the foreign exchange or market, to determine a good faith estimate that reasonably reflects the current market conditions as of the close of the NYSE. The fair value of a security is likely to be different from the quoted or published price, if available.
Investments in other open-end investment companies, including money market funds, are valued at net asset value.
Investments for which market quotations are not readily available, or that have quotations which management believes are not reliable, are valued at fair value as determined in good faith under consistently applied procedures established by and under the general supervision of the Board. If a security or class of securities (such as foreign securities) is valued at fair value, such value is likely to be different from the last quoted market price for the security.
| | | | |
| Semiannual Report 2013 | | | 21 | |
| | |
| |
| | Columbia Asia Pacific ex-Japan Fund |
Notes to Financial Statements (continued)
April 30, 2013 (Unaudited)
The determination of fair value often requires significant judgment. To determine fair value, management may use assumptions including but not limited to future cash flows and estimated risk premiums. Multiple inputs from various sources may be used to determine fair value.
Foreign Currency Transactions and Translations
The values of all assets and liabilities denominated in foreign currencies are translated into U.S. dollars at that day’s exchange rates. Net realized and unrealized gains (losses) on foreign currency transactions and translations include gains (losses) arising from the fluctuation in exchange rates between trade and settlement dates on securities transactions, gains (losses) arising from the disposition of foreign currency and currency gains (losses) between the accrual and payment dates on dividends, interest income and foreign withholding taxes.
For financial statement purposes, the Fund does not distinguish that portion of gains (losses) on investments which is due to changes in foreign exchange rates from that which is due to changes in market prices of the investments. Such fluctuations are included with the net realized and unrealized gains (losses) on investments in the Statement of Operations.
Security Transactions
Security transactions are accounted for on the trade date. Cost is determined and gains (losses) are based upon the specific identification method for both financial statement and federal income tax purposes.
Income Recognition
Corporate actions and dividend income are recorded net of any non-reclaimable tax withholdings, on the ex-dividend date or upon receipt of ex-dividend notification in the case of certain foreign securities.
Awards from class action litigation are recorded as a reduction of cost basis if the Fund still owns the applicable securities on the payment date. If the Fund no longer owns the applicable securities, the proceeds are recorded as realized gains.
Expenses
General expenses of the Trust are allocated to the Fund and other funds of the Trust based upon relative net assets or other expense allocation methodologies determined by the nature of the expense. Expenses directly attributable to the Fund are charged to the Fund. Expenses directly attributable to a specific class of shares are charged to that share class.
Determination of Class Net Asset Value
All income, expenses (other than class-specific expenses, which are charged to that share class, as shown in the
Statement of Operations) and realized and unrealized gains (losses) are allocated to each class of the Fund on a daily basis, based on the relative net assets of each class, for purposes of determining the net asset value of each class.
Federal Income Tax Status
The Fund intends to qualify each year as a regulated investment company under Subchapter M of the Internal Revenue Code, as amended, and will distribute substantially all of its taxable income (including net short-term capital gains), if any, for its tax year, and as such will not be subject to federal income taxes. In addition, the Fund intends to distribute in each calendar year substantially all of its net investment income, capital gains and certain other amounts, if any, such that the Fund should not be subject to federal excise tax. Therefore, no federal income or excise tax provision is recorded.
Foreign Taxes
The Fund may be subject to foreign taxes on income, gains on investments or currency repatriation, a portion of which may be recoverable. The Fund will accrue such taxes and recoveries, as applicable, based upon its current interpretation of tax rules and regulations that exist in the markets in which it invests.
Realized gains in certain countries may be subject to foreign taxes at the Fund level, based on statutory rates. The Fund accrues for such foreign taxes on net realized and unrealized gains at the appropriate rate for each jurisdiction, as applicable. The amount, if any, is disclosed as a liability on the Statement of Assets and Liabilities.
Distributions to Shareholders
Distributions from net investment income, if any, are declared and paid annually. Net realized capital gains, if any, are distributed along with the income distribution. Income distributions and capital gain distributions are determined in accordance with federal income tax regulations, which may differ from GAAP.
Guarantees and Indemnifications
Under the Trust’s organizational documents and, in some cases, by contract, its officers and trustees are indemnified against certain liabilities arising out of the performance of their duties to the Trust or its funds. In addition, certain of the Fund’s contracts with its service providers contain general indemnification clauses. The Fund’s maximum exposure under these arrangements is unknown since the amount of any future claims that may be made against the Fund cannot be determined, and the Fund has no historical basis for predicting the likelihood of any such claims.
| | |
| 22 | | Semiannual Report 2013 |
| | |
| |
| Columbia Asia Pacific ex-Japan Fund | | |
Notes to Financial Statements (continued)
April 30, 2013 (Unaudited)
Recent Accounting Pronouncement
Disclosures about Offsetting Assets and Liabilities
In December 2011, the Financial Accounting Standards Board (FASB) issued Accounting Standards Update (ASU) No. 2011-11, Disclosures about Offsetting Assets and Liabilities and in January 2013, ASU No. 2013-1, Clarifying the Scope of Disclosures about Offsetting Assets and Liabilities (collectively, the ASU’s). Specifically, the ASU’s require an entity to disclose both gross and net information for derivatives and other financial instruments that are subject to a master netting arrangement or similar agreement. The ASU’s require disclosure of collateral received in connection with the master netting agreements or similar agreements. The disclosure requirements are effective for interim and annual periods beginning on or after January 1, 2013. At this time, management is evaluating the implications of this guidance and the impact it will have on the financial statement amounts and footnote disclosures, if any.
Note 3. Fees and Compensation Paid to Affiliates
Investment Management Fees
Under an Investment Management Services Agreement, Columbia Management Investment Advisers, LLC (the Investment Manager), a wholly-owned subsidiary of Ameriprise Financial, Inc. (Ameriprise Financial), is responsible for the ultimate oversight of investments made by the Fund. The Fund’s subadviser (see Subadvisory Agreement below) has the primary responsibility for the day-to-day portfolio management of the Fund. The investment management fee is an annual fee that is equal to a percentage of the Fund’s average daily net assets that declines from 0.80% to 0.57% as the Fund’s net assets increase. The annualized effective investment management fee rate for the six months ended April 30, 2013 was 0.79% of the Fund’s average daily net assets.
Subadvisory Agreement
The Investment Manager has entered into a Subadvisory Agreement with Threadneedle International Limited (Threadneedle), an affiliate of the Investment Manager and wholly-owned subsidiary of Ameriprise Financial, the subadviser of the Fund. The Investment Manager compensates Threadneedle to manage the investment of the Fund’s assets.
Administration Fees
Under an Administrative Services Agreement, the Investment Manager also serves as the Fund Administrator. The Fund pays the Fund Administrator an annual fee for administration
and accounting services equal to a percentage of the Fund’s average daily net assets that declines from 0.08% to 0.05% as the Fund’s net assets increase. The annualized effective administration fee rate for the six months ended April 30, 2013 was 0.08% of the Fund’s average daily net assets.
Other Expenses
Other expenses are for, among other things, certain expenses of the Fund or the Board, including: Fund boardroom and office expense, employee compensation, employee health and retirement benefits, and certain other expenses. Payment of these Fund and Board expenses is facilitated by a company providing limited administrative services to the Fund and the Board. For the six months ended April 30, 2013, other expenses paid to this company were $944.
Compensation of Board Members
Board members are compensated for their services to the Fund as disclosed in the Statement of Operations. Under a Deferred Compensation Plan (the Plan), the Board members who are not “interested persons” of the Fund, as defined under the 1940 Act, may elect to defer payment of up to 100% of their compensation. Deferred amounts are treated as though equivalent dollar amounts had been invested in shares of certain funds managed by the Investment Manager. The Fund’s liability for these amounts is adjusted for market value changes and remains in the Fund until distributed in accordance with the Plan.
Transfer Agent Fees
Under a Transfer and Dividend Disbursing Agent Agreement, Columbia Management Investment Services Corp. (the Transfer Agent), an affiliate of the Investment Manager and a wholly-owned subsidiary of Ameriprise Financial, is responsible for providing transfer agency services to the Fund. The Transfer Agent has contracted with Boston Financial Data Services (BFDS) to serve as sub-transfer agent.
The Transfer Agent receives monthly account-based service fees based on the number of open accounts and also receives sub-transfer agency fees based on a percentage of the average aggregate value of the Fund’s shares maintained in omnibus accounts (other than omnibus accounts for which American Enterprise Investment Services Inc. is the broker of record or accounts where the beneficial shareholder is a customer of Ameriprise Financial Services, Inc., which are paid a per account fee). The Transfer Agent pays the fees of BFDS for services as sub-transfer agent and is not entitled to reimbursement for such fees from the Fund (with the exception of out-of-pocket fees).
The Transfer Agent also receives compensation from fees for various shareholder services and reimbursements for certain
| | | | |
| Semiannual Report 2013 | | | 23 | |
| | |
| |
| | Columbia Asia Pacific ex-Japan Fund |
Notes to Financial Statements (continued)
April 30, 2013 (Unaudited)
out-of-pocket fees. Class I shares do not pay transfer agent fees. Total transfer agent fees for Class R5 shares are subject to an annual limitation of not more than 0.05% of the average daily net assets attributable to Class R5 shares.
For the six months ended April 30, 2013, the Fund’s annualized effective transfer agent fee rates as a percentage of average daily net assets of each class were as follows:
| | | | |
Class A | | | 0.16 | % |
Class C | | | 0.18 | |
Class R | | | 0.18 | |
Class R5 | | | 0.05 | |
Class Z | | | 0.18 | |
An annual minimum account balance fee of $20 may apply to certain accounts with a value below the Fund’s initial minimum investment requirements to reduce the impact of small accounts on transfer agent fees. These minimum account balance fees are recorded as part of expense reductions in the Statement of Operations. For the six months ended April 30, 2013, no minimum account balance fees were charged by the Fund.
Distribution Fees
The Fund has an agreement with Columbia Management Investment Distributors, Inc. (the Distributor), an affiliate of the Investment Manager and a wholly-owned subsidiary of Ameriprise Financial, for distribution and shareholder services. Under a Plan and Agreement of Distribution pursuant to Rule 12b-1, the Fund pays a fee at an annual rate of up to 0.25% of the Fund’s average daily net assets attributable to Class A, shares, a fee at an annual rate of up to 0.50% of the Fund’s average daily net assets attributable to Class R shares (of which up to 0.25% may be used for shareholder services) and a fee at an annual rate of up to 1.00% of the Fund’s average daily net assets attributable to Class C shares. For Class C shares, of the 1.00% fee, up to 0.75% is reimbursed for distribution expenses.
The amount of distribution expenses incurred by the Distributor and not yet reimbursed (unreimbursed expense) was approximately $2,000 for Class C shares. These amounts are based on the most recent information available as of December 31, 2012, and may be recovered from future payments under the distribution plan or CDSCs. To the extent the unreimbursed expense has been fully recovered, the distribution fee is reduced.
Sales Charges
Sales charges, including front-end charges and CDSCs, received by the Distributor for distributing Fund shares were $1,131 for Class A shares for the six months ended April 30, 2013.
Expenses Waived/Reimbursed by the Investment Manager and its Affiliates
The Investment Manager and certain of its affiliates have contractually agreed to waive fees and/or reimburse expenses (excluding certain fees and expenses described below) for the periods disclosed below, unless sooner terminated at the sole discretion of the Board, so that the Fund’s net operating expenses, after giving effect to fees waived/expenses reimbursed and any balance credits and/or overdraft charges from the Fund’s custodian, do not exceed the following annual rates as a percentage of the class’ average daily net assets:
| | | | | | | | |
| | | March 1, 2013 through February 28, 2014 | | | Prior to March 1, 2013 | |
Class A | | | 1.72 | % | | | 1.50 | % |
Class C | | | 2.47 | | | | 2.25 | |
Class I | | | 1.35 | | | | 1.08 | |
Class R | | | 1.97 | | | | 1.75 | |
Class R5 | | | 1.40 | | | | 1.13 | |
Class Z | | | 1.47 | | | | 1.25 | |
Under the agreement governing these fee waivers and/or expense reimbursement arrangements, the following fees and expenses are excluded from the waiver/reimbursement commitment, and therefore will be paid by the Fund, if applicable: taxes (including foreign transaction taxes), expenses associated with investments in affiliated and non-affiliated pooled investment vehicles (including mutual funds and exchange traded funds), transaction costs and brokerage commissions, costs related to any securities lending program, dividend expenses associated with securities sold short, inverse floater program fees and expenses, transaction charges and interest on borrowed money, interest, extraordinary expenses and any other expenses the exclusion of which is specifically approved by the Board. This agreement may be modified or amended only with approval from all parties.
Note 4. Federal Tax Information
The timing and character of income and capital gain distributions are determined in accordance with income tax regulations, which may differ from GAAP because of temporary or permanent book to tax differences.
At April 30, 2013, the cost of investments for federal income tax purposes was approximately $421,560,000 and the aggregate gross approximate unrealized appreciation and depreciation based on that cost was:
| | | | |
Unrealized appreciation | | | $97,726,000 | |
Unrealized depreciation | | | (8,565,000 | ) |
Net unrealized appreciation | | | $89,161,000 | |
| | |
| 24 | | Semiannual Report 2013 |
| | |
| |
| Columbia Asia Pacific ex-Japan Fund | | |
Notes to Financial Statements (continued)
April 30, 2013 (Unaudited)
The following capital loss carryforward, determined as of October 31, 2012 may be available to reduce taxable income arising from future net realized gains on investments, if any, to the extent permitted by the Internal Revenue Code:
| | | | |
| Year of Expiration | | Amount ($) | |
Unlimited short-term | | | 24,279,438 | |
Unlimited long-term | | | 20,442,020 | |
Total | | | 44,721,458 | |
Management of the Fund has concluded that there are no significant uncertain tax positions that would require recognition in the financial statements. However, management’s conclusion may be subject to review and adjustment at a later date based on factors including, but not limited to, new tax laws, regulations, and administrative interpretations (including relevant court decisions). Generally, the Fund’s federal tax returns for the prior three fiscal years remain subject to examination by the Internal Revenue Service.
Note 5. Portfolio Information
The cost of purchases and proceeds from sales of securities, excluding short-term obligations, aggregated to $157,175,597 and $94,981,720, respectively, for the six months ended April 30, 2013.
Note 6. Lending of Portfolio Securities
Effective December 19, 2012, the Fund no longer participates in securities lending activity. Prior to that date, the Fund participated, or was eligible to participate, in securities lending activity pursuant to a Master Securities Lending Agreement (the Agreement) with JPMorgan Chase Bank, N.A. (JPMorgan). The Agreement authorized JPMorgan as lending agent to lend securities to authorized borrowers in order to generate additional income on behalf of the Fund. Pursuant to the Agreement, the securities loaned were secured by cash or securities that either were issued or guaranteed as to principal and interest by the U.S. government, its agencies, authorities or instrumentalities with value equal to at least 100% of the market value of the loaned securities. Any additional collateral required to maintain those levels due to market fluctuations of the loaned securities was requested to be delivered the following business day. Cash collateral received was invested by the lending agent on behalf of the Fund into authorized investments pursuant to the Agreement.
Pursuant to the Agreement, the Fund received income for lending its securities either in the form of fees or by earning interest on invested cash collateral, net of negotiated rebates paid to borrowers and fees paid to the lending agent for services provided and any other securities lending expenses.
Net income earned from securities lending for the six months ended April 30, 2013 is disclosed in the Statement of Operations. The Fund continued to earn and accrue interest and dividends on the securities loaned.
Note 7. Affiliated Money Market Fund
The Fund invests its daily cash balances in Columbia Short-Term Cash Fund, an affiliated money market fund established for the exclusive use by the Fund and other affiliated funds. The income earned by the Fund from such investments is included as “Dividends — affiliated issuers” in the Statement of Operations. As an investing fund, the Fund indirectly bears its proportionate share of the expenses of Columbia Short-Term Cash Fund.
Note 8. Line of Credit
The Fund has entered into a revolving credit facility with a syndicate of banks led by JPMorgan whereby the Fund may borrow for the temporary funding of shareholder redemptions or for other temporary or emergency purposes. The credit facility agreement, as amended, which is a collective agreement between the Fund and certain other funds managed by the Investment Manager, severally and not jointly, permits collective borrowings up to $500 million. Interest is charged to each participating fund based on its borrowings at a rate equal to the higher of (i) the overnight federal funds rate plus 1.00% or (ii) the one-month LIBOR rate plus 1.00%. Each borrowing under the credit facility matures no later than 60 days after the date of borrowing. The Fund also pays a commitment fee equal to its pro rata share of the amount of the credit facility at a rate of 0.08% per annum.
For the six months ended April 30, 2013, the average daily loan balance outstanding on days when borrowing existed was $2,611,111 at a weighted average interest rate of 1.21%.
Note 9. Significant Risks
Foreign Securities Risk
Investing in foreign securities may include certain risks and considerations not typically associated with investing in U.S. securities, such as fluctuating currency values and changing local and regional economic, political and social conditions, which may result in greater market volatility. In addition, certain foreign securities may not be as liquid as U.S. securities. Investing in emerging markets may accentuate these risks.
Investments in emerging market countries are subject to additional risk. The risk of foreign investments is typically increased in less developed countries. These countries are also more likely to experience high levels of inflation, deflation or
| | | | |
| Semiannual Report 2013 | | | 25 | |
| | |
| |
| | Columbia Asia Pacific ex-Japan Fund |
Notes to Financial Statements (continued)
April 30, 2013 (Unaudited)
currency devaluation which could hurt their economies and securities markets.
Asian Pacific Region Risk
Many of the countries in the Asian Pacific Region are developing both politically and economically, and may have relatively unstable governments and economies based on a limited number of commodities or industries. Securities markets in the Asian Pacific Region are smaller and have a lower trading volume than those in the United States, which may result in the securities of some companies in the Asian Pacific Region being less liquid than similar U.S. or other foreign securities. Some currencies in the Asian Pacific Region are more volatile than the U.S. dollar and some countries in the Asian Pacific Region have restricted the flow of money in and out of the country.
Geographic Concentration Risk
Because the Fund concentrates its investments in the Asian Pacific Region, the Fund may be particularly susceptible to economic, political or regulatory events affecting companies and countries within the Asian Pacific Region. Currency devaluations could occur in countries that have not yet experienced currency devaluation to date, or could continue to occur in countries that have already experienced such devaluations. As a result, the Fund may be more volatile than a more geographically diversified fund. If securities of companies in the Asian Pacific Region fall out of favor, it may cause the Fund to underperform funds that do not concentrate in a single region of the world.
Note 10. Subsequent Events
Management has evaluated the events and transactions that have occurred through the date the financial statements were issued and noted no items requiring adjustment of the financial statements or additional disclosure.
Note 11. Information Regarding Pending and Settled Legal Proceedings
In December 2005, without admitting or denying the allegations, American Express Financial Corporation (AEFC, which is now known as Ameriprise Financial, Inc. (Ameriprise Financial)) entered into settlement agreements with the Securities and Exchange Commission (SEC) and Minnesota Department of Commerce (MDOC) related to market timing activities. As a result, AEFC was censured and ordered to cease and desist from committing or causing any violations of certain provisions of the Investment Advisers Act of 1940, the Investment Company Act of 1940, and various Minnesota laws. AEFC agreed to pay disgorgement of
$10 million and civil money penalties of $7 million. AEFC also agreed to retain an independent distribution consultant to assist in developing a plan for distribution of all disgorgement and civil penalties ordered by the SEC in accordance with various undertakings detailed at www.sec.gov/litigation/admin/ia-2451.pdf. Ameriprise Financial and its affiliates have cooperated with the SEC and the MDOC in these legal proceedings, and have made regular reports to the funds’ Boards of Trustees.
Ameriprise Financial and certain of its affiliates have historically been involved in a number of legal, arbitration and regulatory proceedings, including routine litigation, class actions, and governmental actions, concerning matters arising in connection with the conduct of their business activities. Ameriprise Financial believes that the Funds are not currently the subject of, and that neither Ameriprise Financial nor any of its affiliates are the subject of, any pending legal, arbitration or regulatory proceedings that are likely to have a material adverse effect on the Funds or the ability of Ameriprise Financial or its affiliates to perform under their contracts with the Funds. Ameriprise Financial is required to make 10-Q, 10-K and, as necessary, 8-K filings with the Securities and Exchange Commission on legal and regulatory matters that relate to Ameriprise Financial and its affiliates. Copies of these filings may be obtained by accessing the SEC website at www.sec.gov.
There can be no assurance that these matters, or the adverse publicity associated with them, will not result in increased fund redemptions, reduced sale of fund shares or other adverse consequences to the Funds. Further, although we believe proceedings are not likely to have a material adverse effect on the Funds or the ability of Ameriprise Financial or its affiliates to perform under their contracts with the Funds, these proceedings are subject to uncertainties and, as such, we are unable to estimate the possible loss or range of loss that may result. An adverse outcome in one or more of these proceedings could result in adverse judgments, settlements, fines, penalties or other relief that could have a material adverse effect on the consolidated financial condition or results of operations of Ameriprise Financial.
| | |
| 26 | | Semiannual Report 2013 |
| | |
| |
| Columbia Asia Pacific ex-Japan Fund | | |
Approval of Investment Management Services and Subadvisory Agreements
Columbia Management Investment Advisers, LLC (Columbia Management or the Investment Manager), a wholly-owned subsidiary of Ameriprise Financial, Inc. (Ameriprise Financial), serves as the investment manager to Columbia Asia Pacific ex-Japan Fund (the Fund). Under an investment management services agreement (the IMS Agreement), Columbia Management provides investment advice and other services to the Fund and other funds distributed by Columbia Management Investment Distributors, Inc. (collectively, the Funds). In addition, under a Subadvisory Agreement (the Subadvisory Agreement) between Columbia Management and Threadneedle International Limited (the Subadviser), an affiliate of Columbia Management, the Subadviser has provided portfolio management and related services for the Fund. On an annual basis, the Fund’s Board of Trustees (the Board), including the independent Board members (the Independent Trustees), considers renewal of the IMS Agreement and the Subadvisory Agreement (together, the Advisory Agreements). Columbia Management prepared detailed reports for the Board and its Contracts Committee in January, March and April 2013, including reports based on analyses of data provided by an independent organization and a comprehensive response to each item of information requested by independent legal counsel to the Independent Trustees (Independent Legal Counsel) in a letter to the Investment Manager, to assist the Board in making this determination. All of the materials presented in January, March and April were first supplied in draft form to designated representatives of the Independent Trustees, i.e., Independent Legal Counsel, the Chair of the Board and the Chair of the Contracts Committee, and the final materials (including proposed additional breakpoints in IMS fees for certain Funds) were revised to reflect discussion and subsequent requests made by the Contracts Committee. In addition, throughout the year, the Board (or its committees) regularly meets with portfolio management teams and senior management personnel and reviews information prepared by Columbia Management addressing the services Columbia Management provides and Fund performance. Further, the Board retained an independent consulting firm (the Independent Consultant) to assist the Independent Trustees in their review of IMS fees, expense caps and Ameriprise Financial’s profitability. The Board also accords particular weight to the work, deliberations and conclusions of the Contracts Committee, the Investment Review Committee and the Compliance Committee in determining whether to continue the Advisory Agreements.
The Board, at its April 15-17, 2013 in-person Board meeting (the April Meeting), considered the renewal of the Advisory Agreements for an additional one-year term. At the April Meeting, Independent Legal Counsel reviewed with the Independent Trustees various factors relevant to the Board’s consideration of advisory and subadvisory agreements and the Board’s legal responsibilities related to such consideration. Following an analysis and discussion of the factors identified below, the Board, including all of the Independent Trustees, approved the renewal of each of the Advisory Agreements.
Nature, Extent and Quality of Services Provided by Columbia Management and the Subadviser
The Board analyzed various reports and presentations it had received detailing the services performed by Columbia Management and the Subadviser, as well as their history, reputation, expertise, resources and relative capabilities, and the qualifications of their personnel.
With respect to Columbia Management, the Board specifically considered many developments during the past year concerning the services provided by Columbia Management, including, in particular, the recent globalization initiative, which fosters increased worldwide investment support of global products, continued investment in upgrading technology (such as the implementation of new systems and hardware), the hiring of a Chief Interest Rate Strategist as part of Columbia Management’s fixed income team and the addition of Columbia Management investment personnel to the Asset Allocation, Quantitative and Technology teams. The Board took into account the information it received and reviewed concerning Columbia Management’s ongoing oversight and monitoring of the subadvisers, observing the broad scope of services provided by Columbia Management to each subadvised Fund, including, among other noted services, investment, risk and compliance oversight. The Board also took into account the Subadviser oversight structure and the Columbia Management team dedicated thereto. The Board also noted the information it received concerning Columbia Management’s ability to retain its key portfolio management personnel. In this regard, the Board took into account its comprehensive discussions with Columbia Management’s Chief Investment Officer (the CIO), observing the organizational depth of Columbia Management and the capabilities of its investment personnel. The Board also recalled the information the CIO provided it identifying the strengths and areas for enhancement of each Columbia Management investment team, as well as the discussion with the CIO regarding the investment personnel talent being infused to enhance support for certain Funds. The Board also observed the materials demonstrating the strength and depth of Columbia Management’s equity and fixed income research departments.
In connection with the Board’s evaluation of the overall package of services provided by Columbia Management, the Board also considered the quality of administrative services provided to the Fund by Columbia Management, recalling the information it
| | | | |
| Semiannual Report 2013 | | | 27 | |
| | |
| |
| | Columbia Asia Pacific ex-Japan Fund |
Approval of Investment Management Services and Subadvisory Agreements (continued)
received highlighting significant achievements in 2012 in the performance of administrative services. In evaluating the quality of services provided under the IMS Agreement and the Fund’s Administrative Service Agreement, the Board also took into account the organization and strength of the Fund’s and its service providers’ compliance programs. The Board also reviewed the financial condition of Columbia Management and its affiliates and their ability to carry out their responsibilities under the IMS Agreement and the Fund’s other service agreements with affiliates of Ameriprise Financial, observing the financial strength of Ameriprise Financial, with its solid balance sheet. In addition, the Board discussed the acceptability of the terms of the IMS Agreement (including the relatively broad scope of services required to be performed by Columbia Management). The Board concluded that the services being performed under the IMS Agreement were of a reasonably high quality.
Based on the foregoing, and based on other information received (both oral and written, including the information on investment performance referenced below) and other considerations, the Board concluded that Columbia Management and its affiliates were in a position to continue to provide a high quality and level of services to the Fund.
With respect to the Subadviser, the Board observed that it had previously approved the Subadviser’s code of ethics and compliance program, that the Chief Compliance Officer of the Fund continues to monitor the code and the program, and that no material concerns have been reported. The Board also considered the Subadviser’s organizational strength and resources, portfolio management team depth and capabilities and investment process. The Board also considered the Subadviser’s capability and wherewithal to carry out its responsibilities under the Subadvisory Agreement. In addition, the Board discussed the acceptability of the terms of the Subadvisory Agreement including the scope of services required to be performed. The Board noted that the terms of the Subadvisory Agreement are generally consistent with the terms of other subadviser agreements for subadvisers who manage other funds managed by the Investment Manager. It was observed that no changes were recommended to the Subadvisory Agreement. Based on the foregoing, and based on other information received (both oral and written) and other considerations, including, in particular, the performance of the Fund (discussed below) as well as the Investment Manager’s recommendation that the Board approve renewal of the Subadvisory Agreement with the Subadviser the Board concluded that the services being performed under the Subadvisory Agreement were of a reasonably high quality.
Based on the foregoing, and based on other information received (both oral and written, including the information on investment performance referenced below) and other considerations, the Board concluded that the Subadviser was in a position to continue to provide a high quality and level of services to the Fund.
Investment Performance
For purposes of evaluating the nature, extent and quality of services provided under the Advisory Agreements, the Board carefully reviewed the investment performance of the Fund. In this regard, the Board considered detailed reports providing the results of analyses performed by an independent organization showing, for various periods, the performance of the Fund, the performance of a benchmark index, the percentage ranking of the Fund among its comparison group and the net assets of the Fund. The Board observed that the Fund’s investment performance met expectations.
Additionally, the Board reviewed the performance of the Subadviser and Columbia Management’s process for monitoring the Subadviser. The Board considered, in particular, management’s rationale for recommending the continued retention of the Subadviser.
Comparative Fees, Costs of Services Provided and the Profits Realized by Columbia Management, its Affiliates and the Subadviser from their Relationships with the Fund
The Board reviewed comparative fees and the costs of services to be provided under each of the Advisory Agreements. The Board members considered detailed comparative information set forth in an annual report on fees and expenses, including, among other things, data (based on analyses conducted by an independent organization) showing a comparison of the Fund’s expenses with median expenses paid by funds in its comparative peer universe, as well as data showing the Fund’s contribution to Columbia Management’s profitability. The Board reviewed the fees charged to comparable institutional or other accounts/vehicles managed by Columbia Management and discussed differences in how the products are managed and operated, noting no unreasonable differences in the levels of contractual fees.
The Board accorded particular weight to the notion that the level of fees should reflect a rational pricing model applied consistently across the various product lines in the Fund family, while assuring that the overall fees for each Fund (with few defined exceptions) are generally in line with the “pricing philosophy” (i.e., that the total expense ratio of the Fund is no higher
| | |
| 28 | | Semiannual Report 2013 |
| | |
| |
| Columbia Asia Pacific ex-Japan Fund | | |
Approval of Investment Management Services and Subadvisory Agreements (continued)
than the median expense ratio of funds in the same comparison universe of the Fund). In this connection, the Board also considered the Independent Consultant’s report that concluded that: the Funds’ expense cap philosophy of assuring that each Fund’s total expense ratio is not above its peer universe median ratio is reasonable. The Board took into account that the Fund’s total expense ratio (after considering proposed expense caps/waivers) was below the peer universe’s median expense ratio shown in the reports. Additionally, the Board reviewed the level of subadvisory fees paid to the Subadviser, noting that the fees are paid by the Investment Manager and do not impact the fees paid by the Fund. The Board observed that the subadvisory fee level for the Subadviser was generally comparable to those charged by other subadvisers to similar funds managed by the Investment Manager. The Board also reviewed fee rates charged by the Subadviser to other client accounts. Based on its review, the Board concluded that the Fund’s management and subadvisory fees were fair and reasonable in light of the extent and quality of services that the Fund receives.
The Board also considered the expected profitability of Columbia Management and its affiliates in connection with Columbia Management providing investment management services to the Fund. In this regard, the Board referred to a detailed profitability report, discussing the profitability to Columbia Management and Ameriprise Financial from managing, operating and distributing the Funds. In this regard, the Board observed that 2012 profitability approximates 2011 profitability and that, as was the case in 2011, 2012 profitability remained generally in line with (and, in many cases, lower than) the reported profitability of other asset management firms. Further, the Board considered the Independent Consultant’s report that concluded that Columbia Management’s profitability, particularly in comparison to industry competitors, was reasonable and not excessive. It also took into account the indirect economic benefits flowing to Columbia Management or its affiliates in connection with managing or distributing the Funds, such as the enhanced ability to offer various other financial products to Ameriprise Financial customers, soft dollar benefits and overall reputational advantages. The Board noted that the fees paid by the Funds should permit the Investment Manager to offer competitive compensation to its personnel, make necessary investments in its business and earn an appropriate profit. The Board concluded that profitability levels were reasonable.
Economies of Scale to be Realized
The Board also considered the economies of scale that might be realized by Columbia Management as the Fund grows and took note of the extent to which Fund shareholders might also benefit from such growth. In this regard, the Board took into account that IMS fees decline as Fund assets exceed various breakpoints, all of which have not been surpassed.
Based on the foregoing, the Board, including all of the Independent Trustees, concluded that fees payable under the Advisory Agreements were fair and reasonable in light of the extent and quality of services provided. In reaching this conclusion, no single factor was determinative. On April 17, 2013, the Board, including 11 of the Independent Trustees, approved the renewal of the Advisory Agreements.
| | | | |
| Semiannual Report 2013 | | | 29 | |
| | |
| |
| | Columbia Asia Pacific ex-Japan Fund |
[THIS PAGE INTENTIONALLY LEFT BLANK]
| | |
| 30 | | Semiannual Report 2013 |
| | |
| |
| Columbia Asia Pacific ex-Japan Fund | | |
[THIS PAGE INTENTIONALLY LEFT BLANK]
| | | | |
| Semiannual Report 2013 | | | 31 | |
| | |
| |
| | Columbia Asia Pacific ex-Japan Fund |
[THIS PAGE INTENTIONALLY LEFT BLANK]
| | |
| 32 | | Semiannual Report 2013 |
| | |
| |
| Columbia Asia Pacific ex-Japan Fund | | |
Important Information About This Report
Each fund mails one shareholder report to each shareholder address. If you would like more than one report, please call shareholder services at 800.345.6611 and additional reports will be sent to you.
The policy of the Board is to vote the proxies of the companies in which each fund holds investments consistent with the procedures as stated in the Statement of Additional Information (SAI). You may obtain a copy of the SAI without charge by calling 800.345.6611; contacting your financial intermediary; visiting columbiamanagement.com; or searching the website of the Securities and Exchange Commission (SEC) at sec.gov. Information regarding how each fund voted proxies relating to portfolio securities is filed with the SEC by August 31 for the most recent 12-month period ending June 30 of that year, and is available without charge by visiting columbiamanagement.com; or searching the website of the SEC at sec.gov.
Each fund files a complete schedule of portfolio holdings with the SEC for the first and third quarters of each fiscal year on Form N-Q. Each fund’s Form N-Q is available on the SEC’s website at sec.gov and may be reviewed and copied at the SEC’s Public Reference Room in Washington, D.C. Information on the operation of the Public Reference Room may be obtained by calling 800.SEC.0330. Each fund’s complete schedule of portfolio holdings, as filed on Form N-Q, can also be obtained without charge, upon request, by calling 800.345.6611.
| | | | |
| Semiannual Report 2013 | | | 33 | |

Columbia Asia Pacific ex-Japan Fund
P.O. Box 8081
Boston, MA 02266-8081
columbiamanagement.com
This information is for use with concurrent or prior delivery of a fund prospectus. Please read and consider the investment objectives, risks, charges and expenses for any fund carefully before investing. For a prospectus which contains this and other important information about the Fund, go to columbiamanagement.com. The Fund is distributed by Columbia Management Investment Distributors, Inc., member FINRA, and managed by Columbia Management Investment Advisers, LLC.
© 2013 Columbia Management Investment Advisers, LLC. All rights reserved.
SAR119_10_C01_(06/13)
Semiannual Report
April 30, 2013

Columbia Absolute Return Currency and Income Fund
Not FDIC insured • No bank guarantee • May lose value
Columbia Absolute Return Currency and Income Fund
 Dear Shareholders,
U.S. equities had a strong first quarter
Similar to 2012, equities once again were the best performing asset class in the first quarter of 2013. The S&P 500 Index reached an all-time closing high on the last trading day of the quarter and pushed through its October 2007 peak. Although global equities have performed well year-to-date, there is significant performance divergence among regions. In local currency terms, Japanese equities were the best performing developed market globally, and U.S. stocks outperformed most other global equity markets. European equities rose in the first quarter but trailed U.S. stocks and had a turbulent March, as investors were reminded of instability in the eurozone with news of a banking crisis in Cyprus.
Although all 10 sectors of the S&P 500 Index delivered positive returns, this was a rally led by defensive stocks such as those in health care, consumer staples and utilities. Materials and technology stocks were the weakest sectors.
High yield leads fixed income; most sectors flat to down
The fixed-income markets lagged equities with modest, single-digit returns coming from municipals and high-yield sectors in the United States. Most government and investment-grade credit sectors were roughly flat to down for the first quarter of 2013. Emerging market bonds were the biggest disappointment with single-digit losses.
Columbia Management to begin delivering summary prospectuses
Each Columbia fund is required to update its prospectus on an annual basis. Beginning with June 2013 prospectus updates, shareholders of Columbia retail mutual funds will start to receive a summary prospectus, rather than the full length (statutory) mutual fund prospectus they have received in the past.
Each fund's summary prospectus will include the following key information:
> Investment objective
> Fee and expense table
> Portfolio turnover rate information
> Principal investment strategies, principal risks and performance information
> Management information
> Purchase and sale information
> Tax information
> Financial intermediary compensation information
Each fund's statutory prospectus will contain additional information about the fund and its risks. Both the statutory and summary prospectus will be updated each year, and will be available at columbiamanagement.com. Shareholders may request a printed version of a statutory prospectus at no cost by calling 800.345.6611 or sending an email to serviceinquiries@columbiamanagement.com.
Stay on track with Columbia Management
Backed by more than 100 years of experience, Columbia Management is one of the nation's largest asset managers. At the heart of our success — and, most importantly, that of our investors — are highly talented industry professionals, brought together by a unique way of working. We are dedicated to helping you take advantage of today's opportunities and anticipate tomorrow's. We stay abreast of the latest investment trends and ideas, using our collective insight to evaluate events and transform them into solutions you can use.
Visit columbiamanagement.com for:
> The Columbia Management Perspectives blog, featuring timely posts by our investment teams
> Detailed up-to-date fund performance and portfolio information
> Economic analysis and market commentary
> Quarterly fund commentaries
> Columbia Management Investor, our award-winning quarterly newsletter for shareholders
Thank you for your continued support of the Columbia Funds. We look forward to serving your investment needs for many years to come.
Best Regards,

J. Kevin Connaughton
President, Columbia Funds
The S&P 500 Index, an unmanaged index, measures the performance of 500 large-capitalization U.S. stocks and is frequently used as a general measure of market performance. Indices are not available for investment, are not professionally managed and do not reflect sales charges, fees, brokerage commissions, taxes or other expenses of investing.
Investors should consider the investment objectives, risks, charges and expenses of a mutual fund carefully before investing. For a free prospectus, which contains this and other important information about a fund, visit columbiamanagement.com. The prospectus should be read carefully before investing.
Columbia Funds are distributed by Columbia Management Investment Distributors, Inc., member FINRA, and managed by Columbia Management Investment Advisers, LLC.
© 2013 Columbia Management Investment Advisers, LLC. All rights reserved.
Columbia Absolute Return Currency and Income Fund
Performance Overview | | | 2 | | |
Portfolio Overview | | | 3 | | |
Understanding Your Fund's Expenses | | | 4 | | |
Portfolio of Investments | | | 5 | | |
Statement of Assets and Liabilities | | | 9 | | |
Statement of Operations | | | 11 | | |
Statement of Changes in Net Assets | | | 12 | | |
Financial Highlights | | | 14 | | |
Notes to Financial Statements | | | 22 | | |
Approval of Investment Management Services Agreement | | | 29 | | |
Shareholder Meeting Results | | | 31 | | |
Important Information About This Report | | | 33 | | |
Fund Investment Manager
Columbia Management Investment
Advisers, LLC
225 Franklin Street
Boston, MA 02110
Fund Distributor
Columbia Management Investment
Distributors, Inc.
225 Franklin Street
Boston, MA 02110
Fund Transfer Agent
Columbia Management Investment
Services Corp.
P.O. Box 8081
Boston, MA 02266-8081
For more information about any of the funds, please visit columbiamanagement.com or call 800.345.6611. Customer Service Representatives are available to answer your questions Monday through Friday from 8 a.m. to 8 p.m. Eastern time.
The views expressed in this report reflect the current views of the respective parties. These views are not guarantees of future performance and involve certain risks, uncertainties and assumptions that are difficult to predict, so actual outcomes and results may differ significantly from the views expressed. These views are subject to change at any time based upon economic, market or other conditions and the respective parties disclaim any responsibility to update such views. These views may not be relied on as investment advice and, because investment decisions for a Columbia Fund are based on numerous factors, may not be relied on as an indication of trading intent on behalf of any particular Columbia Fund. References to specific securities should not be construed as a recommendation or investment advice.
Columbia Absolute Return Currency and Income Fund
Performance Overview
(Unaudited)
Performance Summary
> Columbia Absolute Return Currency and Income Fund (the Fund) Class A shares returned 0.72% excluding sales charges for the six months ended April 30, 2013.
> The Fund outperformed its benchmark, the Citigroup 3-Month U.S. Treasury Bill Index, which returned 0.04% for the same time frame.
Average Annual Total Returns (%) (for period ended April 30, 2013)
| | Inception | | 6 Months
cumulative | | 1 Year | | 5 Years | | Life | |
Class A | | 6/15/06 | | | | | | | | | |
Excluding sales charges | | | | | 0.72 | | | | 0.72 | | | | 1.34 | | | | 2.19 | | |
Including sales charges | | | | | -2.34 | | | | -2.34 | | | | 0.73 | | | | 1.74 | | |
Class B | | 6/15/06 | | | | | | | | | |
Excluding sales charges | | | | | 0.34 | | | | 0.03 | | | | 0.57 | | | | 1.47 | | |
Including sales charges | | | | | -4.56 | | | | -4.85 | | | | 0.18 | | | | 1.47 | | |
Class C | | 6/15/06 | | | | | | | | | |
Excluding sales charges | | | | | 0.34 | | | | 0.03 | | | | 0.57 | | | | 1.47 | | |
Including sales charges | | | | | -0.64 | | | | -0.94 | | | | 0.57 | | | | 1.47 | | |
Class I | | 6/15/06 | | | 1.00 | | | | 1.30 | | | | 1.83 | | | | 2.67 | | |
Class R4* | | 3/19/13 | | | 0.83 | | | | 0.83 | | | | 1.36 | | | | 2.21 | | |
Class W* | | 12/1/06 | | | 0.52 | | | | 0.52 | | | | 1.25 | | | | 2.13 | | |
Class Y* | | 2/28/13 | | | 0.82 | | | | 0.82 | | | | 1.36 | | | | 2.21 | | |
Class Z* | | 9/27/10 | | | 0.81 | | | | 1.00 | | | | 1.54 | | | | 2.32 | | |
Citigroup 3-Month U.S. Treasury Bill Index** | | | | | 0.04 | | | | 0.08 | | | | 0.28 | | | | 1.38 | | |
Returns for Class A are shown with and without the maximum initial sales charge of 3.00% Returns for Class B are shown with and without the applicable contingent deferred sales charge (CDSC) of 5.00% in the first year, declining to 1.00% in the sixth year and eliminated thereafter. Returns for Class C are shown with and without the 1.00% CDSC for the first year only. The Fund's other classes are not subject to sales charges and have limited eligibility. Please see the Fund's prospectus for details. Performance for different share classes will vary based on differences in sales charges and fees associated with each class. All results shown assume reinvestment of distributions during the period. Returns do not reflect the deduction of taxes that a shareholder may pay on Fund distributions or on the redemption of Fund shares. Performance results reflect the effect of any fee waivers or reimbursements of Fund expenses by Columbia Management Investment Advisers, LLC and/or any of its affiliates. Absent these fee waivers or expense reimbursement arrangements, performance results would have been lower.
The performance information shown represents past performance and is not a guarantee of future results. The investment return and principal value of your investment will fluctuate so that your shares, when redeemed, may be worth more or less than their original cost. Current performance may be lower or higher than the performance information shown. You may obtain performance information current to the most recent month-end by contacting your financial intermediary, visiting columbiamanagement.com or calling 800.345.6611.
* The returns shown for periods prior to the share class inception date (including returns for the Life of the Fund, if shown, which are since Fund inception) include the returns of the Fund's oldest share class. Since the Fund launched more than one share class at its inception, Class A shares were used. These returns are adjusted to reflect any higher class-related operating expenses of the newer share classes, as applicable. Please visit columbiamanagement.com/mutual-funds/appended-performance for more information.
** Since June 30, 2006
The Citigroup 3-Month U.S. Treasury Bill Index, an unmanaged index, is representative of the performance of three-month Treasury bills.
Indices are not available for investment, are not professionally managed and do not reflect sales charges, fees, brokerage commissions, taxes or other expenses of investing. Securities in the Fund may not match those in an index.
Semiannual Report 2013
2
Columbia Absolute Return Currency and Income Fund
Portfolio Overview
(Unaudited)
Portfolio Breakdown (%)
(at April 30, 2013) | |
Asset-Backed Securities — Non-Agency | | | 1.5 | | |
Commercial Mortgage-Backed Securities — Non-Agency | | | 3.3 | | |
Short-Term Investments Segregated in Connection with
Open Derivatives Contracts(a) | | | 95.2 | | |
Total | | | 100.0 | | |
Percentages indicated are based upon total investments. The Fund's portfolio composition is subject to change.
(a) Includes investments in Money Market Funds (amounting to $85.5 million) which have been segregated to cover obligations related to the Fund's investment in derivatives which provides exposure to multiple markets. For a description of the Fund's investments in derivatives, see Investments in Derivatives following the Portfolio of Investments, and Note 2 to the financial statements.
Quality Breakdown (%)
(at April 30, 2013) | |
AAA rating | | | 98.8 | | |
Non-investment grade | | | 1.2 | | |
Total | | | 100.0 | | |
Percentages indicated are based upon total fixed income securities (excluding Money Market Funds).
Bond ratings apply to the underlying holdings of the Fund and not the Fund itself and are divided into categories ranging from AAA (highest) to D (lowest), and are subject to change. The ratings shown are determined by using the middle rating of Moody's, S&P, and Fitch after dropping the highest and lowest available ratings. When a rating from only two agencies is available, the lower rating is used. When a rating from only one agency is available, that rating is used. When a bond is not rated by any of these agencies, it is designated as Not rated. Credit ratings are subjective opinions and not statements of fact.
Currency Exposures as a % of Net Assets
as of April 30, 2013
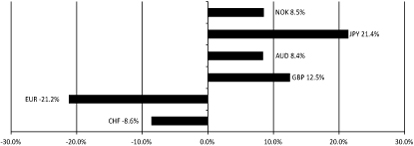
AUD Australian Dollar
CHF Swiss Franc
EUR Euro
GBP British Pound
JPY Japanese Yen
NOK Norwegian Krone
Portfolio Management
Nicholas Pifer, CFA
Semiannual Report 2013
3
Columbia Absolute Return Currency and Income Fund
Understanding Your Fund's Expenses
(Unaudited)
As an investor, you incur two types of costs. There are transaction costs, which generally include sales charges on purchases and may include redemption fees. There are also ongoing costs, which generally include management fees, distribution and service (Rule 12b-1) fees, and other fund expenses. The following information is intended to help you understand your ongoing costs (in dollars) of investing in the Fund and to help you compare these costs with the ongoing costs of investing in other mutual funds.
Analyzing Your Fund's Expenses
To illustrate these ongoing costs, we have provided examples and calculated the expenses paid by investors in each share class of the Fund during the period. The actual and hypothetical information in the table is based on an initial investment of $1,000 at the beginning of the period indicated and held for the entire period. Expense information is calculated two ways and each method provides you with different information. The amount listed in the "Actual" column is calculated using the Fund's actual operating expenses and total return for the period. You may use the Actual information, together with the amount invested, to estimate the expenses that you paid over the period. Simply divide your account value by $1,000 (for example, an $8,600 account value divided by $1,000 = 8.6), then multiply the results by the expenses paid during the period under the Actual column. The amount listed in the "Hypothetical" column assumes a 5% annual rate of return before expenses (which is not the Fund's actual return) and then applies the Fund's actual expense ratio for the period to the hypothetical return. You should not use the hypothetical account values and expenses to estimate either your actual account balance at the end of the period or the expenses you paid during the period. See "Compare With Other Funds" below for details on how to use the hypothetical data.
Compare With Other Funds
Since all mutual funds are required to include the same hypothetical calculations about expenses in shareholder reports, you can use this information to compare the ongoing cost of investing in the Fund with other funds. To do so, compare the hypothetical example with the 5% hypothetical examples that appear in the shareholder reports of other funds. As you compare hypothetical examples of other funds, it is important to note that hypothetical examples are meant to highlight the ongoing costs of investing in a fund only and do not reflect any transaction costs, such as sales charges, or redemption or exchange fees. Therefore, the hypothetical calculations are useful in comparing ongoing costs only, and will not help you determine the relative total costs of owning different funds. If transaction costs were included in these calculations, your costs would be higher.
November 1, 2012 – April 30, 2013
| | Account Value at the Beginning
of the Period ($) | | Account Value at the End of the
Period ($) | | Expenses Paid During the
Period ($) | | Fund's Annualized
Expense Ratio (%) | |
| | Actual | | Hypothetical | | Actual | | Hypothetical | | Actual | | Hypothetical | | Actual | |
Class A | | | 1,000.00 | | | | 1,000.00 | | | | 1,007.20 | | | | 1,017.65 | | | | 7.17 | | | | 7.20 | | | | 1.44 | | |
Class B | | | 1,000.00 | | | | 1,000.00 | | | | 1,003.40 | | | | 1,013.98 | | | | 10.83 | | | | 10.89 | | | | 2.18 | | |
Class C | | | 1,000.00 | | | | 1,000.00 | | | | 1,003.40 | | | | 1,013.93 | | | | 10.88 | | | | 10.94 | | | | 2.19 | | |
Class I | | | 1,000.00 | | | | 1,000.00 | | | | 1,010.00 | | | | 1,019.84 | | | | 4.98 | | | | 5.01 | | | | 1.00 | | |
Class R4 | | | 1,000.00 | | | | 1,000.00 | | | | 998.10 | * | | | 1,018.55 | | | | 1.41 | * | | | 6.31 | | | | 1.26 | * | |
Class W | | | 1,000.00 | | | | 1,000.00 | | | | 1,005.20 | | | | 1,018.25 | | | | 6.56 | | | | 6.61 | | | | 1.32 | | |
Class Y | | | 1,000.00 | | | | 1,000.00 | | | | 1,002.00 | ** | | | 1,018.65 | | | | 2.04 | ** | | | 6.21 | | | | 1.24 | ** | |
Class Z | | | 1,000.00 | | | | 1,000.00 | | | | 1,008.10 | | | | 1,018.89 | | | | 5.92 | | | | 5.96 | | | | 1.19 | | |
*For the period March 19, 2013 through April 30, 2013. Class R4 shares commenced operations on March 19, 2013.
**For the period February 28, 2013 through April 30, 2013. Class Y shares commenced operations on February 28, 2013.
Expenses paid during the period are equal to the annualized expense ratio for each class as indicated above, multiplied by the average account value over the period and then multiplied by the number of days in the Fund's most recent fiscal half year and divided by 365.
Expenses do not include fees and expenses incurred indirectly by the Fund from the underlying funds in which the Fund may invest (also referred to as "acquired funds"), including affiliated and non-affiliated pooled investment vehicles (including mutual funds and exchange-traded funds).
Had Columbia Management Investment Advisers, LLC and/or certain of its affiliates not waived/reimbursed certain fees and expenses, account value at the end of the period would have been reduced.
Columbia Management Investment Advisers, LLC and/or certain of its affiliates have contractually agreed to waive certain fees and to absorb certain expenses until February 28, 2014, unless sooner terminated at the sole discretion of the Fund's Board, such that net expenses, subject to applicable exclusions, will not exceed 1.69% for Class A, 2.44% for Class B, 2.44% for Class C, 1.24% for Class I, 1.44% for Class R4, 1.69% for Class W and 1.44% for Class Z. Any amounts waived will not be reimbursed by the Fund. This change was effective March 1, 2013. If this change had been in place for the entire six month period ended April 30, 2013, the actual expenses paid would have been $8.41 for Class A, $12.12 for Class B, $12.12 for Class C, $6.18 for Class I, $7.13 for Class R4, $8.40 for Class W and $7.17 for Class Z; the hypothetical expenses paid would have been $8.45 for Class A, $12.18 for Class B, $12.18 for Class C, $6.21 for Class I, $7.20 for Class R4, $8.45 for Class W and $7.20 for Class Z.
Other share classes may have had expense waiver changes; however, the changes were not considered significant.
Semiannual Report 2013
4
Columbia Absolute Return Currency and Income Fund
Portfolio of Investments
April 30, 2013 (Unaudited)
(Percentages represent value of investments compared to net assets)
Commercial Mortgage-Backed Securities —
Non-Agency 3.4%
Issuer | | Coupon
Rate | | Principal
Amount ($) | | Value ($) | |
GS Mortgage Securities Corp. II(a)(b)(c)
Series 2007-EOP Class A2
03/06/20 | | | 1.260 | % | | | 1,200,000 | | | | 1,201,811 | | |
Series 2007-EOP Class A3
03/06/20 | | | 1.456 | % | | | 1,770,000 | | | | 1,773,603 | | |
Total Commercial Mortgage-Backed
Securities — Non-Agency
(Cost: $2,926,030) | | | | | | | 2,975,414 | | |
Asset-Backed Securities — Non-Agency 1.5%
Countrywide Home Equity Loan Trust
Series 2005-H Class 2A (FGIC)(a)
12/15/35 | | | 0.439 | % | | | 95,180 | | | | 51,515 | | |
Northstar Education Finance, Inc.
Series 2007-1 Class A2(a)
01/29/46 | | | 1.026 | % | | | 750,000 | | | | 701,346 | | |
Asset-Backed Securities — Non-Agency (continued)
Issuer | | Coupon
Rate | | Principal
Amount ($) | | Value ($) | |
SLM Student Loan Trust(a)
Series 2005-5 Class A2
10/25/21 | | | 0.356 | % | | | 138,262 | | | | 138,229 | | |
Series 2005-8 Class A2
07/25/22 | | | 0.366 | % | | | 107,067 | | | | 107,045 | | |
Series 2007-2 Class A2
07/25/17 | | | 0.276 | % | | | 355,814 | | | | 355,286 | | |
Total Asset-Backed Securities — Non-Agency
(Cost: $1,440,028) | | | | | | | 1,353,421 | | |
Money Market Funds 95.6%
| | | Shares | | Value ($) | |
Columbia Short-Term Cash Fund,
0.126%(d)(e) | | | 85,498,704 | | | | 85,498,704 | | |
Total Money Market Funds
(Cost: $85,498,704) | | | | | 85,498,704 | | |
Total Investments
(Cost: $89,864,762) | | | | | 89,827,539 | | |
Other Assets & Liabilities, Net | | | | | (432,488 | ) | |
Net Assets | | | | | 89,395,051 | | |
Investments in Derivatives
Forward Foreign Currency Exchange Contracts Open at April 30, 2013
Counterparty | | Exchange Date | | Currency to
be Delivered | | Currency to
be Received | | Unrealized
Appreciation ($) | | Unrealized
Depreciation ($) | |
State Street Bank & Trust Company | | May 15, 2013
| | | 8,051,000
(CHF) | | | | 8,660,994
(USD) | | | | 1,052
| | | | —
| | |
State Street Bank & Trust Company | | May 15, 2013
| | | 89,000
(CHF) | | | | 95,032
(USD) | | | | —
| | | | (700
| ) | |
Goldman, Sachs & Co. | | May 15, 2013
| | | 16,572,000
(EUR) | | | | 21,685,727
(USD) | | | | —
| | | | (140,645
| ) | |
Citigroup Global Markets Inc. | | May 15, 2013
| | | 8,387,000
(GBP) | | | | 12,887,348
(USD) | | | | —
| | | | (139,395
| ) | |
Deutsche Bank Securities, Inc. | | May 15, 2013
| | | 8,640,951
(USD) | | | | 8,332,000
(AUD) | | | | —
| | | | (12,192
| ) | |
Deutsche Bank Securities, Inc. | | May 15, 2013
| | | 4,401,352
(USD) | | | | 4,261,000
(AUD) | | | | 11,412
| | | | —
| | |
J.P. Morgan Securities, Inc. | | May 15, 2013
| | | 21,659,395
(USD) | | | | 2,121,811,000
(JPY) | | | | 107,526
| | | | —
| | |
The accompanying Notes to Financial Statements are an integral part of this statement.
Semiannual Report 2013
5
Columbia Absolute Return Currency and Income Fund
Portfolio of Investments (continued)
April 30, 2013 (Unaudited)
Forward Foreign Currency Exchange Contracts Open at April 30, 2013 (continued)
Counterparty | | Exchange Date | | Currency to
be Delivered | | Currency to
be Received | | Unrealized
Appreciation ($) | | Unrealized
Depreciation ($) | |
Barclays Bank PLC | | May 15, 2013
| | | 8,541,498
(USD) | | | | 48,955,000
(NOK) | | | | —
| | | | (56,299
| ) | |
Barclays Bank PLC | | May 15, 2013
| | | 248,164
(USD) | | | | 1,452,000
(NOK) | | | | 3,506
| | | | —
| | |
Total | | | | | | | | | 123,496 | | | | (349,231 | ) | |
Notes to Portfolio of Investments
(a) Variable rate security.
(b) Security exempt from registration pursuant to Rule 144A under the Securities Act of 1933. This security may be resold in transactions exempt from registration, normally to qualified institutional buyers. At April 30, 2013, the value of these securities amounted to $2,975,414 or 3.33% of net assets.
(c) The maturity dates shown represent the original maturity of the underlying obligation. Actual maturity may vary based upon prepayment activity on these obligations. Unless otherwise noted, the coupon rates presented are fixed rates.
(d) The rate shown is the seven-day current annualized yield at April 30, 2013.
(e) As defined in the Investment Company Act of 1940, an affiliated company is one in which the Fund owns 5% or more of its outstanding voting securities, or a company which is under common ownership or control with the Fund. Holdings and transactions in these affiliated companies during the period ended April 30, 2013, are as follows:
Issuer | | Beginning
Cost ($) | | Purchase
Cost ($) | | Sales Cost/
Proceeds
From Sales ($) | | Ending
Cost ($) | | Dividends or
Interest
Income ($) | | Value ($) | |
Columbia Short-Term Cash Fund | | | 96,812,305 | | | | 8,381,507 | | | | (19,695,108 | ) | | | 85,498,704 | | | | 63,212 | | | | 85,498,704 | | |
Abbreviation Legend
FGIC Financial Guaranty Insurance Company
Currency Legend
AUD Australian Dollar
CHF Swiss Franc
EUR Euro
GBP British Pound
JPY Japanese Yen
NOK Norwegian Krone
USD US Dollar
The accompanying Notes to Financial Statements are an integral part of this statement.
Semiannual Report 2013
6
Columbia Absolute Return Currency and Income Fund
Portfolio of Investments (continued)
April 30, 2013 (Unaudited)
Fair Value Measurements
Generally accepted accounting principles (GAAP) require disclosure regarding the inputs and valuation techniques used to measure fair value and any changes in valuation inputs or techniques. In addition, investments shall be disclosed by major category.
The Fund categorizes its fair value measurements according to a three-level hierarchy that maximizes the use of observable inputs and minimizes the use of unobservable inputs by prioritizing that the most observable input be used when available. Observable inputs are those that market participants would use in pricing an investment based on market data obtained from sources independent of the reporting entity. Unobservable inputs are those that reflect the Fund's assumptions about the information market participants would use in pricing an investment. An investment's level within the fair value hierarchy is based on the lowest level of any input that is deemed significant to the asset or liability's fair value measurement. The input levels are not necessarily an indication of the risk or liquidity associated with investments at that level. For example, certain U.S. government securities are generally high quality and liquid, however, they are reflected as Level 2 because the inputs used to determine fair value may not always be quoted prices in an active market.
Fair value inputs are summarized in the three broad levels listed below:
> Level 1 — Valuations based on quoted prices for investments in active markets that the Fund has the ability to access at the measurement date (including NAV for open-end mutual funds). Valuation adjustments are not applied to Level 1 investments.
> Level 2 — Valuations based on other significant observable inputs (including quoted prices for similar securities, interest rates, prepayment speeds, credit risks, etc.).
> Level 3 — Valuations based on significant unobservable inputs (including the Fund's own assumptions and judgment in determining the fair value of investments).
Inputs that are used in determining fair value of an investment may include price information, credit data, volatility statistics, and other factors. These inputs can be either observable or unobservable. The availability of observable inputs can vary between investments, and is affected by various factors such as the type of investment, and the volume and level of activity for that investment or similar investments in the marketplace. The inputs will be considered by the Investment Manager, along with any other relevant factors in the calculation of an investment's fair value. The Fund uses prices and inputs that are current as of the measurement date, which may include periods of market dislocations. During these periods, the availability of prices and inputs may be reduced for many investments. This condition could cause an investment to be reclassified between the various levels within the hierarchy.
Investments falling into the Level 3 category are primarily supported by quoted prices from brokers and dealers participating in the market for those investments. However, these may be classified as Level 3 investments due to lack of market transparency and corroboration to support these quoted prices. Additionally, valuation models may be used as the pricing source for any remaining investments classified as Level 3. These models may rely on one or more significant unobservable inputs and/or significant assumptions by the Investment Manager. Inputs used in valuations may include, but are not limited to, financial statement analysis, capital account balances, discount rates and estimated cash flows, and comparable company data.
Under the direction of the Fund's Board of Trustees (the Board), the Investment Manager's Valuation Committee (the Committee) is responsible for carrying out the valuation procedures approved by the Board. The Committee consists of voting and non-voting members from various groups within the Investment Manager's organization, including operations and accounting, trading and investments, compliance, risk management and legal.
The Committee meets at least monthly to review and approve valuation matters, which may include a description of specific valuation determinations, data regarding pricing information received from approved pricing vendors and brokers and the results of Board-approved valuation control policies and procedures (the Policies). The Policies address, among other things, instances when market quotations are readily available, including recommendations of third party pricing vendors and a determination of appropriate pricing methodologies; events that require specific valuation determinations and assessment of fair value techniques; securities with a potential for stale pricing, including those that are illiquid, restricted, or in default; and the effectiveness of third-party pricing vendors, including periodic reviews of vendors. The Committee meets more frequently, as needed, to discuss additional valuation matters, which may include the need to review back-testing results, review time-sensitive information or approve related valuation actions. The Committee reports to the Board, with members of the Committee meeting with the Board at each of its regularly scheduled meetings to discuss valuation matters and actions during the period, similar to those described earlier.
For investments categorized as Level 3, the Committee monitors information similar to that described above, which may include: (i) data specific to the issuer or comparable issuers, (ii) general market or specific sector news and (iii) quoted prices and specific or similar security transactions. The Committee considers this data and any changes from prior periods in order to assess the reasonableness of observable and unobservable inputs, any assumptions or internal models used to value those securities and changes in fair value. This data is also used to corroborate, when available, information received from approved pricing vendors and brokers. Various factors impact the frequency of monitoring this information (which may occur as often as daily). However, the Committee may determine that changes to inputs, assumptions and models are not required as a result of the monitoring procedures performed.
The accompanying Notes to Financial Statements are an integral part of this statement.
Semiannual Report 2013
7
Columbia Absolute Return Currency and Income Fund
Portfolio of Investments (continued)
April 30, 2013 (Unaudited)
Fair Value Measurements (continued)
The following table is a summary of the inputs used to value the Fund's investments at April 30, 2013:
Description | | Level 1
Quoted Prices in Active
Markets for Identical
Assets ($) | |
Level 2
Other Significant
Observable Inputs ($) | |
Level 3
Significant
Unobservable Inputs ($) | |
Total ($) | |
Bonds | |
Commercial Mortgage-Backed
Securities — Non-Agency | | | — | | | | 2,975,414 | | | | — | | | | 2,975,414 | | |
Asset-Backed Securities —
Non-Agency | | | — | | | | 1,353,421 | | | | — | | | | 1,353,421 | | |
Total Bonds | | | — | | | | 4,328,835 | | | | — | | | | 4,328,835 | | |
Other | |
Money Market Funds | | | 85,498,704 | | | | — | | | | — | | | | 85,498,704 | | |
Total Other | | | 85,498,704 | | | | — | | | | — | | | | 85,498,704 | | |
Investments in Securities | | | 85,498,704 | | | | 4,328,835 | | | | — | | | | 89,827,539 | | |
Derivatives | |
Assets | |
Forward Foreign Currency
Exchange Contracts | | | — | | | | 123,496 | | | | — | | | | 123,496 | | |
Liabilities | |
Forward Foreign Currency
Exchange Contracts | | | — | | | | (349,231 | ) | | | — | | | | (349,231 | ) | |
Total | | | 85,498,704 | | | | 4,103,100 | | | | — | | | | 89,601,804 | | |
See the Portfolio of Investments for all investment classifications not indicated in the table.
The Fund's assets assigned to the Level 2 input category are generally valued using the market approach, in which a security's value is determined through reference to prices and information from market transactions for similar or identical assets.
There were no transfers of financial assets between Levels 1 and 2 during the period.
Derivative instruments are valued at unrealized appreciation (depreciation).
The accompanying Notes to Financial Statements are an integral part of this statement.
Semiannual Report 2013
8
Columbia Absolute Return Currency and Income Fund
Statement of Assets and Liabilities
April 30, 2013 (Unaudited)
Assets | |
Investments, at value | |
Unaffiliated issuers (identified cost $4,366,058) | | $ | 4,328,835 | | |
Affiliated issuers (identified cost $85,498,704) | | | 85,498,704 | | |
Total investments (identified cost $89,864,762) | | | 89,827,539 | | |
Unrealized appreciation on forward foreign currency exchange contracts | | | 123,496 | | |
Receivable for: | |
Investments sold | | | 35,343 | | |
Capital shares sold | | | 84,516 | | |
Dividends | | | 9,318 | | |
Interest | | | 2,954 | | |
Prepaid expenses | | | 681 | | |
Other assets | | | 32,990 | | |
Total assets | | | 90,116,837 | | |
Liabilities | |
Unrealized depreciation on forward foreign currency exchange contracts | | | 349,231 | | |
Payable for: | |
Investments purchased | | | 73,579 | | |
Capital shares purchased | | | 250,988 | | |
Investment management fees | | | 2,187 | | |
Distribution and/or service fees | | | 269 | | |
Transfer agent fees | | | 19,434 | | |
Administration fees | | | 197 | | |
Compensation of board members | | | 12,075 | | |
Expense reimbursement due to Investment Manager | | | 2 | | |
Other expenses | | | 13,824 | | |
Total liabilities | | | 721,786 | | |
Net assets applicable to outstanding capital stock | | $ | 89,395,051 | | |
Represented by | |
Paid-in capital | | $ | 89,505,061 | | |
Excess of distributions over net investment income | | | (1,266,980 | ) | |
Accumulated net realized gain | | | 1,419,928 | | |
Unrealized appreciation (depreciation) on: | |
Investments | | | (37,223 | ) | |
Forward foreign currency exchange contracts | | | (225,735 | ) | |
Total — representing net assets applicable to outstanding capital stock | | $ | 89,395,051 | | |
The accompanying Notes to Financial Statements are an integral part of this statement.
Semiannual Report 2013
9
Columbia Absolute Return Currency and Income Fund
Statement of Assets and Liabilities (continued)
April 30, 2013 (Unaudited)
Class A | |
Net assets | | $ | 25,953,889 | | |
Shares outstanding | | | 2,582,139 | | |
Net asset value per share | | $ | 10.05 | | |
Maximum offering price per share(a) | | $ | 10.36 | | |
Class B | |
Net assets | | $ | 343,555 | | |
Shares outstanding | | | 35,418 | | |
Net asset value per share | | $ | 9.70 | | |
Class C | |
Net assets | | $ | 2,856,401 | | |
Shares outstanding | | | 294,798 | | |
Net asset value per share | | $ | 9.69 | | |
Class I | |
Net assets | | $ | 51,992,718 | | |
Shares outstanding | | | 5,055,012 | | |
Net asset value per share | | $ | 10.29 | | |
Class R4 | |
Net assets | | $ | 2,494 | | |
Shares outstanding | | | 243 | | |
Net asset value per share | | $ | 10.26 | | |
Class W | |
Net assets | | $ | 162,755 | | |
Shares outstanding | | | 16,253 | | |
Net asset value per share | | $ | 10.01 | | |
Class Y | |
Net assets | | $ | 2,505 | | |
Shares outstanding | | | 244 | | |
Net asset value per share | | $ | 10.27 | | |
Class Z | |
Net assets | | $ | 8,080,734 | | |
Shares outstanding | | | 787,465 | | |
Net asset value per share | | $ | 10.26 | | |
(a) The maximum offering price per share is calculated by dividing the net asset value by 1.0 minus the maximum sales charge of 3.00%.
The accompanying Notes to Financial Statements are an integral part of this statement.
Semiannual Report 2013
10
Columbia Absolute Return Currency and Income Fund
Statement of Operations
Six Months Ended April 30, 2013 (Unaudited)
Net investment income | |
Income: | |
Dividends — affiliated issuers | | $ | 63,212 | | |
Interest | | | 38,117 | | |
Total income | | | 101,329 | | |
Expenses: | |
Investment management fees | | | 424,353 | | |
Distribution and/or service fees | |
Class A | | | 34,780 | | |
Class B | | | 2,007 | | |
Class C | | | 14,341 | | |
Class W | | | 7,700 | | |
Transfer agent fees | |
Class A | | | 57,716 | | |
Class B | | | 836 | | |
Class C | | | 5,924 | | |
Class W | | | 13,834 | | |
Class Z | | | 17,494 | | |
Administration fees | | | 38,144 | | |
Compensation of board members | | | 7,925 | | |
Custodian fees | | | 2,650 | | |
Printing and postage fees | | | 35,855 | | |
Registration fees | | | 41,347 | | |
Professional fees | | | 16,106 | | |
Other | | | 5,013 | | |
Total expenses | | | 726,025 | | |
Fees waived or expenses reimbursed by Investment Manager and its affiliates | | | (150,903 | ) | |
Total net expenses | | | 575,122 | | |
Net investment loss | | | (473,793 | ) | |
Realized and unrealized gain (loss) — net | |
Net realized gain (loss) on: | |
Investments | | | 3,166 | | |
Forward foreign currency exchange contracts | | | 1,471,956 | | |
Net realized gain | | | 1,475,122 | | |
Net change in unrealized appreciation (depreciation) on: | |
Investments | | | 22,916 | | |
Forward foreign currency exchange contracts | | | (269,291 | ) | |
Net change in unrealized appreciation (depreciation) | | | (246,375 | ) | |
Net realized and unrealized gain | | | 1,228,747 | | |
Net increase in net assets resulting from operations | | $ | 754,954 | | |
The accompanying Notes to Financial Statements are an integral part of this statement.
Semiannual Report 2013
11
Columbia Absolute Return Currency and Income Fund
Statement of Changes in Net Assets
| | | Six Months Ended
April 30, 2013
(Unaudited) | | Year Ended
October 31, 2012 | |
Operations | |
Net investment loss | | $ | (473,793 | ) | | $ | (1,081,496 | ) | |
Net realized gain | | | 1,475,122 | | | | 4,228,866 | | |
Net change in unrealized appreciation (depreciation) | | | (246,375 | ) | | | 92,989 | | |
Net increase in net assets resulting from operations | | | 754,954 | | | | 3,240,359 | | |
Distributions to shareholders | |
Net realized gains | |
Class A | | | (669,389 | ) | | | — | | |
Class B | | | (9,970 | ) | | | — | | |
Class C | | | (70,481 | ) | | | — | | |
Class I | | | (1,113,563 | ) | | | — | | |
Class W | | | (259,616 | ) | | | — | | |
Class Z | | | (208,068 | ) | | | — | | |
Total distributions to shareholders | | | (2,331,087 | ) | | | — | | |
Increase (decrease) in net assets from capital stock activity | | | (10,783,399 | ) | | | (44,181,803 | ) | |
Total decrease in net assets | | | (12,359,532 | ) | | | (40,941,444 | ) | |
Net assets at beginning of period | | | 101,754,583 | | | | 142,696,027 | | |
Net assets at end of period | | $ | 89,395,051 | | | $ | 101,754,583 | | |
Excess of distributions over net investment income | | $ | (1,266,980 | ) | | $ | (793,187 | ) | |
The accompanying Notes to Financial Statements are an integral part of this statement.
Semiannual Report 2013
12
Columbia Absolute Return Currency and Income Fund
Statement of Changes in Net Assets (continued)
| | | Six Months Ended April 30, 2013(a)(b)
(Unaudited) | | Year Ended October 31, 2012 | |
| | | Shares | | Dollars ($) | | Shares | | Dollars ($) | |
Capital stock activity | |
Class A shares | |
Subscriptions(c) | | | 217,422 | | | | 2,202,768 | | | | 550,895 | | | | 5,590,192 | | |
Distributions reinvested | | | 65,824 | | | | 664,824 | | | | — | | | | — | | |
Redemptions | | | (713,438 | ) | | | (7,223,048 | ) | | | (1,633,832 | ) | | | (16,525,902 | ) | |
Net decrease | | | (430,192 | ) | | | (4,355,456 | ) | | | (1,082,937 | ) | | | (10,935,710 | ) | |
Class B shares | |
Subscriptions | | | 1,021 | | | | 10,000 | | | | 3,529 | | | | 34,759 | | |
Distributions reinvested | | | 1,020 | | | | 9,970 | | | | — | | | | — | | |
Redemptions(c) | | | (12,724 | ) | | | (124,710 | ) | | | (29,184 | ) | | | (287,546 | ) | |
Net decrease | | | (10,683 | ) | | | (104,740 | ) | | | (25,655 | ) | | | (252,787 | ) | |
Class C shares | |
Subscriptions | | | 76,039 | | | | 741,149 | | | | 76,222 | | | | 752,965 | | |
Distributions reinvested | | | 5,857 | | | | 57,161 | | | | — | | | | — | | |
Redemptions | | | (79,061 | ) | | | (769,611 | ) | | | (127,454 | ) | | | (1,254,559 | ) | |
Net increase (decrease) | | | 2,835 | | | | 28,699 | | | | (51,232 | ) | | | (501,594 | ) | |
Class I shares | |
Subscriptions | | | 562,435 | | | | 5,843,220 | | | | 733,082 | | | | 7,588,187 | | |
Distributions reinvested | | | 107,985 | | | | 1,113,328 | | | | — | | | | — | | |
Redemptions | | | (181,711 | ) | | | (1,891,763 | ) | | | (2,860,955 | ) | | | (29,236,950 | ) | |
Net increase (decrease) | | | 488,709 | | | | 5,064,785 | | | | (2,127,873 | ) | | | (21,648,763 | ) | |
Class R4 shares | |
Subscriptions | | | 243 | | | | 2,500 | | | | — | | | | — | | |
Net increase | | | 243 | | | | 2,500 | | | | — | | | | — | | |
Class W shares | |
Subscriptions | | | 119,586 | | | | 1,213,916 | | | | 416,090 | | | | 4,199,212 | | |
Distributions reinvested | | | 25,744 | | | | 259,500 | | | | — | | | | — | | |
Redemptions | | | (1,200,777 | ) | | | (11,961,386 | ) | | | (1,774,990 | ) | | | (17,908,514 | ) | |
Net decrease | | | (1,055,447 | ) | | | (10,487,970 | ) | | | (1,358,900 | ) | | | (13,709,302 | ) | |
Class Y shares | |
Subscriptions | | | 244 | | | | 2,500 | | | | — | | | | — | | |
Net increase | | | 244 | | | | 2,500 | | | | — | | | | — | | |
Class Z shares | |
Subscriptions | | | 170,055 | | | | 1,747,951 | | | | 509,624 | | | | 5,255,433 | | |
Distributions reinvested | | | 8,582 | | | | 88,392 | | | | — | | | | — | | |
Redemptions | | | (270,012 | ) | | | (2,770,060 | ) | | | (231,954 | ) | | | (2,389,080 | ) | |
Net increase (decrease) | | | (91,375 | ) | | | (933,717 | ) | | | 277,670 | | | | 2,866,353 | | |
Total net decrease | | | (1,095,666 | ) | | | (10,783,399 | ) | | | (4,368,927 | ) | | | (44,181,803 | ) | |
(a) Class R4 shares are for the period from March 19, 2013 (commencement of operations) to April 30, 2013.
(b) Class Y shares are for the period from February 28, 2013 (commencement of operations) to April 30, 2013.
(c) Includes conversions of Class B shares to Class A shares, if any.
The accompanying Notes to Financial Statements are an integral part of this statement.
Semiannual Report 2013
13
Columbia Absolute Return Currency and Income Fund
The following tables are intended to help you understand the Fund's financial performance. Certain information reflects financial results for a single share of a class held for the periods shown. Per share net investment income (loss) amounts are calculated based on average shares outstanding during the period. Total return assumes reinvestment of all dividends and distributions, if any. Total return does not reflect payment of sales charges, if any, and is not annualized for periods of less than one year.
| | | Six Months Ended
April 30, 2013 | | Year Ended October 31, | |
Class A | | (Unaudited) | | 2012 | | 2011 | | 2010 | | 2009 | | 2008 | |
Per share data | |
Net asset value, beginning of period | | $ | 10.21 | | | $ | 9.95 | | | $ | 10.00 | | | $ | 9.93 | | | $ | 9.97 | | | $ | 10.58 | | |
Income from investment operations: | |
Net investment income (loss) | | | (0.06 | ) | | | (0.12 | ) | | | (0.15 | ) | | | (0.12 | ) | | | (0.08 | ) | | | 0.15 | | |
Net realized and unrealized gain (loss) | | | 0.14 | | | | 0.38 | | | | 0.10 | | | | 0.19 | | | | 0.09 | | | | (0.22 | ) | |
Total from investment operations | | | 0.08 | | | | 0.26 | | | | (0.05 | ) | | | 0.07 | | | | 0.01 | | | | (0.07 | ) | |
Less distributions to shareholders: | |
Net investment income | | | — | | | | — | | | | — | | | | — | | | | (0.00 | )(a) | | | (0.18 | ) | |
Net realized gains | | | (0.24 | ) | | | — | | | | — | | | | — | | | | (0.05 | ) | | | (0.36 | ) | |
Total distributions to shareholders | | | (0.24 | ) | | | — | | | | — | | | | — | | | | (0.05 | ) | | | (0.54 | ) | |
Net asset value, end of period | | $ | 10.05 | | | $ | 10.21 | | | $ | 9.95 | | | $ | 10.00 | | | $ | 9.93 | | | $ | 9.97 | | |
Total return | | | 0.72 | % | | | 2.61 | % | | | (0.50 | %) | | | 0.71 | % | | | 0.15 | % | | | (0.57 | %) | |
Ratios to average net assets(b) | |
Total gross expenses | | | 1.86 | %(c) | | | 1.65 | % | | | 1.73 | % | | | 1.47 | % | | | 1.38 | % | | | 1.39 | % | |
Total net expenses(d) | | | 1.44 | %(c) | | | 1.42 | % | | | 1.73 | % | | | 1.47 | % | | | 1.38 | % | | | 1.39 | % | |
Net investment income (loss) | | | (1.23 | %)(c) | | | (1.18 | %) | | | (1.48 | %) | | | (1.19 | %) | | | (0.83 | %) | | | 1.50 | % | |
Supplemental data | |
Net assets, end of period (in thousands) | | $ | 25,954 | | | $ | 30,758 | | | $ | 40,755 | | | $ | 62,209 | | | $ | 114,238 | | | $ | 175,659 | | |
Portfolio turnover | | | 0 | % | | | 0 | % | | | 0 | % | | | 0 | % | | | 16 | % | | | 39 | % | |
Notes to Financial Highlights
(a) Rounds to zero.
(b) In addition to the fees and expenses which the Fund bears directly, the Fund indirectly bears a pro rata share of the fees and expenses of the acquired funds in which it invests. Such indirect expenses are not included in the reported expense ratios.
(c) Annualized.
(d) Total net expenses include the impact of certain waivers/reimbursements made by the Investment Manager and certain of its affiliates, if applicable.
The accompanying Notes to Financial Statements are an integral part of this statement.
Semiannual Report 2013
14
Columbia Absolute Return Currency and Income Fund
Financial Highlights (continued)
| | | Six Months Ended
April 30, 2013 | | Year Ended October 31, | |
Class B | | (Unaudited) | | 2012 | | 2011 | | 2010 | | 2009 | | 2008 | |
Per share data | |
Net asset value, beginning of period | | $ | 9.90 | | | $ | 9.72 | | | $ | 9.85 | | | $ | 9.85 | | | $ | 9.96 | | | $ | 10.58 | | |
Income from investment operations: | |
Net investment income (loss) | | | (0.10 | ) | | | (0.19 | ) | | | (0.22 | ) | | | (0.19 | ) | | | (0.16 | ) | | | 0.04 | | |
Net realized and unrealized gain (loss) | | | 0.14 | | | | 0.37 | | | | 0.09 | | | | 0.19 | | | | 0.10 | | | | (0.18 | ) | |
Total from investment operations | | | 0.04 | | | | 0.18 | | | | (0.13 | ) | | | — | | | | (0.06 | ) | | | (0.14 | ) | |
Less distributions to shareholders: | |
Net investment income | | | — | | | | — | | | | — | | | | — | | | | — | | | | (0.12 | ) | |
Net realized gains | | | (0.24 | ) | | | — | | | | — | | | | — | | | | (0.05 | ) | | | (0.36 | ) | |
Total distributions to shareholders | | | (0.24 | ) | | | — | | | | — | | | | — | | | | (0.05 | ) | | | (0.48 | ) | |
Net asset value, end of period | | $ | 9.70 | | | $ | 9.90 | | | $ | 9.72 | | | $ | 9.85 | | | $ | 9.85 | | | $ | 9.96 | | |
Total return | | | 0.34 | % | | | 1.85 | % | | | (1.32 | %) | | | 0.00 | %(a) | | | (0.56 | %) | | | (1.35 | %) | |
Ratios to average net assets(b) | |
Total gross expenses | | | 2.61 | %(c) | | | 2.39 | % | | | 2.47 | % | | | 2.23 | % | | | 2.14 | % | | | 2.16 | % | |
Total net expenses(d) | | | 2.18 | %(c) | | | 2.17 | % | | | 2.47 | % | | | 2.23 | % | | | 2.14 | % | | | 2.16 | % | |
Net investment income (loss) | | | (1.97 | %)(c) | | | (1.93 | %) | | | (2.21 | %) | | | (1.95 | %) | | | (1.59 | %) | | | 0.38 | % | |
Supplemental data | |
Net assets, end of period (in thousands) | | $ | 344 | | | $ | 456 | | | $ | 698 | | | $ | 1,006 | | | $ | 2,026 | | | $ | 3,269 | | |
Portfolio turnover | | | 0 | % | | | 0 | % | | | 0 | % | | | 0 | % | | | 16 | % | | | 39 | % | |
Notes to Financial Highlights
(a) Rounds to zero.
(b) In addition to the fees and expenses which the Fund bears directly, the Fund indirectly bears a pro rata share of the fees and expenses of the acquired funds in which it invests. Such indirect expenses are not included in the reported expense ratios.
(c) Annualized.
(d) Total net expenses include the impact of certain waivers/reimbursements made by the Investment Manager and certain of its affiliates, if applicable.
The accompanying Notes to Financial Statements are an integral part of this statement.
Semiannual Report 2013
15
Columbia Absolute Return Currency and Income Fund
Financial Highlights (continued)
| | | Six Months Ended
April 30, 2013 | | Year Ended October 31, | |
Class C | | (Unaudited) | | 2012 | | 2011 | | 2010 | | 2009 | | 2008 | |
Per share data | |
Net asset value, beginning of period | | $ | 9.89 | | | $ | 9.71 | | | $ | 9.83 | | | $ | 9.84 | | | $ | 9.95 | | | $ | 10.57 | | |
Income from investment operations: | |
Net investment income (loss) | | | (0.10 | ) | | | (0.19 | ) | | | (0.22 | ) | | | (0.19 | ) | | | (0.16 | ) | | | 0.06 | | |
Net realized and unrealized gain (loss) | | | 0.14 | | | | 0.37 | | | | 0.10 | | | | 0.18 | | | | 0.10 | | | | (0.20 | ) | |
Total from investment operations | | | 0.04 | | | | 0.18 | | | | (0.12 | ) | | | (0.01 | ) | | | (0.06 | ) | | | (0.14 | ) | |
Less distributions to shareholders: | |
Net investment income | | | — | | | | — | | | | — | | | | — | | | | — | | | | (0.12 | ) | |
Net realized gains | | | (0.24 | ) | | | — | | | | — | | | | — | | | | (0.05 | ) | | | (0.36 | ) | |
Total distributions to shareholders | | | (0.24 | ) | | | — | | | | — | | | | — | | | | (0.05 | ) | | | (0.48 | ) | |
Net asset value, end of period | | $ | 9.69 | | | $ | 9.89 | | | $ | 9.71 | | | $ | 9.83 | | | $ | 9.84 | | | $ | 9.95 | | |
Total return | | | 0.34 | % | | | 1.85 | % | | | (1.22 | %) | | | (0.10 | %) | | | (0.56 | %) | | | (1.31 | %) | |
Ratios to average net assets(a) | |
Total gross expenses | | | 2.61 | %(b) | | | 2.39 | % | | | 2.48 | % | | | 2.22 | % | | | 2.14 | % | | | 2.15 | % | |
Total net expenses(c) | | | 2.19 | %(b) | | | 2.16 | % | | | 2.48 | % | | | 2.22 | % | | | 2.14 | % | | | 2.15 | % | |
Net investment income (loss) | | | (1.98 | %)(b) | | | (1.92 | %) | | | (2.23 | %) | | | (1.94 | %) | | | (1.60 | %) | | | 0.66 | % | |
Supplemental data | |
Net assets, end of period (in thousands) | | $ | 2,856 | | | $ | 2,887 | | | $ | 3,333 | | | $ | 4,703 | | | $ | 7,609 | | | $ | 9,463 | | |
Portfolio turnover | | | 0 | % | | | 0 | % | | | 0 | % | | | 0 | % | | | 16 | % | | | 39 | % | |
Notes to Financial Highlights
(a) In addition to the fees and expenses which the Fund bears directly, the Fund indirectly bears a pro rata share of the fees and expenses of the acquired funds in which it invests. Such indirect expenses are not included in the reported expense ratios.
(b) Annualized.
(c) Total net expenses include the impact of certain waivers/reimbursements made by the Investment Manager and certain of its affiliates, if applicable.
The accompanying Notes to Financial Statements are an integral part of this statement.
Semiannual Report 2013
16
Columbia Absolute Return Currency and Income Fund
Financial Highlights (continued)
| | | Six Months Ended
April 30, 2013 | | Year Ended October 31, | |
Class I | | (Unaudited) | | 2012 | | 2011 | | 2010 | | 2009 | | 2008 | |
Per share data | |
Net asset value, beginning of period | | $ | 10.42 | | | $ | 10.11 | | | $ | 10.09 | | | $ | 9.98 | | | $ | 9.98 | | | $ | 10.59 | | |
Income from investment operations: | |
Net investment income (loss) | | | (0.04 | ) | | | (0.07 | ) | | | (0.08 | ) | | | (0.08 | ) | | | (0.04 | ) | | | 0.21 | | |
Net realized and unrealized gain (loss) | | | 0.15 | | | | 0.38 | | | | 0.10 | | | | 0.19 | | | | 0.10 | | | | (0.24 | ) | |
Total from investment operations | | | 0.11 | | | | 0.31 | | | | 0.02 | | | | 0.11 | | | | 0.06 | | | | (0.03 | ) | |
Less distributions to shareholders: | |
Net investment income | | | — | | | | — | | | | — | | | | — | | | | (0.01 | ) | | | (0.22 | ) | |
Net realized gains | | | (0.24 | ) | | | — | | | | — | | | | — | | | | (0.05 | ) | | | (0.36 | ) | |
Total distributions to shareholders | | | (0.24 | ) | | | — | | | | — | | | | — | | | | (0.06 | ) | | | (0.58 | ) | |
Net asset value, end of period | | $ | 10.29 | | | $ | 10.42 | | | $ | 10.11 | | | $ | 10.09 | | | $ | 9.98 | | | $ | 9.98 | | |
Total return | | | 1.00 | % | | | 3.07 | % | | | 0.20 | % | | | 1.10 | % | | | 0.56 | % | | | (0.25 | %) | |
Ratios to average net assets(a) | |
Total gross expenses | | | 1.20 | %(b) | | | 1.14 | % | | | 1.05 | % | | | 1.07 | % | | | 1.01 | % | | | 1.03 | % | |
Total net expenses(c) | | | 1.00 | %(b) | | | 0.91 | % | | | 1.05 | % | | | 1.07 | % | | | 1.01 | % | | | 1.03 | % | |
Net investment income (loss) | | | (0.78 | %)(b) | | | (0.68 | %) | | | (0.84 | %) | | | (0.79 | %) | | | (0.40 | %) | | | 2.10 | % | |
Supplemental data | |
Net assets, end of period (in thousands) | | $ | 51,993 | | | $ | 47,585 | | | $ | 67,660 | | | $ | 38,718 | | | $ | 28,926 | | | $ | 202,106 | | |
Portfolio turnover | | | 0 | % | | | 0 | % | | | 0 | % | | | 0 | % | | | 16 | % | | | 39 | % | |
Notes to Financial Highlights
(a) In addition to the fees and expenses which the Fund bears directly, the Fund indirectly bears a pro rata share of the fees and expenses of the acquired funds in which it invests. Such indirect expenses are not included in the reported expense ratios.
(b) Annualized.
(c) Total net expenses include the impact of certain waivers/reimbursements made by the Investment Manager and certain of its affiliates, if applicable.
The accompanying Notes to Financial Statements are an integral part of this statement.
Semiannual Report 2013
17
Columbia Absolute Return Currency and Income Fund
Financial Highlights (continued)
Class R4 | | Six Months Ended
April 30, 2013(a)
(Unaudited) | |
Per share data | |
Net asset value, beginning of period | | $ | 10.28 | | |
Income from investment operations: | |
Net investment loss | | | (0.01 | ) | |
Net realized and unrealized loss | | | (0.01 | )(b) | |
Total from investment operations | | | (0.02 | ) | |
Net asset value, end of period | | $ | 10.26 | | |
Total return | | | (0.19 | %) | |
Ratios to average net assets(c) | |
Total gross expenses | | | 1.38 | %(d) | |
Total net expenses(e) | | | 1.26 | %(d) | |
Net investment loss | | | (1.10 | %)(d) | |
Supplemental data | |
Net assets, end of period (in thousands) | | $ | 2 | | |
Portfolio turnover | | | 0 | % | |
Notes to Financial Highlights
(a) For the period from March 19, 2013 (commencement of operations) to April 30, 2013.
(b) Calculation of the net gain (loss) per share (both realized and unrealized) does not correlate to the aggregate realized and unrealized gain (loss) presented in the Statement of Operations due to the timing of sales and repurchases of Fund shares in relation to fluctuations in the market value of the portfolio.
(c) In addition to the fees and expenses which the Fund bears directly, the Fund indirectly bears a pro rata share of the fees and expenses of the acquired funds in which it invests. Such indirect expenses are not included in the reported expense ratios.
(d) Annualized.
(e) Total net expenses include the impact of certain waivers/reimbursements made by the Investment Manager and certain of its affiliates, if applicable.
The accompanying Notes to Financial Statements are an integral part of this statement.
Semiannual Report 2013
18
Columbia Absolute Return Currency and Income Fund
Financial Highlights (continued)
| | | Six Months Ended
April 30, 2013 | | Year Ended October 31, | |
Class W | | (Unaudited) | | 2012 | | 2011 | | 2010 | | 2009 | | 2008 | |
Per share data | |
Net asset value, beginning of period | | $ | 10.19 | | | $ | 9.94 | | | $ | 9.99 | | | $ | 9.92 | | | $ | 9.97 | | | $ | 10.58 | | |
Income from investment operations: | |
Net investment income (loss) | | | (0.06 | ) | | | (0.14 | ) | | | (0.15 | ) | | | (0.12 | ) | | | (0.08 | ) | | | 0.11 | | |
Net realized and unrealized gain (loss) | | | 0.12 | | | | 0.39 | | | | 0.10 | | | | 0.19 | | | | 0.08 | | | | (0.19 | ) | |
Total from investment operations | | | 0.06 | | | | 0.25 | | | | (0.05 | ) | | | 0.07 | | | | — | | | | (0.08 | ) | |
Less distributions to shareholders: | |
Net investment income | | | — | | | | — | | | | — | | | | — | | | | — | | | | (0.17 | ) | |
Net realized gains | | | (0.24 | ) | | | — | | | | — | | | | — | | | | (0.05 | ) | | | (0.36 | ) | |
Total distributions to shareholders | | | (0.24 | ) | | | — | | | | — | | | | — | | | | (0.05 | ) | | | (0.53 | ) | |
Net asset value, end of period | | $ | 10.01 | | | $ | 10.19 | | | $ | 9.94 | | | $ | 9.99 | | | $ | 9.92 | | | $ | 9.97 | | |
Total return | | | 0.52 | % | | | 2.52 | % | | | (0.50 | %) | | | 0.71 | % | | | 0.04 | % | | | (0.66 | %) | |
Ratios to average net assets(a) | |
Total gross expenses | | | 1.84 | %(b) | | | 1.83 | % | | | 1.71 | % | | | 1.51 | % | | | 1.46 | % | | | 1.50 | % | |
Total net expenses(c) | | | 1.32 | %(b) | | | 1.62 | % | | | 1.71 | % | | | 1.51 | % | | | 1.46 | % | | | 1.50 | % | |
Net investment income (loss) | | | (1.12 | %)(b) | | | (1.38 | %) | | | (1.46 | %) | | | (1.23 | %) | | | (0.86 | %) | | | 1.09 | % | |
Supplemental data | |
Net assets, end of period (in thousands) | | $ | 163 | | | $ | 10,922 | | | $ | 24,171 | | | $ | 63,369 | | | $ | 87,000 | | | $ | 303,933 | | |
Portfolio turnover | | | 0 | % | | | 0 | % | | | 0 | % | | | 0 | % | | | 16 | % | | | 39 | % | |
Notes to Financial Highlights
(a) In addition to the fees and expenses which the Fund bears directly, the Fund indirectly bears a pro rata share of the fees and expenses of the acquired funds in which it invests. Such indirect expenses are not included in the reported expense ratios.
(b) Annualized.
(c) Total net expenses include the impact of certain waivers/reimbursements made by the Investment Manager and certain of its affiliates, if applicable.
The accompanying Notes to Financial Statements are an integral part of this statement.
Semiannual Report 2013
19
Columbia Absolute Return Currency and Income Fund
Financial Highlights (continued)
Class Y | | Six Months Ended
April 30, 2013(a)
(Unaudited) | |
Per share data | |
Net asset value, beginning of period | | $ | 10.25 | | |
Income from investment operations: | |
Net investment loss | | | (0.02 | ) | |
Net realized and unrealized gain | | | 0.04 | | |
Total from investment operations | | | 0.02 | | |
Net asset value, end of period | | $ | 10.27 | | |
Total return | | | 0.20 | % | |
Ratios to average net assets(b) | |
Total gross expenses | | | 1.34 | %(c) | |
Total net expenses(d) | | | 1.24 | %(c) | |
Net investment income | | | (1.08 | %)(c) | |
Supplemental data | |
Net assets, end of period (in thousands) | | $ | 3 | | |
Portfolio turnover | | | 0 | % | |
Notes to Financial Highlights
(a) For the period from February 28, 2013 (commencement of operations) to April 30, 2013.
(b) In addition to the fees and expenses which the Fund bears directly, the Fund indirectly bears a pro rata share of the fees and expenses of the acquired funds in which it invests. Such indirect expenses are not included in the reported expense ratios.
(c) Annualized.
(d) Total net expenses include the impact of certain waivers/reimbursements made by the Investment Manager and certain of its affiliates, if applicable.
The accompanying Notes to Financial Statements are an integral part of this statement.
Semiannual Report 2013
20
Columbia Absolute Return Currency and Income Fund
Financial Highlights (continued)
| | | Six Months Ended
April 30, 2013 | | Year Ended October 31, | |
Class Z | | (Unaudited) | | 2012 | | 2011 | | 2010(a) | |
Per share data | |
Net asset value, beginning of period | | $ | 10.41 | | | $ | 10.11 | | | $ | 10.09 | | | $ | 10.18 | | |
Income from investment operations: | |
Net investment income (loss) | | | (0.05 | ) | | | (0.09 | ) | | | (0.10 | ) | | | (0.01 | ) | |
Net realized and unrealized gain (loss) | | | 0.14 | | | | 0.39 | | | | 0.12 | | | | (0.08 | ) | |
Total from investment operations | | | 0.09 | | | | 0.30 | | | | 0.02 | | | | (0.09 | ) | |
Less distributions to shareholders: | |
Net realized gains | | | (0.24 | ) | | | — | | | | — | | | | — | | |
Total distributions to shareholders | | | (0.24 | ) | | | — | | | | — | | | | — | | |
Net asset value, end of period | | $ | 10.26 | | | $ | 10.41 | | | $ | 10.11 | | | $ | 10.09 | | |
Total return | | | 0.81 | % | | | 2.97 | % | | | 0.20 | % | | | (0.88 | %) | |
Ratios to average net assets(b) | |
Total gross expenses | | | 1.61 | %(c) | | | 1.34 | % | | | 1.15 | % | | | 1.54 | %(c) | |
Total net expenses(d) | | | 1.19 | %(c) | | | 1.09 | % | | | 1.15 | % | | | 1.54 | %(c) | |
Net investment income (loss) | | | (0.98 | %)(c) | | | (0.85 | %) | | | (0.95 | %) | | | (1.20 | %)(c) | |
Supplemental data | |
Net assets, end of period (in thousands) | | $ | 8,081 | | | $ | 9,146 | | | $ | 6,079 | | | $ | 14 | | |
Portfolio turnover | | | 0 | % | | | 0 | % | | | 0 | % | | | 0 | % | |
Notes to Financial Highlights
(a) For the period from September 27, 2010 (commencement of operations) to October 31, 2010.
(b) In addition to the fees and expenses which the Fund bears directly, the Fund indirectly bears a pro rata share of the fees and expenses of the acquired funds in which it invests. Such indirect expenses are not included in the reported expense ratios.
(c) Annualized.
(d) Total net expenses include the impact of certain waivers/reimbursements made by the Investment Manager and certain of its affiliates, if applicable.
The accompanying Notes to Financial Statements are an integral part of this statement.
Semiannual Report 2013
21
Columbia Absolute Return Currency and Income Fund
Notes to Financial Statements
April 30, 2013 (Unaudited)
Note 1. Organization
Columbia Absolute Return Currency and Income Fund (the Fund), a series of Columbia Funds Series Trust II (the Trust), is a diversified fund. The Trust is registered under the Investment Company Act of 1940, as amended (the 1940 Act), as an open-end management investment company organized as a Massachusetts business trust.
Fund Shares
The Trust may issue an unlimited number of shares (without par value). The Fund offers Class A, Class B, Class C, Class I, Class R4, Class W, Class Y and Class Z shares. All share classes have identical voting, dividend and liquidation rights. Each share class has its own expense structure and sales charges, as applicable.
Class A shares are subject to a maximum front-end sales charge of 3.00% based on the initial investment amount. Class A shares purchased without an initial sales charge in accounts aggregating $1 million to $50 million at the time of purchase are subject to a contingent deferred sales charge (CDSC) if the shares are sold within 18 months of purchase, charged as follows: 1.00% CDSC if redeemed within 12 months of purchase, and 0.50% CDSC if redeemed more than 12, but less than 18, months after purchase.
Class B shares may be subject to a maximum CDSC of 5.00% based upon the holding period after purchase. Class B shares will generally convert to Class A shares eight years after purchase. The Fund no longer accepts investments by new or existing investors in the Fund's Class B shares, except in connection with the reinvestment of any dividend and/or capital gain distributions in Class B shares of the Fund and exchanges by existing Class B shareholders of certain other funds within the Columbia Family of Funds.
Class C shares are subject to a 1.00% CDSC on shares redeemed within one year of purchase.
Class I shares are not subject to sales charges and are available only to the Columbia Family of Funds.
Class R4 shares are not subject to sales charges and are generally available only to omnibus retirement plans and certain other eligible investors. Class R4 shares commenced operations on March 19, 2013.
Class W shares are not subject to sales charges and are available only to investors purchasing through authorized investment programs managed by investment professionals, including discretionary managed account programs.
Class Y shares are not subject to sales charges and are generally available only to certain retirement plans. Class Y shares commenced operations on February 28, 2013.
Class Z shares are not subject to sales charges, and are available only to certain investors.
Note 2. Summary of Significant Accounting Policies
Use of Estimates
The preparation of financial statements in accordance with U.S. generally accepted accounting principles (GAAP) requires management to make certain estimates and assumptions that affect the reported amounts of assets and liabilities, the disclosure of contingent assets and liabilities at the date of the financial statements and the reported amounts of revenue and expenses during the reporting period. Actual results could differ from those estimates.
The following is a summary of significant accounting policies consistently followed by the Fund in the preparation of its financial statements.
Security Valuation
Debt securities generally are valued by pricing services approved by the Board of Trustees (the Board) based upon market transactions for normal, institutional-size trading units of similar securities. The services may use various pricing techniques which take into account appropriate factors such as yield, quality, coupon rate, maturity, type of issue, trading characteristics and other data, as well as broker quotes. Debt securities for which quotations are readily available may also be valued based upon an over-the-counter or exchange bid quotation.
Asset and mortgage-backed securities are generally valued by pricing services, which utilize pricing models that incorporate the securities' cash flow and loan performance data. These models also take into account available market data, including trades, market quotations, and benchmark yield curves for identical or similar securities. Factors used to identify similar securities may include, but are not limited to, issuer, collateral type, vintage, prepayment speeds, collateral performance, credit ratings, credit enhancement and expected life. Asset-backed securities for which quotations are readily available may also be valued based upon an over-the-counter or exchange bid quotation.
Investments in other open-end investment companies, including money market funds, are valued at net asset value.
Forward foreign currency exchange contracts are marked-to-market based upon foreign currency exchange rates provided by a pricing service.
Investments for which market quotations are not readily available, or that have quotations which management believes
Semiannual Report 2013
22
Columbia Absolute Return Currency and Income Fund
Notes to Financial Statements (continued)
April 30, 2013 (Unaudited)
are not reliable, are valued at fair value as determined in good faith under consistently applied procedures established by and under the general supervision of the Board. If a security or class of securities (such as foreign securities) is valued at fair value, such value is likely to be different from the last quoted market price for the security.
The determination of fair value often requires significant judgment. To determine fair value, management may use assumptions including but not limited to future cash flows and estimated risk premiums. Multiple inputs from various sources may be used to determine fair value.
Foreign Currency Transactions and Translations
The values of all assets and liabilities denominated in foreign currencies are translated into U.S. dollars at that day's exchange rates. Net realized and unrealized gains (losses) on foreign currency transactions and translations include gains (losses) arising from the fluctuation in exchange rates between trade and settlement dates on securities transactions, gains (losses) arising from the disposition of foreign currency and currency gains (losses) between the accrual and payment dates on dividends, interest income and foreign withholding taxes.
For financial statement purposes, the Fund does not distinguish that portion of gains (losses) on investments which is due to changes in foreign exchange rates from that which is due to changes in market prices of the investments. Such fluctuations are included with the net realized and unrealized gains (losses) on investments in the Statement of Operations.
Derivative Instruments
The Fund invests in certain derivative instruments, as detailed below, to meet its investment objectives. Derivatives are instruments whose values depend on, or are derived from, in whole or in part, the value of one or more other assets, such as securities, currencies, commodities or indices. Derivative instruments may be used to maintain cash reserves while maintaining exposure to certain other assets, to offset anticipated declines in values of investments, to facilitate trading, to reduce transaction costs and to pursue higher investment returns. The Fund may also use derivative instruments to mitigate certain investment risks, such as foreign currency exchange rate risk, interest rate risk and credit risk. Derivatives may involve various risks, including the potential inability of the counterparty to fulfill its obligation under the terms of the contract, the potential for an illiquid secondary market and the potential for market movements which may expose the Fund to gains or losses in excess of the amount shown in the Statement of Assets and Liabilities.
The Fund and any counterparty are required to maintain an agreement that requires the Fund and that counterparty to monitor (on a daily basis) the net fair value of all derivatives
entered into pursuant to the agreement between the Fund and such counterparty. If the net fair value of such derivatives between the Fund and that counterparty exceeds a certain threshold (as defined in the agreement), the Fund or the counterparty (as the case may be) is required to post cash and/or securities as collateral. Fair values of derivatives presented in the financial statements are not netted with the fair value of other derivatives or with any collateral amounts posted by the Fund or any counterparty.
Forward Foreign Currency Exchange Contracts
Forward foreign currency exchange contracts are agreements between two parties to buy and sell a currency at a set price on a future date. These contracts are intended to be used to minimize the exposure to foreign exchange rate fluctuations during the period between the trade and settlement dates of the contract. The Fund utilized forward foreign currency exchange contracts to shift foreign currency exposure back to U.S. dollars, to shift investment exposure from one currency to another, and to take long and short positions with the goal of generating gains for the Fund.
The values of forward foreign currency exchange contracts fluctuate with changes in foreign currency exchange rates. The Fund will record a realized gain or loss when the forward foreign currency exchange contract expires or is closed.
The use of forward foreign currency exchange contracts does not eliminate fluctuations in the prices of the Fund's portfolio securities. The risks of forward foreign currency exchange contracts include movement in the values of the foreign currencies relative to the U.S. dollar (or other foreign currencies) and the possibility that counterparties will not complete their contractual obligations, which may be in excess of the amount reflected, if any, in the Statement of Assets and Liabilities.
Effects of Derivative Transactions in the Financial Statements
The following tables are intended to provide additional information about the effect of derivatives on the financial statements of the Fund, including: the fair value of derivatives by risk category and the location of those fair values in the Statement of Assets and Liabilities; the impact of derivative transactions on the Fund's operations over the period including realized gains or losses and unrealized gains or losses. The derivative schedules following the Portfolio of Investments present additional information regarding derivative instruments outstanding at the end of the period, if any.
Semiannual Report 2013
23
Columbia Absolute Return Currency and Income Fund
Notes to Financial Statements (continued)
April 30, 2013 (Unaudited)
The following table is a summary of the fair value of derivative instruments at April 30, 2013:
Asset Derivatives | |
Risk Exposure
Category | | Statement of Assets and
Liabilities Location | | Fair Value ($) | |
Foreign exchange
contracts
| | Unrealized appreciation on
forward foreign currency
exchange contracts | | | 123,496
| | |
Liability Derivatives | |
Risk Exposure
Category | | Statement of Assets and
Liabilities Location | | Fair Value ($) | |
Foreign exchange
contracts
| | Unrealized depreciation on
forward foreign currency
exchange contracts | | | 349,231
| | |
The effect of derivative instruments in the Statement of Operations for the six months ended April 30, 2013:
Amount of Realized Gain (Loss) on Derivatives Recognized in Income | |
| Risk Exposure Category | | Forward Foreign Currency
Exchange Contracts ($) | |
Foreign exchange contracts | | | 1,471,956 | | |
Change in Unrealized Appreciation (Depreciation) on
Derivatives Recognized in Income | |
| Risk Exposure Category | | Forward Foreign Currency
Exchange Contracts ($) | |
Foreign exchange contracts | | | (269,291 | ) | |
The following table is a summary of the volume of derivative instruments for the six months ended April 30, 2013:
Derivative Instrument | | Contracts Opened | |
Forward foreign currency exchange contracts | | | 166 | | |
Security Transactions
Security transactions are accounted for on the trade date. Cost is determined and gains (losses) are based upon the specific identification method for both financial statement and federal income tax purposes.
Income Recognition
Interest income is recorded on an accrual basis. Market premiums and discounts, including original issue discounts, are amortized and accreted, respectively, over the expected life of the security on all debt securities, unless otherwise noted.
Expenses
General expenses of the Trust are allocated to the Fund and other funds of the Trust based upon relative net assets or other expense allocation methodologies determined by the nature of the expense. Expenses directly attributable to the Fund are
charged to the Fund. Expenses directly attributable to a specific class of shares are charged to that share class.
Determination of Class Net Asset Value
All income, expenses (other than class-specific expenses, which are charged to that share class, as shown in the Statement of Operations) and realized and unrealized gains (losses) are allocated to each class of the Fund on a daily basis, based on the relative net assets of each class, for purposes of determining the net asset value of each class.
Federal Income Tax Status
The Fund intends to qualify each year as a regulated investment company under Subchapter M of the Internal Revenue Code, as amended, and will distribute substantially all of its taxable income (including net short-term capital gains), if any, for its tax year, and as such will not be subject to federal income taxes. In addition, the Fund intends to distribute in each calendar year substantially all of its net investment income, capital gains and certain other amounts, if any, such that the Fund should not be subject to federal excise tax. Therefore, no federal income or excise tax provision is recorded.
Foreign Taxes
The Fund may be subject to foreign taxes on income, gains on investments or currency repatriation, a portion of which may be recoverable. The Fund will accrue such taxes and recoveries, as applicable, based upon its current interpretation of tax rules and regulations that exist in the markets in which it invests.
Realized gains in certain countries may be subject to foreign taxes at the Fund level, based on statutory rates. The Fund accrues for such foreign taxes on net realized and unrealized gains at the appropriate rate for each jurisdiction, as applicable. The amount, if any, is disclosed as a liability on the Statement of Assets and Liabilities.
Distributions to Shareholders
Distributions from net investment income, if any, are declared and paid monthly. Net realized capital gains, if any, are distributed at least annually. Income distributions and capital gain distributions are determined in accordance with federal income tax regulations, which may differ from GAAP.
Guarantees and Indemnifications
Under the Trust's organizational documents and, in some cases, by contract, its officers and trustees are indemnified against certain liabilities arising out of the performance of their duties to the Trust or its funds. In addition, certain of the Fund's contracts with its service providers contain general
Semiannual Report 2013
24
Columbia Absolute Return Currency and Income Fund
Notes to Financial Statements (continued)
April 30, 2013 (Unaudited)
indemnification clauses. The Fund's maximum exposure under these arrangements is unknown since the amount of any future claims that may be made against the Fund cannot be determined, and the Fund has no historical basis for predicting the likelihood of any such claims.
Recent Accounting Pronouncement
Disclosures about Offsetting Assets and Liabilities
In December 2011, the Financial Accounting Standards Board (FASB) issued Accounting Standards Update (ASU) No. 2011-11, Disclosures about Offsetting Assets and Liabilities and in January 2013, ASU No. 2013-1, Clarifying the Scope of Disclosures about Offsetting Assets and Liabilities (collectively, the ASUs). Specifically, the ASUs require an entity to disclose both gross and net information for derivatives and other financial instruments that are subject to a master netting arrangement or similar agreement. The ASUs require disclosure of collateral received in connection with the master netting agreements or similar agreements. The disclosure requirements are effective for interim and annual periods beginning on or after January 1, 2013. At this time, management is evaluating the implications of this guidance and the impact it will have on the financial statement amounts and footnote disclosures, if any.
Note 3. Fees and Compensation Paid to Affiliates
Investment Management Fees
Under an Investment Management Services Agreement, Columbia Management Investment Advisers, LLC (the Investment Manager), a wholly-owned subsidiary of Ameriprise Financial, Inc. (Ameriprise Financial), determines which securities will be purchased, held or sold. The investment management fee is an annual fee that is equal to a percentage of the Fund's average daily net assets that declines from 0.89% to 0.70% as the Fund's net assets increase. The annualized effective investment management fee rate for the six months ended April 30, 2013 was 0.89% of the Fund's average daily net assets.
Administration Fees
Under an Administrative Services Agreement, the Investment Manager also serves as the Fund Administrator. The Fund pays the Fund Administrator an annual fee for administration and accounting services equal to a percentage of the Fund's average daily net assets that declines from 0.08% to 0.05% as the Fund's net assets increase. The annualized effective administration fee rate for the six months ended April 30, 2013 was 0.08% of the Fund's average daily net assets.
Other Expenses
Other expenses are for, among other things, certain expenses of the Fund or the Board, including: Fund boardroom and office expense, employee compensation, employee health and retirement benefits, and certain other expenses. Payment of these Fund and Board expenses is facilitated by a company providing limited administrative services to the Fund and the Board. For the six months ended April 30, 2013, other expenses paid to this company were $603.
Compensation of Board Members
Board members are compensated for their services to the Fund as disclosed in the Statement of Operations. Under a Deferred Compensation Plan (the Plan), the Board members who are not "interested persons" of the Fund, as defined under the 1940 Act, may elect to defer payment of up to 100% of their compensation. Deferred amounts are treated as though equivalent dollar amounts had been invested in shares of certain funds managed by the Investment Manager. The Fund's liability for these amounts is adjusted for market value changes and remains in the Fund until distributed in accordance with the Plan.
Transfer Agent Fees
Under a Transfer and Dividend Disbursing Agent Agreement, Columbia Management Investment Services Corp. (the Transfer Agent), an affiliate of the Investment Manager and a wholly-owned subsidiary of Ameriprise Financial, is responsible for providing transfer agency services to the Fund. The Transfer Agent has contracted with Boston Financial Data Services (BFDS) to serve as sub-transfer agent.
The Transfer Agent receives monthly account-based service fees based on the number of open accounts and also receives sub-transfer agency fees based on a percentage of the average aggregate value of the Fund's shares maintained in omnibus accounts (other than omnibus accounts for which American Enterprise Investment Services Inc. is the broker of record or accounts where the beneficial shareholder is a customer of Ameriprise Financial Services, Inc., which are paid a per account fee). The Transfer Agent pays the fees of BFDS for services as sub-transfer agent and is not entitled to reimbursement for such fees from the Fund (with the exception of out-of-pocket fees).
The Transfer Agent also receives compensation from fees for various shareholder services and reimbursements for certain out-of-pocket fees. Class I shares do not pay transfer agent fees. Beginning February 28, 2013, Class Y shares are not subject to transfer agent fees for at least twelve months.
Semiannual Report 2013
25
Columbia Absolute Return Currency and Income Fund
Notes to Financial Statements (continued)
April 30, 2013 (Unaudited)
For the six months ended April 30, 2013, the Fund's annualized effective transfer agent fee rates as a percentage of average daily net assets of each class were as follows:
Class A | | | 0.41 | % | |
Class B | | | 0.42 | | |
Class C | | | 0.41 | | |
Class R4* | | | 0.02 | | |
Class W | | | 0.45 | | |
Class Z | | | 0.41 | | |
*Annualized.
An annual minimum account balance fee of $20 may apply to certain accounts with a value below the Fund's initial minimum investment requirements to reduce the impact of small accounts on transfer agent fees. These minimum account balance fees are recorded as part of expense reductions in the Statement of Operations. For the six months ended April 30, 2013, no minimum account balance fees were charged by the Fund.
Distribution Fees
The Fund has an agreement with Columbia Management Investment Distributors, Inc. (the Distributor), an affiliate of the Investment Manager and a wholly-owned subsidiary of Ameriprise Financial, for distribution and shareholder services. Under a Plan and Agreement of Distribution pursuant to Rule 12b-1, the Fund pays a fee at an annual rate of up to 0.25% of the Fund's average daily net assets attributable to Class A and Class W shares and a fee at an annual rate of up to 1.00% of the Fund's average daily net assets attributable to Class B and Class C shares. For Class B and Class C shares, of the 1.00% fee, up to 0.75% is reimbursed for distribution expenses.
The amount of distribution expenses incurred by the Distributor and not yet reimbursed (unreimbursed expense) was approximately $47,000 and $31,000 for Class B and Class C shares, respectively. These amounts are based on the most recent information available as of March 31, 2013, and may be recovered from future payments under the distribution plan or CDSCs. To the extent the unreimbursed expense has been fully recovered, the distribution fee is reduced.
Sales Charges
Sales charges, including front-end charges and CDSCs, received by the Distributor for distributing Fund shares were $12,534 for Class A and $240 for Class C shares for the six months ended April 30, 2013.
Expenses Waived/Reimbursed by the Investment Manager and its Affiliates
The Investment Manager and certain of its affiliates have contractually agreed to waive fees and/or reimburse expenses (excluding certain fees and expenses described below) for the periods disclosed below, unless sooner terminated at the sole discretion of the Board, so that the Fund's net operating expenses, after giving effect to fees waived/expenses reimbursed and any balance credits and/or overdraft charges from the Fund's custodian, do not exceed the following annual rates as a percentage of the class' average daily net assets:
| | | March 1, 2013
through
February 28, 2014 | | Prior to
March 1, 2013 | |
Class A | | | 1.69 | % | | | 1.32 | % | |
Class B | | | 2.44 | | | | 2.07 | | |
Class C | | | 2.44 | | | | 2.07 | | |
Class I | | | 1.24 | | | | 0.87 | | |
Class R4 | | | 1.44 | * | | | — | | |
Class W | | | 1.69 | | | | 1.32 | | |
Class Y | | | 1.24 | | | | — | | |
Class Z | | | 1.44 | | | | 1.07 | | |
*Annual rate is contractual from March 19, 2013 (the commencement of operations of Class R4 shares) through February 28, 2014.
Under the agreement governing these fee waivers and/or expense reimbursement arrangements, the following fees and expenses are excluded from the waiver/reimbursement commitment, and therefore will be paid by the Fund, if applicable: taxes (including foreign transaction taxes), expenses associated with investments in affiliated and non-affiliated pooled investment vehicles (including mutual funds and exchange traded funds), transaction costs and brokerage commissions, costs related to any securities lending program, dividend expenses associated with securities sold short, inverse floater program fees and expenses, transaction charges and interest on borrowed money, interest, extraordinary expenses and any other expenses the exclusion of which is specifically approved by the Board. This agreement may be modified or amended only with approval from all parties.
Note 4. Federal Tax Information
The timing and character of income and capital gain distributions are determined in accordance with income tax regulations, which may differ from GAAP because of temporary or permanent book to tax differences.
At April 30, 2013, the cost of investments for federal income tax purposes was approximately $89,865,000 and the
Semiannual Report 2013
26
Columbia Absolute Return Currency and Income Fund
Notes to Financial Statements (continued)
April 30, 2013 (Unaudited)
aggregate gross approximate unrealized appreciation and depreciation based on that cost was:
Unrealized appreciation | | $ | 52,000 | | |
Unrealized depreciation | | | (89,000 | ) | |
Net unrealized depreciation | | $ | (37,000 | ) | |
Under current tax rules, regulated investment companies can elect to treat certain late-year ordinary losses incurred and post-October capital losses (capital losses realized after October 31) as arising on the first day of the following taxable year. The Fund has elected to treat late year ordinary losses of $782,430 at October 31, 2012 as arising on November 1, 2012.
Management of the Fund has concluded that there are no significant uncertain tax positions that would require recognition in the financial statements. However, management's conclusion may be subject to review and adjustment at a later date based on factors including, but not limited to, new tax laws, regulations, and administrative interpretations (including relevant court decisions). Generally, the Fund's federal tax returns for the prior three fiscal years remain subject to examination by the Internal Revenue Service.
Note 5. Portfolio Information
The cost of purchases and proceeds from sales of securities, excluding short-term obligations, aggregated to $0 and $415,497, respectively, for the six months ended April 30, 2013
Note 6. Affiliated Money Market Fund
The Fund significantly invests in Columbia Short-Term Cash Fund, an affiliated money market fund established for the exclusive use by the Fund and other affiliated funds. The income earned by the Fund from such investments is included as "Dividends — affiliated issuers" in the Statement of Operations. As an investing fund, the Fund indirectly bears its proportionate share of the expenses of Columbia Short-Term Cash Fund.
Note 7. Shareholder Concentration
At April 30, 2013, one unaffiliated shareholder account owned 15.6% of the outstanding shares of the Fund. The Fund has no knowledge about whether any portion of those shares was owned beneficially by such account. Affiliated shareholder accounts owned 58.3% of the outstanding shares of the Fund. Subscription and redemption activity by concentrated accounts may have a significant effect on the operations of the Fund.
Note 8. Line of Credit
The Fund has entered into a revolving credit facility with a syndicate of banks led by JPMorgan Chase Bank N.A.
whereby the Fund may borrow for the temporary funding of shareholder redemptions or for other temporary or emergency purposes. The credit facility agreement, as amended, which is a collective agreement between the Fund and certain other funds managed by the Investment Manager, severally and not jointly, permits collective borrowings up to $500 million. Interest is charged to each participating fund based on its borrowings at a rate equal to the higher of (i) the overnight federal funds rate plus 1.00% or (ii) the one-month LIBOR rate plus 1.00%. Each borrowing under the credit facility matures no later than 60 days after the date of borrowing. The Fund also pays a commitment fee equal to its pro rata share of the amount of the credit facility at a rate of 0.08% per annum.
The Fund had no borrowings during the six months ended April 30, 2013.
Note 9. Significant Risks
Foreign Currency Risk
The Fund's exposure to foreign currencies subjects the Fund to constantly changing exchange rates and the risk that those currencies will decline in value relative to the U.S. dollar, or, in the case of short positions, that the U.S. dollar will decline in value relative to the currency being sold forward. Currency rates in foreign countries may fluctuate significantly over short periods of time for a number of reasons, including changes in interest rates and economic or political developments in U.S. or abroad. As a result, the Fund's exposure to foreign currencies may reduce the returns of the Fund. Trading of foreign currencies also includes the risk of clearing and settling trades which, if prices are volatile, may be difficult.
Geographic Concentration Risk
The Fund may be particularly susceptible to economic, political, regulatory or other events or conditions affecting issuers and countries within the specific geographic regions in which the Fund invests. Currency devaluation could occur in countries that have not yet experienced currency devaluation to date, or could continue to occur in countries that have already experienced such devaluations. As a result, the Fund may be more volatile than a more geographically diversified fund.
Counterparty Risk
Counterparty risk is the risk that a counterparty to a financial instrument entered into by the Fund or held by a special purpose or structured vehicle becomes bankrupt or otherwise fails to perform its obligations due to financial difficulties. The Fund may experience significant delays in obtaining any recovery in a bankruptcy or other reorganization proceeding. The Fund may obtain only limited recovery or may obtain no
Semiannual Report 2013
27
Columbia Absolute Return Currency and Income Fund
Notes to Financial Statements (continued)
April 30, 2013 (Unaudited)
recovery in such circumstances. The Fund will typically enter into financial instrument transactions with counterparties whose credit rating is investment grade, or, if unrated, determined to be of comparable quality by the Investment Manager.
Derivatives Risk
Losses involving derivative instruments may be substantial, because a relatively small price movement in the underlying security(ies), instrument, commodity, currency or index may result in a substantial loss for the Fund. In addition to the potential for increased losses, the use of derivative instruments may lead to increased volatility within the Fund. Derivatives will typically increase the Fund's exposure to principal risks to which it is otherwise exposed, and may expose the Fund to additional risks, including correlation risk, counterparty risk, hedging risk, leverage risk and liquidity risk.
Note 10. Subsequent Events
Management has evaluated the events and transactions that have occurred through the date the financial statements were issued and noted no items requiring adjustment of the financial statements or additional disclosure.
Note 11. Information Regarding Pending and Settled Legal Proceedings
In December 2005, without admitting or denying the allegations, American Express Financial Corporation (AEFC, which is now known as Ameriprise Financial, Inc. (Ameriprise Financial)) entered into settlement agreements with the Securities and Exchange Commission (SEC) and Minnesota Department of Commerce (MDOC) related to market timing activities. As a result, AEFC was censured and ordered to cease and desist from committing or causing any violations of certain provisions of the Investment Advisers Act of 1940, the Investment Company Act of 1940, and various Minnesota laws. AEFC agreed to pay disgorgement of $10 million and civil money penalties of $7 million. AEFC also agreed to retain an independent distribution consultant to assist in developing a plan for distribution of all disgorgement and civil penalties ordered by the SEC in accordance with various undertakings detailed at www.sec.gov/litigation/admin/ia-2451.pdf. Ameriprise Financial and its affiliates have cooperated with the SEC and the MDOC in these legal proceedings, and have made regular reports to the funds' Boards of Trustees.
Ameriprise Financial and certain of its affiliates have historically been involved in a number of legal, arbitration and regulatory proceedings, including routine litigation, class actions, and governmental actions, concerning matters arising in connection with the conduct of their business activities.
Ameriprise Financial believes that the Funds are not currently the subject of, and that neither Ameriprise Financial nor any of its affiliates are the subject of, any pending legal, arbitration or regulatory proceedings that are likely to have a material adverse effect on the Funds or the ability of Ameriprise Financial or its affiliates to perform under their contracts with the Funds. Ameriprise Financial is required to make 10-Q, 10-K and, as necessary, 8-K filings with the Securities and Exchange Commission on legal and regulatory matters that relate to Ameriprise Financial and its affiliates. Copies of these filings may be obtained by accessing the SEC website at www.sec.gov.
There can be no assurance that these matters, or the adverse publicity associated with them, will not result in increased fund redemptions, reduced sale of fund shares or other adverse consequences to the Funds. Further, although we believe proceedings are not likely to have a material adverse effect on the Funds or the ability of Ameriprise Financial or its affiliates to perform under their contracts with the Funds, these proceedings are subject to uncertainties and, as such, we are unable to estimate the possible loss or range of loss that may result. An adverse outcome in one or more of these proceedings could result in adverse judgments, settlements, fines, penalties or other relief that could have a material adverse effect on the consolidated financial condition or results of operations of Ameriprise Financial.
Semiannual Report 2013
28
Columbia Absolute Return Currency and Income Fund
Approval of Investment Management Services Agreement
Columbia Management Investment Advisers, LLC (Columbia Management or the Investment Manager), a wholly-owned subsidiary of Ameriprise Financial, Inc. (Ameriprise Financial), serves as the investment manager to Columbia Absolute Return Currency and Income Fund (the Fund). Under an investment management services agreement (the IMS Agreement), Columbia Management provides investment advice and other services to the Fund and other funds distributed by Columbia Management Investment Distributors, Inc. (collectively, the Funds).
On an annual basis, the Fund's Board of Trustees (the Board), including the independent Board members (the Independent Trustees), considers renewal of the IMS Agreement. Columbia Management prepared detailed reports for the Board and its Contracts Committee in January, March and April 2013, including reports based on analyses of data provided by an independent organization and a comprehensive response to each item of information requested by independent legal counsel to the Independent Trustees (Independent Legal Counsel) in a letter to the Investment Manager, to assist the Board in making this determination. All of the materials presented in January, March and April were first supplied in draft form to designated representatives of the Independent Trustees, i.e., Independent Legal Counsel, the Chair of the Board and the Chair of the Contracts Committee, and the final materials (including proposed additional breakpoints in IMS fees for certain Funds) were revised to reflect discussion and subsequent requests made by the Contracts Committee. In addition, throughout the year, the Board (or its committees) regularly meets with portfolio management teams and senior management personnel, and reviews information prepared by Columbia Management addressing the services Columbia Management provides and Fund performance. Further, the Board retained an independent consulting firm (the Independent Consultant) to assist the Independent Trustees in their review of IMS fees, expense caps and Ameriprise Financial's profitability. The Board also accords particular weight to the work, deliberations and conclusions of the Contracts Committee, the Investment Review Committee and the Compliance Committee in determining whether to continue the IMS Agreement.
The Board, at its April 15-17, 2013 in-person Board meeting (the April Meeting), considered the renewal of the IMS Agreement for an additional one-year term. At the April Meeting, Independent Legal Counsel reviewed with the Independent Trustees various factors relevant to the Board's consideration of advisory agreements and the Board's legal responsibilities related to such consideration. Following an analysis and discussion of the factors identified below, the Board, including all of the Independent Trustees, approved the renewal of the IMS Agreement.
Nature, Extent and Quality of Services Provided by Columbia Management
The Independent Trustees analyzed various reports and presentations they had received detailing the services performed by Columbia Management, as well as its expertise, resources and capabilities. The Independent Trustees specifically considered many developments during the past year concerning the services provided by Columbia Management, including, in particular, the recent globalization initiative, which fosters increased worldwide investment support of global products, continued investment in upgrading technology (such as the implementation of new systems and hardware), the hiring of a Chief Interest Rate Strategist as part of Columbia Management's fixed income team and the addition of Columbia Management investment personnel to the Asset Allocation, Quantitative and Technology teams. The Independent Trustees noted the information they received concerning Columbia Management's ability to retain its key portfolio management personnel. In this regard, the Independent Trustees took into account their comprehensive discussions with Columbia Management's Chief Investment Officer (the CIO), observing the organizational depth of Columbia Management and the capabilities of its investment personnel. The Independent Trustees also recalled the information the CIO provided them identifying the strengths and areas for enhancement of each Columbia Management investment team, as well as the discussion with the CIO regarding the investment personnel talent being infused to enhance support for certain Funds. The Independent Trustees also observed the materials demonstrating the strength and depth of Columbia Management's equity and fixed income research departments.
In connection with the Board's evaluation of the overall package of services provided by Columbia Management, the Board also considered the quality of administrative services provided to the Fund by Columbia Management, recalling the information it received highlighting significant achievements in 2012 in the performance of administrative services (such as strong accounting performance measures, refined derivatives processing and enhancements to the electronic communications under the affiliated and unaffiliated service provider oversight program). In evaluating the quality of services provided under the IMS Agreement and the Fund's Administrative Service Agreement, the Independent Trustees also took into account the organization and strength of the Fund's and its service providers' compliance programs. In addition, the Board also reviewed the financial condition of Columbia Management (and its affiliates) and each entity's ability to carry out its responsibilities under the IMS Agreement and the Fund's other services agreements with affiliates of Ameriprise Financial, observing the financial strength of Ameriprise Financial, with its solid balance sheet. The Board also discussed the acceptability of the terms of the IMS Agreement (including
Semiannual Report 2013
29
Columbia Absolute Return Currency and Income Fund
Approval of Investment Management Services Agreement (continued)
the relatively broad scope of services required to be performed by Columbia Management). The Board concluded that the services being performed under the IMS Agreement were of a reasonably high quality.
Based on the foregoing, and based on other information received (both oral and written, including the information on investment performance referenced below) and other considerations, the Board concluded that Columbia Management and its affiliates were in a position to continue to provide a high quality and level of services to the Fund.
Investment Performance
For purposes of evaluating the nature, extent and quality of services provided under the IMS Agreement, the Board carefully reviewed the investment performance of the Fund. In this regard, the Board considered detailed reports providing the results of analyses performed by an independent organization showing, for various periods, the performance of the Fund, the performance of a benchmark index, the percentage ranking of the Fund among its comparison group and the net assets of the Fund. The Board observed that the Fund's investment performance was appropriate in light of the particular management style involved and the particular market environment.
Comparative Fees, Costs of Services Provided and the Profits Realized By Columbia Management and its Affiliates from their Relationships with the Fund
The Board reviewed comparative fees and the costs of services to be provided under the IMS Agreement. The Board members considered detailed comparative information set forth in an annual report on fees and expenses, including, among other things, data (based on analyses conducted by an independent organization) showing a comparison of the Fund's expenses with median expenses paid by funds in its comparative peer universe, as well as data showing the Fund's contribution to Columbia Management's profitability.
The Board accorded particular weight to the notion that the level of fees should reflect a rational pricing model applied consistently across the various product lines in the Fund family, while assuring that the overall fees for each Fund (with few defined exceptions) are generally in line with the "pricing philosophy" (i.e., that the total expense ratio of the Fund is no higher than the median expense ratio of funds in the same comparison universe of the Fund). In this connection, the Board also considered the Independent Consultant's report that concluded that: the Funds' expense cap philosophy of assuring that each Fund's total expense ratio is not above its peer universe median ratio is reasonable. The Board took into account that the Fund's total expense ratio (after considering proposed expense caps/waivers) approximated the peer universe's median expense ratio. Based on its review, the Board concluded that the Fund's management fee was fair and reasonable in light of the extent and quality of services that the Fund receives.
The Board also considered the expected profitability of Columbia Management and its affiliates in connection with Columbia Management providing investment management services to the Fund. In this regard, the Board referred to a detailed profitability report, discussing the profitability to Columbia Management and Ameriprise Financial from managing, operating and distributing the Funds. In this regard, the Board observed that 2012 profitability approximates 2011 profitability and that, as was the case in 2011, 2012 profitability remained generally in line with (and, in many cases, lower than) the reported profitability of other asset management firms. Further, the Board considered the Independent Consultant's report that concluded that Columbia Management's profitability, particularly in comparison to industry competitors, was reasonable and not excessive. It also took into account the indirect economic benefits flowing to Columbia Management or its affiliates in connection with managing or distributing the Funds, such as the enhanced ability to offer various other financial products to Ameriprise Financial customers, soft dollar benefits and overall reputational advantages. The Board noted that the fees paid by the Funds should permit the Investment Manager to offer competitive compensation to its personnel, make necessary investments in its business and earn an appropriate profit. The Board concluded that profitability levels were reasonable.
Economies of Scale to be Realized
The Board also considered the economies of scale that might be realized by Columbia Management as the Fund grows and took note of the extent to which Fund shareholders might also benefit from such growth. In this regard, the Independent Trustees took into account that IMS fees decline as Fund assets exceed various breakpoints, all of which have not been surpassed.
Based on the foregoing, the Board, including all of the Independent Trustees, concluded that the investment management service fees were fair and reasonable in light of the extent and quality of services provided. In reaching this conclusion, no single factor was determinative. On April 17, 2013, the Board, including all of the Independent Trustees, approved the renewal of the IMS Agreement.
Semiannual Report 2013
30
Columbia Absolute Return Currency and Income Fund
Shareholder Meeting Results
(Unaudited)
Special Meeting of Shareholders held on February 27, 2013
At a Joint Special Meeting of Shareholders held on February 27, 2013 (the "Meeting"), shareholders of the Fund approved a proposal to modify the Fund's fundamental policy regarding concentration by removing an exception in the policy for investment in banks or bank holding companies and finance companies. The votes cast for or against as well as the number of abstentions and broker non-votes as to the proposal are set forth below. A vote is based on total dollar interest in the Fund as of the record date of the Meeting.
| Votes For | | Votes Against | | Abstentions | | Broker Non-Votes | |
| | 6,767,404 | | | | 135,257 | | | | 175,511 | | | | 0 | | |
Semiannual Report 2013
31
This page intentionally left blank.
Semiannual Report 2013
32
Columbia Absolute Return Currency and Income Fund
Important Information About This Report
Each fund mails one shareholder report to each shareholder address. If you would like more than one report, please call shareholder services at 800.345.6611 and additional reports will be sent to you.
The policy of the Board is to vote the proxies of the companies in which each fund holds investments consistent with the procedures as stated in the Statement of Additional Information (SAI). You may obtain a copy of the SAI without charge by calling 800.345.6611; contacting your financial intermediary; visiting columbiamanagement.com; or searching the website of the Securities and Exchange Commission (SEC) at sec.gov. Information regarding how each fund voted proxies relating to portfolio securities is filed with the SEC by August 31 for the most recent 12-month period ending June 30 of that year, and is available without charge by visiting columbiamanagement.com; or searching the website of the SEC at sec.gov.
Each fund files a complete schedule of portfolio holdings with the SEC for the first and third quarters of each fiscal year on Form N-Q. Each fund's Form N-Q is available on the SEC's website at sec.gov and may be reviewed and copied at the SEC's Public Reference Room in Washington, D.C. Information on the operation of the Public Reference Room may be obtained by calling 800.SEC.0330. Each fund's complete schedule of portfolio holdings, as filed on Form N-Q, can also be obtained without charge, upon request, by calling 800.345.6611.
Semiannual Report 2013
33

Columbia Absolute Return Currency and Income Fund
P.O. Box 8081
Boston, MA 02266-8081
columbiamanagement.com
This information is for use with concurrent or prior delivery of a fund prospectus. Please read and consider the investment objectives, risks, charges and expenses for any fund carefully before investing. For a prospectus which contains this and other important information about the Fund go to columbiamanagement.com. The Fund is distributed by Columbia Management Investment Distributors, Inc., member FINRA, and managed by Columbia Management Investment Advisers, LLC.
© 2013 Columbia Management Investment Advisers, LLC. All rights reserved.
SAR104_10_C01_(06/13)
Semiannual Report
April 30, 2013

Columbia Emerging Markets Bond Fund
Not FDIC insured • No bank guarantee • May lose value
Columbia Emerging Markets Bond Fund
 Dear Shareholders,
U.S. equities had a strong first quarter
Similar to 2012, equities once again were the best performing asset class in the first quarter of 2013. The S&P 500 Index reached an all-time closing high on the last trading day of the quarter and pushed through its October 2007 peak. Although global equities have performed well year-to-date, there is significant performance divergence among regions. In local currency terms, Japanese equities were the best performing developed market globally, and U.S. stocks outperformed most other global equity markets. European equities rose in the first quarter but trailed U.S. stocks and had a turbulent March, as investors were reminded of instability in the eurozone with news of a banking crisis in Cyprus.
Although all 10 sectors of the S&P 500 Index delivered positive returns, this was a rally led by defensive stocks such as those in health care, consumer staples and utilities. Materials and technology stocks were the weakest sectors.
High yield leads fixed income; most sectors flat to down
The fixed-income markets lagged equities with modest, single-digit returns coming from municipals and high-yield sectors in the United States. Most government and investment-grade credit sectors were roughly flat to down for the first quarter of 2013. Emerging market bonds were the biggest disappointment with single-digit losses.
Columbia Management to begin delivering summary prospectuses
Each Columbia fund is required to update its prospectus on an annual basis. Beginning with June 2013 prospectus updates, shareholders of Columbia retail mutual funds will start to receive a summary prospectus, rather than the full length (statutory) mutual fund prospectus they have received in the past.
Each fund's summary prospectus will include the following key information:
> Investment objective
> Fee and expense table
> Portfolio turnover rate information
> Principal investment strategies, principal risks and performance information
> Management information
> Purchase and sale information
> Tax information
> Financial intermediary compensation information
Each fund's statutory prospectus will contain additional information about the fund and its risks. Both the statutory and summary prospectus will be updated each year, and will be available at columbiamanagement.com. Shareholders may request a printed version of a statutory prospectus at no cost by calling 800.345.6611 or sending an email to serviceinquiries@columbiamanagement.com.
Stay on track with Columbia Management
Backed by more than 100 years of experience, Columbia Management is one of the nation's largest asset managers. At the heart of our success — and, most importantly, that of our investors — are highly talented industry professionals, brought together by a unique way of working. We are dedicated to helping you take advantage of today's opportunities and anticipate tomorrow's. We stay abreast of the latest investment trends and ideas, using our collective insight to evaluate events and transform them into solutions you can use.
Visit columbiamanagement.com for:
> The Columbia Management Perspectives blog, featuring timely posts by our investment teams
> Detailed up-to-date fund performance and portfolio information
> Economic analysis and market commentary
> Quarterly fund commentaries
> Columbia Management Investor, our award-winning quarterly newsletter for shareholders
Thank you for your continued support of the Columbia Funds. We look forward to serving your investment needs for many years to come.
Best Regards,

J. Kevin Connaughton
President, Columbia Funds
The S&P 500 Index, an unmanaged index, measures the performance of 500 large-capitalization U.S. stocks and is frequently used as a general measure of market performance. Indices are not available for investment, are not professionally managed and do not reflect sales charges, fees, brokerage commissions, taxes or other expenses of investing.
Investors should consider the investment objectives, risks, charges and expenses of a mutual fund carefully before investing. For a free prospectus, which contains this and other important information about a fund, visit columbiamanagement.com. The prospectus should be read carefully before investing.
Columbia Funds are distributed by Columbia Management Investment Distributors, Inc., member FINRA, and managed by Columbia Management Investment Advisers, LLC.
© 2013 Columbia Management Investment Advisers, LLC. All rights reserved.
Columbia Emerging Markets Bond Fund
Performance Overview | | | 2 | | |
Portfolio Overview | | | 3 | | |
Understanding Your Fund's Expenses | | | 5 | | |
Portfolio of Investments | | | 6 | | |
Statement of Assets and Liabilities | | | 15 | | |
Statement of Operations | | | 17 | | |
Statement of Changes in Net Assets | | | 18 | | |
Financial Highlights | | | 21 | | |
Notes to Financial Statements | | | 32 | | |
Approval of Investment Management Services Agreement | | | 41 | | |
Important Information About This Report | | | 45 | | |
Fund Investment Manager
Columbia Management Investment
Advisers, LLC
225 Franklin Street
Boston, MA 02110
Fund Distributor
Columbia Management Investment
Distributors, Inc.
225 Franklin Street
Boston, MA 02110
Fund Transfer Agent
Columbia Management Investment
Services Corp.
P.O. Box 8081
Boston, MA 02266-8081
For more information about any of the funds, please visit columbiamanagement.com or call 800.345.6611. Customer Service Representatives are available to answer your questions Monday through Friday from 8 a.m. to 8 p.m. Eastern time.
The views expressed in this report reflect the current views of the respective parties. These views are not guarantees of future performance and involve certain risks, uncertainties and assumptions that are difficult to predict, so actual outcomes and results may differ significantly from the views expressed. These views are subject to change at any time based upon economic, market or other conditions and the respective parties disclaim any responsibility to update such views. These views may not be relied on as investment advice and, because investment decisions for a Columbia Fund are based on numerous factors, may not be relied on as an indication of trading intent on behalf of any particular Columbia Fund. References to specific securities should not be construed as a recommendation or investment advice.
Columbia Emerging Markets Bond Fund
Performance Overview
(Unaudited)
Performance Summary
> Columbia Emerging Markets Bond Fund (the Fund) Class A shares returned 4.89% excluding sales charges for the six months ended April 30, 2013.
> The Fund outperformed its benchmark, the JPMorgan Emerging Markets Bond Index (EMBI) — Global, which returned 2.97% for the same period.
Average Annual Total Returns (%) (for period ended April 30, 2013)
| | Inception | | 6 Months
cumulative | | 1 Year | | 5 Years | | Life | |
Class A | | 02/16/06 | | | | | | | | | |
Excluding sales charges | | | | | 4.89 | | | | 13.66 | | | | 11.19 | | | | 9.80 | | |
Including sales charges | | | | | -0.06 | | | | 8.26 | | | | 10.12 | | | | 9.06 | | |
Class B | | 02/16/06 | | | | | | | | | |
Excluding sales charges | | | | | 4.42 | | | | 12.75 | | | | 10.33 | | | | 8.96 | | |
Including sales charges | | | | | -0.58 | | | | 7.75 | | | | 10.06 | | | | 8.96 | | |
Class C | | 02/16/06 | | | | | | | | | |
Excluding sales charges | | | | | 4.46 | | | | 12.71 | | | | 10.35 | | | | 8.97 | | |
Including sales charges | | | | | 3.46 | | | | 11.71 | | | | 10.35 | | | | 8.97 | | |
Class I | | 02/16/06 | | | 5.13 | | | | 14.11 | | | | 11.68 | | | | 10.26 | | |
Class K | | 02/16/06 | | | 4.89 | | | | 13.74 | | | | 11.35 | | | | 10.00 | | |
Class R* | | 11/16/11 | | | 4.76 | | | | 13.28 | | | | 10.99 | | | | 9.62 | | |
Class R4* | | 03/19/13 | | | 4.87 | | | | 13.64 | | | | 11.18 | | | | 9.80 | | |
Class R5* | | 11/08/12 | | | 5.02 | | | | 13.80 | | | | 11.21 | | | | 9.82 | | |
Class W* | | 12/01/06 | | | 4.89 | | | | 13.59 | | | | 11.15 | | | | 9.76 | | |
Class Y* | | 11/08/12 | | | 5.13 | | | | 13.92 | | | | 11.24 | | | | 9.83 | | |
Class Z* | | 09/27/10 | | | 5.02 | | | | 13.84 | | | | 11.37 | | | | 9.92 | | |
JPMorgan Emerging Markets Bond Index-Global | | | | | 2.97 | | | | 11.60 | | | | 10.21 | | | | 9.21 | | |
Returns for Class A are shown with and without the maximum initial sales charge of 4.75% Returns for Class B are shown with and without the applicable contingent deferred sales charge (CDSC) of 5.00% in the first year, declining to 1.00% in the sixth year and eliminated thereafter. Returns for Class C are shown with and without the 1.00% CDSC for the first year only. The Fund's other classes are not subject to sales charges and have limited eligibility. Please see the Fund's prospectus for details. Performance for different share classes will vary based on differences in sales charges and fees associated with each class. All results shown assume reinvestment of distributions during the period. Returns do not reflect the deduction of taxes that a shareholder may pay on Fund distributions or on the redemption of Fund shares. Performance results reflect the effect of any fee waivers or reimbursements of Fund expenses by Columbia Management Investment Advisers, LLC and/or any of its affiliates. Absent these fee waivers or expense reimbursement arrangements, performance results would have been lower.
The performance information shown represents past performance and is not a guarantee of future results. The investment return and principal value of your investment will fluctuate so that your shares, when redeemed, may be worth more or less than their original cost. Current performance may be lower or higher than the performance information shown. You may obtain performance information current to the most recent month-end by contacting your financial intermediary, visiting columbiamanagement.com or calling 800.345.6611.
*The returns shown for periods prior to the share class inception date (including returns for the Life of the Fund, if shown, which are since Fund inception) include the returns of the Fund's oldest share class. Since the Fund launched more than one share class at its inception, Class A shares were used. These returns are adjusted to reflect any higher class-related operating expenses of the newer share classes, as applicable. Please visit columbiamanagement.com/mutual-funds/appended-performance for more information.
The JPMorgan Emerging Markets Bond Index (EMBI) — Global is based on U.S. dollar-denominated debt instruments issued by emerging market sovereign and quasi-sovereign entities, such as Brady bonds, Eurobonds and loans, and reflects reinvestment of all distributions and changes in market prices.
Indices are not available for investment, are not professionally managed and do not reflect sales charges, fees, brokerage commissions, taxes or other expenses of investing. Securities in the Fund may not match those in an index.
Semiannual Report 2013
2
Columbia Emerging Markets Bond Fund
Portfolio Overview
(Unaudited)
Country Breakdown (%)
(at April 30, 2013) | |
Argentina | | | 1.7 | | |
Bolivia | | | 0.4 | | |
Brazil | | | 5.5 | | |
Colombia | | | 5.4 | | |
Costa Rica | | | 0.1 | | |
Dominican Republic | | | 2.2 | | |
El Salvador | | | 0.4 | | |
Georgia | | | 0.6 | | |
Guatemala | | | 1.8 | | |
Hungary | | | 1.1 | | |
Indonesia | | | 8.5 | | |
Kazakhstan | | | 2.9 | | |
Latvia | | | 0.2 | | |
Lithuania | | | 1.2 | | |
Luxembourg | | | 0.5 | | |
Mexico | | | 8.9 | | |
Mongolia | | | 0.2 | | |
Morocco | | | 0.3 | | |
Panama | | | 0.5 | | |
Peru | | | 2.5 | | |
Philippines | | | 0.7 | | |
Poland | | | 1.1 | | |
Qatar | | | 0.6 | | |
Republic of Namibia | | | 0.9 | | |
Republic of the Congo | | | 0.2 | | |
Romania | | | 2.1 | | |
Russian Federation | | | 14.4 | | |
South Africa | | | 0.4 | | |
South Korea | | | 1.0 | | |
Supra-National | | | 1.0 | | |
Trinidad and Tobago | | | 1.4 | | |
Turkey | | | 6.3 | | |
Ukraine | | | 1.4 | | |
United Arab Emirates | | | 1.4 | | |
United States(a) | | | 6.2 | | |
Uruguay | | | 6.5 | | |
Venezuela | | | 9.0 | | |
Zambia | | | 0.5 | | |
Total | | | 100.0 | | |
Percentages indicated are based upon total investments. The Fund's portfolio composition is subject to change.
(a) Includes investments in Money Market Funds.
Portfolio Management
Nicholas Pifer, CFA
James Carlen, CFA
Semiannual Report 2013
3
Columbia Emerging Markets Bond Fund
Portfolio Overview (continued)
(Unaudited)
Quality Breakdown (%)
(at April 30, 2013) | |
AA rating | | | 2.1 | | |
A rating | | | 3.1 | | |
BBB rating | | | 55.5 | | |
BB rating | | | 17.3 | | |
B rating | | | 15.6 | | |
CCC rating | | | 0.4 | | |
Non rated | | | 6.0 | | |
Total | | | 100.0 | | |
Percentages indicated are based upon total fixed income securities (excluding Money Market Funds).
Bond ratings apply to the underlying holdings of the Fund and not the Fund itself and are divided into categories ranging from AAA (highest) to D (lowest), and are subject to change. The ratings shown are determined by using the middle rating of Moody's, S&P, and Fitch after dropping the highest and lowest available ratings. When a rating from only two agencies is available, the lower rating is used. When a rating from only one agency is available, that rating is used. When a bond is not rated by any of these agencies, it is designated as Not rated. Credit ratings are subjective opinions and not statements of fact.
Semiannual Report 2013
4
Columbia Emerging Markets Bond Fund
Understanding Your Fund's Expenses
(Unaudited)
As an investor, you incur two types of costs. There are transaction costs, which generally include sales charges on purchases and may include redemption fees. There are also ongoing costs, which generally include management fees, distribution and service (Rule 12b-1) fees, and other fund expenses. The following information is intended to help you understand your ongoing costs (in dollars) of investing in the Fund and to help you compare these costs with the ongoing costs of investing in other mutual funds.
Analyzing Your Fund's Expenses
To illustrate these ongoing costs, we have provided examples and calculated the expenses paid by investors in each share class of the Fund during the period. The actual and hypothetical information in the table is based on an initial investment of $1,000 at the beginning of the period indicated and held for the entire period. Expense information is calculated two ways and each method provides you with different information. The amount listed in the "Actual" column is calculated using the Fund's actual operating expenses and total return for the period. You may use the Actual information, together with the amount invested, to estimate the expenses that you paid over the period. Simply divide your account value by $1,000 (for example, an $8,600 account value divided by $1,000 = 8.6), then multiply the results by the expenses paid during the period under the Actual column. The amount listed in the "Hypothetical" column assumes a 5% annual rate of return before expenses (which is not the Fund's actual return) and then applies the Fund's actual expense ratio for the period to the hypothetical return. You should not use the hypothetical account values and expenses to estimate either your actual account balance at the end of the period or the expenses you paid during the period. See "Compare With Other Funds" below for details on how to use the hypothetical data.
Compare With Other Funds
Since all mutual funds are required to include the same hypothetical calculations about expenses in shareholder reports, you can use this information to compare the ongoing cost of investing in the Fund with other funds. To do so, compare the hypothetical example with the 5% hypothetical examples that appear in the shareholder reports of other funds. As you compare hypothetical examples of other funds, it is important to note that hypothetical examples are meant to highlight the ongoing costs of investing in a fund only and do not reflect any transaction costs, such as sales charges, or redemption or exchange fees. Therefore, the hypothetical calculations are useful in comparing ongoing costs only, and will not help you determine the relative total costs of owning different funds. If transaction costs were included in these calculations, your costs would be higher.
November 1, 2012 – April 30, 2013
| | Account Value at the Beginning
of the Period ($) | | Account Value at the End of the
Period ($) | | Expenses Paid During the
Period ($) | | Fund's Annualized
Expense Ratio (%) | |
| | Actual | | Hypothetical | | Actual | | Hypothetical | | Actual | | Hypothetical | | Actual | |
Class A | | | 1,000.00 | | | | 1,000.00 | | | | 1,048.90 | | | | 1,019.29 | | | | 5.64 | | | | 5.56 | | | | 1.11 | | |
Class B | | | 1,000.00 | | | | 1,000.00 | | | | 1,044.20 | | | | 1,015.57 | | | | 9.43 | | | | 9.30 | | | | 1.86 | | |
Class C | | | 1,000.00 | | | | 1,000.00 | | | | 1,044.60 | | | | 1,015.57 | | | | 9.43 | | | | 9.30 | | | | 1.86 | | |
Class I | | | 1,000.00 | | | | 1,000.00 | | | | 1,051.30 | | | | 1,021.52 | | | | 3.36 | | | | 3.31 | | | | 0.66 | | |
Class K | | | 1,000.00 | | | | 1,000.00 | | | | 1,048.90 | | | | 1,020.08 | | | | 4.83 | | | | 4.76 | | | | 0.95 | | |
Class R | | | 1,000.00 | | | | 1,000.00 | | | | 1,047.60 | | | | 1,018.05 | | | | 6.90 | | | | 6.80 | | | | 1.36 | | |
Class R4 | | | 1,000.00 | | | | 1,000.00 | | | | 1,020.60 | * | | | 1,020.33 | | | | 1.02 | * | | | 4.51 | | | | 0.90 | * | |
Class R5 | | | 1,000.00 | | | | 1,000.00 | | | | 1,045.10 | ** | | | 1,021.22 | | | | 3.47 | ** | | | 3.61 | | | | 0.72 | ** | |
Class W | | | 1,000.00 | | | | 1,000.00 | | | | 1,048.90 | | | | 1,019.29 | | | | 5.64 | | | | 5.56 | | | | 1.11 | | |
Class Y | | | 1,000.00 | | | | 1,000.00 | | | | 1,046.20 | ** | | | 1,021.52 | | | | 3.18 | ** | | | 3.31 | | | | 0.66 | ** | |
Class Z | | | 1,000.00 | | | | 1,000.00 | | | | 1,050.20 | | | | 1,020.53 | | | | 4.37 | | | | 4.31 | | | | 0.86 | | |
*For the period March 19, 2013 through April 30, 2013. Class R4 shares commenced operations on March 19, 2013.
**For the period November 8, 2012 through April 30, 2013. Class R5 and Class Y shares commenced operations on November 8, 2012.
Expenses paid during the period are equal to the annualized expense ratio for each class as indicated above, multiplied by the average account value over the period and then multiplied by the number of days in the Fund's most recent fiscal half year and divided by 365.
Expenses do not include fees and expenses incurred indirectly by the Fund from the underlying funds in which the Fund may invest (also referred to as "acquired funds"), including affiliated and non-affiliated pooled investment vehicles (including mutual funds and exchange-traded funds).
Semiannual Report 2013
5
Columbia Emerging Markets Bond Fund
Portfolio of Investments
April 30, 2013 (Unaudited)
(Percentages represent value of investments compared to net assets)
Corporate Bonds & Notes(a) 10.1%
Issuer | | Coupon
Rate | | Principal
Amount ($) | | Value ($) | |
Brazil 1.5% | |
Banco Santander Brasil SA
Senior Unsecured(b)
02/13/17 | | | 4.625 | % | | | 2,000,000 | | | | 2,130,000 | | |
Companhia de Eletricidade do Estad
04/27/16 | | | 11.750 | % | | BRL | 6,000,000 | | | | 3,165,313 | | |
Samarco Mineracao SA
Senior Unsecured(b)
11/01/22 | | | 4.125 | % | | | 5,000,000 | | | | 4,896,138 | | |
Vale Overseas Ltd.
01/11/22 | | | 4.375 | % | | | 1,000,000 | | | | 1,052,380 | | |
Vale SA
Senior Unsecured
09/11/42 | | | 5.625 | % | | | 2,000,000 | | | | 2,089,350 | | |
Total | | | | | | | 13,333,181 | | |
Colombia 0.8% | |
BanColombia SA
Senior Unsecured
06/03/21 | | | 5.950 | % | | | 2,100,000 | | | | 2,367,750 | | |
Banco de Bogota SA
Senior Unsecured(b)
01/15/17 | | | 5.000 | % | | | 1,000,000 | | | | 1,082,099 | | |
Grupo Aval Ltd.(b)
09/26/22 | | | 4.750 | % | | | 4,000,000 | | | | 4,035,000 | | |
Total | | | | | | | 7,484,849 | | |
Kazakhstan 1.0% | |
Zhaikmunai LP
11/13/19 | | | 7.125 | % | | | 3,575,000 | | | | 3,869,938 | | |
Zhaikmunai LP(b)
11/13/19 | | | 7.125 | % | | | 4,990,000 | | | | 5,388,117 | | |
Total | | | | | | | 9,258,055 | | |
Luxembourg 0.5% | |
Cosan Luxembourg SA(b)
03/14/18 | | | 9.500 | % | | BRL | 6,000,000 | | | | 3,104,703 | | |
03/14/23 | | | 5.000 | % | | | 1,309,000 | | | | 1,337,033 | | |
Total | | | | | | | 4,441,736 | | |
Mexico 0.5% | |
America Movil SAB de CV
Senior Unsecured
12/05/22 | | | 6.450 | % | | MXN | 30,000,000 | | | | 2,629,863 | | |
Mexichem SAB de CV(b)
09/19/42 | | | 6.750 | % | | | 1,000,000 | | | | 1,147,500 | | |
Senior Unsecured
09/19/22 | | | 4.875 | % | | | 1,000,000 | | | | 1,087,500 | | |
Total | | | | | | | 4,864,863 | | |
Corporate Bonds & Notes(a) (continued)
Issuer | | Coupon
Rate | | Principal
Amount ($) | | Value ($) | |
Peru 0.9% | |
Banco de Credito del Peru
Subordinated Notes(b)(c)
10/15/22 | | | 7.170 | % | | PEN | 6,000,000 | | | | 2,614,075 | | |
Corp. Azucarera del Peru SA(b)
08/02/22 | | | 6.375 | % | | | 4,700,000 | | | | 5,045,556 | | |
Total | | | | | | | 7,659,631 | | |
Russian Federation 3.6% | |
EDC Finance Ltd.(b)
04/17/20 | | | 4.875 | % | | | 2,400,000 | | | | 2,405,228 | | |
Lukoil International Finance BV(b)
11/05/19 | | | 7.250 | % | | | 2,400,000 | | | | 2,897,115 | | |
11/09/20 | | | 6.125 | % | | | 2,900,000 | | | | 3,319,750 | | |
06/07/22 | | | 6.656 | % | | | 1,000,000 | | | | 1,188,750 | | |
Metalloinvest Finance Ltd.(b)
07/21/16 | | | 6.500 | % | | | 2,000,000 | | | | 2,124,288 | | |
Novatek Finance Ltd.(b)
Senior Unsecured
02/21/17 | | | 7.750 | % | | RUB | 83,300,000 | | | | 2,685,784 | | |
02/03/21 | | | 6.604 | % | | | 4,000,000 | | | | 4,637,314 | | |
Severstal OAO Via Steel Capital SA
Senior Unsecured(b)
07/26/16 | | | 6.250 | % | | | 1,500,000 | | | | 1,599,895 | | |
Sibur Securities Ltd.(b)
01/31/18 | | | 3.914 | % | | | 4,250,000 | | | | 4,196,945 | | |
TNK-BP Finance SA(b)
03/13/18 | | | 7.875 | % | | | 1,000,000 | | | | 1,199,664 | | |
VimpelCom Holdings BV(b)
02/13/18 | | | 9.000 | % | | RUB | 95,300,000 | | | | 3,182,858 | | |
03/01/22 | | | 7.504 | % | | | 2,500,000 | | | | 2,825,000 | | |
Total | | | | | | | 32,262,591 | | |
Ukraine 1.0% | |
MHP SA(b)
04/29/15 | | | 10.250 | % | | | 691,000 | | | | 734,188 | | |
04/02/20 | | | 8.250 | % | | | 7,200,000 | | | | 7,109,020 | | |
Metinvest BV(b)
02/14/18 | | | 8.750 | % | | | 1,500,000 | | | | 1,530,000 | | |
Total | | | | | | | 9,373,208 | | |
United States 0.3% | |
Industrial Senior Trust(b)
11/01/22 | | | 5.500 | % | | | 3,000,000 | | | | 3,000,000 | | |
Total Corporate Bonds & Notes
(Cost: $87,357,722) | | | | | | | 91,678,114 | | |
The accompanying Notes to Financial Statements are an integral part of this statement.
Semiannual Report 2013
6
Columbia Emerging Markets Bond Fund
Portfolio of Investments (continued)
April 30, 2013 (Unaudited)
Inflation-Indexed Bonds(a) 5.9%
Issuer | | Coupon
Rate | | Principal
Amount ($) | | Value ($) | |
Uruguay 5.9% | |
Uruguay Government International Bond
04/05/27 | | | 4.250 | % | | UYU | 378,928,840 | | | | 24,835,904 | | |
Senior Unsecured
12/15/28 | | | 4.375 | % | | UYU | 429,077,130 | | | | 28,753,635 | | |
Total | | | | | | | 53,589,539 | | |
Total Inflation-Indexed Bonds
(Cost: $43,896,232) | | | | | | | 53,589,539 | | |
Foreign Government Obligations(a) 77.3%
Argentina 1.7% | |
Argentina Boden Bonds
10/03/15 | | | 7.000 | % | | | 4,335,000 | | | | 3,782,287 | | |
Argentina Bonar Bonds
04/17/17 | | | 7.000 | % | | | 4,338,000 | | | | 3,535,470 | | |
City of Buenos Aires
Senior Unsecured(b)
03/01/17 | | | 9.950 | % | | | 5,342,000 | | | | 4,700,960 | | |
Provincia de Buenos Aires
Senior Unsecured(b)
01/26/21 | | | 10.875 | % | | | 2,780,000 | | | | 1,973,800 | | |
Provincia de Cordoba
Senior Unsecured(b)
08/17/17 | | | 12.375 | % | | | 2,050,000 | | | | 1,609,250 | | |
Total | | | | | | | 15,601,767 | | |
Bolivia 0.4% | |
Bolivian Government International Bond(b)
10/29/22 | | | 4.875 | % | | | 3,100,000 | | | | 3,147,079 | | |
Brazil 4.0% | |
Banco do Brasil SA
Bank Guaranteed
10/10/22 | | | 3.875 | % | | | 2,000,000 | | | | 1,987,000 | | |
Brazil Notas do Tesouro Nacional
Senior Notes
01/01/17 | | | 10.000 | % | | BRL | 19,548,000 | | | | 10,405,037 | | |
Centrais Eletricas Brasileiras SA
Senior Unsecured(b)
10/27/21 | | | 5.750 | % | | | 6,800,000 | | | | 7,415,400 | | |
Cia de Saneamento Basico do Estado de Sao Paulo
Senior Unsecured(b)
12/16/20 | | | 6.250 | % | | | 500,000 | | | | 543,500 | | |
Morgan Stanley
Senior Unsecured
10/22/20 | | | 11.500 | % | | BRL | 3,300,000 | | | | 1,877,705 | | |
Foreign Government Obligations(a) (continued)
Issuer | | Coupon
Rate | | Principal
Amount ($) | | Value ($) | |
Petrobras International Finance Co.
03/15/19 | | | 7.875 | % | | | 4,900,000 | | | | 6,093,032 | | |
01/20/20 | | | 5.750 | % | | | 1,000,000 | | | | 1,128,746 | | |
01/27/21 | | | 5.375 | % | | | 3,424,000 | | | | 3,784,738 | | |
01/20/40 | | | 6.875 | % | | | 2,600,000 | | | | 3,104,584 | | |
Total | | | | | | | 36,339,742 | | |
Colombia 4.6% | |
Bogota Distrito Capital
Senior Unsecured(b)
07/26/28 | | | 9.750 | % | | COP | 1,377,000,000 | | | | 1,144,026 | | |
Colombia Government International Bond
Senior Unsecured
01/18/41 | | | 6.125 | % | | | 6,600,000 | | | | 8,832,520 | | |
Corporación Andina de Fomento
06/15/22 | | | 4.375 | % | | | 3,715,000 | | | | 4,050,019 | | |
Emgesa SA ESP
Senior Unsecured
01/25/21 | | | 8.750 | % | | COP | 4,924,000,000 | | | | 3,267,225 | | |
Empresa de Energia de Bogota SA
Senior Unsecured(b)
11/10/21 | | | 6.125 | % | | | 6,645,000 | | | | 7,407,960 | | |
Empresas Publicas de Medellin ESP
Senior Unsecured(b)
02/01/21 | | | 8.375 | % | | COP | 15,188,000,000 | | | | 9,782,281 | | |
Transportadora de Gas Internacional SA ESP
Senior Unsecured(b)
03/20/22 | | | 5.700 | % | | | 6,100,000 | | | | 6,740,742 | | |
Total | | | | | | | 41,224,773 | | |
Costa Rica 0.1% | |
Costa Rica Government International Bond
Senior Unsecured(b)
01/26/23 | | | 4.250 | % | | | 1,000,000 | | | | 1,015,000 | | |
Dominican Republic 2.1% | |
Banco de Reservas de La Republica Dominicana
Subordinated Notes(b)
02/01/23 | | | 7.000 | % | | | 4,300,000 | | | | 4,401,050 | | |
Dominican Republic International Bond(b)
Senior Unsecured
05/06/21 | | | 7.500 | % | | | 7,500,000 | | | | 8,527,007 | | |
04/18/24 | | | 5.875 | % | | | 1,500,000 | | | | 1,522,479 | | |
04/20/27 | | | 8.625 | % | | | 3,984,000 | | | | 4,999,920 | | |
Total | | | | | | | 19,450,456 | | |
El Salvador 0.4% | |
El Salvador Government International Bond(b)
Senior Unsecured
04/10/32 | | | 8.250 | % | | | 1,000,000 | | | | 1,250,000 | | |
06/15/35 | | | 7.650 | % | | | 1,810,000 | | | | 2,104,125 | | |
Total | | | | | | | 3,354,125 | | |
The accompanying Notes to Financial Statements are an integral part of this statement.
Semiannual Report 2013
7
Columbia Emerging Markets Bond Fund
Portfolio of Investments (continued)
April 30, 2013 (Unaudited)
Foreign Government Obligations(a) (continued)
Issuer | | Coupon
Rate | | Principal
Amount ($) | | Value ($) | |
Georgia 0.6% | |
Georgian Railway JSC
Senior Unsecured(b)
07/11/22 | | | 7.750 | % | | | 4,844,000 | | | | 5,630,840 | | |
Guatemala 1.8% | |
Guatemala Government Bond(b)
Senior Unsecured
06/06/22 | | | 5.750 | % | | | 8,700,000 | | | | 9,796,200 | | |
02/13/28 | | | 4.875 | % | | | 6,322,000 | | | | 6,400,000 | | |
Total | | | | | | | 16,196,200 | | |
Hungary 1.0% | |
Hungary Government International Bond
Senior Unsecured
03/29/21 | | | 6.375 | % | | | 2,400,000 | | | | 2,663,717 | | |
03/29/41 | | | 7.625 | % | | | 1,500,000 | | | | 1,760,625 | | |
Magyar Export-Import Bank RT(b)
02/12/18 | | | 5.500 | % | | | 5,000,000 | | | | 5,036,667 | | |
Total | | | | | | | 9,461,009 | | |
Indonesia 8.4% | |
Indonesia Government International Bond(b)
01/17/42 | | | 5.250 | % | | | 1,000,000 | | | | 1,130,000 | | |
Senior Unsecured
05/05/21 | | | 4.875 | % | | | 8,000,000 | | | | 9,045,596 | | |
01/17/38 | | | 7.750 | % | | | 3,700,000 | | | | 5,494,500 | | |
Indonesia Treasury Bond
Senior Unsecured
10/15/14 | | | 11.000 | % | | IDR | 6,000,000,000 | | | | 673,887 | | |
06/15/15 | | | 9.500 | % | | IDR | 49,000,000,000 | | | | 5,546,568 | | |
07/15/17 | | | 10.000 | % | | IDR | 30,762,000,000 | | | | 3,777,871 | | |
09/15/19 | | | 11.500 | % | | IDR | 29,400,000,000 | | | | 4,037,551 | | |
11/15/20 | | | 11.000 | % | | IDR | 9,000,000,000 | | | | 1,248,147 | | |
06/15/21 | | | 12.800 | % | | IDR | 6,800,000,000 | | | | 1,035,572 | | |
07/15/22 | | | 10.250 | % | | IDR | 13,210,000,000 | | | | 1,812,011 | | |
05/15/27 | | | 7.000 | % | | IDR | 21,520,000,000 | | | | 2,392,145 | | |
Majapahit Holding BV(b)
10/17/16 | | | 7.750 | % | | | 1,830,000 | | | | 2,131,950 | | |
06/28/17 | | | 7.250 | % | | | 1,150,000 | | | | 1,339,643 | | |
08/07/19 | | | 8.000 | % | | | 3,600,000 | | | | 4,509,000 | | |
01/20/20 | | | 7.750 | % | | | 5,900,000 | | | | 7,328,246 | | |
PT Pertamina Persero(b)
05/23/21 | | | 5.250 | % | | | 2,000,000 | | | | 2,179,995 | | |
Senior Unsecured
05/03/22 | | | 4.875 | % | | | 1,000,000 | | | | 1,063,800 | | |
05/27/41 | | | 6.500 | % | | | 1,000,000 | | | | 1,127,826 | | |
05/03/42 | | | 6.000 | % | | | 3,000,000 | | | | 3,226,200 | | |
PT Perusahaan Listrik Negara(b)
Senior Unsecured
11/22/21 | | | 5.500 | % | | | 13,834,000 | | | | 15,287,404 | | |
10/24/42 | | | 5.250 | % | | | 2,000,000 | | | | 1,985,000 | | |
Total | | | | | | | 76,372,912 | | |
Foreign Government Obligations(a) (continued)
Issuer | | Coupon
Rate | | Principal
Amount ($) | | Value ($) | |
Kazakhstan 1.9% | |
KazMunayGas National Co. JSC(b)
07/02/18 | | | 9.125 | % | | | 4,095,000 | | | | 5,231,362 | | |
05/05/20 | | | 7.000 | % | | | 1,650,000 | | | | 1,990,934 | | |
Senior Unsecured
04/30/23 | | | 4.400 | % | | | 1,000,000 | | | | 1,009,885 | | |
04/30/43 | | | 5.750 | % | | | 2,000,000 | | | | 2,035,691 | | |
KazMunayGas National Co. JSC(b)(d)
Senior Unsecured
04/30/23 | | | 4.400 | % | | | 1,000,000 | | | | 1,009,885 | | |
04/30/43 | | | 5.750 | % | | | 1,000,000 | | | | 1,017,846 | | |
Kazakhstan Temir Zholy Finance BV(b)
07/10/42 | | | 6.950 | % | | | 4,000,000 | | | | 4,740,000 | | |
Total | | | | | | | 17,035,603 | | |
Latvia 0.2% | |
Republic of Latvia
Senior Unsecured(b)
06/16/21 | | | 5.250 | % | | | 1,500,000 | | | | 1,739,512 | | |
Lithuania 1.2% | |
Lithuania Government International Bond(b)
Senior Unsecured
09/14/17 | | | 5.125 | % | | | 1,150,000 | | | | 1,292,564 | | |
03/09/21 | | | 6.125 | % | | | 4,850,000 | | | | 5,951,134 | | |
02/01/22 | | | 6.625 | % | | | 2,830,000 | | | | 3,580,466 | | |
Total | | | | | | | 10,824,164 | | |
Mexico 8.3% | |
Comision Federal de Electricidad
Senior Unsecured(b)
02/14/42 | | | 5.750 | % | | | 3,200,000 | | | | 3,616,000 | | |
Mexican Bonos
12/17/15 | | | 8.000 | % | | MXN | 3,940,000 | | | | 3,564,382 | | |
12/15/16 | | | 7.250 | % | | MXN | 6,901,000 | | | | 6,288,820 | | |
12/14/17 | | | 7.750 | % | | MXN | 3,910,000 | | | | 3,707,746 | | |
06/09/22 | | | 6.500 | % | | MXN | 9,900,000 | | | | 9,400,528 | | |
06/03/27 | | | 7.500 | % | | MXN | 17,408,000 | | | | 18,298,966 | | |
Pemex Project Funding Master Trust
06/15/35 | | | 6.625 | % | | | 4,304,000 | | | | 5,413,476 | | |
06/15/38 | | | 6.625 | % | | | 2,000,000 | | | | 2,525,136 | | |
Petroleos Mexicanos
11/24/21 | | | 7.650 | % | | MXN | 116,500,000 | | | | 11,042,376 | | |
01/24/22 | | | 4.875 | % | | | 800,000 | | | | 910,000 | | |
06/02/41 | | | 6.500 | % | | | 6,000,000 | | | | 7,455,000 | | |
06/27/44 | | | 5.500 | % | | | 2,900,000 | | | | 3,175,500 | | |
Total | | | | | | | 75,397,930 | | |
Mongolia 0.2% | |
Mongolia Government International Bond
Senior Unsecured(b)
12/05/22 | | | 5.125 | % | | | 1,664,000 | | | | 1,572,356 | | |
The accompanying Notes to Financial Statements are an integral part of this statement.
Semiannual Report 2013
8
Columbia Emerging Markets Bond Fund
Portfolio of Investments (continued)
April 30, 2013 (Unaudited)
Foreign Government Obligations(a) (continued)
Issuer | | Coupon
Rate | | Principal
Amount ($) | | Value ($) | |
Morocco 0.3% | |
Morocco Government International Bond
Senior Unsecured(b)
12/11/22 | | | 4.250 | % | | | 2,600,000 | | | | 2,693,782 | | |
Panama 0.5% | |
Ena Norte Trust
Pass-Through Certificates(b)
04/25/23 | | | 4.950 | % | | | 4,407,054 | | | | 4,586,510 | | |
Peru 1.7% | |
Corporacion Financiera de Desarrollo SA
Senior Unsecured(b)
02/08/22 | | | 4.750 | % | | | 5,000,000 | | | | 5,398,381 | | |
El Fondo MIVIVENDA SA(b)
01/31/23 | | | 3.500 | % | | | 500,000 | | | | 496,750 | | |
Peru Enhanced Pass-Through Finance Ltd.
Pass-Through Certificates(b)(e)
05/31/18 | | | 0.000 | % | | | 5,138,461 | | | | 4,752,506 | | |
Peruvian Government International Bond
Senior Unsecured
03/14/37 | | | 6.550 | % | | | 1,500,000 | | | | 2,141,250 | | |
11/18/50 | | | 5.625 | % | | | 1,800,000 | | | | 2,308,500 | | |
Total | | | | | | | 15,097,387 | | |
Philippines 0.7% | |
Philippine Government International Bond
Senior Unsecured
03/30/26 | | | 5.500 | % | | | 1,500,000 | | | | 1,888,125 | | |
Power Sector Assets & Liabilities Management Corp.
Government Guaranteed(b)
12/02/24 | | | 7.390 | % | | | 3,000,000 | | | | 4,084,805 | | |
Total | | | | | | | 5,972,930 | | |
Poland 1.0% | |
Poland Government International Bond
Senior Unsecured
04/21/21 | | | 5.125 | % | | | 8,000,000 | | | | 9,400,800 | | |
Qatar 0.6% | |
Qatar Government International Bond(b)
Senior Unsecured
01/20/22 | | | 4.500 | % | | | 3,500,000 | | | | 3,990,000 | | |
01/20/40 | | | 6.400 | % | | | 1,000,000 | | | | 1,360,000 | | |
Total | | | | | | | 5,350,000 | | |
Republic of Namibia 0.9% | |
Namibia International Bonds
Senior Unsecured(b)
11/03/21 | | | 5.500 | % | | | 7,300,000 | | | | 8,157,750 | | |
Foreign Government Obligations(a) (continued)
Issuer | | Coupon
Rate | | Principal
Amount ($) | | Value ($) | |
Republic of the Congo 0.2% | |
Republic of Congo
Senior Unsecured(c)
06/30/29 | | | 3.000 | % | | | 2,210,175 | | | | 2,044,412 | | |
Romania 2.1% | |
Romania Government Bond
07/26/17 | | | 5.900 | % | | RON | 23,390,000 | | | | 7,373,871 | | |
Romanian Government International Bond(b)
Senior Unsecured
02/07/22 | | | 6.750 | % | | | 8,334,000 | | | | 10,229,815 | | |
08/22/23 | | | 4.375 | % | | | 1,200,000 | | | | 1,241,118 | | |
Total | | | | | | | 18,844,804 | | |
Russian Federation 10.7% | |
AK Transneft OJSC Via TransCapitalInvest Ltd.
Senior Unsecured(b)
08/07/18 | | | 8.700 | % | | | 1,180,000 | | | | 1,505,975 | | |
Gazprom Neft OAO Via GPN Capital SA
Senior Unsecured(b)
09/19/22 | | | 4.375 | % | | | 7,000,000 | | | | 7,010,310 | | |
Gazprom OAO Via Gaz Capital SA(b)
Senior Unsecured
11/22/16 | | | 6.212 | % | | | 3,350,000 | | | | 3,760,375 | | |
01/23/21 | | | 5.999 | % | | | 2,000,000 | | | | 2,272,500 | | |
03/07/22 | | | 6.510 | % | | | 9,800,000 | | | | 11,429,250 | | |
08/16/37 | | | 7.288 | % | | | 2,950,000 | | | | 3,658,000 | | |
Rosneft International Finance Ltd.
Senior Unsecured(b)
03/06/22 | | | 4.199 | % | | | 2,400,000 | | | | 2,412,000 | | |
Russian Agricultural Bank OJSC Via RSHB Capital SA
Senior Unsecured(b)
12/27/17 | | | 5.298 | % | | | 6,450,000 | | | | 6,895,943 | | |
Russian Foreign Bond - Eurobond(b)
Senior Unsecured
03/10/18 | | | 7.850 | % | | RUB | 100,000,000 | | | | 3,466,922 | | |
04/29/20 | | | 5.000 | % | | | 6,000,000 | | | | 6,915,000 | | |
04/04/42 | | | 5.625 | % | | | 3,000,000 | | | | 3,555,000 | | |
Russian Foreign Bond - Eurobond(b)(c)
Senior Unsecured
03/31/30 | | | 7.500 | % | | | 5,223,195 | | | | 6,570,779 | | |
Russian Railways via RZD Capital PLC
Senior Unsecured
04/02/19 | | | 8.300 | % | | RUB | 415,300,000 | | | | 13,989,284 | | |
Sberbank of Russia Via SB Capital SA
Senior Unsecured
06/16/21 | | | 5.717 | % | | | 1,500,000 | | | | 1,660,500 | | |
Sberbank of Russia Via SB Capital SA(b)
Senior Unsecured
02/07/22 | | | 6.125 | % | | | 6,700,000 | | | | 7,559,757 | | |
Subordinated Notes
10/29/22 | | | 5.125 | % | | | 3,000,000 | | | | 3,039,300 | | |
The accompanying Notes to Financial Statements are an integral part of this statement.
Semiannual Report 2013
9
Columbia Emerging Markets Bond Fund
Portfolio of Investments (continued)
April 30, 2013 (Unaudited)
Foreign Government Obligations(a) (continued)
Issuer | | Coupon
Rate | | Principal
Amount ($) | | Value ($) | |
VTB Bank OJSC Via VTB Capital SA
Senior Unsecured(b)
04/12/17 | | | 6.000 | % | | | 4,500,000 | | | | 4,888,125 | | |
Vnesheconombank Via VEB Finance PLC(b)
Senior Unsecured
07/05/22 | | | 6.025 | % | | | 1,200,000 | | | | 1,360,500 | | |
11/22/25 | | | 6.800 | % | | | 4,500,000 | | | | 5,388,750 | | |
Total | | | | | | | 97,338,270 | | |
South Africa 0.4% | |
South Africa Government International Bond
Senior Unsecured
01/17/24 | | | 4.665 | % | | | 1,200,000 | | | | 1,341,000 | | |
Transnet SOC Ltd.
Senior Unsecured(b)
07/26/22 | | | 4.000 | % | | | 2,200,000 | | | | 2,184,513 | | |
Total | | | | | | | 3,525,513 | | |
South Korea 1.0% | |
Export-Import Bank of Korea
Senior Unsecured
09/15/21 | | | 4.375 | % | | | 3,000,000 | | | | 3,332,439 | | |
Export-Import Bank of Korea(b)
02/15/15 | | | 5.000 | % | | IDR | 52,840,000,000 | | | | 5,324,637 | | |
Total | | | | | | | 8,657,076 | | |
Supra-National 1.0% | |
African Export-Import Bank
Senior Unsecured
07/27/16 | | | 5.750 | % | | | 1,000,000 | | | | 1,078,850 | | |
Eurasian Development Bank
Senior Unsecured
10/05/17 | | | 8.000 | % | | RUB | 237,800,000 | | | | 7,881,081 | | |
Total | | | | | | | 8,959,931 | | |
Trinidad and Tobago 1.4% | |
Petroleum Co. of Trinidad & Tobago Ltd.
Senior Unsecured(b)
08/14/19 | | | 9.750 | % | | | 9,900,000 | | | | 12,712,435 | | |
Turkey 6.2% | |
Export Credit Bank of Turkey(b)
Senior Unsecured
11/04/16 | | | 5.375 | % | | | 3,000,000 | | | | 3,251,638 | | |
04/24/19 | | | 5.875 | % | | | 12,785,000 | | | | 14,512,225 | | |
Turkey Government International Bond
03/25/22 | | | 5.125 | % | | | 6,250,000 | | | | 7,140,625 | | |
01/14/41 | | | 6.000 | % | | | 2,100,000 | | | | 2,525,250 | | |
Senior Unsecured
11/07/19 | | | 7.500 | % | | | 1,625,000 | | | | 2,075,938 | | |
06/05/20 | | | 7.000 | % | | | 1,300,000 | | | | 1,631,500 | | |
03/30/21 | | | 5.625 | % | | | 4,550,000 | | | | 5,334,875 | | |
Foreign Government Obligations(a) (continued)
Issuer | | Coupon
Rate | | Principal
Amount ($) | | Value ($) | |
09/26/22 | | | 6.250 | % | | | 5,000,000 | | | | 6,162,500 | | |
03/23/23 | | | 3.250 | % | | | 2,000,000 | | | | 1,965,000 | | |
02/05/25 | | | 7.375 | % | | | 2,000,000 | | | | 2,670,000 | | |
03/17/36 | | | 6.875 | % | | | 3,800,000 | | | | 4,978,000 | | |
05/30/40 | | | 6.750 | % | | | 3,100,000 | | | | 4,045,500 | | |
Total | | | | | | | 56,293,051 | | |
Ukraine 0.3% | |
City of Kyiv Via Kyiv Finance PLC
Senior Unsecured(b)
07/11/16 | | | 9.375 | % | | | 1,100,000 | | | | 1,089,989 | | |
Ukraine Government International Bond
Senior Unsecured(b)
02/23/21 | | | 7.950 | % | | | 1,655,000 | | | | 1,679,212 | | |
Total | | | | | | | 2,769,201 | | |
United Arab Emirates 1.4% | |
Abu Dhabi National Energy Co.(b)
Senior Unsecured
12/13/21 | | | 5.875 | % | | | 4,500,000 | | | | 5,352,331 | | |
01/12/23 | | | 3.625 | % | | | 3,000,000 | | | | 3,042,000 | | |
Dolphin Energy Ltd.
Senior Secured(b)
12/15/21 | | | 5.500 | % | | | 3,550,000 | | | | 4,197,141 | | |
Total | | | | | | | 12,591,472 | | |
Uruguay 0.6% | |
Uruguay Government International Bond
Senior Unsecured
03/21/36 | | | 7.625 | % | | | 1,783,939 | | | | 2,691,072 | | |
11/20/45 | | | 4.125 | % | | | 2,500,000 | | | | 2,432,500 | | |
Total | | | | | | | 5,123,572 | | |
Venezuela 8.9% | |
Petroleos de Venezuela SA
04/12/17 | | | 5.250 | % | | | 11,647,000 | | | | 10,103,772 | | |
11/02/17 | | | 8.500 | % | | | 13,270,000 | | | | 12,838,725 | | |
11/17/21 | | | 9.000 | % | | | 18,082,629 | | | | 17,042,878 | | |
02/17/22 | | | 12.750 | % | | | 507,800 | | | | 566,197 | | |
Senior Unsecured
10/28/15 | | | 5.000 | % | | | 11,700,500 | | | | 10,793,711 | | |
Venezuela Government International Bond
Senior Unsecured
05/07/23 | | | 9.000 | % | | | 25,750,000 | | | | 24,501,125 | | |
10/13/24 | | | 8.250 | % | | | 5,000,000 | | | | 4,507,500 | | |
03/31/38 | | | 7.000 | % | | | 800,000 | | | | 636,000 | | |
Total | | | | | | | 80,989,908 | | |
Zambia 0.5% | |
Zambia Government International Bond(b)
09/20/22 | | | 5.375 | % | | | 4,800,000 | | | | 4,697,084 | | |
Total Foreign Government Obligations
(Cost: $631,766,823) | | | | | | | 700,169,356 | | |
The accompanying Notes to Financial Statements are an integral part of this statement.
Semiannual Report 2013
10
Columbia Emerging Markets Bond Fund
Portfolio of Investments (continued)
April 30, 2013 (Unaudited)
Money Market Funds 5.8%
| | | Shares | | Value ($) | |
Columbia Short-Term Cash Fund,
0.126%(f)(g) | | | 52,526,380 | | | | 52,526,380 | | |
Total Money Market Funds
(Cost: $52,526,380) | | | | | 52,526,380 | | |
Total Investments
(Cost: $815,547,157) | | | | | 897,963,389 | | |
Other Assets & Liabilities, Net | | | | | 8,123,406 | | |
Net Assets | | | | | 906,086,795 | | |
Investments in Derivatives
Credit Default Swap Contracts Outstanding at April 30, 2013
Buy Protection
Counterparty | | Reference
Entity | | Expiration
Date | | Pay Fixed
Rate (%) | | Notional
Amount ($) | | Market
Value ($) | | Unamortized
Premium
(Paid)
Received ($) | | Periodic
Payments
Receivable
(Payable) ($) | | Unrealized
Appreciation
($) | | Unrealized
Depreciation
($) | |
JPMorgan
Chase Bank | | CDX Emerging
Markets Index | | June 20,
2013 | | | 2.650 | | | | 2,000,000 | | | | 3,570 | | | | (11,294 | ) | | | (19,433 | ) | | | — | | | | (27,158 | ) | |
Total | | | | | | | | | | | | | | | | | — | | | | (27,158 | ) | |
Credit Default Swap Contracts Outstanding at April 30, 2013
Sell Protection
Counterparty | | Reference
Entity | | Expiration
Date | | Receive
Fixed
Rate (%) | | Notional
Amount ($) | | Market
Value ($) | | Unamortized
Premium
(Paid)
Received ($) | | Periodic
Payments
Receivable
(Payable) ($) | | Unrealized
Appreciation
($) | | Unrealized
Depreciation
($) | |
Merril Lynch
Intl | | CDX Emerging
Markets Index | | June 20,
2013 | | | 2.650 | | | | 2,000,000 | | | | (3,570 | ) | | | — | | | | 19,433 | | | | 15,864 | | | | — | | |
Total | | | | | | | | | | | | | | | | | 15,864 | | | | — | | |
Forward Foreign Currency Exchange Contracts Open at April 30, 2013
Counterparty | | Exchange Date | | Currency to
be Delivered | | Currency to
be Received | | Unrealized
Appreciation ($) | | Unrealized
Depreciation ($) | |
Citigroup | | May 21, 2013 | | | 2,876,519
(USD) | | | | 89,267,000
(RUB) | | | | — | | | | (18,711 | ) | |
Deutsche Bank | | May 31, 2013 | | | 6,019,256
(USD) | | | | 18,443,000
(MYR) | | | | 32,921 | | | | — | | |
Morgan Stanley | | June 5, 2013 | | | 82,265,000
(CZK) | | | | 4,159,609
(USD) | | | | — | | | | (41,143 | ) | |
Goldman Sachs | | June 14, 2013 | | | 4,232,819
(USD) | | | | 13,421,000
(PLN) | | | | 260 | | | | — | | |
Total | | | | | | | | | 33,181 | | | | (59,854 | ) | |
The accompanying Notes to Financial Statements are an integral part of this statement.
Semiannual Report 2013
11
Columbia Emerging Markets Bond Fund
Portfolio of Investments (continued)
April 30, 2013 (Unaudited)
Notes to Portfolio of Investments
(a) Principal amounts are denominated in United States Dollars unless otherwise noted.
(b) Security exempt from registration pursuant to Rule 144A under the Securities Act of 1933. This security may be resold in transactions exempt from registration, normally to qualified institutional buyers. At April 30, 2013, the value of these securities amounted to $449,011,709 or 49.56% of net assets.
(c) Variable rate security.
(d) Represents a security purchased on a when-issued or delayed delivery basis.
(e) Zero coupon bond.
(f) The rate shown is the seven-day current annualized yield at April 30, 2013.
(g) As defined in the Investment Company Act of 1940, an affiliated company is one in which the Fund owns 5% or more of its outstanding voting securities, or a company which is under common ownership or control with the Fund. Holdings and transactions in these affiliated companies during the period ended April 30, 2013, are as follows:
Issuer | | Beginning
Cost ($) | | Purchase
Cost ($) | | Proceeds
From Sales ($) | | Ending
Cost ($) | | Dividends —
Affiliated
Issuers ($) | | Value ($) | |
Columbia
Short-Term
Cash Fund | | | 37,572,908 | | | | 165,080,636 | | | | (150,127,164) | | | | 52,526,380 | | | | 31,071 | | | | 52,526,380 | | |
Currency Legend
BRL Brazilian Real
COP Colombian Peso
CZK Czech Koruna
IDR Indonesian Rupiah
MXN Mexican Peso
MYR Malaysia Ringgits
PEN Peru Nuevos Soles
PLN Polish Zloty
RON Romania, New Lei
RUB Russian Rouble
USD US Dollar
UYU Uruguay Pesos
Fair Value Measurements
Generally accepted accounting principles (GAAP) require disclosure regarding the inputs and valuation techniques used to measure fair value and any changes in valuation inputs or techniques. In addition, investments shall be disclosed by major category.
The Fund categorizes its fair value measurements according to a three-level hierarchy that maximizes the use of observable inputs and minimizes the use of unobservable inputs by prioritizing that the most observable input be used when available. Observable inputs are those that market participants would use in pricing an investment based on market data obtained from sources independent of the reporting entity. Unobservable inputs are those that reflect the Fund's assumptions about the information market participants would use in pricing an investment. An investment's level within the fair value hierarchy is based on the lowest level of any input that is deemed significant to the asset or liability's fair value measurement. The input levels are not necessarily an indication of the risk or liquidity associated with investments at that level. For example, certain U.S. government securities are generally high quality and liquid, however, they are reflected as Level 2 because the inputs used to determine fair value may not always be quoted prices in an active market.
Fair value inputs are summarized in the three broad levels listed below:
> Level 1 — Valuations based on quoted prices for investments in active markets that the Fund has the ability to access at the measurement date (including NAV for open-end mutual funds). Valuation adjustments are not applied to Level 1 investments.
The accompanying Notes to Financial Statements are an integral part of this statement.
Semiannual Report 2013
12
Columbia Emerging Markets Bond Fund
Portfolio of Investments (continued)
April 30, 2013 (Unaudited)
Fair Value Measurements (continued)
> Level 2 — Valuations based on other significant observable inputs (including quoted prices for similar securities, interest rates, prepayment speeds, credit risks, etc.).
> Level 3 — Valuations based on significant unobservable inputs (including the Fund's own assumptions and judgment in determining the fair value of investments).
Inputs that are used in determining fair value of an investment may include price information, credit data, volatility statistics, and other factors. These inputs can be either observable or unobservable. The availability of observable inputs can vary between investments, and is affected by various factors such as the type of investment, and the volume and level of activity for that investment or similar investments in the marketplace. The inputs will be considered by the Investment Manager, along with any other relevant factors in the calculation of an investment's fair value. The Fund uses prices and inputs that are current as of the measurement date, which may include periods of market dislocations. During these periods, the availability of prices and inputs may be reduced for many investments. This condition could cause an investment to be reclassified between the various levels within the hierarchy.
Investments falling into the Level 3 category are primarily supported by quoted prices from brokers and dealers participating in the market for those investments. However, these may be classified as Level 3 investments due to lack of market transparency and corroboration to support these quoted prices. Additionally, valuation models may be used as the pricing source for any remaining investments classified as Level 3. These models may rely on one or more significant unobservable inputs and/or significant assumptions by the Investment Manager. Inputs used in valuations may include, but are not limited to, financial statement analysis, capital account balances, discount rates and estimated cash flows, and comparable company data.
Under the direction of the Fund's Board of Trustees (the Board), the Investment Manager's Valuation Committee (the Committee) is responsible for carrying out the valuation procedures approved by the Board. The Committee consists of voting and non-voting members from various groups within the Investment Manager's organization, including operations and accounting, trading and investments, compliance, risk management and legal.
The Committee meets at least monthly to review and approve valuation matters, which may include a description of specific valuation determinations, data regarding pricing information received from approved pricing vendors and brokers and the results of Board-approved valuation control policies and procedures (the Policies). The Policies address, among other things, instances when market quotations are readily available, including recommendations of third party pricing vendors and a determination of appropriate pricing methodologies; events that require specific valuation determinations and assessment of fair value techniques; securities with a potential for stale pricing, including those that are illiquid, restricted, or in default; and the effectiveness of third-party pricing vendors, including periodic reviews of vendors. The Committee meets more frequently, as needed, to discuss additional valuation matters, which may include the need to review back-testing results, review time-sensitive information or approve related valuation actions. The Committee reports to the Board, with members of the Committee meeting with the Board at each of its regularly scheduled meetings to discuss valuation matters and actions during the period, similar to those described earlier.
For investments categorized as Level 3, the Committee monitors information similar to that described above, which may include: (i) data specific to the issuer or comparable issuers, (ii) general market or specific sector news and (iii) quoted prices and specific or similar security transactions. The Committee considers this data and any changes from prior periods in order to assess the reasonableness of observable and unobservable inputs, any assumptions or internal models used to value those securities and changes in fair value. This data is also used to corroborate, when available, information received from approved pricing vendors and brokers. Various factors impact the frequency of monitoring this information (which may occur as often as daily). However, the Committee may determine that changes to inputs, assumptions and models are not required as a result of the monitoring procedures performed.
The following table is a summary of the inputs used to value the Fund's investments at April 30, 2013:
Description | | Level 1
Quoted Prices in Active
Markets for Identical
Assets ($) | |
Level 2
Other Significant
Observable Inputs ($) | |
Level 3
Significant
Unobservable Inputs ($) | |
Total ($) | |
Bonds | |
Corporate Bonds & Notes | |
Banking | | | — | | | | 12,614,849 | | | | 2,614,075 | | | | 15,228,924 | | |
All Other Industries | | | — | | | | 76,449,190 | | | | — | | | | 76,449,190 | | |
Inflation-Indexed Bonds | | | — | | | | 53,589,539 | | | | — | | | | 53,589,539 | | |
Foreign Government Obligations | | | — | | | | 700,169,356 | | | | — | | | | 700,169,356 | | |
Total Bonds | | | — | | | | 842,822,934 | | | | 2,614,075 | | | | 845,437,009 | | |
Other | |
Money Market Funds | | | 52,526,380 | | | | — | | | | — | | | | 52,526,380 | | |
Total Other | | | 52,526,380 | | | | — | | | | — | | | | 52,526,380 | | |
The accompanying Notes to Financial Statements are an integral part of this statement.
Semiannual Report 2013
13
Columbia Emerging Markets Bond Fund
Portfolio of Investments (continued)
April 30, 2013 (Unaudited)
Fair Value Measurements (continued)
Description | | Level 1
Quoted Prices in Active
Markets for Identical
Assets ($) | |
Level 2
Other Significant
Observable Inputs ($) | |
Level 3
Significant
Unobservable Inputs ($) | |
Total ($) | |
Investments in Securities | | | 52,526,380 | | | | 842,822,934 | | | | 2,614,075 | | | | 897,963,389 | | |
Derivatives | |
Assets | |
Swap Contracts | | | — | | | | 15,864 | | | | — | | | | 15,864 | | |
Forward Foreign Currency Exchange Contracts | | | — | | | | 33,181 | | | | — | | | | 33,181 | | |
Liabilities | |
Swap Contracts | | | — | | | | (27,158 | ) | | | — | | | | (27,158 | ) | |
Forward Foreign Currency Exchange Contracts | | | — | | | | (59,854 | ) | | | — | | | | (59,854 | ) | |
Total | | | 52,526,380 | | | | 842,784,967 | | | | 2,614,075 | | | | 897,925,422 | | |
See the Portfolio of Investments for all investment classifications not indicated in the table.
The Fund's assets assigned to the Level 2 input category are generally valued using the market approach, in which a security's value is determined through reference to prices and information from market transactions for similar or identical assets.
There were no transfers of financial assets between Levels 1 and 2 during the period.
Derivative instruments are valued at unrealized appreciation (depreciation).
The following table is a reconciliation of Level 3 assets for which significant observable and/or unobservable inputs were used to determine fair value.
| | | Corporate Bonds
and Notes ($) | | Foreign
Government
Obligations ($) | | Total ($) | |
Balance as of October 31, 2012 | | | 2,641,714 | | | | 5,045,034 | | | | 7,686,748 | | |
Accrued discounts/premiums | | | 367 | | | | — | | | | 367 | | |
Realized gain (loss) | | | — | | | | — | | | | — | | |
Change in unrealized appreciation (depreciation)(a) | | | (28,006 | ) | | | — | | | | (28,006 | ) | |
Sales | | | — | | | | — | | | | — | | |
Purchases | | | — | | | | — | | | | — | | |
Transfers into Level 3 | | | — | | | | — | | | | — | | |
Transfers out of Level 3 | | | — | | | | (5,045,034 | ) | | | (5,045,034 | ) | |
Balance as of April 30, 2013 | | | 2,614,075 | | | | — | | | | 2,614,075 | | |
(a) Change in unrealized appreciation (depreciation) relating to securities held at April 30, 2013 was $(28,006).
The Fund's assets assigned to the Level 3 category are valued utilizing the valuation technique deemed the most appropriate in the circumstances. Certain Corporate Bonds classified as Level 3 securities are valued using the market approach and utilize single market quotations from broker dealers which may have included, but not limited to, the distressed nature of the security and observable transactions for similar assets in the market. Significant increases (decreases) to any of these inputs would result in a significantly lower (higher) fair value measurement.
Financial assets were transferred from Level 3 to Level 2 as observable market inputs were utilized and management's determination that there was sufficient, reliable and observable market data to value these assets as of period end, April 30, 2013.
Transfers in and/or out of Level 3 are determined based on the fair value at the beginning of the period for security positions held throughout the period.
The accompanying Notes to Financial Statements are an integral part of this statement.
Semiannual Report 2013
14
Columbia Emerging Markets Bond Fund
Statement of Assets and Liabilities
April 30, 2013 (Unaudited)
Assets | |
Investments, at value | |
Unaffiliated issuers (identified cost $763,020,777) | | $ | 845,437,009 | | |
Affiliated issuers (identified cost $52,526,380) | | | 52,526,380 | | |
Total investments (identified cost $815,547,157) | | | 897,963,389 | | |
Cash | | | 146,359 | | |
Foreign currency (identified cost $0) | | | 824,413 | | |
Unrealized appreciation on forward foreign currency exchange contracts | | | 33,181 | | |
Unrealized appreciation on swap contracts | | | 15,864 | | |
Premiums paid on outstanding swap contracts | | | 11,294 | | |
Receivable for: | |
Capital shares sold | | | 1,799,442 | | |
Dividends | | | 6,136 | | |
Interest | | | 12,780,709 | | |
Reclaims | | | 394,146 | | |
Prepaid expenses | | | 1,243 | | |
Total assets | | | 913,976,176 | | |
Liabilities | |
Unrealized depreciation on forward foreign currency exchange contracts | | | 59,854 | | |
Unrealized depreciation on swap contracts | | | 27,158 | | |
Payable for: | |
Investments purchased | | | 4,477,290 | | |
Investments purchased on a delayed delivery basis | | | 2,007,500 | | |
Capital shares purchased | | | 867,632 | | |
Investment management fees | | | 13,060 | | |
Distribution and/or service fees | | | 4,780 | | |
Foreign capital gains taxes deferred | | | 290,005 | | |
Transfer agent fees | | | 87,851 | | |
Administration fees | | | 1,677 | | |
Compensation of board members | | | 16,311 | | |
Other expenses | | | 36,263 | | |
Total liabilities | | | 7,889,381 | | |
Net assets applicable to outstanding capital stock | | $ | 906,086,795 | | |
Represented by | |
Paid-in capital | | $ | 819,456,659 | | |
Undistributed net investment income | | | 267,676 | | |
Accumulated net realized gain | | | 4,222,835 | | |
Unrealized appreciation (depreciation) on: | |
Investments | | | 82,416,232 | | |
Foreign currency translations | | | 51,365 | | |
Forward foreign currency exchange contracts | | | (26,673 | ) | |
Swap contracts | | | (11,294 | ) | |
Foreign capital gains tax | | | (290,005 | ) | |
Total — representing net assets applicable to outstanding capital stock | | $ | 906,086,795 | | |
The accompanying Notes to Financial Statements are an integral part of this statement.
Semiannual Report 2013
15
Columbia Emerging Markets Bond Fund
Statement of Assets and Liabilities (continued)
April 30, 2013 (Unaudited)
Class A | |
Net assets | | $ | 353,547,397 | | |
Shares outstanding | | | 27,805,501 | | |
Net asset value per share | | $ | 12.72 | | |
Maximum offering price per share(a) | | $ | 13.35 | | |
Class B | |
Net assets | | $ | 3,097,701 | | |
Shares outstanding | | | 243,667 | | |
Net asset value per share | | $ | 12.71 | | |
Class C | |
Net assets | | $ | 66,067,071 | | |
Shares outstanding | | | 5,218,825 | | |
Net asset value per share | | $ | 12.66 | | |
Class I | |
Net assets | | $ | 192,023,377 | | |
Shares outstanding | | | 15,100,087 | | |
Net asset value per share | | $ | 12.72 | | |
Class K | |
Net assets | | $ | 70,885 | | |
Shares outstanding | | | 5,580 | | |
Net asset value per share | | $ | 12.70 | | |
Class R | |
Net assets | | $ | 3,010,747 | | |
Shares outstanding | | | 236,843 | | |
Net asset value per share | | $ | 12.71 | | |
Class R4 | |
Net assets | | $ | 103,470 | | |
Shares outstanding | | | 8,134 | | |
Net asset value per share | | $ | 12.72 | | |
Class R5 | |
Net assets | | $ | 13,919,915 | | |
Shares outstanding | | | 1,094,960 | | |
Net asset value per share | | $ | 12.71 | | |
Class W | |
Net assets | | $ | 63,770,567 | | |
Shares outstanding | | | 5,021,228 | | |
Net asset value per share | | $ | 12.70 | | |
Class Y | |
Net assets | | $ | 9,478,447 | | |
Shares outstanding | | | 745,361 | | |
Net asset value per share | | $ | 12.72 | | |
Class Z | |
Net assets | | $ | 200,997,218 | | |
Shares outstanding | | | 15,805,370 | | |
Net asset value per share | | $ | 12.72 | | |
(a) The maximum offering price per share is calculated by dividing the net asset value by 1.0 minus the maximum sales charge of 4.75%.
The accompanying Notes to Financial Statements are an integral part of this statement.
Semiannual Report 2013
16
Columbia Emerging Markets Bond Fund
Statement of Operations
Six Months Ended April 30, 2013 (Unaudited)
Net investment income | |
Income: | |
Dividends — affiliated issuers | | $ | 31,071 | | |
Interest | | | 24,580,262 | | |
Income from securities lending — net | | | 186 | | |
Total income | | | 24,611,519 | | |
Expenses: | |
Investment management fees | | | 2,121,213 | | |
Distribution and/or service fees | |
Class A | | | 398,988 | | |
Class B | | | 15,119 | | |
Class C | | | 277,614 | | |
Class R | | | 6,953 | | |
Class W | | | 80,029 | | |
Transfer agent fees | |
Class A | | | 327,483 | | |
Class B | | | 3,101 | | |
Class C | | | 57,067 | | |
Class K | | | 18 | | |
Class R | | | 2,855 | | |
Class R4(a) | | | 16 | | |
Class R5(b) | | | 803 | | |
Class W | | | 65,646 | | |
Class Z | | | 189,957 | | |
Administration fees | | | 273,479 | | |
Plan administration fees | |
Class K | | | 89 | | |
Compensation of board members | | | 14,934 | | |
Custodian fees | | | 25,920 | | |
Printing and postage fees | | | 49,676 | | |
Registration fees | | | 120,024 | | |
Professional fees | | | 19,041 | | |
Other | | | 9,841 | | |
Total expenses | | | 4,059,866 | | |
Net investment income | | | 20,551,653 | | |
Realized and unrealized gain (loss) — net | |
Net realized gain (loss) on: | |
Investments | | | 4,843,927 | | |
Foreign currency translations | | | 30,677 | | |
Forward foreign currency exchange contracts | | | 276,054 | | |
Futures contracts | | | (370,211 | ) | |
Swap contracts | | | (40,886 | ) | |
Net realized gain | | | 4,739,561 | | |
Net change in unrealized appreciation (depreciation) on: | |
Investments | | | 12,882,465 | | |
Foreign currency translations | | | 75,094 | | |
Forward foreign currency exchange contracts | | | (79,607 | ) | |
Futures contracts | | | 89,194 | | |
Swap contracts | | | 40,887 | | |
Foreign capital gains tax | | | 9,917 | | |
Net change in unrealized appreciation (depreciation) | | | 13,017,950 | | |
Net realized and unrealized gain | | | 17,757,511 | | |
Net increase in net assets resulting from operations | | $ | 38,309,164 | | |
(a) Class R4 shares are for the period from March 19, 2013 (commencement of operations) to April 30, 2013.
(b) Class R5 shares are for the period from November 8, 2012 (commencement of operations) to April 30, 2013.
The accompanying Notes to Financial Statements are an integral part of this statement.
Semiannual Report 2013
17
Columbia Emerging Markets Bond Fund
Statement of Changes in Net Assets
| | | Six Months Ended
April 30, 2013
(Unaudited) | | Year Ended
October 31,
2012 | |
Operations | |
Net investment income | | $ | 20,551,653 | | | $ | 31,268,480 | | |
Net realized gain | | | 4,739,561 | | | | 6,647,217 | | |
Net change in unrealized appreciation (depreciation) | | | 13,017,950 | | | | 47,941,485 | | |
Net increase in net assets resulting from operations | | | 38,309,164 | | | | 85,857,182 | | |
Distributions to shareholders | |
Net investment income | |
Class A | | | (8,005,435 | ) | | | (10,973,703 | ) | |
Class B | | | (63,508 | ) | | | (133,350 | ) | |
Class C | | | (1,201,745 | ) | | | (1,527,054 | ) | |
Class I | | | (4,541,725 | ) | | | (9,599,340 | ) | |
Class K | | | (1,821 | ) | | | (3,693 | ) | |
Class R | | | (65,495 | ) | | | (103,674 | ) | |
Class R4(a) | | | (445 | ) | | | — | | |
Class R5(b) | | | (110,156 | ) | | | — | | |
Class W | | | (1,588,642 | ) | | | (3,463,410 | ) | |
Class Y(b) | | | (122,967 | ) | | | — | | |
Class Z | | | (4,835,468 | ) | | | (4,222,442 | ) | |
Net realized gains | |
Class A | | | (2,009,049 | ) | | | — | | |
Class B | | | (19,613 | ) | | | — | | |
Class C | | | (329,244 | ) | | | — | | |
Class I | | | (1,059,820 | ) | | | — | | |
Class K | | | (478 | ) | | | — | | |
Class R | | | (18,848 | ) | | | — | | |
Class R5(b) | | | (16 | ) | | | — | | |
Class W | | | (432,474 | ) | | | — | | |
Class Y(b) | | | (16 | ) | | | — | | |
Class Z | | | (1,141,006 | ) | | | — | | |
Total distributions to shareholders | | | (25,547,971 | ) | | | (30,026,666 | ) | |
Increase (decrease) in net assets from capital stock activity | | | 184,768,777 | | | | 217,536,796 | | |
Total increase in net assets | | | 197,529,970 | | | | 273,367,312 | | |
Net assets at beginning of period | | | 708,556,825 | | | | 435,189,513 | | |
Net assets at end of period | | $ | 906,086,795 | | | $ | 708,556,825 | | |
Undistributed net investment income | | $ | 267,676 | | | $ | 253,430 | | |
(a) Class R4 shares are for the period from March 19, 2013 (commencement of operations) to April 30, 2013.
(b) Class R5 and Class Y shares are for the period from November 8, 2012 (commencement of operations) to April 30, 2013.
The accompanying Notes to Financial Statements are an integral part of this statement.
Semiannual Report 2013
18
Columbia Emerging Markets Bond Fund
Statement of Changes in Net Assets (continued)
| | | Six Months Ended April 30, 2013
(Unaudited) | | Year Ended October 31, 2012 | |
| | | Shares | | Dollars ($) | | Shares | | Dollars ($) | |
Capital stock activity | |
Class A shares | |
Subscriptions(a) | | | 10,915,866 | | | | 137,927,933 | | | | 16,034,941 | | | | 189,932,122 | | |
Distributions reinvested | | | 744,637 | | | | 9,381,429 | | | | 834,942 | | | | 9,819,371 | | |
Redemptions | | | (6,625,078 | ) | | | (83,546,050 | ) | | | (8,397,743 | ) | | | (97,519,115 | ) | |
Net increase | | | 5,035,425 | | | | 63,763,312 | | | | 8,472,140 | | | | 102,232,378 | | |
Class B shares | |
Subscriptions | | | 35,296 | | | | 445,077 | | | | 66,815 | | | | 785,730 | | |
Distributions reinvested | | | 6,439 | | | | 81,112 | | | | 10,982 | | | | 128,128 | | |
Redemptions(a) | | | (30,599 | ) | | | (386,954 | ) | | | (96,697 | ) | | | (1,134,968 | ) | |
Net increase (decrease) | | | 11,136 | | | | 139,235 | | | | (18,900 | ) | | | (221,110 | ) | |
Class C shares | |
Subscriptions | | | 1,910,010 | | | | 24,034,826 | | | | 2,479,112 | | | | 29,021,492 | | |
Distributions reinvested | | | 97,801 | | | | 1,226,988 | | | | 96,440 | | | | 1,130,335 | | |
Redemptions | | | (480,037 | ) | | | (6,035,354 | ) | | | (643,797 | ) | | | (7,558,321 | ) | |
Net increase | | | 1,527,774 | | | | 19,226,460 | | | | 1,931,755 | | | | 22,593,506 | | |
Class I shares | |
Subscriptions | | | 2,043,937 | | | | 25,793,466 | | | | 2,001,642 | | | | 22,727,425 | | |
Distributions reinvested | | | 444,583 | | | | 5,601,123 | | | | 822,017 | | | | 9,598,391 | | |
Redemptions | | | (458,423 | ) | | | (5,784,615 | ) | | | (2,678,367 | ) | | | (31,536,595 | ) | |
Net increase | | | 2,030,097 | | | | 25,609,974 | | | | 145,292 | | | | 789,221 | | |
Class K shares | |
Subscriptions | | | 39 | | | | 496 | | | | 99 | | | | 1,139 | | |
Distributions reinvested | | | 151 | | | | 1,897 | | | | 260 | | | | 3,040 | | |
Redemptions | | | (402 | ) | | | (5,061 | ) | | | (50 | ) | | | (591 | ) | |
Net increase (decrease) | | | (212 | ) | | | (2,668 | ) | | | 309 | | | | 3,588 | | |
Class R shares | |
Subscriptions | | | 70,979 | | | | 894,630 | | | | 289,127 | | | | 3,322,322 | | |
Distributions reinvested | | | 1,646 | | | | 20,738 | | | | 2,072 | | | | 24,509 | | |
Redemptions | | | (65,893 | ) | | | (833,473 | ) | | | (61,088 | ) | | | (728,542 | ) | |
Net increase | | | 6,732 | | | | 81,895 | | | | 230,111 | | | | 2,618,289 | | |
Class R4 shares(b) | |
Subscriptions | | | 8,101 | | | | 101,789 | | | | — | | | | — | | |
Distributions reinvested | | | 33 | | | | 424 | | | | — | | | | — | | |
Net increase | | | 8,134 | | | | 102,213 | | | | — | | | | — | | |
Class R5 shares(c) | |
Subscriptions | | | 1,995,951 | | | | 25,182,268 | | | | — | | | | — | | |
Distributions reinvested | | | 8,703 | | | | 109,658 | | | | — | | | | — | | |
Redemptions | | | (909,694 | ) | | | (11,437,362 | ) | | | — | | | | — | | |
Net increase | | | 1,094,960 | | | | 13,854,564 | | | | — | | | | — | | |
The accompanying Notes to Financial Statements are an integral part of this statement.
Semiannual Report 2013
19
Columbia Emerging Markets Bond Fund
Statement of Changes in Net Assets (continued)
| | | Six Months Ended April 30, 2013
(Unaudited) | | Year Ended October 31, 2012 | |
| | | Shares | | Dollars ($) | | Shares | | Dollars ($) | |
Capital stock activity (continued) | |
Class W shares | |
Subscriptions | | | 786,710 | | | | 9,912,263 | | | | 1,531,707 | | | | 17,974,519 | | |
Distributions reinvested | | | 160,566 | | | | 2,020,924 | | | | 297,185 | | | | 3,463,103 | | |
Redemptions | | | (1,025,324 | ) | | | (12,907,949 | ) | | | (2,730,250 | ) | | | (32,261,417 | ) | |
Net decrease | | | (78,048 | ) | | | (974,762 | ) | | | (901,358 | ) | | | (10,823,795 | ) | |
Class Y shares(c) | |
Subscriptions | | | 736,069 | | | | 9,296,131 | | | | — | | | | — | | |
Distributions reinvested | | | 9,292 | | | | 116,789 | | | | — | | | | — | | |
Net increase | | | 745,361 | | | | 9,412,920 | | | | — | | | | — | | |
Class Z shares | |
Subscriptions | | | 8,071,099 | | | | 101,846,712 | | | | 11,411,803 | | | | 135,278,924 | | |
Distributions reinvested | | | 326,388 | | | | 4,112,395 | | | | 246,170 | | | | 2,902,633 | | |
Redemptions | | | (4,157,655 | ) | | | (52,403,473 | ) | | | (3,255,736 | ) | | | (37,836,838 | ) | |
Net increase | | | 4,239,832 | | | | 53,555,634 | | | | 8,402,237 | | | | 100,344,719 | | |
Total net increase | | | 14,621,191 | | | | 184,768,777 | | | | 18,261,586 | | | | 217,536,796 | | |
(a) Includes conversions of Class B shares to Class A shares, if any. The line items from the prior year have been combined to conform to the current year presentation.
(b) Class R4 shares are for the period from March 19, 2013 (commencement of operations) to April 30, 2013.
(c) Class R5 and Class Y shares are for the period from November 8, 2012 (commencement of operations) to April 30, 2013.
The accompanying Notes to Financial Statements are an integral part of this statement.
Semiannual Report 2013
20
Columbia Emerging Markets Bond Fund
The following tables are intended to help you understand the Fund's financial performance. Certain information reflects financial results for a single share of a class held for the periods shown. Per share net investment income (loss) amounts are calculated based on average shares outstanding during the period. Total return assumes reinvestment of all dividends and distributions, if any. Total return does not reflect payment of sales charges, if any, and is not annualized for periods of less than one year.
| | | Six Months Ended
April 30, 2013 | | Year Ended October 31, | |
Class A | | (Unaudited) | | 2012 | | 2011 | | 2010 | | 2009 | | 2008 | |
Per share data | |
Net asset value, beginning of period | | $ | 12.51 | | | $ | 11.33 | | | $ | 11.69 | | | $ | 10.35 | | | $ | 7.05 | | | $ | 10.57 | | |
Income from investment operations: | |
Net investment income | | | 0.31 | | | | 0.65 | | | | 0.68 | | | | 0.76 | | | | 0.53 | | | | 0.61 | | |
Net realized and unrealized gain (loss) | | | 0.29 | | | | 1.16 | | | | (0.29 | ) | | | 1.32 | | | | 3.22 | | | | (3.43 | ) | |
Total from investment operations | | | 0.60 | | | | 1.81 | | | | 0.39 | | | | 2.08 | | | | 3.75 | | | | (2.82 | ) | |
Less distributions to shareholders: | |
Net investment income | | | (0.31 | ) | | | (0.63 | ) | | | (0.75 | ) | | | (0.74 | ) | | | (0.45 | ) | | | (0.61 | ) | |
Net realized gains | | | (0.08 | ) | | | — | | | | — | | | | — | | | | — | | | | (0.09 | ) | |
Total distributions to shareholders | | | (0.39 | ) | | | (0.63 | ) | | | (0.75 | ) | | | (0.74 | ) | | | (0.45 | ) | | | (0.70 | ) | |
Net asset value, end of period | | $ | 12.72 | | | $ | 12.51 | | | $ | 11.33 | | | $ | 11.69 | | | $ | 10.35 | | | $ | 7.05 | | |
Total return | | | 4.89 | % | | | 16.51 | % | | | 3.58 | % | | | 20.75 | % | | | 54.87 | % | | | (28.44 | %) | |
Ratios to average net assets(a) | |
Total gross expenses | | | 1.11 | %(b) | | | 1.16 | % | | | 1.35 | % | | | 1.37 | % | | | 1.37 | % | | | 1.41 | % | |
Total net expenses(c) | | | 1.11 | %(b) | | | 1.16 | % | | | 1.28 | %(d) | | | 1.31 | % | | | 1.27 | % | | | 1.40 | % | |
Net investment income | | | 5.01 | %(b) | | | 5.54 | % | | | 5.91 | % | | | 6.93 | % | | | 5.85 | % | | | 6.31 | % | |
Supplemental data | |
Net assets, end of period (in thousands) | | $ | 353,547 | | | $ | 284,818 | | | $ | 162,047 | | | $ | 76,725 | | | $ | 32,726 | | | $ | 9,671 | | |
Portfolio turnover | | | 6 | % | | | 21 | % | | | 24 | % | | | 38 | % | | | 62 | % | | | 82 | % | |
Notes to Financial Highlights
(a) In addition to the fees and expenses which the Fund bears directly, the Fund indirectly bears a pro rata share of the fees and expenses of the acquired funds in which it invests. Such indirect expenses are not included in the reported expense ratios.
(b) Annualized.
(c) Total net expenses include the impact of certain waivers/reimbursements made by the Investment Manager and certain of its affiliates, if applicable.
(d) The benefits derived from expense reductions had an impact of less than 0.01%.
The accompanying Notes to Financial Statements are an integral part of this statement.
Semiannual Report 2013
21
Columbia Emerging Markets Bond Fund
Financial Highlights (continued)
| | | Six Months Ended
April 30, 2013 | | Year Ended October 31, | |
Class B | | (Unaudited) | | 2012 | | 2011 | | 2010 | | 2009 | | 2008 | |
Per share data | |
Net asset value, beginning of period | | $ | 12.51 | | | $ | 11.32 | | | $ | 11.67 | | | $ | 10.34 | | | $ | 7.05 | | | $ | 10.55 | | |
Income from investment operations: | |
Net investment income | | | 0.27 | | | | 0.57 | | | | 0.60 | | | | 0.67 | | | | 0.46 | | | | 0.55 | | |
Net realized and unrealized gain (loss) | | | 0.28 | | | | 1.16 | | | | (0.30 | ) | | | 1.31 | | | | 3.22 | | | | (3.42 | ) | |
Total from investment operations | | | 0.55 | | | | 1.73 | | | | 0.30 | | | | 1.98 | | | | 3.68 | | | | (2.87 | ) | |
Less distributions to shareholders: | |
Net investment income | | | (0.27 | ) | | | (0.54 | ) | | | (0.65 | ) | | | (0.65 | ) | | | (0.39 | ) | | | (0.54 | ) | |
Net realized gains | | | (0.08 | ) | | | — | | | | — | | | | — | | | | — | | | | (0.09 | ) | |
Total distributions to shareholders | | | (0.35 | ) | | | (0.54 | ) | | | (0.65 | ) | | | (0.65 | ) | | | (0.39 | ) | | | (0.63 | ) | |
Net asset value, end of period | | $ | 12.71 | | | $ | 12.51 | | | $ | 11.32 | | | $ | 11.67 | | | $ | 10.34 | | | $ | 7.05 | | |
Total return | | | 4.42 | % | | | 15.73 | % | | | 2.77 | % | | | 19.76 | % | | | 53.60 | % | | | (28.85 | %) | |
Ratios to average net assets(a) | |
Total gross expenses | | | 1.86 | %(b) | | | 1.90 | % | | | 2.22 | % | | | 2.13 | % | | | 2.15 | % | | | 2.19 | % | |
Total net expenses(c) | | | 1.86 | %(b) | | | 1.90 | % | | | 2.04 | %(d) | | | 2.08 | % | | | 2.04 | % | | | 2.17 | % | |
Net investment income | | | 4.25 | %(b) | | | 4.87 | % | | | 5.27 | % | | | 6.20 | % | | | 5.28 | % | | | 5.61 | % | |
Supplemental data | |
Net assets, end of period (in thousands) | | $ | 3,098 | | | $ | 2,908 | | | $ | 2,846 | | | $ | 3,569 | | | $ | 2,420 | | | $ | 1,178 | | |
Portfolio turnover | | | 6 | % | | | 21 | % | | | 24 | % | | | 38 | % | | | 62 | % | | | 82 | % | |
Notes to Financial Highlights
(a) In addition to the fees and expenses which the Fund bears directly, the Fund indirectly bears a pro rata share of the fees and expenses of the acquired funds in which it invests. Such indirect expenses are not included in the reported expense ratios.
(b) Annualized.
(c) Total net expenses include the impact of certain waivers/reimbursements made by the Investment Manager and certain of its affiliates, if applicable.
(d) The benefits derived from expense reductions had an impact of less than 0.01%.
The accompanying Notes to Financial Statements are an integral part of this statement.
Semiannual Report 2013
22
Columbia Emerging Markets Bond Fund
Financial Highlights (continued)
| | | Six Months Ended
April 30, 2013 | | Year Ended October 31, | |
Class C | | (Unaudited) | | 2012 | | 2011 | | 2010 | | 2009 | | 2008 | |
Per share data | |
Net asset value, beginning of period | | $ | 12.46 | | | $ | 11.30 | | | $ | 11.65 | | | $ | 10.32 | | | $ | 7.04 | | | $ | 10.54 | | |
Income from investment operations: | |
Net investment income | | | 0.27 | | | | 0.56 | | | | 0.58 | | | | 0.67 | | | | 0.45 | | | | 0.55 | | |
Net realized and unrealized gain (loss) | | | 0.28 | | | | 1.15 | | | | (0.26 | ) | | | 1.32 | | | | 3.22 | | | | (3.42 | ) | |
Total from investment operations | | | 0.55 | | | | 1.71 | | | | 0.32 | | | | 1.99 | | | | 3.67 | | | | (2.87 | ) | |
Less distributions to shareholders: | |
Net investment income | | | (0.27 | ) | | | (0.55 | ) | | | (0.67 | ) | | | (0.66 | ) | | | (0.39 | ) | | | (0.54 | ) | |
Net realized gains | | | (0.08 | ) | | | — | | | | — | | | | — | | | | — | | | | (0.09 | ) | |
Total distributions to shareholders | | | (0.35 | ) | | | (0.55 | ) | | | (0.67 | ) | | | (0.66 | ) | | | (0.39 | ) | | | (0.63 | ) | |
Net asset value, end of period | | $ | 12.66 | | | $ | 12.46 | | | $ | 11.30 | | | $ | 11.65 | | | $ | 10.32 | | | $ | 7.04 | | |
Total return | | | 4.46 | % | | | 15.55 | % | | | 2.96 | % | | | 19.87 | % | | | 53.57 | % | | | (28.88 | %) | |
Ratios to average net assets(a) | |
Total gross expenses | | | 1.86 | %(b) | | | 1.91 | % | | | 2.03 | % | | | 2.14 | % | | | 2.13 | % | | | 2.18 | % | |
Total net expenses(c) | | | 1.86 | %(b) | | | 1.91 | % | | | 2.02 | %(d) | | | 2.06 | % | | | 2.03 | % | | | 2.16 | % | |
Net investment income | | | 4.27 | %(b) | | | 4.78 | % | | | 5.11 | % | | | 6.14 | % | | | 5.06 | % | | | 5.64 | % | |
Supplemental data | |
Net assets, end of period (in thousands) | | $ | 66,067 | | | $ | 45,979 | | | $ | 19,877 | | | $ | 3,622 | | | $ | 722 | | | $ | 191 | | |
Portfolio turnover | | | 6 | % | | | 21 | % | | | 24 | % | | | 38 | % | | | 62 | % | | | 82 | % | |
Notes to Financial Highlights
(a) In addition to the fees and expenses which the Fund bears directly, the Fund indirectly bears a pro rata share of the fees and expenses of the acquired funds in which it invests. Such indirect expenses are not included in the reported expense ratios.
(b) Annualized.
(c) Total net expenses include the impact of certain waivers/reimbursements made by the Investment Manager and certain of its affiliates, if applicable.
(d) The benefits derived from expense reductions had an impact of less than 0.01%.
The accompanying Notes to Financial Statements are an integral part of this statement.
Semiannual Report 2013
23
Columbia Emerging Markets Bond Fund
Financial Highlights (continued)
| | | Six Months Ended
April 30, 2013 | | Year Ended October 31, | |
Class I | | (Unaudited) | | 2012 | | 2011 | | 2010 | | 2009 | | 2008 | |
Per share data | |
Net asset value, beginning of period | | $ | 12.51 | | | $ | 11.34 | | | $ | 11.69 | | | $ | 10.35 | | | $ | 7.05 | | | $ | 10.57 | | |
Income from investment operations: | |
Net investment income | | | 0.34 | | | | 0.72 | | | | 0.73 | | | | 0.77 | | | | 0.57 | | | | 0.69 | | |
Net realized and unrealized gain (loss) | | | 0.29 | | | | 1.14 | | | | (0.27 | ) | | | 1.35 | | | | 3.22 | | | | (3.46 | ) | |
Total from investment operations | | | 0.63 | | | | 1.86 | | | | 0.46 | | | | 2.12 | | | | 3.79 | | | | (2.77 | ) | |
Less distributions to shareholders: | |
Net investment income | | | (0.34 | ) | | | (0.69 | ) | | | (0.81 | ) | | | (0.78 | ) | | | (0.49 | ) | | | (0.66 | ) | |
Net realized gains | | | (0.08 | ) | | | — | | | | — | | | | — | | | | — | | | | (0.09 | ) | |
Total distributions to shareholders | | | (0.42 | ) | | | (0.69 | ) | | | (0.81 | ) | | | (0.78 | ) | | | (0.49 | ) | | | (0.75 | ) | |
Net asset value, end of period | | $ | 12.72 | | | $ | 12.51 | | | $ | 11.34 | | | $ | 11.69 | | | $ | 10.35 | | | $ | 7.05 | | |
Total return | | | 5.13 | % | | | 16.96 | % | | | 4.18 | % | | | 21.19 | % | | | 55.52 | % | | | (28.08 | %) | |
Ratios to average net assets(a) | |
Total gross expenses | | | 0.66 | %(b) | | | 0.68 | % | | | 0.83 | % | | | 0.92 | % | | | 0.88 | % | | | 0.91 | % | |
Total net expenses(c) | | | 0.66 | %(b) | | | 0.68 | % | | | 0.83 | % | | | 0.92 | % | | | 0.85 | % | | | 0.91 | % | |
Net investment income | | | 5.47 | %(b) | | | 6.11 | % | | | 6.43 | % | | | 7.13 | % | | | 6.59 | % | | | 6.89 | % | |
Supplemental data | |
Net assets, end of period (in thousands) | | $ | 192,023 | | | $ | 163,508 | | | $ | 146,569 | | | $ | 78,154 | | | $ | 106,359 | | | $ | 65,282 | | |
Portfolio turnover | | | 6 | % | | | 21 | % | | | 24 | % | | | 38 | % | | | 62 | % | | | 82 | % | |
Notes to Financial Highlights
(a) In addition to the fees and expenses which the Fund bears directly, the Fund indirectly bears a pro rata share of the fees and expenses of the acquired funds in which it invests. Such indirect expenses are not included in the reported expense ratios.
(b) Annualized.
(c) Total net expenses include the impact of certain waivers/reimbursements made by the Investment Manager and certain of its affiliates, if applicable.
The accompanying Notes to Financial Statements are an integral part of this statement.
Semiannual Report 2013
24
Columbia Emerging Markets Bond Fund
Financial Highlights (continued)
| | | Six Months Ended
April 30, 2013 | | Year Ended October 31, | |
Class K | | (Unaudited) | | 2012 | | 2011 | | 2010 | | 2009 | | 2008 | |
Per share data | |
Net asset value, beginning of period | | $ | 12.50 | | | $ | 11.31 | | | $ | 11.68 | | | $ | 10.35 | | | $ | 7.05 | | | $ | 10.56 | | |
Income from investment operations: | |
Net investment income | | | 0.32 | | | | 0.68 | | | | 0.71 | | | | 0.72 | | | | 0.54 | | | | 0.67 | | |
Net realized and unrealized gain (loss) | | | 0.28 | | | | 1.16 | | | | (0.31 | ) | | | 1.35 | | | | 3.23 | | | | (3.43 | ) | |
Total from investment operations | | | 0.60 | | | | 1.84 | | | | 0.40 | | | | 2.07 | | | | 3.77 | | | | (2.76 | ) | |
Less distributions to shareholders: | |
Net investment income | | | (0.32 | ) | | | (0.65 | ) | | | (0.77 | ) | | | (0.74 | ) | | | (0.47 | ) | | | (0.66 | ) | |
Net realized gains | | | (0.08 | ) | | | — | | | | — | | | | — | | | | — | | | | (0.09 | ) | |
Total distributions to shareholders | | | (0.40 | ) | | | (0.65 | ) | | | (0.77 | ) | | | (0.74 | ) | | | (0.47 | ) | | | (0.75 | ) | |
Net asset value, end of period | | $ | 12.70 | | | $ | 12.50 | | | $ | 11.31 | | | $ | 11.68 | | | $ | 10.35 | | | $ | 7.05 | | |
Total return | | | 4.89 | % | | | 16.87 | % | | | 3.65 | % | | | 20.75 | % | | | 55.14 | % | | | (27.98 | %) | |
Ratios to average net assets(a) | |
Total gross expenses | | | 0.95 | %(b) | | | 0.98 | % | | | 1.17 | % | | | 1.27 | % | | | 1.18 | % | | | 1.22 | % | |
Total net expenses(c) | | | 0.95 | %(b) | | | 0.98 | % | | | 1.13 | % | | | 1.22 | % | | | 1.11 | % | | | 0.97 | % | |
Net investment income | | | 5.15 | %(b) | | | 5.78 | % | | | 6.18 | % | | | 6.52 | % | | | 6.31 | % | | | 6.82 | % | |
Supplemental data | |
Net assets, end of period (in thousands) | | $ | 71 | | | $ | 72 | | | $ | 62 | | | $ | 124 | | | $ | 23 | | | $ | 15 | | |
Portfolio turnover | | | 6 | % | | | 21 | % | | | 24 | % | | | 38 | % | | | 62 | % | | | 82 | % | |
Notes to Financial Highlights
(a) In addition to the fees and expenses which the Fund bears directly, the Fund indirectly bears a pro rata share of the fees and expenses of the acquired funds in which it invests. Such indirect expenses are not included in the reported expense ratios.
(b) Annualized.
(c) Total net expenses include the impact of certain waivers/reimbursements made by the Investment Manager and certain of its affiliates, if applicable.
The accompanying Notes to Financial Statements are an integral part of this statement.
Semiannual Report 2013
25
Columbia Emerging Markets Bond Fund
Financial Highlights (continued)
Class R | | Six Months Ended
April 30, 2013
(Unaudited) | | Year Ended
October 31,
2012(a) | |
Per share data | |
Net asset value, beginning of period | | $ | 12.50 | | | $ | 11.30 | | |
Income from investment operations: | |
Net investment income | | | 0.30 | | | | 0.58 | | |
Net realized and unrealized gain | | | 0.29 | | | | 1.23 | | |
Total from investment operations | | | 0.59 | | | | 1.81 | | |
Less distributions to shareholders: | |
Net investment income | | | (0.30 | ) | | | (0.61 | ) | |
Net realized gains | | | (0.08 | ) | | | — | | |
Total distributions to shareholders | | | (0.38 | ) | | | (0.61 | ) | |
Net asset value, end of period | | $ | 12.71 | | | $ | 12.50 | | |
Total return | | | 4.76 | % | | | 16.57 | % | |
Ratios to average net assets(b) | |
Total gross expenses | | | 1.36 | %(c) | | | 1.42 | %(c) | |
Total net expenses(d) | | | 1.36 | %(c) | | | 1.42 | %(c) | |
Net investment income | | | 4.76 | %(c) | | | 5.15 | %(c) | |
Supplemental data | |
Net assets, end of period (in thousands) | | $ | 3,011 | | | $ | 2,877 | | |
Portfolio turnover | | | 6 | % | | | 21 | % | |
Notes to Financial Highlights
(a) For the period from November 16, 2011 (commencement of operations) to October 31, 2012.
(b) In addition to the fees and expenses which the Fund bears directly, the Fund indirectly bears a pro rata share of the fees and expenses of the acquired funds in which it invests. Such indirect expenses are not included in the reported expense ratios.
(c) Annualized.
(d) Total net expenses include the impact of certain waivers/reimbursements made by the Investment Manager and certain of its affiliates, if applicable.
The accompanying Notes to Financial Statements are an integral part of this statement.
Semiannual Report 2013
26
Columbia Emerging Markets Bond Fund
Financial Highlights (continued)
Class R4 | | Six Months Ended
April 30, 2013(a)
(Unaudited) | |
Per share data | |
Net asset value, beginning of period | | $ | 12.57 | | |
Income from investment operations: | |
Net investment income | | | 0.08 | | |
Net realized and unrealized gain | | | 0.18 | | |
Total from investment operations | | | 0.26 | | |
Less distributions to shareholders: | |
Net investment income | | | (0.11 | ) | |
Total distributions to shareholders | | | (0.11 | ) | |
Net asset value, end of period | | $ | 12.72 | | |
Total return | | | 2.06 | % | |
Ratios to average net assets(b) | |
Total gross expenses | | | 0.90 | %(c) | |
Total net expenses(d) | | | 0.90 | %(c) | |
Net investment income | | | 5.49 | %(c) | |
Supplemental data | |
Net assets, end of period (in thousands) | | $ | 103 | | |
Portfolio turnover | | | 6 | % | |
Notes to Financial Highlights
(a) For the period from March 19, 2013 (commencement of operations) to April 30, 2013.
(b) In addition to the fees and expenses which the Fund bears directly, the Fund indirectly bears a pro rata share of the fees and expenses of the acquired funds in which it invests. Such indirect expenses are not included in the reported expense ratios.
(c) Annualized.
(d) Total net expenses include the impact of certain waivers/reimbursements made by the Investment Manager and certain of its affiliates, if applicable.
The accompanying Notes to Financial Statements are an integral part of this statement.
Semiannual Report 2013
27
Columbia Emerging Markets Bond Fund
Financial Highlights (continued)
Class R5 | | Six Months Ended
April 30, 2013(a)
(Unaudited) | |
Per share data | |
Net asset value, beginning of period | | $ | 12.57 | | |
Income from investment operations: | |
Net investment income | | | 0.32 | | |
Net realized and unrealized gain | | | 0.24 | | |
Total from investment operations | | | 0.56 | | |
Less distributions to shareholders: | |
Net investment income | | | (0.34 | ) | |
Net realized gains | | | (0.08 | ) | |
Total distributions to shareholders | | | (0.42 | ) | |
Net asset value, end of period | | $ | 12.71 | | |
Total return | | | 4.51 | % | |
Ratios to average net assets(b) | |
Total gross expenses | | | 0.72 | %(c) | |
Total net expenses(d) | | | 0.72 | %(c) | |
Net investment income | | | 5.58 | %(c) | |
Supplemental data | |
Net assets, end of period (in thousands) | | $ | 13,920 | | |
Portfolio turnover | | | 6 | % | |
Notes to Financial Highlights
(a) For the period from November 8, 2012 (commencement of operations) to April 30, 2013.
(b) In addition to the fees and expenses which the Fund bears directly, the Fund indirectly bears a pro rata share of the fees and expenses of the acquired funds in which it invests. Such indirect expenses are not included in the reported expense ratios.
(c) Annualized.
(d) Total net expenses include the impact of certain waivers/reimbursements made by the Investment Manager and certain of its affiliates, if applicable.
The accompanying Notes to Financial Statements are an integral part of this statement.
Semiannual Report 2013
28
Columbia Emerging Markets Bond Fund
Financial Highlights (continued)
| | | Six Months Ended
April 30, 2013 | | Year Ended October 31, | |
Class W | | (Unaudited) | | 2012 | | 2011 | | 2010 | | 2009 | | 2008 | |
Per share data | |
Net asset value, beginning of period | | $ | 12.49 | | | $ | 11.31 | | | $ | 11.68 | | | $ | 10.34 | | | $ | 7.05 | | | $ | 10.55 | | |
Income from investment operations: | |
Net investment income | | | 0.31 | | | | 0.66 | | | | 0.68 | | | | 0.75 | | | | 0.53 | | | | 0.56 | | |
Net realized and unrealized gain (loss) | | | 0.29 | | | | 1.15 | | | | (0.30 | ) | | | 1.32 | | | | 3.21 | | | | (3.36 | ) | |
Total from investment operations | | | 0.60 | | | | 1.81 | | | | 0.38 | | | | 2.07 | | | | 3.74 | | | | (2.80 | ) | |
Less distributions to shareholders: | |
Net investment income | | | (0.31 | ) | | | (0.63 | ) | | | (0.75 | ) | | | (0.73 | ) | | | (0.45 | ) | | | (0.61 | ) | |
Net realized gains | | | (0.08 | ) | | | — | | | | — | | | | — | | | | — | | | | (0.09 | ) | |
Total distributions to shareholders | | | (0.39 | ) | | | (0.63 | ) | | | (0.75 | ) | | | (0.73 | ) | | | (0.45 | ) | | | (0.70 | ) | |
Net asset value, end of period | | $ | 12.70 | | | $ | 12.49 | | | $ | 11.31 | | | $ | 11.68 | | | $ | 10.34 | | | $ | 7.05 | | |
Total return | | | 4.89 | % | | | 16.53 | % | | | 3.47 | % | | | 20.68 | % | | | 54.69 | % | | | (28.29 | %) | |
Ratios to average net assets(a) | |
Total gross expenses | | | 1.11 | %(b) | | | 1.15 | % | | | 1.45 | % | | | 1.37 | % | | | 1.33 | % | | | 1.35 | % | |
Total net expenses(c) | | | 1.11 | %(b) | | | 1.15 | % | | | 1.30 | %(d) | | | 1.37 | % | | | 1.30 | % | | | 1.35 | % | |
Net investment income | | | 5.00 | %(b) | | | 5.63 | % | | | 5.96 | % | | | 6.93 | % | | | 6.18 | % | | | 6.08 | % | |
Supplemental data | |
Net assets, end of period (in thousands) | | $ | 63,771 | | | $ | 63,707 | | | $ | 67,886 | | | $ | 74,067 | | | $ | 117,037 | | | $ | 104,386 | | |
Portfolio turnover | | | 6 | % | | | 21 | % | | | 24 | % | | | 38 | % | | | 62 | % | | | 82 | % | |
Notes to Financial Highlights
(a) In addition to the fees and expenses which the Fund bears directly, the Fund indirectly bears a pro rata share of the fees and expenses of the acquired funds in which it invests. Such indirect expenses are not included in the reported expense ratios.
(b) Annualized.
(c) Total net expenses include the impact of certain waivers/reimbursements made by the Investment Manager and certain of its affiliates, if applicable.
(d) The benefits derived from expense reductions had an impact of less than 0.01%.
The accompanying Notes to Financial Statements are an integral part of this statement.
Semiannual Report 2013
29
Columbia Emerging Markets Bond Fund
Financial Highlights (continued)
Class Y | | Six Months Ended
April 30, 2013(a)
(Unaudited) | |
Per share data | |
Net asset value, beginning of period | | $ | 12.57 | | |
Income from investment operations | |
Net investment income | | | 0.33 | | |
Net realized and unrealized gain | | | 0.24 | | |
Total from investment operations | | | 0.57 | | |
Less distributions to shareholders: | |
Net investment income | | | (0.34 | ) | |
Net realized gains | | | (0.08 | ) | |
Total distributions to shareholders | | | (0.42 | ) | |
Net asset value, end of period | | $ | 12.72 | | |
Total return | | | 4.62 | % | |
Ratios to average net assets(b) | |
Total gross expenses | | | 0.66 | %(c) | |
Total net expenses(d) | | | 0.66 | %(c) | |
Net investment income | | | 5.60 | %(c) | |
Supplemental data | |
Net assets, end of period (in thousands) | | $ | 9,478 | | |
Portfolio turnover | | | 6 | % | |
Notes to Financial Highlights
(a) For the period from November 8, 2012 (commencement of operations) to April 30, 2013.
(b) In addition to the fees and expenses which the Fund bears directly, the Fund indirectly bears a pro rata share of the fees and expenses of the acquired funds in which it invests. Such indirect expenses are not included in the reported expense ratios.
(c) Annualized.
(d) Total net expenses include the impact of certain waivers/reimbursements made by the Investment Manager and certain of its affiliates, if applicable.
The accompanying Notes to Financial Statements are an integral part of this statement.
Semiannual Report 2013
30
Columbia Emerging Markets Bond Fund
Financial Highlights (continued)
| | | Six Months Ended
April 30, 2013 | | Year Ended October 31, | |
Class Z | | (Unaudited) | | 2012 | | 2011 | | 2010(a) | |
Per share data | |
Net asset value, beginning of period | | $ | 12.51 | | | $ | 11.35 | | | $ | 11.69 | | | $ | 11.47 | | |
Income from investment operations: | |
Net investment income | | | 0.33 | | | | 0.68 | | | | 0.68 | | | | 0.07 | | |
Net realized and unrealized gain (loss) | | | 0.29 | | | | 1.14 | | | | (0.22 | ) | | | 0.24 | | |
Total from investment operations | | | 0.62 | | | | 1.82 | | | | 0.46 | | | | 0.31 | | |
Less distributions to shareholders: | |
Net investment income | | | (0.33 | ) | | | (0.66 | ) | | | (0.80 | ) | | | (0.09 | ) | |
Net realized gains | | | (0.08 | ) | | | — | | | | — | | | | — | | |
Total distributions to shareholders | | | (0.41 | ) | | | (0.66 | ) | | | (0.80 | ) | | | (0.09 | ) | |
Net asset value, end of period | | $ | 12.72 | | | $ | 12.51 | | | $ | 11.35 | | | $ | 11.69 | | |
Total return | | | 5.02 | % | | | 16.64 | % | | | 4.16 | % | | | 2.68 | % | |
Ratios to average net assets(b) | |
Total gross expenses | | | 0.86 | %(c) | | | 0.91 | % | | | 0.84 | % | | | 1.32 | %(c) | |
Total net expenses(d) | | | 0.86 | %(c) | | | 0.91 | % | | | 0.84 | %(e) | | | 0.97 | %(c) | |
Net investment income | | | 5.26 | %(c) | | | 5.72 | % | | | 6.03 | % | | | 7.36 | %(c) | |
Supplemental data | |
Net assets, end of period (in thousands) | | $ | 200,997 | | | $ | 144,687 | | | $ | 35,902 | | | $ | 123 | | |
Portfolio turnover | | | 6 | % | | | 21 | % | | | 24 | % | | | 38 | % | |
Notes to Financial Highlights
(a) For the period from September 27, 2010 (commencement of operations) to October 31, 2010.
(b) In addition to the fees and expenses which the Fund bears directly, the Fund indirectly bears a pro rata share of the fees and expenses of the acquired funds in which it invests. Such indirect expenses are not included in the reported expense ratios.
(c) Annualized.
(d) Total net expenses include the impact of certain waivers/reimbursements made by the Investment Manager and certain of its affiliates, if applicable.
(e) The benefits derived from expense reductions had an impact of less than 0.01%.
The accompanying Notes to Financial Statements are an integral part of this statement.
Semiannual Report 2013
31
Columbia Emerging Markets Bond Fund
Notes to Financial Statements
April 30, 2013 (Unaudited)
Note 1. Organization
Columbia Emerging Markets Bond Fund (the Fund), a series of Columbia Funds Series Trust II (the Trust), is a non-diversified fund. The Trust is registered under the Investment Company Act of 1940, as amended (the 1940 Act), as an open-end management investment company organized as a Massachusetts business trust.
Fund Shares
The Trust may issue an unlimited number of shares (without par value). The Fund offers Class A, Class B, Class C, Class I, Class K, Class R, Class R4, Class R5, Class W, Class Y and Class Z shares. All share classes have identical voting, dividend and liquidation rights. Each share class has its own expense structure and sales charges, as applicable.
Class A shares are subject to a maximum front-end sales charge of 4.75% based on the initial investment amount. Class A shares purchased without an initial sales charge in accounts aggregating $1 million to $50 million at the time of purchase are subject to a contingent deferred sales charge (CDSC) if the shares are sold within 18 months of purchase, charged as follows: 1.00% CDSC if redeemed within 12 months of purchase, and 0.50% CDSC if redeemed more than 12, but less than 18, months after purchase.
Class B shares may be subject to a maximum CDSC of 5.00% based upon the holding period after purchase. Class B shares will generally convert to Class A shares eight years after purchase. The Fund no longer accepts investments by new or existing investors in the Fund's Class B shares, except in connection with the reinvestment of any dividend and/or capital gain distributions in Class B shares of the Fund and exchanges by existing Class B shareholders of certain other funds within the Columbia Family of Funds.
Class C shares are subject to a 1.00% CDSC on shares redeemed within one year of purchase.
Class I shares are not subject to sales charges and are available only to the Columbia Family of Funds.
Class K shares are not subject to sales charges, however this share class is closed to new investors.
Class R shares are not subject to sales charges and are available only to certain retirement plans and other eligible investors.
Class R4 shares are not subject to sales charges and are generally available only to omnibus retirement plans and certain other eligible investors. Class R4 shares commenced operations on March 19, 2013.
Class R5 shares are not subject to sales charges and are generally available only to investors purchasing through authorized investment professionals and omnibus retirement plans. Class R5 shares commenced operations on November 8, 2012.
Class W shares are not subject to sales charges and are available only to investors purchasing through authorized investment programs managed by investment professionals, including discretionary managed account programs.
Class Y shares are not subject to sales charges and are generally available only to certain retirement plans.
Class Y shares commenced operations on November 8, 2012.
Class Z shares are not subject to sales charges, and are available only to certain investors.
Note 2. Summary of Significant Accounting Policies
Use of Estimates
The preparation of financial statements in accordance with U.S. generally accepted accounting principles (GAAP) requires management to make certain estimates and assumptions that affect the reported amounts of assets and liabilities, the disclosure of contingent assets and liabilities at the date of the financial statements and the reported amounts of revenue and expenses during the reporting period. Actual results could differ from those estimates.
The following is a summary of significant accounting policies consistently followed by the Fund in the preparation of its financial statements.
Security Valuation
Debt securities generally are valued by pricing services approved by the Board of Trustees (the Board) based upon market transactions for normal, institutional-size trading units of similar securities. The services may use various pricing techniques which take into account appropriate factors such as yield, quality, coupon rate, maturity, type of issue, trading characteristics and other data, as well as broker quotes. Debt securities for which quotations are readily available may also be valued based upon an over-the-counter or exchange bid quotation.
Investments in other open-end investment companies, including money market funds, are valued at net asset value.
Forward foreign currency exchange contracts are marked-to-market based upon foreign currency exchange rates provided by a pricing service.
Semiannual Report 2013
32
Columbia Emerging Markets Bond Fund
Notes to Financial Statements (continued)
April 30, 2013 (Unaudited)
Futures and options on futures contracts are valued based upon the settlement price established each day by the board of trade or exchange on which they are traded.
Swap transactions are valued through an independent pricing service or broker, or if neither is available, through an internal model based upon observable inputs.
Investments for which market quotations are not readily available, or that have quotations which management believes are not reliable, are valued at fair value as determined in good faith under consistently applied procedures established by and under the general supervision of the Board. If a security or class of securities (such as foreign securities) is valued at fair value, such value is likely to be different from the last quoted market price for the security.
The determination of fair value often requires significant judgment. To determine fair value, management may use assumptions including but not limited to future cash flows and estimated risk premiums. Multiple inputs from various sources may be used to determine fair value.
Foreign Currency Transactions and Translations
The values of all assets and liabilities denominated in foreign currencies are translated into U.S. dollars at that day's exchange rates. Net realized and unrealized gains (losses) on foreign currency transactions and translations include gains (losses) arising from the fluctuation in exchange rates between trade and settlement dates on securities transactions, gains (losses) arising from the disposition of foreign currency and currency gains (losses) between the accrual and payment dates on dividends, interest income and foreign withholding taxes.
For financial statement purposes, the Fund does not distinguish that portion of gains (losses) on investments which is due to changes in foreign exchange rates from that which is due to changes in market prices of the investments. Such fluctuations are included with the net realized and unrealized gains (losses) on investments in the Statement of Operations.
Derivative Instruments
The Fund invests in certain derivative instruments, as detailed below, to meet its investment objectives. Derivatives are instruments whose values depend on, or are derived from, in whole or in part, the value of one or more other assets, such as securities, currencies, commodities or indices. Derivative instruments may be used to maintain cash reserves while maintaining exposure to certain other assets, to offset anticipated declines in values of investments, to facilitate trading, to reduce transaction costs and to pursue higher investment returns. The Fund may also use derivative instruments to mitigate certain investment risks, such as foreign currency exchange rate risk, interest rate risk and
credit risk. Derivatives may involve various risks, including the potential inability of the counterparty to fulfill its obligation under the terms of the contract, the potential for an illiquid secondary market and the potential for market movements which may expose the Fund to gains or losses in excess of the amount shown in the Statement of Assets and Liabilities.
The Fund and any counterparty are required to maintain an agreement that requires the Fund and that counterparty to monitor (on a daily basis) the net fair value of all derivatives entered into pursuant to the agreement between the Fund and such counterparty. If the net fair value of such derivatives between the Fund and that counterparty exceeds a certain threshold (as defined in the agreement), the Fund or the counterparty (as the case may be) is required to post cash and/or securities as collateral. Fair values of derivatives presented in the financial statements are not netted with the fair value of other derivatives or with any collateral amounts posted by the Fund or any counterparty.
Forward Foreign Currency Exchange Contracts
Forward foreign currency exchange contracts are agreements between two parties to buy and sell a currency at a set price on a future date. These contracts are intended to be used to minimize the exposure to foreign exchange rate fluctuations during the period between the trade and settlement dates of the contract. The Fund utilized forward foreign currency exchange contracts to hedge the currency exposure associated with some or all of the Fund's securities and to shift U.S. dollar exposure to achieve a representative weighted mix of major currencies in its benchmark, and/or to recover an underweight country exposure in its portfolio.
The values of forward foreign currency exchange contracts fluctuate with changes in foreign currency exchange rates. The Fund will record a realized gain or loss when the forward foreign currency exchange contract expires or is closed.
The use of forward foreign currency exchange contracts does not eliminate fluctuations in the prices of the Fund's portfolio securities. The risks of forward foreign currency exchange contracts include movement in the values of the foreign currencies relative to the U.S. dollar (or other foreign currencies) and the possibility that counterparties will not complete their contractual obligations, which may be in excess of the amount reflected, if any, in the Statement of Assets and Liabilities.
Futures Contracts
Futures contracts represent commitments for the future purchase or sale of an asset at a specified price on a specified date. The Fund bought and sold futures contracts to manage
Semiannual Report 2013
33
Columbia Emerging Markets Bond Fund
Notes to Financial Statements (continued)
April 30, 2013 (Unaudited)
the duration and yield curve exposure of the Fund versus the benchmark and manage exposure to movements in interest rates. Upon entering into futures contracts, the Fund bears risks which may include interest rates, exchange rates or securities prices moving unexpectedly, in which case, the Fund may not achieve the anticipated benefits of the futures contracts and may realize a loss. Additional risks include counterparty credit risk, the possibility of an illiquid market, and that a change in the value of the contract or option may not correlate with changes in the value of the underlying asset.
Upon entering into a futures contract, the Fund pledges cash or securities with the broker in an amount sufficient to meet the initial margin requirement. Subsequent payments (variation margin) are made or received by the Fund each day. The variation margin payments are equal to the daily change in the contract value and are recorded as variation margin receivable or payable and are offset in unrealized gains or losses. The Fund recognizes a realized gain or loss when the contract is closed or expires. Futures contracts involve, to varying degrees, risk of loss in excess of the variation margin disclosed in the Statement of Assets and Liabilities.
Credit Default Swap Contracts
Credit default swap contracts are agreements in which one party pays fixed periodic payments to a counterparty in consideration for a guarantee from the counterparty to make a specific payment should a specified negative credit event(s) take place. The Fund entered into credit default swap contracts to increase or decrease its credit exposure to an index.
As the purchaser of a credit default swap contract, the Fund purchases protection by paying a periodic interest rate on the notional amount to the counterparty. The interest amount is accrued daily as a component of unrealized appreciation (depreciation) and is recorded as a realized loss upon payment. If a credit event as specified in the contract occurs, the Fund may have the option either to deliver the reference obligation to the seller in exchange for a cash payment of its par amount, or to receive a net cash settlement equal to the par amount less an agreed-upon value of the reference obligation as of the date of the credit event. The difference between the value of the obligation or cash delivered and the notional amount received will be recorded as a realized gain (loss).
As the seller of a credit default swap contract, the Fund sells protection to a buyer and will generally receive a periodic interest rate on the notional amount. The interest amount is accrued daily as a component of unrealized appreciation (depreciation) and is recorded as a realized gain upon receipt of the payment. If a credit event as specified in the contract occurs, the Fund may either be required to accept the reference obligation from the buyer in exchange for a cash payment of
its notional amount, or to pay the buyer a net cash settlement equal to the notional amount less an agreed-upon value of the reference obligation as of the date of the credit event. The difference between the value of the obligation or cash received and the notional amount paid will be recorded as a realized gain (loss). The maximum potential amount of undiscounted future payments the Fund could be required to make as the seller of protection under a credit default swap contract is equal to the notional amount of the reference obligation. Notional amounts of all credit default swap contracts outstanding for which the Fund is the seller of protection, if any, are disclosed in the Credit Default Swap Contracts Outstanding schedule following the Portfolio of Investments. These potential amounts may be partially offset by any recovery values of the respective reference obligations or premiums received upon entering into the agreement.
As a protection seller, the Fund bears the risk of loss from the credit events specified in the contract. Although specified events are contract specific, credit events are generally defined as bankruptcy, failure to pay, restructuring, obligation acceleration, obligation default, or repudiation/moratorium. For credit default swap contracts on credit indices, quoted market prices and resulting market values serve as an indicator of the current status of the payment/performance risk. Increasing market values, in absolute terms when compared to the notional amount of the swap, represent a deterioration of the reference entity's credit soundness and a greater likelihood or risk of default or other credit event occurring as defined under the terms of the contract. Market values for credit default swap contracts in which the Fund is the seller of protection, if any, are disclosed in the Credit Default Swap Contracts Outstanding schedule following the Portfolio of Investments.
The notional amounts and market values of credit default swap contracts are not recorded in the financial statements. Any premium paid or received by the Fund upon entering into a credit default swap contract is recorded as an asset or liability, respectively, and amortized daily as a component of realized gain (loss) in the Statement of Operations. Credit default swap contracts are valued daily, and the change in value is recorded as unrealized appreciation (depreciation) until the termination of the swap, at which time a realized gain (loss) is recorded.
Credit default swap contracts can involve greater risks than if a fund had invested in the reference obligation directly since, in addition to general market risks, credit default swaps are subject to counterparty credit risk, leverage risk, hedging risk, correlation risk and liquidity risk. The Fund will enter into credit default swap transactions only with counterparties that meet certain standards of creditworthiness.
Semiannual Report 2013
34
Columbia Emerging Markets Bond Fund
Notes to Financial Statements (continued)
April 30, 2013 (Unaudited)
At April 30, 2013, no collateral had been posted by either the fund or the counterparty.
Effects of Derivative Transactions in the Financial Statements
The following tables are intended to provide additional information about the effect of derivatives on the financial statements of the Fund, including: the fair value of derivatives by risk category and the location of those fair values in the Statement of Assets and Liabilities; the impact of derivative transactions on the Fund's operations over the period including realized gains or losses and unrealized gains or losses. The derivative schedules following the Portfolio of Investments present additional information regarding derivative instruments outstanding at the end of the period, if any.
The following table is a summary of the fair value of derivative instruments at April 30, 2013:
Asset Derivatives | |
Risk Exposure
Category | | Statement of Assets and
Liabilities Location | | Fair Value ($) | |
Credit contracts
| | Unrealized appreciation on
swap contracts | | | 15,864
| | |
Credit contracts
| | Premiums paid on
outstanding credit default
swap contracts | | | 11,294
| | |
Foreign exchange
contracts
| | Unrealized appreciation on
forward foreign currency
exchange contracts | | | 33,181
| | |
Total | | | | | 60,339 | | |
Liability Derivatives | |
Risk Exposure
Category | | Statement of Assets and
Liabilities Location | | Fair Value ($) | |
Credit contracts
| | Unrealized depreciation on
swap contracts | | | 27,158
| | |
Foreign exchange
contracts
| | Unrealized depreciation on
forward foreign currency
exchange contracts | | | 59,854
| | |
Total | | | | | 87,012 | | |
The effect of derivative instruments in the Statement of Operations for the six months ended April 30, 2013:
Amount of Realized Gain (Loss) on Derivatives Recognized in Income | |
| Risk Exposure Category | | Forward Foreign
Currency Exchange
Contracts ($) | | Futures
Contracts ($) | | Swap Contracts ($) | | Total ($) | |
Credit contracts | | | — | | | | — | | | | (40,886 | ) | | | (40,886 | ) | |
Foreign exchange contracts | | | 276,054 | | | | — | | | | — | | | | 276,054 | | |
Interest rate contracts | | | — | | | | (370,211 | ) | | | — | | | | (370,211 | ) | |
Total | | | 276,054 | | | | (370,211 | ) | | | (40,886 | ) | | | (135,043 | ) | |
Change in Unrealized Appreciation (Depreciation) on Derivatives Recognized in Income | |
| Risk Exposure Category | | Forward Foreign
Currency Exchange
Contracts ($) | | Futures
Contracts ($) | | Swap Contracts ($) | | Total ($) | |
Credit contracts | | | — | | | | — | | | | 40,887 | | | | 40,887 | | |
Foreign exchange contracts | | | (79,607 | ) | | | — | | | | — | | | | (79,607 | ) | |
Interest rate contracts | | | — | | | | 89,194 | | | | — | | | | 89,194 | | |
Total | | | (79,607 | ) | | | 89,194 | | | | 40,887 | | | | 50,474 | | |
Semiannual Report 2013
35
Columbia Emerging Markets Bond Fund
Notes to Financial Statements (continued)
April 30, 2013 (Unaudited)
The following table is a summary of the volume of derivative instruments for the six months ended April 30, 2013:
Derivative Instrument | | Contracts Opened | |
Forward foreign currency exchange contracts | | | 20 | | |
Futures contracts | | | 92 | | |
Delayed Delivery Securities
The Fund may trade securities on other than normal settlement terms, including securities purchased or sold on a "when-issued" basis. This may increase the risk if the other party to the transaction fails to deliver and causes the Fund to subsequently invest at less advantageous prices. The Fund designates cash or liquid securities in an amount equal to the delayed delivery commitment.
Security Transactions
Security transactions are accounted for on the trade date. Cost is determined and gains (losses) are based upon the specific identification method for both financial statement and federal income tax purposes.
Income Recognition
Interest income is recorded on an accrual basis. Market premiums and discounts, including original issue discounts, are amortized and accreted, respectively, over the expected life of the security on all debt securities, unless otherwise noted.
Expenses
General expenses of the Trust are allocated to the Fund and other funds of the Trust based upon relative net assets or other expense allocation methodologies determined by the nature of the expense. Expenses directly attributable to the Fund are charged to the Fund. Expenses directly attributable to a specific class of shares are charged to that share class.
Determination of Class Net Asset Value
All income, expenses (other than class-specific expenses, which are charged to that share class, as shown in the Statement of Operations) and realized and unrealized gains (losses) are allocated to each class of the Fund on a daily basis, based on the relative net assets of each class, for purposes of determining the net asset value of each class.
Federal Income Tax Status
The Fund intends to qualify each year as a regulated investment company under Subchapter M of the Internal Revenue Code, as amended, and will distribute substantially all of its taxable income (including net short-term capital gains), if any, for its tax year, and as such will not be subject to federal income taxes. In addition, the Fund intends to distribute in each calendar year substantially all of its net investment income, capital gains and certain other amounts, if
any, such that the Fund should not be subject to federal excise tax. Therefore, no federal income or excise tax provision is recorded.
Foreign Taxes
The Fund may be subject to foreign taxes on income, gains on investments or currency repatriation, a portion of which may be recoverable. The Fund will accrue such taxes and recoveries, as applicable, based upon its current interpretation of tax rules and regulations that exist in the markets in which it invests.
Realized gains in certain countries may be subject to foreign taxes at the Fund level, based on statutory rates. The Fund accrues for such foreign taxes on net realized and unrealized gains at the appropriate rate for each jurisdiction, as applicable. The amount, if any, is disclosed as a liability on the Statement of Assets and Liabilities.
Distributions to Shareholders
Distributions from net investment income, if any, are declared and paid monthly. Net realized capital gains, if any, are distributed at least annually. Income distributions and capital gain distributions are determined in accordance with federal income tax regulations, which may differ from GAAP.
Guarantees and Indemnifications
Under the Trust's organizational documents and, in some cases, by contract, its officers and trustees are indemnified against certain liabilities arising out of the performance of their duties to the Trust or its funds. In addition, certain of the Fund's contracts with its service providers contain general indemnification clauses. The Fund's maximum exposure under these arrangements is unknown since the amount of any future claims that may be made against the Fund cannot be determined, and the Fund has no historical basis for predicting the likelihood of any such claims.
Recent Accounting Pronouncement
Disclosures about Offsetting Assets and Liabilities
In December 2011, the Financial Accounting Standards Board (FASB) issued Accounting Standards Update (ASU) No. 2011-11, Disclosures about Offsetting Assets and Liabilities and in January 2013, ASU No. 2013-1, Clarifying the Scope of Disclosures about Offsetting Assets and Liabilities (collectively, the ASUs). Specifically, the ASUs require an entity to disclose both gross and net information for derivatives and other financial instruments that are subject to a master netting arrangement or similar agreement. The ASUs require disclosure of collateral received in connection with the master netting agreements or similar agreements. The disclosure requirements are effective for interim and annual periods beginning on or after January 1, 2013. At this time,
Semiannual Report 2013
36
Columbia Emerging Markets Bond Fund
Notes to Financial Statements (continued)
April 30, 2013 (Unaudited)
management is evaluating the implications of this guidance and the impact it will have on the financial statement amounts and footnote disclosures, if any.
Note 3. Fees and Compensation Paid to Affiliates
Investment Management Fees
Under an Investment Management Services Agreement, Columbia Management Investment Advisers, LLC (the Investment Manager), a wholly-owned subsidiary of Ameriprise Financial, Inc. (Ameriprise Financial), determines which securities will be purchased, held or sold. The investment management fee is an annual fee that is equal to a percentage of the Fund's average daily net assets that declines from 0.530% to 0.353% as the Fund's net assets increase. The annualized effective investment management fee rate for the six months ended April 30, 2013 was 0.53% of the Fund's average daily net assets.
Administration Fees
Under an Administrative Services Agreement, the Investment Manager also serves as the Fund Administrator. The Fund pays the Fund Administrator an annual fee for administration and accounting services equal to a percentage of the Fund's average daily net assets that declines from 0.07% to 0.04% as the Fund's net assets increase. The annualized effective administration fee rate for the six months ended April 30, 2013 was 0.07% of the Fund's average daily net assets.
Other Expenses
Other expenses are for, among other things, certain expenses of the Fund or the Board, including: Fund boardroom and office expense, employee compensation, employee health and retirement benefits, and certain other expenses. Payment of these Fund and Board expenses is facilitated by a company providing limited administrative services to the Fund and the Board. For the six months ended April 30, 2013, other expenses paid to this company were $1,337.
Compensation of Board Members
Board members are compensated for their services to the Fund as disclosed in the Statement of Operations. Under a Deferred Compensation Plan (the Plan), the Board members who are not "interested persons" of the Fund, as defined under the 1940 Act, may elect to defer payment of up to 100% of their compensation. Deferred amounts are treated as though equivalent dollar amounts had been invested in shares of certain funds managed by the Investment Manager. The Fund's liability for these amounts is adjusted for market value changes and remains in the Fund until distributed in accordance with the Plan.
Transfer Agent Fees
Under a Transfer and Dividend Disbursing Agent Agreement, Columbia Management Investment Services Corp. (the Transfer Agent), an affiliate of the Investment Manager and a wholly-owned subsidiary of Ameriprise Financial, is responsible for providing transfer agency services to the Fund. The Transfer Agent has contracted with Boston Financial Data Services (BFDS) to serve as sub-transfer agent.
The Transfer Agent receives monthly account-based service fees based on the number of open accounts and also receives sub-transfer agency fees based on a percentage of the average aggregate value of the Fund's shares maintained in omnibus account (other than omnibus accounts for which American Enterprise Investment Services Inc. is the broker of record or accounts where the beneficial shareholder is a customer of Ameriprise Financial Services, Inc., which are paid a per account fee). The Transfer Agent pays the fees of BFDS for services as sub-transfer agent and is not entitled to reimbursement for such fees from the Fund (with the exception of out-of-pocket fees).
The Transfer Agent also receives compensation from fees for various shareholder services and reimbursements for certain out-of-pocket fees. Class I shares do not pay transfer agent fees. Total transfer agent fees for Class K and Class R5 shares are subject to an annual limitation of not more than 0.05% of the average daily net assets attributable to each share class. Beginning November 8, 2012, Class Y shares are not subject to transfer agent fees for at least twelve months.
For the six months ended April 30, 2013, the Fund's annualized effective transfer agent fee rates as a percentage of average daily net assets of each class were as follows:
Class A | | | 0.21 | % | |
Class B | | | 0.20 | | |
Class C | | | 0.21 | | |
Class K | | | 0.05 | | |
Class R | | | 0.21 | | |
Class R4 | | | 0.22 | | |
Class R5 | | | 0.05 | | |
Class W | | | 0.20 | | |
Class Z | | | 0.21 | | |
An annual minimum account balance fee of $20 may apply to certain accounts with a value below the Fund's initial minimum investment requirements to reduce the impact of small accounts on transfer agent fees. These minimum account balance fees are recorded as part of expense reductions in the Statement of Operations. For the six months ended April 30, 2013, no minimum account balance fees were charged by the Fund.
Semiannual Report 2013
37
Columbia Emerging Markets Bond Fund
Notes to Financial Statements (continued)
April 30, 2013 (Unaudited)
Plan Administration Fees
Under a Plan Administration Services Agreement with the Transfer Agent, the Fund pays an annual fee at a rate of 0.25% of the Fund's average daily net assets attributable to Class K shares for the provision of various administrative, recordkeeping, communication and educational services.
Distribution Fees
The Fund has an agreement with Columbia Management Investment Distributors, Inc. (the Distributor), an affiliate of the Investment Manager and a wholly-owned subsidiary of Ameriprise Financial, for distribution and shareholder services. Under a Plan and Agreement of Distribution pursuant to Rule 12b-1, the Fund pays a fee at an annual rate of up to 0.25% of the Fund's average daily net assets attributable to Class A and Class W shares, a fee at an annual rate of up to 0.50% of the Fund's average daily net assets attributable to Class R shares (of which up to 0.25% may be used for shareholder services) and a fee at an annual rate of up to 1.00% of the Fund's average daily net assets attributable to Class B and Class C shares. For Class B and Class C shares, of the 1.00% fee, up to 0.75% is reimbursed for distribution expenses.
The amount of distribution expenses incurred by the Distributor and not yet reimbursed (unreimbursed expense) was approximately $172,000 and $415,000 for Class B and Class C shares, respectively. These amounts are based on the most recent information available as of March 31, 2013, and may be recovered from future payments under the distribution plan or CDSCs. To the extent the unreimbursed expense has been fully recovered, the distribution fee is reduced.
Sales Charges
Sales charges, including front-end charges and CDSCs, received by the Distributor for distributing Fund shares were $462,091 for Class A, $241 for Class B and $3,187 for Class C shares for the six months ended April 30, 2013.
Expenses Waived/Reimbursed by the Investment Manager and its Affiliates
The Investment Manager and certain of its affiliates have contractually agreed to waive fees and/or reimburse expenses (excluding certain fees and expenses described below) for the periods disclosed below, unless sooner terminated at the sole discretion of the Board, so that the Fund's net operating expenses, after giving effect to fees waived/expenses reimbursed and any balance credits and/or overdraft charges
from the Fund's custodian, do not exceed the following annual rates as a percentage of the class' average daily net assets:
| | | March 1, 2013
through
February 28, 2014 | | Prior to
March 1, 2013 | |
Class A | | | 1.25 | % | | | 1.28 | % | |
Class B | | | 2.00 | | | | 2.03 | | |
Class C | | | 2.00 | | | | 2.03 | | |
Class I | | | 0.83 | | | | 0.83 | | |
Class K | | | 1.13 | | | | 1.13 | | |
Class R | | | 1.50 | | | | 1.53 | | |
Class R4 | | | 1.00 | * | | | — | | |
Class R5 | | | 0.88 | | | | 0.88 | | |
Class W | | | 1.25 | | | | 1.28 | | |
Class Y | | | 0.83 | | | | 0.83 | | |
Class Z | | | 1.00 | | | | 1.03 | | |
*Annual rate is contractual from March 19, 2013 (the commencement of operations of Class R4 shares) through February 28, 2014.
Under the agreement governing these fee waivers and/or expense reimbursement arrangements, the following fees and expenses are excluded from the waiver/reimbursement commitment, and therefore will be paid by the Fund, if applicable: taxes (including foreign transaction taxes), expenses associated with investments in affiliated and non-affiliated pooled investment vehicles (including mutual funds and exchange traded funds), transaction costs and brokerage commissions, costs related to any securities lending program, dividend expenses associated with securities sold short, inverse floater program fees and expenses, transaction charges and interest on borrowed money, interest, extraordinary expenses and any other expenses the exclusion of which is specifically approved by the Board. This agreement may be modified or amended only with approval from all parties.
Note 4. Federal Tax Information
The timing and character of income and capital gain distributions are determined in accordance with income tax regulations, which may differ from GAAP because of temporary or permanent book to tax differences.
At April 30, 2013, the cost of investments for federal income tax purposes was approximately $815,547,000 and the aggregate gross approximate unrealized appreciation and depreciation based on that cost was:
Unrealized appreciation | | $ | 85,302,000 | | |
Unrealized depreciation | | | 2,886,000 | | |
Net unrealized appreciation | | $ | 82,416,000 | | |
Semiannual Report 2013
38
Columbia Emerging Markets Bond Fund
Notes to Financial Statements (continued)
April 30, 2013 (Unaudited)
Management of the Fund has concluded that there are no significant uncertain tax positions that would require recognition in the financial statements. However, management's conclusion may be subject to review and adjustment at a later date based on factors including, but not limited to, new tax laws, regulations, and administrative interpretations (including relevant court decisions). Generally, the Fund's federal tax returns for the prior three fiscal years remain subject to examination by the Internal Revenue Service.
Note 5. Portfolio Information
The cost of purchases and proceeds from sales of securities, excluding short-term obligations, aggregated to $218,992,071 and $49,211,284, respectively, for the six months ended April 30, 2013.
Note 6. Lending of Portfolio Securities
Effective December 19, 2012, the Fund no longer participates in securities lending activity. Prior to that date, the Fund participated, or was eligible to participate, in securities lending activity pursuant to a Master Securities Lending Agreement (the Agreement) with JPMorgan Chase Bank, N.A. (JPMorgan). The Agreement authorized JPMorgan as lending agent to lend securities to authorized borrowers in order to generate additional income on behalf of the Fund. Pursuant to the Agreement, the securities loaned were secured by cash or securities that either were issued or guaranteed as to principal and interest by the U.S. government, its agencies, authorities or instrumentalities with value equal to at least 100% of the market value of the loaned securities. Any additional collateral required to maintain those levels due to market fluctuations of the loaned securities was requested to be delivered the following business day. Cash collateral received was invested by the lending agent on behalf of the Fund into authorized investments pursuant to the Agreement.
Pursuant to the Agreement, the Fund received income for lending its securities either in the form of fees or by earning interest on invested cash collateral, net of negotiated rebates paid to borrowers and fees paid to the lending agent for services provided and any other securities lending expenses. Net income earned from securities lending for the six months ended April 30, 2013 is disclosed in the Statement of Operations. The Fund continued to earn and accrue interest and dividends on the securities loaned.
Note 7. Affiliated Money Market Fund
The Fund invests its daily cash balances in Columbia Short-Term Cash Fund, an affiliated money market fund established for the exclusive use by the Fund and other affiliated funds.
The income earned by the Fund from such investments is included as "Dividends — affiliated issuers" in the Statement of Operations. As an investing fund, the Fund indirectly bears its proportionate share of the expenses of Columbia Short-Term Cash Fund.
Note 8. Shareholder Concentration
At April 30, 2013, two unaffiliated shareholder accounts owned an aggregate of 44.2% of the outstanding shares of the Fund. The Fund has no knowledge about whether any portion of those shares was owned beneficially by such accounts.
Note 9. Line of Credit
The Fund has entered into a revolving credit facility with a syndicate of banks led by JPMorgan whereby the Fund may borrow for the temporary funding of shareholder redemptions or for other temporary or emergency purposes. The credit facility agreement, as amended, which is a collective agreement between the Fund and certain other funds managed by the Investment Manager, severally and not jointly, permits collective borrowings up to $500 million. Interest is charged to each participating fund based on its borrowings at a rate equal to the higher of (i) the overnight federal funds rate plus 1.00% or (ii) the one-month LIBOR rate plus 1.00%. Each borrowing under the credit facility matures no later than 60 days after the date of borrowing. The Fund also pays a commitment fee equal to its pro rata share of the amount of the credit facility at a rate of 0.08% per annum.
The Fund had no borrowings during the six months ended April 30, 2013.
Note 10. Significant Risks
Non-Diversification Risk
A non-diversified fund is permitted to invest a greater percentage of its total assets in fewer issuers than a diversified fund. The Fund may, therefore, have a greater risk of loss from a few issuers than a similar fund that invests more broadly.
Foreign Securities Risk
Investing in foreign securities may include certain risks and considerations not typically associated with investing in U.S. securities, such as fluctuating currency values and changing local and regional economic, political and social conditions, which may result in greater market volatility. In addition, certain foreign securities may not be as liquid as U.S. securities. Investing in emerging markets may accentuate these risks.
Investments in emerging market countries are subject to additional risk. The risk of foreign investments is typically increased in less developed countries. These countries are also
Semiannual Report 2013
39
Columbia Emerging Markets Bond Fund
Notes to Financial Statements (continued)
April 30, 2013 (Unaudited)
more likely to experience high levels of inflation, deflation or currency devaluation which could hurt their economies and securities markets.
Note 11. Subsequent Events
Management has evaluated the events and transactions that have occurred through the date the financial statements were issued and noted no items requiring adjustment of the financial statements or additional disclosure.
Note 12. Information Regarding Pending and Settled Legal Proceedings
In December 2005, without admitting or denying the allegations, American Express Financial Corporation (AEFC, which is now known as Ameriprise Financial, Inc. (Ameriprise Financial)) entered into settlement agreements with the Securities and Exchange Commission (SEC) and Minnesota Department of Commerce (MDOC) related to market timing activities. As a result, AEFC was censured and ordered to cease and desist from committing or causing any violations of certain provisions of the Investment Advisers Act of 1940, the Investment Company Act of 1940, and various Minnesota laws. AEFC agreed to pay disgorgement of $10 million and civil money penalties of $7 million. AEFC also agreed to retain an independent distribution consultant to assist in developing a plan for distribution of all disgorgement and civil penalties ordered by the SEC in accordance with various undertakings detailed at www.sec.gov/litigation/admin/ia-2451.pdf. Ameriprise Financial and its affiliates have cooperated with the SEC and the MDOC in these legal proceedings, and have made regular reports to the funds' Boards of Trustees.
Ameriprise Financial and certain of its affiliates have historically been involved in a number of legal, arbitration and regulatory proceedings, including routine litigation, class actions, and governmental actions, concerning matters arising in connection with the conduct of their business activities. Ameriprise Financial believes that the Funds are not currently the subject of, and that neither Ameriprise Financial nor any of its affiliates are the subject of, any pending legal, arbitration or regulatory proceedings that are likely to have a material adverse effect on the Funds or the ability of Ameriprise Financial or its affiliates to perform under their contracts with the Funds. Ameriprise Financial is required to make 10-Q, 10-K and, as necessary, 8-K filings with the Securities and Exchange Commission on legal and regulatory matters that relate to Ameriprise Financial and its affiliates. Copies of these filings may be obtained by accessing the SEC website at www.sec.gov.
There can be no assurance that these matters, or the adverse publicity associated with them, will not result in increased
fund redemptions, reduced sale of fund shares or other adverse consequences to the Funds. Further, although we believe proceedings are not likely to have a material adverse effect on the Funds or the ability of Ameriprise Financial or its affiliates to perform under their contracts with the Funds, these proceedings are subject to uncertainties and, as such, we are unable to estimate the possible loss or range of loss that may result. An adverse outcome in one or more of these proceedings could result in adverse judgments, settlements, fines, penalties or other relief that could have a material adverse effect on the consolidated financial condition or results of operations of Ameriprise Financial.
Semiannual Report 2013
40
Columbia Emerging Markets Bond Fund
Approval of Investment Management Services Agreement
Columbia Management Investment Advisers, LLC (Columbia Management or the Investment Manager), a wholly-owned subsidiary of Ameriprise Financial, Inc. (Ameriprise Financial), serves as the investment manager to Columbia Emerging Markets Bond Fund (the Fund). Under an investment management services agreement (the IMS Agreement), Columbia Management provides investment advice and other services to the Fund and other funds distributed by Columbia Management Investment Distributors, Inc. (collectively, the Funds).
On an annual basis, the Fund's Board of Trustees (the Board), including the independent Board members (the Independent Trustees), considers renewal of the IMS Agreement. Columbia Management prepared detailed reports for the Board and its Contracts Committee in January, March and April 2013, including reports based on analyses of data provided by an independent organization and a comprehensive response to each item of information requested by independent legal counsel to the Independent Trustees (Independent Legal Counsel) in a letter to the Investment Manager, to assist the Board in making this determination. All of the materials presented in January, March and April were first supplied in draft form to designated representatives of the Independent Trustees, i.e., Independent Legal Counsel, the Chair of the Board and the Chair of the Contracts Committee, and the final materials (including proposed additional breakpoints in IMS fees for certain Funds) were revised to reflect discussion and subsequent requests made by the Contracts Committee. In addition, throughout the year, the Board (or its committees) regularly meets with portfolio management teams and senior management personnel, and reviews information prepared by Columbia Management addressing the services Columbia Management provides and Fund performance. Further, the Board retained an independent consulting firm (the Independent Consultant) to assist the Independent Trustees in their review of IMS fees, expense caps and Ameriprise Financial's profitability. The Board also accords particular weight to the work, deliberations and conclusions of the Contracts Committee, the Investment Review Committee and the Compliance Committee in determining whether to continue the IMS Agreement.
The Board, at its April 15-17, 2013 in-person Board meeting (the April Meeting), considered the renewal of the IMS Agreement for an additional one-year term. At the April Meeting, Independent Legal Counsel reviewed with the Independent Trustees various factors relevant to the Board's consideration of advisory agreements and the Board's legal responsibilities related to such consideration. Following an analysis and discussion of the factors identified below, the Board, including all of the Independent Trustees, approved the renewal of the IMS Agreement.
Nature, Extent and Quality of Services Provided by Columbia Management
The Independent Trustees analyzed various reports and presentations they had received detailing the services performed by Columbia Management, as well as its expertise, resources and capabilities. The Independent Trustees specifically considered many developments during the past year concerning the services provided by Columbia Management, including, in particular, the recent globalization initiative, which fosters increased worldwide investment support of global products, continued investment in upgrading technology (such as the implementation of new systems and hardware), the hiring of a Chief Interest Rate Strategist as part of Columbia Management's fixed income team and the addition of Columbia Management investment personnel to the Asset Allocation, Quantitative and Technology teams. The Independent Trustees noted the information they received concerning Columbia Management's ability to retain its key portfolio management personnel. In this regard, the Independent Trustees took into account their comprehensive discussions with Columbia Management's Chief Investment Officer (the CIO), observing the organizational depth of Columbia Management and the capabilities of its investment personnel. The Independent Trustees also recalled the information the CIO provided them identifying the strengths and areas for enhancement of each Columbia Management investment team, as well as the discussion with the CIO regarding the investment personnel talent being infused to enhance support for certain Funds. The Independent Trustees also observed the materials demonstrating the strength and depth of Columbia Management's equity and fixed income research departments.
In connection with the Board's evaluation of the overall package of services provided by Columbia Management, the Board also considered the quality of administrative services provided to the Fund by Columbia Management, recalling the information it received highlighting significant achievements in 2012 in the performance of administrative services (such as strong accounting performance measures, refined derivatives processing and enhancements to the electronic communications under the affiliated and unaffiliated service provider oversight program). In evaluating the quality of services provided under the IMS Agreement and the Fund's Administrative Service Agreement, the Independent Trustees also took into account the organization and strength of the Fund's and its service providers' compliance programs. In
Semiannual Report 2013
41
Columbia Emerging Markets Bond Fund
Approval of Investment Management Services Agreement (continued)
addition, the Board also reviewed the financial condition of Columbia Management (and its affiliates) and each entity's ability to carry out its responsibilities under the IMS Agreement and the Fund's other services agreements with affiliates of Ameriprise Financial, observing the financial strength of Ameriprise Financial, with its solid balance sheet. The Board also discussed the acceptability of the terms of the IMS Agreement (including the relatively broad scope of services required to be performed by Columbia Management). The Board concluded that the services being performed under the IMS Agreement were of a reasonably high quality.
Based on the foregoing, and based on other information received (both oral and written, including the information on investment performance referenced below) and other considerations, the Board concluded that Columbia Management and its affiliates were in a position to continue to provide a high quality and level of services to the Fund.
Investment Performance
For purposes of evaluating the nature, extent and quality of services provided under the IMS Agreement, the Board carefully reviewed the investment performance of the Fund. In this regard, the Board considered detailed reports providing the results of analyses performed by an independent organization showing, for various periods, the performance of the Fund, the performance of a benchmark index, the percentage ranking of the Fund among its comparison group and the net assets of the Fund. The Board observed that the Fund's investment performance met expectations.
Comparative Fees, Costs of Services Provided and the Profits Realized By Columbia Management and its Affiliates from their Relationships with the Fund
The Board reviewed comparative fees and the costs of services to be provided under the IMS Agreement. The Board members considered detailed comparative information set forth in an annual report on fees and expenses, including, among other things, data (based on analyses conducted by an independent organization) showing a comparison of the Fund's expenses with median expenses paid by funds in its comparative peer universe, as well as data showing the Fund's contribution to Columbia Management's profitability.
The Board accorded particular weight to the notion that the level of fees should reflect a rational pricing model applied consistently across the various product lines in the Fund family, while assuring that the overall fees for each Fund (with few defined exceptions) are generally in line with the "pricing philosophy" (i.e., that the total expense ratio of the Fund is no higher than the median expense ratio of funds in the same comparison universe of the Fund). In this connection, the Board also considered the Independent Consultant's report that concluded that: (i) the Funds' standardized investment management fee rates, particularly in the context of the current competitive fee landscape, were within a reasonable range; and (ii) the Funds' expense cap philosophy of assuring that each Fund's total expense ratio is not above its peer universe median ratio is reasonable. The Board took into account that the Fund's total expense ratio (after considering proposed expense caps/waivers) approximated the peer universe's median expense ratio. Based on its review, the Board concluded that the Fund's management fee was fair and reasonable in light of the extent and quality of services that the Fund receives.
The Board also considered the expected profitability of Columbia Management and its affiliates in connection with Columbia Management providing investment management services to the Fund. In this regard, the Board referred to a detailed profitability report, discussing the profitability to Columbia Management and Ameriprise Financial from managing, operating and distributing the Funds. In this regard, the Board observed that 2012 profitability approximates 2011 profitability and that, as was the case in 2011, 2012 profitability remained generally in line with (and, in many cases, lower than) the reported profitability of other asset management firms. Further, the Board considered the Independent Consultant's report that concluded that Columbia Management's profitability, particularly in comparison to industry competitors, was reasonable and not excessive. It also took into account the indirect economic benefits flowing to Columbia Management or its affiliates in connection with managing or distributing the Funds, such as the enhanced ability to offer various other financial products to Ameriprise Financial customers, soft dollar benefits and overall reputational advantages. The Board noted that the fees paid by the Funds should permit the Investment Manager to offer competitive compensation to its personnel, make necessary investments in its business and earn an appropriate profit. The Board concluded that profitability levels were reasonable.
Semiannual Report 2013
42
Columbia Emerging Markets Bond Fund
Approval of Investment Management Services Agreement (continued)
Economies of Scale to be Realized
The Board also considered the economies of scale that might be realized by Columbia Management as the Fund grows and took note of the extent to which Fund shareholders might also benefit from such growth. In this regard, the Independent Trustees took into account that IMS fees decline as Fund assets exceed various breakpoints, all of which have not been surpassed.
Based on the foregoing, the Board, including all of the Independent Trustees, concluded that the investment management service fees were fair and reasonable in light of the extent and quality of services provided. In reaching this conclusion, no single factor was determinative. On April 17, 2013, the Board, including all of the Independent Trustees, approved the renewal of the IMS Agreement.
Semiannual Report 2013
43
This page intentionally left blank.
Semiannual Report 2013
44
Columbia Emerging Markets Bond Fund
Important Information About This Report
Each fund mails one shareholder report to each shareholder address. If you would like more than one report, please call shareholder services at 800.345.6611 and additional reports will be sent to you.
The policy of the Board is to vote the proxies of the companies in which each fund holds investments consistent with the procedures as stated in the Statement of Additional Information (SAI). You may obtain a copy of the SAI without charge by calling 800.345.6611; contacting your financial intermediary; visiting columbiamanagement.com; or searching the website of the Securities and Exchange Commission (SEC) at sec.gov. Information regarding how each fund voted proxies relating to portfolio securities is filed with the SEC by August 31 for the most recent 12-month period ending June 30 of that year, and is available without charge by visiting columbiamanagement.com; or searching the website of the SEC at sec.gov.
Each fund files a complete schedule of portfolio holdings with the SEC for the first and third quarters of each fiscal year on Form N-Q. Each fund's Form N-Q is available on the SEC's website at sec.gov and may be reviewed and copied at the SEC's Public Reference Room in Washington, D.C. Information on the operation of the Public Reference Room may be obtained by calling 800.SEC.0330. Each fund's complete schedule of portfolio holdings, as filed on Form N-Q, can also be obtained without charge, upon request, by calling 800.345.6611.
Semiannual Report 2013
45

Columbia Emerging Markets Bond Fund
P.O. Box 8081
Boston, MA 02266-8081
columbiamanagement.com
This information is for use with concurrent or prior delivery of a fund prospectus. Please read and consider the investment objectives, risks, charges and expenses for any fund carefully before investing. For a prospectus which contains this and other important information about the Fund go to columbiamanagement.com. The Fund is distributed by Columbia Management Investment Distributors, Inc., member FINRA, and managed by Columbia Management Investment Advisers, LLC.
© 2013 Columbia Management Investment Advisers, LLC. All rights reserved.
SAR141_10_C01_(06/13)
Semiannual Report
April 30, 2013

Columbia European Equity Fund
Not FDIC insured • No bank guarantee • May lose value
Columbia European Equity Fund
 Dear Shareholders,
U.S. equities had a strong first quarter
Similar to 2012, equities once again were the best performing asset class in the first quarter of 2013. The S&P 500 Index reached an all-time closing high on the last trading day of the quarter and pushed through its October 2007 peak. Although global equities have performed well year-to-date, there is significant performance divergence among regions. In local currency terms, Japanese equities were the best performing developed market globally, and U.S. stocks outperformed most other global equity markets. European equities rose in the first quarter but trailed U.S. stocks and had a turbulent March, as investors were reminded of instability in the eurozone with news of a banking crisis in Cyprus.
Although all 10 sectors of the S&P 500 Index delivered positive returns, this was a rally led by defensive stocks such as those in health care, consumer staples and utilities. Materials and technology stocks were the weakest sectors.
High yield leads fixed income; most sectors flat to down
The fixed-income markets lagged equities with modest, single-digit returns coming from municipals and high-yield sectors in the United States. Most government and investment-grade credit sectors were roughly flat to down for the first quarter of 2013. Emerging market bonds were the biggest disappointment with single-digit losses.
Columbia Management to begin delivering summary prospectuses
Each Columbia fund is required to update its prospectus on an annual basis. Beginning with June 2013 prospectus updates, shareholders of Columbia retail mutual funds will start to receive a summary prospectus, rather than the full length (statutory) mutual fund prospectus they have received in the past.
Each fund's summary prospectus will include the following key information:
> Investment objective
> Fee and expense table
> Portfolio turnover rate information
> Principal investment strategies, principal risks and performance information
> Management information
> Purchase and sale information
> Tax information
> Financial intermediary compensation information
Each fund's statutory prospectus will contain additional information about the fund and its risks. Both the statutory and summary prospectus will be updated each year, and will be available at columbiamanagement.com. Shareholders may request a printed version of a statutory prospectus at no cost by calling 800.345.6611 or sending an email to serviceinquiries@columbiamanagement.com.
Stay on track with Columbia Management
Backed by more than 100 years of experience, Columbia Management is one of the nation's largest asset managers. At the heart of our success — and, most importantly, that of our investors — are highly talented industry professionals, brought together by a unique way of working. We are dedicated to helping you take advantage of today's opportunities and anticipate tomorrow's. We stay abreast of the latest investment trends and ideas, using our collective insight to evaluate events and transform them into solutions you can use.
Visit columbiamanagement.com for:
> The Columbia Management Perspectives blog, featuring timely posts by our investment teams
> Detailed up-to-date fund performance and portfolio information
> Economic analysis and market commentary
> Quarterly fund commentaries
> Columbia Management Investor, our award-winning quarterly newsletter for shareholders
Thank you for your continued support of the Columbia Funds. We look forward to serving your investment needs for many years to come.
Best Regards,

J. Kevin Connaughton
President, Columbia Funds
The S&P 500 Index, an unmanaged index, measures the performance of 500 large-capitalization U.S. stocks and is frequently used as a general measure of market performance. Indices are not available for investment, are not professionally managed and do not reflect sales charges, fees, brokerage commissions, taxes or other expenses of investing.
Investors should consider the investment objectives, risks, charges and expenses of a mutual fund carefully before investing. For a free prospectus, which contains this and other important information about a fund, visit columbiamanagement.com. The prospectus should be read carefully before investing.
Columbia Funds are distributed by Columbia Management Investment Distributors, Inc., member FINRA, and managed by Columbia Management Investment Advisers, LLC.
© 2013 Columbia Management Investment Advisers, LLC. All rights reserved.
Columbia European Equity Fund
Performance Overview | | | 2 | | |
Portfolio Overview | | | 3 | | |
Understanding Your Fund's Expenses | | | 5 | | |
Portfolio of Investments | | | 6 | | |
Statement of Assets and Liabilities | | | 10 | | |
Statement of Operations | | | 12 | | |
Statement of Changes in Net Assets | | | 13 | | |
Financial Highlights | | | 15 | | |
Notes to Financial Statements | | | 22 | | |
Approval of Investment Management
Services and Subadvisory Agreements | | | 28 | | |
Important Information About This Report | | | 33 | | |
Fund Investment Manager
Columbia Management Investment
Advisers, LLC
225 Franklin Street
Boston, MA 02110
Fund Distributor
Columbia Management Investment
Distributors, Inc.
225 Franklin Street
Boston, MA 02110
Fund Transfer Agent
Columbia Management Investment
Services Corp.
P.O. Box 8081
Boston, MA 02266-8081
For more information about any of the funds, please visit columbiamanagement.com or call 800.345.6611. Customer Service Representatives are available to answer your questions Monday through Friday from 8 a.m. to 8 p.m. Eastern time.
The views expressed in this report reflect the current views of the respective parties. These views are not guarantees of future performance and involve certain risks, uncertainties and assumptions that are difficult to predict, so actual outcomes and results may differ significantly from the views expressed. These views are subject to change at any time based upon economic, market or other conditions and the respective parties disclaim any responsibility to update such views. These views may not be relied on as investment advice and, because investment decisions for a Columbia Fund are based on numerous factors, may not be relied on as an indication of trading intent on behalf of any particular Columbia Fund. References to specific securities should not be construed as a recommendation or investment advice.
Columbia European Equity Fund
Performance Overview
(Unaudited)
Performance Summary
> Columbia European Equity Fund (the Fund) Class A shares returned 13.78% excluding sales charges for the six months ended April 30, 2013.
> The Fund outperformed its benchmark, the MSCI Europe Index (Net), which returned 13.04% during the same six-month period.
Average Annual Total Returns (%) (for period ended April 30, 2013)
| | Inception | | 6 Months
cumulative | | 1 Year | | 5 Years | | 10 Years | |
Class A | | 06/26/00 | | | | | | | | | |
Excluding sales charges | | | | | 13.78 | | | | 16.53 | | | | 2.60 | | | | 10.10 | | |
Including sales charges | | | | | 7.28 | | | | 9.90 | | | | 1.38 | | | | 9.46 | | |
Class B | | 06/26/00 | | | | | | | | | |
Excluding sales charges | | | | | 13.29 | | | | 15.45 | | | | 1.78 | | | | 9.23 | | |
Including sales charges | | | | | 8.29 | | | | 10.45 | | | | 1.41 | | | | 9.23 | | |
Class C | | 06/26/00 | | | | | | | | | |
Excluding sales charges | | | | | 13.23 | | | | 15.61 | | | | 1.79 | | | | 9.28 | | |
Including sales charges | | | | | 12.23 | | | | 14.61 | | | | 1.79 | | | | 9.28 | | |
Class I* | | 07/15/04 | | | 14.13 | | | | 17.08 | | | | 3.18 | | | | 10.64 | | |
Class K | | 06/26/00 | | | 13.90 | | | | 16.66 | | | | 2.83 | | | | 10.38 | | |
Class W* | | 06/18/12 | | | 13.59 | | | | 16.33 | | | | 2.56 | | | | 10.08 | | |
Class Z* | | 09/27/10 | | | 13.79 | | | | 16.74 | | | | 2.78 | | | | 10.20 | | |
MSCI Europe Index (Net) | | | | | 13.04 | | | | 18.06 | | | | -2.12 | | | | 8.80 | | |
Returns for Class A are shown with and without the maximum initial sales charge of 5.75%. Returns for Class B are shown with and without the applicable contingent deferred sales charge (CDSC) of 5.00% in the first year, declining to 1.00% in the sixth year and eliminated thereafter. Returns for Class C are shown with and without the 1.00% CDSC for the first year only. The Fund's other classes are not subject to sales charges and have limited eligibility. Please see the Fund's prospectus for details. Performance for different share classes will vary based on differences in sales charges and fees associated with each class. All results shown assume reinvestment of distributions during the period. Returns do not reflect the deduction of taxes that a shareholder may pay on Fund distributions or on the redemption of Fund shares. Performance results reflect the effect of any fee waivers or reimbursements of Fund expenses by Columbia Management Investment Advisers, LLC and/or any of its affiliates. Absent these fee waivers or expense reimbursement arrangements, performance results would have been lower.
The performance information shown represents past performance and is not a guarantee of future results. The investment return and principal value of your investment will fluctuate so that your shares, when redeemed, may be worth more or less than their original cost. Current performance may be lower or higher than the performance information shown. You may obtain performance information current to the most recent month-end by contacting your financial intermediary, visiting columbiamanagement.com or calling 800.345.6611.
*The returns shown for periods prior to the share class inception date (including returns for the Life of the Fund, if shown, which are since Fund inception) include the returns of the Fund's oldest share class. Since the Fund launched more than one share class at its inception, Class A shares were used. These returns are adjusted to reflect any higher class-related operating expenses of the newer share classes, as applicable. Please visit columbiamanagement.com/mutual-funds/appended-performance for more information.
The MSCI Europe Index (Net) is a free float-adjusted market capitalization weighted index that is designed to measure the equity market performance of the developed markets in Europe.
Indices are not available for investment, are not professionally managed and do not reflect sales charges, fees, brokerage commissions, taxes or other expenses of investing. Securities in the Fund may not match those in an index.
Semiannual Report 2013
2
Columbia European Equity Fund
Portfolio Overview
(Unaudited)
Top Ten Holdings (%)
(at April 30, 2013) | |
Unilever PLC (United Kingdom) | | | 3.6 | | |
Nestlé SA, Registered Shares (Switzerland) | | | 3.5 | | |
Allianz SE, Registered Shares (Germany) | | | 2.9 | | |
Diageo PLC (United Kingdom) | | | 2.7 | | |
Brenntag AG (Germany) | | | 2.7 | | |
Novartis AG, Registered Shares (Switzerland) | | | 2.7 | | |
Bayer AG, Registered Shares (Germany) | | | 2.6 | | |
Swatch Group AG (The), Registered Shares (Switzerland) | | | 2.6 | | |
Syngenta AG (Switzerland) | | | 2.5 | | |
Fresenius Medical Care AG & Co. KGaA (Germany) | | | 2.4 | | |
Percentages indicated are based upon total investments (excluding Money Market Funds).
For further detail about these holdings, please refer to the section entitled "Portfolio of Investments."
Fund holdings are as of the date given, are subject to change at any time, and are not recommendations to buy or sell any security.
Country Breakdown (%)
(at April 30, 2013) | |
Belgium | | | 2.3 | | |
Denmark | | | 2.0 | | |
Finland | | | 0.9 | | |
France | | | 13.3 | | |
Germany | | | 22.0 | | |
Netherlands | | | 5.0 | | |
Norway | | | 0.8 | | |
Portugal | | | 0.9 | | |
Spain | | | 3.8 | | |
Sweden | | | 1.3 | | |
Switzerland | | | 17.2 | | |
United Kingdom | | | 30.4 | | |
United States(a) | | | 0.1 | | |
Total | | | 100.0 | | |
Percentages indicated are based upon total investments. The Fund's portfolio composition is subject to change.
(a) Includes investments in Money Market Funds.
Portfolio Management
Threadneedle International Limited
Daniel Ison
Morningstar Style BoxTM

The Morningstar Style BoxTM is based on a fund's portfolio holdings. For equity funds, the vertical axis shows the market capitalization of the stocks owned, and the horizontal axis shows investment style (value, blend, or growth). Information shown is based on the most recent data provided by Morningstar.
© 2013 Morningstar, Inc. All rights reserved. The Morningstar information contained herein: (1) is proprietary to Morningstar and/or its content providers; (2) may not be copied or distributed; and (3) is not warranted to be accurate, complete or timely. Neither Morningstar nor its content providers are responsible for any damages or losses arising from any use of this information.
Semiannual Report 2013
3
Columbia European Equity Fund
Portfolio Overview (continued)
(Unaudited)
Summary of Investments in Securities by Industry (%)
(at April 30, 2013) | |
Aerospace & Defense | | | 2.3 | | |
Airlines | | | 1.2 | | |
Auto Components | | | 2.5 | | |
Automobiles | | | 0.9 | | |
Beverages | | | 5.0 | | |
Capital Markets | | | 3.0 | | |
Chemicals | | | 7.2 | | |
Commercial Banks | | | 3.8 | | |
Commercial Services & Supplies | | | 0.8 | | |
Diversified Financial Services | | | 1.0 | | |
Diversified Telecommunication Services | | | 2.4 | | |
Electrical Equipment | | | 1.8 | | |
Energy Equipment & Services | | | 1.7 | | |
Food Products | | | 7.1 | | |
Health Care Equipment & Supplies | | | 3.3 | | |
Health Care Providers & Services | | | 2.4 | | |
Hotels, Restaurants & Leisure | | | 1.2 | | |
Household Durables | | | 2.4 | | |
Household Products | | | 2.7 | | |
Insurance | | | 8.5 | | |
IT Services | | | 2.4 | | |
Machinery | | | 2.2 | | |
Media | | | 5.0 | | |
Oil, Gas & Consumable Fuels | | | 1.8 | | |
Personal Products | | | 1.1 | | |
Pharmaceuticals | | | 8.8 | | |
Professional Services | | | 2.1 | | |
Semiconductors & Semiconductor Equipment | | | 2.1 | | |
Software | | | 2.3 | | |
Specialty Retail | | | 1.4 | | |
Textiles, Apparel & Luxury Goods | | | 4.1 | | |
Trading Companies & Distributors | | | 4.7 | | |
Money Market Funds | | | 0.1 | | |
Total | | | 99.3 | | |
Percentages indicated are based upon net assets. The Fund's portfolio composition is subject to change.
Semiannual Report 2013
4
Columbia European Equity Fund
Understanding Your Fund's Expenses
(Unaudited)
As an investor, you incur two types of costs. There are transaction costs, which generally include sales charges on purchases and may include redemption fees. There are also ongoing costs, which generally include management fees, distribution and service (Rule 12b-1) fees, and other fund expenses. The following information is intended to help you understand your ongoing costs (in dollars) of investing in the Fund and to help you compare these costs with the ongoing costs of investing in other mutual funds.
Analyzing Your Fund's Expenses
To illustrate these ongoing costs, we have provided examples and calculated the expenses paid by investors in each share class of the Fund during the period. The actual and hypothetical information in the table is based on an initial investment of $1,000 at the beginning of the period indicated and held for the entire period. Expense information is calculated two ways and each method provides you with different information. The amount listed in the "Actual" column is calculated using the Fund's actual operating expenses and total return for the period. You may use the Actual information, together with the amount invested, to estimate the expenses that you paid over the period. Simply divide your account value by $1,000 (for example, an $8,600 account value divided by $1,000 = 8.6), then multiply the results by the expenses paid during the period under the Actual column. The amount listed in the "Hypothetical" column assumes a 5% annual rate of return before expenses (which is not the Fund's actual return) and then applies the Fund's actual expense ratio for the period to the hypothetical return. You should not use the hypothetical account values and expenses to estimate either your actual account balance at the end of the period or the expenses you paid during the period. See "Compare With Other Funds" below for details on how to use the hypothetical data.
Compare With Other Funds
Since all mutual funds are required to include the same hypothetical calculations about expenses in shareholder reports, you can use this information to compare the ongoing cost of investing in the Fund with other funds. To do so, compare the hypothetical example with the 5% hypothetical examples that appear in the shareholder reports of other funds. As you compare hypothetical examples of other funds, it is important to note that hypothetical examples are meant to highlight the ongoing costs of investing in a fund only and do not reflect any transaction costs, such as sales charges, or redemption or exchange fees. Therefore, the hypothetical calculations are useful in comparing ongoing costs only, and will not help you determine the relative total costs of owning different funds. If transaction costs were included in these calculations, your costs would be higher.
November 1, 2012 – April 30, 2013
| | Account Value at the Beginning
of the Period ($) | | Account Value at the End of the
Period ($) | | Expenses Paid During the
Period ($) | | Fund's Annualized
Expense Ratio (%) | |
| | Actual | | Hypothetical | | Actual | | Hypothetical | | Actual | | Hypothetical | | Actual | |
Class A | | | 1,000.00 | | | | 1,000.00 | | | | 1,137.80 | | | | 1,017.55 | | | | 7.74 | | | | 7.30 | | | | 1.46 | | |
Class B | | | 1,000.00 | | | | 1,000.00 | | | | 1,132.90 | | | | 1,013.84 | | | | 11.69 | | | | 11.03 | | | | 2.21 | | |
Class C | | | 1,000.00 | | | | 1,000.00 | | | | 1,132.30 | | | | 1,013.84 | | | | 11.68 | | | | 11.03 | | | | 2.21 | | |
Class I | | | 1,000.00 | | | | 1,000.00 | | | | 1,141.30 | | | | 1,020.03 | | | | 5.10 | | | | 4.81 | | | | 0.96 | | |
Class K | | | 1,000.00 | | | | 1,000.00 | | | | 1,139.00 | | | | 1,018.55 | | | | 6.68 | | | | 6.31 | | | | 1.26 | | |
Class W | | | 1,000.00 | | | | 1,000.00 | | | | 1,135.90 | | | | 1,017.41 | | | | 7.89 | | | | 7.45 | | | | 1.49 | | |
Class Z | | | 1,000.00 | | | | 1,000.00 | | | | 1,137.90 | | | | 1,018.79 | | | | 6.41 | | | | 6.06 | | | | 1.21 | | |
Expenses paid during the period are equal to the annualized expense ratio for each class as indicated above, multiplied by the average account value over the period and then multiplied by the number of days in the Fund's most recent fiscal half year and divided by 365.
Expenses do not include fees and expenses incurred indirectly by the Fund from the underlying funds in which the Fund may invest (also referred to as "acquired funds"), including affiliated and non-affiliated pooled investment vehicles (including mutual funds and exchange-traded funds).
Semiannual Report 2013
5
Columbia European Equity Fund
Portfolio of Investments
April 30, 2013 (Unaudited)
(Percentages represent value of investments compared to net assets)
Common Stocks 97.2%
Issuer | | Shares | | Value ($) | |
Belgium 2.3% | |
Anheuser-Busch InBev NV | | | 93,432 | | | | 8,890,024 | | |
Denmark 2.0% | |
Novo Nordisk A/S, Class B | | | 42,827 | | | | 7,512,182 | | |
Finland 0.9% | |
KONE OYJ, Class B | | | 39,860 | | | | 3,519,699 | | |
France 13.2% | |
Air Liquide SA | | | 21,298 | | | | 2,696,013 | | |
AtoS | | | 53,228 | | | | 3,704,713 | | |
BNP Paribas SA | | | 99,260 | | | | 5,530,785 | | |
Edenred | | | 91,753 | | | | 3,054,687 | | |
Essilor International SA | | | 35,178 | | | | 3,958,237 | | |
European Aeronautic Defence and
Space Co. NV | | | 164,784 | | | | 8,703,281 | | |
Iliad SA | | | 23,529 | | | | 5,379,261 | | |
L'Oreal SA | | | 24,773 | | | | 4,417,400 | | |
Publicis Groupe SA | | | 96,265 | | | | 6,696,321 | | |
Schneider Electric SA | | | 88,699 | | | | 6,763,426 | | |
Total | | | | | 50,904,124 | | |
Germany 19.8% | |
Allianz SE, Registered Shares | | | 76,377 | | | | 11,270,518 | | |
BASF SE | | | 68,914 | | | | 6,436,438 | | |
Bayer AG, Registered Shares | | | 96,749 | | | | 10,093,709 | | |
Brenntag AG | | | 61,366 | | | | 10,461,629 | | |
Continental AG | | | 40,521 | | | | 4,811,312 | | |
Fresenius Medical Care AG & Co. KGaA | | | 135,269 | | | | 9,334,671 | | |
Kabel Deutschland Holding AG | | | 96,504 | | | | 9,172,157 | | |
Merck KGaA | | | 40,375 | | | | 6,146,669 | | |
SAP AG | | | 111,995 | | | | 8,895,234 | | |
Total | | | | | 76,622,337 | | |
Netherlands 5.0% | |
Aegon NV | | | 598,313 | | | | 3,948,411 | | |
| ASML Holding NV | | | 106,757 | | | | 7,936,513 | | |
ING Groep NV-CVA(a) | | | 474,129 | | | | 3,891,288 | | |
Reed Elsevier NV | | | 221,787 | | | | 3,598,456 | | |
Total | | | | | 19,374,668 | | |
Norway 0.8% | |
TGS Nopec Geophysical Co., ASA | | | 90,077 | | | | 3,238,912 | | |
Common Stocks (continued)
Issuer | | Shares | | Value ($) | |
Portugal 0.7% | |
Galp Energia SGPS SA | | | 173,328 | | | | 2,777,978 | | |
Spain 3.9% | |
Amadeus IT Holding SA, Class A | | | 187,353 | | | | 5,530,556 | | |
Banco Bilbao Vizcaya Argentaria SA | | | 435,710 | | | | 4,228,969 | | |
Inditex SA | | | 39,781 | | | | 5,346,359 | | |
Total | | | | | 15,105,884 | | |
Sweden 1.3% | |
Elekta AB, Class B | | | 320,810 | | | | 4,919,122 | | |
Switzerland 17.1% | |
Cie Financiere Richemont SA, Class A | | | 72,586 | | | | 5,862,775 | | |
Nestlé SA, Registered Shares | | | 187,922 | | | | 13,420,113 | | |
Novartis AG, Registered Shares | | | 137,455 | | | | 10,207,860 | | |
SGS SA, Registered Shares | | | 1,700 | | | | 4,108,303 | | |
Sika AG | | | 1,506 | | | | 3,636,234 | | |
Swatch Group AG (The), Registered Shares | | | 100,098 | | | | 10,055,015 | | |
Syngenta AG | | | 22,512 | | | | 9,621,713 | | |
UBS AG, Registered Shares | | | 504,948 | | | | 9,014,989 | | |
Total | | | | | 65,927,002 | | |
United Kingdom 30.2% | |
Ashtead Group PLC | | | 260,569 | | | | 2,377,934 | | |
Barclays PLC | | | 1,073,827 | | | | 4,771,397 | | |
BG Group PLC | | | 252,260 | | | | 4,249,592 | | |
BT Group PLC | | | 918,725 | | | | 3,941,654 | | |
Diageo PLC | | | 343,502 | | | | 10,479,487 | | |
easyJet PLC | | | 255,305 | | | | 4,429,776 | | |
Experian PLC | | | 222,429 | | | | 3,911,174 | | |
GKN PLC | | | 1,159,500 | | | | 4,949,448 | | |
IMI PLC | | | 262,773 | | | | 5,057,330 | | |
Intercontinental Hotels Group PLC | | | 161,847 | | | | 4,771,667 | | |
John Wood Group PLC | | | 282,616 | | | | 3,402,262 | | |
Johnson Matthey PLC | | | 143,103 | | | | 5,388,286 | | |
Legal & General Group PLC | | | 2,546,048 | | | | 6,703,561 | | |
Persimmon PLC | | | 544,195 | | | | 9,129,512 | | |
Prudential PLC | | | 407,776 | | | | 6,999,277 | | |
Reckitt Benckiser Group PLC | | | 86,730 | | | | 6,326,546 | | |
Schroders PLC | | | 71,291 | | | | 2,585,776 | | |
Smith & Nephew PLC | | | 354,582 | | | | 4,045,551 | | |
The accompanying Notes to Financial Statements are an integral part of this statement.
Semiannual Report 2013
6
Columbia European Equity Fund
Portfolio of Investments (continued)
April 30, 2013 (Unaudited)
Common Stocks (continued)
Issuer | | Shares | | Value ($) | |
St. James's Place PLC | | | 469,936 | | | | 4,044,061 | | |
Unilever PLC | | | 321,165 | | | | 13,898,841 | | |
Wolseley PLC | | | 105,753 | | | | 5,228,759 | | |
Total | | | | | 116,691,891 | | |
Total Common Stocks
(Cost: $312,065,361) | | | | | 375,483,823 | | |
Preferred Stocks 2.0% | |
Germany 2.0% | |
Henkel AG & Co. KGaA | | | 44,709 | | | | 4,215,775 | | |
Volkswagen AG | | | 17,441 | | | | 3,534,919 | | |
Total | | | | | 7,750,694 | | |
Total Preferred Stocks
(Cost: $6,412,282) | | | | | 7,750,694 | | |
Money Market Funds 0.1%
| | | Shares | | Value ($) | |
Columbia Short-Term Cash Fund,
0.126%(b)(c) | | | 527,696 | | | | 527,696 | | |
Total Money Market Funds
(Cost: $527,696) | | | | | 527,696 | | |
Total Investments
(Cost: $319,005,339) | | | | | 383,762,213 | | |
Other Assets & Liabilities, Net | | | | | 2,795,168 | | |
Net Assets | | | | | 386,557,381 | | |
Notes to Portfolio of Investments
(a) Non-income producing.
(b) The rate shown is the seven-day current annualized yield at April 30, 2013.
(c) As defined in the Investment Company Act of 1940, an affiliated company is one in which the Fund owns 5% or more of its outstanding voting securities, or a company which is under common ownership or control with the Fund. Holdings and transactions in these affiliated companies during the period ended April 30, 2013, are as follows:
Issuer | | Beginning
Cost ($) | | Purchase
Cost ($) | | Proceeds
From Sales ($) | | Realized
Gain/Loss ($) | | Ending
Cost ($) | | Dividends —
Affiliated
Issuers ($) | | Value ($) | |
Columbia Short-Term
Cash Fund | | | 4,230,027 | | | | 61,259,055 | | | | (64,961,386) | | | | — | | | | 527,696 | | | | 2,107 | | | | 527,696 | | |
Fair Value Measurements
Generally accepted accounting principles (GAAP) require disclosure regarding the inputs and valuation techniques used to measure fair value and any changes in valuation inputs or techniques. In addition, investments shall be disclosed by major category.
The Fund categorizes its fair value measurements according to a three-level hierarchy that maximizes the use of observable inputs and minimizes the use of unobservable inputs by prioritizing that the most observable input be used when available. Observable inputs are those that market participants would use in pricing an investment based on market data obtained from sources independent of the reporting entity. Unobservable inputs are those that reflect the Fund's assumptions about the information market participants would use in pricing an investment. An investment's level within the fair value hierarchy is based on the lowest level of any input that is deemed significant to the asset or liability's fair value measurement. The input levels are not necessarily an indication of the risk or liquidity associated with investments at that level. For example, certain U.S. government securities are generally high quality and liquid, however, they are reflected as Level 2 because the inputs used to determine fair value may not always be quoted prices in an active market.
Fair value inputs are summarized in the three broad levels listed below:
> Level 1 — Valuations based on quoted prices for investments in active markets that the Fund has the ability to access at the measurement date (including NAV for open-end mutual funds). Valuation adjustments are not applied to Level 1 investments.
> Level 2 — Valuations based on other significant observable inputs (including quoted prices for similar securities, interest rates, prepayment speeds, credit risks, etc.).
> Level 3 — Valuations based on significant unobservable inputs (including the Fund's own assumptions and judgment in determining the fair value of investments).
The accompanying Notes to Financial Statements are an integral part of this statement.
Semiannual Report 2013
7
Columbia European Equity Fund
Portfolio of Investments (continued)
April 30, 2013 (Unaudited)
Fair Value Measurements (continued)
Inputs that are used in determining fair value of an investment may include price information, credit data, volatility statistics, and other factors. These inputs can be either observable or unobservable. The availability of observable inputs can vary between investments, and is affected by various factors such as the type of investment, and the volume and level of activity for that investment or similar investments in the marketplace. The inputs will be considered by the Investment Manager, along with any other relevant factors in the calculation of an investment's fair value. The Fund uses prices and inputs that are current as of the measurement date, which may include periods of market dislocations. During these periods, the availability of prices and inputs may be reduced for many investments. This condition could cause an investment to be reclassified between the various levels within the hierarchy.
Foreign equity securities actively traded in markets where there is a significant delay in the local close relative to the New York Stock Exchange (NYSE) are classified as Level 2. The values of these securities may include an adjustment to reflect the impact of significant market movements following the close of local trading, as described in Note 2 to the financial statements — Security Valuation.
Investments falling into the Level 3 category are primarily supported by quoted prices from brokers and dealers participating in the market for those investments. However, these may be classified as Level 3 investments due to lack of market transparency and corroboration to support these quoted prices. Additionally, valuation models may be used as the pricing source for any remaining investments classified as Level 3. These models may rely on one or more significant unobservable inputs and/or significant assumptions by the Investment Manager. Inputs used in valuations may include, but are not limited to, financial statement analysis, capital account balances, discount rates and estimated cash flows, and comparable company data.
Under the direction of the Fund's Board of Trustees (the Board), the Investment Manager's Valuation Committee (the Committee) is responsible for carrying out the valuation procedures approved by the Board. The Committee consists of voting and non-voting members from various groups within the Investment Manager's organization, including operations and accounting, trading and investments, compliance, risk management and legal.
The Committee meets at least monthly to review and approve valuation matters, which may include a description of specific valuation determinations, data regarding pricing information received from approved pricing vendors and brokers and the results of Board-approved valuation control policies and procedures (the Policies). The Policies address, among other things, instances when market quotations are readily available, including recommendations of third party pricing vendors and a determination of appropriate pricing methodologies; events that require specific valuation determinations and assessment of fair value techniques; securities with a potential for stale pricing, including those that are illiquid, restricted, or in default; and the effectiveness of third-party pricing vendors, including periodic reviews of vendors. The Committee meets more frequently, as needed, to discuss additional valuation matters, which may include the need to review back-testing results, review time-sensitive information or approve related valuation actions. The Committee reports to the Board, with members of the Committee meeting with the Board at each of its regularly scheduled meetings to discuss valuation matters and actions during the period, similar to those described earlier.
For investments categorized as Level 3, the Committee monitors information similar to that described above, which may include: (i) data specific to the issuer or comparable issuers, (ii) general market or specific sector news and (iii) quoted prices and specific or similar security transactions. The Committee considers this data and any changes from prior periods in order to assess the reasonableness of observable and unobservable inputs, any assumptions or internal models used to value those securities and changes in fair value. This data is also used to corroborate, when available, information received from approved pricing vendors and brokers. Various factors impact the frequency of monitoring this information (which may occur as often as daily). However, the Committee may determine that changes to inputs, assumptions and models are not required as a result of the monitoring procedures performed.
The accompanying Notes to Financial Statements are an integral part of this statement.
Semiannual Report 2013
8
Columbia European Equity Fund
Portfolio of Investments (continued)
April 30, 2013 (Unaudited)
Fair Value Measurements (continued)
The following table is a summary of the inputs used to value the Fund's investments at April 30, 2013:
Description | | Level 1
Quoted Prices in Active
Markets for Identical
Assets ($) | | Level 2
Other Significant
Observable Inputs ($) | | Level 3
Significant
Unobservable Inputs ($) | | Total ($) | |
Equity Securities | |
Common Stocks | |
Consumer Discretionary | | | — | | | | 64,393,022 | | | | — | | | | 64,393,022 | | |
Consumer Staples | | | — | | | | 57,432,411 | | | | — | | | | 57,432,411 | | |
Energy | | | — | | | | 13,668,743 | | | | — | | | | 13,668,743 | | |
Financials | | | — | | | | 62,989,032 | | | | — | | | | 62,989,032 | | |
Health Care | | | — | | | | 56,218,000 | | | | — | | | | 56,218,000 | | |
Industrials | | | — | | | | 57,615,998 | | | | — | | | | 57,615,998 | | |
Information Technology | | | — | | | | 26,067,018 | | | | — | | | | 26,067,018 | | |
Materials | | | — | | | | 27,778,684 | | | | — | | | | 27,778,684 | | |
Telecommunication Services | | | — | | | | 9,320,915 | | | | — | | | | 9,320,915 | | |
Preferred Stocks | |
Consumer Discretionary | | | — | | | | 3,534,919 | | | | — | | | | 3,534,919 | | |
Consumer Staples | | | — | | | | 4,215,775 | | | | — | | | | 4,215,775 | | |
Total Equity Securities | | | — | | | | 383,234,517 | | | | — | | | | 383,234,517 | | |
Other | |
Money Market Funds | | | 527,696 | | | | — | | | | — | | | | 527,696 | | |
Total Other | | | 527,696 | | | | — | | | | — | | | | 527,696 | | |
Total | | | 527,696 | | | | 383,234,517 | | | | — | | | | 383,762,213 | | |
See the Portfolio of Investments for all investment classifications not indicated in the table.
The Fund's assets assigned to the Level 2 input category are generally valued using the market approach, in which a security's value is determined through reference to prices and information from market transactions for similar or identical assets. These assets include certain foreign securities for which a third party statistical pricing service may be employed for purposes of fair market valuation. The models utilized by the third party statistical pricing service take into account a security's correlation to available market data including, but not limited to, intraday index, ADR, and ETF movements.
There were no transfers of financial assets between Levels 1 and 2 during the period.
The accompanying Notes to Financial Statements are an integral part of this statement.
Semiannual Report 2013
9
Columbia European Equity Fund
Statement of Assets and Liabilities
April 30, 2013 (Unaudited)
Assets | |
Investments, at value | |
Unaffiliated issuers (identified cost $318,477,643) | | $ | 383,234,517 | | |
Affiliated issuers (identified cost $527,696) | | | 527,696 | | |
Total investments (identified cost $319,005,339) | | | 383,762,213 | | |
Foreign currency (identified cost $567,008) | | | 569,440 | | |
Receivable for: | |
Capital shares sold | | | 52,713 | | |
Dividends | | | 1,786,120 | | |
Reclaims | | | 709,304 | | |
Prepaid expenses | | | 888 | | |
Total assets | | | 386,880,678 | | |
Liabilities | |
Payable for: | |
Capital shares purchased | | | 193,712 | | |
Investment management fees | | | 8,365 | | |
Distribution and/or service fees | | | 520 | | |
Transfer agent fees | | | 13,157 | | |
Administration fees | | | 846 | | |
Compensation of board members | | | 10,117 | | |
Other expenses | | | 96,580 | | |
Total liabilities | | | 323,297 | | |
Net assets applicable to outstanding capital stock | | $ | 386,557,381 | | |
Represented by | |
Paid-in capital | | $ | 342,677,632 | | |
Undistributed net investment income | | | 2,000,960 | | |
Accumulated net realized loss | | | (22,911,314 | ) | |
Unrealized appreciation (depreciation) on: | |
Investments | | | 64,756,874 | | |
Foreign currency translations | | | 33,229 | | |
Total — representing net assets applicable to outstanding capital stock | | $ | 386,557,381 | | |
The accompanying Notes to Financial Statements are an integral part of this statement.
Semiannual Report 2013
10
Columbia European Equity Fund
Statement of Assets and Liabilities (continued)
April 30, 2013 (Unaudited)
Class A | |
Net assets | | $ | 58,928,771 | | |
Shares outstanding | | | 8,893,931 | | |
Net asset value per share | | $ | 6.63 | | |
Maximum offering price per share(a) | | $ | 7.03 | | |
Class B | |
Net assets | | $ | 1,567,193 | | |
Shares outstanding | | | 237,762 | | |
Net asset value per share | | $ | 6.59 | | |
Class C | |
Net assets | | $ | 2,694,662 | | |
Shares outstanding | | | 415,222 | | |
Net asset value per share | | $ | 6.49 | | |
Class I | |
Net assets | | $ | 250,512,825 | | |
Shares outstanding | | | 37,748,304 | | |
Net asset value per share | | $ | 6.64 | | |
Class K | |
Net assets | | $ | 11,860 | | |
Shares outstanding | | | 1,795 | | |
Net asset value per share | | $ | 6.61 | | |
Class W | |
Net assets | | $ | 3,167 | | |
Shares outstanding | | | 480 | | |
Net asset value per share | | $ | 6.60 | | |
Class Z | |
Net assets | | $ | 72,838,903 | | |
Shares outstanding | | | 11,030,948 | | |
Net asset value per share | | $ | 6.60 | | |
(a) The maximum offering price per share is calculated by dividing the net asset value by 1.0 minus the maximum sales charge of 5.75%.
The accompanying Notes to Financial Statements are an integral part of this statement.
Semiannual Report 2013
11
Columbia European Equity Fund
Statement of Operations
Six Months Ended April 30, 2013 (Unaudited)
Net investment income | |
Income: | | | |
Dividends — unaffiliated issuers | | $ | 6,207,791 | | |
Dividends — affiliated issuers | | | 2,107 | | |
Income from securities lending — net | | | 204 | | |
Foreign taxes withheld | | | (591,044 | ) | |
Total income | | | 5,619,058 | | |
Expenses: | |
Investment management fees | | | 1,440,715 | | |
Distribution and/or service fees | |
Class A | | | 69,332 | | |
Class B | | | 7,656 | | |
Class C | | | 12,359 | | |
Class W | | | 4 | | |
Transfer agent fees | |
Class A | | | 71,023 | | |
Class B | | | 1,958 | | |
Class C | | | 3,177 | | |
Class K | | | 4 | | |
Class W | | | 4 | | |
Class Z | | | 83,298 | | |
Administration fees | | | 145,523 | | |
Plan administration fees | |
Class K | | | 20 | | |
Compensation of board members | | | 10,047 | | |
Custodian fees | | | 28,229 | | |
Printing and postage fees | | | 24,966 | | |
Registration fees | | | 69,470 | | |
Professional fees | | | 17,694 | | |
Other | | | 6,866 | | |
Total expenses | | | 1,992,345 | | |
Net investment income | | | 3,626,713 | | |
Realized and unrealized gain (loss) — net | |
Net realized gain (loss) on: | |
Investments | | | 8,142,314 | | |
Foreign currency translations | | | 61,415 | | |
Net realized gain | | | 8,203,729 | | |
Net change in unrealized appreciation (depreciation) on: | |
Investments | | | 35,969,543 | | |
Foreign currency translations | | | 29,925 | | |
Net change in unrealized appreciation (depreciation) | | | 35,999,468 | | |
Net realized and unrealized gain | | | 44,203,197 | | |
Net increase in net assets resulting from operations | | $ | 47,829,910 | | |
The accompanying Notes to Financial Statements are an integral part of this statement.
Semiannual Report 2013
12
Columbia European Equity Fund
Statement of Changes in Net Assets
| | | Six Months Ended
April 30, 2013
(Unaudited) | | Year Ended
October 31,
2012 | |
Operations | |
Net investment income | | $ | 3,626,713 | | | $ | 6,028,718 | | |
Net realized gain (loss) | | | 8,203,729 | | | | (200,192 | ) | |
Net change in unrealized appreciation (depreciation) | | | 35,999,468 | | | | 26,011,514 | | |
Net increase in net assets resulting from operations | | | 47,829,910 | | | | 31,840,040 | | |
Distributions to shareholders | |
Net investment income | | | | | |
Class A | | | (841,341 | ) | | | (146,906 | ) | |
Class B | | | (7,782 | ) | | | — | | |
Class C | | | (24,712 | ) | | | — | | |
Class I | | | (4,821,907 | ) | | | (2,750,865 | ) | |
Class K(a) | | | (321 | ) | | | (156 | ) | |
Class W | | | (54 | ) | | | — | | |
Class Z | | | (1,254,063 | ) | | | (2,120 | ) | |
Net realized gains | | | | | |
Class A | | | (225,554 | ) | | | — | | |
Class B | | | (6,395 | ) | | | — | | |
Class C | | | (9,195 | ) | | | — | | |
Class I | | | (972,651 | ) | | | — | | |
Class K(a) | | | (75 | ) | | | — | | |
Class W | | | (12 | ) | | | — | | |
Class Z | | | (258,474 | ) | | | — | | |
Total distributions to shareholders | | | (8,422,536 | ) | | | (2,900,047 | ) | |
Increase (decrease) in net assets from capital stock activity | | | (6,434,176 | ) | | | (58,640,140 | ) | |
Total increase (decrease) in net assets | | | 32,973,198 | | | | (29,700,147 | ) | |
Net assets at beginning of period | | | 353,584,183 | | | | 383,284,330 | | |
Net assets at end of period | | $ | 386,557,381 | | | $ | 353,584,183 | | |
Undistributed net investment income | | $ | 2,000,960 | | | $ | 5,324,427 | | |
(a) Effective October 25, 2012, Class R4 shares were renamed Class K shares.
The accompanying Notes to Financial Statements are an integral part of this statement.
Semiannual Report 2013
13
Columbia European Equity Fund
Statement of Changes in Net Assets (continued)
| | | Six Months Ended April 30, 2013
(Unaudited) | | Year Ended October 31, 2012(a) | |
| | | Shares | | Dollars ($) | | Shares | | Dollars ($) | |
Capital stock activity | |
Class A shares | |
Subscriptions(b) | | | 903,868 | | | | 5,702,383 | | | | 1,015,395 | | | | 5,676,650 | | |
Distributions reinvested | | | 167,217 | | | | 1,045,109 | | | | 27,218 | | | | 140,171 | | |
Redemptions | | | (1,074,702 | ) | | | (6,736,157 | ) | | | (3,163,855 | ) | | | (17,365,536 | ) | |
Net decrease | | | (3,617 | ) | | | 11,335 | | | | (2,121,242 | ) | | | (11,548,715 | ) | |
Class B shares | |
Subscriptions | | | 22,974 | | | | 145,880 | | | | 12,156 | | | | 68,779 | | |
Distributions reinvested | | | 2,231 | | | | 13,902 | | | | — | | | | — | | |
Redemptions(b) | | | (41,552 | ) | | | (262,564 | ) | | | (196,270 | ) | | | (1,054,046 | ) | |
Net decrease | | | (16,347 | ) | | | (102,782 | ) | | | (184,114 | ) | | | (985,267 | ) | |
Class C shares | |
Subscriptions | | | 122,414 | | | | 766,371 | | | | 198,639 | | | | 1,125,618 | | |
Distributions reinvested | | | 3,290 | | | | 20,202 | | | | — | | | | — | | |
Redemptions | | | (72,561 | ) | | | (450,790 | ) | | | (73,195 | ) | | | (401,509 | ) | |
Net increase | | | 53,143 | | | | 335,783 | | | | 125,444 | | | | 724,109 | | |
Class I shares | |
Subscriptions | | | 230,859 | | | | 1,429,579 | | | | 18,070,680 | | | | 101,625,088 | | |
Distributions reinvested | | | 927,097 | | | | 5,794,354 | | | | 534,136 | | | | 2,750,802 | | |
Redemptions | | | (3,104,657 | ) | | | (19,335,277 | ) | | | (36,955,761 | ) | | | (211,614,642 | ) | |
Net decrease | | | (1,946,701 | ) | | | (12,111,344 | ) | | | (18,350,945 | ) | | | (107,238,752 | ) | |
Class K shares(c) | |
Subscriptions | | | — | | | | — | | | | 106 | | | | 594 | | |
Distributions reinvested | | | 51 | | | | 313 | | | | 27 | | | | 136 | | |
Redemptions | | | (1,169 | ) | | | (7,389 | ) | | | (2,082 | ) | | | (11,825 | ) | |
Net decrease | | | (1,118 | ) | | | (7,076 | ) | | | (1,949 | ) | | | (11,095 | ) | |
Class W shares | |
Subscriptions | | | — | | | | — | | | | 480 | | | | 2,500 | | |
Net increase | | | — | | | | — | | | | 480 | | | | 2,500 | | |
Class Z shares | |
Subscriptions | | | 943,341 | | | | 5,923,649 | | | | 10,229,369 | | | | 60,852,542 | | |
Distributions reinvested | | | 242,971 | | | | 1,511,281 | | | | 402 | | | | 2,066 | | |
Redemptions | | | (320,942 | ) | | | (1,995,022 | ) | | | (76,973 | ) | | | (437,528 | ) | |
Net increase | | | 865,370 | | | | 5,439,908 | | | | 10,152,798 | | | | 60,417,080 | | |
Total net decrease | | | (1,049,270 | ) | | | (6,434,176 | ) | | | (10,379,528 | ) | | | (58,640,140 | ) | |
(a) Class W shares are for the period from June 18, 2012 (commencement of operations) to October 31, 2012.
(b) Includes conversions of Class B shares to Class A shares, if any.
(c) Effective October 25, 2012, Class R4 shares were renamed Class K shares.
The accompanying Notes to Financial Statements are an integral part of this statement.
Semiannual Report 2013
14
Columbia European Equity Fund
The following tables are intended to help you understand the Fund's financial performance. Certain information reflects financial results for a single share of a class held for the periods shown. Per share net investment income (loss) amounts are calculated based on average shares outstanding during the period. Total return assumes reinvestment of all dividends and distributions, if any. Total return does not reflect payment of sales charges, if any, and is not annualized for periods of less than one year.
| | | Six Months Ended
April 30, 2013 | | Year Ended October 31, | |
Class A | | (Unaudited) | | 2012 | | 2011 | | 2010 | | 2009 | | 2008 | |
Per share data | |
Net asset value, beginning of period | | $ | 5.94 | | | $ | 5.47 | | | $ | 5.80 | | | $ | 4.86 | | | $ | 3.88 | | | $ | 6.83 | | |
Income from investment operations: | |
Net investment income | | | 0.05 | | | | 0.08 | | | | 0.05 | | | | 0.03 | | | | 0.07 | | | | 0.06 | | |
Net realized and unrealized gain (loss) | | | 0.76 | | | | 0.40 | | | | (0.35 | ) | | | 0.98 | | | | 0.96 | | | | (2.96 | ) | |
Total from investment operations | | | 0.81 | | | | 0.48 | | | | (0.30 | ) | | | 1.01 | | | | 1.03 | | | | (2.90 | ) | |
Less distributions to shareholders: | |
Net investment income | | | (0.09 | ) | | | (0.01 | ) | | | (0.03 | ) | | | (0.07 | ) | | | (0.06 | ) | | | (0.05 | ) | |
Net realized gains | | | (0.03 | ) | | | — | | | | — | | | | — | | | | — | | | | — | | |
Total distributions to shareholders | | | (0.12 | ) | | | (0.01 | ) | | | (0.03 | ) | | | (0.07 | ) | | | (0.06 | ) | | | (0.05 | ) | |
Proceeds from regulatory settlements | | | — | | | | — | | | | — | | | | — | | | | 0.01 | | | | — | | |
Net asset value, end of period | | $ | 6.63 | | | $ | 5.94 | | | $ | 5.47 | | | $ | 5.80 | | | $ | 4.86 | | | $ | 3.88 | | |
Total return | | | 13.78 | % | | | 8.88 | % | | | (5.25 | %) | | | 21.14 | % | | | 27.11 | %(a) | | | (42.70 | %) | |
Ratios to average net assets(b)(c) | |
Total gross expenses | | | 1.46 | %(e) | | | 1.54 | %(d) | | | 1.55 | % | | | 1.67 | % | | | 1.93 | % | | | 1.58 | % | |
Total net expenses(f) | | | 1.46 | %(e) | | | 1.52 | %(d)(g) | | | 1.51 | %(g) | | | 1.41 | % | | | 1.61 | % | | | 1.58 | % | |
Net investment income | | | 1.62 | %(e) | | | 1.42 | % | | | 0.84 | % | | | 0.63 | % | | | 1.79 | % | | | 0.95 | % | |
Supplemental data | |
Net assets, end of period (in thousands) | | $ | 58,929 | | | $ | 52,850 | | | $ | 60,295 | | | $ | 69,831 | | | $ | 64,717 | | | $ | 57,916 | | |
Portfolio turnover | | | 32 | % | | | 126 | % | | | 121 | % | | | 115 | % | | | 154 | % | | | 180 | % | |
Notes to Financial Highlights
(a) The Fund received proceeds from regulatory settlements. Had the Fund not received these proceeds, the total return would have been lower by 0.12%.
(b) In addition to the fees and expenses which the Fund bears directly, the Fund indirectly bears a pro rata share of the fees and expenses of the acquired funds in which it invests. Such indirect expenses are not included in the reported expense ratios.
(c) Certain line items from prior years have been reclassified to conform to the current presentation.
(d) Ratios include line of credit interest expense which rounds to less than 0.01%.
(e) Annualized.
(f) Total net expenses include the impact of certain waivers/reimbursements made by the Investment Manager and certain of its affiliates, if applicable.
(g) The benefits derived from expense reductions had an impact of less than 0.01%.
The accompanying Notes to Financial Statements are an integral part of this statement.
Semiannual Report 2013
15
Columbia European Equity Fund
Financial Highlights (continued)
| | | Six Months Ended
April 30, 2013 | | Year Ended October 31, | |
Class B | | (Unaudited) | | 2012 | | 2011 | | 2010 | | 2009 | | 2008 | |
Per share data | |
Net asset value, beginning of period | | $ | 5.87 | | | $ | 5.44 | | | $ | 5.78 | | | $ | 4.83 | | | $ | 3.82 | | | $ | 6.73 | | |
Income from investment operations: | |
Net investment income (loss) | | | 0.03 | | | | 0.04 | | | | 0.01 | | | | (0.00 | )(a) | | | 0.05 | | | | 0.02 | | |
Net realized and unrealized gain (loss) | | | 0.75 | | | | 0.39 | | | | (0.35 | ) | | | 0.97 | | | | 0.95 | | | | (2.93 | ) | |
Total from investment operations | | | 0.78 | | | | 0.43 | | | | (0.34 | ) | | | 0.97 | | | | 1.00 | | | | (2.91 | ) | |
Less distributions to shareholders: | |
Net investment income | | | (0.03 | ) | | | — | | | | — | | | | (0.02 | ) | | | — | | | | — | | |
Net realized gains | | | (0.03 | ) | | | — | | | | — | | | | — | | | | — | | | | — | | |
Total distributions to shareholders | | | (0.06 | ) | | | — | | | | — | | | | (0.02 | ) | | | — | | | | — | | |
Proceeds from regulatory settlements | | | — | | | | — | | | | — | | | | — | | | | 0.01 | | | | — | | |
Net asset value, end of period | | $ | 6.59 | | | $ | 5.87 | | | $ | 5.44 | | | $ | 5.78 | | | $ | 4.83 | | | $ | 3.82 | | |
Total return | | | 13.29 | % | | | 7.90 | % | | | (5.88 | %) | | | 20.10 | % | | | 26.44 | %(b) | | | (43.24 | %) | |
Ratios to average net assets(c)(d) | |
Total gross expenses | | | 2.21 | %(f) | | | 2.28 | %(e) | | | 2.30 | % | | | 2.41 | % | | | 2.74 | % | | | 2.32 | % | |
Total net expenses(g) | | | 2.21 | %(f) | | | 2.27 | %(e)(h) | | | 2.26 | %(h) | | | 2.16 | % | | | 2.40 | % | | | 2.32 | % | |
Net investment income (loss) | | | 0.82 | %(f) | | | 0.78 | % | | | 0.15 | % | | | (0.06 | %) | | | 1.22 | % | | | 0.28 | % | |
Supplemental data | |
Net assets, end of period (in thousands) | | $ | 1,567 | | | $ | 1,492 | | | $ | 2,382 | | | $ | 4,051 | | | $ | 6,124 | | | $ | 10,080 | | |
Portfolio turnover | | | 32 | % | | | 126 | % | | | 121 | % | | | 115 | % | | | 154 | % | | | 180 | % | |
Notes to Financial Highlights
(a) Rounds to zero.
(b) The Fund received proceeds from regulatory settlements. Had the Fund not received these proceeds, the total return would have been lower by 0.12%.
(c) In addition to the fees and expenses which the Fund bears directly, the Fund indirectly bears a pro rata share of the fees and expenses of the acquired funds in which it invests. Such indirect expenses are not included in the reported expense ratios.
(d) Certain line items from prior years have been reclassified to conform to the current presentation.
(e) Ratios include line of credit interest expense which rounds to less than 0.01%.
(f) Annualized.
(g) Total net expenses include the impact of certain waivers/reimbursements made by the Investment Manager and certain of its affiliates, if applicable.
(h) The benefits derived from expense reductions had an impact of less than 0.01%.
The accompanying Notes to Financial Statements are an integral part of this statement.
Semiannual Report 2013
16
Columbia European Equity Fund
Financial Highlights (continued)
| | | Six Months Ended
April 30, 2013 | | Year Ended October 31, | |
Class C | | (Unaudited) | | 2012 | | 2011 | | 2010 | | 2009 | | 2008 | |
Per share data | |
Net asset value, beginning of period | | $ | 5.82 | | | $ | 5.39 | | | $ | 5.72 | | | $ | 4.81 | | | $ | 3.81 | | | $ | 6.71 | | |
Income from investment operations: | |
Net investment income (loss) | | | 0.03 | | | | 0.04 | | | | 0.01 | | | | (0.01 | ) | | | 0.04 | | | | 0.01 | | |
Net realized and unrealized gain (loss) | | | 0.73 | | | | 0.39 | | | | (0.34 | ) | | | 0.96 | | | | 0.95 | | | | (2.90 | ) | |
Total from investment operations | | | 0.76 | | | | 0.43 | | | | (0.33 | ) | | | 0.95 | | | | 0.99 | | | | (2.89 | ) | |
Less distributions to shareholders: | |
Net investment income | | | (0.06 | ) | | | — | | | | — | | | | (0.04 | ) | | | (0.00 | )(a) | | | (0.01 | ) | |
Net realized gains | | | (0.03 | ) | | | — | | | | — | | | | — | | | | — | | | | — | | |
Total distributions to shareholders | | | (0.09 | ) | | | — | | | | — | | | | (0.04 | ) | | | (0.00 | )(a) | | | (0.01 | ) | |
Proceeds from regulatory settlements | | | — | | | | — | | | | — | | | | — | | | | 0.01 | | | | — | | |
Net asset value, end of period | | $ | 6.49 | | | $ | 5.82 | | | $ | 5.39 | | | $ | 5.72 | | | $ | 4.81 | | | $ | 3.81 | | |
Total return | | | 13.23 | % | | | 7.98 | % | | | (5.77 | %) | | | 19.96 | % | | | 26.39 | %(b) | | | (43.10 | %) | |
Ratios to average net assets(c)(d) | |
Total gross expenses | | | 2.21 | %(f) | | | 2.31 | %(e) | | | 2.29 | % | | | 2.43 | % | | | 2.69 | % | | | 2.33 | % | |
Total net expenses(g) | | | 2.21 | %(f) | | | 2.27 | %(e)(h) | | | 2.26 | %(h) | | | 2.17 | % | | | 2.37 | % | | | 2.33 | % | |
Net investment income (loss) | | | 0.91 | %(f) | | | 0.72 | % | | | 0.11 | % | | | (0.10 | %) | | | 1.07 | % | | | 0.25 | % | |
Supplemental data | |
Net assets, end of period (in thousands) | | $ | 2,695 | | | $ | 2,106 | | | $ | 1,274 | | | $ | 1,406 | | | $ | 1,157 | | | $ | 954 | | |
Portfolio turnover | | | 32 | % | | | 126 | % | | | 121 | % | | | 115 | % | | | 154 | % | | | 180 | % | |
Notes to Financial Highlights
(a) Rounds to zero.
(b) The Fund received proceeds from regulatory settlements. Had the Fund not received these proceeds, the total return would have been lower by 0.12%.
(c) In addition to the fees and expenses which the Fund bears directly, the Fund indirectly bears a pro rata share of the fees and expenses of the acquired funds in which it invests. Such indirect expenses are not included in the reported expense ratios.
(d) Certain line items from prior years have been reclassified to conform to the current presentation.
(e) Ratios include line of credit interest expense which rounds to less than 0.01%.
(f) Annualized.
(g) Total net expenses include the impact of certain waivers/reimbursements made by the Investment Manager and certain of its affiliates, if applicable.
(h) The benefits derived from expense reductions had an impact of less than 0.01%.
The accompanying Notes to Financial Statements are an integral part of this statement.
Semiannual Report 2013
17
Columbia European Equity Fund
Financial Highlights (continued)
| | | Six Months Ended
April 30, 2013 | | Year Ended October 31, | |
Class I | | (Unaudited) | | 2012 | | 2011 | | 2010 | | 2009 | | 2008 | |
Per share data | |
Net asset value, beginning of period | | $ | 5.96 | | | $ | 5.50 | | | $ | 5.80 | | | $ | 4.86 | | | $ | 3.89 | | | $ | 6.84 | | |
Income from investment operations: | |
Net investment income | | | 0.07 | | | | 0.10 | | | | 0.11 | | | | 0.05 | | | | 0.09 | | | | 0.09 | | |
Net realized and unrealized gain (loss) | | | 0.76 | | | | 0.41 | | | | (0.36 | ) | | | 0.98 | | | | 0.95 | | | | (2.96 | ) | |
Total from investment operations | | | 0.83 | | | | 0.51 | | | | (0.25 | ) | | | 1.03 | | | | 1.04 | | | | (2.87 | ) | |
Less distributions to shareholders: | |
Net investment income | | | (0.12 | ) | | | (0.05 | ) | | | (0.05 | ) | | | (0.09 | ) | | | (0.08 | ) | | | (0.08 | ) | |
Net realized gains | | | (0.03 | ) | | | — | | | | — | | | | — | | | | — | | | | — | | |
Total distributions to shareholders | | | (0.15 | ) | | | (0.05 | ) | | | (0.05 | ) | | | (0.09 | ) | | | (0.08 | ) | | | (0.08 | ) | |
Proceeds from regulatory settlements | | | — | | | | — | | | | — | | | | — | | | | 0.01 | | | | — | | |
Net asset value, end of period | | $ | 6.64 | | | $ | 5.96 | | | $ | 5.50 | | | $ | 5.80 | | | $ | 4.86 | | | $ | 3.89 | | |
Total return | | | 14.13 | % | | | 9.36 | % | | | (4.36 | %) | | | 21.61 | % | | | 27.78 | %(a) | | | (42.38 | %) | |
Ratios to average net assets(b)(c) | |
Total gross expenses | | | 0.96 | %(e) | | | 0.97 | %(d) | | | 1.00 | % | | | 1.14 | % | | | 1.31 | % | | | 1.08 | % | |
Total net expenses(f) | | | 0.96 | %(e) | | | 0.97 | %(d) | | | 1.00 | % | | | 0.96 | % | | | 1.16 | % | | | 1.08 | % | |
Net investment income | | | 2.11 | %(e) | | | 1.86 | % | | | 1.83 | % | | | 1.07 | % | | | 2.27 | % | | | 1.50 | % | |
Supplemental data | |
Net assets, end of period (in thousands) | | $ | 250,513 | | | $ | 236,735 | | | $ | 319,236 | | | $ | 8 | | | $ | 6 | | | $ | 5 | | |
Portfolio turnover | | | 32 | % | | | 126 | % | | | 121 | % | | | 115 | % | | | 154 | % | | | 180 | % | |
Notes to Financial Highlights
(a) The Fund received proceeds from regulatory settlements. Had the Fund not received these proceeds, the total return would have been lower by 0.12%.
(b) In addition to the fees and expenses which the Fund bears directly, the Fund indirectly bears a pro rata share of the fees and expenses of the acquired funds in which it invests. Such indirect expenses are not included in the reported expense ratios.
(c) Certain line items from prior years have been reclassified to conform to the current presentation.
(d) Ratios include line of credit interest expense which rounds to less than 0.01%.
(e) Annualized.
(f) Total net expenses include the impact of certain waivers/reimbursements made by the Investment Manager and certain of its affiliates, if applicable.
The accompanying Notes to Financial Statements are an integral part of this statement.
Semiannual Report 2013
18
Columbia European Equity Fund
Financial Highlights (continued)
| | | Six Months Ended
April 30, 2013 | | Year Ended October 31, | |
Class K(a) | | (Unaudited) | | 2012 | | 2011 | | 2010 | | 2009 | | 2008 | |
Per share data | |
Net asset value, beginning of period | | $ | 5.93 | | | $ | 5.47 | | | $ | 5.79 | | | $ | 4.86 | | | $ | 3.90 | | | $ | 6.84 | | |
Income from investment operations: | |
Net investment income | | | 0.05 | | | | 0.08 | | | | 0.06 | | | | 0.04 | | | | 0.07 | | | | 0.08 | | |
Net realized and unrealized gain (loss) | | | 0.77 | | | | 0.41 | | | | (0.34 | ) | | | 0.97 | | | | 0.97 | | | | (2.94 | ) | |
Total from investment operations | | | 0.82 | | | | 0.49 | | | | (0.28 | ) | | | 1.01 | | | | 1.04 | | | | (2.86 | ) | |
Less distributions to shareholders: | |
Net investment income | | | (0.11 | ) | | | (0.03 | ) | | | (0.04 | ) | | | (0.08 | ) | | | (0.09 | ) | | | (0.08 | ) | |
Net realized gains | | | (0.03 | ) | | | — | | | | — | | | | — | | | | — | | | | — | | |
Total distributions to shareholders | | | (0.14 | ) | | | (0.03 | ) | | | (0.04 | ) | | | (0.08 | ) | | | (0.09 | ) | | | (0.08 | ) | |
Proceeds from regulatory settlements | | | — | | | | — | | | | — | | | | — | | | | 0.01 | | | | — | | |
Net asset value, end of period | | $ | 6.61 | | | $ | 5.93 | | | $ | 5.47 | | | $ | 5.79 | | | $ | 4.86 | | | $ | 3.90 | | |
Total return | | | 13.90 | % | | | 9.08 | % | | | (4.93 | %) | | | 21.08 | % | | | 27.57 | %(b) | | | (42.29 | %) | |
Ratios to average net assets(c)(d) | |
Total gross expenses | | | 1.26 | %(f) | | | 1.27 | %(e) | | | 1.32 | % | | | 1.49 | % | | | 1.58 | % | | | 1.36 | % | |
Total net expenses(g) | | | 1.26 | %(f) | | | 1.27 | %(e) | | | 1.26 | % | | | 1.27 | % | | | 1.39 | % | | | 1.11 | % | |
Net investment income | | | 1.48 | %(f) | | | 1.43 | % | | | 1.08 | % | | | 0.79 | % | | | 1.79 | % | | | 1.35 | % | |
Supplemental data | |
Net assets, end of period (in thousands) | | $ | 12 | | | $ | 17 | | | $ | 27 | | | $ | 25 | | | $ | 18 | | | $ | 13 | | |
Portfolio turnover | | | 32 | % | | | 126 | % | | | 121 | % | | | 115 | % | | | 154 | % | | | 180 | % | |
Notes to Financial Highlights
(a) Effective October 25, 2012, Class R4 shares were renamed Class K shares.
(b) The Fund received proceeds from regulatory settlements. Had the Fund not received these proceeds, the total return would have been lower by 0.12%.
(c) In addition to the fees and expenses which the Fund bears directly, the Fund indirectly bears a pro rata share of the fees and expenses of the acquired funds in which it invests. Such indirect expenses are not included in the reported expense ratios.
(d) Certain line items from prior years have been reclassified to conform to the current presentation.
(e) Ratios include line of credit interest expense which rounds to less than 0.01%.
(f) Annualized.
(g) Total net expenses include the impact of certain waivers/reimbursements made by the Investment Manager and certain of its affiliates, if applicable.
The accompanying Notes to Financial Statements are an integral part of this statement.
Semiannual Report 2013
19
Columbia European Equity Fund
Financial Highlights (continued)
| | | Six Months Ended
April 30, 2013 | | Year Ended
October 31, | |
Class W | | (Unaudited) | | 2012(a) | |
Per share data | |
Net asset value, beginning of period | | $ | 5.94 | | | $ | 5.21 | | |
Income from investment operations: | |
Net investment income | | | 0.05 | | | | 0.00 | (b) | |
Net realized and unrealized gain | | | 0.75 | | | | 0.73 | | |
Total from investment operations | | | 0.80 | | | | 0.73 | | |
Less distributions to shareholders: | |
Net investment income | | | (0.11 | ) | | | — | | |
Net realized gains | | | (0.03 | ) | | | — | | |
Total distributions to shareholders | | | (0.14 | ) | | | — | | |
Net asset value, end of period | | $ | 6.60 | | | $ | 5.94 | | |
Total return | | | 13.59 | % | | | 14.01 | % | |
Ratios to average net assets(c)(d) | |
Total gross expenses | | | 1.49 | %(e) | | | 1.64 | %(e) | |
Total net expenses | | | 1.49 | %(e) | | | 1.52 | %(e) | |
Net investment income | | | 1.59 | %(e) | | | 0.11 | %(e) | |
Supplemental data | |
Net assets, end of period (in thousands) | | $ | 3 | | | $ | 3 | | |
Portfolio turnover | | | 32 | % | | | 126 | % | |
Notes to Financial Highlights
(a) For the period from June 18, 2012 (commencement of operations) to October 31, 2012.
(b) Rounds to zero.
(c) In addition to the fees and expenses which the Fund bears directly, the Fund indirectly bears a pro rata share of the fees and expenses of the acquired funds in which it invests. Such indirect expenses are not included in the reported expense ratios.
(d) Certain line items from prior years have been reclassified to conform to the current presentation.
(e) Annualized.
The accompanying Notes to Financial Statements are an integral part of this statement.
Semiannual Report 2013
20
Columbia European Equity Fund
Financial Highlights (continued)
| | | Six Months Ended
April 30, 2013 | | Year Ended October 31, | |
Class Z | | (Unaudited) | | 2012 | | 2011 | | 2010(a) | |
Per share data | |
Net asset value, beginning of period | | $ | 5.94 | | | $ | 5.49 | | | $ | 5.80 | | | $ | 5.52 | | |
Income from investment operations: | |
Net investment income | | | 0.06 | | | | 0.02 | | | | 0.10 | | | | 0.00 | (b) | |
Net realized and unrealized gain (loss) | | | 0.75 | | | | 0.47 | | | | (0.36 | ) | | | 0.28 | | |
Total from investment operations | | | 0.81 | | | | 0.49 | | | | (0.26 | ) | | | 0.28 | | |
Less distributions to shareholders: | |
Net investment income | | | (0.12 | ) | | | (0.04 | ) | | | (0.05 | ) | | | — | | |
Net realized gains | | | (0.03 | ) | | | — | | | | — | | | | — | | |
Total distributions to shareholders | | | (0.15 | ) | | | (0.04 | ) | | | (0.05 | ) | | | — | | |
Net asset value, end of period | | $ | 6.60 | | | $ | 5.94 | | | $ | 5.49 | | | $ | 5.80 | | |
Total return | | | 13.79 | % | | | 9.09 | % | | | (4.57 | %) | | | 5.07 | % | |
Ratios to average net assets(c)(d) | |
Total gross expenses | | | 1.21 | %(e) | | | 1.49 | %(f) | | | 1.24 | % | | | 1.96 | %(e) | |
Total net expenses(g) | | | 1.21 | %(e) | | | 1.27 | %(f)(h) | | | 1.24 | %(h) | | | 1.27 | %(e) | |
Net investment income | | | 1.93 | %(e) | | | 0.34 | % | | | 1.72 | % | | | 0.12 | %(e) | |
Supplemental data | |
Net assets, end of period (in thousands) | | $ | 72,839 | | | $ | 60,380 | | | $ | 70 | | | $ | 3 | | |
Portfolio turnover | | | 32 | % | | | 126 | % | | | 121 | % | | | 115 | % | |
Notes to Financial Highlights
(a) For the period from September 27, 2010 (commencement of operations) to October 31, 2010.
(b) Rounds to zero.
(c) In addition to the fees and expenses which the Fund bears directly, the Fund indirectly bears a pro rata share of the fees and expenses of the acquired funds in which it invests. Such indirect expenses are not included in the reported expense ratios.
(d) Certain line items from prior years have been reclassified to conform to the current presentation.
(e) Annualized.
(f) Ratios include line of credit interest expense which rounds to less than 0.01%.
(g) Total net expenses include the impact of certain waivers/reimbursements made by the Investment Manager and certain of its affiliates, if applicable.
(h) The benefits derived from expense reductions had an impact of less than 0.01%.
The accompanying Notes to Financial Statements are an integral part of this statement.
Semiannual Report 2013
21
Columbia European Equity Fund
Notes to Financial Statements
April 30, 2013 (Unaudited)
Note 1. Organization
Columbia European Equity Fund (the Fund), a series of Columbia Funds Series Trust II (the Trust), is a diversified fund. The Trust is registered under the Investment Company Act of 1940, as amended (the 1940 Act), as an open-end management investment company organized as a Massachusetts business trust.
Fund Shares
The Trust may issue an unlimited number of shares (without par value). The Fund offers Class A, Class B, Class C, Class I, Class K, Class W and Class Z shares. All share classes have identical voting, dividend and liquidation rights. Each share class has its own expense structure and sales charges, as applicable.
Class A shares are subject to a maximum front-end sales charge of 5.75% based on the initial investment amount. Class A shares purchased without an initial sales charge in accounts aggregating $1 million to $50 million at the time of purchase are subject to a contingent deferred sales charge (CDSC) if the shares are sold within 18 months of purchase, charged as follows: 1.00% CDSC if redeemed within 12 months of purchase, and 0.50% CDSC if redeemed more than 12, but less than 18, months after purchase.
Class B shares may be subject to a maximum CDSC of 5.00% based upon the holding period after purchase. Class B shares will generally convert to Class A shares eight years after purchase. The Fund no longer accepts investments by new or existing investors in the Fund's Class B shares, except in connection with the reinvestment of any dividend and/or capital gain distributions in Class B shares of the Fund and exchanges by existing Class B shareholders of certain other funds within the Columbia Family of Funds.
Class C shares are subject to a 1.00% CDSC on shares redeemed within one year of purchase.
Class I shares are not subject to sales charges and are available only to the Columbia Family of Funds.
Class K shares are not subject to sales charges, however this share class is closed to new investors.
Class W shares are not subject to sales charges and are available only to investors purchasing through authorized investment programs managed by investment professionals, including discretionary managed account programs.
Class Z shares are not subject to sales charges, and are available only to certain investors.
Note 2. Summary of Significant Accounting Policies
Use of Estimates
The preparation of financial statements in accordance with U.S. generally accepted accounting principles (GAAP) requires management to make certain estimates and assumptions that affect the reported amounts of assets and liabilities, the disclosure of contingent assets and liabilities at the date of the financial statements and the reported amounts of revenue and expenses during the reporting period. Actual results could differ from those estimates.
The following is a summary of significant accounting policies consistently followed by the Fund in the preparation of its financial statements.
Security Valuation
All equity securities are valued at the close of business of the New York Stock Exchange (NYSE). Equity securities are valued at the last quoted sales price on the principal exchange or market on which they trade, except for securities traded on the NASDAQ Stock Market, which are valued at the NASDAQ official close price. Unlisted securities or listed securities for which there were no sales during the day are valued at the mean of the latest quoted bid and ask prices on such exchanges or markets.
Foreign equity securities are valued based on quotations from the principal market in which such securities are normally traded. If any foreign share prices are not readily available as a result of limited share activity the securities are valued at the mean of the latest quoted bid and ask prices on such exchanges or markets. Foreign currency exchange rates are generally determined at 4:00 p.m. Eastern (U.S.) time. However, many securities markets and exchanges outside the U.S. close prior to the close of the NYSE; therefore, the closing prices for securities in such markets or on such exchanges may not fully reflect events that occur after such close but before the close of the NYSE. In those situations, foreign securities will be fair valued pursuant to the policy adopted by the Board of Trustees (the Board), including utilizing a third party pricing service to determine these fair values. The third party pricing service takes into account multiple factors, including, but not limited to, movements in the U.S. securities markets, certain depositary receipts, futures contracts and foreign exchange rates that have occurred subsequent to the close of the foreign exchange or market, to determine a good faith estimate that reasonably reflects the current market conditions as of the close of the NYSE. The fair value of a security is likely to be different from the quoted or published price, if available.
Semiannual Report 2013
22
Columbia European Equity Fund
Notes to Financial Statements (continued)
April 30, 2013 (Unaudited)
Investments in other open-end investment companies, including money market funds, are valued at net asset value.
Investments for which market quotations are not readily available, or that have quotations which management believes are not reliable, are valued at fair value as determined in good faith under consistently applied procedures established by and under the general supervision of the Board. If a security or class of securities (such as foreign securities) is valued at fair value, such value is likely to be different from the last quoted market price for the security.
The determination of fair value often requires significant judgment. To determine fair value, management may use assumptions including but not limited to future cash flows and estimated risk premiums. Multiple inputs from various sources may be used to determine fair value.
Foreign Currency Transactions and Translations
The values of all assets and liabilities denominated in foreign currencies are translated into U.S. dollars at that day's exchange rates. Net realized and unrealized gains (losses) on foreign currency transactions and translations include gains (losses) arising from the fluctuation in exchange rates between trade and settlement dates on securities transactions, gains (losses) arising from the disposition of foreign currency and currency gains (losses) between the accrual and payment dates on dividends, interest income and foreign withholding taxes.
For financial statement purposes, the Fund does not distinguish that portion of gains (losses) on investments which is due to changes in foreign exchange rates from that which is due to changes in market prices of the investments. Such fluctuations are included with the net realized and unrealized gains (losses) on investments in the Statement of Operations.
Security Transactions
Security transactions are accounted for on the trade date. Cost is determined and gains (losses) are based upon the specific identification method for both financial statement and federal income tax purposes.
Income Recognition
Corporate actions and dividend income are recorded net of any non-reclaimable tax withholdings, on the ex-dividend date or upon receipt of ex-dividend notification in the case of certain foreign securities.
Awards from class action litigation are recorded as a reduction of cost basis if the Fund still owns the applicable securities on the payment date. If the Fund no longer owns the applicable securities, the proceeds are recorded as realized gains.
Expenses
General expenses of the Trust are allocated to the Fund and other funds of the Trust based upon relative net assets or other expense allocation methodologies determined by the nature of the expense. Expenses directly attributable to the Fund are charged to the Fund. Expenses directly attributable to a specific class of shares are charged to that share class.
Determination of Class Net Asset Value
All income, expenses (other than class-specific expenses, which are charged to that share class, as shown in the Statement of Operations) and realized and unrealized gains (losses) are allocated to each class of the Fund on a daily basis, based on the relative net assets of each class, for purposes of determining the net asset value of each class.
Federal Income Tax Status
The Fund intends to qualify each year as a regulated investment company under Subchapter M of the Internal Revenue Code, as amended, and will distribute substantially all of its taxable income (including net short-term capital gains), if any, for its tax year, and as such will not be subject to federal income taxes. In addition, the Fund intends to distribute in each calendar year substantially all of its net investment income, capital gains and certain other amounts, if any, such that the Fund should not be subject to federal excise tax. Therefore, no federal income or excise tax provision is recorded.
Foreign Taxes
The Fund may be subject to foreign taxes on income, gains on investments or currency repatriation, a portion of which may be recoverable. The Fund will accrue such taxes and recoveries, as applicable, based upon its current interpretation of tax rules and regulations that exist in the markets in which it invests.
Realized gains in certain countries may be subject to foreign taxes at the Fund level, based on statutory rates. The Fund accrues for such foreign taxes on net realized and unrealized gains at the appropriate rate for each jurisdiction, as applicable. The amount, if any, is disclosed as a liability on the Statement of Assets and Liabilities.
Distributions to Shareholders
Distributions from net investment income, if any, are declared and paid annually. Net realized capital gains, if any, are distributed along with the income distribution. Income distributions and capital gain distributions are determined in accordance with federal income tax regulations, which may differ from GAAP.
Semiannual Report 2013
23
Columbia European Equity Fund
Notes to Financial Statements (continued)
April 30, 2013 (Unaudited)
Guarantees and Indemnifications
Under the Trust's organizational documents and, in some cases, by contract, its officers and trustees are indemnified against certain liabilities arising out of the performance of their duties to the Trust or its funds. In addition, certain of the Fund's contracts with its service providers contain general indemnification clauses. The Fund's maximum exposure under these arrangements is unknown since the amount of any future claims that may be made against the Fund cannot be determined, and the Fund has no historical basis for predicting the likelihood of any such claims.
Recent Accounting Pronouncement
Disclosures about Offsetting Assets and Liabilities
In December 2011, the Financial Accounting Standards Board (FASB) issued Accounting Standards Update (ASU) No. 2011-11, Disclosures about Offsetting Assets and Liabilities and in January 2013, ASU No. 2013-1, Clarifying the Scope of Disclosures about Offsetting Assets and Liabilities (collectively, the ASUs). Specifically, the ASUs require an entity to disclose both gross and net information for derivatives and other financial instruments that are subject to a master netting arrangement or similar agreement. The ASUs require disclosure of collateral received in connection with the master netting agreements or similar agreements. The disclosure requirements are effective for interim and annual periods beginning on or after January 1, 2013. At this time, management is evaluating the implications of this guidance and the impact it will have on the financial statement amounts and footnote disclosures, if any.
Note 3. Fees and Compensation Paid to Affiliates
Investment Management Fees
Under an Investment Management Services Agreement, Columbia Management Investment Advisers, LLC (the Investment Manager), a wholly-owned subsidiary of Ameriprise Financial, Inc. (Ameriprise Financial), is responsible for the ultimate oversight of investments made by the Fund. The Fund's subadviser (see Subadvisory Agreement below) has the primary responsibility for the day-to-day portfolio management of the Fund. The investment management fee is an annual fee that is equal to a percentage of the Fund's average daily net assets that declines from 0.80% to 0.57% as the Fund's net assets increase. The annualized effective investment management fee rate for the six months ended April 30, 2013 was 0.79% of the Fund's average daily net assets.
Subadvisory Agreement
The Investment Manager has entered into a Subadvisory Agreement with Threadneedle International Limited (Threadneedle), an affiliate of the Investment Manager and wholly-owned subsidiary of Ameriprise Financial, the subadviser of the Fund. The Investment Manager compensates Threadneedle to manage the investment of the Fund's assets.
Administration Fees
Under an Administrative Services Agreement, the Investment Manager also serves as the Fund Administrator. The Fund pays the Fund Administrator an annual fee for administration and accounting services equal to a percentage of the Fund's average daily net assets that declines from 0.08% to 0.05% as the Fund's net assets increase. The annualized effective administration fee rate for the six months ended April 30, 2013 was 0.08% of the Fund's average daily net assets.
Other Expenses
Other expenses are for, among other things, certain expenses of the Fund or the Board, including: Fund boardroom and office expense, employee compensation, employee health and retirement benefits, and certain other expenses. Payment of these Fund and Board expenses is facilitated by a company providing limited administrative services to the Fund and the Board. For the six months ended April 30, 2013, other expenses paid to this company were $886.
Compensation of Board Members
Board members are compensated for their services to the Fund as disclosed in the Statement of Operations. Under a Deferred Compensation Plan (the Plan), the Board members who are not "interested persons" of the Fund, as defined under the 1940 Act, may elect to defer payment of up to 100% of their compensation. Deferred amounts are treated as though equivalent dollar amounts had been invested in shares of certain funds managed by the Investment Manager. The Fund's liability for these amounts is adjusted for market value changes and remains in the Fund until distributed in accordance with the Plan.
Transfer Agent Fees
Under a Transfer and Dividend Disbursing Agent Agreement, Columbia Management Investment Services Corp. (the Transfer Agent), an affiliate of the Investment Manager and a wholly-owned subsidiary of Ameriprise Financial, is responsible for providing transfer agency services to the Fund. The Transfer Agent has contracted with Boston Financial Data Services (BFDS) to serve as sub-transfer agent.
The Transfer Agent receives monthly account-based service fees based on the number of open accounts and also receives
Semiannual Report 2013
24
Columbia European Equity Fund
Notes to Financial Statements (continued)
April 30, 2013 (Unaudited)
sub-transfer agency fees based on a percentage of the average aggregate value of the Fund's shares maintained in omnibus accounts (other than omnibus accounts for which American Enterprise Investment Services Inc. is the broker of record or accounts where the beneficial shareholder is a customer of Ameriprise Financial Services, Inc., which are paid a per account fee). The Transfer Agent pays the fees of BFDS for services as sub-transfer agent and is not entitled to reimbursement for such fees from the Fund (with the exception of out-of-pocket fees).
The Transfer Agent also receives compensation from fees for various shareholder services and reimbursements for certain out-of-pocket fees. Class I shares do not pay transfer agent fees. Total transfer agent fees for Class K shares are subject to an annual limitation of not more than 0.05% of the average daily net assets attributable to Class K shares.
For the six months ended April 30, 2013, the Fund's annualized effective transfer agent fee rates as a percentage of average daily net assets of each class were as follows:
Class A | | | 0.26 | % | |
Class B | | | 0.26 | | |
Class C | | | 0.26 | | |
Class K | | | 0.05 | | |
Class W | | | 0.27 | | |
Class Z | | | 0.26 | | |
An annual minimum account balance fee of $20 may apply to certain accounts with a value below the Fund's initial minimum investment requirements to reduce the impact of small accounts on transfer agent fees. These minimum account balance fees are recorded as part of expense reductions in the Statement of Operations. For the six months ended April 30, 2013, no minimum account balance fees were charged by the Fund.
Plan Administration Fees
Under a Plan Administration Services Agreement with the Transfer Agent, the Fund pays an annual fee at a rate of 0.25% of the Fund's average daily net assets attributable to Class K shares for the provision of various administrative, recordkeeping, communication and educational services.
Distribution Fees
The Fund has an agreement with Columbia Management Investment Distributors, Inc. (the Distributor), an affiliate of the Investment Manager and a wholly-owned subsidiary of Ameriprise Financial, for distribution and shareholder services. Under a Plan and Agreement of Distribution pursuant to Rule 12b-1, the Fund pays a fee at an annual rate of up to 0.25% of the Fund's average daily net assets
attributable to Class A and Class W shares, and a fee at an annual rate of up to 1.00% of the Fund's average daily net assets attributable to Class B and Class C shares. For Class B and Class C shares, of the 1.00% fee, up to 0.75% is reimbursed for distribution expenses.
The amount of distribution expenses incurred by the Distributor and not yet reimbursed (unreimbursed expense) was approximately $127,000 and $48,000 for Class B and Class C shares, respectively. These amounts are based on the most recent information available as of March 31, 2013, and may be recovered from future payments under the distribution plan or CDSCs. To the extent the unreimbursed expense has been fully recovered, the distribution fee is reduced.
Sales Charges
Sales charges, including front-end charges and CDSCs, received by the Distributor for distributing Fund shares were $43,700 for Class A and $10 for Class B shares for the six months ended April 30, 2013.
Expenses Waived/Reimbursed by the Investment Manager and its Affiliates
The Investment Manager and certain of its affiliates have contractually agreed to waive fees and/or reimburse expenses (excluding certain fees and expenses described below) for the periods disclosed below, unless sooner terminated at the sole discretion of the Board, so that the Fund's net operating expenses, after giving effect to fees waived/expenses reimbursed and any balance credits and/or overdraft charges from the Fund's custodian, do not exceed the following annual rates as a percentage of the class' average daily net assets:
| | | March 1, 2013
through
February 28, 2014 | | Prior to
March 1, 2013 | |
Class A | | | 1.51 | % | | | 1.52 | % | |
Class B | | | 2.26 | | | | 2.27 | | |
Class C | | | 2.26 | | | | 2.27 | | |
Class I | | | 1.09 | | | | 1.07 | | |
Class K | | | 1.39 | | | | 1.37 | | |
Class W | | | 1.51 | | | | 1.52 | | |
Class Z | | | 1.26 | | | | 1.27 | | |
Under the agreement governing these fee waivers and/or expense reimbursement arrangements, the following fees and expenses are excluded from the waiver/reimbursement commitment, and therefore will be paid by the Fund, if applicable: taxes (including foreign transaction taxes), expenses associated with investments in affiliated and non-affiliated pooled investment vehicles (including mutual funds and exchange traded funds), transaction costs and brokerage
Semiannual Report 2013
25
Columbia European Equity Fund
Notes to Financial Statements (continued)
April 30, 2013 (Unaudited)
commissions, costs related to any securities lending program, dividend expenses associated with securities sold short, inverse floater program fees and expenses, transaction charges and interest on borrowed money, interest, extraordinary expenses and any other expenses the exclusion of which is specifically approved by the Board. This agreement may be modified or amended only with approval from all parties.
Note 4. Federal Tax Information
The timing and character of income and capital gain distributions are determined in accordance with income tax regulations, which may differ from GAAP because of temporary or permanent book to tax differences.
At April 30, 2013, the cost of investments for federal income tax purposes was approximately $319,005,000 and the aggregate gross approximate unrealized appreciation and depreciation based on that cost was:
Unrealized appreciation | | $ | 66,412,000 | | |
Unrealized depreciation | | | (1,655,000 | ) | |
Net unrealized appreciation | | $ | 64,757,000 | | |
The following capital loss carryforward, determined as of October 31, 2012 may be available to reduce taxable income arising from future net realized gains on investments, if any, to the extent permitted by the Internal Revenue Code:
Year of Expiration | | Amount ($) | |
2016 | | | 4,272,956 | | |
2017 | | | 18,724,480 | | |
Unlimited short-term | | | 3,925,293 | | |
Total | | | 26,922,729 | | |
Unlimited capital loss carryforwards are required to be utilized prior to any capital losses which carry an expiration date. As a result of this ordering rule, capital loss carryforwards which carry an expiration date may be more likely to expire unused.
Management of the Fund has concluded that there are no significant uncertain tax positions that would require recognition in the financial statements. However, management's conclusion may be subject to review and adjustment at a later date based on factors including, but not limited to, new tax laws, regulations, and administrative interpretations (including relevant court decisions). Generally, the Fund's federal tax returns for the prior three fiscal years remain subject to examination by the Internal Revenue Service.
Note 5. Portfolio Information
The cost of purchases and proceeds from sales of securities, excluding short-term obligations, aggregated to $115,166,560 and $127,150,276, respectively, for the six months ended April 30, 2013.
Note 6. Lending of Portfolio Securities
Effective December 19, 2012, the Fund no longer participates in securities lending activity. Prior to that date, the Fund participated, or was eligible to participate, in securities lending activity pursuant to a Master Securities Lending Agreement (the Agreement) with JPMorgan Chase Bank, N.A. (JPMorgan). The Agreement authorized JPMorgan as lending agent to lend securities to authorized borrowers in order to generate additional income on behalf of the Fund. Pursuant to the Agreement, the securities loaned were secured by cash or securities that either were issued or guaranteed as to principal and interest by the U.S. government, its agencies, authorities or instrumentalities with value equal to at least 100% of the market value of the loaned securities. Any additional collateral required to maintain those levels due to market fluctuations of the loaned securities was requested to be delivered the following business day. Cash collateral received was invested by the lending agent on behalf of the Fund into authorized investments pursuant to the Agreement.
Pursuant to the Agreement, the Fund received income for lending its securities either in the form of fees or by earning interest on invested cash collateral, net of negotiated rebates paid to borrowers and fees paid to the lending agent for services provided and any other securities lending expenses. Net income earned from securities lending for the six month ended April 30, 2013 is disclosed in the Statement of Operations. The Fund continued to earn and accrue interest and dividends on the securities loaned.
At April 30, 2013, the Fund did not have any securities on loan.
Note 7. Affiliated Money Market Fund
The Fund invests its daily cash balances in Columbia Short-Term Cash Fund, an affiliated money market fund established for the exclusive use by the Fund and other affiliated funds. The income earned by the Fund from such investments is included as "Dividends — affiliated issuers" in the Statement of Operations. As an investing fund, the Fund indirectly bears its proportionate share of the expenses of Columbia Short-Term Cash Fund.
Note 8. Shareholder Concentration
Affiliated shareholder accounts owned 83.0% of the outstanding shares of the Fund. Subscription and redemption activity by concentrated accounts may have a significant effect on the operations of the Fund.
Note 9. Line of Credit
The Fund has entered into a revolving credit facility with a syndicate of banks led by JPMorgan Chase Bank N.A. whereby the Fund may borrow for the temporary funding of shareholder redemptions or for other temporary or emergency
Semiannual Report 2013
26
Columbia European Equity Fund
Notes to Financial Statements (continued)
April 30, 2013 (Unaudited)
purposes. The credit facility agreement, as amended, which is a collective agreement between the Fund and certain other funds managed by the Investment Manager, severally and not jointly, permits collective borrowings up to $500 million. Interest is charged to each participating fund based on its borrowings at a rate equal to the higher of (i) the overnight federal funds rate plus 1.00% or (ii) the one-month LIBOR rate plus 1.00%. Each borrowing under the credit facility matures no later than 60 days after the date of borrowing. The Fund also pays a commitment fee equal to its pro rata share of the amount of the credit facility at a rate of 0.08% per annum.The Fund had no borrowings during the six months ended April 30, 2013.
Note 10. Significant Risks
Foreign Securities Risk
Investing in foreign securities may include certain risks and considerations not typically associated with investing in U.S. securities, such as fluctuating currency values and changing local and regional economic, political and social conditions, which may result in greater market volatility. In addition, certain foreign securities may not be as liquid as U.S. securities. Investing in emerging markets may accentuate these risks.
Investments in emerging market countries are subject to additional risk. The risk of foreign investments is typically increased in less developed countries. These countries are also more likely to experience high levels of inflation, deflation or currency devaluation which could hurt their economies and securities markets.
Geographic Concentration Risk
Because the Fund concentrates its investments in Europe, the Fund may be particularly susceptible to economic, political, regulatory or other events or conditions affecting issuers and countries in Europe. Currency devaluations could occur in countries that have not yet experienced currency devaluation to date, or could continue to occur in countries that have already experienced such devaluations. In addition, the private and public sectors' debt problems of a single EU country can pose significant economic risks to the EU as a whole. As a result, the Fund may be more volatile than a more geographically diversified fund. If securities of issuers in Europe fall out of favor, it may cause the Fund to underperform other funds that do not concentrate in this region of the world.
Note 11. Subsequent Events
Management has evaluated the events and transactions that have occurred through the date the financial statements were issued and noted no items requiring adjustment of the financial statements or additional disclosure.
Note 12. Information Regarding Pending and Settled Legal Proceedings
In December 2005, without admitting or denying the allegations, American Express Financial Corporation (AEFC, which is now known as Ameriprise Financial, Inc. (Ameriprise Financial)) entered into settlement agreements with the Securities and Exchange Commission (SEC) and Minnesota Department of Commerce (MDOC) related to market timing activities. As a result, AEFC was censured and ordered to cease and desist from committing or causing any violations of certain provisions of the Investment Advisers Act of 1940, the Investment Company Act of 1940, and various Minnesota laws. AEFC agreed to pay disgorgement of $10 million and civil money penalties of $7 million. AEFC also agreed to retain an independent distribution consultant to assist in developing a plan for distribution of all disgorgement and civil penalties ordered by the SEC in accordance with various undertakings detailed at www.sec.gov/litigation/admin/ia-2451.pdf. Ameriprise Financial and its affiliates have cooperated with the SEC and the MDOC in these legal proceedings, and have made regular reports to the funds' Boards of Trustees.
Ameriprise Financial and certain of its affiliates have historically been involved in a number of legal, arbitration and regulatory proceedings, including routine litigation, class actions, and governmental actions, concerning matters arising in connection with the conduct of their business activities. Ameriprise Financial believes that the Funds are not currently the subject of, and that neither Ameriprise Financial nor any of its affiliates are the subject of, any pending legal, arbitration or regulatory proceedings that are likely to have a material adverse effect on the Funds or the ability of Ameriprise Financial or its affiliates to perform under their contracts with the Funds. Ameriprise Financial is required to make 10-Q, 10-K and, as necessary, 8-K filings with the Securities and Exchange Commission on legal and regulatory matters that relate to Ameriprise Financial and its affiliates. Copies of these filings may be obtained by accessing the SEC website at www.sec.gov.
There can be no assurance that these matters, or the adverse publicity associated with them, will not result in increased fund redemptions, reduced sale of fund shares or other adverse consequences to the Funds. Further, although we believe proceedings are not likely to have a material adverse effect on the Funds or the ability of Ameriprise Financial or its affiliates to perform under their contracts with the Funds, these proceedings are subject to uncertainties and, as such, we are unable to estimate the possible loss or range of loss that may result. An adverse outcome in one or more of these proceedings could result in adverse judgments, settlements, fines, penalties or other relief that could have a material adverse effect on the consolidated financial condition or results of operations of Ameriprise Financial.
Semiannual Report 2013
27
Columbia European Equity Fund
Approval of Investment Management Services and Subadvisory Agreements
Columbia Management Investment Advisers, LLC (Columbia Management or the Investment Manager), a wholly-owned subsidiary of Ameriprise Financial, Inc. (Ameriprise Financial), serves as the investment manager to Columbia European Equity Fund (the Fund). Under an investment management services agreement (the IMS Agreement), Columbia Management provides investment advice and other services to the Fund and other funds distributed by Columbia Management Investment Distributors, Inc. (collectively, the Funds). In addition, under a Subadvisory Agreement (the Subadvisory Agreement) between Columbia Management and Threadneedle International Limited (the Subadviser), an affiliate of Columbia Management, the Subadviser has provided portfolio management and related services for the Fund.
On an annual basis, the Fund's Board of Trustees (the Board), including the independent Board members (the Independent Trustees), considers renewal of the IMS Agreement and the Subadvisory Agreement (together, the Advisory Agreements). Columbia Management prepared detailed reports for the Board and its Contracts Committee in January, March and April 2013, including reports based on analyses of data provided by an independent organization and a comprehensive response to each item of information requested by independent legal counsel to the Independent Trustees (Independent Legal Counsel) in a letter to the Investment Manager, to assist the Board in making this determination. All of the materials presented in January, March and April were first supplied in draft form to designated representatives of the Independent Trustees, i.e., Independent Legal Counsel, the Chair of the Board and the Chair of the Contracts Committee, and the final materials (including proposed additional breakpoints in IMS fees for certain Funds) were revised to reflect discussion and subsequent requests made by the Contracts Committee. In addition, throughout the year, the Board (or its committees) regularly meets with portfolio management teams and senior management personnel and reviews information prepared by Columbia Management addressing the services Columbia Management provides and Fund performance. Further, the Board retained an independent consulting firm (the Independent Consultant) to assist the Independent Trustees in their review of IMS fees, expense caps and Ameriprise Financial's profitability. The Board also accords particular weight to the work, deliberations and conclusions of the Contracts Committee, the Investment Review Committee and the Compliance Committee in determining whether to continue the Advisory Agreements.
The Board, at its April 15-17, 2013 in-person Board meeting (the April Meeting), considered the renewal of the Advisory Agreements for an additional one-year term. At the April Meeting, Independent Legal Counsel reviewed with the Independent Trustees various factors relevant to the Board's consideration of advisory and subadvisory agreements and the Board's legal responsibilities related to such consideration. Following an analysis and discussion of the factors identified below, the Board, including all of the Independent Trustees, approved the renewal of each of the Advisory Agreements.
Nature, Extent and Quality of Services Provided by Columbia Management and the Subadviser
The Board analyzed various reports and presentations it had received detailing the services performed by Columbia Management and the Subadviser, as well as their history, reputation, expertise, resources and relative capabilities, and the qualifications of their personnel.
With respect to Columbia Management, the Board specifically considered many developments during the past year concerning the services provided by Columbia Management, including, in particular, the recent globalization initiative, which fosters increased worldwide investment support of global products, continued investment in upgrading technology (such as the implementation of new systems and hardware), the hiring of a Chief Interest Rate Strategist as part of Columbia Management's fixed income team and the addition of Columbia Management investment personnel to the Asset Allocation, Quantitative and Technology teams. The Board took into account the information it received and reviewed concerning Columbia Management's ongoing oversight and monitoring of the subadvisers, observing the broad scope of services provided by Columbia Management to each subadvised Fund, including, among other noted services, investment, risk and compliance oversight. The Board also took into account the Subadviser oversight structure and the Columbia Management team dedicated thereto. The Board also noted the information it received concerning Columbia Management's ability to retain its key portfolio management personnel. In this regard, the Board took into account its comprehensive discussions with Columbia Management's Chief Investment Officer (the CIO), observing the organizational depth of Columbia Management and the capabilities of its investment personnel. The Board also recalled the information the CIO provided it identifying the strengths and areas for enhancement of each Columbia Management investment team, as well as the discussion with the CIO regarding the investment personnel talent being infused to enhance support for certain Funds. The Board also observed the materials demonstrating the strength and depth of Columbia Management's equity and fixed income research departments.
Semiannual Report 2013
28
Columbia European Equity Fund
Approval of Investment Management Services and Subadvisory Agreements (continued)
In connection with the Board's evaluation of the overall package of services provided by Columbia Management, the Board also considered the quality of administrative services provided to the Fund by Columbia Management, recalling the information it received highlighting significant achievements in 2012 in the performance of administrative services. In evaluating the quality of services provided under the IMS Agreement and the Fund's Administrative Service Agreement, the Board also took into account the organization and strength of the Fund's and its service providers' compliance programs. The Board also reviewed the financial condition of Columbia Management and its affiliates and their ability to carry out their responsibilities under the IMS Agreement and the Fund's other service agreements with affiliates of Ameriprise Financial, observing the financial strength of Ameriprise Financial, with its solid balance sheet. In addition, the Board discussed the acceptability of the terms of the IMS Agreement (including the relatively broad scope of services required to be performed by Columbia Management). The Board concluded that the services being performed under the IMS Agreement were of a reasonably high quality.
Based on the foregoing, and based on other information received (both oral and written, including the information on investment performance referenced below) and other considerations, the Board concluded that Columbia Management and its affiliates were in a position to continue to provide a high quality and level of services to the Fund.
With respect to the Subadviser, the Board observed that it had previously approved the Subadviser's code of ethics and compliance program, that the Chief Compliance Officer of the Fund continues to monitor the code and the program, and that no material concerns have been reported. The Board also considered the Subadviser's organizational strength and resources, portfolio management team depth and capabilities and investment process. The Board also considered the Subadviser's capability and wherewithal to carry out its responsibilities under the Subadvisory Agreement. In addition, the Board discussed the acceptability of the terms of the Subadvisory Agreement including the scope of services required to be performed. The Board noted that the terms of the Subadvisory Agreement are generally consistent with the terms of other subadviser agreements for subadvisers who manage other funds managed by the Investment Manager. It was observed that no changes were recommended to the Subadvisory Agreement. Based on the foregoing, and based on other information received (both oral and written) and other considerations, including, in particular, the performance of the Fund (discussed below) as well as the Investment Manager's recommendation that the Board approve renewal of the Subadvisory Agreement with the Subadviser, the Board concluded that the services being performed under the Subadvisory Agreement were of a reasonably high quality.
Based on the foregoing, and based on other information received (both oral and written, including the information on investment performance referenced below) and other considerations, the Board concluded that the Subadviser was in a position to continue to provide a high quality and level of services to the Fund.
Investment Performance
For purposes of evaluating the nature, extent and quality of services provided under the Advisory Agreements, the Board carefully reviewed the investment performance of the Fund. In this regard, the Board considered detailed reports providing the results of analyses performed by an independent organization showing, for various periods, the performance of the Fund, the performance of a benchmark index, the percentage ranking of the Fund among its comparison group and the net assets of the Fund. The Board observed that the Fund's investment performance was appropriate in light of the particular management style involved and the particular market environment, noting that appropriate steps are contemplated (such as the "global asset management initiative") in seeking to improve performance.
Additionally, the Board reviewed the performance of the Subadviser and Columbia Management's process for monitoring the Subadviser. The Board considered, in particular, management's rationale for recommending the continued retention of the Subadviser.
Comparative Fees, Costs of Services Provided and the Profits Realized by Columbia Management, its Affiliates and the Subadviser from their Relationships with the Fund
The Board reviewed comparative fees and the costs of services to be provided under each of the Advisory Agreements. The Board members considered detailed comparative information set forth in an annual report on fees and expenses, including, among other things, data (based on analyses conducted by an independent organization) showing a comparison of the Fund's expenses with median expenses paid by funds in its comparative peer universe, as well as data showing the Fund's contribution to Columbia Management's profitability. The Board reviewed the fees charged to comparable institutional or
Semiannual Report 2013
29
Columbia European Equity Fund
Approval of Investment Management Services and Subadvisory Agreements (continued)
other accounts/vehicles managed by Columbia Management and discussed differences in how the products are managed and operated, noting no unreasonable differences in the levels of contractual fees.
The Board accorded particular weight to the notion that the level of fees should reflect a rational pricing model applied consistently across the various product lines in the Fund family, while assuring that the overall fees for each Fund (with few defined exceptions) are generally in line with the "pricing philosophy" (i.e., that the total expense ratio of the Fund is no higher than the median expense ratio of funds in the same comparison universe of the Fund). In this connection, the Board also considered the Independent Consultant's report that concluded that the Funds' expense cap philosophy of assuring that each Fund's total expense ratio is not above its peer universe median ratio is reasonable. The Board took into account that the Fund's total expense ratio (after considering proposed expense caps/waivers) approximated the peer universe's median expense ratio. Additionally, the Board reviewed the level of subadvisory fees paid to the Subadviser, noting that the fees are paid by the Investment Manager and do not impact the fees paid by the Fund. The Board observed that the subadvisory fee level for the Subadviser was generally comparable to those charged by other subadvisers to similar funds managed by the Investment Manager. The Board also reviewed fee rates charged by the Subadviser to other client accounts. Based on its review, the Board concluded that the Fund's management and subadvisory fees were fair and reasonable in light of the extent and quality of services that the Fund receives.
The Board also considered the expected profitability of Columbia Management and its affiliates in connection with Columbia Management providing investment management services to the Fund. In this regard, the Board referred to a detailed profitability report, discussing the profitability to Columbia Management and Ameriprise Financial from managing, operating and distributing the Funds. In this regard, the Board observed that 2012 profitability approximates 2011 profitability and that, as was the case in 2011, 2012 profitability remained generally in line with (and, in many cases, lower than) the reported profitability of other asset management firms. Further, the Board considered the Independent Consultant's report that concluded that Columbia Management's profitability, particularly in comparison to industry competitors, was reasonable and not excessive. It also took into account the indirect economic benefits flowing to Columbia Management or its affiliates in connection with managing or distributing the Funds, such as the enhanced ability to offer various other financial products to Ameriprise Financial customers, soft dollar benefits and overall reputational advantages. The Board noted that the fees paid by the Funds should permit the Investment Manager to offer competitive compensation to its personnel, make necessary investments in its business and earn an appropriate profit. The Board concluded that profitability levels were reasonable.
Economies of Scale to be Realized
The Board also considered the economies of scale that might be realized by Columbia Management as the Fund grows and took note of the extent to which Fund shareholders might also benefit from such growth. In this regard, the Board took into account that IMS fees decline as Fund assets exceed various breakpoints, all of which have not been surpassed.
Based on the foregoing, the Board, including all of the Independent Trustees, concluded that fees payable under the Advisory Agreements were fair and reasonable in light of the extent and quality of services provided. In reaching this conclusion, no single factor was determinative. On April 17, 2013, the Board, including all of the Independent Trustees, approved the renewal of the Advisory Agreements.
Semiannual Report 2013
30
This page intentionally left blank.
Semiannual Report 2013
31
This page intentionally left blank.
Semiannual Report 2013
32
Columbia European Equity Fund
Important Information About This Report
Each fund mails one shareholder report to each shareholder address. If you would like more than one report, please call shareholder services at 800.345.6611 and additional reports will be sent to you.
The policy of the Board is to vote the proxies of the companies in which each fund holds investments consistent with the procedures as stated in the Statement of Additional Information (SAI). You may obtain a copy of the SAI without charge by calling 800.345.6611; contacting your financial intermediary; visiting columbiamanagement.com; or searching the website of the Securities and Exchange Commission (SEC) at sec.gov. Information regarding how each fund voted proxies relating to portfolio securities is filed with the SEC by August 31 for the most recent 12-month period ending June 30 of that year, and is available without charge by visiting columbiamanagement.com; or searching the website of the SEC at sec.gov.
Each fund files a complete schedule of portfolio holdings with the SEC for the first and third quarters of each fiscal year on Form N-Q. Each fund's Form N-Q is available on the SEC's website at sec.gov and may be reviewed and copied at the SEC's Public Reference Room in Washington, D.C. Information on the operation of the Public Reference Room may be obtained by calling 800.SEC.0330. Each fund's complete schedule of portfolio holdings, as filed on Form N-Q, can also be obtained without charge, upon request, by calling 800.345.6611.
Semiannual Report 2013
33

Columbia European Equity Fund
P.O. Box 8081
Boston, MA 02266-8081
columbiamanagement.com
This information is for use with concurrent or prior delivery of a fund prospectus. Please read and consider the investment objectives, risks, charges and expenses for any fund carefully before investing. For a prospectus which contains this and other important information about the Fund go to columbiamanagement.com. The Fund is distributed by Columbia Management Investment Distributors, Inc., member FINRA, and managed by Columbia Management Investment Advisers, LLC.
© 2013 Columbia Management Investment Advisers, LLC. All rights reserved.
SAR147_10_C01_(06/13)
Semiannual Report
April 30, 2013

Columbia Global Bond Fund
Not FDIC insured • No bank guarantee • May lose value
Columbia Global Bond Fund
 Dear Shareholders,
U.S. equities had a strong first quarter
Similar to 2012, equities once again were the best performing asset class in the first quarter of 2013. The S&P 500 Index reached an all-time closing high on the last trading day of the quarter and pushed through its October 2007 peak. Although global equities have performed well year-to-date, there is significant performance divergence among regions. In local currency terms, Japanese equities were the best performing developed market globally, and U.S. stocks outperformed most other global equity markets. European equities rose in the first quarter but trailed U.S. stocks and had a turbulent March, as investors were reminded of instability in the eurozone with news of a banking crisis in Cyprus.
Although all 10 sectors of the S&P 500 Index delivered positive returns, this was a rally led by defensive stocks such as those in health care, consumer staples and utilities. Materials and technology stocks were the weakest sectors.
High yield leads fixed income; most sectors flat to down
The fixed-income markets lagged equities with modest, single-digit returns coming from municipals and high-yield sectors in the United States. Most government and investment-grade credit sectors were roughly flat to down for the first quarter of 2013. Emerging market bonds were the biggest disappointment with single-digit losses.
Columbia Management to begin delivering summary prospectuses
Each Columbia fund is required to update its prospectus on an annual basis. Beginning with June 2013 prospectus updates, shareholders of Columbia retail mutual funds will start to receive a summary prospectus, rather than the full length (statutory) mutual fund prospectus they have received in the past.
Each fund's summary prospectus will include the following key information:
> Investment objective
> Fee and expense table
> Portfolio turnover rate information
> Principal investment strategies, principal risks and performance information
> Management information
> Purchase and sale information
> Tax information
> Financial intermediary compensation information
Each fund's statutory prospectus will contain additional information about the fund and its risks. Both the statutory and summary prospectus will be updated each year, and will be available at columbiamanagement.com. Shareholders may request a printed version of a statutory prospectus at no cost by calling 800.345.6611 or sending an email to serviceinquiries@columbiamanagement.com.
Stay on track with Columbia Management
Backed by more than 100 years of experience, Columbia Management is one of the nation's largest asset managers. At the heart of our success — and, most importantly, that of our investors — are highly talented industry professionals, brought together by a unique way of working. We are dedicated to helping you take advantage of today's opportunities and anticipate tomorrow's. We stay abreast of the latest investment trends and ideas, using our collective insight to evaluate events and transform them into solutions you can use.
Visit columbiamanagement.com for:
> The Columbia Management Perspectives blog, featuring timely posts by our investment teams
> Detailed up-to-date fund performance and portfolio information
> Economic analysis and market commentary
> Quarterly fund commentaries
> Columbia Management Investor, our award-winning quarterly newsletter for shareholders
Thank you for your continued support of the Columbia Funds. We look forward to serving your investment needs for many years to come.
Best Regards,

J. Kevin Connaughton
President, Columbia Funds
The S&P 500 Index, an unmanaged index, measures the performance of 500 large-capitalization U.S. stocks and is frequently used as a general measure of market performance. Indices are not available for investment, are not professionally managed and do not reflect sales charges, fees, brokerage commissions, taxes or other expenses of investing.
Investors should consider the investment objectives, risks, charges and expenses of a mutual fund carefully before investing. For a free prospectus, which contains this and other important information about a fund, visit columbiamanagement.com. The prospectus should be read carefully before investing.
Columbia Funds are distributed by Columbia Management Investment Distributors, Inc., member FINRA, and managed by Columbia Management Investment Advisers, LLC.
© 2013 Columbia Management Investment Advisers, LLC. All rights reserved.
Columbia Global Bond Fund
Performance Overview | | | 2 | | |
Portfolio Overview | | | 3 | | |
Understanding Your Fund's Expenses | | | 5 | | |
Portfolio of Investments | | | 7 | | |
Statement of Assets and Liabilities | | | 25 | | |
Statement of Operations | | | 27 | | |
Statement of Changes in Net Assets | | | 28 | | |
Financial Highlights | | | 30 | | |
Notes to Financial Statements | | | 39 | | |
Approval of Investment Management Services Agreement | | | 47 | | |
Important Information About This Report | | | 49 | | |
Fund Investment Manager
Columbia Management Investment
Advisers, LLC
225 Franklin Street
Boston, MA 02110
Fund Distributor
Columbia Management Investment
Distributors, Inc.
225 Franklin Street
Boston, MA 02110
Fund Transfer Agent
Columbia Management Investment
Services Corp.
P.O. Box 8081
Boston, MA 02266-8081
For more information about any of the funds, please visit columbiamanagement.com or call 800.345.6611. Customer Service Representatives are available to answer your questions Monday through Friday from 8 a.m. to 8 p.m. Eastern time.
The views expressed in this report reflect the current views of the respective parties. These views are not guarantees of future performance and involve certain risks, uncertainties and assumptions that are difficult to predict, so actual outcomes and results may differ significantly from the views expressed. These views are subject to change at any time based upon economic, market or other conditions and the respective parties disclaim any responsibility to update such views. These views may not be relied on as investment advice and, because investment decisions for a Columbia Fund are based on numerous factors, may not be relied on as an indication of trading intent on behalf of any particular Columbia Fund. References to specific securities should not be construed as a recommendation or investment advice.
Columbia Global Bond Fund
Performance Overview
(Unaudited)
Performance Summary
> Columbia Global Bond Fund (the Fund) Class A shares returned -0.18% excluding sales charges for the six months ended April 30, 2013.
> The Fund outperformed its benchmark, the Barclays Global Aggregate Bond Index which returned -1.07% during the same six-month period.
Average Annual Total Returns (%) (for period ended April 30, 2013)
| | Inception | | 6 Months
cumulative | | 1 Year | | 5 Years | | 10 Years | |
Class A | | 03/20/89 | | | | | | | | | |
Excluding sales charges | | | | | -0.18 | | | | 2.68 | | | | 4.69 | | | | 5.36 | | |
Including sales charges | | | | | -4.92 | | | | -2.18 | | | | 3.67 | | | | 4.85 | | |
Class B | | 03/20/95 | | | | | | | | | |
Excluding sales charges | | | | | -0.65 | | | | 1.87 | | | | 3.91 | | | | 4.55 | | |
Including sales charges | | | | | -5.32 | | | | -2.92 | | | | 3.58 | | | | 4.55 | | |
Class C | | 06/26/00 | | | | | | | | | |
Excluding sales charges | | | | | -0.50 | | | | 1.91 | | | | 3.92 | | | | 4.56 | | |
Including sales charges | | | | | -1.43 | | | | 0.96 | | | | 3.92 | | | | 4.56 | | |
Class I* | | 03/04/04 | | | -0.10 | | | | 3.09 | | | | 5.13 | | | | 5.77 | | |
Class K | | 03/20/95 | | | -0.25 | | | | 2.83 | | | | 4.86 | | | | 5.55 | | |
Class R* | | 03/15/10 | | | -0.29 | | | | 2.43 | | | | 4.36 | | | | 5.01 | | |
Class W* | | 12/01/06 | | | -0.47 | | | | 2.53 | | | | 4.62 | | | | 5.32 | | |
Class Y* | | 11/08/12 | | | -0.10 | | | | 2.76 | | | | 4.70 | | | | 5.36 | | |
Class Z* | | 09/27/10 | | | -0.06 | | | | 2.94 | | | | 4.84 | | | | 5.43 | | |
Barclays Global Aggregate Bond Index | | | | | -1.07 | | | | 1.46 | | | | 4.34 | | | | 5.48 | | |
Returns for Class A are shown with and without the maximum initial sales charge of 4.75%. Returns for Class B are shown with and without the applicable contingent deferred sales charge (CDSC) of 5.00% in the first year, declining to 1.00% in the sixth year and eliminated thereafter. Returns for Class C are shown with and without the 1.00% CDSC for the first year only. The Fund's other classes are not subject to sales charges and have limited eligibility. Please see the Fund's prospectus for details. Performance for different share classes will vary based on differences in sales charges and fees associated with each class. All results shown assume reinvestment of distributions during the period. Returns do not reflect the deduction of taxes that a shareholder may pay on Fund distributions or on the redemption of Fund shares. Performance results reflect the effect of any fee waivers or reimbursements of Fund expenses by Columbia Management Investment Advisers, LLC and/or any of its affiliates. Absent these fee waivers or expense reimbursement arrangements, performance results would have been lower.
The performance information shown represents past performance and is not a guarantee of future results. The investment return and principal value of your investment will fluctuate so that your shares, when redeemed, may be worth more or less than their original cost. Current performance may be lower or higher than the performance information shown. You may obtain performance information current to the most recent month-end by contacting your financial intermediary, visiting columbiamanagement.com or calling 800.345.6611.
*The returns shown for periods prior to the share class inception date (including returns for the Life of the Fund, if shown, which are since Fund inception) include the returns of the Fund's oldest share class. These returns are adjusted to reflect any higher class-related operating expenses of the newer share classes, as applicable. Please visit columbiamanagement.com/mutual-funds/appended-performance for more information.
Barclays Global Aggregate Bond Index is a broad-based benchmark that measures the global investment grade fixed-rate debt markets.
Indices are not available for investment, are not professionally managed and do not reflect sales charges, fees, brokerage commissions, taxes or other expenses of investing. Securities in the Fund may not match those in an index.
Semiannual Report 2013
2
Columbia Global Bond Fund
Portfolio Overview
(Unaudited)
Quality Breakdown (%)
(at April 30, 2013) | |
AAA rating | | | 33.8 | | |
AA rating | | | 19.3 | | |
A rating | | | 13.3 | | |
BBB rating | | | 23.2 | | |
BB rating | | | 3.3 | | |
B rating | | | 3.3 | | |
Non-investment grade | | | — | (a) | |
Non rated | | | 3.8 | | |
Total | | | 100.0 | | |
(a) Rounds to zero.
Percentages indicated are based upon total fixed income securities (excluding Money Market Funds).
Bond ratings apply to the underlying holdings of the Fund and not the Fund itself and are divided into categories ranging from AAA (highest) to D (lowest), and are subject to change. The ratings shown are determined by using the middle rating of Moody's, S&P, and Fitch after dropping the highest and lowest available ratings. When a rating from only two agencies is available, the lower rating is used. When a rating from only one agency is available, that rating is used. When a bond is not rated by any of these agencies, it is designated as Not rated. Credit ratings are subjective opinions and not statements of fact.
Portfolio Management
Nicholas Pifer, CFA
Semiannual Report 2013
3
Columbia Global Bond Fund
Portfolio Overview (continued)
(Unaudited)
Country Breakdown (%)
(at April 30, 2013) | |
Argentina | | | 0.3 | | |
Australia | | | 1.7 | | |
Belgium | | | 0.5 | | |
Bermuda | | | 0.6 | | |
Brazil | | | 2.6 | | |
Canada | | | 5.0 | | |
Cayman Islands | | | 0.0 | (a) | |
Colombia | | | 0.4 | | |
Czech Republic | | | 0.2 | | |
Denmark | | | 0.5 | | |
Finland | | | 1.9 | | |
France | | | 0.8 | | |
Germany | | | 7.2 | | |
Greece | | | 0.0 | (a) | |
Indonesia | | | 2.1 | | |
Israel | | | 0.0 | (a) | |
Japan | | | 6.1 | | |
Kazakhstan | | | 0.2 | | |
Lithuania | | | 0.5 | | |
Luxembourg | | | 0.1 | | |
Malaysia | | | 0.6 | | |
Mexico | | | 2.2 | | |
Netherlands | | | 1.7 | | |
New Zealand | | | 1.0 | | |
Norway | | | 2.8 | | |
Peru | | | 0.1 | | |
Philippines | | | 0.2 | | |
Poland | | | 3.8 | | |
Romania | | | 0.3 | | |
Russian Federation | | | 0.6 | | |
Singapore | | | 0.0 | (a) | |
South Africa | | | 0.4 | | |
South Korea | | | 0.7 | | |
Supra-National | | | 0.2 | | |
Sweden | | | 1.3 | | |
Turkey | | | 0.7 | | |
United Kingdom | | | 6.6 | | |
United States(b) | | | 45.2 | | |
Uruguay | | | 0.2 | | |
Venezuela | | | 0.7 | | |
Total | | | 100.0 | | |
Percentages indicated are based upon total investments. The Fund's portfolio composition is subject to change.
(a) Rounds to zero.
(b) Includes investments in Money Market Funds.
Semiannual Report 2013
4
Columbia Global Bond Fund
Understanding Your Fund's Expenses
(Unaudited)
As an investor, you incur two types of costs. There are transaction costs, which generally include sales charges on purchases and may include redemption fees. There are also ongoing costs, which generally include management fees, distribution and service (Rule 12b-1) fees, and other fund expenses. The following information is intended to help you understand your ongoing costs (in dollars) of investing in the Fund and to help you compare these costs with the ongoing costs of investing in other mutual funds.
Analyzing Your Fund's Expenses
To illustrate these ongoing costs, we have provided examples and calculated the expenses paid by investors in each share class of the Fund during the period. The actual and hypothetical information in the table is based on an initial investment of $1,000 at the beginning of the period indicated and held for the entire period. Expense information is calculated two ways and each method provides you with different information. The amount listed in the "Actual" column is calculated using the Fund's actual operating expenses and total return for the period. You may use the Actual information, together with the amount invested, to estimate the expenses that you paid over the period. Simply divide your account value by $1,000 (for example, an $8,600 account value divided by $1,000 = 8.6), then multiply the results by the expenses paid during the period under the Actual column. The amount listed in the "Hypothetical" column assumes a 5% annual rate of return before expenses (which is not the Fund's actual return) and then applies the Fund's actual expense ratio for the period to the hypothetical return. You should not use the hypothetical account values and expenses to estimate either your actual account balance at the end of the period or the expenses you paid during the period. See "Compare With Other Funds" below for details on how to use the hypothetical data.
Compare With Other Funds
Since all mutual funds are required to include the same hypothetical calculations about expenses in shareholder reports, you can use this information to compare the ongoing cost of investing in the Fund with other funds. To do so, compare the hypothetical example with the 5% hypothetical examples that appear in the shareholder reports of other funds. As you compare hypothetical examples of other funds, it is important to note that hypothetical examples are meant to highlight the ongoing costs of investing in a fund only and do not reflect any transaction costs, such as sales charges, or redemption or exchange fees. Therefore, the hypothetical calculations are useful in comparing ongoing costs only, and will not help you determine the relative total costs of owning different funds. If transaction costs were included in these calculations, your costs would be higher.
Semiannual Report 2013
5
Columbia Global Bond Fund
Understanding Your Fund's Expenses (continued)
(Unaudited)
November 1, 2012 – April 30, 2013
| | Account Value at the Beginning
of the Period ($) | | Account Value at the End of the
Period ($) | | Expenses Paid During the
Period ($) | | Fund's Annualized
Expense Ratio (%) | |
| | Actual | | Hypothetical | | Actual | | Hypothetical | | Actual | | Hypothetical | | Actual | |
Class A | | | 1,000.00 | | | | 1,000.00 | | | | 998.20 | | | | 1,019.24 | | | | 5.55 | | | | 5.61 | | | | 1.12 | | |
Class B | | | 1,000.00 | | | | 1,000.00 | | | | 993.50 | | | | 1,015.52 | | | | 9.24 | | | | 9.35 | | | | 1.87 | | |
Class C | | | 1,000.00 | | | | 1,000.00 | | | | 995.00 | | | | 1,015.52 | | | | 9.25 | | | | 9.35 | | | | 1.87 | | |
Class I | | | 1,000.00 | | | | 1,000.00 | | | | 999.00 | | | | 1,021.47 | | | | 3.32 | | | | 3.36 | | | | 0.67 | | |
Class K | | | 1,000.00 | | | | 1,000.00 | | | | 997.50 | | | | 1,019.98 | | | | 4.80 | | | | 4.86 | | | | 0.97 | | |
Class R | | | 1,000.00 | | | | 1,000.00 | | | | 997.10 | | | | 1,018.00 | | | | 6.78 | | | | 6.85 | | | | 1.37 | | |
Class W | | | 1,000.00 | | | | 1,000.00 | | | | 995.30 | | | | 1,019.19 | | | | 5.59 | | | | 5.66 | | | | 1.13 | | |
Class Y | | | 1,000.00 | | | | 1,000.00 | | | | 996.20 | * | | | 1,021.47 | | | | 3.15 | * | | | 3.36 | | | | 0.67 | * | |
Class Z | | | 1,000.00 | | | | 1,000.00 | | | | 999.40 | | | | 1,020.53 | | | | 4.26 | | | | 4.31 | | | | 0.86 | | |
*For the period November 8, 2012 through April 30, 2013. Class Y shares commenced operations on November 8, 2012.
Expenses paid during the period are equal to the annualized expense ratio for each class as indicated above, multiplied by the average account value over the period and then multiplied by the number of days in the Fund's most recent fiscal half year and divided by 365.
Expenses do not include fees and expenses incurred indirectly by the Fund from the underlying funds in which the Fund may invest (also referred to as "acquired funds"), including affiliated and non-affiliated pooled investment vehicles (including mutual funds and exchange-traded funds).
Had Columbia Management Investment Advisers, LLC and/or certain of its affiliates not waived/reimbursed certain fees and expenses, account value at the end of the period would have been reduced.
Columbia Management Investment Advisers, LLC and/or certain of its affiliates have contractually agreed to waive certain fees and to absorb certain expenses until February 28, 2014, unless sooner terminated at the sole discretion of the Fund's Board, such that net expenses; subject to applicable exclusions, will not exceed 1.07% for Class A, 1.82% for Class B, 1.82% for Class C, 0.62% for Class I, 0.92% for Class K, 1.32% for Class R, 1.07% for Class W and 0.62% for Class Y. Any amounts waived will not be reimbursed by the Fund. This change was effective March 1, 2013. If this change had been in place for the entire six month period ended April 30, 2013, the actual expenses paid would have been $5.30 for Class A, $9.00 for Class B, $9.00 for Class C, $3.07 for Class I, $4.56 for Class K, $6.54 for Class R, $5.29 for Class W and $2.92 for Class Y; the hypothetical expenses paid would have been $5.36 for Class A, $9.10 for Class B, $9.10 for Class C, $3.11 for Class I, $4.61 for Class K, $6.61 for Class R, $5.36 for Class W and $3.11 for Class Y.
Other share classes may have had expense waiver changes; however, the changes were not considered significant.
Semiannual Report 2013
6
Columbia Global Bond Fund
Portfolio of Investments
April 30, 2013 (Unaudited)
(Percentages represent value of investments compared to net assets)
Corporate Bonds & Notes(a) 23.8%
Issuer | | Coupon
Rate | | Principal
Amount ($) | | Value ($) | |
Australia 0.3% | |
Woodside Finance Ltd.(b)
05/10/21 | | | 4.600 | % | | | 605,000 | | | | 684,574 | | |
Belgium —% | |
Calcipar SA
Senior Secured(b)
05/01/18 | | | 6.875 | % | | | 75,000 | | | | 80,156 | | |
Bermuda 0.1% | |
Bacardi Ltd.(b)
04/01/14 | | | 7.450 | % | | | 245,000 | | | | 259,702 | | |
Canada 1.6% | |
Bank of Nova Scotia
Senior Unsecured
04/25/18 | | | 1.450 | % | | | 940,000 | | | | 940,989 | | |
Bombardier, Inc.
Senior Notes(b)
01/15/23 | | | 6.125 | % | | | 20,000 | | | | 21,600 | | |
Cogeco Cable, Inc.(b)
05/01/20 | | | 4.875 | % | | | 7,000 | | | | 7,131 | | |
Inmet Mining Corp.(b)
06/01/20 | | | 8.750 | % | | | 36,000 | | | | 38,880 | | |
06/01/21 | | | 7.500 | % | | | 20,000 | | | | 20,900 | | |
MDC Partners, Inc.(b)
04/01/20 | | | 6.750 | % | | | 31,000 | | | | 32,240 | | |
Petro-Canada
Senior Unsecured
05/15/18 | | | 6.050 | % | | | 305,000 | | | | 368,283 | | |
Quebecor Media, Inc.
Senior Unsecured(b)
01/15/23 | | | 5.750 | % | | | 18,000 | | | | 18,765 | | |
Toronto-Dominion Bank (The)
Senior Unsecured
05/14/15 | | | 5.375 | % | | EUR | 350,000 | | | | 506,550 | | |
04/30/18 | | | 1.400 | % | | | 360,000 | | | | 362,117 | | |
TransAlta Corp.
Senior Unsecured
01/15/15 | | | 4.750 | % | | | 900,000 | | | | 949,222 | | |
Videotron Ltd.
07/15/22 | | | 5.000 | % | | | 16,000 | | | | 16,480 | | |
Total | | | | | | | 3,283,157 | | |
France 0.2% | |
France Telecom SA
Senior Unsecured
02/21/17 | | | 4.750 | % | | EUR | 205,000 | | | | 307,654 | | |
Corporate Bonds & Notes(a) (continued)
Issuer | | Coupon
Rate | | Principal
Amount ($) | | Value ($) | |
Veolia Environnement SA
Senior Unsecured
01/16/17 | | | 4.375 | % | | EUR | 110,000 | | | | 161,930 | | |
Total | | | | | | | 469,584 | | |
Germany 0.2% | |
E.ON International Finance BV
10/02/17 | | | 5.500 | % | | EUR | 275,000 | | | | 429,768 | | |
Unitymedia Hessen GmbH & Co. KG NRW
Senior Secured(b)
01/15/23 | | | 5.500 | % | | | 20,000 | | | | 20,625 | | |
Total | | | | | | | 450,393 | | |
Italy —% | |
Wind Acquisition Finance SA
Senior Secured(b)
02/15/18 | | | 7.250 | % | | | 5,000 | | | | 5,275 | | |
Japan —% | |
Softbank Corp.
Senior Unsecured(b)
04/15/20 | | | 4.500 | % | | | 30,000 | | | | 31,078 | | |
Luxembourg 0.1% | |
Intelsat Jackson Holdings SA
10/15/20 | | | 7.250 | % | | | 162,000 | | | | 179,820 | | |
Wind Acquisition Finance SA
Senior Secured(b)
04/30/20 | | | 6.500 | % | | | 15,000 | | | | 15,713 | | |
Total | | | | | | | 195,533 | | |
Netherlands 1.2% | |
Allianz Finance II BV
11/23/16 | | | 4.000 | % | | EUR | 400,000 | | | | 585,832 | | |
Cooperatieve Centrale Raiffeisen-Boerenleenbank BA
Senior Unsecured
07/03/14 | | | 6.750 | % | | AUD | 300,000 | | | | 322,994 | | |
Deutsche Telekom International Finance BV
01/19/15 | | | 4.000 | % | | EUR | 275,000 | | | | 382,740 | | |
Heineken NV
Senior Unsecured(b)
04/01/22 | | | 3.400 | % | | | 325,000 | | | | 342,247 | | |
ING Groep NV
Senior Unsecured
05/31/17 | | | 4.750 | % | | EUR | 505,000 | | | | 749,122 | | |
NXP BV/Funding LLC(b)
02/15/21 | | | 5.750 | % | | | 30,000 | | | | 31,800 | | |
The accompanying Notes to Financial Statements are an integral part of this statement.
Semiannual Report 2013
7
Columbia Global Bond Fund
Portfolio of Investments (continued)
April 30, 2013 (Unaudited)
Corporate Bonds & Notes(a) (continued)
Issuer | | Coupon
Rate | | Principal
Amount ($) | | Value ($) | |
Schaeffler Finance BV(b)
Senior Secured
02/15/19 | | | 8.500 | % | | | 25,000 | | | | 28,563 | | |
05/15/21 | | | 4.750 | % | | | 20,000 | | | | 20,250 | | |
Total | | | | | | | 2,463,548 | | |
Singapore —% | |
Flextronics International Ltd.(b)
02/15/20 | | | 4.625 | % | | | 27,000 | | | | 27,608 | | |
02/15/23 | | | 5.000 | % | | | 21,000 | | | | 21,420 | | |
Total | | | | | | | 49,028 | | |
Supra-National 0.2% | |
Council of Europe Development Bank
Senior Unsecured
09/16/14 | | | 5.750 | % | | AUD | 425,000 | | | | 455,020 | | |
United Kingdom 0.8% | |
British Sky Broadcasting Group PLC(b)
11/26/22 | | | 3.125 | % | | | 670,000 | | | | 678,303 | | |
Diageo Capital PLC
04/29/23 | | | 2.625 | % | | | 315,000 | | | | 316,083 | | |
HSBC Holdings PLC
Senior Unsecured
03/30/22 | | | 4.000 | % | | | 275,000 | | | | 304,627 | | |
Jaguar Land Rover Automotive PLC(b)
02/01/23 | | | 5.625 | % | | | 45,000 | | | | 47,025 | | |
SABMiller PLC
Senior Unsecured(b)
07/15/18 | | | 6.500 | % | | | 225,000 | | | | 279,042 | | |
Total | | | | | | | 1,625,080 | | |
United States 19.1% | |
ADS Tactical, Inc.
Senior Secured(b)
04/01/18 | | | 11.000 | % | | | 70,000 | | | | 69,825 | | |
AES Corp. (The)
Senior Unsecured
07/01/21 | | | 7.375 | % | | | 56,000 | | | | 66,640 | | |
AMC Entertainment, Inc.
06/01/19 | | | 8.750 | % | | | 28,000 | | | | 30,835 | | |
AMC Networks, Inc.
07/15/21 | | | 7.750 | % | | | 60,000 | | | | 68,700 | | |
12/15/22 | | | 4.750 | % | | | 21,000 | | | | 21,578 | | |
ARAMARK Corp.(b)
03/15/20 | | | 5.750 | % | | | 24,000 | | | | 25,140 | | |
AT&T, Inc.
Senior Unsecured(b)
06/15/45 | | | 4.350 | % | | | 770,000 | | | | 754,894 | | |
Corporate Bonds & Notes(a) (continued)
Issuer | | Coupon
Rate | | Principal
Amount ($) | | Value ($) | |
Access Midstream Partners LP/Finance Corp.
05/15/23 | | | 4.875 | % | | | 23,000 | | | | 23,748 | | |
Actuant Corp.
06/15/22 | | | 5.625 | % | | | 36,000 | | | | 37,530 | | |
Aetna, Inc.
Senior Unsecured
11/15/22 | | | 2.750 | % | | | 215,000 | | | | 214,194 | | |
Air Lease Corp.
03/01/20 | | | 4.750 | % | | | 55,000 | | | | 56,925 | | |
Alliance Data Systems Corp.(b)
12/01/17 | | | 5.250 | % | | | 25,000 | | | | 26,063 | | |
04/01/20 | | | 6.375 | % | | | 33,000 | | | | 35,640 | | |
Ally Financial, Inc.
09/15/20 | | | 7.500 | % | | | 111,000 | | | | 137,085 | | |
Alpha Natural Resources, Inc.
04/15/18 | | | 9.750 | % | | | 46,000 | | | | 49,910 | | |
American Axle & Manufacturing, Inc.
03/15/21 | | | 6.250 | % | | | 13,000 | | | | 13,699 | | |
American Builders & Contractors Supply Co., Inc.
Senior Unsecured(b)
04/15/21 | | | 5.625 | % | | | 12,000 | | | | 12,480 | | |
Amkor Technology, Inc.
Senior Unsecured
06/01/21 | | | 6.625 | % | | | 19,000 | | | | 19,618 | | |
Amsurg Corp.(b)
11/30/20 | | | 5.625 | % | | | 15,000 | | | | 15,825 | | |
Antero Resources Finance Corp.
08/01/19 | | | 7.250 | % | | | 19,000 | | | | 20,615 | | |
Apex Tool Group LLC(b)
02/01/21 | | | 7.000 | % | | | 9,000 | | | | 9,675 | | |
Appalachian Power Co.
Senior Unsecured
03/30/21 | | | 4.600 | % | | | 370,000 | | | | 425,577 | | |
Apple, Inc.
Senior Unsecured(c)
05/04/43 | | | 3.850 | % | | | 220,000 | | | | 218,720 | | |
Arch Coal, Inc.(b)
06/15/19 | | | 9.875 | % | | | 20,000 | | | | 20,800 | | |
Ashland, Inc.(b)
08/15/22 | | | 4.750 | % | | | 22,000 | | | | 22,990 | | |
08/15/22 | | | 4.750 | % | | | 6,000 | | | | 6,270 | | |
Ashtead Capital, Inc.
Secured(b)
07/15/22 | | | 6.500 | % | | | 9,000 | | | | 9,923 | | |
Atwood Oceanics, Inc.
Senior Unsecured
02/01/20 | | | 6.500 | % | | | 112,000 | | | | 122,080 | | |
The accompanying Notes to Financial Statements are an integral part of this statement.
Semiannual Report 2013
8
Columbia Global Bond Fund
Portfolio of Investments (continued)
April 30, 2013 (Unaudited)
Corporate Bonds & Notes(a) (continued)
Issuer | | Coupon
Rate | | Principal
Amount ($) | | Value ($) | |
AutoNation, Inc.
02/01/20 | | | 5.500 | % | | | 19,000 | | | | 20,805 | | |
Avis Budget Car Rental LLC/Finance, Inc.
03/15/20 | | | 9.750 | % | | | 22,000 | | | | 26,153 | | |
B/E Aerospace, Inc.
Senior Unsecured
04/01/22 | | | 5.250 | % | | | 58,000 | | | | 61,625 | | |
Ball Corp.
09/15/20 | | | 6.750 | % | | | 44,000 | | | | 48,565 | | |
Bank of America Corp.
Senior Unsecured
01/11/23 | | | 3.300 | % | | | 345,000 | | | | 349,426 | | |
Burlington Northern Santa Fe LLC
Senior Unsecured
06/01/41 | | | 5.400 | % | | | 115,000 | | | | 135,883 | | |
03/15/43 | | | 4.450 | % | | | 335,000 | | | | 351,834 | | |
CBRE Services, Inc.
03/15/23 | | | 5.000 | % | | | 9,000 | | | | 9,214 | | |
CCO Holdings LLC/Capital Corp.
01/31/22 | | | 6.625 | % | | | 41,000 | | | | 45,100 | | |
CCO Holdings LLC/Capital Corp.(b)
03/15/21 | | | 5.250 | % | | | 50,000 | | | | 51,000 | | |
CHS/Community Health Systems, Inc.
11/15/19 | | | 8.000 | % | | | 30,000 | | | | 34,013 | | |
07/15/20 | | | 7.125 | % | | | 15,000 | | | | 16,763 | | |
Senior Secured
08/15/18 | | | 5.125 | % | | | 43,000 | | | | 46,010 | | |
CIT Group, Inc.
Senior Unsecured
05/15/20 | | | 5.375 | % | | | 65,000 | | | | 73,287 | | |
CIT Group, Inc.(b)
Senior Secured
04/01/18 6.625% 70,000 81,550
Senior Unsecured
02/15/19 | | | 5.500 | % | | | 43,000 | | | | 48,590 | | |
CMS Energy Corp.
Senior Unsecured
12/15/15 | | | 6.875 | % | | | 320,000 | | | | 364,339 | | |
03/31/43 | | | 4.700 | % | | | 110,000 | | | | 114,479 | | |
CNH Capital LLC
11/01/16 | | | 6.250 | % | | | 109,000 | | | | 120,717 | | |
CONSOL Energy, Inc.
03/01/21 | | | 6.375 | % | | | 25,000 | | | | 26,125 | | |
CSC Holdings, Inc.
Senior Unsecured
11/15/21 | | | 6.750 | % | | | 89,000 | | | | 101,460 | | |
CSX Corp.
Senior Unsecured
03/15/18 | | | 6.250 | % | | | 1,000,000 | | | | 1,218,009 | | |
03/15/44 | | | 4.100 | % | | | 30,000 | | | | 29,472 | | |
Corporate Bonds & Notes(a) (continued)
Issuer | | Coupon
Rate | | Principal
Amount ($) | | Value ($) | |
Calpine Corp.
Senior Secured(b)
02/15/21 | | | 7.500 | % | | | 41,000 | | | | 46,227 | | |
Cardinal Health, Inc.
Senior Unsecured
12/15/20 | | | 4.625 | % | | | 380,000 | | | | 432,148 | | |
Cardtronics, Inc.
09/01/18 | | | 8.250 | % | | | 90,000 | | | | 98,550 | | |
Carolina Power & Light Co.
1st Mortgage
05/15/42 | | | 4.100 | % | | | 100,000 | | | | 104,310 | | |
Carrizo Oil & Gas, Inc.
10/15/18 | | | 8.625 | % | | | 40,000 | | | | 44,300 | | |
Case New Holland, Inc.
12/01/17 | | | 7.875 | % | | | 65,000 | | | | 77,350 | | |
Cedar Fair LP/Canada's Wonderland Co./Magnum
Management Corp.(b)
03/15/21 | | | 5.250 | % | | | 15,000 | | | | 15,338 | | |
Celanese U.S. Holdings LLC
06/15/21 | | | 5.875 | % | | | 69,000 | | | | 77,280 | | |
Cequel Communications Holdings I LLC/Capital Corp.
Senior Unsecured(b)
09/15/20 | | | 6.375 | % | | | 49,000 | | | | 52,185 | | |
Chesapeake Energy Corp.
08/15/20 | | | 6.625 | % | | | 132,000 | | | | 149,490 | | |
Choice Hotels International, Inc.
07/01/22 | | | 5.750 | % | | | 14,000 | | | | 15,680 | | |
Chrysler Group LLC/Co-Issuer, Inc.
Secured
06/15/21 | | | 8.250 | % | | | 26,000 | | | | 29,835 | | |
Cimarex Energy Co.
05/01/22 | | | 5.875 | % | | | 17,000 | | | | 18,530 | | |
Cinemark USA, Inc.(b)
12/15/22 | | | 5.125 | % | | | 14,000 | | | | 14,490 | | |
Citigroup, Inc.
Senior Unsecured
08/02/19 | | | 5.000 | % | | EUR | 195,000 | | | | 307,237 | | |
Clean Harbors, Inc.
08/01/20 | | | 5.250 | % | | | 33,000 | | | | 34,898 | | |
Clean Harbors, Inc.(b)
06/01/21 | | | 5.125 | % | | | 75,000 | | | | 78,375 | | |
Clear Channel Worldwide Holdings, Inc.(b)
11/15/22 | | | 6.500 | % | | | 22,000 | | | | 23,375 | | |
11/15/22 | | | 6.500 | % | | | 60,000 | | | | 64,350 | | |
Cleveland Electric Illuminating Co. (The)
1st Mortgage
11/15/18 | | | 8.875 | % | | | 750,000 | | | | 1,002,154 | | |
The accompanying Notes to Financial Statements are an integral part of this statement.
Semiannual Report 2013
9
Columbia Global Bond Fund
Portfolio of Investments (continued)
April 30, 2013 (Unaudited)
Corporate Bonds & Notes(a) (continued)
Issuer | | Coupon
Rate | | Principal
Amount ($) | | Value ($) | |
Clorox Co. (The)
Senior Unsecured
09/15/22 | | | 3.050 | % | | | 265,000 | | | | 269,122 | | |
Colorado Interstate Gas Co. LLC
Senior Unsecured
11/15/15 | | | 6.800 | % | | | 1,620,000 | | | | 1,856,170 | | |
Comstock Resources, Inc.
06/15/20 | | | 9.500 | % | | | 37,000 | | | | 41,625 | | |
ConAgra Foods, Inc.
Senior Unsecured
09/15/22 | | | 3.250 | % | | | 630,000 | | | | 646,655 | | |
Concho Resources, Inc.
01/15/21 | | | 7.000 | % | | | 109,000 | | | | 122,625 | | |
Constellation Brands Inc.(c)
Senior Unsecured
05/01/21 | | | 3.750 | % | | | 9,000 | | | | 9,000 | | |
05/01/23 | | | 4.250 | % | | | 15,000 | | | | 15,000 | | |
Continental Resources, Inc.
10/01/20 | | | 7.375 | % | | | 10,000 | | | | 11,550 | | |
04/01/21 | | | 7.125 | % | | | 29,000 | | | | 33,495 | | |
09/15/22 | | | 5.000 | % | | | 139,000 | | | | 151,162 | | |
Corrections Corp. of America(b)
04/01/20 | | | 4.125 | % | | | 15,000 | | | | 15,488 | | |
05/01/23 | | | 4.625 | % | | | 15,000 | | | | 15,638 | | |
Cott Beverages, Inc.
09/01/18 | | | 8.125 | % | | | 34,000 | | | | 37,315 | | |
Crown Castle International Corp.
Senior Unsecured
01/15/23 | | | 5.250 | % | | | 39,000 | | | | 40,852 | | |
CyrusOne LLP/Finance Corp.(b)
11/15/22 | | | 6.375 | % | | | 25,000 | | | | 26,625 | | |
DISH DBS Corp.
06/01/21 | | | 6.750 | % | | | 81,000 | | | | 87,480 | | |
07/15/22 | | | 5.875 | % | | | 34,000 | | | | 34,680 | | |
DaVita HealthCare Partners, Inc.
08/15/22 | | | 5.750 | % | | | 31,000 | | | | 33,015 | | |
DigitalGlobe, Inc.(b)
02/01/21 | | | 5.250 | % | | | 14,000 | | | | 14,140 | | |
Dow Chemical Co. (The)
Senior Unsecured
11/15/22 | | | 3.000 | % | | | 590,000 | | | | 590,239 | | |
E*TRADE Financial Corp.
Senior Unsecured
11/15/19 | | | 6.375 | % | | | 28,000 | | | | 30,100 | | |
EP Energy Holdings LLC/Bond Co., Inc.
Senior Unsecured PIK(b)
12/15/17 | | | 8.125 | % | | | 19,000 | | | | 20,235 | | |
Corporate Bonds & Notes(a) (continued)
Issuer | | Coupon
Rate | | Principal
Amount ($) | | Value ($) | |
EP Energy LLC/Everest Acquisition Finance, Inc.
09/01/22 7.750% 6,000 6,885
Senior Secured
05/01/19 | | | 6.875 | % | | | 44,000 | | | | 48,180 | | |
EP Energy LLC/Finance, Inc.
Senior Unsecured
05/01/20 | | | 9.375 | % | | | 28,000 | | | | 32,620 | | |
ERAC U.S.A. Finance LLC(b)
03/15/42 | | | 5.625 | % | | | 480,000 | | | | 549,561 | | |
Eagle Spinco, Inc.(b)
02/15/21 | | | 4.625 | % | | | 18,000 | | | | 18,900 | | |
El Paso LLC
Senior Secured
09/15/20 | | | 6.500 | % | | | 168,000 | | | | 189,630 | | |
01/15/32 | | | 7.750 | % | | | 10,000 | | | | 11,397 | | |
Enterprise Products Operating LLC
03/15/44 | | | 4.850 | % | | | 425,000 | | | | 456,705 | | |
Equinix, Inc.
Senior Unsecured
07/15/21 | | | 7.000 | % | | | 120,000 | | | | 136,200 | | |
FTI Consulting, Inc.(b)
11/15/22 | | | 6.000 | % | | | 11,000 | | | | 11,743 | | |
First Data Corp.
Senior Secured(b)
06/15/19 | | | 7.375 | % | | | 73,000 | | | | 79,387 | | |
Fresenius Medical Care U.S. Finance II, Inc.(b)
01/31/22 | | | 5.875 | % | | | 20,000 | | | | 22,900 | | |
Fresenius Medical Care U.S. Finance, Inc.(b)
09/15/18 | | | 6.500 | % | | | 16,000 | | | | 18,520 | | |
Frontier Communications Corp.
Senior Unsecured
07/01/21 | | | 9.250 | % | | | 10,000 | | | | 11,675 | | |
04/15/22 | | | 8.750 | % | | | 27,000 | | | | 30,375 | | |
01/15/23 | | | 7.125 | % | | | 37,000 | | | | 38,295 | | |
04/15/24 | | | 7.625 | % | | | 11,000 | | | | 11,468 | | |
General Electric Capital Corp.
Senior Unsecured
10/17/21 | | | 4.650 | % | | | 383,000 | | | | 437,719 | | |
01/09/23 | | | 3.100 | % | | | 715,000 | | | | 725,466 | | |
General Electric Co.
Senior Unsecured
10/09/42 | | | 4.125 | % | | | 355,000 | | | | 375,848 | | |
Gibraltar Industries, Inc.(b)
02/01/21 | | | 6.250 | % | | | 9,000 | | | | 9,653 | | |
Goldman Sachs Group, Inc. (The)
Senior Unsecured
05/02/18 | | | 6.375 | % | | EUR | 350,000 | | | | 563,937 | | |
Graphic Packaging International, Inc.
10/01/18 | | | 7.875 | % | | | 38,000 | | | | 42,180 | | |
04/15/21 | | | 4.750 | % | | | 20,000 | | | | 20,700 | | |
The accompanying Notes to Financial Statements are an integral part of this statement.
Semiannual Report 2013
10
Columbia Global Bond Fund
Portfolio of Investments (continued)
April 30, 2013 (Unaudited)
Corporate Bonds & Notes(a) (continued)
Issuer | | Coupon
Rate | | Principal
Amount ($) | | Value ($) | |
H&E Equipment Services, Inc.
09/01/22 | | | 7.000 | % | | | 24,000 | | | | 26,580 | | |
HCA Holdings, Inc.
Senior Unsecured
02/15/21 | | | 6.250 | % | | | 45,000 | | | | 49,275 | | |
HCA, Inc.
Senior Secured
05/01/23 | | | 4.750 | % | | | 15,000 | | | | 15,638 | | |
HJ Heinz Co.
Secured(b)
10/15/20 | | | 4.250 | % | | | 59,000 | | | | 59,737 | | |
Hiland Partners LP/Finance Corp.(b)
10/01/20 | | | 7.250 | % | | | 54,000 | | | | 60,075 | | |
Hologic, Inc.
08/01/20 | | | 6.250 | % | | | 7,000 | | | | 7,560 | | |
Huntington Ingalls Industries, Inc.
03/15/21 | | | 7.125 | % | | | 17,000 | | | | 18,913 | | |
Huntsman International LLC
11/15/20 | | | 4.875 | % | | | 24,000 | | | | 25,140 | | |
Indiana Michigan Power Co.
Senior Unsecured
03/15/23 | | | 3.200 | % | | | 360,000 | | | | 369,358 | | |
03/15/37 | | | 6.050 | % | | | 255,000 | | | | 317,553 | | |
Interface, Inc.
12/01/18 | | | 7.625 | % | | | 43,000 | | | | 46,709 | | |
Interline Brands, Inc.
11/15/18 | | | 7.500 | % | | | 129,000 | | | | 139,320 | | |
International Lease Finance Corp.
Senior Unsecured
04/15/18 | | | 3.875 | % | | | 6,000 | | | | 6,090 | | |
12/15/20 | | | 8.250 | % | | | 98,000 | | | | 122,500 | | |
04/15/21 | | | 4.625 | % | | | 11,000 | | | | 11,193 | | |
Ipalco Enterprises, Inc.
Senior Secured
05/01/18 | | | 5.000 | % | | | 60,000 | | | | 64,800 | | |
JM Huber Corp.
Senior Notes(b)
11/01/19 | | | 9.875 | % | | | 80,000 | | | | 92,100 | | |
JMC Steel Group, Inc.
Senior Notes(b)
03/15/18 | | | 8.250 | % | | | 42,000 | | | | 43,942 | | |
KB Home
03/15/20 | | | 8.000 | % | | | 13,000 | | | | 15,308 | | |
09/15/22 | | | 7.500 | % | | | 11,000 | | | | 12,595 | | |
Kinder Morgan Energy Partners LP
Senior Unsecured
08/15/42 | | | 5.000 | % | | | 560,000 | | | | 599,988 | | |
Kraft Foods Group, Inc.
Senior Unsecured
06/04/42 | | | 5.000 | % | | | 245,000 | | | | 277,638 | | |
Corporate Bonds & Notes(a) (continued)
Issuer | | Coupon
Rate | | Principal
Amount ($) | | Value ($) | |
Kratos Defense & Security Solutions, Inc.
Senior Secured
06/01/17 | | | 10.000 | % | | | 55,000 | | | | 60,637 | | |
L Brands, Inc.
04/01/21 | | | 6.625 | % | | | 65,000 | | | | 74,669 | | |
L-3 Communications Corp.
11/15/16 | | | 3.950 | % | | | 510,000 | | | | 549,732 | | |
02/15/21 | | | 4.950 | % | | | 205,000 | | | | 231,266 | | |
Lamar Media Corp.
02/01/22 | | | 5.875 | % | | | 18,000 | | | | 19,688 | | |
Laredo Petroleum, Inc.
05/01/22 | | | 7.375 | % | | | 60,000 | | | | 66,000 | | |
Level 3 Financing, Inc.
04/01/19 | | | 9.375 | % | | | 52,000 | | | | 58,630 | | |
Libbey Glass, Inc.
Senior Secured
05/15/20 | | | 6.875 | % | | | 24,000 | | | | 26,310 | | |
Liberty Mutual Group, Inc.(b)
05/01/22 | | | 4.950 | % | | | 355,000 | | | | 395,150 | | |
Lockheed Martin Corp.
Senior Unsecured(b)
12/15/42 | | | 4.070 | % | | | 295,000 | | | | 284,131 | | |
Lynx I Corp.
Senior Secured(b)
04/15/21 | | | 5.375 | % | | | 27,000 | | | | 28,924 | | |
Lynx II Corp.
Senior Unsecured(b)
04/15/23 | | | 6.375 | % | | | 11,000 | | | | 11,908 | | |
MGM Resorts International
12/15/21 | | | 6.625 | % | | | 17,000 | | | | 18,466 | | |
MGM Resorts International(b)
10/01/20 | | | 6.750 | % | | | 5,000 | | | | 5,488 | | |
Manitowoc Co., Inc. (The)
11/01/20 | | | 8.500 | % | | | 30,000 | | | | 34,200 | | |
MarkWest Energy Partners LP/Finance Corp.
06/15/22 | | | 6.250 | % | | | 73,000 | | | | 81,212 | | |
02/15/23 | | | 5.500 | % | | | 39,000 | | | | 42,802 | | |
Meritage Homes Corp.
04/01/22 | | | 7.000 | % | | | 22,000 | | | | 24,805 | | |
Meritage Homes Corp.(b)
03/01/18 | | | 4.500 | % | | | 12,000 | | | | 12,060 | | |
MetroPCS Wireless, Inc.(b)
04/01/23 | | | 6.625 | % | | | 14,000 | | | | 14,980 | | |
Molson Coors Brewing Co.
05/01/22 | | | 3.500 | % | | | 135,000 | | | | 142,743 | | |
Morgan Stanley
Senior Unsecured
10/02/17 | | | 5.500 | % | | EUR | 395,000 | | | | 602,325 | | |
The accompanying Notes to Financial Statements are an integral part of this statement.
Semiannual Report 2013
11
Columbia Global Bond Fund
Portfolio of Investments (continued)
April 30, 2013 (Unaudited)
Corporate Bonds & Notes(a) (continued)
Issuer | | Coupon
Rate | | Principal
Amount ($) | | Value ($) | |
NBCUniversal Media LLC
04/01/21 | | | 4.375 | % | | | 275,000 | | | | 317,236 | | |
01/15/43 | | | 4.450 | % | | | 305,000 | | | | 323,112 | | |
National CineMedia LLC
Senior Secured
04/15/22 | | | 6.000 | % | | | 38,000 | | | | 41,420 | | |
News America, Inc.
09/15/22 | | | 3.000 | % | | | 1,300,000 | | | | 1,318,582 | | |
NiSource Finance Corp.
09/15/17 | | | 5.250 | % | | | 2,000,000 | | | | 2,300,039 | | |
Nielsen Finance LLC/Co.(b)
10/01/20 | | | 4.500 | % | | | 59,000 | | | | 60,254 | | |
Northwest Pipeline GP
Senior Unsecured
04/15/17 | | | 5.950 | % | | | 460,000 | | | | 532,418 | | |
Nuance Communications, Inc.(b)
08/15/20 | | | 5.375 | % | | | 54,000 | | | | 55,620 | | |
Oasis Petroleum, Inc.
01/15/23 | | | 6.875 | % | | | 51,000 | | | | 56,610 | | |
Oil States International, Inc.(b)
01/15/23 | | | 5.125 | % | | | 18,000 | | | | 18,495 | | |
Omnicare, Inc.
06/01/20 | | | 7.750 | % | | | 64,000 | | | | 72,160 | | |
Oshkosh Corp.
03/01/17 | | | 8.250 | % | | | 41,000 | | | | 44,690 | | |
Pacific Gas & Electric Co.
Senior Unsecured
10/01/20 | | | 3.500 | % | | | 305,000 | | | | 335,811 | | |
Peabody Energy Corp.
11/15/18 | | | 6.000 | % | | | 70,000 | | | | 75,600 | | |
Penske Automotive Group, Inc.(b)
10/01/22 | | | 5.750 | % | | | 11,000 | | | | 11,646 | | |
Physio-Control International, Inc.
Senior Secured(b)
01/15/19 | | | 9.875 | % | | | 62,000 | | | | 70,835 | | |
Pinnacle Foods Finance LLC/Corp.(b)
05/01/21 | | | 4.875 | % | | | 12,000 | | | | 12,345 | | |
Plains Exploration & Production Co.
11/15/20 | | | 6.500 | % | | | 61,000 | | | | 68,015 | | |
02/15/23 | | | 6.875 | % | | | 116,000 | | | | 132,095 | | |
Polypore International, Inc.
11/15/17 | | | 7.500 | % | | | 20,000 | | | | 21,600 | | |
Progress Energy, Inc.
Senior Unsecured
04/01/22 | | | 3.150 | % | | | 1,325,000 | | | | 1,373,521 | | |
Prudential Financial, Inc.
Senior Unsecured
05/12/41 | | | 5.625 | % | | | 115,000 | | | | 136,477 | | |
Corporate Bonds & Notes(a) (continued)
Issuer | | Coupon
Rate | | Principal
Amount ($) | | Value ($) | |
Public Service Co. of Colorado
1st Mortgage
03/15/43 | | | 3.950 | % | | | 265,000 | | | | 276,812 | | |
QEP Resources, Inc.
Senior Unsecured
10/01/22 | | | 5.375 | % | | | 57,000 | | | | 60,562 | | |
05/01/23 | | | 5.250 | % | | | 20,000 | | | | 21,250 | | |
Reed Elsevier Capital, Inc.(b)
10/15/22 | | | 3.125 | % | | | 570,000 | | | | 564,001 | | |
Regency Energy Partners LP/Finance Corp.
07/15/21 | | | 6.500 | % | | | 94,000 | | | | 105,280 | | |
04/15/23 | | | 5.500 | % | | | 17,000 | | | | 18,615 | | |
Regency Energy Partners LP/Finance Corp.(b)
11/01/23 | | | 4.500 | % | | | 15,000 | | | | 15,525 | | |
Revlon Consumer Products Corp.(b)
02/15/21 | | | 5.750 | % | | | 35,000 | | | | 36,050 | | |
Reynolds Group Issuer, Inc./LLC
Senior Secured
08/15/19 | | | 7.875 | % | | | 83,000 | | | | 92,960 | | |
SBA Telecommunications, Inc.
08/15/19 | | | 8.250 | % | | | 20,000 | | | | 22,150 | | |
SBA Telecommunications, Inc.(b)
07/15/20 | | | 5.750 | % | | | 23,000 | | | | 24,495 | | |
SM Energy Co.
Senior Unsecured
11/15/21 | | | 6.500 | % | | | 68,000 | | | | 74,800 | | |
STHI Holding Corp.
Secured(b)
03/15/18 | | | 8.000 | % | | | 51,000 | | | | 55,845 | | |
Sabine Pass Liquefaction LLC(b)
Senior Secured
02/01/21 | | | 5.625 | % | | | 50,000 | | | | 51,750 | | |
04/15/23 | | | 5.625 | % | | | 18,000 | | | | 18,495 | | |
Sally Holdings LLC/Capital, Inc.
11/15/19 | | | 6.875 | % | | | 21,000 | | | | 23,494 | | |
Sealed Air Corp.(b)
09/15/21 | | | 8.375 | % | | | 3,000 | | | | 3,510 | | |
Shearer's Foods, Inc. LLC
Senior Secured(b)
11/01/19 | | | 9.000 | % | | | 24,000 | | | | 26,700 | | |
Southern California Edison Co.
1st Refunding Mortgage
03/15/43 | | | 3.900 | % | | | 470,000 | | | | 484,984 | | |
Southern Natural Gas Co. LLC
Senior Unsecured(b)
04/01/17 | | | 5.900 | % | | | 2,131,000 | | | | 2,492,219 | | |
Spectrum Brands Escrow Corp.(b)
11/15/20 | | | 6.375 | % | | | 45,000 | | | | 49,162 | | |
The accompanying Notes to Financial Statements are an integral part of this statement.
Semiannual Report 2013
12
Columbia Global Bond Fund
Portfolio of Investments (continued)
April 30, 2013 (Unaudited)
Corporate Bonds & Notes(a) (continued)
Issuer | | Coupon
Rate | | Principal
Amount ($) | | Value ($) | |
Spectrum Brands, Inc.
Senior Secured
06/15/18 | | | 9.500 | % | | | 41,000 | | | | 46,074 | | |
Sprint Nextel Corp.(b)
11/15/18 | | | 9.000 | % | | | 115,000 | | | | 141,450 | | |
03/01/20 | | | 7.000 | % | | | 35,000 | | | | 39,812 | | |
Synovus Financial Corp.
Senior Unsecured
02/15/19 | | | 7.875 | % | | | 89,000 | | | | 102,572 | | |
TRW Automotive, Inc.(b)
03/01/21 | | | 4.500 | % | | | 19,000 | | | | 19,618 | | |
Taylor Morrison Communities, Inc./Monarch, Inc.(b)
04/15/20 | | | 7.750 | % | | | 67,000 | | | | 75,207 | | |
Tempur-Pedic International, Inc.(b)
12/15/20 | | | 6.875 | % | | | 5,000 | | | | 5,456 | | |
Tenet Healthcare Corp.
Senior Secured(b)
06/01/20 | | | 4.750 | % | | | 31,000 | | | | 32,240 | | |
Tesoro Logistics LP/Finance Corp.
Senior Unsecured(b)
10/01/20 | | | 5.875 | % | | | 25,000 | | | | 26,813 | | |
Time Warner Cable, Inc.
02/01/20 | | | 5.000 | % | | | 175,000 | | | | 202,402 | | |
09/15/42 | | | 4.500 | % | | | 310,000 | | | | 294,859 | | |
Time Warner, Inc.
03/29/41 | | | 6.250 | % | | | 250,000 | | | | 311,608 | | |
Toledo Edison Co. (The)
Senior Secured
05/15/37 | | | 6.150 | % | | | 165,000 | | | | 208,943 | | |
TransDigm, Inc.(b)
10/15/20 | | | 5.500 | % | | | 26,000 | | | | 27,755 | | |
Transcontinental Gas Pipe Line Co. LLC
Senior Unsecured
04/15/16 | | | 6.400 | % | | | 2,255,000 | | | | 2,582,665 | | |
United Rentals North America, Inc.
05/15/20 | | | 7.375 | % | | | 41,000 | | | | 46,432 | | |
04/15/22 | | | 7.625 | % | | | 68,000 | | | | 78,030 | | |
06/15/23 | | | 6.125 | % | | | 4,000 | | | | 4,310 | | |
Secured
07/15/18 | | | 5.750 | % | | | 49,000 | | | | 53,410 | | |
United States Cellular Corp.
Senior Unsecured
12/15/33 | | | 6.700 | % | | | 165,000 | | | | 179,121 | | |
Universal Hospital Services, Inc.
Secured
08/15/20 | | | 7.625 | % | | | 20,000 | | | | 21,650 | | |
Universal Hospital Services, Inc.(b)
Secured
08/15/20 | | | 7.625 | % | | | 23,000 | | | | 24,984 | | |
Corporate Bonds & Notes(a) (continued)
Issuer | | Coupon
Rate | | Principal
Amount ($) | | Value ($) | |
Univision Communications, Inc.(b)
Senior Secured
05/15/19 | | | 6.875 | % | | | 37,000 | | | | 40,422 | | |
09/15/22 | | | 6.750 | % | | | 38,000 | | | | 42,180 | | |
Vail Resorts, Inc.
05/01/19 | | | 6.500 | % | | | 46,000 | | | | 49,507 | | |
Valeant Pharmaceuticals International(b)
10/15/20 | | | 6.375 | % | | | 35,000 | | | | 38,762 | | |
VeriSign, Inc.(b)
05/01/23 | | | 4.625 | % | | | 14,000 | | | | 14,350 | | |
Verizon Communications, Inc.
Senior Unsecured
11/01/42 | | | 3.850 | % | | | 655,000 | | | | 598,645 | | |
Visteon Corp.
04/15/19 | | | 6.750 | % | | | 38,000 | | | | 40,992 | | |
Vivint, Inc.
Senior Secured(b)
12/01/19 | | | 6.375 | % | | | 67,000 | | | | 67,502 | | |
Waste Management, Inc.
06/30/20 | | | 4.750 | % | | | 535,000 | | | | 613,623 | | |
Wells Fargo & Co.
Senior Unsecured
11/03/16 | | | 4.125 | % | | EUR | 330,000 | | | | 483,931 | | |
Whiting Petroleum Corp.
10/01/18 | | | 6.500 | % | | | 5,000 | | | | 5,388 | | |
Windstream Corp.
03/15/19 | | | 7.000 | % | | | 40,000 | | | | 40,950 | | |
10/15/20 | | | 7.750 | % | | | 45,000 | | | | 49,387 | | |
Zayo Group LLC/Capital, Inc.
Senior Secured
01/01/20 | | | 8.125 | % | | | 44,000 | | | | 49,610 | | |
tw telecom holdings, Inc.
03/01/18 | | | 8.000 | % | | | 106,000 | | | | 115,010 | | |
Total | | | | | | | 40,390,703 | | |
Total Corporate Bonds & Notes
(Cost: $46,968,404) | | | | | | | 50,442,831 | | |
Residential Mortgage-Backed Securities — Agency 5.8%
United States 5.8% | |
Federal Home Loan Mortgage Corp.(d)
05/01/42 | | | 3.500 | % | | | 2,638,337 | | | | 2,833,868 | | |
10/01/18 | | | 5.000 | % | | | 159,650 | | | | 170,045 | | |
09/01/17-
08/01/33 | | | 6.500 | % | | | 152,640 | | | | 170,694 | | |
The accompanying Notes to Financial Statements are an integral part of this statement.
Semiannual Report 2013
13
Columbia Global Bond Fund
Portfolio of Investments (continued)
April 30, 2013 (Unaudited)
Residential Mortgage-Backed Securities — Agency (continued)
Issuer | | Coupon
Rate | | Principal
Amount ($) | | Value ($) | |
Federal National Mortgage Association(d)
06/01/27 | | | 2.500 | % | | | 2,408,349 | | | | 2,526,397 | | |
08/01/18 | | | 4.500 | % | | | 334,969 | | | | 359,228 | | |
12/01/18-
06/01/33 | | | 5.000 | % | | | 1,429,303 | | | | 1,575,173 | | |
11/01/18-
06/01/33 | | | 5.500 | % | | | 923,484 | | | | 1,021,329 | | |
03/01/17-
04/01/33 | | | 6.000 | % | | | 346,939 | | | | 379,296 | | |
04/01/17-
11/01/33 | | | 6.500 | % | | | 675,916 | | | | 762,621 | | |
05/01/32-
06/01/32 | | | 7.000 | % | | | 465,339 | | | | 553,689 | | |
05/01/32-
11/01/32 | | | 7.500 | % | | | 334,869 | | | | 397,192 | | |
Federal National Mortgage Association(d)(e)
09/01/40 | | | 4.500 | % | | | 327,238 | | | | 362,950 | | |
01/01/37 | | | 5.500 | % | | | 570,984 | | | | 638,987 | | |
Government National Mortgage Association(d)
10/15/33 | | | 5.500 | % | | | 454,794 | | | | 526,175 | | |
Total | | | | | | | 12,277,644 | | |
Total Residential Mortgage-Backed
Securities — Agency
(Cost: $11,545,253) | | | | | | | 12,277,644 | | |
Residential Mortgage-Backed Securities — Non-Agency 0.1%
United States 0.1% | |
Harborview Mortgage Loan Trust
CMO Series 2004-1 Class 4A(d)(f)
04/19/34 | | | 4.484 | % | | | 298,192 | | | | 295,901 | | |
Total Residential Mortgage-Backed
Securities — Non-Agency
(Cost: $268,822) | | | | | | | 295,901 | | |
Commercial Mortgage-Backed Securities — Agency 2.1%
United States 2.1% | |
Government National Mortgage Association(d)
Series 2013-13 Class AC
04/16/46 | | | 1.700 | % | | | 2,090,037 | | | | 2,085,177 | | |
Commercial Mortgage-Backed Securities — Agency (continued)
Issuer | | Coupon
Rate | | Principal
Amount ($) | | Value ($) | |
Series 2013-33 Class AC
05/16/46 | | | 1.744 | % | | | 2,292,607 | | | | 2,304,272 | | |
Total | | | | | | | 4,389,449 | | |
Total Commercial Mortgage-Backed
Securities — Agency
(Cost: $4,348,887) | | | | | | | 4,389,449 | | |
Commercial Mortgage-Backed Securities — Non-Agency 3.1%
United States 3.1% | |
Citigroup/Deutsche Bank Commercial Mortgage Trust
Series 2007-CD4 Class A4(d)
12/11/49 | | | 5.322 | % | | | 250,000 | | | | 282,936 | | |
Credit Suisse First Boston Mortgage Securities Corp.
Series 2004-C2 Class A1(d)
05/15/36 | | | 3.819 | % | | | 143,971 | | | | 145,427 | | |
Extended Stay America Trust
Series 2013-ESH5 Class A25(b)(d)
12/05/31 | | | 1.830 | % | | | 1,000,000 | | | | 1,001,431 | | |
General Electric Capital Assurance Co.
Series 2003-1 Class A4(b)(d)(f)
05/12/35 | | | 5.254 | % | | | 133,093 | | | | 140,441 | | |
Greenwich Capital Commercial Funding Corp.
Series 2007-GG9 Class A4(d)
03/10/39 | | | 5.444 | % | | | 800,000 | | | | 914,350 | | |
JPMorgan Chase Commercial Mortgage Securities Corp.
Series 2005-LDP3 Class ASB(d)(f)
08/15/42 | | | 4.893 | % | | | 486,453 | | | | 506,632 | | |
LB-UBS Commercial Mortgage Trust
Series 2004-C2 Class A3(d)
03/15/29 | | | 3.973 | % | | | 197,730 | | | | 199,136 | | |
Morgan Stanley Re-Remic Trust
Series 2010-GG10 Class A4A(b)(d)(f)
08/15/45 | | | 5.982 | % | | | 1,500,000 | | | | 1,728,760 | | |
Rialto Real Estate Fund
Series 2013-LT2 Class A(b)(d)
05/22/28 | | | 2.833 | % | | | 1,495,621 | | | | 1,495,873 | | |
S2 Hospitality LLC
Series 2012-LV1 Class A(b)(d)
04/15/25 | | | 4.500 | % | | | 207,203 | | | | 207,154 | | |
Total | | | | | | | 6,622,140 | | |
Total Commercial Mortgage-Backed
Securities — Non-Agency
(Cost: $6,412,950) | | | | | | | 6,622,140 | | |
The accompanying Notes to Financial Statements are an integral part of this statement.
Semiannual Report 2013
14
Columbia Global Bond Fund
Portfolio of Investments (continued)
April 30, 2013 (Unaudited)
Asset-Backed Securities — Non-Agency 2.8%
Issuer | | Coupon
Rate | | Principal
Amount ($) | | Value ($) | |
Bermuda 0.5% | |
Cronos Containers Program Ltd.
Series 2013-1A Class A(b)
04/18/28 | | | 3.080 | % | | | 1,000,000 | | | | 1,000,019 | | |
United States 2.3% | |
American Credit Acceptance Receivables Trust
Series 2013-1 Class A(b)
04/16/18 | | | 1.450 | % | | | 1,740,000 | | | | 1,740,520 | | |
CLI Funding V LLC
Series 2013-1A(b)
03/18/28 | | | 2.830 | % | | | 595,000 | | | | 593,038 | | |
Centre Point Funding LLC
Series 2012-2A Class 1(b)
08/20/21 | | | 2.610 | % | | | 731,621 | | | | 743,389 | | |
GTP Towers Issuer LLC(b)
02/15/15 | | | 4.436 | % | | | 450,000 | | | | 470,034 | | |
SBA Tower Trust
Secured(b)
04/15/18 | | | 2.240 | % | | | 900,000 | | | | 904,552 | | |
TAL Advantage V LLC
Series 2013-1A Class A(b)
02/22/38 | | | 2.830 | % | | | 516,250 | | | | 517,891 | | |
Total | | | | | | | 4,969,424 | | |
Total Asset-Backed Securities — Non-Agency
(Cost: $5,944,590) | | | | | | | 5,969,443 | | |
Inflation-Indexed Bonds(a) 0.9%
Japan 0.9% | |
Japanese Government CPI-Linked Bond
Senior Unsecured
03/10/18 | | | 1.400 | % | | JPY | 166,940 | | | | 1,957,351 | | |
Total Inflation-Indexed Bonds
(Cost: $1,554,268) | | | | | | | 1,957,351 | | |
U.S. Treasury Obligations 5.3%
United States 5.3% | |
U.S. Treasury
03/15/14 | | | 1.250 | % | | | 200,000 | | | | 201,937 | | |
03/31/17 | | | 1.000 | % | | | 4,165,000 | | | | 4,249,599 | | |
02/15/22 | | | 2.000 | % | | | 1,080,000 | | | | 1,125,732 | | |
08/15/22 | | | 1.625 | % | | | 355,000 | | | | 356,026 | | |
02/15/23 | | | 2.000 | % | | | 300,000 | | | | 308,766 | | |
U.S. Treasury Obligations (continued)
Issuer | | Coupon
Rate | | Principal
Amount ($) | | Value ($) | |
11/15/41 | | | 3.125 | % | | | 2,855,000 | | | | 3,002,210 | | |
02/15/42 | | | 3.125 | % | | | 275,000 | | | | 288,922 | | |
05/15/42 | | | 3.000 | % | | | 680,000 | | | | 696,256 | | |
11/15/42 | | | 2.750 | % | | | 945,000 | | | | 916,650 | | |
Total | | | | | | | 11,146,098 | | |
Total U.S. Treasury Obligations
(Cost: $10,823,855) | | | | | | | 11,146,098 | | |
Foreign Government Obligations(a) 45.3%
Argentina 0.3% | |
Argentina Bonar Bonds
09/12/13 | | | 7.000 | % | | | 383,000 | | | | 386,830 | | |
04/17/17 | | | 7.000 | % | | | 194,000 | | | | 158,110 | | |
Total | | | | | | | 544,940 | | |
Australia 1.3% | |
Australia Government Bond
Senior Unsecured
05/15/13 | | | 6.500 | % | | AUD | 2,600,000 | | | | 2,699,252 | | |
Belgium 0.5% | |
Belgium Government Bond
03/28/14 | | | 4.000 | % | | EUR | 750,000 | | | | 1,022,283 | | |
Brazil 2.5% | |
Banco Nacional de Desenvolvimento Economico e Social
Senior Unsecured(b)
06/10/19 | | | 6.500 | % | | | 210,000 | | | | 250,878 | | |
Brazil Notas do Tesouro Nacional
Senior Notes
01/01/17 | | | 10.000 | % | | BRL | 7,908,000 | | | | 4,209,281 | | |
Brazilian Government International Bond
Senior Unsecured
01/07/41 | | | 5.625 | % | | | 270,000 | | | | 337,500 | | |
Petrobras International Finance Co.
01/27/21 | | | 5.375 | % | | | 420,000 | | | | 464,249 | | |
Total | | | | | | | 5,261,908 | | |
Canada 3.2% | |
Canadian Government Bond
06/01/18 | | | 4.250 | % | | CAD | 180,000 | | | | 205,560 | | |
06/01/19 | | | 3.750 | % | | CAD | 1,052,000 | | | | 1,193,450 | | |
Province of British Columbia
06/18/14 | | | 5.300 | % | | CAD | 960,000 | | | | 997,592 | | |
Province of Ontario
03/08/14 | | | 5.000 | % | | CAD | 1,640,000 | | | | 1,681,429 | | |
Senior Unsecured
05/26/15 | | | 0.950 | % | | | 1,050,000 | | | | 1,060,977 | | |
The accompanying Notes to Financial Statements are an integral part of this statement.
Semiannual Report 2013
15
Columbia Global Bond Fund
Portfolio of Investments (continued)
April 30, 2013 (Unaudited)
Foreign Government Obligations(a) (continued)
Issuer | | Coupon
Rate | | Principal
Amount ($) | | Value ($) | |
Province of Quebec
12/01/17 | | | 4.500 | % | | CAD | 1,458,000 | | | | 1,625,574 | | |
Total | | | | | | | 6,764,582 | | |
Colombia 0.4% | |
Colombia Government International Bond
Senior Unsecured
01/18/41 | | | 6.125 | % | | | 235,000 | | | | 314,491 | | |
Corporación Andina de Fomento
06/15/22 | | | 4.375 | % | | | 432,000 | | | | 470,958 | | |
Total | | | | | | | 785,449 | | |
Czech Republic 0.2% | |
Czech Republic Government Bond
06/16/13 | | | 3.700 | % | | CZK | 7,230,000 | | | | 370,673 | | |
Denmark 0.5% | |
Realkredit Danmark A/S
01/01/19 | | | 4.000 | % | | DKK | 5,330,000 | | | | 1,080,850 | | |
Finland 1.8% | |
Finland Government Bond
Senior Unsecured
04/15/21 | | | 3.500 | % | | EUR | 2,531,000 | | | | 3,934,511 | | |
France 0.5% | |
Cie de Financement Foncier SA(b)
09/16/15 | | | 2.500 | % | | | 600,000 | | | | 622,434 | | |
Electricite de France SA
Senior Unsecured
02/05/18 | | | 5.000 | % | | EUR | 350,000 | | | | 541,117 | | |
Total | | | | | | | 1,163,551 | | |
Germany 6.7% | |
Bundesrepublik Deutschland
07/04/14 | | | 4.250 | % | | EUR | 1,365,000 | | | | 1,885,722 | | |
01/04/15 | | | 3.750 | % | | EUR | 723,000 | | | | 1,011,560 | | |
07/04/19 | | | 3.500 | % | | EUR | 1,082,000 | | | | 1,683,781 | | |
07/04/27 | | | 6.500 | % | | EUR | 1,702,001 | | | | 3,616,647 | | |
07/04/28 | | | 4.750 | % | | EUR | 875,000 | | | | 1,608,367 | | |
07/04/34 | | | 4.750 | % | | EUR | 1,706,000 | | | | 3,309,145 | | |
07/04/44 | | | 2.500 | % | | EUR | 710,000 | | | | 1,021,774 | | |
Total | | | | | | | 14,136,996 | | |
Greece —% | |
Hellenic Republic Government Bond
Senior Unsecured(f)
10/15/42 | | | 0.000 | % | | EUR | 488,200 | | | | 5,111 | | |
Foreign Government Obligations(a) (continued)
Issuer | | Coupon
Rate | | Principal
Amount ($) | | Value ($) | |
Indonesia 2.0% | |
Indonesia Government International Bond(b)
Senior Unsecured
01/17/18 | | | 6.875 | % | | | 500,000 | | | | 603,750 | | |
10/12/35 | | | 8.500 | % | | | 190,000 | | | | 295,213 | | |
01/17/38 | | | 7.750 | % | | | 140,000 | | | | 207,900 | | |
Indonesia Treasury Bond
Senior Unsecured
05/15/16 | | | 10.750 | % | | IDR | 3,620,000,000 | | | | 436,942 | | |
11/15/20 | | | 11.000 | % | | IDR | 10,840,000,000 | | | | 1,503,324 | | |
07/15/22 | | | 10.250 | % | | IDR | 8,394,000,000 | | | | 1,151,402 | | |
Total | | | | | | | 4,198,531 | | |
Italy —% | |
Italy Buoni Poliennali Del Tesoro
11/01/26 | | | 7.250 | % | | EUR | 283 | | | | 488 | | |
Japan 4.8% | |
Japan Government 20-Year Bond
Senior Unsecured
12/20/26 | | | 2.100 | % | | JPY | 338,500,000 | | | | 3,981,873 | | |
09/20/29 | | | 2.100 | % | | JPY | 126,000,000 | | | | 1,466,612 | | |
12/20/32 | | | 1.700 | % | | JPY | 253,000,000 | | | | 2,701,529 | | |
Japan Government 30-Year Bond
Senior Unsecured
12/20/34 | | | 2.400 | % | | JPY | 124,000,000 | | | | 1,479,596 | | |
03/20/39 | | | 2.300 | % | | JPY | 55,500,000 | | | | 657,012 | | |
Total | | | | | | | 10,286,622 | | |
Kazakhstan 0.1% | |
KazMunayGas National Co. JSC(b)
07/02/18 | | | 9.125 | % | | | 250,000 | | | | 319,375 | | |
Lithuania 0.4% | |
Lithuania Government International Bond
Senior Unsecured
02/07/18 | | | 4.850 | % | | EUR | 470,000 | | | | 695,254 | | |
Lithuania Government International Bond(b)
Senior Unsecured
09/14/17 | | | 5.125 | % | | | 210,000 | | | | 236,034 | | |
Total | | | | | | | 931,288 | | |
Malaysia 0.5% | |
Petronas Capital Ltd.(b)
08/12/19 | | | 5.250 | % | | | 970,000 | | | | 1,142,169 | | |
Mexico 2.1% | |
Mexican Bonos
12/19/13 | | | 8.000 | % | | MXN | 1,677,600 | | | | 1,416,419 | | |
12/17/15 | | | 8.000 | % | | MXN | 2,238,260 | | | | 2,024,877 | | |
The accompanying Notes to Financial Statements are an integral part of this statement.
Semiannual Report 2013
16
Columbia Global Bond Fund
Portfolio of Investments (continued)
April 30, 2013 (Unaudited)
Foreign Government Obligations(a) (continued)
Issuer | | Coupon
Rate | | Principal
Amount ($) | | Value ($) | |
Mexico Government International Bond
Senior Unsecured
09/27/34 | | | 6.750 | % | | | 270,000 | | | | 377,325 | | |
Petroleos Mexicanos
01/24/22 | | | 4.875 | % | | | 500,000 | | | | 568,750 | | |
Total | | | | | | | 4,387,371 | | |
Netherlands 0.5% | |
Bank Nederlandse Gemeenten
Senior Unsecured(b)
03/23/15 | | | 1.375 | % | | | 960,000 | | | | 976,781 | | |
New Zealand 1.0% | |
New Zealand Government Bond
Senior Unsecured
03/15/19 | | | 5.000 | % | | NZD | 2,150,000 | | | | 2,056,277 | | |
Norway 1.8% | |
Norway Government Bond
05/22/19 | | | 4.500 | % | | NOK | 19,000,000 | | | | 3,861,087 | | |
Peru 0.1% | |
Peruvian Government International Bond
Senior Unsecured
07/21/25 | | | 7.350 | % | | | 150,000 | | | | 217,875 | | |
Philippines 0.2% | |
Power Sector Assets & Liabilities Management Corp.
Government Guaranteed(b)
05/27/19 | | | 7.250 | % | | | 290,000 | | | | 366,125 | | |
Poland 3.6% | |
Poland Government Bond
10/24/13 | | | 5.000 | % | | PLN | 3,410,000 | | | | 1,090,173 | | |
04/25/14 | | | 5.750 | % | | PLN | 3,250,000 | | | | 1,058,871 | | |
10/25/17 | | | 5.250 | % | | PLN | 7,705,000 | | | | 2,696,634 | | |
10/25/21 | | | 5.750 | % | | PLN | 7,310,000 | | | | 2,757,574 | | |
Total | | | | | | | 7,603,252 | | |
Romania 0.3% | |
Romanian Government International Bond
Senior Unsecured
06/17/16 | | | 5.250 | % | | EUR | 480,000 | | | | 686,310 | | |
Russian Federation 0.6% | |
AK Transneft OJSC Via TransCapitalInvest Ltd.
Senior Unsecured(b)
08/07/18 | | | 8.700 | % | | | 100,000 | | | | 127,625 | | |
Foreign Government Obligations(a) (continued)
Issuer | | Coupon
Rate | | Principal
Amount ($) | | Value ($) | |
Gazprom OAO Via Gaz Capital SA(b)
Senior Unsecured
11/22/16 | | | 6.212 | % | | | 100,000 | | | | 112,250 | | |
08/16/37 | | | 7.288 | % | | | 230,000 | | | | 285,200 | | |
Russian Foreign Bond - Eurobond
Senior Unsecured(b)(f)
03/31/30 | | | 7.500 | % | | | 592,275 | | | | 745,082 | | |
Total | | | | | | | 1,270,157 | | |
South Africa 0.4% | |
South Africa Government Bond
12/21/14 | | | 8.750 | % | | ZAR | 7,375,000 | | | | 869,039 | | |
South Korea 0.7% | |
Export-Import Bank of Korea
Senior Unsecured
01/21/14 | | | 8.125 | % | | | 360,000 | | | | 378,238 | | |
01/14/15 | | | 5.875 | % | | | 450,000 | | | | 484,027 | | |
04/11/22 | | | 5.000 | % | | | 500,000 | | | | 578,950 | | |
Total | | | | | | | 1,441,215 | | |
Sweden 1.2% | |
Nordea Hypotek AB
06/19/13 | | | 4.250 | % | | SEK | 7,300,000 | | | | 1,130,611 | | |
Sweden Government Bond
08/12/17 | | | 3.750 | % | | SEK | 4,530,000 | | | | 778,223 | | |
06/01/22 | | | 3.500 | % | | SEK | 4,000,000 | | | | 720,660 | | |
Total | | | | | | | 2,629,494 | | |
Turkey 0.7% | |
Turkey Government International Bond
Senior Unsecured
02/16/17 | | | 5.500 | % | | EUR | 480,000 | | | | 708,435 | | |
03/17/36 | | | 6.875 | % | | | 540,000 | | | | 707,400 | | |
Total | | | | | | | 1,415,835 | | |
United Kingdom 5.5% | |
United Kingdom Gilt
09/07/16 | | | 4.000 | % | | GBP | 1,780,000 | | | | 3,099,634 | | |
03/07/19 | | | 4.500 | % | | GBP | 680,000 | | | | 1,273,512 | | |
09/07/21 | | | 3.750 | % | | GBP | 190,000 | | | | 349,178 | | |
03/07/25 | | | 5.000 | % | | GBP | 430,000 | | | | 884,006 | | |
12/07/27 | | | 4.250 | % | | GBP | 810,000 | | | | 1,565,658 | | |
03/07/36 | | | 4.250 | % | | GBP | 572,000 | | | | 1,104,194 | | |
12/07/38 | | | 4.750 | % | | GBP | 684,000 | | | | 1,421,858 | | |
12/07/40 | | | 4.250 | % | | GBP | 540,000 | | | | 1,040,631 | | |
12/07/49 | | | 4.250 | % | | GBP | 475,000 | | | | 923,571 | | |
Total | | | | | | | 11,662,242 | | |
The accompanying Notes to Financial Statements are an integral part of this statement.
Semiannual Report 2013
17
Columbia Global Bond Fund
Portfolio of Investments (continued)
April 30, 2013 (Unaudited)
Foreign Government Obligations(a) (continued)
Issuer | | Coupon
Rate | | Principal
Amount ($) | | Value ($) | |
Uruguay 0.2% | |
Uruguay Government International Bond
Senior Unsecured
03/21/36 | | | 7.625 | % | | | 275,000 | | | | 414,838 | | |
Venezuela 0.7% | |
Petroleos de Venezuela SA
04/12/17 | | | 5.250 | % | | | 590,000 | | | | 511,825 | | |
Venezuela Government International Bond
Senior Unsecured
02/26/16 | | | 5.750 | % | | | 20,000 | | | | 18,950 | | |
05/07/23 | | | 9.000 | % | | | 931,000 | | | | 885,847 | | |
Total | | | | | | | 1,416,622 | | |
Total Foreign Government Obligations
(Cost: $88,375,638) | | | | | | | 95,923,099 | | |
Senior Loans 0.3%
Borrower | | Weighted
Average
Coupon | | Principal
Amount ($) | | Value ($) | |
Australia —% | |
FMG Resources August 2006 Proprietary Ltd.
Term Loan(f)(g)
10/18/17 | | | 5.250 | % | | | 96,515 | | | | 98,204 | | |
United Kingdom —% | |
Vantage Drilling Co.
2nd Lien Term Loan(c)(f)(g)
03/28/19 | | | 5.750 | % | | | 6,000 | | | | 6,079 | | |
United States 0.3% | |
Affinia Group, Inc.
Tranche B2 Term Loan(c)(f)(g)
04/25/20 | | | 4.750 | % | | | 8,000 | | | | 8,090 | | |
Alliant Holdings I, Inc.
Term Loan(f)(g)
12/20/19 | | | 5.000 | % | | | 12,967 | | | | 13,113 | | |
Ancestry.com, Inc.
Term Loan(f)(g)
12/28/18 | | | 7.000 | % | | | 54,862 | | | | 55,480 | | |
Apex Tool Group LLC
Term Loan(f)(g)
01/31/20 | | | 4.500 | % | | | 6,000 | | | | 6,077 | | |
Asurion LLC
Tranche B1 Term Loan(f)(g)
05/24/19 | | | 4.500 | % | | | 4,988 | | | | 5,043 | | |
Senior Loans (continued)
Borrower | | Weighted
Average
Coupon | | Principal
Amount ($) | | Value ($) | |
Blue Coat Systems, Inc.
Term Loan(f)(g)
02/15/18 | | | 5.750 | % | | | 14,887 | | | | 15,009 | | |
ConvaTec, Inc.
Term Loan(f)(g)
12/22/16 | | | 5.000 | % | | | 6,000 | | | | 6,104 | | |
Cumulus Media Holdings, Inc.
2nd Lien Term Loan(f)(g)
09/16/19 | | | 7.500 | % | | | 24,704 | | | | 25,610 | | |
Dupont Performance Coatings, Inc.
Tranche B Term Loan(f)(g)
02/01/20 | | | 4.750 | % | | | 9,000 | | | | 9,112 | | |
Hostess Brands, Inc.
1st Lien Term Loan(c)(f)(g)
02/25/20 | | | 6.750 | % | | | 12,000 | | | | 12,270 | | |
Integra Telecom Holdings, Inc.
Term Loan(f)(g)
02/22/19 | | | 6.000 | % | | | 8,000 | | | | 8,160 | | |
Lonestar Intermediate Super Holdings LLC
Term Loan(f)(g)
09/02/19 | | | 11.000 | % | | | 95,000 | | | | 101,947 | | |
New Breed, Inc.
Term Loan(f)(g)
10/01/19 | | | 6.000 | % | | | 85,785 | | | | 86,214 | | |
PQ Corp.
Term Loan(f)(g)
08/07/17 | | | 4.500 | % | | | 44,887 | | | | 45,362 | | |
ROC Finance LLC
Tranche B Term Loan(c)(f)(g)
03/28/19 | | | 5.000 | % | | | 14,000 | | | | 14,122 | | |
Rite Aid Corp.
2nd Lien Tranche 1 Term Loan(f)(g)
08/21/20 | | | 5.750 | % | | | 20,000 | | | | 20,733 | | |
Serta Simmons Holdings LLC
Term Loan(f)(g)
10/01/19 | | | 5.000 | % | | | 64,837 | | | | 65,678 | | |
Spectrum Brands, Inc.
Term Loan(f)(g)
12/17/19 | | | 4.500 | % | | | 4,988 | | | | 5,058 | | |
Sun Products Corp. (The)
Tranche B Term Loan(f)(g)
03/23/20 | | | 5.500 | % | | | 16,000 | | | | 16,120 | | |
United Surgical Partners International, Inc.
Tranche B Term Loan(c)(f)(g)
04/03/19 | | | 5.030 | % | | | 6,983 | | | | 7,017 | | |
The accompanying Notes to Financial Statements are an integral part of this statement.
Semiannual Report 2013
18
Columbia Global Bond Fund
Portfolio of Investments (continued)
April 30, 2013 (Unaudited)
Senior Loans (continued)
Borrower | | Weighted
Average
Coupon | | Principal
Amount ($) | | Value ($) | |
WideOpenWest Finance LLC
Tranche B Term Loan(f)(g)
04/01/19 | | | 4.750 | % | | | 12,903 | | | | 13,068 | | |
Total | | | | | | | 539,387 | | |
Total Senior Loans
(Cost: $621,332) | | | | | | | 643,670 | | |
Treasury Bills(a) 0.8%
Issuer | | Coupon
Rate | | Principal
Amount ($) | | Value ($) | |
Norway 0.8% | |
Norway Treasury Bills
12/18/13 | | | 1.500 | % | | NOK | 10,300,000 | | | | 1,769,298 | | |
Total Treasury Bills
(Cost: $1,834,978) | | | | | | | 1,769,298 | | |
Money Market Funds 5.0%
| | | Shares | | Value ($) | |
Columbia Short-Term Cash Fund,
0.126%(h)(i) | | | 10,604,611 | | | | 10,604,611 | | |
Total Money Market Funds
(Cost: $10,604,611) | | | | | 10,604,611 | | |
Total Investments
(Cost: $189,303,588) | | | | | 202,041,535 | | |
Other Assets & Liabilities, Net | | | | | 9,988,996 | | |
Net Assets | | | | | 212,030,531 | | |
Investments in Derivatives
Futures Contracts Outstanding at April 30, 2013
At April 30, 2013, $584,851 was held in a margin deposit account as collateral to cover initial margin requirements on open futures contracts.
| Contract Description | | Number of
Contracts
Long (Short) | | Notional
Market
Value ($) | | Expiration
Date | | Unrealized
Appreciation ($) | | Unrealized
Depreciation ($) | |
Australian Government Bond, 10-year | | | (124 | ) | | | (12,458,503 | ) | | June 2013 | | | — | | | | (441,895 | ) | |
Canadian Government Bond, 10-year | | | 117 | | | | 15,880,272 | | | June 2013 | | | 4,790 | | | | — | | |
Euro-Bobl, 5-year | | | 32 | | | | 5,340,708 | | | June 2013 | | | 36,423 | | | | — | | |
U.S. Treasury Note, 5-year | | | (66 | ) | | | (8,226,282 | ) | | June 2013 | | | — | | | | (66,057 | ) | |
U.S. Treasury Note, 10-year | | | (134 | ) | | | (17,870,157 | ) | | June 2013 | | | — | | | | (225,905 | ) | |
U.S. Treasury Ultra Bond, 30-year | | | (5 | ) | | | (821,719 | ) | | June 2013 | | | — | | | | (29,960 | ) | |
Total | | | | | | | | | 41,213 | | | | (763,817 | ) | |
Forward Foreign Currency Exchange Contracts Open at April 30, 2013
Counterparty | | Exchange Date | | Currency to
be Delivered | | Currency to
be Received | | Unrealized
Appreciation ($) | | Unrealized
Depreciation ($) | |
Standard Chartered Bank | | May 15, 2013 | | | 570,000
(AUD) | | | | 583,275
(USD) | | | | — | | | | (7,026 | ) | |
Standard Chartered Bank | | May 15, 2013 | | | 239,000
(CAD) | | | | 232,631
(USD) | | | | — | | | | (4,525 | ) | |
Standard Chartered Bank | | May 15, 2013 | | | 2,766,000
(CHF) | | | | 2,975,585
(USD) | | | | 378 | | | | — | | |
State Street Bank & Trust Co. | | May 15, 2013 | | | 8,958,000
(CHF) | | | | 9,636,714
(USD) | | | | 1,171 | | | | — | | |
The accompanying Notes to Financial Statements are an integral part of this statement.
Semiannual Report 2013
19
Columbia Global Bond Fund
Portfolio of Investments (continued)
April 30, 2013 (Unaudited)
Forward Foreign Currency Exchange Contracts Open at April 30, 2013 (continued)
Counterparty | | Exchange Date | | Currency to
be Delivered | | Currency to
be Received | | Unrealized
Appreciation ($) | | Unrealized
Depreciation ($) | |
Goldman, Sachs & Co. | | May 15, 2013 | | | 18,236,000
(EUR) | | | | 23,863,630
(USD) | | | | — | | | | (154,335 | ) | |
Standard Chartered Bank | | May 15, 2013 | | | 1,081,000
(EUR) | | | | 1,408,792
(USD) | | | | — | | | | (14,954 | ) | |
Citigroup Global Markets, Inc. | | May 15, 2013 | | | 9,230,000
(GBP) | | | | 14,183,077
(USD) | | | | — | | | | (153,019 | ) | |
Standard Chartered Bank | | May 15, 2013 | | | 456,000
(GBP) | | | | 695,026
(USD) | | | | — | | | | (13,236 | ) | |
Standard Chartered Bank | | May 15, 2013 | | | 288,148,000
(JPY) | | | | 2,941,595
(USD) | | | | — | | | | (14,415 | ) | |
Standard Chartered Bank | | May 15, 2013 | | | 3,422,000
(NOK) | | | | 583,392
(USD) | | | | — | | | | (9,732 | ) | |
Standard Chartered Bank | | May 15, 2013 | | | 689,000
(NZD) | | | | 578,774
(USD) | | | | — | | | | (11,229 | ) | |
Standard Chartered Bank | | May 15, 2013 | | | 3,851,000
(SEK) | | | | 589,574
(USD) | | | | — | | | | (4,443 | ) | |
Deutsche Bank | | May 15, 2013 | | | 9,585,730
(USD) | | | | 9,243,000
(AUD) | | | | — | | | | (13,525 | ) | |
Deutsche Bank | | May 15, 2013 | | | 4,767,893
(USD) | | | | 4,615,000
(AUD) | | | | 11,478 | | | | — | | |
J.P. Morgan Securities, Inc. | | May 15, 2013 | | | 23,837,985
(USD) | | | | 2,334,941,000
(JPY) | | | | 115,363 | | | | — | | |
Barclays Bank PLC | | May 15, 2013 | | | 9,538,283
(USD) | | | | 54,668,000
(NOK) | | | | — | | | | (62,869 | ) | |
Barclays Bank PLC | | May 15, 2013 | | | 137,242
(USD) | | | | 803,000
(NOK) | | | | 1,939 | | | | — | | |
J.P. Morgan Securities, Inc. | | May 15, 2013 | | | 1,300,411
(USD) | | | | 1,615,000
(SGD) | | | | 10,789 | | | | — | | |
UBS Securities | | May 23, 2013 | | | 2,944,000
(NZD) | | | | 2,478,112
(USD) | | | | — | | | | (41,381 | ) | |
Standard Chartered Bank | | May 24, 2013 | | | 4,140,000
(BRL) | | | | 2,060,727
(USD) | | | | — | | | | (3,094 | ) | |
J.P. Morgan Securities, Inc. | | May 30, 2013 | | | 5,535,852
(USD) | | | | 550,200,000
(JPY) | | | | 108,880 | | | | — | | |
J.P. Morgan Securities, Inc. | | May 31, 2013 | | | 15,325,000
(ILS) | | | | 4,225,080
(USD) | | | | — | | | | (44,955 | ) | |
UBS Securities | | May 31, 2013 | | | 17,045,000
(MXN) | | | | 1,400,281
(USD) | | | | — | | | | (6 | ) | |
Goldman, Sachs & Co. | | May 31, 2013 | | | 6,688,000
(PLN) | | | | 2,127,802
(USD) | | | | 15,936 | | | | — | | |
Standard Chartered Bank | | May 31, 2013 | | | 7,640,000
(TRY) | | | | 4,243,266
(USD) | | | | — | | | | (4,648 | ) | |
Citigroup Global Markets, Inc. | | May 31, 2013 | | | 4,221,376
(USD) | | | | 230,065,000
(INR) | | | | 48,972 | | | | — | | |
J.P. Morgan Securities, Inc. | | May 31, 2013 | | | 2,131,732
(USD) | | | | 2,377,947,000
(KRW) | | | | 26,728 | | | | — | | |
Deutsche Bank | | May 31, 2013 | | | 2,026,762
(USD) | | | | 6,210,000
(MYR) | | | | 11,085 | | | | — | | |
The accompanying Notes to Financial Statements are an integral part of this statement.
Semiannual Report 2013
20
Columbia Global Bond Fund
Portfolio of Investments (continued)
April 30, 2013 (Unaudited)
Forward Foreign Currency Exchange Contracts Open at April 30, 2013 (continued)
Counterparty | | Exchange Date | | Currency to
be Delivered | | Currency to
be Received | | Unrealized
Appreciation ($) | | Unrealized
Depreciation ($) | |
Barclays Bank PLC | | May 31, 2013 | | | 4,170,099
(USD) | | | | 131,772,000
(RUB) | | | | 41,201 | | | | — | | |
State Street Bank & Trust Co. | | June 5, 2013 | | | 7,764,212
(USD) | | | | 5,966,000
(EUR) | | | | 94,481 | | | | — | | |
State Street Bank & Trust Co. | | June 13, 2013 | | | 133,000
(GBP) | | | | 206,799
(USD) | | | | 262 | | | | |
J.P. Morgan Securities, Inc. | | June 14, 2013 | | | 4,432,000
(PLN) | | | | 1,397,666
(USD) | | | | | | (218 | ) | |
HSBC Securities (USA), Inc. | | June 14, 2013 | | | 1,320,232
(USD) | | | | 1,277,000
(AUD) | | | | — | | | | (951 | ) | |
HSBC Securities (USA), Inc. | | June 14, 2013 | | | 1,289,091
(USD) | | | | 1,299,000
(CAD) | | | | | | (1,097 | ) | |
Citigroup Global Markets, Inc. | | June 20, 2013 | | | 2,037,096
(USD) | | | | 2,251,500,000
(KRW) | | | | 5,637 | | | | |
Total | | | | | | | | | 494,300 | | | | (559,658 | ) | |
Notes to Portfolio of Investments
(a) Principal amounts are denominated in United States Dollars unless otherwise noted.
(b) Security exempt from registration pursuant to Rule 144A under the Securities Act of 1933. This security may be resold in transactions exempt from registration, normally to qualified institutional buyers. At April 30, 2013, the value of these securities amounted to $27,006,603 or 12.74% of net assets.
(c) Represents a security purchased on a when-issued or delayed delivery basis.
(d) The maturity dates shown represent the original maturity of the underlying obligation. Actual maturity may vary based upon prepayment activity on these obligations. Unless otherwise noted, the coupon rates presented are fixed rates.
(e) At April 30, 2013, investments in securities included securities valued at $330,742 that were partially pledged as collateral to cover initial margin deposits on open interest rate futures contracts.
(f) Variable rate security.
(g) Senior loans have rates of interest that float periodically based primarily on the London Interbank Offered Rate ("LIBOR") and other short-term rates. The interest rate shown reflects the weighted average coupon as of April 30, 2013. The interest rate shown for senior loans purchased on a when-issued or delayed delivery basis, if any, reflects an estimated average coupon. Remaining maturities of senior loans may be less than the stated maturities shown as a result of contractual or optional prepayments by the borrower. Such prepayments cannot be predicted with certainty.
(h) The rate shown is the seven-day current annualized yield at April 30, 2013.
(i) As defined in the Investment Company Act of 1940, an affiliated company is one in which the Fund owns 5% or more of its outstanding voting securities, or a company which is under common ownership or control with the Fund. Holdings and transactions in these affiliated companies during the period ended April 30, 2013, are as follows:
Issuer | | Beginning
Cost ($) | | Purchase
Cost ($) | | Proceeds
From Sales ($) | | Ending
Cost ($) | | Dividends —
Affiliated
Issuers ($) | | Value ($) | |
Columbia Short-Term Cash Fund | | | 13,776,932 | | | | 48,419,109 | | | | (51,591,430 | ) | | | 10,604,611 | | | | 9,849 | | | | 10,604,611 | | |
Abbreviation Legend
CMO Collateralized Mortgage Obligation
PIK Payment-in-Kind
The accompanying Notes to Financial Statements are an integral part of this statement.
Semiannual Report 2013
21
Columbia Global Bond Fund
Portfolio of Investments (continued)
April 30, 2013 (Unaudited)
Currency Legend
AUD Australian Dollar
BRL Brazilian Real
CAD Canadian Dollar
CHF Swiss Franc
CZK Czech Koruna
DKK Danish Krone
EUR Euro
GBP British Pound
IDR Indonesian Rupiah
ILS Israeli Shekel
INR Indian Rupee
JPY Japanese Yen
KRW Korean Won
MXN Mexican Peso
MYR Malaysia Ringgits
NOK Norwegian Krone
NZD New Zealand Dollar
PLN Polish Zloty
RUB Russian Rouble
SEK Swedish Krona
SGD Singapore Dollar
TRY Turkish Lira
USD US Dollar
ZAR South African Rand
Fair Value Measurements
Generally accepted accounting principles (GAAP) require disclosure regarding the inputs and valuation techniques used to measure fair value and any changes in valuation inputs or techniques. In addition, investments shall be disclosed by major category.
The Fund categorizes its fair value measurements according to a three-level hierarchy that maximizes the use of observable inputs and minimizes the use of unobservable inputs by prioritizing that the most observable input be used when available. Observable inputs are those that market participants would use in pricing an investment based on market data obtained from sources independent of the reporting entity. Unobservable inputs are those that reflect the Fund's assumptions about the information market participants would use in pricing an investment. An investment's level within the fair value hierarchy is based on the lowest level of any input that is deemed significant to the asset or liability's fair value measurement. The input levels are not necessarily an indication of the risk or liquidity associated with investments at that level. For example, certain U.S. government securities are generally high quality and liquid, however, they are reflected as Level 2 because the inputs used to determine fair value may not always be quoted prices in an active market.
Fair value inputs are summarized in the three broad levels listed below:
> Level 1 — Valuations based on quoted prices for investments in active markets that the Fund has the ability to access at the measurement date (including NAV for open-end mutual funds). Valuation adjustments are not applied to Level 1 investments.
> Level 2 — Valuations based on other significant observable inputs (including quoted prices for similar securities, interest rates, prepayment speeds, credit risks, etc.).
> Level 3 — Valuations based on significant unobservable inputs (including the Fund's own assumptions and judgment in determining the fair value of investments).
The accompanying Notes to Financial Statements are an integral part of this statement.
Semiannual Report 2013
22
Columbia Global Bond Fund
Portfolio of Investments (continued)
April 30, 2013 (Unaudited)
Fair Value Measurements (continued)
Inputs that are used in determining fair value of an investment may include price information, credit data, volatility statistics, and other factors. These inputs can be either observable or unobservable. The availability of observable inputs can vary between investments, and is affected by various factors such as the type of investment, and the volume and level of activity for that investment or similar investments in the marketplace. The inputs will be considered by the Investment Manager, along with any other relevant factors in the calculation of an investment's fair value. The Fund uses prices and inputs that are current as of the measurement date, which may include periods of market dislocations. During these periods, the availability of prices and inputs may be reduced for many investments. This condition could cause an investment to be reclassified between the various levels within the hierarchy.
Investments falling into the Level 3 category are primarily supported by quoted prices from brokers and dealers participating in the market for those investments. However, these may be classified as Level 3 investments due to lack of market transparency and corroboration to support these quoted prices. Additionally, valuation models may be used as the pricing source for any remaining investments classified as Level 3. These models may rely on one or more significant unobservable inputs and/or significant assumptions by the Investment Manager. Inputs used in valuations may include, but are not limited to, financial statement analysis, capital account balances, discount rates and estimated cash flows, and comparable company data.
Under the direction of the Fund's Board of Trustees (the Board), the Investment Manager's Valuation Committee (the Committee) is responsible for carrying out the valuation procedures approved by the Board. The Committee consists of voting and non-voting members from various groups within the Investment Manager's organization, including operations and accounting, trading and investments, compliance, risk management and legal.
The Committee meets at least monthly to review and approve valuation matters, which may include a description of specific valuation determinations, data regarding pricing information received from approved pricing vendors and brokers and the results of Board-approved valuation control policies and procedures (the Policies). The Policies address, among other things, instances when market quotations are readily available, including recommendations of third party pricing vendors and a determination of appropriate pricing methodologies; events that require specific valuation determinations and assessment of fair value techniques; securities with a potential for stale pricing, including those that are illiquid, restricted, or in default; and the effectiveness of third-party pricing vendors, including periodic reviews of vendors. The Committee meets more frequently, as needed, to discuss additional valuation matters, which may include the need to review back-testing results, review time-sensitive information or approve related valuation actions. The Committee reports to the Board, with members of the Committee meeting with the Board at each of its regularly scheduled meetings to discuss valuation matters and actions during the period, similar to those described earlier.
For investments categorized as Level 3, the Committee monitors information similar to that described above, which may include: (i) data specific to the issuer or comparable issuers, (ii) general market or specific sector news and (iii) quoted prices and specific or similar security transactions. The Committee considers this data and any changes from prior periods in order to assess the reasonableness of observable and unobservable inputs, any assumptions or internal models used to value those securities and changes in fair value. This data is also used to corroborate, when available, information received from approved pricing vendors and brokers. Various factors impact the frequency of monitoring this information (which may occur as often as daily). However, the Committee may determine that changes to inputs, assumptions and models are not required as a result of the monitoring procedures performed.
The accompanying Notes to Financial Statements are an integral part of this statement.
Semiannual Report 2013
23
Columbia Global Bond Fund
Portfolio of Investments (continued)
April 30, 2013 (Unaudited)
Fair Value Measurements (continued)
The following table is a summary of the inputs used to value the Fund's investments at April 30, 2013:
Description | | Level 1
Quoted Prices in Active
Markets for Identical
Assets ($) | | Level 2
Other Significant
Observable Inputs ($) | | Level 3
Significant
Unobservable Inputs ($) | | Total ($) | |
Bonds | |
Corporate Bonds & Notes | | | — | | | | 50,442,831 | | | | — | | | | 50,442,831 | | |
Residential Mortgage-Backed
Securities — Agency | | | — | | | | 12,277,644 | | | | — | | | | 12,277,644 | | |
Residential Mortgage-Backed
Securities — Non-Agency | | | — | | | | 295,901 | | | | — | | | | 295,901 | | |
Commercial Mortgage-Backed
Securities — Agency | | | — | | | | 4,389,449 | | | | — | | | | 4,389,449 | | |
Commercial Mortgage-Backed
Securities — Non-Agency | | | — | | | | 6,622,140 | | | | — | | | | 6,622,140 | | |
Asset-Backed Securities —
Non-Agency | | | — | | | | 5,969,443 | | | | — | | | | 5,969,443 | | |
Inflation-Indexed Bonds | | | — | | | | 1,957,351 | | | | — | | | | 1,957,351 | | |
U.S. Treasury Obligations | | | 11,146,098 | | | | — | | | | — | | | | 11,146,098 | | |
Foreign Government Obligations | | | — | | | | 95,923,099 | | | | — | | | | 95,923,099 | | |
Total Bonds | | | 11,146,098 | | | | 177,877,858 | | | | — | | | | 189,023,956 | | |
Short-Term Securities | |
Treasury Bills | | | — | | | | 1,769,298 | | | | — | | | | 1,769,298 | | |
Total Short-Term Securities | | | — | | | | 1,769,298 | | | | — | | | | 1,769,298 | | |
Other | |
Senior Loans | | | — | | | | 643,670 | | | | — | | | | 643,670 | | |
Money Market Funds | | | 10,604,611 | | | | — | | | | — | | | | 10,604,611 | | |
Total Other | | | 10,604,611 | | | | 643,670 | | | | — | | | | 11,248,281 | | |
Investments in Securities | | | 21,750,709 | | | | 180,290,826 | | | | — | | | | 202,041,535 | | |
Derivatives | |
Assets | |
Futures Contracts | | | 41,213 | | | | — | | | | — | | | | 41,213 | | |
Forward Foreign Currency Exchange
Contracts | | | — | | | | 494,300 | | | | — | | | | 494,300 | | |
Liabilities | |
Futures Contracts | | | (763,817 | ) | | | — | | | | — | | | | (763,817 | ) | |
Forward Foreign Currency Exchange
Contracts | | | — | | | | (559,658 | ) | | | — | | | | (559,658 | ) | |
Total | | | 21,028,105 | | | | 180,225,468 | | | | — | | | | 201,253,573 | | |
See the Portfolio of Investments for all investment classifications not indicated in the table.
The Fund's assets assigned to the Level 2 input category are generally valued using the market approach, in which a security's value is determined through reference to prices and information from market transactions for similar or identical assets.
There were no transfers of financial assets between Levels 1 and 2 during the period.
Derivative instruments are valued at unrealized appreciation (depreciation).
The accompanying Notes to Financial Statements are an integral part of this statement.
Semiannual Report 2013
24
Columbia Global Bond Fund
Statement of Assets and Liabilities
April 30, 2013 (Unaudited)
Assets | |
Investments, at value | |
Unaffiliated issuers (identified cost $178,698,977) | | $ | 191,436,924 | | |
Affiliated issuers (identified cost $10,604,611) | | | 10,604,611 | | |
Total investments (identified cost $189,303,588) | | | 202,041,535 | | |
Cash | | | 36,626 | | |
Foreign currency (identified cost $6,239,587) | | | 6,261,682 | | |
Margin deposits on futures contracts | | | 584,851 | | |
Unrealized appreciation on forward foreign currency exchange contracts | | | 494,300 | | |
Receivable for: | |
Investments sold | | | 2,274,061 | | |
Capital shares sold | | | 93,270 | | |
Dividends | | | 1,438 | | |
Interest | | | 2,321,097 | | |
Reclaims | | | 151,725 | | |
Expense reimbursement due from Investment Manager | | | 1,437 | | |
Prepaid expenses | | | 871 | | |
Total assets | | | 214,262,893 | | |
Liabilities | |
Unrealized depreciation on forward foreign currency exchange contracts | | | 559,658 | | |
Payable for: | |
Investments purchased | | | 779,290 | | |
Investments purchased on a delayed delivery basis | | | 289,617 | | |
Capital shares purchased | | | 337,244 | | |
Variation margin on futures contracts | | | 1,525 | | |
Investment management fees | | | 3,309 | | |
Distribution and/or service fees | | | 1,703 | | |
Foreign capital gains taxes deferred | | | 116,728 | | |
Transfer agent fees | | | 50,178 | | |
Administration fees | | | 464 | | |
Plan administration fees | | | 2 | | |
Compensation of board members | | | 21,960 | | |
Other expenses | | | 70,684 | | |
Total liabilities | | | 2,232,362 | | |
Net assets applicable to outstanding capital stock | | $ | 212,030,531 | | |
Represented by | |
Paid-in capital | | $ | 204,285,519 | | |
Excess of distributions over net investment income | | | (7,560,057 | ) | |
Accumulated net realized gain | | | 3,437,283 | | |
Unrealized appreciation (depreciation) on: | |
Investments | | | 12,737,947 | | |
Foreign currency translations | | | 34,529 | | |
Forward foreign currency exchange contracts | | | (65,358 | ) | |
Futures contracts | | | (722,604 | ) | |
Foreign capital gains tax | | | (116,728 | ) | |
Total — representing net assets applicable to outstanding capital stock | | $ | 212,030,531 | | |
The accompanying Notes to Financial Statements are an integral part of this statement.
Semiannual Report 2013
25
Columbia Global Bond Fund
Statement of Assets and Liabilities (continued)
April 30, 2013 (Unaudited)
Class A | |
Net assets | | $ | 194,155,367 | | |
Shares outstanding | | | 28,775,879 | | |
Net asset value per share | | $ | 6.75 | | |
Maximum offering price per share(a) | | $ | 7.09 | | |
Class B | |
Net assets | | $ | 4,963,616 | | |
Shares outstanding | | | 729,988 | | |
Net asset value per share | | $ | 6.80 | | |
Class C | |
Net assets | | $ | 8,651,996 | | |
Shares outstanding | | | 1,288,317 | | |
Net asset value per share | | $ | 6.72 | | |
Class I | |
Net assets | | $ | 9,713 | | |
Shares outstanding | | | 1,447 | | |
Net asset value per share | | $ | 6.71 | | |
Class K | |
Net assets | | $ | 325,402 | | |
Shares outstanding | | | 48,186 | | |
Net asset value per share | | $ | 6.75 | | |
Class R | |
Net assets | | $ | 4,822 | | |
Shares outstanding | | | 716 | | |
Net asset value per share | | $ | 6.73 | | |
Class W | |
Net assets | | $ | 188,841 | | |
Shares outstanding | | | 27,999 | | |
Net asset value per share | | $ | 6.74 | | |
Class Y | |
Net assets | | $ | 2,328 | | |
Shares outstanding | | | 347 | | |
Net asset value per share(b) | | $ | 6.70 | | |
Class Z | |
Net assets | | $ | 3,728,446 | | |
Shares outstanding | | | 552,391 | | |
Net asset value per share | | $ | 6.75 | | |
(a) The maximum offering price per share is calculated by dividing the net asset value by 1.0 minus the maximum sales charge of 4.75%.
(b) Net asset value per share rounds to this amount due to fractional shares outstanding.
The accompanying Notes to Financial Statements are an integral part of this statement.
Semiannual Report 2013
26
Columbia Global Bond Fund
Statement of Operations
Six Months Ended April 30, 2013 (Unaudited)
Net investment income | |
Income: | |
Dividends — affiliated issuers | | $ | 9,849 | | |
Interest | | | 3,959,776 | | |
Income from securities lending — net | | | 53 | | |
Foreign taxes withheld | | | (28,973 | ) | |
Total income | | | 3,940,705 | | |
Expenses: | |
Investment management fees | | | 670,000 | | |
Distribution and/or service fees | |
Class A | | | 250,304 | | |
Class B | | | 26,846 | | |
Class C | | | 43,118 | | |
Class R | | | 12 | | |
Class W | | | 21,387 | | |
Transfer agent fees | |
Class A | | | 341,645 | | |
Class B | | | 9,167 | | |
Class C | | | 14,715 | | |
Class K | | | 90 | | |
Class R | | | 9 | | |
Class W | | | 29,297 | | |
Class Z | | | 5,780 | | |
Administration fees | | | 94,035 | | |
Plan administration fees | |
Class K | | | 451 | | |
Compensation of board members | | | 10,920 | | |
Custodian fees | | | 21,488 | | |
Printing and postage fees | | | 56,246 | | |
Registration fees | | | 54,940 | | |
Professional fees | | | 17,362 | | |
Other | | | 7,223 | | |
Total expenses | | | 1,675,035 | | |
Fees waived or expenses reimbursed by Investment Manager and its affiliates | | | (311,250 | ) | |
Total net expenses | | | 1,363,785 | | |
Net investment income | | | 2,576,920 | | |
Realized and unrealized gain (loss) — net | |
Net realized gain (loss) on: | |
Investments | | | 5,148,391 | | |
Foreign currency translations | | | 4,283 | | |
Forward foreign currency exchange contracts | | | (1,071,072 | ) | |
Futures contracts | | | 939,376 | | |
Net realized gain | | | 5,020,978 | | |
Net change in unrealized appreciation (depreciation) on: | |
Investments | | | (7,994,081 | ) | |
Foreign currency translations | | | (116,162 | ) | |
Forward foreign currency exchange contracts | | | 203,433 | | |
Futures contracts | | | (773,711 | ) | |
Foreign capital gains tax | | | 11,323 | | |
Net change in unrealized appreciation (depreciation) | | | (8,669,198 | ) | |
Net realized and unrealized loss | | | (3,648,220 | ) | |
Net decrease in net assets from operations | | $ | (1,071,300 | ) | |
The accompanying Notes to Financial Statements are an integral part of this statement.
Semiannual Report 2013
27
Columbia Global Bond Fund
Statement of Changes in Net Assets
| | | Six Months Ended
April 30, 2013(a)
(Unaudited) | | Year Ended
October 31,
2012 | |
Operations | |
Net investment income | | $ | 2,576,920 | | | $ | 6,595,684 | | |
Net realized gain | | | 5,020,978 | | | | 6,579,763 | | |
Net change in unrealized appreciation (depreciation) | | | (8,669,198 | ) | | | (30,803 | ) | |
Net increase (decrease) in net assets resulting from operations | | | (1,071,300 | ) | | | 13,144,644 | | |
Distributions to shareholders | |
Net investment income | |
Class A | | | (12,636,940 | ) | | | (13,525,752 | ) | |
Class B | | | (324,525 | ) | | | (525,693 | ) | |
Class C | | | (508,118 | ) | | | (333,562 | ) | |
Class I | | | (659 | ) | | | (205,049 | ) | |
Class K | | | (25,365 | ) | | | (24,475 | ) | |
Class R | | | (310 | ) | | | (314 | ) | |
Class W | | | (1,885,172 | ) | | | (2,978,760 | ) | |
Class Y | | | (158 | ) | | | — | | |
Class Z | | | (146,335 | ) | | | (57,642 | ) | |
Net realized gains | |
Class A | | | (610,804 | ) | | | (905,617 | ) | |
Class B | | | (16,571 | ) | | | (39,090 | ) | |
Class C | | | (25,863 | ) | | | (24,734 | ) | |
Class I | | | (31 | ) | | | (13,695 | ) | |
Class K | | | (1,218 | ) | | | (1,586 | ) | |
Class R | | | (15 | ) | | | (22 | ) | |
Class W | | | (93,323 | ) | | | (205,051 | ) | |
Class Y | | | (7 | ) | | | — | | |
Class Z | | | (6,056 | ) | | | (3,453 | ) | |
Total distributions to shareholders | | | (16,281,470 | ) | | | (18,844,495 | ) | |
Increase (decrease) in net assets from capital stock activity | | | (28,525,122 | ) | | | (32,579,444 | ) | |
Total decrease in net assets | | | (45,877,892 | ) | | | (38,279,295 | ) | |
Net assets at beginning of period | | | 257,908,423 | | | | 296,187,718 | | |
Net assets at end of period | | $ | 212,030,531 | | | $ | 257,908,423 | | |
Undistributed (excess of distributions over) net investment income | | $ | (7,560,057 | ) | | $ | 5,390,605 | | |
(a) Class Y shares are for the period from November 8, 2012 (commencement of operations) to April 30, 2013.
The accompanying Notes to Financial Statements are an integral part of this statement.
Semiannual Report 2013
28
Columbia Global Bond Fund
Statement of Changes in Net Assets (continued)
| | | Six Months Ended April 30, 2013(a)
(Unaudited) | | Year Ended October 31, 2012 | |
| | | Shares | | Dollars ($) | | Shares | | Dollars ($) | |
Capital stock activity | |
Class A shares | |
Subscriptions(b) | | | 1,720,180 | | | | 11,817,886 | | | | 3,431,960 | | | | 24,203,233 | | |
Distributions reinvested | | | 1,852,947 | | | | 12,648,970 | | | | 1,875,892 | | | | 12,870,895 | | |
Redemptions | | | (3,856,785 | ) | | | (26,385,472 | ) | | | (6,634,315 | ) | | | (46,770,836 | ) | |
Net decrease | | | (283,658 | ) | | | (1,918,616 | ) | | | (1,326,463 | ) | | | (9,696,708 | ) | |
Class B shares | |
Subscriptions | | | 31,101 | | | | 214,451 | | | | 42,599 | | | | 301,284 | | |
Distributions reinvested | | | 47,674 | | | | 328,477 | | | | 75,354 | | | | 520,694 | | |
Redemptions(b) | | | (148,535 | ) | | | (1,019,934 | ) | | | (644,810 | ) | | | (4,565,242 | ) | |
Net decrease | | | (69,760 | ) | | | (477,006 | ) | | | (526,857 | ) | | | (3,743,264 | ) | |
Class C shares | |
Subscriptions | | | 277,446 | | | | 1,886,782 | | | | 534,165 | | | | 3,767,227 | | |
Distributions reinvested | | | 77,063 | | | | 524,032 | | | | 47,828 | | | | 326,664 | | |
Redemptions | | | (245,239 | ) | | | (1,647,868 | ) | | | (210,878 | ) | | | (1,479,741 | ) | |
Net increase | | | 109,270 | | | | 762,946 | | | | 371,115 | | | | 2,614,150 | | |
Class I shares | |
Subscriptions | | | — | | | | — | | | | 99,977 | | | | 701,945 | | |
Distributions reinvested | | | — | | | | — | | | | 31,795 | | | | 217,943 | | |
Redemptions | | | — | | | | — | | | | (588,039 | ) | | | (4,093,918 | ) | |
Net increase (decrease) | | | — | | | | — | | | | (456,267 | ) | | | (3,174,030 | ) | |
Class K shares | |
Subscriptions | | | 1,885 | | | | 13,405 | | | | 15,229 | | | | 111,009 | | |
Distributions reinvested | | | 3,894 | | | | 26,583 | | | | 3,797 | | | | 26,061 | | |
Redemptions | | | (14,355 | ) | | | (97,611 | ) | | | (1,782 | ) | | | (12,945 | ) | |
Net increase (decrease) | | | (8,576 | ) | | | (57,623 | ) | | | 17,244 | | | | 124,125 | | |
Class W shares | |
Subscriptions | | | 373,626 | | | | 2,616,627 | | | | 1,856,591 | | | | 13,263,151 | | |
Distributions reinvested | | | 290,053 | | | | 1,978,163 | | | | 464,964 | | | | 3,183,456 | | |
Redemptions | | | (4,956,596 | ) | | | (33,216,498 | ) | | | (5,150,963 | ) | | | (36,493,728 | ) | |
Net decrease | | | (4,292,917 | ) | | | (28,621,708 | ) | | | (2,829,408 | ) | | | (20,047,121 | ) | |
Class Y shares | |
Subscriptions | | | 347 | | | | 2,500 | | | | — | | | | — | | |
Net increase | | | 347 | | | | 2,500 | | | | — | | | | — | | |
Class Z shares | |
Subscriptions | | | 395,437 | | | | 2,713,319 | | | | 268,955 | | | | 1,910,003 | | |
Distributions reinvested | | | 22,075 | | | | 150,590 | | | | 8,786 | | | | 60,408 | | |
Redemptions | | | (158,953 | ) | | | (1,079,524 | ) | | | (88,272 | ) | | | (627,007 | ) | |
Net increase | | | 258,559 | | | | 1,784,385 | | | | 189,469 | | | | 1,343,404 | | |
Total net decrease | | | (4,286,735 | ) | | | (28,525,122 | ) | | | (4,561,167 | ) | | | (32,579,444 | ) | |
(a) Class Y shares are for the period from November 8, 2012 (commencement of operations) to April 30, 2013.
(b) Includes conversions of Class B shares to Class A shares, if any.
The accompanying Notes to Financial Statements are an integral part of this statement.
Semiannual Report 2013
29
Columbia Global Bond Fund
The following tables are intended to help you understand the Fund's financial performance. Certain information reflects financial results for a single share of a class held for the periods shown. Per share net investment income (loss) amounts are calculated based on average shares outstanding during the period. Total return assumes reinvestment of all dividends and distributions, if any. Total return does not reflect payment of sales charges, if any, and is not annualized for periods of less than one year.
| | | Six Months Ended
April 30, 2013 | | Year Ended October 31, | |
Class A | | (Unaudited) | | 2012 | | 2011 | | 2010 | | 2009 | | 2008 | |
Per share data | |
Net asset value, beginning of period | | $ | 7.22 | | | $ | 7.35 | | | $ | 7.47 | | | $ | 7.10 | | | $ | 6.16 | | | $ | 6.89 | | |
Income from investment operations: | |
Net investment income | | | 0.08 | | | | 0.18 | | | | 0.22 | | | | 0.23 | | | | 0.17 | | | | 0.22 | | |
Net realized and unrealized gain (loss) | | | (0.09 | ) | | | 0.17 | | | | (0.05 | ) | | | 0.31 | | | | 1.15 | | | | (0.73 | ) | |
Total from investment operations | | | (0.01 | ) | | | 0.35 | | | | 0.17 | | | | 0.54 | | | | 1.32 | | | | (0.51 | ) | |
Less distributions to shareholders: | |
Net investment income | | | (0.44 | ) | | | (0.45 | ) | | | (0.29 | ) | | | (0.17 | ) | | | (0.38 | ) | | | (0.22 | ) | |
Net realized gains | | | (0.02 | ) | | | (0.03 | ) | | | — | | | | — | | | | — | | | | — | | |
Total distributions to shareholders | | | (0.46 | ) | | | (0.48 | ) | | | (0.29 | ) | | | (0.17 | ) | | | (0.38 | ) | | | (0.22 | ) | |
Net asset value, end of period | | $ | 6.75 | | | $ | 7.22 | | | $ | 7.35 | | | $ | 7.47 | | | $ | 7.10 | | | $ | 6.16 | | |
Total return | | | (0.18 | %) | | | 5.20 | % | | | 2.46 | % | | | 7.70 | % | | | 22.12 | % | | | (7.66 | %) | |
Ratios to average net assets(a) | |
Total gross expenses | | | 1.38 | %(b) | | | 1.33 | % | | | 1.35 | % | | | 1.34 | % | | | 1.36 | % | | | 1.32 | % | |
Total net expenses(c) | | | 1.12 | %(b) | | | 1.15 | %(d) | | | 1.21 | %(d) | | | 1.25 | % | | | 1.25 | % | | | 1.25 | % | |
Net investment income | | | 2.22 | %(b) | | | 2.51 | % | | | 2.95 | % | | | 3.31 | % | | | 2.72 | % | | | 3.26 | % | |
Supplemental data | |
Net assets, end of period (in thousands) | | $ | 194,155 | | | $ | 209,873 | | | $ | 223,462 | | | $ | 246,929 | | | $ | 252,773 | | | $ | 248,748 | | |
Portfolio turnover | | | 31 | % | | | 34 | % | | | 57 | % | | | 62 | % | | | 69 | % | | | 75 | % | |
Notes to Financial Highlights
(a) In addition to the fees and expenses which the Fund bears directly, the Fund indirectly bears a pro rata share of the fees and expenses of the acquired funds in which it invests. Such indirect expenses are not included in the reported expense ratios.
(b) Annualized.
(c) Total net expenses include the impact of certain waivers/reimbursements made by the Investment Manager and certain of its affiliates, if applicable.
(d) The benefits derived from expense reductions had an impact of less than 0.01%.
The accompanying Notes to Financial Statements are an integral part of this statement.
Semiannual Report 2013
30
Columbia Global Bond Fund
Financial Highlights (continued)
| | | Six Months Ended
April 30, 2013 | | Year Ended October 31, | |
Class B | | (Unaudited) | | 2012 | | 2011 | | 2010 | | 2009 | | 2008 | |
Per share data | |
Net asset value, beginning of period | | $ | 7.28 | | | $ | 7.41 | | | $ | 7.52 | | | $ | 7.14 | | | $ | 6.23 | | | $ | 6.96 | | |
Income from investment operations: | |
Net investment income | | | 0.05 | | | | 0.13 | | | | 0.16 | | | | 0.18 | | | | 0.13 | | | | 0.17 | | |
Net realized and unrealized gain (loss) | | | (0.09 | ) | | | 0.18 | | | | (0.04 | ) | | | 0.31 | | | | 1.15 | | | | (0.73 | ) | |
Total from investment operations | | | (0.04 | ) | | | 0.31 | | | | 0.12 | | | | 0.49 | | | | 1.28 | | | | (0.56 | ) | |
Less distributions to shareholders: | |
Net investment income | | | (0.42 | ) | | | (0.41 | ) | | | (0.23 | ) | | | (0.11 | ) | | | (0.37 | ) | | | (0.17 | ) | |
Net realized gains | | | (0.02 | ) | | | (0.03 | ) | | | — | | | | — | | | | — | | | | — | | |
Total distributions to shareholders | | | (0.44 | ) | | | (0.44 | ) | | | (0.23 | ) | | | (0.11 | ) | | | (0.37 | ) | | | (0.17 | ) | |
Net asset value, end of period | | $ | 6.80 | | | $ | 7.28 | | | $ | 7.41 | | | $ | 7.52 | | | $ | 7.14 | | | $ | 6.23 | | |
Total return | | | (0.65 | %) | | | 4.50 | % | | | 1.72 | % | | | 6.89 | % | | | 21.14 | % | | | (8.28 | %) | |
Ratios to average net assets(a) | |
Total gross expenses | | | 2.13 | %(b) | | | 2.10 | % | | | 2.12 | % | | | 2.10 | % | | | 2.13 | % | | | 2.09 | % | |
Total net expenses(c) | | | 1.87 | %(b) | | | 1.90 | %(d) | | | 1.96 | %(d) | | | 2.02 | % | | | 2.01 | % | | | 2.01 | % | |
Net investment income | | | 1.47 | %(b) | | | 1.79 | % | | | 2.22 | % | | | 2.58 | % | | | 2.00 | % | | | 2.49 | % | |
Supplemental data | |
Net assets, end of period (in thousands) | | $ | 4,964 | | | $ | 5,819 | | | $ | 9,836 | | | $ | 18,513 | | | $ | 29,977 | | | $ | 42,400 | | |
Portfolio turnover | | | 31 | % | | | 34 | % | | | 57 | % | | | 62 | % | | | 69 | % | | | 75 | % | |
Notes to Financial Highlights
(a) In addition to the fees and expenses which the Fund bears directly, the Fund indirectly bears a pro rata share of the fees and expenses of the acquired funds in which it invests. Such indirect expenses are not included in the reported expense ratios.
(b) Annualized.
(c) Total net expenses include the impact of certain waivers/reimbursements made by the Investment Manager and certain of its affiliates, if applicable.
(d) The benefits derived from expense reductions had an impact of less than 0.01%.
The accompanying Notes to Financial Statements are an integral part of this statement.
Semiannual Report 2013
31
Columbia Global Bond Fund
Financial Highlights (continued)
| | | Six Months Ended
April 30, 2013 | | Year Ended October 31, | |
Class C | | (Unaudited) | | 2012 | | 2011 | | 2010 | | 2009 | | 2008 | |
Per share data | |
Net asset value, beginning of period | | $ | 7.19 | | | $ | 7.33 | | | $ | 7.45 | | | $ | 7.08 | | | $ | 6.18 | | | $ | 6.91 | | |
Income from investment operations: | |
Net investment income | | | 0.05 | | | | 0.12 | | | | 0.16 | | | | 0.18 | | | | 0.13 | | | | 0.17 | | |
Net realized and unrealized gain (loss) | | | (0.08 | ) | | | 0.18 | | | | (0.04 | ) | | | 0.31 | | | | 1.14 | | | | (0.73 | ) | |
Total from investment operations | | | (0.03 | ) | | | 0.30 | | | | 0.12 | | | | 0.49 | | | | 1.27 | | | | (0.56 | ) | |
Less distributions to shareholders: | |
Net investment income | | | (0.42 | ) | | | (0.41 | ) | | | (0.24 | ) | | | (0.12 | ) | | | (0.37 | ) | | | (0.17 | ) | |
Net realized gains | | | (0.02 | ) | | | (0.03 | ) | | | — | | | | — | | | | — | | | | — | | |
Total distributions to shareholders | | | (0.44 | ) | | | (0.44 | ) | | | (0.24 | ) | | | (0.12 | ) | | | (0.37 | ) | | | (0.17 | ) | |
Net asset value, end of period | | $ | 6.72 | | | $ | 7.19 | | | $ | 7.33 | | | $ | 7.45 | | | $ | 7.08 | | | $ | 6.18 | | |
Total return | | | (0.50 | %) | | | 4.42 | % | | | 1.70 | % | | | 6.95 | % | | | 21.15 | % | | | (8.27 | %) | |
Ratios to average net assets(a) | |
Total gross expenses | | | 2.13 | %(b) | | | 2.09 | % | | | 2.10 | % | | | 2.10 | % | | | 2.12 | % | | | 2.08 | % | |
Total net expenses(c) | | | 1.87 | %(b) | | | 1.90 | %(d) | | | 1.95 | %(d) | | | 2.01 | % | | | 2.01 | % | | | 2.01 | % | |
Net investment income | | | 1.47 | %(b) | | | 1.73 | % | | | 2.21 | % | | | 2.58 | % | | | 1.94 | % | | | 2.51 | % | |
Supplemental data | |
Net assets, end of period (in thousands) | | $ | 8,652 | | | $ | 8,481 | | | $ | 5,926 | | | $ | 6,162 | | | $ | 5,557 | | | $ | 4,295 | | |
Portfolio turnover | | | 31 | % | | | 34 | % | | | 57 | % | | | 62 | % | | | 69 | % | | | 75 | % | |
Notes to Financial Highlights
(a) In addition to the fees and expenses which the Fund bears directly, the Fund indirectly bears a pro rata share of the fees and expenses of the acquired funds in which it invests. Such indirect expenses are not included in the reported expense ratios.
(b) Annualized.
(c) Total net expenses include the impact of certain waivers/reimbursements made by the Investment Manager and certain of its affiliates, if applicable.
(d) The benefits derived from expense reductions had an impact of less than 0.01%.
The accompanying Notes to Financial Statements are an integral part of this statement.
Semiannual Report 2013
32
Columbia Global Bond Fund
Financial Highlights (continued)
| | | Six Months Ended
April 30, 2013 | | Year Ended October 31, | |
Class I | | (Unaudited) | | 2012 | | 2011 | | 2010 | | 2009 | | 2008 | |
Per share data | |
Net asset value, beginning of period | | $ | 7.19 | | | $ | 7.36 | | | $ | 7.48 | | | $ | 7.11 | | | $ | 6.14 | | | $ | 6.87 | | |
Income from investment operations: | |
Net investment income | | | 0.09 | | | | 0.21 | | | | 0.25 | | | | 0.26 | | | | 0.20 | | | | 0.25 | | |
Net realized and unrealized gain (loss) | | | (0.09 | ) | | | 0.17 | | | | (0.05 | ) | | | 0.31 | | | | 1.15 | | | | (0.73 | ) | |
Total from investment operations | | | — | | | | 0.38 | | | | 0.20 | | | | 0.57 | | | | 1.35 | | | | (0.48 | ) | |
Less distributions to shareholders: | |
Net investment income | | | (0.46 | ) | | | (0.52 | ) | | | (0.32 | ) | | | (0.20 | ) | | | (0.38 | ) | | | (0.25 | ) | |
Net realized gains | | | (0.02 | ) | | | (0.03 | ) | | | — | | | | — | | | | — | | | | — | | |
Total distributions to shareholders | | | (0.48 | ) | | | (0.55 | ) | | | (0.32 | ) | | | (0.20 | ) | | | (0.38 | ) | | | (0.25 | ) | |
Net asset value, end of period | | $ | 6.71 | | | $ | 7.19 | | | $ | 7.36 | | | $ | 7.48 | | | $ | 7.11 | | | $ | 6.14 | | |
Total return | | | (0.10 | %) | | | 5.63 | % | | | 2.94 | % | | | 8.16 | % | | | 22.83 | % | | | (7.30 | %) | |
Ratios to average net assets(a) | |
Total gross expenses | | | 0.79 | %(b) | | | 0.77 | % | | | 0.82 | % | | | 0.86 | % | | | 0.86 | % | | | 0.85 | % | |
Total net expenses(c) | | | 0.67 | %(b) | | | 0.71 | % | | | 0.76 | % | | | 0.82 | % | | | 0.82 | % | | | 0.82 | % | |
Net investment income | | | 2.66 | %(b) | | | 3.02 | % | | | 3.40 | % | | | 3.70 | % | | | 3.16 | % | | | 3.68 | % | |
Supplemental data | |
Net assets, end of period (in thousands) | | $ | 10 | | | $ | 10 | | | $ | 3,369 | | | $ | 195,613 | | | $ | 169,717 | | | $ | 205,798 | | |
Portfolio turnover | | | 31 | % | | | 34 | % | | | 57 | % | | | 62 | % | | | 69 | % | | | 75 | % | |
Notes to Financial Highlights
(a) In addition to the fees and expenses which the Fund bears directly, the Fund indirectly bears a pro rata share of the fees and expenses of the acquired funds in which it invests. Such indirect expenses are not included in the reported expense ratios.
(b) Annualized.
(c) Total net expenses include the impact of certain waivers/reimbursements made by the Investment Manager and certain of its affiliates, if applicable.
The accompanying Notes to Financial Statements are an integral part of this statement.
Semiannual Report 2013
33
Columbia Global Bond Fund
Financial Highlights (continued)
| | | Six Months Ended
April 30, 2013 | | Year Ended October 31, | |
Class K | | (Unaudited) | | 2012 | | 2011 | | 2010 | | 2009 | | 2008 | |
Per share data | |
Net asset value, beginning of period | | $ | 7.23 | | | $ | 7.36 | | | $ | 7.48 | | | $ | 7.11 | | | $ | 6.16 | | | $ | 6.89 | | |
Income from investment operations: | |
Net investment income | | | 0.08 | | | | 0.19 | | | | 0.23 | | | | 0.24 | | | | 0.18 | | | | 0.25 | | |
Net realized and unrealized gain (loss) | | | (0.09 | ) | | | 0.18 | | | | (0.05 | ) | | | 0.31 | | | | 1.15 | | | | (0.72 | ) | |
Total from investment operations | | | (0.01 | ) | | | 0.37 | | | | 0.18 | | | | 0.55 | | | | 1.33 | | | | (0.47 | ) | |
Less distributions to shareholders: | |
Net investment income | | | (0.45 | ) | | | (0.47 | ) | | | (0.30 | ) | | | (0.18 | ) | | | (0.38 | ) | | | (0.26 | ) | |
Net realized gains | | | (0.02 | ) | | | (0.03 | ) | | | — | | | | — | | | | — | | | | — | | |
Total distributions to shareholders | | | (0.47 | ) | | | (0.50 | ) | | | (0.30 | ) | | | (0.18 | ) | | | (0.38 | ) | | | (0.26 | ) | |
Net asset value, end of period | | $ | 6.75 | | | $ | 7.23 | | | $ | 7.36 | | | $ | 7.48 | | | $ | 7.11 | | | $ | 6.16 | | |
Total return | | | (0.25 | %) | | | 5.39 | % | | | 2.60 | % | | | 7.85 | % | | | 22.42 | % | | | (7.19 | %) | |
Ratios to average net assets(a) | |
Total gross expenses | | | 1.09 | %(b) | | | 1.08 | % | | | 1.12 | % | | | 1.18 | % | | | 1.16 | % | | | 1.14 | % | |
Total net expenses(c) | | | 0.97 | %(b) | | | 1.00 | % | | | 1.06 | % | | | 1.12 | % | | | 1.06 | % | | | 0.87 | % | |
Net investment income | | | 2.38 | %(b) | | | 2.65 | % | | | 3.10 | % | | | 3.35 | % | | | 2.86 | % | | | 3.64 | % | |
Supplemental data | |
Net assets, end of period (in thousands) | | $ | 325 | | | $ | 410 | | | $ | 291 | | | $ | 407 | | | $ | 169 | | | $ | 118 | | |
Portfolio turnover | | | 31 | % | | | 34 | % | | | 57 | % | | | 62 | % | | | 69 | % | | | 75 | % | |
Notes to Financial Highlights
(a) In addition to the fees and expenses which the Fund bears directly, the Fund indirectly bears a pro rata share of the fees and expenses of the acquired funds in which it invests. Such indirect expenses are not included in the reported expense ratios.
(b) Annualized.
(c) Total net expenses include the impact of certain waivers/reimbursements made by the Investment Manager and certain of its affiliates, if applicable.
The accompanying Notes to Financial Statements are an integral part of this statement.
Semiannual Report 2013
34
Columbia Global Bond Fund
Financial Highlights (continued)
| | | Six Months Ended
April 30, 2013 | | Year Ended October 31, | |
Class R | | (Unaudited) | | 2012 | | 2011 | | 2010(a) | |
Per share data | |
Net asset value, beginning of period | | $ | 7.20 | | | $ | 7.34 | | | $ | 7.46 | | | $ | 6.98 | | |
Income from investment operations: | |
Net investment income | | | 0.07 | | | | 0.16 | | | | 0.20 | | | | 0.16 | | |
Net realized and unrealized gain (loss) | | | (0.09 | ) | | | 0.17 | | | | (0.05 | ) | | | 0.40 | | |
Total from investment operations | | | (0.02 | ) | | | 0.33 | | | | 0.15 | | | | 0.56 | | |
Less distributions to shareholders: | |
Net investment income | | | (0.43 | ) | | | (0.44 | ) | | | (0.27 | ) | | | (0.08 | ) | |
Net realized gains | | | (0.02 | ) | | | (0.03 | ) | | | — | | | | — | | |
Total distributions to shareholders | | | (0.45 | ) | | | (0.47 | ) | | | (0.27 | ) | | | (0.08 | ) | |
Net asset value, end of period | | $ | 6.73 | | | $ | 7.20 | | | $ | 7.34 | | | $ | 7.46 | | |
Total return | | | (0.29 | %) | | | 4.83 | % | | | 2.21 | % | | | 8.15 | % | |
Ratios to average net assets(b) | |
Total gross expenses | | | 1.66 | %(c) | | | 1.60 | % | | | 1.59 | % | | | 1.66 | %(c) | |
Total net expenses(d) | | | 1.37 | %(c) | | | 1.40 | % | | | 1.46 | % | | | 1.59 | %(c) | |
Net investment income | | | 1.98 | %(c) | | | 2.26 | % | | | 2.69 | % | | | 3.58 | %(c) | |
Supplemental data | |
Net assets, end of period (in thousands) | | $ | 5 | | | $ | 5 | | | $ | 5 | | | $ | 5 | | |
Portfolio turnover | | | 31 | % | | | 34 | % | | | 57 | % | | | 62 | % | |
Notes to Financial Highlights
(a) For the period from March 15, 2010 (commencement of operations) to October 31, 2010.
(b) In addition to the fees and expenses which the Fund bears directly, the Fund indirectly bears a pro rata share of the fees and expenses of the acquired funds in which it invests. Such indirect expenses are not included in the reported expense ratios.
(c) Annualized.
(d) Total net expenses include the impact of certain waivers/reimbursements made by the Investment Manager and certain of its affiliates, if applicable.
The accompanying Notes to Financial Statements are an integral part of this statement.
Semiannual Report 2013
35
Columbia Global Bond Fund
Financial Highlights (continued)
| | | Six Months Ended
April 30, 2013 | | Year Ended October 31, | |
Class W | | (Unaudited) | | 2012 | | 2011 | | 2010 | | 2009 | | 2008 | |
Per share data | |
Net asset value, beginning of period | | $ | 7.22 | | | $ | 7.35 | | | $ | 7.46 | | | $ | 7.09 | | | $ | 6.15 | | | $ | 6.88 | | |
Income from investment operations: | |
Net investment income | | | 0.08 | | | | 0.18 | | | | 0.22 | | | | 0.22 | | | | 0.17 | | | | 0.22 | | |
Net realized and unrealized gain (loss) | | | (0.11 | ) | | | 0.17 | | | | (0.04 | ) | | | 0.31 | | | | 1.14 | | | | (0.73 | ) | |
Total from investment operations | | | (0.03 | ) | | | 0.35 | | | | 0.18 | | | | 0.53 | | | | 1.31 | | | | (0.51 | ) | |
Less distributions to shareholders: | |
Net investment income | | | (0.43 | ) | | | (0.45 | ) | | | (0.29 | ) | | | (0.16 | ) | | | (0.37 | ) | | | (0.22 | ) | |
Net realized gains | | | (0.02 | ) | | | (0.03 | ) | | | — | | | | — | | | | — | | | | — | | |
Total distributions to shareholders | | | (0.45 | ) | | | (0.48 | ) | | | (0.29 | ) | | | (0.16 | ) | | | (0.37 | ) | | | (0.22 | ) | |
Net asset value, end of period | | $ | 6.74 | | | $ | 7.22 | | | $ | 7.35 | | | $ | 7.46 | | | $ | 7.09 | | | $ | 6.15 | | |
Total return | | | (0.47 | %) | | | 5.18 | % | | | 2.59 | % | | | 7.66 | % | | | 22.04 | % | | | (7.62 | %) | |
Ratios to average net assets(a) | |
Total gross expenses | | | 1.37 | %(b) | | | 1.34 | % | | | 1.36 | % | | | 1.31 | % | | | 1.30 | % | | | 1.30 | % | |
Total net expenses(c) | | | 1.13 | %(b) | | | 1.16 | %(d) | | | 1.21 | %(d) | | | 1.27 | % | | | 1.27 | % | | | 1.27 | % | |
Net investment income | | | 2.37 | %(b) | | | 2.56 | % | | | 2.95 | % | | | 3.15 | % | | | 2.70 | % | | | 3.27 | % | |
Supplemental data | |
Net assets, end of period (in thousands) | | $ | 189 | | | $ | 31,187 | | | $ | 52,531 | | | $ | 69,842 | | | $ | 60,278 | | | $ | 135,157 | | |
Portfolio turnover | | | 31 | % | | | 34 | % | | | 57 | % | | | 62 | % | | | 69 | % | | | 75 | % | |
Notes to Financial Highlights
(a) In addition to the fees and expenses which the Fund bears directly, the Fund indirectly bears a pro rata share of the fees and expenses of the acquired funds in which it invests. Such indirect expenses are not included in the reported expense ratios.
(b) Annualized.
(c) Total net expenses include the impact of certain waivers/reimbursements made by the Investment Manager and certain of its affiliates, if applicable.
(d) The benefits derived from expense reductions had an impact of less than 0.01%.
The accompanying Notes to Financial Statements are an integral part of this statement.
Semiannual Report 2013
36
Columbia Global Bond Fund
Financial Highlights (continued)
Class Y | | Six Months Ended
April 30, 2013(a)
(Unaudited) | |
Per share data | |
Net asset value, beginning of period | | $ | 7.20 | | |
Income from investment operations: | |
Net investment income | | | 0.09 | | |
Net realized and unrealized loss | | | (0.11 | ) | |
Total from investment operations | | | (0.02 | ) | |
Less distributions to shareholders: | |
Net investment income | | | (0.46 | ) | |
Net realized gains | | | (0.02 | ) | |
Total distributions to shareholders | | | (0.48 | ) | |
Net asset value, end of period | | $ | 6.70 | | |
Total return | | | (0.38 | %) | |
Ratios to average net assets(b) | |
Total gross expenses | | | 0.78 | %(c) | |
Total net expenses(d) | | | 0.67 | %(c) | |
Net investment income | | | 2.69 | %(c) | |
Supplemental data | |
Net assets, end of period (in thousands) | | $ | 2 | | |
Portfolio turnover | | | 31 | % | |
Notes to Financial Highlights
(a) For the period from November 8, 2012 (commencement of operations) to April 30, 2013.
(b) In addition to the fees and expenses which the Fund bears directly, the Fund indirectly bears a pro rata share of the fees and expenses of the acquired funds in which it invests. Such indirect expenses are not included in the reported expense ratios.
(c) Annualized.
(d) Total net expenses include the impact of certain waivers/reimbursements made by the Investment Manager and certain of its affiliates, if applicable.
The accompanying Notes to Financial Statements are an integral part of this statement.
Semiannual Report 2013
37
Columbia Global Bond Fund
Financial Highlights (continued)
| | | Six Months Ended
April 30, 2013 | | Year Ended October 31, | |
Class Z | | (Unaudited) | | 2012 | | 2011 | | 2010 | |
Per share data | |
Net asset value, beginning of period | | $ | 7.22 | | | $ | 7.36 | | | $ | 7.48 | | | $ | 7.33 | | |
Income from investment operations: | |
Net investment income | | | 0.08 | | | | 0.19 | | | | 0.23 | | | | 0.01 | | |
Net realized and unrealized gain (loss) | | | (0.08 | ) | | | 0.17 | | | | (0.03 | ) | | | 0.14 | | |
Total from investment operations | | | — | | | | 0.36 | | | | 0.20 | | | | 0.15 | | |
Less distributions to shareholders: | |
Net investment income | | | (0.45 | ) | | | (0.47 | ) | | | (0.32 | ) | | | — | | |
Net realized gains | | | (0.02 | ) | | | (0.03 | ) | | | — | | | | — | | |
Total distributions to shareholders | | | (0.47 | ) | | | (0.50 | ) | | | (0.32 | ) | | | — | | |
Net asset value, end of period | | $ | 6.75 | | | $ | 7.22 | | | $ | 7.36 | | | $ | 7.48 | | |
Total return | | | (0.06 | %) | | | 5.34 | % | | | 2.83 | % | | | 2.05 | % | |
Ratios to average net assets(a) | |
Total gross expenses | | | 1.15 | %(b) | | | 1.08 | % | | | 0.96 | % | | | 1.13 | %(b) | |
Total net expenses(c) | | | 0.86 | %(b) | | | 0.89 | %(d) | | | 0.94 | %(d) | | | 0.95 | %(b) | |
Net investment income | | | 2.52 | %(b) | | | 2.70 | % | | | 3.19 | % | | | 2.31 | %(b) | |
Supplemental data | |
Net assets, end of period (in thousands) | | $ | 3,728 | | | $ | 2,123 | | | $ | 768 | | | $ | 8 | | |
Portfolio turnover | | | 31 | % | | | 34 | % | | | 57 | % | | | 62 | % | |
Notes to Financial Highlights
(a) In addition to the fees and expenses which the Fund bears directly, the Fund indirectly bears a pro rata share of the fees and expenses of the acquired funds in which it invests. Such indirect expenses are not included in the reported expense ratios.
(b) Annualized.
(c) Total net expenses include the impact of certain waivers/reimbursements made by the Investment Manager and certain of its affiliates, if applicable.
(d) The benefits derived from expense reductions had an impact of less than 0.01%.
The accompanying Notes to Financial Statements are an integral part of this statement.
Semiannual Report 2013
38
Columbia Global Bond Fund
Notes to Financial Statements
April 30, 2013 (Unaudited)
Note 1. Organization
Columbia Global Bond Fund (the Fund), a series of Columbia Funds Series Trust II (the Trust), is a non-diversified fund. The Trust is registered under the Investment Company Act of 1940, as amended (the 1940 Act), as an open-end management investment company organized as a Massachusetts business trust.
Fund Shares
The Trust may issue an unlimited number of shares (without par value). The Fund offers Class A, Class B, Class C, Class I, Class K, Class R, Class W, Class Y and Class Z shares. All share classes have identical voting, dividend and liquidation rights. Each share class has its own expense structure and sales charges, as applicable.
Class A shares are subject to a maximum front-end sales charge of 4.75% based on the initial investment amount. Class A shares purchased without an initial sales charge in accounts aggregating $1 million to $50 million at the time of purchase are subject to a contingent deferred sales charge (CDSC) if the shares are sold within 18 months of purchase, charged as follows: 1.00% CDSC if redeemed within 12 months of purchase, and 0.50% CDSC if redeemed more than 12, but less than 18, months after purchase.
Class B shares may be subject to a maximum CDSC of 5.00% based upon the holding period after purchase. Class B shares will generally convert to Class A shares eight years after purchase. The Fund no longer accepts investments by new or existing investors in the Fund's Class B shares, except in connection with the reinvestment of any dividend and/or capital gain distributions in Class B shares of the Fund and exchanges by existing Class B shareholders of certain other funds within the Columbia Family of Funds.
Class C shares are subject to a 1.00% CDSC on shares redeemed within one year of purchase.
Class I shares are not subject to sales charges and are available only to the Columbia Family of Funds.
Class K shares are not subject to sales charges, however this share class is closed to new investors.
Class R shares are not subject to sales charges and are available only to certain retirement plans and other eligible investors.
Class W shares are not subject to sales charges and are available only to investors purchasing through authorized investment programs managed by investment professionals, including discretionary managed account programs.
Class Y shares are not subject to sales charges and are generally available only to certain retirement plans. Class Y shares commenced operations on November 8, 2012.
Class Z shares are not subject to sales charges, and are available only to certain investors.
Note 2. Summary of Significant Accounting Policies
Use of Estimates
The preparation of financial statements in accordance with U.S. generally accepted accounting principles (GAAP) requires management to make certain estimates and assumptions that affect the reported amounts of assets and liabilities, the disclosure of contingent assets and liabilities at the date of the financial statements and the reported amounts of revenue and expenses during the reporting period. Actual results could differ from those estimates.
The following is a summary of significant accounting policies consistently followed by the Fund in the preparation of its financial statements.
Security Valuation
Debt securities generally are valued by pricing services approved by the Board of Trustees (the Board) based upon market transactions for normal, institutional-size trading units of similar securities. The services may use various pricing techniques which take into account appropriate factors such as yield, quality, coupon rate, maturity, type of issue, trading characteristics and other data, as well as broker quotes. Debt securities for which quotations are readily available may also be valued based upon an over-the-counter or exchange bid quotation.
Asset and mortgage-backed securities are generally valued by pricing services, which utilize pricing models that incorporate the securities' cash flow and loan performance data. These models also take into account available market data, including trades, market quotations, and benchmark yield curves for identical or similar securities. Factors used to identify similar securities may include, but are not limited to, issuer, collateral type, vintage, prepayment speeds, collateral performance, credit ratings, credit enhancement and expected life. Asset-backed securities for which quotations are readily available may also be valued based upon an over-the-counter or exchange bid quotation.
Investments in other open-end investment companies, including money market funds, are valued at net asset value.
Short-term securities purchased within 60 days to maturity are valued at amortized cost, which approximates market value.
Semiannual Report 2013
39
Columbia Global Bond Fund
Notes to Financial Statements (continued)
April 30, 2013 (Unaudited)
The value of short-term securities originally purchased with maturities greater than 60 days is determined based on an amortized value to par upon reaching 60 days to maturity. Short-term securities maturing in more than 60 days from the valuation date are valued at the market price or approximate market value based on current interest rates.
Forward foreign currency exchange contracts are
marked-to-market based upon foreign currency exchange
rates provided by a pricing service.
Futures and options on futures contracts are valued based upon the settlement price established each day by the board of trade or exchange on which they are traded.
Investments for which market quotations are not readily available, or that have quotations which management believes are not reliable, are valued at fair value as determined in good faith under consistently applied procedures established by and under the general supervision of the Board. If a security or class of securities (such as foreign securities) is valued at fair value, such value is likely to be different from the last quoted market price for the security.
The determination of fair value often requires significant judgment. To determine fair value, management may use assumptions including but not limited to future cash flows and estimated risk premiums. Multiple inputs from various sources may be used to determine fair value.
Foreign Currency Transactions and Translations
The values of all assets and liabilities denominated in foreign currencies are translated into U.S. dollars at that day's exchange rates. Net realized and unrealized gains (losses) on foreign currency transactions and translations include gains (losses) arising from the fluctuation in exchange rates between trade and settlement dates on securities transactions, gains (losses) arising from the disposition of foreign currency and currency gains (losses) between the accrual and payment dates on dividends, interest income and foreign withholding taxes.
For financial statement purposes, the Fund does not distinguish that portion of gains (losses) on investments which is due to changes in foreign exchange rates from that which is due to changes in market prices of the investments. Such fluctuations are included with the net realized and unrealized gains (losses) on investments in the Statement of Operations.
Derivative Instruments
The Fund invests in certain derivative instruments, as detailed below, to meet its investment objectives. Derivatives are instruments whose values depend on, or are derived from, in whole or in part, the value of one or more other assets, such as securities, currencies, commodities or indices. Derivative
instruments may be used to maintain cash reserves while maintaining exposure to certain other assets, to offset anticipated declines in values of investments, to facilitate trading, to reduce transaction costs and to pursue higher investment returns. The Fund may also use derivative instruments to mitigate certain investment risks, such as foreign currency exchange rate risk, interest rate risk and credit risk. Derivatives may involve various risks, including the potential inability of the counterparty to fulfill its obligation under the terms of the contract, the potential for an illiquid secondary market and the potential for market movements which may expose the Fund to gains or losses in excess of the amount shown in the Statement of Assets and Liabilities.
The Fund and any counterparty are required to maintain an agreement that requires the Fund and that counterparty to monitor (on a daily basis) the net fair value of all derivatives entered into pursuant to the agreement between the Fund and such counterparty. If the net fair value of such derivatives between the Fund and that counterparty exceeds a certain threshold (as defined in the agreement), the Fund or the counterparty (as the case may be) is required to post cash and/or securities as collateral. Fair values of derivatives presented in the financial statements are not netted with the fair value of other derivatives or with any collateral amounts posted by the Fund or any counterparty.
Forward Foreign Currency Exchange Contracts
Forward foreign currency exchange contracts are agreements between two parties to buy and sell a currency at a set price on a future date. These contracts are intended to be used to minimize the exposure to foreign exchange rate fluctuations during the period between the trade and settlement dates of the contract. The Fund utilized forward foreign currency exchange contracts to hedge the currency exposure associated with some or all of the Fund's securities, to shift foreign currency exposure back to U.S. dollars, to shift investment exposure from one currency to another, and to shift U.S. dollar exposure to achieve a representative weighted mix of major currencies in its benchmark, and/or to recover an underweight country exposure in its portfolio and to create long and short currency exposures.
The values of forward foreign currency exchange contracts fluctuate with changes in foreign currency exchange rates. The Fund will record a realized gain or loss when the forward foreign currency exchange contract expires or is closed.
The use of forward foreign currency exchange contracts does not eliminate fluctuations in the prices of the Fund's portfolio securities. The risks of forward foreign currency exchange contracts include movement in the values of the
Semiannual Report 2013
40
Columbia Global Bond Fund
Notes to Financial Statements (continued)
April 30, 2013 (Unaudited)
foreign currencies relative to the U.S. dollar (or other foreign currencies) and the possibility that counterparties will not complete their contractual obligations, which may be in excess of the amount reflected, if any, in the Statement of Assets and Liabilities.
Futures Contracts
Futures contracts represent commitments for the future purchase or sale of an asset at a specified price on a specified date. The Fund bought and sold futures contracts to produce incremental earnings, manage the duration and yield curve exposure of the Fund versus the benchmark, manage exposure to movements in interest rates and to create long and short positions. Upon entering into futures contracts, the Fund bears risks which may include interest rates, exchange rates or securities prices moving unexpectedly, in which case, the Fund may not achieve the anticipated benefits of the futures contracts and may realize a loss. Additional risks include counterparty credit risk, the possibility of an illiquid market, and that a change in the value of the contract or option may not correlate with changes in the value of the underlying asset.
Upon entering into a futures contract, the Fund pledges cash or securities with the broker in an amount sufficient to meet the initial margin requirement. Subsequent payments (variation margin) are made or received by the Fund each day. The variation margin payments are equal to the daily change in the contract value and are recorded as variation margin receivable or payable and are offset in unrealized gains or losses. The Fund recognizes a realized gain or loss when the contract is closed or expires. Futures contracts involve, to varying degrees, risk of loss in excess of the variation margin disclosed in the Statement of Assets and Liabilities.
Effects of Derivative Transactions in the Financial Statements
The following tables are intended to provide additional information about the effect of derivatives on the financial statements of the Fund, including: the fair value of derivatives by risk category and the location of those fair values in the Statement of Assets and Liabilities; the impact of derivative transactions on the Fund's operations over the period including realized gains or losses and unrealized gains or losses. The derivative schedules following the Portfolio of Investments present additional information regarding derivative instruments outstanding at the end of the period, if any.
The following table is a summary of the fair value of derivative instruments at April 30, 2013:
Asset Derivatives | |
Risk Exposure
Category | | Statement of Assets and
Liabilities Location | | Fair Value ($) | |
Foreign exchange
contracts | | Unrealized appreciation on
forward foreign currency
exchange contracts | | | 494,300
| | |
Interest rate
contracts | | Net assets — unrealized
appreciation on futures
contracts | | | 41,213
| * | |
Total | | | | | 535,513 | | |
Liability Derivatives | |
Risk Exposure
Category | | Statement of Assets and
Liabilities Location | | Fair Value ($) | |
Foreign exchange
contracts | | Unrealized depreciation on
forward foreign currency
exchange contracts | | | 559,658
| | |
Interest rate
contracts | | Net assets — unrealized
depreciation on futures
contracts | | | 763,817
| * | |
Total | | | | | 1,323,475 | | |
*Includes cumulative appreciation (depreciation) of futures contracts as reported in the Futures Contracts Outstanding table following the Portfolio of Investments. Only the current day's variation margin is reported in receivables or payables in the Statement of Assets and Liabilities.
The effect of derivative instruments in the Statement of Operations for the six months ended April 30, 2013:
Amount of Realized Gain (Loss) on Derivatives Recognized in Income | |
Risk Exposure
Category | | Forward Foreign
Currency Exchange
Contracts ($) | | Futures
Contracts ($) | | Total ($) | |
Foreign exchange | | | (1,071,072 | ) | | | — | | | | (1,071,072)
contracts | | |
Interest rate
contracts | | | — | | | | 939,376 | | | | 939,376 | | |
Total | | | (1,071,072 | ) | | | 939,376 | | | | (131,696 | ) | |
Change in Unrealized Appreciation (Depreciation) on Derivatives
Recognized in Income | |
Risk Exposure
Category | | Forward Foreign
Currency Exchange
Contracts ($) | | Futures
Contracts ($) | | Total ($) | |
Foreign exchange
contracts | | | 203,433 | | | | — | | | | 203,433 | | |
Interest rate
contracts | | | — | | | | (773,711 | ) | | | (773,711 | ) | |
Total | | | 203,433 | | | | (773,711 | ) | | | (570,278 | ) | |
Semiannual Report 2013
41
Columbia Global Bond Fund
Notes to Financial Statements (continued)
April 30, 2013 (Unaudited)
The following table is a summary of the volume of derivative instruments for the six months ended April 30, 2013:
Derivative Instrument | | Contracts Opened | |
Forward foreign currency exchange contracts | | | 553 | | |
Futures contracts | | | 2,187 | | |
Delayed Delivery Securities
The Fund may trade securities on other than normal settlement terms, including securities purchased or sold on a "when-issued" basis. This may increase the risk if the other party to the transaction fails to deliver and causes the Fund to subsequently invest at less advantageous prices. The Fund designates cash or liquid securities in an amount equal to the delayed delivery commitment.
Treasury Inflation Protected Securities
The Fund may invest in treasury inflation protected securities (TIPS). The principal amount of TIPS is adjusted periodically and is increased for inflation or decreased for deflation based on a monthly published index. Interest payments are based on the adjusted principal at the time the interest is paid. These adjustments are recorded as interest income in the Statement of Operations.
Loan Participations and Commitments
The Fund may invest in loan participations. When the Fund purchases a loan participation, the Fund typically enters into a contractual relationship with the lender or third party selling such participation (Selling Participant), but not the borrower. However, the Fund assumes the credit risk of the borrower, Selling Participant and any other persons interpositioned between the Fund and the borrower. The Fund may not directly benefit from the collateral supporting the senior loan which it has purchased from the Selling Participant.
Security Transactions
Security transactions are accounted for on the trade date. Cost is determined and gains (losses) are based upon the specific identification method for both financial statement and federal income tax purposes.
Income Recognition
Interest income is recorded on an accrual basis. Market premiums and discounts, including original issue discounts, are amortized and accreted, respectively, over the expected life of the security on all debt securities, unless otherwise noted.
Dividend income is recorded on the ex-dividend date.
The value of additional securities received as an income payment is recorded as income and increases the cost basis of such securities.
Expenses
General expenses of the Trust are allocated to the Fund and other funds of the Trust based upon relative net assets or other expense allocation methodologies determined by the nature of the expense. Expenses directly attributable to the Fund are charged to the Fund. Expenses directly attributable to a specific class of shares are charged to that share class.
Determination of Class Net Asset Value
All income, expenses (other than class-specific expenses, which are charged to that share class, as shown in the Statement of Operations) and realized and unrealized gains (losses) are allocated to each class of the Fund on a daily basis, based on the relative net assets of each class, for purposes of determining the net asset value of each class.
Federal Income Tax Status
The Fund intends to qualify each year as a regulated investment company under Subchapter M of the Internal Revenue Code, as amended, and will distribute substantially all of its taxable income (including net short-term capital gains), if any, for its tax year, and as such will not be subject to federal income taxes. In addition, the Fund intends to distribute in each calendar year substantially all of its net investment income, capital gains and certain other amounts, if any, such that the Fund should not be subject to federal excise tax. Therefore, no federal income or excise tax provision is recorded.
Foreign Taxes
The Fund may be subject to foreign taxes on income, gains on investments or currency repatriation, a portion of which may be recoverable. The Fund will accrue such taxes and recoveries, as applicable, based upon its current interpretation of tax rules and regulations that exist in the markets in which it invests.
Realized gains in certain countries may be subject to foreign taxes at the Fund level, based on statutory rates. The Fund accrues for such foreign taxes on net realized and unrealized gains at the appropriate rate for each jurisdiction, as applicable. The amount, if any, is disclosed as a liability on the Statement of Assets and Liabilities.
Distributions to Shareholders
Distributions from net investment income, if any, are declared and paid each calendar quarter. Net realized capital gains, if any, are distributed at least annually. Income distributions and capital gain distributions are determined in accordance with federal income tax regulations, which may differ from GAAP.
Semiannual Report 2013
42
Columbia Global Bond Fund
Notes to Financial Statements (continued)
April 30, 2013 (Unaudited)
Guarantees and Indemnifications
Under the Trust's organizational documents and, in some cases, by contract, its officers and trustees are indemnified against certain liabilities arising out of the performance of their duties to the Trust or its funds. In addition, certain of the Fund's contracts with its service providers contain general indemnification clauses. The Fund's maximum exposure under these arrangements is unknown since the amount of any future claims that may be made against the Fund cannot be determined, and the Fund has no historical basis for predicting the likelihood of any such claims.
Recent Accounting Pronouncement
Disclosures about Offsetting Assets and Liabilities
In December 2011, the Financial Accounting Standards Board (FASB) issued Accounting Standards Update (ASU) No. 2011-11, Disclosures about Offsetting Assets and Liabilities and in January 2013, ASU No. 2013-1, Clarifying the Scope of Disclosures about Offsetting Assets and Liabilities (collectively, the ASUs). Specifically, the ASUs require an entity to disclose both gross and net information for derivatives and other financial instruments that are subject to a master netting arrangement or similar agreement. The ASUs require disclosure of collateral received in connection with the master netting agreements or similar agreements. The disclosure requirements are effective for interim and annual periods beginning on or after January 1, 2013. At this time, management is evaluating the implications of this guidance and the impact it will have on the financial statement amounts and footnote disclosures, if any.
Note 3. Fees and Compensation Paid to Affiliates
Investment Management Fees
Under an Investment Management Services Agreement, Columbia Management Investment Advisers, LLC (the Investment Manager), a wholly-owned subsidiary of Ameriprise Financial, Inc. (Ameriprise Financial), determines which securities will be purchased, held or sold. The investment management fee is an annual fee that is equal to a percentage of the Fund's average daily net assets that declines from 0.57% to 0.47% as the Fund's net assets increase. The annualized effective investment management fee rate for the six months ended April 30, 2013 was 0.57% of the Fund's average daily net assets.
Administration Fees
Under an Administrative Services Agreement, the Investment Manager also serves as the Fund Administrator. The Fund pays the Fund Administrator an annual fee for administration and
accounting services equal to a percentage of the Fund's average daily net assets that declines from 0.08% to 0.05% as the Fund's net assets increase. The annualized effective administration fee rate for the six months ended April 30, 2013 was 0.08% of the Fund's average daily net assets.
Other Expenses
Other expenses are for, among other things, certain expenses of the Fund or the Board, including: Fund boardroom and office expense, employee compensation, employee health and retirement benefits, and certain other expenses. Payment of these Fund and Board expenses is facilitated by a company providing limited administrative services to the Fund and the Board. For the six months ended April 30, 2013, other expenses paid to this company were $761.
Compensation of Board Members
Board members are compensated for their services to the Fund as disclosed in the Statement of Operations. Under a Deferred Compensation Plan (the Plan), the Board members who are not "interested persons" of the Fund, as defined under the 1940 Act, may elect to defer payment of up to 100% of their compensation. Deferred amounts are treated as though equivalent dollar amounts had been invested in shares of certain funds managed by the Investment Manager. The Fund's liability for these amounts is adjusted for market value changes and remains in the Fund until distributed in accordance with the Plan.
Transfer Agent Fees
Under a Transfer and Dividend Disbursing Agent Agreement, Columbia Management Investment Services Corp. (the Transfer Agent), an affiliate of the Investment Manager and a wholly-owned subsidiary of Ameriprise Financial, is responsible for providing transfer agency services to the Fund. The Transfer Agent has contracted with Boston Financial Data Services (BFDS) to serve as sub-transfer agent.
The Transfer Agent receives monthly account-based service fees based on the number of open accounts and also receives sub-transfer agency fees based on a percentage of the average aggregate value of the Fund's shares maintained in each such omnibus account (other than omnibus accounts for which American Enterprise Investment Services Inc. is the broker of record or accounts where the beneficial shareholder is a customer of Ameriprise Financial Services, Inc., which are paid a per account fee). The Transfer Agent pays the fees of BFDS for services as sub-transfer agent and is not entitled to reimbursement for such fees from the Fund (with the exception of out-of-pocket fees).
Semiannual Report 2013
43
Columbia Global Bond Fund
Notes to Financial Statements (continued)
April 30, 2013 (Unaudited)
The Transfer Agent also receives compensation from fees for various shareholder services and reimbursements for certain out-of-pocket fees. Class I shares do not pay transfer agent fees. Total transfer agent fees for Class K shares are subject to an annual limitation of not more than 0.05% of the average daily net assets attributable to Class K shares. Beginning November 8, 2012, Class Y shares are not subject to transfer agent fees for at least twelve months.
For the six months ended April 30, 2013, the Fund's annualized effective transfer agent fee rates as a percentage of average daily net assets of each class were as follows:
Class A | | | 0.34 | % | |
Class B | | | 0.34 | | |
Class C | | | 0.34 | | |
Class K | | | 0.05 | | |
Class R | | | 0.35 | | |
Class W | | | 0.34 | | |
Class Z | | | 0.34 | | |
An annual minimum account balance fee of $20 may apply to certain accounts with a value below the Fund's initial minimum investment requirements to reduce the impact of small accounts on transfer agent fees. These minimum account balance fees are recorded as part of expense reductions in the Statement of Operations. For the six months ended April 30, 2013, no minimum account balance fees were charged by the Fund.
Plan Administration Fees
Under a Plan Administration Services Agreement with the Transfer Agent, the Fund pays an annual fee at a rate of 0.25% of the Fund's average daily net assets attributable to Class K shares for the provision of various administrative, recordkeeping, communication and educational services.
Distribution Fees
The Fund has an agreement with Columbia Management Investment Distributors, Inc. (the Distributor), an affiliate of the Investment Manager and a wholly-owned subsidiary of Ameriprise Financial, for distribution and shareholder services. Under a Plan and Agreement of Distribution pursuant to Rule 12b-1, the Fund pays a fee at an annual rate of up to 0.25% of the Fund's average daily net assets attributable to Class A and Class W shares, a fee at an annual rate of up to 0.50% of the Fund's average daily net assets attributable to Class R shares (of which up to 0.25% may be used for shareholder services) and a fee at an annual rate of up to 1.00% of the Fund's average daily net assets attributable to Class B and Class C shares. For Class B and Class C shares, of
the 1.00% fee, up to 0.75% is reimbursed for distribution expenses.
The amount of distribution expenses incurred by the Distributor and not yet reimbursed (unreimbursed expense) was approximately $782,000 and $101,000 for Class B and Class C shares, respectively. These amounts are based on the most recent information available as of March 31, 2013, and may be recovered from future payments under the distribution plan or CDSCs. To the extent the unreimbursed expense has been fully recovered, the distribution fee is reduced.
Sales Charges
Sales charges, including front-end charges and CDSCs, received by the Distributor for distributing Fund shares were $105,183 for Class A, $405 for Class B and $3,144 for Class C shares for the six months ended April 30, 2013.
Expenses Waived/Reimbursed by the Investment Manager and its Affiliates
The Investment Manager and certain of its affiliates have contractually agreed to waive fees and/or reimburse expenses (excluding certain fees and expenses described below) for the periods disclosed below, unless sooner terminated at the sole discretion of the Board, so that the Fund's net operating expenses, after giving effect to fees waived/expenses reimbursed and any balance credits and/or overdraft charges from the Fund's custodian, do not exceed the following annual rates as a percentage of the class' average daily net assets:
| | | March 1, 2013
through
February 28, 2014 | | Prior to
March 1, 2013 | |
Class A | | | 1.07 | % | | | 1.14 | % | |
Class B | | | 1.82 | | | | 1.89 | | |
Class C | | | 1.82 | | | | 1.89 | | |
Class I | | | 0.62 | | | | 0.69 | | |
Class K | | | 0.92 | | | | 0.99 | | |
Class R | | | 1.32 | | | | 1.39 | | |
Class W | | | 1.07 | | | | 1.14 | | |
Class Y | | | 0.62 | | | | 0.69 | | |
Class Z | | | 0.82 | | | | 0.89 | | |
Under the agreement governing these fee waivers and/or expense reimbursement arrangements, the following fees and expenses are excluded from the waiver/reimbursement commitment, and therefore will be paid by the Fund, if applicable: taxes (including foreign transaction taxes), expenses associated with investments in affiliated and non-affiliated pooled investment vehicles (including mutual funds and exchange traded funds), transaction costs and brokerage commissions, costs related to any securities lending program,
Semiannual Report 2013
44
Columbia Global Bond Fund
Notes to Financial Statements (continued)
April 30, 2013 (Unaudited)
dividend expenses associated with securities sold short, inverse floater program fees and expenses, transaction charges and interest on borrowed money, interest, extraordinary expenses and any other expenses the exclusion of which is specifically approved by the Board. This agreement may be modified or amended only with approval from all parties.
Note 4. Federal Tax Information
The timing and character of income and capital gain distributions are determined in accordance with income tax regulations, which may differ from GAAP because of temporary or permanent book to tax differences.
At April 30, 2013, the cost of investments for federal income tax purposes was approximately $189,304,000 and the aggregate gross approximate unrealized appreciation and depreciation based on that cost was:
Unrealized appreciation | | $ | 13,294,000 | | |
Unrealized depreciation | | | (556,000 | ) | |
Net unrealized appreciation | | $ | 12,738,000 | | |
Management of the Fund has concluded that there are no significant uncertain tax positions that would require recognition in the financial statements. However, management's conclusion may be subject to review and adjustment at a later date based on factors including, but not limited to, new tax laws, regulations, and administrative interpretations (including relevant court decisions). Generally, the Fund's federal tax returns for the prior three fiscal years remain subject to examination by the Internal Revenue Service.
Note 5. Portfolio Information
The cost of purchases and proceeds from sales of securities, excluding short-term obligations, aggregated to $66,891,082 and $107,061,858, respectively, for the six months ended April 30, 2013, of which $1,421,876 and $6,151,934, respectively, were U.S. government securities.
Note 6. Lending of Portfolio Securities
Effective December 19, 2012, the Fund no longer participates in securities lending activity. Prior to that date, the Fund participated, or was eligible to participate, in securities lending activity pursuant to a Master Securities Lending Agreement (the Agreement) with JPMorgan Chase Bank, N.A. (JPMorgan). The Agreement authorized JPMorgan as lending agent to lend securities to authorized borrowers in order to generate additional income on behalf of the Fund. Pursuant to the Agreement, the securities loaned were secured by cash or securities that either were issued or guaranteed as to principal and interest by the U.S. government, its agencies, authorities
or instrumentalities with value equal to at least 100% of the market value of the loaned securities. Any additional collateral required to maintain those levels due to market fluctuations of the loaned securities was requested to be delivered the following business day. Cash collateral received was invested by the lending agent on behalf of the Fund into authorized investments pursuant to the Agreement.
Pursuant to the Agreement, the Fund received income for lending its securities either in the form of fees or by earning interest on invested cash collateral, net of negotiated rebates paid to borrowers and fees paid to the lending agent for services provided and any other securities lending expenses. Net income earned from securities lending for the six months ended April 30, 2013 is disclosed in the Statement of Operations. The Fund continued to earn and accrue interest and dividends on the securities loaned.
Note 7. Affiliated Money Market Fund
The Fund invests its daily cash balances in Columbia Short-Term Cash Fund, an affiliated money market fund established for the exclusive use by the Fund and other affiliated funds. The income earned by the Fund from such investments is included as "Dividends — affiliated issuers" in the Statement of Operations. As an investing fund, the Fund indirectly bears its proportionate share of the expenses of Columbia Short-Term Cash Fund.
Note 8. Shareholder Concentration
At April 30, 2013, one unaffiliated shareholder account owned 24.8% of the outstanding shares of the Fund. The Fund has no knowledge about whether any portion of those shares was owned beneficially by such account. Subscription and redemption activity by concentrated accounts may have a significant effect on the operations of the Fund.
Note 9. Line of Credit
The Fund has entered into a revolving credit facility with a syndicate of banks led by JPMorgan whereby the Fund may borrow for the temporary funding of shareholder redemptions or for other temporary or emergency purposes. The credit facility agreement, as amended, which is a collective agreement between the Fund and certain other funds managed by the Investment Manager, severally and not jointly, permits collective borrowings up to $500 million. Interest is charged to each participating fund based on its borrowings at a rate equal to the higher of (i) the overnight federal funds rate plus 1.00% or (ii) the one-month LIBOR rate plus 1.00%. Each borrowing under the credit facility matures no later than 60 days after the date of borrowing. The Fund also pays a commitment fee
Semiannual Report 2013
45
Columbia Global Bond Fund
Notes to Financial Statements (continued)
April 30, 2013 (Unaudited)
equal to its pro rata share of the amount of the credit facility at a rate of 0.08% per annum.
The Fund had no borrowings during the six months ended April 30, 2013.
Note 10. Significant Risks
Non-Diversification Risk
A non-diversified fund is permitted to invest a greater percentage of its total assets in fewer issuers than a diversified fund. The Fund may, therefore, have a greater risk of loss from a few issuers than a similar fund that invests more broadly.
Foreign Securities Risk
Investing in foreign securities may include certain risks and considerations not typically associated with investing in U.S. securities, such as fluctuating currency values and changing local and regional economic, political and social conditions, which may result in greater market volatility. In addition, certain foreign securities may not be as liquid as U.S. securities. Investing in emerging markets may accentuate these risks.
Investments in emerging market countries are subject to additional risk. The risk of foreign investments is typically increased in less developed countries. These countries are also more likely to experience high levels of inflation, deflation or currency devaluation which could hurt their economies and securities markets.
Geographic Concentration Risk
The Fund may be particularly susceptible to economic, political, regulatory or other events or conditions affecting issuers and countries within the specific geographic regions in which the Fund invests. Currency devaluation could occur in countries that have not yet experienced currency devaluation to date, or could continue to occur in countries that have already experienced such devaluations. As a result, the Fund may be more volatile than a more geographically diversified fund.
Derivatives Risk
Losses involving derivative instruments may be substantial, because a relatively small price movement in the underlying security(ies) instrument, commodity, currency or index may result in a substantial loss for the Fund. In addition to the potential for increased losses, the use of derivative instruments may lead to increased volatility within the Fund. Derivatives will typically increase the Fund's exposure to principal risks to which it is otherwise exposed, and may expose the Fund to additional risks, including correlation risk, counterparty risk, hedging risk, leverage risk and liquidity risk.
Note 11. Subsequent Events
Management has evaluated the events and transactions that have occurred through the date the financial statements were issued and noted no items requiring adjustment of the financial statements or additional disclosure.
Note 12. Information Regarding Pending and Settled Legal Proceedings
In December 2005, without admitting or denying the allegations, American Express Financial Corporation (AEFC, which is now known as Ameriprise Financial, Inc. (Ameriprise Financial)) entered into settlement agreements with the Securities and Exchange Commission (SEC) and Minnesota Department of Commerce (MDOC) related to market timing activities. As a result, AEFC was censured and ordered to cease and desist from committing or causing any violations of certain provisions of the Investment Advisers Act of 1940, the Investment Company Act of 1940, and various Minnesota laws. AEFC agreed to pay disgorgement of $10 million and civil money penalties of $7 million. AEFC also agreed to retain an independent distribution consultant to assist in developing a plan for distribution of all disgorgement and civil penalties ordered by the SEC in accordance with various undertakings detailed at www.sec.gov/litigation/admin/ia-2451.pdf. Ameriprise Financial and its affiliates have cooperated with the SEC and the MDOC in these legal proceedings, and have made regular reports to the funds' Boards of Trustees.
Ameriprise Financial and certain of its affiliates have historically been involved in a number of legal, arbitration and regulatory proceedings, including routine litigation, class actions, and governmental actions, concerning matters arising in connection with the conduct of their business activities. Ameriprise Financial believes that the Funds are not currently the subject of, and that neither Ameriprise Financial nor any of its affiliates are the subject of, any pending legal, arbitration or regulatory proceedings that are likely to have a material adverse effect on the Funds or the ability of Ameriprise Financial or its affiliates to perform under their contracts with the Funds. Ameriprise Financial is required to make 10-Q, 10-K and, as necessary, 8-K filings with the Securities and Exchange Commission on legal and regulatory matters that relate to Ameriprise Financial and its affiliates. Copies of these filings may be obtained by accessing the SEC website at www.sec.gov.
There can be no assurance that these matters, or the adverse publicity associated with them, will not result in increased fund redemptions, reduced sale of fund shares or other adverse consequences to the Funds. Further, although we believe proceedings are not likely to have a material adverse effect on the Funds or the ability of Ameriprise Financial or its affiliates to perform under their contracts with the Funds, these proceedings are subject to uncertainties and, as such, we are unable to estimate the possible loss or range of loss that may result. An adverse outcome in one or more of these proceedings could result in adverse judgments, settlements, fines, penalties or other relief that could have a material adverse effect on the consolidated financial condition or results of operations of Ameriprise Financial.
Semiannual Report 2013
46
Columbia Global Bond Fund
Approval of Investment Management Services
Agreement
Columbia Management Investment Advisers, LLC (Columbia Management or the Investment Manager), a wholly-owned subsidiary of Ameriprise Financial, Inc. (Ameriprise Financial), serves as the investment manager to Columbia Global Bond Fund (the Fund). Under an investment management services agreement (the IMS Agreement), Columbia Management provides investment advice and other services to the Fund and other funds distributed by Columbia Management Investment Distributors, Inc. (collectively, the Funds).
On an annual basis, the Fund's Board of Trustees (the Board), including the independent Board members (the Independent Trustees), considers renewal of the IMS Agreement. Columbia Management prepared detailed reports for the Board and its Contracts Committee in January, March and April 2013, including reports based on analyses of data provided by an independent organization and a comprehensive response to each item of information requested by independent legal counsel to the Independent Trustees (Independent Legal Counsel) in a letter to the Investment Manager, to assist the Board in making this determination. All of the materials presented in January, March and April were first supplied in draft form to designated representatives of the Independent Trustees, i.e., Independent Legal Counsel, the Chair of the Board and the Chair of the Contracts Committee, and the final materials (including proposed additional breakpoints in IMS fees for certain Funds) were revised to reflect discussion and subsequent requests made by the Contracts Committee. In addition, throughout the year, the Board (or its committees) regularly meets with portfolio management teams and senior management personnel, and reviews information prepared by Columbia Management addressing the services Columbia Management provides and Fund performance. Further, the Board retained an independent consulting firm (the Independent Consultant) to assist the Independent Trustees in their review of IMS fees, expense caps and Ameriprise Financial's profitability. The Board also accords particular weight to the work, deliberations and conclusions of the Contracts Committee, the Investment Review Committee and the Compliance Committee in determining whether to continue the IMS Agreement.
The Board, at its April 15-17, 2013 in-person Board meeting (the April Meeting), considered the renewal of the IMS Agreement for an additional one-year term. At the April Meeting, Independent Legal Counsel reviewed with the Independent Trustees various factors relevant to the Board's consideration of advisory agreements and the Board's legal responsibilities related to such consideration. Following an analysis and discussion of the factors identified below, the Board, including all of the Independent Trustees, approved the renewal of the IMS Agreement.
Nature, Extent and Quality of Services Provided by Columbia Management
The Independent Trustees analyzed various reports and presentations they had received detailing the services performed by Columbia Management, as well as its expertise, resources and capabilities. The Independent Trustees specifically considered many developments during the past year concerning the services provided by Columbia Management, including, in particular, the recent globalization initiative, which fosters increased worldwide investment support of global products, continued investment in upgrading technology (such as the implementation of new systems and hardware), the hiring of a Chief Interest Rate Strategist as part of Columbia Management's fixed income team and the addition of Columbia Management investment personnel to the Asset Allocation, Quantitative and Technology teams. The Independent Trustees noted the information they received concerning Columbia Management's ability to retain its key portfolio management personnel. In this regard, the Independent Trustees took into account their comprehensive discussions with Columbia Management's Chief Investment Officer (the CIO), observing the organizational depth of Columbia Management and the capabilities of its investment personnel. The Independent Trustees also recalled the information the CIO provided them identifying the strengths and areas for enhancement of each Columbia Management investment team, as well as the discussion with the CIO regarding the investment personnel talent being infused to enhance support for certain Funds. The Independent Trustees also observed the materials demonstrating the strength and depth of Columbia Management's equity and fixed income research departments.
In connection with the Board's evaluation of the overall package of services provided by Columbia Management, the Board also considered the quality of administrative services provided to the Fund by Columbia Management, recalling the information it received highlighting significant achievements in 2012 in the performance of administrative services (such as strong accounting performance measures, refined derivatives processing and enhancements to the electronic communications under the affiliated and unaffiliated service provider oversight program). In evaluating the quality of services provided under the IMS Agreement and the Fund's Administrative Service Agreement, the Independent Trustees also took into account the organization and strength of the Fund's and its service providers' compliance programs. In addition, the Board also reviewed the financial condition of Columbia Management (and its affiliates) and each entity's ability to carry out its responsibilities under the IMS Agreement and the Fund's other services agreements with affiliates of Ameriprise Financial, observing the financial strength of Ameriprise Financial, with its solid balance sheet. The Board also discussed the acceptability of the terms of the IMS Agreement (including the relatively broad scope of services required to
Semiannual Report 2013
47
Columbia Global Bond Fund
Approval of Investment Management Services
Agreement (continued)
be performed by Columbia Management). The Board concluded that the services being performed under the IMS Agreement were of a reasonably high quality.
Based on the foregoing, and based on other information received (both oral and written, including the information on investment performance referenced below) and other considerations, the Board concluded that Columbia Management and its affiliates were in a position to continue to provide a high quality and level of services to the Fund.
Investment Performance
For purposes of evaluating the nature, extent and quality of services provided under the IMS Agreement, the Board carefully reviewed the investment performance of the Fund. In this regard, the Board considered detailed reports providing the results of analyses performed by an independent organization showing, for various periods, the performance of the Fund, the performance of a benchmark index, the percentage ranking of the Fund among its comparison group and the net assets of the Fund. The Board observed the Fund's underperformance for certain periods, noting that appropriate steps are contemplated (such as the "global asset management initiative") in seeking to improve performance.
Comparative Fees, Costs of Services Provided and the Profits Realized By Columbia Management and its Affiliates from their Relationships with the Fund
The Board reviewed comparative fees and the costs of services to be provided under the IMS Agreement. The Board members considered detailed comparative information set forth in an annual report on fees and expenses, including, among other things, data (based on analyses conducted by an independent organization) showing a comparison of the Fund's expenses with median expenses paid by funds in its comparative peer universe, as well as data showing the Fund's contribution to Columbia Management's profitability.
The Board accorded particular weight to the notion that the level of fees should reflect a rational pricing model applied consistently across the various product lines in the Fund family, while assuring that the overall fees for each Fund (with few defined exceptions) are generally in line with the "pricing philosophy" (i.e., that the total expense ratio of the Fund is no higher than the median expense ratio of funds in the same comparison universe of the Fund). In this connection, the Board also considered the Independent Consultant's report that concluded that: (i) the Funds' standardized investment management fee rates, particularly in the context of the current competitive fee landscape, were within a reasonable range; and (ii) the Funds' expense cap philosophy of assuring that each Fund's total expense ratio is not above its peer universe median ratio is reasonable. The Board took into account that the Fund's total expense ratio (after considering proposed expense caps/waivers) approximated the peer universe's median expense ratio. Based on its review, the Board concluded that the Fund's management fee was fair and reasonable in light of the extent and quality of services that the Fund receives.
The Board also considered the expected profitability of Columbia Management and its affiliates in connection with Columbia Management providing investment management services to the Fund. In this regard, the Board referred to a detailed profitability report, discussing the profitability to Columbia Management and Ameriprise Financial from managing, operating and distributing the Funds. In this regard, the Board observed that 2012 profitability approximates 2011 profitability and that, as was the case in 2011, 2012 profitability remained generally in line with (and, in many cases, lower than) the reported profitability of other asset management firms. Further, the Board considered the Independent Consultant's report that concluded that Columbia Management's profitability, particularly in comparison to industry competitors, was reasonable and not excessive. It also took into account the indirect economic benefits flowing to Columbia Management or its affiliates in connection with managing or distributing the Funds, such as the enhanced ability to offer various other financial products to Ameriprise Financial customers, soft dollar benefits and overall reputational advantages. The Board noted that the fees paid by the Funds should permit the Investment Manager to offer competitive compensation to its personnel, make necessary investments in its business and earn an appropriate profit. The Board concluded that profitability levels were reasonable.
Economies of Scale to be Realized
The Board also considered the economies of scale that might be realized by Columbia Management as the Fund grows and took note of the extent to which Fund shareholders might also benefit from such growth. In this regard, the Independent Trustees took into account that IMS fees decline as Fund assets exceed various breakpoints, all of which have not been surpassed.
Based on the foregoing, the Board, including all of the Independent Trustees, concluded that the investment management service fees were fair and reasonable in light of the extent and quality of services provided. In reaching this conclusion, no single factor was determinative. On April 17, 2013, the Board, including all of the Independent Trustees, approved the renewal of the IMS Agreement.
Semiannual Report 2013
48
Columbia Global Bond Fund
Important Information About This Report
Each fund mails one shareholder report to each shareholder address. If you would like more than one report, please call shareholder services at 800.345.6611 and additional reports will be sent to you.
The policy of the Board is to vote the proxies of the companies in which each fund holds investments consistent with the procedures as stated in the Statement of Additional Information (SAI). You may obtain a copy of the SAI without charge by calling 800.345.6611; contacting your financial intermediary; visiting columbiamanagement.com; or searching the website of the Securities and Exchange Commission (SEC) at sec.gov. Information regarding how each fund voted proxies relating to portfolio securities is filed with the SEC by August 31 for the most recent 12-month period ending June 30 of that year, and is available without charge by visiting columbiamanagement.com; or searching the website of the SEC at sec.gov.
Each fund files a complete schedule of portfolio holdings with the SEC for the first and third quarters of each fiscal year on Form N-Q. Each fund's Form N-Q is available on the SEC's website at sec.gov and may be reviewed and copied at the SEC's Public Reference Room in Washington, D.C. Information on the operation of the Public Reference Room may be obtained by calling 800.SEC.0330. Each fund's complete schedule of portfolio holdings, as filed on Form N-Q, can also be obtained without charge, upon request, by calling 800.345.6611.
Semiannual Report 2013
49

Columbia Global Bond Fund
P.O. Box 8081
Boston, MA 02266-8081
columbiamanagement.com
This information is for use with concurrent or prior delivery of a fund prospectus. Please read and consider the investment objectives, risks, charges and expenses for any fund carefully before investing. For a prospectus which contains this and other important information about the Fund go to columbiamanagement.com. The Fund is distributed by Columbia Management Investment Distributors, Inc., member FINRA, and managed by Columbia Management Investment Advisers, LLC.
© 2013 Columbia Management Investment Advisers, LLC. All rights reserved.
SAR153_10_C01_(06/13)
Item 2. Code of Ethics.
Not applicable for semiannual reports.
Item 3. Audit Committee Financial Expert.
Not applicable for semiannual reports.
Item 4. Principal Accountant Fees and Services.
Not applicable for semiannual reports.
Item 5. Audit Committee of Listed Registrants.
Not applicable.
Item 6. Investments
| | (a) | The registrant’s “Schedule I – Investments in securities of unaffiliated issuers” (as set forth in 17 CFR 210.12-12) is included in Item 1 of this Form N-CSR. |
Item 7. Disclosure of Proxy Voting Policies and Procedures for Closed-End Management Investment Companies.
Not applicable.
Item 8. Portfolio Managers of Closed-End Management Investment Companies.
Not applicable.
Item 9. Purchases of Equity Securities by Closed-End Management Investment Company and Affiliated Purchasers.
Not applicable.
Item 10. Submission of Matters to a Vote of Security Holders.
There were no material changes to the procedures by which shareholders may recommend nominees to the registrant’s board of directors.
Item 11. Controls and Procedures.
| | (a) | The registrant’s principal executive officer and principal financial officers, based on their evaluation of the registrant’s disclosure controls and procedures as of a date within 90 days of the filing of this report, have concluded that such controls and procedures are adequately designed to ensure that material information required to be disclosed by the registrant in Form N-CSR is accumulated and communicated to the registrant’s management, including the principal executive officer and principal financial officer, or persons performing similar functions, as appropriate to allow timely decisions regarding required disclosure. |
| | (b) | There was no change in the registrant’s internal control over financial reporting that occurred during the registrant’s second fiscal quarter of the period covered by this report that has materially affected, or is reasonably likely to materially affect, the registrant’s internal control over financial reporting. |
Item 12. Exhibits.
(a)(1) Code of ethics required to be disclosed under Item 2 of Form N-CSR: Not applicable for semiannual reports.
(a)(2) Certifications pursuant to Rule 30a-2(a) under the Investment Company Act of 1940 (17 CFR 270.30a-2(a)) attached hereto as Exhibit 99.CERT.
(a)(3) Not applicable.
(b) Certification pursuant to Rule 30a-2(b) under the Investment Company Act of 1940 (17 CFR 270.30a-2(b)) attached hereto as Exhibit 99.906CERT.
SIGNATURES
Pursuant to the requirements of the Securities Exchange Act of 1934 and the Investment Company Act of 1940, the registrant has duly caused this report to be signed on its behalf by the undersigned, thereunto duly authorized.
| | | | |
| (registrant) | | Columbia Funds Series Trust II | | |
| | | | |
| | |
| By (Signature and Title) | | /s/ J. Kevin Connaughton | | |
| | J. Kevin Connaughton, President and Principal Executive Officer | | |
Pursuant to the requirements of the Securities Exchange Act of 1934 and the Investment Company Act of 1940, this report has been signed below by the following persons on behalf of the registrant and in the capacities and on the dates indicated.
| | | | |
| By (Signature and Title) | | /s/ J. Kevin Connaughton | | |
| | J. Kevin Connaughton, President and Principal Executive Officer | | |
| | | | |
| | |
| By (Signature and Title) | | /s/ Michael G. Clarke | | |
| | Michael G. Clarke, Treasurer and Chief Financial Officer | | |