UNITED STATES
SECURITIES AND EXCHANGE COMMISSION
Washington, D.C. 20549
FORM N-CSR
CERTIFIED SHAREHOLDER REPORT OF REGISTERED
MANAGEMENT INVESTMENT COMPANIES
Investment Company Act file number 811-21852
Columbia Funds Series Trust II
(Exact name of registrant as specified in charter)
50606 Ameriprise Financial Center, Minneapolis, Minnesota 55474
(Address of principal executive offices) (Zip code)
Christopher O. Petersen, Esq.
c/o Columbia Management
Investment Advisers, LLC
225 Franklin Street
Boston, MA 02110
(Name and address of agent for service)
Registrant’s telephone number, including area code: (800) 345-6611
Date of fiscal year end: February 28
Date of reporting period: August 31, 2013
Form N-CSR is to be used by management investment companies to file reports with the Commission not later than 10 days after the transmission to stockholders of any report that is required to be transmitted to stockholders under Rule 30e-1 under the Investment Company Act of 1940 (17 CFR 270.30e-1). The Commission may use the information provided on Form N-CSR in its regulatory, disclosure review, inspection, and policymaking roles.
A registrant is required to disclose the information specified by Form N-CSR, and the Commission will make this information public. A registrant is not required to respond to the collection of information contained in Form N-CSR unless the Form displays a currently valid Office of Management and Budget (“OMB”) control number. Please direct comments concerning the accuracy of the information collection burden estimate and any suggestions for reducing the burden to Secretary, Securities and Exchange Commission, 450 Fifth Street, NW, Washington, DC 20549-0609. The OMB has reviewed this collection of information under the clearance requirements of 44 U.S.C. § 3507.
Item 1. Reports to Stockholders.
| | |
Semiannual Report August 31, 2013 | |  |
| | |
Columbia Equity Value Fund | | |

President’s Message

Dear Shareholders,
A return to volatility
Volatility returned to the financial markets in the second quarter of 2013, as uncertainty about the global economy, monetary policy and the impact of the sequester’s spending cuts weighed on investors. Households advanced their spending but also allocated less to savings. Labor markets continued to crank out jobs at a steady pace, slowly reducing unemployment. Housing activity remained strong and retail sales were higher despite no real increase in income. The single weak spot was in the manufacturing sector, where activity slowed. While the consumer has weathered the domestic drag well, business has been closer to the global slowdown and effects of sequestration. Businesses remain very cautious, keeping inventories and staffs lean, and are planning for but not yet confident enough to make capital expenditures.
Against this backdrop, equities outperformed fixed income during the second quarter of 2013. Small-cap stocks outperformed large- and mid-cap stocks, and growth outperformed value except for in the large-cap sector. Outside the United States, foreign stock markets generally lost ground, with the most significant losses sustained by emerging markets.
Columbia Management to begin delivering summary prospectuses
Each Columbia fund is required to update its prospectus on an annual basis. Beginning with June 2013 prospectus updates, shareholders of Columbia retail mutual funds will start to receive a summary prospectus, rather than the full length (statutory) mutual fund prospectus they have received in the past.
Each fund’s summary prospectus will include the following key information:
| > | | Portfolio turnover rate information |
| > | | Principal investment strategies, principal risks and performance information |
| > | | Purchase and sale information |
| > | | Financial intermediary compensation information |
Each fund’s statutory prospectus will contain additional information about the fund and its risks. Both the statutory and summary prospectus will be updated each year, and will be available at columbiamanagement.com. Shareholders may request a printed version of a statutory prospectus at no cost by calling 800.345.6611 or sending an email to serviceinquiries@columbiamanagement.com.
Stay on track with Columbia Management
Backed by more than 100 years of experience, Columbia Management is one of the nation’s largest asset managers. At the heart of our success — and, most importantly, that of our investors — are highly talented industry professionals, brought together by a unique way of working. We are dedicated to helping you take advantage of today’s opportunities and anticipate tomorrow’s. We stay abreast of the latest investment trends and ideas, using our collective insight to evaluate events and transform them into solutions you can use.
Visit columbiamanagement.com for:
| > | | The Columbia Management Perspectives blog, featuring timely posts by our investment teams |
| > | | Detailed up-to-date fund performance and portfolio information |
| > | | Economic analysis and market commentary |
| > | | Quarterly fund commentaries |
| > | | Columbia Management Investor, our award-winning quarterly newsletter for shareholders |
Thank you for your continued support of the Columbia Funds. We look forward to serving your investment needs for many years to come.
Best Regards,

J. Kevin Connaughton
President, Columbia Funds
Investors should consider the investment objectives, risks, charges and expenses of a mutual fund carefully before investing. For a free prospectus, which contains this and other important information about a fund, visit columbiamanagement.com. The prospectus should be read carefully before investing.
Columbia Funds are distributed by Columbia Management Investment Distributors, Inc., member FINRA, and managed by Columbia Management Investment Advisers, LLC.
© 2013 Columbia Management Investment Advisers, LLC. All rights reserved.
Semiannual Report 2013
| | |
| |
| Columbia Equity Value Fund | | |
Table of Contents
Fund Investment Manager
Columbia Management Investment
Advisers, LLC
225 Franklin Street
Boston, MA 02110
Fund Distributor
Columbia Management Investment
Distributors, Inc.
225 Franklin Street
Boston, MA 02110
Fund Transfer Agent
Columbia Management Investment
Services Corp.
P.O. Box 8081
Boston, MA 02266-8081
For more information about any of the funds, please visit columbiamanagement.com or call 800.345.6611. Customer Service Representatives are available to answer your questions Monday through Friday from 8 a.m. to 8 p.m. Eastern time.
The views expressed in this report reflect the current views of the respective parties. These views are not guarantees of future performance and involve certain risks, uncertainties and assumptions that are difficult to predict, so actual outcomes and results may differ significantly from the views expressed. These views are subject to change at any time based upon economic, market or other conditions and the respective parties disclaim any responsibility to update such views. These views may not be relied on as investment advice and, because investment decisions for a Columbia Fund are based on numerous factors, may not be relied on as an indication of trading intent on behalf of any particular Columbia Fund. References to specific securities should not be construed as a recommendation or investment advice.
Semiannual Report 2013
| | |
| |
| | Columbia Equity Value Fund |
Performance Overview
(Unaudited)
Performance Summary
| > | | Columbia Equity Value Fund (the Fund) Class A shares returned 8.41% excluding sales charges for the six-month period that ended August 31, 2013. |
| > | | The Fund underperformed its benchmark, the Russell 1000 Value Index, which returned 8.79% for the same six-month period. |
| | | | | | | | | | | | | | | | | | |
Average Annual Total Returns (%) (for period ended August 31, 2013) | |
| | | Inception | | 6 Months
cumulative | | | 1 Year | | | 5 Years | | | 10 Years | |
Class A | | 03/20/95 | | | | | | | | | | | | | | | | |
Excluding sales charges | | | | | 8.41 | | | | 21.23 | | | | 5.03 | | | | 7.68 | |
Including sales charges | | | | | 2.18 | | | | 14.25 | | | | 3.79 | | | | 7.04 | |
Class B | | 05/14/84 | | | | | | | | | | | | | | | | |
Excluding sales charges | | | | | 7.94 | | | | 20.39 | | | | 4.25 | | | | 6.87 | |
Including sales charges | | | | | 2.94 | | | | 15.39 | | | | 3.90 | | | | 6.87 | |
Class C | | 06/26/00 | | | | | | | | | | | | | | | | |
Excluding sales charges | | | | | 7.99 | | | | 20.33 | | | | 4.24 | | | | 6.87 | |
Including sales charges | | | | | 6.99 | | | | 19.33 | | | | 4.24 | | | | 6.87 | |
Class I* | | 03/04/04 | | | 8.61 | | | | 21.75 | | | | 5.48 | | | | 8.11 | |
Class K | | 03/20/95 | | | 8.45 | | | | 21.41 | | | | 5.22 | | | | 7.86 | |
Class R* | | 12/11/06 | | | 8.22 | | | | 20.89 | | | | 4.77 | | | | 7.42 | |
Class R4* | | 12/11/06 | | | 8.52 | | | | 21.41 | | | | 5.09 | | | | 7.68 | |
Class R5* | | 12/11/06 | | | 8.60 | | | | 21.65 | | | | 5.47 | | | | 7.96 | |
Class W* | | 12/01/06 | | | 8.44 | | | | 21.28 | | | | 5.01 | | | | 7.64 | |
Class Y* | | 02/28/13 | | | 8.63 | | | | 21.48 | | | | 5.08 | | | | 7.70 | |
Class Z* | | 09/27/10 | | | 8.53 | | | | 21.61 | | | | 5.21 | | | | 7.77 | |
Russell 1000 Value Index | | | | | 8.79 | | | | 23.10 | | | | 6.69 | | | | 7.61 | |
Returns for Class A are shown with and without the maximum initial sales charge of 5.75%. Returns for Class B are shown with and without the applicable contingent deferred sales charge (CDSC) of 5.00% in the first year, declining to 1.00% in the sixth year and eliminated thereafter. Returns for Class C are shown with and without the 1.00% CDSC for the first year only. The Fund’s other classes are not subject to sales charges and have limited eligibility. Please see the Fund’s prospectus for details. Performance for different share classes will vary based on differences in sales charges and fees associated with each class. All results shown assume reinvestment of distributions during the period. Returns do not reflect the deduction of taxes that a shareholder may pay on Fund distributions or on the redemption of Fund shares. Performance results reflect the effect of any fee waivers or reimbursements of Fund expenses by Columbia Management Investment Advisers, LLC and/or any of its affiliates. Absent these fee waivers or expense reimbursement arrangements, performance results would have been lower.
The performance information shown represents past performance and is not a guarantee of future results. The investment return and principal value of your investment will fluctuate so that your shares, when redeemed, may be worth more or less than their original cost. Current performance may be lower or higher than the performance information shown. You may obtain performance information current to the most recent month-end by contacting your financial intermediary, visiting columbiamanagement.com or calling 800.345.6611.
| * | The returns shown for periods prior to the share class inception date (including returns for the Life of the Fund, if shown, which are since Fund inception) typically include the returns of the Fund’s oldest share class. Since the oldest share class of the Fund, Class B, are no longer available, Class A shares of the Fund were used. These returns are adjusted to reflect any higher class-related operating expenses of the newer share classes, as applicable. Please visit columbiamanagement.com/mutual-funds/appended-performance for more information. |
The Russell 1000 Value Index, an unmanaged index, measures the performance of those stocks in the Russell 1000 Index with lower price-to-book ratios and lower forecasted growth values.
Indices are not available for investment, are not professionally managed and do not reflect sales charges, fees, brokerage commissions, taxes or other expenses of investing. Securities in the Fund may not match those in an index.
| | |
| |
| Columbia Equity Value Fund | | |
Portfolio Overview
(Unaudited)
| | | | |
Top Ten Holdings (%)
(at August 31, 2013) | |
Chevron Corp. | | | 3.5 | |
JPMorgan Chase & Co. | | | 3.0 | |
General Electric Co. | | | 3.0 | |
Wells Fargo & Co. | | | 2.6 | |
Pfizer, Inc. | | | 2.6 | |
Citigroup, Inc. | | | 2.6 | |
Cisco Systems, Inc. | | | 2.4 | |
UnitedHealth Group, Inc. | | | 2.2 | |
Johnson & Johnson | | | 2.2 | |
Goldman Sachs Group, Inc. (The) | | | 2.2 | |
Percentages indicated are based upon total investments (excluding Money Market Funds).
For further detail about these holdings, please refer to the section entitled “Portfolio of Investments.”
Fund holdings are as of the date given, are subject to change at any time, and are not recommendations to buy or sell any security.
| | | | |
Portfolio Breakdown (%)
(at August 31, 2013) | |
Common Stocks | | | 97.4 | |
Consumer Discretionary | | | 7.0 | |
Consumer Staples | | | 6.5 | |
Energy | | | 10.5 | |
Financials | | | 25.4 | |
Health Care | | | 15.3 | |
Industrials | | | 13.4 | |
Information Technology | | | 12.6 | |
Materials | | | 2.5 | |
Telecommunication Services | | | 2.1 | |
Utilities | | | 2.1 | |
Money Market Funds | | | 2.6 | |
Total | | | 100.0 | |
Percentages indicated are based upon total investments. The Fund’s portfolio composition is subject to change.
Portfolio Management
Steven Schroll
Paul Stocking
Dean Ramos, CFA
Morningstar Style Box™
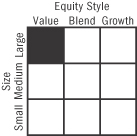
The Morningstar Style Box™ is based on a fund’s portfolio holdings. For equity funds, the vertical axis shows the market capitalization of the stocks owned, and the horizontal axis shows investment style (value, blend, or growth). Information shown is based on the most recent data provided by Morningstar.
© 2013 Morningstar, Inc. All rights reserved. The Morningstar information contained herein: (1) is proprietary to Morningstar and/or its content providers; (2) may not be copied or distributed; and (3) is not warranted to be accurate, complete or timely. Neither Morningstar nor its content providers are responsible for any damages or losses arising from any use of this information.
| | |
| |
| | Columbia Equity Value Fund |
Understanding Your Fund’s Expenses
(Unaudited)
As an investor, you incur two types of costs. There are transaction costs, which generally include sales charges on purchases and may include redemption fees. There are also ongoing costs, which generally include management fees, distribution and service (Rule 12b-1) fees, and other fund expenses. The following information is intended to help you understand your ongoing costs (in dollars) of investing in the Fund and to help you compare these costs with the ongoing costs of investing in other mutual funds.
Analyzing Your Fund’s Expenses
To illustrate these ongoing costs, we have provided examples and calculated the expenses paid by investors in each share class of the Fund during the period. The actual and hypothetical information in the table is based on an initial investment of $1,000 at the beginning of the period indicated and held for the entire period. Expense information is calculated two ways and each method provides you with different information. The amount listed in the “Actual” column is calculated using the Fund’s actual operating expenses and total return for the period. You may use the Actual information, together with the amount invested, to estimate the expenses that you paid over the period. Simply divide your account value by $1,000 (for example, an $8,600 account value divided by $1,000 = 8.6), then multiply the results by the expenses paid during the period under the Actual column. The amount listed in the “Hypothetical” column assumes a 5% annual rate of return before expenses (which is not the Fund’s actual return) and then applies the Fund’s actual expense ratio for the period to the hypothetical return. You should not use the hypothetical account values and expenses to estimate either your actual account balance at the end of the period or the expenses you paid during the period. See “Compare With Other Funds” below for details on how to use the hypothetical data.
Compare With Other Funds
Since all mutual funds are required to include the same hypothetical calculations about expenses in shareholder reports, you can use this information to compare the ongoing cost of investing in the Fund with other funds. To do so, compare the hypothetical example with the 5% hypothetical examples that appear in the shareholder reports of other funds. As you compare hypothetical examples of other funds, it is important to note that hypothetical examples are meant to highlight the ongoing costs of investing in a fund only and do not reflect any transaction costs, such as sales charges, or redemption or exchange fees. Therefore, the hypothetical calculations are useful in comparing ongoing costs only, and will not help you determine the relative total costs of owning different funds. If transaction costs were included in these calculations, your costs would be higher.
March 1, 2013 – August 31, 2013
| | | | | | | | | | | | | | | | | | | | | | | | | | | | |
| | | Account Value at the
Beginning of the
Period ($) | | | Account Value at the
End of the
Period ($) | | | Expenses Paid During
the Period ($) | | | Fund’s Annualized
Expense Ratio (%) | |
| | | | Actual | | | | Hypothetical | | | | Actual | | | | Hypothetical | | | | Actual | | | | Hypothetical | | | | Actual | |
Class A | | | 1,000.00 | | | | 1,000.00 | | | | 1,084.10 | | | | 1,019.15 | | | | 6.16 | | | | 5.97 | | | | 1.18 | |
Class B | | | 1,000.00 | | | | 1,000.00 | | | | 1,079.40 | | | | 1,015.39 | | | | 10.06 | | | | 9.75 | | | | 1.93 | |
Class C | | | 1,000.00 | | | | 1,000.00 | | | | 1,079.90 | | | | 1,015.39 | | | | 10.06 | | | | 9.75 | | | | 1.93 | |
Class I | | | 1,000.00 | | | | 1,000.00 | | | | 1,086.10 | | | | 1,021.86 | | | | 3.35 | | | | 3.24 | | | | 0.64 | |
Class K | | | 1,000.00 | | | | 1,000.00 | | | | 1,084.50 | | | | 1,019.85 | | | | 5.43 | | | | 5.27 | | | | 1.04 | |
Class R | | | 1,000.00 | | | | 1,000.00 | | | | 1,082.20 | | | | 1,017.90 | | | | 7.46 | | | | 7.23 | | | | 1.43 | |
Class R4 | | | 1,000.00 | | | | 1,000.00 | | | | 1,085.20 | | | | 1,020.41 | | | | 4.86 | | | | 4.71 | | | | 0.93 | |
Class R5 | | | 1,000.00 | | | | 1,000.00 | | | | 1,086.00 | | | | 1,021.11 | | | | 4.13 | | | | 4.00 | | | | 0.79 | |
Class W | | | 1,000.00 | | | | 1,000.00 | | | | 1,084.40 | | | | 1,019.15 | | | | 6.17 | | | | 5.97 | | | | 1.18 | |
Class Y | | | 1,000.00 | | | | 1,000.00 | | | | 1,086.30 | | | | 1,021.46 | | | | 3.75 | | | | 3.65 | | | | 0.72 | |
Class Z | | | 1,000.00 | | | | 1,000.00 | | | | 1,085.30 | | | | 1,020.41 | | | | 4.86 | | | | 4.71 | | | | 0.93 | |
Expenses paid during the period are equal to the annualized expense ratio for each class as indicated above, multiplied by the average account value over the period and then multiplied by the number of days in the Fund’s most recent fiscal half year and divided by 365.
Expenses do not include fees and expenses incurred indirectly by the Fund from the underlying funds in which the Fund may invest (also referred to as “acquired funds”), including affiliated and non-affiliated pooled investment vehicles (including mutual funds and exchange-traded funds).
Had Columbia Management Investment Advisers, LLC and/or certain of its affiliates not waived/reimbursed certain fees and expenses, account value at the end of the period would have been reduced.
| | |
| |
| Columbia Equity Value Fund | | |
Portfolio of Investments
August 31, 2013 (Unaudited)
(Percentages represent value of investments compared to net assets)
| | | | | | | | |
| Common Stocks 97.1% | |
| Issuer | | Shares | | | Value ($) | |
Consumer Discretionary 7.0% | |
Automobiles 1.5% | |
| | |
Ford Motor Co. | | | 1,107,554 | | | | 17,931,299 | |
|
Hotels, Restaurants & Leisure 0.4% | |
| | |
Royal Caribbean Cruises Ltd. | | | 126,870 | | | | 4,654,861 | |
|
Media 4.4% | |
| | |
Comcast Corp., Class A | | | 39,556 | | | | 1,664,912 | |
| | |
Omnicom Group, Inc. | | | 70,622 | | | | 4,283,224 | |
| | |
Reed Elsevier PLC | | | 266,643 | | | | 3,270,611 | |
| | |
Time Warner, Inc. | | | 248,565 | | | | 15,045,640 | |
| | |
Twenty-First Century Fox, Inc. | | | 122,495 | | | | 3,837,768 | |
| | |
Walt Disney Co. (The) | | | 333,180 | | | | 20,267,339 | |
| | |
WPP PLC | | | 178,482 | | | | 3,305,294 | |
| | | | | | | | | |
Total | | | | | | | 51,674,788 | |
|
Specialty Retail 0.7% | |
| | |
Gap, Inc. (The) | | | 66,698 | | | | 2,697,267 | |
| | |
Home Depot, Inc. (The) | | | 75,573 | | | | 5,629,433 | |
| | | | | | | | | |
Total | | | | | | | 8,326,700 | |
| | | | | | | | | |
Total Consumer Discretionary | | | | | | | 82,587,648 | |
| | |
| | | | | | | | |
Consumer Staples 6.4% | |
Beverages 0.3% | |
| | |
PepsiCo, Inc. | | | 44,043 | | | | 3,511,549 | |
|
Food & Staples Retailing 2.4% | |
| | |
CVS Caremark Corp. | | | 287,884 | | | | 16,711,666 | |
| | |
SYSCO Corp. | | | 245,076 | | | | 7,847,334 | |
| | |
Walgreen Co. | | | 76,189 | | | | 3,662,405 | |
| | | | | | | | | |
Total | | | | | | | 28,221,405 | |
|
Food Products 1.9% | |
| | |
Kellogg Co. | | | 95,229 | | | | 5,781,353 | |
| | |
Kraft Foods Group, Inc. | | | 85,254 | | | | 4,413,599 | |
| | |
Mead Johnson Nutrition Co. | | | 102,695 | | | | 7,705,206 | |
| | |
Mondelez International, Inc., Class A | | | 158,205 | | | | 4,852,147 | |
| | | | | | | | | |
Total | | | | | | | 22,752,305 | |
|
Household Products 1.1% | |
| | |
Procter & Gamble Co. (The) | | | 179,335 | | | | 13,968,403 | |
|
Tobacco 0.7% | |
| | |
Lorillard, Inc. | | | 85,666 | | | | 3,623,672 | |
| | |
Philip Morris International, Inc. | | | 52,903 | | | | 4,414,226 | |
| | | | | | | | | |
Total | | | | | | | 8,037,898 | |
| | | | | | | | | |
Total Consumer Staples | | | | | | | 76,491,560 | |
| | |
| | | | | | | | |
Energy 10.5% | |
Energy Equipment & Services 1.1% | |
| | |
Cameron International Corp.(a) | | | 130,513 | | | | 7,411,833 | |
| | | | | | | | |
| Common Stocks (continued) | |
| Issuer | | Shares | | | Value ($) | |
Schlumberger Ltd. | | | 74,952 | | | | 6,066,615 | |
| | | | | | | | | |
Total | | | | | | | 13,478,448 | |
|
Oil, Gas & Consumable Fuels 9.4% | |
| | |
Anadarko Petroleum Corp. | | | 76,484 | | | | 6,992,167 | |
| | |
Cameco Corp. | | | 83,716 | | | | 1,593,953 | |
| | |
Cameco Corp. | | | 138,040 | | | | 2,627,648 | |
| | |
Chevron Corp. | | | 339,302 | | | | 40,862,140 | |
| | |
Enbridge, Inc. | | | 62,162 | | | | 2,545,534 | |
| | |
EQT Corp. | | | 139,726 | | | | 11,977,313 | |
| | |
Occidental Petroleum Corp. | | | 108,507 | | | | 9,571,402 | |
| | |
Phillips 66 | | | 154,491 | | | | 8,821,436 | |
| | |
Pioneer Natural Resources Co. | | | 72,809 | | | | 12,739,391 | |
| | |
Suncor Energy, Inc. | | | 296,130 | | | | 10,029,923 | |
| | |
Valero Energy Corp. | | | 93,768 | | | | 3,331,577 | |
| | | | | | | | | |
Total | | | | | | | 111,092,484 | |
| | | | | | | | | |
Total Energy | | | | | | | 124,570,932 | |
| | |
| | | | | | | | |
Financials 25.3% | |
Capital Markets 3.9% | |
| | |
Bank of New York Mellon Corp. (The) | | | 124,931 | | | | 3,715,448 | |
| | |
BlackRock, Inc. | | | 20,974 | | | | 5,459,952 | |
| | |
Goldman Sachs Group, Inc. (The) | | | 163,194 | | | | 24,826,703 | |
| | |
Morgan Stanley | | | 490,223 | | | | 12,628,144 | |
| | | | | | | | | |
Total | | | | | | | 46,630,247 | |
|
Commercial Banks 6.0% | |
| | |
CIT Group, Inc.(a) | | | 170,507 | | | | 8,162,170 | |
| | |
Fifth Third Bancorp | | | 336,442 | | | | 6,153,524 | |
| | |
KeyCorp | | | 568,014 | | | | 6,628,723 | |
| | |
PNC Financial Services Group, Inc. (The) | | | 102,545 | | | | 7,410,927 | |
| | |
Regions Financial Corp. | | | 667,296 | | | | 6,272,583 | |
| | |
Wells Fargo & Co. | | | 737,185 | | | | 30,283,560 | |
| | |
Zions Bancorporation | | | 224,126 | | | | 6,268,804 | |
| | | | | | | | | |
Total | | | | | | | 71,180,291 | |
|
Consumer Finance 1.2% | |
| | |
Capital One Financial Corp. | | | 170,738 | | | | 11,021,138 | |
| | |
Discover Financial Services | | | 75,596 | | | | 3,571,911 | |
| | | | | | | | | |
Total | | | | | | | 14,593,049 | |
|
Diversified Financial Services 7.3% | |
| | |
Bank of America Corp. | | | 1,548,988 | | | | 21,871,711 | |
| | |
Citigroup, Inc. | | | 611,210 | | | | 29,539,779 | |
| | |
JPMorgan Chase & Co. | | | 690,324 | | | | 34,882,072 | |
| | | | | | | | | |
Total | | | | | | | 86,293,562 | |
|
Insurance 6.5% | |
| | |
ACE Ltd. | | | 218,129 | | | | 19,134,276 | |
The accompanying Notes to Financial Statements are an integral part of this statement.
| | |
| |
| | Columbia Equity Value Fund |
Portfolio of Investments (continued)
August 31, 2013 (Unaudited)
| | | | | | | | |
| Common Stocks (continued) | |
| Issuer | | Shares | | | Value ($) | |
Allstate Corp. (The) | | | 209,940 | | | | 10,060,325 | |
| | |
American International Group, Inc.(a) | | | 182,863 | | | | 8,495,815 | |
| | |
MetLife, Inc. | | | 354,813 | | | | 16,388,812 | |
| | |
Travelers Companies, Inc. (The) | | | 59,621 | | | | 4,763,718 | |
| | |
XL Group PLC | | | 629,613 | | | | 18,611,360 | |
| | | | | | | | | |
Total | | | | | | | 77,454,306 | |
|
Real Estate Investment Trusts (REITs) 0.4% | |
| | |
Weyerhaeuser Co. | | | 150,026 | | | | 4,107,712 | |
| | | | | | | | | |
Total Financials | | | | | | | 300,259,167 | |
| | |
| | | | | | | | |
Health Care 15.2% | |
Health Care Equipment & Supplies 2.7% | |
| | |
Abbott Laboratories | | | 370,835 | | | | 12,359,931 | |
| | |
Boston Scientific Corp.(a) | | | 1,314,949 | | | | 13,912,160 | |
| | |
Medtronic, Inc. | | | 113,723 | | | | 5,885,165 | |
| | | | | | | | | |
Total | | | | | | | 32,157,256 | |
|
Health Care Providers & Services 4.0% | |
| | |
Aetna, Inc. | | | 103,327 | | | | 6,549,899 | |
| | |
Cardinal Health, Inc. | | | 59,788 | | | | 3,006,141 | |
| | |
CHS/Community Health Systems, Inc. | | | 170,886 | | | | 6,708,984 | |
| | |
UnitedHealth Group, Inc. | | | 348,255 | | | | 24,983,814 | |
| | |
Universal Health Services, Inc., Class B | | | 96,006 | | | | 6,504,406 | |
| | | | | | | | | |
Total | | | | | | | 47,753,244 | |
|
Life Sciences Tools & Services 1.1% | |
| | |
Thermo Fisher Scientific, Inc. | | | 139,627 | | | | 12,403,066 | |
|
Pharmaceuticals 7.4% | |
| | |
Actavis, Inc.(a) | | | 44,595 | | | | 6,028,352 | |
| | |
Johnson & Johnson | | | 287,488 | | | | 24,841,838 | |
| | |
Merck & Co., Inc. | | | 269,291 | | | | 12,734,771 | |
| | |
Novartis AG, ADR | | | 93,261 | | | | 6,806,188 | |
| | |
Pfizer, Inc. | | | 1,066,692 | | | | 30,091,381 | |
| | |
Roche Holding AG, ADR | | | 125,421 | | | | 7,808,712 | |
| | | | | | | | | |
Total | | | | | | | 88,311,242 | |
| | | | | | | | | |
Total Health Care | | | | | | | 180,624,808 | |
| | |
| | | | | | | | |
Industrials 13.3% | |
Aerospace & Defense 3.7% | |
| | |
Boeing Co. (The) | | | 123,713 | | | | 12,856,255 | |
| | |
Honeywell International, Inc. | | | 197,007 | | | | 15,675,847 | |
| | |
United Technologies Corp. | | | 150,610 | | | | 15,076,061 | |
| | | | | | | | | |
Total | | | | | | | 43,608,163 | |
|
Airlines 1.2% | |
| | |
Delta Air Lines, Inc. | | | 300,640 | | | | 5,931,627 | |
| | |
United Continental Holdings, Inc.(a) | | | 306,729 | | | | 8,729,508 | |
| | | | | | | | | |
Total | | | | | | | 14,661,135 | |
| | | | | | | | |
| Common Stocks (continued) | |
| Issuer | | Shares | | | Value ($) | |
Commercial Services & Supplies 1.0% | |
| | |
ADT Corp. (The) | | | 139,107 | | | | 5,540,632 | |
| | |
Republic Services, Inc. | | | 192,788 | | | | 6,267,538 | |
| | | | | | | | | |
Total | | | | | | | 11,808,170 | |
|
Construction & Engineering 0.4% | |
| | |
Fluor Corp. | | | 77,324 | | | | 4,904,661 | |
|
Electrical Equipment 1.4% | |
| | |
ABB Ltd., ADR | | | 214,834 | | | | 4,599,596 | |
| | |
Eaton Corp. PLC | | | 194,192 | | | | 12,296,237 | |
| | | | | | | | | |
Total | | | | | | | 16,895,833 | |
|
Industrial Conglomerates 2.9% | |
| | |
General Electric Co. | | | 1,501,783 | | | | 34,751,259 | |
|
Machinery 2.2% | |
| | |
Caterpillar, Inc. | | | 86,393 | | | | 7,130,878 | |
| | |
Illinois Tool Works, Inc. | | | 89,803 | | | | 6,418,220 | |
| | |
Parker Hannifin Corp. | | | 86,723 | | | | 8,667,964 | |
| | |
Pentair Ltd. | | | 67,462 | | | | 4,055,141 | |
| | | | | | | | | |
Total | | | | | | | 26,272,203 | |
|
Road & Rail 0.5% | |
| | |
CSX Corp. | | | 220,157 | | | | 5,418,064 | |
| | | | | | | | | |
Total Industrials | | | | | | | 158,319,488 | |
| | |
| | | | | | | | |
Information Technology 12.6% | |
Communications Equipment 2.3% | |
| | |
Cisco Systems, Inc. | | | 1,192,019 | | | | 27,785,963 | |
|
Computers & Peripherals 2.4% | |
| | |
Apple, Inc. | | | 32,579 | | | | 15,867,602 | |
| | |
EMC Corp. | | | 303,406 | | | | 7,821,807 | |
| | |
Hewlett-Packard Co. | | | 238,439 | | | | 5,326,727 | |
| | | | | | | | | |
Total | | | | | | | 29,016,136 | |
|
Electronic Equipment, Instruments & Components 0.8% | |
| | |
Amphenol Corp., Class A | | | 31,897 | | | | 2,416,836 | |
| | |
Corning, Inc. | | | 211,634 | | | | 2,971,341 | |
| | |
TE Connectivity Ltd. | | | 84,275 | | | | 4,129,475 | |
| | | | | | | | | |
Total | | | | | | | 9,517,652 | |
|
IT Services 2.0% | |
| | |
Accenture PLC, Class A | | | 78,193 | | | | 5,649,444 | |
| | |
Mastercard, Inc., Class A | | | 21,537 | | | | 13,053,145 | |
| | |
Teradata Corp.(a) | | | 75,138 | | | | 4,400,082 | |
| | | | | | | | | |
Total | | | | | | | 23,102,671 | |
|
Office Electronics 0.5% | |
| | |
Xerox Corp. | | | 541,495 | | | | 5,404,120 | |
|
Semiconductors & Semiconductor Equipment 2.4% | |
| | |
Analog Devices, Inc. | | | 132,172 | | | | 6,116,920 | |
The accompanying Notes to Financial Statements are an integral part of this statement.
| | |
| |
| Columbia Equity Value Fund | | |
Portfolio of Investments (continued)
August 31, 2013 (Unaudited)
| | | | | | | | |
| Common Stocks (continued) | |
| Issuer | | Shares | | | Value ($) | |
Infineon Technologies AG, ADR | | | 329,860 | | | | 2,985,233 | |
| | |
Intel Corp. | | | 671,930 | | | | 14,769,022 | |
| | |
Maxim Integrated Products, Inc. | | | 113,181 | | | | 3,151,525 | |
| | |
Microchip Technology, Inc. | | | 41,694 | | | | 1,618,144 | |
| | | | | | | | | |
Total | | | | | | | 28,640,844 | |
|
Software 2.2% | |
| | |
CA, Inc. | | | 153,604 | | | | 4,492,917 | |
| | |
Citrix Systems, Inc.(a) | | | 48,640 | | | | 3,442,253 | |
| | |
Microsoft Corp. | | | 197,034 | | | | 6,580,935 | |
| | |
Oracle Corp. | | | 172,221 | | | | 5,486,961 | |
| | |
Symantec Corp. | | | 223,218 | | | | 5,716,613 | |
| | | | | | | | | |
Total | | | | | | | 25,719,679 | |
| | | | | | | | | |
Total Information Technology | | | | | | | 149,187,065 | |
| | |
| | | | | | | | |
Materials 2.5% | |
Chemicals 1.5% | |
| | |
Dow Chemical Co. (The) | | | 92,872 | | | | 3,473,413 | |
| | |
LyondellBasell Industries NV, Class A | | | 153,035 | | | | 10,735,405 | |
| | |
Mosaic Co. (The) | | | 85,184 | | | | 3,547,914 | |
| | | | | | | | | |
Total | | | | | | | 17,756,732 | |
|
Paper & Forest Products 1.0% | |
| | |
International Paper Co. | | | 264,122 | | | | 12,469,199 | |
| | | | | | | | | |
Total Materials | | | | | | | 30,225,931 | |
| | |
| | | | | | | | |
Telecommunication Services 2.1% | |
Diversified Telecommunication Services 1.7% | |
| | |
AT&T, Inc. | | | 476,057 | | | | 16,105,008 | |
| | |
Deutsche Telekom AG, ADR | | | 331,790 | | | | 4,258,525 | |
| | | | | | | | | |
Total | | | | | | | 20,363,533 | |
| | | | | | | | |
| Common Stocks (continued) | |
| Issuer | | Shares | | | Value ($) | |
Wireless Telecommunication Services 0.4% | |
| | |
Vodafone Group PLC, ADR | | | 135,258 | | | | 4,375,596 | |
| | | | | | | | | |
Total Telecommunication Services | | | | | | | 24,739,129 | |
| | |
| | | | | | | | |
Utilities 2.2% | |
Electric Utilities 0.5% | |
| | |
Duke Energy Corp. | | | 78,995 | | | | 5,182,072 | |
|
Multi-Utilities 1.7% | |
| | |
Dominion Resources, Inc. | | | 99,114 | | | | 5,783,302 | |
| | |
PG&E Corp. | | | 120,509 | | | | 4,984,252 | |
| | |
Sempra Energy | | | 113,626 | | | | 9,592,307 | |
| | | | | | | | | |
Total | | | | | | | 20,359,861 | |
| | | | | | | | | |
Total Utilities | | | | | | | 25,541,933 | |
| | | | | | | | | |
Total Common Stocks | | | | | | | | |
(Cost: $936,990,245) | | | | | | | 1,152,547,661 | |
| | |
| | | | | | | | |
| Money Market Funds 2.6% | |
| | | Shares | | | Value ($) | |
Columbia Short-Term Cash Fund, 0.097%(b)(c) | | | 30,764,467 | | | | 30,764,467 | |
| | | | | | | | | |
Total Money Market Funds | | | | | | | | |
(Cost: $30,764,467) | | | | | | | 30,764,467 | |
| | | | | | | | | |
Total Investments | | | | | | | | |
(Cost: $967,754,712) | | | | | | | 1,183,312,128 | |
| | | | | | | | | |
Other Assets & Liabilities, Net | | | | | | | 3,455,427 | |
| | | | | | | | | |
Net Assets | | | | | | | 1,186,767,555 | |
| | | | | | | | | |
Notes to Portfolio of Investments
| (b) | The rate shown is the seven-day current annualized yield at August 31, 2013. |
| (c) | As defined in the Investment Company Act of 1940, an affiliated company is one in which the Fund owns 5% or more of its outstanding voting securities, or a company which is under common ownership or control with the Fund. Holdings and transactions in these affiliated companies during the period ended August 31, 2013, are as follows: |
| | | | | | | | | | | | | | | | | | | | | | | | |
| Issuer | | Beginning
Cost ($) | | | Purchase
Cost ($) | | | Proceeds
From Sales ($) | | | Ending
Cost ($) | | | Dividends –
Affiliated
Issuers ($) | | | Value ($) | |
| | | | | | |
Columbia Short-Term Cash Fund | | | 6,238,554 | | | | 152,179,041 | | | | (127,653,128 | ) | | | 30,764,467 | | | | 8,835 | | | | 30,764,467 | |
Abbreviation Legend
| | |
| ADR | | American Depositary Receipt |
The accompanying Notes to Financial Statements are an integral part of this statement.
| | |
| |
| | Columbia Equity Value Fund |
Portfolio of Investments (continued)
August 31, 2013 (Unaudited)
Fair Value Measurements
Generally accepted accounting principles (GAAP) require disclosure regarding the inputs and valuation techniques used to measure fair value and any changes in valuation inputs or techniques. In addition, investments shall be disclosed by major category.
The Fund categorizes its fair value measurements according to a three-level hierarchy that maximizes the use of observable inputs and minimizes the use of unobservable inputs by prioritizing that the most observable input be used when available. Observable inputs are those that market participants would use in pricing an investment based on market data obtained from sources independent of the reporting entity. Unobservable inputs are those that reflect the Fund’s assumptions about the information market participants would use in pricing an investment. An investment’s level within the fair value hierarchy is based on the lowest level of any input that is deemed significant to the asset or liability’s fair value measurement. The input levels are not necessarily an indication of the risk or liquidity associated with investments at that level. For example, certain U.S. government securities are generally high quality and liquid, however, they are reflected as Level 2 because the inputs used to determine fair value may not always be quoted prices in an active market.
Fair value inputs are summarized in the three broad levels listed below:
| > | | Level 1 — Valuations based on quoted prices for investments in active markets that the Fund has the ability to access at the measurement date (including NAV for open-end mutual funds). Valuation adjustments are not applied to Level 1 investments. |
| > | | Level 2 — Valuations based on other significant observable inputs (including quoted prices for similar securities, interest rates, prepayment speeds, credit risks, etc.). |
| > | | Level 3 — Valuations based on significant unobservable inputs (including the Fund’s own assumptions and judgment in determining the fair value of investments). |
Inputs that are used in determining fair value of an investment may include price information, credit data, volatility statistics, and other factors. These inputs can be either observable or unobservable. The availability of observable inputs can vary between investments, and is affected by various factors such as the type of investment, and the volume and level of activity for that investment or similar investments in the marketplace. The inputs will be considered by the Investment Manager, along with any other relevant factors in the calculation of an investment’s fair value. The Fund uses prices and inputs that are current as of the measurement date, which may include periods of market dislocations. During these periods, the availability of prices and inputs may be reduced for many investments. This condition could cause an investment to be reclassified between the various levels within the hierarchy.
Investments falling into the Level 3 category are primarily supported by quoted prices from brokers and dealers participating in the market for those investments. However, these may be classified as Level 3 investments due to lack of market transparency and corroboration to support these quoted prices. Additionally, valuation models may be used as the pricing source for any remaining investments classified as Level 3. These models may rely on one or more significant unobservable inputs and/or significant assumptions by the Investment Manager. Inputs used in valuations may include, but are not limited to, financial statement analysis, capital account balances, discount rates and estimated cash flows, and comparable company data.
Under the direction of the Fund’s Board of Trustees (the Board), the Investment Manager’s Valuation Committee (the Committee) is responsible for carrying out the valuation procedures approved by the Board. The Committee consists of voting and non-voting members from various groups within the Investment Manager’s organization, including operations and accounting, trading and investments, compliance, risk management and legal.
The Committee meets at least monthly to review and approve valuation matters, which may include a description of specific valuation determinations, data regarding pricing information received from approved pricing vendors and brokers and the results of Board-approved valuation control policies and procedures (the Policies). The Policies address, among other things, instances when market quotations are or are not readily available, including recommendations of third party pricing vendors and a determination of appropriate pricing methodologies; events that require specific valuation determinations and assessment of fair value techniques; securities with a potential for stale pricing, including those that are illiquid, restricted, or in default; and the effectiveness of third- party pricing vendors, including periodic reviews of vendors. The Committee meets more frequently, as needed, to discuss additional valuation matters, which may include the need to review back-testing results, review time-sensitive information or approve related valuation actions. The Committee reports to the Board, with members of the Committee meeting with the Board at each of its regularly scheduled meetings to discuss valuation matters and actions during the period, similar to those described earlier.
For investments categorized as Level 3, the Committee monitors information similar to that described above, which may include: (i) data specific to the issuer or comparable issuers, (ii) general market or specific sector news and (iii) quoted prices and specific or similar security transactions. The Committee considers this data and any changes from prior periods in order to assess the reasonableness of observable and unobservable inputs, any assumptions or internal models used to value those securities and changes in fair value. This data is also used to corroborate, when available, information received from approved pricing vendors and brokers. Various factors impact the frequency of monitoring this information (which may occur as often as daily). However, the Committee may determine that changes to inputs, assumptions and models are not required as a result of the monitoring procedures performed.
The accompanying Notes to Financial Statements are an integral part of this statement.
| | |
| |
| Columbia Equity Value Fund | | |
Portfolio of Investments (continued)
August 31, 2013 (Unaudited)
Fair Value Measurements (continued)
The following table is a summary of the inputs used to value the Fund’s investments at August 31, 2013:
| | | | | | | | | | | | | | | | |
| Description | | Level 1
Quoted Prices in Active
Markets for Identical
Assets ($) | | | Level 2
Other Significant
Observable Inputs ($) | | | Level 3
Significant
Unobservable Inputs ($) | | | Total ($) | |
Equity Securities | | | | | | | | | | | | | | | | |
| | | | |
Common Stocks | | | | | | | | | | | | | | | | |
| | | | |
Consumer Discretionary | | | 76,011,743 | | | | 6,575,905 | | | | — | | | | 82,587,648 | |
| | | | |
Consumer Staples | | | 76,491,560 | | | | — | | | | — | | | | 76,491,560 | |
| | | | |
Energy | | | 124,570,932 | | | | — | | | | — | | | | 124,570,932 | |
| | | | |
Financials | | | 300,259,167 | | | | — | | | | — | | | | 300,259,167 | |
| | | | |
Health Care | | | 180,624,808 | | | | — | | | | — | | | | 180,624,808 | |
| | | | |
Industrials | | | 158,319,488 | | | | — | | | | — | | | | 158,319,488 | |
| | | | |
Information Technology | | | 149,187,065 | | | | — | | | | — | | | | 149,187,065 | |
| | | | |
Materials | | | 30,225,931 | | | | — | | | | — | | | | 30,225,931 | |
| | | | |
Telecommunication Services | | | 24,739,129 | | | | — | | | | — | | | | 24,739,129 | |
| | | | |
Utilities | | | 25,541,933 | | | | — | | | | — | | | | 25,541,933 | |
| | | | | | | | | | | | | | | | | |
Total Equity Securities | | | 1,145,971,756 | | | | 6,575,905 | | | | — | | | | 1,152,547,661 | |
| | | | | | | | | | | | | | | | | |
Mutual Funds | | | | | | | | | | | | | | | | |
| | | | |
Money Market Funds | | | 30,764,467 | | | | — | | | | — | | | | 30,764,467 | |
| | | | | | | | | | | | | | | | | |
Total Mutual Funds | | | 30,764,467 | | | | — | | | | — | | | | 30,764,467 | |
| | | | | | | | | | | | | | | | | |
Total | | | 1,176,736,223 | | | | 6,575,905 | | | | — | | | | 1,183,312,128 | |
| | | | | | | | | | | | | | | | | |
See the Portfolio of Investments for all investment classifications not indicated in the table.
The Fund’s assets assigned to the Level 2 input category are generally valued using the market approach, in which a security’s value is determined through reference to prices and information from market transactions for similar or identical assets. These assets include certain foreign securities for which a third party statistical pricing service may be employed for purposes of fair market valuation. The models utilized by the third party statistical pricing service take into account a security’s correlation to available market data including, but not limited to, intraday index, ADR, and ETF movements.
There were no transfers of financial assets between Levels 1 and 2 during the period.
The accompanying Notes to Financial Statements are an integral part of this statement.
| | |
| |
| | Columbia Equity Value Fund |
Statement of Assets and Liabilities
August 31, 2013 (Unaudited)
| | | | |
Assets | | | | |
| |
Investments, at value | | | | |
| |
Unaffiliated issuers (identified cost $936,990,245) | | | $1,152,547,661 | |
| |
Affiliated issuers (identified cost $30,764,467) | | | 30,764,467 | |
| |
Total investments (identified cost $967,754,712) | | | 1,183,312,128 | |
| |
Receivable for: | | | | |
| |
Investments sold | | | 8,194,847 | |
| |
Capital shares sold | | | 551,629 | |
| |
Dividends | | | 2,689,691 | |
| |
Reclaims | | | 27,860 | |
| |
Prepaid expenses | | | 47,568 | |
| |
Total assets | | | 1,194,823,723 | |
| |
| |
Liabilities | | | | |
| |
Payable for: | | | | |
| |
Investments purchased | | | 6,006,804 | |
| |
Capital shares purchased | | | 1,604,135 | |
| |
Investment management fees | | | 20,494 | |
| |
Distribution and/or service fees | | | 8,295 | |
| |
Transfer agent fees | | | 143,013 | |
| |
Administration fees | | | 1,841 | |
| |
Plan administration fees | | | 845 | |
| |
Compensation of board members | | | 168,428 | |
| |
Expense reimbursement due to Investment Manager | | | 384 | |
| |
Other expenses | | | 101,929 | |
| |
Total liabilities | | | 8,056,168 | |
| |
Net assets applicable to outstanding capital stock | | | $1,186,767,555 | |
| |
| |
Represented by | | | | |
| |
Paid-in capital | | | $898,849,480 | |
| |
Undistributed net investment income | | | 2,421,272 | |
| |
Accumulated net realized gain | | | 69,939,678 | |
| |
Unrealized appreciation (depreciation) on: | | | | |
| |
Investments | | | 215,557,416 | |
| |
Foreign currency translations | | | (291 | ) |
| |
Total — representing net assets applicable to outstanding capital stock | | | $1,186,767,555 | |
| |
The accompanying Notes to Financial Statements are an integral part of this statement.
| | |
| 10 | | Semiannual Report 2013 |
| | |
| |
| Columbia Equity Value Fund | | |
Statement of Assets and Liabilities (continued)
August 31, 2013 (Unaudited)
| | | | |
Class A | | | | |
| |
Net assets | | | $1,016,291,922 | |
| |
Shares outstanding | | | 79,753,013 | |
| |
Net asset value per share | | | $12.74 | |
| |
Maximum offering price per share(a) | | | $13.52 | |
| |
Class B | | | | |
| |
Net assets | | | $17,626,621 | |
| |
Shares outstanding | | | 1,376,011 | |
| |
Net asset value per share | | | $12.81 | |
| |
Class C | | | | |
| |
Net assets | | | $28,671,295 | |
| |
Shares outstanding | | | 2,270,662 | |
| |
Net asset value per share | | | $12.63 | |
| |
Class I | | | | |
| |
Net assets | | | $14,504 | |
| |
Shares outstanding | | | 1,162 | |
| |
Net asset value per share | | | $12.48 | |
| |
Class K | | | | |
| |
Net assets | | | $3,852,332 | |
| |
Shares outstanding | | | 301,359 | |
| |
Net asset value per share | | | $12.78 | |
| |
Class R | | | | |
| |
Net assets | | | $953,137 | |
| |
Shares outstanding | | | 74,915 | |
| |
Net asset value per share | | | $12.72 | |
| |
Class R4 | | | | |
| |
Net assets | | | $52,178 | |
| |
Shares outstanding | | | 4,082 | |
| |
Net asset value per share | | | $12.78 | |
| |
Class R5 | | | | |
| |
Net assets | | | $1,207,226 | |
| |
Shares outstanding | | | 94,660 | |
| |
Net asset value per share | | | $12.75 | |
| |
Class W | | | | |
| |
Net assets | | | $17,484 | |
| |
Shares outstanding | | | 1,364 | |
| |
Net asset value per share | | | $12.82 | |
| |
Class Y | | | | |
| |
Net assets | | | $3,765,615 | |
| |
Shares outstanding | | | 300,983 | |
| |
Net asset value per share | | | $12.51 | |
| |
Class Z | | | | |
| |
Net assets | | | $114,315,241 | |
| |
Shares outstanding | | | 8,961,044 | |
| |
Net asset value per share | | | $12.76 | |
| |
| (a) | The maximum offering price per share is calculated by dividing the net asset value per share by 1.0 minus the maximum sales charge of 5.75%. |
The accompanying Notes to Financial Statements are an integral part of this statement.
| | | | |
| Semiannual Report 2013 | | | 11 | |
| | |
| |
| | Columbia Equity Value Fund |
Statement of Operations
Six months ended August 31, 2013 (Unaudited)
| | | | |
Net investment income | | | | |
Income: | | | | |
Dividends — unaffiliated issuers | | | $12,032,750 | |
Dividends — affiliated issuers | | | 8,835 | |
Foreign taxes withheld | | | (49,266 | ) |
| |
Total income | | | 11,992,319 | |
| |
Expenses: | | | | |
Investment management fees | | | 3,300,130 | |
Distribution and/or service fees | | | | |
Class A | | | 1,136,993 | |
Class B | | | 90,636 | |
Class C | | | 109,973 | |
Class R | | | 1,751 | |
Class W | | | 20 | |
Transfer agent fees | | | | |
Class A | | | 974,888 | |
Class B | | | 19,547 | |
Class C | | | 23,156 | |
Class K | | | 875 | |
Class R | | | 736 | |
Class R4 | | | 30 | |
Class R5 | | | 281 | |
Class W | | | 18 | |
Class Z | | | 94,965 | |
Administration fees | | | 296,786 | |
Plan administration fees | | | | |
Class K | | | 4,739 | |
Compensation of board members | | | 22,026 | |
Custodian fees | | | 10,111 | |
Printing and postage fees | | | 108,231 | |
Registration fees | | | 46,915 | |
Professional fees | | | 22,455 | |
Other | | | 40,879 | |
| |
Total expenses | | | 6,306,141 | |
Fees waived or expenses reimbursed by Investment Manager and its affiliates | | | (74,928 | ) |
Expense reductions | | | (19,862 | ) |
| |
Total net expenses | | | 6,211,351 | |
| |
Net investment income | | | 5,780,968 | |
| |
| |
Realized and unrealized gain (loss) — net | | | | |
Net realized gain (loss) on: | | | | |
Investments | | | 95,002,951 | |
Foreign currency translations | | | (2,131 | ) |
| |
Net realized gain | | | 95,000,820 | |
Net change in unrealized appreciation (depreciation) on: | | | | |
Investments | | | (29,403,888 | ) |
Foreign currency translations | | | (53 | ) |
| |
Net change in unrealized appreciation (depreciation) | | | (29,403,941 | ) |
| |
Net realized and unrealized gain | | | 65,596,879 | |
| |
Net increase in net assets resulting from operations | | | $71,377,847 | |
| |
The accompanying Notes to Financial Statements are an integral part of this statement.
| | |
| 12 | | Semiannual Report 2013 |
| | |
| |
| Columbia Equity Value Fund | | |
Statement of Changes in Net Assets
| | | | | | | | |
| | | Six Months Ended
August 31, 2013
(Unaudited) | | | Year Ended
February 28, 2013(a) | |
Operations | | | | | | | | |
| | |
Net investment income | | | $5,780,968 | | | | $8,264,589 | |
| | |
Net realized gain | | | 95,000,820 | | | | 50,262,793 | |
| | |
Net change in unrealized appreciation (depreciation) | | | (29,403,941 | ) | | | 8,048,764 | |
| |
Net increase in net assets resulting from operations | | | 71,377,847 | | | | 66,576,146 | |
| |
| | |
Distributions to shareholders | | | | | | | | |
| | |
Net investment income | | | | | | | | |
| | |
Class A | | | (4,578,028 | ) | | | (8,645,068 | ) |
| | |
Class B | | | (31,434 | ) | | | (107,952 | ) |
| | |
Class C | | | (31,356 | ) | | | (30,450 | ) |
| | |
Class I | | | (107 | ) | | | (185 | ) |
| | |
Class K | | | (23,147 | ) | | | (46,158 | ) |
| | |
Class R | | | (2,539 | ) | | | (386 | ) |
| | |
Class R4 | | | (207 | ) | | | (111 | ) |
| | |
Class R5 | | | (8,925 | ) | | | (20,143 | ) |
| | |
Class W | | | (86 | ) | | | (188 | ) |
| | |
Class Y | | | (14,951 | ) | | | — | |
| | |
Class Z | | | (442,863 | ) | | | (11,156 | ) |
| |
Total distributions to shareholders | | | (5,133,643 | ) | | | (8,861,797 | ) |
| |
Increase (decrease) in net assets from capital stock activity | | | 510,921,614 | | | | (71,003,723 | ) |
| |
Total increase (decrease) in net assets | | | 577,165,818 | | | | (13,289,374 | ) |
| | |
Net assets at beginning of period | | | 609,601,737 | | | | 622,891,111 | |
| |
Net assets at end of period | | | $1,186,767,555 | | | | $609,601,737 | |
| |
Undistributed net investment income | | | $2,421,272 | | | | $1,773,947 | |
| |
| (a) | Class Y shares commenced operations on February 28, 2013. |
The accompanying Notes to Financial Statements are an integral part of this statement.
| | | | |
| Semiannual Report 2013 | | | 13 | |
| | |
| |
| | Columbia Equity Value Fund |
Statement of Changes in Net Assets (continued)
| | | | | | | | | | | | | | | | |
| | | Six Months Ended
August 31, 2013 (Unaudited) | | | Year Ended
February 28, 2013(a) | |
| | | Shares | | | Dollars ($) | | | Shares | | | Dollars ($) | |
Capital stock activity | | | | | | | | | | | | | | | | |
| | | | |
Class A shares | | | | | | | | | | | | | | | | |
| | | | |
Subscriptions(b) | | | 3,241,997 | | | | 41,262,663 | | | | 5,763,865 | | | | 62,013,117 | |
| | | | |
Fund merger | | | 32,813,908 | | | | 405,567,944 | | | | — | | | | — | |
| | | | |
Distributions reinvested | | | 354,708 | | | | 4,340,035 | | | | 790,914 | | | | 8,511,381 | |
| | | | |
Redemptions | | | (6,326,943 | ) | | | (80,769,504 | ) | | | (12,416,280 | ) | | | (134,287,538 | ) |
| |
Net increase (decrease) | | | 30,083,670 | | | | 370,401,138 | | | | (5,861,501 | ) | | | (63,763,040 | ) |
| |
Class B shares | | | | | | | | | | | | | | | | |
| | | | |
Subscriptions | | | 8,521 | | | | 109,833 | | | | 15,201 | | | | 164,952 | |
| | | | |
Fund merger | | | 680,034 | | | | 8,456,462 | | | | — | | | | — | |
| | | | |
Distributions reinvested | | | 2,466 | | | | 30,359 | | | | 9,862 | | | | 106,986 | |
| | | | |
Redemptions(b) | | | (385,986 | ) | | | (5,038,848 | ) | | | (718,595 | ) | | | (7,554,084 | ) |
| |
Net increase (decrease) | | | 305,035 | | | | 3,557,806 | | | | (693,532 | ) | | | (7,282,146 | ) |
| |
Class C shares | | | | | | | | | | | | | | | | |
| | | | |
Subscriptions | | | 49,617 | | | | 629,238 | | | | 31,445 | | | | 336,331 | |
| | | | |
Fund merger | | | 2,025,364 | | | | 24,825,553 | | | | — | | | | — | |
| | | | |
Distributions reinvested | | | 2,202 | | | | 26,826 | | | | 2,754 | | | | 29,583 | |
| | | | |
Redemptions | | | (160,391 | ) | | | (2,048,355 | ) | | | (75,889 | ) | | | (809,462 | ) |
| |
Net increase (decrease) | | | 1,916,792 | | | | 23,433,262 | | | | (41,690 | ) | | | (443,548 | ) |
| |
Class I shares | | | | | | | | | | | | | | | | |
| | | | |
Fund merger | | | 271 | | | | 3,282 | | | | — | | | | — | |
| |
Net increase | | | 271 | | | | 3,282 | | | | — | | | | — | |
| |
Class K shares | | | | | | | | | | | | | | | | |
| | | | |
Subscriptions | | | 48,561 | | | | 612,669 | | | | 72,903 | | | | 800,841 | |
| | | | |
Distributions reinvested | | | 1,883 | | | | 23,086 | | | | 4,262 | | | | 46,021 | |
| | | | |
Redemptions | | | (35,246 | ) | | | (440,273 | ) | | | (47,928 | ) | | | (518,792 | ) |
| |
Net increase | | | 15,198 | | | | 195,482 | | | | 29,237 | | | | 328,070 | |
| |
Class R shares | | | | | | | | | | | | | | | | |
| | | | |
Subscriptions | | | 15,120 | | | | 187,916 | | | | 751 | | | | 8,458 | |
| | | | |
Fund merger | | | 59,981 | | | | 740,564 | | | | — | | | | — | |
| | | | |
Distributions reinvested | | | 193 | | | | 2,369 | | | | 27 | | | | 293 | |
| | | | |
Redemptions | | | (3,576 | ) | | | (46,013 | ) | | | (299 | ) | | | (3,426 | ) |
| |
Net increase | | | 71,718 | | | | 884,836 | | | | 479 | | | | 5,325 | |
| |
Class R4 shares | | | | | | | | | | | | | | | | |
| | | | |
Subscriptions | | | 5,300 | | | | 68,815 | | | | — | | | | — | |
| | | | |
Distributions reinvested | | | 12 | | | | 149 | | | | 1 | | | | 7 | |
| | | | |
Redemptions | | | (1,946 | ) | | | (25,128 | ) | | | — | | | | — | |
| |
Net increase | | | 3,366 | | | | 43,836 | | | | 1 | | | | 7 | |
| |
Class R5 shares | | | | | | | | | | | | | | | | |
| | | | |
Subscriptions | | | 1,320 | | | | 16,911 | | | | 7,333 | | | | 78,842 | |
| | | | |
Distributions reinvested | | | 725 | | | | 8,861 | | | | 1,860 | | | | 20,007 | |
| | | | |
Redemptions | | | (4,499 | ) | | | (56,394 | ) | | | (9,353 | ) | | | (101,966 | ) |
| |
Net decrease | | | (2,454 | ) | | | (30,622 | ) | | | (160 | ) | | | (3,117 | ) |
| |
The accompanying Notes to Financial Statements are an integral part of this statement.
| | |
| 14 | | Semiannual Report 2013 |
| | |
| |
| Columbia Equity Value Fund | | |
Statement of Changes in Net Assets (continued)
| | | | | | | | | | | | | | | | |
| | | Six Months Ended
August 31, 2013 (Unaudited) | | | Year Ended
February 28, 2013(a) | |
| | | Shares | | | Dollars ($) | | | Shares | | | Dollars ($) | |
Class W shares | | | | | | | | | | | | | | | | |
| | | | |
Subscriptions | | | — | | | | — | | | | 1 | | | | 8 | |
| | | | |
Fund merger | | | 263 | | | | 3,277 | | | | — | | | | — | |
| | | | |
Distributions reinvested | | | 4 | | | | 51 | | | | 13 | | | | 136 | |
| | | | |
Redemptions | | | (12 | ) | | | (154 | ) | | | (1,267 | ) | | | (13,600 | ) |
| |
Net increase (decrease) | | | 255 | | | | 3,174 | | | | (1,253 | ) | | | (13,456 | ) |
| |
Class Y shares | | | | | | | | | | | | | | | | |
| | | | |
Subscriptions | | | 2 | | | | 25 | | | | 215 | | | | 2,500 | |
| | | | |
Fund merger | | | 318,778 | | | | 3,869,769 | | | | — | | | | — | |
| | | | |
Redemptions | | | (18,012 | ) | | | (230,013 | ) | | | — | | | | — | |
| |
Net increase | | | 300,768 | | | | 3,639,781 | | | | 215 | | | | 2,500 | |
| |
Class Z shares | | | | | | | | | | | | | | | | |
| | | | |
Subscriptions | | | 93,578 | | | | 1,202,044 | | | | 52,637 | | | | 579,258 | |
| | | | |
Fund merger | | | 11,446,337 | | | | 141,699,961 | | | | — | | | | — | |
| | | | |
Distributions reinvested | | | 23,974 | | | | 295,087 | | | | 840 | | | | 9,064 | |
| | | | |
Redemptions | | | (2,669,191 | ) | | | (34,407,453 | ) | | | (38,603 | ) | | | (422,640 | ) |
| |
Net increase | | | 8,894,698 | | | | 108,789,639 | | | | 14,874 | | | | 165,682 | |
| |
Total net increase (decrease) | | | 41,589,317 | | | | 510,921,614 | | | | (6,553,330 | ) | | | (71,003,723 | ) |
| |
| (a) | Class Y shares commenced operations on February 28, 2013. |
| (b) | Includes conversions of Class B shares to Class A shares, if any. |
The accompanying Notes to Financial Statements are an integral part of this statement.
| | | | |
| Semiannual Report 2013 | | | 15 | |
| | |
| |
| | Columbia Equity Value Fund |
Financial Highlights
The following tables are intended to help you understand the Fund’s financial performance. Certain information reflects financial results for a single share of a class held for the periods shown. Per share net investment income (loss) amounts are calculated based on average shares outstanding during the period. Total return assumes reinvestment of all dividends and distributions, if any. Total return does not reflect payment of sales charges, if any, and is not annualized for periods of less than one year.
| | | | | | | | | | | | | | | | | | | | | | | | | | | | |
| |
| Six Months Ended
August 31, 2013 |
| |
| Year Ended
February 28, |
| |
| Year Ended
February 29, |
| | | Year Ended March 31, | |
Class A | | | (Unaudited) | | | | 2013 | | | | 2012(a) | | | | 2011 | | | | 2010 | | | | 2009 | | | | 2008 | |
Per share data | | | | | | | | | | | | | | | | | | | | | | | | | | | | |
Net asset value, beginning of period | | | $11.82 | | | | $10.72 | | | | $11.02 | | | | $9.63 | | | | $6.54 | | | | $11.97 | | | | $13.43 | |
| | | | | | | | | | | | | | | | | | | | | | | | | | | | | |
Income from investment operations: | | | | | | | | | | | | | | | | | | | | | | | | | | | | |
| | | | | | | |
Net investment income | | | 0.07 | | | | 0.15 | | | | 0.11 | | | | 0.10 | | | | 0.12 | | | | 0.16 | | | | 0.15 | |
| | | | | | | | | | | | | | | | | | | | | | | | | | | | | |
Net realized and unrealized gain (loss) | | | 0.92 | | | | 1.11 | | | | (0.33 | ) | | | 1.40 | | | | 3.10 | | | | (4.79 | ) | | | (0.66 | ) |
| | | | | | | | | | | | | | | | | | | | | | | | | | | | | |
Total from investment operations | | | 0.99 | | | | 1.26 | | | | (0.22 | ) | | | 1.50 | | | | 3.22 | | | | (4.63 | ) | | | (0.51 | ) |
| | | | | | | | | | | | | | | | | | | | | | | | | | | | | |
Less distributions to shareholders: | | | | | | | | | | | | | | | | | | | | | | | | | | | | |
| | | | | | | |
Net investment income | | | (0.07 | ) | | | (0.16 | ) | | | (0.08 | ) | | | (0.11 | ) | | | (0.13 | ) | | | (0.15 | ) | | | (0.18 | ) |
| | | | | | | | | | | | | | | | | | | | | | | | | | | | | |
Net realized gains | | | — | | | | — | | | | — | | | | — | | | | — | | | | (0.65 | ) | | | (0.77 | ) |
| | | | | | | | | | | | | | | | | | | | | | | | | | | | | |
Total distributions to shareholders | | | (0.07 | ) | | | (0.16 | ) | | | (0.08 | ) | | | (0.11 | ) | | | (0.13 | ) | | | (0.80 | ) | | | (0.95 | ) |
| | | | | | | | | | | | | | | | | | | | | | | | | | | | | |
Net asset value, end of period | | | $12.74 | | | | $11.82 | | | | $10.72 | | | | $11.02 | | | | $9.63 | | | | $6.54 | | | | $11.97 | |
| | | | | | | | | | | | | | | | | | | | | | | | | | | | | |
Total return | | | 8.41 | % | | | 11.94 | % | | | (1.87 | %) | | | 15.67 | % | | | 49.52 | % | | | (39.50 | %) | | | (4.39 | %) |
| | | | | | | | | | | | | | | | | | | | | | | | | | | | | |
Ratios to average net assets(b) | | | | | | | | | | | | | | | | | | | | | | | | | | | | |
| | | | | | | |
Total gross expenses | | | 1.20 | %(c) | | | 1.26 | % | | | 1.22 | %(c) | | | 1.11 | % | | | 1.09 | % | | | 1.11 | % | | | 1.06 | % |
| | | | | | | | | | | | | | | | | | | | | | | | | | | | | |
Total net expenses(d) | | | 1.18 | %(c)(e) | | | 1.16 | %(e) | | | 1.12 | %(c)(e) | | | 1.11 | % | | | 1.09 | % | | | 1.11 | % | | | 1.06 | %(f) |
| | | | | | | | | | | | | | | | | | | | | | | | | | | | | |
Net investment income | | | 1.09 | %(c) | | | 1.41 | % | | | 1.18 | %(c) | | | 1.07 | % | | | 1.39 | % | | | 1.68 | % | | | 1.09 | % |
| | | | | | | | | | | | | | | | | | | | | | | | | | | | | |
Supplemental data | | | | | | | | | | | | | | | | | | | | | | | | | | | | |
| | | | | | | |
Net assets, end of period (in thousands) | | | $1,016,292 | | | | $587,324 | | | | $595,255 | | | | $729,078 | | | | $681,073 | | | | $450,713 | | | | $862,727 | |
| | | | | | | | | | | | | | | | | | | | | | | | | | | | | |
Portfolio turnover | | | 31 | % | | | 49 | % | | | 21 | % | | | 37 | % | | | 30 | % | | | 21 | % | | | 25 | % |
| | | | | | | | | | | | | | | | | | | | | | | | | | | | | |
Notes to Financial Highlights
| (a) | For the period from April 1, 2011 to February 29, 2012. During the period, the Fund’s fiscal year end was changed from March 31 to February 29. |
| (b) | In addition to the fees and expenses which the Fund bears directly, the Fund indirectly bears a pro rata share of the fees and expenses of the acquired funds in which it invests. Such indirect expenses are not included in the reported expense ratios. |
| (d) | Total net expenses include the impact of certain waivers/reimbursements made by the Investment Manager and certain of its affiliates, if applicable. |
| (e) | The benefits derived from expense reductions had an impact of less than 0.01%. |
| (f) | The ratio of net expenses after reduction for earnings and bank fee credits was 1.05%. |
The accompanying Notes to Financial Statements are an integral part of this statement.
| | |
| 16 | | Semiannual Report 2013 |
| | |
| |
| Columbia Equity Value Fund | | |
Financial Highlights (continued)
| | | | | | | | | | | | | | | | | | | | | | | | | | | | |
| |
| Six Months Ended
August 31, 2013 |
| |
| Year Ended
February 28, |
| |
| Year Ended
February 29, |
| | | Year Ended March 31, | |
Class B | | | (Unaudited) | | | | 2013 | | | | 2012(a) | | | | 2011 | | | | 2010 | | | | 2009 | | | | 2008 | |
Per share data | | | | | | | | | | | | | | | | | | | | | | | | | | | | |
Net asset value, beginning of period | | | $11.89 | | | | $10.77 | | | | $11.08 | | | | $9.67 | | | | $6.57 | | | | $12.01 | | | | $13.46 | |
| | | | | | | | | | | | | | | | | | | | | | | | | | | | | |
Income from investment operations: | | | | | | | | | | | | | | | | | | | | | | | | | | | | |
| | | | | | | |
Net investment income | | | 0.02 | | | | 0.07 | | | | 0.04 | | | | 0.03 | | | | 0.06 | | | | 0.09 | | | | 0.05 | |
| | | | | | | | | | | | | | | | | | | | | | | | | | | | | |
Net realized and unrealized gain (loss) | | | 0.92 | | | | 1.13 | | | | (0.33 | ) | | | 1.40 | | | | 3.10 | | | | (4.80 | ) | | | (0.66 | ) |
| | | | | | | | | | | | | | | | | | | | | | | | | | | | | |
Total from investment operations | | | 0.94 | | | | 1.20 | | | | (0.29 | ) | | | 1.43 | | | | 3.16 | | | | (4.71 | ) | | | (0.61 | ) |
| | | | | | | | | | | | | | | | | | | | | | | | | | | | | |
Less distributions to shareholders: | | | | | | | | | | | | | | | | | | | | | | | | | | | | |
| | | | | | | |
Net investment income | | | (0.02 | ) | | | (0.08 | ) | | | (0.02 | ) | | | (0.02 | ) | | | (0.06 | ) | | | (0.08 | ) | | | (0.07 | ) |
| | | | | | | | | | | | | | | | | | | | | | | | | | | | | |
Net realized gains | | | — | | | | — | | | | — | | | | — | | | | — | | | | (0.65 | ) | | | (0.77 | ) |
| | | | | | | | | | | | | | | | | | | | | | | | | | | | | |
Total distributions to shareholders | | | (0.02 | ) | | | (0.08 | ) | | | (0.02 | ) | | | (0.02 | ) | | | (0.06 | ) | | | (0.73 | ) | | | (0.84 | ) |
| | | | | | | | | | | | | | | | | | | | | | | | | | | | | |
Net asset value, end of period | | | $12.81 | | | | $11.89 | | | | $10.77 | | | | $11.08 | | | | $9.67 | | | | $6.57 | | | | $12.01 | |
| | | | | | | | | | | | | | | | | | | | | | | | | | | | | |
Total return | | | 7.94 | % | | | 11.18 | % | | | (2.58 | %) | | | 14.84 | % | | | 48.26 | % | | | (39.94 | %) | | | (5.07 | %) |
| | | | | | | | | | | | | | | | | | | | | | | | | | | | | |
Ratios to average net assets(b) | | | | | | | | | | | | | | | | | | | | | | | | | | | | |
| | | | | | | |
Total gross expenses | | | 1.95 | %(c) | | | 2.00 | % | | | 1.96 | %(c) | | | 1.86 | % | | | 1.85 | % | | | 1.88 | % | | | 1.82 | % |
| | | | | | | | | | | | | | | | | | | | | | | | | | | | | |
Total net expenses(d) | | | 1.93 | %(c)(e) | | | 1.91 | %(e) | | | 1.88 | %(c)(e) | | | 1.86 | % | | | 1.85 | % | | | 1.88 | % | | | 1.82 | %(f) |
| | | | | | | | | | | | | | | | | | | | | | | | | | | | | |
Net investment income | | | 0.34 | %(c) | | | 0.63 | % | | | 0.41 | %(c) | | | 0.30 | % | | | 0.68 | % | | | 0.88 | % | | | 0.33 | % |
| | | | | | | | | | | | | | | | | | | | | | | | | | | | | |
Supplemental data | | | | | | | | | | | | | | | | | | | | | | | | | | | | |
| | | | | | | |
Net assets, end of period (in thousands) | | | $17,627 | | | | $12,730 | | | | $19,003 | | | | $32,311 | | | | $50,132 | | | | $50,135 | | | | $120,950 | |
| | | | | | | | | | | | | | | | | | | | | | | | | | | | | |
Portfolio turnover | | | 31 | % | | | 49 | % | | | 21 | % | | | 37 | % | | | 30 | % | | | 21 | % | | | 25 | % |
| | | | | | | | | | | | | | | | | | | | | | | | | | | | | |
Notes to Financial Highlights
| (a) | For the period from April 1, 2011 to February 29, 2012. During the period, the Fund’s fiscal year end was changed from March 31 to February 29. |
| (b) | In addition to the fees and expenses which the Fund bears directly, the Fund indirectly bears a pro rata share of the fees and expenses of the acquired funds in which it invests. Such indirect expenses are not included in the reported expense ratios. |
| (d) | Total net expenses include the impact of certain waivers/reimbursements made by the Investment Manager and certain of its affiliates, if applicable. |
| (e) | The benefits derived from expense reductions had an impact of less than 0.01%. |
| (f) | The ratio of net expenses after reduction for earnings and bank fee credits was 1.81%. |
The accompanying Notes to Financial Statements are an integral part of this statement.
| | | | |
| Semiannual Report 2013 | | | 17 | |
| | |
| |
| | Columbia Equity Value Fund |
Financial Highlights (continued)
| | | | | | | | | | | | | | | | | | | | | | | | | | | | |
| |
| Six Months Ended
August 31, 2013 |
| |
| Year Ended
February 28, |
| |
| Year Ended
February 29, |
| | | Year Ended March 31, | |
Class C | | | (Unaudited) | | | | 2013 | | | | 2012(a) | | | | 2011 | | | | 2010 | | | | 2009 | | | | 2008 | |
Per share data | | | | | | | | | | | | | | | | | | | | | | | | | | | | |
Net asset value, beginning of period | | | $11.72 | | | | $10.62 | | | | $10.93 | | | | $9.55 | | | | $6.49 | | | | $11.89 | | | | $13.34 | |
| | | | | | | | | | | | | | | | | | | | | | | | | | | | | |
Income from investment operations: | | | | | | | | | | | | | | | | | | | | | | | | | | | | |
| | | | | | | |
Net investment income | | | 0.03 | | | | 0.07 | | | | 0.04 | | | | 0.03 | | | | 0.05 | | | | 0.09 | | | | 0.05 | |
| | | | | | | | | | | | | | | | | | | | | | | | | | | | | |
Net realized and unrealized gain (loss) | | | 0.91 | | | | 1.11 | | | | (0.32 | ) | | | 1.38 | | | | 3.08 | | | | (4.76 | ) | | | (0.66 | ) |
| | | | | | | | | | | | | | | | | | | | | | | | | | | | | |
Total from investment operations | | | 0.94 | | | | 1.18 | | | | (0.28 | ) | | | 1.41 | | | | 3.13 | | | | (4.67 | ) | | | (0.61 | ) |
| | | | | | | | | | | | | | | | | | | | | | | | | | | | | |
Less distributions to shareholders: | | | | | | | | | | | | | | | | | | | | | | | | | | | | |
| | | | | | | |
Net investment income | | | (0.03 | ) | | | (0.08 | ) | | | (0.03 | ) | | | (0.03 | ) | | | (0.07 | ) | | | (0.08 | ) | | | (0.07 | ) |
| | | | | | | | | | | | | | | | | | | | | | | | | | | | | |
Net realized gains | | | — | | | | — | | | | — | | | | — | | | | — | | | | (0.65 | ) | | | (0.77 | ) |
| | | | | | | | | | | | | | | | | | | | | | | | | | | | | |
Total distributions to shareholders | | | (0.03 | ) | | | (0.08 | ) | | | (0.03 | ) | | | (0.03 | ) | | | (0.07 | ) | | | (0.73 | ) | | | (0.84 | ) |
| | | | | | | | | | | | | | | | | | | | | | | | | | | | | |
Net asset value, end of period | | | $12.63 | | | | $11.72 | | | | $10.62 | | | | $10.93 | | | | $9.55 | | | | $6.49 | | | | $11.89 | |
| | | | | | | | | | | | | | | | | | | | | | | | | | | | | |
Total return | | | 7.99 | % | | | 11.20 | % | | | (2.56 | %) | | | 14.82 | % | | | 48.35 | % | | | (39.97 | %) | | | (5.07 | %) |
| | | | | | | | | | | | | | | | | | | | | | | | | | | | | |
Ratios to average net assets(b) | | | | | | | | | | | | | | | | | | | | | | | | | | | | |
| | | | | | | |
Total gross expenses | | | 1.94 | %(c) | | | 2.01 | % | | | 1.97 | %(c) | | | 1.86 | % | | | 1.85 | % | | | 1.87 | % | | | 1.82 | % |
| | | | | | | | | | | | | | | | | | | | | | | | | | | | | |
Total net expenses(d) | | | 1.93 | %(c)(e) | | | 1.91 | %(e) | | | 1.88 | %(c)(e) | | | 1.86 | % | | | 1.85 | % | | | 1.87 | % | | | 1.82 | %(f) |
| | | | | | | | | | | | | | | | | | | | | | | | | | | | | |
Net investment income | | | 0.44 | %(c) | | | 0.66 | % | | | 0.44 | %(c) | | | 0.32 | % | | | 0.62 | % | | | 0.94 | % | | | 0.34 | % |
| | | | | | | | | | | | | | | | | | | | | | | | | | | | | |
Supplemental data | | | | | | | | | | | | | | | | | | | | | | | | | | | | |
| | | | | | | |
Net assets, end of period (in thousands) | | | $28,671 | | | | $4,147 | | | | $4,203 | | | | $4,977 | | | | $4,895 | | | | $3,103 | | | | $5,339 | |
| | | | | | | | | | | | | | | | | | | | | | | | | | | | | |
Portfolio turnover | | | 31 | % | | | 49 | % | | | 21 | % | | | 37 | % | | | 30 | % | | | 21 | % | | | 25 | % |
| | | | | | | | | | | | | | | | | | | | | | | | | | | | | |
Notes to Financial Highlights
| (a) | For the period from April 1, 2011 to February 29, 2012. During the period, the Fund’s fiscal year end was changed from March 31 to February 29. |
| (b) | In addition to the fees and expenses which the Fund bears directly, the Fund indirectly bears a pro rata share of the fees and expenses of the acquired funds in which it invests. Such indirect expenses are not included in the reported expense ratios. |
| (d) | Total net expenses include the impact of certain waivers/reimbursements made by the Investment Manager and certain of its affiliates, if applicable. |
| (e) | The benefits derived from expense reductions had an impact of less than 0.01%. |
| (f) | The ratio of net expenses after reduction for earnings and bank fee credits was 1.81%. |
The accompanying Notes to Financial Statements are an integral part of this statement.
| | |
| 18 | | Semiannual Report 2013 |
| | |
| |
| Columbia Equity Value Fund | | |
Financial Highlights (continued)
| | | | | | | | | | | | | | | | | | | | | | | | | | | | |
| |
| Six Months Ended
August 31, 2013 |
| |
| Year Ended
February 28, |
| |
| Year Ended
February 29, |
| | | Year Ended March 31, | |
Class I | | | (Unaudited) | | | | 2013 | | | | 2012(a) | | | | 2011 | | | | 2010 | | | | 2009 | | | | 2008 | |
Per share data | | | | | | | | | | | | | | | | | | | | | | | | | | | | |
Net asset value, beginning of period | | | $11.59 | | | | $10.51 | | | | $11.03 | | | | $9.64 | | | | $6.55 | | | | $11.99 | | | | $13.45 | |
| | | | | | | | | | | | | | | | | | | | | | | | | | | | | |
Income from investment operations: | | | | | | | | | | | | | | | | | | | | | | | | | | | | |
| | | | | | | |
Net investment income | | | 0.10 | | | | 0.19 | | | | 0.14 | | | | 0.14 | | | | 0.14 | | | | 0.21 | | | | 0.21 | |
| | | | | | | | | | | | | | | | | | | | | | | | | | | | | |
Net realized and unrealized gain (loss) | | | 0.89 | | | | 1.10 | | | | (0.36 | ) | | | 1.40 | | | | 3.12 | | | | (4.80 | ) | | | (0.67 | ) |
| | | | | | | | | | | | | | | | | | | | | | | | | | | | | |
Total from investment operations | | | 0.99 | | | | 1.29 | | | | (0.22 | ) | | | 1.54 | | | | 3.26 | | | | (4.59 | ) | | | (0.46 | ) |
| | | | | | | | | | | | | | | | | | | | | | | | | | | | | |
Less distributions to shareholders: | | | | | | | | | | | | | | | | | | | | | | | | | | | | |
| | | | | | | |
Net investment income | | | (0.10 | ) | | | (0.21 | ) | | | (0.30 | ) | | | (0.15 | ) | | | (0.17 | ) | | | (0.20 | ) | | | (0.23 | ) |
| | | | | | | | | | | | | | | | | | | | | | | | | | | | | |
Net realized gains | | | — | | | | — | | | | — | | | | — | | | | — | | | | (0.65 | ) | | | (0.77 | ) |
| | | | | | | | | | | | | | | | | | | | | | | | | | | | | |
Total distributions to shareholders | | | (0.10 | ) | | | (0.21 | ) | | | (0.30 | ) | | | (0.15 | ) | | | (0.17 | ) | | | (0.85 | ) | | | (1.00 | ) |
| | | | | | | | | | | | | | | | | | | | | | | | | | | | | |
Net asset value, end of period | | | $12.48 | | | | $11.59 | | | | $10.51 | | | | $11.03 | | | | $9.64 | | | | $6.55 | | | | $11.99 | |
| | | | | | | | | | | | | | | | | | | | | | | | | | | | | |
Total return | | | 8.61 | % | | | 12.46 | % | | | (1.59 | %) | | | 16.18 | % | | | 50.13 | % | | | (39.22 | %) | | | (3.99 | %) |
| | | | | | | | | | | | | | | | | | | | | | | | | | | | | |
Ratios to average net assets(b) | | | | | | | | | | | | | | | | | | | | | | | | | | | | |
| | | | | | | |
Total gross expenses | | | 0.64 | %(c) | | | 0.78 | % | | | 0.74 | %(c) | | | 0.63 | % | | | 0.66 | % | | | 0.69 | % | | | 0.65 | % |
| | | | | | | | | | | | | | | | | | | | | | | | | | | | | |
Total net expenses(d) | | | 0.64 | %(c) | | | 0.75 | % | | | 0.69 | %(c) | | | 0.63 | % | | | 0.66 | % | | | 0.69 | % | | | 0.65 | % |
| | | | | | | | | | | | | | | | | | | | | | | | | | | | | |
Net investment income | | | 1.60 | %(c) | | | 1.83 | % | | | 1.52 | %(c) | | | 1.50 | % | | | 1.50 | % | | | 2.00 | % | | | 1.50 | % |
| | | | | | | | | | | | | | | | | | | | | | | | | | | | | |
Supplemental data | | | | | | | | | | | | | | | | | | | | | | | | | | | | |
| | | | | | | |
Net assets, end of period (in thousands) | | | $15 | | | | $10 | | | | $9 | | | | $10 | | | | $18,363 | | | | $4 | | | | $13 | |
| | | | | | | | | | | | | | | | | | | | | | | | | | | | | |
Portfolio turnover | | | 31 | % | | | 49 | % | | | 21 | % | | | 37 | % | | | 30 | % | | | 21 | % | | | 25 | % |
| | | | | | | | | | | | | | | | | | | | | | | | | | | | | |
Notes to Financial Highlights
| (a) | For the period from April 1, 2011 to February 29, 2012. During the period, the Fund’s fiscal year end was changed from March 31 to February 29. |
| (b) | In addition to the fees and expenses which the Fund bears directly, the Fund indirectly bears a pro rata share of the fees and expenses of the acquired funds in which it invests. Such indirect expenses are not included in the reported expense ratios. |
| (d) | Total net expenses include the impact of certain waivers/reimbursements made by the Investment Manager and certain of its affiliates, if applicable. |
The accompanying Notes to Financial Statements are an integral part of this statement.
| | | | |
| Semiannual Report 2013 | | | 19 | |
| | |
| |
| | Columbia Equity Value Fund |
Financial Highlights (continued)
| | | | | | | | | | | | | | | | | | | | | | | | | | | | |
| |
| Six Months Ended
August 31, 2013 |
| |
| Year Ended
February 28, |
| |
| Year Ended
February 29, |
| | | Year Ended March 31, | |
Class K | | | (Unaudited) | | | | 2013 | | | | 2012(a) | | | | 2011 | | | | 2010 | | | | 2009 | | | | 2008 | |
Per share data | | | | | | | | | | | | | | | | | | | | | | | | | | | | |
Net asset value, beginning of period | | | $11.86 | | | | $10.75 | | | | $11.05 | | | | $9.65 | | | | $6.56 | | | | $11.98 | | | | $13.44 | |
| | | | | | | | | | | | | | | | | | | | | | | | | | | | | |
Income from investment operations: | | | | | | | | | | | | | | | | | | | | | | | | | | | | |
| | | | | | | |
Net investment income | | | 0.08 | | | | 0.17 | | | | 0.11 | | | | 0.12 | | | | 0.13 | | | | 0.19 | | | | 0.17 | |
| | | | | | | | | | | | | | | | | | | | | | | | | | | | | |
Net realized and unrealized gain (loss) | | | 0.92 | | | | 1.12 | | | | (0.32 | ) | | | 1.40 | | | | 3.10 | | | | (4.79 | ) | | | (0.66 | ) |
| | | | | | | | | | | | | | | | | | | | | | | | | | | | | |
Total from investment operations | | | 1.00 | | | | 1.29 | | | | (0.21 | ) | | | 1.52 | | | | 3.23 | | | | (4.60 | ) | | | (0.49 | ) |
| | | | | | | | | | | | | | | | | | | | | | | | | | | | | |
Less distributions to shareholders: | | | | | | | | | | | | | | | | | | | | | | | | | | | | |
| | | | | | | |
Net investment income | | | (0.08 | ) | | | (0.18 | ) | | | (0.09 | ) | | | (0.12 | ) | | | (0.14 | ) | | | (0.17 | ) | | | (0.20 | ) |
| | | | | | | | | | | | | | | | | | | | | | | | | | | | | |
Net realized gains | | | — | | | | — | | | | — | | | | — | | | | — | | | | (0.65 | ) | | | (0.77 | ) |
| | | | | | | | | | | | | | | | | | | | | | | | | | | | | |
Total distributions to shareholders | | | (0.08 | ) | | | (0.18 | ) | | | (0.09 | ) | | | (0.12 | ) | | | (0.14 | ) | | | (0.82 | ) | | | (0.97 | ) |
| | | | | | | | | | | | | | | | | | | | | | | | | | | | | |
Net asset value, end of period | | | $12.78 | | | | $11.86 | | | | $10.75 | | | | $11.05 | | | | $9.65 | | | | $6.56 | | | | $11.98 | |
| | | | | | | | | | | | | | | | | | | | | | | | | | | | | |
Total return | | | 8.45 | % | | | 12.13 | % | | | (1.81 | %) | | | 15.94 | % | | | 49.64 | % | | | (39.30 | %) | | | (4.24 | %) |
| | | | | | | | | | | | | | | | | | | | | | | | | | | | | |
Ratios to average net assets(b) | | | | | | | | | | | | | | | | | | | | | | | | | | | | |
| | | | | | | |
Total gross expenses | | | 1.04 | %(c) | | | 1.08 | % | | | 1.03 | %(c) | | | 0.92 | % | | | 0.92 | % | | | 0.97 | % | | | 0.97 | % |
| | | | | | | | | | | | | | | | | | | | | | | | | | | | | |
Total net expenses(d) | | | 1.04 | %(c) | | | 1.05 | % | | | 0.97 | %(c) | | | 0.92 | % | | | 0.92 | % | | | 0.93 | % | | | 0.93 | % |
| | | | | | | | | | | | | | | | | | | | | | | | | | | | | |
Net investment income | | | 1.18 | %(c) | | | 1.55 | % | | | 1.14 | %(c) | | | 1.26 | % | | | 1.53 | % | | | 1.83 | % | | | 1.22 | % |
| | | | | | | | | | | | | | | | | | | | | | | | | | | | | |
Supplemental data | | | | | | | | | | | | | | | | | | | | | | | | | | | | |
| | | | | | | |
Net assets, end of period (in thousands) | | | $3,852 | | | | $3,394 | | | | $2,762 | | | | $13,828 | | | | $10,093 | | | | $4,173 | | | | $12,092 | |
| | | | | | | | | | | | | | | | | | | | | | | | | | | | | |
Portfolio turnover | | | 31 | % | | | 49 | % | | | 21 | % | | | 37 | % | | | 30 | % | | | 21 | % | | | 25 | % |
| | | | | | | | | | | | | | | | | | | | | | | | | | | | | |
Notes to Financial Highlights
| (a) | For the period from April 1, 2011 to February 29, 2012. During the period, the Fund’s fiscal year end was changed from March 31 to February 29. |
| (b) | In addition to the fees and expenses which the Fund bears directly, the Fund indirectly bears a pro rata share of the fees and expenses of the acquired funds in which it invests. Such indirect expenses are not included in the reported expense ratios. |
| (d) | Total net expenses include the impact of certain waivers/reimbursements made by the Investment Manager and certain of its affiliates, if applicable. |
The accompanying Notes to Financial Statements are an integral part of this statement.
| | |
| 20 | | Semiannual Report 2013 |
| | |
| |
| Columbia Equity Value Fund | | |
Financial Highlights (continued)
| | | | | | | | | | | | | | | | | | | | | | | | | | | | |
| |
| Six Months Ended
August 31, 2013 |
| |
| Year Ended
February 28, |
| |
| Year Ended
February 29, |
| | | Year Ended March 31, | |
Class R | | | (Unaudited) | | | | 2013 | | | | 2012(a) | | | | 2011 | | | | 2010 | | | | 2009 | | | | 2008 | |
Per share data | | | | | | | | | | | | | | | | | | | | | | | | | | | | |
Net asset value, beginning of period | | | $11.82 | | | | $10.72 | | | | $11.02 | | | | $9.63 | | | | $6.54 | | | | $11.98 | | | | $13.43 | |
| | | | | | | | | | | | | | | | | | | | | | | | | | | | | |
Income from investment operations: | | | | | | | | | | | | | | | | | | | | | | | | | | | | |
| | | | | | | |
Net investment income | | | 0.06 | | | | 0.13 | | | | 0.09 | | | | 0.08 | | | | 0.08 | | | | 0.15 | | | | 0.13 | |
| | | | | | | | | | | | | | | | | | | | | | | | | | | | | |
Net realized and unrealized gain (loss) | | | 0.91 | | | | 1.11 | | | | (0.33 | ) | | | 1.39 | | | | 3.12 | | | | (4.79 | ) | | | (0.65 | ) |
| | | | | | | | | | | | | | | | | | | | | | | | | | | | | |
Total from investment operations | | | 0.97 | | | | 1.24 | | | | (0.24 | ) | | | 1.47 | | | | 3.20 | | | | (4.64 | ) | | | (0.52 | ) |
| | | | | | | | | | | | | | | | | | | | | | | | | | | | | |
Less distributions to shareholders: | | | | | | | | | | | | | | | | | | | | | | | | | | | | |
| | | | | | | |
Net investment income | | | (0.07 | ) | | | (0.14 | ) | | | (0.06 | ) | | | (0.08 | ) | | | (0.11 | ) | | | (0.15 | ) | | | (0.16 | ) |
| | | | | | | | | | | | | | | | | | | | | | | | | | | | | |
Net realized gains | | | — | | | | — | | | | — | | | | — | | | | — | | | | (0.65 | ) | | | (0.77 | ) |
| | | | | | | | | | | | | | | | | | | | | | | | | | | | | |
Total distributions to shareholders | | | (0.07 | ) | | | (0.14 | ) | | | (0.06 | ) | | | (0.08 | ) | | | (0.11 | ) | | | (0.80 | ) | | | (0.93 | ) |
| | | | | | | | | | | | | | | | | | | | | | | | | | | | | |
Net asset value, end of period | | | $12.72 | | | | $11.82 | | | | $10.72 | | | | $11.02 | | | | $9.63 | | | | $6.54 | | | | $11.98 | |
| | | | | | | | | | | | | | | | | | | | | | | | | | | | | |
Total return | | | 8.22 | % | | | 11.68 | % | | | (2.08 | %) | | | 15.35 | % | | | 49.13 | % | | | (39.60 | %) | | | (4.45 | %) |
| | | | | | | | | | | | | | | | | | | | | | | | | | | | | |
Ratios to average net assets(b) | | | | | | | | | | | | | | | | | | | | | | | | | | | | |
| | | | | | | |
Total gross expenses | | | 1.44 | %(c) | | | 1.51 | % | | | 1.47 | %(c) | | | 1.39 | % | | | 1.45 | % | | | 1.50 | % | | | 1.46 | % |
| | | | | | | | | | | | | | | | | | | | | | | | | | | | | |
Total net expenses(d) | | | 1.43 | %(c)(e) | | | 1.41 | % | | | 1.38 | %(c) | | | 1.39 | % | | | 1.45 | % | | | 1.25 | % | | | 1.21 | % |
| | | | | | | | | | | | | | | | | | | | | | | | | | | | | |
Net investment income | | | 0.95 | %(c) | | | 1.18 | % | | | 0.95 | %(c) | | | 0.78 | % | | | 0.88 | % | | | 1.55 | % | | | 0.94 | % |
| | | | | | | | | | | | | | | | | | | | | | | | | | | | | |
Supplemental data | | | | | | | | | | | | | | | | | | | | | | | | | | | | |
| | | | | | | |
Net assets, end of period (in thousands) | | | $953 | | | | $38 | | | | $29 | | | | $34 | | | | $30 | | | | $2 | | | | $4 | |
| | | | | | | | | | | | | | | | | | | | | | | | | | | | | |
Portfolio turnover | | | 31 | % | | | 49 | % | | | 21 | % | | | 37 | % | | | 30 | % | | | 21 | % | | | 25 | % |
| | | | | | | | | | | | | | | | | | | | | | | | | | | | | |
Notes to Financial Highlights
| (a) | For the period from April 1, 2011 to February 29, 2012. During the period, the Fund’s fiscal year end was changed from March 31 to February 29. |
| (b) | In addition to the fees and expenses which the Fund bears directly, the Fund indirectly bears a pro rata share of the fees and expenses of the acquired funds in which it invests. Such indirect expenses are not included in the reported expense ratios. |
| (d) | Total net expenses include the impact of certain waivers/reimbursements made by the Investment Manager and certain of its affiliates, if applicable. |
| (e) | The benefits derived from expense reductions had an impact of less than 0.01%. |
The accompanying Notes to Financial Statements are an integral part of this statement.
| | | | |
| Semiannual Report 2013 | | | 21 | |
| | |
| |
| | Columbia Equity Value Fund |
Financial Highlights (continued)
| | | | | | | | | | | | | | | | | | | | | | | | | | | | |
| |
| Six Months Ended
August 31, 2013 |
| |
| Year Ended
February 28, |
| |
| Year Ended
February 29, |
| | | Year Ended March 31, | |
Class R4 | | | (Unaudited) | | | | 2013 | | | | 2012(a) | | | | 2011 | | | | 2010 | | | | 2009 | | | | 2008 | |
Per share data | | | | | | | | | | | | | | | | | | | | | | | | | | | | |
Net asset value, beginning of period | | | $11.86 | | | | $10.74 | | | | $11.07 | | | | $9.64 | | | | $6.55 | | | | $11.98 | | | | $13.43 | |
| | | | | | | | | | | | | | | | | | | | | | | | | | | | | |
Income from investment operations: | | | | | | | | | | | | | | | | | | | | | | | | | | | | |
| | | | | | | |
Net investment income | | | 0.08 | | | | 0.15 | | | | 0.13 | | | | 0.10 | | | | 0.11 | | | | 0.15 | | | | 0.12 | |
| | | | | | | | | | | | | | | | | | | | | | | | | | | | | |
Net realized and unrealized gain (loss) | | | 0.93 | | | | 1.13 | | | | (0.34 | ) | | | 1.40 | | | | 3.10 | | | | (4.78 | ) | | | (0.61 | ) |
| | | | | | | | | | | | | | | | | | | | | | | | | | | | | |
Total from investment operations | | | 1.01 | | | | 1.28 | | | | (0.21 | ) | | | 1.50 | | | | 3.21 | | | | (4.63 | ) | | | (0.49 | ) |
| | | | | | | | | | | | | | | | | | | | | | | | | | | | | |
Less distributions to shareholders: | | | | | | | | | | | | | | | | | | | | | | | | | | | | |
| | | | | | | |
Net investment income | | | (0.09 | ) | | | (0.16 | ) | | | (0.12 | ) | | | (0.07 | ) | | | (0.12 | ) | | | (0.15 | ) | | | (0.19 | ) |
| | | | | | | | | | | | | | | | | | | | | | | | | | | | | |
Net realized gains | | | — | | | | — | | | | — | | | | — | | | | — | | | | (0.65 | ) | | | (0.77 | ) |
| | | | | | | | | | | | | | | | | | | | | | | | | | | | | |
Total distributions to shareholders | | | (0.09 | ) | | | (0.16 | ) | | | (0.12 | ) | | | (0.07 | ) | | | (0.12 | ) | | | (0.80 | ) | | | (0.96 | ) |
| | | | | | | | | | | | | | | | | | | | | | | | | | | | | |
Net asset value, end of period | | | $12.78 | | | | $11.86 | | | | $10.74 | | | | $11.07 | | | | $9.64 | | | | $6.55 | | | | $11.98 | |
| | | | | | | | | | | | | | | | | | | | | | | | | | | | | |
Total return | | | 8.52 | % | | | 12.03 | % | | | (1.77 | %) | | | 15.67 | % | | | 49.35 | % | | | (39.51 | %) | | | (4.22 | %) |
| | | | | | | | | | | | | | | | | | | | | | | | | | | | | |
Ratios to average net assets(b) | | | | | | | | | | | | | | | | | | | | | | | | | | | | |
| | | | | | | |
Total gross expenses | | | 0.94 | %(c) | | | 1.21 | % | | | 1.29 | %(c) | | | 1.18 | % | | | 1.17 | % | | | 1.20 | % | | | 1.37 | % |
| | | | | | | | | | | | | | | | | | | | | | | | | | | | | |
Total net expenses(d) | | | 0.93 | %(c)(e) | | | 1.15 | % | | | 0.92 | %(c) | | | 1.18 | % | | | 1.17 | % | | | 1.19 | % | | | 1.12 | %(f) |
| | | | | | | | | | | | | | | | | | | | | | | | | | | | | |
Net investment income | | | 1.31 | %(c) | | | 1.43 | % | | | 1.40 | %(c) | | | 1.07 | % | | | 1.32 | % | | | 1.71 | % | | | 1.06 | % |
| | | | | | | | | | | | | | | | | | | | | | | | | | | | | |
Supplemental data | | | | | | | | | | | | | | | | | | | | | | | | | | | | |
| | | | | | | |
Net assets, end of period (in thousands) | | | $52 | | | | $8 | | | | $8 | | | | $8 | | | | $183 | | | | $107 | | | | $138 | |
| | | | | | | | | | | | | | | | | | | | | | | | | | | | | |
Portfolio turnover | | | 31 | % | | | 49 | % | | | 21 | % | | | 37 | % | | | 30 | % | | | 21 | % | | | 25 | % |
| | | | | | | | | | | | | | | | | | | | | | | | | | | | | |
Notes to Financial Highlights
| (a) | For the period from April 1, 2011 to February 29, 2012. During the period, the Fund’s fiscal year end was changed from March 31 to February 29. |
| (b) | In addition to the fees and expenses which the Fund bears directly, the Fund indirectly bears a pro rata share of the fees and expenses of the acquired funds in which it invests. Such indirect expenses are not included in the reported expense ratios. |
| (d) | Total net expenses include the impact of certain waivers/reimbursements made by the Investment Manager and certain of its affiliates, if applicable. |
| (e) | The benefits derived from expense reductions had an impact of less than 0.01%. |
| (f) | The ratio of net expenses after reduction for earnings and bank fee credits was 1.10% |
The accompanying Notes to Financial Statements are an integral part of this statement.
| | |
| 22 | | Semiannual Report 2013 |
| | |
| |
| Columbia Equity Value Fund | | |
Financial Highlights (continued)
| | | | | | | | | | | | | | | | | | | | | | | | | | | | |
| |
| Six Months Ended
August 31, 2013 |
| |
| Year Ended
February 28, |
| |
| Year Ended
February 29, |
| | | Year Ended March 31, | |
Class R5 | | | (Unaudited) | | | | 2013 | | | | 2012(a) | | | | 2011 | | | | 2010 | | | | 2009 | | | | 2008 | |
Per share data | | | | | | | | | | | | | | | | | | | | | | | | | | | | |
Net asset value, beginning of period | | | $11.83 | | | | $10.73 | | | | $11.03 | | | | $9.63 | | | | $6.54 | | | | $11.98 | | | | $13.43 | |
| | | | | | | | | | | | | | | | | | | | | | | | | | | | | |
Income from investment operations: | | | | | | | | | | | | | | | | | | | | | | | | | | | | |
| | | | | | | |
Net investment income | | | 0.09 | | | | 0.19 | | | | 0.15 | | | | 0.14 | | | | 0.15 | | | | 0.20 | | | | 0.20 | |
| | | | | | | | | | | | | | | | | | | | | | | | | | | | | |
Net realized and unrealized gain (loss) | | | 0.92 | | | | 1.11 | | | | (0.33 | ) | | | 1.41 | | | | 3.10 | | | | (4.80 | ) | | | (0.65 | ) |
| | | | | | | | | | | | | | | | | | | | | | | | | | | | | |
Total from investment operations | | | 1.01 | | | | 1.30 | | | | (0.18 | ) | | | 1.55 | | | | 3.25 | | | | (4.60 | ) | | | (0.45 | ) |
| | | | | | | | | | | | | | | | | | | | | | | | | | | | | |
Less distributions to shareholders: | | | | | | | | | | | | | | | | | | | | | | | | | | | | |
| | | | | | | |
Net investment income | | | (0.09 | ) | | | (0.20 | ) | | | (0.12 | ) | | | (0.15 | ) | | | (0.16 | ) | | | (0.19 | ) | | | (0.23 | ) |
| | | | | | | | | | | | | | | | | | | | | | | | | | | | | |
Net realized gains | | | — | | | | — | | | | — | | | | — | | | | — | | | | (0.65 | ) | | | (0.77 | ) |
| | | | | | | | | | | | | | | | | | | | | | | | | | | | | |
Total distributions to shareholders | | | (0.09 | ) | | | (0.20 | ) | | | (0.12 | ) | | | (0.15 | ) | | | (0.16 | ) | | | (0.84 | ) | | | (1.00 | ) |
| | | | | | | | | | | | | | | | | | | | | | | | | | | | | |
Net asset value, end of period | | | $12.75 | | | | $11.83 | | | | $10.73 | | | | $11.03 | | | | $9.63 | | | | $6.54 | | | | $11.98 | |
| | | | | | | | | | | | | | | | | | | | | | | | | | | | | |
Total return | | | 8.60 | % | | | 12.34 | % | | | (1.53 | %) | | | 16.26 | % | | | 50.15 | % | | | (39.29 | %) | | | (3.98 | %) |
| | | | | | | | | | | | | | | | | | | | | | | | | | | | | |
Ratios to average net assets(b) | | | | | | | | | | | | | | | | | | | | | | | | | | | | |
| | | | | | | |
Total gross expenses | | | 0.79 | %(c) | | | 0.83 | % | | | 0.79 | %(c) | | | 0.67 | % | | | 0.67 | % | | | 0.75 | % | | | 0.71 | % |
| | | | | | | | | | | | | | | | | | | | | | | | | | | | | |
Total net expenses(d) | | | 0.79 | %(c) | | | 0.80 | % | | | 0.73 | %(c) | | | 0.67 | % | | | 0.67 | % | | | 0.75 | % | | | 0.71 | % |
| | | | | | | | | | | | | | | | | | | | | | | | | | | | | |
Net investment income | | | 1.42 | %(c) | | | 1.78 | % | | | 1.59 | %(c) | | | 1.49 | % | | | 1.72 | % | | | 2.05 | % | | | 1.44 | % |
| | | | | | | | | | | | | | | | | | | | | | | | | | | | | |
Supplemental data | | | | | | | | | | | | | | | | | | | | | | | | | | | | |
| | | | | | | |
Net assets, end of period (in thousands) | | | $1,207 | | | | $1,149 | | | | $1,043 | | | | $1,066 | | | | $7 | | | | $2 | | | | $4 | |
| | | | | | | | | | | | | | | | | | | | | | | | | | | | | |
Portfolio turnover | | | 31 | % | | | 49 | % | | | 21 | % | | | 37 | % | | | 30 | % | | | 21 | % | | | 25 | % |
| | | | | | | | | | | | | | | | | | | | | | | | | | | | | |
Notes to Financial Highlights
| (a) | For the period from April 1, 2011 to February 29, 2012. During the period, the Fund’s fiscal year end was changed from March 31 to February 29. |
| (b) | In addition to the fees and expenses which the Fund bears directly, the Fund indirectly bears a pro rata share of the fees and expenses of the acquired funds in which it invests. Such indirect expenses are not included in the reported expense ratios. |
| (d) | Total net expenses include the impact of certain waivers/reimbursements made by the Investment Manager and certain of its affiliates, if applicable. |
The accompanying Notes to Financial Statements are an integral part of this statement.
| | | | |
| Semiannual Report 2013 | | | 23 | |
| | |
| |
| | Columbia Equity Value Fund |
Financial Highlights (continued)
| | | | | | | | | | | | | | | | | | | | | | | | | | | | |
| |
| Six Months Ended
August 31, 2013 |
| |
| Year Ended
February 28, |
| |
| Year Ended
February 29, |
| | | Year Ended March 31, | |
Class W | | | (Unaudited) | | | | 2013 | | | | 2012(a) | | | | 2011 | | | | 2010 | | | | 2009 | | | | 2008 | |
Per share data | | | | | | | | | | | | | | | | | | | | | | | | | | | | |
Net asset value, beginning of period | | | $11.89 | | | | $10.76 | | | | $11.03 | | | | $9.63 | | | | $6.54 | | | | $11.98 | | | | $13.43 | |
| | | | | | | | | | | | | | | | | | | | | | | | | | | | | |
Income from investment operations: | | | | | | | | | | | | | | | | | | | | | | | | | | | | |
| | | | | | | |
Net investment income | | | 0.07 | | | | 0.15 | | | | 0.09 | | | | 0.11 | | | | 0.12 | | | | 0.16 | | | | 0.14 | |
| | | | | | | | | | | | | | | | | | | | | | | | | | | | | |
Net realized and unrealized gain (loss) | | | 0.93 | | | | 1.12 | | | | (0.33 | ) | | | 1.40 | | | | 3.10 | | | | (4.80 | ) | | | (0.65 | ) |
| | | | | | | | | | | | | | | | | | | | | | | | | | | | | |
Total from investment operations | | | 1.00 | | | | 1.27 | | | | (0.24 | ) | | | 1.51 | | | | 3.22 | | | | (4.64 | ) | | | (0.51 | ) |
| | | | | | | | | | | | | | | | | | | | | | | | | | | | | |
Less distributions to shareholders: | | | | | | | | | | | | | | | | | | | | | | | | | | | | |
| | | | | | | |
Net investment income | | | (0.07 | ) | | | (0.14 | ) | | | (0.03 | ) | | | (0.11 | ) | | | (0.13 | ) | | | (0.15 | ) | | | (0.17 | ) |
| | | | | | | | | | | | | | | | | | | | | | | | | | | | | |
Net realized gains | | | — | | | | — | | | | — | | | | — | | | | — | | | | (0.65 | ) | | | (0.77 | ) |
| | | | | | | | | | | | | | | | | | | | | | | | | | | | | |
Total distributions to shareholders | | | (0.07 | ) | | | (0.14 | ) | | | (0.03 | ) | | | (0.11 | ) | | | (0.13 | ) | | | (0.80 | ) | | | (0.94 | ) |
| | | | | | | | | | | | | | | | | | | | | | | | | | | | | |
Net asset value, end of period | | | $12.82 | | | | $11.89 | | | | $10.76 | | | | $11.03 | | | | $9.63 | | | | $6.54 | | | | $11.98 | |
| | | | | | | | | | | | | | | | | | | | | | | | | | | | | |
Total return | | | 8.44 | % | | | 11.92 | % | | | (2.19 | %) | | | 15.82 | % | | | 49.56 | % | | | (39.54 | %) | | | (4.36 | %) |
| | | | | | | | | | | | | | | | | | | | | | | | | | | | | |
Ratios to average net assets(b) | | | | | | | | | | | | | | | | | | | | | | | | | | | | |
| | | | | | | |
Total gross expenses | | | 1.20 | %(c) | | | 1.26 | % | | | 1.13 | %(c) | | | 1.14 | % | | | 1.03 | % | | | 1.15 | % | | | 1.12 | % |
| | | | | | | | | | | | | | | | | | | | | | | | | | | | | |
Total net expenses(d) | | | 1.18 | %(c)(e) | | | 1.16 | % | | | 1.10 | %(c)(e) | | | 1.14 | % | | | 1.03 | % | | | 1.15 | % | | | 1.12 | % |
| | | | | | | | | | | | | | | | | | | | | | | | | | | | | |
Net investment income | | | 1.06 | %(c) | | | 1.38 | % | | | 0.89 | %(c) | | | 1.04 | % | | | 1.45 | % | | | 1.66 | % | | | 1.03 | % |
| | | | | | | | | | | | | | | | | | | | | | | | | | | | | |
Supplemental data | | | | | | | | | | | | | | | | | | | | | | | | | | | | |
| | | | | | | |
Net assets, end of period (in thousands) | | | $17 | | | | $13 | | | | $25 | | | | $20,400 | | | | $4 | | | | $2 | | | | $5 | |
| | | | | | | | | | | | | | | | | | | | | | | | | | | | | |
Portfolio turnover | | | 31 | % | | | 49 | % | | | 21 | % | | | 37 | % | | | 30 | % | | | 21 | % | | | 25 | % |
| | | | | | | | | | | | | | | | | | | | | | | | | | | | | |
Notes to Financial Highlights
| (a) | For the period from April 1, 2011 to February 29, 2012. During the period, the Fund’s fiscal year end was changed from March 31 to February 29. |
| (b) | In addition to the fees and expenses which the Fund bears directly, the Fund indirectly bears a pro rata share of the fees and expenses of the acquired funds in which it invests. Such indirect expenses are not included in the reported expense ratios. |
| (d) | Total net expenses include the impact of certain waivers/reimbursements made by the Investment Manager and certain of its affiliates, if applicable. |
| (e) | The benefits derived from expense reductions had an impact of less than 0.01%. |
The accompanying Notes to Financial Statements are an integral part of this statement.
| | |
| 24 | | Semiannual Report 2013 |
| | |
| |
| Columbia Equity Value Fund | | |
Financial Highlights (continued)
| | | | |
| |
| Six Months Ended
August 31, 2013(a) |
|
Class Y | | | (Unaudited) | |
Per share data | | | | |
Net asset value, beginning of period | | | $11.61 | |
| | | | | |
Income from investment operations | | | | |
| |
Net investment income | | | 0.11 | |
| | | | | |
Net realized and unrealized gain | | | 0.89 | |
| | | | | |
Total from investment operations | | | 1.00 | |
| | | | | |
Less distributions to shareholders: | | | | |
| |
Net investment income | | | (0.10 | ) |
| | | | | |
Total distributions to shareholders | | | (0.10 | ) |
| | | | | |
Net asset value, end of period | | | $12.51 | |
| | | | | |
Total return | | | 8.63 | % |
| | | | | |
Ratios to average net assets(b) | | | | |
| |
Total gross expenses | | | 0.72 | %(c) |
| | | | | |
Total net expenses(d) | | | 0.72 | %(c) |
| | | | | |
Net investment income | | | 1.70 | %(c) |
| | | | | |
Supplemental data | | | | |
| |
Net assets, end of period (in thousands) | | | $3,766 | |
| | | | | |
Portfolio turnover | | | 31 | % |
| | | | | |
Notes to Financial Highlights
| (a) | Shares commenced operations on February 28, 2013. |
| (b) | In addition to the fees and expenses which the Fund bears directly, the Fund indirectly bears a pro rata share of the fees and expenses of the acquired funds in which it invests. Such indirect expenses are not included in the reported expense ratios. |
| (d) | Total net expenses include the impact of certain waivers/reimbursements made by the Investment Manager and certain of its affiliates, if applicable. |
The accompanying Notes to Financial Statements are an integral part of this statement.
| | | | |
| Semiannual Report 2013 | | | 25 | |
| | |
| |
| | Columbia Equity Value Fund |
Financial Highlights (continued)
| | | | | | | | | | | | | | | | |
| |
| Six Months Ended
August 31, 2013 |
| |
| Year Ended
February 28, |
| |
| Year Ended
February 29, |
| |
| Year Ended
March 31, |
|
Class Z | | | (Unaudited) | | | | 2013 | | | | 2012(a) | | | | 2011(b) | |
Per share data | | | | | | | | | | | | | | | | |
Net asset value, beginning of period | | | $11.84 | | | | $10.73 | | | | $11.03 | | | | $9.32 | |
| | | | | | | | | | | | | | | | | |
Income from investment operations: | | | | | | | | | | | | | | | | |
| | | | |
Net investment income | | | 0.10 | | | | 0.18 | | | | 0.15 | | | | 0.06 | |
| | | | | | | | | | | | | | | | | |
Net realized and unrealized gain (loss) | | | 0.91 | | | | 1.12 | | | | (0.34 | ) | | | 1.72 | |
| | | | | | | | | | | | | | | | | |
Total from investment operations | | | 1.01 | | | | 1.30 | | | | (0.19 | ) | | | 1.78 | |
| | | | | | | | | | | | | | | | | |
Less distributions to shareholders: | | | | | | | | | | | | | | | | |
| | | | |
Net investment income | | | (0.09 | ) | | | (0.19 | ) | | | (0.11 | ) | | | (0.07 | ) |
| | | | | | | | | | | | | | | | | |
Total distributions to shareholders | | | (0.09 | ) | | | (0.19 | ) | | | (0.11 | ) | | | (0.07 | ) |
| | | | | | | | | | | | | | | | | |
Net asset value, end of period | | | $12.76 | | | | $11.84 | | | | $10.73 | | | | $11.03 | |
| | | | | | | | | | | | | | | | | |
Total return | | | 8.53 | % | | | 12.32 | % | | | (1.62 | %) | | | 19.16 | % |
| | | | | | | | | | | | | | | | | |
Ratios to average net assets(c) | | | | | | | | | | | | | | | | |
| | | | |
Total gross expenses | | | 0.93 | %(d) | | | 1.01 | % | | | 0.96 | %(d) | | | 0.87 | %(d) |
| | | | | | | | | | | | | | | | | |
Total net expenses(e) | | | 0.93 | %(d)(f) | | | 0.91 | %(f) | | | 0.86 | %(d)(f) | | | 0.87 | %(d) |
| | | | | | | | | | | | | | | | | |
Net investment income | | | 1.50 | %(d) | | | 1.68 | % | | | 1.67 | %(d) | | | 1.35 | %(d) |
| | | | | | | | | | | | | | | | | |
Supplemental data | | | | | | | | | | | | | | | | |
| | | | |
Net assets, end of period (in thousands) | | | $114,315 | | | | $785 | | | | $552 | | | | $3 | |
| | | | | | | | | | | | | | | | | |
Portfolio turnover | | | 31 | % | | | 49 | % | | | 21 | % | | | 37 | % |
| | | | | | | | | | | | | | | | | |
Notes to Financial Highlights
| (a) | For the period from April 1, 2011 to February 29, 2012. During the period, the Fund’s fiscal year end was changed from March 31 to February 29. |
| (b) | For the period from September 27, 2010 (commencement of operations) to March 31, 2011. |
| (c) | In addition to the fees and expenses which the Fund bears directly, the Fund indirectly bears a pro rata share of the fees and expenses of the acquired funds in which it invests. Such indirect expenses are not included in the reported expense ratios. |
| (e) | Total net expenses include the impact of certain waivers/reimbursements made by the Investment Manager and certain of its affiliates, if applicable. |
| (f) | The benefits derived from expense reductions had an impact of less than 0.01%. |
The accompanying Notes to Financial Statements are an integral part of this statement.
| | |
| 26 | | Semiannual Report 2013 |
| | |
| |
| Columbia Equity Value Fund | | |
Notes to Financial Statements
August 31, 2013 (Unaudited)
Note 1. Organization
Columbia Equity Value Fund (the Fund), a series of Columbia Funds Series Trust II (the Trust), is a diversified fund. The Trust is registered under the Investment Company Act of 1940, as amended (the 1940 Act), as an open-end management investment company organized as a Massachusetts business trust.
Fund Shares
The Trust may issue an unlimited number of shares (without par value). The Fund offers Class A, Class B, Class C, Class I, Class K, Class R, Class R4, Class R5, Class W, Class Y and Class Z shares. Although all share classes generally have identical voting, dividend and liquidation rights, each share class votes separately when required by law. Different share classes pay different distribution amounts to the extent the expenses of such share classes differ, and distributions in liquidation will be proportional to the net asset value of each share class. Each share class has its own expense structure and sales charges, as applicable.
Class A shares are subject to a maximum front-end sales charge of 5.75% based on the initial investment amount. Class A shares purchased without an initial sales charge in accounts aggregating $1 million to $50 million at the time of purchase are subject to a contingent deferred sales charge (CDSC) if the shares are sold within 18 months of purchase, charged as follows: 1.00% CDSC if redeemed within 12 months of purchase, and 0.50% CDSC if redeemed more than 12, but less than 18, months after purchase.
Class B shares may be subject to a maximum CDSC of 5.00% based upon the holding period after purchase. Class B shares will generally convert to Class A shares eight years after purchase. The Fund no longer accepts investments by new or existing investors in the Fund’s Class B shares, except in connection with the reinvestment of any dividend and/or capital gain distributions in Class B shares of the Fund and exchanges by existing Class B shareholders of certain other funds within the Columbia Family of Funds.
Class C shares are subject to a 1.00% CDSC on shares redeemed within one year of purchase.
Class I shares are not subject to sales charges and are available only to the Columbia Family of Funds.
Class K shares are not subject to sales charges, however this share class is closed to new investors.
Class R shares are not subject to sales charges and are generally available only to certain retirement plans and other eligible investors.
Class R4 shares are not subject to sales charges and are generally available only to omnibus retirement plans and certain other eligible investors.
Class R5 shares are not subject to sales charges and are generally available only to investors purchasing through authorized investment professionals and omnibus retirement plans.
Class W shares are not subject to sales charges and are available only to investors purchasing through authorized investment programs managed by investment professionals, including discretionary managed account programs.
Class Y shares are not subject to sales charges and are generally available only to certain retirement plans.
Class Z shares are not subject to sales charges and are available only to certain eligible investors, which are subject to different investment minimums.
Note 2. Summary of Significant Accounting Policies
Use of Estimates
The preparation of financial statements in accordance with U.S. generally accepted accounting principles (GAAP) requires management to make certain estimates and assumptions that affect the reported amounts of assets and liabilities, the disclosure of contingent assets and liabilities at the date of the financial statements and the reported amounts of revenue and expenses during the reporting period. Actual results could differ from those estimates.
The following is a summary of significant accounting policies consistently followed by the Fund in the preparation of its financial statements.
Security Valuation
All equity securities are valued at the close of business of the New York Stock Exchange (NYSE). Equity securities are valued at the last quoted sales price on the principal exchange or market on which they trade, except for securities traded on the NASDAQ Stock Market, which are valued at the NASDAQ official close price. Unlisted securities or listed securities for which there were no sales during the day are valued at the mean of the latest quoted bid and ask prices on such exchanges or markets.
Foreign equity securities are valued based on quotations from the principal market in which such securities are normally traded. If any foreign share prices are not readily available as a result of limited share activity the securities are valued at the mean of the latest quoted bid and ask prices on such
| | | | |
| Semiannual Report 2013 | | | 27 | |
| | |
| |
| | Columbia Equity Value Fund |
Notes to Financial Statements (continued)
August 31, 2013 (Unaudited)
exchanges or markets. Foreign currency exchange rates are generally determined at 4:00 p.m. Eastern (U.S.) time. However, many securities markets and exchanges outside the U.S. close prior to the close of the NYSE; therefore, the closing prices for securities in such markets or on such exchanges may not fully reflect events that occur after such close but before the close of the NYSE. In those situations, foreign securities will be fair valued pursuant to the policy adopted by the Board of Trustees (the Board), including utilizing a third party pricing service to determine these fair values. The third party pricing service takes into account multiple factors, including, but not limited to, movements in the U.S. securities markets, certain depositary receipts, futures contracts and foreign exchange rates that have occurred subsequent to the close of the foreign exchange or market, to determine a good faith estimate that reasonably reflects the current market conditions as of the close of the NYSE. The fair value of a security is likely to be different from the quoted or published price, if available.
Investments in open-end investment companies, including money market funds, are valued at net asset value.
Investments for which market quotations are not readily available, or that have quotations which management believes are not reliable, are valued at fair value as determined in good faith under consistently applied procedures established by and under the general supervision of the Board. If a security or class of securities (such as foreign securities) is valued at fair value, such value is likely to be different from the last quoted market price for the security.
The determination of fair value often requires significant judgment. To determine fair value, management may use assumptions including but not limited to future cash flows and estimated risk premiums. Multiple inputs from various sources may be used to determine fair value.
Foreign Currency Transactions and Translations
The values of all assets and liabilities denominated in foreign currencies are translated into U.S. dollars at that day’s exchange rates. Net realized and unrealized gains (losses) on foreign currency transactions and translations include gains (losses) arising from the fluctuation in exchange rates between trade and settlement dates on securities transactions, gains (losses) arising from the disposition of foreign currency and currency gains (losses) between the accrual and payment dates on dividends, interest income and foreign withholding taxes.
For financial statement purposes, the Fund does not distinguish that portion of gains (losses) on investments which is due to changes in foreign exchange rates from that which is due to changes in market prices of the investments. Such
fluctuations are included with the net realized and unrealized gains (losses) on investments in the Statement of Operations.
Security Transactions
Security transactions are accounted for on the trade date. Cost is determined and gains (losses) are based upon the specific identification method for both financial statement and federal income tax purposes.
Income Recognition
Corporate actions and dividend income are generally recorded net of any non-reclaimable tax withholdings, on the ex-dividend date or upon receipt of ex-dividend notification in the case of certain foreign securities.
The Fund may receive distributions from holdings in business development companies (BDCs), exchange traded funds (ETFs) and real estate investment trusts (REITs), which report information on the character of their distributions annually. These distributions are allocated to dividend income, capital gain and return of capital based on estimates made by the Fund’s management if actual information has not yet been reported. Return of capital is recorded as a reduction of the cost basis of securities held. If the Fund no longer owns the applicable securities, return of capital is recorded as a realized gain. Management’s estimates are subsequently adjusted when the actual character of the distributions is disclosed by the BDCs, ETFs and REITs, which could result in a proportionate change in return of capital to shareholders.
Awards from class action litigation are recorded as a reduction of cost basis if the Fund still owns the applicable securities on the payment date. If the Fund no longer owns the applicable securities, the proceeds are recorded as realized gains.
Expenses
General expenses of the Trust are allocated to the Fund and other funds of the Trust based upon relative net assets or other expense allocation methodologies determined by the nature of the expense. Expenses directly attributable to the Fund are charged to the Fund. Expenses directly attributable to a specific class of shares are charged to that share class.
Determination of Class Net Asset Value
All income, expenses (other than class-specific expenses, which are charged to that share class, as shown in the Statement of Operations) and realized and unrealized gains (losses) are allocated to each class of the Fund on a daily basis, based on the relative net assets of each class, for purposes of determining the net asset value of each class.
| | |
| 28 | | Semiannual Report 2013 |
| | |
| |
| Columbia Equity Value Fund | | |
Notes to Financial Statements (continued)
August 31, 2013 (Unaudited)
Federal Income Tax Status
The Fund intends to qualify each year as a regulated investment company under Subchapter M of the Internal Revenue Code, as amended, and will distribute substantially all of its taxable income (including net short-term capital gains), if any, for its tax year, and as such will not be subject to federal income taxes. In addition, the Fund intends to distribute in each calendar year substantially all of its net investment income, capital gains and certain other amounts, if any, such that the Fund should not be subject to federal excise tax. Therefore, no federal income or excise tax provision is recorded.
Foreign Taxes
The Fund may be subject to foreign taxes on income, gains on investments or currency repatriation, a portion of which may be recoverable. The Fund will accrue such taxes and recoveries, as applicable, based upon its current interpretation of tax rules and regulations that exist in the markets in which it invests.
Realized gains in certain countries may be subject to foreign taxes at the Fund level, based on statutory rates. The Fund accrues for such foreign taxes on realized and unrealized gains at the appropriate rate for each jurisdiction, as applicable. The amount, if any, is disclosed as a liability on the Statement of Assets and Liabilities.
Distributions to Shareholders
Distributions from net investment income, if any, are declared and paid each calendar quarter. Net realized capital gains, if any, are distributed at least annually. Income distributions and capital gain distributions are determined in accordance with federal income tax regulations, which may differ from GAAP.
Guarantees and Indemnifications
Under the Trust’s organizational documents and, in some cases, by contract, its officers and trustees are indemnified against certain liabilities arising out of the performance of their duties to the Trust or its funds. In addition, certain of the Fund’s contracts with its service providers contain general indemnification clauses. The Fund’s maximum exposure under these arrangements is unknown since the amount of any future claims that may be made against the Fund cannot be determined, and the Fund has no historical basis for predicting the likelihood of any such claims.
Note 3. Fees and Compensation Paid to Affiliates
Investment Management Fees
Under an Investment Management Services Agreement, Columbia Management Investment Advisers, LLC (the Investment Manager), a wholly-owned subsidiary of Ameriprise Financial, Inc. (Ameriprise Financial), determines which securities will be purchased, held or sold. The investment management fee is an annual fee that is equal to a percentage of the Fund’s average daily net assets that declines from 0.66% to 0.49% as the Fund’s net assets increase. The annualized effective investment management fee rate for the six months ended August 31, 2013 was 0.63% of the Fund’s average daily net assets.
Administration Fees
Under an Administrative Services Agreement, the Investment Manager also serves as the Fund Administrator. The Fund pays the Fund Administrator an annual fee for administration and accounting services equal to a percentage of the Fund’s average daily net assets that declines from 0.06% to 0.03% as the Fund’s net assets increase. The annualized effective administration fee rate for the six months ended August 31, 2013 was 0.06% of the Fund’s average daily net assets.
Other Expenses
Other expenses are for, among other things, miscellaneous expenses of the Fund or the Board, including payments to a company providing limited administrative services to the Fund and the Board. That company’s expenses include boardroom and office expense, employee compensation, employee health and retirement benefits, and certain other expenses. For the six months ended August 31, 2013, other expenses paid to this company were $2,063.
Compensation of Board Members
Board members are compensated for their services to the Fund as disclosed in the Statement of Operations. Under a Deferred Compensation Plan (the Plan), the Board members who are not “interested persons” of the Fund, as defined under the 1940 Act, may elect to defer payment of up to 100% of their compensation. Deferred amounts are treated as though equivalent dollar amounts had been invested in shares of certain funds managed by the Investment Manager. The Fund’s liability for these amounts is adjusted for market value changes and remains in the Fund until distributed in accordance with the Plan.
| | | | |
| Semiannual Report 2013 | | | 29 | |
| | |
| |
| | Columbia Equity Value Fund |
Notes to Financial Statements (continued)
August 31, 2013 (Unaudited)
Transfer Agent Fees
Under a Transfer and Dividend Disbursing Agent Agreement, Columbia Management Investment Services Corp. (the Transfer Agent), an affiliate of the Investment Manager and a wholly-owned subsidiary of Ameriprise Financial, is responsible for providing transfer agency services to the Fund. The Transfer Agent has contracted with Boston Financial Data Services (BFDS) to serve as sub-transfer agent.
The Transfer Agent receives monthly account-based service fees based on the number of open accounts and also receives sub-transfer agency fees based on a percentage of the average aggregate value of the Fund’s shares maintained in omnibus accounts (other than omnibus accounts for which American Enterprise Investment Services Inc. is the broker of record or accounts where the beneficial shareholder is a customer of Ameriprise Financial Services, Inc., which are paid a per account fee). The Transfer Agent pays the fees of BFDS for services as sub-transfer agent and is not entitled to reimbursement for such fees from the Fund (with the exception of out-of-pocket fees).
The Transfer Agent also receives compensation from fees for various shareholder services and reimbursements for certain out-of-pocket fees. Class I shares do not pay transfer agent fees. Total transfer agent fees for Class K and Class R5 shares are subject to an annual limitation of not more than 0.05% of the average daily net assets attributable to each share class. Beginning February 28, 2013, Class Y shares are not subject to transfer agent fees for at least twelve months.
For the six months ended August 31, 2013, the Fund’s annualized effective transfer agent fee rates as a percentage of average daily net assets of each class were as follows:
| | | | |
Class A | | | 0.21 | % |
Class B | | | 0.22 | |
Class C | | | 0.21 | |
Class K | | | 0.05 | |
Class R | | | 0.21 | |
Class R4 | | | 0.20 | |
Class R5 | | | 0.05 | |
Class W | | | 0.21 | |
Class Z | | | 0.21 | |
An annual minimum account balance fee of $20 may apply to certain accounts with a value below the applicable share class’ initial minimum investment requirements to reduce the impact of small accounts on transfer agent fees. These minimum account balance fees are recorded as part of expense reductions in the Statement of Operations. For the six months
ended August 31, 2013, these minimum account balance fees reduced total expenses by $19,862.
Plan Administration Fees
Under a Plan Administration Services Agreement with the Transfer Agent, the Fund pays an annual fee at a rate of 0.25% of the Fund’s average daily net assets attributable to Class K shares for the provision of various administrative, recordkeeping, communication and educational services.
Distribution Fees
The Fund has an agreement with Columbia Management Investment Distributors, Inc. (the Distributor), an affiliate of the Investment Manager and a wholly-owned subsidiary of Ameriprise Financial, for distribution and shareholder services. Under a Plan and Agreement of Distribution pursuant to Rule 12b-1, the Fund pays a fee at an annual rate of up to 0.25% of the Fund’s average daily net assets attributable to Class A and Class W shares, a fee at an annual rate of up to 0.50% of the Fund’s average daily net assets attributable to Class R shares (of which up to 0.25% may be used for shareholder services) and a fee at an annual rate of up to 1.00% of the Fund’s average daily net assets attributable to Class B and Class C shares. For Class B and Class C shares, of the 1.00% fee, up to 0.75% is reimbursed for distribution expenses.
The amount of distribution expenses incurred by the Distributor and not yet reimbursed (unreimbursed expense) was approximately $1,790,000 and $161,000 for Class B and Class C shares, respectively. These amounts are based on the most recent information available as of June 30, 2013, and may be recovered from future payments under the distribution plan or CDSCs. To the extent the unreimbursed expense has been fully recovered, the distribution fee is reduced.
Sales Charges
Sales charges, including front-end charges and CDSCs, received by the Distributor for distributing Fund shares were $96,130 for Class A, $2,341 for Class B and $526 for Class C shares for the six months ended August 31, 2013.
Expenses Waived/Reimbursed by the Investment Manager and its Affiliates
The Investment Manager and certain of its affiliates have contractually agreed to waive fees and/or reimburse expenses (excluding certain fees and expenses described below) for the period disclosed below, unless sooner terminated at the sole discretion of the Board, so that the Fund’s net operating expenses, after giving effect to fees waived/expenses reimbursed and any balance credits and/or overdraft charges
| | |
| 30 | | Semiannual Report 2013 |
| | |
| |
| Columbia Equity Value Fund | | |
Notes to Financial Statements (continued)
August 31, 2013 (Unaudited)
from the Fund’s custodian, do not exceed the following annual rates as a percentage of the class’ average daily net assets:
| | | | |
| | | Fee Rates Contractual through June 30, 2014 | |
Class A | | | 1.18 | % |
Class B | | | 1.93 | |
Class C | | | 1.93 | |
Class I | | | 0.77 | |
Class K | | | 1.07 | |
Class R | | | 1.43 | |
Class R4 | | | 0.93 | |
Class R5 | | | 0.82 | |
Class W | | | 1.18 | |
Class Y | | | 0.77 | |
Class Z | | | 0.93 | |
Under the agreement governing these fee waivers and/or expense reimbursement arrangements, the following fees and expenses are excluded from the waiver/reimbursement commitment, and therefore will be paid by the Fund, if applicable: taxes (including foreign transaction taxes), expenses associated with investments in affiliated and non-affiliated pooled investment vehicles (including mutual funds and exchange traded funds), transaction costs and brokerage commissions, costs related to any securities lending program, dividend expenses associated with securities sold short, inverse floater program fees and expenses, transaction charges and interest on borrowed money, interest, extraordinary expenses and any other expenses the exclusion of which is specifically approved by the Board. This agreement may be modified or amended only with approval from all parties.
Note 4. Federal Tax Information
The timing and character of income and capital gain distributions are determined in accordance with income tax regulations, which may differ from GAAP because of temporary or permanent book to tax differences.
At August 31, 2013, the cost of investments for federal income tax purposes was approximately $967,755,000 and the aggregate gross approximate unrealized appreciation and depreciation based on that cost was:
| | | | |
Unrealized appreciation | | | $224,370,000 | |
Unrealized depreciation | | | (8,813,000 | ) |
Net unrealized appreciation | | | $215,557,000 | |
The following capital loss carryforward, determined as of February 28, 2013 may be available to reduce taxable income
arising from future net realized gains on investments, if any, to the extent permitted by the Internal Revenue Code:
| | | | |
| Year of Expiration | | Amount ($) | |
2017 | | | 7,842,960 | |
2018 | | | 12,337,777 | |
Total | | | 20,180,737 | |
Management of the Fund has concluded that there are no significant uncertain tax positions that would require recognition in the financial statements. However, management’s conclusion may be subject to review and adjustment at a later date based on factors including, but not limited to, new tax laws, regulations, and administrative interpretations (including relevant court decisions). Generally, the Fund’s federal tax returns for the prior three fiscal years remain subject to examination by the Internal Revenue Service.
Note 5. Portfolio Information
The cost of purchases and proceeds from sales of securities, excluding short-term obligations, aggregated to $316,622,790 and $421,500,257, respectively, for the six months ended August 31, 2013.
Transactions to realign the Fund’s portfolio following the merger as described in Note 9 are excluded for purposes of calculating the Fund’s portfolio turnover rate. These realignment transactions amounted to cost of purchases and proceeds from sales of $10,957,768 and $8,443,735, respectively.
Note 6. Affiliated Money Market Fund
The Fund invests its daily cash balances in Columbia Short-Term Cash Fund, an affiliated money market fund established for the exclusive use by the Fund and other affiliated funds. The income earned by the Fund from such investments is included as “Dividends — affiliated issuers” in the Statement of Operations. As an investing fund, the Fund indirectly bears its proportionate share of the expenses of Columbia Short-Term Cash Fund.
Note 7. Shareholder Concentration
At August 31, 2013, affiliated shareholder accounts owned 17.5% of the outstanding shares of the Fund. Subscription and redemption activity by concentrated accounts may have a significant effect on the operations of the Fund.
Note 8. Line of Credit
The Fund has entered into a revolving credit facility with a syndicate of banks led by JPMorgan Chase Bank N.A.
| | | | |
| Semiannual Report 2013 | | | 31 | |
| | |
| |
| | Columbia Equity Value Fund |
Notes to Financial Statements (continued)
August 31, 2013 (Unaudited)
whereby the Fund may borrow for the temporary funding of shareholder redemptions or for other temporary or emergency purposes. The credit facility agreement, as amended, which is a collective agreement between the Fund and certain other funds managed by the Investment Manager, severally and not jointly, permits collective borrowings up to $500 million. Interest is charged to each participating fund based on its borrowings at a rate equal to the higher of (i) the overnight federal funds rate plus 1.00% or (ii) the one-month LIBOR rate plus 1.00%. Each borrowing under the credit facility matures no later than 60 days after the date of borrowing. The Fund also pays a commitment fee equal to its pro rata share of the amount of the credit facility at a rate of 0.08% per annum. The commitment fee is included in other expenses in the Statement of Operations.
The Fund had no borrowings during the six months ended August 31, 2013.
Note 9. Fund Merger
At the close of business on April 26, 2013, the Fund acquired the assets and assumed the identified liabilities of Columbia Large Cap Value Fund, a series of Columbia Funds Series Trust (the acquired fund). The reorganization was completed after shareholders of the acquired fund approved a plan of reorganization on February 27, 2013. The purpose of the transaction was to combine two funds managed by the Investment Manager with comparable investment objectives and strategies.
The aggregate net assets of the Fund immediately before the acquisition were $632,565,282 and the combined net assets immediately after the acquisition were $1,217,732,094.
The merger was accomplished by a tax-free exchange of 43,816,346 shares of the acquired fund valued at $585,166,812 (including $138,447,417 of unrealized appreciation).
In exchange for the acquired fund’s shares, the Fund issued the following number of shares:
| | | | |
| | | Shares | |
Class A | | | 32,813,908 | |
Class B | | | 680,034 | |
Class C | | | 2,025,364 | |
Class I | | | 271 | |
Class R | | | 59,981 | |
Class W | | | 263 | |
Class Y | | | 318,778 | |
Class Z | | | 11,446,337 | |
For financial reporting purposes, net assets received and shares issued by the Fund were recorded at fair value; however, the acquired fund’s cost of investments was carried forward.
The financial statements reflect the operations of the Fund for the period prior to the merger and the combined fund for the period subsequent to the merger. Because the combined investment portfolios have been managed as a single integrated portfolio since the merger was completed, it is not practicable to separate the amounts of revenue and earnings of the acquired fund that have been included in the combined Fund’s Statement of Operations since the merger was completed.
Assuming the merger had been completed on March 1, 2013, the Fund’s pro-forma net investment income, net gain on investments, net change in unrealized depreciation and net increase in net assets from operations for the six months ended August 31, 2013 would have been approximately $6.4 million, $115.1 million, $(20.4) million and $101.2 million, respectively.
Note 10. Significant Risks
Financial Sector Risk
The Fund’s portfolio managers may invest significantly in issuers operating in the financial sector. The Fund may be more susceptible to the particular risks of this sector than if the Fund were invested in a wider variety of issuers operating in unrelated sectors.
Note 11. Subsequent Events
Management has evaluated the events and transactions that have occurred through the date the financial statements were issued and noted no items requiring adjustment of the financial statements or additional disclosure.
Note 12. Information Regarding Pending and Settled Legal Proceedings
In December 2005, without admitting or denying the allegations, American Express Financial Corporation (AEFC, which is now known as Ameriprise Financial, Inc. (Ameriprise Financial)) entered into settlement agreements with the Securities and Exchange Commission (SEC) and Minnesota Department of Commerce (MDOC) related to market timing activities. As a result, AEFC was censured and ordered to cease and desist from committing or causing any violations of certain provisions of the Investment Advisers Act of 1940, the Investment Company Act of 1940, and various Minnesota laws. AEFC agreed to pay disgorgement of $10 million and civil money penalties of $7 million. AEFC
| | |
| 32 | | Semiannual Report 2013 |
| | |
| |
| Columbia Equity Value Fund | | |
Notes to Financial Statements (continued)
August 31, 2013 (Unaudited)
also agreed to retain an independent distribution consultant to assist in developing a plan for distribution of all disgorgement and civil penalties ordered by the SEC in accordance with various undertakings detailed at www.sec.gov/litigation/admin/ia-2451.pdf. Ameriprise Financial and its affiliates have cooperated with the SEC and the MDOC in these legal proceedings, and have made regular reports to the funds’ Boards of Trustees.
Ameriprise Financial and certain of its affiliates have historically been involved in a number of legal, arbitration and regulatory proceedings, including routine litigation, class actions, and governmental actions, concerning matters arising in connection with the conduct of their business activities. Ameriprise Financial believes that the Funds are not currently the subject of, and that neither Ameriprise Financial nor any of its affiliates are the subject of, any pending legal, arbitration or regulatory proceedings that are likely to have a material adverse effect on the Funds or the ability of Ameriprise Financial or its affiliates to perform under their contracts with the Funds. Ameriprise Financial is required to make 10-Q, 10-K and, as necessary, 8-K filings with the Securities and Exchange Commission on legal and regulatory matters that relate to Ameriprise Financial and its affiliates. Copies of these filings may be obtained by accessing the SEC website at www.sec.gov.
There can be no assurance that these matters, or the adverse publicity associated with them, will not result in increased fund redemptions, reduced sale of fund shares or other adverse consequences to the Funds. Further, although we believe proceedings are not likely to have a material adverse effect on the Funds or the ability of Ameriprise Financial or its affiliates to perform under their contracts with the Funds, these proceedings are subject to uncertainties and, as such, we are unable to estimate the possible loss or range of loss that may result. An adverse outcome in one or more of these proceedings could result in adverse judgments, settlements, fines, penalties or other relief that could have a material adverse effect on the consolidated financial condition or results of operations of Ameriprise Financial.
| | | | |
| Semiannual Report 2013 | | | 33 | |
| | |
| |
| | Columbia Equity Value Fund |
Approval of Investment Management Services Agreement
Columbia Management Investment Advisers, LLC (Columbia Management or the Investment Manager), a wholly-owned subsidiary of Ameriprise Financial, Inc. (Ameriprise Financial), serves as the investment manager to Columbia Equity Value Fund (the Fund). Under an investment management services agreement (the IMS Agreement), Columbia Management provides investment advice and other services to the Fund and other funds distributed by Columbia Management Investment Distributors, Inc. (collectively, the Funds).
On an annual basis, the Fund’s Board of Trustees (the Board), including the independent Board members (the Independent Trustees), considers renewal of the IMS Agreement. Columbia Management prepared detailed reports for the Board and its Contracts Committee in January, March and April 2013, including reports based on analyses of data provided by an independent organization (Lipper) and a comprehensive response to each item of information requested by independent legal counsel to the Independent Trustees (Independent Legal Counsel) in a letter to the Investment Manager, to assist the Board in making this determination. All of the materials presented in January, March and April were first supplied in draft form to designated representatives of the Independent Trustees, i.e., Independent Legal Counsel, Fund Counsel, the Chair of the Board and the Chair of the Contracts Committee, and the final materials (including proposed additional breakpoints in IMS fees for certain Funds) were revised to reflect discussion and subsequent requests made by the Contracts Committee. In addition, throughout the year, the Board (or its committees) regularly meets with portfolio management teams and senior management personnel, and reviews information prepared by Columbia Management addressing the services Columbia Management provides and Fund performance. Further, the Board retained an independent consulting firm, Bobroff Consulting (the Independent Consultant), to assist the Independent Trustees in their review of IMS fees, expense caps and Ameriprise Financial’s profitability. The Board also accords appropriate weight to the work, deliberations and conclusions of the Contracts Committee, the Investment Review Committee and the Compliance Committee in determining whether to continue the IMS Agreement.
The Board, at its April 15-17, 2013 in-person Board meeting (the April Meeting), considered the renewal of the IMS Agreement for an additional one-year term. At the April Meeting, Independent Legal Counsel reviewed with the Independent Trustees various factors relevant to the Board’s consideration of advisory agreements and the Board’s legal responsibilities related to such consideration. Following an analysis and discussion of the factors identified below, the Board, including all of the Independent Trustees, approved the renewal of the IMS Agreement.
Nature, Extent and Quality of Services Provided by Columbia Management
The Independent Trustees analyzed various reports and presentations they had received detailing the services performed by Columbia Management, as well as its expertise, resources and capabilities. The Independent Trustees specifically considered many developments during the past year concerning the services provided by Columbia Management, including, in particular, the recent globalization initiative, which fosters increased worldwide investment support of global products, continued investment in upgrading technology (such as the implementation of new systems and hardware), the hiring of a Chief Interest Rate Strategist as part of Columbia Management’s fixed income team and the addition of Columbia Management investment personnel to the Asset Allocation, Quantitative and Technology teams. The Independent Trustees noted the information they received concerning Columbia Management’s ability to retain its key portfolio management personnel. In this regard, the Independent Trustees took into account their comprehensive discussions with Columbia Management’s Chief Investment Officer (the CIO), observing the organizational depth of Columbia Management and the capabilities of its investment personnel. The Independent Trustees also recalled the information the CIO provided them identifying the strengths and areas for enhancement of each Columbia Management investment team, as well as the discussion with the CIO regarding the investment personnel talent being infused to enhance support for certain Funds. The Independent Trustees also observed the materials demonstrating the strength and depth of Columbia Management’s equity and fixed income research departments.
In connection with the Board’s evaluation of the overall package of services provided by Columbia Management, the Board also considered the quality of administrative services provided to the Fund by Columbia Management, recalling the information it received highlighting significant achievements in 2012 in the performance of administrative services (such as strong accounting performance measures, refined derivatives processing and enhancements to the electronic communications under the affiliated and unaffiliated service provider oversight program). In evaluating the quality of services provided under the IMS Agreement and the Fund’s Administrative Services Agreement, the Independent Trustees also took into account the organization and strength of the Fund’s and its service providers’ compliance programs. In addition, the Board also reviewed the financial condition of Columbia Management (and its affiliates) and each entity’s ability to carry out its responsibilities under the IMS Agreement and the Fund’s other services agreements with affiliates of Ameriprise Financial, observing the financial strength of Ameriprise Financial, with its solid balance sheet. The Board also discussed the acceptability of the terms of the IMS Agreement (including the relatively broad scope of services required to be performed by Columbia Management). The Board concluded that the services being performed under the IMS Agreement were of a reasonably high quality.
| | |
| 34 | | Semiannual Report 2013 |
| | |
| |
| Columbia Equity Value Fund | | |
Approval of Investment Management Services Agreement (continued)
Based on the foregoing, and based on other information received (both oral and written, including the information on investment performance referenced below) and other considerations, the Board concluded that Columbia Management and its affiliates were in a position to continue to provide a high quality and level of services to the Fund.
Investment Performance
For purposes of evaluating the nature, extent and quality of services provided under the IMS Agreement, the Board carefully reviewed the investment performance of the Fund. In this regard, the Board considered detailed reports providing the results of analyses performed by an independent organization showing, for various periods, the performance of the Fund, the performance of a benchmark index, the percentage ranking of the Fund among its comparison group and the net assets of the Fund. The Board observed that the Fund’s investment performance was appropriate in light of the particular management style involved and the particular market environment.
Comparative Fees, Costs of Services Provided and the Profits Realized by Columbia Management and its Affiliates from their Relationships with the Fund
The Board reviewed comparative fees and the costs of services to be provided under the IMS Agreement. The Board members considered detailed comparative information set forth in an annual report on fees and expenses, including, among other things, data (based on analyses conducted by an independent organization) showing a comparison of the Fund’s expenses with median expenses paid by funds in its comparative peer universe, as well as data showing the Fund’s contribution to Columbia Management’s profitability. The Board reviewed the fees charged to comparable institutional or other accounts/vehicles managed by Columbia Management and discussed differences in how the products are managed and operated, noting no unreasonable differences in the levels of contractual fees.
The Board accorded particular weight to the notion that the level of fees should reflect a rational pricing model applied consistently across the various product lines in the Fund family, while assuring that the overall fees for each Fund (with few defined exceptions) are generally in line with the “pricing philosophy” (i.e., that the total expense ratio of the Fund is no higher than the median expense ratio of funds in the same comparison universe of the Fund). In this connection, the Board also considered the Independent Consultant’s report that concluded that: (i) the Funds’ standardized investment management fee rates, particularly in the context of the current competitive fee landscape, were within a reasonable range; and (ii) the Funds’ expense cap philosophy of assuring that each Fund’s total expense ratio is not above its peer universe median ratio is reasonable. The Board took into account that the Fund’s total expense ratio (after considering proposed expense caps/waivers) was below the peer universe’s median expense ratio shown in the reports. Based on its review, the Board concluded that the Fund’s investment management fee was fair and reasonable in light of the extent and quality of services that the Fund receives.
The Board also considered the expected profitability of Columbia Management and its affiliates in connection with Columbia Management providing investment management services to the Fund. In this regard, the Board referred to a detailed profitability report, discussing the profitability to Columbia Management and Ameriprise Financial from managing, operating and distributing the Funds. In this regard, the Board observed that 2012 profitability approximates 2011 profitability and that, as was the case in 2011, 2012 profitability remained generally in line with (and, in many cases, lower than) the reported profitability of other asset management firms. Further, the Board considered the Independent Consultant’s report that concluded that Columbia Management’s profitability, particularly in comparison to industry competitors, was reasonable and not excessive. It also took into account the indirect economic benefits flowing to Columbia Management or its affiliates in connection with managing or distributing the Funds, such as the enhanced ability to offer various other financial products to Ameriprise Financial customers, soft dollar benefits and overall reputational advantages. The Board noted that the fees paid by the Funds should permit the Investment Manager to offer competitive compensation to its personnel, make necessary investments in its business and earn an appropriate profit. The Board concluded that profitability levels were reasonable.
Economies of Scale to be Realized
The Board also considered the economies of scale that might be realized by Columbia Management as the Fund grows and took note of the extent to which Fund shareholders might also benefit from such growth. In this regard, the Independent Trustees took into account that IMS fees decline as Fund assets exceed various breakpoints, all of which have not been surpassed.
Based on the foregoing, the Board, including all of the Independent Trustees, concluded that the investment management service fees were fair and reasonable in light of the extent and quality of services provided. In reaching this conclusion, no single factor was determinative. On April 17, 2013, the Board, including all of the Independent Trustees, approved the renewal of the IMS Agreement.
| | | | |
| Semiannual Report 2013 | | | 35 | |
| | |
| |
| | Columbia Equity Value Fund |
[THIS PAGE INTENTIONALLY LEFT BLANK]
| | |
| 36 | | Semiannual Report 2013 |
| | |
| |
| Columbia Equity Value Fund | | |
Important Information About This Report
Each fund mails one shareholder report to each shareholder address. If you would like more than one report, please call shareholder services at 800.345.6611 and additional reports will be sent to you.
The policy of the Board is to vote the proxies of the companies in which each fund holds investments consistent with the procedures as stated in the Statement of Additional Information (SAI). You may obtain a copy of the SAI without charge by calling 800.345.6611; contacting your financial intermediary; visiting columbiamanagement.com; or searching the website of the Securities and Exchange Commission (SEC) at sec.gov. Information regarding how each fund voted proxies relating to portfolio securities is filed with the SEC by August 31 for the most recent 12-month period ending June 30 of that year, and is available without charge by visiting columbiamanagement.com; or searching the website of the SEC at sec.gov.
Each fund files a complete schedule of portfolio holdings with the SEC for the first and third quarters of each fiscal year on Form N-Q. Each fund’s Form N-Q is available on the SEC’s website at sec.gov and may be reviewed and copied at the SEC’s Public Reference Room in Washington, D.C. Information on the operation of the Public Reference Room may be obtained by calling 800.SEC.0330. Each fund’s complete schedule of portfolio holdings, as filed on Form N-Q, can also be obtained without charge, upon request, by calling 800.345.6611.
| | | | |
| Semiannual Report 2013 | | | 37 | |

Columbia Equity Value Fund
P.O. Box 8081
Boston, MA 02266-8081
columbiamanagement.com
This information is for use with concurrent or prior delivery of a fund prospectus. Please read and consider the investment objectives, risks, charges and expenses for any fund carefully before investing. For a prospectus which contains this and other important information about the Fund, go to columbiamanagement.com. The Fund is distributed by Columbia Management Investment Distributors, Inc., member FINRA, and managed by Columbia Management Investment Advisers, LLC.
© 2013 Columbia Management Investment Advisers, LLC. All rights reserved.
SAR145_02_C01_(10/13)
Item 2. Code of Ethics.
Not applicable for semiannual reports.
Item 3. Audit Committee Financial Expert.
Not applicable for semiannual reports.
Item 4. Principal Accountant Fees and Services.
Not applicable for semiannual reports.
Item 5. Audit Committee of Listed Registrants.
Not applicable.
Item 6. Investments
| | (a) | The registrant’s “Schedule I – Investments in securities of unaffiliated issuers” (as set forth in 17 CFR 210.12-12) is included in Item 1 of this Form N-CSR. |
Item 7. Disclosure of Proxy Voting Policies and Procedures for Closed-End Management Investment Companies.
Not applicable.
Item 8. Portfolio Managers of Closed-End Management Investment Companies.
Not applicable.
Item 9. Purchases of Equity Securities by Closed-End Management Investment Company and Affiliated Purchasers.
Not applicable.
Item 10. Submission of Matters to a Vote of Security Holders.
There were no material changes to the procedures by which shareholders may recommend nominees to the registrant’s board of directors.
Item 11. Controls and Procedures.
| | (a) | The registrant’s principal executive officer and principal financial officers, based on their evaluation of the registrant’s disclosure controls and procedures as of a |
| | date within 90 days of the filing of this report, have concluded that such controls and procedures are adequately designed to ensure that material information required to be disclosed by the registrant in Form N-CSR is accumulated and communicated to the registrant’s management, including the principal executive officer and principal financial officer, or persons performing similar functions, as appropriate to allow timely decisions regarding required disclosure. |
| | (b) | There was no change in the registrant’s internal control over financial reporting that occurred during the registrant’s second fiscal quarter of the period covered by this report that has materially affected, or is reasonably likely to materially affect, the registrant’s internal control over financial reporting. |
Item 12. Exhibits.
(a)(1) Code of ethics required to be disclosed under Item 2 of Form N-CSR: Not applicable for semiannual reports.
(a)(2) Certifications pursuant to Rule 30a-2(a) under the Investment Company Act of 1940 (17 CFR 270.30a-2(a)) attached hereto as Exhibit 99.CERT.
(a)(3) Not applicable.
(b) Certification pursuant to Rule 30a-2(b) under the Investment Company Act of 1940 (17 CFR 270.30a-2(b)) attached hereto as Exhibit 99.906CERT.
SIGNATURES
Pursuant to the requirements of the Securities Exchange Act of 1934 and the Investment Company Act of 1940, the registrant has duly caused this report to be signed on its behalf by the undersigned, thereunto duly authorized.
| | |
| (registrant) | | Columbia Funds Series Trust II |
| | |
| |
| By (Signature and Title) | | /s/ J. Kevin Connaughton |
| | J. Kevin Connaughton, President and Principal Executive Officer |
Pursuant to the requirements of the Securities Exchange Act of 1934 and the Investment Company Act of 1940, this report has been signed below by the following persons on behalf of the registrant and in the capacities and on the dates indicated.
| | |
| By (Signature and Title) | | /s/ J. Kevin Connaughton |
| | J. Kevin Connaughton, President and Principal Executive Officer |
| | |
| |
| By (Signature and Title) | | /s/ Michael G. Clarke |
| | Michael G. Clarke, Treasurer and Chief Financial Officer |