UNITED STATES
SECURITIES AND EXCHANGE COMMISSION
Washington, D.C. 20549
FORM N-CSR
CERTIFIED SHAREHOLDER REPORT OF REGISTERED
MANAGEMENT INVESTMENT COMPANIES
Investment Company Act file number 811-21852
Columbia Funds Series Trust II
(Exact name of registrant as specified in charter)
50606 Ameriprise Financial Center
Minneapolis, MN 55474
(Address of principal executive offices) (Zip code)
Ryan Larrenaga
c/o Columbia Management Investment Advisers, LLC
225 Franklin Street
Boston, MA 02110
(Name and address of agent for service)
Registrant’s telephone number, including area code: (800) 345-6611
Date of fiscal year end: August 31
Date of reporting period: February 29, 2016
Form N-CSR is to be used by management investment companies to file reports with the Commission not later than 10 days after the transmission to stockholders of any report that is required to be transmitted to stockholders under Rule 30e-1 under the Investment Company Act of 1940 (17 CFR 270.30e-1). The Commission may use the information provided on Form N-CSR in its regulatory, disclosure review, inspection, and policymaking roles.
A registrant is required to disclose the information specified by Form N-CSR, and the Commission will make this information public. A registrant is not required to respond to the collection of information contained in Form N-CSR unless the Form displays a currently valid Office of Management and Budget (“OMB”) control number. Please direct comments concerning the accuracy of the information collection burden estimate and any suggestions for reducing the burden to Secretary, Securities and Exchange Commission, 450 Fifth Street, NW, Washington, DC 20549-0609. The OMB has reviewed this collection of information under the clearance requirements of 44 U.S.C. § 3507.
Item 1. Reports to Stockholders.

SEMIANNUAL REPORT
February 29, 2016

COLUMBIA LARGE CAP GROWTH FUND IV
(formerly Columbia Marsico Flexible Capital Fund)


ABOUT COLUMBIA THREADNEEDLE INVESTMENTS
Columbia Threadneedle Investments is a leading global asset management group that provides a broad range of actively managed investment strategies and solutions for individual, institutional and corporate clients around the world.
With more than 2,000 people, including over 450 investment professionals based in North America, Europe and Asia, we manage $472 billion* of assets across developed and emerging market equities, fixed income, asset allocation solutions and alternatives. We are the 13th largest manager of long-term mutual fund assets in the U.S.** and the 4th largest manager of retail funds in the U.K.***
Our priority is the investment success of our clients. We aim to deliver the investment outcomes they expect through an investment approach that is team-based, performance-driven and risk-aware. Our culture is dynamic and interactive. By sharing our insights across asset classes and geographies, we generate richer perspectives on global, regional and local investment landscapes. The ability to exchange and debate investment ideas in a collaborative environment enriches our teams’ investment processes. More importantly, it results in better informed investment decisions for our clients.
Columbia funds are distributed by Columbia Management Investment Distributors, Inc., member FINRA, and managed by Columbia Management Investment Advisers, LLC.
Columbia Threadneedle Investments (Columbia Threadneedle) is the global brand name of the Columbia and Threadneedle group of companies.
| * | | In U.S. dollars as of December 31, 2015. Source: Ameriprise Q4 Earnings Release. Includes all assets managed by entities in the Columbia and Threadneedle groups of companies. Contact us for more current data. |
| ** | | Source: ICI as of December 31, 2015 for Columbia Management Investment Advisers, LLC. |
| *** | | Source: Investment Association as of September 2015 for Threadneedle Asset Management Limited. |
© 2016 Columbia Management Investment Advisers, LLC. All rights reserved.
Not part of the shareholder report
PRESIDENT’S MESSAGE

Dear Shareholder,
Today’s investors are typically focused on outcomes, like living a certain retirement lifestyle, paying for college education or building a legacy. But in today’s complex global investment landscape, even simple goals are not easily achieved.
At Columbia Threadneedle Investments, we aspire to help satisfy five core needs of today’s investors:
| | n | | Generate an appropriate stream of income in retirement |
Traditional approaches to generating income may not provide the diversification benefits they once did, and they may actually introduce unwanted risk in today’s market. To seek to improve your potential to live comfortably long term, we endeavor to pursue investments that explore less traveled paths to income.
| n | | Navigate a changing interest rate environment |
Today’s uncertain market environment includes the prospect of a rise in interest rates. Blending traditional investments with non-traditional or alternative products may help protect your wealth during periods of volatility. We can attempt to help strengthen your portfolio with agile products designed to take on the market’s ups and downs.
| n | | Maximize after-tax returns |
In an environment where what you keep may be more important than what you earn, municipal bonds can help mitigate high tax burdens while providing potentially attractive yields. Our state and federal tax-exempt products are aimed at helping investors manage risk, minimize the fluctuation of capital and grow wealth on a more tax-efficient basis.
| n | | Grow assets to achieve financial goals |
We believe that finding and protecting growth comes from a disciplined security selection process designed to create excess return. Our goal is to provide investment solutions built to help you face today’s market challenges and grow your assets at each crossroad of your journey.
| n | | Ease the impact of volatile markets |
Despite a bull market run that has benefited many investors over the past several years, it’s important to remember the lessons of 2008 and the value that a well-diversified portfolio may provide through times of market volatility. We are here to help you hold onto the savings you have worked tirelessly to amass, and to provide you the best opportunity to maintain your standard of living regardless of market conditions.
Find out today how we can help you confidently invest to realize your dreams. Please visit us at blog.columbiathreadneedleus.com/our-best-ideas to learn more about our unique investment solutions.
The world is constantly changing, but our priority remains the same: to help you secure your finances, meet your goals and achieve success. Thank you for your continued investment with us.
Sincerely,

Christopher O. Petersen
President, Columbia Funds
Investors should consider the investment objectives, risks, charges and expenses of a mutual fund carefully before investing. For a free prospectus and summary prospectus, which contains this and other important information about a fund, visit columbiathreadneedle.com/us. The prospectus should be read carefully before investing.
Columbia Funds are distributed by Columbia Management Investment Distributors, Inc., member FINRA, and managed by Columbia Management Investment Advisers, LLC.
© 2016 Columbia Management Investment Advisers, LLC. All rights reserved.
Semiannual Report 2016
| | | | |
| | |
| | COLUMBIA LARGE CAP GROWTH FUND IV | | |
TABLE OF CONTENTS
Fund Investment Manager
Columbia Management Investment
Advisers, LLC
225 Franklin Street
Boston, MA 02110
Fund Distributor
Columbia Management Investment
Distributors, Inc.
225 Franklin Street
Boston, MA 02110
Fund Transfer Agent
Columbia Management Investment
Services Corp.
P.O. Box 8081
Boston, MA 02266-8081
For more information about any of the funds, please visit columbiathreadneedle.com/us or call 800.345.6611. Customer Service Representatives are available to answer your questions Monday through Friday from 8 a.m. to 7 p.m. Eastern time.
The views expressed in this report reflect the current views of the respective parties. These views are not guarantees of future performance and involve certain risks, uncertainties and assumptions that are difficult to predict, so actual outcomes and results may differ significantly from the views expressed. These views are subject to change at any time based upon economic, market or other conditions and the respective parties disclaim any responsibility to update such views. These views may not be relied on as investment advice and, because investment decisions for a Columbia fund are based on numerous factors, may not be relied on as an indication of trading intent on behalf of any particular Columbia fund. References to specific securities should not be construed as a recommendation or investment advice.
Semiannual Report 2016
| | | | |
| | |
| | COLUMBIA LARGE CAP GROWTH FUND IV | | |
PERFORMANCE OVERVIEW
(Unaudited)
Performance Summary
| n | | Columbia Large Cap Growth Fund IV (the Fund) Class A shares returned -6.33% excluding sales charges for the six-month period that ended February 29, 2016. |
| n | | The Fund underperformed its benchmark, the Russell 1000 Growth Index, which returned -1.22% for the same time period. |
| | | | | | | | | | | | | | | | | | |
Average Annual Total Returns (%) (for period ended February 29, 2016) | |
| | | Inception | | 6 Months
Cumulative | | | 1 Year | | | 5 Years | | | Life | |
Class A | | 09/28/10 | | | | | | | | | | | | | | | | |
Excluding sales charges | | | | | -6.33 | | | | -11.54 | | | | 7.97 | | | | 11.00 | |
Including sales charges | | | | | -11.72 | | | | -16.62 | | | | 6.69 | | | | 9.80 | |
Class C | | 09/28/10 | | | | | | | | | | | | | | | | |
Excluding sales charges | | | | | -6.70 | | | | -12.18 | | | | 7.18 | | | | 10.16 | |
Including sales charges | | | | | -7.52 | | | | -12.95 | | | | 7.18 | | | | 10.16 | |
Class I | | 09/28/10 | | | -6.22 | | | | -11.18 | | | | 8.32 | | | | 11.35 | |
Class R | | 09/28/10 | | | -6.47 | | | | -11.75 | | | | 7.69 | | | | 10.69 | |
Class R4* | | 06/25/14 | | | -6.23 | | | | -11.28 | | | | 8.07 | | | | 11.10 | |
Class R5* | | 11/08/12 | | | -6.22 | | | | -11.23 | | | | 8.22 | | | | 11.24 | |
Class Z | | 09/28/10 | | | -6.24 | | | | -11.29 | | | | 8.25 | | | | 11.28 | |
Russell 1000 Growth Index | | | | | -1.22 | | | | -5.05 | | | | 10.95 | | | | 13.46 | |
Returns for Class A are shown with and without the maximum initial sales charge of 5.75%. Returns for Class C are shown with and without the 1.00% contingent deferred sales charge for the first year only. The Fund’s other classes are not subject to sales charges and have limited eligibility. Please see the Fund’s prospectus for details. Performance for different share classes will vary based on differences in sales charges and fees associated with each class. All results shown assume reinvestment of distributions during the period. Returns do not reflect the deduction of taxes that a shareholder may pay on Fund distributions or on the redemption of Fund shares. Performance results reflect the effect of any fee waivers or reimbursements of Fund expenses by Columbia Management Investment Advisers, LLC and/or any of its affiliates. Absent these fee waivers or expense reimbursement arrangements, performance results would have been lower.
The performance information shown represents past performance and is not a guarantee of future results. The investment return and principal value of your investment will fluctuate so that your shares, when redeemed, may be worth more or less than their original cost. Current performance may be lower or higher than the performance information shown. You may obtain performance information current to the most recent month-end by contacting your financial intermediary, visiting columbiathreadneedle.com/us or calling 800.345.6611.
| * | The returns shown for periods prior to the share class inception date (including returns for the Life of the Fund, if shown, which are since Fund inception) include the returns of the Fund’s oldest share class. Since the Fund launched more than one class of shares at its inception, Class A shares were used. These returns are adjusted to reflect any higher class-related operating expenses of the newer share classes, as applicable. Please visit columbiathreadneedle.com/us/investment-products/mutual-funds/appended-performance for more information. |
Effective November 20, 2015 the Fund compares its performance to that of the Russell 1000 Growth Index (replacing the S&P 500 Index). The Fund’s investment manager believes that the new index provides a more appropriate basis for comparing the Fund’s performance in light of the changes made to the Fund’s name and principal investment strategies.
The Russell 1000 Growth Index, an unmanaged index, measures the performance of those Russell 1000 Index companies with higher price-to-book ratios and higher forecasted growth values.
Indices are not available for investment, are not professionally managed and do not reflect sales charges, fees, brokerage commissions, taxes or other expenses of investing. Securities in the Fund may not match those in an index.
| | | | |
| | |
| | COLUMBIA LARGE CAP GROWTH FUND IV | | |
PORTFOLIO OVERVIEW
(Unaudited)
Portfolio Management
John Wilson, CFA
Peter Deininger, CFA, CAIA
Tchintcia Barros, CFA
Effective November 20, 2015, Marsico Capital Management, LLC (Marsico) no longer serves as the subadviser to the Fund and Columbia Management Investment Advisers, LLC assumed the day-to-day management of the Fund’s portfolio.
Morningstar Style Box™
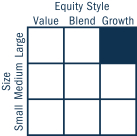
The Morningstar Style Box™ is based on a fund’s portfolio holdings. For equity funds, the vertical axis shows the market capitalization of the stocks owned, and the horizontal axis shows investment style (value, blend, or growth). Information shown is based on the most recent data provided by Morningstar.
© 2016 Morningstar, Inc. All rights reserved. The Morningstar information contained herein: (1) is proprietary to Morningstar and/or its content providers; (2) may not be copied or distributed; and (3) is not warranted to be accurate, complete or timely. Neither Morningstar nor its content providers are responsible for any damages or losses arising from any use of this information.
| | | | |
Top Ten Holdings (%)
(at February 29, 2016) | |
Alphabet, Inc., Class A | | | 5.1 | |
Comcast Corp., Class A | | | 4.2 | |
Microsoft Corp. | | | 4.1 | |
Facebook, Inc., Class A | | | 4.0 | |
Amazon.com, Inc. | | | 4.0 | |
Apple, Inc. | | | 3.6 | |
Visa, Inc., Class A | | | 3.2 | |
PepsiCo, Inc. | | | 3.0 | |
SPDR S&P 500 ETF Trust | | | 3.0 | |
Philip Morris International, Inc. | | | 2.9 | |
Percentages indicated are based upon total investments (excluding Money Market Funds).
For further detail about these holdings, please refer to the section entitled “Portfolio of Investments.”
Fund holdings are as of the date given, are subject to change at any time, and are not recommendations to buy or sell any security.
| | | | |
Portfolio Breakdown (%)
(at February 29, 2016) | |
Common Stocks | | | 89.9 | |
Exchange-Traded Funds | | | 2.8 | |
Money Market Funds | | | 7.3 | |
Total | | | 100.0 | |
Percentages indicated are based upon total investments. The Fund’s portfolio composition is subject to change.
| | | | |
Equity Sector Breakdown (%)
(at February 29, 2016) | |
Consumer Discretionary | | | 22.6 | |
Consumer Staples | | | 12.2 | |
Financials | | | 6.9 | |
Health Care | | | 14.9 | |
Industrials | | | 10.2 | |
Information Technology | | | 32.2 | |
Materials | | | 1.0 | |
Total | | | 100.0 | |
Percentages indicated are based upon total equity investments. The Fund’s portfolio composition is subject to change.
| | | | |
| | |
| | COLUMBIA LARGE CAP GROWTH FUND IV | | |
UNDERSTANDING YOUR FUND’S EXPENSES
(Unaudited)
As an investor, you incur two types of costs. There are transaction costs, which generally include sales charges on purchases and may include redemption fees. There are also ongoing costs, which generally include management fees, distribution and/or service fees, and other fund expenses. The following information is intended to help you understand your ongoing costs (in dollars) of investing in the Fund and to help you compare these costs with the ongoing costs of investing in other mutual funds.
Analyzing Your Fund’s Expenses
To illustrate these ongoing costs, we have provided examples and calculated the expenses paid by investors in each share class of the Fund during the period. The actual and hypothetical information in the table is based on an initial investment of $1,000 at the beginning of the period indicated and held for the entire period. Expense information is calculated two ways and each method provides you with different information. The amount listed in the “Actual” column is calculated using the Fund’s actual operating expenses and total return for the period. You may use the Actual information, together with the amount invested, to estimate the expenses that you paid over the period. Simply divide your account value by $1,000 (for example, an $8,600 account value divided by $1,000 = 8.6), then multiply the results by the expenses paid during the period under the “Actual” column. The amount listed in the “Hypothetical” column assumes a 5% annual rate of return before expenses (which is not the Fund’s actual return) and then applies the Fund’s actual expense ratio for the period to the hypothetical return. You should not use the hypothetical account values and expenses to estimate either your actual account balance at the end of the period or the expenses you paid during the period. See “Compare With Other Funds” below for details on how to use the hypothetical data.
Compare With Other Funds
Since all mutual funds are required to include the same hypothetical calculations about expenses in shareholder reports, you can use this information to compare the ongoing cost of investing in the Fund with other funds. To do so, compare the hypothetical example with the 5% hypothetical examples that appear in the shareholder reports of other funds. As you compare hypothetical examples of other funds, it is important to note that hypothetical examples are meant to highlight the ongoing costs of investing in a fund only and do not reflect any transaction costs, such as sales charges, or redemption or exchange fees. Therefore, the hypothetical calculations are useful in comparing ongoing costs only, and will not help you determine the relative total costs of owning different funds. If transaction costs were included in these calculations, your costs would be higher.
September 1, 2015 – February 29, 2016
| | | | | | | | | | | | | | | | | | | | | | | | | | | | |
| | | Account Value at the
Beginning of the
Period ($) | | | Account Value at the
End of the
Period ($) | | | Expenses Paid During
the Period ($) | | | Fund’s Annualized
Expense Ratio (%) | |
| | | | Actual | | | | Hypothetical | | | | Actual | | | | Hypothetical | | | | Actual | | | | Hypothetical | | | | Actual | |
Class A | | | 1,000.00 | | | | 1,000.00 | | | | 936.70 | | | | 1,018.60 | | | | 6.07 | | | | 6.32 | | | | 1.26 | |
Class C | | | 1,000.00 | | | | 1,000.00 | | | | 933.00 | | | | 1,014.87 | | | | 9.66 | | | | 10.07 | | | | 2.01 | |
Class I | | | 1,000.00 | | | | 1,000.00 | | | | 937.80 | | | | 1,020.49 | | | | 4.24 | | | | 4.42 | | | | 0.88 | |
Class R | | | 1,000.00 | | | | 1,000.00 | | | | 935.30 | | | | 1,017.35 | | | | 7.27 | | | | 7.57 | | | | 1.51 | |
Class R4 | | | 1,000.00 | | | | 1,000.00 | | | | 937.70 | | | | 1,019.84 | | | | 4.87 | | | | 5.07 | | | | 1.01 | |
Class R5 | | | 1,000.00 | | | | 1,000.00 | | | | 937.80 | | | | 1,020.34 | | | | 4.38 | | | | 4.57 | | | | 0.91 | |
Class Z | | | 1,000.00 | | | | 1,000.00 | | | | 937.60 | | | | 1,019.79 | | | | 4.91 | | | | 5.12 | | | | 1.02 | |
Expenses paid during the period are equal to the annualized expense ratio for each class as indicated above, multiplied by the average account value over the period and then multiplied by the number of days in the Fund’s most recent fiscal half year and divided by 366.
Expenses do not include fees and expenses incurred indirectly by the Fund from its investment in underlying funds, including affiliated and non-affiliated pooled investment vehicles, such as mutual funds and exchange-traded funds.
Had Columbia Management Investment Advisers, LLC and/or certain of its affiliates not waived/reimbursed certain fees and expenses, account value at the end of the period would have been reduced.
| | | | |
| | |
| | COLUMBIA LARGE CAP GROWTH FUND IV | | |
PORTFOLIO OF INVESTMENTS
February 29, 2016 (Unaudited)
(Percentages represent value of investments compared to net assets)
| | | | | | | | |
| Common Stocks 90.2% | |
| Issuer | | Shares | | | Value ($) | |
CONSUMER DISCRETIONARY 20.4% | |
Auto Components 0.6% | |
| | |
Visteon Corp. | | | 6,497 | | | | 454,270 | |
|
Hotels, Restaurants & Leisure 1.1% | |
| | |
Norwegian Cruise Line Holdings Ltd.(a) | | | 18,550 | | | | 911,361 | |
|
Household Durables 0.7% | |
| | |
Jarden Corp.(a) | | | 10,317 | | | | 545,563 | |
|
Internet & Catalog Retail 6.0% | |
| | |
Amazon.com, Inc.(a) | | | 5,391 | | | | 2,978,635 | |
| | |
Ctrip.com International Ltd., ADR(a) | | | 13,806 | | | | 564,942 | |
| | |
Expedia, Inc. | | | 4,822 | | | | 502,018 | |
| | |
Priceline Group, Inc. (The)(a) | | | 594 | | | | 751,535 | |
| | | | | | | | | |
Total | | | | | | | 4,797,130 | |
|
Media 6.7% | |
| | |
Comcast Corp., Class A | | | 53,520 | | | | 3,089,710 | |
| | |
DISH Network Corp., Class A(a) | | | 13,548 | | | | 638,517 | |
| | |
Liberty Global PLC, Class C(a) | | | 45,307 | | | | 1,629,240 | |
| | | | | | | | | |
Total | | | | | | | 5,357,467 | |
|
Multiline Retail 1.1% | |
| | |
Dollar General Corp. | | | 11,712 | | | | 869,616 | |
|
Specialty Retail 3.6% | |
| | |
Lowe’s Companies, Inc. | | | 26,109 | | | | 1,763,141 | |
| | |
TJX Companies, Inc. (The) | | | 15,521 | | | | 1,150,106 | |
| | | | | | | | | |
Total | | | | | | | 2,913,247 | |
|
Textiles, Apparel & Luxury Goods 0.6% | |
| | |
lululemon athletica, Inc.(a) | | | 7,683 | | | | 481,955 | |
| | | | | | | | | |
Total Consumer Discretionary | | | | | | | 16,330,609 | |
|
| |
CONSUMER STAPLES 11.0% | |
Beverages 5.4% | |
| | |
Constellation Brands, Inc., Class A | | | 7,509 | | | | 1,061,998 | |
| | |
Molson Coors Brewing Co., Class B | | | 12,200 | | | | 1,040,294 | |
| | |
PepsiCo, Inc. | | | 23,012 | | | | 2,251,034 | |
| | | | | | | | | |
Total | | | | | | | 4,353,326 | |
|
Food & Staples Retailing 2.5% | |
| | |
CVS Health Corp. | | | 20,340 | | | | 1,976,438 | |
|
Food Products 0.4% | |
| | |
Tyson Foods, Inc., Class A | | | 4,472 | | | | 289,562 | |
|
Tobacco 2.7% | |
| | |
Philip Morris International, Inc. | | | 24,073 | | | | 2,191,365 | |
| | | | | | | | | |
Total Consumer Staples | | | | | | | 8,810,691 | |
|
| |
| | | | | | | | |
| Common Stocks (continued) | |
| Issuer | | Shares | | | Value ($) | |
FINANCIALS 6.2% | |
Banks 0.6% | |
| | |
Wells Fargo & Co. | | | 9,728 | | | | 456,438 | |
|
Capital Markets 3.1% | |
| | |
Bank of New York Mellon Corp. (The) | | | 37,770 | | | | 1,336,680 | |
| | |
BlackRock, Inc. | | | 1,139 | | | | 355,323 | |
| | |
Goldman Sachs Group, Inc. (The) | | | 2,781 | | | | 415,843 | |
| | |
Invesco Ltd. | | | 15,904 | | | | 425,273 | |
| | | | | | | | | |
Total | | | | | | | 2,533,119 | |
|
Diversified Financial Services 1.8% | |
| | |
CME Group, Inc. | | | 15,496 | | | | 1,416,954 | |
|
Real Estate Investment Trusts (REITs) 0.7% | |
| | |
Simon Property Group, Inc. | | | 3,011 | | | | 571,277 | |
| | | | | | | | | |
Total Financials | | | | | | | 4,977,788 | |
|
| |
HEALTH CARE 13.4% | |
Biotechnology 5.5% | |
| | |
Alexion Pharmaceuticals, Inc.(a) | | | 5,134 | | | | 722,867 | |
| | |
Alkermes PLC(a) | | | 15,373 | | | | 496,087 | |
| | |
Biogen, Inc.(a) | | | 3,398 | | | | 881,509 | |
| | |
Celgene Corp.(a) | | | 14,213 | | | | 1,433,097 | |
| | |
Incyte Corp.(a) | | | 2,621 | | | | 192,643 | |
| | |
Intercept Pharmaceuticals, Inc.(a) | | | 876 | | | | 97,569 | |
| | |
Novavax, Inc.(a) | | | 20,714 | | | | 90,313 | |
| | |
Ultragenyx Pharmaceutical, Inc.(a) | | | 1,896 | | | | 115,637 | |
| | |
Vertex Pharmaceuticals, Inc.(a) | | | 4,865 | | | | 415,909 | |
| | | | | | | | | |
Total | | | | | | | 4,445,631 | |
|
Health Care Equipment & Supplies 1.7% | |
| | |
Medtronic PLC | | | 17,538 | | | | 1,357,266 | |
|
Health Care Providers & Services 2.0% | |
| | |
Express Scripts Holding Co.(a) | | | 14,687 | | | | 1,033,671 | |
| | |
Laboratory Corp. of America Holdings(a) | | | 5,310 | | | | 583,250 | |
| | | | | | | | | |
Total | | | | | | | 1,616,921 | |
|
Life Sciences Tools & Services 1.8% | |
| | |
Thermo Fisher Scientific, Inc. | | | 10,925 | | | | 1,411,401 | |
|
Pharmaceuticals 2.4% | |
| | |
Bristol-Myers Squibb Co. | | | 31,198 | | | | 1,932,092 | |
| | | | | | | | | |
Total Health Care | | | | | | | 10,763,311 | |
|
| |
INDUSTRIALS 9.3% | |
Aerospace & Defense 1.4% | |
| | |
Northrop Grumman Corp. | | | 5,690 | | | | 1,093,732 | |
|
Air Freight & Logistics 1.6% | |
| | |
FedEx Corp. | | | 9,599 | | | | 1,313,911 | |
The accompanying Notes to Financial Statements are an integral part of this statement.
| | | | |
| | |
| | COLUMBIA LARGE CAP GROWTH FUND IV | | |
PORTFOLIO OF INVESTMENTS (continued)
February 29, 2016 (Unaudited)
| | | | | | | | |
| Common Stocks (continued) | |
| Issuer | | Shares | | | Value ($) | |
Airlines 1.6% | |
| | |
Delta Air Lines, Inc. | | | 27,419 | | | | 1,322,692 | |
|
Electrical Equipment 0.5% | |
| | |
AMETEK, Inc. | | | 8,842 | | | | 410,357 | |
|
Machinery 1.8% | |
| | |
Ingersoll-Rand PLC | | | 13,394 | | | | 744,171 | |
| | |
Stanley Black & Decker, Inc. | | | 7,030 | | | | 660,890 | |
| | | | | | | | | |
Total | | | | | | | 1,405,061 | |
|
Professional Services 1.7% | |
| | |
Nielsen Holdings PLC | | | 26,458 | | | | 1,331,896 | |
|
Road & Rail 0.7% | |
| | |
Kansas City Southern | | | 6,451 | | | | 527,111 | |
| | | | | | | | | |
Total Industrials | | | | | | | 7,404,760 | |
|
| |
INFORMATION TECHNOLOGY 29.0% | |
Communications Equipment 0.6% | |
| | |
Palo Alto Networks, Inc.(a) | | | 3,416 | | | | 494,603 | |
|
Internet Software & Services 9.6% | |
| | |
Alibaba Group Holding Ltd., ADR(a) | | | 9,942 | | | | 684,109 | |
| | |
Alphabet, Inc., Class A(a) | | | 5,263 | | | | 3,774,729 | |
| | |
Facebook, Inc., Class A(a) | | | 27,987 | | | | 2,992,370 | |
| | |
LinkedIn Corp., Class A(a) | | | 1,726 | | | | 202,270 | |
| | | | | | | | | |
Total | | | | | | | 7,653,478 | |
|
IT Services 3.7% | |
| | |
PayPal Holdings, Inc.(a) | | | 15,060 | | | | 574,388 | |
| | |
Visa, Inc., Class A | | | 33,126 | | | | 2,397,991 | |
| | | | | | | | | |
Total | | | | | | | 2,972,379 | |
|
Semiconductors & Semiconductor Equipment 3.5% | |
| | |
Broadcom Ltd. | | | 7,731 | | | | 1,035,722 | |
| | |
NVIDIA Corp. | | | 24,160 | | | | 757,658 | |
| | |
NXP Semiconductors NV(a) | | | 7,908 | | | | 563,366 | |
| | |
Qorvo, Inc.(a) | | | 8,991 | | | | 405,314 | |
| | | | | | | | | |
Total | | | | | | | 2,762,060 | |
| | | | | | | | |
| Common Stocks (continued) | |
| Issuer | | Shares | | | Value ($) | |
Software 8.3% | |
| | |
Electronic Arts, Inc.(a) | | | 14,205 | | | | 912,529 | |
| | |
Microsoft Corp. | | | 60,605 | | | | 3,083,583 | |
| | |
Red Hat, Inc.(a) | | | 13,860 | | | | 905,751 | |
| | |
Salesforce.com, inc.(a) | | | 20,505 | | | | 1,389,214 | |
| | |
ServiceNow, Inc.(a) | | | 7,067 | | | | 388,614 | |
| | | | | | | | | |
Total | | | | | | | 6,679,691 | |
|
Technology Hardware, Storage & Peripherals 3.3% | |
| | |
Apple, Inc. | | | 27,700 | | | | 2,678,313 | |
| | | | | | | | | |
Total Information Technology | | | | | | | 23,240,524 | |
|
| |
MATERIALS 0.9% | |
Chemicals 0.9% | |
| | |
Eastman Chemical Co. | | | 10,759 | | | | 690,190 | |
| | | | | | | | | |
Total Materials | | | | | | | 690,190 | |
| | | | | | | | | |
Total Common Stocks | | | | | | | | |
(Cost: $75,326,547) | | | | | | | 72,217,873 | |
| | |
| | | | | | | | |
| Exchange-Traded Funds 2.8% | |
| | | Shares | | | Value ($) | |
SPDR S&P 500 ETF Trust | | | 11,515 | | | | 2,228,843 | |
| | | | | | | | | |
Total Exchange-Traded Funds | | | | | |
(Cost: $2,207,129) | | | | | | | 2,228,843 | |
| | |
| | | | | | | | |
| Money Market Funds 7.4% | |
Columbia Short-Term Cash Fund,
0.420%(b)(c) | | | 5,908,107 | | | | 5,908,107 | |
| | | | | | | | | |
Total Money Market Funds | | | | | |
(Cost: $5,908,107) | | | | | | | 5,908,107 | |
| | | | | | | | | |
Total Investments | | | | | |
(Cost: $83,441,783) | | | | | | | 80,354,823 | |
| | | | | | | | | |
Other Assets & Liabilities, Net | | | | (321,385 | ) |
| | | | | | | | | |
Net Assets | | | | 80,033,438 | |
| | | | | | | | | |
Notes to Portfolio of Investments
| (a) | Non-income producing investment. |
| (b) | The rate shown is the seven-day current annualized yield at February 29, 2016. |
| (c) | As defined in the Investment Company Act of 1940, an affiliated company is one in which the Fund owns 5% or more of the company’s outstanding voting securities, or a company which is under common ownership or control with the Fund. Holdings and transactions in these affiliated companies during the period ended February 29, 2016 are as follows: |
| | | | | | | | | | | | | | | | | | | | | | | | |
| Issuer | | Beginning
Cost ($) | | | Purchase
Cost ($) | | | Proceeds
From Sales ($) | | | Ending
Cost ($) | | | Dividends —
Affiliated
Issuers ($) | | | Value ($) | |
Columbia Short-Term Cash Fund | | | 16,999,684 | | | | 68,225,464 | | | | (79,317,041 | ) | | | 5,908,107 | | | | 11,293 | | | | 5,908,107 | |
Abbreviation Legend
| | |
| ADR | | American Depositary Receipt |
The accompanying Notes to Financial Statements are an integral part of this statement.
| | | | |
| | |
| | COLUMBIA LARGE CAP GROWTH FUND IV | | |
PORTFOLIO OF INVESTMENTS (continued)
February 29, 2016 (Unaudited)
Fair Value Measurements
The Fund categorizes its fair value measurements according to a three-level hierarchy that maximizes the use of observable inputs and minimizes the use of unobservable inputs by prioritizing that the most observable input be used when available. Observable inputs are those that market participants would use in pricing an investment based on market data obtained from sources independent of the reporting entity. Unobservable inputs are those that reflect the Fund’s assumptions about the information market participants would use in pricing an investment. An investment’s level within the fair value hierarchy is based on the lowest level of any input that is deemed significant to the asset’s or liability’s fair value measurement. The input levels are not necessarily an indication of the risk or liquidity associated with investments at that level. For example, certain U.S. government securities are generally high quality and liquid, however, they are reflected as Level 2 because the inputs used to determine fair value may not always be quoted prices in an active market.
Fair value inputs are summarized in the three broad levels listed below:
| n | | Level 1 — Valuations based on quoted prices for investments in active markets that the Fund has the ability to access at the measurement date (including NAV for open-end mutual funds). Valuation adjustments are not applied to Level 1 investments. |
| n | | Level 2 — Valuations based on other significant observable inputs (including quoted prices for similar securities, interest rates, prepayment speeds, credit risks, etc.). |
| n | | Level 3 — Valuations based on significant unobservable inputs (including the Fund’s own assumptions and judgment in determining the fair value of investments). |
Inputs that are used in determining fair value of an investment may include price information, credit data, volatility statistics, and other factors. These inputs can be either observable or unobservable. The availability of observable inputs can vary between investments, and is affected by various factors such as the type of investment, and the volume and level of activity for that investment or similar investments in the marketplace. The inputs will be considered by the Investment Manager, along with any other relevant factors in the calculation of an investment’s fair value. The Fund uses prices and inputs that are current as of the measurement date, which may include periods of market dislocations. During these periods, the availability of prices and inputs may be reduced for many investments. This condition could cause an investment to be reclassified between the various levels within the hierarchy.
Investments falling into the Level 3 category are primarily supported by quoted prices from brokers and dealers participating in the market for those investments. However, these may be classified as Level 3 investments due to lack of market transparency and corroboration to support these quoted prices. Additionally, valuation models may be used as the pricing source for any remaining investments classified as Level 3. These models may rely on one or more significant unobservable inputs and/or significant assumptions by the Investment Manager. Inputs used in valuations may include, but are not limited to, financial statement analysis, capital account balances, discount rates and estimated cash flows, and comparable company data.
Under the direction of the Fund’s Board of Trustees (the Board), the Investment Manager’s Valuation Committee (the Committee) is responsible for overseeing the valuation procedures approved by the Board. The Committee consists of voting and non-voting members from various groups within the Investment Manager’s organization, including operations and accounting, trading and investments, compliance, risk management and legal.
The Committee meets at least monthly to review and approve valuation matters, which may include a description of specific valuation determinations, data regarding pricing information received from approved pricing vendors and brokers and the results of Board-approved valuation control policies and procedures (the Policies). The Policies address, among other things, instances when market quotations are or are not readily available, including recommendations of third party pricing vendors and a determination of appropriate pricing methodologies; events that require specific valuation determinations and assessment of fair value techniques; securities with a potential for stale pricing, including those that are illiquid, restricted, or in default; and the effectiveness of third party pricing vendors, including periodic reviews of vendors. The Committee meets more frequently, as needed, to discuss additional valuation matters, which may include the need to review back-testing results, review time-sensitive information or approve related valuation actions. The Committee reports to the Board, with members of the Committee meeting with the Board at each of its regularly scheduled meetings to discuss valuation matters and actions during the period, similar to those described earlier.
For investments categorized as Level 3, the Committee monitors information similar to that described above, which may include: (i) data specific to the issuer or comparable issuers, (ii) general market or specific sector news and (iii) quoted prices and specific or similar security transactions. The Committee considers this data and any changes from prior periods in order to assess the reasonableness of observable and unobservable inputs, any assumptions or internal models used to value those securities and changes in fair value. This data is also used to corroborate, when available, information received from approved pricing vendors and brokers. Various factors impact the frequency of monitoring this information (which may occur as often as daily). However, the Committee may determine that changes to inputs, assumptions and models are not required as a result of the monitoring procedures performed.
The accompanying Notes to Financial Statements are an integral part of this statement.
| | | | |
| | |
| | COLUMBIA LARGE CAP GROWTH FUND IV | | |
PORTFOLIO OF INVESTMENTS (continued)
February 29, 2016 (Unaudited)
Fair Value Measurements (continued)
The following table is a summary of the inputs used to value the Fund’s investments at February 29, 2016:
| | | | | | | | | | | | | | | | |
| | | Level 1
Quoted Prices in Active
Markets for Identical
Assets ($) | | | Level 2
Other Significant
Observable Inputs ($) | | | Level 3 Significant
Unobservable Inputs ($) | | | Total ($) | |
Investments | | | | | | | | | | | | | | | | |
| | | | |
Common Stocks | | | | | | | | | | | | | | | | |
| | | | |
Consumer Discretionary | | | 16,330,609 | | | | — | | | | — | | | | 16,330,609 | |
| | | | |
Consumer Staples | | | 8,810,691 | | | | — | | | | — | | | | 8,810,691 | |
| | | | |
Financials | | | 4,977,788 | | | | — | | | | — | | | | 4,977,788 | |
| | | | |
Health Care | | | 10,763,311 | | | | — | | | | — | | | | 10,763,311 | |
| | | | |
Industrials | | | 7,404,760 | | | | — | | | | — | | | | 7,404,760 | |
| | | | |
Information Technology | | | 23,240,524 | | | | — | | | | — | | | | 23,240,524 | |
| | | | |
Materials | | | 690,190 | | | | — | | | | — | | | | 690,190 | |
| | | | | | | | | | | | | | | | | |
Total Common Stocks | | | 72,217,873 | | | | — | | | | — | | | | 72,217,873 | |
| | | | | | | | | | | | | | | | | |
Exchange-Traded Funds | | | 2,228,843 | | | | — | | | | — | | | | 2,228,843 | |
| | | | |
Money Market Funds | | | — | | | | 5,908,107 | | | | — | | | | 5,908,107 | |
| | | | | | | | | | | | | | | | | |
Total Investments | | | 74,446,716 | | | | 5,908,107 | | | | — | | | | 80,354,823 | |
| | | | | | | | | | | | | | | | | |
See the Portfolio of Investments for all investment classifications not indicated in the table.
The Fund’s assets assigned to the Level 2 input category are valued based upon utilizing observable market inputs, in which a security’s value is determined through reference to prices and information from market transactions for similar or identical assets and/or fund per share market values which are not considered publicly available.
There were no transfers of financial assets between levels during the period.
The accompanying Notes to Financial Statements are an integral part of this statement.
| | | | |
| | |
| | COLUMBIA LARGE CAP GROWTH FUND IV | | |
STATEMENT OF ASSETS AND LIABILITIES
February 29, 2016 (Unaudited)
| | | | |
Assets | | | | |
| |
Investments, at value | | | | |
| |
Unaffiliated issuers (identified cost $77,533,676) | | | $74,446,716 | |
| |
Affiliated issuers (identified cost $5,908,107) | | | 5,908,107 | |
| |
Total investments (identified cost $83,441,783) | | | 80,354,823 | |
| |
Receivable for: | | | | |
| |
Capital shares sold | | | 20,006 | |
| |
Dividends | | | 58,994 | |
| |
Foreign tax reclaims | | | 76,647 | |
| |
Expense reimbursement due from Investment Manager | | | 1,456 | |
| |
Prepaid expenses | | | 1,463 | |
| |
Other assets | | | 653 | |
| |
Total assets | | | 80,514,042 | |
| |
| |
Liabilities | | | | |
| |
Payable for: | | | | |
| |
Capital shares purchased | | | 415,625 | |
| |
Investment management fees | | | 5,120 | |
| |
Distribution and/or service fees | | | 2,708 | |
| |
Transfer agent fees | | | 16,626 | |
| |
Compensation of board members | | | 19,187 | |
| |
Other expenses | | | 21,338 | |
| |
Total liabilities | | | 480,604 | |
| |
Net assets applicable to outstanding capital stock | | | $80,033,438 | |
| |
| |
Represented by | | | | |
| |
Paid-in capital | | | $78,169,849 | |
| |
Undistributed net investment income | | | 220,930 | |
| |
Accumulated net realized gain | | | 4,740,201 | |
| |
Unrealized appreciation (depreciation) on: | | | | |
| |
Investments | | | (3,086,960 | ) |
| |
Foreign currency translations | | | (10,582 | ) |
| |
Total — representing net assets applicable to outstanding capital stock | | | $80,033,438 | |
| |
The accompanying Notes to Financial Statements are an integral part of this statement.
| | |
| 10 | | Semiannual Report 2016 |
| | | | |
| | |
| | COLUMBIA LARGE CAP GROWTH FUND IV | | |
STATEMENT OF ASSETS AND LIABILITIES (continued)
February 29, 2016 (Unaudited)
| | | | |
Class A | | | | |
| |
Net assets | | | $50,613,373 | |
| |
Shares outstanding | | | 4,329,691 | |
| |
Net asset value per share | | | $11.69 | |
| |
Maximum offering price per share(a) | | | $12.40 | |
| |
Class C | | | | |
| |
Net assets | | | $19,535,179 | |
| |
Shares outstanding | | | 1,727,787 | |
| |
Net asset value per share | | | $11.31 | |
| |
Class I | | | | |
| |
Net assets | | | $1,907 | |
| |
Shares outstanding | | | 162 | |
| |
Net asset value per share(b) | | | $11.73 | |
| |
Class R | | | | |
| |
Net assets | | | $776,681 | |
| |
Shares outstanding | | | 67,583 | |
| |
Net asset value per share | | | $11.49 | |
| |
Class R4 | | | | |
| |
Net assets | | | $1,092,887 | |
| |
Shares outstanding | | | 93,841 | |
| |
Net asset value per share | | | $11.65 | |
| |
Class R5 | | | | |
| |
Net assets | | | $225,334 | |
| |
Shares outstanding | | | 18,934 | |
| |
Net asset value per share | | | $11.90 | |
| |
Class Z | | | | |
| |
Net assets | | | $7,788,077 | |
| |
Shares outstanding | | | 660,670 | |
| |
Net asset value per share | | | $11.79 | |
| |
| (a) | The maximum offering price per share is calculated by dividing the net asset value per share by 1.0 minus the maximum sales charge of 5.75%. |
| (b) | Net asset value per share rounds to this amount due to fractional shares outstanding. |
The accompanying Notes to Financial Statements are an integral part of this statement.
| | | | |
| Semiannual Report 2016 | | | 11 | |
| | | | |
| | |
| | COLUMBIA LARGE CAP GROWTH FUND IV | | |
STATEMENT OF OPERATIONS
Six Months Ended February 29, 2016 (Unaudited)
| | | | |
Net investment income | | | | |
| |
Income: | | | | |
| |
Dividends — unaffiliated issuers | | | $1,240,379 | |
| |
Dividends — affiliated issuers | | | 11,293 | |
| |
Interest | | | 105,545 | |
| |
Foreign taxes withheld | | | (6,548 | ) |
| |
Total income | | | 1,350,669 | |
| |
| |
Expenses: | | | | |
| |
Investment management fees | | | 534,815 | |
| |
Distribution and/or service fees | | | | |
| |
Class A | | | 86,210 | |
| |
Class C | | | 115,352 | |
| |
Class R | | | 1,944 | |
| |
Transfer agent fees | | | | |
| |
Class A | | | 57,357 | |
| |
Class C | | | 19,232 | |
| |
Class R | | | 649 | |
| |
Class R4 | | | 1,045 | |
| |
Class R5 | | | 230 | |
| |
Class Z | | | 36,105 | |
| |
Compensation of board members | | | 4,055 | |
| |
Custodian fees | | | 3,264 | |
| |
Printing and postage fees | | | 21,242 | |
| |
Registration fees | | | 41,240 | |
| |
Audit fees | | | 15,073 | |
| |
Legal fees | | | 3,445 | |
| |
Other | | | 8,042 | |
| |
Total expenses | | | 949,300 | |
| |
Fees waived or expenses reimbursed by Investment Manager and its affiliates | | | (42,989 | ) |
| |
Total net expenses | | | 906,311 | |
| |
Net investment income | | | 444,358 | |
| |
| |
Realized and unrealized gain (loss) — net | | | | |
| |
Net realized gain (loss) on: | | | | |
| |
Investments | | | 4,931,864 | |
| |
Foreign currency translations | | | 3,728 | |
| |
Net realized gain | | | 4,935,592 | |
| |
Net change in unrealized appreciation (depreciation) on: | | | | |
| |
Investments | | | (13,011,066 | ) |
| |
Foreign currency translations | | | (1,818 | ) |
| |
Net change in unrealized depreciation | | | (13,012,884 | ) |
| |
Net realized and unrealized loss | | | (8,077,292 | ) |
| |
Net decrease in net assets from operations | | | $(7,632,934 | ) |
| |
The accompanying Notes to Financial Statements are an integral part of this statement.
| | |
| 12 | | Semiannual Report 2016 |
| | | | |
| | |
| | COLUMBIA LARGE CAP GROWTH FUND IV | | |
STATEMENT OF CHANGES IN NET ASSETS
| | | | | | | | |
| | | Six Months Ended
February 29, 2016
(Unaudited) | | | Year Ended
August 31, 2015 | |
Operations | | | | | | | | |
| | |
Net investment income | | | $444,358 | | | | $6,132,533 | |
| | |
Net realized gain | | | 4,935,592 | | | | 19,295,887 | |
| | |
Net change in unrealized depreciation | | | (13,012,884 | ) | | | (24,513,794 | ) |
| |
Net increase (decrease) in net assets resulting from operations | | | (7,632,934 | ) | | | 914,626 | |
| |
| | |
Distributions to shareholders | | | | | | | | |
| | |
Net investment income | | | | | | | | |
| | |
Class A | | | (2,348,463 | ) | | | (257,115 | ) |
| | |
Class C | | | (591,165 | ) | | | — | |
| | |
Class I | | | (83 | ) | | | (17 | ) |
| | |
Class R | | | (22,945 | ) | | | (249 | ) |
| | |
Class R4 | | | (44,545 | ) | | | (7,642 | ) |
| | |
Class R5 | | | (36,735 | ) | | | (42,811 | ) |
| | |
Class Z | | | (1,871,434 | ) | | | (423,434 | ) |
| | |
Net realized gains | | | | | | | | |
| | |
Class A | | | (7,271,815 | ) | | | (9,208,905 | ) |
| | |
Class C | | | (2,422,254 | ) | | | (2,780,020 | ) |
| | |
Class I | | | (228 | ) | | | (257 | ) |
| | |
Class R | | | (77,346 | ) | | | (68,689 | ) |
| | |
Class R4 | | | (127,546 | ) | | | (153,660 | ) |
| | |
Class R5 | | | (101,415 | ) | | | (686,206 | ) |
| | |
Class Z | | | (5,353,028 | ) | | | (8,092,471 | ) |
| |
Total distributions to shareholders | | | (20,269,002 | ) | | | (21,721,476 | ) |
| |
Decrease in net assets from capital stock activity | | | (60,118,974 | ) | | | (32,910,319 | ) |
| |
Total decrease in net assets | | | (88,020,910 | ) | | | (53,717,169 | ) |
| | |
Net assets at beginning of period | | | 168,054,348 | | | | 221,771,517 | |
| |
Net assets at end of period | | | $80,033,438 | | | | $168,054,348 | |
| |
Undistributed net investment income | | | $220,930 | | | | $4,691,942 | |
| |
The accompanying Notes to Financial Statements are an integral part of this statement.
| | | | |
| Semiannual Report 2016 | | | 13 | |
| | | | |
| | |
| | COLUMBIA LARGE CAP GROWTH FUND IV | | |
STATEMENT OF CHANGES IN NET ASSETS (continued)
| | | | | | | | | | | | | | | | |
| | | Six Months Ended
February 29, 2016 (Unaudited) | | | Year Ended
August 31, 2015 | |
| | | Shares | | | Dollars ($) | | | Shares | | | Dollars ($) | |
Capital stock activity | | | | | | | | | | | | | | | | |
| | | | |
Class A shares | | | | | | | | | | | | | | | | |
| | | | |
Subscriptions | | | 174,274 | | | | 2,410,902 | | | | 883,917 | | | | 13,342,263 | |
| | | | |
Distributions reinvested | | | 738,062 | | | | 9,609,573 | | | | 647,706 | | | | 9,462,980 | |
| | | | |
Redemptions | | | (2,074,891 | ) | | | (26,226,656 | ) | | | (2,300,263 | ) | | | (34,846,129 | ) |
| |
Net decrease | | | (1,162,555 | ) | | | (14,206,181 | ) | | | (768,640 | ) | | | (12,040,886 | ) |
| |
Class C shares | | | | | | | | | | | | | | | | |
| | | | |
Subscriptions | | | 57,212 | | | | 747,276 | | | | 256,775 | | | | 3,766,708 | |
| | | | |
Distributions reinvested | | | 238,781 | | | | 3,013,419 | | | | 195,551 | | | | 2,778,778 | |
| | | | |
Redemptions | | | (366,520 | ) | | | (4,535,570 | ) | | | (417,522 | ) | | | (6,113,429 | ) |
| |
Net increase (decrease) | | | (70,527 | ) | | | (774,875 | ) | | | 34,804 | | | | 432,057 | |
| |
Class R shares | | | | | | | | | | | | | | | | |
| | | | |
Subscriptions | | | 6,769 | | | | 85,667 | | | | 11,414 | | | | 168,933 | |
| | | | |
Distributions reinvested | | | 7,829 | | | | 100,291 | | | | 4,787 | | | | 68,938 | |
| | | | |
Redemptions | | | (1,582 | ) | | | (18,552 | ) | | | (3,553 | ) | | | (52,240 | ) |
| |
Net increase | | | 13,016 | | | | 167,406 | | | | 12,648 | | | | 185,631 | |
| |
Class R4 shares | | | | | | | | | | | | | | | | |
| | | | |
Subscriptions | | | 1,717 | | | | 21,346 | | | | 24,946 | | | | 377,561 | |
| | | | |
Distributions reinvested | | | 13,255 | | | | 171,785 | | | | 11,060 | | | | 161,033 | |
| | | | |
Redemptions | | | (20,239 | ) | | | (271,274 | ) | | | (33,744 | ) | | | (511,877 | ) |
| |
Net increase (decrease) | | | (5,267 | ) | | | (78,143 | ) | | | 2,262 | | | | 26,717 | |
| |
Class R5 shares | | | | | | | | | | | | | | | | |
| | | | |
Subscriptions | | | 4,654 | | | | 59,600 | | | | 95,424 | | | | 1,476,783 | |
| | | | |
Distributions reinvested | | | 10,404 | | | | 137,847 | | | | 49,107 | | | | 728,751 | |
| | | | |
Redemptions | | | (106,940 | ) | | | (1,400,202 | ) | | | (441,743 | ) | | | (6,766,519 | ) |
| |
Net decrease | | | (91,882 | ) | | | (1,202,755 | ) | | | (297,212 | ) | | | (4,560,985 | ) |
| |
Class Z shares | | | | | | | | | | | | | | | | |
| | | | |
Subscriptions | | | 62,348 | | | | 830,572 | | | | 754,430 | | | | 11,645,735 | |
| | | | |
Distributions reinvested | | | 550,634 | | | | 7,224,315 | | | | 578,523 | | | | 8,515,853 | |
| | | | |
Redemptions | | | (4,199,549 | ) | | | (52,079,313 | ) | | | (2,425,498 | ) | | | (37,114,441 | ) |
| |
Net decrease | | | (3,586,567 | ) | | | (44,024,426 | ) | | | (1,092,545 | ) | | | (16,952,853 | ) |
| |
Total net decrease | | | (4,903,782 | ) | | | (60,118,974 | ) | | | (2,108,683 | ) | | | (32,910,319 | ) |
| |
The accompanying Notes to Financial Statements are an integral part of this statement.
| | |
| 14 | | Semiannual Report 2016 |
| | | | |
| | |
| | COLUMBIA LARGE CAP GROWTH FUND IV | | |
FINANCIAL HIGHLIGHTS
The following tables are intended to help you understand the Fund’s financial performance. Certain information reflects financial results for a single share of a class held for the periods shown. Per share net investment income (loss) amounts are calculated based on average shares outstanding during the period. Total return assumes reinvestment of all dividends and distributions, if any. Total return does not reflect payment of sales charges, if any. Total return and portfolio turnover are not annualized for periods of less than one year. The portfolio turnover rate is calculated without regard to purchase and sales transactions of short-term instruments and certain derivatives, if any. If such transactions were included, the Fund’s portfolio turnover rate may be higher.
| | | | | | | | | | | | | | | | | | | | | | | | |
| |
| Six Months Ended
February 29, 2016 |
| | | Year Ended August 31, | |
Class A | | | (Unaudited) | | | | 2015 | | | | 2014 | | | | 2013 | | | | 2012 | | | | 2011(a) | |
Per share data | | | | | | | | | | | | | | | | | | | | | | | | |
Net asset value, beginning of period | | | $14.26 | | | | $15.94 | | | | $14.77 | | | | $13.00 | | | | $11.09 | | | | $10.00 | |
| | | | | | | | | | | | | | | | | | | | | | | | | |
Income from investment operations: | | | | | | | | | | | | | | | | | | | | | | | | |
| | | | | | |
Net investment income | | | 0.05 | | | | 0.45 | (b) | | | 0.03 | | | | 0.05 | | | | 0.02 | | | | 0.03 | |
| | | | | | | | | | | | | | | | | | | | | | | | | |
Net realized and unrealized gain (loss) | | | (0.76 | ) | | | (0.50 | ) | | | 2.84 | | | | 2.45 | | | | 1.93 | | | | 1.10 | |
| | | | | | | | | | | | | | | | | | | | | | | | | |
Total from investment operations | | | (0.71 | ) | | | (0.05 | ) | | | 2.87 | | | | 2.50 | | | | 1.95 | | | | 1.13 | |
| | | | | | | | | | | | | | | | | | | | | | | | | |
Less distributions to shareholders: | | | | | | | | | | | | | | | | | | | | | | | | |
| | | | | | |
Net investment income | | | (0.46 | ) | | | (0.05 | ) | | | — | | | | (0.18 | ) | | | — | | | | (0.04 | ) |
| | | | | | | | | | | | | | | | | | | | | | | | | |
Net realized gains | | | (1.40 | ) | | | (1.58 | ) | | | (1.70 | ) | | | (0.55 | ) | | | (0.04 | ) | | | (0.00 | )(c) |
| | | | | | | | | | | | | | | | | | | | | | | | | |
Total distributions to shareholders | | | (1.86 | ) | | | (1.63 | ) | | | (1.70 | ) | | | (0.73 | ) | | | (0.04 | ) | | | (0.04 | ) |
| | | | | | | | | | | | | | | | | | | | | | | | | |
Net asset value, end of period | | | $11.69 | | | | $14.26 | | | | $15.94 | | | | $14.77 | | | | $13.00 | | | | $11.09 | |
| | | | | | | | | | | | | | | | | | | | | | | | | |
Total return | | | (6.33 | %) | | | (0.58 | %) | | | 20.18 | % | | | 20.17 | % | | | 17.63 | % | | | 11.29 | % |
| | | | | | | | | | | | | | | | | | | | | | | | | |
Ratios to average net assets(d) | | | | | | | | | | | | | | | | | | | | | | | | |
| | | | | | |
Total gross expenses | | | 1.34 | %(e) | | | 1.28 | % | | | 1.28 | % | | | 1.36 | % | | | 1.50 | %(f) | | | 1.67 | %(e) |
| | | | | | | | | | | | | | | | | | | | | | | | | |
Total net expenses(g) | | | 1.26 | %(e) | | | 1.28 | % | | | 1.28 | % | | | 1.32 | % | | | 1.50 | %(f)(h) | | | 1.60 | %(e) |
| | | | | | | | | | | | | | | | | | | | | | | | | |
Net investment income | | | 0.70 | %(e) | | | 2.98 | % | | | 0.21 | % | | | 0.33 | % | | | 0.19 | % | | | 0.25 | %(e) |
| | | | | | | | | | | | | | | | | | | | | | | | | |
Supplemental data | | | | | | | | | | | | | | | | | | | | | | | | |
| | | | | | |
Net assets, end of period (in thousands) | | | $50,613 | | | | $78,341 | | | | $99,789 | | | | $77,404 | | | | $51,772 | | | | $55,034 | |
| | | | | | | | | | | | | | | | | | | | | | | | | |
Portfolio turnover | | | 69 | % | | | 79 | % | | | 119 | % | | | 147 | % | | | 146 | % | | | 214 | % |
| | | | | | | | | | | | | | | | | | | | | | | | | |
Notes to Financial Highlights
| (a) | Based on operations from September 28, 2010 (commencement of operations) through the stated period end. |
| (b) | Net investment income per share includes special dividends. The effect of these dividends amounted to $0.45 per share. |
| (d) | In addition to the fees and expenses that the Fund bears directly, the Fund indirectly bears a pro rata share of the fees and expenses of any other funds in which it invests. Such indirect expenses are not included in the Fund’s reported expense ratios. |
| (f) | Ratios include line of credit interest expense which is less than 0.01%. |
| (g) | Total net expenses include the impact of certain fee waivers/expense reimbursements made by the Investment Manager and certain of its affiliates, if applicable. |
| (h) | The benefits derived from expense reductions had an impact of less than 0.01%. |
The accompanying Notes to Financial Statements are an integral part of this statement.
| | | | |
| Semiannual Report 2016 | | | 15 | |
| | | | |
| | |
| | COLUMBIA LARGE CAP GROWTH FUND IV | | |
FINANCIAL HIGHLIGHTS (continued)
| | | | | | | | | | | | | | | | | | | | | | | | |
| |
| Six Months Ended
February 29, 2016 |
| | | Year Ended August 31, | |
Class C | | | (Unaudited) | | | | 2015 | | | | 2014 | | | | 2013 | | | | 2012 | | | | 2011(a) | |
Per share data | | | | | | | | | | | | | | | | | | | | | | | | |
Net asset value, beginning of period | | | $13.80 | | | | $15.53 | | | | $14.53 | | | | $12.81 | | | | $11.01 | | | | $10.00 | |
| | | | | | | | | | | | | | | | | | | | | | | | | |
Income from investment operations: | | | | | | | | | | | | | | | | | | | | | | | | |
| | | | | | |
Net investment income (loss) | | | (0.00 | )(b) | | | 0.34 | (c) | | | (0.08 | ) | | | (0.06 | ) | | | (0.07 | ) | | | (0.05 | ) |
| | | | | | | | | | | | | | | | | | | | | | | | | |
Net realized and unrealized gain (loss) | | | (0.74 | ) | | | (0.49 | ) | | | 2.78 | | | | 2.42 | | | | 1.91 | | | | 1.09 | |
| | | | | | | | | | | | | | | | | | | | | | | | | |
Total from investment operations | | | (0.74 | ) | | | (0.15 | ) | | | 2.70 | | | | 2.36 | | | | 1.84 | | | | 1.04 | |
| | | | | | | | | | | | | | | | | | | | | | | | | |
Less distributions to shareholders: | | | | | | | | | | | | | | | | | | | | | | | | |
| | | | | | |
Net investment income | | | (0.35 | ) | | | — | | | | — | | | | (0.09 | ) | | | — | | | | (0.03 | ) |
| | | | | | | | | | | | | | | | | | | | | | | | | |
Net realized gains | | | (1.40 | ) | | | (1.58 | ) | | | (1.70 | ) | | | (0.55 | ) | | | (0.04 | ) | | | (0.00 | )(b) |
| | | | | | | | | | | | | | | | | | | | | | | | | |
Total distributions to shareholders | | | (1.75 | ) | | | (1.58 | ) | | | (1.70 | ) | | | (0.64 | ) | | | (0.04 | ) | | | (0.03 | ) |
| | | | | | | | | | | | | | | | | | | | | | | | | |
Net asset value, end of period | | | $11.31 | | | | $13.80 | | | | $15.53 | | | | $14.53 | | | | $12.81 | | | | $11.01 | |
| | | | | | | | | | | | | | | | | | | | | | | | | |
Total return | | | (6.70 | %) | | | (1.24 | %) | | | 19.28 | % | | | 19.23 | % | | | 16.76 | % | | | 10.42 | % |
| | | | | | | | | | | | | | | | | | | | | | | | | |
Ratios to average net assets(d) | | | | | | | | | | | | | | | | | | | | | | | | |
| | | | | | |
Total gross expenses | | | 2.10 | %(e) | | | 2.03 | % | | | 2.03 | % | | | 2.11 | % | | | 2.26 | %(f) | | | 2.38 | %(e) |
| | | | | | | | | | | | | | | | | | | | | | | | | |
Total net expenses(g) | | | 2.01 | %(e) | | | 2.03 | % | | | 2.03 | % | | | 2.07 | % | | | 2.25 | %(f)(h) | | | 2.35 | %(e) |
| | | | | | | | | | | | | | | | | | | | | | | | | |
Net investment income (loss) | | | (0.03 | %)(e) | | | 2.31 | % | | | (0.52 | %) | | | (0.42 | %) | | | (0.57 | %) | | | (0.46 | %)(e) |
| | | | | | | | | | | | | | | | | | | | | | | | | |
Supplemental data | | | | | | | | | | | | | | | | | | | | | | | | |
| | | | | | |
Net assets, end of period (in thousands) | | | $19,535 | | | | $24,811 | | | | $27,393 | | | | $17,316 | | | | $12,272 | | | | $9,255 | |
| | | | | | | | | | | | | | | | | | | | | | | | | |
Portfolio turnover | | | 69 | % | | | 79 | % | | | 119 | % | | | 147 | % | | | 146 | % | | | 214 | % |
| | | | | | | | | | | | | | | | | | | | | | | | | |
Notes to Financial Highlights
| (a) | Based on operations from September 28, 2010 (commencement of operations) through the stated period end. |
| (c) | Net investment income per share includes special dividends. The effect of these dividends amounted to $0.44 per share. |
| (d) | In addition to the fees and expenses that the Fund bears directly, the Fund indirectly bears a pro rata share of the fees and expenses of any other funds in which it invests. Such indirect expenses are not included in the Fund’s reported expense ratios. |
| (f) | Ratios include line of credit interest expense which is less than 0.01%. |
| (g) | Total net expenses include the impact of certain fee waivers/expense reimbursements made by the Investment Manager and certain of its affiliates, if applicable. |
| (h) | The benefits derived from expense reductions had an impact of less than 0.01%. |
The accompanying Notes to Financial Statements are an integral part of this statement.
| | |
| 16 | | Semiannual Report 2016 |
| | | | |
| | |
| | COLUMBIA LARGE CAP GROWTH FUND IV | | |
FINANCIAL HIGHLIGHTS (continued)
| | | | | | | | | | | | | | | | | | | | | | | | |
| |
| Six Months Ended
February 29, 2016 |
| | | Year Ended August 31, | |
Class I | | | (Unaudited) | | | | 2015 | | | | 2014 | | | | 2013 | | | | 2012 | | | | 2011(a) | |
Per share data | | | | | | | | | | | | | | | | | | | | | | | | |
Net asset value, beginning of period | | | $14.34 | | | | $16.01 | | | | $14.78 | | | | $13.01 | | | | $11.08 | | | | $10.00 | |
| | | | | | | | | | | | | | | | | | | | | | | | | |
Income from investment operations: | | | | | | | | | | | | | | | | | | | | | | | | |
| | | | | | |
Net investment income (loss) | | | 0.07 | | | | 0.53 | (b) | | | 0.08 | | | | 0.10 | | | | (0.05 | ) | | | 0.05 | |
| | | | | | | | | | | | | | | | | | | | | | | | | |
Net realized and unrealized gain (loss) | | | (0.77 | ) | | | (0.51 | ) | | | 2.85 | | | | 2.46 | | | | 2.04 | | | | 1.07 | |
| | | | | | | | | | | | | | | | | | | | | | | | | |
Total from investment operations | | | (0.70 | ) | | | 0.02 | | | | 2.93 | | | | 2.56 | | | | 1.99 | | | | 1.12 | |
| | | | | | | | | | | | | | | | | | | | | | | | | |
Less distributions to shareholders: | | | | | | | | | | | | | | | | | | | | | | | | |
| | | | | | |
Net investment income | | | (0.51 | ) | | | (0.11 | ) | | | — | | | | (0.24 | ) | | | (0.02 | ) | | | (0.04 | ) |
| | | | | | | | | | | | | | | | | | | | | | | | | |
Net realized gains | | | (1.40 | ) | | | (1.58 | ) | | | (1.70 | ) | | | (0.55 | ) | | | (0.04 | ) | | | (0.00 | )(c) |
| | | | | | | | | | | | | | | | | | | | | | | | | |
Total distributions to shareholders | | | (1.91 | ) | | | (1.69 | ) | | | (1.70 | ) | | | (0.79 | ) | | | (0.06 | ) | | | (0.04 | ) |
| | | | | | | | | | | | | | | | | | | | | | | | | |
Net asset value, end of period | | | $11.73 | | | | $14.34 | | | | $16.01 | | | | $14.78 | | | | $13.01 | | | | $11.08 | |
| | | | | | | | | | | | | | | | | | | | | | | | | |
Total return | | | (6.22 | %) | | | (0.10 | %) | | | 20.60 | % | | | 20.67 | % | | | 18.08 | % | | | 11.22 | % |
| | | | | | | | | | | | | | | | | | | | | | | | | |
Ratios to average net assets(d) | | | | | | | | | | | | | | | | | | | | | | | | |
| | | | | | |
Total gross expenses | | | 0.95 | %(e) | | | 0.90 | % | | | 0.87 | % | | | 0.95 | % | | | 1.07 | %(f) | | | 2.64 | %(e) |
| | | | | | | | | | | | | | | | | | | | | | | | | |
Total net expenses(g) | | | 0.88 | %(e) | | | 0.90 | % | | | 0.87 | % | | | 0.92 | % | | | 1.07 | %(f) | | | 1.25 | %(e) |
| | | | | | | | | | | | | | | | | | | | | | | | | |
Net investment income (loss) | | | 1.10 | %(e) | | | 3.48 | % | | | 0.51 | % | | | 0.73 | % | | | (0.47 | %) | | | 0.43 | %(e) |
| | | | | | | | | | | | | | | | | | | | | | | | | |
Supplemental data | | | | | | | | | | | | | | | | | | | | | | | | |
| | | | | | |
Net assets, end of period (in thousands) | | | $2 | | | | $2 | | | | $3 | | | | $3 | | | | $3 | | | | $5,527 | |
| | | | | | | | | | | | | | | | | | | | | | | | | |
Portfolio turnover | | | 69 | % | | | 79 | % | | | 119 | % | | | 147 | % | | | 146 | % | | | 214 | % |
| | | | | | | | | | | | | | | | | | | | | | | | | |
Notes to Financial Highlights
| (a) | Based on operations from September 28, 2010 (commencement of operations) through the stated period end. |
| (b) | Net investment income per share includes special dividends. The effect of these dividends amounted to $0.46 per share. |
| (d) | In addition to the fees and expenses that the Fund bears directly, the Fund indirectly bears a pro rata share of the fees and expenses of any other funds in which it invests. Such indirect expenses are not included in the Fund’s reported expense ratios. |
| (f) | Ratios include line of credit interest expense which is less than 0.01%. |
| (g) | Total net expenses include the impact of certain fee waivers/expense reimbursements made by the Investment Manager and certain of its affiliates, if applicable. |
The accompanying Notes to Financial Statements are an integral part of this statement.
| | | | |
| Semiannual Report 2016 | | | 17 | |
| | | | |
| | |
| | COLUMBIA LARGE CAP GROWTH FUND IV | | |
FINANCIAL HIGHLIGHTS (continued)
| | | | | | | | | | | | | | | | | | | | | | | | |
| |
| Six Months Ended
February 29, 2016 |
| | | Year Ended August 31, | |
Class R | | | (Unaudited) | | | | 2015 | | | | 2014 | | | | 2013 | | | | 2012 | | | | 2011(a) | |
Per share data | | | | | | | | | | | | | | | | | | | | | | | | |
Net asset value, beginning of period | | | $14.03 | | | | $15.71 | | | | $14.61 | | | | $12.93 | | | | $11.06 | | | | $10.00 | |
| | | | | | | | | | | | | | | | | | | | | | | | | |
Income from investment operations: | | | | | | | | | | | | | | | | | | | | | | | | |
| | | | | | |
Net investment income (loss) | | | 0.03 | | | | 0.47 | (b) | | | (0.02 | ) | | | (0.00 | )(c) | | | (0.00 | )(c) | | | (0.00 | )(c) |
| | | | | | | | | | | | | | | | | | | | | | | | | |
Net realized and unrealized gain (loss) | | | (0.75 | ) | | | (0.56 | ) | | | 2.82 | | | | 2.44 | | | | 1.91 | | | | 1.09 | |
| | | | | | | | | | | | | | | | | | | | | | | | | |
Total from investment operations | | | (0.72 | ) | | | (0.09 | ) | | | 2.80 | | | | 2.44 | | | | 1.91 | | | | 1.09 | |
| | | | | | | | | | | | | | | | | | | | | | | | | |
Less distributions to shareholders: | | | | | | | | | | | | | | | | | | | | | | | | |
| | | | | | |
Net investment income | | | (0.42 | ) | | | (0.01 | ) | | | — | | | | (0.21 | ) | | | — | | | | (0.03 | ) |
| | | | | | | | | | | | | | | | | | | | | | | | | |
Net realized gains | | | (1.40 | ) | | | (1.58 | ) | | | (1.70 | ) | | | (0.55 | ) | | | (0.04 | ) | | | (0.00 | )(c) |
| | | | | | | | | | | | | | | | | | | | | | | | | |
Total distributions to shareholders | | | (1.82 | ) | | | (1.59 | ) | | | (1.70 | ) | | | (0.76 | ) | | | (0.04 | ) | | | (0.03 | ) |
| | | | | | | | | | | | | | | | | | | | | | | | | |
Net asset value, end of period | | | $11.49 | | | | $14.03 | | | | $15.71 | | | | $14.61 | | | | $12.93 | | | | $11.06 | |
| | | | | | | | | | | | | | | | | | | | | | | | | |
Total return | | | (6.47 | %) | | | (0.84 | %) | | | 19.91 | % | | | 19.87 | % | | | 17.31 | % | | | 10.87 | % |
| | | | | | | | | | | | | | | | | | | | | | | | | |
Ratios to average net assets(d) | | | | | | | | | | | | | | | | | | | | | | | | |
| | | | | | |
Total gross expenses | | | 1.61 | %(e) | | | 1.53 | % | | | 1.53 | % | | | 1.58 | % | | | 1.72 | %(f) | | | 2.89 | %(e) |
| | | | | | | | | | | | | | | | | | | | | | | | | |
Total net expenses(g) | | | 1.51 | %(e) | | | 1.53 | % | | | 1.53 | % | | | 1.56 | % | | | 1.72 | %(f) | | | 1.85 | %(e) |
| | | | | | | | | | | | | | | | | | | | | | | | | |
Net investment income (loss) | | | 0.47 | %(e) | | | 3.15 | % | | | (0.12 | %) | | | (0.02 | %) | | | (0.01 | %) | | | 0.01 | %(e) |
| | | | | | | | | | | | | | | | | | | | | | | | | |
Supplemental data | | | | | | | | | | | | | | | | | | | | | | | | |
| | | | | | |
Net assets, end of period (in thousands) | | | $777 | | | | $766 | | | | $658 | | | | $608 | | | | $229 | | | | $10 | |
| | | | | | | | | | | | | | | | | | | | | | | | | |
Portfolio turnover | | | 69 | % | | | 79 | % | | | 119 | % | | | 147 | % | | | 146 | % | | | 214 | % |
| | | | | | | | | | | | | | | | | | | | | | | | | |
Notes to Financial Highlights
| (a) | Based on operations from September 28, 2010 (commencement of operations) through the stated period end. |
| (b) | Net investment income per share includes special dividends. The effect of these dividends amounted to $0.50 per share. |
| (d) | In addition to the fees and expenses that the Fund bears directly, the Fund indirectly bears a pro rata share of the fees and expenses of any other funds in which it invests. Such indirect expenses are not included in the Fund’s reported expense ratios. |
| (f) | Ratios include line of credit interest expense which is less than 0.01%. |
| (g) | Total net expenses include the impact of certain fee waivers/expense reimbursements made by the Investment Manager and certain of its affiliates, if applicable. |
The accompanying Notes to Financial Statements are an integral part of this statement.
| | |
| 18 | | Semiannual Report 2016 |
| | | | |
| | |
| | COLUMBIA LARGE CAP GROWTH FUND IV | | |
FINANCIAL HIGHLIGHTS (continued)
| | | | | | | | | | | | |
| |
| Six Months Ended
February 29, 2016 |
| | | Year Ended August 31, | |
Class R4 | | | (Unaudited) | | | | 2015 | | | | 2014(a) | |
Per share data | | | | | | | | | | | | |
Net asset value, beginning of period | | | $14.24 | | | | $15.91 | | | | $15.46 | |
| | | | | | | | | | | | | |
Income from investment operations: | | | | | | | | | | | | |
| | | |
Net investment income | | | 0.06 | | | | 0.56 | (b) | | | 0.08 | |
| | | | | | | | | | | | | |
Net realized and unrealized gain (loss) | | | (0.76 | ) | | | (0.57 | ) | | | 0.37 | |
| | | | | | | | | | | | | |
Total from investment operations | | | (0.70 | ) | | | (0.01 | ) | | | 0.45 | |
| | | | | | | | | | | | | |
Less distributions to shareholders: | | | | | | | | | | | | |
| | | |
Net investment income | | | (0.49 | ) | | | (0.08 | ) | | | — | |
| | | | | | | | | | | | | |
Net realized gains | | | (1.40 | ) | | | (1.58 | ) | | | — | |
| | | | | | | | | | | | | |
Total distributions to shareholders | | | (1.89 | ) | | | (1.66 | ) | | | — | |
| | | | | | | | | | | | | |
Net asset value, end of period | | | $11.65 | | | | $14.24 | | | | $15.91 | |
| | | | | | | | | | | | | |
Total return | | | (6.23 | %) | | | (0.28 | %) | | | 2.91 | % |
| | | | | | | | | | | | | |
Ratios to average net assets(c) | | | | | | | | | | | | |
| | | |
Total gross expenses | | | 1.10 | %(d) | | | 1.03 | % | | | 1.13 | %(d) |
| | | | | | | | | | | | | |
Total net expenses(e) | | | 1.01 | %(d) | | | 1.03 | % | | | 1.07 | %(d) |
| | | | | | | | | | | | | |
Net investment income | | | 0.96 | %(d) | | | 3.70 | % | | | 2.92 | %(d) |
| | | | | | | | | | | | | |
Supplemental data | | | | | | | | | | | | |
| | | |
Net assets, end of period (in thousands) | | | $1,093 | | | | $1,411 | | | | $1,541 | |
| | | | | | | | | | | | | |
Portfolio turnover | | | 69 | % | | | 79 | % | | | 119 | % |
| | | | | | | | | | | | | |
Notes to Financial Highlights
| (a) | Based on operations from June 25, 2014 (commencement of operations) through the stated period end. |
| (b) | Net investment income per share includes special dividends. The effect of these dividends amounted to $0.51 per share. |
| (c) | In addition to the fees and expenses that the Fund bears directly, the Fund indirectly bears a pro rata share of the fees and expenses of any other funds in which it invests. Such indirect expenses are not included in the Fund’s reported expense ratios. |
| (e) | Total net expenses include the impact of certain fee waivers/expense reimbursements made by the Investment Manager and certain of its affiliates, if applicable. |
The accompanying Notes to Financial Statements are an integral part of this statement.
| | | | |
| Semiannual Report 2016 | | | 19 | |
| | | | |
| | |
| | COLUMBIA LARGE CAP GROWTH FUND IV | | |
FINANCIAL HIGHLIGHTS (continued)
| | | | | | | | | | | | | | | | |
| |
| Six Months Ended
February 29, 2016 |
| | | Year Ended August 31, | |
Class R5 | | | (Unaudited) | | | | 2015 | | | | 2014 | | | | 2013(a) | |
Per share data | | | | | | | | | | | | | | | | |
Net asset value, beginning of period | | | $14.52 | | | | $16.19 | | | | $14.93 | | | | $13.11 | |
| | | | | | | | | | | | | | | | | |
Income from investment operations: | | | | | | | | | | | | | | | | |
| | | | |
Net investment income | | | 0.06 | | | | 0.22 | (b) | | | 0.09 | | | | 0.09 | |
| | | | | | | | | | | | | | | | | |
Net realized and unrealized gain (loss) | | | (0.77 | ) | | | (0.21 | ) | | | 2.87 | | | | 2.51 | |
| | | | | | | | | | | | | | | | | |
Total from investment operations | | | (0.71 | ) | | | 0.01 | | | | 2.96 | | | | 2.60 | |
| | | | | | | | | | | | | | | | | |
Less distributions to shareholders: | | | | | | | | | | | | | | | | |
| | | | |
Net investment income | | | (0.51 | ) | | | (0.10 | ) | | | — | | | | (0.23 | ) |
| | | | | | | | | | | | | | | | | |
Net realized gains | | | (1.40 | ) | | | (1.58 | ) | | | (1.70 | ) | | | (0.55 | ) |
| | | | | | | | | | | | | | | | | |
Total distributions to shareholders | | | (1.91 | ) | | | (1.68 | ) | | | (1.70 | ) | | | (0.78 | ) |
| | | | | | | | | | | | | | | | | |
Net asset value, end of period | | | $11.90 | | | | $14.52 | | | | $16.19 | | | | $14.93 | |
| | | | | | | | | | | | | | | | | |
Total return | | | (6.22 | %) | | | (0.15 | %) | | | 20.59 | % | | | 20.89 | % |
| | | | | | | | | | | | | | | | | |
Ratios to average net assets(c) | | | | | | | | | | | | | | | | |
| | | | |
Total gross expenses | | | 0.94 | %(d) | | | 0.91 | % | | | 0.93 | % | | | 0.90 | %(d) |
| | | | | | | | | | | | | | | | | |
Total net expenses(e) | | | 0.91 | %(d) | | | 0.91 | % | | | 0.93 | % | | | 0.90 | %(d) |
| | | | | | | | | | | | | | | | | |
Net investment income | | | 0.91 | %(d) | | | 1.39 | % | | | 0.55 | % | | | 0.76 | %(d) |
| | | | | | | | | | | | | | | | | |
Supplemental data | | | | | | | | | | | | | | | | |
| | | | |
Net assets, end of period (in thousands) | | | $225 | | | | $1,609 | | | | $6,608 | | | | $2,292 | |
| | | | | | | | | | | | | | | | | |
Portfolio turnover | | | 69 | % | | | 79 | % | | | 119 | % | | | 147 | % |
| | | | | | | | | | | | | | | | | |
Notes to Financial Highlights
| (a) | Based on operations from November 8, 2012 (commencement of operations) through the stated period end. |
| (b) | Net investment income per share includes special dividends. The effect of these dividends amounted to $0.16 per share. |
| (c) | In addition to the fees and expenses that the Fund bears directly, the Fund indirectly bears a pro rata share of the fees and expenses of any other funds in which it invests. Such indirect expenses are not included in the Fund’s reported expense ratios. |
| (e) | Total net expenses include the impact of certain fee waivers/expense reimbursements made by the Investment Manager and certain of its affiliates, if applicable. |
The accompanying Notes to Financial Statements are an integral part of this statement.
| | |
| 20 | | Semiannual Report 2016 |
| | | | |
| | |
| | COLUMBIA LARGE CAP GROWTH FUND IV | | |
FINANCIAL HIGHLIGHTS (continued)
| | | | | | | | | | | | | | | | | | | | | | | | |
| |
| Six Months Ended
February 29, 2016 |
| | | Year Ended August 31, | |
Class Z | | | (Unaudited) | | | | 2015 | | | | 2014 | | | | 2013 | | | | 2012 | | | | 2011(a) | |
Per share data | | | | | | | | | | | | | | | | | | | | | | | | |
Net asset value, beginning of period | | | $14.39 | | | | $16.06 | | | | $14.84 | | | | $13.04 | | | | $11.12 | | | | $10.00 | |
| | | | | | | | | | | | | | | | | | | | | | | | | |
Income from investment operations: | | | | | | | | | | | | | | | | | | | | | | | | |
| | | | | | |
Net investment income | | | 0.06 | | | | 0.51 | (b) | | | 0.07 | | | | 0.08 | | | | 0.05 | | | | 0.06 | |
| | | | | | | | | | | | | | | | | | | | | | | | | |
Net realized and unrealized gain (loss) | | | (0.77 | ) | | | (0.51 | ) | | | 2.85 | | | | 2.46 | | | | 1.92 | | | | 1.10 | |
| | | | | | | | | | | | | | | | | | | | | | | | | |
Total from investment operations | | | (0.71 | ) | | | 0.00 | (c) | | | 2.92 | | | | 2.54 | | | | 1.97 | | | | 1.16 | |
| | | | | | | | | | | | | | | | | | | | | | | | | |
Less distributions to shareholders: | | | | | | | | | | | | | | | | | | | | | | | | |
| | | | | | |
Net investment income | | | (0.49 | ) | | | (0.09 | ) | | | — | | | | (0.19 | ) | | | (0.01 | ) | | | (0.04 | ) |
| | | | | | | | | | | | | | | | | | | | | | | | | |
Net realized gains | | | (1.40 | ) | | | (1.58 | ) | | | (1.70 | ) | | | (0.55 | ) | | | (0.04 | ) | | | (0.00 | )(c) |
| | | | | | | | | | | | | | | | | | | | | | | | | |
Total distributions to shareholders | | | (1.89 | ) | | | (1.67 | ) | | | (1.70 | ) | | | (0.74 | ) | | | (0.05 | ) | | | (0.04 | ) |
| | | | | | | | | | | | | | | | | | | | | | | | | |
Net asset value, end of period | | | $11.79 | | | | $14.39 | | | | $16.06 | | | | $14.84 | | | | $13.04 | | | | $11.12 | |
| | | | | | | | | | | | | | | | | | | | | | | | | |
Total return | | | (6.24 | %) | | | (0.26 | %) | | | 20.44 | % | | | 20.48 | % | | | 17.83 | % | | | 11.61 | % |
| | | | | | | | | | | | | | | | | | | | | | | | | |
Ratios to average net assets(d) | | | | | | | | | | | | | | | | | | | | | | | | |
| | | | | | |
Total gross expenses | | | 1.05 | %(e) | | | 1.03 | % | | | 1.03 | % | | | 1.12 | % | | | 1.26 | %(f) | | | 1.32 | %(e) |
| | | | | | | | | | | | | | | | | | | | | | | | | |
Total net expenses(g) | | | 1.02 | %(e) | | | 1.03 | % | | | 1.03 | % | | | 1.08 | % | | | 1.25 | %(f)(h) | | | 1.32 | %(e) |
| | | | | | | | | | | | | | | | | | | | | | | | | |
Net investment income | | | 0.89 | %(e) | | | 3.28 | % | | | 0.44 | % | | | 0.59 | % | | | 0.40 | % | | | 0.60 | %(e) |
| | | | | | | | | | | | | | | | | | | | | | | | | |
Supplemental data | | | | | | | | | | | | | | | | | | | | | | | | |
| | | | | | |
Net assets, end of period (in thousands) | | | $7,788 | | | | $61,114 | | | | $85,780 | | | | $76,756 | | | | $66,930 | | | | $91,860 | |
| | | | | | | | | | | | | | | | | | | | | | | | | |
Portfolio turnover | | | 69 | % | | | 79 | % | | | 119 | % | | | 147 | % | | | 146 | % | | | 214 | % |
| | | | | | | | | | | | | | | | | | | | | | | | | |
Notes to Financial Highlights
| (a) | Based on operations from September 28, 2010 (commencement of operations) through the stated period end. |
| (b) | Net investment income per share includes special dividends. The effect of these dividends amounted to $0.46 per share. |
| (d) | In addition to the fees and expenses that the Fund bears directly, the Fund indirectly bears a pro rata share of the fees and expenses of any other funds in which it invests. Such indirect expenses are not included in the Fund’s reported expense ratios. |
| (f) | Ratios include line of credit interest expense which is less than 0.01%. |
| (g) | Total net expenses include the impact of certain fee waivers/expense reimbursements made by the Investment Manager and certain of its affiliates, if applicable. |
| (h) | The benefits derived from expense reductions had an impact of less than 0.01%. |
The accompanying Notes to Financial Statements are an integral part of this statement.
| | | | |
| Semiannual Report 2016 | | | 21 | |
| | | | |
| | |
| | COLUMBIA LARGE CAP GROWTH FUND IV | | |
NOTES TO FINANCIAL STATEMENTS
February 29, 2016 (Unaudited)
Note 1. Organization
Columbia Large Cap Growth Fund IV (formerly known as Columbia Marsico Flexible Capital Fund) (the Fund), a series of Columbia Funds Series Trust II (the Trust), is a diversified fund. The Trust is registered under the Investment Company Act of 1940, as amended (the 1940 Act), as an open-end management investment company organized as a Massachusetts business trust. Effective November 20, 2015, Columbia Marsico Flexible Capital Fund was renamed Columbia Large Cap Growth Fund IV.
Fund Shares
The Trust may issue an unlimited number of shares (without par value). The Fund offers Class A, Class C, Class I, Class R, Class R4, Class R5 and Class Z shares. Although all share classes generally have identical voting, dividend and liquidation rights, each share class votes separately when required by the Trust’s organizational documents or by law. Different share classes pay different distribution amounts to the extent the expenses of such share classes differ, and distributions in liquidation will be proportional to the net asset value of each share class. Each share class has its own expense and sales charge structure.
Class A shares are subject to a maximum front-end sales charge of 5.75% based on the initial investment amount. Class A shares purchased without an initial sales charge in accounts aggregating $1 million to $50 million at the time of purchase are subject to a contingent deferred sales charge (CDSC) if the shares are sold within 18 months after purchase, charged as follows: 1.00% CDSC if redeemed within 12 months after purchase, and 0.50% CDSC if redeemed more than 12, but less than 18, months after purchase.
Class C shares are subject to a 1.00% CDSC on shares redeemed within 12 months after purchase.
Class I shares are not subject to sales charges and are available only to the Columbia Family of Funds.
Class R shares are not subject to sales charges and are generally available only to certain retirement plans and other investors as described in the Fund’s prospectus.
Class R4 shares are not subject to sales charges and are generally available only to omnibus retirement plans and certain investors as described in the Fund’s prospectus.
Class R5 shares are not subject to sales charges and are generally available only to investors purchasing
through authorized investment professionals and omnibus retirement plans.
Class Z shares are not subject to sales charges and are available only to eligible investors, which are subject to different investment minimums as described in the Fund’s prospectus.
Note 2. Summary of Significant Accounting Policies
Basis of Preparation
The Fund is an investment company that applies the accounting and reporting guidance in the Financial Accounting Standards Board (FASB) Accounting Standards Codification Topic 946, Financial Services —Investment Companies (ASC 946). The financial statements are prepared in accordance with U.S. generally accepted accounting principles (GAAP), which requires management to make certain estimates and assumptions that affect the reported amounts of assets and liabilities, the disclosure of contingent assets and liabilities at the date of the financial statements and the reported amounts of income and expenses during the reporting period. Actual results could differ from those estimates.
The following is a summary of significant accounting policies followed by the Fund in the preparation of its financial statements.
Security Valuation
All equity securities and exchange-traded funds are valued at the close of business of the New York Stock Exchange (NYSE). Equity securities and exchange-traded funds are valued at the last quoted sales price on the principal exchange or market on which they trade, except for securities traded on the NASDAQ Stock Market, which are valued at the NASDAQ official close price. Unlisted securities or listed securities for which there were no sales during the day are valued at the mean of the latest quoted bid and ask prices on such exchanges or markets.
Foreign equity securities are valued based on the closing price on the foreign exchange in which such securities are primarily traded. If any foreign equity security closing prices are not readily available, the securities are valued at the mean of the latest quoted bid and ask prices on such exchanges or markets. Foreign currency exchange rates are generally determined at 4:00 p.m. Eastern (U.S.) time. Many securities markets and exchanges outside the U.S. close prior to the close of the NYSE; therefore, the closing prices for securities in such
| | |
| 22 | | Semiannual Report 2016 |
| | | | |
| | |
| | COLUMBIA LARGE CAP GROWTH FUND IV | | |
NOTES TO FINANCIAL STATEMENTS (continued)
February 29, 2016 (Unaudited)
markets or on such exchanges may not fully reflect events that occur after such close but before the close of the NYSE. In those situations, foreign securities will be fair valued pursuant to a policy adopted by the Board of Trustees (the Board), including, if available, utilizing a third party pricing service to determine these fair values. The third party pricing service takes into account multiple factors, including, but not limited to, movements in the U.S. securities markets, certain depositary receipts, futures contracts and foreign exchange rates that have occurred subsequent to the close of the foreign exchange or market, to determine a good faith estimate that reasonably reflects the current market conditions as of the close of the NYSE. The fair value of a security is likely to be different from the quoted or published price, if available.
Investments in open-end investment companies, including money market funds, are valued at their latest net asset value.
Investments for which market quotations are not readily available, or that have quotations which management believes are not reflective of market value or reliable, are valued at fair value as determined in good faith under procedures approved by and under the general supervision of the Board. If a security or class of securities (such as foreign securities) is valued at fair value, such value is likely to be different from the quoted or published price for the security.
The determination of fair value often requires significant judgment. To determine fair value, management may use assumptions including but not limited to future cash flows and estimated risk premiums. Multiple inputs from various sources may be used to determine fair value.
GAAP requires disclosure regarding the inputs and valuation techniques used to measure fair value and any changes in valuation inputs or techniques. In addition, investments shall be disclosed by major category. This information is disclosed following the Fund’s Portfolio of Investments.
Foreign Currency Transactions and Translations
The values of all assets and liabilities denominated in foreign currencies are generally translated into U.S. dollars at exchange rates determined at the close of the NYSE on any given day. Net realized and unrealized gains (losses) on foreign currency transactions and translations include gains (losses) arising from the fluctuation in exchange rates between trade and settlement dates on securities transactions, gains (losses) arising from the
disposition of foreign currency and currency gains (losses) between the accrual and payment dates on dividends, interest income and foreign withholding taxes.
For financial statement purposes, the Fund does not distinguish that portion of gains (losses) on investments which is due to changes in foreign exchange rates from that which is due to changes in market prices of the investments. Such fluctuations are included with the net realized and unrealized gains (losses) on investments in the Statement of Operations.
Security Transactions
Security transactions are accounted for on the trade date. Cost is determined and gains (losses) are based upon the specific identification method for both financial statement and federal income tax purposes.
Income Recognition
Corporate actions and dividend income are generally recorded net of any non-reclaimable tax withholdings, on the ex-dividend date or upon receipt of ex-dividend notification in the case of certain foreign securities.
Interest income is recorded on an accrual basis. Market premiums and discounts, including original issue discounts, are amortized and accreted, respectively, over the expected life of the security on all debt securities, unless otherwise noted.
The Fund may place a debt security on non-accrual status and reduce related interest income when it becomes probable that the interest will not be collected and the amount of uncollectible interest can be reasonably estimated. A defaulted debt security is removed from non-accrual status when the issuer resumes interest payments or when collectibility of interest is reasonably assured.
The Fund may receive distributions from holdings in equity securities, business development companies (BDCs), exchange-traded funds, other regulated investment companies (RICs), and real estate investment trusts (REITs), which report information on the tax character of their distributions annually. These distributions are allocated to dividend income, capital gain and return of capital based on actual information reported. Return of capital is recorded as a reduction of the cost basis of securities held. If the Fund no longer owns the applicable securities, return of capital is recorded as a realized gain. With respect to REITs, to the extent actual information has not yet been reported, estimates for return of capital are made by the Fund’s management. Management’s
| | | | |
| Semiannual Report 2016 | | | 23 | |
| | | | |
| | |
| | COLUMBIA LARGE CAP GROWTH FUND IV | | |
NOTES TO FINANCIAL STATEMENTS (continued)
February 29, 2016 (Unaudited)
estimates are subsequently adjusted when the actual character of the distributions is disclosed by the REITs, which could result in a proportionate change in return of capital to shareholders.
Awards from class action litigation are recorded as a reduction of cost basis if the Fund still owns the applicable securities on the payment date. If the Fund no longer owns the applicable securities, the proceeds are recorded as realized gains.
Expenses
General expenses of the Trust are allocated to the Fund and other funds of the Trust based upon relative net assets or other expense allocation methodologies determined by the nature of the expense. Expenses directly attributable to the Fund are charged to the Fund. Expenses directly attributable to a specific class of shares are charged to that share class.
Determination of Class Net Asset Value
All income, expenses (other than class-specific expenses, which are charged to that share class, as shown in the Statement of Operations) and realized and unrealized gains (losses) are allocated to each class of the Fund on a daily basis, based on the relative net assets of each class, for purposes of determining the net asset value of each class.
Federal Income Tax Status
The Fund intends to qualify each year as a regulated investment company under Subchapter M of the Internal Revenue Code, as amended, and will distribute substantially all of its taxable income (including net short-term capital gains), if any, for its tax year, and as such will not be subject to federal income taxes. In addition, the Fund intends to distribute in each calendar year substantially all of its net investment income, capital gains and certain other amounts, if any, such that the Fund should not be subject to federal excise tax. Therefore, no federal income or excise tax provision is recorded.
Foreign Taxes
The Fund may be subject to foreign taxes on income, gains on investments or currency repatriation, a portion of which may be recoverable. The Fund will accrue such taxes and recoveries, as applicable, based upon its current interpretation of tax rules and regulations that exist in the markets in which it invests.
Realized gains in certain countries may be subject to foreign taxes at the Fund level, based on statutory rates.
The Fund accrues for such foreign taxes on realized and unrealized gains at the appropriate rate for each jurisdiction, as applicable. The amount, if any, is disclosed as a liability on the Statement of Assets and Liabilities.
Distributions to Shareholders
Distributions from net investment income, if any, are declared and paid annually. Net realized capital gains, if any, are distributed along with the income distribution. Income distributions and capital gain distributions are determined in accordance with federal income tax regulations, which may differ from GAAP.
Guarantees and Indemnifications
Under the Trust’s organizational documents and, in some cases, by contract, its officers and trustees are indemnified against certain liabilities arising out of the performance of their duties to the Trust or its funds. In addition, certain of the Fund’s contracts with its service providers contain general indemnification clauses. The Fund’s maximum exposure under these arrangements is unknown since the amount of any future claims that may be made against the Fund cannot be determined, and the Fund has no historical basis for predicting the likelihood of any such claims.
Recent Accounting Pronouncement
Fair Value Measurement (Topic 820), Disclosure for Investments in Certain Entities That Calculate Net Asset Value per Share (or Its Equivalent)
In May 2015, FASB issued Accounting Standards Update (ASU) No. 2015-07, Fair Value Measurement (Topic 820), Disclosure for Investments in Certain Entities That Calculate Net Asset Value per Share (or Its Equivalent). ASU No. 2015-07 changes the disclosure requirements for investments for which fair value is measured using the net asset value per share practical expedient. The disclosure requirements are effective for annual periods beginning after December 15, 2015 and interim periods within those fiscal years. At this time, management is evaluating the implications of this guidance and the impact it will have on the financial statement amounts and footnote disclosures, if any.
Note 3. Fees and Other Transactions with Affiliates
Management Fees
Effective January 1, 2016, the Fund entered into a Management Agreement with Columbia Management Investment Advisers, LLC (the Investment Manager), a
| | |
| 24 | | Semiannual Report 2016 |
| | | | |
| | |
| | COLUMBIA LARGE CAP GROWTH FUND IV | | |
NOTES TO FINANCIAL STATEMENTS (continued)
February 29, 2016 (Unaudited)
wholly-owned subsidiary of Ameriprise Financial, Inc. (Ameriprise Financial). Under the Management Agreement, the Investment Manager provides the Fund with investment research and advice, as well as administrative and accounting services. The management services fee is an annual fee that is equal to a percentage of the Fund’s average daily net assets that declines from 0.77% to 0.57% as the Fund’s net assets increase. The annualized effective management services fee rate for the six months ended February 29, 2016 was 0.77% of the Fund’s average daily net assets.
Prior to January 1, 2016, the Fund paid the Investment Manager an annual fee for advisory services under an Investment Management Services Agreement and a separate annual fee for administrative and accounting services under an Administrative Services Agreement. For the period from September 1, 2015 through December 31, 2015, the investment advisory services fee paid to the Investment Manager was $383,127, and the administrative services fee paid to the Investment Manager was $32,377.
Subadvisory Agreement
Prior to November 20, 2015, the Investment Manager entered into a Subadvisory Agreement with Marsico Capital Management, LLC (Marsico) to serve as the subadviser to the Fund. The Investment Manager compensated Marsico to manage the investment of the Fund’s assets. Effective November 20, 2015, Marsico no longer serves as the subadviser to the Fund and the Investment Manager has assumed the day-to-day portfolio management of the Fund.
Other Expenses
Other expenses are for, among other things, miscellaneous expenses of the Fund or the Board, including payments to Board Services Corp., a company providing limited administrative services to the Fund and the Board. That company’s expenses include boardroom and office expense, employee compensation, employee health and retirement benefits, and certain other expenses. For the six months ended February 29, 2016, other expenses paid by the Fund to this company were $821.
Compensation of Board Members
Board members, who are not officers or employees of the Investment Manager or Ameriprise Financial, are compensated for their services to the Fund as disclosed in the Statement of Operations. Under a Deferred Compensation Plan (the Plan), these Board members may elect to defer payment of up to 100% of their compensation. Deferred amounts are treated as though
equivalent dollar amounts had been invested in shares of certain funds managed by the Investment Manager. The Fund’s liability for these amounts is adjusted for market value changes and remains in the Fund until distributed in accordance with the Plan. All amounts payable under the Plan constitute a general unsecured obligation of the Fund.
Transfer Agency Fees
Under a Transfer and Dividend Disbursing Agent Agreement, Columbia Management Investment Services Corp. (the Transfer Agent), an affiliate of the Investment Manager and a wholly-owned subsidiary of Ameriprise Financial, is responsible for providing transfer agency services to the Fund. The Transfer Agent has contracted with Boston Financial Data Services (BFDS) to serve as sub-transfer agent.
The Transfer Agent receives a monthly transfer agency fee based on the number or the average value of accounts, depending on the type of account. In addition, the Transfer Agent also receives sub-transfer agency fees based on a percentage of the average aggregate value of the Fund’s shares maintained in omnibus accounts (other than omnibus accounts for which American Enterprise Investment Services Inc. is the broker of record or accounts where the beneficial shareholder is a customer of Ameriprise Financial Services, Inc., for which the Transfer Agent receives a per account fee). The Transfer Agent pays the fees of BFDS for services as sub-transfer agent and is not entitled to reimbursement for such fees from the Fund (with the exception of out-of-pocket fees).
The Transfer Agent also receives compensation from the Fund for various shareholder services and reimbursements for certain out-of-pocket fees. Class I shares do not pay transfer agency fees. Total transfer agency fees for Class R5 shares are subject to an annual limitation of not more than 0.05% of the average daily net assets attributable to Class R5 shares.
For the six months ended February 29, 2016, the Fund’s annualized effective transfer agency fee rates as a percentage of average daily net assets of each class were as follows:
| | | | |
Class A | | | 0.17 | % |
Class C | | | 0.17 | |
Class R | | | 0.17 | |
Class R4 | | | 0.17 | |
Class R5 | | | 0.05 | |
Class Z | | | 0.16 | |
| | | | |
| Semiannual Report 2016 | | | 25 | |
| | | | |
| | |
| | COLUMBIA LARGE CAP GROWTH FUND IV | | |
NOTES TO FINANCIAL STATEMENTS (continued)
February 29, 2016 (Unaudited)
An annual minimum account balance fee of $20 may apply to certain accounts with a value below the applicable share class’s initial minimum investment requirements to reduce the impact of small accounts on transfer agency fees. These minimum account balance fees are remitted to the Fund and recorded as part of expense reductions in the Statement of Operations. For the six months ended February 29, 2016, no minimum account balance fees were charged by the Fund.
Distribution and Service Fees
The Fund has an agreement with Columbia Management Investment Distributors, Inc. (the Distributor), an affiliate of the Investment Manager and a wholly-owned subsidiary of Ameriprise Financial, for distribution and shareholder services. Under a Plan and Agreement of Distribution, the Fund pays a fee at an annual rate of up to 0.25% of the Fund’s average daily net assets attributable to Class A shares, a fee at an annual rate of up to 0.50% of the Fund’s average daily net assets attributable to Class R shares (of which up to 0.25% may be used for shareholder services) and a fee at an annual rate of up to 1.00% of the Fund’s average daily net assets attributable to Class C shares. For Class C shares, of the 1.00% fee, up to 0.75% is reimbursed for distribution expenses.
The amount of distribution and shareholder services expenses incurred by the Distributor and not yet reimbursed (unreimbursed expense) was approximately $30,000 for Class C shares. These amounts are based on the most recent information available as of December 31, 2015, and may be recovered from future payments under the distribution plan or CDSCs. To the extent the unreimbursed expense has been fully recovered, the distribution and/or shareholder services fee is reduced.
Sales Charges
Sales charges, including front-end charges and CDSCs, received by the Distributor for distributing Fund shares were $20,860 for Class A and $1,535 for Class C shares for the six months ended February 29, 2016.
Expenses Waived/Reimbursed by the Investment Manager and its Affiliates
The Fund’s expense ratio is subject to an expense reimbursement arrangement pursuant to which fees will be waived and/or expenses reimbursed (excluding certain fees and expenses described below), so that the Fund’s net operating expenses, after giving effect to fees waived/expenses reimbursed and any balance credits and/or overdraft charges from the Fund’s custodian, do
not exceed the following annual rates as a percentage of the class’ average daily net assets:
| | | | | | | | |
| | | Contractual
Expense Cap January 1, 2016 Through December 31, 2016 | | | Voluntary
Expense Cap Prior to November 20, 2015 | |
Class A | | | 1.30 | % | | | 1.30 | % |
Class C | | | 2.05 | | | | 2.05 | |
Class I | | | 0.92 | | | | 0.92 | |
Class R | | | 1.55 | | | | 1.55 | |
Class R4 | | | 1.05 | | | | 1.05 | |
Class R5 | | | 0.97 | | | | 0.97 | |
Class Z | | | 1.05 | | | | 1.05 | |
The contractual agreement may be modified or amended only with approval from the Investment Manager, certain of its affiliates and the Fund. Under the arrangements, the following fees and expenses are excluded from the waiver/reimbursement commitment, and therefore will be paid by the Fund, if applicable: taxes (including foreign transaction taxes), expenses associated with investments in affiliated and non-affiliated pooled investment vehicles (including mutual funds and exchange-traded funds), transaction costs and brokerage commissions, costs related to any securities lending program, dividend and interest expenses associated with securities sold short, inverse floater program fees and expenses, transaction charges and interest on borrowed money, interest and extraordinary expenses.
In addition, effective November 20, 2015, the Fund’s expense ratio is subject to a voluntary expense reimbursement arrangement pursuant to which fees will be waived and/or expenses reimbursed (excluding certain fees and expenses immediately described above), so that the Fund’s net operating expenses, after giving effect to fees waived/expenses reimbursed and any balance credits and/or overdraft charges from the Fund’s custodian, do not exceed the annual rates of 1.23% for Class A, 1.98% for Class C, 0.85% for Class I, 1.48% for Class R, 0.98% for Class R4, 0.90% for Class R5 and 0.98% for Class Z. This arrangement may be revised or discontinued at any time.
Any fees waived and/or expenses reimbursed under the expense reimbursement arrangements described above are not recoverable by the Investment Manager or its affiliates in future periods.
| | |
| 26 | | Semiannual Report 2016 |
| | | | |
| | |
| | COLUMBIA LARGE CAP GROWTH FUND IV | | |
NOTES TO FINANCIAL STATEMENTS (continued)
February 29, 2016 (Unaudited)
Note 4. Federal Tax Information
The timing and character of income and capital gain distributions are determined in accordance with income tax regulations, which may differ from GAAP because of temporary or permanent book to tax differences.
At February 29, 2016, the cost of investments for federal income tax purposes was approximately $83,442,000 and the aggregate gross approximate unrealized appreciation and depreciation based on that cost was:
| | | | |
Unrealized appreciation | | | $ 3,307,000 | |
Unrealized depreciation | | | (6,394,000 | ) |
Net unrealized depreciation | | | $(3,087,000 | ) |
Management of the Fund has concluded that there are no significant uncertain tax positions in the Fund that would require recognition in the financial statements. However, management’s conclusion may be subject to review and adjustment at a later date based on factors including, but not limited to, new tax laws, regulations, and administrative interpretations (including relevant court decisions). Generally, the Fund’s federal tax returns for the prior three fiscal years remain subject to examination by the Internal Revenue Service.
Note 5. Portfolio Information
The cost of purchases and proceeds from sales of securities, excluding short-term investments and derivatives, if any, aggregated to $84,873,112 and $153,092,848, respectively, for the six months ended February 29, 2016. The amount of purchase and sale activity impacts the portfolio turnover rate reported in the Financial Highlights.
Note 6. Affiliated Money Market Fund
The Fund invests in Columbia Short-Term Cash Fund, an affiliated money market fund established for the exclusive use by the Fund and other affiliated funds. The income earned by the Fund from such investments is included as Dividends — affiliated issuers in the Statement of Operations. As an investing fund, the Fund indirectly bears its proportionate share of the expenses of Columbia Short-Term Cash Fund.
Note 7. Line of Credit
The Fund has access to a revolving credit facility whereby the Fund may borrow for the temporary funding of shareholder redemptions or for other temporary or emergency purposes. Effective December 8, 2015, Citibank, N.A. and HSBC Bank USA, N.A. joined JPMorgan Chase Bank, N.A. (JPMorgan) as lead of a syndicate of
banks under the credit facility, which is a collective agreement between the Fund and certain other funds managed by the Investment Manager, severally and not jointly, that permits collective borrowings up to $1 billion. Interest is charged to each participating fund based on its borrowings at a rate equal to the higher of (i) the overnight federal funds rate plus 1.00% or (ii) the one-month LIBOR rate plus 1.00%. Each borrowing under the credit facility matures no later than 60 days after the date of borrowing. The Fund also pays a commitment fee equal to its pro rata share of the amount of the credit facility at a rate of 0.15% per annum. The commitment fee is included in other expenses in the Statement of Operations. Prior to December 8, 2015, JPMorgan was the sole lead bank under the credit facility agreement that permitted borrowings up to $550 million under the same terms and interest rates as described above with the exception of the commitment fee which was charged at a rate of 0.075% per annum.
The Fund had no borrowings during the six months ended February 29, 2016.
Note 8. Significant Risks
Shareholder Concentration Risk
At February 29, 2016, affiliated shareholders of record owned 67.3% of the outstanding shares of the Fund in one or more accounts. Subscription and redemption activity by concentrated accounts may have a significant effect on the operations of the Fund. In the case of a large redemption, the Fund may be forced to sell investments at inopportune times, including its liquid or more liquid positions, resulting in Fund losses and the Fund holding a higher percentage of less liquid or illiquid securities. Large redemptions could result in decreased economies of scale and increased operating expenses for non-redeeming Fund shareholders.
Technology and Technology-related Investment Risk
The Fund may be more susceptible to the particular risks that may affect companies in the information technology sector, as well as other technology-related sectors (collectively, the technology sectors) than if it were invested in a wider variety of companies in unrelated sectors. Companies in the technology sectors are subject to certain risks, including the risk that new services, equipment or technologies will not be accepted by consumers and businesses or will become rapidly obsolete. Performance of such companies may be affected by factors including obtaining and protecting patents (or the failure to do so) and significant competitive pressures, including aggressive pricing of
| | | | |
| Semiannual Report 2016 | | | 27 | |
| | | | |
| | |
| | COLUMBIA LARGE CAP GROWTH FUND IV | | |
NOTES TO FINANCIAL STATEMENTS (continued)
February 29, 2016 (Unaudited)
their products or services, new market entrants, competition for market share and short product cycles due to an accelerated rate of technological developments. Such competitive pressures may lead to limited earnings and/or falling profit margins. As a result, the value of their securities may fall or fail to rise. In addition, many technology sector companies have limited operating histories and prices of these companies’ securities historically have been more volatile than other securities, especially over the short term.
Consumer Discretionary Sector Risk
The Fund may be more susceptible to the particular risks that may affect companies in the consumer discretionary sector than if it were invested in a wider variety of companies in unrelated sectors. Companies in the consumer discretionary sector are subject to certain risks, including fluctuations in the performance of the overall domestic and international economy, interest rate changes, increased competition and consumer confidence. Performance of such companies may be affected by factors including reduced disposable household income, reduced consumer spending, changing demographics and consumer tastes.
Note 9. Subsequent Events
Management has evaluated the events and transactions that have occurred through the date the financial statements were issued. Other than as noted below, there were no items requiring adjustment of the financial statements or additional disclosure.
On April 15, 2016, shareholders of the Fund approved a proposal to merge the Fund into Columbia Large Cap Growth Fund. The merger is expected to take place on or about May 20, 2016.
Note 10. Information Regarding Pending and Settled Legal Proceedings
In December 2005, without admitting or denying the allegations, American Express Financial Corporation (AEFC, which is now known as Ameriprise Financial, Inc. (Ameriprise Financial)) entered into settlement agreements with the Securities and Exchange Commission (SEC) and Minnesota Department of Commerce (MDOC) related to market timing activities. As a result, AEFC was censured and ordered to cease and desist from committing or causing any violations of
certain provisions of the Investment Advisers Act of 1940, the Investment Company Act of 1940, and various Minnesota laws. AEFC agreed to pay disgorgement of $10 million and civil money penalties of $7 million. AEFC also agreed to retain an independent distribution consultant to assist in developing a plan for distribution of all disgorgement and civil penalties ordered by the SEC in accordance with various undertakings detailed at http://www.sec.gov/litigation/admin/ia-2451.pdf. Ameriprise Financial and its affiliates have cooperated with the SEC and the MDOC in these legal proceedings, and have made regular reports to the Funds’ Boards of Trustees.
Ameriprise Financial and certain of its affiliates have historically been involved in a number of legal, arbitration and regulatory proceedings, including routine litigation, class actions, and governmental actions, concerning matters arising in connection with the conduct of their business activities. Ameriprise Financial believes that the Funds are not currently the subject of, and that neither Ameriprise Financial nor any of its affiliates are the subject of, any pending legal, arbitration or regulatory proceedings that are likely to have a material adverse effect on the Funds or the ability of Ameriprise Financial or its affiliates to perform under their contracts with the Funds. Ameriprise Financial is required to make quarterly (10-Q), annual (10-K) and, as necessary, 8-K filings with the SEC on legal and regulatory matters that relate to Ameriprise Financial and its affiliates. Copies of these filings may be obtained by accessing the SEC website at www.sec.gov.
There can be no assurance that these matters, or the adverse publicity associated with them, will not result in increased fund redemptions, reduced sale of fund shares or other adverse consequences to the Funds. Further, although we believe proceedings are not likely to have a material adverse effect on the Funds or the ability of Ameriprise Financial or its affiliates to perform under their contracts with the Funds, these proceedings are subject to uncertainties and, as such, we are unable to estimate the possible loss or range of loss that may result. An adverse outcome in one or more of these proceedings could result in adverse judgments, settlements, fines, penalties or other relief that could have a material adverse effect on the consolidated financial condition or results of operations of Ameriprise Financial.
| | |
| 28 | | Semiannual Report 2016 |
| | | | |
| | |
| | COLUMBIA LARGE CAP GROWTH FUND IV | | |
IMPORTANT INFORMATION ABOUT THIS REPORT
Each fund mails one shareholder report to each shareholder address. If you would like more than one report, please call shareholder services at 800.345.6611 and additional reports will be sent to you.
The policy of the Board is to vote the proxies of the companies in which each fund holds investments consistent with the procedures as stated in the Statement of Additional Information (SAI). You may obtain a copy of the SAI without charge by calling 800.345.6611; contacting your financial intermediary; visiting columbiathreadneedle.com/us; or searching the website of the Securities and Exchange Commission (SEC) at sec.gov. Information regarding how each fund voted proxies relating to portfolio securities is filed with the SEC by August 31st for the most recent 12-month period ending June 30th of that year, and is available without charge by visiting columbiathreadneedle.com/us, or searching the website of the SEC at sec.gov.
Each fund files a complete schedule of portfolio holdings with the SEC for the first and third quarters of each fiscal year on Form N-Q. Each fund’s Form N-Q is available on the SEC’s website at sec.gov and may be reviewed and copied at the SEC’s Public Reference Room in Washington, D.C. Information on the operation of the Public Reference Room may be obtained by calling 800.SEC.0330. Each fund’s complete schedule of portfolio holdings, as filed on Form N-Q, can also be obtained without charge, upon request, by calling 800.345.6611.
| | | | |
| Semiannual Report 2016 | | | 29 | |
Columbia Large Cap Growth Fund IV
P.O. Box 8081
Boston, MA 02266-8081
This information is for use with concurrent or prior delivery of a fund prospectus. Please read and consider the investment objectives, risks, charges and expenses for any fund carefully before investing. For a prospectus and summary prospectus, which contains this and other important information about the Fund, go to columbiathreadneedle.com/us. The Fund is distributed by Columbia Management Investment Distributors, Inc., member FINRA, and managed by Columbia Management Investment Advisers, LLC.
Columbia Threadneedle Investments (Columbia Threadneedle) is the global brand name of the Columbia and Threadneedle group of companies. All rights reserved. Columbia Management Investment Distributors, Inc., 225 Franklin Street, Boston, MA 02110-2804
© 2016 Columbia Management Investment Advisers, LLC.
columbiathreadneedle.com/us
SAR185_08_F01_(04/16)
Item 2. Code of Ethics.
Not applicable for semiannual reports.
Item 3. Audit Committee Financial Expert.
Not applicable for semiannual reports.
Item 4. Principal Accountant Fees and Services.
Not applicable for semiannual reports.
Item 5. Audit Committee of Listed Registrants.
Not applicable.
Item 6. Investments
| | (a) | The registrant’s “Schedule I – Investments in securities of unaffiliated issuers” (as set forth in 17 CFR 210.12-12) is included in Item 1 of this Form N-CSR. |
Item 7. Disclosure of Proxy Voting Policies and Procedures for Closed-End Management Investment Companies.
Not applicable.
Item 8. Portfolio Managers of Closed-End Management Investment Companies.
Not applicable.
Item 9. Purchases of Equity Securities by Closed-End Management Investment Company and Affiliated Purchasers.
Not applicable.
Item 10. Submission of Matters to a Vote of Security Holders.
There were no material changes to the procedures by which shareholders may recommend nominees to the registrant’s board of directors.
Item 11. Controls and Procedures.
| | (a) | The registrant’s principal executive officer and principal financial officers, based on their evaluation of the registrant’s disclosure controls and procedures as of a date within 90 days of the filing of this report, have concluded that such controls and procedures are adequately designed to ensure that material information required to be disclosed by the registrant in Form N-CSR is accumulated and communicated to the registrant’s management, including the principal executive officer and principal financial officer, or persons performing similar functions, as appropriate to allow timely decisions regarding required disclosure. |
| | (b) | There was no change in the registrant’s internal control over financial reporting that occurred during the registrant’s second fiscal quarter of the period covered by this report that has materially affected, or is reasonably likely to materially affect, the registrant’s internal control over financial reporting. |
Item 12. Exhibits.
(a)(1) Code of ethics required to be disclosed under Item 2 of Form N-CSR: Not applicable for semiannual reports.
(a)(2) Certifications pursuant to Rule 30a-2(a) under the Investment Company Act of 1940 (17 CFR 270.30a-2(a)) attached hereto as Exhibit 99.CERT.
(a)(3) Not applicable.
(b) Certification pursuant to Rule 30a-2(b) under the Investment Company Act of 1940 (17 CFR 270.30a-2(b)) attached hereto as Exhibit 99.906CERT.
SIGNATURES
Pursuant to the requirements of the Securities Exchange Act of 1934 and the Investment Company Act of 1940, the registrant has duly caused this report to be signed on its behalf by the undersigned, thereunto duly authorized.
| | |
| (registrant) | | Columbia Funds Series Trust II |
| | |
| By (Signature and Title) | | /s/ Christopher O. Petersen |
| | Christopher O. Petersen, President and Principal Executive Officer |
Pursuant to the requirements of the Securities Exchange Act of 1934 and the Investment Company Act of 1940, this report has been signed below by the following persons on behalf of the registrant and in the capacities and on the dates indicated.
| | |
| By (Signature and Title) | | /s/ Christopher O. Petersen |
| | Christopher O. Petersen, President and Principal Executive Officer |
| | |
| By (Signature and Title) | | /s/ Michael G. Clarke |
| | Michael G. Clarke, Treasurer and Chief Financial Officer |