united states
securities and exchange commission
washington, d.c. 20549
form n-csr
certified shareholder report of registered management
investment companies
Investment Company Act file number 811-21853
Northern Lights Variable Fund Trust
(Exact name of registrant as specified in charter)
225 Pictoria Drive, Suite 450 Cincinnati, OH 45246
(Address of principal executive offices) (Zip code)
The Corporation Trust Company
1209 Orange Street
Wilmington, DE 19801
(Name and address of agent for service)
Registrant's telephone number, including area code: 631-470-2600
Date of fiscal year end: 12/31
Date of reporting period: 12/31/21
Item 1. Reports to Stockholders.
| |
| |
| |
| |
| |
 |
| |
| |
| |
| |
| |
| |
| Donoghue Forlines Dividend VIT Fund |
| Class 1 shares |
| Class 2 shares |
| |
| Donoghue Forlines Momentum VIT Fund |
| Class 1 shares |
| Class 2 shares |
| |
| |
| |
| |
| Annual Report |
| December 31, 2021 |
| |
| |
| |
| |
| |
| |
| |
| |
| |
| |
| 1-877-779-7462 |
| |
| |
| |
| |
| |
| |
| |
| |
| |
| |
| Distributed by Northern Lights Distributors, LLC |
| Member FINRA |
| |
| |
| |
| |

POWER INCOME VIT FUND (Liquidated)
DONOGHUE FORLINES DIVIDEND VIT FUND
DONOGHUE FORLINES MOMENTUM VIT FUND
ANNUAL LETTER TO SHAREHOLDERS
BY JEFFREY R. THOMPSON, CHIEF EXECUTIVE OFFICER, PORTFOLIO MANAGER
February 16, 2022
Dear Investors,
We are pleased to address our annual letter to shareholders of the Power Income VIT Fund, the Donoghue Forlines Dividend VIT Fund, and the Donoghue Forlines Momentum VIT Fund (each a “VIT Fund” and collectively the “VIT Funds”).
The Power Income VIT Fund was liquidated in March 2021. During the year ended December 31, 2021, the Donoghue Forlines Dividend VIT Fund, and the Donoghue Forlines Momentum VIT Fund had the following performance relative to their respective benchmark indices:
Returns for Year ended December 31, 2021
| | Dividend VIT Fund | 30.30% |
| | S&P 500 Total Return Index | 28.71% |
| | S&P 500 Value Total Return Index | 24.90% |
| | | |
| | Momentum VIT Fund | 29.66% |
| | S&P 500 Total Return Index | 28.71% |
| | | |
Source: Ultimus Fund Solutions
Stock markets continued to climb higher in 2021, hitting a series of all-time closing highs and ending the year near a record. A robust economic environment provided tailwinds for all risk assets. While Covid continued to dominate headlines, concerns flipped to inflation and its potential impact. With high inflation and strong job growth, markets prepare for the beginning of a shift toward less accommodative monetary policy.
 | 800.642.4276 |  | DonoghueForlines.com |  | One International Place, Suite 310
Boston, MA 02110 |
UPDATE ON THE POWER INCOME VIT FUND
The Power Income VIT Fund was liquidated in March 2021.
UPDATE ON THE DONOGHUE FORLINES DIVIDEND VIT FUND
To better serve our shareholders, we enhanced the strategy used to manage the Donoghue Forlines Dividend VIT Fund effective March 9, 2021. The major impact to the portfolio is that sector allocations will be neutral to the benchmark. This will reduce active share and help the portfolio participate through rapidly changing sectoral trends. Additionally, we extended the duration of one of our tactical sell signals. This will allow half the portfolio to remain invested over time. These changes were implemented by changing the underlying index that the portfolio attempts to track from the W.E. Donoghue Power Dividend Index to the FCF Risk Managed Sector Neutral Dividend Index.
The Donoghue Forlines Dividend VIT Fund’s primary objective is total return from dividend income and capital appreciation. Capital preservation is a secondary objective of the fund. The Fund seeks to beat the total return performance of the both the S&P 500 Index and the S&P 500 Value Index over a full market cycle on a risk adjusted basis.
The Donoghue Forlines Dividend VIT Fund began the year in a bullish stance invested in dividend stocks. The Fund received no technical triggers the year. The Fund had quarterly reconstitution and rebalanced on March 9, June 4, September 8, and December 6, 2021.
The Donoghue Forlines Dividend VIT outperformed its benchmarks during 2021 in large part due to the changes that we implemented during the year. We stayed invested for the entire period in a risk-on environment and our quantitative approach was able to provide positive attribution. Our holdings in Energy, Financials, and Healthcare provided the largest contribution to return.
Our focus continues to be risk-adjusted returns over a full market cycle. This is where we may miss upside in some instances for the greater good of missing the catastrophic downside, which can be devastating to a pre-retiree or retiree.
UPDATE ON THE DONOGHUE FORLINES MOMENTUM VIT FUND
To better serve our clients, we enhanced the strategy used to manage the Donoghue Forlines Momentum Fund effective March 9, 2021. The major impact to the portfolio is that sector allocations will be neutral to the benchmark. This will reduce active share and help the portfolio participate through rapidly changing sectoral trends. Additionally, we extended the duration of one of our tactical sell signals. This will allow half the portfolio to remain invested over time. These changes were implemented by changing the underlying index that the portfolio attempts to track

from the W.E. Donoghue Power Momentum Index to the FCF Risk Managed Sector Neutral Momentum Index.
The Donoghue Forlines Momentum Index VIT Fund’s primary objective is capital growth and income. Capital preservation is a secondary objective of the fund. The Fund seeks to beat the total return performance of the S&P 500 Index over a full market cycle on a risk adjusted basis.
During the year, the strategy had one total tactical trigger. The fund sold out of the utilities sector on February 26, 2021. The fund became fully invested again when the index change became effective on March 9, 2021. The Fund had quarterly reconstitution and rebalanced on March 9, June 4, September 8, and December 6, 2021.
The Donoghue Forlines Momentum VIT outperformed its benchmark during 2021 in large part due to the changes that we implemented during the year. We stayed invested for the majority of the period in a risk-on environment and our quantitative approach was able to provide positive attribution. Our holdings in Energy, Consumer Staples, and Information Technology provided the largest contribution to return.
Our focus continues to be risk-adjusted returns over a full market cycle. This is where we may miss upside in some instances for the greater good of missing the catastrophic downside, which can be devastating to a pre-retiree or retiree.
DIVIDENDS AND DISTRIBUTIONS
The Donoghue Forlines Dividend VIT Fund made the following dividend and capital gain distributions during the year ended December 31, 2021:
| | Distribution Date | Long-Term
Capital Gains | Short-Term
Capital Gains | Dividend
Income | Distribution
Total |
| | 03/30/2021 | 0.0000 | 0.0000 | 0.0513 | 0.0513 |
| | 06/29/2021 | 0.0000 | 0.0000 | 0.0553 | 0.0553 |
| | 9/29/2021 | 0.0000 | 0.0000 | 0.0884 | 0.0884 |
| | Source: Ultimus Fund Solutions | | | | |
| | | | | | |
The Donoghue Forlines Momentum VIT Fund did not have any dividend or capital gain distributions during the year ended December 31, 2021.
MARKET OUTLOOK AND POTENTIAL POWER VIT FUND IMPLICATION
We are only a few weeks into the year, but investors must hope the adage “as January goes, so goes the year” does not hold true for 2022. After all, at the recent lows, the S&P 500 was down
almost 10% while the Nasdaq 100 was down almost 15%. And behind this pullback, pain in the most speculative parts of the market is starting to add up. SPACS, meme stocks, unprofitable tech, and crypto have all struggled. Momentum seems to have turned…so, is there anything to like about risk markets?
Surging COVID cases, the FOMC’s hawkish pivot, fiscal headwinds from Washington, extreme 2021 equity flows, and valuations are all legitimate concerns for investors, but the fact that we’re all talking about them suggests they’re already well known and mostly reflected in the market.
And selling the market based on headlines has never been a successful path to long-term outperformance.
And we believe, despite higher volatility, there are several reasons to remain constructive towards risk assets for 2022.
So, let’s throw away the headlines and review the current macro landscape and its implications on financial markets:
Growth
First, while growth will slow this year, we expect it will remain above trend. As we saw in 2021, average growth during economic expansions tends to be strongest early as pent-up demand leads to strong economic activity. While we believe we have reached “peak growth” for the cycle, at 20 months, the current expansion is still a baby. Post-WWII expansions have an average of 67 months, including three which have been longer than 100 months. It’s highly unlikely for the economy to move back into a recession so early in an expansion, and two indicators we track closely - the ratio of leading to coincident indicators and the US treasury yield curve - indicate that the recovery remains on track.
Leading indicators tend to always roll over well in advance of a recession. Now, the ratio is right at cycle highs indicating the health of the expansion remains sound.
One of the most reliable predictors of an impending recession is the US Treasury yield curve and specifically the spread between the 2-year and 10- year notes. Almost every inversion of yield curve has been followed by a recession, and no recession since at least the mid-1970s has occurred without an inversion of the yield curve beforehand.
While the curve has flattened substantially since March 2021, it still hasn’t inverted, suggesting that outside of a major policy error by the Fed (or an exogenous shock), a recession starting in 2022 is unlikely.
We also discount the effect rising covid cases will have on the economy. Households and firms have learned to transact through covid over the last 2 years and the new Omicron variant appears to be less severe. We believe cases may have already peaked for the current wave.
Inflation
Second, we believe that inflation is peaking, and in any case is not as bad as it looks. Inflation should dip over the next six to nine months as the demand for goods moderates and supply-chain disruptions abate. When you strip out temporary distortions, inflation is not high by historical standards. The year over year inflation rates everyone is panicking about are misleading because they include large paybacks for the collapse in prices in the first year of the pandemic. If we look at two-year core rates that exclude energy and strip out Covid base effects, we find annualized US core PCE inflation is only 2.8%. Granted, even when the Covid reopening and energy effects drop out, inflation is unlikely to subside to the official 2% target rates. But after the shock of 7% headlines, inflation in the range of 3-4% in the US and even milder in other developed economies should be met with relief. On a longer timeline, inflation may continue to be structurally higher the next decade and investors will need to consider new diversifiers.
Policy
Finally, we expect these growth and inflation dynamics will allow the Fed to not significantly tighten monetary policy in 2022 despite current headlines. While the Federal Reserve will expedite the tapering of asset purchases and will probably begin raising rates in March, the Fed is unlikely to raise rates significantly. The respite from inflation this year will give the Fed some breathing space and a major tightening campaign is less likely before mid-2023. The Fed has turned more hawkish, but the market has made a habit of over-estimating Fed moves. Reflective of this environment, real bond yields remain low and financial conditions remain easy. On the fiscal side, there will be much less stimulus, but with the dysfunction coming out of DC, tax hikes may also be less likely.
Financial Market Implications
Our golden rule of investing is simple: Don’t bet against stocks unless you think that there is a recession around the corner, because equities and bear markets tend to overlap. Equity corrections can occur outside of recessionary periods. In fact, we are experiencing such a correction right now. Yet, with the percentage of bearish investors reaching the highest level in over 12 months in this week’s American Association of Individual Investors survey, chances are that the correction will not last much longer. A sustained decline in stock prices requires a sustained decline in corporate earnings; the latter normally only happens during economic downturns.
Equity valuations are still at lofty levels, but equities still look much more attractive than other asset classes. Don’t expect the outsized returns of the past year and a half, but the bull market should continue. Our equity exposure remains focused on quality.
Investors need to adapt their portfolio for today’s low return environment or accept low (or negative) expected returns. Advisors are challenged to rethink foundational portfolio elements of investor portfolios – which means seeking out strategies that bolster the “core” going forward. With no cheap assets, tactical and unconstrained management is now more important than ever.
In order to produce positive returns over the next 5-10 years, investors will likely need to actively manage growth cycles. Tactical management is an excellent alternative for advisors trying to navigate this new environment for their clients. In today’s markets, the 60/40 retirement rule is stuck in the past.
Regards,

Jeffrey R. Thompson
Chief Executive Officer
Portfolio Manager
9104-NLD 02/18/2022
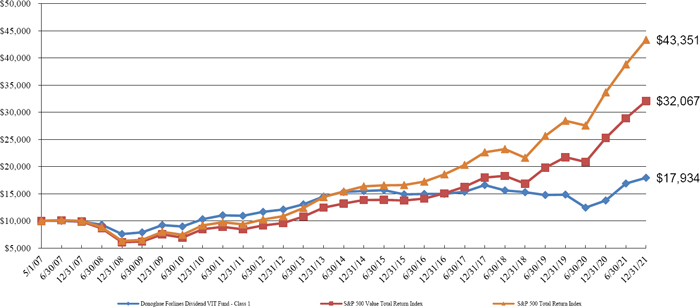
| Donoghue Forlines Dividend VIT Fund |
| PORTFOLIO REVIEW (Unaudited) |
| December 31, 2021 |
| |
The Fund’s performance figures* for the periods ended December 31, 2021, compared to its benchmarks:
| | | Annualized | Annualized | Annualized |
| | One Year | Five Year | Ten Year | Since Inception (a) |
| Donoghue Forlines Dividend VIT Fund - Class 1 | 30.30% | 3.67% | 5.08% | 4.06% |
| S&P 500 Value Total Return Index (b) | 26.89% | 16.31% | 14.25% | 8.27% |
| S&P 500 Total Return Index (c) | 28.71% | 18.47% | 16.55% | 10.52% |
| | | | | |
Comparison of the Change in Value of a $10,000 Investment
| * | The performance data quoted is historical. Past performance is no guarantee of future results. Current performance may be higher or lower than the performance data quoted. The principal value and investment return of an investment will fluctuate so that your shares, when redeemed, may be worth more or less than their original cost. The returns shown do not reflect the deduction of taxes that a shareholder would pay on Fund distributions or on the redemption of Fund shares, as well as other charges and expenses of the insurance contract or separate account. Returns greater than 1 year are annualized. The total annual operating expenses as stated in the fee table of the Fund’s Class 1 and Class 2 prospectus dated May 1, 2021 is 2.41% and 2.66% for Class 1 and Class 2 shares, respectively. The Fund’s advisor has contractually agreed to waive its fees and reimburse expenses of the Fund, at least until October 31, 2022, to ensure that Total Annual Fund Operating Expenses After Expense Waiver and Reimbursements (exclusive of any (i) front-end or contingent deferred loads, (ii) brokerage fees and commissions, (iii) acquired fund fees and expenses, (iv) fees and expenses associated with investments in other collective investment vehicles or derivative instruments (including for example option and swap fees and expenses), (v) borrowing costs (such as interest and dividend expense on securities sold short), (vi) taxes, and (vii) extraordinary expenses, such as litigation expenses (which may include indemnification of Fund officers and Trustees, contractual indemnification of Fund service providers (other than the advisor)) , will not exceed 2.00% and 2.50% of the Fund’s average daily net assets for Class 1 and Class 2 shares, respectively. As of December 31, 2021 Class 2 shares have not commenced operations. For performance information current to the most recent month-end, please call 1-877-779-7462. |
| (a) | Inception date is May 1, 2007 |
| (b) | The S&P 500 Value Total Return Index measures the performance of the large-capitalization value sector in the US equity market. It is a subset of the S&P 500 Index and consists of those stocks in the S&P 500 Index exhibiting the strongest value characteristics. Investors cannot invest directly in an index. |
| (c) | The S&P 500 Total Return Index is an unmanaged market capitalization weighted index of 500 of the largest capitalized US domiciled companies. Index returns assume reinvestment of dividends. Investors may not invest in the indexes directly; unlike the Fund’s returns, the indexes do not reflect any fees or expenses. |
| Portfolio Composition as of December 31, 2021 |
| | | | |
| Holdings By Investment Types | | % of Net Assets | |
| Common Stock | | | 98.4 | % |
| Short-Term Investments | | | 13.7 | % |
| Other Assets in Excess of Liabilities | | | (12.1 | )% |
| | | | 100.0 | % |
| | | | | |
Please refer to the Portfolio of Investments in this report for a detailed listing of the Fund’s holdings.
| Donoghue Forlines Momentum VIT Fund |
| PORTFOLIO REVIEW (Unaudited) |
| December 31, 2021 |
| |
The Fund’s performance figures* for the periods ended December 31, 2021, compared to its benchmarks:
| | | Annualized | Annualized | Annualized |
| | One Year | Five Year | Ten Year | Since Inception (a) |
| Donoghue Forlines Momentum VIT Fund - Class 1 | 29.66% | 10.22% | 11.29% | 6.72% |
| S&P 500 Total Return Index (b) | 28.71% | 18.47% | 16.55% | 10.52% |
| | | | | |
Comparison of the Change in Value of a $10,000 Investment

| * | The performance data quoted is historical. Past performance is no guarantee of future results. Current performance may be higher or lower than the performance data quoted. The principal value and investment return of an investment will fluctuate so that your shares, when redeemed, may be worth more or less than their original cost. The returns shown do not reflect the deduction of taxes that a shareholder would pay on Fund distributions or on the redemptions of Fund shares, as well as other charges and expenses of the insurance contract or separate account. Returns greater than 1 year are annualized. The total annual operating expenses as stated in the fee table of the Fund’s Class 1 and Class 2 prospectus dated May 1, 2021, is 1.60% and 1.85% for Class 1 and Class 2 shares, respectively. The Fund’s advisor has contractually agreed to waive its fees and reimburse expenses of the Fund at least until October 31, 2022, to ensure that Total Annual Fund Operating Expenses After Expense Waiver and Reimbursements (exclusive of any (i) front-end or contingent deferred loads, (ii) brokerage fees and commissions, (iii) acquired fund fees and expenses, (iv) fees and expenses associated with investments in other collective investment vehicles or derivative instruments (including for example option and swap fees and expenses), (v) borrowing costs (such as interest and dividend expense on securities sold short), (vi) taxes, and (vii) extraordinary expenses, such as litigation expenses (which may include indemnification of Fund officers and Trustees, contractual indemnification of Fund service providers (other than the advisor)), will not exceed 2.00% and 2.50% of the Fund’s average daily net assets for Class 1 and Class 2 shares, respectively. As of December 31, 2021 Class 2 shares have not commenced operations. For performance information current to the most recent month-end, please call 1-877-779-7462. |
| (a) | Inception date is May 1, 2007 |
| (b) | The S&P 500 Total Return Index is an unmanaged market capitalization weighted index of 500 of the largest capitalized US domiciled companies. Index returns assume reinvestment of dividends. Investors may not invest in the indexes directly; unlike the Fund’s returns, the indexes do not reflect any fees or expenses. |
| Portfolio Composition as of December 31, 2021 |
| | | | |
| Holdings By Investment Type | | % of Net Assets | |
| Common Stock | | | 98.9 | % |
| Short-Term Investments | | | 9.6 | % |
| Other Assets in Excess of Liabilities | | | (8.50 | )% |
| | | | 100.0 | % |
| | | | | |
Please refer to the Schedule of Investments in this report for a detailed listing of the Fund’s holdings.
| DONOGHUE FORLINES DIVIDEND VIT FUND |
| SCHEDULE OF INVESTMENTS |
| December 31, 2021 |
| Shares | | | | | Fair Value | |
| | | | | COMMON STOCKS — 98.4% | | | | |
| | | | | ADVERTISING & MARKETING - 2.0% | | | | |
| | 3,231 | | | Omnicom Group, Inc. | | $ | 236,735 | |
| | | | | | | | | |
| | | | | | | | | |
| | | | | AEROSPACE & DEFENSE - 5.8% | | | | |
| | 1,149 | | | General Dynamics Corporation | | | 239,532 | |
| | 1,226 | | | Huntington Ingalls Industries, Inc. | | | 228,943 | |
| | 652 | | | Lockheed Martin Corporation | | | 231,727 | |
| | | | | | | | 700,202 | |
| | | | | ASSET MANAGEMENT - 3.7% | | | | |
| | 3,982 | | | Carlyle Group, Inc. | | | 218,611 | |
| | 1,087 | | | T Rowe Price Group, Inc. | | | 213,748 | |
| | | | | | | | 432,359 | |
| | | | | BEVERAGES - 4.1% | | | | |
| | 4,137 | | | Coca-Cola Company (The) | | | 244,952 | |
| | 1,358 | | | PepsiCo, Inc. | | | 235,898 | |
| | | | | | | | 480,850 | |
| | | | | BIOTECH & PHARMA - 9.9% | | | | |
| | 872 | | | Eli Lilly & Company | | | 240,865 | |
| | 3,145 | | | Gilead Sciences, Inc. | | | 228,358 | |
| | 1,392 | | | Johnson & Johnson | | | 238,129 | |
| | 2,896 | | | Merck & Company, Inc. | | | 221,949 | |
| | 4,035 | | | Pfizer, Inc. | | | 238,267 | |
| | | | | | | | 1,167,568 | |
| | | | | CABLE & SATELLITE - 1.8% | | | | |
| | 4,343 | | | Comcast Corporation, Class A | | | 218,583 | |
| | | | | | | | | |
| | | | | CHEMICALS - 2.1% | | | | |
| | 7,314 | | | Chemours Company | | | 245,457 | |
| | | | | | | | | |
| | | | | DIVERSIFIED INDUSTRIALS - 2.0% | | | | |
| | 937 | | | Illinois Tool Works, Inc. | | | 231,252 | |
| | | | | | | | | |
| | | | | ELECTRIC UTILITIES - 4.2% | | | | |
| | 6,032 | | | NRG Energy, Inc. | | | 259,859 | |
| DONOGHUE FORLINES DIVIDEND VIT FUND |
| SCHEDULE OF INVESTMENTS (Continued) |
| December 31, 2021 |
| Shares | | | | | Fair Value | |
| | | | | COMMON STOCKS — 98.4% (Continued) | | | | |
| | | | | ELECTRIC UTILITIES - 4.2% (Continued) | | | | |
| | 7,805 | | | PPL Corporation | | $ | 234,618 | |
| | | | | | | | 494,477 | |
| | | | | FOOD - 3.9% | | | | |
| | 1,223 | | | Hershey Company (The) | | | 236,614 | |
| | 3,547 | | | Kellogg Company | | | 228,498 | |
| | | | | | | | 465,112 | |
| | | | | HEALTH CARE FACILITIES & SERVICES - 4.3% | | | | |
| | 2,439 | | | CVS Health Corporation | | | 251,607 | |
| | 1,460 | | | Quest Diagnostics, Inc. | | | 252,595 | |
| | | | | | | | 504,202 | |
| | | | | INSTITUTIONAL FINANCIAL SERVICES - 5.6% | | | | |
| | 1,564 | | | Evercore, Inc., Class A | | | 212,469 | |
| | 5,096 | | | Lazard Ltd., Class A | | | 222,338 | |
| | 7,719 | | | Virtu Financial, Inc., Class A | | | 222,540 | |
| | | | | | | | 657,347 | |
| | | | | INSURANCE - 5.8% | | | | |
| | 2,001 | | | Allstate Corporation (The) | | | 235,417 | |
| | 4,259 | | | Mercury General Corporation | | | 225,983 | |
| | 9,076 | | | Old Republic International Corporation | | | 223,088 | |
| | | | | | | | 684,488 | |
| | | | | LEISURE PRODUCTS - 1.9% | | | | |
| | 2,241 | | | Hasbro, Inc. | | | 228,089 | |
| | | | | | | | | |
| | | | | MEDICAL EQUIPMENT & DEVICES - 2.1% | | | | |
| | 1,727 | | | Abbott Laboratories(a) | | | 243,058 | |
| | | | | | | | | |
| | | | | METALS & MINING - 1.9% | | | | |
| | 3,712 | | | Southern Copper Corporation | | | 229,068 | |
| | | | | | | | | |
| | | | | OIL & GAS PRODUCERS - 5.5% | | | | |
| | 5,164 | | | Devon Energy Corporation(a) | | | 227,474 | |
| | 3,628 | | | ONEOK, Inc. | | | 213,181 | |
| | 8,114 | | | Williams Companies, Inc. | | | 211,289 | |
| | | | | | | | 651,944 | |
| DONOGHUE FORLINES DIVIDEND VIT FUND |
| SCHEDULE OF INVESTMENTS (Continued) |
| December 31, 2021 |
| Shares | | | | | Fair Value | |
| | | | | COMMON STOCKS — 98.4% (Continued) | | | | |
| | | | | PUBLISHING & BROADCASTING - 3.7% | | | | |
| | 1,453 | | | Nexstar Media Group, Inc., Class A | | $ | 219,374 | |
| | 4,397 | | | World Wrestling Entertainment, Inc., Class A | | | 216,948 | |
| | | | | | | | 436,322 | |
| | | | | RETAIL - DISCRETIONARY - 2.0% | | | | |
| | 1,697 | | | Genuine Parts Company | | | 237,919 | |
| | | | | | | | | |
| | | | | RETAIL REIT - 1.9% | | | | |
| | 1,420 | | | Simon Property Group, Inc.(a) | | | 226,873 | |
| | | | | | | | | |
| | | | | SEMICONDUCTORS - 3.7% | | | | |
| | 4,419 | | | Intel Corporation | | | 227,579 | |
| | 1,128 | | | Texas Instruments, Inc.(a) | | | 212,594 | |
| | | | | | | | 440,173 | |
| | | | | SOFTWARE - 2.4% | | | | |
| | 3,087 | | | Cerner Corporation | | | 286,690 | |
| | | | | | | | | |
| | | | | SPECIALTY FINANCE - 5.7% | | | | |
| | 4,454 | | | Fidelity National Financial, Inc. | | | 232,409 | |
| | 4,368 | | | OneMain Holdings, Inc. | | | 218,575 | |
| | 4,858 | | | Synchrony Financial | | | 225,363 | |
| | | | | | | | 676,347 | |
| | | | | SPECIALTY REITS - 2.1% | | | | |
| | 4,782 | | | Iron Mountain, Inc.(a) | | | 250,242 | |
| | | | | | | | | |
| | | | | TECHNOLOGY HARDWARE - 2.1% | | | | |
| | 3,960 | | | Cisco Systems, Inc. | | | 250,945 | |
| | | | | | | | | |
| | | | | TECHNOLOGY SERVICES - 4.3% | | | | |
| | 607 | | | Accenture plc, Class A | | | 251,632 | |
| | 1,858 | | | International Business Machines Corporation | | | 248,340 | |
| | | | | | | | 499,972 | |
| | | | | TELECOMMUNICATIONS - 1.9% | | | | |
| | 17,623 | | | Lumen Technologies, Inc.(a) | | | 221,169 | |
| DONOGHUE FORLINES DIVIDEND VIT FUND |
| SCHEDULE OF INVESTMENTS (Continued) |
| December 31, 2021 |
| Shares | | | | | Fair Value | |
| | | | | COMMON STOCKS — 98.4% (Continued) | | | | |
| | | | | TRANSPORTATION & LOGISTICS - 2.0% | | | | |
| | 921 | | | Union Pacific Corporation | | $ | 232,028 | |
| | | | | | | | | |
| | | | | TOTAL COMMON STOCKS (Cost $10,585,219) | | | 11,629,471 | |
| | | | | | | | | |
| Shares | | | | | Fair Value | |
| | | | | SHORT-TERM INVESTMENTS — 13.7% | | | | |
| | | | | MONEY MARKET FUNDS – 1.8% | | | | |
| | 218,873 | | | Fidelity Government Portfolio, Class I, 0.01%(b) | | | 218,873 | |
| | | | | | | | | |
| | | | | COLLATERAL FOR SECURITIES LOANED – 11.9% | | | | |
| | 1,401,097 | | | Mount Vernon Liquid Assets Portfolio, LLC, 0.10%(b),(c) | | | 1,401,097 | |
| | | | | | | | | |
| | | | | TOTAL SHORT-TERM INVESTMENTS (Cost $1,619,970) | | | 1,619,970 | |
| | | | | | | | | |
| | | | | TOTAL INVESTMENTS - 112.1% (Cost $12,205,189) | | $ | 13,249,441 | |
| | | | | LIABILITIES IN EXCESS OF OTHER ASSETS - (12.1)% | | | (1,427,147 | ) |
| | | | | NET ASSETS - 100.0% | | $ | 11,822,294 | |
| LLC | - Limited Liability Company |
| PLC | - Public Limited Company |
| REIT | - Real Estate Investment Trust |
| (a) | All or a portion of the security is on loan. The total fair value of the securities on loan as of December 31, 2021 was $1,367,151. |
| (b) | Rate disclosed is the seven day effective yield as of December 31, 2021. |
| (c) | Security was purchased with cash received as collateral for securities on loan at December 31, 2021. Total collateral had a value of $1,401,097 at December 31, 2021. |
See accompanying notes which are an integral part of these financial statements.
| DONOGHUE FORLINES MOMENTUM VIT FUND |
| SCHEDULE OF INVESTMENTS |
| December 31, 2021 |
| Shares | | | | | Fair Value | |
| | | | | COMMON STOCKS — 98.9% | | | | |
| | | | | ASSET MANAGEMENT - 7.7% | | | | |
| | 5,092 | | | Ameriprise Financial, Inc. | | $ | 1,536,054 | |
| | 10,429 | | | Blackstone, Inc. | | | 1,349,408 | |
| | 26,976 | | | Carlyle Group, Inc. | | | 1,480,982 | |
| | 9,344 | | | LPL Financial Holdings, Inc. | | | 1,495,881 | |
| | | | | | | | 5,862,325 | |
| | | | | BIOTECH & PHARMA - 4.2% | | | | |
| | 5,948 | | | Eli Lilly & Company | | | 1,642,956 | |
| | 6,652 | | | Zoetis, Inc. | | | 1,623,288 | |
| | | | | | | | 3,266,244 | |
| | | | | CHEMICALS - 2.0% | | | | |
| | 27,102 | | | Olin Corporation | | | 1,558,907 | |
| | | | | | | | | |
| | | | | CONSUMER SERVICES - 2.1% | | | | |
| | 22,296 | | | Service Corp International | | | 1,582,793 | |
| | | | | | | | | |
| | | | | ELECTRIC UTILITIES - 2.3% | | | | |
| | 40,965 | | | NRG Energy, Inc. | | | 1,764,772 | |
| | | | | | | | | |
| | | | | ELECTRICAL EQUIPMENT - 4.0% | | | | |
| | 7,586 | | | Keysight Technologies, Inc.(a) | | | 1,566,585 | |
| | 4,391 | | | Rockwell Automation, Inc.(b) | | | 1,531,800 | |
| | | | | | | | 3,098,385 | |
| | | | | FOOD - 2.1% | | | | |
| | 8,320 | | | Hershey Company (The) | | | 1,609,670 | |
| | | | | | | | | |
| | | | | HEALTH CARE FACILITIES & SERVICES - 4.2% | | | | |
| | 5,693 | | | IQVIA Holdings, Inc.(a) | | | 1,606,223 | |
| | 5,174 | | | Laboratory Corp of America Holdings(a) | | | 1,625,723 | |
| | | | | | | | 3,231,946 | |
| | | | | INSTITUTIONAL FINANCIAL SERVICES - 1.9% | | | | |
| | 10,639 | | | Evercore, Inc., Class A | | | 1,445,308 | |
| DONOGHUE FORLINES MOMENTUM VIT FUND |
| SCHEDULE OF INVESTMENTS (Continued) |
| December 31, 2021 |
| Shares | | | | | Fair Value | |
| | | | | COMMON STOCKS — 98.9% (Continued) | | | | |
| | | | | INSURANCE - 1.9% | | | | |
| | 4,988 | | | Aon plc, CLASS A | | $ | 1,499,193 | |
| | | | | | | | | |
| | | | | INTERNET MEDIA & SERVICES - 2.0% | | | | |
| | 519 | | | Alphabet, Inc., Class A(a) | | | 1,503,564 | |
| | | | | | | | | |
| | | | | LEISURE FACILITIES & SERVICES - 2.1% | | | | |
| | 25,102 | | | Boyd Gaming Corporation(a) | | | 1,645,938 | |
| | | | | | | | | |
| | | | | MEDICAL EQUIPMENT & DEVICES - 4.1% | | | | |
| | 18,181 | | | Bruker Corporation | | | 1,525,568 | |
| | 2,427 | | | IDEXX Laboratories, Inc.(a) | | | 1,598,082 | |
| | | | | | | | 3,123,650 | |
| | | | | OIL & GAS PRODUCERS - 1.9% | | | | |
| | 33,131 | | | Continental Resources, Inc.(b) | | | 1,482,944 | |
| | | | | | | | | |
| | | | | PUBLISHING & BROADCASTING - 1.9% | | | | |
| | 9,861 | | | Nexstar Media Group, Inc., Class A | | | 1,488,814 | |
| | | | | | | | | |
| | | | | RENEWABLE ENERGY - 1.4% | | | | |
| | 5,910 | | | Enphase Energy, INC.(a) | | | 1,081,175 | |
| | | | | | | | | |
| | | | | RETAIL - CONSUMER STAPLES - 3.8% | | | | |
| | 2,737 | | | Costco Wholesale Corporation | | | 1,553,795 | |
| | 6,058 | | | Target Corporation | | | 1,402,064 | |
| | | | | | | | 2,955,859 | |
| | | | | RETAIL - DISCRETIONARY - 8.1% | | | | |
| | 12,540 | | | Dick’s Sporting Goods, Inc. | | | 1,441,975 | |
| | 14,798 | | | Penske Automotive Group, Inc. | | | 1,586,641 | |
| | 6,553 | | | Tractor Supply Company | | | 1,563,546 | |
| | 3,843 | | | Ulta Beauty, Inc.(a) | | | 1,584,623 | |
| | | | | | | | 6,176,785 | |
| | | | | RETAIL REIT - 2.0% | | | | |
| | 9,623 | | | Simon Property Group, Inc.(b) | | | 1,537,467 | |
| DONOGHUE FORLINES MOMENTUM VIT FUND |
| SCHEDULE OF INVESTMENTS (Continued) |
| December 31, 2021 |
| Shares | | | | | Fair Value | |
| | | | | COMMON STOCKS — 98.9% (Continued) | | | | |
| | | | | SEMICONDUCTORS - 9.9% | | | | |
| | 9,321 | | | Advanced Micro Devices, Inc.(a) | | $ | 1,341,292 | |
| | 10,020 | | | Applied Materials, Inc. | | | 1,576,747 | |
| | 2,664 | | | Broadcom, Inc. | | | 1,772,652 | |
| | 3,614 | | | KLA Corporation | | | 1,554,418 | |
| | 4,517 | | | NVIDIA Corporation | | | 1,328,495 | |
| | | | | | | | 7,573,604 | |
| | | | | SOFTWARE - 11.1% | | | | |
| | 2,205 | | | Adobe, Inc.(a) | | | 1,250,367 | |
| | 2,261 | | | Intuit, Inc.(b) | | | 1,454,320 | |
| | 9,431 | | | Manhattan Associates, Inc.(a) | | | 1,466,426 | |
| | 4,463 | | | Microsoft Corporation | | | 1,500,996 | |
| | 33,920 | | | Teradata Corporation(a)(b) | | | 1,440,582 | |
| | 4,260 | | | Zscaler, Inc.(a) | | | 1,368,866 | |
| | | | | | | | 8,481,557 | |
| | | | | SPECIALTY FINANCE - 2.1% | | | | |
| | 2,363 | | | Credit Acceptance Corporation(a) | | | 1,624,988 | |
| | | | | | | | | |
| | | | | SPECIALTY REITS - 2.2% | | | | |
| | 32,448 | | | Iron Mountain, Inc.(b) | | | 1,698,004 | |
| | | | | | | | | |
| | | | | TECHNOLOGY HARDWARE - 1.9% | | | | |
| | 2,503 | | | Zebra Technologies Corporation, Class A(a) | | | 1,489,786 | |
| | | | | | | | | |
| | | | | TECHNOLOGY SERVICES - 8.1% | | | | |
| | 4,128 | | | Accenture plc, Class A | | | 1,711,262 | |
| | 3,154 | | | FactSet Research Systems, Inc. | | | 1,532,876 | |
| | 3,779 | | | Moody’s Corporation | | | 1,476,002 | |
| | 3,238 | | | S&P Global, Inc.(b) | | | 1,528,109 | |
| | | | | | | | 6,248,249 | |
| | | | | TELECOMMUNICATIONS - 1.9% | | | | |
| | 119,399 | | | Lumen Technologies, Inc.(b) | | | 1,498,457 | |
| DONOGHUE FORLINES MOMENTUM VIT FUND |
| SCHEDULE OF INVESTMENTS (Continued) |
| December 31, 2021 |
| Shares | | | | | Fair Value | |
| | | | | COMMON STOCKS — 98.9% (Continued) | | | | |
| | | | | WHOLESALE - DISCRETIONARY - 2.0% | | | | |
| | 2,668 | | | Pool Corporation | | $ | 1,510,088 | |
| | | | | | | | | |
| | | | | TOTAL COMMON STOCKS (Cost $70,921,048) | | | 76,040,472 | |
| | | | | | | | | |
| Shares | | | | | Fair Value | |
| | | | | SHORT-TERM INVESTMENTS — 9.6% | | | | |
| | | | | MONEY MARKET FUNDS – 1.3% | | | | |
| | 986,267 | | | Fidelity Government Portfolio, CLASS I, 0.01%(c) | | | 986,267 | |
| | | | | | | | | |
| | | | | COLLATERAL FOR SECURITIES LOANED – 8.3% | | | | |
| | 6,380,285 | | | Mount Vernon Liquid Assets Portfolio, LLC, 0.10%(c),(d) | | | 6,380,285 | |
| | | | | | | | | |
| | | | | TOTAL SHORT-TERM INVESTMENTS (Cost $7,366,552) | | | 7,366,552 | |
| | | | | | | | | |
| | | | | TOTAL INVESTMENTS - 108.5% (Cost $78,287,600) | | $ | 83,407,024 | |
| | | | | LIABILITIES IN EXCESS OF OTHER ASSETS - (8.5)% | | | (6,520,375 | ) |
| | | | | NET ASSETS - 100.0% | | $ | 76,886,649 | |
| LLC | - Limited Liability Company |
| PLC | - Public Limited Company |
| REIT | - Real Estate Investment Trust |
| (a) | Non-income producing security. |
| (b) | All or a portion of the security is on loan. The total fair value of the securities on loan as of December 31, 2021 was $6,241,876. |
| (c) | Rate disclosed is the seven day effective yield as of December 31, 2021. |
| (d) | Security was purchased with cash received as collateral for securities on loan at December 31, 2021. Total collateral had a value of $6,380,285 at December 31, 2021. |
See accompanying notes which are an integral part of these financial statements.
| Donoghue Forlines VIT Funds |
| STATEMENTS OF ASSETS AND LIABILITIES |
| December 31, 2021 |
| | | Donoghue Forlines | | | Donoghue Forlines | |
| | | Dividend VIT Fund | | | Momentum VIT Fund | |
| ASSETS | | | | | | | | |
| Investment securities: | | | | | | | | |
| At cost | | $ | 12,205,189 | | | $ | 78,287,600 | |
| At value (Securities on loan $1,367,151 and $6,241,876, respectively) | | $ | 13,249,441 | | | $ | 83,407,024 | |
| Dividends and interest receivable | | | 15,116 | | | | 20,078 | |
| Prepaid expenses and other assets | | | 1,516 | | | | 1,754 | |
| TOTAL ASSETS | | | 13,266,073 | | | | 83,428,856 | |
| | | | | | | | | |
| LIABILITIES | | | | | | | | |
| Securities lending collateral (Note 5) | | | 1,401,097 | | | | 6,380,285 | |
| Investment advisory fees payable | | | 5,750 | | | | 63,915 | |
| Payable for Fund shares repurchased | | | 1,560 | | | | 30,838 | |
| Payable to related parties | | | 2,796 | | | | 6,997 | |
| Distribution (12b-1) fees payable | | | 2,402 | | | | 15,979 | |
| Accrued expenses and other liabilities | | | 30,174 | | | | 44,193 | |
| TOTAL LIABILITIES | | | 1,443,779 | | | | 6,542,207 | |
| NET ASSETS | | $ | 11,822,294 | | | $ | 76,886,649 | |
| | | | | | | | | |
| COMPOSITION OF NET ASSETS: | | | | | | | | |
| Paid in capital | | $ | 15,972,294 | | | $ | 60,564,060 | |
| Accumulated income (losses) | | | (4,150,000 | ) | | | 16,322,589 | |
| NET ASSETS | | $ | 11,822,294 | | | $ | 76,886,649 | |
| | | | | | | | | |
| NET ASSET VALUE PER SHARE: | | | | | | | | |
| Class 1 Shares: | | | | | | | | |
| Net Assets | | $ | 11,822,294 | | | $ | 76,886,649 | |
| Shares of beneficial interest outstanding ($0 par value, unlimited shares authorized) | | | 706,366 | | | | 2,339,208 | |
| Net asset value (Net Assets ÷ Shares Outstanding), offering and redemption price per share | | $ | 16.74 | | | $ | 32.87 | |
See accompanying notes to financial statements.
| Donoghue Forlines VIT Funds |
| STATEMENTS OF OPERATIONS |
| For the Year Ended December 31, 2021 |
| | | Donoghue Forlines | | | Donoghue Forlines | |
| | | Dividend VIT Fund | | | Momentum VIT Fund | |
| INVESTMENT INCOME | | | | | | | | |
| Dividends (including foreign dividend tax withholding of $0, and $1,193, respectively) | | $ | 382,752 | | | $ | 904,904 | |
| Interest | | | 53 | | | | 285 | |
| Securities Lending Income | | | 38 | | | | 127 | |
| TOTAL INVESTMENT INCOME | | | 382,843 | | | | 905,316 | |
| | | | | | | | | |
| EXPENSES | | | | | | | | |
| Investment advisory fees | | | 111,033 | | | | 754,009 | |
| Distribution (12b-1) fees | | | | | | | | |
| Class 1 | | | 27,758 | | | | 188,502 | |
| Audit fees | | | 25,470 | | | | 28,871 | |
| Accounting services fees | | | 25,200 | | | | 30,268 | |
| Administration fees | | | 23,973 | | | | 87,264 | |
| Trustees’ fees and expenses | | | 13,138 | | | | 13,250 | |
| Legal fees | | | 11,466 | | | | 11,496 | |
| Compliance officer fees | | | 7,832 | | | | 17,390 | |
| Custodian fees | | | 4,857 | | | | 7,773 | |
| Transfer agent fees | | | 4,005 | | | | 9,309 | |
| Insurance expense | | | 1,501 | | | | 2,240 | |
| Printing and postage expenses | | | 1,033 | | | | 5,194 | |
| Other expenses | | | 1,582 | | | | 1,754 | |
| TOTAL EXPENSES | | | 258,848 | | | | 1,157,320 | |
| Less: Fees waived/reimbursed by the advisor | | | (36,686 | ) | | | — | |
| NET EXPENSES | | | 222,162 | | | | 1,157,320 | |
| | | | | | | | | |
| NET INVESTMENT INCOME (LOSS) | | | 160,681 | | | | (252,004 | ) |
| | | | | | | | | |
| REALIZED AND UNREALIZED GAIN ON INVESTMENTS | | | | | | | | |
| Net realized gain from security transactions | | | 1,921,254 | | | | 16,275,050 | |
| Net change in unrealized appreciation on investments | | | 800,173 | | | | 2,605,547 | |
| NET REALIZED AND UNREALIZED GAIN ON INVESTMENTS | | | 2,721,427 | | | | 18,880,597 | |
| | | | | | | | | |
| NET INCREASE IN NET ASSETS RESULTING FROM OPERATIONS | | $ | 2,882,108 | | | $ | 18,628,593 | |
See accompanying notes to financial statements.
| Donoghue Forlines Dividend VIT Fund |
| STATEMENTS OF CHANGES IN NET ASSETS |
| | | For the | | | For the | |
| | | Year Ended | | | Year Ended | |
| | | December 31, 2021 | | | December 31, 2020 | |
| FROM OPERATIONS | | | | | | | | |
| Net investment income | | $ | 160,681 | | | $ | 149,422 | |
| Net realized gain (loss) from security transactions | | | 1,921,254 | | | | (2,186,519 | ) |
| Net change in unrealized appreciation (depreciation) on investments | | | 800,173 | | | | (190,116 | ) |
| Net increase (decrease) in net assets resulting from operations | | | 2,882,108 | | | | (2,227,213 | ) |
| | | | | | | | | |
| DISTRIBUTIONS TO SHAREHOLDERS | | | | | | | | |
| Total distributions Paid | | | | | | | | |
| Class 1 | | | (138,454 | ) | | | (547,054 | ) |
| Total distributions to shareholders | | | (138,454 | ) | | | (547,054 | ) |
| | | | | | | | | |
| FROM SHARES OF BENEFICIAL INTEREST | | | | | | | | |
| Proceeds from shares sold | | | | | | | | |
| Class 1 | | | 831,796 | | | | 754,115 | |
| Reinvestment of distributions | | | | | | | | |
| Class 1 | | | 138,454 | | | | 547,054 | |
| Payments for shares redeemed | | | | | | | | |
| Class 1 | | | (1,945,792 | ) | | | (11,257,776 | ) |
| Net decrease in net assets resulting from shares of beneficial interest | | | (975,542 | ) | | | (9,956,607 | ) |
| | | | | | | | | |
| TOTAL INCREASE (DECREASE) IN NET ASSETS | | | 1,768,112 | | | | (12,730,874 | ) |
| | | | | | | | | |
| NET ASSETS | | | | | | | | |
| Beginning of Year | | | 10,054,182 | | | | 22,785,056 | |
| End of Year | | $ | 11,822,294 | | | $ | 10,054,182 | |
| | | | | | | | | |
| SHARE ACTIVITY | | | | | | | | |
| Class 1: | | | | | | | | |
| Shares Sold | | | 52,200 | | | | 60,523 | |
| Shares Reinvested | | | 8,963 | | | | 47,440 | |
| Shares Redeemed | | | (127,455 | ) | | | (864,876 | ) |
| Net decrease in shares of beneficial interest outstanding | | | (66,292 | ) | | | (756,913 | ) |
See accompanying notes to financial statements.
| Donoghue Forlines Momentum VIT Fund |
| STATEMENTS OF CHANGES IN NET ASSETS |
| | | For the | | | For the | |
| | | Year Ended | | | Year Ended | |
| | | December 31, 2021 | | | December 31, 2020 | |
| FROM OPERATIONS | | | | | | | | |
| Net investment loss | | $ | (252,004 | ) | | $ | (118,266 | ) |
| Net realized gain (loss) from security transactions | | | 16,275,050 | | | | (4,848,461 | ) |
| Net change in unrealized appreciation on investments | | | 2,605,547 | | | | 2,501,520 | |
| Net increase (decrease) in net assets resulting from operations | | | 18,628,593 | | | | (2,465,207 | ) |
| | | | | | | | | |
| DISTRIBUTIONS TO SHAREHOLDERS | | | | | | | | |
| Total Distributions Paid | | | | | | | | |
| Class 1 | | | — | | | | (5,175,717 | ) |
| Total distributions to shareholders | | | — | | | | (5,175,717 | ) |
| | | | | | | | | |
| FROM SHARES OF BENEFICIAL INTEREST | | | | | | | | |
| Proceeds from shares sold | | | | | | | | |
| Class 1 | | | 5,705,615 | | | | 678,861 | |
| Reinvestment of distributions | | | | | | | | |
| Class 1 | | | — | | | | 5,175,717 | |
| Payments for shares redeemed | | | | | | | | |
| Class 1 | | | (11,586,500 | ) | | | (9,162,775 | ) |
| Net decrease in net assets resulting from shares of beneficial interest | | | (5,880,885 | ) | | | (3,308,197 | ) |
| | | | | | | | | |
| TOTAL INCREASE (DECREASE) IN NET ASSETS | | | 12,747,708 | | | | (10,949,121 | ) |
| | | | | | | | | |
| NET ASSETS | | | | | | | | |
| Beginning of Year | | | 64,138,941 | | | | 75,088,062 | |
| End of Year | | $ | 76,886,649 | | | $ | 64,138,941 | |
| | | | | | | | | |
| SHARE ACTIVITY | | | | | | | | |
| Class 1: | | | | | | | | |
| Shares Sold | | | 190,237 | | | | 28,314 | |
| Shares Reinvested | | | — | | | | 226,906 | |
| Shares Redeemed | | | (380,869 | ) | | | (392,718 | ) |
| Net decrease in shares of beneficial interest outstanding | | | (190,632 | ) | | | (137,498 | ) |
See accompanying notes to financial statements.
| Donoghue Forlines Dividend VIT Fund |
| FINANCIAL HIGHLIGHTS |
Per Share Data and Ratios for a Share of Beneficial Interest Outstanding Throughout Each Year
| | | Class 1 | |
| | | For the | | | For the | | | For the | | | For the | | | For the | |
| | | Year Ended | | | Year Ended | | | Year Ended | | | Year Ended | | | Year Ended | |
| | | December 31, 2021 | | | December 31, 2020 | | | December 31, 2019 | | | December 31, 2018 | | | December 31, 2017 | |
| Net asset value, beginning of year | | $ | 13.01 | | | $ | 14.90 | | | $ | 15.56 | | | $ | 17.29 | | | $ | 15.82 | |
| Activity from investment operations: | | | | | | | | | | | | | | | | | | | | |
| Net investment income (1) | | | 0.22 | | | | 0.17 | | | | 0.26 | | | | 0.41 | | | | 0.36 | |
| Net realized and unrealized gain (loss) on investments | | | 3.70 | | | | (1.35 | ) | | | (0.71 | ) | | | (1.78 | ) | | | 1.35 | |
| Total from investment operations | | | 3.92 | | | | (1.18 | ) | | | (0.45 | ) | | | (1.37 | ) | | | 1.71 | |
| Less distributions from: | | | | | | | | | | | | | | | | | | | | |
| Net investment income | | | (0.20 | ) | | | (0.71 | ) | | | (0.21 | ) | | | (0.30 | ) | | | (0.24 | ) |
| Net realized gains | | | — | | | | — | | | | — | | | | (0.06 | ) | | | — | |
| Total distributions | | | (0.20 | ) | | | (0.71 | ) | | | (0.21 | ) | | | (0.36 | ) | | | (0.24 | ) |
| Net asset value, end of year | | $ | 16.74 | | | $ | 13.01 | | | $ | 14.90 | | | $ | 15.56 | | | $ | 17.29 | |
| Total return (2) | | | 30.30 | % | | | (7.25 | )% | | | (2.84 | )% | | | (8.02 | )% | | | 10.89 | % |
| Net assets, at end of year (000s) | | $ | 11,822 | | | $ | 10,054 | | | $ | 22,785 | | | $ | 31,865 | | | $ | 23,252 | |
| Ratio of gross expenses to average net assets before waiver (3,6) | | | 2.33 | % | | | 2.38 | % | | | 1.74 | % | | | 1.80 | % | | | 1.95 | % |
| Ratio of net expenses to average net assets after waiver (3,6) | | | 2.00 | % | | | 2.02 | % | | | 1.53 | % (5) | | | 1.25 | % | | | 1.25 | % |
| Ratio of net investment income to average net assets before waivers (3,4,6) | | | 1.12 | % | | | 0.98 | % | | | 1.54 | % | | | 1.96 | % | | | 1.50 | % |
| Ratio of net investment income to average net assets after waivers (3,4,6) | | | 1.45 | % | | | 1.34 | % | | | 1.75 | % | | | 2.51 | % | | | 2.20 | % |
| Portfolio Turnover Rate | | | 180 | % | | | 303 | % | | | 495 | % | | | 322 | % | | | 197 | % |
| (1) | Per share amounts calculated using the average shares method, which appropriately presents the per share data for the period. |
| (2) | Total returns are historical in nature and exclude the effect of applicable sales charges and assumes reinvestment of dividends and capital gain distributions. Had the advisor not absorbed a portion of the expenses, total returns would have been lower. |
| (3) | Does not include the expenses of the investment companies in which the Fund invests. |
| (4) | Recognition of net investment income by the Fund is affected by the timing of the declaration of dividends by the underlying investment companies in which the Fund invests. |
| (5) | Effective June 1, 2019, the Advisor agreed to waive expenses greater than 2.00% per annum of the Fund’s average daily net assets. Prior to June 1, 2019, the advisor waived expenses over 1.25% per annum of the Fund’s average daily net assets. |
| (6) | Excluding interest expense, the following ratios would have been: |
| Gross expenses to average net assets | | | 2.33 | % | | | 2.36 | % | | | 1.74 | % | | | 1.80 | % | | | 1.95 | % |
| Net expenses to average net assets | | | 2.00 | % | | | 2.00 | % | | | 1.53 | % | | | 1.25 | % | | | 1.25 | % |
| Net investment income to average net assets before waivers | | | 1.12 | % | | | 1.00 | % | | | 1.54 | % | | | 1.96 | % | | | 1.50 | % |
| Net investment income to average net assets after waivers | | | 1.45 | % | | | 1.36 | % | | | 1.75 | % | | | 2.51 | % | | | 2.20 | % |
See accompanying notes to financial statements.
| Donoghue Forlines Momentum VIT Fund |
| FINANCIAL HIGHLIGHTS |
Per Share Data and Ratios for a Share of Beneficial Interest Outstanding Throughout Each Year
| | | Class 1 | |
| | | For the | | | For the | | | For the | | | For the | | | For the | |
| | | Year Ended | | | Year Ended | | | Year Ended | | | Year Ended | | | Year Ended | |
| | | December 31, 2021 | | | December 31, 2020 | | | December 31, 2019 | | | December 31, 2018 | | | December 31, 2017 | |
| Net asset value, beginning of year | | $ | 25.35 | | | $ | 28.15 | | | $ | 26.30 | | | $ | 33.82 | | | $ | 28.51 | |
| Activity from investment operations: | | | | | | | | | | | | | | | | | | | | |
| Net investment income (loss) (1) | | | (0.10 | ) | | | (0.05 | ) | | | 0.04 | | | | 0.25 | | | | 0.10 | |
| Net realized and unrealized gain (loss) on investments | | | 7.62 | | | | (0.54 | ) | | | 2.03 | | | | (2.02 | ) | | | 5.85 | |
| Total from investment operations | | | 7.52 | | | | (0.59 | ) | | | 2.07 | | | | (1.77 | ) | | | 5.95 | |
| Less distributions from: | | | | | | | | | | | | | | | | | | | | |
| Net investment income | | | — | | | | (0.04 | ) | | | (0.22 | ) | | | (0.11 | ) | | | (0.43 | ) |
| Net realized gains | | | — | | | | (2.17 | ) | | | — | | | | (5.64 | ) | | | (0.21 | ) |
| Total distributions | | | — | | | | (2.21 | ) | | | (0.22 | ) | | | (5.75 | ) | | | (0.64 | ) |
| Net asset value, end of year | | $ | 32.87 | | | $ | 25.35 | | | $ | 28.15 | | | $ | 26.30 | | | $ | 33.82 | |
| Total return | | | 29.66 | % | | | (1.20 | )% | | | 7.87 | % (2) | | | (2.66 | )% (2) | | | 20.93 | % (2) |
| Net assets, at end of year (000s) | | $ | 76,887 | | | $ | 64,139 | | | $ | 75,088 | | | $ | 77,657 | | | $ | 82,133 | |
| Ratio of gross expenses to average net assets before waiver (3) | | | 1.53 | % | | | 1.57 | % | | | 1.49 | % | | | 1.50 | % | | | 1.49 | % |
| Ratio of net expenses to average net assets after waiver (3) | | | 1.53 | % | | | 1.57 | % | | | 1.31 | % (5) | | | 1.15 | % | | | 1.19 | % |
| Ratio of net investment income (loss) to average net assets before waivers (3,4) | | | (0.33 | )% | | | (0.20 | )% | | | (0.04 | )% | | | 0.40 | % | | | 0.01 | % |
| Ratio of net investment income (loss) to average net assets after waivers (3,4) | | | (0.33 | )% | | | (0.20 | )% | | | 0.13 | % | | | 0.75 | % | | | 0.31 | % |
| Portfolio Turnover Rate | | | 287 | % | | | 477 | % | | | 526 | % | | | 458 | % | | | 506 | % |
| (1) | Per share amounts calculated using the average shares method, which appropriately presents the per share data for the period. |
| (2) | Total returns are historical in nature and exclude the effect of applicable sales charges and assumes reinvestment of dividends and capital gain distributions. Had the advisor not absorbed a portion of the expenses, total returns would have been lower. |
| (3) | Does not include the expenses of the investment companies in which the Fund invests. |
| (4) | Recognition of net investment income by the Fund is affected by the timing of the declaration of dividends by the underlying investment companies in which the Fund invests. |
| (5) | Effective June 1, 2019, the advisor agreed to waive expenses greater than 2.00% per annum of the Fund’s average daily net assets. Prior to June 1, 2019, the advisor waived expenses over 1.25% per annum of the Fund’s average daily net assets. |
See accompanying notes to financial statements.
| Donoghue Forlines VIT Funds |
| NOTES TO FINANCIAL STATEMENTS |
| December 31, 2021 |
The Donoghue Forlines Dividend VIT Fund (formerly the Power Dividend Index VIT Fund, , which was formerly the JNF SSgA Tactical Allocation Portfolio, which was formerly known as the JNF Balanced Portfolio, and the Donoghue Forlines Momentum VIT Fund (formerly the Power Momentum Index VIT Fund, which was formerly known as the JNF SSgA Sector Rotation Portfolio, which was formerly known as the JNF Equity Portfolio (each a “Fund” and collectively, the “Funds”) are each a diversified series of shares of beneficial interest of the Northern Lights Variable Trust (the “Trust”), a statutory trust organized under the laws of the State of Delaware, and registered under the Investment Company Act of 1940, as amended (the “1940 Act”), as an open- end management investment company. The Funds are intended to be funding vehicles for variable annuity contracts and flexible premium variable life insurance policies offered by the separate accounts of various insurance companies, including Jefferson National Life Insurance Company. The Trust offers shares to affiliated and unaffiliated life insurance company separate accounts (registered as unit investment trusts under the 1940 Act) to fund the benefits under variable annuity and variable life insurance contracts. Jefferson National Life Insurance Company separate accounts owns approximately 93% of the shares offered by the Donoghue Forlines Dividend VIT Fund, and 100% of the shares offered by the Donoghue Forlines Momentum VIT Fund.
Each Fund currently offer two classes of shares: Class 1 shares and Class 2 shares. Class 1 and 2 shares are offered at net asset value. Each class of shares of the Funds have identical rights and privileges except with respect to arrangements pertaining to shareholder servicing or distribution, class-related expenses, voting rights on matters affecting a single class of shares, and the exchange privilege of each class of shares. The Funds’ share classes differ in the fees and expenses charged to shareholders. The Funds, income, expenses (other than class specific distribution fees) and realized and unrealized gains and losses are allocated proportionately each day based upon the relative net assets of each class. As of December 31, 2021 Class 2 shares of the Donoghue Forlines Dividend VIT Fund and Donoghue Forlines Momentum VIT Fund have not commenced operations.
The investment objective of each Fund is as follows:
| Fund | Objective |
| Donoghue Forlines Dividend VIT Fund | Total return from dividend income and capital appreciation. Capital preservation is a secondary objective of the Fund. |
| Donoghue Forlines Momentum VIT Fund | Capital growth with a secondary objective of generating income. |
| 2. | SIGNIFICANT ACCOUNTING POLICIES |
The following is a summary of significant accounting policies followed by the Funds in preparation of their financial statements. These policies are in conformity with accounting principles generally accepted in the United States of America (“GAAP”). The preparation of financial statements in conformity with GAAP requires management to make estimates and assumptions that affect the reported amounts of assets and liabilities and disclosure of contingent assets and liabilities at the date of the financial statements and the reported amounts of increases and decreases in net assets from operations during the reporting period. Actual results could differ from those estimates. The Funds are investment companies and accordingly follow the investment company accounting and reporting guidance of the Financial Accounting Standards Board (“FASB”) Accounting Standards Codification Topic 946 “Financial Services – Investment Companies” including FASB Accounting Standards Update (“ASU”) 2013-08.
Securities Valuation – Securities and other assets held by the Funds listed on an exchange are valued at the last reported sale price at the close of the regular trading session of the primary exchange on the business day the value is being determined, or in the case of securities listed on NASDAQ at the NASDAQ Official Closing Price. When the market for these securities is considered active, they will be classified within Level 1 of the fair value hierarchy. In the absence of a sale, such securities shall be valued at the mean between the current bid and ask prices on the primary exchange on the day of valuation. Debt securities (other than short-term obligations) are valued each day by an independent pricing service approved by the Trust’s Board of Trustees (the “Board”) based on methods which include consideration of: yields or prices of securities of comparable quality, coupon, maturity and type, indications as to values from dealers, and general market
| Donoghue Forlines VIT Funds |
| NOTES TO FINANCIAL STATEMENTS (Continued) |
| December 31, 2021 |
conditions or market quotations from a major market maker in the securities. Short-term debt obligations having 60 days or less remaining until maturity, at time of purchase, may be valued at amortized cost. Investments in open-end investment companies are valued at net asset value.
If market quotations are not readily available or are determined to be unreliable, securities will be valued using the “fair value” procedures approved by the Board. The Board will review the fair value method in use for securities requiring a fair value determination at least quarterly. The Fair Value Procedures consider, among others, the following factors to determine a security’s fair value: the nature and pricing history (if any) of the security; whether any dealer quotations for the security are available; and possible valuation methodologies that could be used to determine the fair value of the security.
The Funds may hold securities, such as private investments, interests in commodity pools, other non-traded securities or temporarily illiquid securities, for which market quotations are not readily available or are determined to be unreliable. These securities will be valued using the “fair value” procedures approved by the Board. The Board has delegated execution of these procedures to a fair value committee composed of one or more representatives from each of the (i) Trust, (ii) administrator, and (iii) advisor. The committee may also enlist third party consultants such as a valuation specialist at a public accounting firm, valuation consultant or financial officer of a security issuer on an as-needed basis to assist in determining a security-specific fair value. The Board has also engaged a third party valuation firm to attend valuation meetings held by the Trust, review minutes of such meetings and report to the Board on a quarterly basis. The Board reviews and ratifies the execution of this process and the resultant fair value prices at least quarterly to assure the process produces reliable results.
Fair Valuation Process – As noted above, the fair value committee is composed of one or more representatives from each of the (i) Trust, (ii) administrator, and (iii) advisor. The applicable investments are valued collectively via inputs from each of these groups. For example, fair value determinations are required for the following securities: (i) securities for which market quotations are insufficient or not readily available on a particular business day (including securities for which there is a short and temporary lapse in the provision of a price by the regular pricing source), (ii) securities for which, in the judgment of the advisor, the prices or values available do not represent the fair value of the instrument. Factors which may cause the advisor to make such a judgment include, but are not limited to, the following: only a bid price or an ask price is available; the spread between bid and ask prices is substantial; the frequency of sales; the thinness of the market; the size of reported trades; and actions of the securities markets, such as the suspension or limitation of trading; (iii) securities determined to be illiquid; (iv) securities with respect to which an event that will affect the value thereof has occurred (a “significant event”) since the closing prices were established on the principal exchange on which they are traded, but prior to a Fund’s calculation of its net asset value. Specifically, interests in commodity pools or managed futures pools are valued on a daily basis by reference to the closing market prices of each futures contract or other asset held by a pool, as adjusted for pool expenses. Restricted or illiquid securities, such as private investments or non-traded securities are valued via inputs from the advisor based upon the current bid for the security from two or more independent dealers or other parties reasonably familiar with the facts and circumstances of the security (who should take into consideration all relevant factors as may be appropriate under the circumstances). If the advisor is unable to obtain a current bid from such independent dealers or other independent parties, the fair value committee shall determine the fair value of such security using the following factors: (i) the type of security; (ii) the cost at date of purchase; (iii) the size and nature of the Fund’s holdings; (iv) the discount from market value of unrestricted securities of the same class at the time of purchase and subsequent thereto; (v) information as to any transactions or offers with respect to the security; (vi) the nature and duration of restrictions on disposition of the security and the existence of any registration rights; (vii) how the yield of the security compares to similar securities of companies of similar or equal creditworthiness; (viii) the level of recent trades of similar or comparable securities; (ix) the liquidity characteristics of the security; (x) current market conditions; and (xi) the market value of any securities into which the security is convertible or exchangeable.
Valuation of Fund of Funds – The Funds may invest in portfolios of open-end or closed-end investment companies (the “Underlying Funds”). The Underlying Funds value securities in their portfolios for which market quotations are readily available at their fair values (generally the last reported sale price) and all other securities and assets at their fair value based upon methods established by the board of directors of the Underlying Funds.
Open-end investment companies are valued at their respective net asset values as reported by such investment companies.
| Donoghue Forlines VIT Funds |
| NOTES TO FINANCIAL STATEMENTS (Continued) |
| December 31, 2021 |
The shares of many closed-end investment companies, after their initial public offering, frequently trade at a price per share, which is different than the net asset value per share. The difference represents a market premium or market discount of such shares. There can be no assurances that the market discount or market premium on shares of any closed-end investment company purchased by a Fund will not change.
The Funds utilize various methods to measure the fair value of all of their investments on a recurring basis. GAAP establishes a hierarchy that prioritizes inputs to valuation methods. The three levels of input are:
Level 1 – Unadjusted quoted prices in active markets for identical assets and liabilities that the Funds have the ability to access.
Level 2 – Observable inputs other than quoted prices included in Level 1 that are observable for the asset or liability, either directly or indirectly. These inputs may include quoted prices for the identical instrument in an inactive market, prices for similar instruments, interest rates, prepayment speeds, credit risk, yield curves, default rates and similar data.
Level 3 – Unobservable inputs for the asset, or liability, to the extent relevant observable inputs are not available, representing the Funds own assumptions about the assumptions a market participant would use in valuing the asset or liability, and would be based on the best information available.
The availability of observable inputs can vary from security to security and is affected by a wide variety of factors, including, for example, the type of security, whether the security is new and not yet established in the marketplace, the liquidity of markets, and other characteristics particular to the security. To the extent that valuation is based on models or inputs that are less observable or unobservable in the market, the determination of fair value requires more judgment. Accordingly, the degree of judgment exercised in determining fair value is greatest for instruments categorized in Level 3.
The inputs used to measure fair value may fall into different levels of the fair value hierarchy. In such cases, for disclosure purposes, the level in the fair value hierarchy within which the fair value measurement falls in its entirety, is determined based on the lowest level input that is significant to the fair value measurement in its entirety.
The inputs or methodology used for valuing securities are not necessarily an indication of the risk associated with investing in those securities. The following tables summarize the inputs used as of December 31, 2021 for the Funds’ investments measured at fair value:
Donoghue Forlines Dividend VIT Fund
| Assets * | | Level 1 | | | Level 2 | | | Level 3 | | | Total | |
| Common Stock | | $ | 11,629,471 | | | $ | — | | | $ | — | | | $ | 11,629,471 | |
| Money Market Funds | | | 218,873 | | | | — | | | | — | | | | 218,873 | |
| Collateral for Securities Loaned | | | 1,401,097 | | | | — | | | | — | | | | 1,401,097 | |
| Total | | $ | 13,249,441 | | | $ | — | | | $ | — | | | $ | 13,249,441 | |
Donoghue Forlines Momentum VIT Fund
| Assets * | | Level 1 | | | Level 2 | | | Level 3 | | | Total | |
| Common Stock | | $ | 76,040,472 | | | $ | — | | | $ | — | | | $ | 76,040,472 | |
| Money Market Funds | | | 986,267 | | | | — | | | | — | | | | 986,267 | |
| Collateral for Securities Loaned | | | 6,380,285 | | | | — | | | | — | | | | 6,380,285 | |
| Total | | $ | 83,407,024 | | | $ | — | | | $ | — | | | $ | 83,407,024 | |
The Funds did not hold any Level 3 securities during the period.
| * | Refer to the Portfolios of Investments for classification by asset class. |
Security Transactions and Related Income – Security transactions are recorded on the trade date. Interest income is recognized on an accrual basis. Discounts are accreted and premiums are amortized on securities purchased over the term of the respective securities using the effective interest method. Distributions received from investments in securities that represent a return of capital or capital gains are recorded as a reduction of cost of investment or as a realized gain, respectively. Dividend income is recorded on the ex-dividend date. Realized gains or losses from sales of securities are
| Donoghue Forlines VIT Funds |
| NOTES TO FINANCIAL STATEMENTS (Continued) |
| December 31, 2021 |
determined by comparing the identified cost of the security lot sold with the net sales proceeds. Withholding taxes on foreign dividends have been provided for in accordance with the Funds’ understanding of the applicable country’s tax rules and rates.
Exchange Traded Funds – The Funds may invest in exchange traded funds (“ETFs”). An ETF is a type of open-end fund, however, unlike a mutual fund, its shares are bought and sold on a securities exchange at market price and only certain financial institutions called authorized participants may buy and redeem shares of the ETF at net asset value. ETF shares can trade at either a premium or discount to net asset value. Each ETF like a mutual fund is subject to specific risks depending on the type of strategy (actively managed or passively tracking an index) and the composition of its underlying holdings. Investing in an ETF involves substantially the same risks as investing directly in the ETF’s underlying holdings. ETFs pay fees and incur operating expenses, which reduce the total return earned by the ETFs from their underlying holdings. An ETF may not achieve its investment objective or execute its investment strategy effectively, which may adversely affect the Funds’ performance.
Exchange Traded Notes – The Funds may invest in exchange traded notes (“ETNs”). ETNs are a type of index fund bought and sold on a securities exchange. An ETN trades like common stock and represents a fixed portfolio of securities designed to track the performance and dividend yield of a particular domestic or foreign market index. The risks of owning an ETN generally reflect the risks of owning the underlying securities they are designed to track, although the lack of liquidity on an ETN could result in it being more volatile. Additionally, ETNs have fees and expenses that reduce their value.
Dividends and Distributions to Shareholders – The following table summarizes each Fund’s investment income and capital gain declaration policy:
| Fund | | | Income Dividends | | Capital Gains |
| Donoghue Forlines Dividend VIT Fund | | Quarterly | | Annually |
| Donoghue Forlines Momentum VIT Fund | | Annually | | Annually |
Each Fund records dividends and distributions to its shareholders on the ex-dividend date. Dividends from net investment income and distributions from net realized gains are determined in accordance with federal income tax regulations, which may differ from GAAP. These “book/tax” differences are considered either temporary (e.g., deferred losses, capital loss carryforwards) or permanent in nature. To the extent these differences are permanent in nature, such amounts are reclassified within the composition of net assets based on their federal tax-basis treatment; temporary differences do not require reclassification. Any such reclassifications will have no effect on net assets, results of operations or net asset values per share of each Fund.
Federal Income Tax – It is each Fund’s policy to continue to qualify as a regulated investment company by complying with the provisions of the Internal Revenue Code that are applicable to regulated investment companies and to distribute substantially all of its taxable income and net realized gains to shareholders. Therefore, no federal income tax provision is required.
The Funds recognize the tax benefits of uncertain tax positions only when the position is “more likely than not” to be sustained assuming examination by tax authorities. Management has analyzed each Fund’s tax positions and has concluded that no liability for unrecognized tax benefits should be recorded related to uncertain tax positions taken on returns filed for open tax years ended December 31, 2018 to December 31, 2020, or expected to be taken in the Fund’s December 31, 2021 year-end tax return. The Funds identify their major tax jurisdictions as U.S. federal and Ohio. The Funds are not aware of any tax positions for which it is reasonably possible that the total amounts of unrecognized tax benefits will change materially in the next twelve months.
Expenses – Expenses of the Trust that are directly identifiable to a specific fund are charged to that fund. Expenses, which are not readily identifiable to a specific fund, are allocated in such a manner as deemed equitable, taking into consideration the nature and type of expense and the relative sizes of the funds in the Trust.
Indemnification – The Trust indemnifies its officers and Trustees for certain liabilities that may arise from the performance of their duties to the Trust. Additionally, in the normal course of business, the Funds enter into contracts that
| Donoghue Forlines VIT Funds |
| NOTES TO FINANCIAL STATEMENTS (Continued) |
| December 31, 2021 |
contain a variety of representations and warranties and which provide general indemnities. The Funds’ maximum exposure under these arrangements is unknown, as this would involve future claims that may be made against the Funds that have not yet occurred. However, based on experience, the risk of loss due to these warranties and indemnities appears to be remote.
| 3. | INVESTMENT TRANSACTIONS |
For the year ended December 31, 2021, cost of purchases and proceeds from sales of portfolio securities, other than short-term investments, amounted to the following:
| Fund | | Purchases | | | Sales | |
| Donoghue Forlines Dividend VIT Fund | | $ | 19,315,862 | | | $ | 20,262,211 | |
| Donoghue Forlines Momentum VIT Fund | | | 210,574,016 | | | | 216,384,384 | |
| 4. | INVESTMENT ADVISORY AGREEMENT AND TRANSACTIONS WITH RELATED PARTIES |
Donoghue Forlines LLC serves as the Funds’ investment advisor (the “Advisor”). Pursuant to an investment advisory agreement with the Trust, on behalf of the Funds (the “Advisory Agreement”), under the oversight of the Board, the Advisor supervises the performance of the daily operations of the Funds and the performance of administrative and professional services provided by others. As compensation for its services and the related expenses borne by the Advisor, the Funds pay the Advisor an investment advisory fee, computed and accrued daily and paid monthly, at an annual rate of 1.00% of the Funds’ average daily net assets.
For the year ended December 31, 2021, earned advisory fees for the Funds were as follows:
| Fund | | Advisory Fees | |
| Donoghue Forlines Dividend VIT Fund | | $ | 111,033 | |
| Donoghue Forlines Momentum VIT Fund | | | 754,009 | |
Pursuant to a written contract (the “Waiver Agreement”), the Advisor has contractually agreed, at least until October 31, 2022 for the Donoghue Forlines Dividend VIT Fund and the Donoghue Forlines Momentum VIT Fund, to ensure that Total Annual Fund Operating Expenses After Expense Waiver and Reimbursements: (exclusive of any (i) front-end or contingent deferred loads, (ii) brokerage fees and commissions, (iii) acquired fund fees and expenses, (iv) fees and expenses associated with investments in other collective investment vehicles or derivative instruments (including for example option and swap fees and expenses), (v) borrowing costs (such as interest and dividend expense on securities sold short), (vi) taxes, and (vii) extraordinary expenses, such as litigation expenses (which may include indemnification of Fund officers and Trustees, contractual indemnification of Fund service providers (other than the Advisor)) for Donoghue Forlines Dividend VIT Fund, and Donoghue Forlines Momentum VIT Fund do not exceed 2.00% and 2.50%, of the Funds’ average daily net assets for Class 1 and Class 2 shares, respectively.
During the year ended December 31, 2021, the Advisor waived fees/reimbursed expenses pursuant to the Waiver Agreement for the Funds as follows:
| | | Fees Waived by | |
| Fund | | the Advisor | |
| Donoghue Forlines Dividend VIT Fund | | $ | 36,686 | |
| Donoghue Forlines VIT Funds |
| NOTES TO FINANCIAL STATEMENTS (Continued) |
| December 31, 2021 |
If the Advisor waives any fee or reimburses any expenses and any operating expenses are subsequently lower than their respective expense limitation, the Advisor shall be entitled to reimbursement by the Fund provided that such reimbursement does not cause the Fund’s operating expenses to exceed the expense limitation. The Advisor may seek reimbursement only for expenses waived or paid by it during the three years prior to such reimbursement; provided, however, that such expenses may only be reimbursed to the extent they were waived or paid after the date of the Waiver Agreement (or any similar agreement). The table below contains the amounts of fee waivers and expense reimbursements subject to recapture by the Advisor through December 31 of the years indicated:
| | | Recapture through | | | Recapture through | | | Recapture through | | | | |
| Fund | | December 31, 2022 | | | December 31, 2023 | | | December 31, 2024 | | | Total | |
| Donoghue Forlines Dividend VIT Fund | | $ | 10,297 | | | $ | 40,282 | | | $ | 36,686 | | | $ | 87,265 | |
| Donoghue Forlines Momentum VIT Fund | | $ | — | | | $ | — | | | $ | — | | | $ | — | |
Distributor – The distributor of the Funds is Northern Lights Distributors, LLC (the “Distributor”). The Board has adopted, on behalf of the Funds, the Trust’s Master Distribution and Shareholder Servicing Plans (the “Plans”), as amended, pursuant to Rule 12b -1 under the 1940 Act, to pay for certain distribution activities and shareholder services. Under the Plans, the Donoghue Forlines Dividend VIT Fund and the Donoghue Forlines Momentum VIT Fund may pay 0.25% and 0.50% per year of the average daily net assets of Class 1 and Class 2 shares, respectively.
The Distributor acts as the Fund’s principal underwriter in a continuous public offering of the Fund’s shares. For the year ended December 31, 2021, there were no underwriting commissions paid for sales of Class 1 or Class 2 shares, respectively.
For the year ended December 31, 2021, the Funds incurred distribution fees under the Plans as follows:
| Fund | | Class 1 | |
| Donoghue Forlines Dividend VIT Fund | | $ | 27,758 | |
| Donoghue Forlines Momentum VIT Fund | | | 188,502 | |
In addition, certain affiliates of the Distributor provide services to the Funds as follows:
Ultimus Fund Solutions, LLC (“UFS”)
UFS, an affiliate of the Distributor, provides administration, fund accounting, and transfer agent services to the Trust. Pursuant to separate servicing agreements with UFS, the Funds pay UFS customary fees for providing administration, fund accounting and transfer agency services to the Funds. Certain officers of the Trust are also officers of UFS and are not paid any fees directly by the Funds for serving in such capacities.
Northern Lights Compliance Services, LLC (“NLCS”)
NLCS, an affiliate of UFS, provides a Chief Compliance Officer to the Trust, as well as related compliance services, pursuant to a consulting agreement between NLCS and the Trust. Under the terms of such agreement, NLCS receives customary fees from the Funds.
Blu Giant, LLC (“Blu Giant”)
Blu Giant, an affiliate of UFS, provides EDGAR conversion and filing services as well as print management services for the Funds on an ad-hoc basis. For the provision of these services, Blu Giant receives customary fees from the Funds.
| Donoghue Forlines VIT Funds |
| NOTES TO FINANCIAL STATEMENTS (Continued) |
| December 31, 2021 |
Under an agreement (the “Securities Lending Agreement”) with US Bank, the Funds can lend their portfolio securities to brokers, dealers and other financial institutions approved by the Board to earn additional income. For each securities loan, the borrower shall transfer collateral in an amount determined by applying the margin to the market value of the loaned available securities (102% for same currency and 105% for cross currency). Collateral is invested in highly liquid, short-term instruments such as money market funds in accordance with the Funds’ security lending procedures. The Funds continue to receive interest or dividends on the securities loaned. The Funds have the right under the Securities Lending Agreement to recover the securities from the borrower on demand; if the borrower fails to deliver the securities on a timely basis, the Funds could experience delays or losses on recovery. Additionally, the Funds are subject to the risk of loss from investments made with the cash received as collateral. The Funds manage credit exposure arising from these lending transactions by, in appropriate circumstances, entering into master netting agreements and collateral agreements with third party borrowers that provide in the event of default (such as bankruptcy or a borrower’s failure to pay or perform), the right to net a third-party borrower’s rights and obligations under such agreement and liquidate and set off collateral against the net amount owed by the counterparty.
The following table is a summary of the Portfolios’ securities loaned and related collateral which are subject to a netting agreement as of December 31, 2021:
| | | | | | | | | | | | Gross Amounts Not Offset in the Statement of Assets & | |
| | | | | | | | | | | | Liabilities * | |
| | | | | | | | | Net Amounts | | | | | | | | | | |
| | | | | | Gross Amounts | | | of Assets | | | | | | | | | | |
| | | | | | Offset in the | | | Presented in | | | | | | | | | | |
| | | Gross Amounts | | | Statements of | | | the Statements | | | Financial | | | Pledged | | | | |
| | | of Recognized | | | Assets & | | | of Assets & | | | Instruments | | | Collateral | | | Net Amount of | |
| Assets: | | Assets | | | Liabilities | | | Liabilities | | | Pledged | | | Received | | | Assets | |
| Donoghue Forlines Dividend VIT Fund | | | | | | | | | | | | | |
| Description: | | | | | | | | | | | | | | | | | | | | | | | | |
| Securities Loaned | | $ | 1,367,151 | | | $ | — | | | $ | 1,367,151 | | | $ | — | | | $ | 1,367,151 | | | $ | — | |
| Total | | $ | 1,367,151 | | | $ | — | | | $ | 1,367,151 | | | $ | — | | | $ | 1,367,151 | | | $ | — | |
| | | | | | | | | | | | | | | | | | | | | | | | | |
| Donoghue Forlines Momentum VIT Fund | | | | | | | | | | | | | |
| Description: | | | | | | | | | | | | | | | | | | | | | | | | |
| Securities Loaned | | $ | 6,241,876 | | | $ | — | | | $ | 6,241,876 | | | $ | — | | | $ | 6,241,876 | | | $ | — | |
| Total | | $ | 6,241,876 | | | $ | — | | | $ | 6,241,876 | | | $ | — | | | $ | 6,241,876 | | | $ | — | |
| * | The amount is limited to the derivative asset balance and accordingly, does not include excess collateral pledged. |
| Donoghue Forlines VIT Funds |
| NOTES TO FINANCIAL STATEMENTS (Continued) |
| December 31, 2021 |
The following table breaks out the holdings received as collateral as of December 31, 2021:
| Overnight and Continuous | | | |
| Donoghue Forlines Dividend VIT Fund | | | |
| Mount Vernon Liquid Assets Portfolio, LLC | | $ | 1,401,097 | |
| | | | | |
| Donoghue Forlines Momentum VIT Fund | | | | |
| Mount Vernon Liquid Assets Portfolio, LLC | | $ | 6,380,285 | |
The fair value of the securities loaned for Donoghue Forlines Dividend VIT Fund and Donoghue Forlines Momentum VIT Fund totaled $1,367,151, and $6,241,876 at December 31, 2021, respectively. The securities loaned are noted in the Portfolios of Investments. The fair value of the “Collateral for Securities Loaned” on the Schedule of Investments includes only cash collateral received and reinvested that totaled $1,401,097 and $6,380,285 for the Donoghue Forlines Donoghue VIT Fund and Donoghue Forlines Momentum VIT Fund at December 31, 2021, respectively. This amount is offset by a liability recorded as “Securities lending Collateral.” At December 31, 2021, the Donoghue Forlines Dividend VIT Fund and Donoghue Forlines Momentum VIT Fund received non-cash collateral of $0, and $0, respectively. The non-cash collateral typically consists of short-term investments and long-term bonds and is held for benefit of a Portfolio at the Portfolio’s custodian. A Portfolio cannot pledge or resell the collateral.
| 6. | AGGREGATE UNREALIZED APPRECIATION AND DEPRECIATION – TAX BASIS |
The identified cost of investments in securities owned by each fund for federal income tax purposes, and their respective gross unrealized appreciation and depreciation at December 31, 2021, were as follows:
| | | | | | Gross | | | Gross | | | Net Unrealized | |
| | | Tax | | | Unrealized | | | Unrealized | | | Appreciation | |
| Fund | | Cost | | | Appreciation | | | Depreciation | | | (Depreciation) | |
| Donoghue Forlines Dividend VIT Fund | | $ | 12,194,526 | | | $ | 1,209,545 | | | $ | (154,630 | ) | | $ | 1,054,915 | |
| Donoghue Forlines Momentum VIT Fund | | | 78,297,376 | | | | 5,875,025 | | | | (765,377 | ) | | | 5,109,648 | |
| 7. | DISTRIBUTIONS TO SHAREHOLDERS AND TAX COMPONENTS OF CAPITAL |
The tax character of distributions paid for the fiscal years ended December 31, 2021 and December 31, 2020 was as follows:
| | | For the year ended December 31, 2021 | |
| | | Ordinary | | | Long-Term | | | Return of | | | | |
| Fund | | Income | | | Capital Gains | | | Capital | | | Total | |
| Donoghue Forlines Dividend VIT Fund | | $ | 138,454 | | | $ | — | | | $ | — | | | $ | 138,454 | |
| Donoghue Forlines Momentum VIT Fund | | | — | | | | — | | | | — | | | | — | |
| | | For the year ended December 31, 2020 | |
| | | Ordinary | | | Long-Term | | | Return of | | | | |
| Fund | | Income | | | Capital Gains | | | Capital | | | Total | |
| Donoghue Forlines Dividend VIT Fund | | $ | 547,054 | | | $ | — | | | $ | — | | | $ | 547,054 | |
| Donoghue Forlines Momentum VIT Fund | | | 5,175,717 | | | | — | | | | — | | | | 5,175,717 | |
| Donoghue Forlines VIT Funds |
| NOTES TO FINANCIAL STATEMENTS (Continued) |
| December 31, 2021 |
As of December 31, 2021, the components of accumulated earnings/ (deficit) on a tax basis were as follows:
| | | Undistributed | | | Undistributed | | | Post October | | | Capital Loss | | | Other | | | Unrealized | | | Total | |
| | | Ordinary | | | Long-Term | | | Loss and | | | Carry | | | Book/Tax | | | Appreciation/ | | | Accumulated | |
| Fund | | Income | | | Capital Gains | | | Late Year Loss | | | Forwards | | | Differences | | | (Depreciation) | | | Earnings/(Deficits) | |
| Donoghue Forlines Dividend VIT Fund | | $ | 117,743 | | | $ | — | | | $ | — | | | | (5,322,658 | ) | | | — | | | $ | 1,054,915 | | | $ | (4,150,000 | ) |
| Donoghue Forlines Momentum VIT Fund | | | 11,201,800 | | | | 11,141 | | | | — | | | | — | | | | — | | | | 5,109,648 | | | | 16,322,589 | |
The difference between book basis and tax basis accumulated net realized gain/(loss), and unrealized appreciation/(depreciation) from investments is primarily attributable to the tax deferral of losses on wash sales, adjustments for partnerships and C-Corporation return of capital distributions.
At December 31, 2021, the Portfolios had capital loss carry forwards for federal income tax purposes available to offset future capital gains and capital loss carryforwards utilized as follows:
| | | Non-Expiring | | | | |
| Fund | | Short-Term | | | Long-Term | | | Total | | | Utilized | |
| Donoghue Forlines Dividend VIT Fund | | $ | 4,172,434 | | | $ | 1,150,224 | | | $ | 5,322,658 | | | $ | 1,928,123 | |
| Donoghue Forlines Momentum VIT Fund | | | — | | | | — | | | | — | | | | 4,817,518 | |
The beneficial ownership, either directly or indirectly, of more than 25% of the voting securities of a Fund creates presumption of control of the Fund, under Section 2(a)(9) of the 1940 Act. As of December 31, 2021, the shareholders listed below held, for the benefit of others, more than 25% of an individual Fund and may be deemed to control that Fund. The Funds have no knowledge as to whether all or any portion of the shares owned, by the parties noted below, are also owned beneficially by any party who would be presumed to control the respective Funds. Persons controlling the Funds can determine the outcome of any proposal submitted to the shareholders for approval, including changes to the Fund’s fundamental policies or the terms of the advisory agreement with the Advisor.
| Shareholder | Fund | Percent |
| Jefferson National Life Insurance Co. | Donoghue Forlines Dividend VIT Fund | 92.94% |
| Jefferson National Life Insurance Co. | Donoghue Forlines Momentum VIT Fund | 100.00% |
Subsequent events after the date of the Statement of Assets and Liabilities have been evaluated through the date the financial statements were issued. Management has determined that no events or transactions occurred requiring adjustment or disclosure in the financial statements.
REPORT OF INDEPENDENT REGISTERED PUBLIC ACCOUNTING FIRM
To the shareholders and Board of Trustees of Northern Lights Variable Trust
Opinion on the Financial Statements and Financial Highlights
We have audited the accompanying statements of assets and liabilities, including the portfolios of investments, of Donoghue Forlines Dividend VIT Fund and Donoghue Forlines Momentum VIT Fund, each a fund constituting the Northern Lights Variable Trust (the “Funds”), as of December 31, 2021, the related statements of operations for the year then ended, the statements of changes in net assets for each of the two years in the period then ended, the financial highlights for each of the four years in the period then ended, and the related notes.
In our opinion, the financial statements and financial highlights present fairly, in all material respects, the financial position of the Funds as of December 31, 2021, and the results of their operations for the year then ended, the changes in their net assets for each of the two years in the period then ended, and the financial highlights for each of the four years in the period then ended in conformity with accounting principles generally accepted in the United States of America. The financial highlights for the year ended December 31, 2017 were audited by other auditors whose report, dated February 15, 2018, expressed unqualified opinions on those statements.
Basis for Opinion
These financial statements and financial highlights are the responsibility of the Funds’ management. Our responsibility is to express an opinion on the Funds’ financial statements and financial highlights based on our audits. We are a public accounting firm registered with the Public Company Accounting Oversight Board (United States) (PCAOB) and are required to be independent with respect to the Funds in accordance with the U.S. federal securities laws and the applicable rules and regulations of the Securities and Exchange Commission and the PCAOB.
We conducted our audits in accordance with the standards of the PCAOB. Those standards require that we plan and perform the audit to obtain reasonable assurance about whether the financial statements and financial highlights are free of material misstatement, whether due to error or fraud. The Funds are not required to have, nor were we engaged to perform, an audit of their internal control over financial reporting. As part of our audits we are required to obtain an understanding of internal control over financial reporting but not for the purpose of expressing an opinion on the effectiveness of the Funds’ internal control over financial reporting. Accordingly, we express no such opinion.
Our audits included performing procedures to assess the risks of material misstatement of the financial statements and financial highlights, whether due to error or fraud, and performing procedures that respond to those risks. Such procedures included examining, on a test basis, evidence regarding the amounts and disclosures in the financial statements and financial highlights. Our audits also included evaluating the accounting principles used and significant estimates made by management, as well as evaluating the overall presentation of the financial statements and financial highlights. Our procedures included confirmation of securities owned as of December 31, 2021, by correspondence with the custodian and brokers. We believe that our audits provide a reasonable basis for our opinion.

Costa Mesa, California
February 18, 2022
We have served as the auditor of one or more Donoghue Forlines Funds investment companies since 2018.
| Donoghue Forlines VIT Funds |
| EXPENSE EXAMPLES (Unaudited) |
| December 31, 2021 |
As a shareholder of one or both of the Funds, you incur ongoing costs, including management fees, distribution and/or service (12b-1) fees, and other Fund expenses. This example is intended to help you understand your ongoing costs (in dollars) of investing in the Funds and to compare these costs with the ongoing costs of investing in other mutual funds.
The example is based on an investment of $1,000 invested at the beginning of the period and held for the entire period from July 1, 2021 through December 31, 2021.
Actual Expenses
The “Actual” columns in the table below provide information about actual account values and actual expenses. You may use the information below together with the amount you invested, to estimate the expenses that you paid over the period. Simply divide your account value by $1,000 (for example, an $8,600 account value divided by $1,000 = $8.6), then multiply the result by the number in the table under the heading entitled “Expenses Paid During Period” to estimate the expenses you paid on your account during this period.
Hypothetical Example for Comparison Purposes
The “Hypothetical” columns in the table below provide information about hypothetical account values and hypothetical expenses based on the Funds’ actual expense ratio and an assumed rate of return of 5% per year before expenses, which is not the Funds’ actual return. The hypothetical account values and expenses may not be used to estimate the actual ending account balances or expenses you paid for the period. You may use this information to compare this 5% hypothetical example with the 5% hypothetical examples that appear in the shareholder reports of other funds.
Please note that the expenses shown in the table are meant to highlight your ongoing costs only and do not reflect any transactional costs, such as sales charges (loads), redemption fees, as well as other charges and expenses of the insurance contract, or separate account. Therefore, the table is useful in comparing ongoing costs only, and will not help you determine the relative total costs of owning different funds. In addition, if these transactional costs were included, your costs would have been higher.
The Funds’ expenses shown do not reflect the charges and expenses of the insurance company separate accounts and if such expenses were included the costs would have been higher.
| | | | | | | | | | | Hypothetical |
| | | | | | | | | | | (5% return before |
| | | | | | | Actual | | expenses) |
| | | Fund’s | | | | Ending | | Expenses | | Ending | | Expenses |
| | | Annualized | | Beginning | | Account | | Paid | | Account | | Paid |
| | | Expense | | Account | | Value | | During | | Value | | During |
| | | Ratio | | Value 7/1/21 | | 12/31/21 | | Period* | | 12/31/21 | | Period |
| Donoghue Forlines Dividend VIT Fund Class 1 | | 2.00% | | $1,000.00 | | $1,062.20 | | $10.40 | | $1,015.12 | | $10.16 |
| Donoghue Forlines Momentum VIT Fund Class 1 | | 1.53% | | $1,000.00 | | $1,044.50 | | $7.88 | | $1,017.49 | | $7.78 |
| * | Actual Expenses Paid During Period are equal to the Fund’s annualized expense ratio, multiplied by the average account value over the period, multiplied by the number of days in the period (184) divided by the number of days in the fiscal year (365). |
| Donoghue Forlines VIT Funds |
| SUPPLEMENTAL INFORMATION (Unaudited) |
| December 31, 2021 |
Donoghue Forlines, LLC (Adviser to Donoghue Forlines Dividend VIT Fund & Donoghue Forlines Momentum VIT Fund) *
In connection with the regular meeting held on September 21-23,2021 of the Board of Trustees (the “Trustees” or the “Board”) of the Northern Lights Variable Trust (the “Trust”), including a majority of the Trustees who are not “interested persons,” as that term is defined in the Investment Company Act of 1940, as amended, discussed the re-approval of an investment advisory agreement (the “Advisory Agreement”) between Donoghue Forlines, LLC (“Donoghue” or “Adviser”) and the Trust, with respect to the Donoghue Forlines Dividend VIT Fund (“Dividend VIT”) & Donoghue Forlines Momentum VIT Fund (“Momentum VIT”) (collectively referred to as the “Donoghue Funds”). In considering the re-approval of the Advisory Agreement, the Board received materials specifically relating to the Advisory Agreement.
The Trustees were assisted by independent legal counsel throughout the Advisory Agreement review process. The Trustees relied upon the advice of independent legal counsel and their own business judgment in determining the material factors to be considered in evaluating the Advisory Agreement and the weight to be given to each such factor. The conclusions reached by the Trustees were based on a comprehensive evaluation of all of the information provided and were not the result of any one factor. Moreover, each Trustee may have afforded different weight to the various factors in reaching his conclusions with respect to the Advisory Agreement.
Nature, Extent and Quality of Services. The Board noted that Donoghue was founded in 1986 and had $1.2 billion in combined assets under management and advisement, providing rules-based tactical allocation strategies and professional investment management services to individuals, corporations, and institutions. The Board reviewed the background information of the key investment personnel who were responsible for servicing the Donoghue Funds, considering their education and noting the investment team’s diverse financial industry experience. The Board reviewed the investment process for the Donoghue Funds, noting that Donoghue’s index funds attempted to replicate and track customized sector specific indexes using technical indicators. The Board discussed that Donoghue utilized an order management system to monitor compliance with each Fund’s investment limitations, which automatically sent notifications to the Adviser. The Board commented that Donoghue’s CCO and CIO performed a quarterly best execution review of broker dealers for overall quality and service. The Board remarked that Donoghue allocated substantial resources to risk management and adhered to index tracking. The Board concluded that Donoghue could be expected to continue providing quality services to the Donoghue Funds and their shareholders.
Performance.
Dividend VIT. The Board noted that the Fund received a one-star Morningstar category rating. The Board observed the Fund’s performance, noting that the Fund had returned 35.62% over the one-year period. The Board noted that the Fund underperformed its peer group and Morningstar category across all periods. The Board agreed that Donoghue should continue
| Donoghue Forlines VIT Funds |
| SUPPLEMENTAL INFORMATION (Unaudited) (Continued) |
| December 31, 2021 |
managing the Fund and demonstrate at a future Board meeting that its recently implemented changes were proving beneficial to the Fund’s performance.
Momentum VIT. The Board noted that the Fund received a four-star Morningstar rating. The Board observed the Fund’s performance, noting that the Fund had returned 60.37% over the one-year period and outperformed its benchmarks, peer group, and Morningstar category. The Board noted that the Fund outperformed its peer group and Morningstar category over the three-year and five-year periods and since inception. The Board noted that the Fund’s Sharpe ratio was in the top quartile among its peer group and Morningstar category over the one-year period, and that its standard deviation was in the fourth quartile among its peer group and Morningstar category for the same period. Although past performance is no guarantee of future results, the Board concluded that Donoghue could be expected to provide reasonable returns to the Fund and its shareholders
Fees and Expenses.
Dividend VIT. The Board reviewed the Fund’s advisory fee of 1.00%, which was higher than its peer group and Morningstar category medians and averages. The Board further noted the Fund’s net expense ratio of 2.00%, which was significantly higher than its peer group and Morningstar category medians and averages. The Board discussed Donoghue’s justifications for the higher fees, mainly its risk management and tactical ability to move into 100% short term treasuries. The Board noted that Donoghue intended to renew its expense limitation agreement. After further discussion, the Board concluded that the advisory fee of the Fund was not unreasonable.
Momentum VIT. The Board reviewed the Fund’s advisory fee of 1.00%, which was higher than its peer group and Morningstar category medians and averages. The Board further noted the Fund’s net expense ratio of 1.57%, which was higher than its peer group and Morningstar category medians and averages. The Board noted that Donoghue justified its higher fees in light of its risk management and tactical ability to move into 100% short term treasuries during times of major market downturns in order to protect principal. The Board also considered Donoghue’s assertion that the overall expense ratio should decrease as the Fund increases its assets. The Board noted that Donoghue intended to renew the expense limitation agreements. After further discussion, the Board concluded that the advisory fee of the Fund was not unreasonable.
Profitability. The Board reviewed the profitability analysis provided by Donoghue. The Board examined Donoghue’s responses and noted that Donoghue’s profitability for each Fund ranged considerably. After further discussion, the Board determined that Donoghue’s profitability with respect to each Fund was not excessive.
Economies of Scale. The Board noted that the Donoghue Funds collectively lost assets over the last twelve months. The Board observed that Donoghue was willing to consider implemented a breakpoint when each Fund reached higher targeted assets. The Board considered Donoghue’s assertion that the Momentum VIT Fund was unlikely to grow materially due to the
| Donoghue Forlines VIT Funds |
| SUPPLEMENTAL INFORMATION (Unaudited) (Continued) |
| December 31, 2021 |
limited consumer interest in variable annuity contracts. The Board discussed the benefits to shareholders of the expense limitation agreements. The Board agreed to monitor and revisit this issue at the appropriate time.
Conclusion. Having requested and received such information from Donoghue as the Board believed to be reasonably necessary to evaluate the terms of the Advisory Agreement, and as assisted by the advice of counsel, the Board concluded that the renewal of the Advisory Agreement with Donoghue was in the best interests of each Fund and its respective shareholders.
| * | Due to the timing of the contract renewal schedule, these deliberations may or may not relate to the current performance results of the Donoghue Funds. |
| Donoghue VIT Funds |
| SUPPLEMENTAL INFORMATION (Unaudited) |
| December 31, 2021 |
The Trustees and the executive officers of the Trust are listed below with their present positions with the Trust and principal occupations over at least the last five years. The business address of each Trustee and Officer is 225 Pictoria Drive, Suite 450, Cincinnati, OH 45246. All correspondence to the Trustees and Officers should be directed to c/o Ultimus Fund Solutions, LLC, P.O. Box 541150, Omaha, Nebraska 68154.
Independent Trustees
Name, Address
and Year of
Birth | Position/Term
of Office | Principal Occupation
During the Past Five
Years | Number of
Portfolios
in Fund
Complex*
Overseen
by Trustee | Other Directorships held by
Trustee During the Past Five
Years |
Mark Garbin
Born in 1951 | Trustee Since 2013 | Managing Principal, Coherent Capital Management LLC (since 2007). | 9 | Northern Lights Variable Trust (for series not affiliated with the Funds since 2013); Two Roads Shared Trust (since 2012); Forethought Variable Insurance Trust (since 2013); Northern Lights Fund Trust (since 2013); OHA Mortgage Strategies Fund (offshore), Ltd. (2014 -2017); and Altegris KKR Commitments Master Fund (since 2014); OFI Carlyle Global Private Credit Fund (since March 2018) and and Independent Director OHA CLO Enhanced Equity II Genpar LLP (since June 2021). |
Mark D. Gersten
Born in 1950 | Trustee Since 2013 | Independent Consultant (since 2012). | 9 | Northern Lights Variable Trust (for series not affiliated with the Funds since 2013); Northern Lights Fund Trust (since 2013); Two Roads Shared Trust (since 2012); Altegris KKR Commitments Master Fund (since 2014); previously, Ramius Archview Credit and Distressed Fund (2015-2017); Schroder Global Series Trust (2012 -2017). |
Anthony J. Hertl
Born in 1950 | Trustee Since 2005; Chairman of the Board since 2013 | Retired, previously held several positions in a major Wall Street firm including Capital Markets Controller, Director of Global Taxation, and CFO of the Specialty Finance Group. | 9 | Northern Lights Variable Trust (for series not affiliated with the Funds since 2006); Northern Lights Fund Trust (since 2005); Alternative Strategies Fund (since 2010); Satuit Capital Management Trust (2007-2019). |
Gary W. Lanzen
Born in 1954 | Trustee Since 2005 | Retired since 2012. Formerly, Founder, President, and Chief Investment Officer, Orizon Investment Counsel, Inc. (2000-2012). | 9 | Northern Lights Variable Trust (for series not affiliated with the Funds since 2006); Northern Lights Fund Trust (since 2005); AdvisorOne Funds (since 2003); Alternative Strategies Fund (since 2010); and previously, CLA Strategic Allocation Fund (2014-2015). |
John V. Palancia
Born in 1954 | Trustee Since 2011 | Retired (since 2011). Formerly, Director of Futures Operations, Merrill Lynch, Pierce, Fenner & Smith Inc. (1975-2011). | 9 | Northern Lights Variable Trust (for series not affiliated with the Funds since 2011); Northern Lights Fund Trust III (since February 2012); Alternative Strategies Fund (since 2012) and Northern Lights Fund Trust (since 2011). |
Mark H. Taylor
Born in 1964 | Trustee Since 2007; Chairman of the Audit Committee since 2013 | Director, Lynn Pippenger School of Accountancy Muma College of Business, University of South Florida, Tampa FL (since 2019); Chair, Department of Accountancy and Andrew D. Braden Professor of Accounting and Auditing, Weatherhead School of Management, Case Western Reserve University (2009-2019); Vice President-Finance, American Accounting Association (2017-2020); President, Auditing Section of the American Accounting Association (2012-2015). AICPA Auditing Standards Board Member (2009-2012). | 9 | Northern Lights Variable Trust (for series not affiliated with the Funds since 2007); Alternative Strategies Fund (since 2010); Northern Lights Fund Trust III (since 2012); and Northern Lights Fund Trust (since 2007). |
12/31/21-NLVT-v2
| Donoghue VIT Funds |
| SUPPLEMENTAL INFORMATION (Unaudited)(Continued) |
| December 31, 2021 |
Officers
Name, Address
and Year of Birth | Position/Term of
Office* | Principal Occupation
During the Past Five Years | Number of
Portfolios in
Fund
Complex*
Overseen by
Trustee | Other Directorships held by Trustee
During the Past Five Years |
Kevin E. Wolf
Born in 1969 | President Since June 2017 | Executive Vice President, Head of Fund Administration, and Product; Ultimus Fund Solutions, LLC (since 2020); Vice President of The Ultimus Group, LLC (since 2019); Executive Vice President of Gemini Fund Services, LLC (2019-2020) President, Gemini Fund Services, LLC (2012 -2019). | N/A | N/A |
Richard Malinowski
Born in 1983 | Vice President Since March 2018 | Senior Vice President and Senior Managing Counsel, Ultimus Fund Solutions, LLC (since 2020); Senior Vice President Legal Administration, Gemini Fund Services, LLC (2017-2020); Vice President and Counsel (2016-2017) and Assistant Vice President and Staff Attorney (2012-2016). | N/A | N/A |
James Colantino
Born in 1969 | Treasurer Since June 2017 | Senior Vice President Fund Administration, Ultimus Fund Solutions (since 2020); Senior Vice President Fund Administration, Gemini Fund Services, LLC (2012-2020); Assistant Treasurer of the Trust (2006-June 2017). | N/A | N/A |
Stephanie Shearer
Born in 1979 | Secretary Since February 2017 | Assistant Secretary of the Trust (2012-February 2017); Manager of Legal Administration, Ultimus Fund Solutions (since 2020); Manager of Legal Administration, Gemini Fund Services, LLC (2018-2020); Senior Paralegal, Gemini Fund Services, LLC (2013 -2018). | N/A | N/A |
Michael J. Nanosky
Born in 1966 | Chief Compliance Officer since January 2021 | Chief Compliance Officer, of the Trust (Since January 2021); Vice President-Senior Compliance Officer, Ultimus Fund Solutions (Since 2020); Vice President, Chief Compliance Officer for Williamsburg Investment Trust (2020-current); Senior Vice President-Chief Compliance Officer, PNC Funds (2014-2019). | N/A | N/A |
| * | The term of office for each Trustee and officer listed above will continue indefinitely until the individual resigns or is removed. |
| ** | As of December 31, 2021, the Trust was comprised of 15 active portfolios managed by unaffiliated investment advisers. The term “Fund Complex” applies only to the Portfolios managed by the Adviser. The Portfolios do not hold themselves out as related to any other series within the Trust for investment purposes, nor do they share the same investment adviser with any other series. |
The Fund’s Statement of Additional Information includes additional information about the Trustees and is available free of charge, upon request, by calling toll-free at 1-877-779-7462.
12/31/21-NLVT-v2
PRIVACY NOTICE
Northern Lights Variable Trust
Rev. February 2014
| FACTS | WHAT DOES NORTHERN LIGHTS VARIABLE TRUST DO WITH YOUR PERSONAL INFORMATION? |
| Why? | Financial companies choose how they share your personal information. Federal law gives consumers the right to limit some, but not all sharing. Federal law also requires us to tell you how we collect, share, and protect your personal information. Please read this notice carefully to understand what we do. |
| What? | The types of personal information we collect and share depends on the product or service that you have with us. This information can include: ● Social Security number and wire transfer instructions ● account transactions and transaction history ● investment experience and purchase history When you are no longer our customer, we continue to share your information as described in this notice. |
| How? | All financial companies need to share customers’ personal information to run their everyday business. In the section below, we list the reasons financial companies can share their customers’ personal information; the reasons Northern Lights Variable Trust chooses to share; and whether you can limit this sharing. |
Reasons we can share your
personal information: | Does Northern Lights Variable
Trust share information? | Can you limit this sharing? |
| For our everyday business purposes - such as to process your transactions, maintain your account(s), respond to court orders and legal investigations, or report to credit bureaus. | YES | NO |
| For our marketing purposes - to offer our products and services to you. | NO | We don’t share |
| For joint marketing with other financial companies. | NO | We don’t share |
| For our affiliates’ everyday business purposes - information about your transactions and records. | NO | We don’t share |
| For our affiliates’ everyday business purposes - information about your credit worthiness. | NO | We don’t share |
| For nonaffiliates to market to you | NO | We don’t share |
| QUESTIONS? | Call 1-402-493-4603 |
PRIVACY NOTICE
Northern Lights Variable Trust
| What we do: |
How does Northern Lights Variable Trust protect my personal information? | To protect your personal information from unauthorized access and use, we use security measures that comply with federal law. These measures include computer safeguards and secured files and buildings. Our service providers are held accountable for adhering to strict policies and procedures to prevent any misuse of your nonpublic personal information. |
How does Northern Lights Variable Trust collect my personal information? | We collect your personal information, for example, when you ● open an account or deposit money ● direct us to buy securities or direct us to sell your securities ● seek advice about your investments We also collect your personal information from others, such as credit bureaus, affiliates, or other companies. |
Why can’t I limit all sharing? | Federal law gives you the right to limit only: ● sharing for affiliates’ everyday business purposes – information about your creditworthiness. ● affiliates from using your information to market to you. ● sharing for nonaffiliates to market to you. State laws and individual companies may give you additional rights to limit sharing. |
| Definitions |
| Affiliates | Companies related by common ownership or control. They can be financial and nonfinancial companies. ● Northern Lights Variable Trust does not share with our affiliates. |
| Nonaffiliates | Companies not related by common ownership or control. They can be financial and nonfinancial companies. ● Northern Lights Variable Trust does not share with nonaffiliates so they can market to you. |
| Joint marketing | A formal agreement between nonaffiliated financial companies that together market financial products or services to you. ● Northern Lights Variable Trust doesn’t jointly market. |
PROXY VOTING POLICY
Information regarding how the Funds voted proxies relating to portfolio securities for the most recent twelve month period ended June 30 as well as a description of the policies and procedures that each Fund uses to determine how to vote proxies is available without charge, upon request, by calling 1-877-779-7462 or by referring to the Securities and Exchange Commission’s (“SEC”) website at http://www.sec.gov.
PORTFOLIO HOLDINGS
Funds file a complete schedule of portfolio holdings with the Securities and Exchange Commission (the “SEC”) for the first and third quarters of each fiscal year as an exhibit to its reports on Form N-PORT, within sixty days after the end of the period. Form N-PORT reports are available at the SEC’s website at www.sec.gov.
| INVESTMENT ADVISOR |
| Donoghue Forlines LLC |
| One International Place Suite 310 |
| Boston, MA 02110 |
| |
| ADMINISTRATOR |
| Ultimus Fund Solutions, LLC |
| 4221 North 203rd Street, Suite 100 |
| Elkhorn, NE 68022-3474 |
| |
| |
| |
| |
| |
| DONOGHUEVIT-AR21 |
Item 2. Code of Ethics.
(a) As of the end of the period covered by this report, the registrant has adopted a code of ethics that applies to the registrant's principal executive officer, principal financial officer, principal accounting officer or controller, or persons performing similar functions, regardless of whether these individuals are employed by the registrant or a third party.
(b) For purposes of this item, “code of ethics” means written standards that are reasonably designed to deter wrongdoing and to promote:
| (1) | Honest and ethical conduct, including the ethical handling of actual or apparent conflicts of interest between personal and professional relationships; |
| (2) | Full, fair, accurate, timely, and understandable disclosure in reports and documents that a registrant files with, or submits to, the Commission and in other public communications made by the registrant; |
(3) Compliance with applicable governmental laws, rules, and regulations;
| (4) | The prompt internal reporting of violations of the code to an appropriate person or persons identified in the code; and |
(5) Accountability for adherence to the code.
(c) Amendments: During the period covered by the report, there have not been any amendments to the provisions of the code of ethics.
(d) Waivers: During the period covered by the report, the registrant has not granted any express or implicit waivers from the provisions of the code of ethics.
(e) The Code of Ethics is not posted on Registrant’ website.
(f) A copy of the Code of Ethics is attached as an exhibit.
Item 3. Audit Committee Financial Expert.
(a) The Registrant’s board of trustees has determined that Mark Gersten, Anthony J. Hertl, and Mark H. Taylor are audit committee financial experts, as defined in Item 3 of Form N-CSR. Mr. Gersten, Mr. Hertl and Mr. Taylor are independent for purposes of this Item 3.
Item 4. Principal Accountant Fees and Services.
| (a) | Audit Fees | | 2020 | | 2021 |
| | Donoghue Forlines Dividend VIT Fund | | | $14,775 | | | | $15,300 | |
| | Donoghue Forlines Momentum VIT Fund | | | $14,775 | | | | $15,300 | |
| (b) | Audit-Related Fees | | | 2020 | | | | 2021 | |
| | Donoghue Forlines Dividend VIT Fund | | | None | | | | None | |
| | Donoghue Forlines Momentum VIT Fund | | | None | | | | None | |
| (c) | Tax Fees | | 2020 | | 2021 |
| | Donoghue Forlines Dividend VIT Fund | | | $3,275 | | | | $3,340 | |
| | Donoghue Forlines Momentum VIT Fund | | | $3,275 | | | | $3,340 | |
Preparation of Federal & State income tax returns, assistance with calculation of required income, capital gain and excise distributions and preparation of Federal excise tax returns.
| (d) | All Other Fees | | | 2020 | | | | 2021 | |
| | Donoghue Forlines Dividend VIT Fund | | | None | | | | None | |
| | Donoghue Forlines Momentum VIT Fund | | | None | | | | None | |
| (e) | (1) Audit Committee’s Pre-Approval Policies |
The registrant’s Audit Committee is required to pre-approve all audit services and, when appropriate, any non-audit services (including audit-related, tax and all other services) to the registrant. The registrant’s Audit Committee also is required to pre-approve, when appropriate, any non-audit services (including audit-related, tax and all other services) to its adviser, or any entity controlling, controlled by or under common control with the adviser that provides ongoing services to the registrant, to the extent that the services may be determined to have an impact on the operations or financial reporting of the registrant. Services are reviewed on an engagement by engagement basis by the Audit Committee.
| (2) | Percentages of Services Approved by the Audit Committee |
| Donoghue Forlines Dividend VIT Fund | | 2020 | | 2021 |
| Audit-Related Fees: | | | 0.00% | | | | 0.00% | |
| Tax Fees: | | | 0.00% | | | | 0.00% | |
| All Other Fees: | | | 0.00% | | | | 0.00% | |
| Donoghue Forlines Momentum VIT Fund | | 2020 | | 2021 |
| Audit-Related Fees: | | | 0.00% | | | | 0.00% | |
| Tax Fees: | | | 0.00% | | | | 0.00% | |
| All Other Fees: | | | 0.00% | | | | 0.00% | |
| (f) | During the audit of registrant's financial statements for the most recent fiscal year, less than 50 percent of the hours expended on the principal accountant's engagement were attributed to work performed by persons other than the principal accountant's full-time, permanent employees. |
| (g) | The aggregate non-audit fees billed by the registrant's accountant for services rendered to the registrant, and rendered to the registrant's investment adviser (not including any sub-adviser whose role is primarily portfolio management and is subcontracted with or overseen by another investment adviser), and any entity controlling, controlled by, or under common control with the adviser that provides ongoing services to the registrant: |
| | | 2020 | | 2021 |
| Donoghue Forlines Dividend VIT Fund | | $3,275 | | | $3,340 | |
| Donoghue Forlines Momentum VIT Fund | | $3,275 | | | $3,340 | |
(h) The registrant's audit committee has considered whether the provision of non-audit services to the registrant's investment adviser (not including any sub-adviser whose role is primarily portfolio management and is subcontracted with or overseen by another investment adviser), and any entity controlling, controlled by, or under common control with the investment adviser that provides ongoing services to the registrant, that were not pre-approved pursuant to paragraph (c)(7)(ii) of Rule 2-01 of Regulation S-X, is compatible with maintaining the principal accountant's independence.
Item 5. Audit Committee of Listed Companies. Not applicable to open-end investment companies.
Item 6. Schedule of Investments. Schedule of investments in securities of unaffiliated issuers is included under Item 1.
Item 7. Disclosure of Proxy Voting Policies and Procedures for Closed-End Funds. Not applicable to open-end investment companies.
Item 8. Portfolio Managers of Closed-End Management Investment Companies. Not applicable to open-end investment companies.
Item 9. Purchases of Equity Securities by Closed-End Funds. Not applicable to open-end investment companies.
Item 10. Submission of Matters to a Vote of Security Holders. None
Item 11. Controls and Procedures.
(a) Based on an evaluation of the Registrant’s disclosure controls and procedures as of a date within 90 days of filing date of this Form N-CSR, the principal executive officer and principal financial officer of the Registrant have concluded that the disclosure controls and procedures of the Registrant are reasonably designed to ensure that the information required in filings on Form N-CSR is recorded, processed, summarized, and reported by the filing date, including that information required to be disclosed is accumulated and communicated to the Registrant’s management, including the Registrant’s principal executive officer and principal financial officer, as appropriate to allow timely decisions regarding required disclosure.
(b) There were no significant changes in the Registrant’s internal control over financial reporting that occurred during the Registrant’s last fiscal half-year that have materially affected, or are reasonably likely to materially affect, the Registrant’s internal control over financial reporting.
Item 12. Disclosure of Securities Lending Activities for Closed-End Management Investment Companies. Not applicable to open-end investment companies.
Item 13. Exhibits.
(a)(1) Not applicable.
(a)(2) Certifications required by Section 302 of the Sarbanes-Oxley Act of 2002 (and Item 11(a)(2) of Form N-CSR) are filed herewith.
(a)(3) Not applicable for open-end investment companies.
SIGNATURES
Pursuant to the requirements of the Securities Exchange Act of 1934 and the Investment Company Act of 1940, the registrant has duly caused this report to be signed on its behalf by the undersigned, thereunto duly authorized.
(Registrant) Northern Lights Variable Fund Trust
By (Signature and Title)
/s/ Kevin E. Wolf
Kevin E. Wolf, Principal Executive Officer/President
Date 3/1/22
Pursuant to the requirements of the Securities Exchange Act of 1934 and the Investment Company Act of 1940, this report has been signed below by the following persons on behalf of the registrant and in the capacities and on the dates indicated.
By (Signature and Title)
/s/ Kevin E. Wolf
Kevin E. Wolf, Principal Executive Officer/President
Date 3/1/22
By (Signature and Title)
/s/ Jim Colantino
Jim Colantino, Principal Financial Officer/Treasurer
Date 3/1/22