9united states
securities and exchange commission
washington, d.c. 20549
form n-csr/A
certified shareholder report of registered management
investment companies
[The Fund is amending this filing to correct a typographical error in the audit opinion to the financial statements.]
Investment Company Act file number 811-21853
Northern Lights Variable Fund Trust
(Exact name of registrant as specified in charter)
225 Pictoria Drive, Suite 450, Cincinnati, OH 45246
(Address of principal executive offices) (Zip code)
The Corporation Trust Company
1209 Orange Street, Wilmington, DE 19801
(Name and address of agent for service)
Registrant's telephone number, including area code: 631-470-2600
Date of fiscal year end: 12/31
Date of reporting period: 12/31/21
Item 1. Reports to Stockholders.

TOPS® Managed Risk Flex ETF Portfolio
A series of the Northern Lights Variable Trust
Annual Report
December 31, 2021
Distributed by Northern Lights Distributors, LLC
Member FINRA
A Message from the TOPS® Portfolio Management Team
End of Year 2021 Market Commentary
Positive Momentum into Year End, with Questions Left to be Answered in 2022
In the 4th quarter of 2021, markets rebounded from September weakness to finish the year with strong positive momentum. Looking back, roughly 1/3 of the total 2021 returns were achieved in the last three months of the year. Major events this quarter were the emergence of the Omicron variant, more clarity from the Federal Reserve on a plan to reduce stimulus, the passage of the Infrastructure and Jobs Act, shelving of the Build Back Better plan, and continued high inflation.
After discussing Q4 and full year 2021 financial market results, we will address three topics important to TOPS portfolio returns and strategies:
| 1) | Inflation: What will happen to inflation and what are the repercussions? |
| 2) | The Fed: Will the Fed fight inflation aggressively or not? |
| 3) | Return Expectations: Is it the time to search for a new leader beyond large cap growth? |
Fourth Quarter and Year-To-Date Markets Review
For Q4 2021, most stock indexes had positive returns. This includes, but is not limited to, S&P 500 Growth Index (“S&P 500 Growth”) up +13.4%, S&P 500 Index (“S&P 500”) up +11.0%, MSCI World Real Estate Index up +10.7%, and S&P GSSI Natural Resources Index up +8.1%. The S&P MidCap 400 Index (“S&P MidCap” and S&P SmallCap 600 Index (“S&P SmallCap”) both posted positive returns of +8.0% and +5.6%, respectively. MSCI Emerging Markets Index ended the year with a negative quarter, down - 1.3%.
A positive fourth quarter helped stock market indexes lock in above average returns for the year. The best performer for the year was S&P GSSI Natural Resources Index, up nearly +40.0%. The S&P 500 recorded a strong +28.7%, while S&P SmallCap and MidCap put up +26.8% and +24.8%, respectively. Strong results were also achieved by MSCI World Real Estate Index, up +28.7%. The laggards on the year remain MSCI EAFE Index (developed international) returning +11.3% and MSCI Emerging Markets Index down -2.5%.
Bond yields were flat in the fourth quarter as the Bloomberg 10-year U.S. Treasury Index yield stayed at 1.52%. Total returns for the Bloomberg U.S. Aggregate Bond (“Bloomberg U.S. Aggregate”) Index were also flat on the quarter and the Bloomberg U.S. Treasury Inflation Protected Securities Index (“Bloomberg U.S. TIPS”) returned +2.4%. High Yield corporate bonds had positive returns, while Investment Grade Corporates and Emerging Markets bonds saw negative returns.
The Bloomberg 10-year U.S. Treasury Bond Index yield rose from 0.93% to 1.52% over the year. Bloomberg U.S. TIPS recorded a solidly positive return of +6.0% for the year versus the broader Bloomberg U.S. Aggregate at -1.5%. U.S. High Yield achieved positive returns while developed international and emerging markets were negative.
Inflation: What will happen to inflation, and what are the repercussions?
Prices in the U.S. are clearly higher leading into 2022, as shown by multiple measurements of inflation. With the economy running stronger than it has in a long time, the money supply about $5 Trillion higher than the beginning of 2020, supply chains strained, skilled labor hard to find, and measurements coming off tepid bases registered during the recession; it is no surprise inflation is finally arriving.
For economists and money managers, this is a big change, as inflation has remained subdued for well over a decade. As we have discussed in this commentary over the years, several long-term macro deflationary factors have been keeping inflation down. Factors such as aging population, lower economic growth rates, technological innovation and international trade have been suppressing any hints of inflation for some time. However, the lid has blown off and these longer-term trends have failed to subdue recent pressures, as the U.S. Bureau of Labor Statistics recorded the largest inflation jump in over 40 years for the Consumer Price Index (“CPI”) in December at a 6.8% year-over-year increase. Rising prices in energy and food were a major driver; however, even when stripping out those components the ‘core’ reading of inflation rose 4.9%.
From our standpoint, inflation is the leading concern for markets heading into 2022. Each day, we are researching and debating whether inflation is transitory or here to stay and discussing the impact on our portfolios. A particular area of focus is wages, as increases in wages can help to transition short term spikes in inflation (transitory) to longer term secular inflationary trends. To this point, increases in wages have not been a leading driver of inflation, but that may be changing. Per the November Employment Situation Report from the Bureau of Labor Statistics, the average hourly earnings for all private sector employees rose 4.9% over the last year.
Helping to drive wages higher is a scarcity of labor. While many unemployed from the recession have found jobs, many others are leaving the labor force entirely. According to M&N, 58.8% of the U.S. population is employed currently versus 61.1% pre-pandemic. The 2.3% percentage difference equates to roughly 7.5 million fewer people working or actively seeking employment today. Some have called this, “The Great Resignation.”
While we are happy for the baby boomers finally getting their opportunity to enjoy retirement, the birthrates in the U.S. have fallen below replacement levels. This shrinking labor force could continue to place pressure on wages, which is holding our attention and stopping us from dismissing inflationary figures as purely temporary.
Historically, stocks have been a relatively good place to be invested in periods of moderate inflation. Inflation can be in tandem with solid economic growth, which drives earnings and fuels stocks. Likewise, stocks are one of the few investments with the opportunity to provide returns high enough for investors to avoid losing purchasing power in periods of inflation. Therefore, investors in stocks should be in the right place should we enjoy a period of moderate inflation.
The primary concerns regarding inflation are the impact on bond investments and the measures which may be employed to keep inflation in check. Our Portfolio Management Team is spending significant time and effort in monitoring inflation and modeling the impact inflation could have. We feel the portfolios are well designed to balance this risk, along with the many other risks and opportunities in global financial markets.
The Fed: Will the Fed fight inflation aggressively or not?
There are some similarities between economists and pharmacists, as both try to provide a medicine to cure any ailment. In economics, the common prescription to fight inflation above target levels is to raise interest rates. By raising interest rates, the Federal Reserve should be able to tap the brakes on inflation. Like any commercial on TV outlining the side effects of pharmaceuticals, there are side effects to raising interest rates as well. Likewise, it is very important interest rate increases are enacted in the right dosage.
Federal Reserve Chairman Jerome Powell has outlined many times over the past year that the Fed is confident they can control inflation. Chairman Powell has outlined primarily that the Fed will be nimble, able to appropriately gauge the pulse on inflation and the appropriate dosage of rate rises. However, he has stopped short of outlining whether the Fed will be aggressive or not in the short term. This “trust me” policy has left markets guessing and professional money managers like us forced to allow for multiple scenarios.
Some market pundits feel the Fed is already behind the curve and it will have to aggressively raise rates in 2022 to cool inflation. Others are confident the Fed will expertly execute its Goldilocks strategy. Currently, markets overall are expecting to see three different 0.25% rate increases in the Federal Funds Rate in 2022. The pace and level of these increases is likely to have a major impact on 2022 results in stock and bond markets.
Lastly, there is much debate on how longer-term bonds will react to increases in short term rates. As the Fed increases the Fed Funds Rate, there is no assurance interest rates on 10-year U.S. Treasury bonds will react. As such, we could experience what is referred to as a yield curve flattening, when interest rates at different maturities transition towards parity.
Our Portfolio Management Team is watching the Fed and interest rates closely. We have implemented several different strategies in our bond allocations to balance the risk and return opportunities of the multiple different scenarios we outline.
Return Expectations: Is it the time to search for a new leader beyond large cap growth?
Large cap growth U.S stocks were the clear performance leader among major global asset classes in 2021, as they have been over the past 5 years. For the past 5 years, large growth stocks have returned about 24% annualized, which has led large value (12%), mid cap (13%), small cap (12%) and international developed (10%).
Looking forward to 2022, the path to outperformance for large cap growth stocks appears to be different. The spectacular run-up in growth and tech stocks over the last decade has been a combination of earnings growth and investors bidding up multiples to historically high levels. A valuation multiple we often reference is the Price/Earnings ratio (P/E). Historically, the P/E ratio of the S&P 500 has been around 17. To produce the exceptional returns, the Trailing P/E ratio of the S&P 500 has risen to around 25, with the Forward P/E in the 21/22 range.
According to Dr. Ed Yardeni, the forward P/E of the S&P 500 has remained remarkably high, mostly because the valuation multiple of the S&P 500 Growth stock price index has been amazingly steady, at around 28.0 since mid-2020. Amid a rise in the inflation rate and the increasingly hawkish stance of the Fed, these stable valuations are uncommon. Potentially, the steadiness can be attributed to liquidity provided by monetary and fiscal policies since the start of the pandemic.
Growth stocks, specifically tech stocks, tend to benefit from lower interest rates. Not only do low rates aid borrowing, but they also make growth stocks more attractive to investors compared to more conservative investments. As an example, if an investor could earn 5% on the 10-year U.S. Treasury, this would reduce the attractiveness to the risk inherent in growth stocks. Therefore, if we do see rates rise, it could put pressure particularly on valuations of large cap growth stocks.
So, will we have a new leader among asset classes in 2022 and over the next few years? As our investors should know, at least those who have read our writings over the last 20 years, it is incredibly difficult to predict short term market results. However, over the long term, we do feel there is opportunity for asset classes beyond large cap growth to make up some of the return gap accumulated over the last decade.
In their recently released 10-year return expectations, Vanguard revealed their return expectations for U.S. large growth stocks trail those of U.S. value stocks, international stocks, and several other major asset classes. Value stocks tend to trade at lower valuations and can often be boring companies, like healthcare and financial stocks.
Large cap U.S. stocks are the largest equity concentration in our portfolios currently. We continue to be believers in the long-term return potential of the U.S. stock market. However, as we have seen in periods like the first decade of the millennium, a benefit of diversifying risk into a wide range of global asset classes is the opportunity to experience desirable returns in periods when large cap U.S. stocks do not lead. We have balanced the risk and opportunity to be able to benefit if the large cap U.S. stock rally continues, however, TOPS stands to provide appropriate relative results if the baton is handed off to other diversifying asset classes which currently provide more attractive valuations.
TOPS Portfolio Strategies
All signs lead us to believe 2022 will be quite different from 2021. While the opportunity exists for portfolios to provide marked additional gains, we feel the path to success will likely look different than the story we just experienced. There are quite a few economic pressures, like inflation, which may force the hand of the Fed to act.
The TOPS portfolio team will continue to monitor the constant flow of economic and financial market data as we strategically implement our philosophy of maintaining broadly diversified portfolios. We feel our risk managed approach is well suited to serve our investors and provide appropriate returns over time.
Summary of the Milliman Managed Risk Strategy™ (MMRS)
After returning more than 17% across the final two months of 2020, the global equity market took a breather to start 2021, declining 0.5%, as measured by the MSCI All Country World Index. Unlike the previous month, when virtually all segments of the equity market were uniformly higher, January provided a mixed bag. In the United States, large-cap stocks were down, while small- and mid-caps were higher. Outside the United States, emerging market equities notched their fourth consecutive positive monthly return, while developed market equities finished the month lower. Amid these disparate returns, global equity market volatility crept higher from its post-COVID correction low at the end of 2020. Coming off such a low level, the increase in volatility didn’t result in any changes in the equity allocations of the TOPS Managed Risk Portfolios until month end. As January ended, the Flex portfolio had reduced equity allocations by 0.46 percentage points from levels at the end of December 2020.
After an anemic start to the year, global equities resumed their ascent in February, as measured by the MSCI All Country World Index, only to sell off later in the month amid soaring bond yields. U.S. equities also sold off in late February after the yield on the 10-year U.S. Treasury note jumped to a one-year high in response to rising inflation expectations. The decline notwithstanding, U.S. equities ended the month in the black with investors favoring mid-cap, small-cap, and value stocks. While large-cap stocks also notched gains, their increases were more modest. Equity market volatility shot up in late February, and TOPS Managed Risk Portfolios adjusted by trimming their equity exposure. The Flex portfolio reduced equity allocations by 6.5 percentage points from levels at the end of January 2021.
Global equity markets advanced at a steady clip in March, as measured by the MSCI All Country World Index, but stocks also saw pressure from a Covid-19 resurgence in Europe and Asia as vaccinations hit some snags. In the United States, the S&P 500 Index closed in on an all-time record high of 4000, soaring on the tailwinds of strong fiscal and monetary stimulus, faster-than-expected vaccination rollouts, a robust outlook for the U.S. economy, and pent-up consumer demand. Since hitting a pandemic low during the same month a year ago, the index has climbed 78%. In March, U.S. stocks saw a rotation in leadership, with “Big Tech” taking a breather and value stocks surging by 6% after being in the doldrums for years. Mid-cap names trounced large-cap names, but small-cap stocks settled down after being on a tear since the start of 2021. The Fed vowed to stay dovish on monetary policy through at least 2023, nevertheless concerns about inflation and attendant interest rate hikes buoyed yields on the 10-yr U.S. Treasury to 1.74%—the highest since January 2020. Volatility rose in early March before tapering off, and the TOPS Managed Risk Portfolios adjusted by trimming their equity exposure. The Flex portfolio lowered the equity allocations to a target of 45.96 at the end of the month.
International equity markets mirrored the bullish sentiment in the United States during April, as stocks around the globe continued to hit new highs. The MSCI All Country World Index rose by 4.2% in April, the third consecutive month of gains. U.S. equities set record highs as well across the board among the major indices. But from there, the macroeconomic picture diverges for developed countries. The 19-nation Eurozone reported a decline in GDP for first quarter, its second quarterly drop, and technically entered a recession due to renewed COVID-related lockdowns. In contrast, the U.S. economy, spurred by consumer spending, grew by a robust 6.4% during first quarter. The 10-year U.S. Treasury yield pulled back from its March high to end April at 1.65%, notwithstanding inflation’s uptick to 2.6% in March, its highest level since mid-2018. Equity market volatility declined through most of April, finishing near 14-month lows. The TOPS Managed Risk portfolios adjusted by raising their net equity exposure: the Flex Portfolio upped equity allocations to 55.80 percentage points and spent most of the month at their respective maximum equity allocations.
International stocks outpaced U.S. equities in May as economic recovery in the European Union and other developed nations offset headwinds from emerging countries still grappling to get Covid-19 under control. The MSCI All Country World Index rose by 1.33% in May while the S&P 500 Index was up a meager 0.55% and the Nasdaq actually declined by 1.26%. U.S. stocks hit an all-time high in early May, but days later sold off after April’s inflation number came in at a higher-than-expected 4.2%—its highest level since 2008. Energy prices jumped 25% from a year earlier and other prices advanced as well. U.S. manufacturing activity picked up, but shortages are being reported in labor and materials. Volatility increased during the selloff but leveled off as the market found firmer footing in the second half of May. The low market volatility at the end of April meant that the equity allocations for TOPS Managed Risk Portfolios were all at their respective maximums heading into May. As volatility increased in the middle of the month, the Growth portfolio reduced its equity allocation by about seven percentage points before reverting to its maximum allocation by month end. The Flex portfolio maintained maximum equity allocations for the duration of the month.
Heading into the summer doldrums, international and U.S. equities ended the month of June mostly in positive territory, led by a 5.55% total return in the Nasdaq Composite. The MSCI All Country World Index rose 1.35% month-over-month, while a rally in tech stocks drove the S&P 500 Index and Nasdaq to all-time highs. The Fed kept interest rates unchanged and communicated that rising inflation was notable but transitory since much of the overshoot is from categories directly affected by the reopening of the economy. Nevertheless, the FOMC adjusted its expectation for the timing of interest rate increases to one year earlier than the expectation conveyed at the FOMC’s previous meeting. This sparked an equity market pullback, but it proved to be short lived as inflation fears subsided and stocks quickly recovered. After falling to its year-to-date low during the first half of the month, equity market realized volatility edged moderately higher and then leveled off; and the VIX finished the month at 15.8, its lowest level since February 2020. Amid such low volatility, the Managed Risk Portfolios all maintained their maximum equity exposure for the duration of the month.
The year-to-date divergence between global and U.S. equity performance widened in July, with the MSCI All Country World Index rising just 59 basis points while the S&P 500 Index hit yet another all-time high, up 2.27%—its sixth straight month of gains. Outside the United States, international stocks faltered, down 1.79%, as Chinese stocks suffered their worst decline in years after the government cracked down on technology and private-tutoring companies. The market corrected by approximately 2% mid-month due to concerns about the COVID Delta variant and inflation—the June CPI was up 5.4% year-over-year—but it bounced back quickly, helped by a slew of Wall Street-beating corporate earnings reports. The Fed kept interest rates unchanged and remained convinced inflation hikes were transitory, with talk of tapering still a nonstarter. More fiscal stimulus was in the works, with the U.S. Senate reaching a bipartisan agreement with the White House on the $1 trillion infrastructure bill. The 10-year U.S. Treasury yield fell to 1.23% at month end. The VIX Index touched its year-to-date low (15.1) on July 2 before reverting higher, finishing the month at 18.2. TOPS Managed Risk Flex maintained its maximum equity exposure for the duration of the month.
Geopolitical tensions surrounding the U.S.’s messy withdrawal from Afghanistan and the Fed’s signaling of possible tapering of bond purchases by year’s end were two major factors that could have had an outsized market impact in August. Instead, the market largely shrugged them off, especially after the Fed decoupled tapering from the timing of future rate hikes and indicated ongoing caution surrounding COVID-19. The S&P 500 and Nasdaq hit fresh records, up 2.9% and 4.0% in August, respectively. The 10-year U.S. Treasury yield was up 6 basis points over the month, to 1.30%. Inflation, a bugaboo of recent months, became less of a worry after the Fed reiterated its view that it is transitory. At the Fed’s annual Jackson Hole summit, Chairman Powell said a shift in spending toward durable goods amid supply shortages was a “principal” factor for higher inflation, but that some prices had begun to fall. July’s CPI was up 5.4% over 12 months, just as it was in June (the highest in 13 years). U.S. equities continued to outpace international stocks, with the MSCI All Country World Index (excluding the U.S.) rising just 1.7% as Chinese tech stocks swooned under stricter regulations. Volatility jumped midmonth to 21.7 on the VIX as Afghanistan tensions escalated, but fell back down to 16.5 at month’s end after Jackson Hole. The TOPS Managed Risk Flex Portfolios maintained its maximum equity exposure for the duration of the month.
U.S. equities ended September in the red after seven months of gains, as the Fed shifted to a more hawkish stance and Congress squabbled over the $3.5 trillion budget and debt ceiling. Meanwhile, China’s Evergrande debt woes weighed on international equities to round out the month in a global sell-off. The S&P 500 fell 4.76%, its first monthly decline since January, while the tech-heavy Nasdaq gave up 5.69% and the Russell 2000 declined by 3.05%. The MSCI All Country World Index Ex-U.S. fell less precipitously, by 3.48%. The Fed signaled that tapering could start in November and a rate “liftoff” could come as early as late 2022. Inflation remained elevated (5.2% in August, 5.4% in July) and the labor market continued to recover amid robust economic growth. The Fed said real gross domestic product (GDP) rose 6.4% in the first half of 2021 and “strong” growth was expected in the second half. On those prospects, the 10-Year Treasury yield climbed 22 basis points to 1.52% over the month. Equity market volatility jumped nearly 7 points to 23.1 but remained well below its 2021 high of 37 in January. The TOPS Managed Risk Flex Portfolio maintained its maximum equity exposures for the duration.
The U.S. equity market roared to new heights in October as a better-than-expected third quarter earnings season demonstrated the resilience of businesses despite supply chain constraints, elevated inflation, a chip shortage, oil prices hitting multi-year highs, and a tight labor market. The S&P 500 Index rose 7% on a total return basis, to hit 4,600 for the first time, while the Nasdaq and Dow also reached new highs (up 7.3% and 5.93%, respectively). The Russell 2000 Index rebounded by 4.25% to close in on the all-time high it reached in March 2021. International equities reflected the boomerang rebound of U.S. equities, reversing September’s losses to rise 2.4% in October as measured by the MSCI All Country World Index ex-U.S. The recovery from September’s equity market decline occurred even as economic headwinds gathered, with third quarter U.S. gross domestic product (GDP) growth moderating to 2%. The 10-Year U.S. Treasury yield ended October at 1.56%. Volatility, as measured by the VIX, hit its year-to-date low at 15.0 before finishing the month at 16.26. The Flex portfolio maintained its maximum equity allocations throughout the entire month.
U.S. equities broadly tumbled in November as the triple whammy of the Fed’s decision to accelerate tapering of bond purchases, renewed inflation concerns, and uncertainty about the Omicron variant weighed on investors who were already skittish about a richly valued market. Meanwhile, U.S. economic growth slowed sharply during third quarter. GDP rose 2.1% on an annualized basis versus 6.3% during first quarter and 6.7% during second quarter. However, the labor market remained tight, with the jobless rate falling to 4.6% in October—the lowest since March 2020. After the Fed’s hawkish shift foreshadowing an accelerated interest rate hike, the S&P 500 Index fell by 0.7% on a total return basis. The Dow gave up 3.5% and the Russell 2000 Index declined by 4.2%. Nasdaq bucked the trend, up 0.34%, with shares of its 100 largest companies rising 1.88%. International equities ended the month in the red, weighed down by the new COVID variant. The MSCI All Country World ex U.S. Index fell by 4.49%, with both developed countries and emerging markets reflecting similar declines. In the United States, growth stocks were up 1.42% (S&P 500 Growth Index), but value stocks (S&P 500 Value Index) fell 3.26%. The 10-year U.S. Treasury yield fell 11 basis points (bps) to 1.45% as economic clouds gathered. Volatility as measured by the VIX rose 11 points to 27.19 in the month. The TOPS Managed Risk Flex portfolio maintained its maximum equity allocations for the month.
December saw the Fed shifting to a hawkish monetary policy for the first time since 2018, with the central bank stepping up its taper timeline and indicating that rate hikes will come sooner than indicated in its projections from a year earlier. U.S. equities whipsawed to digest the change, ending the month in the black as the market interpreted the Powell Pivot as anti-inflationary but not quite an economic dampener. The S&P 500 rose 4.5%, Dow was up 5.5%, and Nasdaq eked out a 0.75% gain while the index representing its 100 largest members rose 1.2%. Midcaps trounced small caps (S&P 400 was +5.1% vs. Russell 2000 at +2.2%) and value outpaced growth (S&P 500 Value was +7.0% vs. S&P 500 Growth at +2.5%). Globally, the All Country World Index ex-U.S. largely kept pace at +4.1%. Overall, equity markets signaled more caution but not outright bearishness, with central bank tightening as the biggest tail risk despite Omicron worries. In the month, global monetary policy diverged from the U.S. with the Bank of England raising rates but the ECB and Bank of Japan remaining more accommodative. The U.S. 10-year Treasury yield ended the year at 1.51%, up 6 bps in the month and 59 bps for the year. The VIX started the month at an 11-month high of 31 but gradually trended lower to finish the month at 17.2. With volatility declining into month-end, TOPS Managed Risk Flex Portfolio maintained its maximum equity threshold through year end.
The MSCI EAFE® Index is a free float-adjusted market capitalization index that is designed to measure the equity market performance of developed markets, excluding the US & Canada. As of June 2007 the MSCI EAFE Index consisted of the following 21 developed market country indices: Australia, Austria, Belgium, Denmark, Finland, France, Germany, Greece, Hong Kong, Ireland, Italy, Japan, the Netherlands, New Zealand, Norway, Portugal, Singapore, Spain, Sweden, Switzerland, and the United Kingdom.
The MSCI Emerging Markets Index is a free float-adjusted, market capitalization-weighted index designed to measure the combined equity market performance of the materials sector of emerging markets countries. Component securities include those of chemical companies, construction materials companies, containers and packaging companies, metals and mining companies, and paper and forest products companies.
The S&P 500® Index is an unmanaged composite of 500 large capitalization companies. This index is widely used by professional investors as a performance benchmark for large-cap stocks.
The S&P Growth Index represents the growth companies of the S&P 500 Index.
The S&P MidCap 400® measures the mid-cap segment of the U.S.equity market. The index is designed to be an investable portfolio of companies that meet specific inclusion criteria to ensure that they are liquid and financially viable.
The S&P SmallCap 600® measures the small cap segment of the U.S. equity market. The index is designed to be an investable portfolio of companies that meet specific inclusion criteria to ensure that they are liquid and financially viable.
The Bloomberg U.S. Aggregate Bond Index is weighted according to market capitalization, which means the securities represented in the index are weighted according to the market size of the bond category. Treasury securities, mortgage-backed securities (“MBS”) foreign bonds, government agency bonds and corporate bonds are some of the categories included in the index. The bonds represented are medium term with an average maturity of about 4.57 years. In all, the index represents about 8,200 fixed-income securities with a total value of approximately $15 trillion (about 43% of the total U.S. bond market).
The Bloomberg U.S. Treasury Inflation Protected Securities Index (“TIPS”) Index includes all publicly issued, U.S. Treasury inflation-protected securities that have at least one year remaining to maturity, are rated investment grade, and have $250 million or more of outstanding face value.
You cannot invest directly in an index and unmanaged index returns do not reflect any fees, expenses or sales charges. Past Performance is no guarantee of future results. Past performance does not guarantee future results, and current performance may be lower or higher than the data quoted.
5161-NLD-01242022
TOPS® Managed Risk Flex ETF Portfolio
Portfolio Review (Unaudited)
December 31, 2021
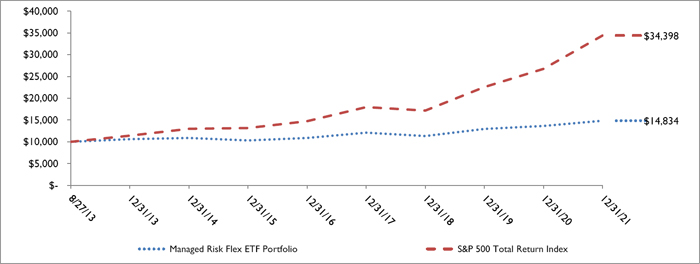
The Portfolio’s Average Annual Total Return through December 31, 2021*, as compared to its benchmark:
| | | | Performance Since |
| | One Year | Five Year | Inception (8/27/13) |
| TOPS Managed Risk Flex ETF Portfolio | 8.79% | 6.40% | 4.84% |
| S&P 500 Total Return Index** | 28.71% | 18.47% | 15.96% |
| * | The performance data quoted is historical. Past performance is no guarantee of future results. Current performance may be higher or lower than the performance data quoted. The principal value and investment return of an investment will fluctuate so that your shares, when redeemed, may be worth more or less than their original cost. The returns shown do not reflect the deduction of taxes that a shareholder would pay on Portfolio distributions or on the redemption of Portfolio shares as well as other charges and expenses of the insurance contract, or separate account. Per the fee table in the most recent prospectus, the Portfolio’s total annual operating expense ratios including acquired fund fees and expenses is 0.96%. For performance information current to the most recent month-end, please call 1-855-572-5945. |
| ** | The S&P 500 Total Return Index is an unmanaged market capitalization-weighted index of 500 of the largest capitalized U.S. domiciled companies. Index returns assume reinvestment of dividends. Investors may not invest in the index directly; unlike the Portfolio’s returns, the Index does not reflect any fees or expenses. |
Comparison of the Change in Value of a $10,000 Investment
| Holdings by Asset Class as of December 31, 2021 | | % of Net Assets | |
| Exchange-Traded Funds - Equity | | | 49.4 | % |
| Exchange-Traded Funds - Fixed Income | | | 38.7 | % |
| Other Assets and Liabilities - net/Short-Term Investments | | | 11.9 | % |
| | | | 100.0 | % |
Please refer to the Schedule of Investments in this annual report for a detailed listing of the Portfolio’s holdings.
| TOPS® Managed Risk Flex ETF Portfolio |
| Schedule of Investments |
| December 31, 2021 |
| Shares | | | | | Fair Value | |
| | | | | EXCHANGE-TRADED FUNDS — 88.1% | | | | |
| | | | | EQUITY - 49.4% | | | | |
| | 111,840 | | | FlexShares Global Upstream Natural Resources Index Fund | | $ | 4,416,562 | |
| | 177,141 | | | SPDR Portfolio S&P 400 Mid Cap ETF | | | 8,810,993 | |
| | 40,669 | | | SPDR Portfolio S&P 500 Growth ETF | | | 2,947,282 | |
| | 209,913 | | | SPDR Portfolio S&P 500 Value ETF | | | 8,816,346 | |
| | 163,750 | | | SPDR Portfolio S&P 600 Small Cap ETF | | | 7,317,987 | |
| | 258,446 | | | Vanguard FTSE Developed Markets ETF | | | 13,196,253 | |
| | 120,120 | | | Vanguard FTSE Emerging Markets ETF | | | 5,941,135 | |
| | 81,916 | | | Vanguard Global ex-U.S. Real Estate ETF | | | 4,419,368 | |
| | 38,311 | | | Vanguard Real Estate ETF | | | 4,444,459 | |
| | 40,345 | | | Vanguard S&P 500 ETF | | | 17,613,417 | |
| | 80,460 | | | Wisdomtree Emerging Markets EX-State-Owned Enterprises Fund | | | 2,964,951 | |
| | | | | | | | 80,888,753 | |
| | | | | FIXED INCOME - 38.7% | | | | |
| | 77,879 | | | iShares iBoxx $ Investment Grade Corporate Bond ETF(a) | | | 10,320,525 | |
| | 144,146 | | | SPDR Bloomberg Investment Grade Floating Rate ETF(a) | | | 4,409,426 | |
| | 285,124 | | | SPDR Portfolio Short Term Corporate Bond ETF | | | 8,830,290 | |
| | 154,813 | | | VanEck Vectors J.P. Morgan EM Local Currency Bond ETF | | | 4,427,652 | |
| | 44,298 | | | Vanguard Intermediate-Term Treasury ETF | | | 2,944,488 | |
| | 55,762 | | | Vanguard Mortgage-Backed Securities ETF | | | 2,946,464 | |
| | 286,419 | | | Vanguard Short-Term Inflation-Protected Securities ETF | | | 14,721,937 | |
| | 120,969 | | | Vanguard Short-Term Treasury ETF | | | 7,358,544 | |
| | 26,686 | | | Vanguard Total International Bond Index Fund(a) | | | 1,472,000 | |
| | 146,687 | | | Xtrackers USD High Yield Corporate Bond ETF(a) | | | 5,844,010 | |
| | | | | | | | 63,275,336 | |
| | | | | | | | | |
| | | | | TOTAL EXCHANGE-TRADED FUNDS (Cost $113,903,933) | | | 144,164,089 | |
| | | | | | | | | |
| Shares | | | | | | Fair Value | |
| | | | | SHORT-TERM INVESTMENTS — 18.5% | | | | |
| | | | | COLLATERAL FOR SECURITIES LOANED - 6.8% | | | | |
| | 11,076,460 | | | STIT - Government & Agency Portfolio, Institutional Class, 0.03% (Cost $11,076,460)(b) | | | 11,076,460 | |
See accompanying notes to financial statements.
| TOPS® Managed Risk Flex ETF Portfolio |
| Schedule of Investments (Continued) |
| December 31, 2021 |
| Shares | | | | | Fair Value | |
| | | | | SHORT-TERM INVESTMENTS — 18.5% (Continued) | | | | |
| | | | | MONEY MARKET FUNDS - 11.7% | | | | |
| | 19,188,273 | | | STIT - Government & Agency Portfolio, Institutional Class, 0.03% (Cost $19,188,273)(b) | | $ | 19,188,273 | |
| | | | | | | | | |
| | | | | TOTAL SHORT-TERM INVESTMENTS (Cost $30,264,733) | | | 30,264,733 | |
| | | | | | | | | |
| | | | | TOTAL INVESTMENTS - 106.6% (Cost $144,168,666) | | $ | 174,428,822 | |
| | | | | LIABILITIES IN EXCESS OF OTHER ASSETS - (6.6)% | | | (10,855,611 | ) |
| | | | | NET ASSETS - 100.0% | | $ | 163,573,211 | |
| OPEN FUTURES CONTRACTS | |
| Number of | | | | | | | | | Notional | | | Unrealized Appreciation | |
| Contracts | | | Open Long Futures Contracts | | Broker | | Expiration | | Amount(c) | | | (Depreciation) | |
| | 67 | | | CBOT 5 Year US Treasury Note | | Bank of America Merrill Lynch | | 03/31/2022 | | $ | 8,105,459 | | | $ | (7,041 | ) |
| | 7 | | | CME E-Mini Russell 2000 Index Futures | | Bank of America Merrill Lynch | | 03/18/2022 | | | 784,980 | | | | (2,635 | ) |
| | 14 | | | CME E-Mini Standard & Poor’s 500 Index Futures | | Bank of America Merrill Lynch | | 03/18/2022 | | | 3,330,950 | | | | (12,775 | ) |
| | 4 | | | CME E-Mini Standard & Poor’s MidCap 400 Index Futures | | Bank of America Merrill Lynch | | 03/18/2022 | | | 1,135,080 | | | | 4,620 | |
| | 15 | | | ICE US Mini MSCI EAFE Index Futures | | Bank of America Merrill Lynch | | 03/18/2022 | | | 1,741,350 | | | | (7,950 | ) |
| | 24 | | | ICE US MSCI Emerging Markets EM Index Futures | | Bank of America Merrill Lynch | | 03/18/2022 | | | 1,471,560 | | | | 2,115 | |
| | | | | TOTAL FUTURES CONTRACTS | | | | | | | | | | $ | (23,666 | ) |
| ETF | - Exchange-Traded Fund |
| SPDR | - Standard & Poor’s Depositary Receipt |
| (a) | All or a portion of this security is on loan. Total loaned securities had a value of $11,212,500 at December 31, 2021. The loaned securities were secured with cash collateral of $11,076,460 and non-cash collateral of $381,216. The non-cash collateral consists of short-term investments and long-term bonds and is held for benefit of the Portfolio at the Portfolio’s custodian. The Portfolio cannot pledge or resell the collateral. |
| (b) | Rate disclosed is the seven day effective yield as of December 31, 2021. |
| (c) | The amounts shown are the underlying reference notional amounts to stock exchange indices and equities upon which the fair value of the futures contracts held by the Portfolio are based. Notional values do not represent the current fair value of, and are not necessarily indicative of the future cash flows of the Portfolio’s futures contracts. Further, the underlying price changes in relation to the variables specified by the notional values affects the fair value of these derivative financial instruments. The notional values as set forth within this schedule do not purport to represent economic value at risk to the Portfolio. |
See accompanying notes to financial statements.
| TOPS® Managed Risk Flex ETF Portfolio |
| Statement of Assets and Liabilities |
| December 31, 2021 |
| Assets: | | | |
| Investments in securities, at cost | | $ | 144,168,666 | |
| Investments in securities, at value (Securities on loan $11,212,500) | | $ | 174,428,822 | |
| Cash | | | 145,794 | |
| Deposits with Broker | | | 579,992 | |
| Receivable for securities sold | | | 915,476 | |
| Receivable for Portfolio shares sold | | | 120,665 | |
| Unrealized appreciation on futures contracts | | | 6,735 | |
| Interest and dividends receivable | | | 394 | |
| Total Assets | | | 176,197,878 | |
| Liabilities: | | | | |
| Collateral on securities loaned | | | 11,076,460 | |
| Payable for Portfolio shares redeemed | | | 5,863 | |
| Payable for securities purchased | | | 1,393,551 | |
| Unrealized depreciation on futures contracts | | | 30,401 | |
| Accrued distribution (12b-1) fees | | | 61,138 | |
| Accrued investment advisory fees | | | 42,130 | |
| Payable to related parties and administrative service fees | | | 15,124 | |
| Total Liabilities | | | 12,624,667 | |
| Net Assets | | $ | 163,573,211 | |
| | | | | |
| Net Assets Consist Of: | | | | |
| Paid in capital | | $ | 133,714,993 | |
| Accumulated earnings | | | 29,858,218 | |
| Net Assets | | $ | 163,573,211 | |
| Total shares of beneficial interest outstanding ($0 par value, unlimited shares authorized) | | | 12,321,544 | |
| | | | | |
| Net asset value, offering and redemption price per share (Net assets ÷ Total shares of beneficial interest outstanding) | | $ | 13.28 | |
See accompanying notes to financial statements.
| TOPS® Managed Risk Flex ETF Portfolio |
| Statement of Operations |
| For the Year Ended December 31, 2021 |
| Investment Income: | | | |
| Dividend income | | $ | 3,281,209 | |
| Interest income | | | 3,811 | |
| Securities lending income | | | 67,446 | |
| Total Investment Income | | | 3,352,466 | |
| Expenses: | | | | |
| Investment advisory fees | | | 478,226 | |
| Distribution fees (12b-1) | | | 717,340 | |
| Related parties and administrative service fees | | | 170,013 | |
| Total Expenses | | | 1,365,579 | |
| Net Investment Income | | | 1,986,887 | |
| | | | | |
| Realized and Unrealized Gain (Loss) on Investments and Futures Contracts: | | | | |
| Net realized gain (loss) on: | | | | |
| Investments | | | 5,340,925 | |
| Futures contracts | | | (391,814 | ) |
| Distributions of realized gains by underlying investment companies | | | 43,997 | |
| Total net realized gain | | | 4,993,108 | |
| Net change in unrealized appreciation (depreciation) on: | | | | |
| Investments | | | 6,582,888 | |
| Futures contracts | | | (251,677 | ) |
| Total unrealized appreciation | | | 6,331,211 | |
| Net Realized and Unrealized Gain on Investments and Futures Contracts | | | 11,324,319 | |
| | | | | |
| Net Increase in Net Assets Resulting from Operations | | $ | 13,311,206 | |
See accompanying notes to financial statements.
| TOPS® Managed Risk Flex ETF Portfolio |
| Statements of Changes in Net Assets |
| | | Year Ended | | | Year Ended | |
| | | December 31, 2021 | | | December 31, 2020 | |
| Increase (Decrease) in Net Assets: | | | | | | | | |
| From Operations: | | | | | | | | |
| Net investment income | | $ | 1,986,887 | | | $ | 1,334,750 | |
| Net realized gain (loss) on investments and futures contracts | | | 4,949,111 | | | | (6,880,642 | ) |
| Distributions of realized gains by underlying investment companies | | | 43,997 | | | | — | |
| Net change in unrealized appreciation on investments and futures contracts | | | 6,331,211 | | | | 13,009,369 | |
| Net increase in net assets resulting from operations | | | 13,311,206 | | | | 7,463,477 | |
| From Distributions to Shareholders: | | | | | | | | |
| Total distributions paid | | | (1,333,792 | ) | | | (3,251,668 | ) |
| Total distributions to shareholders | | | (1,333,792 | ) | | | (3,251,668 | ) |
| From Shares of Beneficial Interest: | | | | | | | | |
| Proceeds from shares sold | | | 8,449,558 | | | | 4,127,998 | |
| Reinvestment of distributions | | | 1,333,792 | | | | 3,251,668 | |
| Cost of shares redeemed | | | (11,871,529 | ) | | | (10,267,253 | ) |
| Net decrease in net assets from share transactions of beneficial interest | | | (2,088,179 | ) | | | (2,887,587 | ) |
| Total Increase In Net Assets | | | 9,889,235 | | | | 1,324,222 | |
| | | | | | | | | |
| Net Assets: | | | | | | | | |
| Beginning of year | | | 153,683,976 | | | | 152,359,754 | |
| End of year | | $ | 163,573,211 | | | $ | 153,683,976 | |
| | | | | | | | | |
| SHARE ACTIVITY | | | | | | | | |
| Shares sold | | | 650,561 | | | | 360,359 | |
| Shares reinvested | | | 102,757 | | | | 287,758 | |
| Shares redeemed | | | (917,771 | ) | | | (885,181 | ) |
| Net decrease in shares of beneficial interest outstanding | | | (164,453 | ) | | | (237,064 | ) |
See accompanying notes to financial statements.
| TOPS® Managed Risk Flex ETF Portfolio |
| Financial Highlights |
Selected data based on a share outstanding throughout each year indicated.
| | | Year Ended | | | Year Ended | | | Year Ended | | | Year Ended | | | Year Ended | |
| | | December 31, 2021 | | | December 31, 2020 | | | December 31, 2019 | | | December 31, 2018 | | | December 31, 2017 | |
| | | | | | | | | | | | | | | | |
| Net asset value, beginning of year | | $ | 12.31 | | | $ | 11.98 | | | $ | 10.83 | | | $ | 11.78 | | | $ | 10.70 | |
| Income (loss) from investment operations: | | | | | | | | | | | | | | | | | | | | |
| Net investment income (a)(b) | | | 0.16 | | | | 0.11 | | | | 0.21 | | | | 0.20 | | | | 0.16 | |
| Net realized and unrealized gain (loss) on investments and futures contracts | | | 0.92 | | | | 0.48 | | | | 1.34 | | | | (0.95 | ) | | | 1.04 | |
| Total income (loss) from investment operations | | | 1.08 | | | | 0.59 | | | | 1.55 | | | | (0.75 | ) | | | 1.20 | |
| Less distributions from: | | | | | | | | | | | | | | | | | | | | |
| Net investment income | | | (0.11 | ) | | | (0.21 | ) | | | (0.19 | ) | | | (0.14 | ) | | | (0.12 | ) |
| Net realized gain | | | — | | | | (0.05 | ) | | | (0.21 | ) | | | (0.06 | ) | | | — | |
| Total distributions | | | (0.11 | ) | | | (0.26 | ) | | | (0.40 | ) | | | (0.20 | ) | | | (0.12 | ) |
| Net asset value, end of year | | $ | 13.28 | | | $ | 12.31 | | | $ | 11.98 | | | $ | 10.83 | | | $ | 11.78 | |
| Total return (c) | | | 8.79 | % | | | 5.15 | % | | | 14.57 | % | | | (6.45 | )% | | | 11.24 | % |
| Ratios and Supplemental Data: | | | | | | | | | | | | | | | | | | | | |
| Net assets, end of year (in 000’s) | | $ | 163,573 | | | $ | 153,684 | | | $ | 152,360 | | | $ | 127,691 | | | $ | 127,621 | |
| Ratio of expenses to average net assets (d) | | | 0.86 | % | | | 0.86 | % | | | 0.86 | % | | | 0.85 | % | | | 0.85 | % |
| Ratio of net investment income to average net assets (b)(d) | | | 1.25 | % | | | 0.92 | % | | | 1.84 | % | | | 1.76 | % | | | 1.45 | % |
| Portfolio turnover rate | | | 11 | % | | | 30 | % | | | 40 | % | | | 44 | % | | | 30 | % |
| | | | | | | | | | | | | | | | | | | | | |
| (a) | Net investment income has been calculated using the average shares method, which more appropriately presents the per share data for the period. |
| (b) | Recognition of net investment income by the Portfolio is affected by the timing of the declaration of dividends by the underlying investment companies in which the Portfolio invests. |
| (c) | Total returns are historical and assume changes in share price and reinvestment of dividends and capital gains distributions, if any. Total returns for periods of less than one year are not annualized. |
| (d) | Does not include the expenses of the underlying investment companies in which the Portfolio invests. |
See accompanying notes to financial statements.
| TOPS® Managed Risk Flex ETF Portfolio |
| Notes to Financial Statements |
| December 31, 2021 |
The TOPS® Managed Risk Flex ETF Portfolio (the “Portfolio”) is a diversified series of shares of beneficial interest of Northern Lights Variable Trust (the “Trust”), a statutory trust organized on November 2, 2005 under the laws of the State of Delaware and registered under the Investment Company Act of 1940, as amended (the “1940 Act”), as an open-end management investment company. The Portfolio is intended to be a funding vehicle for variable annuity contracts and flexible premium variable life insurance policies offered by the separate accounts of various insurance companies. The assets of the Portfolio are segregated and a shareholder’s interest is limited to the Portfolio in which shares are held. The Portfolio pays its own expenses. The Portfolio seeks to provide income and capital appreciation with less volatility than the fixed income and equity markets as a whole. The Portfolio commenced operations on August 27, 2013.
| 2. | SIGNIFICANT ACCOUNTING POLICIES |
The following is a summary of significant accounting policies followed by the Portfolio in the preparation of its financial statements. These policies are in conformity with accounting principles generally accepted in the United States of America (“GAAP”). The preparation of financial statements in conformity with GAAP requires management to make estimates and assumptions that affect the reported amounts of assets, liabilities and disclosure of contingent assets and liabilities at the date of the financial statements and the reported amounts of increases and decreases in net assets from operations during the reporting period. Actual results could differ from those estimates. The Portfolio is an investment company and accordingly follows the investment company accounting and reporting guidance of the Financial Accounting Standards Board (“FASB”) Accounting Standards Codification Topic 946 “Financial Services – Investment Companies”, including Accounting Standards Update 2013-08.
Securities Valuation – Securities listed on an exchange are valued at the last reported sale price at the close of the regular trading session of the primary exchange on the business day the value is being determined, or in the case of securities listed on NASDAQ at the NASDAQ Official Closing Price (“NOCP”). In the absence of a sale, such securities shall be valued at the mean between the current bid and ask prices on the primary exchange on the day of valuation. The independent pricing service does not distinguish between smaller-sized bond positions known as “odd lots” and larger institutional-sized bond positions known as “round lots”. The Portfolio may fair value a particular bond if the advisor does not believe that the round lot value provided by the independent pricing service reflects fair value of the Portfolio’s holding. Short-term debt obligations having 60 days or less remaining until maturity, at time of purchase, may be valued at amortized cost. Futures and future options are valued at the final settled price or, in the absence of a settled price, at the last sale price on the day of valuation.
Valuation of Fund of Funds – The Portfolio may invest in portfolios of open-end investment companies. Open-end investment companies are valued at their respective net asset values as reported by such investment companies. Open-end investment companies value securities in their portfolios for which market quotations are readily available at their market values (generally the last reported sale price) and all other securities and assets at their fair value based on the methods established by the boards of directors or trustees of the open-end investment companies.
The Portfolio may hold securities, such as private investments, interests in commodity pools, other non-traded securities or temporarily illiquid securities, for which market quotations are not readily available or are determined to be unreliable. These securities will be valued using the “fair value” procedures approved by the Trust’s Board of Trustees (the “Board”). The Board has delegated execution of these procedures to a fair value committee composed of one or more representatives from each of the (i) Trust, (ii) administrator, and (iii) advisor and/or sub-advisor. The committee may also enlist third party consultants such as a valuation specialist at a public accounting firm, valuation consultant or financial officer of a security issuer on an as-needed basis to assist in determining a security-specific fair value. The Board reviews and ratifies the execution of this process and the resultant fair value prices at least quarterly to assure the process produces reliable results.
| TOPS® Managed Risk Flex ETF Portfolio |
| Notes to Financial Statements (Continued) |
| December 31, 2021 |
Fair Valuation Process – As noted above, the fair value committee is composed of one or more representatives from each of the (i) Trust, (ii) administrator, and (iii) advisor and/or sub-advisor. The applicable investments are valued collectively via inputs from each of these groups. For example, fair value determinations are required for the following securities: (i) securities for which market quotations are insufficient or not readily available on a particular business day (including securities for which there is a short and temporary lapse in the provision of a price by the regular pricing source); (ii) securities for which, in the judgment of the advisor or sub-advisor, the prices or values available do not represent the fair value of the instrument. Factors which may cause the advisor or sub-advisor to make such a judgment include, but are not limited to, the following: only a bid price or an ask price is available; the spread between bid and ask prices is substantial; the frequency of sales; the thinness of the market; the size of reported trades; and actions of the securities markets, such as the suspension or limitation of trading; (iii) securities determined to be illiquid; (iv) securities with respect to which an event that will affect the value thereof has occurred (a “significant event”) since the closing prices were established on the principal exchange on which they are traded, but prior to the Portfolio’s calculation of its net asset value. Specifically, interests in commodity pools or managed futures pools are valued on a daily basis by reference to the closing market prices of each futures contract or other asset held by a pool, as adjusted for pool expenses.
Restricted or illiquid securities, such as private investments or non-traded securities are valued via inputs from the advisor or sub-advisor based upon the current bid for the security from two or more independent dealers or other parties reasonably familiar with the facts and circumstances of the security (who should take into consideration all relevant factors as may be appropriate under the circumstances). If the advisor or sub-advisor is unable to obtain a current bid from such independent dealers or other independent parties, the fair value committee shall determine the fair value of such security using the following factors: (i) the type of security; (ii) the cost at date of purchase; (iii) the size and nature of the Portfolio’s holdings; (iv) the discount from market value of unrestricted securities of the same class at the time of purchase and subsequent thereto; (v) information as to any transactions or offers with respect to the security; (vi) the nature and duration of restrictions on disposition of the security and the existence of any registration rights; (vii) how the yield of the security compares to similar securities of companies of similar or equal creditworthiness; (viii) the level of recent trades of similar or comparable securities; (ix) the liquidity characteristics of the security; (x) current market conditions; and (xi) the market value of any securities into which the security is convertible or exchangeable.
The Portfolio utilizes various methods to measure the fair value of all of its investments on a recurring basis. GAAP establishes a hierarchy that prioritizes inputs to valuation methods. The three levels of input are:
Level 1 – Unadjusted quoted prices in active markets for identical assets and liabilities that the Portfolio has the ability to access.
Level 2 – Observable inputs other than quoted prices included in Level 1 that are observable for the asset or liability, either directly or indirectly. These inputs may include quoted prices for the identical instrument in an inactive market, prices for similar instruments, interest rates, prepayment speeds, credit risk, yield curves, default rates and similar data.
Level 3 – Unobservable inputs for the asset or liability, to the extent relevant observable inputs are not available, representing the Portfolio’s own assumptions about the assumptions a market participant would use in valuing the asset or liability, and would be based on the best information available.
The availability of observable inputs can vary from security to security and is affected by a wide variety of factors, including, for example, the type of security, whether the security is new and not yet established in the marketplace, the liquidity of markets, and other characteristics particular to the security. To the extent that valuation is based on models or inputs that are less observable or unobservable in the market, the determination of fair value requires more judgment. Accordingly, the degree of judgment exercised in determining fair value is greatest for instruments categorized in Level 3.
The inputs used to measure fair value may fall into different levels of the fair value hierarchy. In such cases, for disclosure purposes, the level in the fair value hierarchy within which the fair value measurement falls in its entirety, is determined based on the lowest level input that is significant to the fair value measurement in its entirety.
| TOPS® Managed Risk Flex ETF Portfolio |
| Notes to Financial Statements (Continued) |
| December 31, 2021 |
The inputs or methodology used for valuing securities are not necessarily an indication of the risk associated with investing in those securities. The following tables summarize the inputs used as of December 31, 2021 for the Portfolio’s investments measured at fair value:
| TOPS® Managed Risk Flex ETF Portfolio | |
| | | | | | | | | | | | | |
| Assets* | | Level 1 | | | Level 2 | | | Level 3 | | | Total | |
| Exchange-Traded Funds | | $ | 144,164,089 | | | $ | — | | | $ | — | | | $ | 144,164,089 | |
| Short-Term Investments | | | 30,264,733 | | | | — | | | | — | | | | 30,264,733 | |
| Derivatives | | | | | | | | | | | | | | | | |
| Futures Contracts ** | | | 6,735 | | | | — | | | | — | | | | 6,735 | |
| Total | | $ | 174,435,557 | | | $ | — | | | $ | — | | | $ | 174,435,557 | |
| | | | | | | | | | | | | | | | | |
| Liabilities | | Level 1 | | | Level 2 | | | Level 3 | | | Total | |
| Futures Contracts ** | | $ | 30,401 | | | $ | — | | | $ | — | | | $ | 30,401 | |
The Portfolio did not hold any Level 2 or 3 securities during the year ended December 31, 2021.
| * | Refer to the Schedule of Investments for security classifications. |
| ** | Cumulative appreciation (depreciation) of futures contracts is reported in the above table. |
Security Transactions and Related Income – Security transactions are accounted for on the trade date. Interest income is recognized on an accrual basis. Discounts are accreted and premiums are amortized on securities purchased over the lives of the respective securities. Dividend income is recorded on the ex-dividend date. Realized gains or losses from sales of securities are determined by comparing the identified cost of the security lot sold with the net sales proceeds.
Dividends and Distributions to Shareholders – Dividends from net investment income and distributions from net realized capital gains if any, are declared and paid annually. Dividends and distributions to shareholders are recorded on the ex-date and are determined in accordance with federal income tax regulations, which may differ from GAAP. These “book/tax” differences are considered either temporary (e.g., deferred losses, capital loss carryforwards) or permanent in nature. To the extent these differences are permanent in nature, such amounts are reclassified within the composition of net assets based on their federal tax-basis treatment; temporary differences do not require reclassification. These reclassifications have no effect on net assets, results from operations or net asset value per share of the Portfolio.
Federal Income Tax – It is the Portfolio’s policy to continue to qualify as a regulated investment company by complying with the provisions of the Internal Revenue Code that are applicable to regulated investment companies and to distribute substantially all of its taxable income and net realized gains to shareholders. Therefore, no federal income tax provision is required.
The Portfolio will recognize the tax benefits of uncertain tax positions only where the position is “more likely than not” to be sustained assuming examination by tax authorities. Management has analyzed the Portfolio’s tax position and has concluded that no liability for unrecognized tax benefits should be recorded related to uncertain tax positions taken on returns filed for open tax years ended or expected to be taken in the Portfolio’s December 31, 2021 year-end tax return. The Portfolio identified its major tax jurisdictions as U.S. federal, Ohio and foreign jurisdictions where the Portfolio makes significant investments. The Portfolio is not aware of any tax positions for which it is reasonably possible that the total amounts of unrecognized tax benefits will change materially in the next twelve months.
| TOPS® Managed Risk Flex ETF Portfolio |
| Notes to Financial Statements (Continued) |
| December 31, 2021 |
Futures Contracts – The Portfolio is subject to equity price risk in the normal course of pursuing its investment objectives. The Portfolio may purchase or sell futures contracts to hedge against market risk and to reduce return volatility. Initial margin deposits required upon entering into futures contracts are satisfied by the segregation of specific securities or cash as collateral for the account of the broker (the Portfolio’s agent in acquiring the futures position). During the period the futures contracts are open, changes in the value of the contracts are recognized as unrealized gains or losses by “marking to market” on a daily basis to reflect the market value of the contracts at the end of each day’s trading. Variation margin payments are received or made depending upon whether unrealized gains or losses are incurred. When the contracts are closed, the Portfolio recognizes a realized gain or loss equal to the difference between the proceeds from, or cost of, the closing transaction and the Portfolio’s basis in the contract. If the Portfolio were unable to liquidate a futures contract and/or enter into an offsetting closing transaction, the Portfolio would continue to be subject to market risk with respect to the value of the contracts and continue to be required to maintain the margin deposits on the futures contracts. The Portfolio segregates liquid securities having a value at least equal to the amount of the current obligation under any open futures contract. Risks may exceed amounts recognized in the Statement of Assets and Liabilities. With futures, there is minimal counterparty credit risk to the Portfolio since futures are exchange traded and the exchange’s clearinghouse, as counterparty to all exchange traded futures, guarantees the futures against default.
For the year ended December 31, 2021, the Portfolio had a net unrealized depreciation from futures contracts subject to interest rate risk and equity price risk of $7,041 and $16,625, respectively, reported in the Statement of Assets and Liabilities. For the year ended December 31, 2021 the Portfolio had a net realized loss from futures contracts subject to interest rate risk and equity price risk of $208,251 and $183,563 reported in the Statement of Operations, respectively. For the year ended December 31, 2021, the Portfolio had a net change in unrealized depreciation from futures contracts subject to interest rate risk and equity price risk of $24,772 and $226,905, respectively.
The notional value of the derivative instruments outstanding as of December 31, 2021 is disclosed in the Schedule of Investments and the amounts of realized and changes in unrealized gains and losses on derivative instruments during the period as disclosed above and in the Statement of Operations serve as indicators of the volume of derivative activity for the Portfolio.
Exchange Traded Funds – The Portfolio may invest in exchange traded funds (“ETFs”). An ETF is a type of open-end fund, however, unlike a mutual fund, its shares are bought and sold on a securities exchange at market price and only certain financial institutions called authorized participants may buy and redeem shares of the ETF at net asset value. ETF shares can trade at either a premium or discount to net asset value. Each ETF like a mutual fund is subject to specific risks depending on the type of strategy (actively managed or passively tracking an index) and the composition of its underlying holdings. Investing in an ETF involves substantially the same risks as investing directly in the ETF’s underlying holdings. ETFs pay fees and incur operating expenses, which reduce the total return earned by the ETFs from their underlying holdings. An ETF may not achieve its investment objective or execute its investment strategy effectively, which may adversely affect the Portfolio’s performance.
Expenses – Expenses of the Trust that are directly identifiable to a specific portfolio are charged to that portfolio. Expenses, which are not readily identifiable to a specific portfolio, are allocated in such a manner as deemed equitable, taking into consideration the nature and type of expense and the relative sizes of the portfolios in the Trust.
Indemnification – The Trust indemnifies its officers and Trustees for certain liabilities that may arise from the performance of their duties to the Trust. Additionally, in the normal course of business, the Portfolio enters into contracts that contain a variety of representations and warranties and which provide general indemnities. The Portfolio’s maximum exposure under these arrangements is unknown, as this would involve future claims that may be made against the Portfolio that have not yet occurred. However, based on experience, the Portfolio expects the risk of loss due to these warranties and indemnities to be remote.
Security Loans – The Portfolio has entered into a securities lending arrangement with Bank of New York (the “Borrower”). Under the terms of the agreement, the Portfolio is authorized to loan securities to the Borrower. In exchange, the Funds receive cash and securities as collateral in the amount of at least 102% of the value of the securities loaned. The cash collateral is invested in short-term instruments as noted in the Schedule of Investments. Securities received as collateral are U.S. government securities; securities received as collateral, if any, are not recognized as portfolios assets. Although risk is mitigated by the collateral, the Portfolio could experience a delay in recovering its securities and possible loss of income or value if the Borrower fails to return them.
| TOPS® Managed Risk Flex ETF Portfolio |
| Notes to Financial Statements (Continued) |
| December 31, 2021 |
Gain or loss in the fair value of securities loaned that may occur during the term of the loan will be for the account of the Portfolio. The Portfolio has the right under the securities lending agreement to recover the securities from the Borrower on demand. If the fair value of the collateral falls below 102% plus accrued interest of the loaned securities, the lender’s agent shall request additional collateral from the Borrower to bring the collateralization back to 102%. Under the terms of the securities lending agreement, the Portfolio is indemnified for such losses by the security lending agreement. Should the Borrower fail financially, the Portfolio has the right to repurchase the securities using the collateral in the open market.
The following table is a summary of the Portfolio’s securities loaned and related collateral which are subject to a netting agreement as of December 31, 2021:
| | | | | | | | | | | | Gross Amounts Not Offset in the Statement of Assets & | |
| | | | | | | | | | | | Liabilities * | |
| | | | | | | | | Net Amounts | | | | | | | | | | |
| | | | | | Gross Amounts | | | of Assets | | | | | | | | | | |
| | | | | | Offset in the | | | Presented in | | | | | | | | | | |
| | | Gross Amounts | | | Statements of | | | the Statements | | | Financial | | | Pledged | | | | |
| | | of Recognized | | | Assets & | | | of Assets & | | | Instruments | | | Collateral | | | Net Amount of | |
| Assets: | | Assets | | | Liabilities | | | Liabilities | | | Pledged | | | Received | | | Assets | |
| Description: | | | | | | | | | | | | | | | | | | | | | | | | |
| Securities Loaned | | $ | 11,212,500 | | | $ | — | | | $ | 11,212,500 | | | $ | 381,216 | | | $ | 10,831,284 | | | $ | — | |
| Total | | $ | 11,212,500 | | | $ | — | | | $ | 11,212,500 | | | $ | 381,216 | | | $ | 10,831,284 | | | $ | — | |
| * | The amount is limited to the securities loaned asset balance and accordingly, does not include excess collateral pledged. |
| Securities Lending Transactions | | | | |
| Overnight and Continuous | | | | |
| STIT - Government & Agency Portfolio, Institutional Class | | $ | 11,076,460 | |
The fair value of the securities loaned for the Portfolio totaled $11,212,500 at December 31, 2021. The securities loaned are noted in the Schedule of Investments. The fair value of the “collateral for securities loaned” on the Schedule of Investments includes only cash collateral received and reinvested that totaled $11,076,460 for the Portfolio at December 31, 2021. This amount is offset by a liability recorded as “Collateral on securities loaned.” At December 31, 2021, the Portfolio received non-cash collateral of $381,216. The non-cash collateral consists of short-term investments and long-term bonds and is held for benefit of the Portfolio at the Portfolio’s custodian. The Portfolio cannot pledge or resell the collateral.
| 3. | INVESTMENT TRANSACTIONS |
For the year ended December 31, 2021, cost of purchases and proceeds from sales of portfolio securities, other than short-term investments and government securities, amounted to $15,360,738 and $18,554,135, respectively.
| 4. | INVESTMENT ADVISORY AGREEMENT AND TRANSACTIONS WITH RELATED PARTIES |
ValMark Advisers, Inc. serves as the Portfolio’s investment advisor (the “Advisor”). The Advisor has engaged Milliman Financial Risk Management, LLC as the Portfolio’s sub-advisor (the “Sub-Advisor”). Pursuant to an advisory agreement with the Trust, the Advisor, on behalf of the Portfolio, under the oversight of the Board, directs the daily investment operations of the Portfolio and supervises the performance of administrative and professional services provided by others. As compensation for its services and the related expenses borne by the Advisor, the Portfolio pays the Advisor a management fee, computed on average daily net assets and accrued daily and paid monthly, at an annual rate of 0.30% of the Portfolio’s average daily net assets. Pursuant to a sub-advisory agreement, the Advisor pays the Sub-Advisor a fee, which is computed and accrued daily and paid monthly. For the year ended December 31, 2021, the Advisor earned $478,226 in advisory fees.
| TOPS® Managed Risk Flex ETF Portfolio |
| Notes to Financial Statements (Continued) |
| December 31, 2021 |
The Board has adopted, on behalf of the Portfolio, a Distribution Plan (the “Plan”) pursuant to Rule 12b-1 under the 1940 Act. The fee is calculated at an annual rate of 0.45% of the average daily net assets attributable to the Portfolio’s shares, and is paid to Northern Lights Distributors, LLC (the “Distributor”) to provide compensation for ongoing shareholder servicing and distribution related activities and/or maintenance of the Portfolio’s shareholder accounts, not otherwise required to be provided by the Advisor. For year ended December 31, 2021, the Portfolio paid $717,340 in distribution fees under the Plan.
In addition, certain affiliates of the Distributor provide services to the Portfolio as follows:
Ultimus Fund Solutions, LLC (“UFS”), an affiliate of the Distributor, provides administration, fund accounting, and transfer agent services to the Trust. Pursuant to the terms of an administrative servicing agreement with UFS, the Portfolio pays to UFS a monthly fee for all operating expenses of the Portfolio, which is calculated by the Portfolio on its average daily net assets. Operating expenses include but are not limited to Fund Accounting, Fund Administration, Transfer Agency, Legal Fees, Audit Fees, Compliance Services, Shareholder Reporting Expenses, Trustees Fees and Custody Fees.
For the year ended December 31, 2021, the Trustees received fees in the amount of $12,558 on behalf of the Portfolio.
The approved entities may be affiliates of UFS and the Distributor. Certain Officers of the Trust are also Officers of UFS, and are not paid any fees directly by the Portfolio for serving in such capacities.
Northern Lights Compliance Services, LLC (“NLCS”), an affiliate of UFS and the Distributor, provides a Chief Compliance Officer to the Trust, as well as related compliance services, pursuant to a consulting agreement between NLCS and the Trust. Under the terms of such agreement, NLCS receives customary fees from UFS under the administrative servicing agreement.
Blu Giant, LLC (“Blu Giant”), an affiliate of UFS and the Distributor, provides EDGAR conversion and filing services as well as print management services for the Portfolio on an ad-hoc basis. For the provision of these services, BluGiant receives customary fees from UFS under the administrative servicing agreement.
The beneficial ownership, either directly or indirectly, of more than 25% of the voting securities of the Portfolio creates presumption of the control of the Portfolio, under Section 2(a)(9) of the 1940 Act. As of December 31, 2021, Minnesota Life Insurance Company held 100% of the voting securities of the Portfolio. The Trust has no knowledge as to whether all or any portion of the shares owned of record are also owned beneficially.
| 6. | DISTRIBUTIONS TO SHAREHOLDERS AND TAX COMPONENTS OF CAPITAL |
Represents aggregate cost for federal tax purposes for the Portfolio as of December 31, 2021 and differs from market value by net unrealized appreciation/depreciation which consisted of:
| | | | Gross | | | Gross | | | | |
| | | | Unrealized | | | Unrealized | | | Total Unrealized | |
| Aggregate Cost | | | Appreciation | | | Depreciation | | | Appreciation | |
| $ | 145,658,188 | | | $ | 31,221,630 | | | $ | (2,450,996 | ) | | $ | 28,770,634 | |
| TOPS® Managed Risk Flex ETF Portfolio |
| Notes to Financial Statements (Continued) |
| December 31, 2021 |
The tax character of the Portfolio’s distribution paid for the years ended December 31, 2021 and December 31, 2020 was as follows:
| | | Fiscal Year Ended | | | Fiscal Year Ended | |
| | | December 31, 2021 | | | December 31, 2020 | |
| Ordinary Income | | $ | 1,457,498 | | | $ | 2,609,040 | |
| Long-Term Capital Gain | | | — | | | | 642,628 | |
| | | $ | 1,457,498 | | | $ | 3,251,668 | |
The difference between ordinary distributions paid from book and ordinary distributions paid from tax relates to allowable foreign tax credits of $123,706 for the fiscal year ended December 31, 2021, which has been passed through to the Portfolio’s underlying shareholders and are deemed dividends for tax purposes.
As of December 31, 2021, the components of accumulated earnings/(deficit) on a tax basis were as follows:
| Undistributed | | | Undistributed | | | Post October Loss | | | Capital Loss | | | Other | | | Unrealized | | | Total | |
| Ordinary | | | Long-Term | | | and | | | Carry | | | Book/Tax | | | Appreciation/ | | | Accumulated | |
| Income | | | Gains | | | Late Year Loss | | | Forwards | | | Differences | | | (Depreciation) | | | Earnings/(Deficits) | |
| $ | 1,986,121 | | | $ | — | | | $ | — | | | $ | (898,537 | ) | | $ | — | | | $ | 28,770,634 | | | $ | 29,858,218 | |
The difference between book basis and tax basis accumulated net realized gains/ losses, and unrealized appreciation/ depreciation from investments is primarily attributable to the tax deferral of losses on wash sales and the mark-to-market treatment of Section 1256 futures contracts.
At December 31, 2021, the Portfolio had capital loss carry forwards for federal income tax purposes available to offset future capital gains as follows:
| Non-Expiring | | | Non-Expiring | | | | | | | |
| Short-Term | | | Long-Term | | | Total | | | CLCF Utilized | |
| $ | 547,913 | | | $ | 350,624 | | | $ | 898,537 | | | $ | 4,733,813 | |
| 7. | RECENT REGULATORY UPDATES |
In October 2020, the Securities and Exchange Commission (the “SEC”) adopted new regulations governing the use of derivatives by registered investment companies (“Rule 18f-4”). The Portfolio will be required to comply with Rule 18f-4 by August 19, 2022. Once implemented, Rule 18f-4 will impose limits on the amount of derivatives a portfolio can enter into, eliminate the asset segregation framework currently used by portfolios to comply with Section 18 of the 1940 Act, treat derivatives as senior securities and require portfolios whose use of derivatives is more than a limited specified exposure amount to establish and maintain a comprehensive derivatives risk management program and appoint a derivatives risk manager. The Portfolio is currently evaluating the impact, if any, of this provision.
Subsequent events after the date of the Statement of Assets and Liabilities have been evaluated through the date the financial statements were issued. Management has determined that no events or transactions occurred requiring adjustment or disclosure in the financial statements.
REPORT OF INDEPENDENT REGISTERED PUBLIC ACCOUNTING FIRM
To the shareholders and Board of Trustees of Northern Lights Variable Trust
Opinion on the Financial Statements and Financial Highlights
We have audited the accompanying statement of assets and liabilities, including the portfolio of investments, of TOPS Managed Risk Flex ETF Portfolio, one of the portfolios constituting the Northern Lights Variable Trust (the “Portfolio”) as of December 31, 2021, the related statement of operations for the year then ended, the statements of changes in net assets for each of the two years in the period then ended, the financial highlights for each of the four years in the period then ended, and the related notes.
In our opinion, the financial statements and financial highlights present fairly, in all material respects, the financial position of the Portfolio as of December 31, 2021, and the results of its operations for the year then ended, the changes in its net assets for each of the two years in the period then ended, and the financial highlights for each of the four years in the period then ended in conformity with accounting principles generally accepted in the United States of America. The financial highlights for the year ended December 31, 2017 were audited by other auditors whose report, dated February 16, 2018, expressed an unqualified opinion on those statements.
Basis for Opinion
These financial statements and financial highlights are the responsibility of the Portfolio’s management. Our responsibility is to express an opinion on the Portfolio’s financial statements and financial highlights based on our audit. We are a public accounting firm registered with the Public Company Accounting Oversight Board (United States) (PCAOB) and are required to be independent with respect to the Portfolio in accordance with the U.S. federal securities laws and the applicable rules and regulations of the Securities and Exchange Commission and the PCAOB.
We conducted our audit in accordance with the standards of the PCAOB. Those standards require that we plan and perform the audit to obtain reasonable assurance about whether the financial statements and financial highlights are free of material misstatement, whether due to error or fraud. The Portfolio is not required to have, nor were we engaged to perform, an audit of its internal control over financial reporting. As part of our audit we are required to obtain an understanding of internal control over financial reporting but not for the purpose of expressing an opinion on the effectiveness of the Portfolio’s internal control over financial reporting. Accordingly, we express no such opinion.
Our audit included performing procedures to assess the risks of material misstatement of the financial statements and financial highlights, whether due to error or fraud, and performing procedures that respond to those risks. Such procedures included examining, on a test basis, evidence regarding the amounts and disclosures in the financial statements and financial highlights. Our audit also included evaluating the accounting principles used and significant estimates made by management, as well as evaluating the overall presentation of the financial statements and financial highlights. Our procedures included confirmation of securities owned as of December 31, 2021, by correspondence with the custodian and brokers; when replies were not received from broker, we performed other auditing procedures. We believe that our audit provides a reasonable basis for our opinion.

Costa Mesa, California
February 18, 2022
We have served as the auditor of one or more TOPS Portfolios investment companies since 2019.
| TOPS® ETF Portfolios |
| Additional Information (Unaudited) |
| December 31, 2021 |
ValMark Advisers, Inc. - Adviser to TOPS® Aggressive Growth ETF Portfolio (“TOPS Aggressive”), TOPS® Balanced ETF Portfolio (“TOPS Balanced”), TOPS® Conservative ETF Portfolio (“TOPS Conservative”), TOPS® Growth ETF Portfolio (“TOPS Growth”), and TOPS® Moderate Growth ETF Portfolio (“TOPS Moderate”) (collectively “TOPS Non-Risk Managed Portfolios” or “TOPS Portfolio”) and
TOPS® Managed Risk Balanced ETF Portfolio (“TOPS Risk Balanced”), TOPS® Managed Risk Growth ETF Portfolio (“TOPS Risk Growth”), TOPS® Managed Risk Flex ETF Portfolio, (“TOPS Risk ETF”), TOPS® Managed Risk Flex ETF Portfolio (“TOPS Risk Flex”), (collectively “TOPS Risk Managed Portfolios” or “TOPS Portfolio”)
In connection with the regular meeting held on November 9-10 & 12, 2021 of the Board of Trustees (the “Trustees” or the “Board”) of the Northern Lights Variable Trust (the “Trust”), including a majority of the Trustees who are not “interested persons,” as that term is defined in the Investment Company Act of 1940, as amended, discussed the renewal of an investment advisory agreement (the “Advisory Agreement”) between ValMark Advisers, Inc (the “Adviser”) and the Trust, with respect to each TOPS Portfolio (the “Fund” or “Funds”). In considering the re-approval of the Advisory Agreement, the Board received materials specifically relating to the Advisory Agreement.
The Trustees were assisted by independent legal counsel throughout the Advisory Agreement review process. The Trustees relied upon the advice of independent legal counsel and their own business judgment in determining the material factors to be considered in evaluating the Advisory Agreement and the weight to be given to each such factor. The conclusions reached by the Trustees were based on a comprehensive evaluation of all of the information provided and were not the result of any one factor. Moreover, each Trustee may have afforded different weight to the various factors in reaching his conclusions with respect to the Advisory Agreement.
Nature, Extent and Quality of Service. The Trustees noted that the Adviser had approximately $7.1 billion in assets under management and specialized in creating and managing ETF portfolios, providing financial planning, and investment advisory and risk management services to high-net-worth investors and institutional clients. The Trustees discussed the backgrounds of the key personnel responsible for servicing the Portfolios and noted their collective experience demonstrated a robust investment management team with diverse skill sets. The Trustees reviewed the adviser’s proprietary investment process and commented that it utilized asset allocation technology and researched many asset classes. The Trustees discussed how the Adviser set asset allocation levels, selected ETFs, and rebalanced portfolios. The Trustees reviewed the Adviser’s process for overseeing the sub-adviser and discussed the Adviser’s multi-step methodology for managing risk. They noted that for TOPS Managed Risk portfolios, the Adviser engaged the sub-adviser to apply a customized risk overlay strategy. The Trustees further noted that the Adviser conducted regular due diligence of the sub-adviser, which included compliance and trading oversight of the TOPS Managed Risk Portfolios and oversight of the trading for the TOPS Non-Managed Risk Portfolios. The Trustees reviewed the Adviser’s ability to manage the risk profile of each Fund and noted that the Adviser attempted to manage and mitigate potential risks by using an ETF selection process that was designed to identify ETFs that closely track the returns of an underlying index. The Trustees acknowledged that the Adviser monitored compliance with each Fund’s investment limitations by reviewing position reports for allocation drift, concentration risk, and compliance with each Fund’s prospectus disclosures. The Trustees noted that the Adviser delegated trading execution to the sub-adviser but utilized a best execution committee to review executing brokers and monitor execution. The Trustees acknowledged that the Adviser had sufficient resources and personnel to support the investment strategy and the Funds’ compliance requirements. The Trustees concluded that the Adviser continued to provide a high level of quality service to the Funds for the benefit of shareholders.
| TOPS® ETF Portfolios |
| Additional Information (Unaudited) (Continued) |
| December 31, 2021 |
Performance.
TOPS Aggressive. The Trustees noted the Fund’s objective of providing capital appreciation and observed that the Fund had approximately $65 million in assets and returned approximately 9.29% since the Fund’s inception in 2011. The Trustees acknowledged that the Fund received a one-star Morningstar rating while outperforming its Morningstar peer group for the one-year period with a return of over 36%. They noted that the Fund had underperformed its Morningstar category median and its benchmark for the one-year, three-year, five-year, and since inception periods. They further noted the Adviser attributed the Fund’s underperformance to its higher allocations to value stocks. The Trustees noted that the Adviser expressed its satisfaction with the Fund’s sub-adviser. They concluded that the Fund was accomplishing its objective and that the Adviser was implementing the strategy as expected.
TOPS Balanced. The Trustees noted the Fund’s objective of providing income and capital appreciation. They further noted that the Fund received a two-star Morningstar rating and had assets of $56 million as of July 31, 2021. They discussed that the Fund had outperformed its peer group median for the one-year period but underperformed its benchmark, Morningstar category and peer group medians for all comparison periods. The Trustees discussed the underperformance and noted that unlike the Fund’s comparison groups, the Fund had higher exposure to international, small and mid-capitalization companies and value securities. The Trustees reviewed the Fund’s risk metrics and acknowledged that the Fund earned 1st quartile Sharpe and Sortino ratios when compared to the Fund’s Morningstar category. They acknowledged that the Fund performed as designed and disclosed in its prospectus.
TOPS Conservative. The Trustees noted the Fund’s objective of preservation of capital and moderate income and moderate capital appreciation. They further noted that the Fund had received a three-star Morningstar rating and had assets of $27 million as of July 31, 2021. The Trustees acknowledged that the Fund outperformed its peer group median for the one-year period and Morningstar category median for the five-year and since-inception periods. The Trustees acknowledged the Fund underperformed its benchmark for all comparison periods and noted the Fund’s underperformance was the result of higher exposure to international, small and mid-capitalization companies and value securities. The Trustees noted that the Fund performed as designed and described in its prospectus. They further noted that the Adviser was satisfied with the sub-adviser’s trade execution. They concluded that the Fund was accomplishing its objective and that the Adviser was implementing the strategy as expected.
TOPS Growth. The Trustees reviewed the Fund’s objective and noted that it sought capital appreciation and received a three-star Morningstar rating. The Trustees acknowledged that the Fund’s assets had increased by approximately $35 million as of July 31, 2021. The Trustees noted that the Fund outperformed its Morningstar category and peer group medians for the one-year, three-year, and since inception periods. They acknowledged that the Fund’s overperformance appeared to be caused in part by a higher equity exposure. They considered the Fund’s underperformance compared to its benchmark and noted that the Fund held international and small and mid-capitalization securities, while the Fund’s benchmark was comprised of large capitalization growth stocks. The Trustees commented that the Adviser expressed its satisfaction with the Fund’s sub-adviser and that the sub-adviser’s services had been beneficial to the Fund’s shareholders. The Trustees agreed that the Fund performed as designed and disclosed in its prospectus.
TOPS Moderate. The Trustees reviewed the Fund’s objective, noting that it sought capital appreciation and received a three-star Morningstar rating. The Trustees noted that the Fund returned 23.72% for the period ended July 31, 2021. They further noted that the Fund outperformed its Morningstar category and peer group medians for the one-year and five-year periods. They acknowledged that the Fund underperformed its benchmark for all comparison periods and attributed the underperformance to the Fund’s allocation to value rather than growth securities. The Trustees reviewed the Fund’s risk metrics and noted that the Fund’s Sharpe and Sortino ratios had improved to the 1st quartile of the Fund’s Morningstar category. They commented that the performance of the Fund’s risk metrics was the result of the Fund’s holdings of small and mid-capitalization companies. The Trustees agreed that the Fund performed as designed and disclosed in its prospectus.
| TOPS® ETF Portfolios |
| Additional Information (Unaudited) (Continued) |
| December 31, 2021 |
TOPS Risk Balanced. The Trustees reviewed the Fund’s objective and noted that the Fund sought to provide income and capital appreciation with less volatility than fixed income and equity markets as a whole. They further noted that the Fund received a two-star Morningstar rating. They acknowledged that the Fund outperformed its Morningstar category and peer group medians for the one-year period however, the Fund underperformed all of its comparison groups for the three-year, five-year, and since inception periods. The Trustees acknowledged that the Fund’s sub-adviser employed a hedging strategy designed to decrease the Fund’s volatility however, the hedging strategy negatively impacted the Fund’s rate of return by approximately 2.44%. They considered the benefit of the Fund’s hedging strategy and commented that it decreased the Fund’s Standard Deviation, which allowed the Fund to meet its investment objective of providing lower volatility. The Trustees acknowledged that the Fund performed as designed and could be suitable for risk adverse shareholders.
TOPS Risk Flex. The Trustees reviewed the Fund’s objective and noted that the Fund seeks income and capital appreciation with less volatility than fixed income and equity markets as a whole. They further noted that the Fund received a two-star Morningstar rating and had $160 million in assets as of July 31, 2021. The Trustees considered the Fund’s performance and acknowledged that the Fund outperformed its Morningstar category and peer group for the one-year period. They further noted that the Fund underperformed all of its comparison groups for the three-year, five-year, and since inception periods. They discussed the impact of the Fund’s hedging strategy and commented that the hedging strategy reduced the Fund’s Standard Deviation. They considered the Fund’s Sharpe ratio and noted that it was in the 1st quartile of the Fund’s peer group. The Trustees concluded that the Fund’s managed risk strategy continued to provide benefit to the Fund’s shareholders.
TOPS Risk Growth. The Trustees considered the Fund’s objective and noted that the Fund seeks to provide capital appreciation with less volatility than equity markets. They acknowledged that the Fund received a two-star Morningstar rating. The Trustees considered the Fund’s one-year performance and commented that the Fund returned 22.59% for the period ended July 31, 2021. They noted that the Fund underperformed its Morningstar category median, peer group median, and benchmark for the one-year, three-year, five-year, and since inception periods. They acknowledged that the Fund’s hedging strategy contributed to the Fund’s underperformance, noting that the hedging strategy was designed for sustained declining markets. The Trustees considered the Fund’s risk metrics and acknowledged that the Fund’s Sharpe and Sortino ratios were in the 3rd or 4th quartile, and Standard Deviation in the top quartile, when compared to the Fund’s Morningstar category for all periods. The Trustees agreed that the Fund was designed for risk adverse shareholder’s and could provide value during periods of sustained declining markets.
TOPS Risk ETF. The Trustees acknowledged the Fund’s objective and noted that the Fund seeks to provide capital appreciation with lower volatility than equity markets. They further noted that the Fund received a two-star Morningstar rating and acknowledged that the Fund underperformed its peer group median, Morningstar category median, and benchmark for all comparison periods. They reviewed the impact of the Fund’s hedging strategy and acknowledged that when compared to TOPS Moderate, it reduced the Fund’s rate of return by approximately 4.10% per year. The Trustees commented that the hedging strategy performed as expected by decreasing the Fund’s Standard Deviation. The Trustees considered the impact of the Fund’s hedging strategy on the Fund’s risk metrics and acknowledged that it resulted in the 3rd or 4th quartile Sharpe and Sortino ratios, when compared to the Fund’s Morningstar category for all periods presented. The Trustees considered the Advisers explanation for the Fund’s performance and agreed that the Fund performed as designed and intentionally performed best in periods of sustained declining markets.
Fees and Expenses.
TOPS Non-Risk Managed Portfolios. The Trustees reviewed the advisory fee charged to each of the TOPS Non-Risk Managed Portfolios and noted that the Adviser charged 0.10% for advisory services to each Fund. They compared each Fund’s advisory fee and net expense ratio to each Fund’s Morningstar category and peer group and acknowledged that each Fund’s advisory fee and net expense ratio were consistently lower than the comparable groups. The Trustees considered the fees by paid by the Adviser to the sub-adviser for execution services. The Trustees concluded that the advisory fees paid to the Adviser by each of the TOPS Non-Risk Managed Portfolios was not unreasonable.
| TOPS® ETF Portfolios |
| Additional Information (Unaudited) (Continued) |
| December 31, 2021 |
TOPS Risk Managed Portfolios. The Trustees reviewed the advisory fee charged to each of the TOPS Risk Managed Portfolios, noting that the Adviser charged 0.30% for the advisory services rendered to each Fund. The Trustees further noted that the Adviser, not each Fund, paid the sub-adviser for the risk overlay and execution services. They compared the net expense ratio and advisory fee of each TOPS Risk Managed Portfolio to its Morningstar category and peer group and acknowledged that each Fund had a higher net expense ratio but that the advisory fee and net expenses were more in line with the peer groups, and the advisory fee was competitive. They further noted that each Fund’s advisory fee and net expense ratio were within the range of the Morningstar category. The Trustees noted that the Adviser attributed the higher net expense ratio to the costs associated with managing each Fund’s volatility. They concluded that the Adviser offered access to a strategy at a competitive advisory fee that was not unreasonable.
Profitability.
TOPS Non-Risk Managed Portfolios. The Trustees reviewed the profitability analysis provided by the Adviser in connection with the services provided to each Fund. They acknowledged that the Adviser indicated that it suffered a loss in connection with its relationship with each Fund. After further discussion, the Trustees concluded that excessive profitability was not a concern at this time for any TOPS Non-Risk Managed Portfolio.
TOPS Risk Managed Portfolios. The Trustees reviewed the profitability analysis provided by the Adviser in connection with the services provided to each Fund. They noted that the Adviser indicated that it received a profit in connection with its relationship with each Fund. The Trustees noted that the profits were reasonable in terms of actual dollars and as a percentage of revenue. After further discussion, the Trustees concluded that the Adviser was not realizing an excessive profit from the advisory services provided to any of the TOPS Risk Managed Portfolios.
Economies of Scale. The Trustees noted the Funds’ competitive fees and considered the size of each Fund. They also considered the Adviser’s assertion that breakpoints would, therefore, be unlikely in the near term. They noted, however, the Adviser’s willingness to discuss the matter of economies as a Fund’s size materially increased. After further discussion, it was the consensus of the Trustees that based on the existing, competitive advisory fees, increasing areas of regulatory related duties assumed by the Adviser, and each Fund’s current asset level, material economies of scale had not yet been reached and the absence of breakpoints was reasonable. The Trustees agreed to monitor this issue and revisit this discussion as each Fund’s size increased significantly.
Conclusion. Having requested and received such information from the Adviser as the Trustees believed to be reasonably necessary to evaluate the terms of the Advisory Agreement, and as assisted by the advice of counsel, the Trustees concluded that the fee structure for each TOPS Portfolio was not unreasonable and that renewal of the Advisory Agreement for each TOPS Portfolio was in the best interests of the shareholders of each TOPS Portfolio.
| * | Due to the timing of the contract renewal schedule, these deliberations may or may not relate to the current performance results of the Fund. |
| TOPS® ETF Portfolios |
| Additional Information (Unaudited) (Continued) |
| December 31, 2021 |
Milliman Financial Risk Management, LLC - Sub-Adviser to TOPS® Aggressive Growth ETF Portfolio, TOPS® Balanced ETF Portfolio, TOPS® Conservative ETF Portfolio, TOPS® Growth ETF Portfolio, and TOPS® Moderate Growth ETF Portfolio (collectively “TOPS Non-Risk Managed Portfolios” or “TOPS Portfolio”) and
TOPS® Managed Risk Balanced ETF Portfolio, TOPS® Managed Risk Growth ETF Portfolio, TOPS® Managed Risk Flex ETF Portfolio, TOPS® Managed Risk Flex ETF Portfolio, (collectively “TOPS Risk Managed Portfolios” or “TOPS Portfolio”)*
In connection with the regular meeting held on November 9-10 & 12, 2021 of the Board, including a majority of the Trustees who are not “interested persons,” as that term is defined in the Investment Company Act of 1940, as amended, discussed the approval of a sub-advisory agreement (the “Sub-Advisory Agreement”) between Milliman Financial Risk Management (the “Sub-Adviser”) and ValMark Advisers, Inc. (“Adviser”), with respect to each TOPS Portfolio (the “Fund” or “Funds”). In considering the approval of the Sub-Advisory Agreement, the Board received materials specifically relating to the Sub-Advisory Agreement.
The Trustees were assisted by independent legal counsel throughout the Sub-Advisory Agreement review process. The Board relied upon the advice of independent legal counsel and their own business judgment in determining the material factors to be considered in evaluating the Sub-Advisory Agreement and the weight to be given to each such factor. The conclusions reached by the Trustees were based on a comprehensive evaluation of all of the information provided and were not the result of any one factor. Moreover, each Trustee may have afforded different weight to the various factors in reaching his conclusions with respect to the Sub-Advisory Agreement.
Nature, Extent and Quality of Service. The Trustees noted that the Sub-Adviser was established in 1998 and was considered a global leader in financial risk management services and specialized in providing investment advisory, custom hedging solutions, and consulting services. The Trustees reviewed the backgrounds of the personnel responsible for serving the Funds and acknowledged their financial industry experience, technical expertise in quantitative finance, and actuarial experience. The Trustees noted that for the TOPS Managed Risk Portfolios, the Sub-Adviser performs daily risk management calculations and utilized a proprietary managed risk strategy to hedge each Fund and reduce volatility. The Trustees stated that the Sub-Adviser provided non-discretionary trading services to each of the TOPS Portfolios, which allowed the Funds to maximize efficiencies. The Trustees observed that the Sub-Adviser maintained several risk management systems and recognized that risk management was a core function of the Sub-Adviser’s business. The Trustees discussed the Sub-Adviser’s process for monitoring compliance with each Fund’s investment limitations and noted that the Sub-Adviser set specific trading thresholds into its trading and compliance systems. They further noted that the Sub-Adviser’s systems allowed the Sub-Adviser to quickly generate accurate post-trade reports. The Trustees concluded, based upon their review, that the Sub-Adviser provided a high level of quality service to the Adviser, the TOPS Portfolios and their respective shareholders.
Performance. The Trustees reviewed the performance of the TOPS Risk Managed Portfolios, particularly noting the impact of the Sub-Adviser’s hedging strategy. They acknowledged that the Sub-Adviser’s hedging strategy was designed to decrease the impact of volatility on each of the TOPS Risk Managed Portfolios, even if this negatively impacted each Fund’s performance. The Trustees noted that the Sub-Adviser’s hedging strategy was designed to perform optimally during sustained market declines and would underperform during periods of market growth. They further noted that the Sub-Adviser’s hedging strategy appeared to be functioning as intended.
Fees and Expenses. The Trustees reviewed the fee arrangement between the Adviser and Sub-Adviser with respect to the TOPS Risk Managed Portfolios and the TOPS Non-Risk Managed Portfolios. They noted that the Sub-Adviser received a fixed fee for the execution services provided to the TOPS Non-Risk Managed Portfolios. They reviewed the fee split between the Adviser and the Sub-Adviser with respect to the TOPS Managed Risk Portfolios, noting that the Sub-Adviser received 0.20% of the Fund’s average daily net assets from the Adviser’s fees. The Trustees considered the fees the Sub-Adviser charged for the Managed Risk Portfolios compared to managing similar accounts, noting that each Fund’s sub-advisory fee was slightly higher than the fee charged to the Sub-Adviser’s similar accounts. The Trustees noted the Sub-Adviser’s explanation that the sub-advisory fee was lower for its similar accounts due to anticipated economies of scale. After further discussion, the Trustees concluded that the sub-advisory fee charged with respect to each TOPS Portfolio was not unreasonable.
| TOPS® ETF Portfolios |
| Additional Information (Unaudited) (Continued) |
| December 31, 2021 |
Profitability. The Trustees reviewed the profitability analysis provided by the Sub-Adviser with respect to each of the TOPS Portfolios. They noted that the Sub-Adviser realized profits in terms of actual dollars and percentage of revenue in connection with its relationship with the TOPS Portfolios. They further noted that the Sub-Adviser indicated higher profits with regards to the TOPS Managed Risk Portfolios due to the structure of the fee arrangement. The Trustees concluded that excessive profitability was not a concern at this time.
Economies of Scale. The Trustees considered whether economies of scale had been achieved by the Sub-Adviser with respect to the management of the TOPS Portfolios. The Trustees agreed that, with respect to the execution services provided to the TOPS Non-Risk Managed Portfolios, the fees were so modest that the Portfolios were already realizing certain economies. With respect to the other TOPS Risk Managed Portfolios, the Trustees agreed that economies of scale should be, and had been, considered with respect to the overall advisory contract with the Adviser, taking into consideration the impact of the sub-advisory expense. They recognized the material impact of the Sub-Adviser fee on the total advisory expense because it represented more than half of the total advisory fee, reflecting the importance of the Sub-Adviser to the risk managed strategy, and agreed that it should be monitored as the Fund’s grow is assets.
Conclusion. Having requested and received such information from the Sub-Adviser as the Trustees believed to be reasonably necessary to evaluate the terms of the Sub-Advisory agreement, and as assisted by the advice of independent counsel, the Trustees concluded that renewal of the Sub-Advisory agreement was in the best interests of the shareholders of each of the TOPS Portfolios.
| * | Due to the timing of the contract renewal schedule, these deliberations may or may not relate to the current performance results of the Fund. |
| TOPS® Managed Risk Flex ETF Portfolio |
| Expense Examples (Unaudited) |
| December 31, 2021 |
As a shareholder of the TOPS® Managed Risk Flex ETF Portfolio, you incur ongoing costs, including management fees; distribution and/or service (12b-1) fees; and other Portfolio expenses. This example is intended to help you understand your ongoing costs (in dollars) of investing in the Portfolio and to compare these costs with the ongoing costs of investing in other mutual funds.
The example is based on an investment of $1,000 invested at the beginning of the period and held for the entire period from July 1, 2021 through December 31, 2021.
Actual Expenses
The “Actual” columns in the table below provides information about actual account values and actual expenses. You may use the information below together with the amount you invested, to estimate the expenses that you paid over the period. Simply divide your account value by $1,000 (for example, an $8,600 account value divided by $1,000 = 8.6), then multiply the result by the number in the table under the heading entitled “Expenses Paid During Period” to estimate the expenses you paid on your account during this period.
Hypothetical Example for Comparison Purposes
The “Hypothetical” columns in the table below provides information about hypothetical account values and hypothetical expenses based on the Portfolio’s actual expense ratio and an assumed rate of return of 5% per year before expenses, which is not the Portfolio’s actual return. The hypothetical account values and expenses may not be used to estimate the actual ending account balances or expenses you paid for the period. You may use this information to compare this 5% hypothetical example with the 5% hypothetical examples that appear in the shareholder reports of other funds.
Please note that the expenses shown in the table are meant to highlight your ongoing costs only and do not reflect any transactional costs, or other expenses charged by your insurance contract or separate account. Therefore, the table is useful in comparing ongoing costs only, and will not help you determine the relative total costs of owning different funds. In addition, if these transactional costs were included, your costs would have been higher.
| | | | | | | | | | | Hypothetical |
| | | | | | | | | | | (5% return before |
| | | | | | | Actual | | expenses) |
| | | Portfolio’s | | Beginning | | Ending | | Expenses | | Ending | | Expenses |
| | | Annualized | | Account | | Account | | Paid | | Account | | Paid |
| | | Expense | | Value | | Value | | During | | Value | | During |
| | | Ratio | | 7-1-21 | | 12-31-21 | | Period * | | 12-31-21 | | Period* |
| TOPS Managed Risk Flex ETF Portfolio | | 0.86% | | $1,000.00 | | $1,020.00 | | $4.36 | | $1,020.89 | | $4.36 |
| * | Expenses are equal to the average account value over the period, multiplied by the Portfolio’s annualized expense ratio, multiplied by the number of days in the period (184) divided by the number of days in the fiscal year (365). |
| TOPS® ETF Portfolios |
| Supplemental Information (Unaudited) |
| December 31, 2021 |
The Trustees and the executive officers of the Trust are listed below with their present positions with the Trust and principal occupations over at least the last five years. The business address of each Trustee and Officer is 225 Pictoria Drive, Suite 450, Cincinnati, OH 45246. All correspondence to the Trustees and Officers should be directed to c/o Ultimus Fund Solutions, LLC, P.O. Box 541150, Omaha, Nebraska 68154.
Independent Trustees
Name, Address
and Year of
Birth | Position/Term
of Office | Principal Occupation
During the Past Five
Years | Number
of
Portfolios
in Fund
Complex*
Overseen
by Trustee | Other Directorships held by
Trustee During the Past Five
Years |
Mark Garbin
Born in 1951 | Trustee Since 2013 | Managing Principal, Coherent Capital Management LLC (since 2007). | 10 | Northern Lights Variable Trust (for series not affiliated with the Portfolios since 2013); Two Roads Shared Trust (since 2012); Forethought Variable Insurance Trust (since 2013); Northern Lights Fund Trust (since 2013); OHA Mortgage Strategies Fund (offshore), Ltd. (2014 -2017); and Altegris KKR Commitments Master Fund (since 2014); OFI Carlyle Global Private Credit Fund (since March 2018) and and Independent Director OHA CLO Enhanced Equity II Genpar LLP (since June 2021). |
Mark D. Gersten
Born in 1950 | Trustee Since 2013 | Independent Consultant (since 2012). | 10 | Northern Lights Variable Trust (for series not affiliated with the Portfolios since 2013); Northern Lights Fund Trust (since 2013); Two Roads Shared Trust (since 2012); Altegris KKR Commitments Master Fund (since 2014); previously, Ramius Archview Credit and Distressed Fund (2015-2017); Schroder Global Series Trust (2012 -2017). |
Anthony J. Hertl
Born in 1950 | Trustee Since 2005; Chairman of the Board since 2013 | Retired, previously held several positions in a major Wall Street firm including Capital Markets Controller, Director of Global Taxation, and CFO of the Specialty Finance Group. | 10 | Northern Lights Variable Trust (for series not affiliated with the Portfolios since 2006); Northern Lights Fund Trust (since 2005); Alternative Strategies Fund (since 2010); Satuit Capital Management Trust (2007-2019). |
Gary W. Lanzen
Born in 1954 | Trustee Since 2005 | Retired since 2012. Formerly, Founder, President, and Chief Investment Officer, Orizon Investment Counsel, Inc. (2000-2012). | 10 | Northern Lights Variable Trust (for series not affiliated with the Portfolios since 2006); Northern Lights Fund Trust (since 2005); AdvisorOne Funds (since 2003); Alternative Strategies Fund (since 2010); and previously, CLA Strategic Allocation Fund (2014-2015). |
John V. Palancia
Born in 1954 | Trustee Since 2011 | Retired (since 2011). Formerly, Director of Futures Operations, Merrill Lynch, Pierce, Fenner & Smith Inc. (1975- 2011). | 10 | Northern Lights Variable Trust (for series not affiliated with the Portfolios since 2011); Northern Lights Fund Trust III (since February 2012); Alternative Strategies Fund (since 2012) and Northern Lights Fund Trust (since 2011). |
Mark H. Taylor
Born in 1964 | Trustee Since 2007; Chairman of the Audit Committee since 2013 | Director, Lynn Pippenger School of Accountancy Muma College of Business, University of South Florida, Tampa FL (since 2019); Chair, Department of Accountancy and Andrew D. Braden Professor of Accounting and Auditing, Weatherhead School of Management, Case Western Reserve University (2009-2019); Vice President-Finance, American Accounting Association (2017-2020); President, Auditing Section of the American Accounting Association (2012-2015). AICPA Auditing Standards Board Member (2009-2012). | 10 | Northern Lights Variable Trust (for series not affiliated with the Portfolios since 2007); Alternative Strategies Fund (since 2010); Northern Lights Fund Trust III (since 2012); and Northern Lights Fund Trust (since 2007). |
12/31/21-NLVT-v2
| TOPS® ETF Portfolios |
| Supplemental Information (Unaudited)(Continued) |
| December 31, 2021 |
Officers
Name, Address
and Year of
Birth | Position/Term
of Office* | Principal Occupation
During the Past Five
Years | Number of
Portfolios in
Fund
Complex*
Overseen by
Trustee | Other Directorships held by
Trustee During the Past Five
Years |
Kevin E. Wolf
Born in 1969 | President Since June 2017 | Executive Vice President, Head of Fund Administration, and Product; Ultimus Fund Solutions, LLC (since 2020); Vice President of The Ultimus Group, LLC (since 2019); Executive Vice President of Gemini Fund Services, LLC (2019-2020) President, Gemini Fund Services, LLC (2012 -2019). | N/A | N/A |
Richard Malinowski
Born in 1983 | Vice President Since March 2018 | Senior Vice President and Senior Managing Counsel, Ultimus Fund Solutions, LLC (since 2020); Senior Vice President Legal Administration, Gemini Fund Services, LLC (2017-2020); Vice President and Counsel (2016-2017) and Assistant Vice President and Staff Attorney (2012-2016). | N/A | N/A |
James Colantino
Born in 1969 | Treasurer Since June 2017 | Senior Vice President Fund Administration, Ultimus Fund Solutions (since 2020); Senior Vice President Fund Administration, Gemini Fund Services, LLC (2012-2020); Assistant Treasurer of the Trust (2006-June 2017). | N/A | N/A |
Stephanie Shearer
Born in 1979 | Secretary Since February 2017 | Assistant Secretary of the Trust (2012-February 2017); Manager of Legal Administration, Ultimus Fund Solutions (since 2020); Manager of Legal Administration, Gemini Fund Services, LLC (2018-2020); Senior Paralegal, Gemini Fund Services, LLC (2013 -2018). | N/A | N/A |
Michael J. Nanosky
Born in 1966 | Chief Compliance Officer since January 2021 | Chief Compliance Officer, of the Trust (Since January 2021); Vice President-Senior Compliance Officer, Ultimus Fund Solutions (Since 2020); Vice President, Chief Compliance Officer for Williamsburg Investment Trust(2020-current); Senior Vice President-Chief Compliance Officer, PNC Funds (2014-2019). | N/A | N/A |
| * | The term of office for each Trustee and officer listed above will continue indefinitely until the individual resigns or is removed. |
| ** | As of December 31, 2021, the Trust was comprised of 15 active portfolios managed by unaffiliated investment advisers. The term “Fund Complex” applies only to the 10 portfolios managed by the Adviser. Those Portfolios do not hold themselves out as related to any other series within the Trust for investment purposes, nor do they share the same investment adviser with any other series. |
The Portfolios’ Statement of Additional Information includes additional information about the Trustees and is available free of charge, upon request, by calling toll-free at 1-855-572-5945.
12/31/21-NLVT-v2
PRIVACY NOTICE
Northern Lights Variable Trust
Rev. February 2014
| FACTS | WHAT DOES NORTHERN LIGHTS VARIABLE TRUST DO WITH YOUR PERSONAL INFORMATION? |
| Why? | Financial companies choose how they share your personal information. Federal law gives consumers the right to limit some, but not all sharing. Federal law also requires us to tell you how we collect, share, and protect your personal information. Please read this notice carefully to understand what we do. |
| What? | The types of personal information we collect and share depends on the product or service that you have with us. This information can include: ● Social Security number and wire transfer instructions ● account transactions and transaction history ● investment experience and purchase history When you are no longer our customer, we continue to share your information as described in this notice. |
| How? | All financial companies need to share customers’ personal information to run their everyday business. In the section below, we list the reasons financial companies can share their customers’ personal information; the reasons Northern Lights Variable Trust chooses to share; and whether you can limit this sharing. |
Reasons we can share your
personal information: | Does Northern Lights Variable
Trust share information? | Can you limit this sharing? |
| For our everyday business purposes - such as to process your transactions, maintain your account(s), respond to court orders and legal investigations, or report to credit bureaus. | YES | NO |
| For our marketing purposes - to offer our products and services to you. | NO | We don’t share |
| For joint marketing with other financial companies. | NO | We don’t share |
| For our affiliates’ everyday business purposes - information about your transactions and records. | NO | We don’t share |
| For our affiliates’ everyday business purposes - information about your credit worthiness. | NO | We don’t share |
| For nonaffiliates to market to you | NO | We don’t share |
| QUESTIONS? | Call 1-631-490-4300 |
PRIVACY NOTICE
Northern Lights Variable Trust
| What we do: |
How does Northern Lights Variable Trust protect my personal information? | To protect your personal information from unauthorized access and use, we use security measures that comply with federal law. These measures include computer safeguards and secured files and buildings. Our service providers are held accountable for adhering to strict policies and procedures to prevent any misuse of your nonpublic personal information. |
How does Northern Lights Variable Trust collect my personal information? | We collect your personal information, for example, when you ● open an account or deposit money ● direct us to buy securities or direct us to sell your securities ● seek advice about your investments We also collect your personal information from others, such as credit bureaus, affiliates, or other companies. |
Why can’t I limit all sharing? | Federal law gives you the right to limit only: ● sharing for affiliates’ everyday business purposes – information about your creditworthiness. ● affiliates from using your information to market to you. ● sharing for nonaffiliates to market to you. State laws and individual companies may give you additional rights to limit sharing. |
| Definitions |
| Affiliates | Companies related by common ownership or control. They can be financial and nonfinancial companies. ● Northern Lights Variable Trust does not share with our affiliates. |
| Nonaffiliates | Companies not related by common ownership or control. They can be financial and nonfinancial companies. ● Northern Lights Variable Trust does not share with nonaffiliates so they can market to you. |
| Joint marketing | A formal agreement between nonaffiliated financial companies that together market financial products or services to you. ● Northern Lights Variable Trust doesn’t jointly market. |
PROXY VOTING POLICY
Information regarding how the Portfolio voted proxies relating to portfolio securities for the most recent twelve month period ended June 30 as well as a description of the policies and procedures that the Portfolio uses to determine how to vote proxies is available without charge, upon request, by calling 1-855 -572-5945 or by referring to the Securities and Exchange Commission’s (“SEC”) website at http://www.sec.gov.
PORTFOLIO HOLDINGS
The Portfolio files a complete schedule of portfolio holdings with the SEC for the first and third quarters of each fiscal year as an exhibit to its reports on Form N-PORT, within sixty days after the end of the period. Form N-PORT reports are available at the SEC’s website at www.sec.gov. The information on Form N-PORT is available without charge, upon request, by calling 1-855-572-5945.
| INVESTMENT ADVISOR |
| ValMark Advisers, Inc. |
| 130 Springside Drive |
| Akron, OH 44333 |
| |
| INVESTMENT SUB-ADVISOR |
| Milliman Financial Risk Management, LLC |
| 71 S. Wacker Drive, 31st Floor |
| Chicago, IL 60606 |
| |
| ADMINISTRATOR |
| Ultimus Fund Solutions, LLC |
| 225 Pictoria Drive, Suite 450 |
| Cincinnati, OH 45246 |
| |
| |
| |
| |
| |
| TFL-AR21 |
(b) Not applicable
Item 2. Code of Ethics.
(a) As of the end of the period covered by this report, the registrant has adopted a code of ethics that applies to the registrant's principal executive officer, principal financial officer, principal accounting officer or controller, or persons performing similar functions, regardless of whether these individuals are employed by the registrant or a third party.
(b) For purposes of this item, “code of ethics” means written standards that are reasonably designed to deter wrongdoing and to promote:
| (1) | Honest and ethical conduct, including the ethical handling of actual or apparent conflicts of interest between personal and professional relationships; |
| (2) | Full, fair, accurate, timely, and understandable disclosure in reports and documents that a registrant files with, or submits to, the Commission and in other public communications made by the registrant; |
(3) Compliance with applicable governmental laws, rules, and regulations;
| (4) | The prompt internal reporting of violations of the code to an appropriate person or persons identified in the code; and |
(5) Accountability for adherence to the code.
(c) Amendments: During the period covered by the report, there have not been any amendments to the provisions of the code of ethics.
(d) Waivers: During the period covered by the report, the registrant has not granted any express or implicit waivers from the provisions of the code of ethics.
(e) The Code of Ethics is not posted on Registrant’ website.
(f) A copy of the Code of Ethics is attached as an exhibit.
Item 3. Audit Committee Financial Expert.
(a)(1)ii The Registrant’s board of trustees has determined that Mark H. Taylor is an audit committee financial experts, as defined in Item 3 of Form N-CSR. Mr. Taylor are independent for purposes of this Item 3.
Item 4. Principal Accountant Fees and Services.
FYE 2021 - $11,870
FYE 2020 - $11,575
FYE 2021 - None
FYE 2020 – None
FYE 2021 - $3,370
FYE 2020 - $3,300
Preparation of Federal & State income tax returns, assistance with calculation of required income, capital gain and excise distributions and preparation of Federal excise tax returns.
FYE 2021 – None
FYE 2020 – None
| (e) | (1) Audit Committee’s Pre-Approval Policies |
The registrant’s Audit Committee is required to pre-approve all audit services and, when appropriate, any non-audit services (including audit-related, tax and all other services) to the registrant. The registrant’s Audit Committee also is required to pre-approve, when appropriate, any non-audit services (including audit-related, tax and all other services) to its adviser, or any entity controlling, controlled by or under common control with the adviser that provides ongoing services to the registrant, to the extent that the services may be determined to have an impact on the operations or financial reporting of the
registrant. Services are reviewed on an engagement by engagement basis by the Audit Committee.
| (2) | Percentages of Services Approved by the Audit Committee |
2021 2020
Audit-Related Fees: 0.00% 0.00%
Tax Fees: 0.00% 0.00%
All Other Fees: 0.00% 0.00%
| (f) | During the audit of registrant's financial statements for the most recent fiscal year, less than 50 percent of the hours expended on the principal accountant's engagement were attributed to work performed by persons other than the principal accountant's full-time, permanent employees. |
| (g) | The aggregate non-audit fees billed by the registrant's accountant for services rendered to the registrant, and rendered to the registrant's investment adviser (not including any sub-adviser whose role is primarily portfolio management and is subcontracted with or overseen by another investment adviser), and any entity controlling, controlled by, or under common control with the adviser that provides ongoing services to the registrant: |
2021 - $11,870
2020 - $11,575
(h) The registrant's audit committee has considered whether the provision of non-audit services to the registrant's investment adviser (not including any sub-adviser whose role is primarily portfolio management and is subcontracted with or overseen by another investment adviser), and any entity controlling, controlled by, or under common control with the investment adviser that provides ongoing services to the registrant, that were not pre-approved pursuant to paragraph (c)(7)(ii) of Rule 2-01 of Regulation S-X, is compatible with maintaining the principal accountant's independence.
Item 5. Audit Committee of Listed Companies. Not applicable to open-end investment companies.
Item 6. Schedule of Investments. Schedule of investments in securities of unaffiliated issuers is included under Item 1.
Item 7. Disclosure of Proxy Voting Policies and Procedures for Closed-End Funds. Not applicable to open-end investment companies.
Item 8. Portfolio Managers of Closed-End Management Investment Companies. Not applicable to open-end investment companies.
Item 9. Purchases of Equity Securities by Closed-End Funds. Not applicable to open-end investment companies.
Item 10. Submission of Matters to a Vote of Security Holders. None
Item 11. Controls and Procedures.
(a) Based on an evaluation of the Registrant’s disclosure controls and procedures as of a date within 90 days of filing date of this Form N-CSR, the principal executive officer and principal financial officer of the Registrant have concluded that the disclosure controls and procedures of the Registrant are reasonably designed to ensure that the information required in filings on Form N-CSR is recorded, processed, summarized, and reported by the filing date, including that information required to be disclosed is accumulated and communicated to the Registrant’s management, including the Registrant’s principal executive officer and principal financial officer, as appropriate to allow timely decisions regarding required disclosure.
(b) There were no significant changes in the Registrant’s internal control over financial reporting that occurred during the Registrant’s last fiscal half-year that have materially affected, or are reasonably likely to materially affect, the Registrant’s internal control over financial reporting.
Item 12. Disclosure Of Securities Lending Activities For Closed-End Management Investment Companies. Not applicable to open-end investment companies.
Item 13. Exhibits.
(a)(1) Not applicable.
(a)(2) Certifications required by Section 302 of the Sarbanes-Oxley Act of 2002 (and Item 11(a)(2) of Form N-CSR) are filed herewith.
(a)(3) Not applicable for open-end investment companies.
SIGNATURES
Pursuant to the requirements of the Securities Exchange Act of 1934 and the Investment Company Act of 1940, the registrant has duly caused this report to be signed on its behalf by the undersigned, thereunto duly authorized.
(Registrant) Northern Lights Variable Fund Trust
By (Signature and Title)
/s/ Kevin E. Wolf
Kevin E. Wolf, Principal Executive Officer/President
Date 12/15/2022
Pursuant to the requirements of the Securities Exchange Act of 1934 and the Investment Company Act of 1940, this report has been signed below by the following persons on behalf of the registrant and in the capacities and on the dates indicated.
By (Signature and Title)
/s/ Kevin E. Wolf
Kevin E. Wolf, Principal Executive Officer/President
Date 12/15/2022
By (Signature and Title)
/s/ Jim Colantino
Jim Colantino, Principal Financial Officer/Treasurer
Date 12/15/2022