united states
securities and exchange commission
washington, d.c. 20549
form n-csr
certified shareholder report of registered management
investment companies
Investment Company Act file number 811-21853
Northern Lights Variable Trust
(Exact name of registrant as specified in charter)
225 Pictoria Drive, Suite 450, Cincinnati, OH 45246
(Address of principal executive offices) (Zip code)
The Corporation Trust Company
1209 Orange Street, Wilmington, DE 19801
(Name and address of agent for service)
Registrant's telephone number, including area code: 631-470-2600
Date of fiscal year end: 12/31
Date of reporting period: 12/31/22
Item 1. Reports to Stockholders.

Annual Report
December 31, 2022
TOPS® Managed Risk Balanced ETF Portfolio
TOPS® Managed Risk Growth ETF Portfolio
TOPS® Managed Risk Moderate Growth ETF Portfolio
Each a series of the Northern Lights Variable Trust
Distributed by Northern Lights Distributors, LLC
Member FINRA
A Message from the TOPS® Portfolio Management Team
End of Year 2022 Market Commentary
2022 – A Year of Survival
While we hope there were bright spots in 2022 for each of us, overall, it was a tough year for many investors. For stocks and bonds, 2022 was seemingly a year of survival. The S&P 500 Index (“the S&P 500”) fell 18.1% for the year, the 3rd worst year for the S&P 500 going back to 1980. Average bond investors did not fare much better, as the Bloomberg U.S. Aggregate Bond Index (the “U.S. Aggregate Bond Index”)lost 13.1%. Going back to 1976, this is the worst return for the U.S. Aggregate Bond Index and only the 5th negative annual return over that period. The next closest was a -3% loss in 1994.
With 2022 creating so many hurdles, many professional managers struggled as well. According to Bloomberg, there are 865 actively managed stock mutual funds domiciled in the U.S. with at least $1 Billion in assets. On average, those 865 mutual funds lost -19% in 2022. Likewise, a 60/40 mix of the S&P 500 and U.S. Aggregate Bond Index would have returned a loss of about 16.1%
We are pleased to report all our managed risk strategies outperformed the S&P 500 and the average large cap U.S. actively managed mutual fund handily (net of fees). Likewise, our Managed Risk Balanced ETF Portfolio (with a target equity/bond mix of 50/50) and our Managed Risk Moderate Growth ETF Portfolio (with a target equity/bond mix of 65/35) outperformed the aforementioned 60/40 index by several percent for the year.
The strong relative performance of the TOPS strategies was driven by a few key elements. The diversification of our equity allocations aided TOPS in outperforming, as large cap growth stocks (a large component of the S&P 500) struggled. For several years, we had highlighted concerns over valuations of large cap growth stocks, and the concerns came to reality in 2022. On the fixed income side, TOPS had the best relative overall outperformance in the 20-year history of our management. Investors in our balanced strategy, for example, will note their fixed income holdings outperformed the U.S. Aggregate Bond Index by about several percent for the year. This outperformance was primarily provided by the risk management strategies TOPS employed to reduce the interest rate risk for our investors. For several years, we have highlighted the high level of interest rate risk and made changes to our strategic allocations to provide, what we feel was, a better risk vs. return position. As this interest rate risk materialized at a meaningful level, our investors benefitted considerably.
TOPS provides long-term strategic portfolios for serious investors, focused on optimizing the amount of return we can target for the amount of risk we are taking. We feel TOPS has provided appropriate returns over the two decades of serving our investors. Likewise, we are very pleased we were able to survive 2022 in much better shape than most and to provide meaningful value for our investors.
We often discuss investment markets using the term “cycles.” As the literal meaning would connotate, markets tend to follow certain cycles for various lengths of time. The pervasive cycle of outperformance of large cap growth U.S. stocks, primarily tech stocks, lasted for about a decade. When the tide receded for growth stocks, the exceptionally high valuations revealed risk levels higher than most investors were willing to take. Further, the long cycle of growth outperformance was fueled by abnormally low interest rates and extremely high access to capital. We believe, the next decade may look very different.
As we look out to the next 10 years, we see an environment where the Federal Reserve (the “Fed”) may be much less accommodating than the last 10 years. The era of the “Fed Put”, the Fed bailing out markets at every slip, seems to be over for now. At least for the next few years, higher interest rates should significantly increase the cost of capital for growth companies. Also, investors will likely ask for more concrete results when the risk-free rate (U.S. Treasury yield) is providing returns over 4%. This may have been a contributor as Tesla saw its stock price fall -65% in 2022, followed by Apple and Microsoft, at -26.3% and -27.9% respectively. Despite these significant retractions, valuations for large cap growth stocks remain higher than most of the other major asset classes we maintain exposure to.
Given what we know, and the modeling we employ regarding what we do not know for sure, we believe our TOPS strategies are well positioned for the next 10 years. Importantly, we are encouraged by the higher yields available for fixed income holdings and the historically attractive valuations for many of our asset classes, such as small cap, mid cap, international and emerging markets. Additionally, we highlight the continued historically strong valuation of the U.S. Dollar (USD). If the USD were to weaken in 2023 (or throughout the next cycle), it would be a boost to the returns of our international investments.
After discussing Q4 2022 financial market results, we will address three general themes important to TOPS portfolio returns and strategies:
| 1) | It is all about the Fed |
| 2) | If we have a 2023 recession, what will it look like? |
| 3) | What’s in store for stocks and bonds in 2023? |
Year-To-Date Markets Review
Equity indexes saw positive returns in the fourth quarter. Value stocks (S&P 500 Value) outperformed growth stocks (S&P 500 Growth), returning +13.6% and +1.4%, respectively. Midcap (S&P 400, +10.8%) outperformed both small cap equities (S&P 600, +9.2%) and large cap equities (S&P 500, +7.6%). Developed international (MSCI EAFE) returned +17.3%, outpacing emerging markets (MSCI Emerging Markets), which returned +9.7%. Natural resources (S&P GSSI NA Natural Resources) and real estate (MSCI World Real Estate) were both positive as well in the fourth quarter, up +18.3% and +5.6%, respectively.
Even with a positive fourth quarter, most equity indexes were still negative for the year. The exception is natural resources with the S&P GSSI Natural Resources Index providing +34.1% returns in 2022. Value stocks (S&P 500 Value) returned -5.2% and significantly outperformed growth stocks (S&P 500 Growth), which returned -29.4%. Midcap (S&P 400, -13.1%) outperformed both small cap equities (S&P 600, -16.1%) and large cap equities (S&P 500, -18.1%). Developed international (MSCI EAFE) returned -14.5% this year, outpacing emerging markets (MSCI Emerging Markets) which returned -7.0%. Real estate (MSCI World Real Estate) was down -25.1% in 2022.
Like equity returns, we also started to see positive fixed income returns in the fourth quarter. The Bloomberg U.S. Aggregate Bond Index had a +1.9% return for the quarter, while the Bloomberg U.S. TIPS Index was up +2.0%. Credit (ICE BofA U.S. Corporate Index, +3.5%) outperformed government (ICE BofA U.S. Treasury Index, +0.7%). High yield (Solactive USD High Yield Corporates, +4.2%), investment grade corporates (iBoxx USD Liquid Investment Grade Index, +4.2%), and international bond indexes (Bloomberg Global Aggregate ex-USD, +0.1%) were also positive. The 10-year U.S. Treasury yield increased from 3.83% to 3.88% in the fourth quarter.
For the year, we saw credit (ICE BofA U.S. Corporate Index, -15.4%) underperform government (ICE BofA U.S. Treasury Index, -12.9%), and shorter duration holdings outperform longer duration holdings. This was seen in both credit markets, with the Bloomberg U.S. Corporate 1-3 year (-3.3%), and government markets, Bloomberg U.S. Treasury 1-3 Year (-3.8%), where the shorter duration indexes outperformed the previously mentioned full duration indexes. Even with positive fourth quarter returns, high yield (Solactive USD High Yield Corporates, -11.0%), international bond indexes (Bloomberg Global Aggregate ex-USD, -12.7%), and investment grade corporates (iBoxx USD Liquid Investment Grade Index, -17.9%) remained negative for the year. Over the course of 2022, the 10-year U.S. Treasury yield increased from 1.52% to 3.88%.
It is all about the Fed
As we discussed throughout 2022, the Federal Reserve remains in the economic driver seat. The Fed is carrying out a tightening monetary policy in an effort to cool high levels of inflation. For stock investors, a major fear is that a strong labor market may force the Fed to maintain high (and/or increasing) interest rates until they push the economy into recession (directly or indirectly).
As we model this situation, we are consistently asking ourselves, what can go right and what can go wrong? Ultimately, there are many inputs of varying impact which will decide the highest level of the Fed Funds Rate (called the terminal rate) and the amount of time it stays there. Levels of inflation, employment and wage growth will likely be the most impactful inputs.
Just after the end of the year, we got the December jobs numbers. According to the Wall Street Journal, “Employers added 223,000 jobs in December, the smallest gain in two years, the Labor Department said Friday. Average hourly earnings were up 4.6% in December from the previous year, the narrowest increase since mid-2021, and down from a March peak of 5.6%.” The report could be considered Goldilocks, not too hot and not too cool.
In response to the numbers, BMO reminded us, “the Fed has assumed that a strong labor market would lead to excessive wage growth which, in turn, would lead to inflation pressures.” Maybe though, we can thread the needle and have inflation cool even as jobs remain robust. For this to happen, wage growth must remain tame. These numbers, along with recent highly publicized layoffs in the tech arena, are encouraging investors that the Fed may back off a bit in response to the Goldilocks report. However, there are still about 1.8 jobs per each unemployed worker, according to Lazard. Likewise, Labor Force Participation numbers remain at the lowest levels since the 1970s, other than the depths of the pandemic of course. Both facts would typically place upward pressure on wages.
The next Fed policy meeting starts January 31st. Currently, markets are pricing in an equal probability of a 0.25% or 0.50% rate increase at the meeting. Before that meeting, important inflation figures, called the Consumer Price Index (CPI), will be released on January 12th. Fortunately, inputs to the CPI number seem to be trending lower, including gas prices, used car prices, residential rent, goods prices, and retail prices.
As the Fed saga of 2022 enters another year, we continue the search for the soft landing, the opportunity for inflation to subside without a significant recession. The Fed has outlined that their path is going to be data driven and take a while, so patience is necessary. As noted in previous messages, though, we believe stocks will be leading indicators and eventually lead coming out of any economic slowdown.
If we have a 2023 recession, what will it look like?
The word recession can strike fear for investors. However, recessions do happen, and they are likely a necessary evil in the longer-term success of economies. Economists believe we are more likely than not to have a recession in 2023. In Bloomberg’s December survey of economists, the consensus estimate was a 70% chance of recession in 2023, up from 65% in November. The story is much bigger than whether we experience a recession though. The key for markets will be the type of recession we get (if one develops). Will it be short or long? Deep or shallow? Broad or rolling?
A recession which is short, shallow, and rolling looks very different from a recession which is long, deep, and broad. Obviously, there are many different combinations between as well. A recession which is short, shallow, and rolling could have little impact on stocks. Actually, stocks may respond positively, as a mellow recession would potentially be better than what is currently priced into stocks. We do not believe stocks have priced in a long, deep, and broad recession. If a long, deep, and broad recession materializes, we believe this will have a negative short-term impact on stock prices.
It is impossible for anyone to confidently predict whether a recession is coming or not, let alone what that recession will look like. According to our research, we feel there is at least a 50% chance we see a recession in 2023. However, we believe stock prices are already reflecting some recessionary concerns and the likelihood of a long, deep, and broad recession is quite low.
Regardless of whether we experience a recession in 2023, we believe our allocations remain appropriate for our long-term investors. Now that 2023 is starting, stock valuations are already starting to reflect earnings in 2024 and beyond, which look pretty good at this point. Ultimately, earnings are the fuel for stocks. Over the next 12-24 months, we are likely to see analysts making meaningful adjustments to earnings expectations, as the Fed saga plays out and the recession question gets answered. While 2023 may in fact turn out to be another “year of survival”, longer-term investors should be rewarded for that risk.
What’s in store for stocks and bonds in 2023?
For quite a long time, we highlighted the relatively high valuations U.S. large cap stocks were recording. As expected, given the concerns of the year, 2022 resulted in “blowing off the froth” on stock valuations. Valuations, which were well above average, fell closer to average for large caps. The story was different for small caps, mid-caps, international and emerging markets though. For these markets, valuations started the decline at lower levels. So, these markets blew off a much smaller amount of froth before they hit averages and are now hovering well below average.
How does this impact 2023? Well, as mentioned earlier, there is no guarantee 2023 will be the end of the current Fed saga. Successful investing typically requires patience, and 2023 may test the patience of all of us. On the other hand, if the Fed is successful in corralling inflation and delivering a soft landing, the expected bounce in securities may be led by some of the markets which currently exhibit more attractive valuations.
Historically, small cap stocks have tended to lead coming out of bear markets, international stocks boast attractive valuations, and there is potential for USD trends to revert. These factors lead us to believe some of these asset classes have a viable opportunity for strong performance when “risk on” shifts into gear. Included in our analysis, and relative focus on diversified asset classes, is the concern it could be another tough year for tech stocks, and it might be a bold time to bargain shop for vanity brands, such as Tesla, etc. Many of these darlings remain highly valued, even after major pullbacks from astronomic price levels.
In the bond market, we expect to be very involved. At this point, we remain cautious of further interest rate risk and are being rewarded for holding a relatively short duration on our bond portfolio overall. As the interest rate and credit environments evolve, we will continue to put our two decades of experience to work for our investors. If the opportunity presents itself, we would like to return towards our long-term duration target near that of the U.S. Aggregate Bond Index.
TOPS Portfolio Strategies
We cannot say we are sad to see 2022 go. Our 20th year of managing portfolios (as a firm) was one of the toughest we have had. While still paling in comparison to the challenges of the financial crisis in 2008, 2022 provided unique trials. That being said, from a relative perspective, 2022 was a very strong year for our portfolios. An accountant’s job is not to bring your tax bill to zero; their job is to professionally execute a strategy which provides the best overall result, accounting for risk and return of tax strategies. Our role is similar in many ways; in that vein, we are pleased with what we were able to provide in a year of survival.
Now that we have survived 2022, we live to fight another day. With the confidence of our investors, we will continue to strive to deliver results to the best of our abilities. Beyond our strategic guidance, we will employ tactics for tax efficiency, index investing, sophisticated trading and cost management to help us as well. Thank you to all our investors for your confidence in us throughout the storm of 2022, and your confidence in us leading up to 2023, which provided us the opportunity to fight for you last year.
Summary of the Milliman Managed Risk Strategy™ (MMRS)
Overall, 2022 was a challenging year for investors, as markets factored in the increasing likelihood of a global recession. The uncertain environment led to a rise in volatility and pushed stocks down for most of the year, but also created a repeating whipsaw pattern as investors anxiously navigated the cycles of economic data and interest rate decisions. Inflation reached 40-year highs as central banks were forced into undertaking one of the strongest rate hiking cycles in decades. The Federal Reserve hiked the Fed Funds Rate by 425bps, the largest net calendar increase since 1972. Meanwhile, the conflict in Ukraine and China’s zero COVID policy put stress on supply chains, further exacerbating inflation and volatility. Stocks and bonds declined together for the first time since the 1960s.
Growth stocks were disproportionally affected by the aggressive rate hikes and the Nasdaq 100 Index was one of the worst performers for the year, down over 32%. Small caps also underperformed large caps during 2022 – Russell 2000 fell 20.44% for the year, a larger loss than the S&P 500’s -18.11%. The MSCI EAFE declined 13.9% for the year, outperforming domestic indices due in large part to the UK’s outperformance through an evolving political landscape that ultimately led markets to regain confidence in the final quarter.
There were, however, some periods of positive market gains in early Q3 when stocks and bonds both rebounded due to resilient corporate earnings in hopes that the end of the rate hiking cycle may come sooner than anticipated. However, sentiment turned negative shortly after and Q3 ended on a sour note in the end. Then, from Mid-October through November equity markets rallied again, posting the first two consecutive months of gains in 2022. However, the rally took a step back in December, as central banks reiterated their commitment to combatting inflation while employment and job market data remained strong.
In this environment, the TOPS Managed Risk Funds sustained defensive hedge positions throughout the year (on average reducing equity exposure by 34% for TOPS Managed Risk Growth ETF, 22% for TOPS Managed Risk Moderate Growth ETF, and 16% for TOPS Managed Risk Balanced ETF) and benefitted from reduced volatility and improved maximum drawdowns (largest peak-to-trough decline) during the year. Furthermore, the TOPS Managed Risk portfolios outperformed their S&P 500 benchmarks and outperformed relevant internal portfolio management team benchmarks for the year.
The MSCI EAFE® Index is a free float-adjusted market capitalization index that is designed to measure the equity market performance of developed markets, excluding the U.S. & Canada. As of June 2007 the MSCI EAFE Index consisted of the following 21 developed market country indices: Australia, Austria, Belgium, Denmark, Finland, France, Germany, Greece, Hong Kong, Ireland, Italy, Japan, the Netherlands, New Zealand, Norway, Portugal, Singapore, Spain, Sweden, Switzerland, and the United Kingdom.
The MSCI Emerging Markets Index is a free float-adjusted, market capitalization-weighted index designed to measure the combined equity market performance of the materials sector of emerging markets countries. Component securities include those of chemical companies, construction materials companies, containers and packaging companies, metals and mining companies, and paper and forest products companies.
The S&P 500® Index is an unmanaged composite of 500 large capitalization companies. This index is widely used by professional investors as a performance benchmark for large-cap stocks.
The S&P Growth Index represents the growth companies of the S&P 500 Index.
The S&P MidCap 400® measures the mid-cap segment of the U.S.equity market. The index is designed to be an investable portfolio of companies that meet specific inclusion criteria to ensure that they are liquid and financially viable.
The S&P SmallCap 600® measures the small cap segment of the U.S. equity market. The index is designed to be an investable portfolio of companies that meet specific inclusion criteria to ensure that they are liquid and financially viable.
The Bloomberg U.S. Aggregate Bond Index is weighted according to market capitalization, which means the securities represented in the index are weighted according to the market size of the bond category. Treasury securities, mortgage-backed securities (“MBS”) foreign bonds, government agency bonds and corporate bonds are some of the categories included in the index. The bonds represented are medium term with an average maturity of about 4.57 years. In all, the index represents about 8,200 fixed-income securities with a total value of approximately $15 trillion (about 43% of the total U.S. bond market).
The Bloomberg U.S. Treasury Inflation Protected Securities Index (“TIPS”) Index includes all publicly issued, U.S. Treasury inflation-protected securities that have at least one year remaining to maturity, are rated investment grade, and have $250 million or more of outstanding face value.
You cannot invest directly in an index and unmanaged index returns do not reflect any fees, expenses or sales charges. Past Performance is no guarantee of future results. Past performance does not guarantee future results, and current performance may be lower or higher than the data quoted.
5162-NLD-01312023
| TOPS® Managed Risk Balanced ETF Portfolio |
| Portfolio Review (Unaudited) |
| December 31, 2022 |
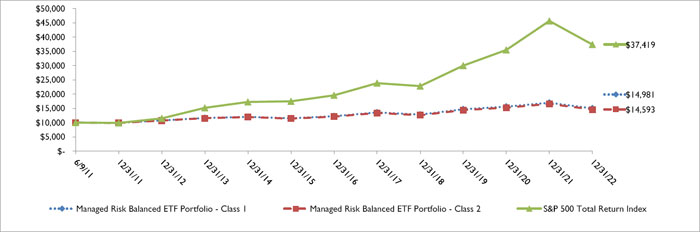
The Portfolio’s Average Annual Total Return through December 31, 2022*, as compared to its benchmark:
| | | | | Performance Since | Performance Since | Since |
| | One | Five | Ten | Inception | Inception | Inception |
| | Year | Year | Year | (6/9/11)** | (5/1/12)*** | (7/22/15)**** |
| Managed Risk Balanced ETF Portfolio | | | | | | |
| Class 1 | -11.75% | 1.97% | 3.36% | 3.56% | N/A | N/A |
| Class 2 | -11.85% | 1.76% | 3.13% | 3.32% | N/A | N/A |
| Class 3 | -12.08% | 1.61% | 3.00% | N/A | 3.18% | N/A |
| Class 4 | -12.17% | 1.40% | 2.77% | N/A | 2.84% | N/A |
| Investor Class | -11.73% | 1.53% | N/A | N/A | N/A | 2.34% |
| S&P 500 Total Return Index ***** | -18.11% | 9.42% | 12.56% | 12.09% | 12.05% | 10.41% |
| * | The performance data quoted is historical. Past performance is no guarantee of future results. Current performance may be higher or lower than the performance data quoted. The principal value and investment return of an investment will fluctuate so that your shares, when redeemed, may be worth more or less than their original cost. The returns shown do not reflect the deduction of taxes that a shareholder would pay on Portfolio distributions or on the redemption of Portfolio shares as well as other charges and expenses of the insurance contract, or separate account. Per the fee table in the most recent prospectus, the Portfolio’s total annual operating expense ratios including acquired fund fees and expenses, for Class 1, Class 2, Class 3, Class 4, and Investor Class are 0.50%, 0.75%, 0.85%, 1.10%, and 1.00% respectively. For performance information current to the most recent month-end, please call 1-855-572-5945. |
| ** | Class 1 and Class 2’s inception date was June 9, 2011. |
| *** | Class 3 and Class 4’s inception date was May 1, 2012. |
| **** | Investor Class’s inception date was July 22, 2015. |
| ***** | The S&P 500 Total Return Index is an unmanaged market capitalization-weighted index of 500 of the largest capitalized U.S. domiciled companies. Index returns assume reinvestment of dividends. Investors may not invest in the index directly; unlike the Portfolio’s returns, the Index does not reflect any fees or expenses. |
Comparison of the Change in Value of a $10,000 Investment
| Holdings by Asset Class as of December 31, 2022 | | % of Net Assets | |
| Exchange-Traded Funds - Equity | | | 45.1 | % |
| Exchange-Traded Funds - Fixed Income | | | 43.2 | % |
| Short-Term Investments | | | 17.3 | % |
| Liabilities in Excess of Other Assets | | | (5.6 | %) |
| | | | 100.0 | % |
Please refer to the Schedule of Investments in this annual report for a detailed listing of the Portfolio’s holdings.
| TOPS® Managed Risk Growth ETF Portfolio |
| Portfolio Review (Unaudited) |
| December 31, 2022 |
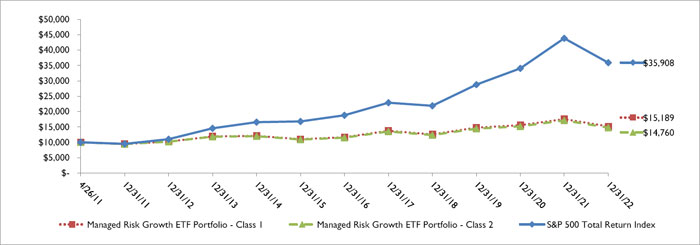
The Portfolio’s Average Annual Total Return through December 31, 2022*, as compared to its benchmark:
| | | | | Performance Since | Performance Since | Since |
| | One | Five | Ten | Inception | Inception | Inception |
| | Year | Year | Year | (4/26/11)** | (5/1/12)*** | (7/22/15)**** |
| Managed Risk Growth ETF Portfolio | | | | | | |
| Class 1 | -13.45% | 2.02% | 4.03% | 3.64% | N/A | N/A |
| Class 2 | -13.73% | 1.77% | 3.77% | 3.39% | N/A | N/A |
| Class 3 | -13.79% | 1.68% | 3.72% | N/A | 3.67% | N/A |
| Class 4 | -13.86% | 1.44% | 3.43% | N/A | 3.53% | N/A |
| Investor Class | -13.38% | 1.62% | N/A | N/A | N/A | 2.66% |
| S&P 500 Total Return Index ***** | -18.11% | 9.42% | 12.56% | 11.56% | 12.05% | 10.41% |
| * | The performance data quoted is historical. Past performance is no guarantee of future results. Current performance may be higher or lower than the performance data quoted. The principal value and investment return of an investment will fluctuate so that your shares, when redeemed, may be worth more or less than their original cost. The returns shown do not reflect the deduction of taxes that a shareholder would pay on Portfolio distributions or on the redemption of Portfolio shares as well as other charges and expenses of the insurance contract, or separate account. Per the fee table in the most recent prospectus, the Portfolio’s total annual operating expense ratios including acquired fund fees and expenses, for Class 1, Class 2, Class 3, Class 4, and Investor Class are 0.49%, 0.74%, 0.84%, 1.09%, and 0.99% respectively. For performance information current to the most recent month-end, please call 1-855-572-5945. |
| ** | Class 1 and Class 2’s inception date was April 26, 2011. |
| *** | Class 3 and Class 4’s inception date was May 1, 2012. |
| **** | Investor Class’s inception date was July 22, 2015. |
| ***** | The S&P 500 Total Return Index is an unmanaged market capitalization-weighted index of 500 of the largest capitalized U.S. domiciled companies. Index returns assume reinvestment of dividends. Investors may not invest in the index directly; unlike the Portfolio’s returns, the Index does not reflect any fees or expenses. |
Comparison of the Change in Value of a $10,000 Investment
| Holdings by Asset Class as of December 31, 2022 | | % of Net Assets | |
| Exchange-Traded Funds - Equity | | | 76.5 | % |
| Exchange-Traded Funds - Fixed Income | | | 11.6 | % |
| Short-Term Investments | | | 12.1 | % |
| Liabilities in Excess of Other Assets | | | (0.2 | %) |
| | | | 100.0 | % |
Please refer to the Schedule of Investments in this annual report for a detailed listing of the Portfolio’s holdings.
| TOPS® Managed Risk Moderate Growth ETF Portfolio |
| Portfolio Review (Unaudited) |
| December 31, 2022 |
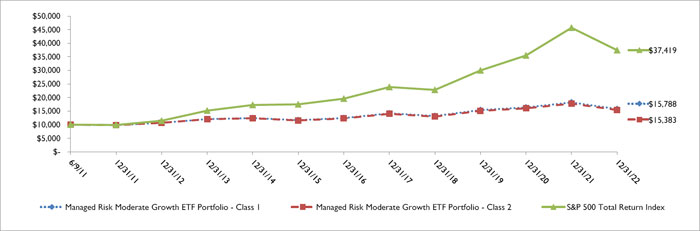
The Portfolio’s Average Annual Total Return through December 31, 2022*, as compared to its benchmark:
| | | | | Performance Since | Performance Since | Since |
| | One | Five | Ten | Inception | Inception | Inception |
| | Year | Year | Year | (6/9/11)** | (5/1/12)*** | (7/22/15)**** |
| Managed Risk Moderate Growth ETF Portfolio | | | | | | |
| Class 1 | -13.22% | 2.16% | 3.97% | 4.03% | N/A | N/A |
| Class 2 | -13.35% | 1.92% | 3.72% | 3.80% | N/A | N/A |
| Class 3 | -13.53% | 1.80% | 3.64% | N/A | 3.66% | N/A |
| Class 4 | -13.76% | 1.53% | 3.34% | N/A | 3.43% | N/A |
| Investor Class | -12.84% | 1.79% | N/A | N/A | N/A | 2.64% |
| S&P 500 Total Return Index ***** | -18.11% | 9.42% | 12.56% | 12.09% | 12.05% | 10.41% |
| * | The performance data quoted is historical. Past performance is no guarantee of future results. Current performance may be higher or lower than the performance data quoted. The principal value and investment return of an investment will fluctuate so that your shares, when redeemed, may be worth more or less than their original cost. The returns shown do not reflect the deduction of taxes that a shareholder would pay on Portfolio distributions or on the redemption of Portfolio share as well as other charges and expenses of the insurance contract, or separate account. Per the fee table in the most recent prospectus, the Portfolio’s total annual operating expense ratios including acquired fund fees and expenses, for Class 1, Class 2, Class 3, Class 4, and Investor Class are 0.49%, 0.74%, 0.84%, 1.09%, and 0.99% respectively. For performance information current to the most recent month-end, please call 1-855-572-5945. |
| ** | Class 1 and Class 2’s inception date was June 9, 2011. |
| *** | Class 3 and Class 4’s inception date was May 1, 2012. |
| **** | Investor Class’s inception date was July 22, 2015. |
| ***** | The S&P 500 Total Return Index is an unmanaged market capitalization-weighted index of 500 of the largest capitalized U.S. domiciled companies. Index returns assume reinvestment of dividends. Investors may not invest in the index directly; unlike the Portfolio’s returns, the Index does not reflect any fees or expenses. |
Comparison of the Change in Value of a $10,000 Investment
| Holdings by Asset Class as of December 31, 2022 | | % of Net Assets | |
| Exchange-Traded Funds - Equity | | | 58.5 | % |
| Exchange-Traded Funds - Fixed Income | | | 29.6 | % |
| Short-Term Investments | | | 14.9 | % |
| Liabilities in Excess of Other Assets | | | (3.0 | %) |
| | | | 100.0 | % |
Please refer to the Schedule of Investments in this annual report for a detailed listing of the Portfolio’s holdings.
| TOPS® Managed Risk Balanced ETF Portfolio |
| Schedule of Investments |
| December 31, 2022 |
| Shares | | | | | Fair Value | |
| | | | | EXCHANGE-TRADED FUNDS — 88.3% | | | | |
| | | | | EQUITY - 45.1% | | | | |
| | 36,962 | | | FlexShares Global Upstream Natural Resources Index Fund | | $ | 1,606,738 | |
| | 11,302 | | | iShares MSCI Emerging Markets ex China ETF | | | 536,506 | |
| | 63,241 | | | SPDR Portfolio S&P 400 Mid Cap ETF | | | 2,687,743 | |
| | 21,170 | | | SPDR Portfolio S&P 500 Growth ETF | | | 1,072,684 | |
| | 97,211 | | | SPDR Portfolio S&P 500 Value ETF | | | 3,780,536 | |
| | 58,128 | | | SPDR Portfolio S&P 600 Small Cap ETF | | | 2,148,992 | |
| | 102,312 | | | Vanguard FTSE Developed Markets ETF | | | 4,294,035 | |
| | 41,185 | | | Vanguard FTSE Emerging Markets ETF | | | 1,605,391 | |
| | 39,288 | | | Vanguard Global ex-U.S. Real Estate ETF | | | 1,624,166 | |
| | 19,535 | | | Vanguard Real Estate ETF | | | 1,611,247 | |
| | 13,779 | | | Vanguard S&P 500 ETF | | | 4,841,113 | |
| | 39,869 | | | Wisdomtree Emerging Markets EX-State-Owned Enterprises Fund | | | 1,063,705 | |
| | | | | | | | 26,872,856 | |
| | | | | FIXED INCOME - 43.2% | | | | |
| | 40,259 | | | iShares iBoxx $ Investment Grade Corporate Bond ETF | | | 4,244,505 | |
| | 71,068 | | | SPDR Bloomberg Investment Grade Floating Rate ETF | | | 2,159,757 | |
| | 91,554 | | | SPDR Portfolio Short Term Corporate Bond ETF(a) | | | 2,689,857 | |
| | 66,172 | | | VanEck Vectors J.P. Morgan EM Local Currency Bond ETF | | | 1,603,348 | |
| | 27,354 | | | Vanguard Intermediate-Term Treasury ETF(a) | | | 1,599,662 | |
| | 23,575 | | | Vanguard Mortgage-Backed Securities ETF(a) | | | 1,073,134 | |
| | 138,131 | | | Vanguard Short-Term Inflation-Protected Securities ETF | | | 6,452,098 | |
| | 55,785 | | | Vanguard Short-Term Treasury ETF | | | 3,225,489 | |
| | 11,174 | | | Vanguard Total International Bond ETF | | | 529,983 | |
| | 63,036 | | | Xtrackers USD High Yield Corporate Bond ETF | | | 2,124,944 | |
| | | | | | | | 25,702,777 | |
| | | | | | | | | |
| | | | | TOTAL EXCHANGE-TRADED FUNDS (Cost $54,720,419) | | | 52,575,633 | |
| | | | | | | | | |
| Shares | | | | | Fair Value | |
| | | | | SHORT-TERM INVESTMENTS — 17.3% | | | | |
| | | | | COLLATERAL FOR SECURITIES LOANED - 6.4% | | | | |
| | 3,813,979 | | | Federated Hermes Government Obligations Fund, Institutional Class, 4.15% (Cost $3,813,979)(b) | | | 3,813,979 | |
| TOPS® Managed Risk Balanced ETF Portfolio |
| Schedule of Investments (Continued) |
| December 31, 2022 |
| Shares | | | | | Fair Value | |
| | | | | SHORT-TERM INVESTMENTS — 17.3% (Continued) | | | | |
| | | | | MONEY MARKET FUNDS - 10.9% | | | | |
| | 6,477,964 | | | STIT - Government & Agency Portfolio, Institutional Class, 4.21% (Cost $6,477,964)(b) | | $ | 6,477,964 | |
| | | | | | | | | |
| | | | | TOTAL SHORT-TERM INVESTMENTS (Cost $10,291,943) | | | 10,291,943 | |
| | | | | | | | | |
| | | | | TOTAL INVESTMENTS - 105.6% (Cost $65,012,362) | | $ | 62,867,576 | |
| | | | | LIABILITIES IN EXCESS OF OTHER ASSETS - (5.6)% | | | (3,319,727 | ) |
| | | | | NET ASSETS - 100.0% | | $ | 59,547,849 | |
| OPEN FUTURES CONTRACTS | |
| Number of | | | | | | | | Notional | | | Value and
Unrealized | |
| Contracts | | Open Long Futures Contracts | | Broker | | Expiration | | Amount(c) | | | Depreciation | |
| 30 | | CBOT 5 Year US Treasury Note | | Bank of America Merrill Lynch | | 03/31/2023 | | $ | 3,237,900 | | | $ | (3,545 | ) |
| | | TOTAL FUTURES CONTRACTS | | | | | | | | | | | | |
| | | | | | | | | | | | | | | |
| OPEN FUTURES CONTRACTS | |
| Number of | | | | | | | | Notional | | | Value and
Unrealized | |
| Contracts | | Open Short Futures Contracts | | Broker | | Expiration | | Amount(c) | | | Appreciation | |
| 8 | | CME E-Mini Russell 2000 Index Futures | | Bank of America Merrill Lynch | | 03/17/2023 | | $ | 708,360 | | | $ | 20,790 | |
| 19 | | CME E-Mini Standard & Poor’s 500 Index Futures | | Bank of America Merrill Lynch | | 03/17/2023 | | | 3,667,950 | | | | 104,032 | |
| 5 | | CME E-Mini Standard & Poor’s MidCap 400 Index Futures | | Bank of America Merrill Lynch | | 03/17/2023 | | | 1,221,300 | | | | 30,195 | |
| 19 | | ICE US Mini MSCI EAFE Index Futures | | Bank of America Merrill Lynch | | 03/17/2023 | | | 1,851,930 | | | | 27,855 | |
| 34 | | ICE US MSCI Emerging Markets EM Index Futures | | Bank of America Merrill Lynch | | 03/17/2023 | | | 1,630,980 | | | | 19,940 | |
| | | TOTAL FUTURES CONTRACTS | | | | | | | | | | $ | 202,812 | |
| | | | | | | | | | | | | | | |
| CBOT | - Chicago Board of Trade |
| CME | - Chicago Mercantile Exchange |
| ETF | - Exchange-Traded Fund |
| ICE | - Intercontinental Exchange |
| MSCI | - Morgan Stanley Capital International |
| SPDR | - Standard & Poor’s Depositary Receipt |
| (a) | All or a portion of this security is on loan. Total loaned securities had a value of $3,737,539 at December 31, 2022. The loaned securities were secured with cash collateral of $3,813,979. The Portfolio cannot pledge or resell the collateral. |
| (b) | Rate disclosed is the seven day effective yield as of December 31, 2022. |
| (c) | The amounts shown are the underlying reference notional amounts to stock exchange indices, equities and treasury notes upon which the fair value of the futures contracts held by the Portfolio are based. Notional values do not represent the current fair value of, and are not necessarily indicative of the future cash flows of the Portfolio’s futures contracts. Further, the underlying price changes in relation to the variables specified by the notional values affects the fair value of these derivative financial instruments. The notional values as set forth within this schedule do not purport to represent economic value at risk to the Portfolio. |
| TOPS® Managed Risk Growth ETF Portfolio |
| Schedule of Investments |
| December 31, 2022 |
| Shares | | | | | Fair Value | |
| | | | | EXCHANGE-TRADED FUNDS — 88.1% | | | | |
| | | | | EQUITY - 76.5% | | | | |
| | 161,487 | | | FlexShares Global Upstream Natural Resources Index Fund(a) | | $ | 7,019,840 | |
| | 74,071 | | | iShares MSCI Emerging Markets ex China ETF | | | 3,516,150 | |
| | 455,938 | | | SPDR Portfolio S&P 400 Mid Cap ETF | | | 19,377,365 | |
| | 138,757 | | | SPDR Portfolio S&P 500 Growth ETF | | | 7,030,817 | |
| | 227,545 | | | SPDR Portfolio S&P 500 Value ETF | | | 8,849,225 | |
| | 380,975 | | | SPDR Portfolio S&P 600 Small Cap ETF | | | 14,084,646 | |
| | 711,325 | | | Vanguard FTSE Developed Markets ETF | | | 29,854,310 | |
| | 226,020 | | | Vanguard FTSE Emerging Markets ETF | | | 8,810,260 | |
| | 128,749 | | | Vanguard Global ex-U.S. Real Estate ETF | | | 5,322,484 | |
| | 42,678 | | | Vanguard Real Estate ETF | | | 3,520,081 | |
| | 105,363 | | | Vanguard S&P 500 ETF | | | 37,018,236 | |
| | 197,514 | | | Wisdomtree Emerging Markets EX-State-Owned Enterprises Fund | | | 5,269,674 | |
| | | | | | | | 149,673,088 | |
| | | | | FIXED INCOME - 11.6% | | | | |
| | 32,981 | | | iShares iBoxx $ Investment Grade Corporate Bond ETF | | | 3,477,187 | |
| | 144,558 | | | VanEck Vectors J.P. Morgan EM Local Currency Bond ETF | | | 3,502,640 | |
| | 38,398 | | | Vanguard Mortgage-Backed Securities ETF(a) | | | 1,747,877 | |
| | 113,164 | | | Vanguard Short-Term Inflation-Protected Securities ETF | | | 5,285,890 | |
| | 60,936 | | | Vanguard Short-Term Treasury ETF | | | 3,523,320 | |
| | 155,420 | | | Xtrackers USD High Yield Corporate Bond ETF(a) | | | 5,239,208 | |
| | | | | | | | 22,776,122 | |
| | | | | | | | | |
| | | | | TOTAL EXCHANGE-TRADED FUNDS (Cost $166,917,769) | | | 172,449,210 | |
| TOPS® Managed Risk Growth ETF Portfolio |
| Schedule of Investments (Continued) |
| December 31, 2022 |
| Shares | | | | | Fair Value | |
| | | | | SHORT-TERM INVESTMENTS — 12.1% | | | | |
| | | | | COLLATERAL FOR SECURITIES LOANED - 2.1% | | | | |
| | 4,070,448 | | | Federated Hermes Government Obligations Fund, Institutional Class, 4.15% (Cost $4,070,448)(b) | | $ | 4,070,448 | |
| | | | | | | | | |
| | | | | MONEY MARKET FUNDS - 10.0% | | | | |
| | 19,511,135 | | | STIT - Government & Agency Portfolio, Institutional Class, 4.21% (Cost $19,511,135)(b) | | | 19,511,135 | |
| | | | | | | | | |
| | | | | TOTAL SHORT-TERM INVESTMENTS (Cost $23,581,583) | | | 23,581,583 | |
| | | | | | | | | |
| | | | | TOTAL INVESTMENTS - 100.2% (Cost $190,499,352) | | $ | 196,030,793 | |
| | | | | LIABILITIES IN EXCESS OF OTHER ASSETS - (0.2)% | | | (394,536 | ) |
| | | | | NET ASSETS - 100.0% | | $ | 195,636,257 | |
| OPEN FUTURES CONTRACTS | |
| Number of | | | | | | | | Notional | | | Value and
Unrealized | |
| Contracts | | Open Long Futures Contracts | | Broker | | Expiration | | Amount(c) | | | Depreciation | |
| 30 | | CBOT 5 Year US Treasury Note | | Bank of America Merrill Lynch | | 03/31/2023 | | $ | 3,237,900 | | | $ | (3,545 | ) |
| | | TOTAL FUTURES CONTRACTS | | | | | | | | | | | | |
| | | | | | | | | | | | | | | |
| OPEN FUTURES CONTRACTS | |
| Number of | | | | | | | | Notional | | | Value and
Unrealized | |
| Contracts | | Open Short Futures Contracts | | Broker | | Expiration | | Amount(c) | | | Appreciation | |
| 69 | | CME E-Mini Russell 2000 Index Futures | | Bank of America Merrill Lynch | | 03/17/2023 | | $ | 6,109,605 | | | $ | 139,820 | |
| 124 | | CME E-Mini Standard & Poor’s 500 Index Futures | | Bank of America Merrill Lynch | | 03/17/2023 | | | 23,938,200 | | | | 634,665 | |
| 39 | | CME E-Mini Standard & Poor’s MidCap 400 Index Futures | | Bank of America Merrill Lynch | | 03/17/2023 | | | 9,526,140 | | | | 164,745 | |
| 147 | | ICE US Mini MSCI EAFE Index Futures | | Bank of America Merrill Lynch | | 03/17/2023 | | | 14,328,090 | | | | 227,350 | |
| 212 | | ICE US MSCI Emerging Markets EM Index Futures | | Bank of America Merrill Lynch | | 03/17/2023 | | | 10,169,640 | | | | 131,620 | |
| | | TOTAL FUTURES CONTRACTS | | | | | | | | | | $ | 1,298,200 | |
| CBOT | - Chicago Board of Trade |
| CME | - Chicago Mercantile Exchange |
| ETF | - Exchange-Traded Fund |
| ICE | - Intercontinental Exchange |
| MSCI | - Morgan Stanley Capital International |
| SPDR | - Standard & Poor’s Depositary Receipt |
| (a) | All or a portion of this security is on loan. Total loaned securities had a value of $3,254,538 at December 31, 2022. The loaned securities were secured with cash collateral of $4,070,448. The Portfolio cannot pledge or resell the collateral. |
| (b) | Rate disclosed is the seven day effective yield as of December 31, 2022. |
| (c) | The amounts shown are the underlying reference notional amounts to stock exchange indices, equities and treasury notes upon which the fair value of the futures contracts held by the Portfolio are based. Notional values do not represent the current fair value of, and are not necessarily indicative of the future cash flows of the Portfolio’s futures contracts. Further, the underlying price changes in relation to the variables specified by the notional values affects the fair value of these derivative financial instruments. The notional values as set forth within this schedule do not purport to represent economic value at risk to the Portfolio. |
| TOPS® Managed Risk Moderate Growth ETF Portfolio |
| Schedule of Investments |
| December 31, 2022 |
| Shares | | | | | Fair Value | |
| | | | | EXCHANGE-TRADED FUNDS — 88.1% | | | | |
| | | | | EQUITY - 58.5% | | | | |
| | 91,112 | | | FlexShares Global Upstream Natural Resources Index Fund | | $ | 3,960,639 | |
| | 21,149 | | | iShares MSCI Emerging Markets ex China ETF | | | 1,003,943 | |
| | 189,345 | | | SPDR Portfolio S&P 400 Mid Cap ETF | | | 8,047,163 | |
| | 39,615 | | | SPDR Portfolio S&P 500 Growth ETF | | | 2,007,292 | |
| | 77,959 | | | SPDR Portfolio S&P 500 Value ETF | | | 3,031,826 | |
| | 163,158 | | | SPDR Portfolio S&P 600 Small Cap ETF | | | 6,031,951 | |
| | 285,649 | | | Vanguard FTSE Developed Markets ETF | | | 11,988,689 | |
| | 102,082 | | | Vanguard FTSE Emerging Markets ETF | | | 3,979,156 | |
| | 73,519 | | | Vanguard Global ex-U.S. Real Estate ETF | | | 3,039,275 | |
| | 24,370 | | | Vanguard Real Estate ETF | | | 2,010,038 | |
| | 51,569 | | | Vanguard S&P 500 ETF | | | 18,118,252 | |
| | 73,916 | | | Wisdomtree Emerging Markets EX-State-Owned Enterprises Fund | | | 1,972,079 | |
| | | | | | | | 65,190,303 | |
| | | | | FIXED INCOME - 29.6% | | | | |
| | 47,082 | | | iShares iBoxx $ Investment Grade Corporate Bond ETF | | | 4,963,855 | |
| | 308,370 | | | SPDR Portfolio Short Term Corporate Bond ETF | | | 9,059,911 | |
| | 82,546 | | | VanEck Vectors J.P. Morgan EM Local Currency Bond ETF | | | 2,000,090 | |
| | 17,117 | | | Vanguard Intermediate-Term Treasury ETF(a) | | | 1,001,002 | |
| | 43,715 | | | Vanguard Mortgage-Backed Securities ETF(a) | | | 1,989,907 | |
| | 129,237 | | | Vanguard Short-Term Inflation-Protected Securities ETF(a) | | | 6,036,660 | |
| | 34,678 | | | Vanguard Short-Term Treasury ETF | | | 2,005,082 | |
| | 20,975 | | | Vanguard Total International Bond ETF(a) | | | 994,844 | |
| | 147,995 | | | Xtrackers USD High Yield Corporate Bond ETF | | | 4,988,911 | |
| | | | | | | | 33,040,262 | |
| | | | | TOTAL EXCHANGE-TRADED FUNDS (Cost — $102,768,105) | | $ | 98,230,565 | |
| TOPS® Managed Risk Moderate Growth ETF Portfolio |
| Schedule of Investments (Continued) |
| December 31, 2022 |
| Shares | | | | | Fair Value | |
| | | | | SHORT-TERM INVESTMENTS — 14.9% | | | | |
| | | | | COLLATERAL FOR SECURITIES LOANED - 4.2% | | | | |
| | 4,684,598 | | | Federated Hermes Government Obligations Fund, Institutional Class, 4.15% (Cost $4,684,598)(b) | | $ | 4,684,598 | |
| | | | | | | | | |
| | | | | MONEY MARKET FUNDS - 10.7% | | | | |
| | 11,865,581 | | | STIT - Government & Agency Portfolio, Institutional Class, 4.21% (Cost $11,865,581)(b) | | | 11,865,581 | |
| | | | | | | | | |
| | | | | TOTAL SHORT-TERM INVESTMENTS (Cost $16,550,179) | | | 16,550,179 | |
| | | | | | | | | |
| | | | | TOTAL INVESTMENTS - 103.0% (Cost $119,318,284) | | $ | 114,780,744 | |
| | | | | LIABILITIES IN EXCESS OF OTHER ASSETS - (3.0)% | | | (3,368,632 | ) |
| | | | | NET ASSETS - 100.0% | | $ | 111,412,112 | |
| OPEN FUTURES CONTRACTS | |
| Number of | | | | | | | | Notional | | | Value and
Unrealized | |
| Contracts | | Open Long Futures Contracts | | Broker | | Expiration | | Amount(c) | | | Depreciation | |
| 39 | | CBOT 5 Year US Treasury Note | | Bank of America Merrill Lynch | | 03/31/2023 | | $ | 4,209,270 | | | $ | (4,605 | ) |
| | | TOTAL FUTURES CONTRACTS | | | | | | | | | | | | |
| | | | | | | | | | | | | | | |
| OPEN FUTURES CONTRACTS | |
| Number of | | | | | | | | Notional | | | Value and
Unrealized | |
| Contracts | | Open Short Futures Contracts | | Broker | | Expiration | | Amount(c) | | | Appreciation | |
| 24 | | CME E-Mini Russell 2000 Index Futures | | Bank of America Merrill Lynch | | 03/17/2023 | | $ | 2,125,080 | | | $ | 45,160 | |
| 45 | | CME E-Mini Standard & Poor’s 500 Index Futures | | Bank of America Merrill Lynch | | 03/17/2023 | | | 8,687,250 | | | | 223,192 | |
| 14 | | CME E-Mini Standard & Poor’s MidCap 400 Index Futures | | Bank of America Merrill Lynch | | 03/17/2023 | | | 3,419,640 | | | | 59,045 | |
| 50 | | ICE US Mini MSCI EAFE Index Futures | | Bank of America Merrill Lynch | | 03/17/2023 | | | 4,873,500 | | | | 74,855 | |
| 76 | | ICE US MSCI Emerging Markets EM Index Futures | | Bank of America Merrill Lynch | | 03/17/2023 | | | 3,645,720 | | | | 38,535 | |
| | | TOTAL FUTURES CONTRACTS | | | | | | | | | | $ | 440,787 | |
| CBOT | - Chicago Board of Trade |
| CME | - Chicago Mercantile Exchange |
| ETF | - Exchange-Traded Fund |
| ICE | - Intercontinental Exchange |
| MSCI | - Morgan Stanley Capital International |
| SPDR | - Standard & Poor’s Depositary Receipt |
| (a) | All or a portion of this security is on loan. Total loaned securities had a value of $4,359,853 at December 31, 2022. The loaned securities were secured with cash collateral of $4,684,598 and non-cash collateral of $588,955. The non-cash collateral consists of short-term investments and long-term bonds and is held for benefit of the Portfolio at the Portfolio’s custodian. The Portfolio cannot pledge or resell the collateral. |
| (b) | Rate disclosed is the seven day effective yield as of December 31, 2022. |
| (c) | The amounts shown are the underlying reference notional amounts to stock exchange indices, equities and treasury notes upon which the fair value of the futures contracts held by the Portfolio are based. Notional values do not represent the current fair value of, and are not necessarily indicative of the future cash flows of the Portfolio’s futures contracts. Further, the underlying price changes in relation to the variables specified by the notional values affects the fair value of these derivative financial instruments. The notional values as set forth within this schedule do not purport to represent economic value at risk to the Portfolio. |
| TOPS® Managed Risk ETF Portfolios |
| Statements of Assets and Liabilities |
| December 31, 2022 |
| | | Managed Risk | | | Managed Risk | | | Managed Risk | |
| | | Balanced | | | Growth | | | Moderate Growth | |
| Assets: | | ETF Portfolio | | | ETF Portfolio | | | ETF Portfolio | |
| Investments in securities, at cost | | $ | 65,012,362 | | | $ | 190,499,352 | | | $ | 119,318,284 | |
| Investments in securities, at value (Securities on loan $3,737,539, $3,254,538 and $4,359,853, respectively) | | $ | 62,867,576 | | | $ | 196,030,793 | | | $ | 114,780,744 | |
| Cash | | | — | | | | — | | | | 3,934 | |
| Deposits with Broker | | | 369,631 | | | | 2,461,955 | | | | 939,362 | |
| Receivable for securities sold | | | — | | | | 48,079 | | | | — | |
| Receivable for Portfolio shares sold | | | 1,189 | | | | 8,766 | | | | 2,903 | |
| Unrealized appreciation on futures contracts | | | 202,812 | | | | 1,298,200 | | | | 440,787 | |
| Interest and dividends receivable | | | 21,041 | | | | 65,242 | | | | 39,033 | |
| Total Assets | | | 63,462,249 | | | | 199,913,035 | | | | 116,206,763 | |
| Liabilities: | | | | | | | | | | | | |
| Due to Custodian | | | 3,922 | | | | 48,100 | | | | — | |
| Collateral on securities loaned | | | 3,813,979 | | | | 4,070,448 | | | | 4,684,598 | |
| Payable for Portfolio shares redeemed | | | 44,728 | | | | 29,669 | | | | 19,844 | |
| Unrealized depreciation on futures contracts | | | 3,545 | | | | 3,545 | | | | 4,605 | |
| Accrued distribution (12b-1) fees | | | 16,167 | | | | 45,447 | | | | 29,640 | |
| Accrued investment advisory fees | | | 15,372 | | | | 50,405 | | | | 28,789 | |
| Payable to related parties and administrative service fees | | | 16,687 | | | | 29,164 | | | | 27,175 | |
| Total Liabilities | | | 3,914,400 | | | | 4,276,778 | | | | 4,794,651 | |
| Net Assets | | $ | 59,547,849 | | | $ | 195,636,257 | | | $ | 111,412,112 | |
| | | | | | | | | | | | | |
| Components of Net Assets: | | | | | | | | | | | | |
| Paid-in capital | | $ | 67,755,301 | | | $ | 204,391,702 | | | $ | 128,045,697 | |
| Accumulated losses | | | (8,207,452 | ) | | | (8,755,445 | ) | | | (16,633,585 | ) |
| Net Assets | | $ | 59,547,849 | | | $ | 195,636,257 | | | $ | 111,412,112 | |
See accompanying notes to financial statements.
| TOPS® Managed Risk ETF Portfolios |
| Statements of Assets and Liabilities (Continued) |
| December 31, 2022 |
| | | Managed Risk | | | Managed Risk | | | Managed Risk | |
| | | Balanced | | | Growth | | | Moderate Growth | |
| | | ETF Portfolio | | | ETF Portfolio | | | ETF Portfolio | |
| Class 1 Shares: | | | | | | | | | | | | |
| Net assets | | $ | 141,931 | | | $ | 17,478,394 | | | $ | 326,104 | |
| Total shares of beneficial interest outstanding ($0 par value, unlimited shares authorized) | | | 34,081 | | | | 3,164,577 | | | | 148,133 | |
| | | | | | | | | | | | | |
| Net asset value, offering and redemption price per share (Net assets ÷ Total shares of beneficial interest outstanding) | | $ | 4.16 | | | $ | 5.52 | | | $ | 2.20 | |
| | | | | | | | | | | | | |
| Class 2 Shares: | | | | | | | | | | | | |
| Net assets | | $ | 32,611,860 | | | $ | 103,516,202 | | | $ | 55,716,739 | |
| Total shares of beneficial interest outstanding ($0 par value, unlimited shares authorized) | | | 7,590,697 | | | | 18,638,584 | | | | 23,595,619 | |
| | | | | | | | | | | | | |
| Net asset value, offering and redemption price per share (Net assets ÷ Total shares of beneficial interest outstanding) | | $ | 4.30 | | | $ | 5.55 | | | $ | 2.36 | |
| | | | | | | | | | | | | |
| Class 3 Shares: | | | | | | | | | | | | |
| Net assets | | $ | 21,739,455 | | | $ | 71,051,379 | | | $ | 50,774,497 | |
| Total shares of beneficial interest outstanding ($0 par value, unlimited shares authorized) | | | 5,145,816 | | | | 13,078,828 | | | | 23,372,953 | |
| | | | | | | | | | | | | |
| Net asset value, offering and redemption price per share (Net assets ÷ Total shares of beneficial interest outstanding) | | $ | 4.22 | | | $ | 5.43 | | | $ | 2.17 | |
| | | | | | | | | | | | | |
| Class 4 Shares: | | | | | | | | | | | | |
| Net assets | | $ | 5,054,589 | | | $ | 3,590,268 | | | $ | 4,594,757 | |
| Total shares of beneficial interest outstanding ($0 par value, unlimited shares authorized) | | | 1,277,768 | | | | 649,301 | | | | 2,206,167 | |
| | | | | | | | | | | | | |
| Net asset value, offering and redemption price per share (Net assets ÷ Total shares of beneficial interest outstanding) | | $ | 3.96 | | | $ | 5.53 | | | $ | 2.08 | |
| | | | | | | | | | | | | |
| Investor Class Shares: | | | | | | | | | | | | |
| Net assets | | $ | 14 | | | $ | 14 | | | $ | 15 | |
| Total shares of beneficial interest outstanding ($0 par value, unlimited shares authorized) | | | 2 | | | | 2 | | | | 3 | |
| | | | | | | | | | | | | |
| Net asset value, offering and redemption price per share (Net assets ÷ Total shares of beneficial interest outstanding) | | $ | 6.43 | (a) | | $ | 6.11 | (a) | | $ | 4.99 | (a) |
| (a) | NAV does not recalculate due to rounding of net assets. |
See accompanying notes to financial statements.
| TOPS® Managed Risk ETF Portfolios |
| Statements of Operations |
| For the Year Ended December 31, 2022 |
| | | Managed Risk | | | Managed Risk | | | Managed Risk | |
| | | Balanced | | | Growth | | | Moderate Growth | |
| | | ETF Portfolio | | | ETF Portfolio | | | ETF Portfolio | |
| Investment Income: | | | | | | | | | | | | |
| Dividend income | | $ | 6,821,308 | | | $ | 10,713,250 | | | $ | 10,883,291 | |
| Interest income | | | 440,843 | | | | 805,503 | | | | 743,607 | |
| Securities lending income | | | 199,286 | | | | 187,157 | | | | 312,286 | |
| Total Investment Income | | | 7,461,437 | | | | 11,705,910 | | | | 11,939,184 | |
| Expenses: | | | | | | | | | | | | |
| Investment advisory fees | | | 1,006,284 | | | | 1,784,909 | | | | 1,712,419 | |
| Distribution fees (12b-1) | | | | | | | | | | | | |
| Class 2 Shares | | | 671,501 | | | | 1,138,901 | | | | 1,114,221 | |
| Class 3 Shares | | | 213,867 | | | | 403,176 | | | | 416,889 | |
| Class 4 Shares | | | 33,292 | | | | 23,639 | | | | 31,058 | |
| Investor Shares | | | 135 | | | | — | | | | 169 | |
| Related parties and administrative service fees | | | 346,353 | | | | 605,894 | | | | 581,731 | |
| Total Expenses | | | 2,271,432 | | | | 3,956,519 | | | | 3,856,487 | |
| Net Investment Income | | | 5,190,005 | | | | 7,749,391 | | | | 8,082,697 | |
| | | | | | | | | | | | | |
| Realized and Unrealized Gain (Loss) on Investments and Futures Contracts: | | | | | | | | | | | | |
| Net realized gain on: | | | | | | | | | | | | |
| Investments | | | 12,932,511 | | | | 77,338,188 | | | | 51,439,291 | |
| Futures contracts | | | 102,431 | | | | 15,674,587 | | | | 3,447,372 | |
| Total net realized gain | | | 13,034,942 | | | | 93,012,775 | | | | 54,886,663 | |
| Net change in unrealized appreciation (depreciation) on: | | | | | | | | | | | | |
| Investments | | | (80,930,649 | ) | | | (221,740,855 | ) | | | (181,547,303 | ) |
| Futures contracts | | | (143,843 | ) | | | 1,599,039 | | | | 167,970 | |
| Total unrealized depreciation | | | (81,074,492 | ) | | | (220,141,816 | ) | | | (181,379,333 | ) |
| Net Realized and Unrealized Loss on Investments and Futures Contracts | | | (68,039,550 | ) | | | (127,129,041 | ) | | | (126,492,670 | ) |
| Net Decrease in Net Assets Resulting from Operations | | $ | (62,849,545 | ) | | $ | (119,379,650 | ) | | $ | (118,409,973 | ) |
See accompanying notes to financial statements.
| TOPS® Managed Risk ETF Portfolios |
| Statements of Changes in Net Assets |
| | | Managed Risk Balanced ETF Portfolio | |
| | | | | | | |
| | | Year Ended | | | Year Ended | |
| | | December 31, 2022 | | | December 31, 2021 | |
| Increase (Decrease) in Net Assets: | | | | | | | | |
| From Operations: | | | | | | | | |
| Net investment income | | $ | 5,190,005 | | | $ | 6,772,253 | |
| Net realized gain on investments and futures contracts | | | 13,034,942 | | | | 21,460,449 | |
| Distributions of realized gains by underlying investment companies | | | — | | | | 159,539 | |
| Net change in unrealized appreciation (depreciation) on investments and futures contracts | | | (81,074,492 | ) | | | 10,708,654 | |
| Net increase (decrease) in net assets resulting from operations | | | (62,849,545 | ) | | | 39,100,895 | |
| From Distributions to Shareholders: | | | | | | | | |
| Total Distributions Paid | | | | | | | | |
| Class 1 | | | (89,730 | ) | | | (2,117 | ) |
| Class 2 | | | (20,385,169 | ) | | | (4,158,280 | ) |
| Class 3 | | | (13,855,786 | ) | | | (813,708 | ) |
| Class 4 | | | (3,281,275 | ) | | | (39,096 | ) |
| Investor Class | | | (7 | ) | | | (0 | ) (a) |
| Total distributions to shareholders | | | (37,611,967 | ) | | | (5,013,201 | ) |
| From Shares of Beneficial Interest: | | | | | | | | |
| Proceeds from shares sold | | | | | | | | |
| Class 2 | | | 11,220,486 | | | | 20,473,587 | |
| Class 3 | | | 1,699,832 | | | | 5,723,972 | |
| Class 4 | | | 5,742,146 | | | | 190,866 | |
| Investor Class | | | 55,055 | | | | — | |
| Reinvestment of distributions | | | | | | | | |
| Class 1 | | | 89,730 | | | | 2,117 | |
| Class 2 | | | 20,385,169 | | | | 4,158,280 | |
| Class 3 | | | 13,855,786 | | | | 813,708 | |
| Class 4 | | | 3,281,275 | | | | 39,096 | |
| Investor Class | | | 7 | | | | 0 | (a) |
| Cost of shares redeemed | | | | | | | | |
| Class 1 | | | (250 | ) | | | (240 | ) |
| Class 2 | | | (300,609,740 | ) | | | (61,716,276 | ) |
| Class 3 | | | (50,419,493 | ) | | | (14,270,560 | ) |
| Class 4 | | | (6,394,816 | ) | | | (2,397,741 | ) |
| Investor Class | | | (51,726 | ) | | | — | |
| Net decrease in net assets from share transactions of beneficial interest | | | (301,146,529 | ) | | | (46,983,191 | ) |
| Total Decrease In Net Assets | | | (401,608,041 | ) | | | (12,895,497 | ) |
| | | | | | | | | |
| Net Assets: | | | | | | | | |
| Beginning of year | | | 461,155,890 | | | | 474,051,387 | |
| End of year | | $ | 59,547,849 | | | $ | 461,155,890 | |
| (a) | Represents less than $1. |
See accompanying notes to financial statements.
| TOPS® Managed Risk ETF Portfolios |
| Statements of Changes in Net Assets (Continued) |
| | | Managed Risk Balanced ETF Portfolio | |
| | | | | | | |
| | | Year Ended | | | Year Ended | |
| | | December 31, 2022 | | | December 31, 2021 | |
| SHARE ACTIVITY | | | | | | | | |
| Class 1 | | | | | | | | |
| Shares Sold | | | 1 | | | | — | |
| Shares Reinvested | | | 21,467 | | | | 170 | |
| Shares Redeemed | | | (28 | ) | | | (19 | ) |
| Net increase in shares of beneficial interest outstanding | | | 21,440 | | | | 151 | |
| | | | | | | | | |
| Class 2 | | | | | | | | |
| Shares Sold | | | 983,055 | | | | 1,650,473 | |
| Shares Reinvested | | | 4,729,737 | | | | 335,345 | |
| Shares Redeemed | | | (27,587,065 | ) | | | (4,975,883 | ) |
| Net decrease in shares of beneficial interest outstanding | | | (21,874,273 | ) | | | (2,990,065 | ) |
| | | | | | | | | |
| Class 3 | | | | | | | | |
| Shares Sold | | | 159,898 | | | | 458,789 | |
| Shares Reinvested | | | 3,267,874 | | | | 65,306 | |
| Shares Redeemed | | | (4,656,447 | ) | | | (1,142,611 | ) |
| Net decrease in shares of beneficial interest outstanding | | | (1,228,675 | ) | | | (618,516 | ) |
| | | | | | | | | |
| Class 4 | | | | | | | | |
| Shares Sold | | | 500,283 | | | | 15,862 | |
| Shares Reinvested | | | 826,518 | | | | 3,194 | |
| Shares Redeemed | | | (568,354 | ) | | | (196,968 | ) |
| Net increase (decrease) in shares of beneficial interest outstanding | | | 758,447 | | | | (177,912 | ) |
| | | | | | | | | |
| Investor Class | | | | | | | | |
| Shares Sold | | | 4,271 | | | | — | |
| Shares Reinvested | | | 1 | | | | 0 | (a) |
| Shares Redeemed | | | (4,271 | ) | | | — | |
| Net increase in shares of beneficial interest outstanding | | | 1 | | | | 0 | (a) |
| (a) | Represents less than one share |
See accompanying notes to financial statements.
| TOPS® Managed Risk ETF Portfolios |
| Statements of Changes in Net Assets (Continued) |
| | | Managed Risk Growth ETF Portfolio | |
| | | | | | | |
| | | Year Ended | | | Year Ended | |
| | | December 31, 2022 | | | December 31, 2021 | |
| Increase (Decrease) in Net Assets: | | | | | | | | |
| From Operations: | | | | | | | | |
| Net investment income | | $ | 7,749,391 | | | $ | 10,727,721 | |
| Net realized gain on investments and futures contracts | | | 93,012,775 | | | | 39,532,274 | |
| Distributions of realized gains by underlying investment companies | | | — | | | | 38,346 | |
| Net change in unrealized appreciation (depreciation) on investments and futures contracts | | | (220,141,816 | ) | | | 45,093,123 | |
| Net increase (decrease) in net assets resulting from operations | | | (119,379,650 | ) | | | 95,391,464 | |
| From Distributions to Shareholders: | | | | | | | | |
| Total Distributions Paid | | | | | | | | |
| Class 1 | | | (9,204,007 | ) | | | (389,154 | ) |
| Class 2 | | | (53,620,014 | ) | | | (6,528,869 | ) |
| Class 3 | | | (37,903,975 | ) | | | (1,376,051 | ) |
| Class 4 | | | (1,892,946 | ) | | | (32,984 | ) |
| Investor Class | | | (7 | ) | | | (0 | ) (a) |
| Total distributions to shareholders | | | (102,620,949 | ) | | | (8,327,058 | ) |
| From Shares of Beneficial Interest: | | | | | | | | |
| Proceeds from shares sold | | | | | | | | |
| Class 1 | | | 19,376 | | | | 341,124 | |
| Class 2 | | | 17,223,139 | | | | 22,618,141 | |
| Class 3 | | | 3,086,972 | | | | 3,440,166 | |
| Class 4 | | | 4,078,091 | | | | 50,959 | |
| Reinvestment of distributions | | | | | | | | |
| Class 1 | | | 9,204,007 | | | | 389,154 | |
| Class 2 | | | 53,620,014 | | | | 6,528,869 | |
| Class 3 | | | 37,903,975 | | | | 1,376,051 | |
| Class 4 | | | 1,892,946 | | | | 32,984 | |
| Investor Class | | | 7 | | | | 0 | (a) |
| Cost of shares redeemed | | | | | | | | |
| Class 1 | | | (5,807,085 | ) | | | (5,991,679 | ) |
| Class 2 | | | (438,004,621 | ) | | | (90,498,632 | ) |
| Class 3 | | | (56,292,148 | ) | | | (25,948,257 | ) |
| Class 4 | | | (4,485,546 | ) | | | (544,087 | ) |
| Net decrease in net assets from share transactions of beneficial interest | | | (377,560,873 | ) | | | (88,205,207 | ) |
| Total Decrease In Net Assets | | | (599,561,472 | ) | | | (1,140,801 | ) |
| | | | | | | | | |
| Net Assets: | | | | | | | | |
| Beginning of year | | | 795,197,729 | | | | 796,338,530 | |
| End of year | | $ | 195,636,257 | | | $ | 795,197,729 | |
| (a) | Represents less than $1. |
See accompanying notes to financial statements.
| TOPS® Managed Risk ETF Portfolios |
| Statements of Changes in Net Assets (Continued) |
| | | Managed Risk Growth ETF Portfolio | |
| | | | | | | |
| | | Year Ended | | | Year Ended | |
| | | December 31, 2022 | | | December 31, 2021 | |
| SHARE ACTIVITY | | | | | | | | |
| Class 1 | | | | | | | | |
| Shares Sold | | | 2,591 | | | | 26,068 | |
| Shares Reinvested | | | 1,649,464 | | | | 30,450 | |
| Shares Redeemed | | | (500,030 | ) | | | (459,417 | ) |
| Net increase (decrease) in shares of beneficial interest outstanding | | | 1,152,025 | | | | (402,899 | ) |
| | | | | | | | | |
| Class 2 | | | | | | | | |
| Shares Sold | | | 1,478,019 | | | | 1,772,900 | |
| Shares Reinvested | | | 9,557,935 | | | | 513,276 | |
| Shares Redeemed | | | (39,675,684 | ) | | | (7,161,491 | ) |
| Net decrease in shares of beneficial interest outstanding | | | (28,639,730 | ) | | | (4,875,315 | ) |
| | | | | | | | | |
| Class 3 | | | | | | | | |
| Shares Sold | | | 269,968 | | | | 270,591 | |
| Shares Reinvested | | | 6,904,185 | | | | 108,693 | |
| Shares Redeemed | | | (5,207,445 | ) | | | (2,059,954 | ) |
| Net increase (decrease) in shares of beneficial interest outstanding | | | 1,966,708 | | | | (1,680,670 | ) |
| | | | | | | | | |
| Class 4 | | | | | | | | |
| Shares Sold | | | 341,637 | | | | 4,077 | |
| Shares Reinvested | | | 338,631 | | | | 2,577 | |
| Shares Redeemed | | | (383,380 | ) | | | (42,687 | ) |
| Net increase (decrease) in shares of beneficial interest outstanding | | | 296,888 | | | | (36,033 | ) |
| | | | | | | | | |
| Investor Class | | | | | | | | |
| Shares Reinvested | | | 1 | | | | 0 | (a) |
| Net increase in shares of beneficial interest outstanding | | | 1 | | | | 0 | (a) |
| (a) | Represents less than one share |
See accompanying notes to financial statements.
| TOPS® Managed Risk ETF Portfolios |
| Statements of Changes in Net Assets (Continued) |
| | | Managed Risk Moderate Growth ETF Portfolio | |
| | | | | | | |
| | | Year Ended | | | Year Ended | |
| | | December 31, 2022 | | | December 31, 2021 | |
| Increase (Decrease) in Net Assets: | | | | | | | | |
| From Operations: | | | | | | | | |
| Net investment income | | $ | 8,082,697 | | | $ | 11,137,908 | |
| Net realized gain on investments and futures contracts | | | 54,886,663 | | | | 41,142,105 | |
| Distributions of realized gains by underlying investment companies | | | — | | | | 121,137 | |
| Net change in unrealized appreciation (depreciation) on investments and futures contracts | | | (181,379,333 | ) | | | 31,940,292 | |
| Net increase (decrease) in net assets resulting from operations | | | (118,409,973 | ) | | | 84,341,442 | |
| From Distributions to Shareholders: | | | | | | | | |
| Total Distributions Paid | | | | | | | | |
| Class 1 | | | (452,047 | ) | | | (15,743 | ) |
| Class 2 | | | (44,987,637 | ) | | | (7,114,969 | ) |
| Class 3 | | | (42,515,268 | ) | | | (1,630,672 | ) |
| Class 4 | | | (3,829,594 | ) | | | (48,800 | ) |
| Investor Class | | | (66 | ) | | | (5,465 | ) |
| Total distributions to shareholders | | | (91,784,612 | ) | | | (8,815,649 | ) |
| From Shares of Beneficial Interest: | | | | | | | | |
| Proceeds from shares sold | | | | | | | | |
| Class 1 | | | 10 | | | | 188,411 | |
| Class 2 | | | 12,595,623 | | | | 17,869,967 | |
| Class 3 | | | 2,323,602 | | | | 6,247,635 | |
| Class 4 | | | 5,411,994 | | | | 242,115 | |
| Investor Class | | | — | | | | 493,679 | |
| Reinvestment of distributions | | | | | | | | |
| Class 1 | | | 452,047 | | | | 15,743 | |
| Class 2 | | | 44,987,637 | | | | 7,114,969 | |
| Class 3 | | | 42,515,268 | | | | 1,630,672 | |
| Class 4 | | | 3,829,594 | | | | 48,800 | |
| Investor Class | | | 66 | | | | 5,465 | |
| Cost of shares redeemed | | | | | | | | |
| Class 1 | | | (699,848 | ) | | | (262,067 | ) |
| Class 2 | | | (488,102,374 | ) | | | (88,080,581 | ) |
| Class 3 | | | (86,145,681 | ) | | | (25,774,082 | ) |
| Class 4 | | | (6,345,120 | ) | | | (1,193,390 | ) |
| Investor Class | | | (501,840 | ) | | | (7,666 | ) |
| Net decrease in net assets from share transactions of beneficial interest | | | (469,679,022 | ) | | | (81,460,330 | ) |
| Total Decrease In Net Assets | | | (679,873,607 | ) | | | (5,934,537 | ) |
| | | | | | | | | |
| Net Assets: | | | | | | | | |
| Beginning of year | | | 791,285,719 | | | | 797,220,256 | |
| End of year | | $ | 111,412,112 | | | $ | 791,285,719 | |
See accompanying notes to financial statements.
| TOPS® Managed Risk ETF Portfolios |
| Statements of Changes in Net Assets (Continued) |
| | | Managed Risk Moderate Growth ETF Portfolio | |
| | | | | | | |
| | | Year Ended | | | Year Ended | |
| | | December 31, 2022 | | | December 31, 2021 | |
| SHARE ACTIVITY | | | | | | | | |
| Class 1 | | | | | | | | |
| Shares Sold | | | 1 | | | | 14,350 | |
| Shares Reinvested | | | 203,625 | | | | 1,199 | |
| Shares Redeemed | | | (141,903 | ) | | | (19,868 | ) |
| Net increase (decrease) in shares of beneficial interest outstanding | | | 61,723 | | | | (4,319 | ) |
| | | | | | | | | |
| Class 2 | | | | | | | | |
| Shares Sold | | | 1,108,644 | | | | 1,356,672 | |
| Shares Reinvested | | | 18,902,369 | | | | 543,542 | |
| Shares Redeemed | | | (42,946,232 | ) | | | (6,749,425 | ) |
| Net decrease in shares of beneficial interest outstanding | | | (22,935,219 | ) | | | (4,849,211 | ) |
| | | | | | | | | |
| Class 3 | | | | | | | | |
| Shares Sold | | | 270,150 | | | | 478,651 | |
| Shares Reinvested | | | 19,413,364 | | | | 124,956 | |
| Shares Redeemed | | | (8,036,119 | ) | | | (1,978,049 | ) |
| Net increase (decrease) in shares of beneficial interest outstanding | | | 11,647,395 | | | | (1,374,442 | ) |
| | | | | | | | | |
| Class 4 | | | | | | | | |
| Shares Sold | | | 445,597 | | | | 18,768 | |
| Shares Reinvested | | | 1,823,616 | | | | 3,751 | |
| Shares Redeemed | | | (540,227 | ) | | | (92,592 | ) |
| Net increase (decrease) in shares of beneficial interest outstanding | | | 1,728,986 | | | | (70,073 | ) |
| | | | | | | | | |
| Investor Class | | | | | | | | |
| Shares Sold | | | — | | | | 36,678 | |
| Shares Reinvested | | | 13 | | | | 393 | |
| Shares Redeemed | | | (36,535 | ) | | | (547 | ) |
| Net increase (decrease) in shares of beneficial interest outstanding | | | (36,522 | ) | | | 36,524 | |
See accompanying notes to financial statements.
| TOPS® Managed Risk ETF Portfolios |
| Financial Highlights |
| Managed Risk Balanced ETF Portfolio |
| |
| Selected data based on a share outstanding throughout each year indicated. |
| | | Class 1 Shares | |
| | | | | | | | | | | | | | | | |
| | | Year Ended | | | Year Ended | | | Year Ended | | | Year Ended | | | Year Ended | |
| | | December 31, 2022 | | | December 31, 2021 | | | December 31, 2020 | | | December 31, 2019 | | | December 31, 2018 | |
| Net asset value, beginning of year | | $ | 12.73 | | | $ | 11.86 | | | $ | 11.63 | | | $ | 10.70 | | | $ | 12.25 | |
| Income (loss) from investment operations: | | | | | | | | | | | | | | | | | | | | |
| Net investment income (a)(b) | | | 0.22 | | | | 0.22 | | | | 0.16 | | | | 0.23 | | | | 0.24 | |
| Net realized and unrealized gain (loss) on investments and futures contracts | | | (1.68 | ) | | | 0.82 | | | | 0.52 | | | | 1.32 | | | | (0.92 | ) |
| Total income (loss) from investment operations | | | (1.46 | ) | | | 1.04 | | | | 0.68 | | | | 1.55 | | | | (0.68 | ) |
| Less distributions from: | | | | | | | | | | | | | | | | | | | | |
| Net investment income | | | (2.35 | ) | | | (0.17 | ) | | | (0.29 | ) | | | (0.29 | ) | | | (0.24 | ) |
| Net realized gain | | | (4.76 | ) | | | — | | | | (0.16 | ) | | | (0.33 | ) | | | (0.63 | ) |
| Total distributions | | | (7.11 | ) | | | (0.17 | ) | | | (0.45 | ) | | | (0.62 | ) | | | (0.87 | ) |
| Net asset value, end of year | | $ | 4.16 | | | $ | 12.73 | | | $ | 11.86 | | | $ | 11.63 | | | $ | 10.70 | |
| Total return (c) | | | (11.75 | )% | | | 8.80 | % | | | 6.17 | % | | | 14.81 | % | | | (5.81 | )% |
| Ratios and Supplemental Data: | | | | | | | | | | | | | | | | | | | | |
| Net assets, end of year (in 000’s) | | $ | 142 | | | $ | 161 | | | $ | 148 | | | $ | 140 | | | $ | 246 | |
| Ratio of expenses to average net assets (d) | | | 0.41 | % | | | 0.40 | % | | | 0.40 | % | | | 0.40 | % | | | 0.40 | % |
| Ratio of net investment income to average net assets (b)(d) | | | 2.26 | % | | | 1.75 | % | | | 1.38 | % | | | 2.04 | % | | | 2.03 | % |
| Portfolio turnover rate | | | 14 | % | | | 9 | % | | | 27 | % | | | 36 | % | | | 48 | % |
| | | | | | | | | | | | | | | | | | | | | |
| (a) | Net investment income has been calculated using the average shares method, which more appropriately presents the per share data for the year. |
| (b) | Recognition of net investment income by the Portfolio is affected by the timing of the declaration of dividends by the underlying investment companies in which the Portfolio invests. |
| (c) | Total returns are historical and assume changes in share price and reinvestment of dividends and capital gains distributions, if any. |
| (d) | Does not include the expenses of the underlying investment companies in which the Portfolio invests. |
See accompanying notes to financial statements.
| TOPS® Managed Risk ETF Portfolios |
| Financial Highlights |
| Managed Risk Balanced ETF Portfolio |
| |
| Selected data based on a share outstanding throughout each year indicated. |
| | | Class 2 Shares | |
| | | | | | | | | | | | | | | | |
| | | Year Ended | | | Year Ended | | | Year Ended | | | Year Ended | | | Year Ended | |
| | | December 31, 2022 | | | December 31, 2021 | | | December 31, 2020 | | | December 31, 2019 | | | December 31, 2018 | |
| Net asset value, beginning of year | | $ | 12.67 | | | $ | 11.80 | | | $ | 11.57 | | | $ | 10.64 | | | $ | 12.18 | |
| Income (loss) from investment operations: | | | | | | | | | | | | | | | | | | | | |
| Net investment income (a)(b) | | | 0.18 | | | | 0.18 | | | | 0.13 | | | | 0.22 | | | | 0.23 | |
| Net realized and unrealized gain (loss) on investments and futures contracts | | | (1.67 | ) | | | 0.83 | | | | 0.52 | | | | 1.30 | | | | (0.93 | ) |
| Total income (loss) from investment operations | | | (1.49 | ) | | | 1.01 | | | | 0.65 | | | | 1.52 | | | | (0.70 | ) |
| Less distributions from: | | | | | | | | | | | | | | | | | | | | |
| Net investment income | | | (2.12 | ) | | | (0.14 | ) | | | (0.26 | ) | | | (0.26 | ) | | | (0.21 | ) |
| Net realized gain | | | (4.76 | ) | | | — | | | | (0.16 | ) | | | (0.33 | ) | | | (0.63 | ) |
| Total distributions | | | (6.88 | ) | | | (0.14 | ) | | | (0.42 | ) | | | (0.59 | ) | | | (0.84 | ) |
| Net asset value, end of year | | $ | 4.30 | | | $ | 12.67 | | | $ | 11.80 | | | $ | 11.57 | | | $ | 10.64 | |
| Total return (c) | | | (11.85 | )% | | | 8.57 | % | | | 5.90 | % | | | 14.55 | % | | | (6.04 | )% |
| Ratios and Supplemental Data: | | | | | | | | | | | | | | | | | | | | |
| Net assets, end of year (in 000’s) | | $ | 32,612 | | | $ | 373,337 | | | $ | 382,900 | | | $ | 409,218 | | | $ | 415,533 | |
| Ratio of expenses to average net assets (d) | | | 0.66 | % | | | 0.65 | % | | | 0.65 | % | | | 0.65 | % | | | 0.65 | % |
| Ratio of net investment income to average net assets (b)(d) | | | 1.55 | % | | | 1.46 | % | | | 1.10 | % | | | 1.97 | % | | | 1.91 | % |
| Portfolio turnover rate | | | 14 | % | | | 9 | % | | | 27 | % | | | 36 | % | | | 48 | % |
| | | | | | | | | | | | | | | | | | | | | |
| (a) | Net investment income has been calculated using the average shares method, which more appropriately presents the per share data for the year. |
| (b) | Recognition of net investment income by the Portfolio is affected by the timing of the declaration of dividends by the underlying investment companies in which the Portfolio invests. |
| (c) | Total returns are historical and assume changes in share price and reinvestment of dividends and capital gains distributions, if any. |
| (d) | Does not include the expenses of the underlying investment companies in which the Portfolio invests. |
See accompanying notes to financial statements.
| TOPS® Managed Risk ETF Portfolios |
| Financial Highlights |
| Managed Risk Balanced ETF Portfolio |
| |
| Selected data based on a share outstanding throughout each year indicated. |
| | | Class 3 Shares | |
| | | | | | | | | | | | | | | | |
| | | Year Ended | | | Year Ended | | | Year Ended | | | Year Ended | | | Year Ended | |
| | | December 31, 2022 | | | December 31, 2021 | | | December 31, 2020 | | | December 31, 2019 | | | December 31, 2018 | |
| Net asset value, beginning of year | | $ | 12.73 | | | $ | 11.85 | | | $ | 11.63 | | | $ | 10.69 | | | $ | 12.24 | |
| Income (loss) from investment operations: | | | | | | | | | | | | | | | | | | | | |
| Net investment income (a)(b) | | | 0.17 | | | | 0.17 | | | | 0.11 | | | | 0.22 | | | | 0.22 | |
| Net realized and unrealized gain (loss) on investments and futures contracts | | | (1.67 | ) | | | 0.84 | | | | 0.52 | | | | 1.30 | | | | (0.94 | ) |
| Total income (loss) from investment operations | | | (1.50 | ) | | | 1.01 | | | | 0.63 | | | | 1.52 | | | | (0.72 | ) |
| Less distributions from: | | | | | | | | | | | | | | | | | | | | |
| Net investment income | | | (2.25 | ) | | | (0.13 | ) | | | (0.25 | ) | | | (0.25 | ) | | | (0.20 | ) |
| Net realized gain | | | (4.76 | ) | | | — | | | | (0.16 | ) | | | (0.33 | ) | | | (0.63 | ) |
| Total distributions | | | (7.01 | ) | | | (0.13 | ) | | | (0.41 | ) | | | (0.58 | ) | | | (0.83 | ) |
| Net asset value, end of year | | $ | 4.22 | | | $ | 12.73 | | | $ | 11.85 | | | $ | 11.63 | | | $ | 10.69 | |
| Total return (c) | | | (12.08 | )% | | | 8.51 | % | | | 5.66 | % | | | 14.48 | % | | | (6.15 | )% |
| Ratios and Supplemental Data: | | | | | | | | | | | | | | | | | | | | |
| Net assets, end of year (in 000’s) | | $ | 21,739 | | | $ | 81,163 | | | $ | 82,899 | | | $ | 88,729 | | | $ | 85,937 | |
| Ratio of expenses to average net assets (d) | | | 0.76 | % | | | 0.75 | % | | | 0.75 | % | | | 0.75 | % | | | 0.75 | % |
| Ratio of net investment income to average net assets (b)(d) | | | 1.56 | % | | | 1.35 | % | | | 1.00 | % | | | 1.90 | % | | | 1.84 | % |
| Portfolio turnover rate | | | 14 | % | | | 9 | % | | | 27 | % | | | 36 | % | | | 48 | % |
| | | | | | | | | | | | | | | | | | | | | |
| (a) | Net investment income has been calculated using the average shares method, which more appropriately presents the per share data for the year. |
| (b) | Recognition of net investment income by the Portfolio is affected by the timing of the declaration of dividends by the underlying investment companies in which the Portfolio invests. |
| (c) | Total returns are historical and assume changes in share price and reinvestment of dividends and capital gains distributions, if any. |
| (d) | Does not include the expenses of the underlying investment companies in which the Portfolio invests. |
See accompanying notes to financial statements.
| TOPS® Managed Risk ETF Portfolios |
| Financial Highlights |
| Managed Risk Balanced ETF Portfolio |
| |
| Selected data based on a share outstanding throughout each year indicated. |
| | | Class 4 Shares | |
| | | | | | | | | | | | | | | | |
| | | Year Ended | | | Year Ended | | | Year Ended | | | Year Ended | | | Year Ended | |
| | | December 31, 2022 | | | December 31, 2021 | | | December 31, 2020 | | | December 31, 2019 | | | December 31, 2018 | |
| Net asset value, beginning of year | | $ | 12.51 | | | $ | 11.62 | | | $ | 11.40 | | | $ | 10.49 | | | $ | 12.02 | |
| Income (loss) from investment operations: | | | | | | | | | | | | | | | | | | | | |
| Net investment income (a)(b) | | | 0.15 | | | | 0.13 | | | | 0.08 | | | | 0.18 | | | | 0.18 | |
| Net realized and unrealized gain (loss) on investments and futures contracts | | | (1.66 | ) | | | 0.83 | | | | 0.51 | | | | 1.28 | | | | (0.92 | ) |
| Total income (loss) from investment operations | | | (1.51 | ) | | | 0.96 | | | | 0.59 | | | | 1.46 | | | | (0.74 | ) |
| Less distributions from: | | | | | | | | | | | | | | | | | | | | |
| Net investment income | | | (2.28 | ) | | | (0.07 | ) | | | (0.21 | ) | | | (0.22 | ) | | | (0.16 | ) |
| Net realized gain | | | (4.76 | ) | | | — | | | | (0.16 | ) | | | (0.33 | ) | | | (0.63 | ) |
| Total distributions | | | (7.04 | ) | | | (0.07 | ) | | | (0.37 | ) | | | (0.55 | ) | | | (0.79 | ) |
| Net asset value, end of year | | $ | 3.96 | | | $ | 12.51 | | | $ | 11.62 | | | $ | 11.40 | | | $ | 10.49 | |
| Total return (c) | | | (12.17 | )% | | | 8.28 | % | | | 5.46 | % | | | 14.17 | % | | | (6.41 | )% |
| Ratios and Supplemental Data: | | | | | | | | | | | | | | | | | | | | |
| Net assets, end of year (in 000’s) | | $ | 5,055 | | | $ | 6,494 | | | $ | 8,104 | | | $ | 10,059 | | | $ | 9,733 | |
| Ratio of expenses to average net assets (d) | | | 1.01 | % | | | 1.00 | % | | | 1.00 | % | | | 1.00 | % | | | 1.00 | % |
| Ratio of net investment income to average net assets (b)(d) | | | 1.61 | % | | | 1.05 | % | | | 0.74 | % | | | 1.64 | % | | | 1.58 | % |
| Portfolio turnover rate | | | 14 | % | | | 9 | % | | | 27 | % | | | 36 | % | | | 48 | % |
| | | | | | | | | | | | | | | | | | | | | |
| (a) | Net investment income has been calculated using the average shares method, which more appropriately presents the per share data for the year. |
| (b) | Recognition of net investment income by the Portfolio is affected by the timing of the declaration of dividends by the underlying investment companies in which the Portfolio invests. |
| (c) | Total returns are historical and assume changes in share price and reinvestment of dividends and capital gains distributions, if any. |
| (d) | Does not include the expenses of the underlying investment companies in which the Portfolio invests. |
See accompanying notes to financial statements.
| TOPS® Managed Risk ETF Portfolios |
| Financial Highlights |
| Managed Risk Balanced ETF Portfolio |
| |
| Selected data based on a share outstanding throughout each year indicated. |
| | | Investor Class Shares | |
| | | | | | | | | | | | | | | | |
| | | Year Ended | | | Year Ended | | | Year Ended | | | Year Ended | | | Year Ended | |
| | | December 31, 2022 | | | December 31, 2021 | | | December 31, 2020 | | | December 31, 2019 | | | December 31, 2018 | |
| Net asset value, beginning of year | | $ | 13.42 | | | $ | 12.55 | | | $ | 12.32 | | | $ | 11.39 | | | $ | 12.17 | |
| Income (loss) from investment operations: | | | | | | | | | | | | | | | | | | | | |
| Net investment income (a)(b) | | | 0.14 | | | | 0.30 | | | | 0.09 | | | | 0.31 | | | | 0.20 | |
| Net realized and unrealized gain (loss) on investments and futures contracts | | | (2.37 | ) | | | 0.71 | | | | 0.56 | | | | 1.21 | | | | (0.15 | ) |
| Total income from investment operations | | | (2.23 | ) | | | 1.01 | | | | 0.65 | | | | 1.52 | | | | 0.05 | |
| Less distributions from: | | | | | | | | | | | | | | | | | | | | |
| Net investment income | | | — | | | | (0.14 | ) | | | (0.26 | ) | | | (0.26 | ) | | | (0.20 | ) |
| Net realized gain | | | (4.76 | ) | | | — | | | | (0.16 | ) | | | (0.33 | ) | | | (0.63 | ) |
| Total distributions | | | (4.76 | ) | | | (0.14 | ) | | | (0.42 | ) | | | (0.59 | ) | | | (0.83 | ) |
| Net asset value, end of year (c) | | $ | 6.43 | | | $ | 13.42 | | | $ | 12.55 | | | $ | 12.32 | | | $ | 11.39 | |
| Total return (d) | | | (11.73 | )% | | | 8.06 | % | | | 5.52 | % | | | 13.64 | % | | | (5.67 | )% |
| Ratios and Supplemental Data: | | | | | | | | | | | | | | | | | | | | |
| Net assets, end of year (e) | | $ | 14 | | | $ | 16 | | | $ | 15 | | | $ | 14 | | | $ | 12 | |
| Ratio of expenses to average net assets (f) | | | 0.91 | % | | | 0.90 | % | | | 0.90 | % | | | 0.90 | % | | | 0.90 | % |
| Ratio of net investment income to average net assets (b)(f) | | | 1.51 | % | | | 0.95 | % | | | 0.64 | % | | | 1.54 | % | | | 1.66 | % |
| Portfolio turnover rate | | | 14 | % | | | 9 | % | | | 27 | % | | | 36 | % | | | 48 | % |
| | | | | | | | | | | | | | | | | | | | | |
| (a) | Net investment income has been calculated using the average shares method, which more appropriately presents the per share data for the year. |
| (b) | Recognition of net investment income by the Portfolio is affected by the timing of the declaration of dividends by the underlying investment companies in which the Portfolio invests. |
| (c) | NAV does not recalculate due to rounding of net assets. |
| (d) | Total returns are historical and assume changes in share price and reinvestment of dividends and capital gains distributions, if any. |
| (e) | Rounded net assets, not truncated. |
| (f) | Does not include the expenses of the underlying investment companies in which the Portfolio invests. |
See accompanying notes to financial statements.
| TOPS® Managed Risk ETF Portfolios |
| Financial Highlights |
| Managed Risk Growth ETF Portfolio |
| |
| Selected data based on a share outstanding throughout each year indicated. |
| | | Class 1 Shares | |
| | | | | | | | | | | | | | | | |
| | | Year Ended | | | Year Ended | | | Year Ended | | | Year Ended | | | Year Ended | |
| | | December 31, 2022 | | | December 31, 2021 | | | December 31, 2020 | | | December 31, 2019 | | | December 31, 2018 | |
| Net asset value, beginning of year | | $ | 13.16 | | | $ | 11.82 | | | $ | 11.49 | | | $ | 10.73 | | | $ | 12.66 | |
| Income (loss) from investment operations: | | | | | | | | | | | | | | | | | | | | |
| Net investment income (a)(b) | | | 0.18 | | | | 0.21 | | | | 0.15 | | | | 0.25 | | | | 0.24 | |
| Net realized and unrealized gain (loss) on investments and futures contracts | | | (1.89 | ) | | | 1.30 | | | | 0.44 | | | | 1.54 | | | | (1.27 | ) |
| Total income (loss) from investment operations | | | (1.71 | ) | | | 1.51 | | | | 0.59 | | | | 1.79 | | | | (1.03 | ) |
| Less distributions from: | | | | | | | | | | | | | | | | | | | | |
| Net investment income | | | (1.09 | ) | | | (0.17 | ) | | | (0.26 | ) | | | (0.26 | ) | | | (0.23 | ) |
| Net realized gain | | | (4.84 | ) | | | — | | | | — | | | | (0.77 | ) | | | (0.67 | ) |
| Total distributions | | | (5.93 | ) | | | (0.17 | ) | | | (0.26 | ) | | | (1.03 | ) | | | (0.90 | ) |
| Net asset value, end of year | | $ | 5.52 | | | $ | 13.16 | | | $ | 11.82 | | | $ | 11.49 | | | $ | 10.73 | |
| Total return (c) | | | (13.45 | )% | | | 12.79 | % | | | 5.46 | % | | | 17.32 | % | | | (8.50 | )% |
| Ratios and Supplemental Data: | | | | | | | | | | | | | | | | | | | | |
| Net assets, end of year (in 000’s) | | $ | 17,478 | | | $ | 26,491 | | | $ | 28,548 | | | $ | 29,825 | | | $ | 26,999 | |
| Ratio of expenses to average net assets (d) | | | 0.40 | % | | | 0.40 | % | | | 0.40 | % | | | 0.40 | % | | | 0.40 | % |
| Ratio of net investment income to average net assets (b)(d) | | | 1.71 | % | | | 1.62 | % | | | 1.34 | % | | | 2.19 | % | | | 1.96 | % |
| Portfolio turnover rate | | | 18 | % | | | 9 | % | | | 37 | % | | | 36 | % | | | 50 | % |
| | | | | | | | | | | | | | | | | | | | | |
| (a) | Net investment income has been calculated using the average shares method, which more appropriately presents the per share data for the year. |
| (b) | Recognition of net investment income by the Portfolio is affected by the timing of the declaration of dividends by the underlying investment companies in which the Portfolio invests. |
| (c) | Total returns are historical and assume changes in share price and reinvestment of dividends and capital gains distributions, if any. |
| (d) | Does not include the expenses of the underlying investment companies in which the Portfolio invests. |
See accompanying notes to financial statements.
| TOPS® Managed Risk ETF Portfolios |
| Financial Highlights |
| Managed Risk Growth ETF Portfolio |
| |
| Selected data based on a share outstanding throughout each year indicated. |
| | | Class 2 Shares | |
| | | | | | | | | | | | | | | | |
| | | Year Ended | | | Year Ended | | | Year Ended | | | Year Ended | | | Year Ended | |
| | | December 31, 2022 | | | December 31, 2021 | | | December 31, 2020 | | | December 31, 2019 | | | December 31, 2018 | |
| Net asset value, beginning of year | | $ | 13.10 | | | $ | 11.76 | | | $ | 11.43 | | | $ | 10.67 | | | $ | 12.59 | |
| Income (loss) from investment operations: | | | | | | | | | | | | | | | | | | | | |
| Net investment income (a)(b) | | | 0.15 | | | | 0.17 | | | | 0.12 | | | | 0.22 | | | | 0.21 | |
| Net realized and unrealized gain (loss) on investments and futures contracts | | | (1.89 | ) | | | 1.31 | | | | 0.44 | | | | 1.54 | | | | (1.27 | ) |
| Total income (loss) from investment operations | | | (1.74 | ) | | | 1.48 | | | | 0.56 | | | | 1.76 | | | | (1.06 | ) |
| Less distributions from: | | | | | | | | | | | | | | | | | | | | |
| Net investment income | | | (0.97 | ) | | | (0.14 | ) | | | (0.23 | ) | | | (0.23 | ) | | | (0.19 | ) |
| Net realized gain | | | (4.84 | ) | | | — | | | | — | | | | (0.77 | ) | | | (0.67 | ) |
| Total distributions | | | (5.81 | ) | | | (0.14 | ) | | | (0.23 | ) | | | (1.00 | ) | | | (0.86 | ) |
| Net asset value, end of year | | $ | 5.55 | | | $ | 13.10 | | | $ | 11.76 | | | $ | 11.43 | | | $ | 10.67 | |
| Total return (c) | | | (13.73 | )% | | | 12.59 | % | | | 5.19 | % | | | 17.08 | % | | | (8.72 | )% |
| Ratios and Supplemental Data: | | | | | | | | | | | | | | | | | | | | |
| Net assets, end of year (in 000’s) | | $ | 103,516 | | | $ | 619,200 | | | $ | 613,432 | | | $ | 652,103 | | | $ | 640,432 | |
| Ratio of expenses to average net assets (d) | | | 0.65 | % | | | 0.65 | % | | | 0.65 | % | | | 0.65 | % | | | 0.65 | % |
| Ratio of net investment income to average net assets (b)(d) | | | 1.28 | % | | | 1.34 | % | | | 1.10 | % | | | 1.91 | % | | | 1.69 | % |
| Portfolio turnover rate | | | 18 | % | | | 9 | % | | | 37 | % | | | 36 | % | | | 50 | % |
| | | | | | | | | | | | | | | | | | | | | |
| (a) | Net investment income has been calculated using the average shares method, which more appropriately presents the per share data for the year. |
| (b) | Recognition of net investment income by the Portfolio is affected by the timing of the declaration of dividends by the underlying investment companies in which the Portfolio invests. |
| (c) | Total returns are historical and assume changes in share price and reinvestment of dividends and capital gains distributions, if any. |
| (d) | Does not include the expenses of the underlying investment companies in which the Portfolio invests. |
See accompanying notes to financial statements.
| TOPS® Managed Risk ETF Portfolios |
| Financial Highlights |
| Managed Risk Growth ETF Portfolio |
| |
| Selected data based on a share outstanding throughout each year indicated. |
| | | Class 3 Shares | |
| | | | | | | | | | | | | | | | |
| | | Year Ended | | | Year Ended | | | Year Ended | | | Year Ended | | | Year Ended | |
| | | December 31, 2022 | | | December 31, 2021 | | | December 31, 2020 | | | December 31, 2019 | | | December 31, 2018 | |
| Net asset value, beginning of year | | $ | 13.04 | | | $ | 11.71 | | | $ | 11.37 | | | $ | 10.62 | | | $ | 12.54 | |
| Income (loss) from investment operations: | | | | | | | | | | | | | | | | | | | | |
| Net investment income (a)(b) | | | 0.15 | | | | 0.16 | | | | 0.11 | | | | 0.20 | | | | 0.19 | |
| Net realized and unrealized gain (loss) on investments and futures contracts | | | (1.88 | ) | | | 1.29 | | | | 0.45 | | | | 1.53 | | | | (1.26 | ) |
| Total income (loss) from investment operations | | | (1.73 | ) | | | 1.45 | | | | 0.56 | | | | 1.73 | | | | (1.07 | ) |
| Less distributions from: | | | | | | | | | | | | | | | | | | | | |
| Net investment income | | | (1.04 | ) | | | (0.12 | ) | | | (0.22 | ) | | | (0.21 | ) | | | (0.18 | ) |
| Net realized gain | | | (4.84 | ) | | | — | | | | — | | | | (0.77 | ) | | | (0.67 | ) |
| Total distributions | | | (5.88 | ) | | | (0.12 | ) | | | (0.22 | ) | | | (0.98 | ) | | | (0.85 | ) |
| Net asset value, end of year | | $ | 5.43 | | | $ | 13.04 | | | $ | 11.71 | | | $ | 11.37 | | | $ | 10.62 | |
| Total return (c) | | | (13.79 | )% | | | 12.43 | % | | | 5.18 | % | | | 16.93 | % | | | (8.84 | )% |
| Ratios and Supplemental Data: | | | | | | | | | | | | | | | | | | | | |
| Net assets, end of year (in 000’s) | | $ | 71,051 | | | $ | 144,867 | | | $ | 149,766 | | | $ | 162,948 | | | $ | 159,859 | |
| Ratio of expenses to average net assets (d) | | | 0.75 | % | | | 0.75 | % | | | 0.75 | % | | | 0.75 | % | | | 0.75 | % |
| Ratio of net investment income to average net assets (b)(d) | | | 1.32 | % | | | 1.23 | % | | | 0.99 | % | | | 1.81 | % | | | 1.60 | % |
| Portfolio turnover rate | | | 18 | % | | | 9 | % | | | 37 | % | | | 36 | % | | | 50 | % |
| | | | | | | | | | | | | | | | | | | | | |
| (a) | Net investment income has been calculated using the average shares method, which more appropriately presents the per share data for the year. |
| (b) | Recognition of net investment income by the Portfolio is affected by the timing of the declaration of dividends by the underlying investment companies in which the Portfolio invests. |
| (c) | Total returns are historical and assume changes in share price and reinvestment of dividends and capital gains distributions, if any. |
| (d) | Does not include the expenses of the underlying investment companies in which the Portfolio invests. |
See accompanying notes to financial statements.
| TOPS® Managed Risk ETF Portfolios |
| Financial Highlights |
| Managed Risk Growth ETF Portfolio |
| |
| Selected data based on a share outstanding throughout each year indicated. |
| | | Class 4 Shares | |
| | | | | | | | | | | | | | | | |
| | | Year Ended | | | Year Ended | | | Year Ended | | | Year Ended | | | Year Ended | |
| | | December 31, 2022 | | | December 31, 2021 | | | December 31, 2020 | | | December 31, 2019 | | | December 31, 2018 | |
| Net asset value, beginning of year | | $ | 13.16 | | | $ | 11.82 | | | $ | 11.48 | | | $ | 10.69 | | | $ | 12.57 | |
| Income (loss) from investment operations: | | | | | | | | | | | | | | | | | | | | |
| Net investment income (a)(b) | | | 0.12 | | | | 0.13 | | | | 0.08 | | | | 0.18 | | | | 0.15 | |
| Net realized and unrealized gain (loss) on investments and futures contracts | | | (1.88 | ) | | | 1.30 | | | | 0.45 | | | | 1.54 | | | | (1.25 | ) |
| Total income (loss) from investment operations | | | (1.76 | ) | | | 1.43 | | | | 0.53 | | | | 1.72 | | | | (1.10 | ) |
| Less distributions from: | | | | | | | | | | | | | | | | | | | | |
| Net investment income | | | (1.03 | ) | | | (0.09 | ) | | | (0.19 | ) | | | (0.16 | ) | | | (0.11 | ) |
| Net realized gain | | | (4.84 | ) | | | — | | | | — | | | | (0.77 | ) | | | (0.67 | ) |
| Total distributions | | | (5.87 | ) | | | (0.09 | ) | | | (0.19 | ) | | | (0.93 | ) | | | (0.78 | ) |
| Net asset value, end of year | | $ | 5.53 | | | $ | 13.16 | | | $ | 11.82 | | | $ | 11.48 | | | $ | 10.69 | |
| Total return (c) | | | (13.86 | )% | | | 12.13 | % | | | 4.85 | % | | | 16.64 | % | | | (9.09 | )% |
| Ratios and Supplemental Data: | | | | | | | | | | | | | | | | | | | | |
| Net assets, end of year (in 000’s) | | $ | 3,590 | | | $ | 4,639 | | | $ | 4,592 | | | $ | 5,079 | | | $ | 4,833 | |
| Ratio of expenses to average net assets (d) | | | 1.00 | % | | | 1.00 | % | | | 1.00 | % | | | 1.00 | % | | | 1.00 | % |
| Ratio of net investment income to average net assets (b)(d) | | | 1.18 | % | | | 0.99 | % | | | 0.74 | % | | | 1.58 | % | | | 1.23 | % |
| Portfolio turnover rate | | | 18 | % | | | 9 | % | | | 37 | % | | | 36 | % | | | 50 | % |
| | | | | | | | | | | | | | | | | | | | | |
| (a) | Net investment income has been calculated using the average shares method, which more appropriately presents the per share data for the year. |
| (b) | Recognition of net investment income by the Portfolio is affected by the timing of the declaration of dividends by the underlying investment companies in which the Portfolio invests. |
| (c) | Total returns are historical and assume changes in share price and reinvestment of dividends and capital gains distributions, if any. |
| (d) | Does not include the expenses of the underlying investment companies in which the Portfolio invests. |
See accompanying notes to financial statements.
| TOPS® Managed Risk ETF Portfolios |
| Financial Highlights |
| Managed Risk Growth ETF Portfolio |
| |
| Selected data based on a share outstanding throughout each year indicated. |
| | | Investor Class Shares | |
| | | | | | | | | | | | | | | | |
| | | Year Ended | | | Year Ended | | | Year Ended | | | Year Ended | | | Year Ended | |
| | | December 31, 2022 | | | December 31, 2021 | | | December 31, 2020 | | | December 31, 2019 | | | December 31, 2018 | |
| Net asset value, beginning of year | | $ | 13.68 | | | $ | 12.34 | | | $ | 12.01 | | | $ | 11.25 | | | $ | 12.59 | |
| Income (loss) from investment operations: | | | | | | | | | | | | | | | | | | | | |
| Net investment income (a)(b) | | | 0.20 | | | | 0.24 | | | | 0.05 | | | | 0.25 | | | | 0.17 | |
| Net realized and unrealized gain (loss) on investments and futures contracts | | | (1.96 | ) | | | 1.24 | | | | 0.51 | | | | 1.51 | | | | (0.65 | ) |
| Total income (loss) from investment operations | | | (1.76 | ) | | | 1.48 | | | | 0.56 | | | | 1.76 | | | | (0.48 | ) |
| Less distributions from: | | | | | | | | | | | | | | | | | | | | |
| Net investment income | | | (0.97 | ) | | | (0.14 | ) | | | (0.23 | ) | | | (0.23 | ) | | | (0.19 | ) |
| Net realized gain | | | (4.84 | ) | | | — | | | | — | | | | (0.77 | ) | | | (0.67 | ) |
| Total distributions | | | (5.81 | ) | | | (0.14 | ) | | | (0.23 | ) | | | (1.00 | ) | | | (0.86 | ) |
| Net asset value, end of year (c) | | $ | 6.11 | | | $ | 13.68 | | | $ | 12.34 | | | $ | 12.01 | | | $ | 11.25 | |
| Total return (d) | | | (13.38 | )% | | | 12.00 | % | | | 4.92 | % | | | 16.12 | % | | | (8.32 | )% |
| Ratios and Supplemental Data: | | | | | | | | | | | | | | | | | | | | |
| Net assets, end of year (e) | | $ | 14 | | | $ | 16 | | | $ | 15 | | | $ | 14 | | | $ | 12 | |
| Ratio of expenses to average net assets (f) | | | 0.90 | % | | | 0.90 | % | | | 0.90 | % | | | 0.90 | % | | | 0.90 | % |
| Ratio of net investment income to average net assets (b)(f) | | | 1.08 | % | | | 0.89 | % | | | 0.64 | % | | | 1.48 | % | | | 1.44 | % |
| Portfolio turnover rate | | | 18 | % | | | 9 | % | | | 37 | % | | | 36 | % | | | 50 | % |
| | | | | | | | | | | | | | | | | | | | | |
| (a) | Net investment income has been calculated using the average shares method, which more appropriately presents the per share data for the year. |
| (b) | Recognition of net investment income by the Portfolio is affected by the timing of the declaration of dividends by the underlying investment companies in which the Portfolio invests. |
| (c) | NAV does not recalculate due to rounding of net assets. |
| (d) | Total returns are historical and assume changes in share price and reinvestment of dividends and capital gains distributions, if any. |
| (e) | Rounded net assets, not truncated. |
| (f) | Does not include the expenses of the underlying investment companies in which the Portfolio invests. |
See accompanying notes to financial statements.
| TOPS® Managed Risk ETF Portfolios |
| Financial Highlights |
| Managed Risk Moderate Growth ETF Portfolio |
| |
| Selected data based on a share outstanding throughout each year indicated. |
| | | Class 1 Shares | |
| | | | | | | | | | | | | | | | |
| | | Year Ended | | | Year Ended | | | Year Ended | | | Year Ended | | | Year Ended | |
| | | December 31, 2022 | | | December 31, 2021 | | | December 31, 2020 | | | December 31, 2019 | | | December 31, 2018 | |
| Net asset value, beginning of year | | $ | 13.50 | | | $ | 12.29 | | | $ | 11.99 | | | $ | 11.02 | | | $ | 12.71 | |
| Income (loss) from investment operations: | | | | | | | | | | | | | | | | | | | | |
| Net investment income (a)(b) | | | 0.16 | | | | 0.22 | | | | 0.16 | | | | 0.27 | | | | 0.25 | |
| Net realized and unrealized gain (loss) on investments and futures contracts | | | (1.86 | ) | | | 1.17 | | | | 0.54 | | | | 1.51 | | | | (1.10 | ) |
| Total income (loss) from investment operations | | | (1.70 | ) | | | 1.39 | | | | 0.70 | | | | 1.78 | | | | (0.85 | ) |
| Less distributions from: | | | | | | | | | | | | | | | | | | | | |
| Net investment income | | | (2.09 | ) | | | (0.18 | ) | | | (0.30 | ) | | | (0.30 | ) | | | (0.24 | ) |
| Net realized gain | | | (7.51 | ) | | | — | | | | (0.10 | ) | | | (0.51 | ) | | | (0.60 | ) |
| Total distributions | | | (9.60 | ) | | | (0.18 | ) | | | (0.40 | ) | | | (0.81 | ) | | | (0.84 | ) |
| Net asset value, end of year | | $ | 2.20 | | | $ | 13.50 | | | $ | 12.29 | | | $ | 11.99 | | | $ | 11.02 | |
| Total return (c) | | | (13.22 | )% | | | 11.38 | % | | | 6.20 | % | | | 16.59 | % | | | (7.00 | )% |
| Ratios and Supplemental Data: | | | | | | | | | | | | | | | | | | | | |
| Net assets, end of year (in 000’s) | | $ | 326 | | | $ | 1,167 | | | $ | 1,116 | | | $ | 1,115 | | | $ | 1,015 | |
| Ratio of expenses to average net assets (d) | | | 0.41 | % | | | 0.40 | % | | | 0.40 | % | | | 0.40 | % | | | 0.40 | % |
| Ratio of net investment income to average net assets (b)(d) | | | 1.79 | % | | | 1.68 | % | | | 1.43 | % | | | 2.31 | % | | | 1.98 | % |
| Portfolio turnover rate | | | 14 | % | | | 9 | % | | | 32 | % | | | 35 | % | | | 38 | % |
| | | | | | | | | | | | | | | | | | | | | |
| (a) | Net investment income has been calculated using the average shares method, which more appropriately presents the per share data for the year. |
| (b) | Recognition of net investment income by the Portfolio is affected by the timing of the declaration of dividends by the underlying investment companies in which the Portfolio invests. |
| (c) | Total returns are historical and assume changes in share price and reinvestment of dividends and capital gains distributions, if any. |
| (d) | Does not include the expenses of the underlying investment companies in which the Portfolio invests. |
See accompanying notes to financial statements.
| TOPS® Managed Risk ETF Portfolios |
| Financial Highlights |
| Managed Risk Moderate Growth ETF Portfolio |
| |
| Selected data based on a share outstanding throughout each year indicated. |
| | | Class 2 Shares | |
| | | | | | | | | | | | | | | | |
| | | Year Ended | | | Year Ended | | | Year Ended | | | Year Ended | | | Year Ended | |
| | | December 31, 2022 | | | December 31, 2021 | | | December 31, 2020 | | | December 31, 2019 | | | December 31, 2018 | |
| Net asset value, beginning of year | | $ | 13.45 | | | $ | 12.25 | | | $ | 11.95 | | | $ | 10.98 | | | $ | 12.66 | |
| Income (loss) from investment operations: | | | | | | | | | | | | | | | | | | | | |
| Net investment income (a)(b) | | | 0.17 | | | | 0.18 | | | | 0.13 | | | | 0.24 | | | | 0.24 | |
| Net realized and unrealized gain (loss) on investments and futures contracts | | | (1.88 | ) | | | 1.17 | | | | 0.54 | | | | 1.50 | | | | (1.11 | ) |
| Total income (loss) from investment operations | | | (1.71 | ) | | | 1.35 | | | | 0.67 | | | | 1.74 | | | | (0.87 | ) |
| Less distributions from: | | | | | | | | | | | | | | | | | | | | |
| Net investment income | | | (1.87 | ) | | | (0.15 | ) | | | (0.27 | ) | | | (0.26 | ) | | | (0.21 | ) |
| Net realized gain | | | (7.51 | ) | | | — | | | | (0.10 | ) | | | (0.51 | ) | | | (0.60 | ) |
| Total distributions | | | (9.38 | ) | | | (0.15 | ) | | | (0.37 | ) | | | (0.77 | ) | | | (0.81 | ) |
| Net asset value, end of year | | $ | 2.36 | | | $ | 13.45 | | | $ | 12.25 | | | $ | 11.95 | | | $ | 10.98 | |
| Total return (c) | | | (13.35 | )% | | | 11.06 | % | | | 5.91 | % | | | 16.30 | % | | | (7.22 | )% |
| Ratios and Supplemental Data: | | | | | | | | | | | | | | | | | | | | |
| Net assets, end of year (in 000’s) | | $ | 55,717 | | | $ | 626,034 | | | $ | 629,522 | | | $ | 673,353 | | | $ | 678,295 | |
| Ratio of expenses to average net assets (d) | | | 0.66 | % | | | 0.65 | % | | | 0.65 | % | | | 0.65 | % | | | 0.65 | % |
| Ratio of net investment income to average net assets (b)(d) | | | 1.41 | % | | | 1.41 | % | | | 1.16 | % | | | 2.02 | % | | | 1.86 | % |
| Portfolio turnover rate | | | 14 | % | | | 9 | % | | | 32 | % | | | 35 | % | | | 38 | % |
| | | | | | | | | | | | | | | | | | | | | |
| (a) | Net investment income has been calculated using the average shares method, which more appropriately presents the per share data for the year. |
| (b) | Recognition of net investment income by the Portfolio is affected by the timing of the declaration of dividends by the underlying investment companies in which the Portfolio invests. |
| (c) | Total returns are historical and assume changes in share price and reinvestment of dividends and capital gains distributions, if any. |
| (d) | Does not include the expenses of the underlying investment companies in which the Portfolio invests. |
See accompanying notes to financial statements.
| TOPS® Managed Risk ETF Portfolios |
| Financial Highlights |
| Managed Risk Moderate Growth ETF Portfolio |
| |
| Selected data based on a share outstanding throughout each year indicated. |
| | | Class 3 Shares | |
| | | | | | | | | | | | | | | | |
| | | Year Ended | | | Year Ended | | | Year Ended | | | Year Ended | | | Year Ended | |
| | | December 31, 2022 | | | December 31, 2021 | | | December 31, 2020 | | | December 31, 2019 | | | December 31, 2018 | |
| Net asset value, beginning of year | | $ | 13.41 | | | $ | 12.21 | | | $ | 11.90 | | | $ | 10.94 | | | $ | 12.63 | |
| Income (loss) from investment operations: | | | | | | | | | | | | | | | | | | | | |
| Net investment income (a)(b) | | | 0.15 | | | | 0.17 | | | | 0.12 | | | | 0.22 | | | | 0.22 | |
| Net realized and unrealized gain (loss) on investments and futures contracts | | | (1.87 | ) | | | 1.17 | | | | 0.54 | | | | 1.50 | | | | (1.11 | ) |
| Total income (loss) from investment operations | | | (1.72 | ) | | | 1.34 | | | | 0.66 | | | | 1.72 | | | | (0.89 | ) |
| Less distributions from: | | | | | | | | | | | | | | | | | | | | |
| Net investment income | | | (2.01 | ) | | | (0.14 | ) | | | (0.25 | ) | | | (0.25 | ) | | | (0.20 | ) |
| Net realized gain | | | (7.51 | ) | | | — | | | | (0.10 | ) | | | (0.51 | ) | | | (0.60 | ) |
| Total distributions | | | (9.52 | ) | | | (0.14 | ) | | | (0.35 | ) | | | (0.76 | ) | | | (0.80 | ) |
| Net asset value, end of year | | $ | 2.17 | | | $ | 13.41 | | | $ | 12.21 | | | $ | 11.90 | | | $ | 10.94 | |
| Total return (c) | | | (13.53 | )% | | | 10.98 | % | | | 5.90 | % | | | 16.16 | % | | | (7.38 | )% |
| Ratios and Supplemental Data: | | | | | | | | | | | | | | | | | | | | |
| Net assets, end of year (in 000’s) | | $ | 50,774 | | | $ | 157,188 | | | $ | 159,926 | | | $ | 171,983 | | | $ | 170,062 | |
| Ratio of expenses to average net assets (d) | | | 0.76 | % | | | 0.75 | % | | | 0.75 | % | | | 0.75 | % | | | 0.75 | % |
| Ratio of net investment income to average net assets (b)(d) | | | 1.44 | % | | | 1.30 | % | | | 1.06 | % | | | 1.92 | % | | | 1.79 | % |
| Portfolio turnover rate | | | 14 | % | | | 9 | % | | | 32 | % | | | 35 | % | | | 38 | % |
| | | | | | | | | | | | | | | | | | | | | |
| (a) | Net investment income has been calculated using the average shares method, which more appropriately presents the per share data for the year. |
| (b) | Recognition of net investment income by the Portfolio is affected by the timing of the declaration of dividends by the underlying investment companies in which the Portfolio invests. |
| (c) | Total returns are historical and assume changes in share price and reinvestment of dividends and capital gains distributions, if any. |
| (d) | Does not include the expenses of the underlying investment companies in which the Portfolio invests. |
See accompanying notes to financial statements.
| TOPS® Managed Risk ETF Portfolios |
| Financial Highlights |
| Managed Risk Moderate Growth ETF Portfolio |
| |
| Selected data based on a share outstanding throughout each year indicated. |
| | | Class 4 Shares | |
| | | | | | | | | | | | | | | | |
| | | Year Ended | | | Year Ended | | | Year Ended | | | Year Ended | | | Year Ended | |
| | | December 31, 2022 | | | December 31, 2021 | | | December 31, 2020 | | | December 31, 2019 | | | December 31, 2018 | |
| Net asset value, beginning of year | | $ | 13.36 | | | $ | 12.16 | | | $ | 11.86 | | | $ | 10.90 | | | $ | 12.57 | |
| Income (loss) from investment operations: | | | | | | | | | | | | | | | | | | | | |
| Net investment income (a)(b) | | | 0.11 | | | | 0.14 | | | | 0.09 | | | | 0.20 | | | | 0.19 | |
| Net realized and unrealized gain (loss) on investments and futures contracts | | | (1.85 | ) | | | 1.16 | | | | 0.53 | | | | 1.49 | | | | (1.10 | ) |
| Total income (loss) from investment operations | | | (1.74 | ) | | | 1.30 | | | | 0.62 | | | | 1.69 | | | | (0.91 | ) |
| Less distributions from: | | | | | | | | | | | | | | | | | | | | |
| Net investment income | | | (2.03 | ) | | | (0.10 | ) | | | (0.22 | ) | | | (0.22 | ) | | | (0.16 | ) |
| Net realized gain | | | (7.51 | ) | | | — | | | | (0.10 | ) | | | (0.51 | ) | | | (0.60 | ) |
| Total distributions | | | (9.54 | ) | | | (0.10 | ) | | | (0.32 | ) | | | (0.73 | ) | | | (0.76 | ) |
| Net asset value, end of year | | $ | 2.08 | | | $ | 13.36 | | | $ | 12.16 | | | $ | 11.86 | | | $ | 10.90 | |
| Total return (c) | | | (13.76 | )% | | | 10.72 | % | | | 5.53 | % | | | 15.88 | % | | | (7.61 | )% |
| Ratios and Supplemental Data: | | | | | | | | | | | | | | | | | | | | |
| Net assets, end of year (in 000’s) | | $ | 4,595 | | | $ | 6,376 | | | $ | 6,657 | | | $ | 7,455 | | | $ | 6,905 | |
| Ratio of expenses to average net assets (d) | | | 1.01 | % | | | 1.00 | % | | | 1.00 | % | | | 1.00 | % | | | 1.00 | % |
| Ratio of net investment income to average net assets (b)(d) | | | 1.37 | % | | | 1.04 | % | | | 0.80 | % | | | 1.70 | % | | | 1.51 | % |
| Portfolio turnover rate | | | 14 | % | | | 9 | % | | | 32 | % | | | 35 | % | | | 38 | % |
| | | | | | | | | | | | | | | | | | | | | |
| (a) | Net investment income has been calculated using the average shares method, which more appropriately presents the per share data for the year. |
| (b) | Recognition of net investment income by the Portfolio is affected by the timing of the declaration of dividends by the underlying investment companies in which the Portfolio invests. |
| (c) | Total returns are historical and assume changes in share price and reinvestment of dividends and capital gains distributions, if any. |
| (d) | Does not include the expenses of the underlying investment companies in which the Portfolio invests. |
See accompanying notes to financial statements.
| TOPS® Managed Risk ETF Portfolios |
| Financial Highlights |
| Managed Risk Moderate Growth ETF Portfolio |
| |
| Selected data based on a share outstanding throughout each year indicated. |
| | | Investor Class Shares | |
| | | | | | | | | | | | | | | | |
| | | Year Ended | | | Year Ended | | | Year Ended | | | Year Ended | | | Year Ended | |
| | | December 31, 2022 | | | December 31, 2021 | | | December 31, 2020 | | | December 31, 2019 | | | December 31, 2018 | |
| Net asset value, beginning of year | | $ | 14.27 | | | $ | 13.04 | | | $ | 12.74 | | | $ | 11.77 | | | $ | 12.67 | |
| Income (loss) from investment operations: | | | | | | | | | | | | | | | | | | | | |
| Net investment income (loss) (a)(b) | | | (0.14 | ) | | | 0.21 | | | | 0.09 | | | | 0.32 | | | | 0.20 | |
| Net realized and unrealized gain (loss) on investments and futures contracts | | | (1.63 | ) | | | 1.17 | | | | 0.58 | | | | 1.42 | | | | (0.29 | ) |
| Total income (loss) from investment operations | | | (1.77 | ) | | | 1.38 | | | | 0.67 | | | | 1.74 | | | | (0.09 | ) |
| Less distributions from: | | | | | | | | | | | | | | | | | | | | |
| Net investment income | | | — | | | | (0.15 | ) | | | (0.27 | ) | | | (0.26 | ) | | | (0.21 | ) |
| Net realized gain | | | (7.51 | ) | | | — | | | | (0.10 | ) | | | (0.51 | ) | | | (0.60 | ) |
| Total distributions | | | (7.51 | ) | | | (0.15 | ) | | | (0.37 | ) | | | (0.77 | ) | | | (0.81 | ) |
| Net asset value, end of year | | $ | 4.99 | | | $ | 14.27 | | | $ | 13.04 | (f) | | $ | 12.74 | (f) | | $ | 11.77 | (f) |
| Total return (c) | | | (12.84 | )% | | | 10.62 | % | | | 5.52 | % | | | 15.21 | % | | | (6.77 | )% |
| Ratios and Supplemental Data: | | | | | | | | | | | | | | | | | | | | |
| Net assets, end of year (d) | | $ | 15 | | | $ | 521,296 | | | $ | 15 | | | $ | 14 | | | $ | 13 | |
| Ratio of expenses to average net assets (e) | | | 0.91 | % | | | 0.90 | % | | | 0.90 | % | | | 0.90 | % | | | 0.90 | % |
| Ratio of net investment income (loss) to average net assets (b)(e) | | | (0.92 | )% | | | 1.49 | % | | | 0.70 | % | | | 1.60 | % | | | 1.61 | % |
| Portfolio turnover rate | | | 14 | % | | | 9 | % | | | 32 | % | | | 35 | % | | | 38 | % |
| | | | | | | | | | | | | | | | | | | | | |
| (a) | Net investment income has been calculated using the average shares method, which more appropriately presents the per share data for the year. |
| (b) | Recognition of net investment income (loss) by the Portfolio is affected by the timing of the declaration of dividends by the underlying investment companies in which the Portfolio invests. |
| (c) | Total returns are historical and assume changes in share price and reinvestment of dividends and capital gains distributions, if any. |
| (d) | Rounded net assets, not truncated. |
| (e) | Does not include the expenses of the underlying investment companies in which the Portfolio invests. |
| (f) | NAV does not recalculate due to rounding of net assets. |
See accompanying notes to financial statements.
| TOPS® Managed Risk ETF Portfolios |
| Notes to Financial Statements |
| December 31, 2022 |
The TOPS® Managed Risk ETF Portfolios (each a “Portfolio”, collectively the “Portfolios”) are comprised of three different actively managed portfolios. Each Portfolio is a diversified series of shares of beneficial interest of Northern Lights Variable Trust (the “Trust”), a statutory trust organized on November 2, 2005 under the laws of the State of Delaware and registered under the Investment Company Act of 1940, as amended (the “1940 Act”), as an open-end management investment company. The Portfolios are intended to be funding vehicles for variable annuity contracts and flexible premium variable life insurance policies offered by the separate accounts of various insurance companies. The assets of each Portfolio are segregated and a shareholder’s interest is limited to the Portfolio in which shares are held. Each Portfolio pays its own expenses. The investment objective of each Portfolio is as follows:
| Portfolio | Primary Objective |
| Managed Risk Balanced ETF Portfolio | Income and capital appreciation with less volatility than the fixed income and equity markets as a whole. |
| Managed Risk Growth ETF Portfolio | Capital appreciation with less volatility than the equity markets as a whole. |
| Managed Risk Moderate Growth Portfolio | Capital appreciation with less volatility than the equity markets as a whole. |
The Portfolios currently offer five classes of shares: Class 1 Shares, Class 2 Shares, Class 3 Shares, Class 4 Shares, and Investor Class Shares. Each class of shares of the Portfolios has identical rights and privileges except with respect to arrangements pertaining to shareholder servicing or distribution, class-related expenses, voting rights on matters affecting a single class of shares, and the exchange privilege of each class of shares. The Portfolios’ share classes differ in the fees and expenses charged to shareholders. The Portfolios’ income, expenses (other than class specific distribution fees) and realized and unrealized gains and losses are allocated proportionately each day based upon the relative net assets of each class.
| 2. | SIGNIFICANT ACCOUNTING POLICIES |
The following is a summary of significant accounting policies followed by the Portfolios in preparation of their financial statements. These policies are in conformity with accounting principles generally accepted in the United States of America (“GAAP”). The preparation of financial statements in conformity with GAAP requires management to make estimates and assumptions that affect the reported amounts of assets and liabilities and disclosure of contingent assets and liabilities at the date of the financial statements and the reported amounts of increases and decreases in net assets from operations during the reporting period. Actual results could differ from those estimates. The Portfolios are investment companies and accordingly follow the investment company accounting and reporting guidance of the Financial Accounting Standards Board (“FASB”) Accounting Standards Codification Topic 946 “Financial Services Investment Companies”, including Accounting Standards Update 2013-08.
Securities Valuation – Securities listed on an exchange are valued at the last reported sale price at the close of the regular trading session of the primary exchange on the business day the value is being determined, or in the case of securities listed on NASDAQ at the NASDAQ Official Closing Price (“NOCP”). In the absence of a sale, such securities shall be valued at the mean between the current bid and ask prices on the primary exchange on the day of valuation . The independent pricing service does not distinguish between smaller-sized bond positions known as “odd lots” and larger institutional-sized bond positions known as “round lots”. The Portfolios may fair value a particular bond if the advisor does not believe that the round lot value provided by the independent pricing service reflects fair value of the Portfolios’ holding. Short-term debt obligations having 60 days or less remaining until maturity, at time of purchase, may be valued at amortized cost. Futures and future options are valued at the final settled price or, in the absence of a settled price, at the last sale price on the day of valuation.
| TOPS® Managed Risk ETF Portfolios |
| Notes to Financial Statements (Continued) |
| December 31, 2022 |
Valuation of Funds of Funds – The Portfolios may invest in portfolios of open-end investment companies. Open-end investment companies are valued at their respective net asset values as reported by such investment companies. Open-end investment companies value securities in their portfolios for which market quotations are readily available at their market values (generally the last reported sale price) and all other securities and assets at their fair value based on the methods established by the boards of directors or trustees of the open-end investment companies.
The Porfolios may hold securities, such as private investments, interests in commodity pools, other non-traded securities or temporarily illiquid securities, for which market quotations are not readily available or are determined to be unreliable. These securities are valued using the “fair value” procedures approved by the Board. The Board has designated the adviser as its valuation designee (the “Valuation Designee”) to execute these procedures. The Board may also enlist third party consultants such as a valuation specialist at a public accounting firm, valuation consultant or financial officer of a security issuer on an as-needed basis to assist the Valuation Designee in determining a security-specific fair value. The Board is responsible for reviewing and approving fair value methodologies utilized by the Valuation Designee, approval of which shall be based upon whether the Valuation Designee followed the valuation procedures established by the Board.
Fair Valuation Process – The applicable investments are valued by the Valuation Designee pursuant to valuation procedures established by the Board. For example, fair value determinations are required for the following securities: (i) securities for which market quotations are insufficient or not readily available on a particular business day (including securities for which there is a short and temporary lapse in the provision of a price by the regular pricing source); (ii) securities for which, in the judgment of the Valuation Designee, the prices or values available do not represent the fair value of the instrument; factors which may cause the Valuation Designee to make such a judgment include, but are not limited to, the following: only a bid price or an asked price is available; the spread between bid and asked prices is substantial; the frequency of sales; the thinness of the market; the size of reported trades; and actions of the securities markets, such as the suspension or limitation of trading; (iii) securities determined to be illiquid; and (iv) securities with respect to which an event that affects the value thereof has occurred (a “significant event”) since the closing prices were established on the principal exchange on which they are traded, but prior to a Portfolio’s calculation of its net asset value. Specifically, interests in commodity pools or managed futures pools are valued on a daily basis by reference to the closing market prices of each futures contract or other asset held by a pool, as adjusted for pool expenses. Restricted or illiquid securities, such as private investments or non-traded securities are valued based upon the current bid for the security from two or more independent dealers or other parties reasonably familiar with the facts and circumstances of the security (who should take into consideration all relevant factors as may be appropriate under the circumstances). If a current bid from such independent dealers or other independent parties is unavailable, the Valuation Designee shall determine the fair value of such security using the following factors: (i) the type of security; (ii) the cost at date of purchase; (iii) the size and nature of the Portfolios’ holdings; (iv) the discount from market value of unrestricted securities of the same class at the time of purchase and subsequent thereto; (v) information as to any transactions or offers with respect to the security; (vi) the nature and duration of restrictions on disposition of the security and the existence of any registration rights; (vii) how the yield of the security compares to similar securities of companies of similar or equal creditworthiness; (viii) the level of recent trades of similar or comparable securities; (ix) the liquidity characteristics of the security; (x) current market conditions; and (xi) the market value of any securities into which the security is convertible or exchangeable.
Each Portfolio utilizes various methods to measure the fair value of all of its investments on a recurring basis. GAAP establishes a hierarchy that prioritizes inputs to valuation methods. The three levels of input are:
Level 1 – Unadjusted quoted prices in active markets for identical assets and liabilities that the Portfolios have the ability to access.
Level 2 – Observable inputs other than quoted prices included in Level 1 that are observable for the asset or liability, either directly or indirectly. These inputs may include quoted prices for the identical instrument in an inactive market, prices for similar instruments, interest rates, prepayment speeds, credit risk, yield curves, default rates and similar data.
Level 3 – Unobservable inputs for the asset or liability, to the extent relevant observable inputs are not available, representing the Portfolios’ own assumptions about the assumptions a market participant would use in valuing the asset or liability, and would be based on the best information available.
| TOPS® Managed Risk ETF Portfolios |
| Notes to Financial Statements (Continued) |
| December 31, 2022 |
The availability of observable inputs can vary from security to security and is affected by a wide variety of factors, including, for example, the type of security, whether the security is new and not yet established in the marketplace, the liquidity of markets, and other characteristics particular to the security. To the extent that valuation is based on models or inputs that are less observable or unobservable in the market, the determination of fair value requires more judgment. Accordingly, the degree of judgment exercised in determining fair value is greatest for instruments categorized in Level 3.
The inputs used to measure fair value may fall into different levels of the fair value hierarchy. In such cases, for disclosure purposes, the level in the fair value hierarchy within which the fair value measurement falls in its entirety, is determined based on the lowest level input that is significant to the fair value measurement in its entirety.
The inputs or methodology used for valuing securities are not necessarily an indication of the risk associated with investing in those securities. The following tables summarize the inputs used as of December 31, 2022 for each Portfolio’s investments measured at fair value:
| Managed Risk Balanced ETF Portfolio | |
| | | | | | | | | | | | | |
| Assets* | | Level 1 | | | Level 2 | | | Level 3 | | | Total | |
| Exchange-Traded Funds | | $ | 52,575,633 | | | $ | — | | | $ | — | | | $ | 52,575,633 | |
| Short-Term Investments | | | 10,291,943 | | | | — | | | | — | | | | 10,291,943 | |
| Derivatives | | | | | | | | | | | | | | | | |
| Futures Contracts ** | | | 202,812 | | | | — | | | | — | | | | 202,812 | |
| Total | | $ | 63,070,388 | | | $ | — | | | $ | — | | | $ | 63,070,388 | |
| | | | | | | | | | | | | | | | | |
| Liabilities* | | Level 1 | | | Level 2 | | | Level 3 | | | Total | |
| Futures Contracts ** | | $ | 3,545 | | | $ | — | | | $ | — | | | $ | 3,545 | |
| | | | | | | | | | | | | | | | | |
| Managed Risk Growth ETF Portfolio | |
| | | | | | | | | | | | | | | | | |
| Assets* | | Level 1 | | | Level 2 | | | Level 3 | | | Total | |
| Exchange-Traded Funds | | $ | 172,449,210 | | | $ | — | | | $ | — | | | $ | 172,449,210 | |
| Short-Term Investments | | | 23,581,583 | | | | — | | | | — | | | | 23,581,583 | |
| Derivatives | | | | | | | | | | | | | | | | |
| Futures Contracts ** | | | 1,298,200 | | | | — | | | | — | | | | 1,298,200 | |
| Total | | $ | 197,328,993 | | | $ | — | | | $ | — | | | $ | 197,328,993 | |
| | | | | | | | | | | | | | | | | |
| Liabilities* | | Level 1 | | | Level 2 | | | Level 3 | | | Total | |
| Futures Contracts ** | | $ | 3,545 | | | $ | — | | | $ | — | | | $ | 3,545 | |
| TOPS® Managed Risk ETF Portfolios |
| Notes to Financial Statements (Continued) |
| December 31, 2022 |
| Managed Risk Moderate Growth ETF Portfolio | |
| | | | | | | | | | | | | |
| Assets* | | Level 1 | | | Level 2 | | | Level 3 | | | Total | |
| Exchange-Traded Funds | | $ | 98,230,565 | | | $ | — | | | $ | — | | | $ | 98,230,565 | |
| Short-Term Investments | | | 16,550,179 | | | | — | | | | — | | | | 16,550,179 | |
| | | | | | | | | | | | | | | | | |
| Derivatives | | | | | | | | | | | | |
| Futures Contracts ** | | | 440,787 | | | | — | | | | — | | | | 440,787 | |
| Total | | $ | 115,221,531 | | | $ | — | | | $ | — | | | $ | 115,221,531 | |
| | | | | | | | | | | | | | | | | |
| Liabilities* | | Level 1 | | | Level 2 | | | Level 3 | | | Total | |
| Futures Contracts ** | | $ | 4,605 | | | $ | — | | | $ | — | | | $ | 4,605 | |
The Portfolios did not hold any Level 2 or 3 securities during the year ended December 31, 2022.
| * | Refer to the Schedule of Investments for security classifications. |
| ** | Cumulative unrealized appreciation (depreciation) of futures contracts is reported in the above table. |
Security Transactions and Related Income – Security transactions are accounted for on the trade date. Interest income is recognized on an accrual basis. Discounts are accreted and premiums are amortized on securities purchased over the lives of the respective securities. Dividend income is recorded on the ex-dividend date. Realized gains or losses from sales of securities are determined by comparing the identified cost of the security lot sold with the net sales proceeds.
Dividends and Distributions to Shareholders – Dividends from net investment income and distributions from net realized capital gains if any, are declared and paid annually. Dividends and distributions to shareholders are recorded on the ex-date and are determined in accordance with federal income tax regulations, which may differ from GAAP. These “book/tax” differences are considered either temporary (e.g., deferred losses, capital loss carryforwards) or permanent in nature. To the extent these differences are permanent in nature, such amounts are reclassified within the composition of net assets based on their federal tax-basis treatment; temporary differences do not require reclassification. These reclassifications have no effect on net assets, results from operations or net asset values per share of the Portfolios.
Federal Income Tax – It is each Portfolio’s policy to continue to qualify as a regulated investment company by complying with the provisions of the Internal Revenue Code that are applicable to regulated investment companies and to distribute substantially all of its taxable income and net realized gains to shareholders. Therefore, no federal income tax provision is required.
Each Portfolio will recognize the tax benefits of uncertain tax positions only where the position is “more likely than not” to be sustained assuming examination by tax authorities. Management has analyzed the Portfolios’ tax positions and has concluded that no liability for unrecognized tax benefits should be recorded related to uncertain tax positions taken on returns filed for open tax years ended December 31, 2019 through December 31, 2021 or expected to be taken in the Portfolios’ December 31, 2022 year-end tax return. Each Portfolio identified its major tax jurisdictions as U.S. federal, Ohio and foreign jurisdictions where the Portfolio makes significant investments. The Portfolios are not aware of any tax positions for which it is reasonably possible that the total amounts of unrecognized tax benefits will change materially in the next twelve months.
| TOPS® Managed Risk ETF Portfolios |
| Notes to Financial Statements (Continued) |
| December 31, 2022 |
Futures Contracts – The Portfolios are subject to equity price risk in the normal course of pursuing their investment objectives. The Portfolios may purchase or sell futures contracts to hedge against market risk and to reduce return volatility. Initial margin deposits required upon entering into futures contracts are satisfied by the segregation of specific securities or cash as collateral for the account of the broker (each Portfolio’s agent in acquiring the futures position). During the period the futures contracts are open, changes in the value of the contracts are recognized as unrealized gains or losses by “marking to market” on a daily basis to reflect the market value of the contracts at the end of each day’s trading. Variation margin payments are received or made depending upon whether unrealized gains or losses are incurred. When the contracts are closed, a Portfolio recognizes a realized gain or loss equal to the difference between the proceeds from, or cost of, the closing transaction and the Portfolio’s basis in the contract. If a Portfolio were unable to liquidate a futures contract and/or enter into an offsetting closing transaction, the Portfolio would continue to be subject to market risk with respect to the value of the contracts and continue to be required to maintain the margin deposits on the futures contracts. Each Portfolio segregates liquid securities having a value at least equal to the amount of the current obligation under any open futures contract. Risks may exceed amounts recognized in the Statements of Assets and Liabilities. With futures, there is minimal counterparty credit risk to a Portfolio since futures are exchange-traded and the exchange’s clearinghouse, as counterparty to all exchange-traded futures, guarantees the futures against default.
The following is a summary of the location of derivative investments on the Portfolios’ Statements of Asset and Liabilities as of December 31, 2022:
| | Managed Risk Balanced ETF Portfolio | |
| | | | | Statement of Assets and Liabilities | | | Unrealized Appreciation | |
| | Contract Type/Primary Risk Exposure | | | Location | | | (Depreciation) | |
| | Equity Risk | | | Unrealized appreciation on futures contracts | | | $ | 202,812 | |
| | Interest Risk | | | Unrealized depreciation on futures contracts | | | | (3,545 | ) |
| | Total | | | | | | $ | 199,267 | |
| | | | | | | | | | |
| | Managed Risk Growth ETF Portfolio | |
| | | | | Statement of Assets and Liabilities | | | Unrealized Appreciation | |
| | Contract Type/Primary Risk Exposure | | | Location | | | (Depreciation) | |
| | Equity Risk | | | Unrealized appreciation on futures contracts | | | $ | 1,298,200 | |
| | Interest Risk | | | Unrealized depreciation on futures contracts | | | | (3,545 | ) |
| | Total | | | | | | $ | 1,294,655 | |
| | | | | | | | | | |
| | Managed Risk Moderate Growth ETF Portfolio | |
| | | | | Statement of Assets and Liabilities | | | Unrealized Appreciation | |
| | Contract Type/Primary Risk Exposure | | | Location | | | (Depreciation) | |
| | Equity Risk | | | Unrealized appreciation on futures contracts | | | $ | 440,787 | |
| | Interest Risk | | | Unrealized depreciation on futures contracts | | | | (4,605 | ) |
| | Total | | | | | | $ | 436,182 | |
| TOPS® Managed Risk ETF Portfolios |
| Notes to Financial Statements (Continued) |
| December 31, 2022 |
The following is a summary of the location of derivative investments on the Portfolios’ Statements of Operations for the year ended December 31, 2022:
Managed Risk Balanced ETF Portfolio
| | | | | | | | | | | Realized and Unrealized Gain | |
| | | | | | | | Location of Gain (Loss) on Derivatives | | | (Loss) on Derivatives | |
| | Derivative Investment Type | | | Primary Risk Exposure | | | recognized in income | | | recognized in income | |
| | Futures Contracts | | | Equity Risk | | | Net realized gain on futures transactions | | | $ | 3,135,874 | |
| | Futures Contracts | | | Interest Risk | | | Net realized loss on futures transactions | | | | (3,033,443 | ) |
| | Total | | | | | | | | | $ | 102,431 | |
| | | | | | | | | | | | | |
| | Futures Contracts | | | Equity Risk | | | Net change in unrealized depreciation on futures contracts | | | $ | (139,528 | ) |
| | Futures Contracts | | | Interest Risk | | | Net change in unrealized depreciation on futures contracts | | | | (4,315 | ) |
| | Total | | | | | | | | | $ | (143,843 | ) |
| | | | | | | | | | | | | |
| | Managed Risk Growth ETF Portfolio | |
| | | | | | | | | | | Realized and Unrealized Gain | |
| | | | | | | | Location of Gain (Loss) on Derivatives | | | (Loss) on Derivatives | |
| | Derivative Investment Type | | | Primary Risk Exposure | | | recognized in income | | | recognized in income | |
| | Futures Contracts | | | Equity Risk | | | Net realized gain on futures transactions | | | $ | 22,937,961 | |
| | Futures Contracts | | | Interest Risk | | | Net realized loss on futures transactions | | | | (7,263,374 | ) |
| | Total | | | | | | | | | $ | 15,674,587 | |
| | | | | | | | | | | | | |
| | Futures Contracts | | | Equity Risk | | | Net change in unrealized on futures appreciation contracts | | | $ | 1,589,975 | |
| | Futures Contracts | | | Interest Risk | | | Net change in unrealized appreciation on futures contracts | | | | 9,064 | |
| | Total | | | | | | | | | $ | 1,599,039 | |
| | | | | | | | | | | | | |
| | Managed Risk Moderate Growth ETF Portfolio | |
| | | | | | | | | | | Realized and Unrealized Gain | |
| | | | | | | | Location of Gain (Loss) on Derivatives | | | (Loss) on Derivatives | |
| | Derivative Investment Type | | | Primary Risk Exposure | | | recognized in income | | | recognized in income | |
| | Futures Contracts | | | Equity Risk | | | Net realized gain on futures transactions | | | $ | 8,797,400 | |
| | Futures Contracts | | | Interest Risk | | | Net realized loss on futures transactions | | | | (5,350,028 | ) |
| | Total | | | | | | | | | $ | 3,447,372 | |
| | | | | | | | | | | | | |
| | Futures Contracts | | | Equity Risk | | | Net change in unrealized appreciation on futures contracts | | | $ | 154,802 | |
| | Futures Contracts | | | Interest Risk | | | Net change in unrealized appreciation on futures contracts | | | | 13,168 | |
| | Total | | | | | | | | | $ | 167,970 | |
The notional value of the derivative instruments outstanding as of December 31, 2022 as disclosed in the Schedules of Investments and the amounts realized and changes in unrealized gains and losses on derivative instruments during the year as disclosed above and within the Statements of Operations serve as indicators of the volume of derivative activity for each Portfolio.
| TOPS® Managed Risk ETF Portfolios |
| Notes to Financial Statements (Continued) |
| December 31, 2022 |
Exchange Traded Funds – The Portfolio may invest in exchange traded funds (“ETFs”). An ETF is a type of open-end fund, however, unlike a mutual fund, its shares are bought and sold on a securities exchange at market price and only certain financial institutions called authorized participants may buy and redeem shares of the ETF at net asset value. ETF shares can trade at either a premium or discount to net asset value. Each ETF like a mutual fund is subject to specific risks depending on the type of strategy (actively managed or passively tracking an index) and the composition of its underlying holdings. Investing in an ETF involves substantially the same risks as investing directly in the ETF’s underlying holdings. ETFs pay fees and incur operating expenses, which reduce the total return earned by the ETFs from their underlying holdings. An ETF may not achieve its investment objective or execute its investment strategy effectively, which may adversely affect the Portfolio’s performance.
Expenses – Expenses of the Trust that are directly identifiable to a specific portfolio are charged to that portfolio. Expenses, which are not readily identifiable to a specific portfolio, are allocated in such a manner as deemed equitable, taking into consideration the nature and type of expense and the relative sizes of the portfolios in the Trust.
Indemnification – The Trust indemnifies its officers and Trustees for certain liabilities that may arise from the performance of their duties to the Trust. Additionally, in the normal course of business, the Portfolios enter into contracts that contain a variety of representations and warranties which provide general indemnities. Each Portfolio’s maximum exposure under these arrangements is unknown, as this would involve future claims that may be made against the Portfolios that have not yet occurred. However, based on experience, the Portfolios expect the risk of loss due to these warranties and indemnities to be remote.
Security Loans – The Portfolios have entered into a securities lending arrangement with The Bank of New York Mellon (the “Borrower”). Under the terms of the agreement, the Portfolios are authorized to loan securities to the Borrower. In exchange, the Portfolios receive cash and securities as collateral in the amount of at least 102% of the value of the securities loaned. The cash collateral is invested in short-term instruments as noted in the Schedules of Investments. Securities received as collateral are U.S. government securities; securities received as collateral, if any, are not recognized as portfolio assets. Although risk is mitigated by the collateral, the Portfolios could experience a delay in recovering their securities and possible loss of income or value if the Borrower fails to return them.
Gain or loss in the fair value of securities loaned that may occur during the term of the loan will be for the account of each Portfolio. Each Portfolio has the right under the securities lending agreement to recover the securities from the Borrower on demand. If the fair value of the collateral falls below 102% plus accrued interest of the loaned securities, the lender’s agent shall request additional collateral from the Borrower to bring the collateralization back to 102%. Under the terms of the securities lending agreement, each Portfolio is indemnified for such losses by the security lending agreement. Should the Borrower fail financially, the Portfolios have the right to repurchase the securities using the collateral in the open market.
| TOPS® Managed Risk ETF Portfolios |
| Notes to Financial Statements (Continued) |
| December 31, 2022 |
The following table is a summary of the Portfolios’ securities loaned and related collateral which are subject to a netting agreement as of December 31, 2022:
| | | | | | | | | | | | Gross Amounts Not Offset in the | | | | |
| | | | | | | | | | | | Statement of Assets & Liabilities * | | | | |
| | | | | | | | | Net Amounts of | | | | | | | | | | |
| | | | | | Gross Amounts | | | Assets Presented | | | | | | | | | | |
| | | | | | Offset in the | | | in the | | | | | | | | | | |
| | | Gross Amounts | | | Statements of | | | Statements of | | | Financial | | | | | | | |
| | | of Recognized | | | Assets & | | | Assets & | | | Instruments | | | Cash Collateral | | | Net Amount of | |
| Assets: | | Assets | | | Liabilities | | | Liabilities | | | Received | | | Received | | | Assets | |
| | | | | | | | | | | | | | | | | | | | | | | | | |
| Managed Risk Balanced ETF Portfolio | |
| Description: | | | | | | | | | | | | | | | | | | | | | | | | |
| Securities Loaned | | $ | 3,737,539 | | | $ | — | | | $ | 3,737,539 | | | $ | — | | | $ | 3,737,539 | | | $ | — | |
| Total | | $ | 3,737,539 | | | $ | — | | | $ | 3,737,539 | | | $ | — | | | $ | 3,737,539 | | | $ | — | |
| | | | | | | | | | | | | | | | | | | | | | | | | |
| Managed Risk Growth ETF Portfolio | |
| Description: | | | | | | | | | | | | | | | | | | | | | | | | |
| Securities Loaned | | $ | 3,254,538 | | | $ | — | | | $ | 3,254,538 | | | $ | — | | | $ | 3,254,538 | | | $ | — | |
| Total | | $ | 3,254,538 | | | $ | — | | | $ | 3,254,538 | | | $ | — | | | $ | 3,254,538 | | | $ | — | |
| | | | | | | | | | | | | | | | | | | | | | | | | |
| Managed Risk Moderate Growth ETF Portfolio | |
| Description: | | | | | | | | | | | | | | | | | | | | | | | | |
| Securities Loaned | | $ | 4,359,853 | | | $ | — | | | $ | 4,359,853 | | | $ | 588,955 | | | $ | 3,770,898 | | | $ | — | |
| Total | | $ | 4,359,853 | | | $ | — | | | $ | 4,359,853 | | | $ | 588,955 | | | $ | 3,770,898 | | | $ | — | |
| * | The amount is limited to the securities loaned asset balance and accordingly, does not include excess collateral pledged. |
The following table breaks out the holdings received as collateral as of December 31, 2022:
| Securities Lending Transactions | | | | |
| Overnight and Continuous | | | | |
| | | | | |
| Managed Risk Balanced ETF Portfolio | | | | |
| Federated Hermes Government Obligations Fund, Institutional Class | | $ | 3,813,979 | |
| | | | | |
| Managed Risk Growth ETF Portfolio | | | | |
| Federated Hermes Government Obligations Fund, Institutional Class | | $ | 4,070,448 | |
| | | | | |
| Managed Risk Moderate Growth ETF Portfolio | | | | |
| Federated Hermes Government Obligations Fund, Institutional Class | | $ | 4,684,598 | |
| TOPS® Managed Risk ETF Portfolios |
| Notes to Financial Statements (Continued) |
| December 31, 2022 |
The fair value of the securities loaned for the Managed Risk Balanced ETF Portfolio, Managed Risk Growth ETF Portfolio and Managed Risk Moderate Growth ETF Portfolio totaled $3,737,539, $3,254,538 and $4,359,853 as of December 31, 2022, respectively. The securities loaned are noted in the Schedules of Investments. The fair value of the “collateral for securities loaned” on each Schedule of Investments includes only cash collateral received and reinvested that totaled $3,813,979, $4,070,448 and $4,684,598 for the Managed Risk Balanced ETF Portfolio, Managed Risk Growth ETF Portfolio and Managed Risk Moderate Growth ETF Portfolio as of December 31, 2022, respectively. This amount is offset by a liability recorded as “Collateral on securities loaned.” At December 31, 2022, the Managed Risk Moderate Growth ETF Portfolio received non-cash collateral of $588,955. The Managed Risk Balanced ETF Portfolio and Managed Risk Growth ETF Portfolio did not receive non-cash collateral as of December 31, 2022. The non-cash collateral consists of short-term investments and long-term bonds and is held for benefit of a Portfolio at the Portfolio’s custodian. A Portfolio cannot pledge or resell the collateral.
| 3. | INVESTMENT TRANSACTIONS |
For the year ended December 31, 2022, cost of purchases and proceeds from sales of portfolio securities, other than short-term investments and government securities, were as follows:
| Portfolio | | Purchases | | | Sales | |
| Managed Risk Balanced ETF Portfolio | | $ | 41,967,277 | | | $ | 327,001,333 | |
| Managed Risk Growth ETF Portfolio | | | 91,768,783 | | | | 476,071,893 | |
| Managed Risk Moderate Growth ETF Portfolio | | | 71,140,667 | | | | 539,989,698 | |
| 4. | INVESTMENT ADVISORY AGREEMENT AND TRANSACTIONS WITH RELATED PARTIES |
ValMark Advisers, Inc. serves as the Portfolios’ investment advisor (the “Advisor”). The Advisor has engaged Milliman Financial Risk Management, LLC as the Portfolios’ Sub-Advisor (the “Sub-Advisor”). Pursuant to an advisory agreement with the Trust, the Advisor, under the oversight of the Board, directs the daily operations of the Portfolios and supervises the performance of administrative and professional services provided by others. As compensation for its services and the related expenses borne by the Advisor, the Portfolios pay the Advisor a management fee, computed on average daily net assets and accrued daily and paid monthly, at an annual rate of 0.30% of each Portfolio’s average daily net assets. Pursuant to a sub-advisory agreement between the Advisor and Sub-Advisor, on behalf of the Portfolios, the Advisor, not the Portfolios, pays the Sub-Advisor a fee, which is computed and accrued daily and paid monthly. For the year ended December 31, 2022, the Portfolios paid the following in advisory fees.
| Portfolio | | Advisory Fees | |
| Managed Risk Balanced ETF Portfolio | | $ | 1,006,284 | |
| Managed Risk Growth ETF Portfolio | | | 1,784,909 | |
| Managed Risk Moderate Growth ETF Portfolio | | | 1,712,419 | |
The Trust, with respect to the Portfolios, has adopted the Trust’s Master Distribution and Shareholder Servicing Plan (“12b-1 Plan” or “Plan”) for each of Class 2 shares, Class 3 shares, Class 4 shares, and Investor Class shares. The fee is calculated at an annual rate of 0.25%, 0.35%, 0.60%, and 0.50% of the average daily net assets attributable to each Portfolio’s Class 2 shares, Class 3 shares, Class 4 shares, and Investor Class shares, respectively, and is paid to Northern Lights Distributors, LLC (the “Distributor”) to provide compensation for ongoing shareholder servicing and distribution related activities and/or maintenance of each Portfolio’s shareholder accounts, not otherwise required to be provided by the Advisor. For the year ended December 31, 2022, the Portfolios paid the following in distribution fees under the Plan.
| Portfolio | | Distribution Fees | |
| Managed Risk Balanced ETF Portfolio | | $ | 918,795 | |
| Managed Risk Growth ETF Portfolio | | | 1,565,716 | |
| Managed Risk Moderate Growth ETF Portfolio | | | 1,562,337 | |
TOPS® Managed Risk ETF Portfolios
Notes to Financial Statements (Continued)
December 31, 2022
In addition, certain affiliates of the Distributor provide services to the Portfolios as follows:
Ultimus Fund Solutions, LLC (“UFS”), an affiliate of the Distributor, provides administration, fund accounting, and transfer agent services to the Trust. Pursuant to the terms of an administrative servicing agreement with UFS, each Portfolio pays to UFS a monthly fee for all operating expenses of the Portfolio, which is calculated by each Portfolio on its average daily net assets. Operating expenses include but are not limited to Fund Accounting, Fund Administration, Transfer Agency, Legal Fees, Audit Fees, Compliance Services, Shareholder Reporting Expense, Trustees fees and Custody Fees.
For the year ended December 31, 2022, the Trustees received fees in the amount $16,577 on behalf of each Portfolio.
The approved entities may be affiliates of UFS and the Distributor. Certain Officers of the Trust are also Officers of UFS, and are not paid any fees directly by the Portfolios for serving in such capacities.
Northern Lights Compliance Services, LLC (“NLCS”), an affiliate of UFS and the Distributor, provides a Chief Compliance Officer to the Trust, as well as related compliance services, pursuant to a consulting agreement between NLCS and the Trust. Under the terms of such agreement, NLCS receives customary fees from UFS under the administrative servicing agreement.
Blu Giant, LLC (“Blu Giant”), an affiliate of UFS and the Distributor, provides EDGAR conversion and filing services as well as print management services for the Portfolios on an ad-hoc basis. For the provision of these services, Blu Giant receives customary fees from UFS under the administrative servicing agreement.
The beneficial ownership, either directly or indirectly, of more than 25% of the voting securities of a Portfolio creates presumption of the control of the Portfolio, under Section 2(a)(9) of the 1940 Act. As of December 31, 2022, ownership percentages of the holders of the voting securities of each Portfolio that may be deemed to control the Portfolio was as follows:
| Managed Risk Balanced ETF Portfolio | | |
| Forethought Life Insurance Company | | 32% |
| | | |
| Managed Risk Growth ETF Portfolio | | |
| Forethought Life Insurance Company | | 35% |
| Minnesota Life Insurance Co. | | 32% |
| | | |
| Managed Risk Moderate Growth ETF Portfolio | | |
| Forethought Life Insurance Company | | 41% |
The Trust has no knowledge as to whether all or any portion of the shares owned of record are also owned beneficially.
| TOPS® Managed Risk ETF Portfolios |
| Notes to Financial Statements (Continued) |
| December 31, 2022 |
| 6. | DISTRIBUTIONS TO SHAREHOLDERS AND TAX COMPONENTS OF CAPITAL |
The table below represents aggregate cost for federal tax purposes for the Portfolios as of December 31, 2022 and differs from market value by net unrealized appreciation/depreciation which consisted of:
| | | | | | | | | | | | Tax Net | |
| | | Cost for | | | | | | | | | Unrealized | |
| | | Federal Tax | | | Unrealized | | | Unrealized | | | Appreciation/ | |
| Portfolio | | Purposes | | | Appreciation | | | Depreciation | | | Depreciation | |
| Managed Risk Balanced ETF Portfolio | | $ | 67,913,189 | | | $ | 886,932 | | | $ | (5,932,545 | ) | | $ | (5,045,613 | ) |
| Managed Risk Growth ETF Portfolio | | | 194,256,735 | | | | 12,349,952 | | | | (10,575,894 | ) | | | 1,774,058 | |
| Managed Risk Moderate Growth ETF Portfolio | | | 123,398,633 | | | | 1,548,566 | | | | (10,166,455 | ) | | | (8,617,889 | ) |
The tax character of the Portfolios distributions paid for the years ended December 31, 2022, and December 31, 2021 was as follows:
| For the year ended December 31, 2022: |
| |
| | | Ordinary | | | Long-Term | | | | |
| | | Income | | | Capital Gains | | | Total | |
| Managed Risk Balanced ETF Portfolio | | $ | 13,359,102 | | | $ | 24,252,865 | | | $ | 37,611,967 | |
| Managed Risk Growth ETF Portfolio | | | 18,156,955 | | | | 84,463,994 | | | | 102,620,949 | |
| Managed Risk Moderate Growth ETF Portfolio | | | 25,714,915 | | | | 66,069,697 | | | | 91,784,612 | |
| | | | | | | | | | | | | |
| For the year ended December 31, 2021: |
| |
| | | Ordinary | | | Long-Term | | | | |
| | | Income | | | Capital Gains | | | Total | |
| Managed Risk Balanced ETF Portfolio | | $ | 5,360,289 | | | $ | — | | | $ | 5,360,289 | |
| Managed Risk Growth ETF Portfolio | | | 9,153,014 | | | | — | | | | 9,153,014 | |
| Managed Risk Moderate Growth ETF Portfolio | | | 9,505,458 | | | | — | | | | 9,505,458 | |
As of December 31, 2022, the components of accumulated earnings/(deficit) on a tax basis were as follows:
| | | Undistributed | | | Undistributed | | | Post October Loss | | | Capital Loss | | | Other | | | Unrealized | | | Total | |
| | | Ordinary | | | Long-Term | | | and | | | Carry | | | Book/Tax | | | Appreciation/ | | | Accumulated | |
| | | Income | | | Capital Gains | | | Late Year Loss | | | Forwards | | | Differences | | | (Depreciation) | | | Earnings/(Deficits) | |
| Managed Risk Balanced ETF Portfolio | | $ | 131,598 | | | $ | 277,804 | | | $ | (3,571,241 | ) | | $ | — | | | $ | — | | | $ | (5,045,613 | ) | | $ | (8,207,452 | ) |
| Managed Risk Growth ETF Portfolio | | | 781,952 | | | | 267,042 | | | | (11,578,497 | ) | | | — | | | | — | | | | 1,774,058 | | | | (8,755,445 | ) |
| Managed Risk Moderate Growth ETF Portfolio | | | 390,163 | | | | 308,036 | | | | (8,713,895 | ) | | | — | | | | — | | | | (8,617,889 | ) | | | (16,633,585 | ) |
The difference between book basis and tax basis accumulated net realized gains/ losses, and unrealized appreciation/ depreciation from investments is primarily attributable to the tax deferral of losses on wash sales and the mark-to-market treatment of Section 1256 futures contracts.
| TOPS® Managed Risk ETF Portfolios |
| Notes to Financial Statements (Continued) |
| December 31, 2022 |
Capital losses incurred after October 31 within the fiscal year are deemed to arise on the first business day of the following fiscal year for tax purposes. The Portfolios incurred and elected to defer such capital losses as follows:
| | | Post October | |
| Portfolio | | Losses | |
| Managed Risk Balanced ETF Portfolio | | $ | 3,571,241 | |
| Managed Risk Growth ETF Portfolio | | | 11,578,497 | |
| Managed Risk Moderate Growth ETF Portfolio | | | 8,713,895 | |
At December 31, 2022, the Managed Risk Growth ETF Portfolio utilized capital loss carry forwards available for federal income tax purposes of $12,050,464.
Subsequent events after the date of the Statements of Assets and Liabilities have been evaluated through the date the financial statements were issued. Management has determined that no events or transactions occurred requiring adjustment or disclosure in the financial statements.
REPORT OF INDEPENDENT REGISTERED PUBLIC ACCOUNTING FIRM
To the Board of Trustees of the Northern Lights Variable Trust and shareholders of TOPS Managed Risk Balanced ETF Portfolio, TOPS Managed Risk Growth ETF Portfolio, and TOPS Managed Risk Moderate Growth ETF Portfolio
Opinion on the Financial Statements and Financial Highlights
We have audited the accompanying statements of assets and liabilities, including the schedules of investments, of TOPS Managed Risk Balanced ETF Portfolio, TOPS Managed Risk Growth ETF Portfolio, and TOPS Managed Risk Moderate Growth ETF Portfolio, each a portfolio constituting the Northern Lights Variable Trust (the “Portfolios”), as of December 31, 2022, the related statements of operations for the year then ended, the statements of changes in net assets for each of the two years in the period then ended, the financial highlights for each of the five years in the period then ended, and the related notes. In our opinion, the financial statements and financial highlights present fairly, in all material respects, the financial position of the Portfolios as of December 31, 2022, and the results of their operations for the year then ended, the changes in their net assets for each of the two years in the period then ended, and the financial highlights for each of the five years in the period then ended in conformity with accounting principles generally accepted in the United States of America.
Basis for Opinion
These financial statements and financial highlights are the responsibility of the Portfolios’ management. Our responsibility is to express an opinion on the Portfolios’ financial statements and financial highlights based on our audits. We are a public accounting firm registered with the Public Company Accounting Oversight Board (United States) (PCAOB) and are required to be independent with respect to the Portfolios in accordance with the U.S. federal securities laws and the applicable rules and regulations of the Securities and Exchange Commission and the PCAOB.
We conducted our audits in accordance with the standards of the PCAOB. Those standards require that we plan and perform the audit to obtain reasonable assurance about whether the financial statements and financial highlights are free of material misstatement, whether due to error or fraud. The Portfolios are not required to have, nor were we engaged to perform, an audit of their internal control over financial reporting. As part of our audits, we are required to obtain an understanding of internal control over financial reporting but not for the purpose of expressing an opinion on the effectiveness of the Portfolios’ internal control over financial reporting. Accordingly, we express no such opinion.
Our audits included performing procedures to assess the risks of material misstatement of the financial statements and financial highlights, whether due to error or fraud, and performing procedures that respond to those risks. Such procedures included examining, on a test basis, evidence regarding the amounts and disclosures in the financial statements and financial highlights. Our audits also included evaluating the accounting principles used and significant estimates made by management, as well as evaluating the overall presentation of the financial statements and financial highlights. Our procedures included confirmation of securities owned as of December 31, 2022, by correspondence with the custodian and brokers; when replies were not received from broker, we performed other auditing procedures. We believe that our audits provide a reasonable basis for our opinion.

Costa Mesa, California
February 23, 2023
We have served as the auditor of one or more TOPS Portfolios investment companies since 2019.
| TOPS® Managed Risk ETF Portfolios |
| Supplemental Information (Unaudited) |
| December 31, 2022 |
FOREIGN TAX CREDIT
The Portfolios intend to elect to pass through to shareholders the income tax credit for taxes paid to foreign countries. Foreign source income and foreign tax expense per outstanding share as of fiscal year ended December 31, 2022 and December 31, 2021, were as follows:
| For Fiscal Year Ended | | | | | | |
| December 31, 2022 | | Foreign Taxes Paid | | | Foreign Source Income | |
| Managed Risk Balanced ETF Portfolio | | $ | 0.0080 | | | $ | 0.1040 | |
| Managed Risk Growth ETF Portfolio | | | 0.0098 | | | | 0.1185 | |
| Managed Risk Moderate Growth ETF Portfolio | | | 0.0048 | | | | 0.0618 | |
| | | | | | | | | |
| For Fiscal Year Ended | | | | | | |
| December 31, 2021 | | Foreign Taxes Paid | | | Foreign Source Income | |
| Managed Risk Balanced ETF Portfolio | | $ | 0.0096 | | | $ | 0.0789 | |
| Managed Risk Growth ETF Portfolio | | | 0.0136 | | | | 0.1255 | |
| Managed Risk Moderate Growth ETF Portfolio | | | 0.0117 | | | | 0.1051 | |
| TOPS® ETF Portfolio |
| Additional Information (Unaudited) |
| December 31, 2022 |
| ValMark Advisers, Inc. - Adviser to the Following Funds: |
| TOPS® Aggressive Growth ETF Portfolio | TOPS® Managed Risk Balanced ETF Portfolio |
| (“TOPS Aggressive”), | (“TOPS Risk Balanced”), |
| TOPS® Balanced ETF Portfolio | TOPS® Managed Risk Growth ETF Portfolio |
| (“TOPS Balanced”), | (“TOPS Risk Growth”), |
| TOPS® Conservative ETF Portfolio | TOPS® Managed Risk Flex ETF Portfolio, |
| (“TOPS Conservative”), | (“TOPS Risk ETF”), |
| TOPS® Growth ETF Portfolio | TOPS® Managed Risk Flex ETF Portfolio |
| (“TOPS Growth”), and | (“TOPS Risk Flex”), |
| TOPS® Moderate Growth ETF Portfolio | (collectively “TOPS Risk Managed Portfolios” or “TOPS Portfolio”)* |
| (“TOPS Moderate”) | |
| (collectively “TOPS Non-Risk Managed Portfolios” or “TOPS Portfolio”)* | |
In connection with the regular meeting held on November 15-16, 2022 of the Board of Trustees (the “Trustees” or the “Board”) of the Northern Lights Variable Trust (the “Trust”), including a majority of the Trustees who are not “interested persons,” as that term is defined in the Investment Company Act of 1940, as amended, discussed the renewal of an investment advisory agreement (the “Advisory Agreement”) between ValMark Advisers, Inc (the “Adviser”) and the Trust, with respect to each TOPS Portfolio (the “Fund”). In considering the re-approval of the Advisory Agreement, the Board received materials specifically relating to the Advisory Agreement.
The Trustees were assisted by independent legal counsel throughout the Advisory Agreement review process. The Trustees relied upon the advice of independent legal counsel and their own business judgment in determining the material factors to be considered in evaluating the Advisory Agreement and the weight to be given to each such factor. The conclusions reached by the Trustees were based on a comprehensive evaluation of all of the information provided and were not the result of any one factor. Moreover, each Trustee may have afforded different weight to the various factors in reaching his conclusions with respect to the Advisory Agreement.
Nature, Extent and Quality of Service. The Board noted that the Adviser was founded in 1997 and had approximately $7.1 billion in assets under management as of July 31, 2022. They acknowledged that the Adviser provided a fee based financial planning, consulting, risk management services, and created and managed ETF portfolio programs. The Board reviewed the background information of the key investment professionals servicing the portfolios taking into consideration their education and diverse financial industry experience. The Board noted for the TOPS Risk Managed Portfolios, the Adviser used a sub-adviser to apply a risk overly strategy to stabilize volatility around each Portfolio’s target volatility level. The Board further noted that the Adviser performed on-going diligence and supervision of the sub-adviser, which included compliance and trading oversight of the TOPS Managed Risk Portfolios and oversight of the trading for the TOPS Non-Managed Risk Portfolios. The Board acknowledged that over the past year, the Adviser has upgraded its firewall infrastructure and reported no cybersecurity incidents. The Board noted that the Adviser has not reported any material compliance or litigation issues since the last renewal of the Advisory Agreement. The Board noted that the Adviser delegated trading execution to the sub-adviser but utilized a best execution committee to review executing brokers and monitor execution. The Board acknowledged that the Adviser had sufficient resources and personnel to support the investment strategy and the TOPS Portfolios’ compliance requirements. The Board concluded that the Adviser continued to provide a high level of service to the TOPs Portfolios and their shareholders.
Performance.
TOPS Aggressive. The Board noted the Fund’s objective of providing capital appreciation and received a three-star Morningstar rating. The Board reviewed the performance of the Fund, noting that the Fund underperformed the benchmark index across all periods but outperformed the Morningstar category and peer group over the three-year and five-year periods. The Board noted that the Fund underperformed its peer group and Morningstar category over the since inception period. The Board considered that the Adviser attributed underperformance to the Fund’s overweighting in equity and international markets compared to its peer funds. They agreed that the Fund performed as designed and disclosed in its prospectus.
| TOPS® ETF Portfolio |
| Additional Information (Unaudited) (Continued) |
| December 31, 2022 |
TOPS Balanced. The Board reviewed the Fund’s objective, noting that the Fund provided income and capital appreciation. The Board acknowledged that the Fund outperformed the peer group and Morningstar category median for the one-year period but underperformed the benchmark index for the same period. The Board further observed that the Fund underperformed its benchmark and Morningstar category over the three-year, five-year, and since inception periods while outperforming its peer group over the three-year and since inception periods. The Board considered that the Adviser attributed underperformance to the Fund’s overweighting in equity and international markets. The Board agreed that the Fund performed as designed and disclosed in its prospectus.
TOPS Conservative. The Board noted the Fund’s objective of preservation of capital and moderate income and moderate capital appreciation. They further noted that the Fund had received a three-star Morningstar rating. The Board acknowledged that the Fund outperformed its peer group median for the one-year, three-year, and five-year periods. The Board further noted that the Fund outperformed its Morningstar category median for the one-year and three-year periods. The Board acknowledged that the Fund underperformed its benchmark for all comparison periods. The Board discussed the Adviser’s position that the peer group was the most relevant comparison and that the benchmark tracked large cap US equities which had generally outperformed while the Fund targeted 70% fixed income and global diversification. The Board concluded that the Fund was accomplishing its objective and that the Adviser was implementing the strategy as expected.
TOPS Growth. The Board reviewed the Fund’s objective and noted that it sought capital appreciation and received a three-star Morningstar rating. The Board acknowledged that the Fund outperformed its peer group and Morningstar category medians across all periods. They considered that the Fund underperformed against it benchmark for all periods. The Board agreed that the Fund performed as designed and disclosed in its prospectus. The Board agreed that the Fund performed as designed and disclosed in its prospectus.
TOPS Moderate. The Board reviewed the Fund’s objective, noting that it sought capital appreciation and received a three-star Morningstar rating. They noted that the Fund outperformed its Morningstar category and peer group medians for the one-year, three-year and five-year periods. They acknowledged that the Fund underperformed its benchmark for all comparison periods and attributed the underperformance to the Fund’s allocation to value rather than growth securities. The Board reviewed the Fund’s risk metrics and noted that the Fund’s Sharpe and Sortino ratios had ranked in the 1st quartile among the Fund’s Morningstar category and peer group over the one-year and three-year periods. The Board concluded that the Fund performed as designed and disclosed in its prospectus.
TOPS Risk Balanced. The Board reviewed the Fund’s objective and noted that it sought income and capital appreciation with less volatility than the fixed and equity markets as a whole and received a three-star Morningstar rating. The Board noted that the Fund outperformed its peer group medians for the one-year, three-year, and five-year periods. The Board acknowledged that the Fund underperformed the Morningstar category median for the three-year, five-year and since inception periods. They also considered that the Fund underperformed the benchmark for all periods. They discussed the impact of the Fund’s hedging strategy on performance. The Board agreed that the Fund performed as designed and disclosed in its prospectus.
TOPS Risk Flex. The Board reviewed the Fund’s objective and noted that the Fund seeks income and capital appreciation with less volatility than fixed income and equity markets as a whole. They further noted that the Fund received a two-star Morningstar rating. The Board considered the Fund’s performance and acknowledged that the Fund outperformed its Morningstar category and peer group for the one-year period. They further noted that the Fund underperformed all of its comparison groups for the five-year and since inception periods. They discussed that the Fund was in the first or second quartile for Standard Deviation among its peer group and Morningstar category for the one-year and three-year periods. The Board concluded that the Fund’s managed risk strategy continued to provide benefits to the Fund’s shareholders.
TOPS Risk Growth. The Board considered the Fund’s objective, noting that the Fund seeks to provide capital appreciation with less volatility than equity markets. They acknowledged that the Portfolio received a two-star Morningstar rating. The Board considered the Fund’s performance, noting that it outperformed its Morningstar category and peer group for the one-year period. The Board noted that although the Fund underperformed all comparison groups across all other time periods, the Fund continued to improve its rankings among its peer group and Morningstar category. The Board agreed that the Fund performed as designed and disclosed in its prospectus.
| TOPS® ETF Portfolio |
| Additional Information (Unaudited) (Continued) |
| December 31, 2022 |
TOPS Risk ETF. The Board acknowledged the Fund’s objective and noted that the Fund seeks to provide capital appreciation with lower volatility than equity markets. They further noted that the Fund received a two-star Morningstar rating. The Board reviewed the performance of the Fund, noting that the Fund outperformed the peer group and Morningstar category for the one-year period, but underperformed all comparison groups for the remaining periods. The Board acknowledged that the Adviser attributed the Fund’s underperformance to its underweighting in equities, overweighting in international equity markets, and exposure to value equities. The Board concluded that the Fund was performing as expected according to its prospectus.
TOPS Global. The Board discussed the Fund’s objective and noted the Fund seeks to provide capital appreciation, with a secondary objective of hedging risk. The Board acknowledged the short history of the Fund and that it performed in line with the Morningstar category and slightly outperformed the peer group over the since inception period. The Board noted that the Fund underperformed its benchmark over the same period. The Board concluded that additional time was needed to fairly assess the performance of the Fund and agreed that the Fund was performing as designed and disclosed in its prospectus.
Fees and Expenses.
TOPS Non-Risk Managed Portfolios. The Board reviewed the advisory fee charged to each of the TOPS Non-Risk Managed Portfolios, noting that the Adviser charged 0.10% for advisory services to each Fund. The Board compared the net expense ratio and advisory fee of each to its Morningstar category and peer group and acknowledged that the Fund’s net expense ratio and advisory fee was consistently lower than the comparable groups. The Board concluded that the advisory fee for each of the TOPS Non-Risk Managed Portfolios was not unreasonable.
TOPS Risk Managed Portfolios. The Board reviewed the advisory fee charged to each of the TOPS Risk Managed Portfolios, noting that the Adviser charged 0.30% for the advisory services rendered to each Fund. The Board compared the net expense ratio and advisory fee of each TOPS Risk Managed Portfolio to its Morningstar category and peer group, acknowledging that each Fund had a higher net expense ratio but that the advisory fee and net expenses were more in line with the peer groups. The Board concluded that the advisory fee for each of the TOPS Risk Managed Portfolios was not unreasonable.
Profitability.
TOPS Non-Risk Managed Portfolios. The Board reviewed the profitability analysis provided by the Adviser in connection with the services provided to each Fund. They acknowledged that the Adviser indicated that it suffered a loss in connection with its relationship with each Fund. After further discussion, the Board concluded that excessive profitability was not a concern at this time for any TOPS Non-Risk Managed Portfolio.
TOPS Risk Managed Portfolios. The Board reviewed the profitability analysis provided by the Adviser in connection with the services provided to each Fund. They noted that the Adviser indicated that it received a profit in connection with its relationship with each Fund. The Board noted that the profits were reasonable in terms of actual dollars and as a percentage of revenue. The Board concluded that the Adviser was not realizing an excessive profit from the advisory services provided to any of the TOPS Risk Managed Portfolios.
Economies of Scale. The Board considered whether economies of scale had been realized in connection with the Adviser’s advisory services provided to each of the TOPS Portfolios. The Board acknowledged that the Adviser did not foresee any capacity limitations and that they would continue to monitor for opportunities to implement breakpoints as each Fund’s size increased significantly. The Board concluded that based on each Fund’s current asset size, the absence of breakpoints was acceptable at this time.
Conclusion. Having requested and received such information from the Adviser as the Board believed to be reasonably necessary to evaluate the terms of the Advisory Agreement, and as assisted by the advice of independent counsel, the Board concluded that each advisory fee paid by each of the TOPS Portfolios to the Adviser was not unreasonable, and that renewal of the Advisory Agreement with the Adviser was in the best interests of the shareholders of each Fund.
| * | Due to the timing of the contract renewal schedule, these deliberations may or may not relate to the current performance results of the TOPS Portfolio. |
TOPS® ETF Portfolio
Additional Information (Unaudited) (Continued)
December 31, 2022
Milliman Financial Risk Management, LLC - Sub-Adviser to the Following Funds:
| TOPS® Aggressive Growth ETF Portfolio (“TOPS Aggressive”), | TOPS® Managed Risk Balanced ETF Portfolio (“TOPS Risk Balanced”), |
| TOPS® Balanced ETF Portfolio (“TOPS Balanced”), | TOPS® Managed Risk Growth ETF Portfolio (“TOPS Risk Growth”), |
| TOPS® Conservative ETF Portfolio (“TOPS Conservative”), | TOPS® Managed Risk Flex ETF Portfolio, (“TOPS Risk ETF”), |
| TOPS® Growth ETF Portfolio (“TOPS Growth”), and | TOPS® Managed Risk Flex ETF Portfolio (“TOPS Risk Flex”), |
| TOPS® Moderate Growth ETF Portfolio (“TOPS Moderate”) | (collectively “TOPS Risk Managed Portfolios” or “TOPS Portfolio”)* |
| (collectively “TOPS Non-Risk Managed Portfolios” or “TOPS Portfolio”)* | |
In connection with the regular meeting held on November 15-16, 2022 of the Board of Trustees (the “Trustees” or the “Board”) of the Northern Lights Variable Trust (the “Trust”), including a majority of the Trustees who are not “interested persons,” as that term is defined in the Investment Company Act of 1940, as amended, discussed the approval of a sub-advisory agreement (the “Sub-Advisory Agreement”) between Milliman Financial Risk Management (the “Sub-Adviser”) and ValMark Advisers, Inc. (“Adviser”), with respect to each TOPS Portfolio (the “Fund” or “Funds”). In considering the approval of the Sub-Advisory Agreement, the Board received materials specifically relating to the Sub-Advisory Agreement.
The Trustees were assisted by independent legal counsel throughout the Sub-Advisory Agreement review process. The Board relied upon the advice of independent legal counsel and their own business judgment in determining the material factors to be considered in evaluating the Sub-Advisory Agreement and the weight to be given to each such factor. The conclusions reached by the Trustees were based on a comprehensive evaluation of all of the information provided and were not the result of any one factor. Moreover, each Trustee may have afforded different weight to the various factors in reaching his conclusions with respect to the Sub-Advisory Agreement.
Nature, Extent and Quality of Service. The Board noted that that Sub-Adviser was founded in 1998 and serviced approximately $170 billion in assets for the insurance industry and self-insured organizations. The Board reviewed the background information of the key personnel responsible for servicing the Funds, taking into consideration their education and experience related to trading, risk management, portfolio management, quantitative finance, technology and actuarial services. The Board observed that the Sub-Adviser provided non-discretionary investment advisory trading services to execute trades for the TOPS Non-Risk Managed Portfolios. They also noted that the Sub-Adviser provided research and analysis, marketing and compliance services to implement the managed risk strategy and execute trades to hedge the TOPS Risk Managed Portfolios. The Board noted the Sub-Adviser reported no cybersecurity incidents over the past year. The Board further noted that the Sub-Adviser reported no compliance or litigation issues since the last renewal of the Sub-Advisory Agreement.
Performance. The Board reviewed the performance of the TOPS Risk Managed Portfolios, particularly noting the impact of the sub-adviser’s hedging strategy. They acknowledged that the sub-adviser’s hedging strategy was designed to decrease the impact of volatility on each of the TOPS Risk Managed Portfolios, even if this negatively impacted each Fund’s performance. The Board noted that the sub-adviser’s hedging strategy was designed to perform optimally during sustained market declines and would underperform during periods of market growth. They further noted that the sub-adviser’s hedging strategy appeared to be functioning as intended.
Fees and Expenses. The Board reviewed the fee arrangement between the Adviser and Sub-Adviser with respect to the TOPS Risk Managed Portfolios and the TOPS Non-Risk Managed Portfolios. They noted that the Sub-Adviser received a modest fixed fee for the execution services provided to the TOPS Non-Risk Managed Portfolios. They reviewed the fee split between the Adviser and the Sub-Adviser with respect to the TOPS Managed Risk Portfolios, noting that the Sub-Adviser received 0.20% of each TOPS Managed Risk Portfolio’s average daily net assets from the Adviser’s fees. They considered the fees the Sub-Adviser charged for the TOPS Risk Managed Portfolios compared to other accounts managed by the Sub-Adviser. After further discussion, the Board concluded that the sub-advisory fee charged with respect to each TOPS Portfolio was not unreasonable.
| TOPS® ETF Portfolio |
| Additional Information (Unaudited) (Continued) |
| December 31, 2022 |
Profitability. The Board reviewed the profitability analysis provided by the Sub-Adviser with respect to each of the TOPS Portfolios. They noted that the Sub-Adviser realized profits in terms of actual dollars and percentage of revenue in connection with its relationship with the TOPS Portfolios. They further noted that the Sub-Adviser indicated lower profits with respect to the TOPS Non-Risk Managed Portfolios due to economies of scale and existing fee arrangements. The Board concluded that excessive profitability was not a concern at this time.
Economies of Scale. The Board considered whether economies of scale had been achieved by the Sub-Adviser with respect to the management of the TOPS Portfolios. The Board agreed that, with respect to the execution services provided to the TOPS Non-Risk Managed Portfolios, the fees were so modest that the Portfolios were already realizing certain economies. With respect to the TOPS Risk Managed Portfolios, the Board concluded that the current fee levels appeared to reflect the sharing of Sub-Adviser efficiencies with the adviser, which allowed the adviser to maintain its fees at reasonable levels.
Conclusion. Having requested and received such information from the Sub-Adviser as the Board believed to be reasonably necessary to evaluate the terms of the Sub-Advisory Agreement, and as assisted by the advice of independent counsel, the Board concluded that renewal of the Sub-Advisory Agreement was in the best interests of the shareholders of each of the TOPS Portfolios.
| * | Due to the timing of the contract renewal schedule, these deliberations may or may not relate to the current performance results of the TOPS Portfolio. |
| TOPS® Managed Risk ETF Portfolios |
| Expense Example (Unaudited) |
| December 31, 2022 |
As a shareholder of one or more of the Portfolios, you incur ongoing costs, including management fees; distribution and/or service (12b-1) fees; and other Portfolio expenses. This example is intended to help you understand your ongoing costs (in dollars) of investing in a Portfolio and to compare these costs with the ongoing costs of investing in other mutual funds.
The example is based on an investment of $1,000 invested at the beginning of the period and held for the entire period from July 1, 2022 through December 31, 2022.
Actual Expenses
The “Actual” columns in the tables below provide information about actual account values and actual expenses. You may use the information below together with the amount you invested, to estimate the expenses that you paid over the period. Simply divide your account value by $1,000 (for example, an $8,600 account value divided by $1,000 = 8.6), then multiply the result by the number in the table under the heading entitled “Expenses Paid During Period” to estimate the expenses you paid on your account during this period.
Hypothetical Example for Comparison Purposes
The “Hypothetical” columns in the tables below provide information about hypothetical account values and hypothetical expenses based on each Portfolio’s actual expense ratio and an assumed rate of return of 5% per year before expenses, which is not the Portfolio’s actual return. The hypothetical account values and expenses may not be used to estimate the actual ending account balances or expenses you paid for the period. You may use this information to compare this 5% hypothetical example with the 5% hypothetical examples that appear in the shareholder reports of other funds.
Please note that the expenses shown in the tables are meant to highlight your ongoing costs only and do not reflect any transactional costs, or other expenses charged by your insurance contract or separate account. Therefore, the tables are useful in comparing ongoing costs only, and will not help you determine the relative total costs of owning different funds. In addition, if these transactional costs were included, your costs would have been higher.
| | | | | | | | | | | Hypothetical |
| | | | | | | | | | | (5% return before |
| | | | | | | Actual | | expenses) |
| | | Portfolio’s | | Beginning | | Ending | | Expenses | | Ending | | Expenses |
| | | Annualized | | Account | | Account | | Paid | | Account | | Paid |
| | | Expense | | Value | | Value | | During | | Value | | During |
| Class 1 | | Ratio | | 7-1-22 | | 12-31-22 | | Period* | | 12-31-22 | | Period* |
| Managed Risk Balanced ETF Portfolio | | 0.41% | | $1,000.00 | | $990.70 | | $2.06 | | $1,023.14 | | $2.09 |
| Managed Risk Growth ETF Portfolio | | 0.40% | | $1,000.00 | | $993.90 | | $2.01 | | $1,023.19 | | $2.04 |
| Managed Risk Moderate Growth ETF Portfolio | | 0.41% | | $1,000.00 | | $991.90 | | $2.06 | | $1,023.14 | | $2.09 |
| TOPS® Managed Risk ETF Portfolios |
| Expense Example (Unaudited) (Continued) |
| December 31, 2022 |
| | | | | | | | | | | Hypothetical |
| | | | | | | | | | | (5% return before |
| | | | | | | Actual | | expenses) |
| | | Portfolio’s | | Beginning | | Ending | | Expenses | | Ending | | Expenses |
| | | Annualized | | Account | | Account | | Paid | | Account | | Paid |
| | | Expense | | Value | | Value | | During | | Value | | During |
| Class 2 | | Ratio | | 7-1-22 | | 12-31-22 | | Period* | | 12-31-22 | | Period* |
| Managed Risk Balanced ETF Portfolio | | 0.66% | | $1,000.00 | | $991.00 | | $3.31 | | $1,021.88 | | $3.36 |
| Managed Risk Growth ETF Portfolio | | 0.65% | | $1,000.00 | | $992.30 | | $3.26 | | $1,021.93 | | $3.31 |
| Managed Risk Moderate Growth ETF Portfolio | | 0.66% | | $1,000.00 | | $991.80 | | $3.31 | | $1,021.88 | | $3.36 |
| | | | | | | | | | | | | |
| | | | | | | | | | | Hypothetical |
| | | | | | | | | | | (5% return before |
| | | | | | | Actual | | expenses) |
| | | Portfolio’s | | Beginning | | Ending | | Expenses | | Ending | | Expenses |
| | | Annualized | | Account | | Account | | Paid | | Account | | Paid |
| | | Expense | | Value | | Value | | During | | Value | | During |
| Class 3 | | Ratio | | 7-1-22 | | 12-31-22 | | Period * | | 12-31-22 | | Period* |
| Managed Risk Balanced ETF Portfolio | | 0.76% | | $1,000.00 | | $988.70 | | $3.81 | | $1,021.37 | | $3.87 |
| Managed Risk Growth ETF Portfolio | | 0.75% | | $1,000.00 | | $992.20 | | $3.77 | | $1,021.42 | | $3.82 |
| Managed Risk Moderate Growth ETF Portfolio | | 0.76% | | $1,000.00 | | $991.10 | | $3.81 | | $1,021.37 | | $3.87 |
| | | | | | | | | | | | | |
| | | | | | | | | | | Hypothetical |
| | | | | | | | | | | (5% return before |
| | | | | | | Actual | | expenses) |
| | | Portfolio’s | | Beginning | | Ending | | Expenses | | Ending | | Expenses |
| | | Annualized | | Account | | Account | | Paid | | Account | | Paid |
| | | Expense | | Value | | Value | | During | | Value | | During |
| Class 4 | | Ratio | | 7-1-22 | | 12-31-22 | | Period * | | 12-31-22 | | Period* |
| Managed Risk Balanced ETF Portfolio | | 1.01% | | $1,000.00 | | $989.80 | | $5.07 | | $1,020.11 | | $5.14 |
| Managed Risk Growth ETF Portfolio | | 1.00% | | $1,000.00 | | $991.80 | | $5.02 | | $1,020.16 | | $5.09 |
| Managed Risk Moderate Growth ETF Portfolio | | 1.01% | | $1,000.00 | | $989.00 | | $5.06 | | $1,020.11 | | $5.14 |
| TOPS® Managed Risk ETF Portfolios |
| Expense Example (Unaudited) (Continued) |
| December 31, 2022 |
| | | | | | | | | | | Hypothetical |
| | | | | | | | | | | (5% return before |
| | | | | | | Actual | | expenses) |
| | | Portfolio’s | | Beginning | | Ending | | Expenses | | Ending | | Expenses |
| | | Annualized | | Account | | Account | | Paid | | Account | | Paid |
| | | Expense | | Value | | Value | | During | | Value | | During |
| Investor Class | | Ratio | | 7-1-22 | | 12-31-22 | | Period* | | 12-31-22 | | Period* |
| Managed Risk Balanced ETF Portfolio | | 0.91% | | $1,000.00 | | $990.50 | | $4.57 | | $1,020.62 | | $4.63 |
| Managed Risk Growth ETF Portfolio | | 0.90% | | $1,000.00 | | $989.90 | | $4.51 | | $1,020.67 | | $4.58 |
| Managed Risk Moderate Growth ETF Portfolio | | 0.91% | | $1,000.00 | | $995.00 | | $4.58 | | $1,020.62 | | $4.63 |
| * | Expenses are equal to the average account value over the period, multiplied by each Portfolio’s annualized expense ratio, multiplied by the number of days in the period (184) divided by the number of days in the fiscal year (365). |
| TOPS® ETF Portfolios |
| Supplemental Information (Unaudited) |
| December 31, 2022 |
The Trustees and the executive officers of the Trust are listed below with their present positions with the Trust and principal occupations over at least the last five years. The business address of each Trustee and Officer is 225 Pictoria Drive, Suite 450, Cincinnati, OH 45246. All correspondence to the Trustees and Officers should be directed to c/o Ultimus Fund Solutions, LLP, P.O. Box 541150, Omaha, Nebraska 68154.
Independent Trustees
Name, Address
and Year of Birth | Position/Term
of Office | Principal Occupation
During the Past Five
Years | Number of
Portfolios
in Fund
Complex*
Overseen
by Trustee | Other Directorships held by
Trustee During the Past Five Years |
Mark Garbin
Born in 1951 | Trustee Since 2013 | Managing Principal, Coherent Capital Management LLC (since 2007). | 10 | Northern Lights Variable Trust (for series not affiliated with the Funds since 2013); Two Roads Shared Trust (since 2012); Forethought Variable Insurance Trust (since 2013); Northern Lights Fund Trust (since 2013); OHA Mortgage Strategies Fund (offshore), Ltd. (2014-2017); and Altegris KKR Commitments Master Fund (since 2014); OFI Carlyle Global Private Credit Fund (since March 2018) and Independent Director OHA CLO Enhanced Equity II Genpar LLP(since June 2021). |
Mark D. Gersten
Born in 1950 | Trustee Since 2013 | Independent Consultant (since 2012). | 10 | Northern Lights Variable Trust (for series not affiliated with the Funds since 2013); Northern Lights Fund Trust (since 2013);Two Roads Shared Trust (since 2012); Altegris KKR Commitments Master Fund (since 2014); previously, Ramius Archview Credit and Distressed Fund (2015-2017); Schroder Global Series Trust (2012 -2017). |
Anthony J. Hertl
Born in 1950 | Trustee Since 2005; Chairman of the Board since 2013 | Retired, previously held several positions in a major Wall Street firm including Capital Markets Controller, Director of Global Taxation, and CFO of the Specialty Finance Group. | 10 | Northern Lights Variable Trust (for series not affiliated with the Funds since 2006); Northern Lights Fund Trust (since 2005); Alternative Strategies Fund (since 2010); Satuit Capital Management Trust (2007-2019). |
Gary W. Lanzen
Born in 1954 | Trustee Since 2005 | Retired since 2012. Formerly, Founder, President, and Chief Investment Officer, Orizon Investment Counsel, Inc. (2000-2012). | 10 | Northern Lights Variable Trust (for series not affiliated with the Funds since 2006); Northern Lights Fund Trust (since 2005); AdvisorOne Funds (since 2003); Alternative Strategies Fund (since 2010); and previously, CLA Strategic Allocation Fund (2014-2015). |
John V. Palancia
Born in 1954 | Trustee Since 2011 | Retired (since 2011). Formerly, Director of Futures Operations, Merrill Lynch, Pierce, Fenner & Smith Inc. (1975-2011). | 10 | Northern Lights Variable Trust (for series not affiliated with the Funds since 2011); Northern Lights Fund Trust III (since February 2012); Alternative Strategies Fund (since 2012) and Northern Lights Fund Trust (since 2011). |
Mark H. Taylor
Born in 1964 | Trustee Since 2007; Chairman of the Audit Committee since 2013 | Director, Lynn Pippenger School of Accountancy Muma College of Business, University of South Florida, Tampa FL(since 2019); Chair, Department of Accountancy and Andrew D. Braden Professor of Accounting and Auditing, Weather head School of Management, Case Western Reserve University (2009-2019); Vice President-Finance, American Accounting Association (2017-2020); President, Auditing Section of the American Accounting Association (2012-2015). AICPA Auditing Standards Board Member (2009-2012). | 10 | Northern Lights Variable Trust (for series not affiliated with the Funds since 2007); Alternative Strategies Fund (since 2010); Northern Lights Fund Trust III (since 2012); and Northern Lights Fund Trust (since 2007). |
12/31/22-NLVT-v1
| TOPS® ETF Portfolios |
| Supplemental Information (Unaudited)(Continued) |
| December 31, 2022 |
Officers
Name, Address
and Year of Birth | Position/Term of
Office* | Principal Occupation During the
Past Five Years | Number of
Portfolios in
Fund
Complex*
Overseen by
Trustee | Other Directorships held by
Trustee During the Past
Five Years |
Kevin E. Wolf
Born in 1969 | President Since June 2017 | Executive Vice President, Head of Fund Administration, and Product; Ultimus Fund Solutions, LLC (since 2020); Vice President of The Ultimus Group, LLC (since 2019);Executive Vice President of Gemini Fund Services, LLC (2019-2020) President, Gemini Fund Services, LLC (2012 -2019). | N/A | N/A |
Eric Kane
Born in 1981 | Vice President Since December 2022 | Vice President and Senior Managing Counsel, Ultimus Fund Solutions, LLC (since 2022); Vice President and Managing Counsel, Ultimus Fund Solutions, LLC (2020-2022); Vice President and Counsel, Gemini Fund Services, LLC (2017-2020); Assistant Vice President, Gemini Fund Services, LLC (2014-2017). | N/A | N/A |
James Colantino
Born in 1969 | Treasurer Since June 2017 | Senior Vice President Fund Administration, Ultimus Fund Solutions (since 2020); Senior Vice President Fund Administration, Gemini Fund Services, LLC (2012-2020); Assistant Treasurer of the Trust (2006-June 2017). | N/A | N/A |
Stephanie Shearer
Born in 1979 | Secretary Since February 2017 | Assistant Secretary of the Trust (2012-February 2017); Associate Director, Ultimus Fund Solutions (since 2022); Manager of Legal Administration, Ultimus Fund Solutions (since 2020-2022); Manager of Legal Administration, Gemini Fund Services, LLC (2018-2020); Senior Paralegal, Gemini Fund Services, LLC (2013 -2018). | N/A | N/A |
Michael J. Nanosky
Born in 1966 | Chief Compliance Officer since January 2021 | Chief Compliance Officer, of the Trust (Since January 2021); Vice President-Senior Compliance Officer, Ultimus Fund Solutions (Since 2020); Vice President, Chief Compliance Officer for Williamsburg Investment Trust (2020-current); Senior Vice President-Chief Compliance Officer, PNC Funds (2014-2019). | N/A | N/A |
| * | The term of office for each Trustee and officer listed above will continue indefinitely until the individual resigns or is removed. |
| ** | As of December 31,2022, the Trust was comprised of 13 active portfolios managed by unaffiliated investment advisers. The term “Fund Complex” applies only to the 10 Portfolios managed by the Adviser. Those Portfolios do not hold themselves out as related to any other series within the Trust for investment purposes, nor do they share the same investment adviser with any other series. |
The Portfolios’ Statement of Additional Information includes additional information about the Trustees and is available free of charge, upon request, by calling toll-free at 1-855-572-5945.
12/31/22-NLVT-v1
PRIVACY NOTICE
Northern Lights Variable Trust
Rev. February 2014
| FACTS | WHAT DOES NORTHERN LIGHTS VARIABLE TRUST DO WITH YOUR PERSONAL INFORMATION? |
| Why? | Financial companies choose how they share your personal information. Federal law gives consumers the right to limit some, but not all sharing. Federal law also requires us to tell you how we collect, share, and protect your personal information. Please read this notice carefully to understand what we do. |
| What? | The types of personal information we collect and share depends on the product or service that you have with us. This information can include: ● Social Security number and wire transfer instructions ● account transactions and transaction history ● investment experience and purchase history When you are no longer our customer, we continue to share your information as described in this notice. |
| How? | All financial companies need to share customers’ personal information to run their everyday business. In the section below, we list the reasons financial companies can share their customers’ personal information; the reasons Northern Lights Variable Trust chooses to share; and whether you can limit this sharing. |
Reasons we can share your
personal information: | Does Northern Lights Variable
Trust share information? | Can you limit this sharing? |
| For our everyday business purposes - such as to process your transactions, maintain your account(s), respond to court orders and legal investigations, or report to credit bureaus. | YES | NO |
| For our marketing purposes - to offer our products and services to you. | NO | We don’t share |
| For joint marketing with other financial companies. | NO | We don’t share |
| For our affiliates’ everyday business purposes - information about your transactions and records. | NO | We don’t share |
| For our affiliates’ everyday business purposes - information about your credit worthiness. | NO | We don’t share |
| For nonaffiliates to market to you | NO | We don’t share |
| QUESTIONS? | Call 1-631-490-4300 |
PRIVACY NOTICE
Northern Lights Variable Trust
| What we do: |
How does Northern Lights Variable Trust protect my personal information? | To protect your personal information from unauthorized access and use, we use security measures that comply with federal law. These measures include computer safeguards and secured files and buildings. Our service providers are held accountable for adhering to strict policies and procedures to prevent any misuse of your nonpublic personal information. |
How does Northern Lights Variable Trust collect my personal information? | We collect your personal information, for example, when you ● open an account or deposit money ● direct us to buy securities or direct us to sell your securities ● seek advice about your investments We also collect your personal information from others, such as credit bureaus, affiliates, or other companies. |
Why can’t I limit all sharing? | Federal law gives you the right to limit only: ● sharing for affiliates’ everyday business purposes – information about your creditworthiness. ● affiliates from using your information to market to you. ● sharing for nonaffiliates to market to you. State laws and individual companies may give you additional rights to limit sharing. |
| Definitions |
| Affiliates | Companies related by common ownership or control. They can be financial and nonfinancial companies. ● Northern Lights Variable Trust does not share with our affiliates. |
| Nonaffiliates | Companies not related by common ownership or control. They can be financial and nonfinancial companies. ● Northern Lights Variable Trust does not share with nonaffiliates so they can market to you. |
| Joint marketing | A formal agreement between nonaffiliated financial companies that together market financial products or services to you. ● Northern Lights Variable Trust doesn’t jointly market. |
PROXY VOTING POLICY
Information regarding how the Portfolios voted proxies relating to portfolio securities for the most recent twelve month period ended June 30 as well as a description of the policies and procedures that the Portfolios use to determine how to vote proxies is available without charge, upon request, by calling 1-855 -572-5945 or by referring to the Securities and Exchange Commission’s (“SEC”) website at http://www.sec.gov.
PORTFOLIO HOLDINGS
Each Portfolio files a complete schedule of portfolio holdings with the SEC for the first and third quarters of each fiscal year as an exhibit to its reports on Form N- PORT, within sixty days after the end of the period. Form N-PORT reports are available on the SEC’s website at www.sec.gov. The information on Form N-PORT is available without charge, upon request, by calling 1-855-572-5945.
| |
| INVESTMENT ADVISOR |
| ValMark Advisers, Inc. |
| 130 Springside Drive |
| Akron, OH 44333 |
| |
| INVESTMENT SUB-ADVISOR |
| Milliman Financial Risk Management, LLC |
| 71 S. Wacker Drive, 31st Floor |
| Chicago, IL 60606 |
| |
| ADMINISTRATOR |
| Ultimus Fund Solutions, LLC |
| 225 Pictoria Drive, Suite 450 |
| Cincinnati, OH 45246 |
| |
| |
| |
| TMR-AR22 |
(b) Not applicable
Item 2. Code of Ethics.
(a) As of the end of the period covered by this report, the registrant has adopted a code of ethics that applies to the registrant's principal executive officer, principal financial officer, principal accounting officer or controller, or persons performing similar functions, regardless of whether these individuals are employed by the registrant or a third party.
(b) For purposes of this item, “code of ethics” means written standards that are reasonably designed to deter wrongdoing and to promote:
| (1) | Honest and ethical conduct, including the ethical handling of actual or apparent conflicts of interest between personal and professional relationships; |
| (2) | Full, fair, accurate, timely, and understandable disclosure in reports and documents that a registrant files with, or submits to, the Commission and in other public communications made by the registrant; |
(3) Compliance with applicable governmental laws, rules, and regulations;
| (4) | The prompt internal reporting of violations of the code to an appropriate person or persons identified in the code; and |
(5) Accountability for adherence to the code.
(c) Amendments: During the period covered by the report, there have not been any amendments to the provisions of the code of ethics.
(d) Waivers: During the period covered by the report, the registrant has not granted any express or implicit waivers from the provisions of the code of ethics.
(e) The Code of Ethics is not posted on Registrant’ website.
(f) A copy of the Code of Ethics is attached as an exhibit.
Item 3. Audit Committee Financial Expert.
(a)(1)ii The Registrant’s board of trustees has determined that Mark H. Taylor is an audit committee financial experts, as defined in Item 3 of Form N-CSR. Mr. Taylor are independent for purposes of this Item 3.
Item 4. Principal Accountant Fees and Services.
FYE 2022 - $35,730
FYE 2021 - $35,610
FYE 2022 - None
FYE 2021 - None
FYE 2022 - $10,320
FYE 2021 - $10,110
Preparation of Federal & State income tax returns, assistance with calculation of required income, capital gain and excise distributions and preparation of Federal excise tax returns.
FYE 2022 - None
FYE 2021 - None
| (e) | (1) Audit Committee’s Pre-Approval Policies |
The registrant’s Audit Committee is required to pre-approve all audit services and, when appropriate, any non-audit services (including audit-related, tax and all other services) to the registrant. The registrant’s Audit Committee also is required to pre-approve, when appropriate, any non-audit services (including audit-related, tax and all other services) to its adviser, or any entity controlling, controlled by or under common control with the adviser that provides ongoing services to the registrant, to the extent that the services may be determined to have an impact on the operations or financial reporting of the registrant. Services are reviewed on an engagement by engagement basis by the Audit Committee.
| (2) | Percentages of Services Approved by the Audit Committee |
2022 2021
Audit-Related Fees: 0.00% 0.00%
Tax Fees: 0.00% 0.00%
All Other Fees: 0.00% 0.00%
| (f) | During the audit of registrant's financial statements for the most recent fiscal year, less than 50 percent of the hours expended on the principal accountant's engagement were attributed to work performed by persons other than the principal accountant's full-time, permanent employees. |
| (g) | The aggregate non-audit fees billed by the registrant's accountant for services rendered to the registrant, and rendered to the registrant's investment adviser (not including any sub-adviser whose role is primarily portfolio management and is subcontracted with or overseen by another investment adviser), and any entity controlling, controlled by, or under common control with the adviser that provides ongoing services to the registrant: |
2022 - $35,730
2021 - $35,610
(h) The registrant's audit committee has considered whether the provision of non-audit services to the registrant's investment adviser (not including any sub-adviser whose role is primarily portfolio management and is subcontracted with or overseen by another investment adviser), and any entity controlling, controlled by, or under common control with the investment adviser that provides ongoing services to the registrant, that were not pre-approved pursuant to paragraph (c)(7)(ii) of Rule 2-01 of Regulation S-X, is compatible with maintaining the principal accountant's independence.
(i) Not applicable
(j) Not applicable
Item 5. Audit Committee of Listed Companies. Not applicable to open-end investment companies.
Item 6. Schedule of Investments. Schedule of investments in securities of unaffiliated issuers is included under Item 1.
Item 7. Disclosure of Proxy Voting Policies and Procedures for Closed-End Funds. Not applicable to open-end investment companies.
Item 8. Portfolio Managers of Closed-End Management Investment Companies. Not applicable to open-end investment companies.
Item 9. Purchases of Equity Securities by Closed-End Funds. Not applicable to open-end investment companies.
Item 10. Submission of Matters to a Vote of Security Holders. None
Item 11. Controls and Procedures.
(a) Based on an evaluation of the Registrant’s disclosure controls and procedures as of a date within 90 days of filing date of this Form N-CSR, the principal executive officer and principal financial officer of the Registrant have concluded that the disclosure controls and procedures of the Registrant are reasonably designed to ensure that the information required in filings on Form N-CSR is recorded, processed, summarized, and reported by the filing date, including that information required to be disclosed is accumulated and communicated to the Registrant’s management, including the Registrant’s principal executive officer and principal financial officer, as appropriate to allow timely decisions regarding required disclosure.
(b) There were no significant changes in the Registrant’s internal control over financial reporting that occurred during the period covered by this report that have materially affected, or are reasonably likely to materially affect, the Registrant’s internal control over financial reporting.
Item 12. Disclosure Of Securities Lending Activities For Closed-End Management Investment Companies. Not applicable to open-end investment companies.
Item 13. Exhibits.
(a)(1) Not applicable.
(a)(2) Certifications required by Section 302 of the Sarbanes-Oxley Act of 2002 (and Item 11(a)(2) of Form N-CSR) are filed herewith.
(a)(3) Not applicable for open-end investment companies.
SIGNATURES
Pursuant to the requirements of the Securities Exchange Act of 1934 and the Investment Company Act of 1940, the registrant has duly caused this report to be signed on its behalf by the undersigned, thereunto duly authorized.
(Registrant) Northern Lights Variable Trust
By (Signature and Title)
/s/ Kevin E. Wolf
Kevin E. Wolf, Principal Executive Officer/President
Date 2/23/2023
Pursuant to the requirements of the Securities Exchange Act of 1934 and the Investment Company Act of 1940, this report has been signed below by the following persons on behalf of the registrant and in the capacities and on the dates indicated.
By (Signature and Title)
/s/ Kevin E. Wolf
Kevin E. Wolf, Principal Executive Officer/President
Date 2/23/2023
By (Signature and Title)
/s/ Jim Colantino
Jim Colantino, Principal Financial Officer/Treasurer
Date 2/23/2023