UNITED STATES
SECURITIES AND EXCHANGE COMMISSION
Washington, D.C. 20549
FORM N-CSR
CERTIFIED SHAREHOLDER REPORT OF REGISTERED
MANAGEMENT INVESTMENT COMPANIES
|
| | | | | | |
| Investment Company Act file number | 811-21861 |
| | |
| AMERICAN CENTURY GROWTH FUNDS, INC. |
| (Exact name of registrant as specified in charter) |
| | |
| 4500 MAIN STREET, KANSAS CITY, MISSOURI | 64111 |
| (Address of principal executive offices) | (Zip Code) |
| | |
CHARLES A. ETHERINGTON 4500 MAIN STREET, KANSAS CITY, MISSOURI 64111 |
| (Name and address of agent for service) |
| | |
| Registrant’s telephone number, including area code: | 816-531-5575 |
| | |
| Date of fiscal year end: | 07-31 |
| | |
| Date of reporting period: | 07-31-2014 |
ITEM 1. REPORTS TO STOCKHOLDERS.
|
| |
ANNUAL REPORT | JULY 31, 2014 |
Legacy Focused Large Cap Fund
|
| |
| President’s Letter | |
| Performance | |
| Portfolio Commentary | |
| Fund Characteristics | |
| Shareholder Fee Example | |
| Schedule of Investments | |
| Statement of Assets and Liabilities | |
| Statement of Operations | |
| Statement of Changes in Net Assets | |
| Notes to Financial Statements | |
| Financial Highlights | |
| Report of Independent Registered Public Accounting Firm | |
| Management | |
| Approval of Management Agreement | |
| Additional Information | |
Any opinions expressed in this report reflect those of the author as of the date of the report, and do not necessarily represent the opinions of American Century Investments® or any other person in the American Century Investments organization. Any such opinions are subject to change at any time based upon market or other conditions and American Century Investments disclaims any responsibility to update such opinions. These opinions may not be relied upon as investment advice and, because investment decisions made by American Century Investments funds are based on numerous factors, may not be relied upon as an indication of trading intent on behalf of any American Century Investments fund. Security examples are used for representational purposes only and are not intended as recommendations to purchase or sell securities. Performance information for comparative indices and securities is provided to American Century Investments by third party vendors. To the best of American Century Investments’ knowledge, such information is accurate at the time of printing.
|
| |
| Dear Investor:
Thank you for reviewing this annual report for the 12 months ended July 31, 2014. It provides investment performance and portfolio information for the reporting period, plus longer-term historical performance data.
Annual reports remain important vehicles for conveying information about fund returns, including market and economic factors that affected performance during the reporting period. For additional, updated investment and market insights, we encourage you to visit our website, americancentury.com.
|
| Jonathan Thomas |
Aggressive Monetary Policies, as Investors Sought Risk and Yield, Boosted Returns
Stimulative monetary policies and expectations of longer-term economic improvement, interspersed with concerns about nearer-term weaker-than-expected economic data and geopolitical conflicts, helped drive financial market returns during the reporting period. We believe the combination of longer-term optimism about global economic growth, low costs of capital, and central bank purchases of fixed-income securities helped persuade investors to seek risk and yield. Broad stock market index returns were largely in the 10-20% range across the spectrum of developed versus emerging and large-cap versus small-cap markets. The S&P 500 Index, the MSCI EAFE Index, and the MSCI Emerging Markets Index advanced 16.94%, 15.07%, and 15.32%, respectively.
Bond performance was also generally solid, which was a surprise, given pre-2014 expectations for rising inflation and interest rates. Inflation showed signs of increasing, but remained contained, and interest rates actually fell in many markets. According to Bloomberg, the 10-year U.S. Treasury yield edged downward from 2.59% to 2.56% during the 12 months, while the 30-year U.S. Treasury yield fell from 3.65% to 3.32%. This “bull market flattening” of the U.S. Treasury yield curve helped produce a total return of 9.74% for the 30-year U.S. Treasury bond, according to Barclays. Indices that tracked U.S. high-yield and investment-grade corporate bonds and mortgage-backed securities also generally outperformed the broad Barclays U.S. Aggregate Bond Index, which advanced 3.97%.
Looking ahead, we see signs of sustained economic growth for the remainder of 2014, but headwinds persist. In the U.S., which was supposed to be an economic growth leader this year, housing market momentum has slowed, inflation and interest rates could rise, and economic growth and U.S. employment levels remain subpar compared with past post-recession periods. In this environment, we continue to believe in a disciplined, diversified, long-term investment approach, using professionally managed stock and bond portfolios—as appropriate—for meeting financial goals. We appreciate your continued trust in us.
Sincerely,
Jonathan Thomas
President and Chief Executive Officer
American Century Investments
|
| | | | | |
| Total Returns as of July 31, 2014 |
| | | | Average Annual Returns | |
| | Ticker Symbol | 1 year | 5 years | Since Inception | Inception Date |
| Investor Class | ACFOX | 19.16% | 15.50% | 7.43% | 5/31/06 |
| S&P 500 Index | — | 16.94% | 16.78% | 7.52% | — |
| Institutional Class | ACFSX | 19.32% | 15.73% | 7.65% | 5/31/06 |
| R Class | ACFCX | 18.51% | 14.92% | 6.89% | 5/31/06 |
| Advisor Class | ACFDX | 18.75% | 15.20% | 7.16% | 5/31/06 |
|
|
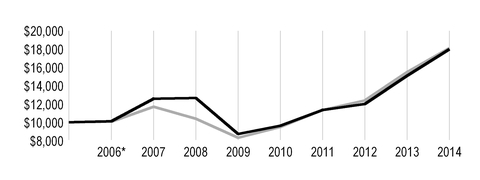
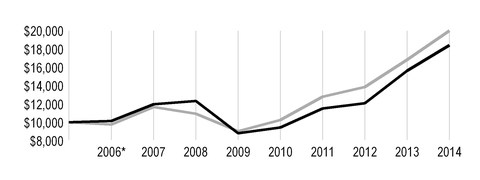
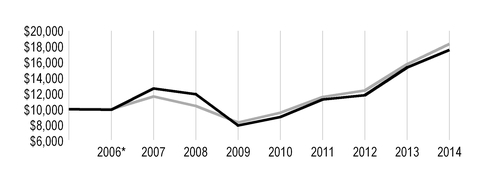
| Growth of $10,000 Over Life of Class |
| $10,000 investment made May 31, 2006 |
|
| |
| Value on July 31, 2014 |
| | Investor Class — $17,961 |
| |
| | S&P 500 Index — $18,091 |
| |
*From May 31, 2006, the Investor Class’s inception date. Not annualized.
|
| | | |
| Total Annual Fund Operating Expenses |
| Investor Class | Institutional Class | R Class | Advisor Class |
| 1.11% | 0.91% | 1.61% | 1.36% |
The total annual fund operating expenses shown is as stated in the fund’s prospectus current as of the date of this report. The prospectus may vary from the expense ratio shown elsewhere in this report because it is based on a different time period, includes acquired fund fees and expenses, and, if applicable, does not include fee waivers or expense reimbursements.
Data presented reflect past performance. Past performance is no guarantee of future results. Current performance may be higher or lower than the performance shown. Investment return and principal value will fluctuate, and redemption value may be more or less than original cost. To obtain performance data current to the most recent month end, please call 1-800-345-2021 or visit americancentury.com. The fund’s investment process may result in high portfolio turnover, which could mean high transaction costs, affecting both performance and capital gains tax liabilities to investors.
Unless otherwise indicated, performance reflects Investor Class shares; performance for other share classes will vary due to differences in fee structure. For information about other share classes available, please consult the prospectus. Data assumes reinvestment of dividends and capital gains, and none of the charts reflect the deduction of taxes that a shareholder would pay on fund distributions or the redemption of fund shares. Returns for the index are provided for comparison. The fund’s total returns include operating expenses (such as transaction costs and management fees) that reduce returns, while the total returns of the index do not.
Portfolio Managers: John T. Small Jr. and Stephen Pool
Performance Summary
Legacy Focused Large Cap returned 19.16%* for the 12 months ended July 31, 2014, outpacing the 16.94% return of the portfolio’s benchmark, the S&P 500 Index.
As discussed in the President's Letter on page 2, U.S. stock indices delivered solid returns during the reporting period. Within the S&P 500 Index, information technology was the top-performing sector, returning nearly 28%. Materials, health care, and energy stocks also outperformed the overall index. Consumer staples was the weakest sector, returning about 7%. Telecommunication services, utilities, financials, consumer discretionary, and industrials also trailed the benchmark average.
Throughout the year, Legacy Focused Large Cap’s management team continued to use its quantitative process to identify and evaluate the fundamental business prospects of its portfolio holdings and potential investments within the fund’s investment universe. Purchases and sales, as well as individual security and industry allocations, are the result of applying this process as company-specific and market events change. Stock decisions in the industrials and health care sectors contributed most to outperformance relative to the S&P 500. Stock selection in consumer staples also aided results, but positioning among household products firms and food and staples retailing were modest detractors. Stock selection in information technology also helped, although lighter exposure to internet software and services companies hampered results. Stock selection in telecommunication services also aided relative performance. Holdings in the materials sector and an underweight to chemicals firms detracted, as did stock selection and an overweight within the utilities sector.
Industrials and Health Care Were Top Contributors
Industrials provided the fund’s best relative contribution by sector, led by positioning in the aerospace and defense and machinery industries. Automotive parts supplier Magna International was among the top contributors for the year. The Ontario-based company benefited from increased sales of new vehicles in North America.
Stock decisions in health care, especially among pharmaceutical companies, also helped results. The fund’s top contributor overall was Actavis, which is expected to benefit from its acquisition of Forest Laboratories, an innovative deal that allows Actavis to lever Forest’s current gastrointestinal business but also helps position the combined firm for the changing health care environment by lowering costs and combining sales forces.
Consumer Staples and Information Technology Were Key Contributors
Positioning within the consumer staples sector benefited results, aided by underweighting struggling tobacco companies. In the food and staples retailing industry, our holding in CVS Caremark performed well while we avoided other, poorer performers. CVS has shown strong retail sales despite dropping tobacco products from its offerings, and its pharmacy benefit manager segment is performing well. In the information technology sector, computers and peripherals manufacturer SanDisk was a key contributor, thanks to improving margins and the broader trend toward flash-based data storage.
* All fund returns referenced in this commentary are for Investor Class shares. Performance for other share classes will vary due to differences in fee structure; when Investor Class performance exceeds that of the fund's benchmark, other share classes may not. See page 3 for returns for all share classes.
Materials and Utilities Detracted
Materials was the major detracting sector, weighed down by stock decisions and by lighter exposure to chemicals and metals and mining firms. International Paper was a major detractor, and we eliminated the holding.
Utilities detracted primarily due to holdings in Consolidated Edison and Duke Energy. Investors are concerned about litigation issues for both companies—Consolidated Edison for a Manhattan explosion that caused several deaths and injuries and Duke Energy for a coal ash spill into the Dan River. We eliminated Consolidated Edison but continue to hold Duke Energy.
The fund’s top detractor was Celgene, which has been mired in a patent dispute over its key blood cancer treatment. The holding was eliminated.
Outlook
The U.S. economy appears headed for a sustained but moderate economic expansion, but there are headwinds both domestically and internationally. Whatever the conditions, Legacy Focused Large Cap will continue to employ its disciplined investment approach that combines current market conditions with appropriate stock selection criteria to identify attractive opportunities. The quantitative model allows the management team to uncover large-cap investments across the growth and value spectrums.
|
| |
| JULY 31, 2014 |
| Top Ten Holdings | % of net assets |
| Apple, Inc. | 3.1% |
| Hospira, Inc. | 2.6% |
| Gap, Inc. (The) | 2.5% |
| Hewlett-Packard Co. | 2.5% |
| Duke Energy Corp. | 2.5% |
| Actavis plc | 2.5% |
| Verizon Communications, Inc. | 2.5% |
| IHS, Inc., Class A | 2.5% |
| General Growth Properties, Inc. | 2.5% |
| International Business Machines Corp. | 2.5% |
| | |
| Top Five Industries | % of net assets |
| Oil, Gas and Consumable Fuels | 8.2% |
| Technology Hardware, Storage and Peripherals | 7.4% |
| Pharmaceuticals | 6.8% |
| Software | 6.8% |
| Consumer Finance | 4.6% |
| | |
| Types of Investments in Portfolio | % of net assets |
| Common Stocks | 96.5% |
| Temporary Cash Investments | 3.3% |
| Other Assets and Liabilities | 0.2% |
Fund shareholders may incur two types of costs: (1) transaction costs, including sales charges (loads) on purchase payments and redemption/exchange fees; and (2) ongoing costs, including management fees; distribution and service (12b-1) fees; and other fund expenses. This example is intended to help you understand your ongoing costs (in dollars) of investing in your fund and to compare these costs with the ongoing cost of investing in other mutual funds.
The example is based on an investment of $1,000 made at the beginning of the period and held for the entire period from February 1, 2014 to July 31, 2014.
Actual Expenses
The table provides information about actual account values and actual expenses for each class. You may use the information, together with the amount you invested, to estimate the expenses that you paid over the period. First, identify the share class you own. Then simply divide your account value by $1,000 (for example, an $8,600 account value divided by $1,000 = 8.6), then multiply the result by the number under the heading “Expenses Paid During Period” to estimate the expenses you paid on your account during this period.
If you hold Investor Class shares of any American Century Investments fund, or Institutional Class shares of the American Century Diversified Bond Fund, in an American Century Investments account (i.e., not a financial intermediary or retirement plan account), American Century Investments may charge you a $12.50 semiannual account maintenance fee if the value of those shares is less than $10,000. We will redeem shares automatically in one of your accounts to pay the $12.50 fee. In determining your total eligible investment amount, we will include your investments in all personal accounts (including American Century Investments Brokerage accounts) registered under your Social Security number. Personal accounts include individual accounts, joint accounts, UGMA/UTMA accounts, personal trusts, Coverdell Education Savings Accounts and IRAs (including traditional, Roth, Rollover, SEP-, SARSEP- and SIMPLE-IRAs), and certain other retirement accounts. If you have only business, business retirement, employer-sponsored or American Century Investments Brokerage accounts, you are currently not subject to this fee. If you are subject to the Account Maintenance Fee, your account value could be reduced by the fee amount.
Hypothetical Example for Comparison Purposes
The table also provides information about hypothetical account values and hypothetical expenses based on the actual expense ratio of each class of your fund and an assumed rate of return of 5% per year before expenses, which is not the actual return of a fund’s share class. The hypothetical account values and expenses may not be used to estimate the actual ending account balance or expenses you paid for the period. You may use this information to compare the ongoing costs of investing in your fund and other funds. To do so, compare this 5% hypothetical example with the 5% hypothetical examples that appear in the shareholder reports of the other funds.
Please note that the expenses shown in the table are meant to highlight your ongoing costs only and do not reflect any transactional costs, such as sales charges (loads) or redemption/exchange fees. Therefore, the table is useful in comparing ongoing costs only, and will not help you determine the relative total costs of owning different funds. In addition, if these transactional costs were included, your costs would have been higher.
|
| | | | |
| | Beginning Account Value 2/1/14 | Ending Account Value 7/31/14 | Expenses Paid During Period(1) 2/1/14 - 7/31/14 | Annualized Expense Ratio(1) |
| Actual |
| Investor Class | $1,000 | $1,101.50 | $5.73 | 1.10% |
| Institutional Class | $1,000 | $1,102.60 | $4.69 | 0.90% |
| R Class | $1,000 | $1,098.50 | $8.33 | 1.60% |
| Advisor Class | $1,000 | $1,099.20 | $7.03 | 1.35% |
| Hypothetical |
| Investor Class | $1,000 | $1,019.34 | $5.51 | 1.10% |
| Institutional Class | $1,000 | $1,020.33 | $4.51 | 0.90% |
| R Class | $1,000 | $1,016.86 | $8.00 | 1.60% |
| Advisor Class | $1,000 | $1,018.10 | $6.76 | 1.35% |
| |
| (1) | Expenses are equal to the class’s annualized expense ratio listed in the table above, multiplied by the average account value over the period, multiplied by 181, the number of days in the most recent fiscal half-year, divided by 365, to reflect the one-half year period. |
JULY 31, 2014
|
| | | | |
| | Shares | Value |
| COMMON STOCKS — 96.5% | | |
| AIR FREIGHT AND LOGISTICS — 2.4% | | |
| United Parcel Service, Inc., Class B | 3,882 | $ | 376,903 |
|
| AUTO COMPONENTS — 2.2% | | |
| Magna International, Inc. | 3,289 | 353,239 |
|
| AUTOMOBILES — 2.3% | | |
| Ford Motor Co. | 21,565 | 367,036 |
|
| BANKS — 1.2% | | |
| Wells Fargo & Co. | 3,892 | 198,103 |
|
| BIOTECHNOLOGY — 2.4% | | |
Biogen Idec, Inc.(1) | 1,120 | 374,517 |
|
| CAPITAL MARKETS — 2.4% | | |
| Blackstone Group LP | 11,660 | 381,049 |
|
| CHEMICALS — 2.1% | | |
| Praxair, Inc. | 2,556 | 327,526 |
|
| COMMUNICATIONS EQUIPMENT — 2.4% | | |
| Cisco Systems, Inc. | 15,092 | 380,771 |
|
| CONSUMER FINANCE — 4.6% | | |
| American Express Co. | 4,172 | 367,136 |
|
| Capital One Financial Corp. | 4,499 | 357,850 |
|
| | | 724,986 |
|
| DIVERSIFIED TELECOMMUNICATION SERVICES — 2.5% | | |
| Verizon Communications, Inc. | 7,847 | 395,646 |
|
| ELECTRIC UTILITIES — 2.5% | | |
| Duke Energy Corp. | 5,496 | 396,426 |
|
| ENERGY EQUIPMENT AND SERVICES — 1.8% | | |
| National Oilwell Varco, Inc. | 3,493 | 283,073 |
|
| FOOD AND STAPLES RETAILING — 2.4% | | |
| CVS Caremark Corp. | 5,027 | 383,862 |
|
| FOOD PRODUCTS — 2.4% | | |
| Archer-Daniels-Midland Co. | 8,376 | 388,646 |
|
| HEALTH CARE PROVIDERS AND SERVICES — 4.2% | | |
Centene Corp.(1) | 4,057 | 292,469 |
|
| UnitedHealth Group, Inc. | 4,570 | 370,399 |
|
| | | 662,868 |
|
| HOUSEHOLD PRODUCTS — 2.2% | | |
| Colgate-Palmolive Co. | 5,654 | 358,464 |
|
| INSURANCE — 2.3% | | |
| Aflac, Inc. | 6,028 | 360,113 |
|
| INTERNET SOFTWARE AND SERVICES — 1.8% | | |
Facebook, Inc., Class A(1) | 4,038 | 293,361 |
|
| IT SERVICES — 2.5% | | |
| International Business Machines Corp. | 2,047 | 392,348 |
|
| MACHINERY — 3.4% | | |
| Caterpillar, Inc. | 2,311 | 232,833 |
|
| PACCAR, Inc. | 4,938 | 307,490 |
|
| | | 540,323 |
|
|
| | | | |
| | Shares | Value |
| MEDIA — 1.8% | | |
| Viacom, Inc., Class B | 3,496 | $ | 289,014 |
|
| METALS AND MINING — 1.7% | | |
| Vale SA ADR | 19,095 | 274,013 |
|
| MULTILINE RETAIL — 1.6% | | |
| Macy's, Inc. | 4,423 | 255,605 |
|
| OIL, GAS AND CONSUMABLE FUELS — 8.2% | | |
| Anadarko Petroleum Corp. | 3,475 | 371,304 |
|
| Chevron Corp. | 3,014 | 389,529 |
|
| Exxon Mobil Corp. | 3,927 | 388,537 |
|
| Valero Energy Corp. | 2,957 | 150,216 |
|
| | | 1,299,586 |
|
| PHARMACEUTICALS — 6.8% | | |
| AbbVie, Inc. | 5,336 | 279,286 |
|
Actavis plc(1) | 1,850 | 396,381 |
|
Hospira, Inc.(1) | 7,450 | 413,252 |
|
| | | 1,088,919 |
|
| PROFESSIONAL SERVICES — 2.5% | | |
IHS, Inc., Class A(1) | 3,009 | 395,292 |
|
| REAL ESTATE INVESTMENT TRUSTS (REITs) — 2.5% | | |
| General Growth Properties, Inc. | 16,895 | 394,836 |
|
| ROAD AND RAIL — 2.3% | | |
| Union Pacific Corp. | 3,777 | 371,317 |
|
| SOFTWARE — 6.8% | | |
FireEye, Inc.(1) | 10,414 | 369,697 |
|
| Microsoft Corp. | 9,027 | 389,605 |
|
| Oracle Corp. | 8,063 | 325,665 |
|
| | | 1,084,967 |
|
| SPECIALTY RETAIL — 2.5% | | |
| Gap, Inc. (The) | 10,055 | 403,306 |
|
| TECHNOLOGY HARDWARE, STORAGE AND PERIPHERALS — 7.4% | |
| Apple, Inc. | 5,202 | 497,155 |
|
| Hewlett-Packard Co. | 11,192 | 398,547 |
|
| SanDisk Corp. | 3,175 | 291,180 |
|
| | | 1,186,882 |
|
| TOBACCO — 2.4% | | |
| Philip Morris International, Inc. | 4,746 | 389,219 |
|
TOTAL COMMON STOCKS (Cost $14,274,160) | | 15,372,216 |
|
| TEMPORARY CASH INVESTMENTS — 3.3% | | |
| Repurchase Agreement, Bank of America Merrill Lynch, (collateralized by various U.S. Treasury obligations, 1.50%, 8/31/18, valued at $89,765), in a joint trading account at 0.07%, dated 7/31/14, due 8/1/14 (Delivery value $87,985) | | 87,985 |
|
| Repurchase Agreement, Credit Suisse First Boston, Inc., (collateralized by various U.S. Treasury obligations, 2.375%, 9/30/14, valued at $89,747), in a joint trading account at 0.01%, dated 7/31/14, due 8/1/14 (Delivery value $87,985) | | 87,985 |
|
| Repurchase Agreement, Goldman Sachs & Co., (collateralized by various U.S. Treasury obligations, 4.25%, 8/15/15, valued at $71,880), in a joint trading account at 0.03%, dated 7/31/14, due 8/1/14 (Delivery value $70,388) | | 70,388 |
|
|
| | | | |
| | Shares | Value |
| SSgA U.S. Government Money Market Fund, Class N | 282,589 | $ | 282,589 |
|
TOTAL TEMPORARY CASH INVESTMENTS (Cost $528,947) | | 528,947 |
|
TOTAL INVESTMENT SECURITIES — 99.8% (Cost $14,803,107) | | 15,901,163 |
|
| OTHER ASSETS AND LIABILITIES — 0.2% | | 33,799 |
|
| TOTAL NET ASSETS — 100.0% | | $ | 15,934,962 |
|
|
| | |
NOTES TO SCHEDULE OF INVESTMENTS
|
| ADR | - | American Depository Receipt |
See Notes to Financial Statements.
|
|
| Statement of Assets and Liabilities |
|
| | | |
| JULY 31, 2014 |
| Assets |
| Investment securities, at value (cost of $14,803,107) | $ | 15,901,163 |
|
| Receivable for capital shares sold | 34,254 |
|
| Dividends and interest receivable | 22,561 |
|
| | 15,957,978 |
|
| | |
| Liabilities |
| Payable for capital shares redeemed | 8,127 |
|
| Accrued management fees | 14,521 |
|
| Distribution and service fees payable | 368 |
|
| | 23,016 |
|
| | |
| Net Assets | $ | 15,934,962 |
|
| | |
| Net Assets Consist of: |
| Capital (par value and paid-in surplus) | $ | 24,170,407 |
|
| Undistributed net investment income | 169,463 |
|
| Accumulated net realized loss | (9,502,964 | ) |
| Net unrealized appreciation | 1,098,056 |
|
| | $ | 15,934,962 |
|
|
| | | | | | |
| | Net Assets | Shares Outstanding | Net Asset Value Per Share |
| Investor Class, $0.01 Par Value |
| $14,829,375 |
| 923,458 |
| $16.06 |
| Institutional Class, $0.01 Par Value |
| $18,421 |
| 1,143 |
| $16.12 |
| R Class, $0.01 Par Value |
| $423,433 |
| 26,724 |
| $15.84 |
| Advisor Class, $0.01 Par Value |
| $663,733 |
| 41,605 |
| $15.95 |
See Notes to Financial Statements.
|
| | | |
| YEAR ENDED JULY 31, 2014 |
| Investment Income (Loss) |
| Income: | |
| Dividends (net of foreign taxes withheld of $705) | $ | 310,256 |
|
| Interest | 30 |
|
| | 310,286 |
|
| | |
| Expenses: | |
| Management fees | 133,141 |
|
| Distribution and service fees: | |
| R Class | 402 |
|
| Advisor Class | 975 |
|
| Directors’ fees and expenses | 185 |
|
| Other expenses | 91 |
|
| | 134,794 |
|
| | |
| Net investment income (loss) | 175,492 |
|
| | |
| Realized and Unrealized Gain (Loss) |
| Net realized gain (loss) on investment transactions | 1,451,944 |
|
| Change in net unrealized appreciation (depreciation) on investments | 377,333 |
|
| | |
| Net realized and unrealized gain (loss) | 1,829,277 |
|
| | |
| Net Increase (Decrease) in Net Assets Resulting from Operations | $ | 2,004,769 |
|
See Notes to Financial Statements.
|
|
| Statement of Changes in Net Assets |
|
| | | | | | |
| YEARS ENDED JULY 31, 2014 AND JULY 31, 2013 |
| Increase (Decrease) in Net Assets | July 31, 2014 | July 31, 2013 |
| Operations |
| Net investment income (loss) | $ | 175,492 |
| $ | 100,367 |
|
| Net realized gain (loss) | 1,451,944 |
| 1,124,551 |
|
| Change in net unrealized appreciation (depreciation) | 377,333 |
| 418,080 |
|
| Net increase (decrease) in net assets resulting from operations | 2,004,769 |
| 1,642,998 |
|
| | | |
| Distributions to Shareholders |
| From net investment income: | | |
| Investor Class | (110,585 | ) | (174,167 | ) |
| Institutional Class | (196 | ) | (344 | ) |
| R Class | (99 | ) | (329 | ) |
| Advisor Class | (1,779 | ) | (4,489 | ) |
| Decrease in net assets from distributions | (112,659 | ) | (179,329 | ) |
| | | |
| Capital Share Transactions |
Net increase (decrease) in net assets from capital share transactions (Note 5) | 3,920,425 |
| 1,440,919 |
|
| | | |
| Net increase (decrease) in net assets | 5,812,535 |
| 2,904,588 |
|
| | | |
| Net Assets |
| Beginning of period | 10,122,427 |
| 7,217,839 |
|
| End of period | $ | 15,934,962 |
| $ | 10,122,427 |
|
| | | |
| Undistributed net investment income | $ | 169,463 |
| $ | 112,645 |
|
See Notes to Financial Statements.
|
|
| Notes to Financial Statements |
JULY 31, 2014
1. Organization
American Century Growth Funds, Inc. (the corporation) is registered under the Investment Company Act of 1940, as amended (the 1940 Act), as an open-end management investment company and is organized as a Maryland corporation. Legacy Focused Large Cap Fund (the fund) is one fund in a series issued by the corporation. The fund is nondiversified as defined under the 1940 Act. The fund’s investment objective is to seek long-term capital growth.
The fund offers the Investor Class, the Institutional Class, the R Class and the Advisor Class. The share classes differ principally in their respective distribution and shareholder servicing expenses and arrangements. The Institutional Class is made available to institutional shareholders or through financial intermediaries whose clients do not require the same level of shareholder and administrative services as shareholders of other classes. As a result, the Institutional Class is charged a lower unified management fee.
2. Significant Accounting Policies
The following is a summary of significant accounting policies consistently followed by the fund in preparation of its financial statements. The financial statements are prepared in conformity with accounting principles generally accepted in the United States of America, which may require management to make certain estimates and assumptions at the date of the financial statements. Actual results could differ from these estimates. Management evaluated the impact of events or transactions occurring through the date the financial statements were issued that would merit recognition or disclosure.
Investment Valuations — The fund determines the fair value of its investments and computes its net asset value per share at the close of regular trading (usually 4 p.m. Eastern time) on the New York Stock Exchange (NYSE) on each day the NYSE is open. The Board of Directors has adopted valuation policies and procedures to guide the investment advisor in the fund’s investment valuation process and to provide methodologies for the oversight of the fund’s pricing function.
Equity securities that are listed or traded on a domestic securities exchange are valued at the last reported sales price or at the official closing price as provided by the exchange. Equity securities traded on foreign securities exchanges are generally valued at the closing price of such securities on the exchange where primarily traded or at the close of the NYSE, if that is earlier. If no last sales price is reported, or if local convention or regulation so provides, the mean of the latest bid and asked prices may be used. Securities traded over-the-counter are valued at the mean of the latest bid and asked prices, the last sales price, or the official closing price.
Fixed income securities maturing within 60 days at the time of purchase may be valued at cost, plus or minus any amortized discount or premium or at the evaluated mean as provided by an independent pricing service. Evaluated mean prices are commonly derived through utilization of market models, which may consider, among other factors: trade data, quotations from dealers and active market makers, relevant yield curve and spread data, related sector levels, creditworthiness, trade data or market information on comparable securities, and other relevant security specific information.
Open-end management investment companies are valued at the reported net asset value per share. Repurchase agreements are valued at cost, which approximates fair value.
If the fund determines that the market price for an investment is not readily available or the valuation methods mentioned above do not reflect an investment’s fair value, such investment is valued as determined in good faith by the Board of Directors or its delegate, in accordance with policies and procedures adopted by the Board of Directors. In its determination of fair value, the fund may review several factors including, but not limited to, market information regarding the specific investment or comparable investments and correlation with other investment types, futures indices or general market indicators. Circumstances that may cause the fund to use these procedures to value an investment include, but are not limited to: an investment has been declared in default or is distressed; trading in a security has been suspended during the trading day or a security is not actively trading on its principal exchange; prices received from a regular pricing source are deemed unreliable; or there is a foreign market holiday and no trading occurred.
The fund monitors for significant events occurring after the close of an investment’s primary exchange but before the fund’s net asset value per share is determined. Significant events may include, but are not limited to: corporate announcements and transactions; governmental action and political unrest that could impact a specific investment or an investment sector; or armed conflicts, natural disasters and similar events that could affect investments in a specific country or region. The fund also monitors for significant fluctuations between domestic and foreign markets, as evidenced by the U.S. market or such other indicators that the Board of Directors, or its delegate, deems appropriate. If significant fluctuations in foreign markets are identified, the fund may apply a model-derived factor to the closing price of equity securities traded on foreign securities exchanges. The factor is based on observable market data as provided by an independent pricing service.
Security Transactions — Security transactions are accounted for as of the trade date. Net realized gains and losses are determined on the identified cost basis, which is also used for federal income tax purposes.
Investment Income — Dividend income less foreign taxes withheld, if any, is recorded as of the ex-dividend date. Distributions received on securities that represent a return of capital or long-term capital gain are recorded as a reduction of cost of investments and/or as a realized gain. The fund may estimate the components of distributions received that may be considered nontaxable distributions or long-term capital gain distributions for income tax purposes. Interest income is recorded on the accrual basis and includes accretion of discounts and amortization of premiums.
Repurchase Agreements — The fund may enter into repurchase agreements with institutions that American Century Investment Management, Inc. (ACIM) (the investment advisor) has determined are creditworthy pursuant to criteria adopted by the Board of Directors. The fund requires that the collateral, represented by securities, received in a repurchase transaction be transferred to the custodian in a manner sufficient to enable the fund to obtain those securities in the event of a default under the repurchase agreement. ACIM monitors, on a daily basis, the securities transferred to ensure the value, including accrued interest, of the securities under each repurchase agreement is equal to or greater than amounts owed to the fund under each repurchase agreement.
Joint Trading Account — Pursuant to an Exemptive Order issued by the Securities and Exchange Commission, the fund, along with certain other funds in the American Century Investments family of funds, may transfer uninvested cash balances into a joint trading account. These balances are invested in one or more repurchase agreements that are collateralized by U.S. Treasury or Agency obligations.
Income Tax Status — It is the fund’s policy to distribute substantially all net investment income and net realized gains to shareholders and to otherwise qualify as a regulated investment company under provisions of the Internal Revenue Code. Accordingly, no provision has been made for income taxes. The fund files U.S. federal, state, local and non-U.S. tax returns as applicable. The fund's tax returns are subject to examination by the relevant taxing authority until expiration of the applicable statute of limitations, which is generally three years from the date of filing but can be longer in certain jurisdictions. At this time, management believes there are no uncertain tax positions which, based on their technical merit, would not be sustained upon examination and for which it is reasonably possible that the total amounts of unrecognized tax benefits will significantly change in the next twelve months.
Multiple Class — All shares of the fund represent an equal pro rata interest in the net assets of the class to which such shares belong, and have identical voting, dividend, liquidation and other rights and the same terms and conditions, except for class specific expenses and exclusive rights to vote on matters affecting only individual classes. Income, non-class specific expenses, and realized and unrealized capital gains and losses of the fund are allocated to each class of shares based on their relative net assets.
Distributions to Shareholders — Distributions from net investment income and net realized gains, if any, are generally declared and paid annually.
Indemnifications — Under the corporation’s organizational documents, its officers and directors are indemnified against certain liabilities arising out of the performance of their duties to the fund. In addition, in the normal course of business, the fund enters into contracts that provide general indemnifications. The maximum exposure under these arrangements is unknown as this would involve future claims that may be made against a fund. The risk of material loss from such claims is considered by management to be remote.
3. Fees and Transactions with Related Parties
Certain officers and directors of the corporation are also officers and/or directors of American Century Companies, Inc. (ACC). The corporation’s investment advisor, ACIM, the corporation's distributor, American Century Investment Services, Inc. (ACIS), and the corporation’s transfer agent, American Century Services, LLC, are wholly owned, directly or indirectly, by ACC.
Management Fees — The corporation has entered into a management agreement with ACIM, under which ACIM provides the fund with investment advisory and management services in exchange for a single, unified management fee (the fee) per class. The agreement provides that all expenses of managing and operating the fund, except distribution and service fees, brokerage expenses, taxes, interest, fees and expenses of the independent directors (including legal counsel fees), and extraordinary expenses, will be paid by ACIM. The fee is computed and accrued daily based on each class’s daily net assets and paid monthly in arrears. The rate of the fee is determined by applying a fee rate calculation formula. This formula takes into account the fund’s assets as well as certain assets, if any, of other clients of the investment advisor outside the American Century Investments family of funds (such as subadvised funds and separate accounts) that have very similar investment teams and investment strategies (strategy assets). The annual management fee schedule ranges from 0.80% to 1.10% for the Investor Class, R Class and Advisor Class. The annual management fee schedule ranges from 0.60% to 0.90% for the Institutional Class. The effective annual management fee for each class for the year ended July 31, 2014 was 1.10% for the Investor Class, R Class and Advisor Class and 0.90% for the Institutional Class.
Distribution and Service Fees — The Board of Directors has adopted a separate Master Distribution and Individual Shareholder Services Plan for each of the R Class and Advisor Class (collectively the plans), pursuant to Rule 12b-1 of the 1940 Act. The plans provide that the R Class will pay ACIS an annual distribution and service fee of 0.50%. The plans provide that the Advisor Class will pay ACIS an annual distribution and service fee of 0.25%. The fees are computed and accrued daily based on each class’s daily net assets and paid monthly in arrears. The fees are used to pay financial intermediaries for distribution and individual shareholder services. Fees incurred under the plans during the year ended July 31, 2014 are detailed in the Statement of Operations.
Directors' Fees and Expenses — The Board of Directors is responsible for overseeing the investment advisor’s management and operations of the fund. The directors receive detailed information about the fund and its investment advisor regularly throughout the year, and meet at least quarterly with management of the investment advisor to review reports about fund operations. Fees and expenses incurred in conjunction with the directors during the year ended July 31, 2014 are detailed in the Statement of Operations. The fund’s officers do not receive compensation from the fund.
4. Investment Transactions
Purchases and sales of investment securities, excluding short-term investments, for the year ended July 31, 2014 were $30,721,538 and $27,138,225, respectively.
5. Capital Share Transactions
The corporation is authorized to issue 3,000,000,000 shares. Transactions in shares of the fund were as follows:
|
| | | | | | | | | | |
| | Year ended July 31, 2014 | Year ended July 31, 2013 |
| | Shares | Amount | Shares | Amount |
| Investor Class | | | | |
| Sold | 507,172 |
| $ | 7,734,709 |
| 324,485 |
| $ | 4,182,973 |
|
| Issued in reinvestment of distributions | 7,242 |
| 105,957 |
| 14,868 |
| 164,142 |
|
| Redeemed | (317,893 | ) | (4,740,443 | ) | (240,497 | ) | (2,846,327 | ) |
| | 196,521 |
| 3,100,223 |
| 98,856 |
| 1,500,788 |
|
| Institutional Class | | | | |
| Issued in reinvestment of distributions | 13 |
| 196 |
| 32 |
| 344 |
|
| R Class | | | | |
| Sold | 25,303 |
| 400,857 |
| — |
| — |
|
| Issued in reinvestment of distributions | 7 |
| 99 |
| 30 |
| 329 |
|
| | 25,310 |
| 400,956 |
| 30 |
| 329 |
|
| Advisor Class | | | | |
| Sold | 62,003 |
| 971,139 |
| 3,763 |
| 47,769 |
|
| Issued in reinvestment of distributions | 122 |
| 1,779 |
| 369 |
| 4,049 |
|
| Redeemed | (34,628 | ) | (553,868 | ) | (9,539 | ) | (112,360 | ) |
| | 27,497 |
| 419,050 |
| (5,407 | ) | (60,542 | ) |
| Net increase (decrease) | 249,341 |
| $ | 3,920,425 |
| 93,511 |
| $ | 1,440,919 |
|
6. Fair Value Measurements
The fund’s investments valuation process is based on several considerations and may use multiple inputs to determine the fair value of the investments held by the fund. In conformity with accounting principles generally accepted in the United States of America, the inputs used to determine a valuation are classified into three broad levels.
| |
| • | Level 1 valuation inputs consist of unadjusted quoted prices in an active market for identical investments. |
| |
| • | Level 2 valuation inputs consist of direct or indirect observable market data (including quoted prices for comparable investments, evaluations of subsequent market events, interest rates, prepayment speeds, credit risk, etc.). These inputs also consist of quoted prices for identical investments initially expressed in local currencies that are adjusted through translation into U.S. dollars. |
| |
| • | Level 3 valuation inputs consist of unobservable data (including a fund’s own assumptions). |
The level classification is based on the lowest level input that is significant to the fair valuation measurement. The valuation inputs are not necessarily an indication of the risks associated with investing in these securities or other financial instruments.
The following is a summary of the level classifications as of period end. The Schedule of Investments provides additional information on the fund’s portfolio holdings.
|
| | | | | | | | |
| | Level 1 | Level 2 | Level 3 |
| Assets | | | |
| Investment Securities |
| Common Stocks | $ | 15,372,216 |
| — |
| — |
|
| Temporary Cash Investments | 282,589 |
| $ | 246,358 |
| — |
|
| | $ | 15,654,805 |
| $ | 246,358 |
| — |
|
7. Risk Factors
The fund’s investment process may result in high portfolio turnover, which could mean high transaction costs, affecting both performance and capital gains tax liabilities to investors.
8. Federal Tax Information
The tax character of distributions paid during the years ended July 31, 2014 and July 31, 2013 were as follows:
|
| | | | | | |
| | 2014 | 2013 |
| Distributions Paid From |
| Ordinary income | $ | 112,659 |
| $ | 179,329 |
|
| Long-term capital gains | — |
| — |
|
The book-basis character of distributions made during the year from net investment income or net realized gains may differ from their ultimate characterization for federal income tax purposes. These differences reflect the differing character of certain income items and net realized gains and losses for financial statement and tax purposes, and may result in reclassification among certain capital accounts on the financial statements.
As of July 31, 2014, the federal tax cost of investments and the components of distributable earnings on a tax-basis were as follows:
|
| | | |
| Federal tax cost of investments | $ | 14,815,168 |
|
| Gross tax appreciation of investments | $ | 1,214,633 |
|
| Gross tax depreciation of investments | (128,638 | ) |
| Net tax appreciation (depreciation) of investments | 1,085,995 |
|
| Undistributed ordinary income | $ | 169,463 |
|
| Accumulated short-term capital losses | $ | (9,490,903 | ) |
The difference between book-basis and tax-basis unrealized appreciation (depreciation) is attributable primarily to the tax deferral of losses on wash sales and timing and recognition of partnership income.
Accumulated capital losses represent net capital loss carryovers that may be used to offset future realized capital gains for federal income tax purposes. Future capital loss carryover utilization in any given year may be subject to Internal Revenue Code limitations. Capital loss carryovers of $(5,149,685) and $(4,341,218) expire in 2017 and 2018, respectively.
|
| | | | | | | | | | | | | |
| For a Share Outstanding Throughout the Years Ended July 31 (except as noted) |
| Per-Share Data | Ratios and Supplemental Data |
| | | Income From Investment Operations: | | | | Ratio to Average Net Assets of: | | |
| | Net Asset Value, Beginning of Period | Net Investment Income (Loss)(1) | Net Realized and Unrealized Gain (Loss) | Total From Investment Operations | Distributions From Net Investment Income | Net Asset Value, End of Period | Total Return(2) | Operating Expenses | Net Investment Income (Loss) | Portfolio Turnover Rate | Net Assets, End of Period (in thousands) |
| Investor Class |
| 2014 | $13.61 | 0.22 | 2.37 | 2.59 | (0.14) | $16.06 | 19.16% | 1.10% | 1.46% | 228% |
| $14,829 |
|
| 2013 | $11.11 | 0.17 | 2.62 | 2.79 | (0.29) | $13.61 | 25.74% | 1.11% | 1.39% | 253% |
| $9,897 |
|
| 2012 | $10.65 | 0.25 | 0.33 | 0.58 | (0.12) | $11.11 | 5.54% | 1.11% | 2.39% | 243% |
| $6,975 |
|
| 2011 | $9.15 | 0.11 | 1.53 | 1.64 | (0.14) | $10.65 | 18.07% | 1.11% | 1.04% | 271% |
| $7,638 |
|
| 2010 | $8.31 | 0.11 | 0.73 | 0.84 | —(3) | $9.15 | 10.14% | 1.11% | 1.19% | 242% |
| $10,272 |
|
| Institutional Class |
| 2014 | $13.67 | 0.25 | 2.37 | 2.62 | (0.17) | $16.12 | 19.32% | 0.90% | 1.66% | 228% |
| $18 |
|
| 2013 | $11.14 | 0.19 | 2.65 | 2.84 | (0.31) | $13.67 | 26.19% | 0.91% | 1.59% | 253% |
| $15 |
|
| 2012 | $10.69 | 0.27 | 0.32 | 0.59 | (0.14) | $11.14 | 5.64% | 0.91% | 2.59% | 243% |
| $12 |
|
| 2011 | $9.18 | 0.13 | 1.54 | 1.67 | (0.16) | $10.69 | 18.36% | 0.91% | 1.24% | 271% |
| $33 |
|
| 2010 | $8.34 | 0.13 | 0.73 | 0.86 | (0.02) | $9.18 | 10.33% | 0.91% | 1.39% | 242% |
| $34 |
|
|
| | | | | | | | | | | | | |
| For a Share Outstanding Throughout the Years Ended July 31 (except as noted) |
| Per-Share Data | Ratios and Supplemental Data |
| | | Income From Investment Operations: | | | | Ratio to Average Net Assets of: | | |
| | Net Asset Value, Beginning of Period | Net Investment Income (Loss)(1) | Net Realized and Unrealized Gain (Loss) | Total From Investment Operations | Distributions From Net Investment Income | Net Asset Value, End of Period | Total Return(2) | Operating Expenses | Net Investment Income (Loss) | Portfolio Turnover Rate | Net Assets, End of Period (in thousands) |
| R Class |
| 2014 | $13.43 | 0.06 | 2.42 | 2.48 | (0.07) | $15.84 | 18.51% | 1.60% | 0.96% | 228% |
| $423 |
|
| 2013 | $10.96 | 0.11 | 2.60 | 2.71 | (0.24) | $13.43 | 25.20% | 1.61% | 0.89% | 253% |
| $19 |
|
| 2012 | $10.51 | 0.20 | 0.32 | 0.52 | (0.07) | $10.96 | 4.98% | 1.61% | 1.89% | 243% |
| $15 |
|
| 2011 | $9.03 | 0.05 | 1.52 | 1.57 | (0.09) | $10.51 | 17.49% | 1.61% | 0.54% | 271% |
| $18 |
|
| 2010 | $8.24 | 0.06 | 0.73 | 0.79 | — | $9.03 | 9.59% | 1.61% | 0.69% | 242% |
| $16 |
|
| Advisor Class |
| 2014 | $13.53 | 0.16 | 2.37 | 2.53 | (0.11) | $15.95 | 18.75% | 1.35% | 1.21% | 228% |
| $664 |
|
| 2013 | $11.03 | 0.14 | 2.62 | 2.76 | (0.26) | $13.53 | 25.62% | 1.36% | 1.14% | 253% |
| $191 |
|
| 2012 | $10.58 | 0.23 | 0.31 | 0.54 | (0.09) | $11.03 | 5.21% | 1.36% | 2.14% | 243% |
| $215 |
|
| 2011 | $9.09 | 0.06 | 1.55 | 1.61 | (0.12) | $10.58 | 17.78% | 1.36% | 0.79% | 271% |
| $399 |
|
| 2010 | $8.28 | 0.08 | 0.73 | 0.81 | — | $9.09 | 9.78% | 1.36% | 0.94% | 242% |
| $68 |
|
|
|
Notes to Financial Highlights
|
| |
| (1) | Computed using average shares outstanding throughout the period. |
| |
| (2) | Total returns are calculated based on the net asset value of the last business day. Total returns for periods less than one year are not annualized. |
| |
| (3) | Per-share amount was less than $0.005. |
See Notes to Financial Statements.
|
|
| Report of Independent Registered Public Accounting Firm |
To the Board of Directors and Shareholders of
American Century Growth Funds, Inc.:
We have audited the accompanying statement of assets and liabilities, including the schedule of investments, of Legacy Focused Large Cap Fund (the “Fund”), one of the funds constituting American Century Growth Funds, Inc., as of July 31, 2014, and the related statement of operations for the year then ended, the statements of changes in net assets for each of the two years in the period then ended, and the financial highlights for each of the periods presented. These financial statements and financial highlights are the responsibility of the Fund's management. Our responsibility is to express an opinion on these financial statements and financial highlights based on our audits.
We conducted our audits in accordance with the standards of the Public Company Accounting Oversight Board (United States). Those standards require that we plan and perform the audit to obtain reasonable assurance about whether the financial statements and financial highlights are free of material misstatement. The Fund is not required to have, nor were we engaged to perform, an audit of its internal control over financial reporting. Our audits included consideration of internal control over financial reporting as a basis for designing audit procedures that are appropriate in the circumstances, but not for the purpose of expressing an opinion on the effectiveness of the Fund's internal control over financial reporting. Accordingly, we express no such opinion. An audit also includes examining, on a test basis, evidence supporting the amounts and disclosures in the financial statements, assessing the accounting principles used and significant estimates made by management, as well as evaluating the overall financial statement presentation. Our procedures included confirmation of securities owned as of July 31, 2014, by correspondence with the custodian and brokers; where replies were not received from brokers, we performed other auditing procedures. We believe that our audits provide a reasonable basis for our opinion.
In our opinion, the financial statements and financial highlights referred to above present fairly, in all material respects, the financial position of Legacy Focused Large Cap Fund of American Century Growth Funds, Inc. as of July 31, 2014, the results of its operations for the year then ended, the changes in its net assets for each of the two years in the period then ended, and the financial highlights for each of the periods presented, in conformity with accounting principles generally accepted in the United States of America.
Deloitte & Touche LLP
Kansas City, Missouri
September 17, 2014
The Board of Directors
The individuals listed below serve as directors of the funds. Each director will continue to serve in this capacity until death, retirement, resignation or removal from office. The board has adopted a mandatory retirement age for directors who are not “interested persons,” as that term is defined in the Investment Company Act (independent directors). Independent directors shall retire by December 31 of the year in which they reach their 75th birthday.
Mr. Thomas is an “interested person” because he currently serves as President and Chief Executive Officer of American Century Companies, Inc. (ACC), the parent company of American Century Investment Management, Inc. (ACIM or the advisor). Mr. Fink is treated as an “interested person” because of his recent employment with ACC and American Century Services, LLC (ACS). The other directors (more than three-fourths of the total number) are independent. They are not employees, directors or officers of, and have no financial interest in, ACC or any of its wholly owned, direct or indirect, subsidiaries, including ACIM, American Century Investment Services, Inc. (ACIS) and ACS, and do not have any other affiliations, positions, or relationships that would cause them to be considered “interested persons” under the Investment Company Act. The directors serve in this capacity for seven (in the case of Mr. Thomas, 15) registered investment companies in the American Century Investments family of funds.
The following table presents additional information about the directors. The mailing address for each director is 4500 Main Street, Kansas City, Missouri 64111.
|
| | | | | |
Name (Year of Birth) | Position(s) Held with Funds | Length of Time Served | Principal Occupation(s) During Past 5 Years | Number of American Century Portfolios Overseen by Director | Other Directorships Held During Past 5 Years |
| Independent Directors | | | | |
Thomas A. Brown (1940) | Director | Since 1980 | Managing Member, Associated Investments, LLC (real estate investment company); Brown Cascade Properties, LLC (real estate investment company) (2001 to 2009) | 73 | None |
Andrea C. Hall (1945) | Director | Since 1997 | Retired | 73 | None |
Jan M. Lewis (1957) | Director | Since 2011 | Retired; President and Chief Executive Officer, Catholic Charities of Northeast Kansas (human services organization) (2006 to 2013) | 73 | None |
James A. Olson (1942) | Director and Chairman of the Board | Since 2007 (Chairman since 2014) | Member, Plaza Belmont LLC (private equity fund manager) | 73 | Saia, Inc. (2002 to 2012) and EPR Properties (2003 to 2013) |
M. Jeannine Strandjord
(1945) | Director | Since 1994 | Retired | 73 | Euronet Worldwide Inc.; Charming Shoppes, Inc. (2006 to 2010); and DST Systems Inc. (1996
to 2012) |
|
| | | | | |
Name (Year of Birth) | Position(s) Held with Funds | Length of Time Served | Principal Occupation(s) During Past 5 Years | Number of American Century Portfolios Overseen by Director | Other Directorships Held During Past 5 Years |
| Independent Directors | | | | |
John R. Whitten (1946) | Director | Since 2008 | Retired | 73 | Rudolph Technologies, Inc. |
Stephen E. Yates (1948) | Director | Since 2012 | Retired; Executive Vice President, Technology & Operations, KeyCorp. (computer services) (2004 to 2010) | 73 | Applied Industrial Technologies, Inc. (2001 to 2010) |
| Interested Directors | | | | |
Barry Fink (1955) | Director | Since 2012 | Retired; Executive Vice President, ACC (September 2007 to February 2013); President, ACS (October 2007 to February 2013); Chief Operating Officer, ACC (September 2007 to November 2012) | 73 | None |
Jonathan S. Thomas (1963) | Director and President | Since 2007 | President and Chief Executive Officer, ACC (March 2007 to present). Also serves as Chief Executive Officer, ACS; Executive Vice President, ACIM; Director, ACC, ACIM and other ACC subsidiaries | 118 | BioMed Valley Discoveries, Inc. |
The Statement of Additional Information has additional information about the fund's directors and is available without charge, upon request, by calling 1-800-345-2021.
Officers
The following table presents certain information about the executive officers of the funds. Each officer serves as an officer for each of the 15 investment companies in the American Century family of funds, unless otherwise noted. No officer is compensated for his or her service as an officer of the funds. The listed officers are interested persons of the funds and are appointed or re-appointed on an annual basis. The mailing address for each officer listed below is 4500 Main Street, Kansas City, Missouri 64111.
|
| | |
Name (Year of Birth) | Offices with the Funds | Principal Occupation(s) During the Past Five Years |
Jonathan S. Thomas (1963) | Director and President since 2007 | President and Chief Executive Officer, ACC (March 2007 to present). Also serves as Chief Executive Officer, ACS; Executive Vice President, ACIM; Director, ACC, ACIM and other ACC subsidiaries |
Amy D. Shelton
(1964) | Chief Compliance
Officer since 2014 | Chief Compliance Officer, American Century funds, (March 2014 to present); Chief Compliance Officer, ACIM (February 2014 to present); Chief Compliance Officer, ACIS (October 2009 to present); Vice President, Client Interactions and Marketing, ACIS (February 2013 to January 2014); Director, Client Interactions and Marketing, ACIS (June 2007 to January 2013). Also serves as Vice President, ACIS |
Charles A. Etherington (1957) | General Counsel since 2007 and Senior Vice President since 2006 | Attorney, ACC (February 1994 to present); Vice President, ACC (November 2005 to present); General Counsel, ACC (March 2007 to present). Also serves as General Counsel, ACIM, ACS, ACIS and other ACC subsidiaries; and Senior Vice President, ACIM and ACS |
C. Jean Wade (1964) | Vice President, Treasurer and Chief Financial Officer since 2012 | Vice President, ACS (February 2000 to present) |
Robert J. Leach (1966) | Vice President since 2006 and Assistant Treasurer since 2012 | Vice President, ACS (February 2000 to present) |
David H. Reinmiller (1963) | Vice President since 2000 | Attorney, ACC (January 1994 to present); Associate General Counsel, ACC (January 2001 to present). Also serves as Vice President, ACIM and ACS |
Ward D. Stauffer (1960) | Secretary since 2005 | Attorney, ACC (June 2003 to present) |
|
|
| Approval of Management Agreement |
At a meeting held on June 18, 2014, the Fund’s Board of Directors unanimously approved the renewal of the management agreement pursuant to which American Century Investment Management, Inc. (the “Advisor”) acts as the investment advisor for the Fund. Under Section 15(c) of the Investment Company Act, contracts for investment advisory services are required to be reviewed, evaluated, and approved by a majority of a fund’s directors (the “Directors”), including a majority of the independent Directors, each year.
Prior to its consideration of the renewal of the management agreement, the Board requested and reviewed extensive data and information compiled by the Advisor and certain independent providers of evaluation data concerning the Fund and the services provided to the Fund by the Advisor. This review was in addition to the oversight and evaluation undertaken by the Board and its committees on a continuous basis and the information received was supplemental to the extensive information that the Board and its committees receive and consider throughout the year.
In connection with its consideration of the renewal of the management agreement, the Board’s review and evaluation of the services provided by the Advisor included, but was not limited to, the following:
| |
| • | the nature, extent, and quality of investment management, shareholder services, and other services provided by the Advisor to the Fund; |
| |
| • | the wide range of other programs and services the Advisor provides to the Fund and its shareholders on a routine and non-routine basis; |
| |
| • | the Fund’s investment performance compared to appropriate benchmarks and/or a peer group of other mutual funds with similar investment objectives and strategies; |
| |
| • | the cost of owning the Fund compared to the cost of owning similar funds; |
| |
| • | the Advisor’s compliance policies, procedures, and regulatory experience; |
| |
| • | financial data showing the cost of services provided to the Fund, the profitability of the Fund to the Advisor, and the overall profitability of the Advisor; |
| |
| • | possible economies of scale associated with the Advisor’s management of the Fund and other accounts under its management; |
| |
| • | the services provided and charges to other investment management clients of the Advisor |
| |
| • | acquired fund fees and expenses; and |
| |
| • | any collateral benefits derived by the Advisor from the management of the Fund. |
In keeping with its practice, the Board held two in-person meetings and one telephonic meeting to review and discuss the information provided. The independent Directors also had the benefit of the advice of their independent counsel throughout the process.
Factors Considered
The Directors considered all of the information provided by the Advisor, the independent data providers, and independent counsel, and evaluated such information for the Fund. In connection with their review, the Directors did not identify any single factor as being all-important or controlling, and each Director may have attributed different levels of importance to different factors. In deciding to renew the management agreement, the Board based its decision on a number of factors, including the following:
Nature, Extent and Quality of Services — Generally. Under the management agreement, the Advisor is responsible for providing or arranging for all services necessary for the operation of the Fund. The Board noted that under the management agreement, the Advisor provides or arranges at its own expense a wide variety of services including:
| |
| • | constructing and designing the Fund |
| |
| • | portfolio research and security selection |
| |
| • | initial capitalization/funding |
| |
| • | daily valuation of the Fund’s portfolio |
| |
| • | shareholder servicing and transfer agency, including shareholder confirmations, recordkeeping, and communications |
| |
| • | legal services (except the independent Directors’ counsel) |
| |
| • | regulatory and portfolio compliance |
| |
| • | marketing and distribution (except Rule 12b-1 plans) |
The Board noted that many of these services have expanded over time both in terms of quantity and complexity in response to shareholder demands, competition in the industry, changing distribution channels, and the changing regulatory environment.
Investment Management Services. The nature of the investment management services provided to the Fund is quite complex and allows Fund shareholders access to professional money management, instant diversification of their investments within an asset class, the opportunity to easily diversify among asset classes by investing in or exchanging among various American Century Investments funds, and liquidity. In evaluating investment performance, the Board expects the Advisor to manage the Fund in accordance with its investment objectives and approved strategies. Further, the Directors recognize that the Advisor has an obligation to monitor trading activities, and in particular to seek the best execution of fund trades, and to evaluate the use of and payment for research. In providing these services, the Advisor utilizes teams of investment professionals (portfolio managers, analysts, research assistants, and securities traders) who require extensive information technology, research, training, compliance and other systems to conduct their business. The Board, directly and through its Fund Performance Review Committee, regularly reviews investment performance information for the Fund, together with comparative information for appropriate benchmarks and/or peer groups of similarly-managed funds, over different time horizons. The Directors also review detailed performance information during the management agreement approval process. If performance concerns are identified, the Fund receives special reviews until performance improves, during which the Board discusses with the Advisor the reasons for such results (e.g., market conditions, security selection) and any efforts being undertaken to improve performance. The Fund’s performance was above its benchmark for the one- and three-year periods and below its benchmark for the five-year period reviewed by the Board. Taking all these factors into consideration, the Board found the investment management services provided by the Advisor to the Fund to be satisfactory and consistent with the management agreement.
Shareholder and Other Services. Under the management agreement, the Advisor provides the Fund with a comprehensive package of transfer agency, shareholder, and other services. The Board, directly and through various committees of the Board, regularly reviews reports and evaluations of such services at its regular meetings. These reports include, but are not limited to, information regarding the operational efficiency and accuracy of the shareholder and transfer agency services provided, staffing levels, shareholder satisfaction (as measured by external as well as internal sources), technology support, new products and services offered to Fund shareholders, securities trading activities, portfolio valuation services, auditing services, and legal and operational compliance activities. Certain aspects of shareholder and transfer agency service level efficiency and the quality of securities trading activities are measured by independent third party providers
and are presented in comparison to other fund groups not managed by the Advisor. The Board found the services provided by the Advisor to the Fund under the management agreement to be competitive and of high quality.
Costs of Services and Profitability. The Advisor provides detailed information concerning its cost of providing various services to the Fund, its profitability in managing the Fund (pre- and post-distribution), its overall profitability, and its financial condition. The Directors have reviewed with the Advisor the methodology used to prepare this financial information. The financial information regarding the Advisor is considered in evaluating the Advisor’s financial condition, its ability to continue to provide services under the management agreement, and the reasonableness of the current management fee. The Board concluded that the Advisor’s profits were reasonable in light of the services provided to the Fund.
Ethics. The Board generally considers the Advisor’s commitment to providing quality services to shareholders and to conducting its business ethically. They noted that the Advisor’s practices generally meet or exceed industry best practices.
Economies of Scale. The Board also reviewed information provided by the Advisor regarding the possible existence of economies of scale in connection with the management of the Fund. The Board concluded that economies of scale are difficult to measure and predict with precision, especially on a fund-by-fund basis. The Board concluded that the Advisor is appropriately sharing economies of scale through its competitive fee structure, offering competitive fees from fund inception, and through reinvestment in its business to provide shareholders additional content and services.
Comparison to Other Funds’ Fees. The management agreement provides that the Fund pays the Advisor a single, all-inclusive (or unified) management fee for providing all services necessary for the management and operation of the Fund, other than brokerage expenses, taxes, interest, extraordinary expenses, and the fees and expenses of the Fund’s independent directors (including their independent legal counsel) and expenses incurred in connection with the provision of shareholder services and distribution services under a plan adopted pursuant to Rule 12b-1 under the 1940 Act. Under the unified fee structure, the Advisor is responsible for providing all investment advisory, custody, audit, administrative, compliance, recordkeeping, marketing and shareholder services, or arranging and supervising third parties to provide such services. By contrast, most other funds are charged a variety of fees, including an investment advisory fee, a transfer agency fee, an administrative fee, distribution charges and other expenses. Other than their investment advisory fees and any applicable Rule 12b-1 distribution fees, all other components of the total fees charged by these other funds may be increased without shareholder approval. The Board believes the unified fee structure is a benefit to Fund shareholders because it clearly discloses to shareholders the cost of owning Fund shares, and, since the unified fee cannot be increased without a vote of Fund shareholders, it shifts to the Advisor the risk of increased costs of operating the Fund and provides a direct incentive to minimize administrative inefficiencies. Part of the Board’s analysis of fee levels involves reviewing certain evaluative data compiled by an independent provider comparing the Fund’s unified fee to the total expense ratios of its peers. The unified fee charged to shareholders of the Fund was above the median of the total expense ratios of the Fund’s peer expense universe and was within the range of its peer expense group. The Board concluded that the management fee paid by the Fund to the Advisor under the management agreement is reasonable in light of the services provided to the Fund.
Comparison to Fees and Services Provided to Other Clients of the Advisor. The Board also requested and received information from the Advisor concerning the nature of the services, fees, costs and profitability of its advisory services to advisory clients other than the Fund. They observed that these varying types of client accounts require different services and involve different regulatory and entrepreneurial risks than the management of the Fund. The Board analyzed this information and concluded that the fees charged and services provided to the Fund were reasonable by comparison.
Collateral or “Fall-Out” Benefits Derived by the Advisor. The Board considered the existence of collateral benefits the Advisor may receive as a result of its relationship with the Fund. They concluded that the Advisor’s primary business is managing mutual funds and it generally does not use fund or shareholder information to generate profits in other lines of business, and therefore does not derive any significant collateral benefits from them. The Board noted that the Advisor receives proprietary research from broker-dealers that execute fund portfolio transactions and concluded that this research is likely to benefit Fund shareholders. The Board also determined that the Advisor is able to provide investment management services to certain clients other than the Fund, at least in part, due to its existing infrastructure built to serve the fund complex. The Board concluded, however, that the assets of those other clients are not material to the analysis and, where applicable, may be included with the assets of the Fund to determine breakpoints in the management fee schedule.
Existing Relationship. The Board also considered whether there was any reason for not continuing the existing arrangement with the Advisor. In this regard, the Board was mindful of the potential disruptions of the Fund’s operations and various risks, uncertainties, and other effects that could occur as a result of a decision not to continue such relationship. In particular, the Board recognized that most shareholders have invested in the Fund on the strength of the Advisor’s industry standing and reputation and in the expectation that the Advisor will have a continuing role in providing advisory services to the Fund.
Conclusion of the Directors. As a result of this process, the Board, including all of the independent Directors, taking into account all of the factors discussed above and the information provided by the Advisor and others, concluded that the management agreement between the Fund and the Advisor is fair and reasonable in light of the services provided and should be renewed.
Retirement Account Information
As required by law, distributions you receive from certain IRAs are subject to federal income tax withholding, unless you elect not to have withholding apply. Tax will be withheld on the total amount withdrawn even though you may be receiving amounts that are not subject to withholding, such as nondeductible contributions. In such case, excess amounts of withholding could occur. You may adjust your withholding election so that a greater or lesser amount will be withheld.
If you don’t want us to withhold on this amount, you must notify us to not withhold the federal income tax. You may notify us in writing or in certain situations by telephone or through other electronic means. For systematic withdrawals, your withholding election will remain in effect until revoked or changed by filing a new election. You have the right to revoke your election at any time.
Remember, even if you elect not to have income tax withheld, you are liable for paying income tax on the taxable portion of your withdrawal. If you elect not to have income tax withheld or you don’t have enough income tax withheld, you may be responsible for payment of estimated tax. You may incur penalties under the estimated tax rules if your withholding and estimated tax payments are not sufficient. You can reduce or defer the income tax on a distribution by directly or indirectly rolling such distribution over to another IRA or eligible plan. You should consult your tax advisor for additional information.
State tax will be withheld if, at the time of your distribution, your address is within one of the mandatory withholding states and you have federal income tax withheld (or as otherwise required by state law). State taxes will be withheld from your distribution in accordance with the respective state rules.
Distributions you receive from 403(b), 457 and qualified plans are subject to special tax and withholding rules. Your plan administrator or plan sponsor is required to provide you with a special tax notice explaining those rules at the time you request a distribution. If applicable, federal and/or state taxes may be withheld from your distribution amount.
Proxy Voting Policies
A description of the policies that the fund's investment advisor uses in exercising the voting rights associated with the securities purchased and/or held by the fund is available without charge, upon request, by calling 1-800-345-2021. It is also available on the "About Us" page of American Century Investments’ website at americancentury.com and on the Securities and Exchange Commission’s website at sec.gov. Information regarding how the investment advisor voted proxies relating to portfolio securities during the most recent 12-month period ended June 30 is available on the "About Us" page at americancentury.com. It is also available at sec.gov.
Quarterly Portfolio Disclosure
The fund files its complete schedule of portfolio holdings with the Securities and Exchange Commission (SEC) for the first and third quarters of each fiscal year on Form N-Q. The fund’s Forms N-Q are available on the SEC’s website at sec.gov, and may be reviewed and copied at the SEC’s Public Reference Room in Washington, DC. Information on the operation of the Public Reference Room may be obtained by calling 1-800-SEC-0330. The fund also makes its complete schedule of portfolio holdings for the most recent quarter of its fiscal year available on its
website at americancentury.com and, upon request, by calling 1-800-345-2021.
Other Tax Information
The following information is provided pursuant to provisions of the Internal Revenue Code.
The fund hereby designates up to the maximum amount allowable as qualified dividend income for the fiscal year ended July 31, 2014.
For corporate taxpayers, the fund hereby designates $112,659, or up to the maximum amount allowable, of ordinary income distributions paid during the fiscal year ended July 31, 2014 as qualified for the corporate dividends received deduction.
|
| | |
| |
| | | |
| Contact Us | americancentury.com | |
| Automated Information Line | 1-800-345-8765 | |
| Investor Services Representative | 1-800-345-2021
or 816-531-5575 | |
| Investors Using Advisors | 1-800-378-9878 | |
| Business, Not-For-Profit, Employer-Sponsored Retirement Plans | 1-800-345-3533 | |
| Banks and Trust Companies, Broker-Dealers, Financial Professionals, Insurance Companies | 1-800-345-6488 | |
| Telecommunications Relay Service for the Deaf | 711 | |
| | | |
| American Century Growth Funds, Inc. | |
| | | |
Investment Advisor: American Century Investment Management, Inc. Kansas City, Missouri | |
| | | |
| This report and the statements it contains are submitted for the general information of our shareholders. The report is not authorized for distribution to prospective investors unless preceded or accompanied by an effective prospectus. | |
| | | |
©2014 American Century Proprietary Holdings, Inc. All rights reserved. CL-ANN-83141 1409 | |
|
| |
ANNUAL REPORT | JULY 31, 2014 |
Legacy Large Cap Fund
|
| |
| President’s Letter | |
| Performance | |
| Portfolio Commentary | |
| Fund Characteristics | |
| Shareholder Fee Example | |
| Schedule of Investments | |
| Statement of Assets and Liabilities | |
| Statement of Operations | |
| Statement of Changes in Net Assets | |
| Notes to Financial Statements | |
| Financial Highlights | |
| Report of Independent Registered Public Accounting Firm | |
| Management | |
| Approval of Management Agreement | |
| Additional Information | |
Any opinions expressed in this report reflect those of the author as of the date of the report, and do not necessarily represent the opinions of American Century Investments® or any other person in the American Century Investments organization. Any such opinions are subject to change at any time based upon market or other conditions and American Century Investments disclaims any responsibility to update such opinions. These opinions may not be relied upon as investment advice and, because investment decisions made by American Century Investments funds are based on numerous factors, may not be relied upon as an indication of trading intent on behalf of any American Century Investments fund. Security examples are used for representational purposes only and are not intended as recommendations to purchase or sell securities. Performance information for comparative indices and securities is provided to American Century Investments by third party vendors. To the best of American Century Investments’ knowledge, such information is accurate at the time of printing.
|
| |
| Dear Investor:
Thank you for reviewing this annual report for the 12 months ended July 31, 2014. It provides investment performance and portfolio information for the reporting period, plus longer-term historical performance data.
Annual reports remain important vehicles for conveying information about fund returns, including market and economic factors that affected performance during the reporting period. For additional, updated investment and market insights, we encourage you to visit our website, americancentury.com.
|
| Jonathan Thomas |
Aggressive Monetary Policies, as Investors Sought Risk and Yield, Boosted Returns
Stimulative monetary policies and expectations of longer-term economic improvement, interspersed with concerns about nearer-term weaker-than-expected economic data and geopolitical conflicts, helped drive financial market returns during the reporting period. We believe the combination of longer-term optimism about global economic growth, low costs of capital, and central bank purchases of fixed-income securities helped persuade investors to seek risk and yield. Broad stock market index returns were largely in the 10-20% range across the spectrum of developed versus emerging and large-cap versus small-cap markets. The S&P 500 Index, the MSCI EAFE Index, and the MSCI Emerging Markets Index advanced 16.94%, 15.07%, and 15.32%, respectively.
Bond performance was also generally solid, which was a surprise, given pre-2014 expectations for rising inflation and interest rates. Inflation showed signs of increasing, but remained contained, and interest rates actually fell in many markets. According to Bloomberg, the 10-year U.S. Treasury yield edged downward from 2.59% to 2.56% during the 12 months, while the 30-year U.S. Treasury yield fell from 3.65% to 3.32%. This “bull market flattening” of the U.S. Treasury yield curve helped produce a total return of 9.74% for the 30-year U.S. Treasury bond, according to Barclays. Indices that tracked U.S. high-yield and investment-grade corporate bonds and mortgage-backed securities also generally outperformed the broad Barclays U.S. Aggregate Bond Index, which advanced 3.97%.
Looking ahead, we see signs of sustained economic growth for the remainder of 2014, but headwinds persist. In the U.S., which was supposed to be an economic growth leader this year, housing market momentum has slowed, inflation and interest rates could rise, and economic growth and U.S. employment levels remain subpar compared with past post-recession periods. In this environment, we continue to believe in a disciplined, diversified, long-term investment approach, using professionally managed stock and bond portfolios—as appropriate—for meeting financial goals. We appreciate your continued trust in us.
Sincerely,
Jonathan Thomas
President and Chief Executive Officer
American Century Investments
|
| | | | | |
| Total Returns as of July 31, 2014 |
| | | | Average Annual Returns | |
| | Ticker Symbol | 1 year | 5 years | Since Inception | Inception Date |
| Investor Class | ACGOX | 17.87% | 15.86% | 7.76% | 5/31/06 |
| Russell 1000 Growth Index | — | 18.69% | 17.24% | 8.84% | — |
| Institutional Class | ACGHX | 18.12% | 16.10% | 7.97% | 5/31/06 |
| R Class | ACGEX | 17.28% | 15.29% | 7.22% | 5/31/06 |
| Advisor Class | ACGDX | 17.57% | 15.59% | 7.49% | 5/31/06 |
|
|
| Growth of $10,000 Over Life of Class |
| $10,000 investment made May 31, 2006 |
|
| |
| Value on July 31, 2014 |
| | Investor Class — $18,422 |
| |
| | Russell 1000 Growth Index — $19,982 |
| |
*From May 31, 2006, the Investor Class’s inception date. Not annualized.
|
| | | |
| Total Annual Fund Operating Expenses |
| Investor Class | Institutional Class | R Class | Advisor Class |
| 1.11% | 0.91% | 1.61% | 1.36% |
The total annual fund operating expenses shown is as stated in the fund’s prospectus current as of the date of this report. The prospectus may vary from the expense ratio shown elsewhere in this report because it is based on a different time period, includes acquired fund fees and expenses, and, if applicable, does not include fee waivers or expense reimbursements.
Data presented reflect past performance. Past performance is no guarantee of future results. Current performance may be higher or lower than the performance shown. Investment return and principal value will fluctuate, and redemption value may be more or less than original cost. To obtain performance data current to the most recent month end, please call 1-800-345-2021 or visit americancentury.com. The fund’s investment process may result in high portfolio turnover, which could mean high transaction costs, affecting both performance and capital gains tax liabilities to investors. International investing involves special risks, such as political instability and currency fluctuations.
Unless otherwise indicated, performance reflects Investor Class shares; performance for other share classes will vary due to differences in fee structure. For information about other share classes available, please consult the prospectus. Data assumes reinvestment of dividends and capital gains, and none of the charts reflect the deduction of taxes that a shareholder would pay on fund distributions or the redemption of fund shares. Returns for the index are provided for comparison. The fund’s total returns include operating expenses (such as transaction costs and management fees) that reduce returns, while the total returns of the index do not.
Portfolio Managers: John T. Small Jr. and Stephen Pool
Performance Summary
Legacy Large Cap returned 17.87%* for the 12 months ended July 31, 2014, trailing the 18.69% return of the portfolio’s benchmark, the Russell 1000 Growth Index.
As discussed in the President's Letter on page 2, U.S. stock indices delivered solid returns during the reporting period. Within the Russell 1000 Growth Index, energy stocks led the way with returns of nearly 30%. Information technology, health care, and materials stocks also performed better than the index average. Consumer staples and utilities were the weakest sectors, posting single-digit returns. Utilities, telecommunication services, consumer discretionary, financials, and industrials also lagged the overall index but registered double-digit gains.
Throughout the year, Legacy Large Cap’s management team continued to use its quantitative process to identify and evaluate the fundamental business prospects of its portfolio holdings and potential investments within the fund’s investment universe. Purchases and sales, as well as individual security and industry allocations, are the result of applying this process as company-specific and market events change. Legacy Large Cap performed well on an absolute basis but lagged its Russell 1000 Growth benchmark. Much of the relative underperformance was attributable to stock selection in the consumer discretionary sector, especially among internet and catalog retailers. Stock decisions and an overweight allocation to consumer staples also detracted. Stock choices in the information technology sector were the top contributors to fund performance versus the benchmark, led by holdings in the internet software and services industry. Stock selection and positioning in health care, especially pharmaceuticals, also aided results.
Consumer Sectors Hampered Results
The consumer discretionary and staples sectors were key detractors from relative performance. Retailers struggled with harsh weather and consumer confidence during the holiday season. Beauty products retailer Ulta Salon Cosmetics & Fragrances fell sharply in December after releasing a cautious outlook for the holiday season. Specialty retailers TJX and L Brands also weighed on results. Social media discounter Groupon was another significant detractor, continuing to decline as it shifts its business strategy. Coffee and brewing systems maker Keurig Green Mountain lagged after performing well in previous periods. We eliminated all of these holdings.
Stock selection in the energy sector hurt results but a major source of weakness was underweighting the strong energy equipment and services industry. Stock decisions in materials also detracted, led by International Paper, which suffered from a harsh winter that reduced demand for its containerboard. At the end of our reporting period, the company reported a solid rebound from that earlier weakness. The largest single detractor from relative results was our lighter-than-benchmark exposure to electronics giant Apple, which rose on positive company guidance, an announced stock buy-back plan, and a stock split.
Information Technology and Health Care Led Contributors
Information technology was the top sector contributor to performance versus the benchmark, led by internet software and services companies. Facebook posted strong profits and revenues and is experiencing larger-than-expected ad revenues from its mobile app. Data center firm Equinix was a
* All fund returns referenced in this commentary are for Investor Class shares. Performance for other share classes will vary due to differences in fee structure; when Investor Class performance exceeds that of the fund's benchmark, other share classes may not. See page 3 for returns for all share classes.
top contributor, as was computers and peripherals manufacturer SanDisk, which continues to benefit from improving margins and the broader trend toward flash-based data storage.
Stock selection in health care was a key source of relative outperformance. Forest Laboratories stock soared after Actavis announced in February that it would merge with Forest. That merger is now complete, and the fund holds Actavis. The merger is an innovative deal that allows Actavis to lever Forest’s current gastrointestinal business but also helps position the combined firm for the changing health care environment by lowering costs and combining sales forces.
Stock choices and positioning in telecommunication services and industrials helped results. Another key contributor, heavy equipment maker Caterpillar, stands to benefit from resurging construction in the U.S. and is also seeing positive results from restructuring. The company is aggressively buying back company stock as well.
Outlook
The U.S. economy appears headed for a sustained but moderate economic expansion, but there are headwinds both domestically and internationally. Whatever the conditions, Legacy Large Cap will continue to employ its disciplined investment approach that combines current market conditions with appropriate stock selection criteria to identify attractive opportunities. The quantitative model allows the management team to uncover large-cap investments across the growth and value spectrums.
|
| |
| JULY 31, 2014 |
| Top Ten Holdings | % of net assets |
| Lowe's Cos., Inc. | 2.0% |
| Actavis plc | 2.0% |
| AmerisourceBergen Corp. | 2.0% |
| SanDisk Corp. | 2.0% |
| Anadarko Petroleum Corp. | 2.0% |
| Seagate Technology plc | 2.0% |
| EMC Corp. | 2.0% |
| McDonald's Corp. | 2.0% |
| Palo Alto Networks, Inc. | 2.0% |
| Boeing Co. (The) | 2.0% |
| | |
| Top Five Industries | % of net assets |
| Technology Hardware, Storage and Peripherals | 8.1% |
| Pharmaceuticals | 7.7% |
| Communications Equipment | 5.6% |
| Internet Software and Services | 5.3% |
| Software | 5.1% |
| | |
| Types of Investments in Portfolio | % of net assets |
| Domestic Common Stocks | 92.5% |
| Foreign Common Stocks* | 5.3% |
| Total Common Stocks | 97.8% |
| Temporary Cash Investments | 19.8% |
| Other Assets and Liabilities | (17.6)%** |
*Includes depositary shares, dual listed securities and foreign ordinary shares.
**Amount relates primarily to payable for investments purchased, but not settled, at period end.
Fund shareholders may incur two types of costs: (1) transaction costs, including sales charges (loads) on purchase payments and redemption/exchange fees; and (2) ongoing costs, including management fees; distribution and service (12b-1) fees; and other fund expenses. This example is intended to help you understand your ongoing costs (in dollars) of investing in your fund and to compare these costs with the ongoing cost of investing in other mutual funds.
The example is based on an investment of $1,000 made at the beginning of the period and held for the entire period from February 1, 2014 to July 31, 2014.
Actual Expenses
The table provides information about actual account values and actual expenses for each class. You may use the information, together with the amount you invested, to estimate the expenses that you paid over the period. First, identify the share class you own. Then simply divide your account value by $1,000 (for example, an $8,600 account value divided by $1,000 = 8.6), then multiply the result by the number under the heading “Expenses Paid During Period” to estimate the expenses you paid on your account during this period.
If you hold Investor Class shares of any American Century Investments fund, or Institutional Class shares of the American Century Diversified Bond Fund, in an American Century Investments account (i.e., not a financial intermediary or retirement plan account), American Century Investments may charge you a $12.50 semiannual account maintenance fee if the value of those shares is less than $10,000. We will redeem shares automatically in one of your accounts to pay the $12.50 fee. In determining your total eligible investment amount, we will include your investments in all personal accounts (including American Century Investments Brokerage accounts) registered under your Social Security number. Personal accounts include individual accounts, joint accounts, UGMA/UTMA accounts, personal trusts, Coverdell Education Savings Accounts and IRAs (including traditional, Roth, Rollover, SEP-, SARSEP- and SIMPLE-IRAs), and certain other retirement accounts. If you have only business, business retirement, employer-sponsored or American Century Investments Brokerage accounts, you are currently not subject to this fee. If you are subject to the Account Maintenance Fee, your account value could be reduced by the fee amount.
Hypothetical Example for Comparison Purposes
The table also provides information about hypothetical account values and hypothetical expenses based on the actual expense ratio of each class of your fund and an assumed rate of return of 5% per year before expenses, which is not the actual return of a fund’s share class. The hypothetical account values and expenses may not be used to estimate the actual ending account balance or expenses you paid for the period. You may use this information to compare the ongoing costs of investing in your fund and other funds. To do so, compare this 5% hypothetical example with the 5% hypothetical examples that appear in the shareholder reports of the other funds.
Please note that the expenses shown in the table are meant to highlight your ongoing costs only and do not reflect any transactional costs, such as sales charges (loads) or redemption/exchange fees. Therefore, the table is useful in comparing ongoing costs only, and will not help you determine the relative total costs of owning different funds. In addition, if these transactional costs were included, your costs would have been higher.
|
| | | | |
| | Beginning Account Value 2/1/14 | Ending Account Value 7/31/14 | Expenses Paid During Period(1) 2/1/14 - 7/31/14 | Annualized Expense Ratio(1) |
| Actual |
| Investor Class | $1,000 | $1,086.30 | $5.69 | 1.10% |
| Institutional Class | $1,000 | $1,087.50 | $4.66 | 0.90% |
| R Class | $1,000 | $1,084.30 | $8.27 | 1.60% |
| Advisor Class | $1,000 | $1,086.00 | $6.98 | 1.35% |
| Hypothetical |
| Investor Class | $1,000 | $1,019.34 | $5.51 | 1.10% |
| Institutional Class | $1,000 | $1,020.33 | $4.51 | 0.90% |
| R Class | $1,000 | $1,016.86 | $8.00 | 1.60% |
| Advisor Class | $1,000 | $1,018.10 | $6.76 | 1.35% |
| |
| (1) | Expenses are equal to the class’s annualized expense ratio listed in the table above, multiplied by the average account value over the period, multiplied by 181, the number of days in the most recent fiscal half-year, divided by 365, to reflect the one-half year period. |
JULY 31, 2014
|
| | | | | |
| | Shares | Value |
| COMMON STOCKS — 97.8% | | |
| AEROSPACE AND DEFENSE — 2.0% | | |
| Boeing Co. (The) | 4,150 |
| $ | 499,992 |
|
| AIR FREIGHT AND LOGISTICS — 1.9% | | |
| United Parcel Service, Inc., Class B | 5,012 |
| 486,615 |
|
| AIRLINES — 1.2% | | |
| American Airlines Group, Inc. | 7,942 |
| 308,547 |
|
| AUTO COMPONENTS — 3.8% | | |
| Delphi Automotive plc | 7,432 |
| 496,458 |
|
| Magna International, Inc. | 4,285 |
| 460,209 |
|
| | | 956,667 |
|
| BEVERAGES — 3.5% | | |
Monster Beverage Corp.(1) | 6,190 |
| 395,912 |
|
| PepsiCo, Inc. | 5,468 |
| 481,731 |
|
| | | 877,643 |
|
| BIOTECHNOLOGY — 1.9% | | |
Alexion Pharmaceuticals, Inc.(1) | 2,986 |
| 474,744 |
|
| CAPITAL MARKETS — 1.6% | | |
Affiliated Managers Group, Inc.(1) | 1,983 |
| 395,113 |
|
| COMMUNICATIONS EQUIPMENT — 5.6% | | |
| Cisco Systems, Inc. | 16,197 |
| 408,650 |
|
Palo Alto Networks, Inc.(1) | 6,209 |
| 502,060 |
|
| QUALCOMM, Inc. | 6,653 |
| 490,326 |
|
| | | 1,401,036 |
|
| DIVERSIFIED TELECOMMUNICATION SERVICES — 2.0% | | |
| Verizon Communications, Inc. | 9,684 |
| 488,267 |
|
| ELECTRICAL EQUIPMENT — 1.4% | | |
| Emerson Electric Co. | 5,621 |
| 357,777 |
|
| ELECTRONIC EQUIPMENT, INSTRUMENTS AND COMPONENTS — 1.8% | |
| Hitachi Ltd. ADR | 5,572 |
| 440,801 |
|
| ENERGY EQUIPMENT AND SERVICES — 1.7% | | |
Weatherford International plc(1) | 18,527 |
| 414,449 |
|
| FOOD AND STAPLES RETAILING — 2.5% | | |
| Kroger Co. (The) | 5,991 |
| 293,439 |
|
| Wal-Mart Stores, Inc. | 4,549 |
| 334,716 |
|
| | | 628,155 |
|
| FOOD PRODUCTS — 1.9% | | |
| Kellogg Co. | 7,827 |
| 468,289 |
|
| HEALTH CARE PROVIDERS AND SERVICES — 4.0% | | |
| AmerisourceBergen Corp. | 6,589 |
| 506,760 |
|
| UnitedHealth Group, Inc. | 5,972 |
| 484,031 |
|
| | | 990,791 |
|
|
| | | | | |
| | Shares | Value |
| HOTELS, RESTAURANTS AND LEISURE — 3.6% | | |
| Las Vegas Sands Corp. | 5,371 |
| $ | 396,648 |
|
| McDonald's Corp. | 5,326 |
| 503,627 |
|
| | | 900,275 |
|
| HOUSEHOLD PRODUCTS — 1.5% | | |
| Colgate-Palmolive Co. | 5,753 |
| 364,740 |
|
| INTERNET AND CATALOG RETAIL — 3.7% | | |
Amazon.com, Inc.(1) | 1,592 |
| 498,280 |
|
JD.com, Inc. ADR(1) | 15,264 |
| 436,245 |
|
| | | 934,525 |
|
| INTERNET SOFTWARE AND SERVICES — 5.3% | | |
Equinix, Inc.(1) | 1,987 |
| 426,251 |
|
Facebook, Inc., Class A(1) | 6,567 |
| 477,093 |
|
Google, Inc., Class A(1) | 705 |
| 408,583 |
|
| | | 1,311,927 |
|
| IT SERVICES — 3.4% | | |
Cognizant Technology Solutions Corp., Class A(1) | 8,460 |
| 414,963 |
|
| International Business Machines Corp. | 2,215 |
| 424,549 |
|
| | | 839,512 |
|
| MACHINERY — 3.2% | | |
| Caterpillar, Inc. | 3,740 |
| 376,805 |
|
| PACCAR, Inc. | 6,743 |
| 419,887 |
|
| | | 796,692 |
|
| MEDIA — 4.0% | | |
Live Nation Entertainment, Inc.(1) | 21,314 |
| 494,698 |
|
| Time Warner Cable, Inc. | 3,414 |
| 495,371 |
|
| | | 990,069 |
|
| METALS AND MINING — 1.6% | | |
| Freeport-McMoRan, Inc. | 10,452 |
| 389,023 |
|
| OIL, GAS AND CONSUMABLE FUELS — 3.7% | | |
| Anadarko Petroleum Corp. | 4,739 |
| 506,362 |
|
| EOG Resources, Inc. | 3,902 |
| 427,035 |
|
| | | 933,397 |
|
| PAPER AND FOREST PRODUCTS — 2.0% | | |
| International Paper Co. | 10,253 |
| 487,017 |
|
| PHARMACEUTICALS — 7.7% | | |
| AbbVie, Inc. | 9,522 |
| 498,382 |
|
Actavis plc(1) | 2,376 |
| 509,082 |
|
Hospira, Inc.(1) | 8,262 |
| 458,293 |
|
| Questcor Pharmaceuticals, Inc. | 4,956 |
| 445,891 |
|
| | | 1,911,648 |
|
| PROFESSIONAL SERVICES — 1.6% | | |
IHS, Inc., Class A(1) | 3,128 |
| 410,925 |
|
| REAL ESTATE INVESTMENT TRUSTS (REITs) — 1.6% | | |
| General Growth Properties, Inc. | 17,562 |
| 410,424 |
|
|
| | | | | |
| | Shares | Value |
| SEMICONDUCTORS AND SEMICONDUCTOR EQUIPMENT — 0.9% | | |
Freescale Semiconductor Ltd.(1) | 11,750 |
| $ | 235,235 |
|
| SOFTWARE — 5.1% | | |
Electronic Arts, Inc.(1) | 11,484 |
| 385,862 |
|
| Microsoft Corp. | 10,875 |
| 469,365 |
|
| Oracle Corp. | 10,456 |
| 422,318 |
|
| | | 1,277,545 |
|
| SPECIALTY RETAIL — 2.0% | | |
| Lowe's Cos., Inc. | 10,680 |
| 511,038 |
|
| TECHNOLOGY HARDWARE, STORAGE AND PERIPHERALS — 8.1% | | |
| Apple, Inc. | 5,187 |
| 495,722 |
|
| EMC Corp. | 17,247 |
| 505,337 |
|
| SanDisk Corp. | 5,524 |
| 506,606 |
|
| Seagate Technology plc | 8,632 |
| 505,835 |
|
| | | 2,013,500 |
|
| TOBACCO — 2.0% | | |
| Philip Morris International, Inc. | 6,030 |
| 494,520 |
|
TOTAL COMMON STOCKS (Cost $23,010,232) | | 24,400,898 |
|
| TEMPORARY CASH INVESTMENTS — 19.8% | | |
| Repurchase Agreement, Bank of America Merrill Lynch, (collateralized by various U.S. Treasury obligations, 1.50%, 8/31/18, valued at $837,168), in a joint trading account at 0.07%, dated 7/31/14, due 8/1/14 (Delivery value $820,565) | | 820,563 |
|
| Repurchase Agreement, Credit Suisse First Boston, Inc., (collateralized by various U.S. Treasury obligations, 2.375%, 9/30/14, valued at $836,999), in a joint trading account at 0.01%, dated 7/31/14, due 8/1/14 (Delivery value $820,563) | | 820,563 |
|
| Repurchase Agreement, Goldman Sachs & Co., (collateralized by various U.S. Treasury obligations, 4.25%, 8/15/15, valued at $670,366), in a joint trading account at 0.03%, dated 7/31/14, due 8/1/14 (Delivery value $656,452) | | 656,451 |
|
| SSgA U.S. Government Money Market Fund, Class N | 2,635,476 |
| 2,635,476 |
|
TOTAL TEMPORARY CASH INVESTMENTS (Cost $4,933,053) | | 4,933,053 |
|
TOTAL INVESTMENT SECURITIES — 117.6% (Cost $27,943,285) | | 29,333,951 |
|
OTHER ASSETS AND LIABILITIES(2) — (17.6)% | | (4,399,900 | ) |
| TOTAL NET ASSETS — 100.0% | | $ | 24,934,051 |
|
|
| | |
| NOTES TO SCHEDULE OF INVESTMENTS |
| ADR | - | American Depositary Receipt |
| |
| (2) | Amount relates primarily to payable for investments purchased, but not settled, at period end. |
See Notes to Financial Statements.
|
|
| Statement of Assets and Liabilities |
|
| | | |
| JULY 31, 2014 |
| Assets |
| Investment securities, at value (cost of $27,943,285) | $ | 29,333,951 |
|
| Receivable for investments sold | 1,436,191 |
|
| Receivable for capital shares sold | 47,494 |
|
| Dividends and interest receivable | 18,498 |
|
| | 30,836,134 |
|
| | |
| Liabilities |
| Payable for investments purchased | 5,862,658 |
|
| Payable for capital shares redeemed | 19,174 |
|
| Accrued management fees | 19,867 |
|
| Distribution and service fees payable | 384 |
|
| | 5,902,083 |
|
| | |
| Net Assets | $ | 24,934,051 |
|
| | |
| Net Assets Consist of: |
| Capital (par value and paid-in surplus) | $ | 23,388,818 |
|
| Undistributed net investment income | 75,282 |
|
| Undistributed net realized gain | 79,285 |
|
| Net unrealized appreciation | 1,390,666 |
|
| | $ | 24,934,051 |
|
|
| | | | | | |
| | Net Assets | Shares Outstanding | Net Asset Value Per Share |
| Investor Class, $0.01 Par Value |
| $23,075,268 |
| 1,389,011 |
| $16.61 |
| Institutional Class, $0.01 Par Value |
| $60,297 |
| 3,619 |
| $16.66 |
| R Class, $0.01 Par Value |
| $195,438 |
| 11,866 |
| $16.47 |
| Advisor Class, $0.01 Par Value |
| $1,603,048 |
| 96,938 |
| $16.54 |
See Notes to Financial Statements.
|
| | | |
| YEAR ENDED JULY 31, 2014 |
| Investment Income (Loss) |
| Income: | |
| Dividends (net of foreign taxes withheld of $1,053) | $ | 250,595 |
|
| Interest | 53 |
|
| | 250,648 |
|
| Expenses: | |
| Management fees | 164,832 |
|
| Distribution and service fees: | |
| R Class | 464 |
|
| Advisor Class | 2,055 |
|
| Directors' fees and expenses | 294 |
|
| Other expenses | 187 |
|
| | 167,832 |
|
| | |
| Net investment income (loss) | 82,816 |
|
| | |
| Realized and Unrealized Gain (Loss) |
| Net realized gain (loss) on investment transactions | 1,776,672 |
|
| Change in net unrealized appreciation (depreciation) on investments | 305,740 |
|
| | |
| Net realized and unrealized gain (loss) | 2,082,412 |
|
| | |
| Net Increase (Decrease) in Net Assets Resulting from Operations | $ | 2,165,228 |
|
See Notes to Financial Statements.
|
|
| Statement of Changes in Net Assets |
|
| | | | | | |
| YEARS ENDED JULY 31, 2014 AND JULY 31, 2013 |
| Increase (Decrease) in Net Assets | July 31, 2014 | July 31, 2013 |
| Operations |
| Net investment income (loss) | $ | 82,816 |
| $ | 63,577 |
|
| Net realized gain (loss) | 1,776,672 |
| 1,192,004 |
|
| Change in net unrealized appreciation (depreciation) | 305,740 |
| 627,121 |
|
| Net increase (decrease) in net assets resulting from operations | 2,165,228 |
| 1,882,702 |
|
| | | |
| Distributions to Shareholders |
| From net investment income: | | |
| Investor Class | (71,896 | ) | (59,863 | ) |
| Institutional Class | (448 | ) | (459 | ) |
| R Class | (106 | ) | (162 | ) |
| Advisor Class | (2,304 | ) | (1,878 | ) |
| Decrease in net assets from distributions | (74,754 | ) | (62,362 | ) |
| | | |
| Capital Share Transactions |
Net increase (decrease) in net assets from capital share transactions (Note 5) | 12,848,853 |
| 1,431,375 |
|
| | | |
| Net increase (decrease) in net assets | 14,939,327 |
| 3,251,715 |
|
| | | |
| Net Assets |
| Beginning of period | 9,994,724 |
| 6,743,009 |
|
| End of period | $ | 24,934,051 |
| $ | 9,994,724 |
|
| | | |
| Undistributed net investment income | $ | 75,282 |
| $ | 74,744 |
|
See Notes to Financial Statements.
|
|
| Notes to Financial Statements |
JULY 31, 2014
1. Organization
American Century Growth Funds, Inc. (the corporation) is registered under the Investment Company Act of 1940, as amended (the 1940 Act), as an open-end management investment company and is organized as a Maryland corporation. Legacy Large Cap Fund (the fund) is one fund in a series issued by the corporation. The fund is diversified as defined under the 1940 Act. The fund’s investment objective is to seek long-term capital growth.
The fund offers the Investor Class, the Institutional Class, the R Class and the Advisor Class. The share classes differ principally in their respective distribution and shareholder servicing expenses and arrangements. The Institutional Class is made available to institutional shareholders or through financial intermediaries whose clients do not require the same level of shareholder and administrative services as shareholders of other classes. As a result, the Institutional Class is charged a lower unified management fee.
2. Significant Accounting Policies
The following is a summary of significant accounting policies consistently followed by the fund in preparation of its financial statements. The financial statements are prepared in conformity with accounting principles generally accepted in the United States of America, which may require management to make certain estimates and assumptions at the date of the financial statements. Actual results could differ from these estimates. Management evaluated the impact of events or transactions occurring through the date the financial statements were issued that would merit recognition or disclosure.
Investment Valuations — The fund determines the fair value of its investments and computes its net asset value per share at the close of regular trading (usually 4 p.m. Eastern time) on the New York Stock Exchange (NYSE) on each day the NYSE is open. The Board of Directors has adopted valuation policies and procedures to guide the investment advisor in the fund’s investment valuation process and to provide methodologies for the oversight of the fund’s pricing function.
Equity securities that are listed or traded on a domestic securities exchange are valued at the last reported sales price or at the official closing price as provided by the exchange. Equity securities traded on foreign securities exchanges are generally valued at the closing price of such securities on the exchange where primarily traded or at the close of the NYSE, if that is earlier. If no last sales price is reported, or if local convention or regulation so provides, the mean of the latest bid and asked prices may be used. Securities traded over-the-counter are valued at the mean of the latest bid and asked prices, the last sales price, or the official closing price.
Fixed income securities maturing within 60 days at the time of purchase may be valued at cost, plus or minus any amortized discount or premium or at the evaluated mean as provided by an independent pricing service. Evaluated mean prices are commonly derived through utilization of market models, which may consider, among other factors: trade data, quotations from dealers and active market makers, relevant yield curve and spread data, related sector levels, creditworthiness, trade data or market information on comparable securities, and other relevant security specific information.
Open-end management investment companies are valued at the reported net asset value per share. Repurchase agreements are valued at cost, which approximates fair value.
If the fund determines that the market price for an investment is not readily available or the valuation methods mentioned above do not reflect an investment’s fair value, such investment is valued as determined in good faith by the Board of Directors or its delegate, in accordance with policies and procedures adopted by the Board of Directors. In its determination of fair value, the fund may review several factors including, but not limited to, market information regarding the specific investment or comparable investments and correlation with other investment types, futures indices or general market indicators. Circumstances that may cause the fund to use these procedures to value an investment include, but are not limited to: an investment has been declared in default or is distressed; trading in a security has been suspended during the trading day or a security is not actively trading on its principal exchange; prices received from a regular pricing source are deemed unreliable; or there is a foreign market holiday and no trading occurred.
The fund monitors for significant events occurring after the close of an investment’s primary exchange but before the fund’s net asset value per share is determined. Significant events may include, but are not limited to: corporate announcements and transactions; governmental action and political unrest that could impact a specific investment or an investment sector; or armed conflicts, natural disasters and similar events that could affect investments in a specific country or region. The fund also monitors for significant fluctuations between domestic and foreign markets, as evidenced by the U.S. market or such other indicators that the Board of Directors, or its delegate, deems appropriate. If significant fluctuations in foreign markets are identified, the fund may apply a model-derived factor to the closing price of equity securities traded on foreign securities exchanges. The factor is based on observable market data as provided by an independent pricing service.
Security Transactions — Security transactions are accounted for as of the trade date. Net realized gains and losses are determined on the identified cost basis, which is also used for federal income tax purposes.
Investment Income — Dividend income less foreign taxes withheld, if any, is recorded as of the ex-dividend date. Distributions received on securities that represent a return of capital or long-term capital gain are recorded as a reduction of cost of investments and/or as a realized gain. The fund may estimate the components of distributions received that may be considered nontaxable distributions or long-term capital gain distributions for income tax purposes. Interest income is recorded on the accrual basis and includes accretion of discounts and amortization of premiums.
Repurchase Agreements — The fund may enter into repurchase agreements with institutions that American Century Investment Management, Inc. (ACIM) (the investment advisor) has determined are creditworthy pursuant to criteria adopted by the Board of Directors. The fund requires that the collateral, represented by securities, received in a repurchase transaction be transferred to the custodian in a manner sufficient to enable the fund to obtain those securities in the event of a default under the repurchase agreement. ACIM monitors, on a daily basis, the securities transferred to ensure the value, including accrued interest, of the securities under each repurchase agreement is equal to or greater than amounts owed to the fund under each repurchase agreement.
Joint Trading Account — Pursuant to an Exemptive Order issued by the Securities and Exchange Commission, the fund, along with certain other funds in the American Century Investments family of funds, may transfer uninvested cash balances into a joint trading account. These balances are invested in one or more repurchase agreements that are collateralized by U.S. Treasury or Agency obligations.
Income Tax Status — It is the fund’s policy to distribute substantially all net investment income and net realized gains to shareholders and to otherwise qualify as a regulated investment company under provisions of the Internal Revenue Code. Accordingly, no provision has been made for income taxes. The fund files U.S. federal, state, local and non-U.S. tax returns as applicable. The fund's tax returns are subject to examination by the relevant taxing authority until expiration of the applicable statute of limitations, which is generally three years from the date of filing but can be longer in certain jurisdictions. At this time, management believes there are no uncertain tax positions which, based on their technical merit, would not be sustained upon examination and for which it is reasonably possible that the total amounts of unrecognized tax benefits will significantly change in the next twelve months.
Multiple Class — All shares of the fund represent an equal pro rata interest in the net assets of the class to which such shares belong, and have identical voting, dividend, liquidation and other rights and the same terms and conditions, except for class specific expenses and exclusive rights to vote on matters affecting only individual classes. Income, non-class specific expenses, and realized and unrealized capital gains and losses of the fund are allocated to each class of shares based on their relative net assets.
Distributions to Shareholders — Distributions from net investment income and net realized gains, if any, are generally declared and paid annually.
Indemnifications — Under the corporation’s organizational documents, its officers and directors are indemnified against certain liabilities arising out of the performance of their duties to the fund. In addition, in the normal course of business, the fund enters into contracts that provide general indemnifications. The maximum exposure under these arrangements is unknown as this would involve future claims that may be made against a fund. The risk of material loss from such claims is considered by management to be remote.
3. Fees and Transactions with Related Parties
Certain officers and directors of the corporation are also officers and/or directors of American Century Companies, Inc. (ACC). The corporation’s investment advisor, ACIM, the corporation's distributor, American Century Investment Services, Inc. (ACIS), and the corporation’s transfer agent, American Century Services, LLC, are wholly owned, directly or indirectly, by ACC.
Management Fees — The corporation has entered into a management agreement with ACIM, under which ACIM provides the fund with investment advisory and management services in exchange for a single, unified management fee (the fee) per class. The agreement provides that all expenses of managing and operating the fund, except distribution and service fees, brokerage expenses, taxes, interest, fees and expenses of the independent directors (including legal counsel fees), and extraordinary expenses, will be paid by ACIM. The fee is computed and accrued daily based on each class’s daily net assets and paid monthly in arrears. The rate of the fee is determined by applying a fee rate calculation formula. This formula takes into account the fund’s assets as well as certain assets, if any, of other clients of the investment advisor outside the American Century Investments family of funds (such as subadvised funds and separate accounts) that have very similar investment teams and investment strategies (strategy assets). The annual management fee schedule ranges from 0.80% to 1.10% for the Investor Class, R Class and Advisor Class. The annual management fee schedule ranges from 0.60% to 0.90% for the Institutional Class. The effective annual management fee for each class for the year ended July 31, 2014 was 1.10% for the Investor Class, R Class and Advisor Class and 0.90% for the Institutional Class.
Distribution and Service Fees — The Board of Directors has adopted a separate Master Distribution and Individual Shareholder Services Plan for each of the R Class and Advisor Class (collectively the plans), pursuant to Rule 12b-1 of the 1940 Act. The plans provide that the R Class will pay ACIS an annual distribution and service fee of 0.50%. The plans provide that the Advisor Class will pay ACIS an annual distribution and service fee of 0.25%. The fees are computed and accrued daily based on each class’s daily net assets and paid monthly in arrears. The fees are used to pay financial intermediaries for distribution and individual shareholder services. Fees incurred under the plans during the year ended July 31, 2014 are detailed in the Statement of Operations.
Directors' Fees and Expenses — The Board of Directors is responsible for overseeing the investment advisor’s management and operations of the fund. The directors receive detailed information about the fund and its investment advisor regularly throughout the year, and meet at least quarterly with management of the investment advisor to review reports about fund operations. Fees and expenses incurred in conjunction with the directors during the year ended July 31, 2014 are detailed in the Statement of Operations. The fund’s officers do not receive compensation from the fund.
4. Investment Transactions
Purchases and sales of investment securities, excluding short-term investments, for the year ended July 31, 2014 were $42,681,677 and $30,256,901, respectively.
5. Capital Share Transactions
The corporation is authorized to issue 3,000,000,000 shares. Transactions in shares of the fund were as follows:
|
| | | | | | | | | | |
| | Year ended July 31, 2014 | Year ended July 31, 2013 |
| | Shares | Amount | Shares | Amount |
| Investor Class |
| Sold | 1,132,021 |
| $ | 18,069,201 |
| 284,443 |
| $ | 3,673,303 |
|
| Issued in reinvestment of distributions | 4,579 |
| 69,414 |
| 5,084 |
| 57,602 |
|
| Redeemed | (413,818 | ) | (6,472,858 | ) | (199,985 | ) | (2,392,702 | ) |
| | 722,782 |
| 11,665,757 |
| 89,542 |
| 1,338,203 |
|
| Institutional Class |
| Issued in reinvestment of distributions | 30 |
| 448 |
| 40 |
| 459 |
|
| Redeemed | — |
| — |
| (734 | ) | (8,315 | ) |
| | 30 |
| 448 |
| (694 | ) | (7,856 | ) |
| R Class | | | | |
| Sold | 7,841 |
| 127,158 |
| 1,389 |
| 17,628 |
|
| Issued in reinvestment of distributions | 7 |
| 106 |
| 14 |
| 162 |
|
| Redeemed | (248 | ) | (3,987 | ) | (228 | ) | (3,123 | ) |
| | 7,600 |
| 123,277 |
| 1,175 |
| 14,667 |
|
| Advisor Class |
| Sold | 73,448 |
| 1,175,120 |
| 13,843 |
| 185,575 |
|
| Issued in reinvestment of distributions | 152 |
| 2,304 |
| 166 |
| 1,878 |
|
| Redeemed | (7,457 | ) | (118,053 | ) | (8,652 | ) | (101,092 | ) |
| | 66,143 |
| 1,059,371 |
| 5,357 |
| 86,361 |
|
| Net increase (decrease) | 796,555 |
| $ | 12,848,853 |
| 95,380 |
| $ | 1,431,375 |
|
6. Fair Value Measurements
The fund’s investments valuation process is based on several considerations and may use multiple inputs to determine the fair value of the investments held by the fund. In conformity with accounting principles generally accepted in the United States of America, the inputs used to determine a valuation are classified into three broad levels.
| |
| • | Level 1 valuation inputs consist of unadjusted quoted prices in an active market for identical investments. |
| |
| • | Level 2 valuation inputs consist of direct or indirect observable market data (including quoted prices for comparable investments, evaluations of subsequent market events, interest rates, prepayment speeds, credit risk, etc.). These inputs also consist of quoted prices for identical investments initially expressed in local currencies that are adjusted through translation into U.S. dollars. |
| |
| • | Level 3 valuation inputs consist of unobservable data (including a fund’s own assumptions). |
The level classification is based on the lowest level input that is significant to the fair valuation measurement. The valuation inputs are not necessarily an indication of the risks associated with investing in these securities or other financial instruments.
The following is a summary of the level classifications as of period end. The Schedule of Investments provides additional information on the fund’s portfolio holdings.
|
| | | | | | | | |
| | Level 1 | Level 2 | Level 3 |
| Assets | | | |
| Investment Securities |
| Common Stocks | $ | 24,400,898 |
| — |
| — |
|
| Temporary Cash Investments | 2,635,476 |
| $ | 2,297,577 |
| — |
|
| | $ | 27,036,374 |
| $ | 2,297,577 |
| — |
|
7. Risk Factors
The fund’s investment process may result in high portfolio turnover, which could mean high transaction costs, affecting both performance and capital gains tax liabilities to investors.
There are certain risks involved in investing in foreign securities. These risks include those resulting from future adverse political, social and economic developments, fluctuations in currency exchange rates, the possible imposition of exchange controls, and other foreign laws or restrictions.
8. Federal Tax Information
The tax character of distributions paid during the years ended July 31, 2014 and July 31, 2013 were as follows:
|
| | | | | | |
| | 2014 | 2013 |
| Distributions Paid From |
| Ordinary income | $ | 74,754 |
| $ | 62,362 |
|
| Long-term capital gains | — |
| — |
|
The book-basis character of distributions made during the year from net investment income or net realized gains may differ from their ultimate characterization for federal income tax purposes. These differences reflect the differing character of certain income items and net realized gains and losses for financial statement and tax purposes, and may result in reclassification among certain capital accounts on the financial statements.
As of July 31, 2014, the federal tax cost of investments and the components of distributable earnings on a tax-basis were as follows: |
| | | |
| Federal tax cost of investments | $ | 27,983,838 |
|
| Gross tax appreciation of investments | $ | 1,626,938 |
|
| Gross tax depreciation of investments | (276,825 | ) |
| Net tax appreciation (depreciation) of investments | 1,350,113 |
|
| Undistributed ordinary income | $ | 75,282 |
|
| Accumulated long-term gains | $ | 119,838 |
|
The difference between book-basis and tax-basis unrealized appreciation (depreciation) is attributable primarily to the tax deferral of losses on wash sales.
|
| | | | | | | | | | | | | |
| For a Share Outstanding Throughout the Years Ended July 31 (except as noted) |
| Per-Share Data | Ratios and Supplemental Data |
| | | Income From Investment Operations: | | | | Ratio to Average Net Assets of: | | |
| | Net Asset Value, Beginning of Period | Net Investment Income (Loss)(1) | Net Realized and Unrealized Gain (Loss) | Total From Investment Operations | Distributions From Net Investment Income | Net Asset Value, End of Period | Total Return(2) | Operating Expenses | Net Investment Income (Loss) | Portfolio Turnover Rate | Net Assets, End of Period (in thousands) |
| Investor Class |
| 2014 | $14.18 | 0.09 | 2.43 | 2.52 | (0.09) | $16.61 | 17.87% | 1.10% | 0.57% | 202% |
| $23,075 |
|
| 2013 | $11.07 | 0.11 | 3.11 | 3.22 | (0.11) | $14.18 | 29.31% | 1.11% | 0.89% | 216% |
| $9,449 |
|
| 2012 | $10.62 | 0.12 | 0.42 | 0.54 | (0.09) | $11.07 | 5.12% | 1.11% | 1.08% | 204% |
| $6,381 |
|
| 2011 | $8.81 | 0.12 | 1.78 | 1.90 | (0.09) | $10.62 | 21.69% | 1.11% | 1.23% | 194% |
| $5,742 |
|
| 2010 | $8.30 | 0.08 | 0.51 | 0.59 | (0.08) | $8.81 | 7.13% | 1.11% | 0.86% | 163% |
| $5,901 |
|
| Institutional Class |
| 2014 | $14.22 | 0.12 | 2.44 | 2.56 | (0.12) | $16.66 | 18.12% | 0.90% | 0.77% | 202% |
| $60 |
|
| 2013 | $11.10 | 0.14 | 3.11 | 3.25 | (0.13) | $14.22 | 29.57% | 0.91% | 1.09% | 216% |
| $51 |
|
| 2012 | $10.65 | 0.14 | 0.42 | 0.56 | (0.11) | $11.10 | 5.32% | 0.91% | 1.28% | 204% |
| $48 |
|
| 2011 | $8.84 | 0.13 | 1.79 | 1.92 | (0.11) | $10.65 | 21.86% | 0.91% | 1.43% | 194% |
| $64 |
|
| 2010 | $8.32 | 0.09 | 0.53 | 0.62 | (0.10) | $8.84 | 7.45% | 0.91% | 1.06% | 163% |
| $401 |
|
|
| | | | | | | | | | | | | |
| For a Share Outstanding Throughout the Years Ended July 31 (except as noted) |
| Per-Share Data | Ratios and Supplemental Data |
| | | Income From Investment Operations: | | | | Ratio to Average Net Assets of: | | |
| | Net Asset Value, Beginning of Period | Net Investment Income (Loss)(1) | Net Realized and Unrealized Gain (Loss) | Total From Investment Operations | Distributions From Net Investment Income | Net Asset Value, End of Period | Total Return(2) | Operating Expenses | Net Investment Income (Loss) | Portfolio Turnover Rate | Net Assets, End of Period (in thousands) |
| R Class |
| 2014 | $14.06 | 0.01 | 2.42 | 2.43 | (0.02) | $16.47 | 17.28% | 1.60% | 0.07% | 202% |
| $195 |
|
| 2013 | $10.97 | 0.05 | 3.09 | 3.14 | (0.05) | $14.06 | 28.76% | 1.61% | 0.39% | 216% |
| $60 |
|
| 2012 | $10.53 | 0.06 | 0.41 | 0.47 | (0.03) | $10.97 | 4.53% | 1.61% | 0.58% | 204% |
| $34 |
|
| 2011 | $8.74 | 0.06 | 1.77 | 1.83 | (0.04) | $10.53 | 21.02% | 1.61% | 0.73% | 194% |
| $27 |
|
| 2010 | $8.23 | 0.03 | 0.52 | 0.55 | (0.04) | $8.74 | 6.64% | 1.61% | 0.36% | 163% |
| $431 |
|
| Advisor Class |
| 2014 | $14.12 | 0.04 | 2.44 | 2.48 | (0.06) | $16.54 | 17.57% | 1.35% | 0.32% | 202% |
| $1,603 |
|
| 2013 | $11.02 | 0.08 | 3.10 | 3.18 | (0.08) | $14.12 | 29.04% | 1.36% | 0.64% | 216% |
| $435 |
|
| 2012 | $10.58 | 0.09 | 0.41 | 0.50 | (0.06) | $11.02 | 4.78% | 1.36% | 0.83% | 204% |
| $280 |
|
| 2011 | $8.78 | 0.10 | 1.77 | 1.87 | (0.07) | $10.58 | 21.34% | 1.36% | 0.98% | 194% |
| $292 |
|
| 2010 | $8.26 | 0.05 | 0.53 | 0.58 | (0.06) | $8.78 | 7.01% | 1.36% | 0.61% | 163% |
| $323 |
|
|
|
Notes to Financial Highlights
|
| |
| (1) | Computed using average shares outstanding throughout the period. |
| |
| (2) | Total returns are calculated based on the net asset value of the last business day. Total returns for periods less than one year are not annualized. |
See Notes to Financial Statements.
|
|
| Report of Independent Registered Public Accounting Firm |
To the Board of Directors and Shareholders of
American Century Growth Funds, Inc.:
We have audited the accompanying statement of assets and liabilities, including the schedule of investments, of Legacy Large Cap Fund (the “Fund”), one of the funds constituting American Century Growth Funds, Inc., as of July 31, 2014, and the related statement of operations for the year then ended, the statements of changes in net assets for each of the two years in the period then ended, and the financial highlights for each of the periods presented. These financial statements and financial highlights are the responsibility of the Fund's management. Our responsibility is to express an opinion on these financial statements and financial highlights based on our audits.
We conducted our audits in accordance with the standards of the Public Company Accounting Oversight Board (United States). Those standards require that we plan and perform the audit to obtain reasonable assurance about whether the financial statements and financial highlights are free of material misstatement. The Fund is not required to have, nor were we engaged to perform, an audit of its internal control over financial reporting. Our audits included consideration of internal control over financial reporting as a basis for designing audit procedures that are appropriate in the circumstances, but not for the purpose of expressing an opinion on the effectiveness of the Fund's internal control over financial reporting. Accordingly, we express no such opinion. An audit also includes examining, on a test basis, evidence supporting the amounts and disclosures in the financial statements, assessing the accounting principles used and significant estimates made by management, as well as evaluating the overall financial statement presentation. Our procedures included confirmation of securities owned as of July 31, 2014, by correspondence with the custodian and brokers; where replies were not received from brokers, we performed other auditing procedures. We believe that our audits provide a reasonable basis for our opinion.
In our opinion, the financial statements and financial highlights referred to above present fairly, in all material respects, the financial position of Legacy Large Cap Fund of American Century Growth Funds, Inc. as of July 31, 2014, the results of its operations for the year then ended, the changes in its net assets for each of the two years in the period then ended, and the financial highlights for each of the periods presented, in conformity with accounting principles generally accepted in the United States of America.
Deloitte & Touche LLP
Kansas City, Missouri
September 17, 2014
The Board of Directors
The individuals listed below serve as directors of the funds. Each director will continue to serve in this capacity until death, retirement, resignation or removal from office. The board has adopted a mandatory retirement age for directors who are not “interested persons,” as that term is defined in the Investment Company Act (independent directors). Independent directors shall retire by December 31 of the year in which they reach their 75th birthday.
Mr. Thomas is an “interested person” because he currently serves as President and Chief Executive Officer of American Century Companies, Inc. (ACC), the parent company of American Century Investment Management, Inc. (ACIM or the advisor). Mr. Fink is treated as an “interested person” because of his recent employment with ACC and American Century Services, LLC (ACS). The other directors (more than three-fourths of the total number) are independent. They are not employees, directors or officers of, and have no financial interest in, ACC or any of its wholly owned, direct or indirect, subsidiaries, including ACIM, American Century Investment Services, Inc. (ACIS) and ACS, and do not have any other affiliations, positions, or relationships that would cause them to be considered “interested persons” under the Investment Company Act. The directors serve in this capacity for seven (in the case of Mr. Thomas, 15) registered investment companies in the American Century Investments family of funds.
The following table presents additional information about the directors. The mailing address for each director is 4500 Main Street, Kansas City, Missouri 64111.
|
| | | | | |
Name (Year of Birth) | Position(s) Held with Funds | Length of Time Served | Principal Occupation(s) During Past 5 Years | Number of American Century Portfolios Overseen by Director | Other Directorships Held During Past 5 Years |
| Independent Directors | | | | |
Thomas A. Brown (1940) | Director | Since 1980 | Managing Member, Associated Investments, LLC (real estate investment company); Brown Cascade Properties, LLC (real estate investment company) (2001 to 2009) | 73 | None |
Andrea C. Hall (1945) | Director | Since 1997 | Retired | 73 | None |
Jan M. Lewis (1957) | Director | Since 2011 | Retired; President and Chief Executive Officer, Catholic Charities of Northeast Kansas (human services organization) (2006 to 2013) | 73 | None |
James A. Olson (1942) | Director and Chairman of the Board | Since 2007 (Chairman since 2014) | Member, Plaza Belmont LLC (private equity fund manager) | 73 | Saia, Inc. (2002 to 2012) and EPR Properties (2003 to 2013) |
M. Jeannine Strandjord
(1945) | Director | Since 1994 | Retired | 73 | Euronet Worldwide Inc.; Charming Shoppes, Inc. (2006 to 2010); and DST Systems Inc. (1996
to 2012) |
|
| | | | | |
Name (Year of Birth) | Position(s) Held with Funds | Length of Time Served | Principal Occupation(s) During Past 5 Years | Number of American Century Portfolios Overseen by Director | Other Directorships Held During Past 5 Years |
| Independent Directors | | | | |
John R. Whitten (1946) | Director | Since 2008 | Retired | 73 | Rudolph Technologies, Inc. |
Stephen E. Yates (1948) | Director | Since 2012 | Retired; Executive Vice President, Technology & Operations, KeyCorp. (computer services) (2004 to 2010) | 73 | Applied Industrial Technologies, Inc. (2001 to 2010) |
| Interested Directors | | | | |
Barry Fink (1955) | Director | Since 2012 | Retired; Executive Vice President, ACC (September 2007 to February 2013); President, ACS (October 2007 to February 2013); Chief Operating Officer, ACC (September 2007 to November 2012) | 73 | None |
Jonathan S. Thomas (1963) | Director and President | Since 2007 | President and Chief Executive Officer, ACC (March 2007 to present). Also serves as Chief Executive Officer, ACS; Executive Vice President, ACIM; Director, ACC, ACIM and other ACC subsidiaries | 118 | BioMed Valley Discoveries, Inc. |
The Statement of Additional Information has additional information about the fund's directors and is available without charge, upon request, by calling 1-800-345-2021.
Officers
The following table presents certain information about the executive officers of the funds. Each officer serves as an officer for each of the 15 investment companies in the American Century family of funds, unless otherwise noted. No officer is compensated for his or her service as an officer of the funds. The listed officers are interested persons of the funds and are appointed or re-appointed on an annual basis. The mailing address for each officer listed below is 4500 Main Street, Kansas City, Missouri 64111.
|
| | |
Name (Year of Birth) | Offices with the Funds | Principal Occupation(s) During the Past Five Years |
Jonathan S. Thomas (1963) | Director and President since 2007 | President and Chief Executive Officer, ACC (March 2007 to present). Also serves as Chief Executive Officer, ACS; Executive Vice President, ACIM; Director, ACC, ACIM and other ACC subsidiaries |
Amy D. Shelton
(1964) | Chief Compliance
Officer since 2014 | Chief Compliance Officer, American Century funds, (March 2014 to present); Chief Compliance Officer, ACIM (February 2014 to present); Chief Compliance Officer, ACIS (October 2009 to present); Vice President, Client Interactions and Marketing, ACIS (February 2013 to January 2014); Director, Client Interactions and Marketing, ACIS (June 2007 to January 2013). Also serves as Vice President, ACIS |
Charles A. Etherington (1957) | General Counsel since 2007 and Senior Vice President since 2006 | Attorney, ACC (February 1994 to present); Vice President, ACC (November 2005 to present); General Counsel, ACC (March 2007 to present). Also serves as General Counsel, ACIM, ACS, ACIS and other ACC subsidiaries; and Senior Vice President, ACIM and ACS |
C. Jean Wade (1964) | Vice President, Treasurer and Chief Financial Officer since 2012 | Vice President, ACS (February 2000 to present) |
Robert J. Leach (1966) | Vice President since 2006 and Assistant Treasurer since 2012 | Vice President, ACS (February 2000 to present) |
David H. Reinmiller (1963) | Vice President since 2000 | Attorney, ACC (January 1994 to present); Associate General Counsel, ACC (January 2001 to present). Also serves as Vice President, ACIM and ACS |
Ward D. Stauffer (1960) | Secretary since 2005 | Attorney, ACC (June 2003 to present) |
|
|
| Approval of Management Agreement |
At a meeting held on June 18, 2014, the Fund’s Board of Directors unanimously approved the renewal of the management agreement pursuant to which American Century Investment Management, Inc. (the “Advisor”) acts as the investment advisor for the Fund. Under Section 15(c) of the Investment Company Act, contracts for investment advisory services are required to be reviewed, evaluated, and approved by a majority of a fund’s directors (the “Directors”), including a majority of the independent Directors, each year.
Prior to its consideration of the renewal of the management agreement, the Board requested and reviewed extensive data and information compiled by the Advisor and certain independent providers of evaluation data concerning the Fund and the services provided to the Fund by the Advisor. This review was in addition to the oversight and evaluation undertaken by the Board and its committees on a continuous basis and the information received was supplemental to the extensive information that the Board and its committees receive and consider throughout the year.
In connection with its consideration of the renewal of the management agreement, the Board’s review and evaluation of the services provided by the Advisor included, but was not limited to, the following:
| |
| • | the nature, extent, and quality of investment management, shareholder services, and other services provided by the Advisor to the Fund; |
| |
| • | the wide range of other programs and services the Advisor provides to the Fund and its shareholders on a routine and non-routine basis; |
| |
| • | the Fund’s investment performance compared to appropriate benchmarks and/or a peer group of other mutual funds with similar investment objectives and strategies; |
| |
| • | the cost of owning the Fund compared to the cost of owning similar funds; |
| |
| • | the Advisor’s compliance policies, procedures, and regulatory experience; |
| |
| • | financial data showing the cost of services provided to the Fund, the profitability of the Fund to the Advisor, and the overall profitability of the Advisor; |
| |
| • | possible economies of scale associated with the Advisor’s management of the Fund and other accounts under its management; |
| |
| • | the services provided and charges to other investment management clients of the Advisor |
| |
| • | acquired fund fees and expenses; and |
| |
| • | any collateral benefits derived by the Advisor from the management of the Fund. |
In keeping with its practice, the Board held two in-person meetings and one telephonic meeting to review and discuss the information provided. The independent Directors also had the benefit of the advice of their independent counsel throughout the process.
Factors Considered
The Directors considered all of the information provided by the Advisor, the independent data providers, and independent counsel, and evaluated such information for the Fund. In connection with their review, the Directors did not identify any single factor as being all-important or controlling, and each Director may have attributed different levels of importance to different factors. In deciding to renew the management agreement, the Board based its decision on a number of factors, including the following:
Nature, Extent and Quality of Services — Generally. Under the management agreement, the Advisor is responsible for providing or arranging for all services necessary for the operation of the Fund. The Board noted that under the management agreement, the Advisor provides or arranges at its own expense a wide variety of services including:
| |
| • | constructing and designing the Fund |
| |
| • | portfolio research and security selection |
| |
| • | initial capitalization/funding |
| |
| • | daily valuation of the Fund’s portfolio |
| |
| • | shareholder servicing and transfer agency, including shareholder confirmations, recordkeeping, and communications |
| |
| • | legal services (except the independent Directors’ counsel) |
| |
| • | regulatory and portfolio compliance |
| |
| • | marketing and distribution (except Rule 12b-1 plans) |
The Board noted that many of these services have expanded over time both in terms of quantity and complexity in response to shareholder demands, competition in the industry, changing distribution channels, and the changing regulatory environment.
Investment Management Services. The nature of the investment management services provided to the Fund is quite complex and allows Fund shareholders access to professional money management, instant diversification of their investments within an asset class, the opportunity to easily diversify among asset classes by investing in or exchanging among various American Century Investments funds, and liquidity. In evaluating investment performance, the Board expects the Advisor to manage the Fund in accordance with its investment objectives and approved strategies. Further, the Directors recognize that the Advisor has an obligation to monitor trading activities, and in particular to seek the best execution of fund trades, and to evaluate the use of and payment for research. In providing these services, the Advisor utilizes teams of investment professionals (portfolio managers, analysts, research assistants, and securities traders) who require extensive information technology, research, training, compliance and other systems to conduct their business. The Board, directly and through its Fund Performance Review Committee, regularly reviews investment performance information for the Fund, together with comparative information for appropriate benchmarks and/or peer groups of similarly-managed funds, over different time horizons. The Directors also review detailed performance information during the management agreement approval process. If performance concerns are identified, the Fund receives special reviews until performance improves, during which the Board discusses with the Advisor the reasons for such results (e.g., market conditions, security selection) and any efforts being undertaken to improve performance. The Fund’s performance was above its benchmark for the one- and three-year periods and below its benchmark for the five-year period reviewed by the Board. Taking all these factors into consideration, the Board found the investment management services provided by the Advisor to the Fund to be satisfactory and consistent with the management agreement.
Shareholder and Other Services. Under the management agreement, the Advisor provides the Fund with a comprehensive package of transfer agency, shareholder, and other services. The Board, directly and through various committees of the Board, regularly reviews reports and evaluations of such services at its regular meetings. These reports include, but are not limited to, information regarding the operational efficiency and accuracy of the shareholder and transfer agency services provided, staffing levels, shareholder satisfaction (as measured by external as well as internal sources), technology support, new products and services offered to Fund shareholders, securities trading activities, portfolio valuation services, auditing services, and legal and operational compliance activities. Certain aspects of shareholder and transfer agency service level efficiency and the quality of securities trading activities are measured by independent third party providers
and are presented in comparison to other fund groups not managed by the Advisor. The Board found the services provided by the Advisor to the Fund under the management agreement to be competitive and of high quality.
Costs of Services and Profitability. The Advisor provides detailed information concerning its cost of providing various services to the Fund, its profitability in managing the Fund (pre- and post-distribution), its overall profitability, and its financial condition. The Directors have reviewed with the Advisor the methodology used to prepare this financial information. The financial information regarding the Advisor is considered in evaluating the Advisor’s financial condition, its ability to continue to provide services under the management agreement, and the reasonableness of the current management fee. The Board concluded that the Advisor’s profits were reasonable in light of the services provided to the Fund.
Ethics. The Board generally considers the Advisor’s commitment to providing quality services to shareholders and to conducting its business ethically. They noted that the Advisor’s practices generally meet or exceed industry best practices.
Economies of Scale. The Board also reviewed information provided by the Advisor regarding the possible existence of economies of scale in connection with the management of the Fund. The Board concluded that economies of scale are difficult to measure and predict with precision, especially on a fund-by-fund basis. The Board concluded that the Advisor is appropriately sharing economies of scale through its competitive fee structure, offering competitive fees from fund inception, and through reinvestment in its business to provide shareholders additional content and services.
Comparison to Other Funds’ Fees. The management agreement provides that the Fund pays the Advisor a single, all-inclusive (or unified) management fee for providing all services necessary for the management and operation of the Fund, other than brokerage expenses, taxes, interest, extraordinary expenses, and the fees and expenses of the Fund’s independent directors (including their independent legal counsel) and expenses incurred in connection with the provision of shareholder services and distribution services under a plan adopted pursuant to Rule 12b-1 under the 1940 Act. Under the unified fee structure, the Advisor is responsible for providing all investment advisory, custody, audit, administrative, compliance, recordkeeping, marketing and shareholder services, or arranging and supervising third parties to provide such services. By contrast, most other funds are charged a variety of fees, including an investment advisory fee, a transfer agency fee, an administrative fee, distribution charges and other expenses. Other than their investment advisory fees and any applicable Rule 12b-1 distribution fees, all other components of the total fees charged by these other funds may be increased without shareholder approval. The Board believes the unified fee structure is a benefit to Fund shareholders because it clearly discloses to shareholders the cost of owning Fund shares, and, since the unified fee cannot be increased without a vote of Fund shareholders, it shifts to the Advisor the risk of increased costs of operating the Fund and provides a direct incentive to minimize administrative inefficiencies. Part of the Board’s analysis of fee levels involves reviewing certain evaluative data compiled by an independent provider comparing the Fund’s unified fee to the total expense ratios of its peers. The unified fee charged to shareholders of the Fund was above the median of the total expense ratios of the Fund’s peer expense universe and was within the range of its peer expense group. The Board concluded that the management fee paid by the Fund to the Advisor under the management agreement is reasonable in light of the services provided to the Fund.
Comparison to Fees and Services Provided to Other Clients of the Advisor. The Board also requested and received information from the Advisor concerning the nature of the services, fees, costs and profitability of its advisory services to advisory clients other than the Fund. They observed that these varying types of client accounts require different services and involve different regulatory and entrepreneurial risks than the management of the Fund. The Board analyzed this information and concluded that the fees charged and services provided to the Fund were reasonable by comparison.
Collateral or “Fall-Out” Benefits Derived by the Advisor. The Board considered the existence of collateral benefits the Advisor may receive as a result of its relationship with the Fund. They concluded that the Advisor’s primary business is managing mutual funds and it generally does not use fund or shareholder information to generate profits in other lines of business, and therefore does not derive any significant collateral benefits from them. The Board noted that the Advisor receives proprietary research from broker-dealers that execute fund portfolio transactions and concluded that this research is likely to benefit Fund shareholders. The Board also determined that the Advisor is able to provide investment management services to certain clients other than the Fund, at least in part, due to its existing infrastructure built to serve the fund complex. The Board concluded, however, that the assets of those other clients are not material to the analysis and, where applicable, may be included with the assets of the Fund to determine breakpoints in the management fee schedule.
Existing Relationship. The Board also considered whether there was any reason for not continuing the existing arrangement with the Advisor. In this regard, the Board was mindful of the potential disruptions of the Fund’s operations and various risks, uncertainties, and other effects that could occur as a result of a decision not to continue such relationship. In particular, the Board recognized that most shareholders have invested in the Fund on the strength of the Advisor’s industry standing and reputation and in the expectation that the Advisor will have a continuing role in providing advisory services to the Fund.
Conclusion of the Directors. As a result of this process, the Board, including all of the independent Directors, taking into account all of the factors discussed above and the information provided by the Advisor and others, concluded that the management agreement between the Fund and the Advisor is fair and reasonable in light of the services provided and should be renewed.
Retirement Account Information
As required by law, distributions you receive from certain IRAs are subject to federal income tax withholding, unless you elect not to have withholding apply. Tax will be withheld on the total amount withdrawn even though you may be receiving amounts that are not subject to withholding, such as nondeductible contributions. In such case, excess amounts of withholding could occur. You may adjust your withholding election so that a greater or lesser amount will be withheld.
If you don’t want us to withhold on this amount, you must notify us to not withhold the federal income tax. You may notify us in writing or in certain situations by telephone or through other electronic means. For systematic withdrawals, your withholding election will remain in effect until revoked or changed by filing a new election. You have the right to revoke your election at any time.
Remember, even if you elect not to have income tax withheld, you are liable for paying income tax on the taxable portion of your withdrawal. If you elect not to have income tax withheld or you don’t have enough income tax withheld, you may be responsible for payment of estimated tax. You may incur penalties under the estimated tax rules if your withholding and estimated tax payments are not sufficient. You can reduce or defer the income tax on a distribution by directly or indirectly rolling such distribution over to another IRA or eligible plan. You should consult your tax advisor for additional information.
State tax will be withheld if, at the time of your distribution, your address is within one of the mandatory withholding states and you have federal income tax withheld (or as otherwise required by state law). State taxes will be withheld from your distribution in accordance with the respective state rules.
Distributions you receive from 403(b), 457 and qualified plans are subject to special tax and withholding rules. Your plan administrator or plan sponsor is required to provide you with a special tax notice explaining those rules at the time you request a distribution. If applicable, federal and/or state taxes may be withheld from your distribution amount.
Proxy Voting Policies
A description of the policies that the fund's investment advisor uses in exercising the voting rights associated with the securities purchased and/or held by the fund is available without charge, upon request, by calling 1-800-345-2021. It is also available on the "About Us" page of American Century Investments’ website at americancentury.com and on the Securities and Exchange Commission’s website at sec.gov. Information regarding how the investment advisor voted proxies relating to portfolio securities during the most recent 12-month period ended June 30 is available on the "About Us" page at americancentury.com. It is also available at sec.gov.
Quarterly Portfolio Disclosure
The fund files its complete schedule of portfolio holdings with the Securities and Exchange Commission (SEC) for the first and third quarters of each fiscal year on Form N-Q. The fund’s Forms N-Q are available on the SEC’s website at sec.gov, and may be reviewed and copied at the SEC’s Public Reference Room in Washington, DC. Information on the operation of the Public Reference Room may be obtained by calling 1-800-SEC-0330. The fund also makes its complete schedule of portfolio holdings for the most recent quarter of its fiscal year available on its
website at americancentury.com and, upon request, by calling 1-800-345-2021.
Other Tax Information
The following information is provided pursuant to provisions of the Internal Revenue Code.
The fund hereby designates up to the maximum amount allowable as qualified dividend income for the fiscal year ended July 31, 2014.
For corporate taxpayers, the fund hereby designates $74,754, or up to the maximum amount allowable, of ordinary income distributions paid during the fiscal year ended July 31, 2014 as qualified for the corporate dividends received deduction.
|
| | |
| |
| | | |
| Contact Us | americancentury.com | |
| Automated Information Line | 1-800-345-8765 | |
| Investor Services Representative | 1-800-345-2021
or 816-531-5575 | |
| Investors Using Advisors | 1-800-378-9878 | |
| Business, Not-For-Profit, Employer-Sponsored Retirement Plans | 1-800-345-3533 | |
| Banks and Trust Companies, Broker-Dealers, Financial Professionals, Insurance Companies | 1-800-345-6488 | |
| Telecommunications Relay Service for the Deaf | 711 | |
| | | |
| American Century Growth Funds, Inc. | |
| | | |
Investment Advisor: American Century Investment Management, Inc. Kansas City, Missouri | |
| | | |
| This report and the statements it contains are submitted for the general information of our shareholders. The report is not authorized for distribution to prospective investors unless preceded or accompanied by an effective prospectus. | |
| | | |
©2014 American Century Proprietary Holdings, Inc. All rights reserved. CL-ANN-83142 1409 | |
|
| |
ANNUAL REPORT | JULY 31, 2014 |
Legacy Multi Cap Fund
|
| |
| President’s Letter | |
| Performance | |
| Portfolio Commentary | |
| Fund Characteristics | |
| Shareholder Fee Example | |
| Schedule of Investments | |
| Statement of Assets and Liabilities | |
| Statement of Operations | |
| Statement of Changes in Net Assets | |
| Notes to Financial Statements | |
| Financial Highlights | |
| Report of Independent Registered Public Accounting Firm | |
| Management | |
| Approval of Management Agreement | |
| Additional Information | |
Any opinions expressed in this report reflect those of the author as of the date of the report, and do not necessarily represent the opinions of American Century Investments® or any other person in the American Century Investments organization. Any such opinions are subject to change at any time based upon market or other conditions and American Century Investments disclaims any responsibility to update such opinions. These opinions may not be relied upon as investment advice and, because investment decisions made by American Century Investments funds are based on numerous factors, may not be relied upon as an indication of trading intent on behalf of any American Century Investments fund. Security examples are used for representational purposes only and are not intended as recommendations to purchase or sell securities. Performance information for comparative indices and securities is provided to American Century Investments by third party vendors. To the best of American Century Investments’ knowledge, such information is accurate at the time of printing.
|
| |
| Dear Investor:
Thank you for reviewing this annual report for the 12 months ended July 31, 2014. It provides investment performance and portfolio information for the reporting period, plus longer-term historical performance data.
Annual reports remain important vehicles for conveying information about fund returns, including market and economic factors that affected performance during the reporting period. For additional, updated investment and market insights, we encourage you to visit our website, americancentury.com.
|
| Jonathan Thomas |
Aggressive Monetary Policies, as Investors Sought Risk and Yield, Boosted Returns
Stimulative monetary policies and expectations of longer-term economic improvement, interspersed with concerns about nearer-term weaker-than-expected economic data and geopolitical conflicts, helped drive financial market returns during the reporting period. We believe the combination of longer-term optimism about global economic growth, low costs of capital, and central bank purchases of fixed-income securities helped persuade investors to seek risk and yield. Broad stock market index returns were largely in the 10-20% range across the spectrum of developed versus emerging and large-cap versus small-cap markets. The S&P 500 Index, the MSCI EAFE Index, and the MSCI Emerging Markets Index advanced 16.94%, 15.07%, and 15.32%, respectively.
Bond performance was also generally solid, which was a surprise, given pre-2014 expectations for rising inflation and interest rates. Inflation showed signs of increasing, but remained contained, and interest rates actually fell in many markets. According to Bloomberg, the 10-year U.S. Treasury yield edged downward from 2.59% to 2.56% during the 12 months, while the 30-year U.S. Treasury yield fell from 3.65% to 3.32%. This “bull market flattening” of the U.S. Treasury yield curve helped produce a total return of 9.74% for the 30-year U.S. Treasury bond, according to Barclays. Indices that tracked U.S. high-yield and investment-grade corporate bonds and mortgage-backed securities also generally outperformed the broad Barclays U.S. Aggregate Bond Index, which advanced 3.97%.
Looking ahead, we see signs of sustained economic growth for the remainder of 2014, but headwinds persist. In the U.S., which was supposed to be an economic growth leader this year, housing market momentum has slowed, inflation and interest rates could rise, and economic growth and U.S. employment levels remain subpar compared with past post-recession periods. In this environment, we continue to believe in a disciplined, diversified, long-term investment approach, using professionally managed stock and bond portfolios—as appropriate—for meeting financial goals. We appreciate your continued trust in us.
Sincerely,
Jonathan Thomas
President and Chief Executive Officer
American Century Investments
|
| | | | | |
| Total Returns as of July 31, 2014 |
| | | | Average Annual Returns | |
| | Ticker Symbol | 1 year | 5 years | Since Inception | Inception Date |
| Investor Class | ACMNX | 14.60% | 17.25% | 7.13% | 5/31/06 |
| Russell 3000 Index | — | 16.37% | 17.07% | 7.67% | — |
| Institutional Class | ACMHX | 14.86% | 17.48% | 7.34% | 5/31/06 |
| R Class | ACMEX | 14.03% | 16.67% | 6.56% | 5/31/06 |
| Advisor Class | ACMFX | 14.32% | 16.96% | 6.85% | 5/31/06 |
|
|
| Growth of $10,000 Over Life of Class |
| $10,000 investment made May 31, 2006 |
|
| |
| Value on July 31, 2014 |
| | Investor Class — $17,554 |
| |
| | Russell 3000 Index — $18,292 |
| |
*From May 31, 2006, the Investor Class’s inception date. Not annualized.
|
| | | |
| Total Annual Fund Operating Expenses |
| Investor Class | Institutional Class | R Class | Advisor Class |
| 1.18% | 0.98% | 1.68% | 1.43% |
The total annual fund operating expenses shown is as stated in the fund’s prospectus current as of the date of this report. The prospectus may vary from the expense ratio shown elsewhere in this report because it is based on a different time period, includes acquired fund fees and expenses, and, if applicable, does not include fee waivers or expense reimbursements.
Data presented reflect past performance. Past performance is no guarantee of future results. Current performance may be higher or lower than the performance shown. Investment return and principal value will fluctuate, and redemption value may be more or less than original cost. To obtain performance data current to the most recent month end, please call 1-800-345-2021 or visit americancentury.com. Historically, small company stocks have been more volatile than the stocks of larger, more established companies. The fund’s investment process may result in high portfolio turnover, which could mean high transaction costs, affecting both performance and capital gains tax liabilities to investors.
Unless otherwise indicated, performance reflects Investor Class shares; performance for other share classes will vary due to differences in fee structure. For information about other share classes available, please consult the prospectus. Data assumes reinvestment of dividends and capital gains, and none of the charts reflect the deduction of taxes that a shareholder would pay on fund distributions or the redemption of fund shares. Returns for the index are provided for comparison. The fund’s total returns include operating expenses (such as transaction costs and management fees) that reduce returns, while the total returns of the index do not.
Portfolio Managers: John T. Small Jr. and Stephen Pool
Performance Summary
Legacy Multi Cap returned 14.60%* for the 12 months ended July 31, 2014, trailing the 16.37% return of the portfolio’s benchmark, the Russell 3000 Index.
As discussed in the President's Letter on page 2, U.S. stock indices delivered solid returns during the reporting period. Within the Russell 3000 Index, information technology was the top-performing sector, returning 26%. Materials, health care, and energy stocks also outperformed the overall index. Consumer staples and utilities were the weakest sectors, registering single-digit gains. Telecommunication services, financials, consumer discretionary, and industrials also lagged the benchmark average with double-digit returns.
Throughout the year, Legacy Multi Cap’s management team continued to use its quantitative process to identify and evaluate the fundamental business prospects of its portfolio holdings and potential investments within the fund’s investment universe. Purchases and sales, as well as individual security and industry allocations, are the result of applying this process as company-specific and market events change. The fund posted a solid gain for the year but underperformed the Russell 3000 Index. Stock selection in the consumer discretionary sector—especially among retailers—and energy were the primary sources of underperformance relative to the benchmark. Stock decisions in health care were the largest contributors to relative results, led by pharmaceutical companies and health care providers and services. Stock selection in the consumer staples sector was another major contributor.
Consumer Discretionary and Energy Stocks Led Detractors
Holdings in the consumer discretionary sector were a chief cause of underperformance relative to the benchmark. Retailers struggled with harsh weather and consumer confidence during the holiday season. Beauty products retailer Ulta Salon Cosmetics & Fragrances fell sharply in December after releasing a cautious outlook for the holiday season. Bon-Ton Stores and Francesca’s Holdings were other significant detractors. All were eliminated from the portfolio. Stock selection in energy also weighed on relative results, primarily due to holdings in the oil, gas, and consumable fuels industry.
Stock choices and positioning among industrials hurt results versus the benchmark, driven largely by lighter exposure to airlines. Stock selection in materials detracted, hampered by holdings in the chemicals industry. Utilities positions struggled as well, including Consolidated Edison and Duke Energy. Investors are concerned about litigation issues for both companies—Consolidated Edison for a Manhattan explosion that caused several deaths and injuries and Duke Energy for a coal ash spill into the Dan River. We eliminated Consolidated Edison but continue to hold Duke Energy.
One of the largest detractors from relative results was our lighter-than-benchmark exposure to consumer electronics giant Apple, which rose on positive company guidance, an announced stock buy-back plan, and a stock split.
* All fund returns referenced in this commentary are for Investor Class shares. Performance for other share classes will vary due to differences in fee structure; when Investor Class performance exceeds that of the fund's benchmark, other share classes may not. See page 3 for returns for all share classes.
Health Care and Consumer Staples Holdings Were Strong Contributors
Holdings in the health care sector were the largest source of positive contributions, led by pharmaceuticals, where several stocks performed well, including Hospira, a maker of generic, injectable pharmaceuticals used in cancer and other treatments. The company reported strong sales and made a bid for Danone’s nutritional products segment. Health care providers and services also contributed strongly. The stock price of Amedisys, a home health care and hospice provider that’s benefiting from an aging population, rose substantially after it announced better-than-expected results on improving gross margins. Cardinal Health, a drug and medical products provider whose revenues beat analyst estimates, was another key contributor.
Consumer staples benefited relative results, helped by positioning in the beverage and household product industries. Lighter exposure to the struggling tobacco industry also aided results.
Outlook
The U.S. economy appears headed for a sustained but moderate economic expansion, but there are headwinds both domestically and internationally. Whatever the conditions, Legacy Multi Cap will continue to employ its disciplined investment approach that combines current market conditions with appropriate stock selection criteria to identify attractive opportunities. The quantitative model allows the management team to uncover investments across the growth, value, and market-capitalization spectrums.
|
| |
| JULY 31, 2014 | |
| Top Ten Holdings | % of net assets |
| Exxon Mobil Corp. | 1.8% |
| Apple, Inc. | 1.7% |
| Microsoft Corp. | 1.7% |
| Amedisys, Inc. | 1.4% |
| General Electric Co. | 1.2% |
| Chevron Corp. | 1.1% |
| Hospira, Inc. | 1.1% |
| Orbitz Worldwide, Inc. | 1.0% |
| Freeport-McMoRan Copper & Gold, Inc. | 1.0% |
| HCI Group, Inc. | 1.0% |
| | |
| Top Five Industries | % of net assets |
| Oil, Gas and Consumable Fuels | 8.6% |
| Technology Hardware, Storage and Peripherals | 4.6% |
| Health Care Providers and Services | 4.3% |
| Machinery | 4.2% |
| IT Services | 4.2% |
| | |
| Types of Investments in Portfolio | % of net assets |
| Common Stocks | 97.6% |
| Temporary Cash Investments | 2.3% |
| Other Assets and Liabilities | 0.1% |
Fund shareholders may incur two types of costs: (1) transaction costs, including sales charges (loads) on purchase payments and redemption/exchange fees; and (2) ongoing costs, including management fees; distribution and service (12b-1) fees; and other fund expenses. This example is intended to help you understand your ongoing costs (in dollars) of investing in your fund and to compare these costs with the ongoing cost of investing in other mutual funds.
The example is based on an investment of $1,000 made at the beginning of the period and held for the entire period from February 1, 2014 to July 31, 2014.
Actual Expenses
The table provides information about actual account values and actual expenses for each class. You may use the information, together with the amount you invested, to estimate the expenses that you paid over the period. First, identify the share class you own. Then simply divide your account value by $1,000 (for example, an $8,600 account value divided by $1,000 = 8.6), then multiply the result by the number under the heading “Expenses Paid During Period” to estimate the expenses you paid on your account during this period.
If you hold Investor Class shares of any American Century Investments fund, or Institutional Class shares of the American Century Diversified Bond Fund, in an American Century Investments account (i.e., not a financial intermediary or retirement plan account), American Century Investments may charge you a $12.50 semiannual account maintenance fee if the value of those shares is less than $10,000. We will redeem shares automatically in one of your accounts to pay the $12.50 fee. In determining your total eligible investment amount, we will include your investments in all personal accounts (including American Century Investments Brokerage accounts) registered under your Social Security number. Personal accounts include individual accounts, joint accounts, UGMA/UTMA accounts, personal trusts, Coverdell Education Savings Accounts and IRAs (including traditional, Roth, Rollover, SEP-, SARSEP- and SIMPLE-IRAs), and certain other retirement accounts. If you have only business, business retirement, employer-sponsored or American Century Investments Brokerage accounts, you are currently not subject to this fee. If you are subject to the Account Maintenance Fee, your account value could be reduced by the fee amount.
Hypothetical Example for Comparison Purposes
The table also provides information about hypothetical account values and hypothetical expenses based on the actual expense ratio of each class of your fund and an assumed rate of return of 5% per year before expenses, which is not the actual return of a fund’s share class. The hypothetical account values and expenses may not be used to estimate the actual ending account balance or expenses you paid for the period. You may use this information to compare the ongoing costs of investing in your fund and other funds. To do so, compare this 5% hypothetical example with the 5% hypothetical examples that appear in the shareholder reports of the other funds.
Please note that the expenses shown in the table are meant to highlight your ongoing costs only and do not reflect any transactional costs, such as sales charges (loads) or redemption/exchange fees. Therefore, the table is useful in comparing ongoing costs only, and will not help you determine the relative total costs of owning different funds. In addition, if these transactional costs were included, your costs would have been higher.
|
| | | | |
| | Beginning Account Value 2/1/14 | Ending Account Value 7/31/14 | Expenses Paid During Period(1) 2/1/14 - 7/31/14 | Annualized Expense Ratio(1) |
| Actual |
| Investor Class | $1,000 | $1,070.70 | $5.90 | 1.15% |
| Institutional Class | $1,000 | $1,071.60 | $4.88 | 0.95% |
| R Class | $1,000 | $1,068.00 | $8.46 | 1.65% |
| Advisor Class | $1,000 | $1,069.40 | $7.18 | 1.40% |
| Hypothetical |
| Investor Class | $1,000 | $1,019.09 | $5.76 | 1.15% |
| Institutional Class | $1,000 | $1,020.08 | $4.76 | 0.95% |
| R Class | $1,000 | $1,016.61 | $8.25 | 1.65% |
| Advisor Class | $1,000 | $1,017.85 | $7.00 | 1.40% |
| |
| (1) | Expenses are equal to the class’s annualized expense ratio listed in the table above, multiplied by the average account value over the period, multiplied by 181, the number of days in the most recent fiscal half-year, divided by 365, to reflect the one-half year period. |
JULY 31, 2014
|
| | | | |
| | Shares | Value |
| COMMON STOCKS — 97.6% | | |
| AEROSPACE AND DEFENSE — 1.7% | | |
| Rockwell Collins, Inc. | 3,019 | $ | 221,202 |
|
| TransDigm Group, Inc. | 1,145 | 192,269 |
|
| | | 413,471 |
|
| AIR FREIGHT AND LOGISTICS — 1.0% | | |
| United Parcel Service, Inc., Class B | 2,415 | 234,472 |
|
| AIRLINES — 1.0% | | |
| Allegiant Travel Co. | 2,067 | 243,410 |
|
| AUTO COMPONENTS — 1.0% | | |
| Magna International, Inc. | 2,266 | 243,368 |
|
| AUTOMOBILES — 2.5% | | |
| Ford Motor Co. | 13,056 | 222,213 |
|
| General Motors Co. | 4,554 | 154,017 |
|
| Honda Motor Co. Ltd. ADR | 7,165 | 249,915 |
|
| | | 626,145 |
|
| BEVERAGES — 1.6% | | |
| Molson Coors Brewing Co., Class B | 3,380 | 228,252 |
|
Monster Beverage Corp.(1) | 2,516 | 160,923 |
|
| | | 389,175 |
|
| BIOTECHNOLOGY — 0.9% | | |
Repligen Corp.(1) | 10,905 | 228,678 |
|
| CAPITAL MARKETS — 3.7% | | |
Affiliated Managers Group, Inc.(1) | 1,136 | 226,348 |
|
| Blackstone Group LP | 7,604 | 248,499 |
|
E*Trade Financial Corp.(1) | 9,710 | 204,104 |
|
| Janus Capital Group, Inc. | 19,811 | 225,647 |
|
| | | 904,598 |
|
| CHEMICALS — 1.4% | | |
| FMC Corp. | 2,870 | 187,181 |
|
Intrepid Potash, Inc.(1) | 10,206 | 151,151 |
|
| | | 338,332 |
|
| COMMERCIAL SERVICES AND SUPPLIES — 1.8% | | |
| Quad/Graphics, Inc. | 9,298 | 196,374 |
|
Stericycle, Inc.(1) | 2,109 | 248,124 |
|
| | | 444,498 |
|
| COMMUNICATIONS EQUIPMENT — 2.5% | | |
| Cisco Systems, Inc. | 9,775 | 246,623 |
|
Palo Alto Networks, Inc.(1) | 1,408 | 113,851 |
|
| Plantronics, Inc. | 5,284 | 248,190 |
|
| | | 608,664 |
|
| CONSUMER FINANCE — 0.8% | | |
| American Express Co. | 2,236 | 196,768 |
|
| CONTAINERS AND PACKAGING — 0.5% | | |
| Packaging Corp. of America | 1,933 | 127,887 |
|
|
| | | | |
| | Shares | Value |
| DIVERSIFIED TELECOMMUNICATION SERVICES — 1.7% | | |
| BCE, Inc. | 5,227 | $ | 236,678 |
|
| Verizon Communications, Inc. | 3,799 | 191,546 |
|
| | | 428,224 |
|
| ELECTRIC UTILITIES — 1.3% | | |
| Duke Energy Corp. | 2,101 | 151,545 |
|
| PPL Corp. | 5,279 | 174,154 |
|
| | | 325,699 |
|
| ELECTRONIC EQUIPMENT, INSTRUMENTS AND COMPONENTS — 1.9% | |
| Corning, Inc. | 11,419 | 224,383 |
|
Plexus Corp.(1) | 5,912 | 232,519 |
|
| | | 456,902 |
|
| ENERGY EQUIPMENT AND SERVICES — 1.7% | | |
| National Oilwell Varco, Inc. | 2,317 | 187,770 |
|
| Patterson-UTI Energy, Inc. | 6,964 | 239,213 |
|
| | | 426,983 |
|
| FOOD AND STAPLES RETAILING — 2.0% | | |
| Kroger Co. (The) | 5,070 | 248,329 |
|
| Sysco Corp. | 6,805 | 242,870 |
|
| | | 491,199 |
|
| FOOD PRODUCTS — 2.0% | | |
| ConAgra Foods, Inc. | 8,265 | 249,024 |
|
TreeHouse Foods, Inc.(1) | 3,230 | 237,405 |
|
| | | 486,429 |
|
| HEALTH CARE EQUIPMENT AND SUPPLIES — 1.7% | | |
| Becton Dickinson and Co. | 1,709 | 198,654 |
|
Varian Medical Systems, Inc.(1) | 2,746 | 225,584 |
|
| | | 424,238 |
|
| HEALTH CARE PROVIDERS AND SERVICES — 4.3% | | |
Amedisys, Inc.(1) | 16,727 | 337,551 |
|
| Cardinal Health, Inc. | 3,051 | 218,604 |
|
Magellan Health, Inc.(1) | 4,298 | 247,565 |
|
| UnitedHealth Group, Inc. | 2,994 | 242,664 |
|
| | | 1,046,384 |
|
| HOTELS, RESTAURANTS AND LEISURE — 2.0% | | |
Hyatt Hotels Corp., Class A(1) | 3,508 | 206,376 |
|
| McDonald's Corp. | 1,409 | 133,235 |
|
MGM Resorts International(1) | 5,718 | 153,471 |
|
| | | 493,082 |
|
| HOUSEHOLD DURABLES — 0.8% | | |
Jarden Corp.(1) | 3,617 | 202,190 |
|
| HOUSEHOLD PRODUCTS — 0.9% | | |
| Kimberly-Clark Corp. | 2,118 | 219,997 |
|
| INDUSTRIAL CONGLOMERATES — 2.2% | | |
| General Electric Co. | 11,513 | 289,552 |
|
| Roper Industries, Inc. | 1,745 | 251,402 |
|
| | | 540,954 |
|
|
| | | | |
| | Shares | Value |
| INSURANCE — 4.1% | | |
| ACE Ltd. | 2,025 | $ | 202,703 |
|
| Aflac, Inc. | 3,968 | 237,048 |
|
| Hanover Insurance Group, Inc. (The) | 3,590 | 207,538 |
|
| HCI Group, Inc. | 6,345 | 253,165 |
|
| Progressive Corp. (The) | 4,720 | 110,637 |
|
| | | 1,011,091 |
|
| INTERNET AND CATALOG RETAIL — 1.8% | | |
Liberty Interactive Corp., Class A(1) | 6,946 | 194,835 |
|
Orbitz Worldwide, Inc.(1) | 28,790 | 254,792 |
|
| | | 449,627 |
|
| IT SERVICES — 4.2% | | |
CACI International, Inc., Class A(1) | 2,439 | 168,267 |
|
| Convergys Corp. | 11,554 | 224,032 |
|
| International Business Machines Corp. | 1,317 | 252,429 |
|
| MAXIMUS, Inc. | 3,571 | 147,697 |
|
| Total System Services, Inc. | 7,869 | 251,808 |
|
| | | 1,044,233 |
|
| LEISURE PRODUCTS — 0.8% | | |
Nautilus, Inc.(1) | 19,937 | 198,573 |
|
| LIFE SCIENCES TOOLS AND SERVICES — 1.0% | | |
PAREXEL International Corp.(1) | 4,654 | 249,268 |
|
| MACHINERY — 4.2% | | |
| Caterpillar, Inc. | 1,516 | 152,737 |
|
| Deere & Co. | 2,207 | 187,838 |
|
Meritor, Inc.(1) | 19,801 | 248,899 |
|
| PACCAR, Inc. | 3,796 | 236,377 |
|
| Pall Corp. | 2,820 | 218,465 |
|
| | | 1,044,316 |
|
| MEDIA — 2.2% | | |
| Comcast Corp., Class A | 2,961 | 159,095 |
|
Live Nation Entertainment, Inc.(1) | 10,049 | 233,237 |
|
| Time Warner Cable, Inc. | 1,084 | 157,288 |
|
| | | 549,620 |
|
| METALS AND MINING — 1.0% | | |
| Freeport-McMoRan Copper & Gold, Inc. | 6,819 | 253,803 |
|
| MULTILINE RETAIL — 0.8% | | |
| Macy's, Inc. | 3,480 | 201,109 |
|
| OIL, GAS AND CONSUMABLE FUELS — 8.6% | | |
| Chevron Corp. | 2,190 | 283,036 |
|
| ConocoPhillips | 2,761 | 227,783 |
|
| EOG Resources, Inc. | 2,086 | 228,292 |
|
| Exxon Mobil Corp. | 4,565 | 451,661 |
|
Halcon Resources Corp.(1) | 17,813 | 105,987 |
|
| Kinder Morgan Energy Partners LP | 1,543 | 125,014 |
|
| Marathon Oil Corp. | 6,359 | 246,411 |
|
| Phillips 66 | 2,537 | 205,776 |
|
| Royal Dutch Shell plc, Class A ADR | 3,076 | 251,709 |
|
| | | 2,125,669 |
|
|
| | | | |
| | Shares | Value |
| PAPER AND FOREST PRODUCTS — 0.8% | | |
| International Paper Co. | 4,057 | $ | 192,707 |
|
| PHARMACEUTICALS — 3.9% | | |
| AbbVie, Inc. | 4,047 | 211,820 |
|
| Eli Lilly & Co. | 3,950 | 241,187 |
|
Hospira, Inc.(1) | 4,838 | 268,364 |
|
Prestige Brands Holdings, Inc.(1) | 7,904 | 243,443 |
|
| | | 964,814 |
|
| REAL ESTATE INVESTMENT TRUSTS (REITs) — 3.8% | | |
| Duke Realty Corp. | 13,980 | 251,500 |
|
| Extra Space Storage, Inc. | 4,721 | 244,218 |
|
| Macerich Co. (The) | 3,696 | 240,277 |
|
| Resource Capital Corp. | 33,724 | 185,819 |
|
| | | 921,814 |
|
| REAL ESTATE MANAGEMENT AND DEVELOPMENT — 0.4% | | |
| Jones Lang LaSalle, Inc. | 766 | 94,754 |
|
| ROAD AND RAIL — 1.0% | | |
| J.B. Hunt Transport Services, Inc. | 3,220 | 248,777 |
|
| SEMICONDUCTORS AND SEMICONDUCTOR EQUIPMENT — 1.6% | |
Cabot Microelectronics Corp.(1) | 358 | 14,388 |
|
Magnachip Semiconductor Corp.(1) | 11,037 | 154,628 |
|
| Microchip Technology, Inc. | 5,142 | 231,493 |
|
| | | 400,509 |
|
| SOFTWARE — 3.6% | | |
Electronic Arts, Inc.(1) | 6,921 | 232,546 |
|
| Microsoft Corp. | 9,434 | 407,171 |
|
| Oracle Corp. | 6,207 | 250,701 |
|
| | | 890,418 |
|
| SPECIALTY RETAIL — 1.8% | | |
| Gap, Inc. (The) | 4,851 | 194,574 |
|
Mattress Firm Holding Corp.(1) | 5,175 | 241,155 |
|
| | | 435,729 |
|
| TECHNOLOGY HARDWARE, STORAGE AND PERIPHERALS — 4.6% | |
| Apple, Inc. | 4,263 | 407,415 |
|
| Hewlett-Packard Co. | 7,068 | 251,691 |
|
| SanDisk Corp. | 2,355 | 215,977 |
|
| Seagate Technology plc | 4,275 | 250,515 |
|
| | | 1,125,598 |
|
| THRIFTS AND MORTGAGE FINANCE — 1.8% | | |
MGIC Investment Corp.(1) | 24,957 | 184,432 |
|
TFS Financial Corp.(1) | 18,584 | 250,513 |
|
| | | 434,945 |
|
| TOBACCO — 1.0% | | |
| Philip Morris International, Inc. | 2,973 | 243,816 |
|
| WATER UTILITIES — 0.8% | | |
| American Water Works Co., Inc. | 4,166 | 199,010 |
|
| WIRELESS TELECOMMUNICATION SERVICES — 0.9% | | |
SBA Communications Corp., Class A(1) | 1,951 | 208,620 |
|
TOTAL COMMON STOCKS (Cost $22,995,384) | | 24,030,567 |
|
|
| | | | |
| | Shares | Value |
| TEMPORARY CASH INVESTMENTS — 2.3% | | |
| Repurchase Agreement, Bank of America Merrill Lynch, (collateralized by various U.S. Treasury obligations, 1.50%, 8/31/18, valued at $98,035), in a joint trading account at 0.07%, dated 7/31/14, due 8/1/14 (Delivery value $96,091) | | $ | 96,091 |
|
| Repurchase Agreement, Credit Suisse First Boston, Inc., (collateralized by various U.S. Treasury obligations, 2.375%, 9/30/14, valued at $98,016), in a joint trading account at 0.01%, dated 7/31/14, due 8/1/14 (Delivery value $96,091) | | 96,091 |
|
| Repurchase Agreement, Goldman Sachs & Co., (collateralized by various U.S. Treasury obligations, 4.25%, 8/15/15, valued at $78,502), in a joint trading account at 0.03%, dated 7/31/14, due 8/1/14 (Delivery value $76,872) | | 76,872 |
|
| SSgA U.S. Government Money Market Fund, Class N | 308,624 | 308,624 |
|
TOTAL TEMPORARY CASH INVESTMENTS (Cost $577,678) | | 577,678 |
|
TOTAL INVESTMENT SECURITIES — 99.9% (Cost $23,573,062) | | 24,608,245 |
|
| OTHER ASSETS AND LIABILITIES — 0.1% | | 17,647 |
|
| TOTAL NET ASSETS — 100.0% | | $ | 24,625,892 |
|
|
| | |
| NOTES TO SCHEDULE OF INVESTMENTS |
| ADR | - | American Depositary Receipt |
See Notes to Financial Statements.
|
|
| Statement of Assets and Liabilities |
|
| | | |
| JULY 31, 2014 |
| Assets |
| Investment securities, at value (cost of $23,573,062) | $ | 24,608,245 |
|
| Receivable for capital shares sold | 31,419 |
|
| Dividends and interest receivable | 24,247 |
|
| | 24,663,911 |
|
| | |
| Liabilities | |
| Payable for capital shares redeemed | 12,884 |
|
| Accrued management fees | 24,363 |
|
| Distribution and service fees payable | 772 |
|
| | 38,019 |
|
| | |
| Net Assets | $ | 24,625,892 |
|
| | |
| Net Assets Consist of: | |
| Capital (par value and paid-in surplus) | $ | 29,493,660 |
|
| Undistributed net investment income | 86,345 |
|
| Accumulated net realized loss | (5,989,296 | ) |
| Net unrealized appreciation | 1,035,183 |
|
| | $ | 24,625,892 |
|
|
| | | | | | |
| | Net Assets | Shares Outstanding | Net Asset Value Per Share |
| Investor Class, $0.01 Par Value |
| $21,231,807 |
| 1,298,807 |
| $16.35 |
| Institutional Class, $0.01 Par Value |
| $31,622 |
| 1,920 |
| $16.47 |
| R Class, $0.01 Par Value |
| $141,528 |
| 8,838 |
| $16.01 |
| Advisor Class, $0.01 Par Value |
| $3,220,935 |
| 199,092 |
| $16.18 |
See Notes to Financial Statements.
|
| | | |
| YEAR ENDED JULY 31, 2014 |
| Investment Income (Loss) |
| Income: | |
| Dividends (net of foreign taxes withheld of $1,873) | $ | 248,827 |
|
| Interest | 62 |
|
| | 248,889 |
|
| | |
| Expenses: | |
| Management fees | 168,782 |
|
| Distribution and service fees: | |
| R Class | 629 |
|
| Advisor Class | 2,539 |
|
| Directors' fees and expenses | 242 |
|
| Other expenses | 39 |
|
| | 172,231 |
|
| | |
| Net investment income (loss) | 76,658 |
|
| | |
| Realized and Unrealized Gain (Loss) | |
| Net realized gain (loss) on: | |
| Investment transactions | 2,029,088 |
|
| Foreign currency transactions | 18 |
|
| | 2,029,106 |
|
| | |
| Change in net unrealized appreciation (depreciation) on investments | (476,478 | ) |
| | |
| Net realized and unrealized gain (loss) | 1,552,628 |
|
| | |
| Net Increase (Decrease) in Net Assets Resulting from Operations | $ | 1,629,286 |
|
See Notes to Financial Statements.
|
|
| Statement of Changes in Net Assets |
|
| | | | | | |
| YEARS ENDED JULY 31, 2014 AND JULY 31, 2013 |
| Increase (Decrease) in Net Assets | July 31, 2014 | July 31, 2013 |
| Operations |
| Net investment income (loss) | $ | 76,658 |
| $ | 104,497 |
|
| Net realized gain (loss) | 2,029,106 |
| 1,076,388 |
|
| Change in net unrealized appreciation (depreciation) | (476,478 | ) | 1,143,296 |
|
| Net increase (decrease) in net assets resulting from operations | 1,629,286 |
| 2,324,181 |
|
| | | |
| Distributions to Shareholders | | |
| From net investment income: | | |
| Investor Class | (155,888 | ) | (123,358 | ) |
| Institutional Class | (378 | ) | (331 | ) |
| R Class | (1,047 | ) | (502 | ) |
| Advisor Class | (5,655 | ) | (4,381 | ) |
| Decrease in net assets from distributions | (162,968 | ) | (128,572 | ) |
| | | |
| Capital Share Transactions | | |
Net increase (decrease) in net assets from capital share transactions (Note 5) | 12,838,925 |
| (570,132 | ) |
| | | |
| Net increase (decrease) in net assets | 14,305,243 |
| 1,625,477 |
|
| | | |
| Net Assets | | |
| Beginning of period | 10,320,649 |
| 8,695,172 |
|
| End of period | $ | 24,625,892 |
| $ | 10,320,649 |
|
| | | |
| Undistributed net investment income | $ | 86,345 |
| $ | 161,194 |
|
See Notes to Financial Statements.
|
|
| Notes to Financial Statements |
JULY 31, 2014
1. Organization
American Century Growth Funds, Inc. (the corporation) is registered under the Investment Company Act of 1940, as amended (the 1940 Act), as an open-end management investment company and is organized as a Maryland corporation. Legacy Multi Cap Fund (the fund) is one fund in a series issued by the corporation. The fund is diversified as defined under the 1940 Act. The fund’s investment objective is to seek long-term capital growth.
The fund offers the Investor Class, the Institutional Class, the R Class and the Advisor Class. The share classes differ principally in their respective distribution and shareholder servicing expenses and arrangements. The Institutional Class is made available to institutional shareholders or through financial intermediaries whose clients do not require the same level of shareholder and administrative services as shareholders of other classes. As a result, the Institutional Class is charged a lower unified management fee.
2. Significant Accounting Policies
The following is a summary of significant accounting policies consistently followed by the fund in preparation of its financial statements. The financial statements are prepared in conformity with accounting principles generally accepted in the United States of America, which may require management to make certain estimates and assumptions at the date of the financial statements. Actual results could differ from these estimates. Management evaluated the impact of events or transactions occurring through the date the financial statements were issued that would merit recognition or disclosure.
Investment Valuations — The fund determines the fair value of its investments and computes its net asset value per share at the close of regular trading (usually 4 p.m. Eastern time) on the New York Stock Exchange (NYSE) on each day the NYSE is open. The Board of Directors has adopted valuation policies and procedures to guide the investment advisor in the fund’s investment valuation process and to provide methodologies for the oversight of the fund’s pricing function.
Equity securities that are listed or traded on a domestic securities exchange are valued at the last reported sales price or at the official closing price as provided by the exchange. Equity securities traded on foreign securities exchanges are generally valued at the closing price of such securities on the exchange where primarily traded or at the close of the NYSE, if that is earlier. If no last sales price is reported, or if local convention or regulation so provides, the mean of the latest bid and asked prices may be used. Securities traded over-the-counter are valued at the mean of the latest bid and asked prices, the last sales price, or the official closing price. Equity securities initially expressed in local currencies are translated into U.S. dollars at the mean of the appropriate currency exchange rate at the close of the NYSE as provided by an independent pricing service.
Fixed income securities maturing within 60 days at the time of purchase may be valued at cost, plus or minus any amortized discount or premium or at the evaluated mean as provided by an independent pricing service. Evaluated mean prices are commonly derived through utilization of market models, which may consider, among other factors: trade data, quotations from dealers and active market makers, relevant yield curve and spread data, related sector levels, creditworthiness, trade data or market information on comparable securities, and other relevant security specific information.
Open-end management investment companies are valued at the reported net asset value per share. Repurchase agreements are valued at cost, which approximates fair value.
If the fund determines that the market price for an investment is not readily available or the valuation methods mentioned above do not reflect an investment’s fair value, such investment is valued as determined in good faith by the Board of Directors or its delegate, in accordance with policies and procedures adopted by the Board of Directors. In its determination of fair value, the fund may review several factors including, but not limited to, market information regarding the specific investment or comparable investments and correlation with other investment types, futures indices or general market indicators. Circumstances that may cause the fund to use these procedures to value an investment include, but are not limited to: an investment has been declared in default or is distressed; trading in a security has been suspended during the trading day or a
security is not actively trading on its principal exchange; prices received from a regular pricing source are deemed unreliable; or there is a foreign market holiday and no trading occurred.
The fund monitors for significant events occurring after the close of an investment’s primary exchange but before the fund’s net asset value per share is determined. Significant events may include, but are not limited to: corporate announcements and transactions; governmental action and political unrest that could impact a specific investment or an investment sector; or armed conflicts, natural disasters and similar events that could affect investments in a specific country or region. The fund also monitors for significant fluctuations between domestic and foreign markets, as evidenced by the U.S. market or such other indicators that the Board of Directors, or its delegate, deems appropriate. If significant fluctuations in foreign markets are identified, the fund may apply a model-derived factor to the closing price of equity securities traded on foreign securities exchanges. The factor is based on observable market data as provided by an independent pricing service.
Security Transactions — Security transactions are accounted for as of the trade date. Net realized gains and losses are determined on the identified cost basis, which is also used for federal income tax purposes.
Investment Income — Dividend income less foreign taxes withheld, if any, is recorded as of the ex-dividend date. Distributions received on securities that represent a return of capital or long-term capital gain are recorded as a reduction of cost of investments and/or as a realized gain. The fund may estimate the components of distributions received that may be considered nontaxable distributions or long-term capital gain distributions for income tax purposes. Interest income is recorded on the accrual basis and includes accretion of discounts and amortization of premiums.
Foreign Currency Translations — All assets and liabilities initially expressed in foreign currencies are translated into U.S. dollars at prevailing exchange rates at period end. The fund may enter into spot foreign currency exchange contracts to facilitate transactions denominated in a foreign currency. Purchases and sales of investment securities, dividend and interest income, spot foreign currency exchange contracts, and expenses are translated at the rates of exchange prevailing on the respective dates of such transactions. Net realized and unrealized foreign currency exchange gains or losses related to investment securities are a component of net realized gain (loss) on investment transactions and change in net unrealized appreciation (depreciation) on investments, respectively.
Repurchase Agreements — The fund may enter into repurchase agreements with institutions that American Century Investment Management, Inc. (ACIM) (the investment advisor) has determined are creditworthy pursuant to criteria adopted by the Board of Directors. The fund requires that the collateral, represented by securities, received in a repurchase transaction be transferred to the custodian in a manner sufficient to enable the fund to obtain those securities in the event of a default under the repurchase agreement. ACIM monitors, on a daily basis, the securities transferred to ensure the value, including accrued interest, of the securities under each repurchase agreement is equal to or greater than amounts owed to the fund under each repurchase agreement.
Joint Trading Account — Pursuant to an Exemptive Order issued by the Securities and Exchange Commission, the fund, along with certain other funds in the American Century Investments family of funds, may transfer uninvested cash balances into a joint trading account. These balances are invested in one or more repurchase agreements that are collateralized by U.S. Treasury or Agency obligations.
Income Tax Status — It is the fund’s policy to distribute substantially all net investment income and net realized gains to shareholders and to otherwise qualify as a regulated investment company under provisions of the Internal Revenue Code. Accordingly, no provision has been made for income taxes. The fund files U.S. federal, state, local and non-U.S. tax returns as applicable. The fund's tax returns are subject to examination by the relevant taxing authority until expiration of the applicable statute of limitations, which is generally three years from the date of filing but can be longer in certain jurisdictions. At this time, management believes there are no uncertain tax positions which, based on their technical merit, would not be sustained upon examination and for which it is reasonably possible that the total amounts of unrecognized tax benefits will significantly change in the next twelve months.
Multiple Class — All shares of the fund represent an equal pro rata interest in the net assets of the class to which such shares belong, and have identical voting, dividend, liquidation and other rights and the same terms and conditions, except for class specific expenses and exclusive rights to vote on matters affecting only individual classes. Income, non-class specific expenses, and realized and unrealized capital gains and losses of the fund are allocated to each class of shares based on their relative net assets.
Distributions to Shareholders — Distributions from net investment income and net realized gains, if any, are generally declared and paid annually.
Indemnifications — Under the corporation’s organizational documents, its officers and directors are indemnified against certain liabilities arising out of the performance of their duties to the fund. In addition, in the normal course of business, the fund enters into contracts that provide general indemnifications. The maximum exposure under these arrangements is unknown as this would involve future claims that may be made against a fund. The risk of material loss from such claims is considered by management to be remote.
3. Fees and Transactions with Related Parties
Certain officers and directors of the corporation are also officers and/or directors of American Century Companies, Inc. (ACC). The corporation’s investment advisor, ACIM, the corporation's distributor, American Century Investment Services, Inc. (ACIS), and the corporation’s transfer agent, American Century Services, LLC, are wholly owned, directly or indirectly, by ACC.
Management Fees — The corporation has entered into a management agreement with ACIM, under which ACIM provides the fund with investment advisory and management services in exchange for a single, unified management fee (the fee) per class. The agreement provides that all expenses of managing and operating the fund, except distribution and service fees, brokerage expenses, taxes, interest, fees and expenses of the independent directors (including legal counsel fees), and extraordinary expenses, will be paid by ACIM. The fee is computed and accrued daily based on each class’s daily net assets and paid monthly in arrears. The rate of the fee is determined by applying a fee rate calculation formula. This formula takes into account the fund’s assets as well as certain assets, if any, of other clients of the investment advisor outside the American Century Investments family of funds (such as subadvised funds and separate accounts) that have very similar investment teams and investment strategies (strategy assets). The annual management fee schedule ranges from 0.85% to 1.15% for the Investor Class, R Class and Advisor Class. The annual management fee schedule ranges from 0.65% to 0.95% for the Institutional Class. The effective annual management fee for each class for the year ended July 31, 2014 was 1.15% for the Investor Class, R Class and Advisor Class and 0.95% for the Institutional Class.
Distribution and Service Fees — The Board of Directors has adopted a separate Master Distribution and Individual Shareholder Services Plan for each of the R Class and Advisor Class (collectively the plans), pursuant to Rule 12b-1 of the 1940 Act. The plans provide that the R Class will pay ACIS an annual distribution and service fee of 0.50%. The plans provide that the Advisor Class will pay ACIS an annual distribution and service fee of 0.25%. The fees are computed and accrued daily based on each class’s daily net assets and paid monthly in arrears. The fees are used to pay financial intermediaries for distribution and individual shareholder services. Fees incurred under the plans during the year ended July 31, 2014 are detailed in the Statement of Operations.
Directors' Fees and Expenses — The Board of Directors is responsible for overseeing the investment advisor’s management and operations of the fund. The directors receive detailed information about the fund and its investment advisor regularly throughout the year, and meet at least quarterly with management of the investment advisor to review reports about fund operations. Fees and expenses incurred in conjunction with the directors during the year ended July 31, 2014 are detailed in the Statement of Operations. The fund’s officers do not receive compensation from the fund.
4. Investment Transactions
Purchases and sales of investment securities, excluding short-term investments, for the year ended July 31, 2014 were $37,745,780 and $25,496,565, respectively.
5. Capital Share Transactions
The corporation is authorized to issue 3,000,000,000 shares. Transactions in shares of the fund were as follows:
|
| | | | | | | | | | |
| | Year ended July 31, 2014 | Year ended July 31, 2013 |
| | Shares | Amount | Shares | Amount |
| Investor Class | | | | |
| Sold | 859,441 |
| $ | 13,788,470 |
| 124,826 |
| $ | 1,662,991 |
|
| Issued in reinvestment of distributions | 9,711 |
| 148,871 |
| 9,869 |
| 116,454 |
|
| Redeemed | (248,279 | ) | (3,915,271 | ) | (193,154 | ) | (2,392,422 | ) |
| | 620,873 |
| 10,022,070 |
| (58,459 | ) | (612,977 | ) |
| Institutional Class | | | | |
| Sold | 307 |
| 4,996 |
| — |
| — |
|
| Issued in reinvestment of distributions | 25 |
| 378 |
| 27 |
| 331 |
|
| | 332 |
| 5,374 |
| 27 |
| 331 |
|
| R Class | | | | |
| Sold | 1,113 |
| 17,370 |
| 4,188 |
| 56,331 |
|
| Issued in reinvestment of distributions | 69 |
| 1,047 |
| 43 |
| 502 |
|
| Redeemed | (281 | ) | (4,040 | ) | (57 | ) | (717 | ) |
| | 901 |
| 14,377 |
| 4,174 |
| 56,116 |
|
| Advisor Class | | | | |
| Sold | 204,244 |
| 3,319,051 |
| 3,612 |
| 45,104 |
|
| Issued in reinvestment of distributions | 366 |
| 5,570 |
| 374 |
| 4,381 |
|
| Redeemed | (32,335 | ) | (527,517 | ) | (5,320 | ) | (63,087 | ) |
| | 172,275 |
| 2,797,104 |
| (1,334 | ) | (13,602 | ) |
| Net increase (decrease) | 794,381 |
| $ | 12,838,925 |
| (55,592 | ) | $ | (570,132 | ) |
6. Fair Value Measurements
The fund’s investments valuation process is based on several considerations and may use multiple inputs to determine the fair value of the investments held by the fund. In conformity with accounting principles generally accepted in the United States of America, the inputs used to determine a valuation are classified into three broad levels.
| |
| • | Level 1 valuation inputs consist of unadjusted quoted prices in an active market for identical investments. |
| |
| • | Level 2 valuation inputs consist of direct or indirect observable market data (including quoted prices for comparable investments, evaluations of subsequent market events, interest rates, prepayment speeds, credit risk, etc.). These inputs also consist of quoted prices for identical investments initially expressed in local currencies that are adjusted through translation into U.S. dollars. |
| |
| • | Level 3 valuation inputs consist of unobservable data (including a fund’s own assumptions). |
The level classification is based on the lowest level input that is significant to the fair valuation measurement. The valuation inputs are not necessarily an indication of the risks associated with investing in these securities or other financial instruments.
The following is a summary of the level classifications as of period end. The Schedule of Investments provides additional information on the fund’s portfolio holdings.
|
| | | | | | | | | |
| | | Level 1 | Level 2 | Level 3 |
| Assets | | | |
| Investment Securities | | | |
| Common Stocks | $ | 24,030,567 |
| — |
| — |
|
| Temporary Cash Investments | 308,624 |
| $ | 269,054 |
| — |
|
| | | $ | 24,339,191 |
| $ | 269,054 |
| — |
|
7. Risk Factors
The fund’s investment process may result in high portfolio turnover, which could mean high transaction costs, affecting both performance and capital gains tax liabilities to investors.
The fund invests in common stocks of small companies. Because of this, it may be subject to greater risk and market fluctuations than a fund investing in larger, more established companies.
8. Federal Tax Information
The tax character of distributions paid during the years ended July 31, 2014 and July 31, 2013 were as follows:
|
| | | | | | |
| | 2014 | 2013 |
| Distributions Paid From |
| Ordinary income | $ | 162,968 |
| $ | 128,572 |
|
| Long-term capital gains | — |
| — |
|
The book-basis character of distributions made during the year from net investment income or net realized gains may differ from their ultimate characterization for federal income tax purposes. These differences reflect the differing character of certain income items and net realized gains and losses for financial statement and tax purposes, and may result in reclassification among certain capital accounts on the financial statements.
As of July 31, 2014, the federal tax cost of investments and the components of distributable earnings on a tax-basis were as follows:
|
| | | |
| Federal tax cost of investments | $ | 23,551,110 |
|
| Gross tax appreciation of investments | $ | 1,496,499 |
|
| Gross tax depreciation of investments | (439,364 | ) |
| Net tax appreciation (depreciation) of investments | 1,057,135 |
|
| Undistributed ordinary income | $ | 86,345 |
|
| Accumulated short-term capital losses | $ | (6,011,248 | ) |
The difference between book-basis and tax-basis unrealized appreciation (depreciation) is attributable primarily to the tax deferral of losses on wash sales and return of capital dividends received.
Accumulated capital losses represent net capital loss carryovers that may be used to offset future realized capital gains for federal income tax purposes. Future capital loss carryover utilization in any given year may be subject to Internal Revenue Code limitations. Capital loss carryovers of $(5,310,161) and $(701,087) expire in 2017 and 2018, respectively.
|
| | | | | | | | | | | | | |
| For a Share Outstanding Throughout the Years Ended July 31 (except as noted) |
| Per-Share Data | Ratios and Supplemental Data |
| | | Income From Investment Operations: | | | | Ratio to Average Net Assets of: | | |
| | Net Asset Value, Beginning of Period | Net Investment Income (Loss)(1) | Net Realized and Unrealized Gain (Loss) | Total From Investment Operations | Distributions From Net Investment Income | Net Asset Value, End of Period | Total Return(2) | Operating Expenses | Net Investment Income (Loss) | Portfolio Turnover Rate | Net Assets, End of Period (in thousands) |
| Investor Class |
| 2014 | $14.46 | 0.09 | 2.01 | 2.10 | (0.21) | $16.35 | 14.60% | 1.15% | 0.54% | 175% |
| $21,232 |
|
| 2013 | $11.30 | 0.15 | 3.20 | 3.35 | (0.19) | $14.46 | 30.01% | 1.16% | 1.21% | 170% |
| $9,801 |
|
| 2012 | $10.90 | 0.19 | 0.33 | 0.52 | (0.12) | $11.30 | 4.87% | 1.16% | 1.72% | 179% |
| $8,321 |
|
| 2011 | $8.74 | 0.12 | 2.04 | 2.16 | — | $10.90 | 24.71% | 1.17% | 1.14% | 246% |
| $8,041 |
|
| 2010 | $7.79 | 0.02 | 1.05 | 1.07 | (0.12) | $8.74 | 13.75% | 1.16% | 0.22% | 235% |
| $7,283 |
|
| Institutional Class |
| 2014 | $14.56 | 0.12 | 2.03 | 2.15 | (0.24) | $16.47 | 14.86% | 0.95% | 0.74% | 175% |
| $32 |
|
| 2013 | $11.38 | 0.18 | 3.21 | 3.39 | (0.21) | $14.56 | 30.23% | 0.96% | 1.41% | 170% |
| $23 |
|
| 2012 | $10.98 | 0.22 | 0.32 | 0.54 | (0.14) | $11.38 | 5.05% | 0.96% | 1.92% | 179% |
| $18 |
|
| 2011 | $8.79 | 0.14 | 2.05 | 2.19 | — | $10.98 | 24.91% | 0.97% | 1.34% | 246% |
| $33 |
|
| 2010 | $7.83 | 0.04 | 1.06 | 1.10 | (0.14) | $8.79 | 14.04% | 0.96% | 0.42% | 235% |
| $23 |
|
|
| | | | | | | | | | | | | |
| For a Share Outstanding Throughout the Years Ended July 31 (except as noted) |
| Per-Share Data | Ratios and Supplemental Data |
| | | Income From Investment Operations: | | | | Ratio to Average Net Assets of: | | |
| | Net Asset Value, Beginning of Period | Net Investment Income (Loss)(1) | Net Realized and Unrealized Gain (Loss) | Total From Investment Operations | Distributions From Net Investment Income | Net Asset Value, End of Period | Total Return(2) | Operating Expenses | Net Investment Income (Loss) | Portfolio Turnover Rate | Net Assets, End of Period (in thousands) |
| R Class |
| 2014 | $14.16 | —(3) | 1.98 | 1.98 | (0.13) | $16.01 | 14.03% | 1.65% | 0.04% | 175% |
| $142 |
|
| 2013 | $11.07 | 0.06 | 3.16 | 3.22 | (0.13) | $14.16 | 29.36% | 1.66% | 0.71% | 170% |
| $112 |
|
| 2012 | $10.68 | 0.16 | 0.30 | 0.46 | (0.07) | $11.07 | 4.34% | 1.66% | 1.22% | 179% |
| $42 |
|
| 2011 | $8.61 | 0.07 | 2.00 | 2.07 | — | $10.68 | 24.04% | 1.67% | 0.64% | 246% |
| $72 |
|
| 2010 | $7.67 | (0.03) | 1.05 | 1.02 | (0.08) | $8.61 | 13.25% | 1.66% | (0.28)% | 235% |
| $56 |
|
| Advisor Class |
| 2014 | $14.31 | 0.05 | 1.99 | 2.04 | (0.17) | $16.18 | 14.32% | 1.40% | 0.29% | 175% |
| $3,221 |
|
| 2013 | $11.19 | 0.12 | 3.16 | 3.28 | (0.16) | $14.31 | 29.63% | 1.41% | 0.96% | 170% |
| $384 |
|
| 2012 | $10.79 | 0.17 | 0.32 | 0.49 | (0.09) | $11.19 | 4.65% | 1.41% | 1.47% | 179% |
| $315 |
|
| 2011 | $8.68 | 0.09 | 2.02 | 2.11 | — | $10.79 | 24.31% | 1.42% | 0.89% | 246% |
| $393 |
|
| 2010 | $7.73 | —(3) | 1.05 | 1.05 | (0.10) | $8.68 | 13.57% | 1.41% | (0.03)% | 235% |
| $406 |
|
|
|
Notes to Financial Highlights
|
| |
| (1) | Computed using average shares outstanding throughout the period. |
| |
| (2) | Total returns are calculated based on the net asset value of the last business day. Total returns for periods less than one year are not annualized. |
| |
| (3) | Per-share amount was less than $0.005. |
See Notes to Financial Statements.
|
|
| Report of Independent Registered Public Accounting Firm |
To the Board of Directors and Shareholders of
American Century Growth Funds, Inc.:
We have audited the accompanying statement of assets and liabilities, including the schedule of investments, of Legacy Multi Cap Fund (the “Fund”), one of the funds constituting American Century Growth Funds, Inc., as of July 31, 2014, and the related statement of operations for the year then ended, the statements of changes in net assets for each of the two years in the period then ended, and the financial highlights for each of the periods presented. These financial statements and financial highlights are the responsibility of the Fund's management. Our responsibility is to express an opinion on these financial statements and financial highlights based on our audits.
We conducted our audits in accordance with the standards of the Public Company Accounting Oversight Board (United States). Those standards require that we plan and perform the audit to obtain reasonable assurance about whether the financial statements and financial highlights are free of material misstatement. The Fund is not required to have, nor were we engaged to perform, an audit of its internal control over financial reporting. Our audits included consideration of internal control over financial reporting as a basis for designing audit procedures that are appropriate in the circumstances, but not for the purpose of expressing an opinion on the effectiveness of the Fund's internal control over financial reporting. Accordingly, we express no such opinion. An audit also includes examining, on a test basis, evidence supporting the amounts and disclosures in the financial statements, assessing the accounting principles used and significant estimates made by management, as well as evaluating the overall financial statement presentation. Our procedures included confirmation of securities owned as of July 31, 2014, by correspondence with the custodian and brokers; where replies were not received from brokers, we performed other auditing procedures. We believe that our audits provide a reasonable basis for our opinion.
In our opinion, the financial statements and financial highlights referred to above present fairly, in all material respects, the financial position of Legacy Multi Cap Fund of American Century Growth Funds, Inc. as of July 31, 2014, the results of its operations for the year then ended, the changes in its net assets for each of the two years in the period then ended, and the financial highlights for each of the periods presented, in conformity with accounting principles generally accepted in the United States of America.
Deloitte & Touche LLP
Kansas City, Missouri
September 17, 2014
The Board of Directors
The individuals listed below serve as directors of the funds. Each director will continue to serve in this capacity until death, retirement, resignation or removal from office. The board has adopted a mandatory retirement age for directors who are not “interested persons,” as that term is defined in the Investment Company Act (independent directors). Independent directors shall retire by December 31 of the year in which they reach their 75th birthday.
Mr. Thomas is an “interested person” because he currently serves as President and Chief Executive Officer of American Century Companies, Inc. (ACC), the parent company of American Century Investment Management, Inc. (ACIM or the advisor). Mr. Fink is treated as an “interested person” because of his recent employment with ACC and American Century Services, LLC (ACS). The other directors (more than three-fourths of the total number) are independent. They are not employees, directors or officers of, and have no financial interest in, ACC or any of its wholly owned, direct or indirect, subsidiaries, including ACIM, American Century Investment Services, Inc. (ACIS) and ACS, and do not have any other affiliations, positions, or relationships that would cause them to be considered “interested persons” under the Investment Company Act. The directors serve in this capacity for seven (in the case of Mr. Thomas, 15) registered investment companies in the American Century Investments family of funds.
The following table presents additional information about the directors. The mailing address for each director is 4500 Main Street, Kansas City, Missouri 64111.
|
| | | | | |
Name (Year of Birth) | Position(s) Held with Funds | Length of Time Served | Principal Occupation(s) During Past 5 Years | Number of American Century Portfolios Overseen by Director | Other Directorships Held During Past 5 Years |
| Independent Directors | | | | |
Thomas A. Brown (1940) | Director | Since 1980 | Managing Member, Associated Investments, LLC (real estate investment company); Brown Cascade Properties, LLC (real estate investment company) (2001 to 2009) | 73 | None |
Andrea C. Hall (1945) | Director | Since 1997 | Retired | 73 | None |
Jan M. Lewis (1957) | Director | Since 2011 | Retired; President and Chief Executive Officer, Catholic Charities of Northeast Kansas (human services organization) (2006 to 2013) | 73 | None |
James A. Olson (1942) | Director and Chairman of the Board | Since 2007 (Chairman since 2014) | Member, Plaza Belmont LLC (private equity fund manager) | 73 | Saia, Inc. (2002 to 2012) and EPR Properties (2003 to 2013) |
M. Jeannine Strandjord
(1945) | Director | Since 1994 | Retired | 73 | Euronet Worldwide Inc.; Charming Shoppes, Inc. (2006 to 2010); and DST Systems Inc. (1996
to 2012) |
|
| | | | | |
Name (Year of Birth) | Position(s) Held with Funds | Length of Time Served | Principal Occupation(s) During Past 5 Years | Number of American Century Portfolios Overseen by Director | Other Directorships Held During Past 5 Years |
| Independent Directors | | | | |
John R. Whitten (1946) | Director | Since 2008 | Retired | 73 | Rudolph Technologies, Inc. |
Stephen E. Yates (1948) | Director | Since 2012 | Retired; Executive Vice President, Technology & Operations, KeyCorp. (computer services) (2004 to 2010) | 73 | Applied Industrial Technologies, Inc. (2001 to 2010) |
| Interested Directors | | | | |
Barry Fink (1955) | Director | Since 2012 | Retired; Executive Vice President, ACC (September 2007 to February 2013); President, ACS (October 2007 to February 2013); Chief Operating Officer, ACC (September 2007 to November 2012) | 73 | None |
Jonathan S. Thomas (1963) | Director and President | Since 2007 | President and Chief Executive Officer, ACC (March 2007 to present). Also serves as Chief Executive Officer, ACS; Executive Vice President, ACIM; Director, ACC, ACIM and other ACC subsidiaries | 118 | BioMed Valley Discoveries, Inc.
|
The Statement of Additional Information has additional information about the fund's directors and is available without charge, upon request, by calling 1-800-345-2021.
Officers
The following table presents certain information about the executive officers of the funds. Each officer serves as an officer for each of the 15 investment companies in the American Century family of funds, unless otherwise noted. No officer is compensated for his or her service as an officer of the funds. The listed officers are interested persons of the funds and are appointed or re-appointed on an annual basis. The mailing address for each officer listed below is 4500 Main Street, Kansas City, Missouri 64111.
|
| | |
Name (Year of Birth) | Offices with the Funds | Principal Occupation(s) During the Past Five Years |
Jonathan S. Thomas (1963) | Director and President since 2007 | President and Chief Executive Officer, ACC (March 2007 to present). Also serves as Chief Executive Officer, ACS; Executive Vice President, ACIM; Director, ACC, ACIM and other ACC subsidiaries |
Amy D. Shelton
(1964) | Chief Compliance
Officer since 2014 | Chief Compliance Officer, American Century funds, (March 2014 to present); Chief Compliance Officer, ACIM (February 2014 to present); Chief Compliance Officer, ACIS (October 2009 to present); Vice President, Client Interactions and Marketing, ACIS (February 2013 to January 2014); Director, Client Interactions and Marketing, ACIS (June 2007 to January 2013). Also serves as Vice President, ACIS |
Charles A. Etherington (1957) | General Counsel since 2007 and Senior Vice President since 2006 | Attorney, ACC (February 1994 to present); Vice President, ACC (November 2005 to present); General Counsel, ACC (March 2007 to present). Also serves as General Counsel, ACIM, ACS, ACIS and other ACC subsidiaries; and Senior Vice President, ACIM and ACS |
C. Jean Wade (1964) | Vice President, Treasurer and Chief Financial Officer since 2012 | Vice President, ACS (February 2000 to present) |
Robert J. Leach (1966) | Vice President since 2006 and Assistant Treasurer since 2012 | Vice President, ACS (February 2000 to present) |
David H. Reinmiller (1963) | Vice President since 2000 | Attorney, ACC (January 1994 to present); Associate General Counsel, ACC (January 2001 to present). Also serves as Vice President, ACIM and ACS |
Ward D. Stauffer (1960) | Secretary since 2005 | Attorney, ACC (June 2003 to present) |
|
|
| Approval of Management Agreement |
At a meeting held on June 18, 2014, the Fund’s Board of Directors unanimously approved the renewal of the management agreement pursuant to which American Century Investment Management, Inc. (the “Advisor”) acts as the investment advisor for the Fund. Under Section 15(c) of the Investment Company Act, contracts for investment advisory services are required to be reviewed, evaluated, and approved by a majority of a fund’s directors (the “Directors”), including a majority of the independent Directors, each year.
Prior to its consideration of the renewal of the management agreement, the Board requested and reviewed extensive data and information compiled by the Advisor and certain independent providers of evaluation data concerning the Fund and the services provided to the Fund by the Advisor. This review was in addition to the oversight and evaluation undertaken by the Board and its committees on a continuous basis and the information received was supplemental to the extensive information that the Board and its committees receive and consider throughout the year.
In connection with its consideration of the renewal of the management agreement, the Board’s review and evaluation of the services provided by the Advisor included, but was not limited to, the following:
| |
| • | the nature, extent, and quality of investment management, shareholder services, and other services provided by the Advisor to the Fund; |
| |
| • | the wide range of other programs and services the Advisor provides to the Fund and its shareholders on a routine and non-routine basis; |
| |
| • | the Fund’s investment performance compared to appropriate benchmarks and/or a peer group of other mutual funds with similar investment objectives and strategies; |
| |
| • | the cost of owning the Fund compared to the cost of owning similar funds; |
| |
| • | the Advisor’s compliance policies, procedures, and regulatory experience; |
| |
| • | financial data showing the cost of services provided to the Fund, the profitability of the Fund to the Advisor, and the overall profitability of the Advisor; |
| |
| • | possible economies of scale associated with the Advisor’s management of the Fund and other accounts under its management; |
| |
| • | the services provided and charges to other investment management clients of the Advisor |
| |
| • | acquired fund fees and expenses; and |
| |
| • | any collateral benefits derived by the Advisor from the management of the Fund. |
In keeping with its practice, the Board held two in-person meetings and one telephonic meeting to review and discuss the information provided. The independent Directors also had the benefit of the advice of their independent counsel throughout the process.
Factors Considered
The Directors considered all of the information provided by the Advisor, the independent data providers, and independent counsel, and evaluated such information for the Fund. In connection with their review, the Directors did not identify any single factor as being all-important or controlling, and each Director may have attributed different levels of importance to different factors. In deciding to renew the management agreement, the Board based its decision on a number of factors, including the following:
Nature, Extent and Quality of Services — Generally. Under the management agreement, the Advisor is responsible for providing or arranging for all services necessary for the operation of the Fund. The Board noted that under the management agreement, the Advisor provides or arranges at its own expense a wide variety of services including:
| |
| • | constructing and designing the Fund |
| |
| • | portfolio research and security selection |
| |
| • | initial capitalization/funding |
| |
| • | daily valuation of the Fund’s portfolio |
| |
| • | shareholder servicing and transfer agency, including shareholder confirmations, recordkeeping, and communications |
| |
| • | legal services (except the independent Directors’ counsel) |
| |
| • | regulatory and portfolio compliance |
| |
| • | marketing and distribution (except Rule 12b-1 plans) |
The Board noted that many of these services have expanded over time both in terms of quantity and complexity in response to shareholder demands, competition in the industry, changing distribution channels, and the changing regulatory environment.
Investment Management Services. The nature of the investment management services provided to the Fund is quite complex and allows Fund shareholders access to professional money management, instant diversification of their investments within an asset class, the opportunity to easily diversify among asset classes by investing in or exchanging among various American Century Investments funds, and liquidity. In evaluating investment performance, the Board expects the Advisor to manage the Fund in accordance with its investment objectives and approved strategies. Further, the Directors recognize that the Advisor has an obligation to monitor trading activities, and in particular to seek the best execution of fund trades, and to evaluate the use of and payment for research. In providing these services, the Advisor utilizes teams of investment professionals (portfolio managers, analysts, research assistants, and securities traders) who require extensive information technology, research, training, compliance and other systems to conduct their business. The Board, directly and through its Fund Performance Review Committee, regularly reviews investment performance information for the Fund, together with comparative information for appropriate benchmarks and/or peer groups of similarly-managed funds, over different time horizons. The Directors also review detailed performance information during the management agreement approval process. If performance concerns are identified, the Fund receives special reviews until performance improves, during which the Board discusses with the Advisor the reasons for such results (e.g., market conditions, security selection) and any efforts being undertaken to improve performance. The Fund’s performance was above its benchmark for the one-, three-, and five-year periods reviewed by the Board. Taking all these factors into consideration, the Board found the investment management services provided by the Advisor to the Fund to be satisfactory and consistent with the management agreement.
Shareholder and Other Services. Under the management agreement, the Advisor provides the Fund with a comprehensive package of transfer agency, shareholder, and other services. The Board, directly and through various committees of the Board, regularly reviews reports and evaluations of such services at its regular meetings. These reports include, but are not limited to, information regarding the operational efficiency and accuracy of the shareholder and transfer agency services provided, staffing levels, shareholder satisfaction (as measured by external as well as internal sources), technology support, new products and services offered to Fund shareholders, securities trading activities, portfolio valuation services, auditing services, and legal and operational compliance activities. Certain aspects of shareholder and transfer agency service level efficiency and the quality of securities trading activities are measured by independent third party providers and are presented in comparison to other fund groups not managed by the Advisor. The Board
found the services provided by the Advisor to the Fund under the management agreement to be competitive and of high quality.
Costs of Services and Profitability. The Advisor provides detailed information concerning its cost of providing various services to the Fund, its profitability in managing the Fund (pre- and post-distribution), its overall profitability, and its financial condition. The Directors have reviewed with the Advisor the methodology used to prepare this financial information. The financial information regarding the Advisor is considered in evaluating the Advisor’s financial condition, its ability to continue to provide services under the management agreement, and the reasonableness of the current management fee. The Board concluded that the Advisor’s profits were reasonable in light of the services provided to the Fund.
Ethics. The Board generally considers the Advisor’s commitment to providing quality services to shareholders and to conducting its business ethically. They noted that the Advisor’s practices generally meet or exceed industry best practices.
Economies of Scale. The Board also reviewed information provided by the Advisor regarding the possible existence of economies of scale in connection with the management of the Fund. The Board concluded that economies of scale are difficult to measure and predict with precision, especially on a fund-by-fund basis. The Board concluded that the Advisor is appropriately sharing economies of scale through its competitive fee structure, offering competitive fees from fund inception, and through reinvestment in its business to provide shareholders additional content and services.
Comparison to Other Funds’ Fees. The management agreement provides that the Fund pays the Advisor a single, all-inclusive (or unified) management fee for providing all services necessary for the management and operation of the Fund, other than brokerage expenses, taxes, interest, extraordinary expenses, and the fees and expenses of the Fund’s independent directors (including their independent legal counsel) and expenses incurred in connection with the provision of shareholder services and distribution services under a plan adopted pursuant to Rule 12b-1 under the 1940 Act. Under the unified fee structure, the Advisor is responsible for providing all investment advisory, custody, audit, administrative, compliance, recordkeeping, marketing and shareholder services, or arranging and supervising third parties to provide such services. By contrast, most other funds are charged a variety of fees, including an investment advisory fee, a transfer agency fee, an administrative fee, distribution charges and other expenses. Other than their investment advisory fees and any applicable Rule 12b-1 distribution fees, all other components of the total fees charged by these other funds may be increased without shareholder approval. The Board believes the unified fee structure is a benefit to Fund shareholders because it clearly discloses to shareholders the cost of owning Fund shares, and, since the unified fee cannot be increased without a vote of Fund shareholders, it shifts to the Advisor the risk of increased costs of operating the Fund and provides a direct incentive to minimize administrative inefficiencies. Part of the Board’s analysis of fee levels involves reviewing certain evaluative data compiled by an independent provider comparing the Fund’s unified fee to the total expense ratios of its peers. The unified fee charged to shareholders of the Fund was below the median of the total expense ratios of the Fund’s peer expense universe and was within the range of its peer expense group. The Board concluded that the management fee paid by the Fund to the Advisor under the management agreement is reasonable in light of the services provided to the Fund.
Comparison to Fees and Services Provided to Other Clients of the Advisor. The Board also requested and received information from the Advisor concerning the nature of the services, fees, costs and profitability of its advisory services to advisory clients other than the Fund. They observed that these varying types of client accounts require different services and involve different regulatory and entrepreneurial risks than the management of the Fund. The Board analyzed this information and concluded that the fees charged and services provided to the Fund were reasonable by comparison.
Collateral or “Fall-Out” Benefits Derived by the Advisor. The Board considered the existence of collateral benefits the Advisor may receive as a result of its relationship with the Fund. They concluded that the Advisor’s primary business is managing mutual funds and it generally does not use fund or shareholder information to generate profits in other lines of business, and therefore does not derive any significant collateral benefits from them. The Board noted that the Advisor receives proprietary research from broker-dealers that execute fund portfolio transactions and concluded that this research is likely to benefit Fund shareholders. The Board also determined that the Advisor is able to provide investment management services to certain clients other than the Fund, at least in part, due to its existing infrastructure built to serve the fund complex. The Board concluded, however, that the assets of those other clients are not material to the analysis and, where applicable, may be included with the assets of the Fund to determine breakpoints in the management fee schedule.
Existing Relationship. The Board also considered whether there was any reason for not continuing the existing arrangement with the Advisor. In this regard, the Board was mindful of the potential disruptions of the Fund’s operations and various risks, uncertainties, and other effects that could occur as a result of a decision not to continue such relationship. In particular, the Board recognized that most shareholders have invested in the Fund on the strength of the Advisor’s industry standing and reputation and in the expectation that the Advisor will have a continuing role in providing advisory services to the Fund.
Conclusion of the Directors. As a result of this process, the Board, including all of the independent Directors, taking into account all of the factors discussed above and the information provided by the Advisor and others, concluded that the management agreement between the Fund and the Advisor is fair and reasonable in light of the services provided and should be renewed.
Retirement Account Information
As required by law, distributions you receive from certain IRAs are subject to federal income tax withholding, unless you elect not to have withholding apply. Tax will be withheld on the total amount withdrawn even though you may be receiving amounts that are not subject to withholding, such as nondeductible contributions. In such case, excess amounts of withholding could occur. You may adjust your withholding election so that a greater or lesser amount will be withheld.
If you don’t want us to withhold on this amount, you must notify us to not withhold the federal income tax. You may notify us in writing or in certain situations by telephone or through other electronic means. For systematic withdrawals, your withholding election will remain in effect until revoked or changed by filing a new election. You have the right to revoke your election at any time.
Remember, even if you elect not to have income tax withheld, you are liable for paying income tax on the taxable portion of your withdrawal. If you elect not to have income tax withheld or you don’t have enough income tax withheld, you may be responsible for payment of estimated tax. You may incur penalties under the estimated tax rules if your withholding and estimated tax payments are not sufficient. You can reduce or defer the income tax on a distribution by directly or indirectly rolling such distribution over to another IRA or eligible plan. You should consult your tax advisor for additional information.
State tax will be withheld if, at the time of your distribution, your address is within one of the mandatory withholding states and you have federal income tax withheld (or as otherwise required by state law). State taxes will be withheld from your distribution in accordance with the respective state rules.
Distributions you receive from 403(b), 457 and qualified plans are subject to special tax and withholding rules. Your plan administrator or plan sponsor is required to provide you with a special tax notice explaining those rules at the time you request a distribution. If applicable, federal and/or state taxes may be withheld from your distribution amount.
Proxy Voting Policies
A description of the policies that the fund's investment advisor uses in exercising the voting rights associated with the securities purchased and/or held by the fund is available without charge, upon request, by calling 1-800-345-2021. It is also available on the "About Us" page of American Century Investments’ website at americancentury.com and on the Securities and Exchange Commission’s website at sec.gov. Information regarding how the investment advisor voted proxies relating to portfolio securities during the most recent 12-month period ended June 30 is available on the "About Us" page at americancentury.com. It is also available at sec.gov.
Quarterly Portfolio Disclosure
The fund files its complete schedule of portfolio holdings with the Securities and Exchange Commission (SEC) for the first and third quarters of each fiscal year on Form N-Q. The fund’s Forms N-Q are available on the SEC’s website at sec.gov, and may be reviewed and copied at the SEC’s Public Reference Room in Washington, DC. Information on the operation of the Public Reference Room may be obtained by calling 1-800-SEC-0330. The fund also makes its complete schedule of portfolio holdings for the most recent quarter of its fiscal year available on its
website at americancentury.com and, upon request, by calling 1-800-345-2021.
Other Tax Information
The following information is provided pursuant to provisions of the Internal Revenue Code.
The fund hereby designates up to the maximum amount allowable as qualified dividend income for the fiscal year ended July 31, 2014.
For corporate taxpayers, the fund hereby designates $159,688, or up to the maximum amount allowable, of ordinary income distributions paid during the fiscal year ended July 31, 2014 as qualified for the corporate dividends received deduction.
|
| | |
| |
| | | |
| Contact Us | americancentury.com | |
| Automated Information Line | 1-800-345-8765 | |
| Investor Services Representative | 1-800-345-2021
or 816-531-5575 | |
| Investors Using Advisors | 1-800-378-9878 | |
| Business, Not-For-Profit, Employer-Sponsored Retirement Plans | 1-800-345-3533 | |
| Banks and Trust Companies, Broker-Dealers, Financial Professionals, Insurance Companies | 1-800-345-6488 | |
| Telecommunications Relay Service for the Deaf | 711 | |
| | | |
| American Century Growth Funds, Inc. | |
| | | |
Investment Advisor: American Century Investment Management, Inc. Kansas City, Missouri | |
| | | |
| This report and the statements it contains are submitted for the general information of our shareholders. The report is not authorized for distribution to prospective investors unless preceded or accompanied by an effective prospectus. | |
| | | |
©2014 American Century Proprietary Holdings, Inc. All rights reserved. CL-ANN-83143 1409 | |
ITEM 2. CODE OF ETHICS.
| |
| (a) | The registrant has adopted a Code of Ethics for Senior Financial Officers that applies to the registrant’s principal executive officer, principal financial officer, principal accounting officer, and persons performing similar functions. |
| |
| (f) | The registrant’s Code of Ethics for Senior Financial Officers was filed as Exhibit 12 (a)(1) to American Century Asset Allocation Portfolios, Inc.’s Annual Certified Shareholder Report on Form N-CSR, File No. 811-21591, on September 29, 2005, and is incorporated herein by reference. |
ITEM 3. AUDIT COMMITTEE FINANCIAL EXPERT.
| |
| (a)(1) | The registrant’s board has determined that the registrant has at least one audit committee financial expert serving on its audit committee. |
| |
| (a)(2) | M. Jeannine Strandjord, Stephen E. Yates, Thomas A. Brown and John R. Whitten are the registrant’s designated audit committee financial experts. They are “independent” as defined in Item 3 of Form N-CSR. |
ITEM 4. PRINCIPAL ACCOUNTANT FEES AND SERVICES.
The aggregate fees billed for each of the last two fiscal years for professional services rendered by the principal accountant for the audit of the registrant’s annual financial statements or services that are normally provided by the accountant in connection with statutory and regulatory filings or engagements for those fiscal years were as follows:
FY 2013: $54,953
FY 2014: $48,530
The aggregate fees billed in each of the last two fiscal years for assurance and related services by the principal accountant that are reasonably related to the performance of the audit of the registrant’s financial statements and are not reported under paragraph (a) of this Item were as follows:
For services rendered to the registrant:
FY 2013: $0
FY 2014: $0
Fees required to be approved pursuant to paragraph (c)(7)(ii) of Rule 2-01 of Regulation S-X (relating to certain engagements for non-audit services with the registrant’s investment adviser and its affiliates):
FY 2013: $0
FY 2014: $0
The aggregate fees billed in each of the last two fiscal years for professional services rendered by the principal accountant for tax compliance, tax advice, and tax planning were as follows:
For services rendered to the registrant:
FY 2013: $0
FY 2014: $0
Fees required to be approved pursuant to paragraph (c)(7)(ii) of Rule 2-01 of Regulation S-X (relating to certain engagements for non-audit services with the registrant’s investment adviser and its affiliates):
FY 2013: $0
FY 2014: $0
The aggregate fees billed in each of the last two fiscal years for products and services provided by the principal accountant, other than the services reported in paragraphs (a) through (c) of this Item were as follows:
For services rendered to the registrant:
FY 2013: $0
FY 2014: $0
Fees required to be approved pursuant to paragraph (c)(7)(ii) of Rule 2-01 of Regulation S-X (relating to certain engagements for non-audit services with the registrant’s investment adviser and its affiliates):
FY 2013: $0
FY 2014: $0
| |
| (e)(1) | In accordance with paragraph (c)(7)(i)(A) of Rule 2-01 of Regulation S-X, before the accountant is engaged by the registrant to render audit or non-audit services, the engagement is approved by the registrant’s audit committee. Pursuant to paragraph (c)(7)(ii) of Rule 2-01 of Regulation S-X, the registrant’s audit committee also pre-approves its accountant’s engagements for non-audit services with the registrant’s investment adviser, its parent company, and any entity controlled by, or under common control with the investment adviser that provides ongoing services to the registrant, if the engagement relates directly to the operations and financial reporting of the registrant. |
| |
| (e)(2) | All services described in each of paragraphs (b) through (d) of this Item were pre-approved before the engagement by the registrant’s audit committee pursuant to paragraph (c)(7)(i)(A) of Rule 2-01 of Regulation S-X. Consequently, none of such services were required to be approved by the audit committee pursuant to paragraph (c)(7)(i)(C). |
| |
| (f) | The percentage of hours expended on the principal accountant’s engagement to audit the registrant’s financial statements for the most recent fiscal year that were attributed to work performed by persons other than the principal accountant’s full-time, permanent employees was less than 50%. |
| |
| (g) | The aggregate non-audit fees billed by the registrant’s accountant for services rendered to the registrant, and rendered to the registrant’s investment adviser (not including any sub-adviser whose role is primarily portfolio management and is subcontracted with or overseen by another investment adviser), and any entity controlling, controlled by, or under common control with the adviser that provides ongoing services to the registrant for each of the last two fiscal years of the registrant were as follows: |
FY 2013: $86,621
FY 2014: $97,308
| |
| (h) | The registrant’s investment adviser and accountant have notified the registrant’s audit committee of all non-audit services that were rendered by the registrant’s accountant to the registrant’s investment adviser, its parent company, and any entity controlled by, or under common control with the investment adviser that provides services to the registrant, which services were not required to be pre-approved pursuant to paragraph (c)(7)(ii) of Rule 2-01 of Regulation S-X. The notification provided to the registrant’s audit committee included sufficient details regarding such services to allow the registrant’s audit committee to consider the continuing independence of its principal accountant. |
ITEM 5. AUDIT COMMITTEE OF LISTED REGISTRANTS.
Not applicable.
ITEM 6. INVESTMENTS.
| |
| (a) | The schedule of investments is included as part of the report to stockholders filed under Item 1 of this Form. |
ITEM 7. DISCLOSURE OF PROXY VOTING POLICIES AND PROCEDURES FOR CLOSED-END MANAGEMENT INVESTMENT COMPANIES.
Not applicable.
ITEM 8. PORTFOLIO MANAGERS OF CLOSED-END MANAGEMENT INVESTMENT COMPANIES.
Not applicable.
ITEM 9. PURCHASES OF EQUITY SECURITIES BY CLOSED-END MANAGEMENT INVESTMENT COMPANY AND AFFILIATED PURCHASERS.
Not applicable.
ITEM 10. SUBMISSION OF MATTERS TO A VOTE OF SECURITY HOLDERS.
During the reporting period, there were no material changes to the procedures by which shareholders may recommend nominees to the registrant’s board.
ITEM 11. CONTROLS AND PROCEDURES.
| |
| (a) | The registrant's principal executive officer and principal financial officer have concluded that the registrant's disclosure controls and procedures (as defined in Rule 30a-3(c) under the Investment Company Act of 1940) are effective based on their evaluation of these controls and procedures as of a date within 90 days of the filing date of this report. |
| |
| (b) | There were no changes in the registrant's internal control over financial reporting (as defined in Rule 30a-3(d) under the Investment Company Act of 1940) that occurred during the registrant's second fiscal quarter of the period covered by this report that have materially affected, or are reasonably likely to materially affect, the registrant's internal control over financial reporting. |
ITEM 12. EXHIBITS.
| |
| (a)(1) | Registrant’s Code of Ethics for Senior Financial Officers, which is the subject of the disclosure required by Item 2 of Form N-CSR, was filed as Exhibit 12(a)(1) to American Century Asset Allocation Portfolios, Inc.’s Certified Shareholder Report on Form N-CSR, File No. 811-21591, on September 29, 2005. |
| |
| (a)(2) | Separate certifications by the registrant’s principal executive officer and principal financial officer, pursuant to Section 302 of the Sarbanes-Oxley Act of 2002 and Rule 30a-2(a) under the Investment Company Act of 1940, are filed and attached hereto as EX-99.CERT. |
| |
| (b) | A certification by the registrant’s chief executive officer and chief financial officer, pursuant to Section 906 of the Sarbanes-Oxley Act of 2002, is furnished and attached hereto as EX-99.906CERT. |
SIGNATURES
Pursuant to the requirements of the Securities Exchange Act of 1934 and the Investment Company Act of 1940, the registrant has duly caused this report to be signed on its behalf by the undersigned, thereunto duly authorized.
|
| | | | |
| Registrant: | American Century Growth Funds, Inc. | |
| | | | |
| | | | |
| By: | /s/ Jonathan S. Thomas | |
| | Name: | Jonathan S. Thomas | |
| | Title: | President | |
| | | | |
| Date: | September 26, 2014 | |
| | | |
Pursuant to the requirements of the Securities Exchange Act of 1934 and the Investment Company Act of 1940, this report has been signed below by the following persons on behalf of the registrant and in the capacities and on the dates indicated.
|
| | | |
| By: | /s/ Jonathan S. Thomas | |
| | Name: | Jonathan S. Thomas | |
| | Title: | President | |
| | | (principal executive officer) | |
| | | | |
| | | | |
| Date: | September 26, 2014 | |
|
| | | |
| By: | /s/ C. Jean Wade | |
| | Name: | C. Jean Wade | |
| | Title: | Vice President, Treasurer, and | |
| | | Chief Financial Officer | |
| | | (principal financial officer) | |
| | | | |
| Date: | September 26, 2014 | |