UNITED STATES
SECURITIES AND EXCHANGE COMMISSION
Washington, D.C. 20549
FORM N-CSR
CERTIFIED SHAREHOLDER REPORT OF REGISTERED
MANAGEMENT INVESTMENT COMPANIES
| Investment Company Act file number | 811-21861 |
| | |
| | |
| | |
| AMERICAN CENTURY GROWTH FUNDS, INC. |
| (Exact name of registrant as specified in charter) |
| | |
| | |
| | |
| 4500 MAIN STREET, KANSAS CITY, MISSOURI | 64111 |
| (Address of principal executive offices) | (Zip Code) |
| | |
| | |
| | |
CHARLES A. ETHERINGTON 4500 MAIN STREET, KANSAS CITY, MISSOURI 64111 |
| (Name and address of agent for service) |
| | |
| | |
| Registrant’s telephone number, including area code: | 816-531-5575 |
| | |
| | |
| Date of fiscal year end: | 07-31 |
| | |
| | |
| Date of reporting period: | 07-31-2012 |
ITEM 1. REPORTS TO STOCKHOLDERS.
ANNUAL REPORT JULY 31, 2012
| | Legacy Focused Large Cap Fund |
| President’s Letter | 2 |
| Independent Chairman’s Letter | 3 |
| Market Perspective | 4 |
| Performance | 5 |
| Portfolio Commentary | 6 |
| Fund Characteristics | 8 |
| Shareholder Fee Example | 9 |
| Schedule of Investments | 11 |
| Statement of Assets and Liabilities | 12 |
| Statement of Operations | 13 |
| Statement of Changes in Net Assets | 14 |
| Notes to Financial Statements | 15 |
| Financial Highlights | 20 |
| Report of Independent Registered Public Accounting Firm | 22 |
| Management | 23 |
| Approval of Management Agreement | 26 |
| Additional Information | 31 |
Any opinions expressed in this report reflect those of the author as of the date of the report, and do not necessarily represent the opinions of American Century Investments® or any other person in the American Century Investments organization. Any such opinions are subject to change at any time based upon market or other conditions and American Century Investments disclaims any responsibility to update such opinions. These opinions may not be relied upon as investment advice and, because investment decisions made by American Century Investments funds are based on numerous factors, may not be relied upon as an indication of trading intent on behalf of any American Century Investments fund. Security examples are used for representational purposes only and are not intended as recommendations to purchase or sell securities. Performance information for comparative indices and securities is provided to American Century Investments by third party vendors. To the best of American Century Investments’ knowledge, such information is accurate at the time of printing.
Dear Investor:
Thank you for reviewing this annual report for the period ended July 31, 2012. Our report offers investment performance and portfolio information, presented with the expert perspective of our portfolio management team.
This report remains one of our most important vehicles for conveying information about fund returns, as well as market factors and strategies that affected fund performance. For additional, updated information, we encourage you to visit our website, americancentury.com. Click on the “Fund Performance” and “Insights & News” headings at the top of our Individual Investors site.
Flight to Quality as Economic and Financial Uncertainties Resurfaced
During the second half of 2011 and the first half of 2012, the global economy and financial markets struggled to move beyond the lingering aftereffects of the 2008 Financial Crisis and Great Recession. Global economic fundamentals have improved since 2008, but weakened since 2010, with increased uncertainty surrounding near-term economic growth levels in major developed economies such as the U.S., Japan, and Europe. There were also questions about near-term growth levels in emerging economies such as China, and about possible sovereign debt defaults in southern Europe.
These near-term uncertainties manifested themselves in asset returns for the 12 months ended July 31, 2012. Assets perceived to be “safe-haven” investments rallied—the 30-year U.S. Treasury bond posted a 38% total return. At the other end of the spectrum, international stock returns for U.S. investors were undermined by a combination of risk-averse investing attitudes, weakening global economic growth, and a stronger U.S. dollar versus the euro and other currencies. Commodity prices also declined during the period.
Unfortunately, the instability that triggered much of this flight-to-quality trading remains largely in place, and the coming months may bring additional uncertainties about U.S. presidential election results and what might happen when U.S. tax cuts and other stimulative measures expire in 2013 (the “Fiscal Cliff”). In this uncertain, unstable environment, we continue to believe in a disciplined, diversified, long-term investment approach, using both stocks and bonds, as appropriate. We appreciate your continued trust in us during these unsettled times.
Sincerely,
Jonathan Thomas
President and Chief Executive Officer
American Century Investments
Independent Chairman’s Letter |
Don Pratt
Dear Fellow Shareholders,
The assets under management in American Century Investments’ funds grow through investors placing new assets in the funds and through market appreciation. Asset growth has been at near record levels over the past two calendar years as market movements were upward, the funds’ relative returns were generally favorable, and the distribution strategies implemented by fund management have been successful.
The board reviews fund performance and distribution strategies on a regular basis. Several years ago, the fund’s management team discussed with the board its plans to grow fund assets in the intermediary, institutional and international distribution channels. These distribution strategies have produced strong positive growth. The growth in the intermediary channel recognizes the funds’ strong relative investment performance and the desire of many shareholders to seek financial guidance. Investors in both the institutional and international channels appear to find the funds’ risk-based investment strategies attractive. The board continues to support fund management’s strategies to increase fund assets and will continue to work to provide the benefits of these gains to fund shareholders.
We continue to receive a steady flow of very thoughtful questions from shareholders. If there are issues that you would like the board to address please email me at dhpratt@fundboardchair.com. Thank you for your continued investment in American Century Investments funds.
Best regards,
Don Pratt
By David Hollond, Chief Investment Officer, U.S. Growth Equity — Mid & Small Cap
Stocks Gained Amid Volatility
The U.S. stock market generated positive results for the 12-month period ended July 31, 2012, although it endured significant volatility along the way. As the reporting period began, stocks were in the midst of a decline as evidence of a slowdown in U.S. economic activity and a worsening sovereign debt crisis in Europe put downward pressure on the equity market.
In early October, though, the equity market bottomed and reversed course, enjoying a substantial rebound through the fourth quarter of 2011 and first quarter of 2012. Investors became more optimistic as signs of improving economic activity quashed recession fears; in particular, job growth consistently exceeded expectations, driving the unemployment rate down to its lowest level in more than three years. Another positive factor was better news out of Europe, as the European Central Bank provided favorable long-term financing to the debt markets and support for the Continent’s banking sector.
The final months of the reporting period brought yet another reversal, as the headwinds facing the equity market at the beginning of the period returned to the forefront. Evidence of slowing economic activity in the U.S. and adverse developments in Europe—including political turmoil in Greece and troubled banks in Spain—weighed on investor confidence, sending stocks down sharply once again.
As the table below illustrates, large-cap issues generated the strongest returns, outpacing mid- and small-cap shares. Growth and value stocks were mixed—growth issues outperformed value among large-cap stocks, while value shares held up better in the mid-and small-cap segments of the market.
From a sector perspective, the defensive telecommunication services sector fared best. Consumer staples, utilities, and health care stocks all managed double-digit gains in the broad Russell 3000 Index. On the downside, the commodity-driven energy and materials sectors fell the most during the period, reflecting a broad decline in commodity prices.
| Market Index Total Returns | |
| For the 12 months ended July 31, 2012 | |
| U.S. Stocks | |
| Russell 1000 Index (Large-Cap) | | | 7.96 | % |
| Russell Midcap Index | | | 2.28 | % |
| Russell 2000 Index (Small-Cap) | | | 0.19 | % |
| Foreign Stocks | |
| MSCI EAFE Index | | | -11.45 | % |
| MSCI Emerging Markets Index | | | -13.93 | % |
| Total Returns as of July 31, 2012 |
| | | | Average Annual Returns | |
| | Ticker Symbol | 1 year | 5 years | Since Inception | Inception Date |
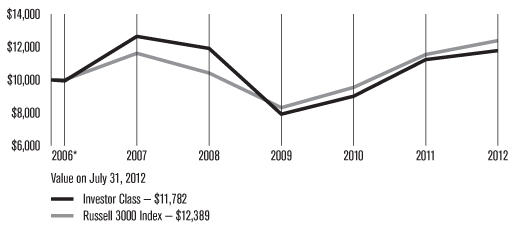
| Investor Class | ACFOX | 5.54% | -0.96% | 2.98% | 5/31/06 |
| S&P 500 Index | — | 9.13% | 1.13% | 3.52% | — |
| Institutional Class | ACFSX | 5.64% | -0.78% | 3.18% | 5/31/06 |
| Advisor Class | ACFDX | 5.21% | -1.22% | 2.71% | 5/31/06 |
| R Class | ACFCX | 4.98% | -1.47% | 2.45% | 5/31/06 |
| Growth of $10,000 Over Life of Class |
| $10,000 investment made May 31, 2006 |
*From 5/31/06, the Investor Class’s inception date. Not annualized.
| Total Annual Fund Operating Expenses |
| Investor Class | Institutional Class | Advisor Class | R Class |
| 1.11% | 0.91% | 1.36% | 1.61% |
The total annual fund operating expenses shown is as stated in the fund’s prospectus current as of the date of this report. The prospectus may vary from the expense ratio shown elsewhere in this report because it is based on a different time period, includes acquired fund fees and expenses, and, if applicable, does not include fee waivers or expense reimbursements.
Data presented reflect past performance. Past performance is no guarantee of future results. Current performance may be higher or lower than the performance shown. Investment return and principal value will fluctuate, and redemption value may be more or less than original cost. To obtain performance data current to the most recent month end, please call 1-800-345-2021 or visit americancentury.com. The fund’s investment process may result in high portfolio turnover, which could mean high transaction costs, affecting both performance and capital gains tax liabilities to investors. International investing involves special risks, such as political instability and currency fluctuations.
Unless otherwise indicated, performance reflects Investor Class shares; performance for other share classes will vary due to differences in fee structure. For information about other share classes available, please consult the prospectus. Data assumes reinvestment of dividends and capital gains, and none of the charts reflect the deduction of taxes that a shareholder would pay on fund distributions or the redemption of fund shares. Returns for the index are provided for comparison. The fund’s total returns include operating expenses (such as transaction costs and management fees) that reduce returns, while the total returns of the index do not.
Portfolio Managers: John T. Small Jr. and Stephen Pool
Performance Summary
Legacy Focused Large Cap returned 5.54%* for the 12 months ended July 31, 2012, lagging the 9.13% return of the portfolio’s benchmark, the S&P 500 Index.
As discussed in the Market Perspective on page 4, U.S. stock indices delivered positive returns during the reporting period, despite high levels of market volatility. In an environment of changing economic and market conditions, Legacy Focused Large Cap’s management team remained focused on the fundamental business prospects of its portfolio investments.
Legacy Focused Large Cap delivered positive results for the reporting period, but its performance trailed that of its benchmark. The majority of the relative underperformance was attributable to stock decisions in the telecommunications services, consumer discretionary, and information technology sectors. Holdings in the materials, energy, and consumer staples sectors partially offset those relative losses.
Telecommunications, Consumer Discretionary Lagged
The telecommunications services sector was the leading source of underperformance relative to the benchmark. Within the wireless telecom industry, the portfolio held several positions in wireless providers that lagged benchmark performance for the period.
The consumer discretionary sector also detracted from returns versus the benchmark. In the auto components industry, the portfolio maintained an overweight stake in automotive supplier TRW Automotive Holdings Corp., which was a significant contributor in recent reporting periods. During the last 12 months, however, the maker of safety electronics and airbags was hurt by a decline in European vehicle production and concerns about slowing economic growth in China. Elsewhere in the sector, overweight holdings in the media industry and the hotels, restaurants, and leisure group also weighed on relative results.
Information Technology Underperformed
Our holdings in the information technology sector were negatively affected by worries about exposure to Europe and potential slowdown in the U.S. going forward. In the sector, stock selection made computers and peripherals firms the leading detractors, led by communication equipment maker Cisco Systems. Cisco actually gained market share and reported solid results, but the company lowered forward earnings guidance marginally after evaluating the macroeconomic environment here and abroad. The office electronics industry was also a source of underperformance compared with the benchmark.
Apart from those sectors, an overweight stake in insurance company Genworth Financial also hurt absolute and relative returns. The company continued to struggle with its mortgage insurance segment, as well as its retirement and international protection businesses.
*All fund returns referenced in this commentary are for Investor Class shares.
Materials, Consumer Staples Contributed
The materials sector was the largest source of relative outperformance for Legacy Focused Large Cap, largely attributable to a position in Mexican building materials company Cemex. The company experienced improving pricing and volumes, with increasing demand in its infrastructure and residential business units. Elsewhere in the sector, the portfolio benefited from individual stakes in the metals and mining industry group.
Within the consumer staples sector, retailer Wal-Mart contributed to absolute and relative returns. The company’s earnings rose as it attracted price-conscious shoppers in a difficult economic environment. Holdings in the tobacco and beverages groups also added meaningfully to relative results.
Aside from those sectors, the portfolio benefited from its position in Humana, which delivered positive results while held in the portfolio but declined for the entire reporting period in the benchmark. The health insurer missed its expected earnings target and lowered guidance for future earnings due to increased membership in its Medicare Advantage programs.
Outlook
We remain cautiously optimistic in our market outlook. Although markets delivered positive results in the past 12 months, we continue to look for more meaningful and sustainable improvements in economic conditions. Regardless of conditions, Legacy Focused Large Cap employs financial acceleration and price momentum screens to identify investment opportunities in any given economic environment. As always, it will employ a quantitative model to exploit large-cap investment opportunities across the growth and value spectrums.
| JULY 31, 2012 | |
| Top Ten Holdings | | % of net assets |
| International Business Machines Corp. | | | 4.8 | % |
| Walgreen Co. | | | 4.2 | % |
| McKesson Corp. | | | 4.1 | % |
| Allstate Corp. (The) | | | 3.9 | % |
| Cardinal Health, Inc. | | | 3.7 | % |
| Chevron Corp. | | | 3.7 | % |
| Exxon Mobil Corp. | | | 3.7 | % |
| Marsh & McLennan Cos., Inc. | | | 3.7 | % |
| Lockheed Martin Corp. | | | 3.6 | % |
| Wal-Mart Stores, Inc. | | | 3.6 | % |
| | | | | |
| Top Five Industries | | % of net assets |
| Health Care Providers and Services | | | 14.3 | % |
| Food and Staples Retailing | | | 12.7 | % |
| Oil, Gas and Consumable Fuels | | | 12.2 | % |
| Insurance | | | 9.4 | % |
| IT Services | | | 7.5 | % |
| | | | | |
| Types of Investments in Portfolio | | % of net assets |
| Domestic Common Stocks | | | 90.2 | % |
| Foreign Common Stocks* | | | 9.8 | % |
| Total Common Stocks | | | 100.0 | % |
| Temporary Cash Investments | | | 0.6 | % |
| Other Assets and Liabilities | | | (0.6 | )% |
| *Includes depositary shares, dual listed securities and foreign ordinary shares. | |
Fund shareholders may incur two types of costs: (1) transaction costs, including sales charges (loads) on purchase payments and redemption/exchange fees; and (2) ongoing costs, including management fees; distribution and service (12b-1) fees; and other fund expenses. This example is intended to help you understand your ongoing costs (in dollars) of investing in your fund and to compare these costs with the ongoing cost of investing in other mutual funds.
The example is based on an investment of $1,000 made at the beginning of the period and held for the entire period from February 1, 2012 to July 31, 2012.
Actual Expenses
The table provides information about actual account values and actual expenses for each class. You may use the information, together with the amount you invested, to estimate the expenses that you paid over the period. First, identify the share class you own. Then simply divide your account value by $1,000 (for example, an $8,600 account value divided by $1,000 = 8.6), then multiply the result by the number under the heading “Expenses Paid During Period” to estimate the expenses you paid on your account during this period.
If you hold Investor Class shares of any American Century Investments fund, or Institutional Class shares of the American Century Diversified Bond Fund, in an American Century Investments account (i.e., not a financial intermediary or retirement plan account), American Century Investments may charge you a $12.50 semiannual account maintenance fee if the value of those shares is less than $10,000. We will redeem shares automatically in one of your accounts to pay the $12.50 fee. In determining your total eligible investment amount, we will include your investments in all personal accounts (including American Century Investments Brokerage accounts) registered under your Social Security number. Personal accounts include individual accounts, joint accounts, UGMA/UTMA accounts, personal trusts, Coverdell Education Savings Accounts and IRAs (including traditional, Roth, Rollover, SEP-, SARSEP- and SIMPLE-IRAs), and certain other retirement accounts. If you have only business, business retirement, employer-sponsored or American Century Investments Brokerage accounts, you are currently not subject to this fee. If you are subject to the Account Maintenance Fee, your account value could be reduced by the fee amount.
Hypothetical Example for Comparison Purposes
The table also provides information about hypothetical account values and hypothetical expenses based on the actual expense ratio of each class of your fund and an assumed rate of return of 5% per year before expenses, which is not the actual return of a fund’s share class. The hypothetical account values and expenses may not be used to estimate the actual ending account balance or expenses you paid for the period. You may use this information to compare the ongoing costs of investing in your fund and other funds. To do so, compare this 5% hypothetical example with the 5% hypothetical examples that appear in the shareholder reports of the other funds.
Please note that the expenses shown in the table are meant to highlight your ongoing costs only and do not reflect any transactional costs, such as sales charges (loads) or redemption/exchange fees. Therefore, the table is useful in comparing ongoing costs only, and will not help you determine the relative total costs of owning different funds. In addition, if these transactional costs were included, your costs would have been higher.
| | Beginning Account Value 2/1/12 | Ending Account Value 7/31/12 | Expenses Paid During Period(1) 2/1/12 – 7/31/12 | Annualized Expense Ratio(1) |
| Actual |
| Investor Class | $1,000 | $1,014.60 | $5.56 | 1.11% |
| Institutional Class | $1,000 | $1,014.60 | $4.56 | 0.91% |
| Advisor Class | $1,000 | $1,012.90 | $6.81 | 1.36% |
| R Class | $1,000 | $1,012.00 | $8.05 | 1.61% |
| Hypothetical |
| Investor Class | $1,000 | $1,019.34 | $5.57 | 1.11% |
| Institutional Class | $1,000 | $1,020.34 | $4.57 | 0.91% |
| Advisor Class | $1,000 | $1,018.10 | $6.82 | 1.36% |
| R Class | $1,000 | $1,016.86 | $8.07 | 1.61% |
| (1) | Expenses are equal to the class’s annualized expense ratio listed in the table above, multiplied by the average account value over the period, multiplied by 182, the number of days in the most recent fiscal half-year, divided by 366, to reflect the one-half year period. |
| | | Shares | | | Value | |
| Common Stocks — 100.0% | |
| AEROSPACE AND DEFENSE — 5.9% | |
| Lockheed Martin Corp. | | | 2,892 | | | | $258,169 | |
| United Technologies Corp. | | | 2,288 | | | | 170,318 | |
| | | | | | | | 428,487 | |
| COMMERCIAL SERVICES AND SUPPLIES — 3.5% | |
| Waste Management, Inc. | | | 7,372 | | | | 253,597 | |
| COMMUNICATIONS EQUIPMENT — 3.3% | |
| Cisco Systems, Inc. | | | 14,887 | | | | 237,448 | |
| COMPUTERS AND PERIPHERALS — 3.5% | |
Apple, Inc.(1) | | | 417 | | | | 254,687 | |
| DIVERSIFIED TELECOMMUNICATION SERVICES — 3.4% | |
| PT Telekomunikasi Indonesia Persero Tbk ADR | | | 6,269 | | | | 243,425 | |
| ELECTRIC UTILITIES — 3.3% | |
| Xcel Energy, Inc. | | | 8,127 | | | | 238,121 | |
| FOOD AND STAPLES RETAILING — 12.7% | |
| CVS Caremark Corp. | | | 5,315 | | | | 240,504 | |
| TESCO plc ADR | | | 7,807 | | | | 117,105 | |
| Wal-Mart Stores, Inc. | | | 3,465 | | | | 257,900 | |
| Walgreen Co. | | | 8,251 | | | | 300,006 | |
| | | | | | | | 915,515 | |
| HEALTH CARE PROVIDERS AND SERVICES — 14.3% | |
| Cardinal Health, Inc. | | | 6,267 | | | | 270,045 | |
| McKesson Corp. | | | 3,237 | | | | 293,693 | |
| UnitedHealth Group, Inc. | | | 4,550 | | | | 232,460 | |
| WellPoint, Inc. | | | 4,422 | | | | 235,648 | |
| | | | | | | | 1,031,846 | |
| INSURANCE — 9.4% | |
| Allstate Corp. (The) | | | 8,307 | | | | 284,930 | |
Genworth Financial, Inc., Class A(1) | | | 25,598 | | | | 129,014 | |
| Marsh & McLennan Cos., Inc. | | | 7,994 | | | | 265,481 | |
| | | | | | | | 679,425 | |
| IT SERVICES — 7.5% | |
| Accenture plc, Class A | | | 3,204 | | | | 193,201 | |
| International Business Machines Corp. | | | 1,779 | | | | 348,649 | |
| | | | | | | | 541,850 | |
| METALS AND MINING — 4.4% | |
| Agnico-Eagle Mines Ltd. New York Shares | | | 3,601 | | | | 157,832 | |
| Southern Copper Corp. | | | 5,033 | | | | 162,465 | |
| | | | | | | | 320,297 | |
| MULTILINE RETAIL — 6.8% | |
| Macy’s, Inc. | | | 6,669 | | | | 239,017 | |
| Target Corp. | | | 4,199 | | | | 254,669 | |
| | | | | | | | 493,686 | |
| OIL, GAS AND CONSUMABLE FUELS — 12.2% | |
| Chevron Corp. | | | 2,450 | | | | 268,471 | |
| Exxon Mobil Corp. | | | 3,086 | | | | 268,019 | |
SandRidge Energy, Inc.(1) | | | 19,795 | | | | 135,002 | |
| Williams Partners LP | | | 3,919 | | | | 212,841 | |
| | | | | | | | 884,333 | |
| REAL ESTATE INVESTMENT TRUSTS (REITs) — 2.7% | |
| CBL & Associates Properties, Inc. | | | 9,746 | | | | 192,289 | |
| SOFTWARE — 2.9% | |
| CA, Inc. | | | 3,834 | | | | 92,284 | |
SolarWinds, Inc.(1) | | | 2,179 | | | | 116,337 | |
| | | | | | | | 208,621 | |
| SPECIALTY RETAIL — 3.2% | |
| Lowe’s Cos., Inc. | | | 8,970 | | | | 227,569 | |
| WIRELESS TELECOMMUNICATION SERVICES — 1.0% | |
Sprint Nextel Corp.(1) | | | 15,867 | | | | 69,180 | |
TOTAL COMMON STOCKS(Cost $6,917,733) | | | | 7,220,376 | |
| Temporary Cash Investments — 0.6% | |
| SSgA U.S. Government Money Market Fund (Cost $39,480) | | | 39,480 | | | | 39,480 | |
TOTAL INVESTMENT SECURITIES — 100.6% (Cost $6,957,213) | | | | 7,259,856 | |
| OTHER ASSETS AND LIABILITIES — (0.6)% | | | | (42,017 | ) |
| TOTAL NET ASSETS — 100.0% | | | | $7,217,839 | |
Notes to Schedule of Investments
ADR = American Depositary Receipt
(1)Non-income producing.
See Notes to Financial Statements.
Statement of Assets and Liabilities |
| JULY 31, 2012 | |
| Assets | |
| Investment securities, at value (cost of $6,957,213) | | | $7,259,856 | |
| Receivable for investments sold | | | 785,887 | |
| Receivable for capital shares sold | | | 20,342 | |
| Dividends receivable | | | 5,274 | |
| | | | 8,071,359 | |
| | | | | |
| Liabilities | | | | |
| Payable for investments purchased | | | 801,297 | |
| Payable for capital shares redeemed | | | 45,434 | |
| Accrued management fees | | | 6,726 | |
| Distribution and service fees payable | | | 63 | |
| | | | 853,520 | |
| | | | | |
| Net Assets | | | $7,217,839 | |
| | | | | |
| Net Assets Consist of: | | | | |
| Capital (par value and paid-in surplus) | | | $18,808,998 | |
| Undistributed net investment income | | | 179,281 | |
| Accumulated net realized loss | | | (12,073,083 | ) |
| Net unrealized appreciation | | | 302,643 | |
| | | | $7,217,839 | |
| | Net assets | Shares outstanding | Net asset value per share |
| Investor Class, $0.01 Par Value | $6,975,121 | 628,081 | $11.11 |
| Institutional Class, $0.01 Par Value | $12,234 | 1,098 | $11.14 |
| Advisor Class, $0.01 Par Value | $215,314 | 19,515 | $11.03 |
| R Class, $0.01 Par Value | $15,170 | 1,384 | $10.96 |
See Notes to Financial Statements.
| YEAR ENDED JULY 31, 2012 | |
| Investment Income (Loss) | |
| Income: | | | |
| Dividends (net of foreign taxes withheld of $5,616) | | | $263,930 | |
| | | | | |
| Expenses: | | | | |
| Management fees | | | 82,987 | |
| Distribution and service fees: | | | | |
| Advisor Class | | | 813 | |
| R Class | | | 76 | |
| Directors’ fees and expenses | | | 286 | |
| Other expenses | | | 77 | |
| | | | 84,239 | |
| | | | | |
| Net investment income (loss) | | | 179,691 | |
| | | | | |
| Realized and Unrealized Gain (Loss) | | | | |
| Net realized gain (loss) on: | | | | |
| Investment transactions | | | 304,885 | |
| Foreign currency transactions | | | 1,356 | |
| | | | 306,241 | |
| | | | | |
| Change in net unrealized appreciation (depreciation) on investments | | | (98,000 | ) |
| | | | | |
| Net realized and unrealized gain (loss) | | | 208,241 | |
| | | | | |
| Net Increase (Decrease) in Net Assets Resulting from Operations | | | $387,932 | |
See Notes to Financial Statements.
Statement of Changes in Net Assets |
| YEARS ENDED JULY 31, 2012 AND JULY 31, 2011 | |
| Increase (Decrease) in Net Assets | July 31, 2012 | | | July 31, 2011 | |
| Operations | |
| Net investment income (loss) | | $179,691 | | | | $96,226 | |
| Net realized gain (loss) | | 306,241 | | | | 1,896,740 | |
| Change in net unrealized appreciation (depreciation) | | (98,000 | ) | | | (339,899 | ) |
| Net increase (decrease) in net assets resulting from operations | | 387,932 | | | | 1,653,067 | |
| | | | | | | | |
| Distributions to Shareholders | | | | | | | |
| From net investment income: | | | | | | | |
| Investor Class | | (83,390 | ) | | | (135,139 | ) |
| Institutional Class | | (153 | ) | | | (480 | ) |
| Advisor Class | | (3,106 | ) | | | (873 | ) |
| R Class | | (94 | ) | | | (155 | ) |
| Decrease in net assets from distributions | | (86,743 | ) | | | (136,647 | ) |
| | | | | | | | |
| Capital Share Transactions | | | | | | | |
| Net increase (decrease) in net assets from capital share transactions | | (1,170,777 | ) | | | (3,819,241 | ) |
| | | | | | | | |
| Net increase (decrease) in net assets | | (869,588 | ) | | | (2,302,821 | ) |
| | | | | | | | |
| Net Assets | | | | | | | |
| Beginning of period | | 8,087,427 | | | | 10,390,248 | |
| End of period | | $7,217,839 | | | | $8,087,427 | |
| | | | | | | | |
| Undistributed net investment income | | $179,281 | | | | $86,631 | |
See Notes to Financial Statements.
Notes to Financial Statements |
JULY 31, 2012
1. Organization
American Century Growth Funds, Inc. (the corporation) is registered under the Investment Company Act of 1940, as amended (the 1940 Act), as an open-end management investment company and is organized as a Maryland corporation. Legacy Focused Large Cap Fund (the fund) is one fund in a series issued by the corporation. The fund is nondiversified as defined under the 1940 Act. The fund’s investment objective is to seek long-term capital growth. The fund pursues its objective by investing primarily in stocks of large-sized market capitalization companies.
The fund offers the Investor Class, the Institutional Class, the Advisor Class and the R Class. The share classes differ principally in their respective distribution and shareholder servicing expenses and arrangements. The Institutional Class is made available to institutional shareholders or through financial intermediaries whose clients do not require the same level of shareholder and administrative services as shareholders of other classes. As a result, the Institutional Class is charged a lower unified management fee.
2. Significant Accounting Policies
The following is a summary of significant accounting policies consistently followed by the fund in preparation of its financial statements. The financial statements are prepared in conformity with accounting principles generally accepted in the United States of America, which may require management to make certain estimates and assumptions at the date of the financial statements. Actual results could differ from these estimates.
Investment Valuations — The fund determines the fair value of its investments and computes its net asset value per share as of the close of regular trading (usually 4 p.m. Eastern time) on the New York Stock Exchange (NYSE) on each day the NYSE is open.
Equity securities that are listed or traded on a domestic securities exchange are valued at the last reported sales price or at the official closing price as provided by the exchange. Equity securities traded on foreign securities exchanges are typically valued at the closing price on the exchange where primarily traded or as of the close of the NYSE, if that is earlier. If no last sales price is reported, or if local convention or regulation so provides, the mean of the latest bid and asked prices is used. Depending on local convention or regulation, securities traded over-the-counter are valued at the mean of the latest bid and asked prices, the last sales price, or the official closing price. In its determination of fair value, the fund may review several factors including: market information specific to a security; news developments in U.S. and foreign markets; the performance of particular U.S. and foreign securities, indices, comparable securities, American Depositary Receipts, Exchange-Traded Funds, and other relevant market indicators.
Debt securities maturing within 60 days at the time of purchase may be valued at cost, plus or minus any amortized discount or premium or at the evaluated mean as provided by an independent pricing service. Evaluated mean prices are commonly derived through utilization of market models, which may consider, among other factors, trade data, quotations from dealers and active market makers, relevant yield curve and spread data, related sector levels, creditworthiness, and other relevant market information on the same or comparable securities.
Investments in open-end management investment companies are valued at the reported net asset value per share.
The value of investments initially expressed in foreign currencies is translated into U.S. dollars at prevailing exchange rates.
If the fund determines that the market price for a portfolio security is not readily available or the valuation methods mentioned above do not reflect a security’s fair value, such security is valued as determined in good faith by the Board of Directors or its designee, in accordance with procedures adopted by the Board of Directors. Circumstances that may cause the fund to use these procedures to value a security include, but are not limited to: a security has been declared in default; trading in a security has been halted during
the trading day; there is a foreign market holiday and no trading occurred; or an event occurred between the close of a foreign exchange and the NYSE that may affect the value of a security.
Security Transactions — Security transactions are accounted for as of the trade date. Net realized gains and losses are determined on the identified cost basis, which is also used for federal income tax purposes.
Investment Income — Dividend income less foreign taxes withheld, if any, is recorded as of the ex-dividend date.
Foreign Currency Translations — All assets and liabilities initially expressed in foreign currencies are translated into U.S. dollars at prevailing exchange rates at period end. The fund may enter into spot foreign currency exchange contracts to facilitate transactions denominated in a foreign currency. Purchases and sales of investment securities, dividend and interest income, spot foreign currency exchange contracts, and expenses are translated at the rates of exchange prevailing on the respective dates of such transactions. Net realized and unrealized foreign currency exchange gains or losses related to investment securities are a component of net realized gain (loss) on investment transactions and change in net unrealized appreciation (depreciation) on investments, respectively.
Income Tax Status — It is the fund’s policy to distribute substantially all net investment income and net realized gains to shareholders and to otherwise qualify as a regulated investment company under provisions of the Internal Revenue Code. The fund is no longer subject to examination by tax authorities for years prior to 2009. At this time, management believes there are no uncertain tax positions which, based on their technical merit, would not be sustained upon examination and for which it is reasonably possible that the total amounts of unrecognized tax benefits will significantly change in the next twelve months. Accordingly, no provision has been made for federal or state income taxes.
Multiple Class — All shares of the fund represent an equal pro rata interest in the net assets of the class to which such shares belong, and have identical voting, dividend, liquidation and other rights and the same terms and conditions, except for class specific expenses and exclusive rights to vote on matters affecting only individual classes. Income, non-class specific expenses, and realized and unrealized capital gains and losses of the fund are allocated to each class of shares based on their relative net assets.
Distributions to Shareholders — Distributions from net investment income and net realized gains, if any, are generally declared and paid annually.
Indemnifications — Under the corporation’s organizational documents, its officers and directors are indemnified against certain liabilities arising out of the performance of their duties to the fund. In addition, in the normal course of business, the fund enters into contracts that provide general indemnifications. The maximum exposure under these arrangements is unknown as this would involve future claims that may be made against a fund. The risk of material loss from such claims is considered by management to be remote.
3. Fees and Transactions with Related Parties
Management Fees — The corporation has entered into a management agreement with American Century Investment Management, Inc. (ACIM) (the investment advisor), under which ACIM provides the fund with investment advisory and management services in exchange for a single, unified management fee (the fee) per class. The agreement provides that all expenses of managing and operating the fund, except distribution and service fees, brokerage expenses, taxes, interest, fees and expenses of the independent directors (including legal counsel fees), and extraordinary expenses, will be paid by ACIM. The fee is computed and accrued daily based on each class’s daily net assets and paid monthly in arrears. The rate of the fee is determined by applying a fee rate calculation formula. This formula takes into account the fund’s assets as well as certain assets, if any, of other clients of the investment advisor outside the American Century Investments family of funds (such as subadvised funds and separate accounts) that have very similar investment teams and investment strategies (strategy assets). The annual management fee schedule ranges from 0.80% to 1.10% for the Investor Class, Advisor Class and R Class. The Institutional
Class is 0.20% less at each point within the range. The effective annual management fee for each class for the year ended July 31, 2012 was 1.10% for the Investor Class, Advisor Class and R Class and 0.90% for the Institutional Class.
Distribution and Service Fees — The Board of Directors has adopted a separate Master Distribution and Individual Shareholder Services Plan for each of the Advisor Class and R Class (collectively the plans), pursuant to Rule 12b-1 of the 1940 Act. The plans provide that the Advisor Class will pay American Century Investment Services, Inc. (ACIS) an annual distribution and service fee of 0.25%. The plans provide that the R Class will pay ACIS an annual distribution and service fee of 0.50%. The fees are computed and accrued daily based on each class’s daily net assets and paid monthly in arrears. The fees are used to pay financial intermediaries for distribution and individual shareholder services. Fees incurred under the plans during the year ended July 31, 2012 are detailed in the Statement of Operations.
Related Parties — Certain officers and directors of the corporation are also officers and/or directors of American Century Companies, Inc., the parent of the corporation’s investment advisor, ACIM, the distributor of the corporation, ACIS, and the corporation’s transfer agent, American Century Services, LLC.
4. Investment Transactions
Purchases and sales of investment securities, excluding short-term investments, for the year ended July 31, 2012 were $18,377,733 and $19,456,243, respectively.
5. Capital Share Transactions
The corporation is authorized to issue 3,000,000,000 shares. Transactions in shares of the fund were as follows:
| | Year ended July 31, 2012 | | | Year ended July 31, 2011 | |
| | Shares | | | Amount | | | Shares | | | Amount | |
| Investor Class | | | | | | | | | | | |
| Sold | | 117,634 | | | | $1,237,074 | | | | 122,346 | | | | $1,256,135 | |
| Issued in reinvestment of distributions | | 7,710 | | | | 79,178 | | | | 12,844 | | | | 128,053 | |
| Redeemed | | (214,277 | ) | | | (2,272,987 | ) | | | (541,337 | ) | | | (5,522,983 | ) |
| | | (88,933 | ) | | | (956,735 | ) | | | (406,147 | ) | | | (4,138,795 | ) |
| Institutional Class | | | | | | | | | | | | | | | |
| Sold | | — | | | | — | | | | 243 | | | | 2,501 | |
| Issued in reinvestment of distributions | | 14 | | | | 153 | | | | 48 | | | | 480 | |
| Redeemed | | (1,975 | ) | | | (18,522 | ) | | | (967 | ) | | | (9,731 | ) |
| | | (1,961 | ) | | | (18,369 | ) | | | (676 | ) | | | (6,750 | ) |
| Advisor Class | | | | | | | | | | | | | | | |
| Sold | | 1,735 | | | | 18,984 | | | | 32,467 | | | | 348,801 | |
| Issued in reinvestment of distributions | | 288 | | | | 2,950 | | | | 68 | | | | 677 | |
| Redeemed | | (20,183 | ) | | | (214,562 | ) | | | (2,289 | ) | | | (22,367 | ) |
| | | (18,160 | ) | | | (192,628 | ) | | | 30,246 | | | | 327,111 | |
| R Class | | | | | | | | | | | | | | | |
| Issued in reinvestment of distributions | | 9 | | | | 94 | | | | 16 | | | | 155 | |
| Redeemed | | (315 | ) | | | (3,139 | ) | | | (100 | ) | | | (962 | ) |
| | | (306 | ) | | | (3,045 | ) | | | (84 | ) | | | (807 | ) |
| Net increase (decrease) | | (109,360 | ) | | | $(1,170,777 | ) | | | (376,661 | ) | | | $(3,819,241 | ) |
6. Fair Value Measurements
The fund’s securities valuation process is based on several considerations and may use multiple inputs to determine the fair value of the positions held by the fund. In conformity with accounting principles generally accepted in the United States of America, the inputs used to determine a valuation are classified into three broad levels as follows:
| • | Level 1 valuation inputs consist of unadjusted quoted prices in an active market for identical securities; |
| • | Level 2 valuation inputs consist of direct or indirect observable market data (including quoted prices for similar securities, evaluations of subsequent market events, interest rates, prepayment speeds, credit risk, etc.); or |
| • | Level 3 valuation inputs consist of unobservable data (including a fund’s own assumptions). |
The level classification is based on the lowest level input that is significant to the fair valuation measurement. The valuation inputs are not necessarily an indication of the risks associated with investing in these securities or other financial instruments.
The following is a summary of the level classifications as of period end. The Schedule of Investments provides additional information on the fund’s portfolio holdings.
| | Level 1 | | | Level 2 | | | Level 3 | |
| Investment Securities | | | | | | | | |
| Domestic Common Stocks | | $6,508,813 | | | | — | | | | — | |
| Foreign Common Stocks | | 711,563 | | | | — | | | | — | |
| Temporary Cash Investments | | 39,480 | | | | — | | | | — | |
| Total Value of Investment Securities | | $7,259,856 | | | | — | | | | — | |
7. Risk Factors
The fund’s investment process may result in high portfolio turnover, which could mean high transaction costs, affecting both performance and capital gains tax liabilities to investors.
There are certain risks involved in investing in foreign securities. These risks include those resulting from future adverse political, social and economic developments, fluctuations in currency exchange rates, the possible imposition of exchange controls, and other foreign laws or restrictions.
8. Federal Tax Information
The tax character of distributions paid during the years ended July 31, 2012 and July 31, 2011 were as follows:
| | | 2012 | | | 2011 | |
| Distributions Paid From | |
| Ordinary income | | | $86,743 | | | | $136,647 | |
| Long-term capital gains | | | — | | | | — | |
The book-basis character of distributions made during the year from net investment income or net realized gains may differ from their ultimate characterization for federal income tax purposes. These differences reflect the differing character of certain income items and net realized gains and losses for financial statement and tax purposes, and may result in reclassification among certain capital accounts on the financial statements.
As of July 31, 2012, the federal tax cost of investments and the components of distributable earnings on a tax-basis were as follows:
| | | | | |
| Federal tax cost of investments | | | $6,998,522 | |
| Gross tax appreciation of investments | | | $433,378 | |
| Gross tax depreciation of investments | | | (172,044 | ) |
| Net tax appreciation (depreciation) of investments | | | $261,334 | |
| Undistributed ordinary income | | | $179,281 | |
| Accumulated short-term capital losses | | | $(12,031,774 | ) |
The difference between book-basis and tax-basis cost and unrealized appreciation (depreciation) is attributable primarily to the tax deferral of losses on wash sales.
The accumulated capital losses represent net capital loss carryovers that may be used to offset future realized capital gains for federal income tax purposes. Future capital loss carryover utilization in any given year may be subject to Internal Revenue Code limitations. Capital loss carryovers of $(7,690,556) and $(4,341,218) expire in 2017 and 2018, respectively.
| For a Share Outstanding Throughout the Years Ended July 31 (except as noted) |
| Per-Share Data | Ratios and Supplemental Data |
| | | Income From Investment Operations: | Distributions From: | | | Ratio to Average Net Assets of: | | |
| | Net Asset Value, Beginning of Period | Net Investment Income (Loss)(1) | Net Realized and Unrealized Gain (Loss) | Total From Investment Operations | Net Investment Income | Net Realized Gains | Tax Return of Capital | Total Distributions | Net Asset Value, End of Period | Total Return(2) | Operating Expenses | Net Investment Income (Loss) | Portfolio Turnover Rate | Net Assets, End of Period (in thousands) |
| Investor Class |
| 2012 | $10.65 | 0.25 | 0.33 | 0.58 | (0.12) | — | — | (0.12) | $11.11 | 5.54% | 1.11% | 2.39% | 243% | $6,975 |
| 2011 | $9.15 | 0.11 | 1.53 | 1.64 | (0.14) | — | — | (0.14) | $10.65 | 18.07% | 1.11% | 1.04% | 271% | $7,638 |
| 2010 | $8.31 | 0.11 | 0.73 | 0.84 | —(3) | — | — | —(3) | $9.15 | 10.14% | 1.11% | 1.19% | 242% | $10,272 |
| 2009 | $12.03 | 0.06 | (3.78) | (3.72) | — | — | — | — | $8.31 | (30.92)% | 1.11% | 0.65% | 305% | $13,594 |
| 2008 | $12.51 | 0.02 | 0.15 | 0.17 | (0.07) | (0.46) | (0.12) | (0.65) | $12.03 | 0.49% | 1.11% | 0.13% | 188% | $35,334 |
| Institutional Class |
| 2012 | $10.69 | 0.27 | 0.32 | 0.59 | (0.14) | — | — | (0.14) | $11.14 | 5.64% | 0.91% | 2.59% | 243% | $12 |
| 2011 | $9.18 | 0.13 | 1.54 | 1.67 | (0.16) | — | — | (0.16) | $10.69 | 18.36% | 0.91% | 1.24% | 271% | $33 |
| 2010 | $8.34 | 0.13 | 0.73 | 0.86 | (0.02) | — | — | (0.02) | $9.18 | 10.33% | 0.91% | 1.39% | 242% | $34 |
| 2009 | $12.04 | 0.06 | (3.76) | (3.70) | — | — | — | — | $8.34 | (30.73)% | 0.91% | 0.85% | 305% | $32 |
| 2008 | $12.53 | 0.06 | 0.13 | 0.19 | (0.08) | (0.46) | (0.14) | (0.68) | $12.04 | 0.61% | 0.91% | 0.33% | 188% | $3,751 |
| Advisor Class |
| 2012 | $10.58 | 0.23 | 0.31 | 0.54 | (0.09) | — | — | (0.09) | $11.03 | 5.21% | 1.36% | 2.14% | 243% | $215 |
| 2011 | $9.09 | 0.06 | 1.55 | 1.61 | (0.12) | — | — | (0.12) | $10.58 | 17.78% | 1.36% | 0.79% | 271% | $399 |
| 2010 | $8.28 | 0.08 | 0.73 | 0.81 | — | — | — | — | $9.09 | 9.78% | 1.36% | 0.94% | 242% | $68 |
| 2009 | $12.01 | 0.03 | (3.76) | (3.73) | — | — | — | — | $8.28 | (31.06)% | 1.36% | 0.40% | 305% | $146 |
| 2008 | $12.49 | (0.01) | 0.14 | 0.13 | (0.05) | (0.46) | (0.10) | (0.61) | $12.01 | 0.24% | 1.36% | (0.12)% | 188% | $945 |
| For a Share Outstanding Throughout the Years Ended July 31 (except as noted) |
| Per-Share Data | Ratios and Supplemental Data |
| | | Income From Investment Operations: | Distributions From: | | | Ratio to Average Net Assets of: | | |
| | Net Asset Value, Beginning of Period | Net Investment Income (Loss)(1) | Net Realized and Unrealized Gain (Loss) | Total From Investment Operations | Net Investment Income | Net Realized Gains | Tax Return of Capital | Total Distributions | Net Asset Value, End of Period | Total Return(2) | Operating Expenses | Net Investment Income (Loss) | Portfolio Turnover Rate | Net Assets, End of Period (in thousands) |
| R Class |
| 2012 | $10.51 | 0.20 | 0.32 | 0.52 | (0.07) | — | — | (0.07) | $10.96 | 4.98% | 1.61% | 1.89% | 243% | $15 |
| 2011 | $9.03 | 0.05 | 1.52 | 1.57 | (0.09) | — | — | (0.09) | $10.51 | 17.49% | 1.61% | 0.54% | 271% | $18 |
| 2010 | $8.24 | 0.06 | 0.73 | 0.79 | — | — | — | — | $9.03 | 9.59% | 1.61% | 0.69% | 242% | $16 |
| 2009 | $11.99 | —(3) | (3.75) | (3.75) | — | — | — | — | $8.24 | (31.28)% | 1.61% | 0.15% | 305% | $14 |
| 2008 | $12.47 | 0.01 | 0.08 | 0.09 | (0.04) | (0.46) | (0.07) | (0.57) | $11.99 | (0.02)% | 1.61% | (0.37)% | 188% | $64 |
Notes to Financial Highlights
| (1) | Computed using average shares outstanding throughout the period. |
| (2) | Total returns are calculated based on the net asset value of the last business day. Total returns for periods less than one year are not annualized. |
| (3) | Per-share amount was less than $0.005. |
See Notes to Financial Statements.
Report of Independent Registered Public Accounting Firm |
To the Shareholders and Board of Directors of
American Century Growth Funds, Inc.:
We have audited the accompanying statement of assets and liabilities, including the schedule of investments, of Legacy Focused Large Cap Fund, one of the funds constituting American Century Growth Funds, Inc. (the “Corporation”) as of July 31, 2012, and the related statement of operations for the year then ended, the statement of changes in net assets for each of the two years in the period then ended, and the financial highlights for each of the five years in the period then ended. These financial statements and financial highlights are the responsibility of the Corporation’s management. Our responsibility is to express an opinion on these financial statements and financial highlights based on our audits.
We conducted our audits in accordance with the standards of the Public Company Accounting Oversight Board (United States). Those standards require that we plan and perform the audit to obtain reasonable assurance about whether the financial statements and financial highlights are free of material misstatement. The Corporation is not required to have, nor were we engaged to perform, an audit of their internal control over financial reporting. Our audits included consideration of internal control over financial reporting as a basis for designing audit procedures that are appropriate in the circumstances, but not for the purpose of expressing an opinion on the effectiveness of the Corporation’s internal control over financial reporting. Accordingly, we express no such opinion. An audit also includes examining, on a test basis, evidence supporting the amounts and disclosures in the financial statements, assessing the accounting principles used and significant estimates made by management, as well as evaluating the overall financial statement presentation. Our procedures included confirmation of securities owned as of July 31, 2012, by correspondence with the custodian and brokers; where replies were not received from brokers, we performed other auditing procedures. We believe that our audits provide a reasonable basis for our opinion.
In our opinion, the financial statements and financial highlights referred to above present fairly, in all material respects, the financial position of Legacy Focused Large Cap Fund of American Century Growth Funds, Inc. as of July 31, 2012, the results of its operations for the year then ended, the changes in its net assets for each of the two years in the period then ended, and the financial highlights for each of the five years in the period then ended, in conformity with accounting principles generally accepted in the United States of America.
Deloitte & Touche LLP
Kansas City, Missouri
September 19, 2012
The Board of Directors
The individuals listed below serve as directors of the funds. Each director will continue to serve in this capacity until death, retirement, resignation or removal from office. The mandatory retirement age for directors who are not “interested persons,” as that term is defined in the Investment Company Act (independent directors), is 72. However, the mandatory retirement age for an individual director may be extended with the approval of the remaining independent directors.
Mr. Thomas is an “interested person” because he currently serves as President and Chief Executive Officer of American Century Companies, Inc. (ACC), the parent company of American Century Investment Management, Inc. (ACIM or the advisor). Mr. Fink is an “interested person” because he currently serves as Executive Vice President and Chief Operating Officer of ACC.
The other directors (more than three-fourths of the total number) are independent; that is, they have never been employees, directors or officers of, and have no financial interest in, ACC or any of its wholly owned, direct or indirect, subsidiaries, including ACIM, American Century Investment Services, Inc. (ACIS) and American Century Services, LLC (ACS). The directors serve in this capacity for seven (in the case of Mr. Thomas, 15) registered investment companies in the American Century Investments family of funds.
The following table presents additional information about the directors. The mailing address for each director is 4500 Main Street, Kansas City, Missouri 64111.
Name (Year of Birth) | Position(s) Held with Funds | Length of Time Served | Principal Occupation(s) During Past 5 Years | | Number of American Century Portfolios Overseen by Director | Other Directorships Held During Past 5 Years |
| Independent Directors |
Thomas A. Brown (1940) | Director | Since 1980 | Managing Member, Associated Investments, LLC (real estate investment company); Brown Cascade Properties, LLC (real estate investment company) (2001 to 2009) | | 66 | None |
Andrea C. Hall (1945) | Director | Since 1997 | Retired | | 66 | None |
Jan M. Lewis (1957) | Director | Since 2011 | President and Chief Executive Officer, Catholic Charities of Northeast Kansas (human services organization) | | 66 | None |
James A. Olson (1942) | Director | Since 2007 | Member, Plaza Belmont LLC (private equity fund manager) | | 66 | Saia, Inc. (2002 to 2012) and Entertainment Properties Trust |
Donald H. Pratt (1937) | Director and Chairman of the Board | Since 1995 (Chairman since 2005) | Chairman and Chief Executive Officer, Western Investments, Inc. (real estate company) | | 66 | None |
Name (Year of Birth) | Position(s) Held with Funds | Length of Time Served | Principal Occupation(s) During Past 5 Years | | Number of American Century Portfolios Overseen by Director | Other Directorships Held During Past 5 Years |
| Independent Directors |
M. Jeannine Strandjord (1945) | Director | Since 1994 | Retired | | 66 | Euronet Worldwide Inc.; Charming Shoppes, Inc. (2006 to 2010); and DST Systems Inc. (1996 to 2012) |
John R. Whitten (1946) | Director | Since 2008 | Retired | | 66 | Rudolph Technologies, Inc. |
Stephen E. Yates (1948) | Director | Since 2012 | Retired; Executive Vice President, Technology & Operations, KeyCorp. (computer services) (2004 to 2010) | | 66 | Applied Industrial Technology (2001 to 2010) |
| |
| Interested Directors |
Barry Fink (1955) | Director and Executive Vice President | Since 2012 (Executive Vice President since 2007) | Chief Operating Officer and Executive Vice President, ACC (September 2007 to present); President, ACS (October 2007 to present); Managing Director, Morgan Stanley (2000 to 2007). Also serves as Manager, ACS and Director, ACC and certain ACC subsidiaries | | 66 | None |
Jonathan S. Thomas (1963) | Director and President | Since 2007 | President and Chief Executive Officer, ACC (March 2007 to present); Chief Administrative Officer, ACC (February 2006 to February 2007); Executive Vice President, ACC. (November 2005 to February 2007). Also serves as Chief Executive Officer and Manager, ACS; Executive Vice President, ACIM; Director, ACC, ACIM and other ACC subsidiaries | | 108 | None |
Officers
The following table presents certain information about the executive officers of the funds. Each officer serves as an officer for each of the 15 investment companies in the American Century family of funds, unless otherwise noted. No officer is compensated for his or her service as an officer of the funds. The listed officers are interested persons of the funds and are appointed or re-appointed on an annual basis. The mailing address for each officer listed below is 4500 Main Street, Kansas City, Missouri 64111.
Name (Year of Birth) | Offices with the Funds | Principal Occupation(s) During the Past Five Years |
Jonathan S. Thomas (1963) | Director and President since 2007 | President and Chief Executive Officer, ACC (March 2007 to present); Chief Administrative Officer, ACC (February 2006 to February 2007); Executive Vice President, ACC (November 2005 to February 2007). Also serves as Chief Executive Officer and Manager, ACS; Executive Vice President, ACIM; Director, ACC, ACIM and other ACC subsidiaries |
Barry Fink (1955) | Director since 2012 and Executive Vice President since 2007 | Chief Operating Officer and Executive Vice President, ACC (September 2007 to present); President, ACS (October 2007 to present); Managing Director, Morgan Stanley (2000 to 2007). Also serves as Manager, ACS and Director, ACC and certain ACC subsidiaries |
Maryanne L. Roepke (1956) | Chief Compliance Officer since 2006 and Senior Vice President since 2000 | Chief Compliance Officer, American Century funds, ACIM and ACS (August 2006 to present). Also serves as Senior Vice President, ACS |
Charles A. Etherington (1957) | General Counsel since 2007 and Senior Vice President since 2006 | Attorney, ACC (February 1994 to present); Vice President, ACC (November 2005 to present), General Counsel, ACC (March 2007 to present); Also serves as General Counsel, ACIM, ACS, ACIS and other ACC subsidiaries; and Senior Vice President, ACIM and ACS |
C. Jean Wade (1964) | Vice President, Treasurer and Chief Financial Officer since 2012 | Vice President, ACS (February 2000 to present) |
Robert J. Leach (1966) | Vice President since 2006 and Assistant Treasurer since 2012 | Vice President, ACS (February 2000 to present) |
David H. Reinmiller (1963) | Vice President since 2000 | Attorney, ACC (January 1994 to present); Associate General Counsel, ACC (January 2001 to present). Also serves as Vice President, ACIM and ACS |
Ward D. Stauffer (1960) | Secretary since 2005 | Attorney, ACC (June 2003 to present) |
The Statement of Additional Information has additional information about the fund’s directors and is available without charge, upon request, by calling 1-800-345-2021.
Approval of Management Agreement |
At a meeting held on June 21, 2012, the Fund’s Board of Directors unanimously approved the renewal of the management agreement pursuant to which American Century Investment Management, Inc. (the “Advisor”) acts as the investment advisor for the Fund. Under Section 15(c) of the Investment Company Act, contracts for investment advisory services are required to be reviewed, evaluated, and approved by a majority of a fund’s independent directors (the “Directors”) each year.
As a part of the approval process, the Board requested and reviewed extensive data and information compiled by the Advisor and certain independent providers of evaluation data concerning the Fund and the services provided to the Fund by the Advisor. This review was in addition to the oversight and evaluation undertaken by the Board and its committees on a continuous basis throughout the year and included, but was not limited to the following:
| • | the nature, extent, and quality of investment management, shareholder services, and other services provided by the Advisor to the Fund; |
| • | the wide range of other programs and services the Advisor provides to the Fund and its shareholders on a routine and non-routine basis; |
| • | the investment performance of the fund, including data comparing the Fund’s performance to appropriate benchmarks and/or a peer group of other mutual funds with similar investment objectives and strategies; |
| • | data comparing the cost of owning the Fund to the cost of owning similar funds; |
| • | the Advisor’s compliance policies, procedures, and regulatory experience; |
| • | financial data showing the cost of services provided to the Fund, the profitability of the Fund to the Advisor, and the overall profitability of the Advisor; |
| • | data comparing services provided and charges to other investment management clients of the Advisor; and |
| • | consideration of collateral benefits derived by the Advisor from the management of the Fund and any potential economies of scale relating thereto. |
In keeping with its practice, the Board held two in-person meetings and one telephonic meeting to review and discuss the information provided. The Directors also had the benefit of the advice of independent counsel throughout the period.
Factors Considered
The Directors considered all of the information provided by the Advisor, the independent data providers, and independent counsel, and evaluated such information for the Fund. In connection with their review, the Directors did not identify any single factor as being all-important or controlling, and each Director may have attributed different levels of importance to different factors. In deciding to renew the management agreement, the Board based its decision on a number of factors, including the following:
Nature, Extent and Quality of Services — Generally. Under the management agreement, the Advisor is responsible for providing or arranging for all services necessary for the operation of the Fund. The Board noted that under the management agreement, the Advisor provides or arranges at its own expense a wide variety of services including:
| • | constructing and designing the Fund |
| • | portfolio research and security selection |
| • | initial capitalization/funding |
| • | daily valuation of the Fund’s portfolio |
| • | shareholder servicing and transfer agency, including shareholder confirmations, recordkeeping, and communications |
| • | regulatory and portfolio compliance |
| • | marketing and distribution |
The Board noted that many of these services have expanded over time both in terms of quantity and complexity in response to shareholder demands, competition in the industry, changing distribution channels, and the changing regulatory environment.
Investment Management Services. The nature of the investment management services provided to the Fund is quite complex and allows Fund shareholders access to professional money management, instant diversification of their investments within an asset class, the opportunity to easily diversify among asset classes by investing in or exchanging among various American Century Investments funds, and liquidity. In evaluating investment performance, the Board expects the Advisor to manage the Fund in accordance with its investment objectives and approved strategies. Further, the Directors recognize that the Advisor has an obligation to monitor trading activities, and in particular to seek the best execution of fund trades, and to evaluate the use of and payment for research. In providing these services, the Advisor utilizes teams of investment professionals (portfolio managers, analysts, research assistants, and securities traders) who require extensive information technology, research, training, compliance and other systems to conduct their business. The Board, directly and through its Fund Performance Review Committee, regularly reviews investment performance information for the Fund, together with comparative information for appropriate benchmarks and/or peer groups of similarly-managed funds, over different time horizons. The
Directors also review detailed performance information during the management agreement approval process. If performance concerns are identified, the Fund receives special reviews until performance improves, during which the Board discusses with the Advisor the reasons for such results (e.g., market conditions, security selection) and any efforts being undertaken to improve performance. Taking all these factors into consideration, the Board found the investment management services provided by the Advisor to the Fund to meet or exceed industry standards. More detailed information about the Fund’s performance can be found in the Performance and Portfolio Commentary sections of this report.
Shareholder and Other Services. Under the management agreement, the Advisor provides the Fund with a comprehensive package of transfer agency, shareholder, and other services. The Board, directly and through various committees of the Board, regularly reviews reports and evaluations of such services at its regular meetings. These reports include, but are not limited to, information regarding the operational efficiency and accuracy of the shareholder and transfer agency services provided, staffing levels, shareholder satisfaction (as measured by external as well as internal sources), technology support, new products and services offered to Fund shareholders, securities trading activities, portfolio valuation services, auditing services, and legal and operational compliance activities. Certain aspects of shareholder and transfer agency service level efficiency and the quality of securities trading activities are measured by independent third party providers and are presented in comparison to other fund groups not managed by the Advisor. The Board found the services provided by the Advisor to the Fund under the management agreement to be competitive and of high quality.
Costs of Services and Profitability. The Advisor provides detailed information concerning its cost of providing various services to the Fund, its profitability in managing the Fund, its overall profitability, and its financial condition. The Directors have reviewed with the Advisor the methodology used to prepare this financial information. The financial information regarding the Advisor is considered in evaluating the Advisor’s financial condition, ability to continue to provide services under the management agreement, and the reasonableness of the current management fee. The Board concluded that the Advisor’s profits were reasonable in light of the services provided to the Fund.
Ethics. The Board generally considers the Advisor’s commitment to providing quality services to shareholders and to conducting its business ethically. They noted that the Advisor’s practices generally meet or exceed industry best practices.
Economies of Scale. The Board also reviewed information provided by the Advisor regarding the possible existence of economies of scale in connection with the management of the Fund. The Board concluded that economies of scale are difficult to measure and predict with precision, especially on a fund-by-fund basis. The Board concluded that the Advisor is appropriately sharing economies of scale through its competitive fee structure, offering competitive fees from fund inception, and through reinvestment in its business to provide shareholders additional content and services.
Comparison to Other Funds’ Fees. The management agreement provides that the Fund pay the Advisor a single, all-inclusive (or unified) management fee for providing all services necessary for the management and operation of the Fund, other than brokerage expenses, taxes, interest, extraordinary expenses, and the fees and expenses of the Fund’s independent directors (including their independent legal counsel) and expenses incurred in connection with the provision of shareholder services and distribution services under a plan adopted pursuant to Rule 12b-1 under the 1940 Act. Under the unified fee structure, the Advisor is responsible for providing all investment advisory, custody, audit, administrative, compliance, recordkeeping, marketing and shareholder services, or arranging and supervising third parties to provide such services. By contrast, most other funds are charged a variety of fees, including an investment advisory fee, a transfer agency fee, an administrative fee, distribution charges and other expenses. Other than their investment advisory fees and any applicable Rule 12b-1 distribution fees, all other components of the total fees charged by these other funds may be increased without shareholder approval. The Board believes the unified fee structure is a benefit to Fund shareholders because it clearly discloses to shareholders the cost of owning Fund shares, and, since the unified fee cannot be increased without a vote of Fund shareholders, it shifts to the Advisor the risk of increased costs of operating the Fund and provides a direct incentive to minimize administrative inefficiencies. Part of the Board’s analysis of fee levels involves reviewing certain evaluative data compiled by an independent provider and comparing the Fund’s unified fee to the total expense ratio of other funds in the Fund’s peer group. The Board concluded that the management fee paid by the Fund to the Advisor under the management agreement is reasonable in light of the services provided to the Fund.
Comparison to Fees and Services Provided to Other Clients of the Advisor. The Board also requested and received information from the Advisor concerning the nature of the services, fees, costs and profitability of its advisory services to advisory clients other than the Fund. They observed that these varying types of client accounts require different services and involve different regulatory and entrepreneurial risks than the management of the Fund. The Board analyzed this information and concluded that the fees charged and services provided to the Fund were reasonable by comparison.
Collateral or “Fall-Out” Benefits Derived by the Advisor. The Board considered the existence of collateral benefits the Advisor may receive as a result of its relationship with the Fund. They concluded that the Advisor’s primary business is managing mutual funds and it generally does not use fund or shareholder information to generate profits in other lines of business, and therefore does not derive any significant collateral benefits from them. The Board noted that the Advisor receives proprietary research from broker-dealers that execute fund portfolio transactions and concluded that this research is likely to benefit Fund shareholders. The Board also determined that the Advisor is able to provide investment management services to certain clients other than the Fund, at least in part, due to its existing infrastructure built to serve the fund complex. The Board concluded, however, that the assets of those other clients are not material to the analysis and, where applicable, may be included with the assets of the Fund to determine breakpoints in the management fee schedule.
Existing Relationship. The Board also considered whether there was any reason for not continuing the existing arrangement with the Advisor. In this regard, the Board was mindful of the potential disruptions of the Fund’s operations and various risks, uncertainties, and other effects that could occur as a result of a decision not to continue such relationship. In particular, the Board recognized that most shareholders have invested in the Fund on the strength of the Advisor’s industry standing and reputation and in the expectation that the Advisor will have a continuing role in providing advisory services to the Fund.
Conclusion of the Directors. As a result of this process, the Board, including all of the independent directors, taking into account all of the factors discussed above and the information provided by the Advisor and others, concluded that the management agreement between the Fund and the Advisor is fair and reasonable in light of the services provided and should be renewed.
Retirement Account Information
As required by law, distributions you receive from certain IRAs, or 403(b), 457 and qualified plans are subject to federal income tax withholding, unless you elect not to have withholding apply. Tax will be withheld on the total amount withdrawn even though you may be receiving amounts that are not subject to withholding, such as nondeductible contributions. In such case, excess amounts of withholding could occur. You may adjust your withholding election so that a greater or lesser amount will be withheld.
If you don’t want us to withhold on this amount, you must notify us to not withhold the federal income tax. You may notify us in writing or in certain situations by telephone or through other electronic means. You have the right to revoke your withholding election at any time and any election you make may remain in effect until revoked by filing a new election.
Remember, even if you elect not to have income tax withheld, you are liable for paying income tax on the taxable portion of your withdrawal. If you elect not to have income tax withheld or you don’t have enough income tax withheld, you may be responsible for payment of estimated tax. You may incur penalties under the estimated tax rules if your withholding and estimated tax payments are not sufficient. You can reduce or defer the income tax on a distribution by directly or indirectly rolling such distribution over to another IRA or eligible plan. You should consult your tax advisor for additional information.
State tax will be withheld if, at the time of your distribution, your address is within one of the mandatory withholding states and you have federal income tax withheld. State taxes will be withheld from your distribution in accordance with the respective state rules.
Proxy Voting Guidelines
American Century Investment Management, Inc., the fund’s investment advisor, is responsible for exercising the voting rights associated with the securities purchased and/or held by the fund. A description of the policies and procedures the advisor uses in fulfilling this responsibility is available without charge, upon request, by calling 1-800-345-2021. It is also available on American Century Investments’ website at americancentury.com and on the Securities and Exchange Commission’s website at sec.gov. Information regarding how the investment advisor voted proxies relating to portfolio securities during the most recent 12-month period ended June 30 is available on the “About Us” page at americancentury.com. It is also available at sec.gov.
Quarterly Portfolio Disclosure
The fund files its complete schedule of portfolio holdings with the Securities and Exchange Commission (SEC) for the first and third quarters of each fiscal year on Form N-Q. The fund’s Forms N-Q are available on the SEC’s website at sec.gov, and may be reviewed and copied at the SEC’s Public Reference Room in Washington, DC. Information on the operation of the Public Reference Room may be obtained by calling 1-800-SEC-0330. The fund also makes its complete schedule of portfolio holdings for the most recent quarter of its fiscal year available on its website at americancentury.com and, upon request, by calling 1-800-345-2021.
Other Tax Information
The following information is provided pursuant to provisions of the Internal Revenue Code.
The fund hereby designates up to the maximum amount allowable as qualified dividend income for the fiscal year ended July 31, 2012.
For corporate taxpayers, the fund hereby designates $86,743, or up to the maximum amount allowable, of ordinary income distributions paid during the fiscal year ended July 31, 2012 as qualified for the corporate dividends received deduction.
| Contact Us | americancentury.com |
| Automated Information Line | 1-800-345-8765 |
| Investor Services Representative | 1-800-345-2021 or 816-531-5575 |
| Investors Using Advisors | 1-800-378-9878 |
Business, Not-For-Profit, Employer-Sponsored Retirement Plans | 1-800-345-3533 |
Banks and Trust Companies, Broker-Dealers, Financial Professionals, Insurance Companies | 1-800-345-6488 |
| Telecommunications Device for the Deaf | 1-800-634-4113 |
American Century Growth Funds, Inc.
Investment Advisor:
American Century Investment Management, Inc.
Kansas City, Missouri
This report and the statements it contains are submitted for the general information of our shareholders. The report is not authorized for distribution to prospective investors unless preceded or accompanied by an effective prospectus.
©2012 American Century Proprietary Holdings, Inc. All rights reserved.
CL-ANN-76090 1209
ANNUAL REPORT JULY 31, 2012
| President’s Letter | 2 |
| Independent Chairman’s Letter | 3 |
| Market Perspective | 4 |
| Performance | 5 |
| Portfolio Commentary | 6 |
| Fund Characteristics | 8 |
| Shareholder Fee Example | 9 |
| Schedule of Investments | 11 |
| Statement of Assets and Liabilities | 14 |
| Statement of Operations | 15 |
| Statement of Changes in Net Assets | 16 |
| Notes to Financial Statements | 17 |
| Financial Highlights | 22 |
| Report of Independent Registered Public Accounting Firm | 24 |
| Management | 25 |
| Approval of Management Agreement | 28 |
| Additional Information | 32 |
Any opinions expressed in this report reflect those of the author as of the date of the report, and do not necessarily represent the opinions of American Century Investments® or any other person in the American Century Investments organization. Any such opinions are subject to change at any time based upon market or other conditions and American Century Investments disclaims any responsibility to update such opinions. These opinions may not be relied upon as investment advice and, because investment decisions made by American Century Investments funds are based on numerous factors, may not be relied upon as an indication of trading intent on behalf of any American Century Investments fund. Security examples are used for representational purposes only and are not intended as recommendations to purchase or sell securities. Performance information for comparative indices and securities is provided to American Century Investments by third party vendors. To the best of American Century Investments’ knowledge, such information is accurate at the time of printing.
Dear Investor:
Thank you for reviewing this annual report for the period ended July 31, 2012. Our report offers investment performance and portfolio information, presented with the expert perspective of our portfolio management team.
This report remains one of our most important vehicles for conveying information about fund returns, as well as market factors and strategies that affected fund performance. For additional, updated information, we encourage you to visit our website, americancentury.com. Click on the “Fund Performance” and “Insights & News” headings at the top of our Individual Investors site.
Flight to Quality as Economic and Financial Uncertainties Resurfaced
During the second half of 2011 and the first half of 2012, the global economy and financial markets struggled to move beyond the lingering aftereffects of the 2008 Financial Crisis and Great Recession. Global economic fundamentals have improved since 2008, but weakened since 2010, with increased uncertainty surrounding near-term economic growth levels in major developed economies such as the U.S., Japan, and Europe. There were also questions about near-term growth levels in emerging economies such as China, and about possible sovereign debt defaults in southern Europe.
These near-term uncertainties manifested themselves in asset returns for the 12 months ended July 31, 2012. Assets perceived to be “safe-haven” investments rallied—the 30-year U.S. Treasury bond posted a 38% total return. At the other end of the spectrum, international stock returns for U.S. investors were undermined by a combination of risk-averse investing attitudes, weakening global economic growth, and a stronger U.S. dollar versus the euro and other currencies. Commodity prices also declined during the period.
Unfortunately, the instability that triggered much of this flight-to-quality trading remains largely in place, and the coming months may bring additional uncertainties about U.S. presidential election results and what might happen when U.S. tax cuts and other stimulative measures expire in 2013 (the “Fiscal Cliff”). In this uncertain, unstable environment, we continue to believe in a disciplined, diversified, long-term investment approach, using both stocks and bonds, as appropriate. We appreciate your continued trust in us during these unsettled times.
Sincerely,
Jonathan Thomas
President and Chief Executive Officer
American Century Investments
Independent Chairman’s Letter |
Don Pratt
Dear Fellow Shareholders,
The assets under management in American Century Investments’ funds grow through investors placing new assets in the funds and through market appreciation. Asset growth has been at near record levels over the past two calendar years as market movements were upward, the funds’ relative returns were generally favorable, and the distribution strategies implemented by fund management have been successful.
The board reviews fund performance and distribution strategies on a regular basis. Several years ago, the fund’s management team discussed with the board its plans to grow fund assets in the intermediary, institutional and international distribution channels. These distribution strategies have produced strong positive growth. The growth in the intermediary channel recognizes the funds’ strong relative investment performance and the desire of many shareholders to seek financial guidance. Investors in both the institutional and international channels appear to find the funds’ risk-based investment strategies attractive. The board continues to support fund management’s strategies to increase fund assets and will continue to work to provide the benefits of these gains to fund shareholders.
We continue to receive a steady flow of very thoughtful questions from shareholders. If there are issues that you would like the board to address please email me at dhpratt@fundboardchair.com. Thank you for your continued investment in American Century Investments funds.
Best regards,
Don Pratt
By David Hollond, Chief Investment Officer,
U.S. Growth Equity — Mid & Small Cap
Stocks Gained Amid Volatility
The U.S. stock market generated positive results for the 12-month period ended July 31, 2012, although it endured significant volatility along the way. As the reporting period began, stocks were in the midst of a decline as evidence of a slowdown in U.S. economic activity and a worsening sovereign debt crisis in Europe put downward pressure on the equity market.
In early October, though, the equity market bottomed and reversed course, enjoying a substantial rebound through the fourth quarter of 2011 and first quarter of 2012. Investors became more optimistic as signs of improving economic activity quashed recession fears; in particular, job growth consistently exceeded expectations, driving the unemployment rate down to its lowest level in more than three years. Another positive factor was better news out of Europe, as the European Central Bank provided favorable long-term financing to the debt markets and support for the Continent’s banking sector.
The final months of the reporting period brought yet another reversal, as the headwinds facing the equity market at the beginning of the period returned to the forefront. Evidence of slowing economic activity in the U.S. and adverse developments in Europe—including political turmoil in Greece and troubled banks in Spain—weighed on investor confidence, sending stocks down sharply once again.
As the table below illustrates, large-cap issues generated the strongest returns, outpacing mid- and small-cap shares. Growth and value stocks were mixed – growth issues outperformed value among large-cap stocks, while value shares held up better in the mid-and small-cap segments of the market.
From a sector perspective, the defensive telecommunication services sector fared best. Consumer staples, utilities, and health care stocks all managed double-digit gains in the broad Russell 3000 Index. On the downside, the commodity-driven energy and materials sectors fell the most during the period, reflecting a broad decline in commodity prices.
| Market Index Total Returns | |
| For the 12 months ended July 31, 2012 | |
| U.S. Stocks | |
| Russell 1000 Index (Large-Cap) | | | 7.96 | % |
| Russell Midcap Index | | | 2.28 | % |
| Russell 2000 Index (Small-Cap) | | | 0.19 | % |
| Foreign Stocks | |
| MSCI EAFE Index | | | -11.45 | % |
| MSCI Emerging Markets Index | | | -13.93 | % |
| Total Returns as of July 31, 2012 |
| | | | Average Annual Returns | |
| | Ticker Symbol | 1 year | 5 years | Since Inception | Inception Date |
| Investor Class | ACMNX | 4.87% | -1.40% | 2.69% | 5/31/06 |
| Russell 3000 Index | — | 7.33% | 1.29% | 3.53% | — |
| Institutional Class | ACMHX | 5.05% | -1.20% | 2.89% | 5/31/06 |
| Advisor Class | ACMFX | 4.65% | -1.66% | 2.43% | 5/31/06 |
| R Class | ACMEX | 4.34% | -1.94% | 2.14% | 5/31/06 |
| Growth of $10,000 Over Life of Class |
| $10,000 investment made May 31, 2006 |
*From 5/31/06, the Investor Class’s inception date. Not annualized.
| Total Annual Fund Operating Expenses |
| Investor Class | Institutional Class | Advisor Class | R Class |
| 1.17% | 0.97% | 1.42% | 1.67% |
The total annual fund operating expenses shown is as stated in the fund’s prospectus current as of the date of this report. The prospectus may vary from the expense ratio shown elsewhere in this report because it is based on a different time period, includes acquired fund fees and expenses, and, if applicable, does not include fee waivers or expense reimbursements.
Data presented reflect past performance. Past performance is no guarantee of future results. Current performance may be higher or lower than the performance shown. Investment return and principal value will fluctuate, and redemption value may be more or less than original cost. To obtain performance data current to the most recent month end, please call 1-800-345-2021 or visit americancentury.com. Historically, small company stocks have been more volatile than the stocks of larger, more established companies. The fund’s investment process may result in high portfolio turnover, which could mean high transaction costs, affecting both performance and capital gains tax liabilities to investors. International investing involves special risks, such as political instability and currency fluctuations.
Unless otherwise indicated, performance reflects Investor Class shares; performance for other share classes will vary due to differences in fee structure. For information about other share classes available, please consult the prospectus. Data assumes reinvestment of dividends and capital gains, and none of the charts reflect the deduction of taxes that a shareholder would pay on fund distributions or the redemption of fund shares. Returns for the index are provided for comparison. The fund’s total returns include operating expenses (such as transaction costs and management fees) that reduce returns, while the total returns of the index do not.
Portfolio Managers: John T. Small Jr. and Stephen Pool
Performance Summary
Legacy Multi Cap returned 4.87%* for the 12 months ended July 31, 2012, lagging the performance of its benchmark, the Russell 3000 Index, which returned 7.33%.
As discussed in the Market Perspective on page 4, U.S. stock indices delivered positive returns during the reporting period, despite high levels of market volatility. In an environment of changing economic and market conditions, Legacy Multi Cap’s management team remained focused on the fundamental business prospects of its portfolio investments.
Legacy Multi Cap delivered positive results for the reporting period, but underperformed its benchmark. Within the portfolio, stock selection in the information technology and telecommunication services sectors detracted meaningfully from returns relative to the benchmark. Stock decisions in the industrials and consumer discretionary sectors also detracted. Holdings in the materials, consumer staples, and health care sectors helped to offset those relative losses.
Information Technology, Telecommunications Services Lagged
The information technology sector was the largest source of relative underperformance for Legacy Multi Cap. Here, a handful of positions in the semiconductor group detracted from returns versus the benchmark, including solar panel manufacturer First Solar. The company’s revenues declined as an aggressive competitive environment drove down prices.
In the IT services group, an overweight position in ManTech International hurt relative returns. The company, which is one of the U.S. government’s leading providers of technologies for national security programs, suffered a decline in earnings due to government funding delays and uncertainty.
In the telecom sector, Legacy Multi Cap held a stake in KT Corp., South Korea’s largest fixed-line telephone operator and second-largest mobile carrier. The company’s net profit declined sharply amid increased spending to upgrade its network and higher marketing costs to attract new subscribers. A government-led campaign initiated in 2011 urging telecom providers to reduce fees to ease rising inflation also hurt earnings. Also in the sector, positioning among wireless telephone companies detracted from relative performance.
Industrials, Consumer Discretionary Underperformed
In the industrials sector, the portfolio held detrimental overweight positions in the commercial services and supplies industry group. Overweight positions in the air freight and logistics group also hurt relative results.
The consumer discretionary sector was also a source of underperformance versus the benchmark. Within the media industry, an overweight position in Cablevision Systems hurt relative returns. The New York-area cable company suffered a drop in net income, caused in part by costs created by Hurricane Irene.
*All fund returns referenced in this commentary are for Investor Class shares.
Materials, Consumer Staples, Health Care Contributed
The materials sector was the largest source of relative outperformance for Legacy Multi Cap, largely attributable to a position in Mexican building materials company Cemex. The company experienced improving pricing and volumes, with increasing demand in its infrastructure and residential business units. Elsewhere in the sector, the portfolio benefited from individual stakes in the metals and mining industry group.
Within the consumer staples sector, retailer Wal-Mart contributed to absolute and relative returns. The company’s earnings rose as it attracted price-conscious shoppers in a difficult economic environment. Holdings in the food products group also added meaningfully to relative results.
In the health care sector, an overweight position in biopharmaceutical company Pharmacyclics added significantly to performance versus the benchmark. The developer of blood cancer treatments reported better-than-expected earnings and saw a significant jump in its share price.
The portfolio benefited from its position in Humana, which delivered positive results while held in the portfolio but declined for the entire reporting period in the benchmark. The health insurer missed its expected earnings target and lowered guidance for future earnings due to increased membership in its Medicare Advantage programs.
Outlook
We remain cautiously optimistic in our market outlook. Despite market volatility, markets delivered solid performance during the reporting period. However, we continue to look for more meaningful improvements in economic conditions. Regardless of economic and market conditions, Legacy Multi Cap employs financial acceleration and price momentum characteristics to identify investment opportunities in any given economic environment. As always, it will employ a quantitative model to exploit investment opportunities across the growth and value spectrum.
| JULY 31, 2012 | | | |
| Top Ten Holdings | | % of net assets |
| Wal-Mart Stores, Inc. | | | 2.8 | % |
| Altisource Portfolio Solutions SA | | | 1.4 | % |
| Abbott Laboratories | | | 1.4 | % |
| Target Corp. | | | 1.3 | % |
| Rayonier, Inc. | | | 1.3 | % |
| China Mobile Ltd. ADR | | | 1.3 | % |
| Packaging Corp. of America | | | 1.3 | % |
| Harris Corp. | | | 1.2 | % |
| Cablevision Systems Corp., Class A | | | 1.2 | % |
| McKesson Corp. | | | 1.2 | % |
| | | | | |
| Top Five Industries | | % of net assets |
| Oil, Gas and Consumable Fuels | | | 8.8 | % |
| Food and Staples Retailing | | | 7.8 | % |
| Health Care Providers and Services | | | 7.0 | % |
| Insurance | | | 6.1 | % |
| Media | | | 5.1 | % |
| | | | | |
| Types of Investments in Portfolio | | % of net assets |
| Domestic Common Stocks | | | 90.4 | % |
| Foreign Common Stocks* | | | 8.6 | % |
| Total Common Stocks | | | 99.0 | % |
| Temporary Cash Investments | | | 1.3 | % |
| Other Assets and Liabilities | | | (0.3 | )% |
| *Includes depositary shares, dual listed securities and foreign ordinary shares. | | | | |
Fund shareholders may incur two types of costs: (1) transaction costs, including sales charges (loads) on purchase payments and redemption/exchange fees; and (2) ongoing costs, including management fees; distribution and service (12b-1) fees; and other fund expenses. This example is intended to help you understand your ongoing costs (in dollars) of investing in your fund and to compare these costs with the ongoing cost of investing in other mutual funds.
The example is based on an investment of $1,000 made at the beginning of the period and held for the entire period from February 1, 2012 to July 31, 2012.
Actual Expenses
The table provides information about actual account values and actual expenses for each class. You may use the information, together with the amount you invested, to estimate the expenses that you paid over the period. First, identify the share class you own. Then simply divide your account value by $1,000 (for example, an $8,600 account value divided by $1,000 = 8.6), then multiply the result by the number under the heading “Expenses Paid During Period” to estimate the expenses you paid on your account during this period.
If you hold Investor Class shares of any American Century Investments fund, or Institutional Class shares of the American Century Diversified Bond Fund, in an American Century Investments account (i.e., not a financial intermediary or retirement plan account), American Century Investments may charge you a $12.50 semiannual account maintenance fee if the value of those shares is less than $10,000. We will redeem shares automatically in one of your accounts to pay the $12.50 fee. In determining your total eligible investment amount, we will include your investments in all personal accounts (including American Century Investments Brokerage accounts) registered under your Social Security number. Personal accounts include individual accounts, joint accounts, UGMA/UTMA accounts, personal trusts, Coverdell Education Savings Accounts and IRAs (including traditional, Roth, Rollover, SEP-, SARSEP- and SIMPLE-IRAs), and certain other retirement accounts. If you have only business, business retirement, employer-sponsored or American Century Investments Brokerage accounts, you are currently not subject to this fee. If you are subject to the Account Maintenance Fee, your account value could be reduced by the fee amount.
Hypothetical Example for Comparison Purposes
The table also provides information about hypothetical account values and hypothetical expenses based on the actual expense ratio of each class of your fund and an assumed rate of return of 5% per year before expenses, which is not the actual return of a fund’s share class. The hypothetical account values and expenses may not be used to estimate the actual ending account balance or expenses you paid for the period. You may use this information to compare the ongoing costs of investing in your fund and other funds. To do so, compare this 5% hypothetical example with the 5% hypothetical examples that appear in the shareholder reports of the other funds.
Please note that the expenses shown in the table are meant to highlight your ongoing costs only and do not reflect any transactional costs, such as sales charges (loads) or redemption/exchange fees. Therefore, the table is useful in comparing ongoing costs only, and will not help you determine the relative total costs of owning different funds. In addition, if these transactional costs were included, your costs would have been higher.
| | Beginning Account Value 2/1/12 | Ending Account Value 7/31/12 | Expenses Paid During Period(1) 2/1/12 – 7/31/12 | Annualized Expense Ratio(1) |
| Actual | | | | |
| Investor Class | $1,000 | $1,014.40 | $5.81 | 1.16% |
| Institutional Class | $1,000 | $1,015.20 | $4.81 | 0.96% |
| Advisor Class | $1,000 | $1,012.70 | $7.06 | 1.41% |
| R Class | $1,000 | $1,011.00 | $8.30 | 1.66% |
| Hypothetical | | | | |
| Investor Class | $1,000 | $1,019.10 | $5.82 | 1.16% |
| Institutional Class | $1,000 | $1,020.09 | $4.82 | 0.96% |
| Advisor Class | $1,000 | $1,017.85 | $7.07 | 1.41% |
| R Class | $1,000 | $1,016.61 | $8.32 | 1.66% |
| (1) | Expenses are equal to the class’s annualized expense ratio listed in the table above, multiplied by the average account value over the period, multiplied by 182, the number of days in the most recent fiscal half-year, divided by 366, to reflect the one-half year period. |
| | | Shares | | | Value | |
| Common Stocks — 99.0% | |
| AEROSPACE AND DEFENSE — 3.6% | |
| General Dynamics Corp. | | | 1,368 | | | | $86,786 | |
| L-3 Communications Holdings, Inc. | | | 1,057 | | | | 74,931 | |
| Lockheed Martin Corp. | | | 1,190 | | | | 106,231 | |
| United Technologies Corp. | | | 582 | | | | 43,324 | |
| | | | | | | | 311,272 | |
| AIR FREIGHT AND LOGISTICS — 1.9% | |
| CH Robinson Worldwide, Inc. | | | 1,399 | | | | 73,937 | |
| United Parcel Service, Inc., Class B | | | 1,262 | | | | 95,420 | |
| | | | | | | | 169,357 | |
| AIRLINES — 0.3% | | | | | | | | |
| Copa Holdings SA Class A | | | 391 | | | | 30,314 | |
| BEVERAGES — 1.1% | | | | | | | | |
| Dr Pepper Snapple Group, Inc. | | | 2,171 | | | | 98,954 | |
| BIOTECHNOLOGY — 0.6% | | | | | | | | |
Spectrum Pharmaceuticals, Inc.(1) | | | 3,710 | | | | 51,903 | |
| CAPITAL MARKETS — 0.5% | |
| Walter Investment Management Corp. | | | 2,033 | | | | 45,987 | |
| COMMERCIAL BANKS — 1.1% | |
| Regions Financial Corp. | | | 13,818 | | | | 96,173 | |
| COMMERCIAL SERVICES AND SUPPLIES — 2.6% | |
| Avery Dennison Corp. | | | 2,950 | | | | 90,831 | |
| Republic Services, Inc. | | | 2,869 | | | | 83,000 | |
Stericycle, Inc.(1) | | | 538 | | | | 49,953 | |
| | | | | | | | 223,784 | |
| COMMUNICATIONS EQUIPMENT — 2.2% | |
| Cisco Systems, Inc. | | | 5,011 | | | | 79,926 | |
| Harris Corp. | | | 2,608 | | | | 108,623 | |
| | | | | | | | 188,549 | |
| COMPUTERS AND PERIPHERALS — 1.4% | |
Apple, Inc.(1) | | | 149 | | | | 91,003 | |
Western Digital Corp.(1) | | | 848 | | | | 33,725 | |
| | | | | | | | 124,728 | |
| CONTAINERS AND PACKAGING — 2.4% | |
Crown Holdings, Inc.(1) | | | 2,648 | | | | 95,063 | |
| Packaging Corp. of America | | | 3,558 | | | | 109,551 | |
| | | | | | | | 204,614 | |
| DIVERSIFIED CONSUMER SERVICES — 1.0% | |
| H&R Block, Inc. | | | 5,549 | | | | 89,505 | |
| DIVERSIFIED FINANCIAL SERVICES — 0.9% | |
| MarketAxess Holdings, Inc. | | | 2,723 | | | | 82,289 | |
| DIVERSIFIED TELECOMMUNICATION SERVICES — 1.5% | |
| BCE, Inc. | | | 1,495 | | | | 63,598 | |
tw telecom, inc.(1) | | | 2,733 | | | | 68,680 | |
| | | | | | | | 132,278 | |
| ELECTRIC UTILITIES — 0.6% | |
| Xcel Energy, Inc. | | | 1,688 | | | | 49,459 | |
| ELECTRICAL EQUIPMENT — 1.0% | |
| Emerson Electric Co. | | | 1,890 | | | | 90,285 | |
| ELECTRONIC EQUIPMENT, INSTRUMENTS AND COMPONENTS — 1.0% | |
Ingram Micro, Inc. Class A(1) | | | 5,651 | | | | 84,709 | |
| ENERGY EQUIPMENT AND SERVICES — 1.6% | |
Nabors Industries Ltd.(1) | | | 3,844 | | | | 53,201 | |
Parker Drilling Co.(1) | | | 18,493 | | | | 85,623 | |
| | | | | | | | 138,824 | |
| FOOD AND STAPLES RETAILING — 7.8% | |
| Andersons, Inc. (The) | | | 2,269 | | | | 86,154 | |
| Costco Wholesale Corp. | | | 811 | | | | 78,002 | |
| CVS Caremark Corp. | | | 1,066 | | | | 48,236 | |
| Kroger Co. (The) | | | 3,491 | | | | 77,395 | |
| Safeway, Inc. | | | 2,583 | | | | 40,166 | |
| Wal-Mart Stores, Inc. | | | 3,256 | | | | 242,344 | |
| Walgreen Co. | | | 2,863 | | | | 104,099 | |
| | | | | | | | 676,396 | |
| FOOD PRODUCTS — 1.0% | | | | | | | | |
TreeHouse Foods, Inc.(1) | | | 1,563 | | | | 87,512 | |
| GAS UTILITIES — 1.1% | | | | | | | | |
| UGI Corp. | | | 3,182 | | | | 97,528 | |
| HEALTH CARE EQUIPMENT AND SUPPLIES — 3.0% | |
| Becton, Dickinson and Co. | | | 1,266 | | | | 95,849 | |
| Medtronic, Inc. | | | 2,554 | | | | 100,679 | |
ResMed, Inc.(1) | | | 2,145 | | | | 67,696 | |
| | | | | | | | 264,224 | |
| HEALTH CARE PROVIDERS AND SERVICES — 7.0% | |
| AmerisourceBergen Corp. | | | 2,461 | | | | 97,702 | |
| Cardinal Health, Inc. | | | 2,312 | | | | 99,624 | |
DaVita, Inc.(1) | | | 700 | | | | 68,894 | |
| McKesson Corp. | | | 1,172 | | | | 106,336 | |
Mednax, Inc.(1) | | | 1,042 | | | | 68,907 | |
| UnitedHealth Group, Inc. | | | 1,636 | | | | 83,583 | |
| WellPoint, Inc. | | | 1,587 | | | | 84,571 | |
| | | | | | | | 609,617 | |
| HOTELS, RESTAURANTS AND LEISURE — 2.1% | |
| Darden Restaurants, Inc. | | | 1,806 | | | | 92,431 | |
| McDonald’s Corp. | | | 967 | | | | 86,411 | |
| | | | | | | | 178,842 | |
| | | Shares | | | Value | |
| HOUSEHOLD DURABLES — 0.5% | |
Skullcandy, Inc.(1) | | | 2,769 | | | | $39,901 | |
| INDEPENDENT POWER PRODUCERS AND ENERGY TRADERS — 0.4% | |
| Ormat Technologies, Inc. | | | 2,123 | | | | 38,214 | |
| INSURANCE — 6.1% | | | | | | | | |
| Cincinnati Financial Corp. | | | 2,334 | | | | 88,318 | |
| CNO Financial Group, Inc. | | | 10,951 | | | | 90,784 | |
| Fidelity National Financial, Inc. Class A | | | 2,401 | | | | 44,707 | |
Genworth Financial, Inc., Class A(1) | | | 8,535 | | | | 43,016 | |
| Marsh & McLennan Cos., Inc. | | | 2,965 | | | | 98,468 | |
| Progressive Corp. (The) | | | 4,780 | | | | 94,357 | |
| StanCorp Financial Group, Inc. | | | 2,372 | | | | 70,591 | |
| | | | | | | | 530,241 | |
| INTERNET SOFTWARE AND SERVICES — 0.9% | |
| NIC, Inc. | | | 5,598 | | | | 75,349 | |
| IT SERVICES — 4.9% | | | | | | | | |
CACI International, Inc., Class A(1) | | | 484 | | | | 27,322 | |
| Computer Sciences Corp. | | | 3,085 | | | | 75,952 | |
| Fidelity National Information Services, Inc. | | | 2,252 | | | | 70,803 | |
| International Business Machines Corp. | | | 242 | | | | 47,427 | |
| MAXIMUS, Inc. | | | 2,076 | | | | 104,838 | |
| Paychex, Inc. | | | 3,062 | | | | 100,097 | |
| | | | | | | | 426,439 | |
| MACHINERY — 2.0% | | | | | | | | |
| Caterpillar, Inc. | | | 1,018 | | | | 85,726 | |
| Toro Co. (The) | | | 2,343 | | | | 88,097 | |
| | | | | | | | 173,823 | |
| MEDIA — 5.1% | | | | | | | | |
| Arbitron, Inc. | | | 1,593 | | | | 55,867 | |
| Belo Corp. Class A | | | 7,551 | | | | 51,724 | |
| Cablevision Systems Corp., Class A | | | 6,975 | | | | 106,996 | |
| Time Warner Cable, Inc. | | | 1,019 | | | | 86,544 | |
Valassis Communications, Inc.(1) | | | 3,527 | | | | 79,534 | |
| Virgin Media, Inc. | | | 2,314 | | | | 63,357 | |
| | | | | | | | 444,022 | |
| METALS AND MINING — 1.8% | |
| Agnico-Eagle Mines Ltd. New York Shares | | | 980 | | | | 42,954 | |
| Kinross Gold Corp. New York Shares | | | 3,388 | | | | 28,154 | |
| Newmont Mining Corp. | | | 1,887 | | | | 83,915 | |
| | | | | | | | 155,023 | |
| MULTILINE RETAIL — 2.1% | |
| Kohl’s Corp. | | | 1,463 | | | | 72,740 | |
| Target Corp. | | | 1,884 | | | | 114,265 | |
| | | | | | | | 187,005 | |
| OIL, GAS AND CONSUMABLE FUELS — 8.8% | |
| Alliance Holdings GP LP | | | 591 | | | | 28,226 | |
| Chevron Corp. | | | 914 | | | | 100,156 | |
| ConocoPhillips | | | 730 | | | | 39,741 | |
| Exxon Mobil Corp. | | | 1,096 | | | | 95,187 | |
| Linn Energy LLC | | | 1,639 | | | | 64,921 | |
| Permian Basin Royalty Trust | | | 4,886 | | | | 89,121 | |
| Plains All American Pipeline LP | | | 1,206 | | | | 106,128 | |
Plains Exploration & Production Co.(1) | | | 1,809 | | | | 72,288 | |
| Ship Finance International Ltd. | | | 3,756 | | | | 54,387 | |
| Targa Resources Partners LP | | | 690 | | | | 26,199 | |
| Williams Partners LP | | | 1,638 | | | | 88,960 | |
| | | | | | | | 765,314 | |
| PHARMACEUTICALS — 1.4% | |
| Abbott Laboratories | | | 1,797 | | | | 119,159 | |
| REAL ESTATE INVESTMENT TRUSTS (REITs) — 3.8% | |
| American Capital Agency Corp. | | | 2,243 | | | | 78,819 | |
| Macerich Co. (The) | | | 1,484 | | | | 86,680 | |
| PS Business Parks, Inc. | | | 772 | | | | 52,195 | |
| Rayonier, Inc. | | | 2,353 | | | | 112,215 | |
| | | | | | | | 329,909 | |
| REAL ESTATE MANAGEMENT AND DEVELOPMENT — 1.4% | |
Altisource Portfolio Solutions SA(1) | | | 1,545 | | | | 119,830 | |
| SEMICONDUCTORS AND SEMICONDUCTOR EQUIPMENT — 2.8% | |
| Advanced Semiconductor Engineering, Inc. ADR | | | 18,780 | | | | 71,552 | |
| Intel Corp. | | | 438 | | | | 11,257 | |
Micron Technology, Inc.(1) | | | 11,449 | | | | 71,098 | |
| United Microelectronics Corp. ADR | | | 40,662 | | | | 88,236 | |
| | | | | | | | 242,143 | |
| SOFTWARE — 4.2% | | | | | | | | |
ANSYS, Inc.(1) | | | 373 | | | | 22,365 | |
| FactSet Research Systems, Inc. | | | 1,046 | | | | 97,236 | |
| Giant Interactive Group, Inc. ADR | | | 19,246 | | | | 86,800 | |
| Microsoft Corp. | | | 3,539 | | | | 104,294 | |
SolarWinds, Inc.(1) | | | 1,068 | | | | 57,021 | |
| | | | | | | | 367,716 | |
| | | Shares/ Principal Amount | | | Value | |
| SPECIALTY RETAIL — 3.1% | |
Childrens Place Retail Stores, Inc. (The)(1) | | | 1,821 | | | | $92,507 | |
| Finish Line, Inc. (The), Class A | | | 4,246 | | | | 88,656 | |
| Lowe’s Cos., Inc. | | | 3,326 | | | | 84,381 | |
| | | | | | | | 265,544 | |
| WIRELESS TELECOMMUNICATION SERVICES — 2.4% | |
| China Mobile Ltd. ADR | | | 1,902 | | | | 110,544 | |
United States Cellular Corp.(1) | | | 2,298 | | | | 94,494 | |
| | | | | | | | 205,038 | |
| TOTAL COMMON STOCKS (Cost $8,243,408) | | | | | | | 8,611,773 | |
| Temporary Cash Investments — 1.3% | |
FHLB, Discount Notes, 0.00%, 8/1/12(2) | | | $113,000 | | | | 113,000 | |
| SSgA U.S. Government Money Market Fund | | | 307 | | | | 307 | |
TOTAL TEMPORARY CASH INVESTMENTS (Cost $113,307) | | | | 113,307 | |
TOTAL INVESTMENT SECURITIES — 100.3% (Cost $8,356,715) | | | | 8,725,080 | |
| OTHER ASSETS AND LIABILITIES — (0.3)% | | | | (29,908 | ) |
| TOTAL NET ASSETS — 100.0% | | | | $8,695,172 | |
Notes to Schedule of Investments
ADR = American Depositary Receipt
FHLB = Federal Home Loan Bank
(1) Non-income producing.
(2) The rate indicated is the yield to maturity at purchase.
See Notes to Financial Statements.
Statement of Assets and Liabilities |
| JULY 31, 2012 | |
| Assets | |
| Investment securities, at value (cost of $8,356,715) | | | $8,725,080 | |
| Receivable for investments sold | | | 710,240 | |
| Receivable for capital shares sold | | | 80 | |
| Dividends receivable | | | 8,572 | |
| | | | 9,443,972 | |
| | | | | |
| Liabilities | | | | |
| Payable for investments purchased | | | 740,370 | |
| Accrued management fees | | | 8,346 | |
| Distribution and service fees payable | | | 84 | |
| | | | 748,800 | |
| | | | | |
| Net Assets | | | $8,695,172 | |
| | | | | |
| Net Assets Consist of: | | | | |
| Capital (par value and paid-in surplus) | | | $17,211,065 | |
| Undistributed net investment income | | | 128,553 | |
| Accumulated net realized loss | | | (9,012,811 | ) |
| Net unrealized appreciation | | | 368,365 | |
| | | | $8,695,172 | |
| | | Net assets | | | Shares outstanding | | | Net asset value per share | |
| Investor Class, $0.01 Par Value | | | $8,320,798 | | | | 736,393 | | | | $11.30 | |
| Institutional Class, $0.01 Par Value | | | $17,759 | | | | 1,561 | | | | $11.38 | |
| Advisor Class, $0.01 Par Value | | | $314,941 | | | | 28,151 | | | | $11.19 | |
| R Class, $0.01 Par Value | | | $41,674 | | | | 3,763 | | | | $11.07 | |
See Notes to Financial Statements.
| YEAR ENDED JULY 31, 2012 | |
| Investment Income (Loss) | |
| Income: | | | |
| Dividends (net of foreign taxes withheld of $3,350) | | | $254,485 | |
| | | | | |
| Expenses: | | | | |
| Management fees | | | 101,770 | |
| Distribution and service fees: | | | | |
| Advisor Class | | | 842 | |
| R Class | | | 263 | |
| Directors’ fees and expenses | | | 334 | |
| Other expenses | | | 114 | |
| | | | 103,323 | |
| | | | | |
| Net investment income (loss) | | | 151,162 | |
| | | | | |
| Realized and Unrealized Gain (Loss) | | | | |
| Net realized gain (loss) on: | | | | |
| Investment transactions | | | (11,219 | ) |
| Foreign currency transactions | | | 277 | |
| | | | (10,942 | ) |
| | | | | |
| Change in net unrealized appreciation (depreciation) on investments | | | 290,181 | |
| | | | | |
| Net realized and unrealized gain (loss) | | | 279,239 | |
| | | | | |
| Net Increase (Decrease) in Net Assets Resulting from Operations | | | $430,401 | |
See Notes to Financial Statements.
Statement of Changes in Net Assets |
| YEARS ENDED JULY 31, 2012 AND JULY 31, 2011 | |
| Increase (Decrease) in Net Assets | July 31, 2012 | | | July 31, 2011 | |
| Operations | |
| Net investment income (loss) | | $151,162 | | | | $97,015 | |
| Net realized gain (loss) | | (10,942 | ) | | | 2,722,609 | |
| Change in net unrealized appreciation (depreciation) | | 290,181 | | | | (1,001,623 | ) |
| Net increase (decrease) in net assets resulting from operations | | 430,401 | | | | 1,818,001 | |
| | | | | | | | |
| Distributions to Shareholders | | | | | | | |
| From net investment income: | | | | | | | |
| Investor Class | | (98,025 | ) | | | — | |
| Institutional Class | | (218 | ) | | | — | |
| Advisor Class | | (3,197 | ) | | | — | |
| R Class | | (483 | ) | | | — | |
| Decrease in net assets from distributions | | (101,923 | ) | | | — | |
| | | | | | | | |
| Capital Share Transactions | | | | | | | |
| Net increase (decrease) in net assets from capital share transactions | | (171,843 | ) | | | (1,046,956 | ) |
| | | | | | | | |
| Net increase (decrease) in net assets | | 156,635 | | | | 771,045 | |
| | | | | | | | |
| Net Assets | | | | | | | |
| Beginning of period | | 8,538,537 | | | | 7,767,492 | |
| End of period | | $8,695,172 | | | | $8,538,537 | |
| | | | | | | | |
| Undistributed net investment income | | $128,553 | | | | $101,820 | |
See Notes to Financial Statements.
Notes to Financial Statements |
JULY 31, 2012
1. Organization
American Century Growth Funds, Inc. (the corporation) is registered under the Investment Company Act of 1940, as amended (the 1940 Act), as an open-end management investment company and is organized as a Maryland corporation. Legacy Multi Cap Fund (the fund) is one fund in a series issued by the corporation. The fund is diversified as defined under the 1940 Act. The fund’s investment objective is to seek long-term capital growth. The fund pursues its objective by investing in small-, medium- and large-sized market capitalization companies.
The fund offers the Investor Class, the Institutional Class, the Advisor Class and the R Class. The share classes differ principally in their respective distribution and shareholder servicing expenses and arrangements. The Institutional Class is made available to institutional shareholders or through financial intermediaries whose clients do not require the same level of shareholder and administrative services as shareholders of other classes. As a result, the Institutional Class is charged a lower unified management fee.
2. Significant Accounting Policies
The following is a summary of significant accounting policies consistently followed by the fund in preparation of its financial statements. The financial statements are prepared in conformity with accounting principles generally accepted in the United States of America, which may require management to make certain estimates and assumptions at the date of the financial statements. Actual results could differ from these estimates.
Investment Valuations — The fund determines the fair value of its investments and computes its net asset value per share as of the close of regular trading (usually 4 p.m. Eastern time) on the New York Stock Exchange (NYSE) on each day the NYSE is open.
Equity securities that are listed or traded on a domestic securities exchange are valued at the last reported sales price or at the official closing price as provided by the exchange. Equity securities traded on foreign securities exchanges are typically valued at the closing price on the exchange where primarily traded or as of the close of the NYSE, if that is earlier. If no last sales price is reported, or if local convention or regulation so provides, the mean of the latest bid and asked prices is used. Depending on local convention or regulation, securities traded over-the-counter are valued at the mean of the latest bid and asked prices, the last sales price, or the official closing price. In its determination of fair value, the fund may review several factors including: market information specific to a security; news developments in U.S. and foreign markets; the performance of particular U.S. and foreign securities, indices, comparable securities, American Depositary Receipts, Exchange-Traded Funds, and other relevant market indicators.
Debt securities maturing within 60 days at the time of purchase may be valued at cost, plus or minus any amortized discount or premium or at the evaluated mean as provided by an independent pricing service. Evaluated mean prices are commonly derived through utilization of market models, which may consider, among other factors, trade data, quotations from dealers and active market makers, relevant yield curve and spread data, related sector levels, creditworthiness, and other relevant market information on the same or comparable securities.
Investments in open-end management investment companies are valued at the reported net asset value per share.
The value of investments initially expressed in foreign currencies is translated into U.S. dollars at prevailing exchange rates.
If the fund determines that the market price for a portfolio security is not readily available or the valuation methods mentioned above do not reflect a security’s fair value, such security is valued as determined in good faith by the Board of Directors or its designee, in accordance with procedures adopted by the Board of Directors. Circumstances that may
cause the fund to use these procedures to value a security include, but are not limited to: a security has been declared in default; trading in a security has been halted during the trading day; there is a foreign market holiday and no trading occurred; or an event occurred between the close of a foreign exchange and the NYSE that may affect the value of a security.
Security Transactions — Security transactions are accounted for as of the trade date. Net realized gains and losses are determined on the identified cost basis, which is also used for federal income tax purposes.
Investment Income — Dividend income less foreign taxes withheld, if any, is recorded as of the ex-dividend date. Distributions received on securities that represent a return of capital or capital gain are recorded as a reduction of cost of investments and/or as a realized gain. The fund estimates the components of distributions received that may be considered nontaxable distributions or capital gain distributions for income tax purposes.
Foreign Currency Translations — All assets and liabilities initially expressed in foreign currencies are translated into U.S. dollars at prevailing exchange rates at period end. The fund may enter into spot foreign currency exchange contracts to facilitate transactions denominated in a foreign currency. Purchases and sales of investment securities, dividend and interest income, spot foreign currency exchange contracts, and expenses are translated at the rates of exchange prevailing on the respective dates of such transactions. Net realized and unrealized foreign currency exchange gains or losses related to investment securities are a component of net realized gain (loss) on investment transactions and change in net unrealized appreciation (depreciation) on investments, respectively.
Income Tax Status — It is the fund’s policy to distribute substantially all net investment income and net realized gains to shareholders and to otherwise qualify as a regulated investment company under provisions of the Internal Revenue Code. The fund is no longer subject to examination by tax authorities for years prior to 2009. At this time, management believes there are no uncertain tax positions which, based on their technical merit, would not be sustained upon examination and for which it is reasonably possible that the total amounts of unrecognized tax benefits will significantly change in the next twelve months. Accordingly, no provision has been made for federal or state income taxes.
Multiple Class — All shares of the fund represent an equal pro rata interest in the net assets of the class to which such shares belong, and have identical voting, dividend, liquidation and other rights and the same terms and conditions, except for class specific expenses and exclusive rights to vote on matters affecting only individual classes. Income, non-class specific expenses, and realized and unrealized capital gains and losses of the fund are allocated to each class of shares based on their relative net assets.
Distributions to Shareholders — Distributions from net investment income and net realized gains, if any, are generally declared and paid annually.
Indemnifications — Under the corporation’s organizational documents, its officers and directors are indemnified against certain liabilities arising out of the performance of their duties to the fund. In addition, in the normal course of business, the fund enters into contracts that provide general indemnifications. The maximum exposure under these arrangements is unknown as this would involve future claims that may be made against a fund. The risk of material loss from such claims is considered by management to be remote.
3. Fees and Transactions with Related Parties
Management Fees — The corporation has entered into a management agreement with American Century Investment Management, Inc. (ACIM) (the investment advisor), under which ACIM provides the fund with investment advisory and management services in exchange for a single, unified management fee (the fee) per class. The agreement provides that all expenses of managing and operating the fund, except distribution and service fees, brokerage expenses, taxes, interest, fees and expenses of the independent directors (including legal counsel fees), and extraordinary expenses, will be paid by ACIM. The fee is computed and accrued daily based on each class’s daily net assets and paid monthly in arrears. The rate of the fee is determined by applying a fee rate calculation formula. This formula takes into account the fund’s assets as well as certain assets, if any, of other clients
of the investment advisor outside the American Century Investments family of funds (such as subadvised funds and separate accounts) that have very similar investment teams and investment strategies (strategy assets). The annual management fee schedule ranges from 0.85% to 1.15% for the Investor Class, Advisor Class and R Class. The Institutional Class is 0.20% less at each point within the range. The effective annual management fee for each class for the year ended July 31, 2012 was 1.15% for the Investor Class, Advisor Class and R Class and 0.95% for the Institutional Class.
Distribution and Service Fees — The Board of Directors has adopted a separate Master Distribution and Individual Shareholder Services Plan for each of the Advisor Class and R Class (collectively the plans), pursuant to Rule 12b-1 of the 1940 Act. The plans provide that the Advisor Class will pay American Century Investment Services, Inc. (ACIS) an annual distribution and service fee of 0.25%. The plans provide that the R Class will pay ACIS an annual distribution and service fee of 0.50%. The fees are computed and accrued daily based on each class’s daily net assets and paid monthly in arrears. The fees are used to pay financial intermediaries for distribution and individual shareholder services. Fees incurred under the plans during the year ended July 31, 2012 are detailed in the Statement of Operations.
Related Parties — Certain officers and directors of the corporation are also officers and/or directors of American Century Companies, Inc., the parent of the corporation’s investment advisor, ACIM, the distributor of the corporation, ACIS, and the corporation’s transfer agent, American Century Services, LLC.
4. Investment Transactions
Purchases and sales of investment securities, excluding short-term investments, for the year ended July 31, 2012 were $15,879,446 and $16,194,113, respectively.
5. Capital Share Transactions
The corporation is authorized to issue 3,000,000,000 shares. Transactions in shares of the fund were as follows:
| | | | | | |
| | Year ended July 31, 2012 | | | Year ended July 31, 2011 | |
| | Shares | | | Amount | | | Shares | | | Amount | |
| Investor Class | | | | | | | | | | | |
| Sold | | 242,785 | | | | $2,589,874 | | | | 225,951 | | | | $2,343,620 | |
| Issued in reinvestment of distributions | | 8,928 | | | | 92,588 | | | | — | | | | — | |
| Redeemed | | (253,139 | ) | | | (2,722,925 | ) | | | (321,297 | ) | | | (3,297,168 | ) |
| | | (1,426 | ) | | | (40,463 | ) | | | (95,346 | ) | | | (953,548 | ) |
| Institutional Class | | | | | | | | | | | | | | | |
| Sold | | — | | | | — | | | | 379 | | | | 4,001 | |
| Issued in reinvestment of distributions | | 21 | | | | 218 | | | | — | | | | — | |
| Redeemed | | (1,469 | ) | | | (14,077 | ) | | | — | | | | — | |
| | | (1,448 | ) | | | (13,859 | ) | | | 379 | | | | 4,001 | |
| Advisor Class | | | | | | | | | | | | | | | |
| Sold | | 6,319 | | | | 66,743 | | | | 12,306 | | | | 123,176 | |
| Issued in reinvestment of distributions | | 311 | | | | 3,197 | | | | — | | | | — | |
| Redeemed | | (14,868 | ) | | | (155,733 | ) | | | (22,666 | ) | | | (223,162 | ) |
| | | (8,238 | ) | | | (85,793 | ) | | | (10,360 | ) | | | (99,986 | ) |
| R Class | | | | | | | | | | | | | | | |
| Sold | | 1,350 | | | | 14,076 | | | | 1,223 | | | | 11,963 | |
| Issued in reinvestment of distributions | | 47 | | | | 483 | | | | — | | | | — | |
| Redeemed | | (4,371 | ) | | | (46,287 | ) | | | (950 | ) | | | (9,386 | ) |
| | | (2,974 | ) | | | (31,728 | ) | | | 273 | | | | 2,577 | |
| Net increase (decrease) | | (14,086 | ) | | | $(171,843 | ) | | | (105,054 | ) | | | $(1,046,956 | ) |
6. Fair Value Measurements
The fund’s securities valuation process is based on several considerations and may use multiple inputs to determine the fair value of the positions held by the fund. In conformity with accounting principles generally accepted in the United States of America, the inputs used to determine a valuation are classified into three broad levels as follows:
| • | Level 1 valuation inputs consist of unadjusted quoted prices in an active market for identical securities; |
| • | Level 2 valuation inputs consist of direct or indirect observable market data (including quoted prices for similar securities, evaluations of subsequent market events, interest rates, prepayment speeds, credit risk, etc.); or |
| • | Level 3 valuation inputs consist of unobservable data (including a fund’s own assumptions). |
The level classification is based on the lowest level input that is significant to the fair valuation measurement. The valuation inputs are not necessarily an indication of the risks associated with investing in these securities or other financial instruments.
The following is a summary of the level classifications as of period end. The Schedule of Investments provides additional information on the fund’s portfolio holdings.
| | | | | | | | | |
| | Level 1 | | | Level 2 | | | Level 3 | |
| Investment Securities | | | | | | | | |
| Domestic Common Stocks | | $7,862,203 | | | | — | | | | — | |
| Foreign Common Stocks | | 749,570 | | | | — | | | | — | |
| Temporary Cash Investments | | 307 | | | | $113,000 | | | | — | |
| Total Value of Investment Securities | | $8,612,080 | | | | $113,000 | | | | — | |
7. Risk Factors
The fund’s investment process may result in high portfolio turnover, which could mean high transaction costs, affecting both performance and capital gains tax liabilities to investors.
There are certain risks involved in investing in foreign securities. These risks include those resulting from future adverse political, social and economic developments, fluctuations in currency exchange rates, the possible imposition of exchange controls, and other foreign laws or restrictions.
The fund invests in common stocks of small companies. Because of this, the fund may be subject to greater risk and market fluctuations than a fund investing in larger, more established companies.
8. Federal Tax Information
The tax character of distributions paid during the years ended July 31, 2012 and July 31, 2011 were as follows:
| | | | | | | |
| | | 2012 | | | 2011 | |
| Distributions Paid From | | | | | | |
| Ordinary income | | | $101,923 | | | | — | |
| Long-term capital gains | | | — | | | | — | |
The book-basis character of distributions made during the year from net investment income or net realized gains may differ from their ultimate characterization for federal income tax purposes. These differences reflect the differing character of certain income items and net realized gains and losses for financial statement and tax purposes, and may result in reclassification among certain capital accounts on the financial statements.
As of July 31, 2012, the federal tax cost of investments and the components of distributable earnings on a tax-basis were as follows:
| | | | |
| Federal tax cost of investments | | | $8,369,920 | |
| Gross tax appreciation of investments | | | $675,391 | |
| Gross tax depreciation of investments | | | (320,231 | ) |
| Net tax appreciation (depreciation) of investments | | | $355,160 | |
| Undistributed ordinary income | | | $128,553 | |
| Accumulated short-term capital losses | | | $(8,999,606 | ) |
The difference between book-basis and tax-basis cost and unrealized appreciation (depreciation) is attributable primarily to the tax deferral of losses on wash sales.
The accumulated capital losses represent net capital loss carryovers that may be used to offset future realized capital gains for federal income tax purposes. Future capital loss carryover utilization in any given year may be subject to Internal Revenue Code limitations. Capital loss carryovers of $(8,300,245) and $(699,361) expire in 2017 and 2018, respectively.
| For a Share Outstanding Throughout the Years Ended July 31 (except as noted) |
| Per-Share Data | Ratios and Supplemental Data |
| | | Income From Investment Operations: | Distributions From: | | | Ratio to Average Net Assets of: | | |
| | Net Asset Value, Beginning of Period | Net Investment Income (Loss)(1) | Net Realized and Unrealized Gain (Loss) | Total From Investment Operations | Net Investment Income | Net Realized Gains | Total Distributions | Net Asset Value, End of Period | Total Return(2) | Operating Expenses | Net Investment Income (Loss) | Portfolio Turnover Rate | Net Assets, End of Period (in thousands) |
| Investor Class |
| 2012 | $10.90 | 0.19 | 0.33 | 0.52 | (0.12) | – | (0.12) | $11.30 | 4.87% | 1.16% | 1.72% | 179% | $8,321 |
| 2011 | $8.74 | 0.12 | 2.04 | 2.16 | – | – | – | $10.90 | 24.71% | 1.17% | 1.14% | 246% | $8,041 |
| 2010 | $7.79 | 0.02 | 1.05 | 1.07 | (0.12) | – | (0.12) | $8.74 | 13.75% | 1.16% | 0.22% | 235% | $7,283 |
| 2009 | $11.72 | 0.11 | (4.04) | (3.93) | – | – | – | $7.79 | (33.53)% | 1.15% | 1.42% | 267% | $22,726 |
| 2008 | $12.60 | (0.02) | (0.69) | (0.71) | – | (0.17) | (0.17) | $11.72 | (5.78)% | 1.16% | (0.17)% | 173% | $35,392 |
| Institutional Class |
| 2012 | $10.98 | 0.22 | 0.32 | 0.54 | (0.14) | – | (0.14) | $11.38 | 5.05% | 0.96% | 1.92% | 179% | $18 |
| 2011 | $8.79 | 0.14 | 2.05 | 2.19 | – | – | – | $10.98 | 24.91% | 0.97% | 1.34% | 246% | $33 |
| 2010 | $7.83 | 0.04 | 1.06 | 1.10 | (0.14) | – | (0.14) | $8.79 | 14.04% | 0.96% | 0.42% | 235% | $23 |
| 2009 | $11.76 | 0.12 | (4.05) | (3.93) | – | – | – | $7.83 | (33.42)% | 0.95% | 1.62% | 267% | $28 |
| 2008 | $12.61 | (0.01) | (0.67) | (0.68) | – | (0.17) | (0.17) | $11.76 | (5.53)% | 0.96% | 0.03% | 173% | $27 |
| Advisor Class | | | | | | | | | | | | |
| 2012 | $10.79 | 0.17 | 0.32 | 0.49 | (0.09) | – | (0.09) | $11.19 | 4.65% | 1.41% | 1.47% | 179% | $315 |
| 2011 | $8.68 | 0.09 | 2.02 | 2.11 | – | – | – | $10.79 | 24.31% | 1.42% | 0.89% | 246% | $393 |
| 2010 | $7.73 | –(3) | 1.05 | 1.05 | (0.10) | – | (0.10) | $8.68 | 13.57% | 1.41% | (0.03)% | 235% | $406 |
| 2009 | $11.67 | 0.07 | (4.01) | (3.94) | – | – | – | $7.73 | (33.76)% | 1.40% | 1.17% | 267% | $1,081 |
| 2008 | $12.58 | (0.05) | (0.69) | (0.74) | – | (0.17) | (0.17) | $11.67 | (6.03)% | 1.41% | (0.42)% | 173% | $751 |
| For a Share Outstanding Throughout the Years Ended July 31 (except as noted) |
| Per-Share Data | Ratios and Supplemental Data |
| | | Income From Investment Operations: | Distributions From: | | | Ratio to Average Net Assets of: | | |
| | Net Asset Value, Beginning of Period | Net Investment Income (Loss)(1) | Net Realized and Unrealized Gain (Loss) | Total From Investment Operations | Net Investment Income | Net Realized Gains | Total Distributions | Net Asset Value, End of Period | Total Return(2) | Operating Expenses | Net Investment Income (Loss) | Portfolio Turnover Rate | Net Assets, End of Period (in thousands) |
| R Class | | | | | | | | | | | | | |
| 2012 | $10.68 | 0.16 | 0.30 | 0.46 | (0.07) | – | (0.07) | $11.07 | 4.34% | 1.66% | 1.22% | 179% | $42 |
| 2011 | $8.61 | 0.07 | 2.00 | 2.07 | – | – | – | $10.68 | 24.04% | 1.67% | 0.64% | 246% | $72 |
| 2010 | $7.67 | (0.03) | 1.05 | 1.02 | (0.08) | – | (0.08) | $8.61 | 13.25% | 1.66% | (0.28)% | 235% | $56 |
| 2009 | $11.61 | 0.07 | (4.01) | (3.94) | – | – | – | $7.67 | (33.94)% | 1.65% | 0.92% | 267% | $41 |
| 2008 | $12.56 | (0.08) | (0.70) | (0.78) | – | (0.17) | (0.17) | $11.61 | (6.36)% | 1.66% | (0.67)% | 173% | $65 |
Notes to Financial Highlights
| (1) | Computed using average shares outstanding throughout the period. |
| (2) | Total returns are calculated based on the net asset value of the last business day. Total returns for periods less than one year are not annualized. |
| (3) | Per-share amount was less than $0.005. |
See Notes to Financial Statements.
Report of Independent Registered Public Accounting Firm |
To the Shareholders and Board of Directors of
American Century Growth Funds, Inc.:
We have audited the accompanying statement of assets and liabilities, including the schedule of investments, of Legacy Multi Cap Fund, one of the funds constituting American Century Growth Funds, Inc. (the “Corporation”) as of July 31, 2012, and the related statement of operations for the year then ended, the statement of changes in net assets for each of the two years in the period then ended, and the financial highlights for each of the five years in the period then ended. These financial statements and financial highlights are the responsibility of the Corporation’s management. Our responsibility is to express an opinion on these financial statements and financial highlights based on our audits.
We conducted our audits in accordance with the standards of the Public Company Accounting Oversight Board (United States). Those standards require that we plan and perform the audit to obtain reasonable assurance about whether the financial statements and financial highlights are free of material misstatement. The Corporation is not required to have, nor were we engaged to perform, an audit of their internal control over financial reporting. Our audits included consideration of internal control over financial reporting as a basis for designing audit procedures that are appropriate in the circumstances, but not for the purpose of expressing an opinion on the effectiveness of the Corporation’s internal control over financial reporting. Accordingly, we express no such opinion. An audit also includes examining, on a test basis, evidence supporting the amounts and disclosures in the financial statements, assessing the accounting principles used and significant estimates made by management, as well as evaluating the overall financial statement presentation. Our procedures included confirmation of securities owned as of July 31, 2012, by correspondence with the custodian and brokers; where replies were not received from brokers, we performed other auditing procedures. We believe that our audits provide a reasonable basis for our opinion.
In our opinion, the financial statements and financial highlights referred to above present fairly, in all material respects, the financial position of Legacy Multi Cap Fund of American Century Growth Funds, Inc. as of July 31, 2012, the results of its operations for the year ended, the changes in its net assets for each of the two years in the period then ended, and the financial highlights for each of the five years in the period then ended, in conformity with accounting principles generally accepted in the United States of America.
Deloitte & Touche LLP
Kansas City, Missouri
September 19, 2012
The Board of Directors
The individuals listed below serve as directors of the funds. Each director will continue to serve in this capacity until death, retirement, resignation or removal from office. The mandatory retirement age for directors who are not “interested persons,” as that term is defined in the Investment Company Act (independent directors), is 72. However, the mandatory retirement age for an individual director may be extended with the approval of the remaining independent directors.
Mr. Thomas is an “interested person” because he currently serves as President and Chief Executive Officer of American Century Companies, Inc. (ACC), the parent company of American Century Investment Management, Inc. (ACIM or the advisor). Mr. Fink is an “interested person” because he currently serves as Executive Vice President and Chief Operating Officer of ACC.
The other directors (more than three-fourths of the total number) are independent; that is, they have never been employees, directors or officers of, and have no financial interest in, ACC or any of its wholly owned, direct or indirect, subsidiaries, including ACIM, American Century Investment Services, Inc. (ACIS) and American Century Services, LLC (ACS). The directors serve in this capacity for seven (in the case of Mr. Thomas, 15) registered investment companies in the American Century Investments family of funds.
The following table presents additional information about the directors. The mailing address for each director is 4500 Main Street, Kansas City, Missouri 64111.
Name (Year of Birth) | Position(s) Held with Funds | Length of Time Served | Principal Occupation(s) During Past 5 Years | | Number of American Century Portfolios Overseen by Director | Other Directorships Held During Past 5 Years |
| Independent Directors |
Thomas A. Brown (1940) | Director | Since 1980 | Managing Member, Associated Investments, LLC (real estate investment company); Brown Cascade Properties, LLC (real estate investment company) (2001 to 2009) | | 66 | None |
Andrea C. Hall (1945) | Director | Since 1997 | Retired | | 66 | None |
Jan M. Lewis (1957) | Director | Since 2011 | President and Chief Executive Officer, Catholic Charities of Northeast Kansas (human services organization) | | 66 | None |
James A. Olson (1942) | Director | Since 2007 | Member, Plaza Belmont LLC (private equity fund manager) | | 66 | Saia, Inc. (2002 to 2012) and Entertainment Properties Trust |
Donald H. Pratt (1937) | Director and Chairman of the Board | Since 1995 (Chairman since 2005) | Chairman and Chief Executive Officer, Western Investments, Inc. (real estate company) | | 66 | None |
Name (Year of Birth) | Position(s) Held with Funds | Length of Time Served | Principal Occupation(s) During Past 5 Years | | Number of American Century Portfolios Overseen by Director | Other Directorships Held During Past 5 Years |
| Independent Directors |
M. Jeannine Strandjord (1945) | Director | Since 1994 | Retired | | 66 | Euronet Worldwide Inc.; Charming Shoppes, Inc. (2006 to 2010); and DST Systems Inc. (1996 to 2012) |
John R. Whitten (1946) | Director | Since 2008 | Retired | | 66 | Rudolph Technologies, Inc. |
Stephen E. Yates (1948) | Director | Since 2012 | Retired; Executive Vice President, Technology & Operations, KeyCorp. (computer services)(2004 to 2010) | | 66 | Applied Industrial Technology (2001 to 2010) |
| | | | | | | |
| Interested Directors |
Barry Fink (1955) | Director and Executive Vice President | Since 2012 (Executive Vice President since 2007) | Chief Operating Officer and Executive Vice President, ACC (September 2007 to present); President, ACS (October 2007 to present); Managing Director, Morgan Stanley (2000 to 2007). Also serves as Manager, ACS and Director, ACC and certain ACC subsidiaries | | 66 | None |
Jonathan S. Thomas (1963) | Director and President | Since 2007 | President and Chief Executive Officer, ACC (March 2007 to present); Chief Administrative Officer, ACC (February 2006 to February 2007); Executive Vice President, ACC (November 2005 to February 2007). Also serves as Chief Executive Officer and Manager, ACS; Executive Vice President, ACIM; Director, ACC, ACIM and other ACC subsidiaries | | 108 | None |
Officers
The following table presents certain information about the executive officers of the funds. Each officer serves as an officer for each of the 15 investment companies in the American Century family of funds, unless otherwise noted. No officer is compensated for his or her service as an officer of the funds. The listed officers are interested persons of the funds and are appointed or re-appointed on an annual basis. The mailing address for each officer listed below is 4500 Main Street, Kansas City, Missouri 64111.
Name (Year of Birth) | Offices with the Funds | | Principal Occupation(s) During the Past Five Years |
Jonathan S. Thomas (1963) | Director and President since 2007 | | President and Chief Executive Officer, ACC (March 2007 to present); Chief Administrative Officer, ACC (February 2006 to February 2007); Executive Vice President, ACC (November 2005 to February 2007). Also serves as Chief Executive Officer and Manager, ACS; Executive Vice President, ACIM; Director, ACC, ACIM and other ACC subsidiaries |
Barry Fink (1955) | Director since 2012 and Executive Vice President since 2007 | | Chief Operating Officer and Executive Vice President, ACC (September 2007 to present); President, ACS (October 2007 to present); Managing Director, Morgan Stanley (2000 to 2007). Also serves as Manager, ACS and Director, ACC and certain ACC subsidiaries |
Maryanne L. Roepke (1956) | Chief Compliance Officer since 2006 and Senior Vice President since 2000 | | Chief Compliance Officer, American Century funds, ACIM and ACS (August 2006 to present). Also serves as Senior Vice President, ACS |
Charles A. Etherington (1957) | General Counsel since 2007 and Senior Vice President since 2006 | | Attorney, ACC (February 1994 to present); Vice President, ACC (November 2005 to present), General Counsel, ACC (March 2007 to present); Also serves as General Counsel, ACIM, ACS, ACIS and other ACC subsidiaries; and Senior Vice President, ACIM and ACS |
C. Jean Wade (1964) | Vice President, Treasurer and Chief Financial Officer since 2012 | | Vice President, ACS (February 2000 to present) |
Robert J. Leach (1966) | Vice President since 2006 and Assistant Treasurer since 2012 | | Vice President, ACS (February 2000 to present) |
David H. Reinmiller (1963) | Vice President since 2000 | | Attorney, ACC (January 1994 to present); Associate General Counsel, ACC (January 2001 to present). Also serves as Vice President, ACIM and ACS |
Ward D. Stauffer (1960) | Secretary since 2005 | | Attorney, ACC (June 2003 to present) |
The Statement of Additional Information has additional information about the fund’s directors and is available without charge, upon request, by calling 1-800-345-2021.
Approval of Management Agreement |
At a meeting held on June 21, 2012, the Fund’s Board of Directors unanimously approved the renewal of the management agreement pursuant to which American Century Investment Management, Inc. (the “Advisor”) acts as the investment advisor for the Fund. Under Section 15(c) of the Investment Company Act, contracts for investment advisory services are required to be reviewed, evaluated, and approved by a majority of a fund’s independent directors (the “Directors”) each year.
As a part of the approval process, the Board requested and reviewed extensive data and information compiled by the Advisor and certain independent providers of evaluation data concerning the Fund and the services provided to the Fund by the Advisor. This review was in addition to the oversight and evaluation undertaken by the Board and its committees on a continuous basis throughout the year and included, but was not limited to the following:
| • | the nature, extent, and quality of investment management, shareholder services, and other services provided by the Advisor to the Fund; |
| • | the wide range of other programs and services the Advisor provides to the Fund and its shareholders on a routine and non-routine basis; |
| • | the investment performance of the fund, including data comparing the Fund’s performance to appropriate benchmarks and/or a peer group of other mutual funds with similar investment objectives and strategies; |
| • | data comparing the cost of owning the Fund to the cost of owning similar funds; |
| • | the Advisor’s compliance policies, procedures, and regulatory experience; |
| • | financial data showing the cost of services provided to the Fund, the profitability of the Fund to the Advisor, and the overall profitability of the Advisor; |
| • | data comparing services provided and charges to other investment management clients of the Advisor; and |
| • | consideration of collateral benefits derived by the Advisor from the management of the Fund and any potential economies of scale relating thereto. |
In keeping with its practice, the Board held two in-person meetings and one telephonic meeting to review and discuss the information provided. The Directors also had the benefit of the advice of independent counsel throughout the period.
Factors Considered
The Directors considered all of the information provided by the Advisor, the independent data providers, and independent counsel, and evaluated such information for the Fund. In connection with their review, the Directors did not identify any single factor as being all-important or controlling, and each Director may have attributed different levels of importance to different factors. In deciding to renew the management agreement, the Board based its decision on a number of factors, including the following:
Nature, Extent and Quality of Services - Generally. Under the management agreement, the Advisor is responsible for providing or arranging for all services necessary for the operation of the Fund. The Board noted that under the management agreement, the Advisor provides or arranges at its own expense a wide variety of services including:
| • | constructing and designing the Fund |
| • | portfolio research and security selection |
| • | initial capitalization/funding |
| • | daily valuation of the Fund’s portfolio |
| • | shareholder servicing and transfer agency, including shareholder confirmations, recordkeeping, and communications |
| • | regulatory and portfolio compliance |
| • | marketing and distribution |
The Board noted that many of these services have expanded over time both in terms of quantity and complexity in response to shareholder demands, competition in the industry, changing distribution channels, and the changing regulatory environment.
Investment Management Services. The nature of the investment management services provided to the Fund is quite complex and allows Fund shareholders access to professional money management, instant diversification of their investments within an asset class, the opportunity to easily diversify among asset classes by investing in or exchanging among various American Century Investments funds, and liquidity. In evaluating investment performance, the Board expects the Advisor to manage the Fund in accordance with its investment objectives and approved strategies. Further, the Directors recognize that the Advisor has an obligation to monitor trading activities, and in particular to seek the best execution of fund trades, and to evaluate the use of and payment for research. In providing these services, the Advisor utilizes teams of investment professionals (portfolio managers, analysts, research assistants, and securities traders) who require extensive information technology, research, training, compliance and other systems to conduct their business. The Board, directly and through its Fund Performance Review Committee, regularly reviews investment performance information for the Fund, together with comparative information for appropriate benchmarks and/or peer groups of similarly-managed funds, over different time horizons. The Directors also review detailed performance information during the management agreement approval process. If performance concerns are identified, the Fund receives special reviews until performance improves, during which the Board discusses with the Advisor the reasons for such results (e.g., market conditions, security selection) and any efforts being undertaken to improve performance. Taking all these factors into consideration, the Board found the investment management services provided by the Advisor to the Fund to meet or exceed industry standards. More detailed information about the Fund’s performance can be found in the Performance and Portfolio Commentary sections of this report.
Shareholder and Other Services. Under the management agreement, the Advisor provides the Fund with a comprehensive package of transfer agency, shareholder, and other services. The Board, directly and through various committees of the Board, regularly reviews reports and evaluations of such services at its regular meetings. These reports include, but are not limited to, information regarding the operational efficiency and accuracy of the shareholder and transfer agency services provided, staffing levels, shareholder satisfaction (as measured by external as well as internal sources), technology support, new products and services offered to Fund shareholders, securities trading activities, portfolio valuation services, auditing services, and legal and operational compliance activities.
Certain aspects of shareholder and transfer agency service level efficiency and the quality of securities trading activities are measured by independent third party providers and are presented in comparison to other fund groups not managed by the Advisor. The Board found the services provided by the Advisor to the Fund under the management agreement to be competitive and of high quality.
Costs of Services and Profitability. The Advisor provides detailed information concerning its cost of providing various services to the Fund, its profitability in managing the Fund, its overall profitability, and its financial condition. The Directors have reviewed with the Advisor the methodology used to prepare this financial information. The financial information regarding the Advisor is considered in evaluating the Advisor’s financial condition, ability to continue to provide services under the management agreement, and the reasonableness of the current management fee. The Board concluded that the Advisor’s profits were reasonable in light of the services provided to the Fund.
Ethics. The Board generally considers the Advisor’s commitment to providing quality services to shareholders and to conducting its business ethically. They noted that the Advisor’s practices generally meet or exceed industry best practices.
Economies of Scale. The Board also reviewed information provided by the Advisor regarding the possible existence of economies of scale in connection with the management of the Fund. The Board concluded that economies of scale are difficult to measure and predict with precision, especially on a fund-by-fund basis. The Board concluded that the Advisor is appropriately sharing economies of scale through its competitive fee structure, offering competitive fees from fund inception, and through reinvestment in its business to provide shareholders additional content and services.
Comparison to Other Funds’ Fees. The management agreement provides that the Fund pay the Advisor a single, all-inclusive (or unified) management fee for providing all services necessary for the management and operation of the Fund, other than brokerage expenses, taxes, interest, extraordinary expenses, and the fees and expenses of the Fund’s independent directors (including their independent legal counsel) and expenses incurred in connection with the provision of shareholder services and distribution services under a plan adopted pursuant to Rule 12b-1 under the 1940 Act. Under the unified fee structure, the Advisor is responsible for providing all investment advisory, custody, audit, administrative, compliance, recordkeeping, marketing and shareholder services, or arranging and supervising third parties to provide such services. By contrast, most other funds are charged a variety of fees, including an investment advisory fee, a transfer agency fee, an administrative fee, distribution charges and other expenses. Other than their investment advisory fees and any applicable Rule 12b-1 distribution fees, all other components of the total fees charged by these other funds may be increased without shareholder approval. The Board believes the unified fee structure is a benefit to Fund shareholders because it clearly discloses to shareholders the cost of owning Fund shares, and, since the unified fee cannot be increased without a vote of Fund shareholders, it shifts to the Advisor the risk of increased costs of operating the Fund and provides a direct incentive to minimize administrative inefficiencies. Part of the Board’s analysis of fee levels involves reviewing certain evaluative data compiled by an independent provider and comparing the Fund’s unified fee to the total expense ratio of other funds in the Fund’s peer group.
The Board concluded that the management fee paid by the Fund to the Advisor under the management agreement is reasonable in light of the services provided to the Fund.
Comparison to Fees and Services Provided to Other Clients of the Advisor. The Board also requested and received information from the Advisor concerning the nature of the services, fees, costs and profitability of its advisory services to advisory clients other than the Fund. They observed that these varying types of client accounts require different services and involve different regulatory and entrepreneurial risks than the management of the Fund. The Board analyzed this information and concluded that the fees charged and services provided to the Fund were reasonable by comparison.
Collateral or “Fall-Out” Benefits Derived by the Advisor. The Board considered the existence of collateral benefits the Advisor may receive as a result of its relationship with the Fund. They concluded that the Advisor’s primary business is managing mutual funds and it generally does not use fund or shareholder information to generate profits in other lines of business, and therefore does not derive any significant collateral benefits from them. The Board noted that the Advisor receives proprietary research from broker-dealers that execute fund portfolio transactions and concluded that this research is likely to benefit Fund shareholders. The Board also determined that the Advisor is able to provide investment management services to certain clients other than the Fund, at least in part, due to its existing infrastructure built to serve the fund complex. The Board concluded, however, that the assets of those other clients are not material to the analysis and, where applicable, may be included with the assets of the Fund to determine breakpoints in the management fee schedule.
Existing Relationship. The Board also considered whether there was any reason for not continuing the existing arrangement with the Advisor. In this regard, the Board was mindful of the potential disruptions of the Fund’s operations and various risks, uncertainties, and other effects that could occur as a result of a decision not to continue such relationship. In particular, the Board recognized that most shareholders have invested in the Fund on the strength of the Advisor’s industry standing and reputation and in the expectation that the Advisor will have a continuing role in providing advisory services to the Fund.
Conclusion of the Directors. As a result of this process, the Board, including all of the independent directors, taking into account all of the factors discussed above and the information provided by the Advisor and others, concluded that the management agreement between the Fund and the Advisor is fair and reasonable in light of the services provided and should be renewed.
Retirement Account Information
As required by law, distributions you receive from certain IRAs, or 403(b), 457 and qualified plans are subject to federal income tax withholding, unless you elect not to have withholding apply. Tax will be withheld on the total amount withdrawn even though you may be receiving amounts that are not subject to withholding, such as nondeductible contributions. In such case, excess amounts of withholding could occur. You may adjust your withholding election so that a greater or lesser amount will be withheld.
If you don’t want us to withhold on this amount, you must notify us to not withhold the federal income tax. You may notify us in writing or in certain situations by telephone or through other electronic means. You have the right to revoke your withholding election at any time and any election you make may remain in effect until revoked by filing a new election.
Remember, even if you elect not to have income tax withheld, you are liable for paying income tax on the taxable portion of your withdrawal. If you elect not to have income tax withheld or you don’t have enough income tax withheld, you may be responsible for payment of estimated tax. You may incur penalties under the estimated tax rules if your withholding and estimated tax payments are not sufficient. You can reduce or defer the income tax on a distribution by directly or indirectly rolling such distribution over to another IRA or eligible plan. You should consult your tax advisor for additional information.
State tax will be withheld if, at the time of your distribution, your address is within one of the mandatory withholding states and you have federal income tax withheld. State taxes will be withheld from your distribution in accordance with the respective state rules.
Proxy Voting Guidelines
American Century Investment Management, Inc., the fund’s investment advisor, is responsible for exercising the voting rights associated with the securities purchased and/or held by the fund. A description of the policies and procedures the advisor uses in fulfilling this responsibility is available without charge, upon request, by calling 1-800-345-2021. It is also available on American Century Investments’ website at americancentury.com and on the Securities and Exchange Commission’s website at sec.gov. Information regarding how the investment advisor voted proxies relating to portfolio securities during the most recent 12-month period ended June 30 is available on the “About Us” page at americancentury.com. It is also available at sec.gov.
Quarterly Portfolio Disclosure
The fund files its complete schedule of portfolio holdings with the Securities and Exchange Commission (SEC) for the first and third quarters of each fiscal year on Form N-Q. The fund’s Forms N-Q are available on the SEC’s website at sec.gov, and may be reviewed and copied at the SEC’s Public Reference Room in Washington, DC. Information on the operation of the Public Reference Room may be obtained by calling 1-800-SEC-0330. The fund also makes its complete schedule of portfolio holdings for the most recent quarter of its fiscal year available on its website at americancentury.com and, upon request, by calling 1-800-345-2021.
Other Tax Information
The following information is provided pursuant to provisions of the Internal Revenue Code.
The fund hereby designates up to the maximum amount allowable as qualified dividend income for the fiscal year ended July 31, 2012.
For corporate taxpayers, the fund hereby designates $101,923, or up to the maximum amount allowable, of ordinary income distributions paid during the fiscal year ended July 31, 2012 as qualified for the corporate dividends received deduction.
| Contact Us | americancentury.com |
| Automated Information Line | 1-800-345-8765 |
| Investor Services Representative | 1-800-345-2021 or 816-531-5575 |
| Investors Using Advisors | 1-800-378-9878 |
Business, Not-For-Profit, Employer-Sponsored Retirement Plans | 1-800-345-3533 |
Banks and Trust Companies, Broker-Dealers, Financial Professionals, Insurance Companies | 1-800-345-6488 |
| Telecommunications Device for the Deaf | 1-800-634-4113 |
American Century Growth Funds, Inc.
Investment Advisor:
American Century Investment Management, Inc.
Kansas City, Missouri
This report and the statements it contains are submitted for the general information of our shareholders. The report is not authorized for distribution to prospective investors unless preceded or accompanied by an effective prospectus.
©2012 American Century Proprietary Holdings, Inc. All rights reserved.
CL-ANN-76092 1209
ANNUAL REPORT JULY 31, 2012


| President’s Letter | 2 |
| Independent Chairman’s Letter | 3 |
| Market Perspective | 4 |
| Performance | 5 |
| Portfolio Commentary | 6 |
| Fund Characteristics | 8 |
| Shareholder Fee Example | 9 |
| Schedule of Investments | 11 |
| Statement of Assets and Liabilities | 13 |
| Statement of Operations | 14 |
| Statement of Changes in Net Assets | 15 |
| Notes to Financial Statements | 16 |
| Financial Highlights | 21 |
| Report of Independent Registered Public Accounting Firm | 23 |
| Management | 24 |
| Approval of Management Agreement | 27 |
| Additional Information | 32 |
Any opinions expressed in this report reflect those of the author as of the date of the report, and do not necessarily represent the opinions of American Century Investments® or any other person in the American Century Investments organization. Any such opinions are subject to change at any time based upon market or other conditions and American Century Investments disclaims any responsibility to update such opinions. These opinions may not be relied upon as investment advice and, because investment decisions made by American Century Investments funds are based on numerous factors, may not be relied upon as an indication of trading intent on behalf of any American Century Investments fund. Security examples are used for representational purposes only and are not intended as recommendations to purchase or sell securities. Performance information for comparative indices and securities is provided to American Century Investments by third party vendors. To the best of American Century Investments’ knowledge, such information is accurate at the time of printing.
Dear Investor:
Thank you for reviewing this annual report for the period ended July 31, 2012. Our report offers investment performance and portfolio information, presented with the expert perspective of our portfolio management team.
This report remains one of our most important vehicles for conveying information about fund returns, as well as market factors and strategies that affected fund performance. For additional, updated information, we encourage you to visit our website, americancentury.com. Click on the “Fund Performance” and “Insights & News” headings at the top of our Individual Investors site.
Flight to Quality as Economic and Financial Uncertainties Resurfaced
During the second half of 2011 and the first half of 2012, the global economy and financial markets struggled to move beyond the lingering aftereffects of the 2008 Financial Crisis and Great Recession. Global economic fundamentals have improved since 2008, but weakened since 2010, with increased uncertainty surrounding near-term economic growth levels in major developed economies such as the U.S., Japan, and Europe. There were also questions about near-term growth levels in emerging economies such as China, and about possible sovereign debt defaults in southern Europe.
These near-term uncertainties manifested themselves in asset returns for the 12 months ended July 31, 2012. Assets perceived to be “safe-haven” investments rallied—the 30-year U.S. Treasury bond posted a 38% total return. At the other end of the spectrum, international stock returns for U.S. investors were undermined by a combination of risk-averse investing attitudes, weakening global economic growth, and a stronger U.S. dollar versus the euro and other currencies. Commodity prices also declined during the period.
Unfortunately, the instability that triggered much of this flight-to-quality trading remains largely in place, and the coming months may bring additional uncertainties about U.S. presidential election results and what might happen when U.S. tax cuts and other stimulative measures expire in 2013 (the “Fiscal Cliff”). In this uncertain, unstable environment, we continue to believe in a disciplined, diversified, long-term investment approach, using both stocks and bonds, as appropriate. We appreciate your continued trust in us during these unsettled times.
Sincerely,
Jonathan Thomas
President and Chief Executive Officer
American Century Investments
Independent Chairman’s Letter |
Dear Fellow Shareholders,
The assets under management in American Century Investments’ funds grow through investors placing new assets in the funds and through market appreciation. Asset growth has been at near record levels over the past two calendar years as market movements were upward, the funds’ relative returns were generally favorable, and the distribution strategies implemented by fund management have been successful.
The board reviews fund performance and distribution strategies on a regular basis. Several years ago, the fund’s management team discussed with the board its plans to grow fund assets in the intermediary, institutional and international distribution channels. These distribution strategies have produced strong positive growth. The growth in the intermediary channel recognizes the funds’ strong relative investment performance and the desire of many shareholders to seek financial guidance. Investors in both the institutional and international channels appear to find the funds’ risk-based investment strategies attractive. The board continues to support fund management’s strategies to increase fund assets and will continue to work to provide the benefits of these gains to fund shareholders.
We continue to receive a steady flow of very thoughtful questions from shareholders. If there are issues that you would like the board to address please email me at dhpratt@fundboardchair.com. Thank you for your continued investment in American Century Investments funds.
Best regards,
Don Pratt
By David Hollond, Chief Investment Officer,
U.S. Growth Equity — Mid & Small Cap
Stocks Gained Amid Volatility
The U.S. stock market generated positive results for the 12-month period ended July 31, 2012, although it endured significant volatility along the way. As the reporting period began, stocks were in the midst of a decline as evidence of a slowdown in U.S. economic activity and a worsening sovereign debt crisis in Europe put downward pressure on the equity market.
In early October, though, the equity market bottomed and reversed course, enjoying a substantial rebound through the fourth quarter of 2011 and first quarter of 2012. Investors became more optimistic as signs of improving economic activity quashed recession fears; in particular, job growth consistently exceeded expectations, driving the unemployment rate down to its lowest level in more than three years. Another positive factor was better news out of Europe, as the European Central Bank provided favorable long-term financing to the debt markets and support for the Continent’s banking sector.
The final months of the reporting period brought yet another reversal, as the headwinds facing the equity market at the beginning of the period returned to the forefront. Evidence of slowing economic activity in the U.S. and adverse developments in Europe—including political turmoil in Greece and troubled banks in Spain—weighed on investor confidence, sending stocks down sharply once again.
As the table below illustrates, large-cap issues generated the strongest returns, outpacing mid- and small-cap shares. Growth and value stocks were mixed—growth issues outperformed value among large-cap stocks, while value shares held up better in the mid-and small-cap segments of the market.
From a sector perspective, the defensive telecommunication services sector fared best. Consumer staples, utilities, and health care stocks all managed double-digit gains in the broad Russell 3000 Index. On the downside, the commodity-driven energy and materials sectors fell the most during the period, reflecting a broad decline in commodity prices.
| Market Index Total Returns | |
| For the 12 months ended July 31, 2012 | |
| U.S. Stocks | |
| Russell 1000 Index (Large-Cap) | | | 7.96 | % |
| Russell Midcap Index | | | 2.28 | % |
| Russell 2000 Index (Small-Cap) | | | 0.19 | % |
| Foreign Stocks | |
| MSCI EAFE Index | | | -11.45 | % |
| MSCI Emerging Markets Index | | | -13.93 | % |
| Total Returns as of July 31, 2012 |
| | | | Average Annual Returns | |
| | Ticker Symbol | 1 year | 5 years | Since Inception | Inception Date |
| Investor Class | ACGOX | 5.12% | 0.21% | 3.12% | 5/31/06 |
| Russell 1000 Growth Index | — | 8.26% | 3.46% | 5.41% | — |
| Institutional Class | ACGHX | 5.32% | 0.39% | 3.32% | 5/31/06 |
| Advisor Class | ACGDX | 4.78% | -0.04% | 2.85% | 5/31/06 |
| R Class | ACGEX | 4.53% | -0.32% | 2.59% | 5/31/06 |
| Growth of $10,000 Over Life of Class |
| $10,000 investment made May 31, 2006 |
*From 5/31/06, the Investor Class’s inception date. Not annualized.
| Total Annual Fund Operating Expenses |
| Investor Class | Institutional Class | Advisor Class | R Class |
| 1.12% | 0.92% | 1.37% | 1.62% |
The total annual fund operating expenses shown is as stated in the fund’s prospectus current as of the date of this report. The prospectus may vary from the expense ratio shown elsewhere in this report because it is based on a different time period, includes acquired fund fees and expenses, and, if applicable, does not include fee waivers or expense reimbursements.
Data presented reflect past performance. Past performance is no guarantee of future results. Current performance may be higher or lower than the performance shown. Investment return and principal value will fluctuate, and redemption value may be more or less than original cost. To obtain performance data current to the most recent month end, please call 1-800-345-2021 or visit americancentury.com. The fund’s investment process may result in high portfolio turnover, which could mean high transaction costs, affecting both performance and capital gains tax liabilities to investors. International investing involves special risks, such as political instability and currency fluctuations.
Unless otherwise indicated, performance reflects Investor Class shares; performance for other share classes will vary due to differences in fee structure. For information about other share classes available, please consult the prospectus. Data assumes reinvestment of dividends and capital gains, and none of the charts reflect the deduction of taxes that a shareholder would pay on fund distributions or the redemption of fund shares. Returns for the index are provided for comparison. The fund’s total returns include operating expenses (such as transaction costs and management fees) that reduce returns, while the total returns of the index do not.
Portfolio Managers: John T. Small Jr. and Stephen Pool
Performance Summary
Legacy Large Cap returned 5.12%* for the 12 months ended July 31, 2012, lagging the 8.26% return of the portfolio’s benchmark, the Russell 1000 Growth Index.
As discussed in the Market Perspective on page 4, U.S. stock indices delivered positive returns during the reporting period, despite high levels of market volatility. In an environment of changing economic and market conditions, Legacy Large Cap’s management team remained focused on the fundamental business prospects of its portfolio investments.
Although Legacy Large Cap delivered positive returns for the reporting period, its performance lagged that of its benchmark. The majority of the relative underperformance was attributable to stock decisions in the information technology and consumer discretionary sectors. Holdings in the materials and health care sectors partially offset those relative losses.
Information Technology Led Underperformance
The information technology sector contributed positively to absolute returns for Legacy Large Cap, but was the largest source of relative underperformance. In the office electronics industry, the portfolio held a stake in Japanese lens and camera manufacturer Canon. The company, which was hurt in 2011 when floods in Thailand resulted in the closure of a printer plant and ruptured supply lines, saw a decline in sales as a rising yen made its products more expensive to foreign consumers and a sluggish Japanese economy weakened domestic demand. Elsewhere in the sector, holdings in the communications equipment and IT services industry groups detracted from performance relative to the benchmark.
Consumer Discretionary Detracted
In the consumer discretionary sector, an overweight stake in Netflix represented the largest single detractor from relative returns. The company stumbled when it raised prices 60% for its mail order DVD rental service, and then announced that it would separate its video streaming business from its DVD offering. Both moves alienated customers, and, although the company lowered guidance for its subscriber base, subscription numbers fell below that revised level.
In the auto components industry, the portfolio maintained an overweight stake in automotive supplier TRW Automotive Holdings Corp. The maker of safety electronics and airbags was hurt by a decline in European vehicle production and concerns about slowing economic growth in China. Also in the sector, holdings in the media industry group detracted from relative returns.
*All fund returns referenced in this commentary are for Investor Class shares.
Materials, Health Care Contributed
Legacy Large Cap derived solid absolute results from the materials sector, which declined in the benchmark during the period. The outperformance was largely attributable to an overweight position in Mexican building materials company Cemex, which was the portfolio’s largest individual contributor to relative performance. The company experienced improving pricing and volumes, with increasing demand in its infrastructure and residential business units. Elsewhere in the sector, the portfolio benefited from an individual stake in the metals and mining industry group.
In the health care sector, an overweight stake in biotechnology company Pharmasset contributed significantly to relative returns. The maker of drugs for the treatment of Chronic Hepatitis C virus (HCV) was acquired by Gilead Sciences for $137 per share, representing an 89% premium over the company’s share price before the acquisition deal was struck.
Biotechnology firm Alexion Pharmaceutical was also a key contributor in the health care sector. The company received U.S. and European approval of a second indication for Soliris, a leading drug for the treatment of rare blood disorders.
Outlook
We remain cautiously optimistic in our market outlook. Despite volatile conditions, markets have performed positively in the past year. Nonetheless, we continue to look for more meaningful improvements in economic conditions. Regardless of conditions, Legacy Large Cap employs financial acceleration and price momentum screens to identify investment opportunities in any given economic environment. As always, it will employ a quantitative model to exploit large-cap investment opportunities across the growth and value spectrums.
| JULY 31, 2012 | |
| Top Ten Holdings | | % of net assets |
| Wal-Mart Stores, Inc. | | | 2.9 | % |
| International Business Machines Corp. | | | 2.7 | % |
| McKesson Corp. | | | 2.6 | % |
| Western Digital Corp. | | | 2.5 | % |
| Dollar General Corp. | | | 2.5 | % |
| Chevron Corp. | | | 2.4 | % |
| Lockheed Martin Corp. | | | 2.4 | % |
| Raytheon Co. | | | 2.4 | % |
| Agnico-Eagle Mines Ltd. New York Shares | | | 2.4 | % |
| Walgreen Co. | | | 2.3 | % |
| | | | | |
| Top Five Industries | | % of net assets |
| Software | | | 10.3 | % |
| Computers and Peripherals | | | 8.7 | % |
| Health Care Providers and Services | | | 8.2 | % |
| IT Services | | | 6.9 | % |
| Multiline Retail | | | 6.5 | % |
| | | | | |
| Types of Investments in Portfolio | | % of net assets |
| Domestic Common Stocks | | | 88.3 | % |
| Foreign Common Stocks* | | | 11.2 | % |
| Total Common Stocks | | | 99.5 | % |
| Temporary Cash Investments | | | 0.4 | % |
| Other Assets and Liabilities | | | 0.1 | % |
| *Includes depositary shares, dual listed securities and foreign ordinary shares. | |
Fund shareholders may incur two types of costs: (1) transaction costs, including sales charges (loads) on purchase payments and redemption/exchange fees; and (2) ongoing costs, including management fees; distribution and service (12b-1) fees; and other fund expenses. This example is intended to help you understand your ongoing costs (in dollars) of investing in your fund and to compare these costs with the ongoing cost of investing in other mutual funds.
The example is based on an investment of $1,000 made at the beginning of the period and held for the entire period from February 1, 2012 to July 31, 2012.
Actual Expenses
The table provides information about actual account values and actual expenses for each class. You may use the information, together with the amount you invested, to estimate the expenses that you paid over the period. First, identify the share class you own. Then simply divide your account value by $1,000 (for example, an $8,600 account value divided by $1,000 = 8.6), then multiply the result by the number under the heading “Expenses Paid During Period” to estimate the expenses you paid on your account during this period.
If you hold Investor Class shares of any American Century Investments fund, or Institutional Class shares of the American Century Diversified Bond Fund, in an American Century Investments account (i.e., not a financial intermediary or retirement plan account), American Century Investments may charge you a $12.50 semiannual account maintenance fee if the value of those shares is less than $10,000. We will redeem shares automatically in one of your accounts to pay the $12.50 fee. In determining your total eligible investment amount, we will include your investments in all personal accounts (including American Century Investments Brokerage accounts) registered under your Social Security number. Personal accounts include individual accounts, joint accounts, UGMA/UTMA accounts, personal trusts, Coverdell Education Savings Accounts and IRAs (including traditional, Roth, Rollover, SEP-, SARSEP- and SIMPLE-IRAs), and certain other retirement accounts. If you have only business, business retirement, employer-sponsored or American Century Investments Brokerage accounts, you are currently not subject to this fee. If you are subject to the Account Maintenance Fee, your account value could be reduced by the fee amount.
Hypothetical Example for Comparison Purposes
The table also provides information about hypothetical account values and hypothetical expenses based on the actual expense ratio of each class of your fund and an assumed rate of return of 5% per year before expenses, which is not the actual return of a fund’s share class. The hypothetical account values and expenses may not be used to estimate the actual ending account balance or expenses you paid for the period. You may use this information to compare the ongoing costs of investing in your fund and other funds. To do so, compare this 5% hypothetical example with the 5% hypothetical examples that appear in the shareholder reports of the other funds.
Please note that the expenses shown in the table are meant to highlight your ongoing costs only and do not reflect any transactional costs, such as sales charges (loads) or redemption/exchange fees. Therefore, the table is useful in comparing ongoing costs only, and will not help you determine the relative total costs of owning different funds. In addition, if these transactional costs were included, your costs would have been higher.
| | | | | |
| | Beginning Account Value 2/1/12 | Ending Account Value 7/31/12 | Expenses Paid During Period(1) 2/1/12 – 7/31/12 | Annualized Expense Ratio(1) |
| Actual |
| Investor Class | $1,000 | $1,012.80 | $5.55 | 1.11% |
| Institutional Class | $1,000 | $1,013.70 | $4.56 | 0.91% |
| Advisor Class | $1,000 | $1,011.00 | $6.80 | 1.36% |
| R Class | $1,000 | $1,009.20 | $8.04 | 1.61% |
| Hypothetical |
| Investor Class | $1,000 | $1,019.34 | $5.57 | 1.11% |
| Institutional Class | $1,000 | $1,020.34 | $4.57 | 0.91% |
| Advisor Class | $1,000 | $1,018.10 | $6.82 | 1.36% |
| R Class | $1,000 | $1,016.86 | $8.07 | 1.61% |
| (1) | Expenses are equal to the class’s annualized expense ratio listed in the table above, multiplied by the average account value over the period, multiplied by 182, the number of days in the most recent fiscal half-year, divided by 366, to reflect the one-half year period. |
| | | Shares | | | Value | |
| Common Stocks — 99.5% | |
| AEROSPACE AND DEFENSE — 4.8% | |
| Lockheed Martin Corp. | | | 1,816 | | | | $162,114 | |
| Raytheon Co. | | | 2,920 | | | | 162,002 | |
| | | | | | | | 324,116 | |
| AIR FREIGHT AND LOGISTICS — 2.1% | |
| United Parcel Service, Inc., Class B | | | 1,859 | | | | 140,559 | |
| BEVERAGES — 0.8% | |
| Cia de Bebidas das Americas Preference Shares ADR | | | 1,348 | | | | 51,965 | |
| BIOTECHNOLOGY — 4.4% | |
Alexion Pharmaceuticals, Inc.(1) | | | 1,471 | | | | 154,235 | |
Celgene Corp.(1) | | | 1,635 | | | | 111,932 | |
Pharmacyclics, Inc.(1) | | | 554 | | | | 29,478 | |
| | | | | | | | 295,645 | |
| CHEMICALS — 2.0% | |
| Praxair, Inc. | | | 1,328 | | | | 137,793 | |
| COMPUTERS AND PERIPHERALS — 8.7% | |
Apple, Inc.(1) | | | 252 | | | | 153,911 | |
EMC Corp.(1) | | | 4,609 | | | | 120,802 | |
| Seagate Technology plc | | | 4,783 | | | | 143,586 | |
Western Digital Corp.(1) | | | 4,290 | | | | 170,613 | |
| | | | | | | | 588,912 | |
| FOOD AND STAPLES RETAILING — 6.5% | |
| Costco Wholesale Corp. | | | 855 | | | | 82,234 | |
| Wal-Mart Stores, Inc. | | | 2,667 | | | | 198,505 | |
| Walgreen Co. | | | 4,263 | | | | 155,002 | |
| | | | | | | | 435,741 | |
| FOOD PRODUCTS — 1.8% | |
| General Mills, Inc. | | | 3,138 | | | | 121,441 | |
| HEALTH CARE PROVIDERS AND SERVICES — 8.2% | |
| Cardinal Health, Inc. | | | 3,530 | | | | 152,108 | |
DaVita, Inc.(1) | | | 965 | | | | 94,975 | |
| McKesson Corp. | | | 1,923 | | | | 174,474 | |
| UnitedHealth Group, Inc. | | | 2,548 | | | | 130,177 | |
| | | | | | | | 551,734 | |
| HOTELS, RESTAURANTS AND LEISURE — 3.8% | |
| Las Vegas Sands Corp. | | | 3,339 | | | | 121,606 | |
| McDonald’s Corp. | | | 1,486 | | | | 132,789 | |
| | | | | | | | 254,395 | |
| INSURANCE — 2.5% | |
| Brown & Brown, Inc. | | | 1,164 | | | | 29,379 | |
| Marsh & McLennan Cos., Inc. | | | 4,194 | | | | 139,283 | |
| | | | | | | | 168,662 | |
| IT SERVICES — 6.9% | |
| Accenture plc, Class A | | | 2,485 | | | | 149,845 | |
| International Business Machines Corp. | | | 943 | | | | 184,809 | |
| MasterCard, Inc., Class A | | | 308 | | | | 134,464 | |
| | | | | | | | 469,118 | |
| MACHINERY — 3.9% | |
| Caterpillar, Inc. | | | 1,460 | | | | 122,947 | |
| Cummins, Inc. | | | 1,451 | | | | 139,151 | |
| | | | | | | | 262,098 | |
| MEDIA — 3.6% | |
| Cablevision Systems Corp., Class A | | | 598 | | | | 9,173 | |
DirecTV, Class A(1) | | | 3,062 | | | | 152,059 | |
| Virgin Media, Inc. | | | 3,004 | | | | 82,250 | |
| | | | | | | | 243,482 | |
| METALS AND MINING — 3.2% | |
| Agnico-Eagle Mines Ltd. New York Shares | | | 3,632 | | | | 159,191 | |
| Newmont Mining Corp. | | | 1,326 | | | | 58,967 | |
| | | | | | | | 218,158 | |
| MULTILINE RETAIL — 6.5% | |
Dollar General Corp.(1) | | | 3,239 | | | | 165,222 | |
| Macy’s, Inc. | | | 3,719 | | | | 133,289 | |
| Target Corp. | | | 2,294 | | | | 139,131 | |
| | | | | | | | 437,642 | |
| OFFICE ELECTRONICS — 1.7% | |
| Canon, Inc. ADR | | | 3,361 | | | | 112,425 | |
| OIL, GAS AND CONSUMABLE FUELS — 4.5% | |
| Chevron Corp. | | | 1,492 | | | | 163,493 | |
| Williams Partners LP | | | 2,571 | | | | 139,631 | |
| | | | | | | | 303,124 | |
| REAL ESTATE INVESTMENT TRUSTS (REITs) — 0.4% | |
| CBL & Associates Properties, Inc. | | | 1,329 | | | | 26,221 | |
| ROAD AND RAIL — 1.0% | |
Hertz Global Holdings, Inc.(1) | | | 5,897 | | | | 66,400 | |
| SEMICONDUCTORS AND SEMICONDUCTOR EQUIPMENT — 2.0% | |
| Taiwan Semiconductor Manufacturing Co. Ltd. ADR | | | 9,905 | | | | 138,373 | |
| SOFTWARE — 10.3% | |
| CA, Inc. | | | 2,802 | | | | 67,444 | |
| FactSet Research Systems, Inc. | | | 1,099 | | | | 102,163 | |
| Intuit, Inc. | | | 1,193 | | | | 69,218 | |
| Microsoft Corp. | | | 4,927 | | | | 145,199 | |
| | | Shares | | | Value | |
| Oracle Corp. | | | 4,802 | | | | $145,020 | |
SolarWinds, Inc.(1) | | | 1,238 | | | | 66,097 | |
Symantec Corp.(1) | | | 6,364 | | | | 100,233 | |
| | | | | | | | 695,374 | |
| SPECIALTY RETAIL — 4.2% | |
AutoZone, Inc.(1) | | | 407 | | | | 152,719 | |
| Lowe’s Cos., Inc. | | | 5,043 | | | | 127,941 | |
| | | | | | | | 280,660 | |
| TOBACCO — 3.6% | |
| Lorillard, Inc. | | | 1,131 | | | | 145,492 | |
| Philip Morris International, Inc. | | | 1,063 | | | | 97,201 | |
| | | | | | | | 242,693 | |
| WIRELESS TELECOMMUNICATION SERVICES — 2.1% | |
Crown Castle International Corp.(1) | | | 2,266 | | | | 140,220 | |
TOTAL COMMON STOCKS (Cost $6,249,146) | | | | 6,706,951 | |
| Temporary Cash Investments — 0.4% | |
| SSgA U.S. Government Money Market Fund (Cost $30,319) | | | 30,319 | | | | $30,319 | |
TOTAL INVESTMENT SECURITIES — 99.9% (Cost $6,279,465) | | | | 6,737,270 | |
| OTHER ASSETS AND LIABILITIES — 0.1% | | | | 5,739 | |
| TOTAL NET ASSETS — 100.0% | | | | $6,743,009 | |
| Geographic Diversification | |
| (as a % of net assets) | |
| United States | | | 88.3 | % |
| Ireland | | | 4.4 | % |
| Canada | | | 2.3 | % |
| Taiwan (Republic of China) | | | 2.0 | % |
| Japan | | | 1.7 | % |
| Brazil | | | 0.8 | % |
| Cash and Equivalents* | | | 0.5 | % |
| *Includes temporary cash investments and other assets and liabilities. | |
Notes to Schedule of Investments
ADR = American Depositary Receipt
(1)Non-income producing.
See Notes to Financial Statements.
Statement of Assets and Liabilities |
| JULY 31, 2012 | |
| Assets | |
| Investment securities, at value (cost of $6,279,465) | | | $6,737,270 | |
| Receivable for investments sold | | | 529,653 | |
| Receivable for capital shares sold | | | 2,969 | |
| Dividends receivable | | | 4,577 | |
| | | | 7,274,469 | |
| | | | | |
| Liabilities | |
| Payable for investments purchased | | | 525,209 | |
| Accrued management fees | | | 6,178 | |
| Distribution and service fees payable | | | 73 | |
| | | | 531,460 | |
| | | | | |
| Net Assets | | | $6,743,009 | |
| | | | | |
| Net Assets Consist of: | |
| Capital (par value and paid-in surplus) | | | $9,107,020 | |
| Undistributed net investment income | | | 62,339 | |
| Accumulated net realized loss | | | (2,884,155 | ) |
| Net unrealized appreciation | | | 457,805 | |
| | | | $6,743,009 | |
| | | Net assets | | | Shares outstanding | | | Net asset value per share | |
| Investor Class, $0.01 Par Value | | | $6,381,318 | | | | 576,687 | | | | $11.07 | |
| Institutional Class, $0.01 Par Value | | | $47,534 | | | | 4,283 | | | | $11.10 | |
| Advisor Class, $0.01 Par Value | | | $280,243 | | | | 25,438 | | | | $11.02 | |
| R Class, $0.01 Par Value | | | $33,914 | | | | 3,091 | | | | $10.97 | |
See Notes to Financial Statements.
| YEAR ENDED JULY 31, 2012 | |
| Investment Income (Loss) | |
| Income: | | | |
| Dividends (net of foreign taxes withheld of $2,960) | | | $139,640 | |
| | | | | |
| Expenses: | | | | |
| Management fees | | | 70,250 | |
| Distribution and service fees: | | | | |
| Advisor Class | | | 647 | |
| R Class | | | 143 | |
| Directors’ fees and expenses | | | 241 | |
| Other expenses | | | 78 | |
| | | | 71,359 | |
| | | | | |
| Net investment income (loss) | | | 68,281 | |
| | | | | |
| Realized and Unrealized Gain (Loss) | |
| Net realized gain (loss) on: | | | | |
| Investment transactions | | | 288,514 | |
| Foreign currency transactions | | | 842 | |
| | | | 289,356 | |
| | | | | |
| Change in net unrealized appreciation (depreciation) on investments | | | (48,118 | ) |
| | | | | |
| Net realized and unrealized gain (loss) | | | 241,238 | |
| | | | | |
| Net Increase (Decrease) in Net Assets Resulting from Operations | | | $309,519 | |
See Notes to Financial Statements.
Statement of Changes in Net Assets |
| YEARS ENDED JULY 31, 2012 AND JULY 31, 2011 | |
| Increase (Decrease) in Net Assets | | July 31, 2012 | | | July 31, 2011 | |
| Operations | |
| Net investment income (loss) | | | $68,281 | | | | $82,001 | |
| Net realized gain (loss) | | | 289,356 | | | | 1,641,256 | |
| Change in net unrealized appreciation (depreciation) | | | (48,118 | ) | | | (334,143 | ) |
| Net increase (decrease) in net assets resulting from operations | | | 309,519 | | | | 1,389,114 | |
| | | | | | | | | |
| Distributions to Shareholders | |
| From net investment income: | | | | | | | | |
| Investor Class | | | (46,116 | ) | | | (54,847 | ) |
| Institutional Class | | | (457 | ) | | | (5,170 | ) |
| Advisor Class | | | (1,424 | ) | | | (2,369 | ) |
| R Class | | | (88 | ) | | | (2,170 | ) |
| Decrease in net assets from distributions | | | (48,085 | ) | | | (64,556 | ) |
| | | | | | | | | |
| Capital Share Transactions | |
| Net increase (decrease) in net assets from capital share transactions | | | 356,822 | | | | (2,255,712 | ) |
| | | | | | | | | |
| Net increase (decrease) in net assets | | | 618,256 | | | | (931,154 | ) |
| | | | | | | | | |
| Net Assets | |
| Beginning of period | | | 6,124,753 | | | | 7,055,907 | |
| End of period | | | $6,743,009 | | | | $6,124,753 | |
| | | | | | | | | |
| Undistributed net investment income | | | $62,339 | | | | $48,016 | |
See Notes to Financial Statements.
Notes to Financial Statements |
JULY 31, 2012
1. Organization
American Century Growth Funds, Inc. (the corporation) is registered under the Investment Company Act of 1940, as amended (the 1940 Act), as an open-end management investment company and is organized as a Maryland corporation. Legacy Large Cap Fund (the fund) is one fund in a series issued by the corporation. The fund is diversified as defined under the 1940 Act. The fund’s investment objective is to seek long-term capital growth. The fund pursues its objective by investing primarily in stocks of large-sized market capitalization companies.
The fund offers the Investor Class, the Institutional Class, the Advisor Class and the R Class. The share classes differ principally in their respective distribution and shareholder servicing expenses and arrangements. The Institutional Class is made available to institutional shareholders or through financial intermediaries whose clients do not require the same level of shareholder and administrative services as shareholders of other classes. As a result, the Institutional Class is charged a lower unified management fee.
2. Significant Accounting Policies
The following is a summary of significant accounting policies consistently followed by the fund in preparation of its financial statements. The financial statements are prepared in conformity with accounting principles generally accepted in the United States of America, which may require management to make certain estimates and assumptions at the date of the financial statements. Actual results could differ from these estimates.
Investment Valuations — The fund determines the fair value of its investments and computes its net asset value per share as of the close of regular trading (usually 4 p.m. Eastern time) on the New York Stock Exchange (NYSE) on each day the NYSE is open.
Equity securities that are listed or traded on a domestic securities exchange are valued at the last reported sales price or at the official closing price as provided by the exchange. Equity securities traded on foreign securities exchanges are typically valued at the closing price on the exchange where primarily traded or as of the close of the NYSE, if that is earlier. If no last sales price is reported, or if local convention or regulation so provides, the mean of the latest bid and asked prices is used. Depending on local convention or regulation, securities traded over-the-counter are valued at the mean of the latest bid and asked prices, the last sales price, or the official closing price. In its determination of fair value, the fund may review several factors including: market information specific to a security; news developments in U.S. and foreign markets; the performance of particular U.S. and foreign securities, indices, comparable securities, American Depositary Receipts, Exchange-Traded Funds, and other relevant market indicators.
Debt securities maturing within 60 days at the time of purchase may be valued at cost, plus or minus any amortized discount or premium or at the evaluated mean as provided by an independent pricing service. Evaluated mean prices are commonly derived through utilization of market models, which may consider, among other factors, trade data, quotations from dealers and active market makers, relevant yield curve and spread data, related sector levels, creditworthiness, and other relevant market information on the same or comparable securities.
Investments in open-end management investment companies are valued at the reported net asset value per share.
The value of investments initially expressed in foreign currencies is translated into U.S. dollars at prevailing exchange rates.
If the fund determines that the market price for a portfolio security is not readily available or the valuation methods mentioned above do not reflect a security’s fair value, such security is valued as determined in good faith by the Board of Directors or its designee, in accordance with procedures adopted by the Board of Directors. Circumstances that may cause the fund to use these procedures to value a security include, but are not limited
to: a security has been declared in default; trading in a security has been halted during the trading day; there is a foreign market holiday and no trading occurred; or an event occurred between the close of a foreign exchange and the NYSE that may affect the value of a security.
Security Transactions — Security transactions are accounted for as of the trade date. Net realized gains and losses are determined on the identified cost basis, which is also used for federal income tax purposes.
Investment Income — Dividend income less foreign taxes withheld, if any, is recorded as of the ex-dividend date. Distributions received on securities that represent a return of capital or capital gain are recorded as a reduction of cost of investments and/or as a realized gain. The fund estimates the components of distributions received that may be considered nontaxable distributions or capital gain distributions for income tax purposes.
Foreign Currency Translations — All assets and liabilities initially expressed in foreign currencies are translated into U.S. dollars at prevailing exchange rates at period end. The fund may enter into spot foreign currency exchange contracts to facilitate transactions denominated in a foreign currency. Purchases and sales of investment securities, dividend and interest income, spot foreign currency exchange contracts, and expenses are translated at the rates of exchange prevailing on the respective dates of such transactions. Net realized and unrealized foreign currency exchange gains or losses related to investment securities are a component of net realized gain (loss) on investment transactions and change in net unrealized appreciation (depreciation) on investments, respectively.
Income Tax Status — It is the fund’s policy to distribute substantially all net investment income and net realized gains to shareholders and to otherwise qualify as a regulated investment company under provisions of the Internal Revenue Code. The fund is no longer subject to examination by tax authorities for years prior to 2009. At this time, management believes there are no uncertain tax positions which, based on their technical merit, would not be sustained upon examination and for which it is reasonably possible that the total amounts of unrecognized tax benefits will significantly change in the next twelve months. Accordingly, no provision has been made for federal or state income taxes.
Multiple Class — All shares of the fund represent an equal pro rata interest in the net assets of the class to which such shares belong, and have identical voting, dividend, liquidation and other rights and the same terms and conditions, except for class specific expenses and exclusive rights to vote on matters affecting only individual classes. Income, non-class specific expenses, and realized and unrealized capital gains and losses of the fund are allocated to each class of shares based on their relative net assets.
Distributions to Shareholders — Distributions from net investment income and net realized gains, if any, are generally declared and paid annually.
Indemnifications — Under the corporation’s organizational documents, its officers and directors are indemnified against certain liabilities arising out of the performance of their duties to the fund. In addition, in the normal course of business, the fund enters into contracts that provide general indemnifications. The maximum exposure under these arrangements is unknown as this would involve future claims that may be made against a fund. The risk of material loss from such claims is considered by management to be remote.
3. Fees and Transactions with Related Parties
Management Fees — The corporation has entered into a management agreement with American Century Investment Management, Inc. (ACIM) (the investment advisor), under which ACIM provides the fund with investment advisory and management services in exchange for a single, unified management fee (the fee) per class. The agreement provides that all expenses of managing and operating the fund, except distribution and service fees, brokerage expenses, taxes, interest, fees and expenses of the independent directors (including legal counsel fees), and extraordinary expenses, will be paid by ACIM. The fee is computed and accrued daily based on each class’s daily net assets and paid monthly in arrears. The rate of the fee is determined by applying a fee rate calculation formula. This formula takes into account the fund’s assets as well as certain assets, if any, of other clients
of the investment advisor outside the American Century Investments family of funds (such as subadvised funds and separate accounts) that have very similar investment teams and investment strategies (strategy assets). The annual management fee schedule ranges from 0.80% to 1.10% for the Investor Class, Advisor Class and R Class. The Institutional Class is 0.20% less at each point within the range. The effective annual management fee for each class for the year ended July 31, 2012 was 1.10% for the Investor Class, Advisor Class and R Class and 0.90% for the Institutional Class.
Distribution and Service Fees — The Board of Directors has adopted a separate Master Distribution and Individual Shareholder Services Plan for each of the Advisor Class and R Class (collectively the plans), pursuant to Rule 12b-1 of the 1940 Act. The plans provide that the Advisor Class will pay American Century Investment Services, Inc. (ACIS) an annual distribution and service fee of 0.25%. The plans provide that the R Class will pay ACIS an annual distribution and service fee of 0.50%. The fees are computed and accrued daily based on each class’s daily net assets and paid monthly in arrears. The fees are used to pay financial intermediaries for distribution and individual shareholder services. Fees incurred under the plans during the year ended July 31, 2012 are detailed in the Statement of Operations.
Related Parties — Certain officers and directors of the corporation are also officers and/or directors of American Century Companies, Inc., the parent of the corporation’s investment advisor, ACIM, the distributor of the corporation, ACIS, and the corporation’s transfer agent, American Century Services, LLC.
4. Investment Transactions
Purchases and sales of investment securities, excluding short-term investments, for the year ended July 31, 2012 were $13,286,861 and $13,008,576, respectively.
5. Capital Share Transactions
The corporation is authorized to issue 3,000,000,000 shares. Transactions in shares of the fund were as follows:
| | | | | | |
| | Year ended July 31, 2012 | | | Year ended July 31, 2011 | |
| | Shares | | | Amount | | | Shares | | | Amount | |
| Investor Class | |
| Sold | | 171,260 | | | | $1,838,003 | | | | 74,738 | | | | $748,777 | |
| Issued in reinvestment of distributions | | 4,319 | | | | 44,311 | | | | 5,286 | | | | 52,277 | |
| Redeemed | | (139,432 | ) | | | (1,499,222 | ) | | | (209,029 | ) | | | (2,034,204 | ) |
| | | 36,147 | | | | 383,092 | | | | (129,005 | ) | | | (1,233,150 | ) |
| Institutional Class | |
| Issued in reinvestment of distributions | | 44 | | | | 457 | | | | 522 | | | | 5,170 | |
| Redeemed | | (1,773 | ) | | | (16,557 | ) | | | (39,823 | ) | | | (433,436 | ) |
| | | (1,729 | ) | | | (16,100 | ) | | | (39,301 | ) | | | (428,266 | ) |
| Advisor Class | |
| Sold | | 2,560 | | | | 27,920 | | | | 4,966 | | | | 53,901 | |
| Issued in reinvestment of distributions | | 139 | | | | 1,424 | | | | 240 | | | | 2,369 | |
| Redeemed | | (4,862 | ) | | | (45,853 | ) | | | (14,448 | ) | | | (146,078 | ) |
| | | (2,163 | ) | | | (16,509 | ) | | | (9,242 | ) | | | (89,808 | ) |
| R Class | |
| Sold | | 560 | | | | 6,263 | | | | 228 | | | | 2,377 | |
| Issued in reinvestment of distributions | | 9 | | | | 88 | | | | 220 | | | | 2,170 | |
| Redeemed | | (1 | ) | | | (12 | ) | | | (47,228 | ) | | | (509,035 | ) |
| | | 568 | | | | 6,339 | | | | (46,780 | ) | | | (504,488 | ) |
| Net increase (decrease) | | 32,823 | | | | $356,822 | | | | (224,328 | ) | | | $(2,255,712 | ) |
6. Fair Value Measurements
The fund’s securities valuation process is based on several considerations and may use multiple inputs to determine the fair value of the positions held by the fund. In conformity with accounting principles generally accepted in the United States of America, the inputs used to determine a valuation are classified into three broad levels as follows:
| • | Level 1 valuation inputs consist of unadjusted quoted prices in an active market for identical securities; |
| • | Level 2 valuation inputs consist of direct or indirect observable market data (including quoted prices for similar securities, evaluations of subsequent market events, interest rates, prepayment speeds, credit risk, etc.); or |
| • | Level 3 valuation inputs consist of unobservable data (including a fund’s own assumptions). |
The level classification is based on the lowest level input that is significant to the fair valuation measurement. The valuation inputs are not necessarily an indication of the risks associated with investing in these securities or other financial instruments.
The following is a summary of the level classifications as of period end. The Schedule of Investments provides additional information on the fund’s portfolio holdings.
| | | | | | | | | |
| | Level 1 | | | Level 2 | | | Level 3 | |
| Investment Securities | |
| Domestic Common Stocks | | $5,951,566 | | | | — | | | | — | |
| Foreign Common Stocks | | 755,385 | | | | — | | | | — | |
| Temporary Cash Investments | | 30,319 | | | | — | | | | — | |
| Total Value of Investment Securities | | $6,737,270 | | | | — | | | | — | |
7. Risk Factors
The fund’s investment process may result in high portfolio turnover, which could mean high transaction costs, affecting both performance and capital gains tax liabilities to investors.
There are certain risks involved in investing in foreign securities. These risks include those resulting from future adverse political, social and economic developments, fluctuations in currency exchange rates, the possible imposition of exchange controls, and other foreign laws or restrictions.
8. Federal Tax Information
The tax character of distributions paid during the years ended July 31, 2012 and July 31, 2011 were as follows:
| | | 2012 | | | 2011 | |
| Distributions Paid From | |
| Ordinary income | | | $48,085 | | | | $64,556 | |
| Long-term capital gains | | | — | | | | — | |
The book-basis character of distributions made during the year from net investment income or net realized gains may differ from their ultimate characterization for federal income tax purposes. These differences reflect the differing character of certain income items and net realized gains and losses for financial statement and tax purposes, and may result in reclassification among certain capital accounts on the financial statements.
As of July 31, 2012, the federal tax cost of investments and the components of distributable earnings on a tax-basis were as follows:
| | | | |
| Federal tax cost of investments | | | $6,282,417 | |
| Gross tax appreciation of investments | | | $690,890 | |
| Gross tax depreciation of investments | | | (236,037 | ) |
| Net tax appreciation (depreciation) of investments | | | $454,853 | |
| Undistributed ordinary income | | | $62,339 | |
| Accumulated short-term capital losses | | | $(2,881,203 | ) |
The difference between book-basis and tax-basis cost and unrealized appreciation (depreciation) is attributable primarily to the tax deferral of losses on wash sales.
The accumulated capital losses represent net capital loss carryovers that may be used to offset future realized capital gains for federal income tax purposes. Future capital loss carryover utilization in any given year may be subject to Internal Revenue Code limitations. Capital loss carryovers of $(1,472,682) and $(1,408,521) expire in 2017 and 2018, respectively.
| For a Share Outstanding Throughout the Years Ended July 31 (except as noted) |
| Per-Share Data | Ratios and Supplemental Data |
| | | Income From Investment Operations: | Distributions From: | | | Ratio to Average Net Assets of: | Portfolio Turnover Rate | |
| | Net Asset Value, Beginning of Period | Net Investment Income (Loss(1) | Net Realized and Unrealized Gain (Loss) | Total From Investment Operations | Net Investment Income | Net Realized Gains | Tax Return of Capital | Total Distributions | Net Asset Value, End of Period | Total Return(2) | Operating Expenses | Net Investment Income (Loss) | Net Assets, End of Period (in thousands) |
| Investor Class |
| 2012 | $10.62 | 0.12 | 0.42 | 0.54 | (0.09) | — | — | (0.09) | $11.07 | 5.12% | 1.11% | 1.08% | 204% | $6,381 |
| 2011 | $8.81 | 0.12 | 1.78 | 1.90 | (0.09) | — | — | (0.09) | $10.62 | 21.69% | 1.11% | 1.23% | 194% | $5,742 |
| 2010 | $8.30 | 0.08 | 0.51 | 0.59 | (0.08) | — | — | (0.08) | $8.81 | 7.13% | 1.11% | 0.86% | 163% | $5,901 |
| 2009 | $11.60 | 0.07 | (3.37) | (3.30) | — | — | — | — | $8.30 | (28.45)% | 1.10% | 0.83% | 283% | $7,714 |
| 2008 | $11.90 | 0.01 | 0.41 | 0.42 | (0.03) | (0.61) | (0.08) | (0.72) | $11.60 | 3.07% | 1.11% | 0.10% | 175% | $13,487 |
| Institutional Class |
| 2012 | $10.65 | 0.14 | 0.42 | 0.56 | (0.11) | — | — | (0.11) | $11.10 | 5.32% | 0.91% | 1.28% | 204% | $48 |
| 2011 | $8.84 | 0.13 | 1.79 | 1.92 | (0.11) | — | — | (0.11) | $10.65 | 21.86% | 0.91% | 1.43% | 194% | $64 |
| 2010 | $8.32 | 0.09 | 0.53 | 0.62 | (0.10) | — | — | (0.10) | $8.84 | 7.45% | 0.91% | 1.06% | 163% | $401 |
| 2009 | $11.61 | 0.08 | (3.37) | (3.29) | — | — | — | — | $8.32 | (28.34)% | 0.90% | 1.03% | 283% | $699 |
| 2008 | $11.92 | 0.04 | 0.40 | 0.44 | (0.04) | (0.61) | (0.10) | (0.75) | $11.61 | 3.19% | 0.91% | 0.30% | 175% | $947 |
| Advisor Class |
| 2012 | $10.58 | 0.09 | 0.41 | 0.50 | (0.06) | — | — | (0.06) | $11.02 | 4.78% | 1.36% | 0.83% | 204% | $280 |
| 2011 | $8.78 | 0.10 | 1.77 | 1.87 | (0.07) | — | — | (0.07) | $10.58 | 21.34% | 1.36% | 0.98% | 194% | $292 |
| 2010 | $8.26 | 0.05 | 0.53 | 0.58 | (0.06) | — | — | (0.06) | $8.78 | 7.01% | 1.36% | 0.61% | 163% | $323 |
| 2009 | $11.58 | 0.04 | (3.36) | (3.32) | — | — | — | — | $8.26 | (28.67)% | 1.35% | 0.58% | 283% | $278 |
| 2008 | $11.88 | (0.02) | 0.41 | 0.39 | (0.02) | (0.61) | (0.06) | (0.69) | $11.58 | 2.81% | 1.36% | (0.15)% | 175% | $1,304 |
| For a Share Outstanding Throughout the Years Ended July 31 (except as noted) |
| Per-Share Data | Ratios and Supplemental Data |
| | | Income From Investment Operations: | Distributions From: | | | Ratio to Average Net Assets of: | Portfolio Turnover Rate | |
| | Net Asset Value, Beginning of Period | Net Investment Income (Loss(1) | Net Realized and Unrealized Gain (Loss) | Total From Investment Operations | Net Investment Income | Net Realized Gains | Tax Return of Capital | Total Distributions | Net Asset Value, End of Period | Total Return(2) | Operating Expenses | Net Investment Income (Loss) | Net Assets, End of Period (in thousands) |
| R Class |
| 2012 | $10.53 | 0.06 | 0.41 | 0.47 | (0.03) | — | — | (0.03) | $10.97 | 4.53% | 1.61% | 0.58% | 204% | $34 |
| 2011 | $8.74 | 0.06 | 1.77 | 1.83 | (0.04) | — | — | (0.04) | $10.53 | 21.02% | 1.61% | 0.73% | 194% | $27 |
| 2010 | $8.23 | 0.03 | 0.52 | 0.55 | (0.04) | — | — | (0.04) | $8.74 | 6.64% | 1.61% | 0.36% | 163% | $431 |
| 2009 | $11.56 | 0.03 | (3.36) | (3.33) | — | — | — | — | $8.23 | (28.81)% | 1.60% | 0.33% | 283% | $651 |
| 2008 | $11.87 | (0.05) | 0.40 | 0.35 | (0.02) | (0.61) | (0.03) | (0.66) | $11.56 | 2.47% | 1.61% | (0.40)% | 175% | $915 |
Notes to Financial Highlights
| (1) | Computed using average shares outstanding throughout the period. |
| (2) | Total returns are calculated based on the net asset value of the last business day. Total returns for periods less than one year are not annualized. |
See Notes to Financial Statements.
Report of Independent Registered Public Accounting Firm |
To the Shareholders and Board of Directors of
American Century Growth Funds, Inc.:
We have audited the accompanying statement of assets and liabilities, including the schedule of investments, of Legacy Large Cap Fund, one of the funds constituting American Century Growth Funds, Inc. (the “Corporation”) as of July 31, 2012, and the related statement of operations for the year then ended, the statement of changes in net assets for each of the two years in the period then ended, and the financial highlights for each of the five years in the period then ended. These financial statements and financial highlights are the responsibility of the Corporation’s management. Our responsibility is to express an opinion on these financial statements and financial highlights based on our audits.
We conducted our audits in accordance with the standards of the Public Company Accounting Oversight Board (United States). Those standards require that we plan and perform the audit to obtain reasonable assurance about whether the financial statements and financial highlights are free of material misstatement. The Corporation is not required to have, nor were we engaged to perform, an audit of their internal control over financial reporting. Our audits included consideration of internal control over financial reporting as a basis for designing audit procedures that are appropriate in the circumstances, but not for the purpose of expressing an opinion on the effectiveness of the Corporation’s internal control over financial reporting. Accordingly, we express no such opinion. An audit also includes examining, on a test basis, evidence supporting the amounts and disclosures in the financial statements, assessing the accounting principles used and significant estimates made by management, as well as evaluating the overall financial statement presentation. Our procedures included confirmation of securities owned as of July 31, 2012, by correspondence with the custodian and brokers; where replies were not received from brokers, we performed other auditing procedures. We believe that our audits provide a reasonable basis for our opinion.
In our opinion, the financial statements and financial highlights referred to above present fairly, in all material respects, the financial position of Legacy Large Cap Fund of American Century Growth Funds, Inc. as of July 31, 2012, the results of its operations for the year then ended, the changes in its net assets for each of the two years in the period then ended, and the financial highlights for each of the five years in the period then ended, in conformity with accounting principles generally accepted in the United States of America.
Deloitte & Touche LLP
Kansas City, Missouri
September 19, 2012
The individuals listed below serve as directors of the funds. Each director will continue to serve in this capacity until death, retirement, resignation or removal from office. The mandatory retirement age for directors who are not “interested persons,” as that term is defined in the Investment Company Act (independent directors), is 72. However, the mandatory retirement age for an individual director may be extended with the approval of the remaining independent directors.
Mr. Thomas is an “interested person” because he currently serves as President and Chief Executive Officer of American Century Companies, Inc. (ACC), the parent company of American Century Investment Management, Inc. (ACIM or the advisor). Mr. Fink is an “interested person” because he currently serves as Executive Vice President and Chief Operating Officer of ACC.
The other directors (more than three-fourths of the total number) are independent; that is, they have never been employees, directors or officers of, and have no financial interest in, ACC or any of its wholly owned, direct or indirect, subsidiaries, including ACIM, American Century Investment Services, Inc. (ACIS) and American Century Services, LLC (ACS). The directors serve in this capacity for seven (in the case of Mr. Thomas, 15) registered investment companies in the American Century Investments family of funds.
The following table presents additional information about the directors. The mailing address for each director is 4500 Main Street, Kansas City, Missouri 64111.
Name (Year of Birth) | Position(s) Held with Funds | Length of Time Served | Principal Occupation(s) During Past 5 Years | | Number of American Century Portfolios Overseen by Director | Other Directorships Held During Past 5 Years |
| Independent Directors |
Thomas A. Brown (1940) | Director | Since 1980 | Managing Member, Associated Investments, LLC (real estate investment company); Brown Cascade Properties, LLC (real estate investment company) (2001 to 2009) | | 66 | None |
Andrea C. Hall (1945) | Director | Since 1997 | Retired | | 66 | None |
Jan M. Lewis (1957) | Director | Since 2011 | President and Chief Executive Officer, Catholic Charities of Northeast Kansas (human services organization) | | 66 | None |
James A. Olson (1942) | Director | Since 2007 | Member, Plaza Belmont LLC (private equity fund manager) | | 66 | Saia, Inc. (2002 to 2012) and Entertainment Properties Trust |
Donald H. Pratt (1937) | Director and Chairman of the Board | Since 1995 (Chairman since 2005) | Chairman and Chief Executive Officer, Western Investments, Inc. (real estate company) | | 66 | None |
Name (Year of Birth) | Position(s) Held with Funds | Length of Time Served | Principal Occupation(s) During Past 5 Years | | Number of American Century Portfolios Overseen by Director | Other Directorships Held During Past 5 Years |
| Independent Directors |
M. Jeannine Strandjord (1945) | Director | Since 1994 | Retired | | 66 | Euronet Worldwide Inc.; Charming Shoppes, Inc. (2006 to 2010); and DST Systems Inc. (1996 to 2012) |
John R. Whitten (1946) | Director | Since 2008 | Retired | | 66 | Rudolph Technologies, Inc. |
Stephen E. Yates (1948) | Director | Since 2012 | Retired; Executive Vice President, Technology & Operations, KeyCorp. (computer services) (2004 to 2010) | | 66 | Applied Industrial Technology (2001 to 2010) |
| |
| Interested Directors |
Barry Fink (1955) | Director and Executive Vice President | Since 2012 (Executive Vice President since 2007) | Chief Operating Officer and Executive Vice President, ACC (September 2007 to present); President, ACS (October 2007 to present); Managing Director, Morgan Stanley (2000 to 2007). Also serves as Manager, ACS and Director, ACC and certain ACC subsidiaries | | 66 | None |
Jonathan S. Thomas (1963) | Director and President | Since 2007 | President and Chief Executive Officer, ACC (March 2007 to present); Chief Administrative Officer, ACC (February 2006 to February 2007); Executive Vice President, ACC (November 2005 to February 2007). Also serves as Chief Executive Officer and Manager, ACS; Executive Vice President, ACIM; Director, ACC, ACIM and other ACC subsidiaries | | 108 | None |
Officers
The following table presents certain information about the executive officers of the funds. Each officer serves as an officer for each of the 15 investment companies in the American Century family of funds, unless otherwise noted. No officer is compensated for his or her service as an officer of the funds. The listed officers are interested persons of the funds and are appointed or re-appointed on an annual basis. The mailing address for each officer listed below is 4500 Main Street, Kansas City, Missouri 64111.
Name (Year of Birth) | Offices with the Funds | Principal Occupation(s) During the Past Five Years |
Jonathan S. Thomas (1963) | Director and President since 2007 | President and Chief Executive Officer, ACC (March 2007 to present); Chief Administrative Officer, ACC (February 2006 to February 2007); Executive Vice President, ACC (November 2005 to February 2007). Also serves as Chief Executive Officer and Manager, ACS; Executive Vice President, ACIM; Director, ACC, ACIM and other ACC subsidiaries |
Barry Fink (1955) | Director since 2012 and Executive Vice President since 2007 | Chief Operating Officer and Executive Vice President, ACC (September 2007 to present); President, ACS (October 2007 to present); Managing Director, Morgan Stanley (2000 to 2007). Also serves as Manager, ACS and Director, ACC and certain ACC subsidiaries |
Maryanne L. Roepke (1956) | Chief Compliance Officer since 2006 and Senior Vice President since 2000 | Chief Compliance Officer, American Century funds, ACIM and ACS (August 2006 to present). Also serves as Senior Vice President, ACS |
Charles A. Etherington (1957) | General Counsel since 2007 and Senior Vice President since 2006 | Attorney, ACC (February 1994 to present); Vice President, ACC (November 2005 to present), General Counsel, ACC (March 2007 to present); Also serves as General Counsel, ACIM, ACS, ACIS and other ACC subsidiaries; and Senior Vice President, ACIM and ACS |
C. Jean Wade (1964) | Vice President, Treasurer and Chief Financial Officer since 2012 | Vice President, ACS (February 2000 to present) |
Robert J. Leach (1966) | Vice President since 2006 and Assistant Treasurer since 2012 | Vice President, ACS (February 2000 to present) |
David H. Reinmiller (1963) | Vice President since 2000 | Attorney, ACC (January 1994 to present); Associate General Counsel, ACC (January 2001 to present). Also serves as Vice President, ACIM and ACS |
Ward D. Stauffer (1960) | Secretary since 2005 | Attorney, ACC (June 2003 to present) |
The Statement of Additional Information has additional information about the fund’s directors and is available without charge, upon request, by calling 1-800-345-2021.
Approval of Management Agreement |
At a meeting held on June 21, 2012, the Fund’s Board of Directors unanimously approved the renewal of the management agreement pursuant to which American Century Investment Management, Inc. (the “Advisor”) acts as the investment advisor for the Fund. Under Section 15(c) of the Investment Company Act, contracts for investment advisory services are required to be reviewed, evaluated, and approved by a majority of a fund’s independent directors (the “Directors”) each year.
As a part of the approval process, the Board requested and reviewed extensive data and information compiled by the Advisor and certain independent providers of evaluation data concerning the Fund and the services provided to the Fund by the Advisor. This review was in addition to the oversight and evaluation undertaken by the Board and its committees on a continuous basis throughout the year and included, but was not limited to the following:
| • | the nature, extent, and quality of investment management, shareholder services, and other services provided by the Advisor to the Fund; |
| • | the wide range of other programs and services the Advisor provides to the Fund and its shareholders on a routine and non-routine basis; |
| • | the investment performance of the fund, including data comparing the Fund’s performance to appropriate benchmarks and/or a peer group of other mutual funds with similar investment objectives and strategies; |
| • | data comparing the cost of owning the Fund to the cost of owning similar funds; |
| • | the Advisor’s compliance policies, procedures, and regulatory experience; |
| • | financial data showing the cost of services provided to the Fund, the profitability of the Fund to the Advisor, and the overall profitability of the Advisor; |
| • | data comparing services provided and charges to other investment management clients of the Advisor; and |
| • | consideration of collateral benefits derived by the Advisor from the management of the Fund and any potential economies of scale relating thereto. |
In keeping with its practice, the Board held two in-person meetings and one telephonic meeting to review and discuss the information provided. The Directors also had the benefit of the advice of independent counsel throughout the period.
Factors Considered
The Directors considered all of the information provided by the Advisor, the independent data providers, and independent counsel, and evaluated such information for the Fund. In connection with their review, the Directors did not identify any single factor as being all-important or controlling, and each Director may have attributed different levels of importance to different factors. In deciding to renew the management agreement, the Board based its decision on a number of factors, including the following:
Nature, Extent and Quality of Services — Generally. Under the management agreement, the Advisor is responsible for providing or arranging for all services necessary for the operation of the Fund. The Board noted that under the management agreement, the Advisor provides or arranges at its own expense a wide variety of services including:
| • | constructing and designing the Fund |
| • | portfolio research and security selection |
| • | initial capitalization/funding |
| • | daily valuation of the Fund’s portfolio |
| • | shareholder servicing and transfer agency, including shareholder confirmations, recordkeeping, and communications |
| • | regulatory and portfolio compliance |
| • | marketing and distribution |
The Board noted that many of these services have expanded over time both in terms of quantity and complexity in response to shareholder demands, competition in the industry, changing distribution channels, and the changing regulatory environment.
Investment Management Services. The nature of the investment management services provided to the Fund is quite complex and allows Fund shareholders access to professional money management, instant diversification of their investments within an asset class, the opportunity to easily diversify among asset classes by investing in or exchanging among various American Century Investments funds, and liquidity. In evaluating investment performance, the Board expects the Advisor to manage the Fund in accordance with its investment objectives and approved strategies. Further, the Directors recognize that the Advisor has an obligation to monitor trading activities, and in particular to seek the best execution of fund trades, and to evaluate the use of and payment for research. In providing these services, the Advisor utilizes teams of investment professionals (portfolio managers, analysts, research assistants, and securities traders) who require extensive information technology, research, training, compliance and other systems to conduct their business. The Board, directly and through its Fund Performance Review Committee, regularly reviews investment performance information for the Fund, together with comparative information for appropriate benchmarks and/or peer groups of similarly-managed funds, over different time
horizons. The Directors also review detailed performance information during the management agreement approval process. If performance concerns are identified, the Fund receives special reviews until performance improves, during which the Board discusses with the Advisor the reasons for such results (e.g., market conditions, security selection) and any efforts being undertaken to improve performance. Taking all these factors into consideration, the Board found the investment management services provided by the Advisor to the Fund to meet or exceed industry standards. More detailed information about the Fund’s performance can be found in the Performance and Portfolio Commentary sections of this report.
Shareholder and Other Services. Under the management agreement, the Advisor provides the Fund with a comprehensive package of transfer agency, shareholder, and other services. The Board, directly and through various committees of the Board, regularly reviews reports and evaluations of such services at its regular meetings. These reports include, but are not limited to, information regarding the operational efficiency and accuracy of the shareholder and transfer agency services provided, staffing levels, shareholder satisfaction (as measured by external as well as internal sources), technology support, new products and services offered to Fund shareholders, securities trading activities, portfolio valuation services, auditing services, and legal and operational compliance activities. Certain aspects of shareholder and transfer agency service level efficiency and the quality of securities trading activities are measured by independent third party providers and are presented in comparison to other fund groups not managed by the Advisor. The Board found the services provided by the Advisor to the Fund under the management agreement to be competitive and of high quality.
Costs of Services and Profitability. The Advisor provides detailed information concerning its cost of providing various services to the Fund, its profitability in managing the Fund, its overall profitability, and its financial condition. The Directors have reviewed with the Advisor the methodology used to prepare this financial information. The financial information regarding the Advisor is considered in evaluating the Advisor’s financial condition, ability to continue to provide services under the management agreement, and the reasonableness of the current management fee. The Board concluded that the Advisor’s profits were reasonable in light of the services provided to the Fund.
Ethics. The Board generally considers the Advisor’s commitment to providing quality services to shareholders and to conducting its business ethically. They noted that the Advisor’s practices generally meet or exceed industry best practices.
Economies of Scale. The Board also reviewed information provided by the Advisor regarding the possible existence of economies of scale in connection with the management of the Fund. The Board concluded that economies of scale are difficult to measure and predict with precision, especially on a fund-by-fund basis. The Board concluded that the Advisor is appropriately sharing economies of scale through its competitive fee structure, offering competitive fees from fund inception, and through reinvestment in its business to provide shareholders additional content and services.
Comparison to Other Funds’ Fees. The management agreement provides that the Fund pay the Advisor a single, all-inclusive (or unified) management fee for providing all services necessary for the management and operation of the Fund, other than brokerage expenses, taxes, interest, extraordinary expenses, and the fees and expenses of the Fund’s independent directors (including their independent legal counsel) and expenses incurred in connection with the provision of shareholder services and distribution services under a plan adopted pursuant to Rule 12b-1 under the 1940 Act. Under the unified fee structure, the Advisor is responsible for providing all investment advisory, custody, audit, administrative, compliance, recordkeeping, marketing and shareholder services, or arranging and supervising third parties to provide such services. By contrast, most other funds are charged a variety of fees, including an investment advisory fee, a transfer agency fee, an administrative fee, distribution charges and other expenses. Other than their investment advisory fees and any applicable Rule 12b-1 distribution fees, all other components of the total fees charged by these other funds may be increased without shareholder approval. The Board believes the unified fee structure is a benefit to Fund shareholders because it clearly discloses to shareholders the cost of owning Fund shares, and, since the unified fee cannot be increased without a vote of Fund shareholders, it shifts to the Advisor the risk of increased costs of operating the Fund and provides a direct incentive to minimize administrative inefficiencies. Part of the Board’s analysis of fee levels involves reviewing certain evaluative data compiled by an independent provider and comparing the Fund’s unified fee to the total expense ratio of other funds in the Fund’s peer group. The Board concluded that the management fee paid by the Fund to the Advisor under the management agreement is reasonable in light of the services provided to the Fund.
Comparison to Fees and Services Provided to Other Clients of the Advisor. The Board also requested and received information from the Advisor concerning the nature of the services, fees, costs and profitability of its advisory services to advisory clients other than the Fund. They observed that these varying types of client accounts require different services and involve different regulatory and entrepreneurial risks than the management of the Fund. The Board analyzed this information and concluded that the fees charged and services provided to the Fund were reasonable by comparison.
Collateral or “Fall-Out” Benefits Derived by the Advisor. The Board considered the existence of collateral benefits the Advisor may receive as a result of its relationship with the Fund. They concluded that the Advisor’s primary business is managing mutual funds and it generally does not use fund or shareholder information to generate profits in other lines of business, and therefore does not derive any significant collateral benefits from them. The Board noted that the Advisor receives proprietary research from broker-dealers that execute fund portfolio transactions and concluded that this research is likely to benefit Fund shareholders. The Board also determined that the Advisor is able to provide investment management services to certain clients other than the Fund, at least in part, due to its existing infrastructure built to serve the fund complex. The Board concluded, however, that the assets of those other clients are not material to the analysis and, where applicable, may be included with the assets of the Fund to determine breakpoints in the management fee schedule.
Existing Relationship. The Board also considered whether there was any reason for not continuing the existing arrangement with the Advisor. In this regard, the Board was mindful of the potential disruptions of the Fund’s operations and various risks, uncertainties, and other effects that could occur as a result of a decision not to continue such relationship. In particular, the Board recognized that most shareholders have invested in the Fund on the strength of the Advisor’s industry standing and reputation and in the expectation that the Advisor will have a continuing role in providing advisory services to the Fund.
Conclusion of the Directors. As a result of this process, the Board, including all of the independent directors, taking into account all of the factors discussed above and the information provided by the Advisor and others, concluded that the management agreement between the Fund and the Advisor is fair and reasonable in light of the services provided and should be renewed.
Retirement Account Information
As required by law, distributions you receive from certain IRAs, or 403(b), 457 and qualified plans are subject to federal income tax withholding, unless you elect not to have withholding apply. Tax will be withheld on the total amount withdrawn even though you may be receiving amounts that are not subject to withholding, such as nondeductible contributions. In such case, excess amounts of withholding could occur. You may adjust your withholding election so that a greater or lesser amount will be withheld.
If you don’t want us to withhold on this amount, you must notify us to not withhold the federal income tax. You may notify us in writing or in certain situations by telephone or through other electronic means. You have the right to revoke your withholding election at any time and any election you make may remain in effect until revoked by filing a new election.
Remember, even if you elect not to have income tax withheld, you are liable for paying income tax on the taxable portion of your withdrawal. If you elect not to have income tax withheld or you don’t have enough income tax withheld, you may be responsible for payment of estimated tax. You may incur penalties under the estimated tax rules if your withholding and estimated tax payments are not sufficient. You can reduce or defer the income tax on a distribution by directly or indirectly rolling such distribution over to another IRA or eligible plan. You should consult your tax advisor for additional information.
State tax will be withheld if, at the time of your distribution, your address is within one of the mandatory withholding states and you have federal income tax withheld. State taxes will be withheld from your distribution in accordance with the respective state rules.
Proxy Voting Guidelines
American Century Investment Management, Inc., the fund’s investment advisor, is responsible for exercising the voting rights associated with the securities purchased and/or held by the fund. A description of the policies and procedures the advisor uses in fulfilling this responsibility is available without charge, upon request, by calling 1-800-345-2021. It is also available on American Century Investments’ website at americancentury.com and on the Securities and Exchange Commission’s website at sec.gov. Information regarding how the investment advisor voted proxies relating to portfolio securities during the most recent 12-month period ended June 30 is available on the “About Us” page at americancentury.com. It is also available at sec.gov.
Quarterly Portfolio Disclosure
The fund files its complete schedule of portfolio holdings with the Securities and Exchange Commission (SEC) for the first and third quarters of each fiscal year on Form N-Q. The fund’s Forms N-Q are available on the SEC’s website at sec.gov, and may be reviewed and copied at the SEC’s Public Reference Room in Washington, DC. Information on the operation of the Public Reference Room may be obtained by calling 1-800-SEC-0330. The fund also makes its complete schedule of portfolio holdings for the most recent quarter of its fiscal year available on its website at americancentury.com and, upon request, by calling 1-800-345-2021.
Other Tax Information
The following information is provided pursuant to provisions of the Internal Revenue Code.
The fund hereby designates up to the maximum amount allowable as qualified dividend income for the fiscal year ended July 31, 2012.
For corporate taxpayers, the fund hereby designates $48,085, or up to the maximum amount allowable, of ordinary income distributions paid during the fiscal year ended July 31, 2012 as qualified for the corporate dividends received deduction.
| Contact Us | americancentury.com |
| Automated Information Line | 1-800-345-8765 |
| Investor Services Representative | 1-800-345-2021 or 816-531-5575 |
| Investors Using Advisors | 1-800-378-9878 |
Business, Not-For-Profit, Employer-Sponsored Retirement Plans | 1-800-345-3533 |
Banks and Trust Companies, Broker-Dealers, Financial Professionals, Insurance Companies | 1-800-345-6488 |
| Telecommunications Device for the Deaf | 1-800-634-4113 |
American Century Growth Funds, Inc.
Investment Advisor:
American Century Investment Management, Inc.
Kansas City, Missouri
This report and the statements it contains are submitted for the general information of our shareholders. The report is not authorized for distribution to prospective investors unless preceded or accompanied by an effective prospectus.
©2012 American Century Proprietary Holdings, Inc. All rights reserved.
CL-ANN-76091 1209
ITEM 2. CODE OF ETHICS.
| (a) | The registrant has adopted a Code of Ethics for Senior Financial Officers that applies to the registrant’s principal executive officer, principal financial officer, principal accounting officer, and persons performing similar functions. |
| (f) | The registrant’s Code of Ethics for Senior Financial Officers was filed as Exhibit 12 (a)(1) to American Century Asset Allocation Portfolios, Inc.’s Annual Certified Shareholder Report on Form N-CSR, File No. 811-21591, on September 29, 2005, and is incorporated herein by reference. |
ITEM 3. AUDIT COMMITTEE FINANCIAL EXPERT.
| (a)(1) | The registrant’s board has determined that the registrant has at least one audit committee financial expert serving on its audit committee. |
| (a)(2) | M. Jeannine Strandjord, James A. Olson, Andrea C. Hall and Stephen E. Yates are the registrant’s designated audit committee financial experts. They are “independent” as defined in Item 3 of Form N-CSR. |
ITEM 4. PRINCIPAL ACCOUNTANT FEES AND SERVICES.
The aggregate fees billed for each of the last two fiscal years for professional services rendered by the principal accountant for the audit of the registrant’s annual financial statements or services that are normally provided by the accountant in connection with statutory and regulatory filings or engagements for those fiscal years were as follows:
FY 2011: $46,458
FY 2012: $43,775
The aggregate fees billed in each of the last two fiscal years for assurance and related services by the principal accountant that are reasonably related to the performance of the audit of the registrant’s financial statements and are not reported under paragraph (a) of this Item were as follows:
| | For services rendered to the registrant: |
Fees required to be approved pursuant to paragraph (c)(7)(ii) of Rule 2-01 of Regulation S-X (relating to certain engagements for non-audit services with the registrant’s investment adviser and its affiliates):
The aggregate fees billed in each of the last two fiscal years for professional services rendered by the principal accountant for tax compliance, tax advice, and tax planning were as follows:
| | For services rendered to the registrant: |
FY 2011: $0
FY 2012: $0
Fees required to be approved pursuant to paragraph (c)(7)(ii) of Rule 2-01 of Regulation S-X (relating to certain engagements for non-audit services with the registrant’s investment adviser and its affiliates):
FY 2011: $0
FY 2012: $0
The aggregate fees billed in each of the last two fiscal years for products and services provided by the principal accountant, other than the services reported in paragraphs (a) through (c) of this Item were as follows:
| | For services rendered to the registrant: |
Fees required to be approved pursuant to paragraph (c)(7)(ii) of Rule 2-01 of Regulation S-X (relating to certain engagements for non-audit services with the registrant’s investment adviser and its affiliates):
| (e)(1) | In accordance with paragraph (c)(7)(i)(A) of Rule 2-01 of Regulation S-X, before the accountant is engaged by the registrant to render audit or non-audit services, the engagement is approved by the registrant’s audit committee. Pursuant to paragraph (c)(7)(ii) of Rule 2-01 of Regulation S-X, the registrant’s audit committee also pre-approves its accountant’s engagements for non-audit services with the registrant’s investment adviser, its parent company, and any entity controlled by, or under common control with the investment adviser that provides ongoing services to the registrant, if the engagement relates directly to the operations and financial reporting of the registrant. |
| (e)(2) | All services described in each of paragraphs (b) through (d) of this Item were pre-approved before the engagement by the registrant’s audit committee pursuant to paragraph (c)(7)(i)(A) of Rule 2-01 of Regulation S-X. Consequently, none of such services were required to be approved by the audit committee pursuant to paragraph (c)(7)(i)(C). |
| (f) | The percentage of hours expended on the principal accountant’s engagement to audit the registrant’s financial statements for the most recent fiscal year that were attributed to work performed by persons other than the principal accountant’s full-time, permanent employees was less than 50%. |
| (g) | The aggregate non-audit fees billed by the registrant’s accountant for services rendered to the registrant, and rendered to the registrant’s investment adviser (not including any sub-adviser whose role is primarily portfolio management and is subcontracted with or overseen by another investment adviser), and any entity controlling, controlled by, or under common control with the adviser that provides ongoing services to the registrant for each of the last two fiscal years of the registrant were as follows: |
FY 2011: $64,047
FY 2012: $71,548
| (h) | The registrant’s investment adviser and accountant have notified the registrant’s audit committee of all non-audit services that were rendered by the registrant’s accountant to the registrant’s investment adviser, its parent company, and any entity controlled by, or under common control with the investment adviser that provides services to the registrant, which services were not required to be pre-approved pursuant to paragraph (c)(7)(ii) of Rule 2-01 of Regulation S-X. The notification provided to the registrant’s audit committee included sufficient details regarding such services to allow the registrant’s audit committee to consider the continuing independence of its principal accountant. |
ITEM 5. AUDIT COMMITTEE OF LISTED REGISTRANTS.
Not applicable.
ITEM 6. INVESTMENTS.
| (a) | The schedule of investments is included as part of the report to stockholders filed under Item 1 of this Form. |
ITEM 7. DISCLOSURE OF PROXY VOTING POLICIES AND PROCEDURES FOR CLOSED-END MANAGEMENT INVESTMENT COMPANIES.
Not applicable.
ITEM 8. PORTFOLIO MANAGERS OF CLOSED-END MANAGEMENT INVESTMENT COMPANIES.
Not applicable.
ITEM 9. PURCHASES OF EQUITY SECURITIES BY CLOSED-END MANAGEMENT INVESTMENT COMPANY AND AFFILIATED PURCHASERS.
Not applicable.
ITEM 10. SUBMISSION OF MATTERS TO A VOTE OF SECURITY HOLDERS.
During the reporting period, there were no material changes to the procedures by which shareholders may recommend nominees to the registrant’s board.
ITEM 11. CONTROLS AND PROCEDURES.
| (a) | The registrant's principal executive officer and principal financial officer have concluded that the registrant's disclosure controls and procedures (as defined in Rule 30a-3(c) under the Investment Company Act of 1940) are effective based on their evaluation of these controls and procedures as of a date within 90 days of the filing date of this report. |
| (b) | There were no changes in the registrant's internal control over financial reporting (as defined in Rule 30a-3(d) under the Investment Company Act of 1940) that occurred during the registrant's second fiscal quarter of the period covered by this report that have materially affected, or are reasonably likely to materially affect, the registrant's internal control over financial reporting. |
ITEM 12. EXHIBITS.
| (a)(1) | Registrant’s Code of Ethics for Senior Financial Officers, which is the subject of the disclosure required by Item 2 of Form N-CSR, was filed as Exhibit 12(a)(1) to American Century Asset Allocation Portfolios, Inc.’s Certified Shareholder Report on Form N-CSR, File No. 811-21591, on September 29, 2005. |
| (a)(2) | Separate certifications by the registrant’s principal executive officer and principal financial officer, pursuant to Section 302 of the Sarbanes-Oxley Act of 2002 and Rule 30a-2(a) under the Investment Company Act of 1940, are filed and attached hereto as EX-99.CERT. |
| (b) | A certification by the registrant’s chief executive officer and chief financial officer, pursuant to Section 906 of the Sarbanes-Oxley Act of 2002, is furnished and attached hereto as EX-99.906CERT. |
SIGNATURES
Pursuant to the requirements of the Securities Exchange Act of 1934 and the Investment Company Act of 1940, the registrant has duly caused this report to be signed on its behalf by the undersigned, thereunto duly authorized.
| Registrant: | American Century Growth Funds, Inc. | |
| | | | |
| | | | |
| By: | /s/ Jonathan S. Thomas | |
| | Name: | Jonathan S. Thomas | |
| | Title: | President | |
| | | | |
| Date: | September 28, 2012 | |
| | | |
Pursuant to the requirements of the Securities Exchange Act of 1934 and the Investment Company Act of 1940, this report has been signed below by the following persons on behalf of the registrant and in the capacities and on the dates indicated.
| By: | /s/ Jonathan S. Thomas | |
| | Name: | Jonathan S. Thomas | |
| | Title: | President | |
| | | (principal executive officer) | |
| | | | |
| | | | |
| Date: | September 28, 2012 | |
| By: | /s/ C. Jean Wade | |
| | Name: | C. Jean Wade | |
| | Title: | Vice President, Treasurer, and | |
| | | Chief Financial Officer | |
| | | (principal financial officer) | |
| | | | |
| Date: | September 28, 2012 | |