| | |
| UNITED STATES |
| SECURITIES AND EXCHANGE COMMISSION |
| Washington, D.C. 20549 |
| |
| FORM N-CSR |
|
| CERTIFIED SHAREHOLDER REPORT OF REGISTERED |
| MANAGEMENT INVESTMENT COMPANIES |
| | |
| Investment Company Act file number | 811-21861 |
| |
| AMERICAN CENTURY GROWTH FUNDS, INC. |
| (Exact name of registrant as specified in charter) |
| |
| 4500 MAIN STREET, KANSAS CITY, MISSOURI | 64111 |
| (Address of principal executive offices) | | (Zip Code) |
| |
| CHARLES A. ETHERINGTON |
| 4500 MAIN STREET, KANSAS CITY, MISSOURI 64111 |
| (Name and address of agent for service) |
| |
| Registrant’s telephone number, including area code: | 816-531-5575 |
| Date of fiscal year end: | 07-31 |
| Date of reporting period: | 07-31-2009 |
| | |
| | | |
ITEM 1. REPORTS TO STOCKHOLDERS.
|
| Annual Report |
| July 31, 2009 |

|
| American Century Investments |
Legacy Focused Large Cap Fund
Legacy Large Cap Fund
Legacy Multi Cap Fund

Dear Investor:
Thank you for investing with us during the financial reporting period ended July 31, 2009. We appreciate your trust in American Century Investments® during these challenging times.
The U.S. economy continued to struggle at the close of the reporting period, part of the lingering fallout from the subprime-initiated credit and financial crises and global recession that shook the capital markets during the past two years. The recession has affected everyone—from first-time individual investors to hundred-year-old financial institutions.
However, as we mark the second anniversary of the start of the subprime mortgage meltdown, the worst of the economic and financial market obstacles appear to be behind us. The rate of U.S. economic decline has slowed, as have the drop-offs in housing prices and jobs. Risk appetites returned to the markets in recent months, evidenced by the strong stock rebound since early March.
Risk was a predominant theme during the reporting period, as the investment pendulum swung from risk avoidance to risk acceptance. We believe, however, that caution and risk management are still advisable. We don’t think we’re out of the economic woods yet, not with mortgage and corporate default rates on the rise, housing prices continuing to decline in some regions, and job losses still mounting.
Effective risk management requires a commitment to disciplined investment approaches that balance risk and reward, with the goal of setting and maintaining risk levels that are appropriate for portfolio objectives. At American Century Investments, we’ve stayed true to the principles that have guided us for over 50 years, including our commitment to delivering superior investment performance and helping investors reach their financial goals. Risk management is part of that commitment—we offer portfolios that can help diversify and stabilize investment returns.
The coming months will likely present additional challenges, but I’m certain that we have the investment professionals and processes in place to provide competitive and compelling long-term results for you. Thank you for your continued confidence in us.
Sincerely,

Jonathan S. Thomas
President and Chief Executive Officer
American Century Investments
|
| Independent Chairman’s Letter |
I am Don Pratt, an independent director and chairman of the mutual fund board responsible for the U.S. Growth Equity, U.S. Value Equity, Global and Non-U.S. Equity and Asset Allocation funds managed by American Century Investments. The board consists of seven independent directors and two directors who are affiliated with the investment advisor.
As one of your independent shareholder representatives on the fund board, I plan to write you from time to time with updates on board activities and news about your funds. My co-independent directors and I are committed to putting your interests first. We work closely with American Century Investments on maintaining strong fund performance, providing quality service to shareholders at competitive fees and ensuring ethical business practices and compliance with all applicable fund regulations.
Last year, the board welcomed its newest independent director, John R. Whitten. He is a great addition to an experienced board where, collectively, the independent directors have served the funds for more than 76 years. This continuity served shareholders well as the investment advisor initiated a successful management transition, creating a strong senior leadership team consisting of well-tenured company executives and experienced industry veterans. Under the leadership of President and Chief Executive Officer Jonathan Thomas and Chief Investment Officer Enrique Chang, the firm has made the achievement of superior investment performance its primary focus and the key driver of its success going forward. This focus helped the company generate strong relative performance against the backdrop of 2008’s unprecedented market volatility.
As investors in the American Century funds, my fellow directors and I share your investing experience. We know firsthand how decisions made at the board level affect all shareholders. To further guide our efforts on your behalf, I invite you to send me your comments, questions or suggestions by email to dhpratt@fundboardchair.com. Thank you for allowing me to serve as your advocate on our board.
| |
| Market Perspective | 2 |
| Market Index Total Returns | 2 |
| |
| Legacy Focused Large Cap | |
| |
| Performance | 3 |
| Portfolio Commentary | 5 |
| Top Ten Holdings | 7 |
| Top Five Industries | 7 |
| Types of Investments in Portfolio | 7 |
| |
| Legacy Large Cap | |
| |
| Performance | 8 |
| Portfolio Commentary | 10 |
| Top Ten Holdings | 12 |
| Top Five Industries | 12 |
| Types of Investments in Portfolio | 12 |
| |
| Legacy Multi Cap | |
| |
| Performance | 13 |
| Portfolio Commentary | 15 |
| Top Ten Holdings | 17 |
| Top Five Industries | 17 |
| Types of Investments in Portfolio | 17 |
| |
| Shareholder Fee Examples | 18 |
| |
| Financial Statements | |
| |
| Schedule of Investments | 21 |
| Statement of Assets and Liabilities | 27 |
| Statement of Operations | 28 |
| Statement of Changes in Net Assets | 29 |
| Notes to Financial Statements | 31 |
| Financial Highlights | 39 |
| Report of Independent Registered Public Accounting Firm | 51 |
| |
| Other Information | |
| |
| Management | 52 |
| Approval of Management Agreements | 56 |
| Additional Information | 61 |
| Index Definitions | 62 |
The opinions expressed in the Market Perspective and each of the Portfolio Commentaries reflect those of the portfolio management team as of the date of the report, and do not necessarily represent the opinions of American Century Investments or any other person in the American Century Investments organization. Any such opinions are subject to change at any time based upon market or other conditions and American Century Investments disclaims any responsibility to update such opinions. These opinions may not be relied upon as investment advice and, because investment decisions made by American Century Investments funds are based on numerous factors, may not be relied upon as an indication of trading intent on behalf of any American Century Investments fund. Security examples are used for representational purposes only and are not intended as recommendations to purchase or sell securities. Performance information for com parative indices and securities is provided to American Century Investments by third party vendors. To the best of American Century Investments’ knowledge, such information is accurate at the time of printing.

By Glenn Fogle, Chief Investment Officer, U.S. Growth Equity — Mid & Small Cap
A Historic Market Decline
The U.S. stock market declined sharply for the 12 months ended July 31, 2009, in an environment marked by severe volatility and dramatic shifts in market sentiment. Major equity indices marched downward amid a debilitating credit crunch, extreme turmoil in the financial sector, and a worsening economic downturn.
A deepening liquidity crisis—sparked by the mortgage market collapse in 2007—led to an increasingly urgent need for capital at many financial companies. Following a series of bankruptcies and takeovers in the financial industry in late 2008, the government moved swiftly to provide financial assistance and other support to prevent a full-scale collapse in the financial system. A series of interest cuts by the Federal Reserve in late 2008 ultimately resulted in an unprecedented federal funds rate of 0.00% –0.25%. The government also passed the Emergency Stabilization Act, which authorized the use of $700 billion to purchase distressed assets and make injections of capital into banks.
The credit crisis exacerbated the weakness in the U.S. economy, which had officially entered a recession in December 2007. The unemployment rate surged to its highest level since 1983, consumer spending shrank, and the housing market continued to deteriorate. The difficult financial and economic conditions drove markets down through late 2008 and into early 2009. From the beginning of the reporting period through March 9, 2009, broad equity indices fell by more than 40%.
Early Signs of Recovery
Market conditions shifted markedly in the final months of the reporting period. After sinking to a multi-year low on March 9, 2009, equity markets staged a powerful rebound amid signs of economic stabilization. Further supporting market strength, investors grew confident about the federal government’s actions to stimulate economic activity and restore liquidity in the credit markets.
Despite the rebound in the second half of the reporting period, broad equity indices declined by approximately 20% for the 12-month period, as shown in the table below. Changing perceptions drove much of the rally, but a truly sustainable long-term advance requires significant improvements in economic and company fundamentals, which have yet to materialize.
| |
| Market Index Total Returns | |
| For the 12 months ended July 31, 2009 | |
| U.S. Stocks | |
| Russell 1000 Index (Large-Cap) | -20.17% |
| Russell Midcap Index | -22.22% |
| Russell 2000 Index (Small-Cap) | -20.72% |
| Foreign Stocks | |
| MSCI EAFE (Europe, Australasia, Far East) Index | -22.60% |
| MSCI EM (Emerging Markets) Index | -16.84% |
2
| | | |
| Legacy Focused Large Cap | | | |
| |
| Total Returns as of July 31, 2009 | | | |
| | | Average | |
| | | Annual Returns | |
| | 1 year | Since Inception | Inception Date |
| Investor Class | -30.92% | -4.18% | 5/31/06 |
| S&P 500 Index(1) | -19.96% | -5.62% | — |
| Russell 1000 Growth Index(1) | -17.57% | -3.22% | — |
| Institutional Class | -30.73% | -3.98% | 5/31/06 |
| Advisor Class | -31.06% | -4.41% | 5/31/06 |
| R Class | -31.28% | -4.67% | 5/31/06 |
| (1) Data provided by Lipper Inc. — A Reuters Company. © 2009 Reuters. All rights reserved. Any copying, republication or redistribution of Lipper |
| content, including by caching, framing or similar means, is expressly prohibited without the prior written consent of Lipper. Lipper shall not be |
| liable for any errors or delays in the content, or for any actions taken in reliance thereon. | | |
| The data contained herein has been obtained from company reports, financial reporting services, periodicals and other resources believed to be |
| reliable. Although carefully verified, data on compilations is not guaranteed by Lipper and may be incomplete. No offer or solicitations to buy or |
| sell any of the securities herein is being made by Lipper. | | | |
Data presented reflect past performance. Past performance is no guarantee of future results. Current performance may be higher or lower than the performance shown. Investment return and principal value will fluctuate, and redemption value may be more or less than original cost. To obtain performance data current to the most recent month end, please call 1-800-345-2021 or visit americancentury.com. The fund is considered nondiversified, which may subject the fund to risk because a price change in any one security may have a greater impact than would be the case if the fund were diversified. The fund’s investment process may also result in high portfolio turnover, which could mean high transaction costs, affecting both performance and capital gains tax liabilities to investors. International investing involves special risks, such as political instability and currency fluctuations.
Unless otherwise indicated, performance reflects Investor Class shares; performance for other share classes will vary due to differences in fee structure. For information about other share classes available, please consult the prospectus. Data assumes reinvestment of dividends and capital gains, and none of the charts reflect the deduction of taxes that a shareholder would pay on fund distributions or the redemption of fund shares. Returns for the indices are provided for comparison. The fund’s total returns include operating expenses (such as transaction costs and management fees) that reduce returns, while the total returns of the indices do not.
3
Legacy Focused Large Cap
| | | | |
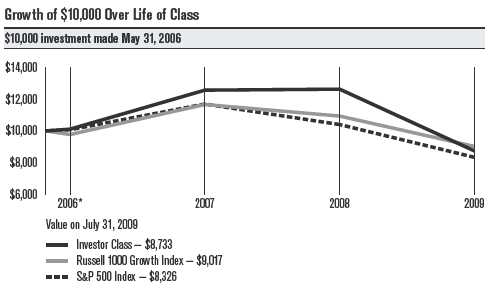
| One-Year Returns Over Life of Class | | | |
| Periods ended July 31 | | | | |
| | 2006* | 2007 | 2008 | 2009 |
| Investor Class | 1.10% | 24.44% | 0.49% | -30.92% |
| S&P 500 Index | 0.75% | 16.13% | -11.09% | -19.96% |
| Russell 1000 Growth Index | -2.29% | 19.47% | -6.29% | -17.57% |
| *From 5/31/06, the Investor Class’s inception date. Not annualized. | | | |
| |
| Total Annual Fund Operating Expenses | | | |
| Investor Class | Institutional Class | Advisor Class | R Class |
| 1.11% | 0.91% | 1.36% | 1.61% |
The total annual fund operating expenses shown is as stated in the fund’s prospectus current as of the date of this report. The prospectus may vary from the expense ratio shown elsewhere in this report because it is based on a different time period, includes acquired fund fees and expenses, and, if applicable, does not include fee waivers or expense reimbursements.
Data presented reflect past performance. Past performance is no guarantee of future results. Current performance may be higher or lower than the performance shown. Investment return and principal value will fluctuate, and redemption value may be more or less than original cost. To obtain performance data current to the most recent month end, please call 1-800-345-2021 or visit americancentury.com. The fund is considered nondiversified, which may subject the fund to risk because a price change in any one security may have a greater impact than would be the case if the fund were diversified. The fund’s investment process may also result in high portfolio turnover, which could mean high transaction costs, affecting both performance and capital gains tax liabilities to investors. International investing involves special risks, such as political instability and currency fluctuations.
Unless otherwise indicated, performance reflects Investor Class shares; performance for other share classes will vary due to differences in fee structure. For information about other share classes available, please consult the prospectus. Data assumes reinvestment of dividends and capital gains, and none of the charts reflect the deduction of taxes that a shareholder would pay on fund distributions or the redemption of fund shares. Returns for the indices are provided for comparison. The fund’s total returns include operating expenses (such as transaction costs and management fees) that reduce returns, while the total returns of the indices do not.
4
Legacy Focused Large Cap
Portfolio Managers: John T. Small Jr. and Stephen Pool
Performance Summary
Legacy Focused Large Cap declined -30.92%* for the 12 months ended July 31, 2009, compared with a -19.96% decline for the portfolio’s benchmark, the S&P 500 Index. The Russell 1000 Growth Index fell -17.57%.
As discussed in the Market Perspective on page 2, U.S. stock indices fell during the reporting period amid a volatile market climate, ongoing credit crisis, and economic recession. The last five months of the period featured a rally in lower-quality stocks with weak balance sheets, poor to negative earnings and cash flow, and negative price momentum. This is at odds with our investment approach, which centers on owning companies that exhibit accelerating earnings and revenues and where the market recognizes this by way of share-price momentum.
Within the portfolio, stock selection in the consumer staples, materials and industrials sectors accounted for the bulk of underperformance relative to the benchmark. An overweight allocation to IT stocks partially offset those losses, and an underweight allocation in the financials sector benefited relative performance.
The portfolio also maintained a significant allocation to foreign stocks. These holdings detracted from performance.
Consumer Staples Led Underperformance
The consumer staples sector was Legacy Focused Large Cap’s largest source of underperformance relative to the benchmark. Here, a detrimental allocation to the food products group reflected overweight stakes in Campbell Soup Company, Kellogg Company, and General Mills Inc. All three holdings hurt relative returns as they experienced larger share price declines during the time they were held in the portfolio than for the entire reporting period. Underweight allocations elsewhere in the sector, including food and staples retailers and tobacco companies, also hurt performance.
Materials, Industrials Detracted
The materials sector was home to relative underperformance. Within the chemicals industry, the portfolio focused on fertilizer companies Mosaic Co. and Canada-based Potash Corp. of Saskatchewan Inc., which are not benchmark constituents. The companies have both benefited in past reporting periods from secularly higher demand in the fertilizer market, driven by a higher standard of living in emerging markets, a lower availability of farmland, and a greater global focus on biofuels. During the reporting period, though, declining demand for fertilizer resulted in lower commodity prices, driving the companies’ share prices down.
*All fund returns referenced in this commentary are for Investor Class shares.
5
Legacy Focused Large Cap
Within the industrials sector, Legacy Focused Large Cap maintained overweight positions in railroad companies, including Norfolk Southern. This industry has experienced improving fundamentals as higher fuel prices created an advantage for the more fuel-efficient railroads versus trucking companies, and as coal shipments continued to increase. During the reporting period, however, these positions detracted from absolute and relative returns.
Information Technology Hindered Results
Although the portfolio’s overweight in the information technology sector contributed to relative returns, select holdings detracted. Research In Motion, which is not a benchmark constituent, experienced a drop in its share price amid concerns that the maker of the Blackberry hand-held device might not be able to maintain momentum in the sluggish economic environment.
Financials, Consumer Discretionary Contributed
The portfolio’s underweight in the financials sector reflected relatively smaller allocations to the insurance and diversified financial services group. Legacy Focused Large Cap was rewarded as these industry groups suffered significant declines. Within the diversified financial services group, in particular, the portfolio avoided Citigroup Inc. and Bank of America Corp., whose share prices declined 83% and 53%, respectively, in the benchmark.
An overweight in the capital markets industry included a stake in Germany-based Deutsche Bank AG, which is not represented in the benchmark. The position helped both absolute and relative performance, as the bank’s share price gained 37% for the time it was held in the portfolio, despite suffering double-digit declines for the entire reporting period.
Outlook
We are cautiously optimistic in our market outlook. Although markets have rebounded in the past several months, we continue to look for more meaningful improvements in economic conditions. Regardless of conditions, Legacy Focused Large Cap employs financial acceleration and price momentum screens to identify investment opportunities in any given economic environment. As always, it will employ a quantitative model to exploit large-cap investment opportunities across the growth and value spectrums.
6
| | | |
| Legacy Focused Large Cap | | |
| |
| Top Ten Holdings as of July 31, 2009 | | |
| | | % of net assets | % of net assets |
| | | as of 7/31/09 | as of 1/31/09 |
| Baidu, Inc. ADR | 4.1% | — |
| Goldman Sachs Group, Inc. (The) | 4.0% | — |
| Cia de Bebidas das Americas, Preference Shares ADR | 3.9% | — |
| Amazon.com, Inc. | 3.9% | — |
| Apple, Inc. | 3.9% | — |
| Texas Instruments, Inc. | 3.7% | — |
| Franklin Resources, Inc. | 3.7% | — |
| Deutsche Bank AG | 3.7% | — |
| Freeport-McMoRan Copper & Gold, Inc. | 3.6% | — |
| TJX Cos., Inc. (The) | 3.5% | — |
| |
| Top Five Industries as of July 31, 2009 | | |
| | | % of net assets | % of net assets |
| | | as of 7/31/09 | as of 1/31/09 |
| Capital Markets | 21.0% | — |
| Internet Software & Services | 7.2% | — |
| Beverages | 6.7% | — |
| Semiconductors & Semiconductor Equipment | 6.7% | — |
| Metals & Mining | 6.3% | 6.5% |
| |
| Types of Investments in Portfolio | | |
| | | % of net assets | % of net assets |
| | | as of 7/31/09 | as of 1/31/09 |
| Domestic Common Stocks | 63.2% | 83.7% |
| Foreign Common Stocks(1) | 36.0% | 16.3% |
| Total Common Stocks | 99.2% | 100.0% |
| Other Assets and Liabilities | 0.8% | —(2) |
| (1) | Includes depositary shares, dual listed securities and foreign ordinary shares. | | |
| (2) | Category is less than 0.05% of total net assets. | | |
7
| | | |
| Legacy Large Cap | | | |
| |
| Total Returns as of July 31, 2009 | | | |
| | | Average | |
| | | Annual Returns | |
| | 1 year | Since Inception | Inception Date |
| Investor Class | -28.45% | -3.88% | 5/31/06 |
| S&P 500 Index(1) | -19.96% | -5.62% | — |
| Russell 1000 Growth Index(1) | -17.57% | -3.22% | — |
| Institutional Class | -28.34% | -3.72% | 5/31/06 |
| Advisor Class | -28.67% | -4.15% | 5/31/06 |
| R Class | -28.81% | -4.37% | 5/31/06 |
| (1) | Data provided by Lipper Inc. — A Reuters Company. © 2009 Reuters. All rights reserved. Any copying, republication or redistribution of Lipper content, including by caching, framing or similar means, is expressly prohibited without the prior written consent of Lipper. Lipper shall not be liable for any errors or delays in the content, or for any actions taken in reliance thereon. |
| | The data contained herein has been obtained from company reports, financial reporting services, periodicals and other resources believed to be reliable. Although carefully verified, data on compilations is not guaranteed by Lipper and may be incomplete. No offer or solicitations to buy or sell any of the securities herein is being made by Lipper. |
Data presented reflect past performance. Past performance is no guarantee of future results. Current performance may be higher or lower than the performance shown. Investment return and principal value will fluctuate, and redemption value may be more or less than original cost. To obtain performance data current to the most recent month end, please call 1-800-345-2021 or visit americancentury.com. The fund’s investment process may also result in high portfolio turnover, which could mean high transaction costs, affecting both performance and capital gains tax liabilities to investors. International investing involves special risks, such as political instability and currency fluctuations.
Unless otherwise indicated, performance reflects Investor Class shares; performance for other share classes will vary due to differences in fee structure. For information about other share classes available, please consult the prospectus. Data assumes reinvestment of dividends and capital gains, and none of the charts reflect the deduction of taxes that a shareholder would pay on fund distributions or the redemption of fund shares. Returns for the indices are provided for comparison. The fund’s total returns include operating expenses (such as transaction costs and management fees) that reduce returns, while the total returns of the indices do not.
8
Legacy Large Cap

| | | | |
| One-Year Returns Over Life of Class | | | |
| Periods ended July 31 | | | | |
| | 2006* | 2007 | 2008 | 2009 |
| Investor Class | 1.50% | 17.83% | 3.07% | -28.45% |
| S&P 500 Index | 0.75% | 16.13% | -11.09% | -19.96% |
| Russell 1000 Growth Index | -2.29% | 19.47% | -6.29% | -17.57% |
| *From 5/31/06, the Investor Class’s inception date. Not annualized. | | | |
| |
| Total Annual Fund Operating Expenses | | | |
| Investor Class | Institutional Class | Advisor Class | R Class |
| 1.11% | 0.91% | 1.36% | 1.61% |
The total annual fund operating expenses shown is as stated in the fund’s prospectus current as of the date of this report. The prospectus may vary from the expense ratio shown elsewhere in this report because it is based on a different time period, includes acquired fund fees and expenses, and, if applicable, does not include fee waivers or expense reimbursements.
Data presented reflect past performance. Past performance is no guarantee of future results. Current performance may be higher or lower than the performance shown. Investment return and principal value will fluctuate, and redemption value may be more or less than original cost. To obtain performance data current to the most recent month end, please call 1-800-345-2021 . or visit americancentury.com. The fund’s investment process may also result in high portfolio turnover, which could mean high transaction costs, affecting both performance and capital gains tax liabilities to investors. International investing involves special risks, such as politic al instability and currency fluctuations.
Unless otherwise indicated, performance reflects Investor Class shares; performance for other share classes will vary due to differences in fee structure. For information about other share classes available, please consult the prospectus. Data assumes reinvestment of dividends and capital gains, and none of the charts reflect the deduction of taxes that a shareholder would pay on fund distributions or the redemption of fund shares. Returns for the indices are provided for comparison. The fund’s total returns include operating expenses (such as transaction costs and management fees) that reduce returns, while the total returns of the indices do not.
9
Legacy Large Cap
Portfolio Managers: John T. Small Jr. and Stephen Pool
Performance Summary
Legacy Large Cap declined -28.45%* for the 12 months ended July 31, 2009, underperforming the -19.96% decline of the portfolio’s benchmark, the S&P 500 Index and the -17.57% decline of the Russell 1000 Growth Index.
As discussed in the Market Perspective on page 2, U.S. stock indices fell during the reporting period amid a volatile market climate, ongoing credit crisis, and economic recession. The last five months of the period featured a rally in lower-quality stocks with weak balance sheets, poor to negative earnings and cash flow, and negative price momentum. This is at odds with our investment approach, which centers on owning companies that exhibit accelerating earnings and revenues and where the market recognizes this by way of share-price momentum.
Stock selection in the information technology and materials sectors accounted for the bulk of Legacy Large Cap’s underperformance relative to the benchmark. Holdings in the industrials and financials sectors also weighed on relative returns. An effective mix of energy stocks only partially offset those losses.
The portfolio also maintained a significant allocation to foreign stocks. These holdings detracted from performance.
Information Technology, Materials Led Underperformance
Holdings in the information technology sector weighed on performance, particularly within the software and semiconductor industry groups. The portfolio’s overweight stake in VMware Inc. hurt returns relative to the benchmark as the virtualization software producer’s share price declined modestly during the reporting period. The portfolio also held a detrimental stake in semiconductor company STMicroelectronics, which is not a benchmark constituent.
The materials sector also was a key source of Legacy Large Cap’s relative underperformance. Within the sector, the portfolio maintained a stake in Brazilian steel producer Gerdau SA, which had been a significant contributor to returns in the past amid rising steel prices. During the reporting period, though, Gerdau’s share price fell as demand and prices for steel both weakened.
Also in the materials sector, the portfolio maintained an underweight stake in the chemicals industry which included Canadian fertilizer company Potash Corp. of Saskatchewan Inc. The company is one of several holdings that have formerly benefited from burgeoning demand for fertilizer, driven by a higher standard of living in emerging markets, a lower availability of farmland, and a greater global focus on biofuels. During the past 12 months, however, declining demand for fertilizer resulted in lower commodity prices, driving the company’s share price down.
*All fund returns referenced in this commentary are for Investor Class shares.
10
Legacy Large Cap
Industrials, Financials Detracted
The industrials sector was home to several holdings that weighed on relative performance. Holdings in the aerospace and defense industry focused on defense contractors, including Lockheed Martin.
Elsewhere in the industrials sector, Legacy Large Cap maintained overweight positions in railroad companies, including Union Pacific. This industry has experienced improving fundamentals as higher fuel prices created an advantage for the more fuel efficient railroads versus trucking companies, and as coal shipments continued to increase. More recently, though, these positions detracted from absolute and relative returns.
Stock picks in the financials sector also hurt performance relative to the benchmark. The portfolio held a stake in MetLife, which is not represented in the benchmark. The insurer’s earnings fell amid declining revenue from premiums and lower investment income.
Energy Helped
In the energy sector, a substantial underweighting in companies involved in equipment and services benefited returns. Within the group, the portfolio held an overweight in National Oilwell Varco. Although the company’s share price tumbled more than 50% in the benchmark for the 12-month period, it gained 35% during the time it was held in the portfolio. Avoiding oil services company Schlumberger also contributed meaningfully to relative performance.
Outlook
We are cautiously optimistic in our market outlook. Although markets have rebounded in the past several months, we continue to look for more meaningful improvements in economic conditions. Regardless of conditions, Legacy Large Cap employs financial acceleration and price momentum screens to identify investment opportunities in any given economic environment. As always, it will employ a quantitative model to exploit large-cap investment opportunities across the growth and value spectrums.
11
| | |
| Legacy Large Cap | | |
| |
| Top Ten Holdings as of July 31, 2009 | | |
| | % of net assets | % of net assets |
| | as of 7/31/09 | as of 1/31/09 |
| Research In Motion Ltd. | 3.4% | 2.9% |
| Apple, Inc. | 3.0% | — |
| International Business Machines Corp. | 2.8% | 2.3% |
| Freeport-McMoRan Copper & Gold, Inc. | 2.7% | — |
| MasterCard, Inc., Class A | 2.6% | 2.0% |
| Baidu, Inc. ADR | 2.6% | — |
| Yum! Brands, Inc. | 2.5% | 2.1% |
| Telefonaktiebolaget LM Ericsson ADR | 2.4% | 2.1% |
| Enersis SA ADR | 2.4% | — |
| Texas Instruments, Inc. | 2.4% | — |
| |
| Top Five Industries as of July 31, 2009 | | |
| | % of net assets | % of net assets |
| | as of 7/31/09 | as of 1/31/09 |
| Capital Markets | 10.7% | — |
| Pharmaceuticals | 8.2% | 11.6% |
| Communications Equipment | 7.9% | 6.7% |
| Health Care Providers & Services | 6.3% | — |
| IT Services | 5.4% | 8.7% |
| |
| Types of Investments in Portfolio | | |
| | % of net assets | % of net assets |
| | as of 7/31/09 | as of 1/31/09 |
| Domestic Common Stocks | 61.9% | 80.1% |
| Foreign Common Stocks(1) | 35.5% | 19.5% |
| Total Common Stocks | 97.4% | 99.6% |
| Temporary Cash Investments | 2.5% | 0.4% |
| Other Assets and Liabilities | 0.1% | —(2) |
| (1) | Includes depositary shares, dual listed securities and foreign ordinary shares. |
| (2) | Category is less than 0.05% of total net assets. |
12
| | | |
| Legacy Multi Cap | | | |
| |
| Total Returns as of July 31, 2009 | | | |
| | | Average | |
| | | Annual Returns | |
| | 1 year | Since Inception | Inception Date |
| Investor Class | -33.53% | -7.10% | 5/31/06 |
| Russell 3000 Index(1) | -20.21% | -5.67% | — |
| Russell 3000 Growth Index(1) | -17.82% | -3.39% | — |
| Institutional Class | -33.42% | -6.91% | 5/31/06 |
| Advisor Class | -33.76% | -7.36% | 5/31/06 |
| R Class | -33.94% | -7.63% | 5/31/06 |
| (1) | Data provided by Lipper Inc. — A Reuters Company. © 2009 Reuters. All rights reserved. Any copying, republication or redistribution of Lipper content, including by caching, framing or similar means, is expressly prohibited without the prior written consent of Lipper. Lipper shall not be liable for any errors or delays in the content, or for any actions taken in reliance thereon. |
| | The data contained herein has been obtained from company reports, financial reporting services, periodicals and other resources believed to be reliable. Although carefully verified, data on compilations is not guaranteed by Lipper and may be incomplete. No offer or solicitations to buy or sell any of the securities herein is being made by Lipper. |
Data presented reflect past performance. Past performance is no guarantee of future results. Current performance may be higher or lower than the performance shown. Investment return and principal value will fluctuate, and redemption value may be more or less than original cost. To obtain performance data current to the most recent month end, please call 1-800-345-2021 or visit americancentury.com. Historically, small company stocks have been more volatile than the stocks of larger, more established companies. The fund’s investment process may also result in high portfolio turnover, which could mean high transaction costs, affecting both performance and capital gains tax liabilities to investors. International investing involves special risks, such as political instability and currency fluctuations.
Unless otherwise indicated, performance reflects Investor Class shares; performance for other share classes will vary due to differences in fee structure. For information about other share classes available, please consult the prospectus. Data assumes reinvestment of dividends and capital gains, and none of the charts reflect the deduction of taxes that a shareholder would pay on fund distributions or the redemption of fund shares. Returns for the indices are provided for comparison. The fund’s total returns include operating expenses (such as transaction costs and management fees) that reduce returns, while the total returns of the indices do not.
13
Legacy Multi Cap

| | | | |
| One-Year Returns Over Life of Class | | | |
| Periods ended July 31 | | | | |
| | 2006* | 2007 | 2008 | 2009 |
| Investor Class | -0.60% | 27.21% | -5.78% | -33.53% |
| Russell 3000 Index | 0.08% | 16.08% | -10.32% | -20.21% |
| Russell 3000 Growth Index | -2.54% | 19.24% | -6.11% | -17.82% |
| *From 5/31/06, the Investor Class’s inception date. Not annualized. | | | |
| |
| Total Annual Fund Operating Expenses | | | |
| Investor Class | Institutional Class | Advisor Class | R Class |
| 1.16% | 0.96% | 1.41% | 1.66% |
The total annual fund operating expenses shown is as stated in the fund’s prospectus current as of the date of this report. The prospectus may vary from the expense ratio shown elsewhere in this report because it is based on a different time period, includes acquired fund fees and expenses, and, if applicable, does not include fee waivers or expense reimbursements.
Data presented reflect past performance. Past performance is no guarantee of future results. Current performance may be higher or lower than the performance shown. Investment return and principal value will fluctuate, and redemption value may be more or less than original cost. To obtain performance data current to the most recent month end, please call 1-800-345-2021 or visit americancentury.com. Historically, small company stocks have been more volatile than the stocks of larger, more established companies. The fund’s investment process may also result in high portfolio turnover, which could mean high transaction costs, affecting both performance and capital gains tax liabilities to investors. International invest ing involves special risks, such as political instability and currency fluctuations.
Unless otherwise indicated, performance reflects Investor Class shares; performance for other share classes will vary due to differences in fee structure. For information about other share classes available, please consult the prospectus. Data assumes reinvestment of dividends and capital gains, and none of the charts reflect the deduction of taxes that a shareholder would pay on fund distributions or the redemption of fund shares. Returns for the indices are provided for comparison. The fund’s total returns include operating expenses (such as transaction costs and management fees) that reduce returns, while the total returns of the indices do not.
14
Legacy Multi Cap
Portfolio Managers: John T. Small Jr. and Stephen Pool
Performance Summary
Legacy Multi Cap declined -33.53%* for the 12 months ended July 31, 2009, lagging its benchmark, the Russell 3000 Index, which declined -20.21%.
As discussed in the Market Perspective on page 2, U.S. stock indices fell during the reporting period amid a volatile market climate, ongoing credit crisis, and economic recession. The last five months of the period featured a rally in lower-quality stocks with weak balance sheets, poor to negative earnings and cash flow, and negative price momentum. This is at odds with our investment approach, which centers on owning companies that exhibit accelerating earnings and revenues and where the market recognizes this by way of share-price momentum.
Holdings in the consumer discretionary, information technology, and industrials sectors accounted for the bulk of Legacy Multi Cap’s under-performance relative to its benchmark. An overweight allocation to the materials sector further trimmed relative returns. Effective stock selection in the utilities sector partially offset those losses.
The portfolio also maintained a significant allocation to foreign stocks. These holdings detracted from performance.
Consumer Discretionary, Information Technology Led Underperformance
An overweight stake in the consumer discretionary sector reflected a focus on private education companies. Although these companies as a group had benefited from expanding student enrollments in previous reporting periods as a result of corporate layoffs and fewer job opportunities, their share prices were hurt as investors seemed willing to move toward more aggressive holdings late in the reporting period. Overweight stakes in DeVry Inc. and ITT Educational Services Inc., in particular, were among the portfolio’s largest detractors.
Elsewhere in the consumer discretionary sector, media holdings also hurt performance. China-based VisionChina Media Inc., which operates advertising networks using mobile digital television broadcasts on public transportation systems, curbed absolute and relative returns as its share price sank.
The information technology sector was also a meaningful source of underperformance for Legacy Multi Cap. An underweight allocation to the semiconductor industry and companies involved in computers and peripherals, coupled with ineffective security selection within both industries, trimmed performance relative to the benchmark.
*All fund returns referenced in this commentary are for Investor Class shares.
15
Legacy Multi Cap
Industrials, Materials Detracted
In the industrials sector, Legacy Multi Cap maintained overweight positions in railroad companies, including Norfolk Southern Corp. This industry has experienced improving fundamentals as higher fuel prices created an advantage for the more fuel efficient railroads versus trucking companies, and as coal shipments continued to increase. More recently, however, these positions collectively detracted from absolute and relative returns.
Industrials holding DXP Enterprises also weighed on performance. The provider of pumping solutions to end users in the oil and gas and general manufacturing industries experienced a steep drop in its share price due to soft demand.
Within the materials sector, Legacy Multi Cap focused on the metals and mining industry and chemical companies. In the metals and mining group, steel company Cliffs Natural Resources (formerly Cleveland-Cliffs) detracted from absolute and relative performance. The company, which produces iron ore pellets for steel manufacturers, has contributed to the portfolio’s returns in the past amid rising prices for iron ore. During the reporting period, though, its share price fell significantly as demand and prices for iron ore both declined.
Picks in Utilities Helped
Holdings in the utilities sector benefited portfolio returns relative to the benchmark. Overweight stakes in Florida-based electric utility FPL Group Inc., in particular, boosted relative performance. An underweight position in Exelon Corp., which delivers electricity to customers in Illinois and Pennsylvania, also helped relative performance, as the company’s share price lost ground during the period.
Outlook
We are cautiously optimistic in our market outlook. Although markets have rebounded in the past several months, we continue to look for more meaningful improvements in economic conditions. Regardless of conditions, Legacy Multi Cap employs financial acceleration and price momentum characteristics to identify investment opportunities in any given economic environment. As always, it will employ a quantitative model to exploit investment opportunities across the growth and value spectrum.
16
| | |
| Legacy Multi Cap | | |
| |
| Top Ten Holdings as of July 31, 2009 | | |
| | % of net assets | % of net assets |
| | as of 7/31/09 | as of 1/31/09 |
| Strayer Education, Inc. | 2.1% | 2.4% |
| Walter Energy, Inc. | 1.9% | — |
| DreamWorks Animation SKG, Inc., Class A | 1.9% | 1.5% |
| Teck Resources Ltd., Class B | 1.8% | — |
| DCP Midstream Partners LP | 1.8% | — |
| McAfee, Inc. | 1.7% | 1.3% |
| Tessera Technologies, Inc. | 1.5% | — |
| Aflac, Inc. | 1.5% | — |
| Kirkland’s, Inc. | 1.5% | — |
| Anaren, Inc. | 1.4% | 1.1% |
| |
| Top Five Industries as of July 31, 2009 | | |
| | % of net assets | % of net assets |
| | as of 7/31/09 | as of 1/31/09 |
| Insurance | 15.4% | 6.7% |
| Health Care Providers & Services | 7.3% | 8.6% |
| Pharmaceuticals | 5.5% | 8.0% |
| Software | 4.8% | 1.9% |
| Metals & Mining | 4.7% | 0.8% |
| |
| Types of Investments in Portfolio | | |
| | % of net assets | % of net assets |
| | as of 7/31/09 | as of 1/31/09 |
| Domestic Common Stocks | 78.2% | 90.6% |
| Foreign Common Stocks(1) | 20.4% | 9.1% |
| Total Common Stocks | 98.6% | 99.7% |
| Temporary Cash Investments | 0.7% | 0.3% |
| Other Assets and Liabilities | 0.7% | —(2) |
| (1) | Includes depositary shares, dual listed securities and foreign ordinary shares. |
| (2) | Category is less than 0.05% of total net assets. |
17
|
| Shareholder Fee Examples (Unaudited) |
Fund shareholders may incur two types of costs: (1) transaction costs, including sales charges (loads) on purchase payments and redemption/ exchange fees; and (2) ongoing costs, including management fees; distribution and service (12b-1) fees; and other fund expenses. This example is intended to help you understand your ongoing costs (in dollars) of investing in your fund and to compare these costs with the ongoing cost of investing in other mutual funds.
The example is based on an investment of $1,000 made at the beginning of the period and held for the entire period from February 1, 2009 to July 31, 2009.
Actual Expenses
The table provides information about actual account values and actual expenses for each class. You may use the information, together with the amount you invested, to estimate the expenses that you paid over the period. First, identify the share class you own. Then simply divide your account value by $1,000 (for example, an $8,600 account value divided by $1,000 = 8.6), then multiply the result by the number under the heading “Expenses Paid During Period” to estimate the expenses you paid on your account during this period.
If you hold Investor Class shares of any American Century Investments fund, or Institutional Class shares of the American Century Diversified Bond Fund, in an American Century Investments account (i.e., not a financial intermediary or retirement plan account), American Century Investments may charge you a $12.50 semiannual account maintenance fee if the value of those shares is less than $10,000. We will redeem shares automatically in one of your accounts to pay the $12.50 fee. In determining your total eligible investment amount, we will include your investments in all personal accounts (including American Century Investments Brokerage accounts) registered under your Social Security number. Personal accounts include individual accounts, joint accounts, UGMA/UTMA accounts, personal trusts, Coverdell Education Savings Accounts and IRAs (including traditional, Roth, Rollover, SEP-, SARSEP- and SIMPLE-IRAs), and certain other retirement accounts. If you have only business, business retirement, employer-sponsored or American Century Investments Brokerage accounts, you are currently not subject to this fee. We will not charge the fee as long as you choose to manage your accounts exclusively online. If you are subject to the Account Maintenance Fee, your account value could be reduced by the fee amount.
Hypothetical Example for Comparison Purposes
The table also provides information about hypothetical account values and hypothetical expenses based on the actual expense ratio of each class of your fund and an assumed rate of return of 5% per year before expenses, which is not the actual return of a fund’s share class. The hypothetical account values and expenses may not be used to estimate the actual ending account balance or expenses you paid for the period. You may use this information to compare the ongoing costs of investing in your fund and other funds. To do so, compare this 5% hypothetical example with the 5% hypothetical examples that appear in the shareholder reports of the other funds.
18
Please note that the expenses shown in the table are meant to highlight your ongoing costs only and do not reflect any transactional costs, such as sales charges (loads) or redemption/exchange fees. Therefore, the table is useful in comparing ongoing costs only, and will not help you determine the relative total costs of owning different funds. In addition, if these transactional costs were included, your costs would have been higher.
| | | | |
| | Beginning | Ending | Expenses Paid | |
| | Account Value | Account Value | During Period* | Annualized |
| | 2/1/09 | 7/31/09 | 2/1/09 – 7/31/09 | Expense Ratio* |
| Legacy Focused Large Cap | | | |
| Actual | | | | |
| Investor Class | $1,000 | $1,123.00 | $5.79 | 1.10% |
| Institutional Class | $1,000 | $1,124.00 | $4.74 | 0.90% |
| Advisor Class | $1,000 | $1,122.00 | $7.10 | 1.35% |
| R Class | $1,000 | $1,119.60 | $8.41 | 1.60% |
| Hypothetical | | | | |
| Investor Class | $1,000 | $1,019.34 | $5.51 | 1.10% |
| Institutional Class | $1,000 | $1,020.33 | $4.51 | 0.90% |
| Advisor Class | $1,000 | $1,018.10 | $6.76 | 1.35% |
| R Class | $1,000 | $1,016.86 | $8.00 | 1.60% |
| Legacy Large Cap | | | | |
| Actual | | | | |
| Investor Class | $1,000 | $1,143.30 | $5.85 | 1.10% |
| Institutional Class | $1,000 | $1,142.90 | $4.78 | 0.90% |
| Advisor Class | $1,000 | $1,140.90 | $7.17 | 1.35% |
| R Class | $1,000 | $1,139.90 | $8.49 | 1.60% |
| Hypothetical | | | | |
| Investor Class | $1,000 | $1,019.34 | $5.51 | 1.10% |
| Institutional Class | $1,000 | $1,020.33 | $4.51 | 0.90% |
| Advisor Class | $1,000 | $1,018.10 | $6.76 | 1.35% |
| R Class | $1,000 | $1,016.86 | $8.00 | 1.60% |
| * | Expenses are equal to the class’s annualized expense ratio listed in the table above, multiplied by the average account value over the period, multiplied by 181, the number of days in the most recent fiscal half-year, divided by 365, to reflect the one-half year period. |
19
| | | | |
| | Beginning | Ending | Expenses Paid | |
| | Account Value | Account Value | During Period* | Annualized |
| | 2/1/09 | 7/31/09 | 2/1/09 – 7/31/09 | Expense Ratio* |
| Legacy Multi Cap | | | | |
| Actual | | | | |
| Investor Class | $1,000 | $1,117.60 | $6.04 | 1.15% |
| Institutional Class | $1,000 | $1,118.60 | $4.99 | 0.95% |
| Advisor Class | $1,000 | $1,115.40 | $7.34 | 1.40% |
| R Class | $1,000 | $1,113.20 | $8.65 | 1.65% |
| Hypothetical | | | | |
| Investor Class | $1,000 | $1,019.09 | $5.76 | 1.15% |
| Institutional Class | $1,000 | $1,020.08 | $4.76 | 0.95% |
| Advisor Class | $1,000 | $1,017.85 | $7.00 | 1.40% |
| R Class | $1,000 | $1,016.61 | $8.25 | 1.65% |
| * | Expenses are equal to the class’s annualized expense ratio listed in the table above, multiplied by the average account value over the period, multiplied by 181, the number of days in the most recent fiscal half-year, divided by 365, to reflect the one-half year period. |
20
| | | | | | |
| Legacy Focused Large Cap | | | | |
| |
| JULY 31, 2009 | | | | | | |
| |
| | Shares | Value | | | Shares | Value |
| Common Stocks — 99.2% | | | METALS & MINING — 6.3% | | |
| | | | | Freeport-McMoRan | | |
| BEVERAGES — 6.7% | | | | Copper & Gold, Inc. | 8,124 | $ 489,877 |
| Cia de Bebidas das Americas, | | | | Sterlite Industries India Ltd. ADR | 28,650 | 379,613 |
| Preference Shares ADR | 7,667 | $ 539,220 | | | | |
| Coca-Cola Enterprises, Inc. | 20,575 | 386,604 | | | | 869,490 |
| | | 925,824 | | ROAD & RAIL — 3.3% | | |
| CAPITAL MARKETS — 21.0% | | | | CSX Corp. | 11,414 | 457,930 |
| | | | | SEMICONDUCTORS & | | |
| BlackRock, Inc. | 2,351 | 447,959 | | SEMICONDUCTOR EQUIPMENT — 6.7% | |
| Credit Suisse Group AG ADR | 9,276 | 439,404 | | Taiwan Semiconductor | | |
| Deutsche Bank AG | 7,893 | 512,256 | | Manufacturing Co. Ltd. ADR | 38,583 | 403,964 |
| Franklin Resources, Inc. | 5,789 | 513,368 | | Texas Instruments, Inc. | 21,366 | 513,852 |
| Goldman Sachs | | | | | | 917,816 |
| Group, Inc. (The) | 3,339 | 545,259 | | SPECIALTY RETAIL — 3.5% | | |
| T. Rowe Price Group, Inc. | 9,432 | 440,569 | | TJX Cos., Inc. (The) | 13,477 | 488,272 |
| | | 2,898,815 | | TEXTILES, APPAREL & LUXURY GOODS — 3.0% |
| COMMERCIAL BANKS — 3.1% | | | | Coach, Inc. | 14,173 | 419,379 |
| Banco Santander SA ADR | 29,351 | 424,415 | | WIRELESS TELECOMMUNICATION SERVICES — 2.9% |
| COMMUNICATIONS EQUIPMENT — 6.0% | | | Mobile TeleSystems OJSC ADR | 9,642 | 404,867 |
| Research In Motion Ltd.(1) | 5,315 | 403,940 | | | | |
| | | | | TOTAL INVESTMENT | | |
| Telefonaktiebolaget LM | | | | SECURITIES — 99.2% | | |
| Ericsson ADR | 42,901 | 416,998 | | (Cost $11,225,951) | | 13,673,582 |
| | | 820,938 | | OTHER ASSETS | | |
| COMPUTERS & PERIPHERALS — 3.9% | | | AND LIABILITIES — 0.8% | | 114,022 |
| Apple, Inc.(1) | 3,279 | 535,756 | | TOTAL NET ASSETS — 100.0% | | $13,787,604 |
| CONSUMER FINANCE — 6.1% | | | | | | |
| American Express Co. | 13,155 | 372,681 | | Geographic Diversification | |
| Capital One Financial Corp. | 15,054 | 462,158 | | (as a % of net assets) | | |
| | | 834,839 | | United States | | 63.2% |
| ELECTRONIC EQUIPMENT, | | | | Switzerland | | 6.7% |
| INSTRUMENTS & COMPONENTS — 3.5% | | | People’s Republic of China | | 4.1% |
| Tyco Electronics Ltd. | 22,300 | 478,781 | | Brazil | | 3.9% |
| ENERGY EQUIPMENT & SERVICES — 2.6% | | | Germany | | 3.7% |
| Cameron | | | | Spain | | 3.1% |
| International Corp.(1) | 11,670 | 364,454 | | | | |
| | | | | Sweden | | 3.0% |
| HEALTH CARE PROVIDERS & SERVICES — 2.7% | | Russian Federation | | 2.9% |
| Quest Diagnostics, Inc. | 6,771 | 369,832 | | Taiwan (Republic of China) | | 2.9% |
| INDUSTRIAL CONGLOMERATES — 3.4% | | | Canada | | 2.9% |
| 3M Co. | 6,608 | 465,996 | | India | | 2.8% |
| INTERNET & CATALOG RETAIL — 3.9% | | | Other Assets and Liabilities | | 0.8% |
| Amazon.com, Inc.(1) | 6,263 | 537,115 | | | | |
| INTERNET SOFTWARE & SERVICES — 7.2% | | | Notes to Schedule of Investments |
| Baidu, Inc. ADR(1) | 1,605 | 558,765 | | ADR = American Depositary Receipt | | |
| eBay, Inc.(1) | 20,296 | 431,290 | | OJSC = Open Joint Stock Company | | |
| | | 990,055 | | (1) Non-income producing. | | |
| IT SERVICES — 3.4% | | | | | | |
| International Business | | | | Industry classifications and geographic diversification are unaudited. |
| Machines Corp. | 3,977 | 469,008 | | See Notes to Financial Statements. | | |
21
| | | | | | |
| Legacy Large Cap | | | | | |
| |
| JULY 31, 2009 | | | | | | |
| |
| | Shares | Value | | | Shares | Value |
| Common Stocks — 97.4% | | | | INDUSTRIAL CONGLOMERATES — 2.0% | |
| AEROSPACE & DEFENSE — 1.9% | | | | 3M Co. | 2,668 | $ 188,147 |
| Raytheon Co. | 3,713 | $ 174,325 | | INSURANCE — 2.0% | | |
| BEVERAGES — 4.1% | | | | Prudential Financial, Inc. | 4,147 | 183,588 |
| Cia de Bebidas das Americas, | | | | INTERNET & CATALOG RETAIL — 2.3% | |
| Preference Shares ADR | 2,757 | 193,900 | | Amazon.com, Inc.(1) | 2,519 | 216,029 |
| Coca-Cola Enterprises, Inc. | 9,920 | 186,397 | | INTERNET SOFTWARE & SERVICES — 2.6% | |
| | | 380,297 | | Baidu, Inc. ADR(1) | 692 | 240,913 |
| BIOTECHNOLOGY — 2.0% | | | | IT SERVICES — 5.4% | | |
| Gilead Sciences, Inc.(1) | 3,821 | 186,962 | | International Business | | |
| CAPITAL MARKETS — 10.7% | | | | Machines Corp. | 2,178 | 256,852 |
| BlackRock, Inc. | 1,111 | 211,690 | | MasterCard, Inc., Class A | 1,271 | 246,612 |
| Credit Suisse Group AG ADR | 4,301 | 203,738 | | | | 503,464 |
| Deutsche Bank AG | 2,516 | 163,288 | | MEDIA — 1.9% | | |
| Franklin Resources, Inc. | 2,483 | 220,193 | | Walt Disney Co. (The) | 6,995 | 175,714 |
| T. Rowe Price Group, Inc. | 4,363 | 203,796 | | METALS & MINING — 4.6% | | |
| | | 1,002,705 | | Freeport-McMoRan | | |
| | | | | Copper & Gold, Inc. | 4,222 | 254,587 |
| COMMUNICATIONS EQUIPMENT — 7.9% | | | Sterlite Industries India Ltd. ADR | 13,520 | 179,140 |
| QUALCOMM, Inc. | 4,151 | 191,818 | | | | 433,727 |
| Research In Motion Ltd.(1) | 4,194 | 318,744 | | | | |
| | | | | MULTILINE RETAIL — 1.9% | | |
| Telefonaktiebolaget LM | | | | Target Corp. | 4,133 | 180,281 |
| Ericsson ADR | 23,497 | 228,391 | | | | |
| | | 738,953 | | MULTI-UTILITIES — 2.1% | | |
| | | | | Public Service | | |
| COMPUTERS & PERIPHERALS — 5.4% | | | Enterprise Group, Inc. | 6,180 | 200,541 |
| Apple, Inc.(1) | 1,738 | 283,972 | | | | |
| | | | | PHARMACEUTICALS — 8.2% | | |
| Hewlett-Packard Co. | 5,042 | 218,318 | | AstraZeneca plc ADR | 3,994 | 185,481 |
| | | 502,290 | | Merck & Co., Inc. | 6,095 | 182,911 |
| DIVERSIFIED TELECOMMUNICATION | | | Novo Nordisk A/S ADR | 3,622 | 211,489 |
| SERVICES — 4.2% | | | | | | |
| Telecomunicacoes de Sao Paulo | | | | Sanofi-Aventis SA ADR | 5,709 | 186,342 |
| SA, Preference Shares ADR | 7,611 | 176,423 | | | | 766,223 |
| Telefonica SA ADR | 2,868 | 214,068 | | SEMICONDUCTORS & | | |
| | | 390,491 | | SEMICONDUCTOR EQUIPMENT — 4.3% | |
| | | | | Taiwan Semiconductor | | |
| ELECTRIC UTILITIES — 2.4% | | | | Manufacturing Co. Ltd. ADR | 17,294 | 181,068 |
| Enersis SA ADR | 11,795 | 226,346 | | Texas Instruments, Inc. | 9,347 | 224,796 |
| ELECTRONIC EQUIPMENT, | | | | | | 405,864 |
| INSTRUMENTS & COMPONENTS — 2.2% | | | | | |
| LG Display Co., Ltd. ADR | 14,043 | 202,921 | | SPECIALTY RETAIL — 4.0% | | |
| | | | | AutoZone, Inc.(1) | 1,071 | 164,473 |
| HEALTH CARE PROVIDERS & SERVICES — 6.3% | | | | |
| Express Scripts, Inc.(1) | 2,687 | 188,198 | | TJX Cos., Inc. (The) | 5,804 | 210,279 |
| | | | | | | 374,752 |
| Medco Health Solutions, Inc.(1) | 3,870 | 204,568 | | | | |
| | | | | TOBACCO — 4.3% | | |
| WellPoint, Inc.(1) | 3,633 | 191,241 | | | | |
| | | | | Altria Group, Inc. | 11,143 | 195,337 |
| | | 584,007 | | Lorillard, Inc. | 2,834 | 208,922 |
| HOTELS, RESTAURANTS & LEISURE — 2.5% | | | | | 404,259 |
| Yum! Brands, Inc. | 6,479 | 229,745 | | | | |
22
| | | | | |
| Legacy Large Cap | | | | |
| |
| |
| | Shares/ | | | Geographic Diversification | |
| | Principal | | | (as a % of net assets) | |
| | Amount | Value | | United States | 61.9% |
| WIRELESS TELECOMMUNICATION SERVICES — 2.2% | | Brazil | 4.0% |
| America Movil SAB | | | | | |
| de CV, Series L ADR | 4,871 | $ 209,502 | | Canada | 3.4% |
| TOTAL COMMON STOCKS | | | | People’s Republic of China | 2.6% |
| (Cost $7,785,887) | | 9,102,046 | | Sweden | 2.4% |
| Temporary Cash Investments — 2.5% | | Chile | 2.4% |
| | | | | Spain | 2.3% |
| FHLB Discount Notes, | | | | | |
| 0.09%, 8/3/09(2) | $200,000 | 200,000 | | Denmark | 2.3% |
| JPMorgan U.S. Treasury | | | | Mexico | 2.2% |
| Plus Money Market Fund | | | | Switzerland | 2.2% |
| Agency Shares | 34,841 | 34,841 | | South Korea | 2.2% |
| TOTAL TEMPORARY | | | | France | 2.0% |
| CASH INVESTMENTS | | | | United Kingdom | 2.0% |
| (Cost $234,841) | | 234,841 | | | |
| | | | | Taiwan (Republic of China) | 1.9% |
| TOTAL INVESTMENT | | | | | |
| SECURITIES — 99.9% | | | | India | 1.9% |
| (Cost $8,020,728) | | 9,336,887 | | Germany | 1.7% |
| OTHER ASSETS | | | | Cash and Equivalents* | 2.6% |
| AND LIABILITIES — 0.1% | | 5,428 | | * Includes temporary cash investments and other assets and liabilities. |
| TOTAL NET ASSETS — 100.0% | | $9,342,315 | | | |
| |
| Notes to Schedule of Investments |
| ADR = American Depositary Receipt |
| FHLB = Federal Home Loan Bank |
| (1) | Non-income producing. |
| (2) | The rate indicated is the yield to maturity at purchase. |
| |
| Industry classifications and geographic diversification are unaudited. |
| |
| |
| See Notes to Financial Statements. |
23
| | | | | | |
| Legacy Multi Cap | | | | | | |
| |
| JULY 31, 2009 | | | | | | |
| |
| | Shares | Value | | | Shares | Value |
| Common Stocks — 98.6% | | | | ELECTRICAL EQUIPMENT — 1.1% | |
| | | | | GT Solar International, Inc.(1) | 42,725 | $ 264,895 |
| AEROSPACE & DEFENSE — 2.6% | | | | | | |
| Cubic Corp. | 6,077 | $ 237,975 | | ELECTRONIC EQUIPMENT, | | |
| | | | | INSTRUMENTS & COMPONENTS — 3.4% | |
| Lockheed Martin Corp. | 2,208 | 165,070 | | CPI International, Inc.(1) | 23,853 | 227,796 |
| Raytheon Co. | 4,458 | 209,303 | | | | |
| | | | | LG Display Co., Ltd. ADR | 22,711 | 328,174 |
| | | 612,348 | | | | |
| | | | | Spectrum Control, Inc.(1) | 25,624 | 252,909 |
| BEVERAGES — 1.0% | | | | | | |
| Coca-Cola Enterprises, Inc. | 12,097 | 227,303 | | | | 808,879 |
| CAPITAL MARKETS — 2.3% | | | | ENERGY EQUIPMENT & SERVICES — 0.9% | |
| BlackRock, Inc. | 1,353 | 257,801 | | Noble Corp. | 6,460 | 218,736 |
| Franklin Resources, Inc. | 3,164 | 280,583 | | FOOD & STAPLES RETAILING — 0.8% | |
| | | 538,384 | | Delhaize Group ADR | 2,777 | 197,695 |
| CHEMICALS — 1.2% | | | | FOOD PRODUCTS — 3.7% | | |
| FMC Corp. | 6,020 | 292,813 | | ConAgra Foods, Inc. | 11,388 | 223,546 |
| COMMERCIAL BANKS — 1.2% | | | | Del Monte Foods Co. | 23,419 | 226,227 |
| Southside Bancshares, Inc. | 13,190 | 298,622 | | J.M. Smucker Co. (The) | 4,527 | 226,486 |
| COMMUNICATIONS EQUIPMENT — 3.4% | | | Unilever plc ADR | 8,019 | 211,301 |
| | | | | | | 887,560 |
| Anaren, Inc.(1) | 19,036 | 342,267 | | | | |
| | | | | HEALTH CARE EQUIPMENT & SUPPLIES — 2.1% |
| Research In Motion Ltd.(1) | 3,155 | 239,780 | | | | |
| | | | | Covidien plc | 6,129 | 231,737 |
| Telefonaktiebolaget LM | | | | Hospira, Inc.(1) | 7,302 | 280,616 |
| Ericsson ADR | 23,442 | 227,856 | | | | |
| | | 809,903 | | | | 512,353 |
| COMPUTERS & PERIPHERALS — 2.3% | | | HEALTH CARE PROVIDERS & SERVICES — 7.3% |
| Apple, Inc.(1) | 1,624 | 265,345 | | AmerisourceBergen Corp. | 13,750 | 271,150 |
| Seagate Technology | 23,286 | 280,364 | | CIGNA Corp. | 9,795 | 278,178 |
| | | 545,709 | | DaVita, Inc.(1) | 4,624 | 229,813 |
| DIVERSIFIED CONSUMER SERVICES — 4.6% | | | Emergency Medical | | |
| | | | | Services Corp., Class A(1) | 7,553 | 295,625 |
| H&R Block, Inc. | 8,149 | 136,007 | | | | |
| | | | | Laboratory Corp. | | |
| ITT Educational Services, Inc.(1) | 1,390 | 135,316 | | of America Holdings(1) | 3,860 | 259,353 |
| Lincoln Educational | | | | Metropolitan Health | | |
| Services Corp.(1) | 15,930 | 324,335 | | Networks, Inc.(1) | 69,900 | 166,362 |
| Strayer Education, Inc. | 2,314 | 491,447 | | WellPoint, Inc.(1) | 4,808 | 253,093 |
| | | 1,087,105 | | | | 1,753,574 |
| DIVERSIFIED FINANCIAL SERVICES — 2.3% | | | HOUSEHOLD DURABLES — 1.2% | | |
| Bank of America Corp. | 22,738 | 336,295 | | Jarden Corp.(1) | 11,419 | 281,478 |
| Moody’s Corp. | 9,087 | 215,725 | | INDEPENDENT POWER PRODUCERS | |
| | | 552,020 | | & ENERGY TRADERS — 1.8% | | |
| DIVERSIFIED TELECOMMUNICATION | | | Mirant Corp.(1) | 10,049 | 181,485 |
| SERVICES — 2.7% | | | | NRG Energy, Inc.(1) | 8,828 | 240,210 |
| Portugal Telecom SGPS SA ADR | 22,432 | 229,928 | | | | 421,695 |
| Telecomunicacoes de Sao Paulo | | | | | | |
| SA, Preference Shares ADR | 10,224 | 236,992 | | INSURANCE — 15.4% | | |
| Windstream Corp. | 20,361 | 178,566 | | Aflac, Inc. | 9,231 | 349,486 |
| | | 645,486 | | Alleghany Corp.(1) | 697 | 188,539 |
| ELECTRIC UTILITIES — 1.0% | | | | Allianz SE ADR | 20,395 | 202,114 |
| Cia Paranaense de Energia ADR | 15,053 | 233,623 | | Allied World Assurance Co. | | |
| | | | | Holdings Ltd. | 5,215 | 226,644 |
24
| | | | | | |
| Legacy Multi Cap | | | | | |
| |
| | Shares | Value | | | Shares/ | |
| Assured Guaranty Ltd. | 14,564 | $ 203,459 | | | Principal | |
| Cincinnati Financial Corp. | 9,131 | 220,514 | | | Amount | Value |
| | | | | SEMICONDUCTORS & | | |
| Delphi Financial | | | | SEMICONDUCTOR EQUIPMENT — 4.5% | |
| Group, Inc., Class A | 11,917 | 283,982 | | | | |
| Fairfax Financial Holdings Ltd. | 830 | 253,474 | | Himax Technologies, Inc. ADR | 65,014 | $ 248,354 |
| HCC Insurance Holdings, Inc. | 11,855 | 297,560 | | National Semiconductor Corp. | 15,249 | 229,650 |
| | | | | Tessera Technologies, Inc.(1) | 12,680 | 356,181 |
| Loews Corp. | 7,731 | 232,085 | | | | |
| MBIA, Inc.(1) | 30,594 | 128,189 | | Texas Instruments, Inc. | 9,909 | 238,311 |
| Odyssey Re Holdings Corp. | 3,638 | 168,076 | | | | 1,072,496 |
| Progressive Corp. (The)(1) | 15,724 | 244,980 | | SOFTWARE — 4.8% | | |
| | | | | i2 Technologies, Inc.(1) | 17,124 | 230,489 |
| StanCorp Financial Group, Inc. | 7,605 | 261,764 | | | | |
| | | | | McAfee, Inc.(1) | 9,036 | 402,825 |
| Tower Group, Inc. | 7,711 | 192,544 | | | | |
| | | | | MicroStrategy, Inc., Class A(1) | 5,325 | 325,091 |
| Unum Group | 12,342 | 231,659 | | | | |
| | | 3,685,069 | | Tyler Technologies, Inc.(1) | 12,535 | 193,039 |
| IT SERVICES — 1.8% | | | | | | 1,151,444 |
| Affiliated Computer | | | | SPECIALTY RETAIL — 3.9% | | |
| Services, Inc., Class A(1) | 4,121 | 195,377 | | Dress Barn, Inc. (The)(1) | 12,900 | 201,111 |
| iGate Corp. | 33,404 | 242,179 | | GameStop Corp., Class A(1) | 6,263 | 137,097 |
| | | 437,556 | | Kirkland’s, Inc.(1) | 25,275 | 349,048 |
| MACHINERY — 0.9% | | | | TJX Cos., Inc. (The) | 6,882 | 249,335 |
| Chart Industries, Inc.(1) | 10,852 | 209,009 | | | | 936,591 |
| MEDIA — 2.8% | | | | TEXTILES, APPAREL & LUXURY GOODS — 2.0% |
| DISH Network Corp., Class A(1) | 12,026 | 203,841 | | Carter’s, Inc.(1) | 9,075 | 257,185 |
| DreamWorks Animation | | | | Unifirst Corp. | 5,656 | 220,132 |
| SKG, Inc., Class A(1) | 14,586 | 459,605 | | | | 477,317 |
| | | 663,446 | | TOBACCO — 2.0% | | |
| METALS & MINING — 4.7% | | | | Altria Group, Inc. | 13,448 | 235,743 |
| Gold Fields Ltd. ADR | 18,689 | 225,389 | | Lorillard, Inc. | 3,407 | 251,164 |
| Teck Resources Ltd., Class B(1) | 16,355 | 429,973 | | | | 486,907 |
| Walter Energy, Inc. | 9,333 | 460,677 | | TOTAL COMMON STOCKS | | |
| | | 1,116,039 | | (Cost $19,726,967) | | 23,538,392 |
| OIL, GAS & CONSUMABLE FUELS — 1.8% | | | Temporary Cash Investments — 0.7% |
| DCP Midstream Partners LP | 16,809 | 418,880 | | FHLB Discount Notes, | | |
| PERSONAL PRODUCTS — 0.8% | | | | 0.09%, 8/3/09(2) | $100,000 | 100,000 |
| Schiff Nutrition | | | | JPMorgan U.S. Treasury | | |
| International, Inc.(1) | 34,495 | 195,587 | | Plus Money Market Fund | | |
| PHARMACEUTICALS — 5.5% | | | | Agency Shares | 68,970 | 68,970 |
| AstraZeneca plc ADR | 5,960 | 276,783 | | TOTAL TEMPORARY | | |
| Bristol-Myers Squibb Co. | 10,537 | 229,074 | | CASH INVESTMENTS | | |
| Forest Laboratories, Inc.(1) | 7,400 | 191,142 | | (Cost $168,970) | | 168,970 |
| | | | | TOTAL INVESTMENT | | |
| Merck & Co., Inc. | 7,760 | 232,878 | | SECURITIES — 99.3% | | |
| Novo Nordisk A/S ADR | 3,321 | 193,913 | | (Cost $19,895,937) | | 23,707,362 |
| Sanofi-Aventis SA ADR | 5,683 | 185,493 | | OTHER ASSETS | | |
| | | 1,309,283 | | AND LIABILITIES — 0.7% | | 168,585 |
| REAL ESTATE INVESTMENT TRUSTS (REITs) — 0.8% | | TOTAL NET ASSETS — 100.0% | | $23,875,947 |
| Plum Creek Timber Co., Inc. | 6,029 | 188,587 | | | | |
25
| | | | |
| Legacy Multi Cap | | | | |
| |
| Geographic Diversification | | | Notes to Schedule of Investments |
| (as a % of net assets) | | | ADR = American Depositary Receipt |
| United States | 78.2% | | FHLB = Federal Home Loan Bank |
| Canada | 3.9% | | (1) | Non-income producing. |
| United Kingdom | 2.0% | | (2) | The rate indicated is the yield to maturity at purchase. |
| Brazil | 2.0% | | | |
| Bermuda | 1.8% | | Industry classifications and geographic diversification are unaudited. |
| South Korea | 1.4% | | | |
| Cayman Islands | 1.2% | | | |
| Taiwan (Republic of China) | 1.0% | | See Notes to Financial Statements. |
| Ireland | 1.0% | | | |
| Portugal | 1.0% | | | |
| Sweden | 1.0% | | | |
| South Africa | 0.9% | | | |
| Germany | 0.8% | | | |
| Belgium | 0.8% | | | |
| Denmark | 0.8% | | | |
| France | 0.8% | | | |
| Cash and Equivalents* | 1.4% | | | |
| * Includes temporary cash investments and other assets and liabilities. | | | |
26
|
| Statement of Assets and Liabilities |
| | | |
| JULY 31, 2009 | | | |
| | Focused Large Cap | Large Cap | Multi Cap |
| Assets | | | |
| Investment securities, at value (cost of $11,225,951, | | | |
| $8,020,728 and $19,895,937, respectively) | $13,673,582 | $9,336,887 | $23,707,362 |
| Receivable for investments sold | 159,525 | — | 210,007 |
| Receivable for capital shares sold | 4,835 | 565 | 2,978 |
| Dividends and interest receivable | 29,146 | 15,618 | 11,073 |
| | 13,867,088 | 9,353,070 | 23,931,420 |
| | | | |
| Liabilities | | | |
| Disbursements in excess of demand deposit cash | 40,472 | — | — |
| Payable for capital shares redeemed | 26,886 | 2,324 | 33,339 |
| Accrued management fees | 12,088 | 8,112 | 21,926 |
| Distribution and service fees payable | 38 | 319 | 208 |
| | 79,484 | 10,755 | 55,473 |
| | | | |
| Net Assets | $13,787,604 | $9,342,315 | $23,875,947 |
| | | | |
| Net Assets Consist of: | | | |
| Capital (par value and paid-in surplus) | $ 28,636,269 | $13,927,446 | $ 36,211,886 |
| Undistributed net investment income | 4,318 | 79,098 | 300,977 |
| Accumulated net realized loss on investment transactions | (17,300,614) | (5,980,388) | (16,448,341) |
| Net unrealized appreciation on investments | 2,447,631 | 1,316,159 | 3,811,425 |
| | $ 13,787,604 | $ 9,342,315 | $ 23,875,947 |
| | | | |
| Investor Class, $0.01 Par Value | | | |
| Net assets | $13,594,326 | $7,713,566 | $22,725,762 |
| Shares outstanding | 1,635,364 | 929,836 | 2,918,402 |
| Net asset value per share | $8.31 | $8.30 | $7.79 |
| | | | |
| Institutional Class, $0.01 Par Value | | | |
| Net assets | $32,343 | $699,415 | $27,540 |
| Shares outstanding | 3,878 | 84,047 | 3,519 |
| Net asset value per share | $8.34 | $8.32 | $7.83 |
| | | | |
| Advisor Class, $0.01 Par Value | | | |
| Net assets | $146,441 | $278,464 | $1,081,377 |
| Shares outstanding | 17,692 | 33,713 | 139,864 |
| Net asset value per share | $8.28 | $8.26 | $7.73 |
| | | | |
| R Class, $0.01 Par Value | | | |
| Net assets | $14,494 | $650,870 | $41,268 |
| Shares outstanding | 1,759 | 79,114 | 5,377 |
| Net asset value per share | $8.24 | $8.23 | $7.67 |
| |
| |
| See Notes to Financial Statements. | | | |
27
| | | |
| YEAR ENDED JULY 31, 2009 | | | |
| | Focused Large Cap | Large Cap | Multi Cap |
| Investment Income (Loss) | | | |
| Income: | | | |
| Dividends (net of foreign taxes withheld of $6,157, | | | |
| $1,466 and $2,011, respectively) | $ 346,609 | $ 187,736 | $ 589,843 |
| Interest | 982 | 5,058 | 1,879 |
| | 347,591 | 192,794 | 591,722 |
| | | | |
| Expenses: | | | |
| Management fees | 214,068 | 108,814 | 264,491 |
| Distribution and service fees: | | | |
| Advisor Class | 789 | 1,241 | 1,236 |
| R Class | 96 | 3,188 | 204 |
| Directors’ fees and expenses | 802 | 431 | 899 |
| Other expenses | 1,486 | 22 | 52 |
| | 217,241 | 113,696 | 266,882 |
| | | | |
| Net investment income (loss) | 130,350 | 79,098 | 324,840 |
| | | | |
| Realized and Unrealized Gain (Loss) | | | |
| Net realized gain (loss) on investment transactions (net of | | | |
| foreign taxes withheld of $126,032, $– and $-, respectively) | (12,672,591) | (5,623,945) | (11,352,369) |
| Change in net unrealized appreciation (depreciation) | | | |
| on investments | 865,762 | 830,639 | (543,313) |
| | | | |
| Net realized and unrealized gain (loss) | (11,806,829) | (4,793,306) | (11,895,682) |
| | | | |
| Net Increase (Decrease) in Net Assets | | | |
| Resulting from Operations | $(11,676,479) | $(4,714,208) | $(11,570,842) |
| |
| |
| See Notes to Financial Statements. | | | |
28
|
| Statement of Changes in Net Assets |
| | | | |
| YEARS ENDED JULY 31, 2009 AND JULY 31, 2008 | | | |
| | Focused Large Cap | Large Cap |
| Increase (Decrease) in Net Assets | 2009 | 2008 | 2009 | 2008 |
| Operations | | | | |
| Net investment income (loss) | $ 130,350 | $ 49,777 | $ 79,098 | $ 6,911 |
| Net realized gain (loss) | (12,672,591) | (4,616,872) | (5,623,945) | (79,650) |
| Change in net unrealized | | | | |
| appreciation (depreciation) | 865,762 | (263,252) | 830,639 | (406,076) |
| Net increase (decrease) in net assets | | | | |
| resulting from operations | (11,676,479) | (4,830,347) | (4,714,208) | (478,815) |
| | | | | |
| Distributions to Shareholders | | | | |
| From net investment income: | | | | |
| Investor Class | — | (126,337) | — | (19,295) |
| Institutional Class | — | (18,993) | — | (3,251) |
| Advisor Class | — | (4,343) | — | (2,193) |
| R Class | — | (320) | — | (1,119) |
| From net realized gains: | | | | |
| Investor Class | — | (887,994) | — | (335,193) |
| Institutional Class | — | (115,208) | — | (45,918) |
| Advisor Class | — | (38,076) | — | (53,441) |
| R Class | — | (3,734) | — | (45,741) |
| From tax return of capital: | | | | |
| Investor Class | — | (234,140) | — | (43,667) |
| Institutional Class | — | (35,199) | — | (7,359) |
| Advisor Class | — | (8,049) | — | (4,965) |
| R Class | — | (594) | — | (2,534) |
| Decrease in net assets from distributions | — | (1,472,987) | — | (564,676) |
| | | | | |
| Capital Share Transactions | | | | |
| Net increase (decrease) in net assets from | | | | |
| capital share transactions | (14,631,232) | 32,324,361 | (2,595,719) | 9,111,702 |
| | | | | |
| Net increase (decrease) in net assets | (26,307,711) | 26,021,027 | (7,309,927) | 8,068,211 |
| | | | | |
| Net Assets | | | | |
| Beginning of period | 40,095,315 | 14,074,288 | 16,652,242 | 8,584,031 |
| End of period | $ 13,787,604 | $40,095,315 | $ 9,342,315 | $16,652,242 |
| | | | | |
| Undistributed net investment income | $4,318 | — | $79,098 | — |
| |
| |
| See Notes to Financial Statements. | | | | |
29
| | |
| YEARS ENDED JULY 31, 2009 AND JULY 31, 2008 | | |
| | Multi Cap |
| Increase (Decrease) in Net Assets | 2009 | 2008 |
| Operations | | |
| Net investment income (loss) | $ 324,840 | $ (70,406) |
| Net realized gain (loss) | (11,352,369) | (5,119,615) |
| Change in net unrealized appreciation (depreciation) | (543,313) | 2,407,698 |
| Net increase (decrease) in net assets resulting from operations | (11,570,842) | (2,782,323) |
| | | |
| Distributions to Shareholders | | |
| From net realized gains: | | |
| Investor Class | — | (552,672) |
| Institutional Class | — | (257) |
| Advisor Class | — | (12,791) |
| R Class | — | (696) |
| Decrease in net assets from distributions | — | (566,416) |
| | | |
| Capital Share Transactions | | |
| Net increase (decrease) in net assets from capital share transactions | (787,651) | 1,216,738 |
| | | |
| Net increase (decrease) in net assets | (12,358,493) | (2,132,001) |
| | | |
| Net Assets | | |
| Beginning of period | 36,234,440 | 38,366,441 |
| End of period | $ 23,875,947 | $ 36,234,440 |
| | | |
| Undistributed net investment income | $300,977 | — |
| |
| |
| See Notes to Financial Statements. | | |
30
|
| Notes to Financial Statements |
JULY 31, 2009
1. Organization and Summary of Significant Accounting Policies
Organization — American Century Growth Funds, Inc. (the corporation) is registered under the Investment Company Act of 1940 (the 1940 Act) as an open-end management investment company. Legacy Focused Large Cap Fund (Focused Large Cap), Legacy Large Cap Fund (Large Cap) and Legacy Multi Cap Fund (Multi Cap) (collectively, the funds) are three funds in a series issued by the corporation. Focused Large Cap is nondiversified under the 1940 Act. Large Cap and Multi Cap are diversified under the 1940 Act. The funds’ investment objective is to seek long-term capital growth. Focused Large Cap and Large Cap pursue their investment objective by investing in stocks of large-sized market capitalization companies. Multi Cap pursues its investment objective by investing in stocks of small-, mid- and large-sized market capitalization companies. The following is a summary of the funds’ significant accounting policies.
Multiple Class — The funds are authorized to issue the Investor Class, the Institutional Class, the Advisor Class and the R Class. The share classes differ principally in their respective distribution and shareholder servicing expenses and arrangements. All shares of each fund represent an equal pro rata interest in the net assets of the class to which such shares belong, and have identical voting, dividend, liquidation and other rights and the same terms and conditions, except for class specific expenses and exclusive rights to vote on matters affecting only individual classes. Income, non-class specific expenses, and realized and unrealized capital gains and losses of the funds are allocated to each class of shares based on their relative net assets.
Security Valuations — Securities traded primarily on a principal securities exchange are valued at the last reported sales price, or at the mean of the latest bid and asked prices where no last sales price is available. Depending on local convention or regulation, securities traded over-the-counter are valued at the mean of the latest bid and asked prices, the last sales price, or the official close price. Investments in open-end management investment companies are valued at the reported net asset value. Debt securities not traded on a principal securities exchange are valued through a commercial pricing service or at the mean of the most recent bid and asked prices. Discount notes may be valued through a commercial pricing service or at amortized cost, which approximates fair value. Securities traded on foreign securities exchanges and ov er-the-counter markets are normally completed before the close of business on days that the New York Stock Exchange (the Exchange) is open and may also take place on days when the Exchange is not open. If an event occurs after the value of a security was established but before the net asset value per share was determined that was likely to materially change the net asset value, that security would be valued as determined in accordance with procedures adopted by the Board of Directors. If the funds determine that the market price of a portfolio security is not readily available, or that the valuation methods mentioned above do not reflect the security’s fair value, such security is valued as determined by the Board of Directors or its designee, in accordance with procedures adopted by the Board of Directors, if such determination would materially impact a fund’s net asset value. Certain other circumstances may cause the funds to use alternative procedures to value a security such as: a security has been declared in default; trading in a security has been halted during the trading day; or there is a foreign market holiday and no trading will commence.
Security Transactions — For financial reporting purposes, security transactions are accounted for as of the trade date. Net realized gains and losses are determined on the identified cost basis, which is also used for federal income tax purposes.
Investment Income — Dividend income less foreign taxes withheld, if any, is recorded as of the ex-dividend date. Interest income is recorded on the accrual basis and includes accretion of discounts and amortization of premiums.
Foreign Currency Transactions — All assets and liabilities initially expressed in foreign currencies are translated into U.S. dollars at prevailing exchange rates at period end. The funds may enter into spot foreign currency exchange contracts to facilitate transactions denominated in a foreign currency. Purchases and sales of investment securities, dividend and interest
31
income, spot foreign currency exchange contracts, and certain expenses are translated at the rates of exchange prevailing on the respective dates of such transactions. For assets and liabilities, other than investments in securities, net realized and unrealized gains and losses from foreign currency translations arise from changes in currency exchange rates.
Net realized and unrealized foreign currency exchange gains or losses occurring during the holding period of investment securities are a component of realized gain (loss) on investment transactions and unrealized appreciation (depreciation) on investments, respectively. Certain countries may impose taxes on the contract amount of purchases and sales of foreign currency contracts in their currency. The funds record the foreign tax expense, if any, as a reduction to the net realized gain (loss) on foreign currency transactions.
Repurchase Agreements — The funds may enter into repurchase agreements with institutions that American Century Investment Management, Inc. (ACIM) (the investment advisor) has determined are creditworthy pursuant to criteria adopted by the Board of Directors. Each repurchase agreement is recorded at cost. Each fund requires that the collateral, represented by securities, received in a repurchase transaction be transferred to the custodian in a manner sufficient to enable each fund to obtain those securities in the event of a default under the repurchase agreement. ACIM monitors, on a daily basis, the securities transferred to ensure the value, including accrued interest, of the securities under each repurchase agreement is equal to or greater than amounts owed to each fund under each repurchase agreement.
Joint Trading Account — Pursuant to an Exemptive Order issued by the Securities and Exchange Commission, each fund, along with certain other funds in the American Century Investments family of funds, may transfer uninvested cash balances into a joint trading account. These balances are invested in one or more repurchase agreements that are collateralized by U.S. Treasury or Agency obligations
Income Tax Status — It is each fund’s policy to distribute substantially all net investment income and net realized gains to shareholders and to otherwise qualify as a regulated investment company under provisions of the Internal Revenue Code. All tax years for the funds remain subject to examination by tax authorities. At this time, management believes there are no uncertain tax positions which, based on their technical merit, would not be sustained upon examination and for which it is reasonably possible that the total amounts of unrecognized tax benefits will significantly change in the next twelve months. Accordingly, no provision has been made for federal or state income taxes. Interest and penalties associated with any federal or state income tax obligations, if any, are recorded as interest expense.
Distributions to Shareholders — Distributions to shareholders are recorded on the ex-dividend date. Distributions from net investment income and net realized gains, if any, are generally declared and paid annually.
Indemnifications — Under the corporation’s organizational documents, its officers and directors are indemnified against certain liabilities arising out of the performance of their duties to the funds. In addition, in the normal course of business, the funds enter into contracts that provide general indemnifications. The maximum exposure under these arrangements is unknown as this would involve future claims that may be made against a fund. The risk of material loss from such claims is considered by management to be remote.
Use of Estimates — The financial statements are prepared in conformity with accounting principles generally accepted in the United States of America, which may require management to make certain estimates and assumptions at the date of the financial statements. Actual results could differ from these estimates.
Subsequent Events — Management has evaluated events or transactions that may have occurred since July 31, 2009, that would merit recognition or disclosure in the financial statements. This evaluation was completed through September 28, 2009, the date the financial statements were issued.
32
2. Fees and Transactions with Related Parties
Management Fees — The corporation has entered into a Management Agreement with ACIM, under which ACIM provides the funds with investment advisory and management services in exchange for a single, unified management fee (the fee) per class. The Agreement provides that all expenses of the funds, except brokerage commissions, taxes, interest, fees and expenses of those directors who are not considered “interested persons” as defined in the 1940 Act (including counsel fees) and extraordinary expenses, will be paid by ACIM. The fee is computed and accrued daily based on the daily net assets of each specific class of shares of each fund and paid monthly in arrears. For funds with a stepped fee schedule, the rate of the fee is determined by applying a fee rate calculation formula. This formula takes into account each fund’s assets as well as certain assets, if any, of other clients of the investment advisor outside the American Century Investments family of funds (such as subadvised funds and separate accounts) that have very similar investment teams and investment strategies (strategy assets). The annual management fee schedule for Focused Large Cap and Large Cap ranges from 0.80% to 1.10% for the Investor Class, Advisor Class and R Class. The annual management fee schedule for Multi Cap ranges from 0.85% to 1.15% for the Investor Class, Advisor Class and R Class. The Institutional Class is 0.20% less at each point within the range.
The effective annual management fee for each class of each fund for the year ended July 31, 2009, was as follows:
| | |
| | Investor, Advisor & R | Institutional |
| Focused Large Cap | 1.10% | 0.90% |
| Large Cap | 1.10% | 0.90% |
| Multi Cap | 1.15% | 0.95% |
Distribution and Service Fees — The Board of Directors has adopted a separate Master Distribution and Individual Shareholder Services Plan for each of the Advisor Class and R Class (collectively, the plans), pursuant to Rule 12b-1 of the 1940 Act. The plans provide that the Advisor Class will pay American Century Investment Services, Inc. (ACIS) an annual distribution and service fee of 0.25%. The plans provide that the R Class will pay ACIS an annual distribution and service fee of 0.50%. The fees are computed and accrued daily based on each class’s daily net assets and paid monthly in arrears. The fees are used to pay financial intermediaries for distribution and individual shareholder services. Fees incurred under the plans during the year ended July 31, 2009, are detailed in the Statement of Operations. Related Parties — Certain officers and directors of the corporation are also officers and/or directors, and, as a group, controlling stockholders of American Century Companies, Inc. (ACC), the parent of the corporation’s investment advisor, ACIM, the distributor of the corporation, ACIS, and the corporation’s transfer agent, American Century Services, LLC. ACIM owns 14% of the outstanding shares of Large Cap. Learning Quest 529 Education Savings Program (Learning Quest) owns 51% of the outstanding shares of Multi Cap. Learning Quest is managed by ACIM. ACIM and Learning Quest do not invest in the funds for the purpose of exercising management or control.
The funds are eligible to invest in a money market fund for temporary purposes, which is managed by J.P. Morgan Investment Management, Inc. (JPMIM). The funds have a Mutual Funds Services Agreement with J.P. Morgan Investor Services Co. (JPMIS). JPMorgan Chase Bank (JPMCB) is a custodian of the funds. JPMIM, JPMIS and JPMCB are wholly owned subsidiaries of JPMorgan Chase & Co. (JPM). JPM is an equity investor in ACC.
3. Investment Transactions
Investment transactions, excluding short-term investments, for the year ended July 31, 2009, were as follows:
| | | |
| | Focused Large Cap | Large Cap | Multi Cap |
| Purchases | $61,813,146 | $28,904,457 | $62,340,379 |
| Sales | $75,644,488 | $31,434,734 | $62,735,879 |
33
4. Capital Share Transactions
The corporation is authorized to issue 3,000,000,000 shares. Transactions in shares of the funds were as follows:
| | | | |
| | Year ended July 31, 2009 | Year ended July 31, 2008 |
| | Shares | Amount | Shares | Amount |
| |
| Focused Large Cap | | | | |
| Investor Class | | | | |
| Sold | 765,356 | $ 6,942,393 | 4,161,104 | $ 58,235,418 |
| Issued in reinvestment of distributions | — | — | 84,574 | 1,217,864 |
| Redeemed | (2,067,372) | (18,708,181) | (1,996,800) | (26,482,190) |
| | (1,302,016) | (11,765,788) | 2,248,878 | 32,971,092 |
| Institutional Class | | | | |
| Sold | 33,692 | 376,880 | 90,169 | 1,242,786 |
| Issued in reinvestment of distributions | — | — | 11,764 | 169,400 |
| Redeemed | (341,286) | (2,621,563) | (74,736) | (1,120,658) |
| | (307,594) | (2,244,683) | 27,197 | 291,528 |
| Advisor Class | | | | |
| Sold | 3,850 | 37,352 | 168,156 | 2,424,653 |
| Issued in reinvestment of distributions | — | — | 3,370 | 48,497 |
| Redeemed | (64,880) | (618,858) | (169,692) | (2,354,336) |
| | (61,030) | (581,506) | 1,834 | 118,814 |
| R Class | | | | |
| Sold | 239 | 2,076 | 15,877 | 220,558 |
| Issued in reinvestment of distributions | — | — | 216 | 3,113 |
| Redeemed | (3,849) | (41,331) | (85,940) | (1,280,744) |
| | (3,610) | (39,255) | (69,847) | (1,057,073) |
| Net increase (decrease) | (1,674,250) | $(14,631,232) | 2,208,062 | $ 32,324,361 |
| | | | | |
| Legacy Large Cap | | | | |
| Investor Class | | | | |
| Sold | 359,783 | $ 3,049,427 | 1,072,268 | $13,516,225 |
| Issued in reinvestment of distributions | — | — | 31,178 | 393,152 |
| Redeemed | (592,705) | (5,038,469) | (435,290) | (5,386,901) |
| | (232,922) | (1,989,042) | 668,156 | 8,522,476 |
| Institutional Class | | | | |
| Sold | 2,519 | 20,430 | 1,583 | 19,535 |
| Issued in reinvestment of distributions | — | — | 4,483 | 56,528 |
| | 2,519 | 20,430 | 6,066 | 76,063 |
| Advisor Class | | | | |
| Sold | 29,453 | 264,301 | 35,987 | 457,405 |
| Issued in reinvestment of distributions | — | — | 4,809 | 60,599 |
| Redeemed | (108,364) | (891,032) | (3,446) | (42,617) |
| | (78,911) | (626,731) | 37,350 | 475,387 |
| R Class | | | | |
| Sold | 350 | 2,503 | 24 | 300 |
| Issued in reinvestment of distributions | — | — | 3,920 | 49,394 |
| Redeemed | (350) | (2,879) | (918) | (11,918) |
| | — | (376) | 3,026 | 37,776 |
| Net increase (decrease) | (309,314) | $(2,595,719) | 714,598 | $ 9,111,702 |
34
| | | | |
| | Year ended July 31, 2009 | Year ended July 31, 2008 |
| | Shares | Amount | Shares | Amount |
| |
| Legacy Multi Cap | | | | |
| Investor Class | | | | |
| Sold | 1,094,781 | $ 8,025,444 | 1,789,560 | $ 23,462,102 |
| Issued in reinvestment of distributions | — | — | 20,818 | 275,219 |
| Redeemed | (1,195,141) | (9,299,211) | (1,668,251) | (21,143,592) |
| | (100,360) | (1,273,767) | 142,127 | 2,593,729 |
| Institutional Class | | | | |
| Sold | 2,004 | 14,930 | 771 | 8,972 |
| Issued in reinvestment of distributions | — | — | 19 | 257 |
| Redeemed | (771) | (5,751) | (48,735) | (700,000) |
| | 1,233 | 9,179 | (47,945) | (690,771) |
| Advisor Class | | | | |
| Sold | 148,770 | 1,018,599 | 86,754 | 1,183,029 |
| Issued in reinvestment of distributions | — | — | 970 | 12,791 |
| Redeemed | (73,242) | (539,826) | (91,173) | (1,235,954) |
| | 75,528 | 478,773 | (3,449) | (40,134) |
| R Class | | | | |
| Sold | 1,464 | 10,537 | 14,342 | 172,188 |
| Issued in reinvestment of distributions | — | — | 53 | 696 |
| Redeemed | (1,651) | (12,373) | (59,845) | (818,970) |
| | (187) | (1,836) | (45,450) | (646,086) |
| Net increase (decrease) | (23,786) | $ (787,651) | 45,283 | $ 1,216,738 |
5. Fair Value Measurements
The funds’ securities valuation process is based on several considerations and may use multiple inputs to determine the fair value of the positions held by the funds. In conformity with accounting principles generally accepted in the United States of America, the inputs used to determine a valuation are classified into three broad levels as follows:
• Level 1 valuation inputs consist of actual quoted prices in an active market for identical securities;
• Level 2 valuation inputs consist of significant direct or indirect observable market data (including quoted prices for similar securities, evaluations of subsequent market events, interest rates, prepayment speeds, credit risk, etc.); or
• Level 3 valuation inputs consist of significant unobservable inputs (including a fund’s own assumptions).
The level classification is based on the lowest level input that is significant to the fair valuation measurement. The valuation inputs are not an indication of the risks associated with investing in these securities or other financial instruments.
35
The following is a summary of the valuation inputs used to determine the fair value of the funds’ securities as of July 31, 2009:
| | | |
| Fund | Level 1 | Level 2 | Level 3 |
| |
| Focused Large Cap | | | |
| Investment Securities | | | |
| Domestic Common Stocks | $ 8,711,359 | — | — |
| Foreign Common Stocks | 4,423,003 | $539,220 | — |
| Total Value of Investment Securities | $13,134,362 | $539,220 | — |
| | | | |
| Large Cap | | | |
| Investment Securities | | | |
| Domestic Common Stocks | $5,780,292 | — | — |
| Foreign Common Stocks | 2,951,431 | $370,323 | — |
| Temporary Cash Investments | 34,841 | 200,000 | — |
| Total Value of Investment Securities | $8,766,564 | $570,323 | — |
| | | | |
| Multi Cap | | | |
| Investment Securities | | | |
| Domestic Common Stocks | $18,675,346 | — | — |
| Foreign Common Stocks | 4,626,054 | $236,992 | — |
| Temporary Cash Investments | 68,970 | 100,000 | — |
| Total Value of Investment Securities | $23,370,370 | $336,992 | — |
6. Risk Factors
The funds’ investment process may result in high portfolio turnover, which could mean high transaction costs, affecting both performance and capital gains tax liabilities to investors. There are certain risks involved in investing in foreign securities. These risks include those resulting from future adverse political, social, and economic developments, fluctuations in currency exchange rates, the possible imposition of exchange controls, and other foreign laws or restrictions.
Focused Large Cap is considered nondiversified which may subject the fund to risk because a price change in any one security may have a greater impact than would be the case if the fund were diversified.
Multi Cap invests in common stocks of small companies. Because of this, Multi Cap may be subject to greater risk and market fluctuations than a fund investing in larger, more established companies.
7. Bank Line of Credit
The funds, along with certain other funds in the American Century Investments family of funds, had a $500,000,000 unsecured bank line of credit agreement with Bank of America, N.A. The line expired December 10, 2008, and was not renewed. The agreement allowed the funds to borrow money for temporary or emergency purposes to fund shareholder redemptions. Borrowings under the agreement were subject to interest at the Federal Funds rate plus 0.40%. The funds did not borrow from the line during the year ended July 31, 2009.
36
8. Interfund Lending
The funds, along with certain other funds in the American Century Investments family of funds, may participate in an interfund lending program, pursuant to an Exemptive Order issued by the Securities and Exchange Commission (SEC). This program provides an alternative credit facility allowing the funds to borrow from or lend to other funds in the American Century Investments family of funds that permit such transactions. Interfund lending transactions are subject to each fund’s investment policies and borrowing and lending limits. The interfund loan rate earned/paid on interfund lending transactions is determined daily based on the average of certain current market rates. Interfund lending transactions normally extend only overnight, but can have a maximum duration of seven days. The program is subject to annual approval by the Board of Directors. During the year ended July 31, 2009, the funds did not utilize the program.
9. Federal Tax Information
The tax character of distributions paid during the years ended July 31, 2009 and July 31, 2008 were as follows:
| | | | | | |
| | Focused Large Cap | Large Cap | Multi Cap |
| | 2009 | 2008 | 2009 | 2008 | 2009 | 2008 |
| Distributions Paid From | | | | | | |
| Ordinary income | — | $803,956 | — | $371,431 | — | $495,307 |
| Long-term capital gains | — | $391,049 | — | $134,720 | — | $71,109 |
| Return of capital | — | $277,982 | — | $58,525 | — | — |
The book-basis character of distributions made during the year from net investment income or net realized gains may differ from their ultimate characterization for federal income tax purposes. These differences reflect the differing character of certain income items and net realized gains and losses for financial statement and tax purposes, and may result in reclassification among certain capital accounts on the financial statements.
As of July 31, 2009, the components of distributable earnings on a tax-basis and the federal tax cost of investments were as follows:
| | | |
| | Focused Large Cap | Large Cap | Multi Cap |
| Federal tax cost of investments | $11,225,951 | $8,020,728 | $19,895,937 |
| Gross tax appreciation of investments | $2,447,631 | $1,374,587 | $4,205,888 |
| Gross tax depreciation of investments | — | (58,428) | (394,463) |
| Net tax appreciation (depreciation) of investments | $2,447,631 | $1,316,159 | $3,811,425 |
| Undistributed ordinary income | $4,318 | $79,098 | $300,977 |
| Accumulated capital losses | $(9,957,444) | $(3,451,519) | $(11,032,918) |
| Capital loss deferrals | $(7,343,170) | $(2,528,869) | $(5,415,423) |
The cost of investments and unrealized appreciation (depreciation) for federal income tax purposes was the same as the cost for financial reporting purposes.
37
The accumulated capital losses listed on the previous page represent net capital loss carryovers that may be used to offset future realized capital gains for federal income tax purposes. Future capital loss carryover utilization in any given year may be limited due to large shareholder redemptions and contributions. The capital loss carryovers expire as follows:
| | |
| | 2016 | 2017 |
| Focused Large Cap | — | $(9,957,444) |
| Large Cap | — | $(3,451,519) |
| Multi Cap | $(1,217,468) | $(9,815,450) |
The capital loss deferrals listed on the previous page represent net capital losses incurred in the nine-month period ended July 31, 2009. The funds have elected to treat such losses as having been incurred in the following fiscal year for federal income tax purposes.
10. Recently Issued Accounting Standards
The Financial Accounting Standards Board (FASB) issued Statement of Financial Accounting Standards No. 157, “Fair Value Measurements” (FAS 157), in September 2006, which is effective for fiscal years beginning after November 15, 2007. FAS 157 defines fair value, establishes a framework for measuring fair value and expands the required financial statement disclosures about fair value measurements. The adoption of FAS 157 did not materially impact the determination of fair value.
In March 2008, the FASB issued Statement of Financial Accounting Standards No. 161, “Disclosures about Derivative Instruments and Hedging Activities — an amendment of FASB Statement No. 133” (FAS 161). FAS 161 is effective for interim periods beginning after November 15, 2008 and has been adopted by the funds. FAS 161 amends and expands disclosures about derivative instruments and hedging activities. FAS 161 requires qualitative disclosures about the objectives and strategies of derivative instruments, quantitative disclosures about the fair value amounts of and gains and losses on derivative instruments, and disclosures of credit-risk-related contingent features in hedging activities.
38
| | | | |
| Legacy Focused Large Cap | | | | |
| |
| Investor Class | | | | |
| For a Share Outstanding Throughout the Years Ended July 31 (except as noted) | | |
| | 2009 | 2008 | 2007 | 2006(1) |
| Per-Share Data | | | | |
| Net Asset Value, Beginning of Period | $12.03 | $12.51 | $10.11 | $10.00 |
| Income From Investment Operations | | | | |
| Net Investment Income (Loss)(2) | 0.06 | 0.02 | 0.12 | 0.01 |
| Net Realized and Unrealized Gain (Loss) | (3.78) | 0.15 | 2.34 | 0.10 |
| Total From Investment Operations | (3.72) | 0.17 | 2.46 | 0.11 |
| Distributions | | | | |
| From Net Investment Income | — | (0.07) | (0.06) | — |
| From Net Realized Gains | — | (0.46) | — | — |
| From Tax Return of Capital | — | (0.12) | — | — |
| Total Distributions | — | (0.65) | (0.06) | — |
| Net Asset Value, End of Period | $8.31 | $12.03 | $12.51 | $10.11 |
| |
| Total Return(3) | (30.92)% | 0.49% | 24.44% | 1.10% |
| |
| Ratios/Supplemental Data | | | | |
| Ratio of Operating Expenses to Average Net Assets | 1.11% | 1.11% | 1.10% | 1.10%(4) |
| Ratio of Net Investment Income (Loss) to Average Net Assets | 0.65% | 0.13% | 1.24% | 0.88%(4) |
| Portfolio Turnover Rate | 305% | 188% | 255% | 30% |
| Net Assets, End of Period (in thousands) | $13,594 | $35,334 | $8,614 | $3,669 |
| (1) | May 31, 2006 (fund inception) through July 31, 2006. |
| (2) | Computed using average shares outstanding throughout the period. |
| (3) | Total return assumes reinvestment of net investment income and capital gains distributions, if any. Total returns for periods less than one year are not annualized. The total return of the classes may not precisely reflect the class expense differences because of the impact of calculating the net asset values to two decimal places. If net asset values were calculated to three decimal places, the total return differences would more closely reflect the class expense differences. The calculation of net asset values to two decimal places is made in accordance with SEC guidelines and does not result in any gain or loss of value between one class and another. |
| (4) | Annualized. |
See Notes to Financial Statements.
39
| | | | |
| Legacy Focused Large Cap | | | | |
| |
| Institutional Class | | | | |
| For a Share Outstanding Throughout the Years Ended July 31 (except as noted) | | |
| | 2009 | 2008 | 2007 | 2006(1) |
| Per-Share Data | | | | |
| Net Asset Value, Beginning of Period | $12.04 | $12.53 | $10.11 | $10.00 |
| Income From Investment Operations | | | | |
| Net Investment Income (Loss)(2) | 0.06 | 0.06 | 0.18 | 0.02 |
| Net Realized and Unrealized Gain (Loss) | (3.76) | 0.13 | 2.31 | 0.09 |
| Total From Investment Operations | (3.70) | 0.19 | 2.49 | 0.11 |
| Distributions | | | | |
| From Net Investment Income | — | (0.08) | (0.07) | — |
| From Net Realized Gains | — | (0.46) | — | — |
| From Tax Return of Capital | — | (0.14) | — | — |
| Total Distributions | — | (0.68) | (0.07) | — |
| Net Asset Value, End of Period | $8.34 | $12.04 | $12.53 | $10.11 |
| |
| Total Return(3) | (30.73)% | 0.61% | 24.78% | 1.10% |
| |
| Ratios/Supplemental Data | | | | |
| Ratio of Operating Expenses to Average Net Assets | 0.91% | 0.91% | 0.90% | 0.90%(4) |
| Ratio of Net Investment Income (Loss) to Average Net Assets | 0.85% | 0.33% | 1.44% | 1.08%(4) |
| Portfolio Turnover Rate | 305% | 188% | 255% | 30% |
| Net Assets, End of Period (in thousands) | $32 | $3,751 | $3,561 | $758 |
| (1) | May 31, 2006 (fund inception) through July 31, 2006. |
| (2) | Computed using average shares outstanding throughout the period. |
| (3) | Total return assumes reinvestment of net investment income and capital gains distributions, if any. Total returns for periods less than one year are not annualized. The total return of the classes may not precisely reflect the class expense differences because of the impact of calculating the net asset values to two decimal places. If net asset values were calculated to three decimal places, the total return differences would more closely reflect the class expense differences. The calculation of net asset values to two decimal places is made in accordance with SEC guidelines and does not result in any gain or loss of value between one class and another. |
| (4) | Annualized. |
See Notes to Financial Statements.
40
| | | | |
| Legacy Focused Large Cap | | | | |
| |
| Advisor Class | | | | |
| For a Share Outstanding Throughout the Years Ended July 31 (except as noted) | | |
| | 2009 | 2008 | 2007 | 2006(1) |
| Per-Share Data | | | | |
| Net Asset Value, Beginning of Period | $12.01 | $12.49 | $10.11 | $10.00 |
| Income From Investment Operations | | | | |
| Net Investment Income (Loss)(2) | 0.03 | (0.01) | 0.10 | 0.01 |
| Net Realized and Unrealized Gain (Loss) | (3.76) | 0.14 | 2.33 | 0.10 |
| Total From Investment Operations | (3.73) | 0.13 | 2.43 | 0.11 |
| Distributions | | | | |
| From Net Investment Income | — | (0.05) | (0.05) | — |
| From Net Realized Gains | — | (0.46) | — | — |
| From Tax Return of Capital | — | (0.10) | — | — |
| Total Distributions | — | (0.61) | (0.05) | — |
| Net Asset Value, End of Period | $8.28 | $12.01 | $12.49 | $10.11 |
| |
| Total Return(3) | (31.06)% | 0.24% | 24.07% | 1.10% |
| |
| Ratios/Supplemental Data | | | | |
| Ratio of Operating Expenses to Average Net Assets | 1.36% | 1.36% | 1.35% | 1.35%(4) |
| Ratio of Net Investment Income (Loss) to Average Net Assets | 0.40% | (0.12)% | 0.99% | 0.63%(4) |
| Portfolio Turnover Rate | 305% | 188% | 255% | 30% |
| Net Assets, End of Period (in thousands) | $146 | $945 | $960 | $845 |
| (1) | May 31, 2006 (fund inception) through July 31, 2006. |
| (2) | Computed using average shares outstanding throughout the period. |
| (3) | Total return assumes reinvestment of net investment income and capital gains distributions, if any. Total returns for periods less than one year are not annualized. The total return of the classes may not precisely reflect the class expense differences because of the impact of calculating the net asset values to two decimal places. If net asset values were calculated to three decimal places, the total return differences would more closely reflect the class expense differences. The calculation of net asset values to two decimal places is made in accordance with SEC guidelines and does not result in any gain or loss of value between one class and another. |
| (4) | Annualized. |
See Notes to Financial Statements.
41
| | | | |
| Legacy Focused Large Cap | | | | |
| |
| R Class | | | | |
| For a Share Outstanding Throughout the Years Ended July 31 (except as noted) | | |
| | 2009 | 2008 | 2007 | 2006(1) |
| Per-Share Data | | | | |
| Net Asset Value, Beginning of Period | $11.99 | $12.47 | $10.10 | $10.00 |
| Income From Investment Operations | | | | |
| Net Investment Income (Loss)(2) | —(3) | 0.01 | 0.07 | 0.01 |
| Net Realized and Unrealized Gain (Loss) | (3.75) | 0.08 | 2.33 | 0.09 |
| Total From Investment Operations | (3.75) | 0.09 | 2.40 | 0.10 |
| Distributions | | | | |
| From Net Investment Income | — | (0.04) | (0.03) | — |
| From Net Realized Gains | — | (0.46) | — | — |
| From Tax Return of Capital | — | (0.07) | — | — |
| Total Distributions | — | (0.57) | (0.03) | — |
| Net Asset Value, End of Period | $8.24 | $11.99 | $12.47 | $10.10 |
| |
| Total Return(4) | (31.28)% | (0.02)% | 23.82% | 1.00% |
| |
| Ratios/Supplemental Data | | | | |
| Ratio of Operating Expenses to Average Net Assets | 1.61% | 1.61% | 1.60% | 1.60%(5) |
| Ratio of Net Investment Income (Loss) to Average Net Assets | 0.15% | (0.37)% | 0.74% | 0.38%(5) |
| Portfolio Turnover Rate | 305% | 188% | 255% | 30% |
| Net Assets, End of Period (in thousands) | $14 | $64 | $938 | $758 |
| (1) | May 31, 2006 (fund inception) through July 31, 2006. |
| (2) | Computed using average shares outstanding throughout the period. |
| (3) | Per-share amount was less than $0.005. |
| (4) | Total return assumes reinvestment of net investment income and capital gains distributions, if any. Total returns for periods less than one year are not annualized. The total return of the classes may not precisely reflect the class expense differences because of the impact of calculating the net asset values to two decimal places. If net asset values were calculated to three decimal places, the total return differences would more closely reflect the class expense differences. The calculation of net asset values to two decimal places is made in accordance with SEC guidelines and does not result in any gain or loss of value between one class and another. |
| (5) | Annualized. |
See Notes to Financial Statements.
42
| | | | |
| Legacy Large Cap | | | | |
| |
| Investor Class | | | | |
| For a Share Outstanding Throughout the Years Ended July 31 (except as noted) | | |
| | 2009 | 2008 | 2007 | 2006(1) |
| Per-Share Data | | | | |
| Net Asset Value, Beginning of Period | $11.60 | $11.90 | $10.15 | $10.00 |
| Income From Investment Operations | | | | |
| Net Investment Income (Loss)(2) | 0.07 | 0.01 | 0.08 | 0.01 |
| Net Realized and Unrealized Gain (Loss) | (3.37) | 0.41 | 1.73 | 0.14 |
| Total From Investment Operations | (3.30) | 0.42 | 1.81 | 0.15 |
| Distributions | | | | |
| From Net Investment Income | — | (0.03) | (0.06) | — |
| From Net Realized Gains | — | (0.61) | — | — |
| From Tax Return of Capital | — | (0.08) | — | — |
| Total Distributions | — | (0.72) | (0.06) | — |
| Net Asset Value, End of Period | $8.30 | $11.60 | $11.90 | $10.15 |
| |
| Total Return(3) | (28.45)% | 3.07% | 17.83% | 1.50% |
| |
| Ratios/Supplemental Data | | | | |
| Ratio of Operating Expenses to Average Net Assets | 1.10% | 1.11% | 1.10% | 1.10%(4) |
| Ratio of Net Investment Income (Loss) to Average Net Assets | 0.83% | 0.10% | 0.72% | 0.66%(4) |
| Portfolio Turnover Rate | 283% | 175% | 246% | 39% |
| Net Assets, End of Period (in thousands) | $7,714 | $13,487 | $5,887 | $2,180 |
| (1) | May 31, 2006 (fund inception) through July 31, 2006. |
| (2) | Computed using average shares outstanding throughout the period. |
| (3) | Total return assumes reinvestment of net investment income and capital gains distributions, if any. Total returns for periods less than one year are not annualized. The total return of the classes may not precisely reflect the class expense differences because of the impact of calculating the net asset values to two decimal places. If net asset values were calculated to three decimal places, the total return differences would more closely reflect the class expense differences. The calculation of net asset values to two decimal places is made in accordance with SEC guidelines and does not result in any gain or loss of value between one class and another. |
| (4) | Annualized. |
See Notes to Financial Statements.
43
| | | | |
| Legacy Large Cap | | | | |
| |
| Institutional Class | | | | |
| For a Share Outstanding Throughout the Years Ended July 31 (except as noted) | | |
| | 2009 | 2008 | 2007 | 2006(1) |
| Per-Share Data | | | | |
| Net Asset Value, Beginning of Period | $11.61 | $11.92 | $10.15 | $10.00 |
| Income From Investment Operations | | | | |
| Net Investment Income (Loss)(2) | 0.08 | 0.04 | 0.10 | 0.01 |
| Net Realized and Unrealized Gain (Loss) | (3.37) | 0.40 | 1.74 | 0.14 |
| Total From Investment Operations | (3.29) | 0.44 | 1.84 | 0.15 |
| Distributions | | | | |
| From Net Investment Income | — | (0.04) | (0.07) | — |
| From Net Realized Gains | — | (0.61) | — | — |
| From Tax Return of Capital | — | (0.10) | — | — |
| Total Distributions | — | (0.75) | (0.07) | — |
| Net Asset Value, End of Period | $8.32 | $11.61 | $11.92 | $10.15 |
| |
| Total Return(3) | (28.34)% | 3.19% | 18.16% | 1.50% |
| |
| Ratios/Supplemental Data | | | | |
| Ratio of Operating Expenses to Average Net Assets | 0.90% | 0.91% | 0.90% | 0.90%(4) |
| Ratio of Net Investment Income (Loss) to Average Net Assets | 1.03% | 0.30% | 0.92% | 0.86%(4) |
| Portfolio Turnover Rate | 283% | 175% | 246% | 39% |
| Net Assets, End of Period (in thousands) | $699 | $947 | $899 | $761 |
| (1) | May 31, 2006 (fund inception) through July 31, 2006. |
| (2) | Computed using average shares outstanding throughout the period. |
| (3) | Total return assumes reinvestment of net investment income and capital gains distributions, if any. Total returns for periods less than one year are not annualized. The total return of the classes may not precisely reflect the class expense differences because of the impact of calculating the net asset values to two decimal places. If net asset values were calculated to three decimal places, the total return differences would more closely reflect the class expense differences. The calculation of net asset values to two decimal places is made in accordance with SEC guidelines and does not result in any gain or loss of value between one class and another. |
| (4) | Annualized. |
See Notes to Financial Statements.
44
| | | | |
| Legacy Large Cap | | | | |
| |
| Advisor Class | | | | |
| For a Share Outstanding Throughout the Years Ended July 31 (except as noted) | | |
| | 2009 | 2008 | 2007 | 2006(1) |
| Per-Share Data | | | | |
| Net Asset Value, Beginning of Period | $11.58 | $11.88 | $10.14 | $10.00 |
| Income From Investment Operations | | | | |
| Net Investment Income (Loss)(2) | 0.04 | (0.02) | 0.05 | 0.01 |
| Net Realized and Unrealized Gain (Loss) | (3.36) | 0.41 | 1.73 | 0.13 |
| Total From Investment Operations | (3.32) | 0.39 | 1.78 | 0.14 |
| Distributions | | | | |
| From Net Investment Income | — | (0.02) | (0.04) | — |
| From Net Realized Gains | — | (0.61) | — | — |
| From Tax Return of Capital | — | (0.06) | — | — |
| Total Distributions | — | (0.69) | (0.04) | — |
| Net Asset Value, End of Period | $8.26 | $11.58 | $11.88 | $10.14 |
| |
| Total Return(3) | (28.67)% | 2.81% | 17.59% | 1.40% |
| |
| Ratios/Supplemental Data | | | | |
| Ratio of Operating Expenses to Average Net Assets | 1.35% | 1.36% | 1.35% | 1.35%(4) |
| Ratio of Net Investment Income (Loss) to Average Net Assets | 0.58% | (0.15)% | 0.47% | 0.41%(4) |
| Portfolio Turnover Rate | 283% | 175% | 246% | 39% |
| Net Assets, End of Period (in thousands) | $278 | $1,304 | $895 | $761 |
| (1) | May 31, 2006 (fund inception) through July 31, 2006. |
| (2) | Computed using average shares outstanding throughout the period. |
| (3) | Total return assumes reinvestment of net investment income and capital gains distributions, if any. Total returns for periods less than one year are not annualized. The total return of the classes may not precisely reflect the class expense differences because of the impact of calculating the net asset values to two decimal places. If net asset values were calculated to three decimal places, the total return differences would more closely reflect the class expense differences. The calculation of net asset values to two decimal places is made in accordance with SEC guidelines and does not result in any gain or loss of value between one class and another. |
| (4) | Annualized. |
See Notes to Financial Statements.
45
| | | | |
| Legacy Large Cap | | | | |
| |
| R Class | | | | |
| For a Share Outstanding Throughout the Years Ended July 31 (except as noted) | | |
| | 2009 | 2008 | 2007 | 2006(1) |
| Per-Share Data | | | | |
| Net Asset Value, Beginning of Period | $11.56 | $11.87 | $10.14 | $10.00 |
| Income From Investment Operations | | | | |
| Net Investment Income (Loss)(2) | 0.03 | (0.05) | 0.02 | —(3) |
| Net Realized and Unrealized Gain (Loss) | (3.36) | 0.40 | 1.73 | 0.14 |
| Total From Investment Operations | (3.33) | 0.35 | 1.75 | 0.14 |
| Distributions | | | | |
| From Net Investment Income | — | (0.02) | (0.02) | —(3) |
| From Net Realized Gains | — | (0.61) | — | — |
| From Tax Return of Capital | — | (0.03) | — | — |
| Total Distributions | — | (0.66) | (0.02) | —(3) |
| Net Asset Value, End of Period | $8.23 | $11.56 | $11.87 | $10.14 |
| |
| Total Return(4) | (28.81)% | 2.47%�� | 17.33% | 1.40% |
| |
| Ratios/Supplemental Data | | | | |
| Ratio of Operating Expenses to Average Net Assets | 1.60% | 1.61% | 1.60% | 1.60%(5) |
| Ratio of Net Investment Income (Loss) to Average Net Assets | 0.33% | (0.40)% | 0.22% | 0.16%(5) |
| Portfolio Turnover Rate | 283% | 175% | 246% | 39% |
| Net Assets, End of Period (in thousands) | $651 | $915 | $903 | $760 |
| (1) | May 31, 2006 (fund inception) through July 31, 2006. |
| (2) | Computed using average shares outstanding throughout the period. |
| (3) | Per-share amount was less than $0.005. |
| (4) | Total return assumes reinvestment of net investment income and capital gains distributions, if any. Total returns for periods less than one year are not annualized. The total return of the classes may not precisely reflect the class expense differences because of the impact of calculating the net asset values to two decimal places. If net asset values were calculated to three decimal places, the total return differences would more closely reflect the class expense differences. The calculation of net asset values to two decimal places is made in accordance with SEC guidelines and does not result in any gain or loss of value between one class and another. |
| (5) | Annualized. |
See Notes to Financial Statements.
46
| | | | |
| Legacy Multi Cap | | | | |
| |
| Investor Class | | | | |
| For a Share Outstanding Throughout the Years Ended July 31 (except as noted) | | |
| | 2009 | 2008 | 2007 | 2006(1) |
| Per-Share Data | | | | |
| Net Asset Value, Beginning of Period | $11.72 | $12.60 | $9.94 | $10.00 |
| Income From Investment Operations | | | | |
| Net Investment Income (Loss)(2) | 0.11 | (0.02) | (0.02) | 0.01 |
| Net Realized and Unrealized Gain (Loss) | (4.04) | (0.69) | 2.72 | (0.07) |
| Total From Investment Operations | (3.93) | (0.71) | 2.70 | (0.06) |
| Distributions | | | | |
| From Net Investment Income | — | — | (0.04) | — |
| From Net Realized Gains | — | (0.17) | — | — |
| Total Distributions | — | (0.17) | (0.04) | — |
| Net Asset Value, End of Period | $7.79 | $11.72 | $12.60 | $9.94 |
| |
| Total Return(3) | (33.53)% | (5.78)% | 27.21% | (0.60)% |
| |
| Ratios/Supplemental Data | | | | |
| Ratio of Operating Expenses to Average Net Assets | 1.15% | 1.16% | 1.15% | 1.15%(4) |
| Ratio of Net Investment Income (Loss) to Average Net Assets | 1.42% | (0.17)% | (0.16)% | 0.99%(4) |
| Portfolio Turnover Rate | 267% | 173% | 230% | 14% |
| Net Assets, End of Period (in thousands) | $22,726 | $35,392 | $36,240 | $2,801 |
| (1) | May 31, 2006 (fund inception) through July 31, 2006. |
| (2) | Computed using average shares outstanding throughout the period. |
| (3) | Total return assumes reinvestment of net investment income and capital gains distributions, if any. Total returns for periods less than one year are not annualized. The total return of the classes may not precisely reflect the class expense differences because of the impact of calculating the net asset values to two decimal places. If net asset values were calculated to three decimal places, the total return differences would more closely reflect the class expense differences. The calculation of net asset values to two decimal places is made in accordance with SEC guidelines and does not result in any gain or loss of value between one class and another. |
| (4) | Annualized. |
See Notes to Financial Statements.
47
| | | | |
| Legacy Multi Cap | | | | |
| |
| Institutional Class | | | | |
| For a Share Outstanding Throughout the Years Ended July 31 (except as noted) | | |
| | 2009 | 2008 | 2007 | 2006(1) |
| Per-Share Data | | | | |
| Net Asset Value, Beginning of Period | $11.76 | $12.61 | $9.94 | $10.00 |
| Income From Investment Operations | | | | |
| Net Investment Income (Loss)(2) | 0.12 | (0.01) | 0.02 | 0.02 |
| Net Realized and Unrealized Gain (Loss) | (4.05) | (0.67) | 2.70 | (0.08) |
| Total From Investment Operations | (3.93) | (0.68) | 2.72 | (0.06) |
| Distributions | | | | |
| From Net Investment Income | — | — | (0.05) | — |
| From Net Realized Gains | — | (0.17) | — | — |
| Total Distributions | — | (0.17) | (0.05) | — |
| Net Asset Value, End of Period | $7.83 | $11.76 | $12.61 | $9.94 |
| |
| Total Return(3) | (33.42)% | (5.53)% | 27.45% | (0.60)% |
| |
| Ratios/Supplemental Data | | | | |
| Ratio of Operating Expenses to Average Net Assets | 0.95% | 0.96% | 0.95% | 0.95%(4) |
| Ratio of Net Investment Income (Loss) to Average Net Assets | 1.62% | 0.03% | 0.04% | 1.19%(4) |
| Portfolio Turnover Rate | 267% | 173% | 230% | 14% |
| Net Assets, End of Period (in thousands) | $28 | $27 | $633 | $497 |
| (1) | May 31, 2006 (fund inception) through July 31, 2006. |
| (2) | Computed using average shares outstanding throughout the period. |
| (3) | Total return assumes reinvestment of net investment income and capital gains distributions, if any. Total returns for periods less than one year are not annualized. The total return of the classes may not precisely reflect the class expense differences because of the impact of calculating the net asset values to two decimal places. If net asset values were calculated to three decimal places, the total return differences would more closely reflect the class expense differences. The calculation of net asset values to two decimal places is made in accordance with SEC guidelines and does not result in any gain or loss of value between one class and another. |
| (4) | Annualized. |
See Notes to Financial Statements.
48
| | | | |
| Legacy Multi Cap | | | | |
| |
| Advisor Class | | | | |
| For a Share Outstanding Throughout the Years Ended July 31 (except as noted) | | |
| | 2009 | 2008 | 2007 | 2006(1) |
| Per-Share Data | | | | |
| Net Asset Value, Beginning of Period | $11.67 | $12.58 | $9.94 | $10.00 |
| Income From Investment Operations | | | | |
| Net Investment Income (Loss)(2) | 0.07 | (0.05) | (0.03) | 0.01 |
| Net Realized and Unrealized Gain (Loss) | (4.01) | (0.69) | 2.69 | (0.07) |
| Total From Investment Operations | (3.94) | (0.74) | 2.66 | (0.06) |
| Distributions | | | | |
| From Net Investment Income | — | — | (0.02) | — |
| From Net Realized Gains | — | (0.17) | — | — |
| Total Distributions | — | (0.17) | (0.02) | — |
| Net Asset Value, End of Period | $7.73 | $11.67 | $12.58 | $9.94 |
| |
| Total Return(3) | (33.76)% | (6.03)% | 26.83% | (0.60)% |
| |
| Ratios/Supplemental Data | | | | |
| Ratio of Operating Expenses to Average Net Assets | 1.40% | 1.41% | 1.40% | 1.40%(4) |
| Ratio of Net Investment Income (Loss) to Average Net Assets | 1.17% | (0.42)% | (0.41)% | 0.74%(4) |
| Portfolio Turnover Rate | 267% | 173% | 230% | 14% |
| Net Assets, End of Period (in thousands) | $1,081 | $751 | $853 | $618 |
| (1) | May 31, 2006 (fund inception) through July 31, 2006. |
| (2) | Computed using average shares outstanding throughout the period. |
| (3) | Total return assumes reinvestment of net investment income and capital gains distributions, if any. Total returns for periods less than one year are not annualized. The total return of the classes may not precisely reflect the class expense differences because of the impact of calculating the net asset values to two decimal places. If net asset values were calculated to three decimal places, the total return differences would more closely reflect the class expense differences. The calculation of net asset values to two decimal places is made in accordance with SEC guidelines and does not result in any gain or loss of value between one class and another. |
| (4) | Annualized. |
See Notes to Financial Statements.
49
| | | | |
| Legacy Multi Cap | | | | |
| |
| R Class | | | | |
| For a Share Outstanding Throughout the Years Ended July 31 (except as noted) | | |
| | 2009 | 2008 | 2007 | 2006(1) |
| Per-Share Data | | | | |
| Net Asset Value, Beginning of Period | $11.61 | $12.56 | $9.93 | $10.00 |
| Income From Investment Operations | | | | |
| Net Investment Income (Loss)(2) | 0.07 | (0.08) | (0.06) | 0.01 |
| Net Realized and Unrealized Gain (Loss) | (4.01) | (0.70) | 2.70 | (0.08) |
| Total From Investment Operations | (3.94) | (0.78) | 2.64 | (0.07) |
| Distributions | | | | |
| From Net Investment Income | — | — | (0.01) | — |
| From Net Realized Gains | — | (0.17) | — | — |
| Total Distributions | — | (0.17) | (0.01) | — |
| Net Asset Value, End of Period | $7.67 | $11.61 | $12.56 | $9.93 |
| |
| Total Return(3) | (33.94)% | (6.36)% | 26.58% | (0.70)% |
| |
| Ratios/Supplemental Data | | | | |
| Ratio of Operating Expenses to Average Net Assets | 1.65% | 1.66% | 1.65% | 1.65%(4) |
| Ratio of Net Investment Income (Loss) to Average Net Assets | 0.92% | (0.67)% | (0.66)% | 0.49%(4) |
| Portfolio Turnover Rate | 267% | 173% | 230% | 14% |
| Net Assets, End of Period (in thousands) | $41 | $65 | $641 | $497 |
| (1) | May 31, 2006 (fund inception) through July 31, 2006. |
| (2) | Computed using average shares outstanding throughout the period. |
| (3) | Total return assumes reinvestment of net investment income and capital gains distributions, if any. Total returns for periods less than one year are not annualized. The total return of the classes may not precisely reflect the class expense differences because of the impact of calculating the net asset values to two decimal places. If net asset values were calculated to three decimal places, the total return differences would more closely reflect the class expense differences. The calculation of net asset values to two decimal places is made in accordance with SEC guidelines and does not result in any gain or loss of value between one class and another. |
| (4) | Annualized. |
See Notes to Financial Statements.
50
|
| Report of Independent Registered Public Accounting Firm |
The Board of Directors and Shareholders, American Century Growth Funds, Inc.:
We have audited the accompanying statements of assets and liabilities, including the schedules of investments, of American Century Growth Funds, Inc. (the “Corporation”), comprising the Legacy Focused Large Cap Fund, Legacy Large Cap Fund and Legacy Multi Cap Fund, as of July 31, 2009, and the related statements of operations for the year then ended, the statements of changes in net assets for each of the two years in the period then ended, and the financial highlights for each of the three years in the period then ended and for the period May 31, 2006 (inception of the funds) through July 31, 2006. These financial statements and financial highlights are the responsibility of the Corporation’s management. Our responsibility is to express an opinion on these financial statements and financial highlights based on our audits.
We conducted our audits in accordance with the standards of the Public Company Accounting Oversight Board (United States). Those standards require that we plan and perform the audit to obtain reasonable assurance about whether the financial statements and financial highlights are free of material misstatement. The Corporation is not required to have, nor were we engaged to perform, an audit of its internal control over financial reporting. Our audits included consideration of internal control over financial reporting as a basis for designing audit procedures that are appropriate in the circumstances, but not for the purpose of expressing an opinion on the effectiveness of the Corporation’s internal control over financial reporting. Accordingly, we express no such opinion. An audit also includes examining, on a test basis, evidence supporting the amounts and disclosures in the financial statements, assessing the accounting principles used and significant estimates made by management, as well as evaluating the overall financial statement presentation. Our procedures included confirmation of securities owned as of July 31, 2009, by correspondence with the custodian. We believe that our audits provide a reasonable basis for our opinion.
In our opinion, the financial statements and financial highlights referred to above present fairly, in all material respects, the respective financial positions of each of the funds constituting American Century Growth Funds, Inc. as of July 31, 2009, the results of their operations for the year then ended, the changes in their net assets for each of the two years in the period then ended, and the financial highlights for each of the three years in the period then ended and for the period May 31, 2006 through July 31, 2006, in conformity with accounting principles generally accepted in the United States of America.
Deloitte & Touche LLP
Kansas City, Missouri
September 28, 2009
51
The individuals listed below serve as directors or officers of the funds. Each director serves until his or her successor is duly elected and qualified or until he or she retires. Mandatory retirement age for independent directors is 72. Those listed as interested directors are “interested” primarily by virtue of their engagement as directors and/or officers of, or ownership interest in, American Century Companies, Inc. (ACC) or its wholly owned, direct or indirect, subsidiaries, including the funds’ investment advisor, American Century Investment Management, Inc. (ACIM); the funds’ principal underwriter, American Century Investment Services, Inc. (ACIS); and the funds’ transfer agent, American Century Services, LLC (ACS).
The other directors (more than three-fourths of the total number) are independent; that is, they have never been employees, directors or officers of, and have no financial interest in, ACC or any of its wholly owned, direct or indirect, subsidiaries, including ACIM, ACIS and ACS. The directors serve in this capacity for seven registered investment companies in the American Century Investments family of funds.
All persons named as officers of the funds also serve in similar capacities for the other 14 registered investment companies in the American Century Investments family of funds advised by ACIM or American Century Global Investment Management, Inc. (ACGIM), a wholly owned subsidiary of ACIM, unless otherwise noted. Only officers with policy-making functions are listed. No officer is compensated for his or her service as an officer of the funds. The listed officers are interested persons of the funds and are appointed or re-appointed on an annual basis.
Interested Directors
James E. Stowers, Jr., 4500 Main Street, Kansas City, MO 64111
Year of Birth: 1924
Position(s) Held with Funds: Director (since 1958) and Vice Chairman (since 2007)
Principal Occupation(s) During Past 5 Years: Founder, Co-Chairman, Director and Controlling
Shareholder, ACC; Co-Vice Chairman, ACC (January 2005 to February 2007);
Chairman, ACC (January 1995 to December 2004); Director, ACIM, ACGIM, ACS,
ACIS and other ACC subsidiaries
Number of Portfolios in Fund Complex Overseen by Director: 63
Other Directorships Held by Director: None
Jonathan S. Thomas, 4500 Main Street, Kansas City, MO 64111
Year of Birth: 1963
Position(s) Held with Funds: Director (since 2007) and President (since 2007)
Principal Occupation(s) During Past 5 Years: President and Chief Executive Officer, ACC
(March 2007 to present); Chief Administrative Officer, ACC (February 2006 to
February 2007); Executive Vice President, ACC (November 2005 to February 2007).
Also serves as: President, Chief Executive Officer and Director, ACS; Executive
Vice President, ACIM and ACGIM; Director, ACIM, ACGIM, ACIS and other ACC
subsidiaries. Managing Director, Morgan Stanley (March 2000 to November 2005)
Number of Portfolios in Fund Complex Overseen by Director: 103
Other Directorships Held by Director: None
52
Independent Directors
Thomas A. Brown, 4500 Main Street, Kansas City, MO 64111
Year of Birth: 1940
Position(s) Held with Funds: Director (since 1980)
Principal Occupation(s) During Past 5 Years: Managing Member, Associated Investments, LLC
(real estate investment company); Managing Member, Brown Cascade Properties,
LLC (real estate investment company); Retired, Area Vice President, Applied
Industrial Technologies (bearings and power transmission company)
Number of Portfolios in Fund Complex Overseen by Director: 63
Other Directorships Held by Director: None
Andrea C. Hall, Ph.D., 4500 Main Street, Kansas City, MO 64111
Year of Birth: 1945
Position(s) Held with Funds: Director (since 1997)
Principal Occupation(s) During Past 5 Years: Retired, Advisor to the President, Midwest
Research Institute (not-for-profit, contract research organization)
Number of Portfolios in Fund Complex Overseen by Director: 63
Other Directorships Held by Director: None
James A. Olson, 4500 Main Street, Kansas City, MO 64111
Year of Birth: 1942
Position(s) Held with Funds: Director (since 2007)
Principal Occupation(s) During Past 5 Years: Member, Plaza Belmont LLC (private equity
fund manager); Chief Financial Officer, Plaza Belmont LLC (September 1999 to
September 2006)
Number of Portfolios in Fund Complex Overseen by Director: 63
Other Directorships Held by Director: Saia, Inc. and Entertainment Properties Trust
Donald H. Pratt, 4500 Main Street, Kansas City, MO 64111
Year of Birth: 1937
Position(s) Held with Funds: Director (since 1995) and Chairman of the Board (since 2005)
Principal Occupation(s) During Past 5 Years: Chairman and Chief Executive Officer, Western
Investments, Inc. (real estate company); Retired Chairman of the Board, Butler
Manufacturing Company (metal buildings producer)
Number of Portfolios in Fund Complex Overseen by Director: 63
Other Directorships Held by Director: None
Gale E. Sayers, 4500 Main Street, Kansas City, MO 64111
Year of Birth: 1943
Position(s) Held with Funds: Director (since 2000)
Principal Occupation(s) During Past 5 Years: President, Chief Executive Officer and Founder,
Sayers40, Inc. (technology products and services provider)
Number of Portfolios in Fund Complex Overseen by Director: 63
Other Directorships Held by Director: None
M. Jeannine Strandjord, 4500 Main Street, Kansas City, MO 64111
Year of Birth: 1945
Position(s) Held with Funds: Director (since 1994)
Principal Occupation(s) During Past 5 Years: Retired, formerly Senior Vice President, Sprint
Corporation (telecommunications company)
Number of Portfolios in Fund Complex Overseen by Director: 63
Other Directorships Held by Director: DST Systems, Inc.; Euronet Worldwide, Inc. and
Charming Shoppes, Inc.
53
John R. Whitten, 4500 Main Street, Kansas City, MO 64111
Year of Birth: 1946
Position(s) Held with Funds: Director (since 2008)
Principal Occupation(s) During Past 5 Years: Project Consultant, Celanese Corp. (industrial
chemical company) (September 2004 to January 2005)
Number of Portfolios in Fund Complex Overseen by Director: 63
Other Directorships Held by Director: Rudolph Technologies, Inc.
Officers
Barry Fink, 4500 Main Street, Kansas City, MO 64111
Year of Birth: 1955
Position(s) Held with Funds: Executive Vice President (since 2007)
Principal Occupation(s) During Past 5 Years: Chief Operating Officer and Executive Vice
President, ACC (September 2007 to present); President, ACS (October 2007 to
present); Managing Director, Morgan Stanley (2000 to 2007); Global General
Counsel, Morgan Stanley (2000 to 2006). Also serves as: Director, ACC, ACS, ACIS
and other ACC subsidiaries
Maryanne Roepke, 4500 Main Street, Kansas City, MO 64111
Year of Birth: 1956
Position(s) Held with Funds: Chief Compliance Officer (since 2006) and Senior Vice
President (since 2000)
Principal Occupation(s) During Past 5 Years: Chief Compliance Officer, ACIM, ACGIM and ACS
(August 2006 to present); Assistant Treasurer, ACC (January 1995 to August 2006); and
Treasurer and Chief Financial Officer, various American Century Investments funds
(July 2000 to August 2006). Also serves as: Senior Vice President, ACS
Charles A. Etherington, 4500 Main Street, Kansas City, MO 64111
Year of Birth: 1957
Position(s) Held with Funds: General Counsel (since 2007) and Senior Vice President
(since 2006)
Principal Occupation(s) During Past 5 Years: Attorney, ACC (February 1994 to present); Vice
President, ACC (November 2005 to present); General Counsel, ACC (March 2007
to present). Also serves as: General Counsel, ACIM, ACGIM, ACS, ACIS and other
ACC subsidiaries; and Senior Vice President, ACIM, ACGIM and ACS
Robert Leach, 4500 Main Street, Kansas City, MO 64111
Year of Birth: 1966
Position(s) Held with Funds: Vice President, Treasurer and Chief Financial Officer
(all since 2006)
Principal Occupation(s) During Past 5 Years: Vice President, ACS (February 2000 to
present); and Controller, various American Century Investments funds (1997
to September 2006)
Jon Zindel, 4500 Main Street, Kansas City, MO 64111
Year of Birth: 1967
Position(s) Held with Funds: Tax Officer (since 1998)
Principal Occupation(s) During Past 5 Years: Chief Financial Officer and Chief Accounting
Officer, ACC (March 2007 to present); Vice President, ACC (October 2001 to
present); Vice President, certain ACC subsidiaries (October 2001 to August 2006);
Vice President, Corporate Tax, ACS (April 1998 to August 2006). Also serves as:
Chief Financial Officer, Chief Accounting Officer and Senior Vice President, ACIM,
ACGIM, ACS and other ACC subsidiaries; and Chief Accounting Officer and Senior
Vice President, ACIS
54
David H. Reinmiller, 4500 Main Street, Kansas City, MO 64111
Year of Birth: 1963
Position(s) Held with Funds: Vice President (since September 2000)
Principal Occupation(s) During Past 5 Years: Attorney, ACC (January 1994 to present);
Associate General Counsel, ACC (January 2001 to present); Chief Compliance
Officer, American Century Investments funds, ACIM and ACGIM (January 2001 to
February 2005). Also serves as: Associate General Counsel, ACIM, ACGIM, ACS,
ACIS and other ACC subsidiaries; and Vice President, ACIM, ACGIM and ACS
Ward Stauffer, 4500 Main Street, Kansas City, MO 64111
Year of Birth: 1960
Position(s) Held with Funds: Secretary (since February 2005)
Principal Occupation(s) During Past 5 Years: Attorney, ACC (June 2003 to present)
The SAI has additional information about the funds’ directors and is available without charge, upon request, by calling 1-800-345-2021.
55
|
| Approval of Management Agreements |
Under Section 15(c) of the Investment Company Act, contracts for investment advisory services are required to be reviewed, evaluated and approved by a majority of a fund’s independent directors (the “Directors”) each year. At American Century Investments, this process is referred to as the “15(c) Process.” As a part of this process, the board reviews fund performance, shareholder services, audit and compliance information, and a variety of other reports from the advisor concerning fund operations. In addition to this annual review, the board of directors oversees and evaluates on a continuous basis at its quarterly meetings the nature and quality of significant services performed by the advisor, fund performance, audit and compliance information, and a variety of other reports relating to fund operations. The board, or committees of the board, also holds special meetings as needed.
Under a Securities and Exchange Commission rule, each fund is required to disclose in its annual or semiannual report, as appropriate, the material factors and conclusions that formed the basis for the board’s approval or renewal of any advisory agreements within the fund’s most recently completed fiscal half-year period.
Annual Contract Review Process
As part of the annual 15(c) Process undertaken during the most recent fiscal half-year period, the Directors reviewed extensive data and information compiled by the advisor and certain independent providers of evaluative data (the “15(c) Providers”) concerning Legacy Focused Large Cap, Legacy Large Cap, and Legacy Multi Cap (the “Funds”) and the services provided to the Funds under the management agreement. The information considered and the discussions held at the meetings included, but were not limited to:
• the nature, extent and quality of investment management, shareholder services and other services provided to the Funds;
• the wide range of programs and services the advisor provides to the Funds and their shareholders on a routine and non-routine basis;
• the compliance policies, procedures, and regulatory experience of the advisor;
• data comparing the cost of owning the Funds to the cost of owning a similar fund;
• data comparing the Funds’ performance to appropriate benchmarks and/or a peer group of other mutual funds with similar investment objectives and strategies;
• financial data showing the profitability of the Funds to the advisor and the overall profitability of the advisor;
• data comparing services provided and charges to other investment management clients of the advisor; and
56
• consideration of collateral benefits derived by the advisor from the management of the Funds and any potential economies of scale relating thereto.
In keeping with its practice, the Funds’ board of directors held two in-person meetings and one telephonic meeting to review and discuss the information provided. The board also had the benefit of the advice of its independent counsel throughout the period.
Factors Considered
The Directors considered all of the information provided by the advisor, the 15(c) Providers, and the board’s independent counsel, and evaluated such information for each fund for which the board has responsibility. In connection with their review of the Funds, the Directors did not identify any single factor as being all-important or controlling, and each Director may have attributed different levels of importance to different factors. In deciding to renew the management agreement under the terms ultimately determined by the board to be appropriate, the Directors’ decision was based on the following factors.
Nature, Extent and Quality of Services — Generally. Under the management agreement, the advisor is responsible for providing or arranging for all services necessary for the operation of the Funds. The board noted that under the management agreement, the advisor provides or arranges at its own expense a wide variety of services including:
• Fund construction and design
• portfolio security selection
• initial capitalization/funding
• securities trading
• Fund administration
• custody of Fund assets
• daily valuation of each Fund’s portfolio
• shareholder servicing and transfer agency, including shareholder confirmations, recordkeeping and communications
• legal services
• regulatory and portfolio compliance
• financial reporting
• marketing and distribution
57
The Directors noted that many of the services provided by the advisor have expanded over time both in terms of quantity and complexity in response to shareholder demands, competition in the industry and the changing regulatory environment. They discussed with the advisor the challenges presented by these changes and the impact on the Funds. In performing their evaluation, the Directors considered information received in connection with the annual review, as well as information provided on an ongoing basis at their regularly scheduled board and committee meetings.
Investment Management Services. The nature of the investment management services provided to the Funds is quite complex and allows Fund shareholders access to professional money management, instant diversification of their investments, and liquidity. In evaluating investment performance, the board expects the advisor to manage the Funds in accordance with its investment objectives and approved strategies. Further, the Directors recognize that the advisor has an obligation to monitor trading activities, and in particular to seek the best execution of fund trades, and to evaluate the use of and payment for research. In providing these services, the advisor utilizes teams of investment professionals (portfolio managers, analysts, research assistants, and securities traders) who require extensive information technology, research, training, com pliance and other systems to conduct their business. At each quarterly meeting the Directors review investment performance information for the Funds, together with comparative information for appropriate benchmarks and/or peer groups of funds managed similarly to the Funds. The Directors also review detailed performance information during the 15(c) Process comparing each Fund’s performance with that of similar funds not managed by the advisor. If performance concerns are identified, the Directors discuss with the advisor the reasons for such results (e.g., market conditions, security selection) and any efforts being undertaken to improve performance. Each Fund’s performance was above the median for its peer group for the three year period and below the median for the one year period. The board discussed the funds’ performance with the advisor and was satisfied with the efforts being undertaken by the advisor. The board will continue to monitor these efforts and the performance of the Funds. Mo re detailed information about the Funds’ performance can be found in the Performance and Portfolio Commentary sections of this report.
Shareholder and Other Services. The advisor provides the Funds with a comprehensive package of transfer agency, shareholder, and other services. The Directors review reports and evaluations of such services at their regular quarterly meetings, including the annual meeting concerning contract review, and reports to the board. These reports include, but are not limited to, information regarding the operational efficiency and accuracy of the shareholder and transfer agency services provided, staffing levels, shareholder satisfaction (as measured by external as well as internal sources), technology support, new products and services offered to Fund shareholders, securities trading activities, portfolio valuation services, auditing services, and legal and operational compliance activities. Certain aspects of shareholder and transfer agency serv ice level efficiency and the quality of securities trading activities are measured by independent third party providers and are presented in comparison to other fund groups not managed by the advisor.
58
Costs of Services Provided and Profitability. The advisor provides detailed information concerning its cost of providing various services to the Funds, its profitability in managing the Funds, its overall profitability, and its financial condition. The Directors have reviewed with the advisor the methodology used to prepare this financial information. This financial information regarding the advisor is considered in order to evaluate the advisor’s financial condition, its ability to continue to provide services under the management agreement, and the reasonableness of the current management fee. The board concluded that the advisor’s profits were reasonable in light of the services provided to the Funds.
Ethics. The Directors generally consider the advisor’s commitment to providing quality services to shareholders and to conducting its business ethically. They noted that the advisor’s practices generally meet or exceed industry best practices.
Economies of Scale. The Directors review information provided by the advisor regarding the possible existence of economies of scale in connection with the management of the Funds. The Directors concluded that economies of scale are difficult to measure and predict with precision, especially on a fund-by-fund basis. The analysis of economies of scale is further complicated by the additional services and content provided by the advisor and its reinvestment in its ability to provide and expand those services. Accordingly, the Directors seek to evaluate economies of scale by reviewing other information, such as year-over-year profitability of the advisor generally, the profitability of its management of the Funds specifically, the expenses incurred by the advisor in providing various functions to the Funds, and the fees of competitive funds no t managed by the advisor. The Directors believe the advisor is appropriately sharing economies of scale through its competitive fee structure, fee breakpoints as each Fund increases in size, and through reinvestment in its business to provide shareholders additional content and services.
Comparison to Other Funds’ Fees. The Funds pay the advisor a single, all-inclusive (or unified) management fee for providing all services necessary for the management and operation of the Funds, other than brokerage expenses, taxes, interest, extraordinary expenses, and the fees and expenses of each Fund’s independent directors (including their independent legal counsel). Under the unified fee structure, the advisor is responsible for providing all investment advisory, custody, audit, administrative, compliance, record-keeping, marketing and shareholder services, or arranging and supervising third parties to provide such services. By contrast, most other funds are charged a variety of fees, including an investment advisory fee, a transfer agency fee, an administrative fee, distribution charges and other expenses. Other than their investment advisory fees and Rule 12b-1 distribution fees, all other components of the total fees charged by these other funds may be increased without shareholder approval. The board believes the unified fee structure is a benefit to Fund shareholders because it clearly discloses to shareholders the cost of owning Fund shares, and, since the unified fee cannot be increased without a vote of Fund shareholders, it shifts to the advisor the risk of increased costs of operating the Fund and provides a direct incentive to minimize administrative inefficiencies. Part of the Directors’ analysis of fee levels involves reviewing certain evaluative data compiled
59
by a 15(c) Provider comparing each Fund’s unified fee to the total expense ratio of other funds in the Fund’s peer group and performing a regression analysis to evaluate the effect of fee breakpoints as assets under management increase. The unified fees charged to shareholders of Legacy Focused Large Cap and Legacy Multi Cap were below the median of the total expense ratios of their peer groups. The unified fee charged to shareholders of Legacy Large Cap was above the median of the total expense ratios of its peer group. In addition, the Directors also reviewed updated fee level data provided by the advisor, but recognized that comparative data was particularly difficult to evaluate given the significant market developments during the past year. The board concluded that the management fee paid by each Fund to the advisor was reasonable in light of the services provided to the Fund.
Comparison to Fees and Services Provided to Other Clients of the Advisor. The Directors also requested and received information from the advisor concerning the nature of the services, fees, and profitability of its advisory services to advisory clients other than the Funds. They observed that these varying types of client accounts require different services and involve different regulatory and entrepreneurial risks than the management of the Funds. The Directors analyzed this information and concluded that the fees charged and services provided to the Funds were reasonable by comparison.
Collateral Benefits Derived by the Advisor. The Directors considered the existence of collateral benefits the advisor may receive as a result of its relationship with the Funds. They concluded that the advisor’s primary business is managing mutual funds and it generally does not use fund or shareholder information to generate profits in other lines of business, and therefore does not derive any significant collateral benefits from them. The Directors noted that the advisor receives proprietary research from broker-dealers that execute fund portfolio transactions and concluded that this research is likely to benefit fund shareholders. The Directors also determined that the advisor is able to provide investment management services to certain clients other than the Funds, at least in part, due to its existing infrastructure built to serv e the fund complex. The Directors concluded, however, that the assets of those other clients are not material to the analysis and, in any event, are included with the assets of the Funds to determine breakpoints in each Fund’s fee schedule, provided they are managed using the same investment team and strategy.
Conclusions of the Directors
As a result of this process, the board, including all of the independent directors, in the absence of particular circumstances and assisted by the advice of legal counsel that is independent of the advisor, taking into account all of the factors discussed above and the information provided by the advisor concluded that the investment management agreement between each Fund and the advisor is fair and reasonable in light of the services provided and should be renewed.
60
Retirement Account Information
As required by law, distributions you receive from certain IRAs, or 403(b), 457 and qualified plans are subject to federal income tax withholding, unless you elect not to have withholding apply. Tax will be withheld on the total amount withdrawn even though you may be receiving amounts that are not subject to withholding, such as nondeductible contributions. In such case, excess amounts of withholding could occur. You may adjust your withholding election so that a greater or lesser amount will be withheld.
If you don’t want us to withhold on this amount, you must notify us to not withhold the federal income tax. You may notify us in writing or in certain situations by telephone or through other electronic means. You have the right to revoke your withholding election at any time and any election you make may remain in effect until revoked by filing a new election.
Remember, even if you elect not to have income tax withheld, you are liable for paying income tax on the taxable portion of your withdrawal. If you elect not to have income tax withheld or you don’t have enough income tax withheld, you may be responsible for payment of estimated tax. You may incur penalties under the estimated tax rules if your withholding and estimated tax payments are not sufficient. You can reduce or defer the income tax on a distribution by directly or indirectly rolling such distribution over to another IRA or eligible plan. You should consult your tax advisor for additional information.
State tax will be withheld if, at the time of your distribution, your address is within one of the mandatory withholding states and you have federal income tax withheld. State taxes will be withheld from your distribution in accordance with the respective state rules.
Proxy Voting Guidelines
American Century Investment Management, Inc., the funds’ investment advisor, is responsible for exercising the voting rights associated with the securities purchased and/or held by the funds. A description of the policies and procedures the advisor uses in fulfilling this responsibility is available without charge, upon request, by calling 1-800-345-2021. It is also available on American Century Investments’ website at americancentury.com and on the Securities and Exchange Commission’s website at sec.gov. Information regarding how the investment advisor voted proxies relating to portfolio securities during the most recent 12-month period ended June 30 is available on the “About Us” page at americancentury.com. It is also available at sec.gov.
Quarterly Portfolio Disclosure
The funds file their complete schedule of portfolio holdings with the Securities and Exchange Commission (SEC) for the first and third quarters of each fiscal year on Form N-Q. The funds’ Forms N-Q are available on the SEC’s website at sec.gov, and may be reviewed and copied at the SEC’s Public Reference Room in Washington, DC. Information on the operation of the Public Reference Room may be obtained by calling 1-800-SEC-0330. The funds also make their complete schedule of portfolio holdings for the most recent quarter of their fiscal year available on their website at americancentury.com and, upon request, by calling 1-800-345-2021.
61
The following indices are used to illustrate investment market, sector, or style performance or to serve as fund performance comparisons. They are not investment products available for purchase.
Morgan Stanley Capital International (MSCI) has developed several indices that measure the performance of foreign stock markets.
The MSCI EAFE (Europe, Australasia, Far East) Index is designed to measure developed market equity performance, excluding the U.S. and Canada.
The MSCI EM (Emerging Markets) Index represents the performance of stocks in global emerging market countries.
The Russell 1000® Index is a market-capitalization weighted, large-cap index created by Frank Russell Company to measure the performance of the 1,000 largest publicly traded U.S. companies, based on total market capitalization.
The Russell 1000® Growth Index measures the performance of those Russell 1000 Index companies (the 1,000 largest publicly traded U.S. companies, based on total market capitalization) with higher price-to-book ratios and higher forecasted growth values.
The Russell 2000® Index is a market-capitalization weighted index created by Frank Russell Company to measure the performance of the 2,000 smallest of the 3,000 largest publicly traded U.S. companies, based on total market capitalization.
The Russell 3000® Index measures the performance of the 3,000 largest U.S. companies based on total market capitalization, which represents approximately 98% of the investable U.S. equity market.
The Russell 3000® Growth Index measures the performance of those Russell 3000 Index companies (the 3,000 largest U.S. companies based on total market capitalization) with higher price-to-book ratios and higher forecasted growth values.
The Russell Midcap® Index measures the performance of the 800 smallest of the 1,000 largest publicly traded U.S. companies, based on total market capitalization.
The S&P 500 Index is a market value-weighted index of the stocks of 500 publicly traded U.S. companies chosen for market size, liquidity, and industry group representation that are considered to be leading firms in dominant industries. Each stock’s weight in the index is proportionate to its market value. Created by Standard & Poor’s, it is considered to be a broad measure of U.S. stock market performance.
62

| |
| |
| Contact Us | |
| americancentury.com | |
| Automated Information Line | 1-800-345-8765 |
| Investor Services Representative | 1-800-345-2021 or |
| | 816-531-5575 |
| Business, Not-For-Profit, Employer-Sponsored | |
| Retirement Plans | 1-800-345-3533 |
| Banks and Trust Companies, Broker-Dealers, | |
| Financial Professionals, Insurance Companies | 1-800-345-6488 |
| Telecommunications Device for the Deaf | 1-800-634-4113 |
| American Century Growth Funds, Inc. | |
| Investment Advisor: | |
| American Century Investment Management, Inc. | |
| Kansas City, Missouri | |
This report and the statements it contains are submitted for the general
information of our shareholders. The report is not authorized for distribution to
prospective investors unless preceded or accompanied by an effective prospectus.
American Century Investment Services, Inc., Distributor
©2009 American Century Proprietary Holdings, Inc. All rights reserved.
0909
CL-ANN-66294N
ITEM 2. CODE OF ETHICS.
| | |
| (a) | The registrant has adopted a Code of Ethics for Senior Financial Officers that applies to the |
| | registrant’s principal executive officer, principal financial officer, principal accounting officer, |
| | and persons performing similar functions. |
| (b) | No response required. |
| (c) | None. | |
| (d) | None. | |
| (e) | Not applicable. |
| (f) | The registrant’s Code of Ethics for Senior Financial Officers was filed as Exhibit 12 (a)(1) to |
| | American Century Asset Allocation Portfolios, Inc.’s Annual Certified Shareholder Report on |
| | Form N-CSR, File No. 811-21591, on September 29, 2005, and is incorporated herein by |
| | reference. | |
|
| ITEM 3. AUDIT COMMITTEE FINANCIAL EXPERT. |
|
| (a)(1) | The registrant’s board has determined that the registrant has at least one audit committee |
| | financial expert serving on its audit committee. |
| (a)(2) | James A. Olson and Thomas A. Brown are the registrant’s designated audit committee financial |
| | experts. They are “independent” as defined in Item 3 of Form N-CSR. |
| (a)(3) | Not applicable. |
| (b) | No response required. |
| (c) | No response required. |
| (d) | No response required. |
| |
| ITEM 4. PRINCIPAL ACCOUNTANT FEES AND SERVICES. |
|
| (a) | Audit Fees. | |
| The aggregate fees billed for each of the last two fiscal years for professional services rendered by the |
| principal accountant for the audit of the registrant’s annual financial statements or services that are |
| normally provided by the accountant in connection with statutory and regulatory filings or engagements |
| for those fiscal years were as follows: |
| | FY 2008: | $45,980 |
| | FY 2009: | $44,065 |
| | |
| (b) | Audit-Related Fees. |
| |
| The aggregate fees billed in each of the last two fiscal years for assurance and related services by the |
| principal accountant that are reasonably related to the performance of the audit of the registrant’s |
| financial statements and are not reported under paragraph (a) of this Item were as follows: |
| |
| | For services rendered to the registrant: |
| |
| | FY 2008: | $0 |
| | FY 2009: | $0 |
| |
| | Fees required to be approved pursuant to paragraph (c)(7)(ii) of Rule 2-01 of Regulation S-X |
| | (relating to certain engagements for non-audit services with the registrant’s investment adviser |
| | and its affiliates): |
| |
| | FY 2008: | $0 |
| | FY 2009: | $0 |
| |
| (c) | Tax Fees. | |
| |
| The aggregate fees billed in each of the last two fiscal years for professional services rendered by the |
| principal accountant for tax compliance, tax advice, and tax planning were as follows: |
| |
| | For services rendered to the registrant: |
| |
| | FY 2008: | $0 |
| | FY 2009: | $0 |
| |
| | Fees required to be approved pursuant to paragraph (c)(7)(ii) of Rule 2-01 of Regulation S-X |
| | (relating to certain engagements for non-audit services with the registrant’s investment adviser |
| | and its affiliates): |
| |
| | FY 2008: | $0 |
| | FY 2009: | $0 |
| |
| |
| (d) | All Other Fees. |
| |
| The aggregate fees billed in each of the last two fiscal years for products and services provided by the |
| principal accountant, other than the services reported in paragraphs (a) through (c) of this Item were as |
| follows: | | |
| |
| | For services rendered to the registrant: |
| |
| | FY 2008: | $0 |
| | FY 2009: | $0 |
| |
| | Fees required to be approved pursuant to paragraph (c)(7)(ii) of Rule 2-01 of Regulation S-X |
| | (relating to certain engagements for non-audit services with the registrant’s investment adviser |
| | and its affiliates): |
| |
| | FY 2008: | $0 |
| | FY 2009: | $0 |
| | |
| (e)(1) | In accordance with paragraph (c)(7)(i)(A) of Rule 2-01 of Regulation S-X, before the |
| | accountant is engaged by the registrant to render audit or non-audit services, the engagement is |
| | approved by the registrant’s audit committee. Pursuant to paragraph (c)(7)(ii) of Rule 2-01 of |
| | Regulation S-X, the registrant’s audit committee also pre-approves its accountant’s |
| | engagements for non-audit services with the registrant’s investment adviser, its parent company, |
| | and any entity controlled by, or under common control with the investment adviser that |
| | provides ongoing services to the registrant, if the engagement relates directly to the operations |
| | and financial reporting of the registrant. |
| |
| (e)(2) | All services described in each of paragraphs (b) through (d) of this Item were pre-approved |
| | before the engagement by the registrant’s audit committee pursuant to paragraph (c)(7)(i)(A) of |
| | Rule 2-01 of Regulation S-X. Consequently, none of such services were required to be |
| | approved by the audit committee pursuant to paragraph (c)(7)(i)(C). |
| |
| (f) | The percentage of hours expended on the principal accountant’s engagement to audit the |
| | registrant’s financial statements for the most recent fiscal year that were attributed to work |
| | performed by persons other than the principal accountant’s full-time, permanent employees was |
| | less than 50%. | |
| |
| (g) | The aggregate non-audit fees billed by the registrant’s accountant for services rendered to the |
| | registrant, and rendered to the registrant’s investment adviser (not including any sub-adviser |
| | whose role is primarily portfolio management and is subcontracted with or overseen by another |
| | investment adviser), and any entity controlling, controlled by, or under common control with |
| | the adviser that provides ongoing services to the registrant for each of the last two fiscal years |
| | of the registrant were as follows: |
| |
| | FY 2008: | $75,493 |
| | FY 2009: | $81,217 |
| |
| (h) | The registrant’s investment adviser and accountant have notified the registrant’s audit |
| | committee of all non-audit services that were rendered by the registrant’s accountant to the |
| | registrant’s investment adviser, its parent company, and any entity controlled by, or under |
| | common control with the investment adviser that provides services to the registrant, which |
| | services were not required to be pre-approved pursuant to paragraph (c)(7)(ii) of Rule 2-01 of |
| | Regulation S-X. The notification provided to the registrant’s audit committee included |
| | sufficient details regarding such services to allow the registrant’s audit committee to consider |
| | the continuing independence of its principal accountant. |
| |
| ITEM 5. AUDIT COMMITTEE OF LISTED REGISTRANTS. |
| |
| Not applicable. | |
| |
| ITEM 6. INVESTMENTS. |
| |
| (a) | The schedule of investments is included as part of the report to stockholders filed under Item 1 |
| | of this Form. | |
| |
| (b) | Not applicable. |
| |
| ITEM 7. DISCLOSURE OF PROXY VOTING POLICIES AND PROCEDURES FOR |
| CLOSED-END MANAGEMENT INVESTMENT COMPANIES. |
| |
| Not applicable. |
| |
| ITEM 8. PORTFOLIO MANAGERS OF CLOSED-END MANAGEMENT |
| INVESTMENT COMPANIES. |
| |
| Not applicable. |
| |
| ITEM 9. PURCHASES OF EQUITY SECURITIES BY CLOSED-END MANAGEMENT |
| INVESTMENT COMPANY AND AFFILIATED PURCHASERS. |
| |
| Not applicable. |
| |
| ITEM 10. SUBMISSION OF MATTERS TO A VOTE OF SECURITY HOLDERS. |
| |
| During the reporting period, there were no material changes to the procedures by which shareholders may |
| recommend nominees to the registrant’s board. |
| |
| ITEM 11. CONTROLS AND PROCEDURES. |
| |
| (a) | The registrant's principal executive officer and principal financial officer have concluded that |
| | the registrant's disclosure controls and procedures (as defined in Rule 30a-3(c) under the |
| | Investment Company Act of 1940) are effective based on their evaluation of these controls and |
| | procedures as of a date within 90 days of the filing date of this report. |
| |
| (b) | There were no changes in the registrant's internal control over financial reporting (as defined in |
| | Rule 30a-3(d) under the Investment Company Act of 1940) that occurred during the registrant's |
| | second fiscal quarter of the period covered by this report that have materially affected, or are |
| | reasonably likely to materially affect, the registrant's internal control over financial reporting. |
| |
| ITEM 12. EXHIBITS. |
| |
| (a)(1) | Registrant’s Code of Ethics for Senior Financial Officers, which is the subject of the disclosure |
| | required by Item 2 of Form N-CSR, was filed as Exhibit 12(a)(1) to American Century Asset |
| | Allocation Portfolios, Inc.’s Certified Shareholder Report on Form N-CSR, File No. 811-21591, |
| | on September 29, 2005. |
| |
| (a)(2) | Separate certifications by the registrant’s principal executive officer and principal financial |
| | officer, pursuant to Section 302 of the Sarbanes-Oxley Act of 2002 and Rule 30a-2(a) under the |
| | Investment Company Act of 1940, are filed and attached hereto as EX-99.CERT. |
| |
| (a)(3) | Not applicable. |
| |
| (b) | A certification by the registrant’s chief executive officer and chief financial officer, pursuant to |
| | Section 906 of the Sarbanes-Oxley Act of 2002, is furnished and attached hereto as EX- |
| | 99.906CERT. |
SIGNATURES
Pursuant to the requirements of the Securities Exchange Act of 1934 and the Investment Company Act of 1940, the registrant has duly caused this report to be signed on its behalf by the undersigned, thereunto duly authorized.
| | |
| Registrant: | AMERICAN CENTURY GROWTH FUNDS, INC. |
| |
| |
| By: | /s/ Jonathan S. Thomas |
| | Name: | Jonathan S. Thomas |
| | Title: | President |
| |
| Date: | September 29, 2009 |
Pursuant to the requirements of the Securities Exchange Act of 1934 and the Investment Company Act of 1940, this report has been signed below by the following persons on behalf of the registrant and in the capacities and on the dates indicated.
| | |
| By: | /s/ Jonathan S. Thomas |
| | Name: | Jonathan S. Thomas |
| | Title: | President |
| | | (principal executive officer) |
| |
| Date: | September 29, 2009 |
| | |
| By: | /s/ Robert J. Leach |
| | Name: | Robert J. Leach |
| | Title: | Vice President, Treasurer, and |
| | | Chief Financial Officer |
| | | (principal financial officer) |
| |
| Date: | September 29, 2009 |