united states
securities and exchange commission
washington, d.c. 20549
form n-csr
certified shareholder report of registered management
investment companies
Investment Company Act file number 811-21872
Mutual Fund Series Trust
(Exact name of registrant as specified in charter)
225 Pictoria Drive, Suite 450, Cincinnati, Ohio 45246
(Address of principal executive offices) (Zip code)
CT CORPORATION SYSTEM
1300 EAST NINTH STREET, CLEVELAND, OH 44114
(Name and address of agent for service)
Registrant's telephone number, including area code: 631-490-4300
Date of fiscal year end: 9/30
Date of reporting period: 3/31/24
ITEM 1. REPORTS TO SHAREHOLDERS.
| | | |
| | | |
| | | |
| | | |
| | | |
| | | |
| | | |
| | | |
| | | |
| | | |
| | | |
| | | |
| | | |
| | | |
| | | |
| |  | |
| | | |
| | | |
| | | |
| | | |
| | | |
| | | |
| | | |
| | | |
| | Empiric Fund | |
| | | |
| | | |
| | | |
| | | |
| | | |
| | | |
| | | |
| | | |
| | Semi-Annual Report | |
| | March 31, 2024 | |
| | | |
| | | |
| | | |
| | | |
| | | |
| | | |
| | | |
| | | |
| | | |
| | | |
| | | |
| | | |
| | | |
| | | |

The Empiric Fund Class “A” shares for the last quarter and last six months ending March 31st, was up 7.31% and 17.76%, respectively. The MSCI US Small Index for the last quarter and last six months ending March 31st, was up 5.56% and 20.04%, respectively.
With a national election less than five months away, it’s easy to get swept up in the sound and fury of politics. As a citizen-voter, make your choices. As an investor, however, you must take a step back from politics, be objective, and look at the economy independently of the political winds.
With that being said, the performance of the U.S. economy will surely be a major campaign issue this summer and fall. The indicators are not quite as strong as late last year, but still show more positive signs than negative. According to the U.S. Bureau of Economic Analysis, real GDP increased at an annual rate of 1.6% in the Q1 2024, down from 3.4% in Q4 of 2023.
Inflation is less than half of its rate two years ago, but it’s not as low as business and government would like it to be. The inflation rate was 3.1% in February and 3.4% in March, according to the U.S. Bureau of Labor Statistics. These levels are higher than the long-term inflation target of the Federal Reserve of about 2%. The Fed has indicated it will probably not reduce interest rates until inflation slows down. The key Fed rate remains at 5.3%, the highest in 20 years, and this is discouraging some consumer spending and corporate investment.
Due to stubborn inflation, recently we have seen a drop in consumer confidence. The Conference Board reported last week that the Consumer Price Index for March 2024 was its lowest in almost two years, with respondents specifically citing food and gasoline cost increases. It should be noted that food and gasoline are among the most volatile prices, so looking at a month or two of data is not the best way to forecast the economy.
The economy seems to be sustaining a better post-Covid recovery than had been expected. It grew strongly last year, and it’s still growing now, though more slowly. A recession seems unlikely; but the picture could be better. Inflation and high interest rates remain troublesome to households and companies. In addition, unanticipated global conflicts have been costly and are interfering with a wide range of raw materials production, manufacturing activity and trade.
Investors can think of the U.S. and global economies as a theater stage; it’s where the action of the economy occurs. But it’s important to remember that individual companies are the actors on the stage. They can react and respond to circumstances, sometimes even in advance of events they see coming. We think this is why smart investors focus on individual companies with proven track records of success.
NLD-05/14/2024
We have endless examples of companies doing quite well under challenging economic conditions and other companies failing to take advantage of immense opportunities.
High-quality companies succeed under a wide variety of conditions because they have strong market positions, excellent strategies and strong implementation – in short, great leadership. Empiric Advisors seeks to identify and invest in those high-quality companies. Let’s look at one of them in our portfolio.
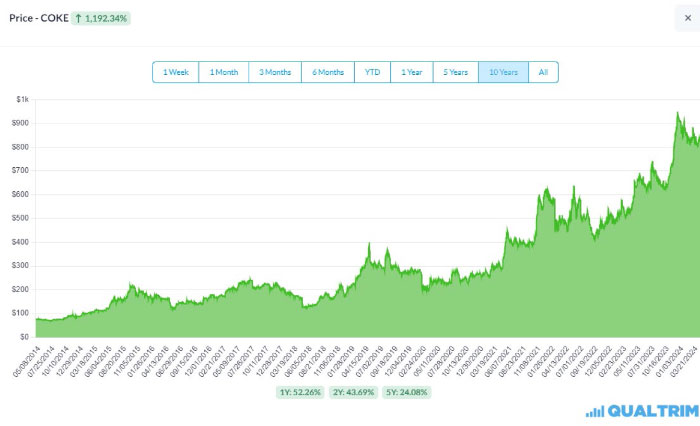
We purchased for the Fund 1307 shares of Coca-Cola Consolidated (COKE) in July and August of 2020 for a total cost of a little less than $300,000. With the Covid pandemic, 2020 was a pretty good year to buy, though buying 3 months earlier would have been better. The value of COKE currently is about $1.2 million. We should note that not every stock we buy has done as well as COKE.
Our strategy is to buy quality companies at a reasonable price that can continue growing earnings and cash flows.
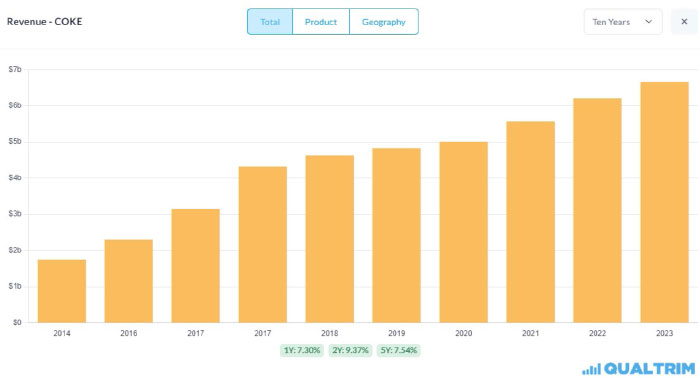
With any investment, growing revenues are always a good place to start. COKE revenues have not grown fast, but have grown consistently, increasing every year for the last 10 years.
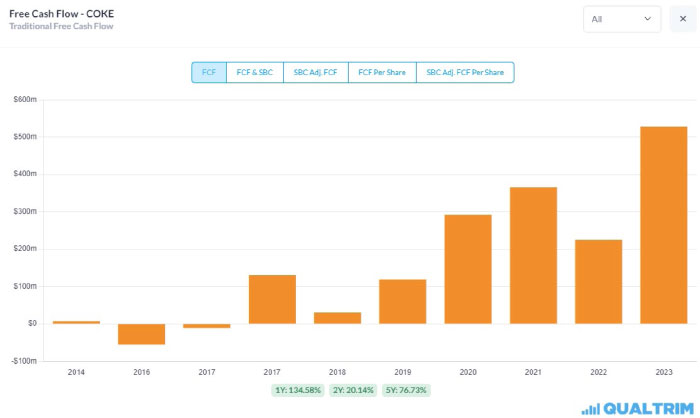
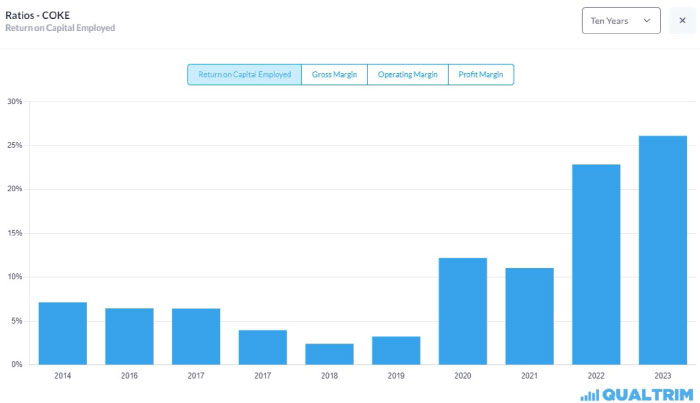
Free Cash Flows have grown quickly, up 76.7% over the last five years. Additionally, the Return on Capital Employed has gone from an acceptable 12% to an outstanding 25% in 2023. The combination of high FCF growth along with the surge in profitability has, we think, driven the stock price.
COKE is the type of business we like to own—steady growth, a business unlikely to be obsolete any time soon, highly profitable, and producing lots of Free Cash Flow. We think that FCF is a better
NLD-05/14/2024
measure of net profits. FCF has no adjustments or accruals that are used in net profits to make net profits look better.
NLD-05/14/2024
For the six-month period, the five stocks that have most contributed and well as the five stocks which have detracted the most are as follows:
| Highest Contributors | Highest Detractors |
| United Rentals | Extreme Networks |
| Coca-Cola Consolidated | Calix |
| Fair Isaac | Denbury |
| Lincoln Electric | AMN Healthcare |
| Bruker | Crown Holdings |
Finally, we manage the Fund to minimize capital gain distributions. For 2023, there were no capital gain distributions. For 2022, the distribution was tiny. While we cannot always avoid distributions, we work hard to keep them small.
Your Fund managers are top holders of the Fund. We appreciate you investing with us.
Respectfully submitted,
| Mark A Coffelt, CFA | Loren M Coffelt |
| | |
| Co-Portfolio Manager | Co-Portfolio Manager |
NLD-05/14/2024
Empiric Fund
PORTFOLIO REVIEW (Unaudited)
March 31, 2024
Average Annual Total Return through March 31, 2024*, as compared to its benchmark:
| | 6 Month Return | 1 Year Return | 5 Year Return | 10 Year Return | Since Inception (a) |
| Empiric Fund Class A | 17.76% | 18.30% | 9.48% | 7.88% | 9.05% |
| Empiric Fund Class A with Load(b) | 10.99% | 11.50% | 8.19% | 7.24% | 8.82% |
| MSCI USA Small Cap Index(c) | 20.04% | 19.89% | 9.60% | 8.64% | N/A |
| * | The performance data quoted here represents past performance. Current performance may be lower or higher than the performance data quoted above. Investment return and principal value will fluctuate, so that shares, when redeemed, may be worth more or less than their original cost. The returns shown do not reflect the deduction of taxes that a shareholder would pay on Fund distributions or on the redemptions of Fund shares. Past performance is no guarantee of future results. For performance information current to the most recent month-end, please call toll-free 1-888-839-7424. The Fund’s expense ratio, as of the February 1, 2023 prospectus, is 2.12% for Class A shares. For more current information on the Fund’s expense ratio, please see the Financial Highlights. |
| (a) | Class A commenced operations on November 6, 1995. |
| (b) | Class A shares are subject to a maximum sales load of 5.75%, which decreases depending on the amount invested and a maximum deferred sales charge of 1.00%. |
| (c) | The MSCI USA Small Cap Index is designed to measure the performance of the small cap segment of the U.S equity market. This index is not available back to the inception of Class A shares. Investors cannot invest directly in an index. |
Empiric Fund
PORTFOLIO REVIEW (Unaudited) (Continued)
March 31, 2024
Average Annual Total Return through March 31, 2024*, as compared to its benchmark:
| | 6 Month Return | 1 Year Return | 5 Year Return | 10 Year Return | Since Inception (a) |
| Empiric Fund Class C | 17.32% | 17.39% | 8.66% | 7.07% | 5.98% |
| MSCI USA Small Cap Index(b) | 20.04% | 19.89% | 9.60% | 8.64% | N/A |
| * | The performance data quoted here represents past performance. Current performance may be lower or higher than the performance data quoted above. Investment return and principal value will fluctuate, so that shares, when redeemed, may be worth more or less than their original cost. The returns shown do not reflect the deduction of taxes that a shareholder would pay on Fund distributions or on the redemptions of Fund shares. Past performance is no guarantee of future results. For performance information current to the most recent month-end, please call toll-free 1-888-839-7424. The Fund’s expense ratio, as of the February 1, 2023 prospectus, is 2.87% for Class C shares. For more current information on the Fund’s expense ratio, please see the Financial Highlights. |
| (a) | Class C commenced operations on October 7, 2005. |
| (b) | The MSCI USA Small Cap Index is designed to measure the performance of the small cap segment of the U.S equity market. This index is not available back to the inception of Class C shares. Investors cannot invest directly in an index. |
Empiric Fund Portfolio Weightings (Unaudited)
March 31, 2024
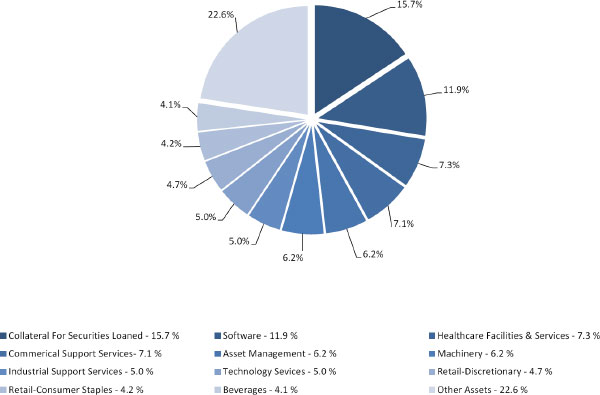
The percentages in the above chart are based on the portfolio holdings as a percentage of net assets of the Fund as of March 31, 2024 and are subject to change.
| EMPIRIC FUND |
| SCHEDULE OF INVESTMENTS (Unaudited) |
| March 31, 2024 |
| Shares | | | | | Fair Value | |
| | | | | COMMON STOCKS — 89.7% | | | | |
| | | | | ADVERTISING & MARKETING - 2.4% | | | | |
| | 19,563 | | | Interpublic Group of Companies, Inc. (The)(a) | | $ | 638,341 | |
| | | | | | | | | |
| | | | | ASSET MANAGEMENT - 6.2% | | | | |
| | 4,104 | | | Ares Management Corporation, Class A(a) | | | 545,750 | |
| | 4,250 | | | LPL Financial Holdings, Inc. | | | 1,122,850 | |
| | | | | | | | 1,668,600 | |
| | | | | BEVERAGES - 4.1% | | | | |
| | 1,307 | | | Coca-Cola Consolidated, Inc. | | | 1,106,258 | |
| | | | | | | | | |
| | | | | BIOTECH & PHARMA - 1.2% | | | | |
| | 8,166 | | | Halozyme Therapeutics, Inc.(b) | | | 332,193 | |
| | | | | | | | | |
| | | | | CHEMICALS - 1.7% | | | | |
| | 1,988 | | | Avery Dennison Corporation | | | 443,821 | |
| | | | | | | | | |
| | | | | COMMERCIAL SUPPORT SERVICES - 7.1% | | | | |
| | 3,545 | | | AMN Healthcare Services, Inc.(b) | | | 221,598 | |
| | 4,205 | | | Brink’s Company (The) | | | 388,458 | |
| | 9,910 | | | Robert Half, Inc. | | | 785,665 | |
| | 3,836 | | | TriNet Group, Inc.(b) | | | 508,231 | |
| | | | | | | | 1,903,952 | |
| | | | | CONTAINERS & PACKAGING - 1.3% | | | | |
| | 4,288 | | | Crown Holdings, Inc. | | | 339,867 | |
| | | | | | | | | |
| | | | | ELECTRICAL EQUIPMENT - 2.3% | | | | |
| | 2,529 | | | A O Smith Corporation | | | 226,244 | |
| | 1,677 | | | Generac Holdings, Inc.(a),(b) | | | 211,537 | |
| | 437 | | | Hubbell, Inc. | | | 181,377 | |
| | | | | | | | 619,158 | |
| | | | | ENGINEERING & CONSTRUCTION - 3.3% | | | | |
| | 3,412 | | | Quanta Services, Inc. | | | 886,438 | |
| | | | | | | | | |
| | | | | HEALTH CARE FACILITIES & SERVICES - 7.3% | | | | |
| | 435 | | | Chemed Corporation | | | 279,239 | |
| EMPIRIC FUND |
| SCHEDULE OF INVESTMENTS (Unaudited) (Continued) |
| March 31, 2024 |
| Shares | | | | | Fair Value | |
| | | | | COMMON STOCKS — 89.7% (Continued) | | | | |
| | | | | HEALTH CARE FACILITIES & SERVICES - 7.3% (Continued) | | | | |
| | 5,044 | | | Henry Schein, Inc.(b) | | $ | 380,923 | |
| | 1,511 | | | Medpace Holdings, Inc.(b) | | | 610,671 | |
| | 1,705 | | | Molina Healthcare, Inc.(b) | | | 700,465 | |
| | | | | | | | 1,971,298 | |
| | | | | INDUSTRIAL SUPPORT SERVICES - 5.0% | | | | |
| | 1,880 | | | United Rentals, Inc. | | | 1,355,687 | |
| | | | | | | | | |
| | | | | INSURANCE - 1.7% | | | | |
| | 2,394 | | | Assurant, Inc. | | | 450,647 | |
| | | | | | | | | |
| | | | | LEISURE FACILITIES & SERVICES - 3.8% | | | | |
| | 6,036 | | | Dine Brands Global, Inc. | | | 280,553 | |
| | 860 | | | Domino’s Pizza, Inc.(a) | | | 427,317 | |
| | 1,394 | | | Vail Resorts, Inc.(a) | | | 310,625 | |
| | | | | | | | 1,018,495 | |
| | | | | MACHINERY - 6.2% | | | | |
| | 5,500 | | | Donaldson Company, Inc. | | | 410,740 | |
| | 3,496 | | | Lincoln Electric Holdings, Inc.(a) | | | 893,018 | |
| | 3,872 | | | Toro Company (The)(a) | | | 354,791 | |
| | | | | | | | 1,658,549 | |
| | | | | MEDICAL EQUIPMENT & DEVICES - 4.1% | | | | |
| | 8,068 | | | Bruker Corporation | | | 757,908 | |
| | 6,429 | | | Globus Medical, Inc., Class A(b) | | | 344,852 | |
| | | | | | | | 1,102,760 | |
| | | | | OIL & GAS PRODUCERS - 2.3% | | | | |
| | 3,108 | | | Exxon Mobil Corporation | | | 361,274 | |
| | 640 | | | Murphy USA, Inc. | | | 268,288 | |
| | | | | | | | 629,562 | |
| | | | | RETAIL - CONSUMER STAPLES - 4.2% | | | | |
| | 6,800 | | | BJ’s Wholesale Club Holdings, Inc.(b) | | | 514,420 | |
| | 1,935 | | | Casey’s General Stores, Inc. | | | 616,201 | |
| | | | | | | | 1,130,621 | |
| | | | | RETAIL - DISCRETIONARY - 4.7% | | | | |
| | 140 | | | AutoZone, Inc.(b) | | | 441,231 | |
| EMPIRIC FUND |
| SCHEDULE OF INVESTMENTS (Unaudited) (Continued) |
| March 31, 2024 |
| Shares | | | | | Fair Value | |
| | | | | COMMON STOCKS — 89.7% (Continued) | | | | |
| | | | | RETAIL - DISCRETIONARY - 4.7% (Continued) | | | | |
| | 400 | | | O’Reilly Automotive, Inc.(b) | | $ | 451,552 | |
| | 1,125 | | | Williams-Sonoma, Inc.(a) | | | 357,221 | |
| | | | | | | | 1,250,004 | |
| | | | | SEMICONDUCTORS - 1.7% | | | | |
| | 4,064 | | | Teradyne, Inc.(a) | | | 458,541 | |
| | | | | | | | | |
| | | | | SOFTWARE - 11.9% | | | | |
| | 13,376 | | | Agilysys, Inc.(b) | | | 1,127,062 | |
| | 13,678 | | | Calix, Inc.(b) | | | 453,562 | |
| | 7,600 | | | CommVault Systems, Inc.(b) | | | 770,868 | |
| | 5,650 | | | Fortinet, Inc.(b) | | | 385,951 | |
| | 2,250 | | | Paycom Software, Inc. | | | 447,773 | |
| | | | | | | | 3,185,216 | |
| | | | | TECHNOLOGY HARDWARE - 0.5% | | | | |
| | 12,298 | | | Extreme Networks, Inc.(b) | | | 141,919 | |
| | | | | | | | | |
| | | | | TECHNOLOGY SERVICES - 5.0% | | | | |
| | 762 | | | Fair Isaac Corporation(a),(b) | | | 952,203 | |
| | 800 | | | Mastercard, Inc., Class A | | | 385,256 | |
| | | | | | | | 1,337,459 | |
| | | | | TRANSPORTATION & LOGISTICS - 1.7% | | | | |
| | 225 | | | GXO Logistics, Inc.(b) | | | 12,096 | |
| | 2,160 | | | Landstar System, Inc. | | | 416,361 | |
| | 225 | | | XPO Logistics, Inc.(b) | | | 27,457 | |
| | | | | | | | 455,914 | |
| | | | | | | | | |
| | | | | TOTAL COMMON STOCKS (Cost $11,143,675) | | | 24,085,300 | |
| EMPIRIC FUND |
| SCHEDULE OF INVESTMENTS (Unaudited) (Continued) |
| March 31, 2024 |
| Shares | | | | | Fair Value | |
| | | | | SHORT-TERM INVESTMENTS — 15.7% | | | | |
| | | | | COLLATERAL FOR SECURITIES LOANED – 15.7% | | | | |
| | 4,225,765 | | | Mount Vernon Liquid Assets Portfolio, LLC, 5.44% (Cost $4,225,765)(c),(d) | | $ | 4,225,765 | |
| | | | | | | | | |
| | | | | TOTAL INVESTMENTS - 105.4% (Cost $15,369,440) | | $ | 28,311,065 | |
| | | | | LIABILITIES IN EXCESS OF OTHER ASSETS - (5.4)% | | | (1,449,122 | ) |
| | | | | NET ASSETS - 100.0% | | $ | 26,861,943 | |
| (a) | All or a portion of the security is on loan. The total fair value of the securities on loan as of March 31, 2024 was $4,149,385. |
| (b) | Non-income producing security. |
| (c) | Rate disclosed is the seven day effective yield as of March 31, 2024. |
| (d) | Security was purchased with cash received as collateral for securities on loan at March 31, 2024. Total collateral had a value of $4,225,765 at March 31, 2024. |
| Empiric Fund |
| STATEMENT OF ASSETS AND LIABILITIES (Unaudited) |
| March 31, 2024 |
| ASSETS | | | |
| Investment securities: (a) | | | | |
| At cost | | $ | 15,369,440 | |
| At fair value | | $ | 28,311,065 | |
| Cash and cash equivalents | | | 2,829,974 | |
| Dividends and interest receivable | | | 23,340 | |
| TOTAL ASSETS | | | 31,164,379 | |
| | | | | |
| LIABILITIES | | | | |
| Payable for collateral from securities loaned | | | 4,225,765 | |
| Payable for Fund shares repurchased | | | 12,823 | |
| Investment advisory fees payable | | | 25,300 | |
| Distribution (12b-1) fees payable | | | 3,402 | |
| Payable to related parties | | | 19,785 | |
| Accrued expenses and other liabilities | | | 15,361 | |
| TOTAL LIABILITIES | | | 4,302,436 | |
| NET ASSETS | | $ | 26,861,943 | |
| | | | | |
| Composition of Net Assets: | | | | |
| Paid in capital | | $ | 13,534,964 | |
| Accumulated earnings | | | 13,326,979 | |
| NET ASSETS | | $ | 26,861,943 | |
| | | | | |
| Net Asset Value Per Share: | | | | |
| Class A Shares: | | | | |
| Net Assets | | $ | 25,579,866 | |
| Shares of beneficial interest outstanding (b) | | | 413,131 | |
| Net asset value (Net Assets ÷ Shares Outstanding) and redemption price per share (c) | | $ | 61.92 | |
| Maximum offering price per share (net asset value plus maximum sales charge of 5.75%) | | $ | 65.70 | |
| Class C Shares: | | | | |
| Net Assets | | $ | 1,282,077 | |
| Shares of beneficial interest outstanding (b) | | | 24,170 | |
| Net asset value (Net Assets ÷ Shares Outstanding), offering price and redemption price per share | | $ | 53.04 | |
| (a) | Includes $4,149,385 of securities out on loan. |
| (b) | Unlimited number of shares of beneficial interest authorized, no par value. |
| (c) | Investments in Class A shares made at or above the $1 million breakpoint are not subject to an initial sales charge and may be subject to a 1.00% contingent deferred sales charge (“CDSC”) on shares redeemed within 12 months after the date of purchase (excluding shares purchased with reinvested dividends and/or distributions). |
See accompanying notes to financial statements.
| Empiric Fund |
| STATEMENT OF OPERATIONS (Unaudited) |
| For the Six Months Ended March 31, 2024 |
| INVESTMENT INCOME | | | | |
| Dividends | | $ | 131,485 | |
| Interest | | | 83,949 | |
| Securities lending income - net | | | 5,226 | |
| TOTAL INVESTMENT INCOME | | | 220,660 | |
| | | | | |
| EXPENSES | | | | |
| Investment advisory fees | | | 125,293 | |
| Distribution(12b-1) fees: | | | | |
| Class A | | | 29,806 | |
| Class C | | | 6,068 | |
| Financial administration/fund accounting fees | | | 40,885 | |
| Legal administration/management services fees | | | 12,529 | |
| Compliance officer fees | | | 10,909 | |
| Legal fees | | | 10,779 | |
| Registration fees | | | 9,150 | |
| Trustees fees and expenses | | | 7,772 | |
| Shareholder service fees | | | 7,521 | |
| Audit Fees | | | 6,818 | |
| Printing and postage expenses | | | 2,857 | |
| Custodian fees | | | 1,781 | |
| Insurance expense | | | 412 | |
| Other expenses | | | 2,552 | |
| TOTAL EXPENSES | | | 275,132 | |
| | | | | |
| NET INVESTMENT LOSS | | | (54,472 | ) |
| | | | | |
| REALIZED AND UNREALIZED GAIN FROM INVESTMENTS | | | | |
| Net realized gain from investments | | | 96,688 | |
| Net realized gain from redemptions in kind | | | 557,115 | |
| Net change in unrealized appreciation on investments | | | 3,543,323 | |
| | | | | |
| NET REALIZED AND UNREALIZED GAIN FROM INVESTMENTS | | | 4,197,126 | |
| | | | | |
| NET INCREASE IN NET ASSETS RESULTING FROM OPERATIONS | | $ | 4,142,654 | |
See accompanying notes to financial statements.
| Empiric Fund |
| STATEMENTS OF CHANGES IN NET ASSETS |
| | | For the | | | For the | |
| | | Six Months Ended | | | Year Ended | |
| | | March 31, 2024 | | | September 30, 2023 | |
| | | (Unaudited) | | | | |
| FROM OPERATIONS | | | | | | | | |
| Net investment loss | | $ | (54,472 | ) | | $ | (265,147 | ) |
| Net realized gain from investments | | | 96,688 | | | | 481,214 | |
| Net realized gain from redemptions in-kind | | | 557,115 | | | | 235,155 | |
| Net change in unrealized appreciation on investments | | | 3,543,323 | | | | 2,936,425 | |
| Net increase in net assets resulting from operations | | | 4,142,654 | | | | 3,387,647 | |
| | | | | | | | | |
| FROM SHARES OF BENEFICIAL INTEREST | | | | | | | | |
| Proceeds from shares sold: | | | | | | | | |
| Class A | | | 894,359 | | | | 588,857 | |
| Payments for shares redeemed: | | | | | | | | |
| Class A | | | (1,820,460 | ) | | | (2,245,938 | ) |
| Class C | | | (59,608 | ) | | | (134,012 | ) |
| Net decrease in net assets from shares of beneficial interest | | | (985,709 | ) | | | (1,791,093 | ) |
| | | | | | | | | |
| TOTAL INCREASE IN NET ASSETS | | | 3,156,945 | | | | 1,596,554 | |
| | | | | | | | | |
| NET ASSETS | | | | | | | | |
| Beginning of Period/Year | | | 23,704,998 | | | | 22,108,444 | |
| End of Period/Year | | $ | 26,861,943 | | | $ | 23,704,998 | |
| | | | | | | | | |
| SHARE ACTIVITY | | | | | | | | |
| Class A: | | | | | | | | |
| Shares Sold | | | 15,476 | | | | 11,174 | |
| Shares Redeemed | | | (31,313 | ) | | | (43,002 | ) |
| Net decrease in shares of beneficial interest outstanding | | | (15,837 | ) | | | (31,828 | ) |
| | | | | | | | | |
| Class C: | | | | | | | | |
| Shares Redeemed | | | (1,158 | ) | | | (2,960 | ) |
| Net decrease in shares of beneficial interest outstanding | | | (1,158 | ) | | | (2,960 | ) |
See accompanying notes to financial statements.
| Empiric Fund |
| FINANCIAL HIGHLIGHTS |
Per Share Data and Ratios for a Share of Beneficial Interest Outstanding Throughout each of the Period/Years Presented
| | | Class A | |
| | | Six Months | | | Year | | | Year | | | Year | | | Year | | | Year | |
| | | Ended | | | Ended | | | Ended | | | Ended | | | Ended | | | Ended | |
| | | March 31, | | | September 30, | | | September 30, | | | September 30, | | | September 30, | | | September 30, | |
| | | 2024 | | | 2023 | | | 2022 | | | 2021 | | | 2020 | | | 2019 | |
| | | (Unaudited) | | | | | | | | | | | | | | | | |
| Net asset value, beginning of period/year | | $ | 52.59 | | | $ | 45.56 | | | $ | 60.07 | | | $ | 45.46 | | | $ | 40.47 | | | $ | 47.39 | |
| Activity from investment operations: | | | | | | | | | | | | | | | | | | | | | | | | |
| Net investment loss (1) | | | (0.11 | ) | | | (0.55 | ) | | | (0.71 | ) | | | (0.68 | ) | | | (0.56 | ) | | | (0.45 | ) |
| Net realized and unrealized gain (loss) on investments | | | 9.44 | | | | 7.58 | | | | (13.49 | ) | | | 19.24 | | | | 5.55 | | | | (6.47 | ) |
| Total from investment operations | | | 9.33 | | | | 7.03 | | | | (14.20 | ) | | | 18.56 | | | | 4.99 | | | | (6.92 | ) |
| Less distributions from: | | | | | | | | | | | | | | | | | | | | | | | | |
| Net realized gains | | | — | | | | — | | | | (0.31 | ) | | | (3.95 | ) | | | — | | | | — | |
| Total distributions | | | — | | | | — | | | | (0.31 | ) | | | (3.95 | ) | | | — | | | | — | |
| Net asset value, end of period/year | | $ | 61.92 | | | $ | 52.59 | | | $ | 45.56 | | | $ | 60.07 | | | $ | 45.46 | | | $ | 40.47 | |
| Total return (2) | | | 17.76 | % (6) | | | 15.43 | % | | | (23.72 | )% | | | 42.05 | % | | | 12.33 | % | | | -14.62 | % |
| Net assets, at end of period/year (000s) | | $ | 25,580 | | | $ | 22,560 | | | $ | 20,992 | | | $ | 28,726 | | | $ | 22,865 | | | $ | 22,346 | |
| Ratio of net expenses to average net assets after waiver (3) | | | 2.16 | % (7) | | | 2.17 | % | | | 2.12 | % | | | 1.96 | % | | | 2.13 | % | | | 2.02 | % |
| Ratio of net investment loss to average net assets (3)(4) | | | (0.40 | )% (7) | | | (1.05 | )% | | | (1.32 | )% | | | (1.17 | )% | | | (1.35 | )% | | | (1.08 | )% |
| Portfolio Turnover Rate (5) | | | 4 | % (6) | | | 8 | % | | | 5 | % | | | 21 | % | | | 119 | % | | | 50 | % |
| (1) | Per share amounts calculated using the average shares method. |
| (2) | Total return in the above table is historical in nature and represents the rate that the investor would have earned or lost on an investment in the Fund assuming reinvestment of dividends and capital gains distributions, if any, and does not reflect the impact of sales charges. Had the adviser not waived a portion of the Fund’s expenses, total returns would have been lower. |
| (3) | The ratios of expenses to average net assets and net investment loss to average net assets do not reflect the expenses of the underlying investment companies in which the Fund invests. |
| (4) | Recognition of net investment income (loss) is affected by the timing and declaration of dividends by the underlying investment companies in which the Fund invests. |
| (5) | In-kind transactions are not included in calculation of turnover. |
See accompanying notes to financial statements.
| Empiric Fund |
| FINANCIAL HIGHLIGHTS |
Per Share Data and Ratios for a Share of Beneficial Interest Outstanding Throughout each of the Period/Years Presented
| | | Class C | |
| | | Six Months | | | Year Ended | | | Year Ended | | | Year | | | Year | | | Year | |
| | | Ended | | | Ended | | | Ended | | | Ended | | | Ended | | | Ended | |
| | | March 31, | | | September 30, | | | September 30, | | | September 30, | | | September 30, | | | September 30, | |
| | | 2024 | | | 2023 | | | 2022 | | | 2021 | | | 2020 | | | 2019 | |
| | | (Unaudited) | | | | | | | | | | | | | | | | |
| Net asset value, beginning of period/year | | $ | 45.22 | | | $ | 39.47 | | | $ | 52.48 | | | $ | 40.40 | | | $ | 36.24 | | | $ | 42.75 | |
| Activity from investment operations: | | | | | | | | | | | | | | | | | | | | | | | | |
| Net investment loss (1) | | | (0.28 | ) | | | (0.81 | ) | | | (0.98 | ) | | | (0.98 | ) | | | (0.78 | ) | | | (0.69 | ) |
| Net realized and unrealized gain (loss) on investments | | | 8.10 | | | | 6.56 | | | | (11.72 | ) | | | 17.01 | | | | 4.94 | | | | (5.82 | ) |
| Total from investment operations | | | 7.82 | | | | 5.75 | | | | (12.70 | ) | | | 16.03 | | | | 4.16 | | | | (6.51 | ) |
| Less distributions from: | | | | | | | | | | | | | | | | | | | | | | | | |
| Net realized gains | | | — | | | | — | | | | (0.31 | ) | | | (3.95 | ) | | | — | | | | — | |
| Total distributions | | | — | | | | — | | | | (0.31 | ) | | | (3.95 | ) | | | — | | | | — | |
| Net asset value, end of period/year | | $ | 53.04 | | | $ | 45.22 | | | $ | 39.47 | | | $ | 52.48 | | | $ | 40.40 | | | $ | 36.24 | |
| Total return (2) | | | 17.32 | % (6) | | | 14.57 | % | | | (24.30 | )% | | | 40.99 | % | | | 11.48 | % | | | (15.25 | )% |
| Net assets, at end of period/year (000s) | | $ | 1,282 | | | $ | 1,145 | | | $ | 1,117 | | | $ | 1,548 | | | $ | 1,166 | | | $ | 1,175 | |
| Ratio of net expenses to average net assets after waiver (3) | | | 2.91 | % (7) | | | 2.92 | % | | | 2.87 | % | | | 2.71 | % | | | 2.88 | % | | | 2.77 | % |
| Ratio of net investment loss to average net assets (3)(4) | | | (1.15 | )% (7) | | | (1.79 | )% | | | (2.07 | )% | | | (1.92 | )% | | | (2.10 | )% | | | (1.83 | )% |
| Portfolio Turnover Rate (5) | | | 4 | % (6) | | | 8 | % | | | 5 | % | | | 21 | % | | | 119 | % | | | 50 | % |
| (1) | Per share amounts calculated using the average shares method. |
| (2) | Total return in the above table is historical in nature and represents the rate that the investor would have earned or lost on an investment in the Fund assuming reinvestment of dividends and capital gains distributions, if any. Had the adviser not waived a portion of the Fund’s expenses, total returns would have been lower. |
| (3) | The ratios of expenses to average net assets and net investment loss to average net assets do not reflect the expenses of the underlying investment companies in which the Fund invests. |
| (4) | Recognition of net investment loss is affected by the timing and declaration of dividends by the underlying investment companies in which the Fund invests. |
| (5) | In-kind transactions are not included in calculation of turnover. |
See accompanying notes to financial statements.
| Empiric Fund |
| NOTES TO FINANCIAL STATEMENTS (Unaudited) |
| March 31, 2024 |
| (1) | ORGANIZATION AND SIGNIFICANT ACCOUNTING POLICIES |
Mutual Fund Series Trust (the “Trust”), was organized as an Ohio business trust on February 27, 2006. The Trust is registered as an open-end management investment company under the Investment Company Act of 1940, as amended, (“1940 Act”). These financial statements include the following series: Empiric Fund (the “Fund”) . The Trust currently consists of thirty-six series. The Fund is a separate diversified series of the Trust. Empiric Advisors, Inc. (the “Adviser”), acts as the investment advisor to the Fund.
The Fund offers two classes of shares: Class A and Class C shares. Each share class represents an interest in the same assets of the Fund, has the same rights and is identical in all material respects except that (i) each class of shares may bear different distribution fees; (ii) each class of shares may be subject to different (or no) sales charges; (iii) certain other class specific expenses will be borne solely by the class to which such expenses are attributable; and (iv) each class has exclusive voting rights with respect to matters relating to its own distribution arrangements. The Fund’s Class A shares commenced operations on November 6, 1995. The Fund’s Class C shares commenced operations on October 7, 2005. Prior to October 7, 2005, the shares of the Fund had no specific class designation. As of that date, all of the then outstanding shares were redesignated as Class A shares. The Fund’s investment objective is to achieve capital appreciation.
The following is a summary of significant accounting policies consistently followed by the Fund which are in accordance with accounting principles generally accepted in the United States of America (“GAAP”). The Fund is an investment company and accordingly follows the Investment Company accounting and reporting guidance of the Financial Accounting Standards Board (“FASB”) Accounting Standards Codification Topic 946, Financial Services - Investment Companies, including FASB Accounting Standards Update (“ASU”) 2013-08.
a) Securities Valuation – Securities listed on an exchange are valued at the last reported sale price at the close of the regular trading session of the exchange on the business day the value is being determined, or in the case of securities listed on NASDAQ, at the NASDAQ Official Closing Price (“NOCP”). In the absence of a sale, such securities shall be valued at the last bid price on the day of valuation. The Fund may invest in portfolios of open-end or closed-end investment companies and exchange traded funds (the “underlying funds”). Open-end funds are valued at their respective net asset values as reported by such investment companies. The underlying funds value securities in their portfolios for which market quotations are readily available at their market values (generally the last reported sale price) and all other securities and assets at their fair value by the methods established by the boards of the underlying funds. The shares of many closed-end investment companies and exchange traded funds, after their initial public offering, frequently trade at a price per share, which is different than the net asset value per share. The difference represents a market premium or market discount of such shares. There can be no assurances that the market discount or market premium on shares of any closed-end investment company or exchange traded fund purchased by the Fund will not change. Short-term debt obligations having 60 days or less remaining until maturity, at time of purchase, may be valued at amortized cost, provided such valuations represent fair value.
In unusual circumstances, instead of valuing securities in the usual manner, the Fund may value securities at “fair value” as determined in good faith by the Board of Trustees (the “Board”), pursuant to the procedures (the “Procedures”) approved by the Board. The Board has designated the adviser as its valuation designee (the “Valuation Designee”) to execute these Procedures. The Procedures consider, among others, the following factors to determine a security’s fair value: the nature and pricing history (if any) of the security; whether any dealer quotations for the security are available; and possible valuation methodologies that could be used to determine the fair value of the security. Fair value may also be used by the Valuation Designee if extraordinary events occur after the close of the relevant world market but prior to the New York Stock Exchange close. The Board may also enlist third party consultants such a valuation specialist at a public accounting firm, valuation consultant or financial officer of a security issuer on an as-needed basis to assist the Valuation Designee in determining a security-specific fair value. The Board is responsible for reviewing and approving fair value methodologies utilized by the Valuation Designee, approval of which shall be based upon whether the Valuation Designee followed the Procedures.
| Empiric Fund |
| NOTES TO FINANCIAL STATEMENTS (Unaudited) (Continued) |
| March 31, 2024 |
The Fund utilizes various methods to measure the fair value of most of its investments on a recurring basis. GAAP establishes a hierarchy that prioritizes inputs to valuation methods. The three levels of input are:
Level 1 – Unadjusted quoted prices in active markets for identical assets and liabilities that the Fund has the ability to access.
Level 2 – Observable inputs other than quoted prices included in Level 1 that are observable for the asset or liability, either directly or indirectly. These inputs may include quoted prices for the identical instrument in an inactive market, prices for similar instruments, interest rates, prepayment speeds, credit risk, yield curves, default rates and similar data.
Level 3 – Unobservable inputs for the asset or liability, to the extent relevant observable inputs are not available, representing the Fund’s own assumptions about the assumptions a market participant would use in valuing the asset or liability, and would be based on the best information available.
The availability of observable inputs can vary from security to security and is affected by a wide variety of factors, including, for example, the type of security, whether the security is new and not yet established in the marketplace, the liquidity of markets, and other characteristics particular to the security. To the extent that valuation is based on models or inputs that are less observable or unobservable in the market, the determination of fair value requires more judgment. Accordingly, the degree of judgment exercised in determining fair value is greatest for instruments categorized in Level 3.
The inputs used to measure fair value may fall into different levels of the fair value hierarchy. In such cases, for disclosure purposes, the level in the fair value hierarchy within which the fair value measurement falls in its entirety, is determined based on the lowest level input that is significant to the fair value measurement in its entirety.
The inputs or methodology used for valuing securities are not necessarily an indication of the risk associated with investing in those securities. The following table summarizes the inputs used as of March 31, 2024 for the Fund’s assets and liabilities measured at fair value:
| Assets | | | | | | | | | | | | |
| | | | | | | | | | | | | |
| Security Classifications (a) | | Level 1 | | | Level 2 | | | Level 3 | | | Totals | |
| Common Stocks | | $ | 24,085,300 | | | $ | — | | | $ | — | | | $ | 24,085,300 | |
| Collateral for Securities Loaned (b) | | | — | | | | — | | | | — | | | | 4,225,765 | |
| Total | | $ | 24,085,300 | | | $ | — | | | $ | — | | | $ | 28,311,065 | |
| (a) | As of and during the six months ended March 31, 2024 the Fund held no securities that were considered to be “Level 3” securities. Therefore, a reconciliation of assets in which significant unobservable inputs (Level 3) were used in determining fair value is not applicable. |
| (b) | The Trust’s officers have elected to adopt ASU 2015-07, Disclosures for Investments in Certain Entities That Calculate Net Asset Value per Share (or Its Equivalent) — a consensus of the Emerging Issues Task Force issued, on May 1, 2015. In accordance with Subtopic 820-10, certain investments that are measured at fair value using the net asset value per share (or its equivalent) have not been classified in the fair value hierarchy. The fair value amount presented in this table is intended to permit reconciliation of the fair value hierarchy to the amounts presented in the Statement of Assets and Liabilities. |
b) Federal Income Tax – As of and during the six months ended March 31, 2024, the Fund did not have a liability for any unrecognized tax expense. The Fund recognizes interest and penalties, if any, related to unrecognized tax expense as income tax expense in the Statement of Operations. As of March 31, 2024 the Fund did not incur any interest or penalties. Management has analyzed the Fund’s tax positions and has concluded that no liability for unrecognized tax benefits should be recorded related to uncertain tax positions taken on returns filed for open tax years September 30, 2021 - September 30, 2023 or expected to be taken in the Fund’s September 30, 2024 tax returns. The tax filings are open for examination by applicable taxing authorities, U.S. federal, Ohio and foreign jurisdictions. No examination of the Fund’s tax returns is presently in progress.
c) Distribution to Shareholders – Distributions of net investment income and capital gains to shareholders, which are determined in accordance with income tax regulations and may differ from GAAP, are recorded on the ex-dividend date and are distributed on an annual basis.
d) Multiple Class Allocations – Income, non-class specific expenses and realized or unrealized gains or losses are allocated to each class based on relative net assets. Distribution fees are charged to each respective share class in accordance with the distribution plan. Expenses of the Trust that are directly identifiable to a specific fund are charged to that fund. Expenses, which are not readily identifiable to a specific fund, are allocated in such a manner as deemed equitable, taking into consideration the nature and type of expense and the relative sizes of the funds in the Trust.
| Empiric Fund |
| NOTES TO FINANCIAL STATEMENTS (Unaudited) (Continued) |
| March 31, 2024 |
e) Other – Investment and shareholder transactions are recorded on the trade date. Interest income is recognized on an accrual basis. Discounts are accreted and premiums are amortized on debt securities using the effective interest method. Withholding taxes on foreign dividends have been provided for in accordance with the Fund’s understanding of the applicable country’s tax rules and rates. Dividend income is recorded on the ex-dividend date. Realized gains or losses from sales of securities are determined by comparing the identified cost of the security lot sold with the net sales proceeds.
f) Use of Estimates – The preparation of financial statements in conformity with GAAP requires management to make estimates and assumptions that affect the reported amounts of assets and liabilities and disclosure of contingent assets and liabilities at the date of the financial statements and the reported amounts of increases and decreases in net assets from operations during the reporting period. Actual results could differ from those estimates.
g) Indemnification – The Trust indemnifies its officers and trustees for certain liabilities that may arise from the performance of their duties to the Trust. Additionally, in the normal course of business, the Fund enters into contracts that contain a variety of representations and warranties and which provide general indemnities. The Fund’s maximum exposure under these arrangements is unknown, as this would involve future claims that may be made against the Fund that have not yet occurred. However, based on experience, the risk of loss due to these warranties and indemnities appears to be remote.
h) Sales charges (loads) – A maximum sales charge of 5.75% is imposed on Class A shares of the Fund. Investments in Class A shares made at or above the $1 million breakpoint are not subject to an initial sales charge and may be subject to a 1.00% contingent deferred sales charge (“CDSC”) on shares redeemed within 12 months of purchase (excluding shares purchased with reinvested dividends and/or distributions). The respective shareholders pay such CDSC charges, which are not an expense of the Fund. For the six months ended March 31, 2024 there were no CDSC fees paid.
i) Foreign Currency – Investment securities and other assets and liabilities denominated in foreign currencies are translated into U.S. dollar amounts at the date of valuation. Purchases and sales of investment securities and income and expense items denominated in foreign currencies are translated into U.S. dollar amounts on the respective dates as such transactions.
The Fund does not isolate that portion of the results of operations resulting from changes in foreign exchange rates on investments from the fluctuations arising from changes in market prices of securities held. Such fluctuations are included with the net realized and unrealized gain or loss from investments.
Reported net realized foreign exchange gains or losses arise from sales of foreign currencies, currency gains or losses realized between the trade and settlement dates on securities transactions, and the difference between the amounts of dividends, interest, and foreign withholding taxes recorded on the Fund’s books and the U.S. dollar equivalent of the amounts actually received or paid. Net unrealized foreign exchange gains and losses arise from changes in the fair values of assets and liabilities, other than investments in securities at fiscal period-end, resulting from changes in exchange rates.
j) Security Loans – The Fund has entered into a securities lending agreement with U.S. Bank National Association. The Fund receives compensation in the form of fees, or retains a portion of interest on the investment of any cash received as collateral. The cash collateral is invested in short-term investments. The Fund also continues to receive interest or dividends on the securities loaned. The loans are secured by collateral at least equal, at all times, to 102% of the market value of loaned securities. Gain or loss in the fair value of the securities loaned that may occur during the term of the loan will be for the account of the Fund. The Fund has the right under the lending agreement to recover the securities from the borrower on demand. If the market value of the collateral falls below 102% of market value plus accrued interest of the loaned securities, the lender’s agent shall request additional collateral from the borrowers to bring the collateralization back to 102%. Under the terms of the securities lending agreement, the Fund is indemnified for such losses by the security lending agent. Should the borrower of the securities fail financially, the Fund has the right to repurchase the securities using the collateral in the open market. Although risk is mitigated by the collateral, the Fund could experience a delay in recovering their securities and possible loss of income or value if the borrower fails to return them.
| Empiric Fund |
| NOTES TO FINANCIAL STATEMENTS (Unaudited) (Continued) |
| March 31, 2024 |
The Fund receives cash as collateral in return for securities lent as part of the securities lending program. The collateral is invested in the Mount Vernon Liquid Assets Portfolio, LLC of which the investment objective is to seek to maximize current income to the extent consistent with the preservation of capital and liquidity and to maintain a stable NAV of $1.00 per unit. The Fund held $4,225,765 in the Mount Vernon Liquid Assets Portfolio, LLC as of March 31, 2024. The remaining contractual maturity of all securities lending transactions is overnight and continuous. The Fund is not subject to a master netting agreement with respect to securities lending; therefore no additional disclosures are required. The income earned by the Fund on investments of cash collateral received from borrowers for the securities loaned to them, if any was received, would be reflected in the Fund’s Statement of Operations.
The following table is a summary of the Fund’s securities loaned and related collateral which are subject to a netting agreement as of March 31, 2024:
| | | | | | | | | Net Amounts of | | | | | | | | | | |
| | | | | | Gross Amounts | | | Assets | | | | | | | | | | |
| | | | | | Offset in the | | | Presented in the | | | | | | | | | | |
| | | Gross Amounts | | | Statement of | | | Statement of | | | Financial | | | Non-Cash | | | | |
| | | of Recognized | | | Assets & | | | Assets & | | | Instruments | | | Collateral | | | Net Amount of | |
| Assets: | | Assets | | | Liabilities | | | Liabilities | | | Pledged | | | Received * | | | Assets | |
| Empiric Fund | | | | | | | | | | | | | | | | | | | | | | | | |
| Description: | | | | | | | | | | | | | | | | | | | | | | | | |
| Securities Loaned | | $ | 4,149,385 | | | $ | — | | | $ | 4,149,385 | | | | | | | $ | 4,149,385 | * | | $ | — | |
| Total | | $ | 4,149,385 | | | $ | — | | | $ | 4,149,385 | | | $ | — | | | $ | 4,149,385 | | | $ | — | |
| * | The amount is limited to the asset balance and accordingly does not include excess collateral pledged. |
The fair value of the securities loaned for the Fund totaled $4,149,385 at March 31, 2024. The securities loaned are noted in the Schedule of Investments. The fair value of the “Collateral for Securities Loaned” on the Schedule of Investments includes cash collateral received and reinvested that totaled $4,225,765 for the Fund at March 31, 2024. This amount is offset by a liability recorded as “Collateral on securities loaned.” The contractual maturity of securities lending transactions is on an overnight and continuous basis. The Fund cannot pledge or resell the collateral.
| (2) | INVESTMENT TRANSACTIONS |
For the six months ended March 31, 2024, aggregate purchases and proceeds from sales of investment securities (excluding short-term investments) for the Fund were as follows:
| Purchases | | | Sales (a) | |
| $ | 782,817 | | | $ | 1,825,744 | * |
| (a) | The Fund may participate in a liquidity program operated by ReFlow Fund, LLC (“ReFlow”). The program is designed to provide an alternative liquidity source for mutual funds experiencing redemptions of their shares. In order to pay cash to shareholders who redeem their shares on a given day, a mutual fund typically must hold cash in its portfolio, liquidate portfolio securities, or borrow money, all of which impose certain costs on the Fund. ReFlow provides participating mutual funds with another source of cash by standing ready to purchase shares from a fund equal to the amount of the Fund’s net redemptions on a given day. ReFlow then generally redeems those shares when the Fund experiences net sales. In return for this service, the Fund will pay a fee to ReFlow at a rate determined by a daily auction with other participating mutual funds. The costs to the Fund for participating in ReFlow are expected to be influenced by and comparable to the cost of the other sources of liquidity, such as the Fund’s short-term lending arrangement or the costs of selling portfolio securities to meet redemptions. ReFlow will be prohibited from acquiring more than 3% of the outstanding voting shares of the Fund. The Fund will waive any redemption fee with respect to redemptions by ReFlow. When covering net sales for the Fund, ReFlow normally utilizes Redemptions In-Kind. During the six months ended March 31, 2024, the Fund utilized ReFlow. ReFlow subscribed 22,765 shares of the Fund during the year. The resulting fee is recorded in other expenses on the Statement of Operations. |
| * | Proceeds from sales include $773,740 from redemptions in-kind sales. |
| Empiric Fund |
| NOTES TO FINANCIAL STATEMENTS (Unaudited) (Continued) |
| March 31, 2024 |
| (3) | INVESTMENT ADVISORY AGREEMENT AND TRANSACTIONS WITH RELATED PARTIES |
The Trust, with respect to the Fund, has entered into an investment advisory agreement (the “Advisory Agreement”) with the Adviser, pursuant to which the Adviser receives a fee, computed daily, at an annual rate of 1.00% of the average daily net assets of the Fund. The Adviser pays expenses incurred by it in connection with acting as an investment adviser to the Fund other than costs (including taxes and brokerage commissions, borrowing costs, costs of investing in underlying funds and extraordinary expenses, if any) of securities purchased for the Fund and certain other expenses paid by the Fund (as detailed in the Advisory Agreement.) . The Adviser pays for all employees, office space and facilities required by it to provide services under the Advisory Agreement, with the exception of specific items of expense (as detailed in the Advisory Agreement). For the six months ended March 31, 2024, investment advisory fees of $125,293 were incurred by the Fund.
Pursuant to the Management Services Agreement between the Trust and Mfund Services LLC (“Mfund”), an affiliate of the Adviser, MFund provides the Funds with various management and legal administrative services (the “Management Services Agreement”). For these services, the Funds pay MFund an annual asset-based fee in accordance with the following schedule applied at the Fund family level (i.e., all the Funds in the Trust advised by the Advisor): 0.10% of net assets up to $50 million; 0.07% of net assets from $50 million to $100 million; 0.05% of net assets from $100 million to $250 million; 0.04% of net assets from $250 million to $500 million; 0.03% of net assets from $500 million to $1 billion; 0.02% of net assets from $1 billion to $5 billion; and 0.01% of assets from $5 billion and above. In addition, the Funds reimburse MFund for any reasonable out of pocket expenses incurred in the performance of its duties under the Management Services Agreement. The amounts due to MFund for the Management Services Agreement are listed in the Statements of Assets and Liabilities under “Payable to related parties” and the amounts accrued for the year are shown in the Statements of Operations under “Legal administration/management services fees.”
Pursuant to the Compliance Services Agreement, MFund provides chief compliance officer services to the Funds. For these services, the Funds pay MFund $1,200 per month for the first fund in the fund family and $400 for each additional fund; $400 for each adviser and sub-adviser; and .0025% of the assets of each Fund. In addition, the Funds reimburse MFund for any reasonable out-of-pocket expenses incurred in the performance of its duties under the Compliance Services Agreement. The amounts due to MFund for chief compliance officer services are listed in the Statements of Assets and Liabilities under “Payable to related parties” and the amounts accrued for the year are shown in the Statements of Operations under “Compliance officer fees.”
A trustee is the controlling member of MFund and of AlphaCentric Advisors LLC and Catalyst Capital Advisors LLC (investment advisers to other series of the Trust) and is not paid any fees directly by the Trust for serving in such capacities. Trustees who are not “interested persons” as that term is defined in the 1940 Act, are paid a quarterly retainer and receive compensation for each special Board meeting and Risk and Compliance Committee meeting. The fees paid to the Independent Trustees for their attendance at a meeting will be shared equally by the funds of the Trust in which the meeting relates. The Lead Independent Trustee of the Trust and the Chairmen of the Board’s Audit Committee and Risk and Compliance Committee receive an additional quarterly retainer. The “interested persons” of the Trust receive no compensation from the Fund. The Trust reimburses each Trustee and Officer for his or her travel and other expenses related to attendance at such meetings.
Northern Lights Distributors, LLC, (“Distributor”) serves as the principal underwriter and national distributor for the shares of the Fund pursuant to an Underwriting Agreement with the Trust. For the six months ended March 31, 2024, NLD received $0 in underwriter commissions from the sale of Class A shares of the Fund, of which they kept $0.
Ultimus Fund Solutions, LLC (“UFS”), an affiliate of the distributor, provides administrative, fund accounting, and transfer agency services to the Fund pursuant to agreements with the Trust, for which it receives from each Fund: (i) basis points in decreasing amounts as assets reach certain breakpoints; and (ii) any related out-of-pocket expenses.
Blu Giant, LLC (“Blu Giant” ) – Blu Giant, an affiliate of the Distributor and UFS, provides EDGAR conversion and filing services as well as print management services for the Fund on an ad-hoc basis. For the provision of these services, Blu Giant receives customary fees from the Fund.
Certain Officers of the Trust are also employees of UFS, and are not paid any fees directly by the Fund for serving in such capacity.
| Empiric Fund |
| NOTES TO FINANCIAL STATEMENTS (Unaudited) (Continued) |
| March 31, 2024 |
The Trust has adopted a Distribution Plan pursuant to Rule 12b-1(the “Plan”), under the 1940 Act for Class A shares and Class C shares, that allows the Fund to pay distribution and shareholder servicing expenses of up to 0.25% per annum for the Class A shares and up to 1.00% for the Class C shares based on average daily net assets of each class. Class A shares are currently paying 0.25% per annum of 12b-1 fees. Class C shares are currently paying 1.00% per annum of 12b-1 fees. The fee may be used for a variety of purposes, including compensating dealers and other financial service organizations for eligible services provided by those parties to the Fund and its shareholders and to reimburse the Distributor and the Adviser for distribution related expenses.
| (4) | TAX COMPONENTS OF CAPITAL |
The Statement of Assets and Liabilities represents cost for financial reporting purposes. Aggregate cost for federal tax purposes is $15,338,060 for the Fund and differs from fair value by net unrealized appreciation (depreciation) of securities as follows:
| Unrealized appreciation: | | $ | 12,981,053 | |
| Unrealized depreciation: | | | (8,048 | ) |
| Net unrealized appreciation: | | $ | 12,973,005 | |
The tax character of fund distributions paid for the years ended September 30, 2023 and September 30, 2022 was as follows:
| | | Fiscal Year Ended | | | Fiscal Year Ended | |
| | | September 30, 2023 | | | September 30, 2022 | |
| Ordinary Income | | $ | — | | | $ | — | |
| Long-Term Capital Gain | | | — | | | | 156,544 | |
| Return of Capital | | | — | | | | 40 | |
| | | $ | — | | | $ | 156,584 | |
As of September 30, 2023, the components of accumulated earnings/(deficit) on a tax basis were as follows:
| Undistributed | | | Undistributed | | | Post October Loss | | | Capital Loss | | | Other | | | Unrealized | | | Total | |
| Ordinary | | | Long-Term | | | and | | | Carry | | | Book/Tax | | | Appreciation/ | | | Distributable Earnings | |
| Income | | | Gains | | | Late Year Loss | | | Forwards | | | Differences | | | (Depreciation) | | | /(Accumulated Deficit) | |
| $ | — | | | $ | — | | | $ | (222,596 | ) | | $ | (22,760 | ) | | $ | — | | | $ | 9,429,681 | | | $ | 9,184,325 | |
The difference between book basis and tax basis undistributed net investment income/(loss), accumulated net realized gain/(loss), and unrealized appreciation/(depreciation) from investments is primarily attributable to the tax deferral of losses on wash sales and adjustments for C-Corporation return of capital distributions.
Late year losses incurred after December 31 within the fiscal year are deemed to arise on the first business day of the following fiscal year for tax purposes. The Fund incurred and elected to defer such late year losses of $222,596.
At September 30, 2023, the Funds had capital loss carry forwards for federal income tax purposes available to offset future capital gains, as follows:
| | | | Long-Term Non- | | | | | | | |
| Short-Term Non-Expiring | | | Expiring | | | Total | | | CLCF Utilized | |
| $ | 22,760 | | | $ | — | | | $ | 22,760 | | | $ | 115,105 | |
| Empiric Fund |
| NOTES TO FINANCIAL STATEMENTS (Unaudited) (Continued) |
| March 31, 2024 |
Permanent book and tax differences, primarily attributable to the book/tax basis treatment of realized gain (loss) on in-kind redemptions and net operating losses, resulted in reclassification for the year ended September 30, 2023, as follows:
| Paid | | | | |
| In | | | Distributable | |
| Capital | | | Earnings | |
| $ | (88,130 | ) | | $ | 88,130 | |
On January 24, 2023, the SEC adopted rule and form amendments to require mutual funds and ETFs to transmit concise and visually engaging streamlined annual and semiannual reports to shareholders that highlight key information. Other information, including financial statements, will not appear in a streamlined shareholder report but must be available online, delivered free of charge upon request, and filed on a semiannual basis on Form N-CSR. The rule and form amendments have a compliance date of July 24, 2024. At this time, management is evaluating the impact of these amendments on the shareholder reports for the Fund.
Subsequent events occurring after the date of the Statement of Assets and Liabilities have been evaluated through the date the financial statements were issued. The Trust’s officers have determined that no events or transactions occurred requiring adjustment or disclosure in the financial statements.
| Empiric Fund |
| EXPENSE EXAMPLES (Unaudited) |
| March 31, 2024 |
As a shareholder of the Fund, you incur two types of costs: (1) transaction costs, including sales charges (loads) on purchases of Class A shares; (2) ongoing costs, including management fees; distribution and/or service (12b-1) fees; and other Fund expenses. This example is intended to help you understand your ongoing costs (in dollars) of investing in the Fund and to compare these costs with the ongoing costs of investing in other mutual funds.
The example is based on an investment of $1,000 invested at the beginning of the period and held for the entire period from October 1, 2023 through March 31, 2024.
Actual Expenses
The “Actual” lines in the table below provide information about actual account values and actual expenses. You may use the information below together with the amount you invested, to estimate the expenses that you paid over the period. Simply divide your account value by $1,000 (for example, an $8,600 account value divided by $1,000 = 8.6), then multiply the result by the number in the table under the heading entitled “Expenses Paid During Period” to estimate the expenses you paid on your account during this period.
Hypothetical Example for Comparison Purposes
The “Hypothetical” lines in the table below provide information about hypothetical account values and hypothetical expenses based on the Fund’s actual expense ratio and an assumed rate of return of 5% per year before expenses, which is not the Fund’s actual return. The hypothetical account values and expenses may not be used to estimate the actual ending account balances or expenses you paid for the period. You may use this information to compare this 5% hypothetical example with the 5% hypothetical examples that appear in the shareholder reports of other funds.
Please note that the expenses shown in the table are meant to highlight your ongoing costs only and do not reflect any transactional costs, such as sales charges (loads) . Therefore, the table is useful in comparing ongoing costs only, and will not help you determine the relative total costs of owning different funds. In addition, if these transactional costs were included, your costs would have been higher.
| | | Beginning | | Ending | | Expenses Paid | | Expense Ratio |
| | | Account Value | | Account Value | | During Period* | | During Period** |
| Actual | | 10/1/23 | | 3/31/24 | | 10/1/23 – 3/31/24 | | 10/1/23 – 3/31/24 |
| Class A | | $1,000.00 | | $1,177.60 | | $11.75 | | 2.16% |
| Class C | | 1,000.00 | | 1,173.20 | | 15.80 | | 2.91% |
| | | | | | | | | |
| | | Beginning | | Ending | | Expenses Paid | | Expense Ratio |
| Hypothetical | | Account Value | | Account Value | | During Period* | | During Period** |
| (5% return before expenses) | | 10/1/23 | | 3/31/24 | | 10/1/23 – 3/31/24 | | 10/1/23 – 3/31/24 |
| Class A | | $1,000.00 | | $1,014.21 | | $10.87 | | 2.16% |
| Class C | | 1,000.00 | | 1,010.46 | | 14.61 | | 2.91% |
| * | Expenses are equal to the average account value over the period, multiplied by the Fund’s annualized expense ratio, multiplied by the number of days in the period (183) divided by the number of days in the fiscal year (366). |
| Empiric Fund |
| ADDITIONAL INFORMATION (Unaudited) |
| March 31, 2024 |
Approval of the Renewal of the Advisory Agreement between the Trust and Empiric Advisors, Inc. with respect to Empiric Fund
At a meeting held on February 14 and 27, 2024, the Board of Trustees (the “Board”) of Mutual Fund Series Trust (the “Trust”), including a majority of the Trustees who are not “interested persons” as that term is defined in the Investment Company Act of 1940, as amended, each an “Independent Trustee” and collectively the “Independent Trustees”) discussed the renewal of the advisory agreement (the “Advisory Agreement”) between the Trust and Empiric Advisors, Inc. (“Empiric”), with respect to Empiric Fund.
The Board examined Empiric’s responses to a series of questions regarding, among other things, its advisory services provided to Empiric Fund, comparative fee and expense information, and profitability from managing Empiric Fund. The Board was assisted by legal counsel throughout the review process and relied upon the advice of legal counsel and its own business judgment in determining the material factors to be considered in evaluating the Advisory Agreement and the weight to be given to each factor considered. The conclusions reached by the Board were based on a comprehensive evaluation of all of the information provided and were not the result of any one factor. Moreover, each Trustee may have afforded different weight to the various factors in reaching his conclusions with respect to renewal of the Advisory Agreement.
Nature, Extent and Quality of Services. The Board recognized that the key personnel at Empiric servicing Empiric Fund remained consistent. The Board noted that Empiric utilized quantitative analysis to provide portfolio management services. The Board observed that small-cap stocks were identified by Empiric as the largest risk to the Empiric Fund but noted that Empiric reviewed sector and industry concentrations monthly and that its quantitative model was designed to avoid concentrations in certain industries and sectors. The Board added that Empiric monitored Empiric Fund’s liquidity on a regular basis and that Empiric was the Board’s valuation designee for Empiric Fund. The Board noted that Empiric reported no material compliance issues, litigation or code of ethics violations during the prior year, and that the Empiric maintained a detailed cybersecurity program and robust ransomware protocols. The Board concluded that Empiric was likely to continue providing services to Empiric Fund that were consistent with the Board’s expectations.
Performance. The Board observed that Empiric Fund outperformed its peer group over the 5- year and 10-year periods, but otherwise trailed its Morningstar category, peer group and benchmark index for all other periods. The Board observed that Empiric Fund noted that many funds in the Morningstar category were significantly larger than Empiric Fund, and that when limiting the Morningstar category to funds with less than $30 million in assets under management, Empiric Fund outperformed the Morningstar category over the 3-year and 10-year periods and was on par with the Morningstar category over the 5-year period. The Board noted that Empiric attributed Empiric Fund’s underperformance over the 1-year period to the low levels of speculative factors such as residual volatility, beta, momentum, and variability, which it believed drove the Morningstar category over the past year. After further discussion, the Board concluded that Empiric Fund’s performance was satisfactory.
Fees and Expenses. The Board recognized that Empiric charged an advisory fee of 1.00% which was higher than the peer group and Morningstar category’s averages and medians but was well below the highs for each. The Board noted that Empiric Fund’s net expense ratio was above the Morningstar median and average ratio but was below the peer group’s average expense ratio. The Board concluded that the advisory fee for Empiric Fund was not unreasonable.
Profitability. The Board recognized that, based on the financial statements that Empiric provided, Empiric was managing Empiric Fund at a loss. The Board therefore determined that excessive profitability was not a concern at this time.
Economies of Scale. The Board considered whether Empiric had realized economies of scale with respect to Empiric Fund. The Board determined that based on the current asset level of Empiric Fund, breakpoints did not appear warranted. The Board agreed that although Empiric did not appear to be benefiting from material economies of scale, it would revisit the issue as Empiric Fund’s asset level grew.
| Empiric Fund |
| ADDITIONAL INFORMATION (Unaudited) (Continued) |
| March 31, 2024 |
Conclusion. Having requested and received such information from Empiric as the Board believed to be reasonably necessary to evaluate the terms of the Advisory Agreement, and as assisted by the advice of counsel, the Board concluded that the renewal of the Advisory Agreement was in the best interests of Empiric Fund and its shareholders.
| Empiric Fund |
| ADDITIONAL INFORMATION (Unaudited) |
| March 31, 2024 |
Proxy Voting Policy and Portfolio Holdings
Reference is made to the Prospectus and the Statement of Additional Information for more detailed descriptions of the Management Agreement and Services Agreement Plan, tax aspects of the Fund and the calculation of the net asset value of shares of the Fund.
The Fund files its complete schedule of portfolio holdings with the Securities and Exchange Commission (the “Commission”) for the first and third quarters of each fiscal year as an exhibit to its reports on Form N-PORT, within sixty days after the end of the period. Form N-PORT reports are available at the SEC’s website at http://www.sec.gov.
Information regarding how the Fund voted proxies relating to portfolio securities during the twelve month period ended June 30 as well as a description of the policies and procedures that the Fund uses to determine how to vote proxies relating to portfolio securities is available without charge, upon request, by calling 1-888-839-7424; and on the Commission’s website at http://www.sec.gov.
PRIVACY NOTICE
Mutual Fund Series Trust
Rev. August 2021
| FACTS | WHAT DOES MUTUAL FUND SERIES TRUST DO WITH YOUR PERSONAL INFORMATION? |
| Why? | Financial companies choose how they share your personal information. Federal law gives consumers the right to limit some, but not all sharing. Federal law also requires us to tell you how we collect, share, and protect your personal information. Please read this notice carefully to understand what we do. |
| What? | The types of personal information we collect and share depends on the product or service that you have with us. This information can include: ● Social Security number and wire transfer instructions ● account transactions and transaction history ● investment experience and purchase history When you are no longer our customer, we continue to share your information as described in this notice. |
| How? | All financial companies need to share customers’ personal information to run their everyday business. In the section below, we list the reasons financial companies can share their customers’ personal information; the reasons Mutual Fund Series Trust chooses to share; and whether you can limit this sharing. |
Reasons we can share your
personal information: | Does Mutual Fund Series
Trust share information? | Can you limit this
sharing? |
| For our everyday business purposes - such as to process your transactions, maintain your account(s), respond to court orders and legal investigations, or report to credit bureaus. | YES | NO |
| For our marketing purposes - to offer our products and services to you. | NO | We don’t share |
| For joint marketing with other financial companies. | NO | We don’t share |
| For our affiliates’ everyday business purposes - information about your transactions and records. | NO | We don’t share |
| For our affiliates’ everyday business purposes - information about your credit worthiness. | NO | We don’t share |
| For our affiliates to market to you | NO | We don’t share |
| For non-affiliates to market to you | NO | We don’t share |
PRIVACY NOTICE
Mutual Fund Series Trust
| What we do: |
How does Mutual Fund Series Trust protect my personal information? | To protect your personal information from unauthorized access and use, we use security measures that comply with federal law. These measures include computer safeguards and secured files and buildings. Our service providers are held accountable for adhering to strict policies and procedures to prevent any misuse of your nonpublic personal information. |
How does Mutual Fund Series Trust collect my personal information? | We collect your personal information, for example, when you: ● open an account or deposit money ● direct us to buy securities or direct us to sell your securities ● seek advice about your investments We also collect your personal information from others, such as credit bureaus, affiliates, or other companies. |
Why can’t I limit all sharing? | Federal law gives you the right to limit only: ● sharing for affiliates’ everyday business purposes – information about your creditworthiness. ● affiliates from using your information to market to you. ● sharing for non-affiliates to market to you. State laws and individual companies may give you additional rights to limit sharing. |
| Definitions |
| Affiliates | Companies related by common ownership or control. They can be financial and non-financial companies. ● Mutual Fund Series Trust does not share with affiliates. |
| Non-affiliates | Companies not related by common ownership or control. They can be financial and non-financial companies. ● Mutual Fund Series Trust doesn’t share with non-affiliates so they can market to you. |
| Joint marketing | A formal agreement between nonaffiliated financial companies that together market financial products or services to you. ● Mutual Fund Series Trust doesn’t jointly market. |
QUESTIONS?
CALL | Alpha Centric | 844-223-8637 |
| Catalyst | 866-447-4228 |
| Empiric | 888-839-7424 |
| Eventide | 877-771-3836 |
| JAG | 855-552-4596 |
| |
| |
| |
| Mutual Fund Series Trust |
| 4221 North 203rd Street, Suite 100 |
| Elkhorn, NE 68022 |
| |
| ADVISER |
| Empiric Advisors, Inc. |
| 500 N. Capital of Texas Highway |
| Building 8, Suite 150 |
| Austin, TX 78746 |
| |
| ADMINISTRATOR |
Ultimus Fund Solutions, LLC
225 Pictoria Drive, Suite 450
Cincinnati, OH 45246 |
| |
| TRANSFER AGENT |
Ultimus Fund Solutions, LLC
225 Pictoria Drive, Suite 450
Cincinnati, OH 45246 |
| |
| DISTRIBUTOR |
| Northern Lights Distributors, LLC |
| 4221 North 203rd Street, Suite 100 |
| Elkhorn, NE 68022 |
| |
| INDEPENDENT REGISTERED PUBLIC ACCOUNTING FIRM |
Cohen & Company, Ltd.
1350 Euclid Avenue,
Suite 800
Cleveland, OH 44115 |
| |
| LEGAL COUNSEL |
| Thompson Hine LLP |
| 41 South High Street |
| Suite 1700 |
| Columbus, OH 43215 |
| |
| CUSTODIAN BANK |
| U.S. Bank |
| 1555 N. Rivercenter Dr. |
| Milwaukee, WI 53212 |
| |
| |
| |
| |
| |
| |
| |
| |
| |
| |
| |
| EMP-SAR24 |
| |
(b) Not applicable
Item 2. Code of Ethics.
Not applicable for semi-annual reports.
Item 3. Audit Committee Financial Expert.
Not applicable for semi-annual reports.
Item 4. Principal Accountant Fees and Services.
Not applicable for semi-annual reports.
Item 5. Audit Committee of Listed Companies. Not applicable to open-end investment companies.
Item 6. Schedule of Investments. See Item 1.
Item 7. Disclosure of Proxy Voting Policies and Procedures for Closed-End Management Investment Companies. Not applicable to open-end investment companies.
ITEM 8. PORTFOLIO MANAGERS OF CLOSED-END MANAGEMENT INVESTMENT COMPANIES
Item 9. Purchases of Equity Securities by Closed-End Management Investment Company and Affiliated Purchasers. Not applicable to open-end investment companies.
Item 10. Submission of Matters to a Vote of Security Holder. None.
ITEM 11. CONTROLS AND PROCEDURES.
| (a) | The registrant's principal executive and principal financial officers, or persons performing similar functions, have concluded that the registrant's disclosure controls and procedures (as defined in Rule 30a-3(c) under the 1940 Act, are effective, as of a date within 90 days of the filing date of this report, based on the evaluation of these controls and procedures required by Rule 30a-3(b) under the 1940 Act and Rule 15d-15(b) under the Securities Exchange Act of 1934, as amended. |
| (b) | There were no significant changes in the Registrant’s internal control over financial reporting that occurred during the period covered by this report that have materially affected, or are reasonably likely to materially affect, the Registrant’s internal control over financial reporting. |
| ITEM | 12. DISCLOSURE OF SECURITIES LENDING ACTIVITIES FOR CLOSED-END MANAGEMENT INVESTMENT COMPANIES Not applicable. |
ITEM 13. EXHIBITS
| (1) | Code of Ethics for Principal Executive and Senior Financial Officers is attached hereto. |
ITEM 13. Disclosure of Securities Lending Activities for Closed-End Management Investment Companies. Not applicable to open-end investment companies.
SIGNATURES
Pursuant to the requirements of the Securities Exchange Act of 1934 and the Investment Company Act of 1940, the registrant has duly caused this report to be signed on its behalf by the undersigned, thereunto duly authorized.
Mutual Fund Series Trust
| By Michael Schoonover | /s/ Michael Schoonover |
| Principal Executive Officer/President |
| Date: June 7, 2024 | |
Pursuant to the requirements of the Securities Exchange Act of 1934 and the Investment Company Act of 1940, this report has been signed below by the following person on behalf of the registrant and in the capacities and on the date indicated.
| By Michael Schoonover | /s/ Michael Schoonover ___________ |
| Principal Executive Officer/President |
| Date: June 7, 2024 | |
Pursuant to the requirements of the Securities Exchange Act of 1934 and the Investment Company Act of 1940, this report has been signed below by the following person on behalf of the registrant and in the capacities and on the date indicated.
| By Erik Naviloff | /s/ Erik Naviloff_____________ |
| Principal Financial Officer/Treasurer |
| Date: June 7, 2024 | |