united states
securities and exchange commission
washington, d.c. 20549
form n-csr
certified shareholder report of registered management
investment companies
| Investment Company Act file number | 811-21872 |
| Mutual Fund Series Trust |
| (Exact name of registrant as specified in charter) |
| 225 Pictoria Drive, Suite 450, Cincinnati, Ohio | 45246 |
| (Address of principal executive offices) | (Zip code) |
| The Corporation Trust Company |
| 1300 EAST NINTH STREET, CLEVELAND, OH 44114 |
| (Name and address of agent for service) |
| Registrant’s telephone number, including area code: | 866-447-4228 | |
| Date of fiscal year end: | 3/31 | |
| | | |
| Date of reporting period: | 9/30/24 | |
Item 1. Reports to Stockholders.
(a)
AlphaCentric Income Opportunities Fund
Semi-Annual Shareholder Report - September 30, 2024
This semi-annual shareholder report contains important information about AlphaCentric Income Opportunities Fund for the period of April 1, 2024 to September 30, 2024. You can find additional information about the Fund at https://alphacentricfunds.com/mutual-funds/. You can also request this information by contacting us at 1-844-223-8637.
What were the Fund’s costs for the last six months?
(based on a hypothetical $10,000 investment)
| Class Name | Costs of a $10,000 investment | Costs paid as a percentage of a $10,000 investment |
|---|
| Class A | $107 | 2.11%Footnote Reference* |
| Net Assets | $303,588,432 |
| Number of Portfolio Holdings | 91 |
| Advisory Fee (net of waivers) | $1,823,689 |
| Portfolio Turnover | 4% |
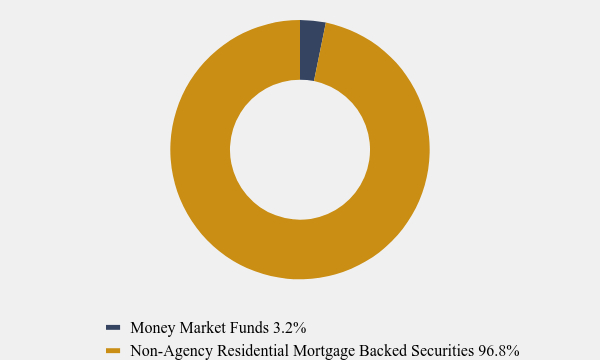
Asset Weighting (% of total investments)
| Value | Value |
|---|
| Money Market Funds | 3.2% |
| Non-Agency Residential Mortgage Backed Securities | 96.8% |
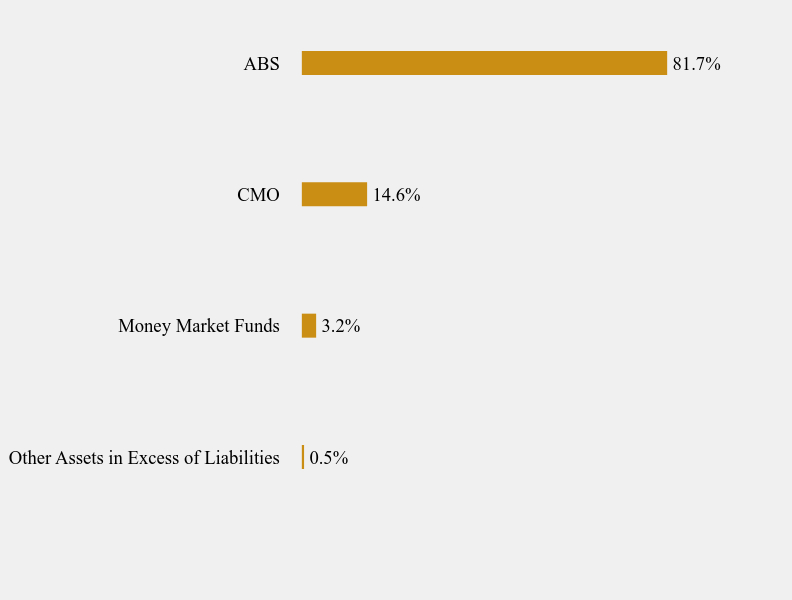
What did the Fund invest in?
Sector Weighting (% of net assets)
| Value | Value |
|---|
| Other Assets in Excess of Liabilities | 0.5% |
| Money Market Funds | 3.2% |
| CMO | 14.6% |
| ABS | 81.7% |
Top 10 Holdings (% of net assets)
| Holding Name | % of Net Assets |
| Carrington Mortgage Loan Trust Series 2006-FRE1, 1.126%, 07/25/36 | 10.8% |
| CIT Mortgage Loan Trust 2007-1, 6.061%, 10/25/37 | 10.7% |
| Option One Mortgage Loan Trust 2007-CP1, –%, 03/25/37 | 4.7% |
| Towd Point Mortgage Trust 2019-4, 4.161%, 10/25/59 | 4.3% |
| Seasoned Credit Risk Transfer Trust Series 2018-3, 0.944%, 08/25/57 | 4.2% |
| Citigroup Mortgage Loan Trust 2007-AHL1, 4.535%, 12/25/36 | 3.6% |
| CIT Mortgage Loan Trust 2007-1, 5.567%, 10/25/37 | 3.5% |
| Carrington Mortgage Loan Trust Series 2007-RFC1, 4.178%, 12/25/36 | 3.4% |
| RAAC Series 2007-SP3 Trust, 7.642%, 09/25/47 | 3.0% |
| Nationstar Home Equity Loan Trust 2007-B, 4.479%, 04/25/37 | 2.6% |
No material changes occurred during the period ended September 30, 2024.
AlphaCentric Income Opportunities Fund
Semi-Annual Shareholder Report - September 30, 2024
Where can I find additional information about the Fund?
Additional information is available on the Fund's website ( https://alphacentricfunds.com/mutual-funds/ ), including its:
Prospectus
Financial information
Holdings
Proxy voting information
AlphaCentric Income Opportunities Fund
Semi-Annual Shareholder Report - September 30, 2024
This semi-annual shareholder report contains important information about AlphaCentric Income Opportunities Fund for the period of April 1, 2024 to September 30, 2024. You can find additional information about the Fund at https://alphacentricfunds.com/mutual-funds/. You can also request this information by contacting us at 1-844-223-8637.
What were the Fund’s costs for the last six months?
(based on a hypothetical $10,000 investment)
| Class Name | Costs of a $10,000 investment | Costs paid as a percentage of a $10,000 investment |
|---|
| Class C | $145 | 2.86%Footnote Reference* |
| Net Assets | $303,588,432 |
| Number of Portfolio Holdings | 91 |
| Advisory Fee (net of waivers) | $1,823,689 |
| Portfolio Turnover | 4% |
Asset Weighting (% of total investments)
| Value | Value |
|---|
| Money Market Funds | 3.2% |
| Non-Agency Residential Mortgage Backed Securities | 96.8% |
What did the Fund invest in?
Sector Weighting (% of net assets)
| Value | Value |
|---|
| Other Assets in Excess of Liabilities | 0.5% |
| Money Market Funds | 3.2% |
| CMO | 14.6% |
| ABS | 81.7% |
Top 10 Holdings (% of net assets)
| Holding Name | % of Net Assets |
| Carrington Mortgage Loan Trust Series 2006-FRE1, 1.126%, 07/25/36 | 10.8% |
| CIT Mortgage Loan Trust 2007-1, 6.061%, 10/25/37 | 10.7% |
| Option One Mortgage Loan Trust 2007-CP1, –%, 03/25/37 | 4.7% |
| Towd Point Mortgage Trust 2019-4, 4.161%, 10/25/59 | 4.3% |
| Seasoned Credit Risk Transfer Trust Series 2018-3, 0.944%, 08/25/57 | 4.2% |
| Citigroup Mortgage Loan Trust 2007-AHL1, 4.535%, 12/25/36 | 3.6% |
| CIT Mortgage Loan Trust 2007-1, 5.567%, 10/25/37 | 3.5% |
| Carrington Mortgage Loan Trust Series 2007-RFC1, 4.178%, 12/25/36 | 3.4% |
| RAAC Series 2007-SP3 Trust, 7.642%, 09/25/47 | 3.0% |
| Nationstar Home Equity Loan Trust 2007-B, 4.479%, 04/25/37 | 2.6% |
No material changes occurred during the period ended September 30, 2024.
AlphaCentric Income Opportunities Fund
Semi-Annual Shareholder Report - September 30, 2024
Where can I find additional information about the Fund?
Additional information is available on the Fund's website ( https://alphacentricfunds.com/mutual-funds/ ), including its:
Prospectus
Financial information
Holdings
Proxy voting information
AlphaCentric Income Opportunities Fund
Semi-Annual Shareholder Report - September 30, 2024
This semi-annual shareholder report contains important information about AlphaCentric Income Opportunities Fund for the period of April 1, 2024 to September 30, 2024. You can find additional information about the Fund at https://alphacentricfunds.com/mutual-funds/. You can also request this information by contacting us at 1-844-223-8637.
What were the Fund’s costs for the last six months?
(based on a hypothetical $10,000 investment)
| Class Name | Costs of a $10,000 investment | Costs paid as a percentage of a $10,000 investment |
|---|
| Class I | $95 | 1.86%Footnote Reference* |
| Net Assets | $303,588,432 |
| Number of Portfolio Holdings | 91 |
| Advisory Fee (net of waivers) | $1,823,689 |
| Portfolio Turnover | 4% |
Asset Weighting (% of total investments)
| Value | Value |
|---|
| Money Market Funds | 3.2% |
| Non-Agency Residential Mortgage Backed Securities | 96.8% |
What did the Fund invest in?
Sector Weighting (% of net assets)
| Value | Value |
|---|
| Other Assets in Excess of Liabilities | 0.5% |
| Money Market Funds | 3.2% |
| CMO | 14.6% |
| ABS | 81.7% |
Top 10 Holdings (% of net assets)
| Holding Name | % of Net Assets |
| Carrington Mortgage Loan Trust Series 2006-FRE1, 1.126%, 07/25/36 | 10.8% |
| CIT Mortgage Loan Trust 2007-1, 6.061%, 10/25/37 | 10.7% |
| Option One Mortgage Loan Trust 2007-CP1, –%, 03/25/37 | 4.7% |
| Towd Point Mortgage Trust 2019-4, 4.161%, 10/25/59 | 4.3% |
| Seasoned Credit Risk Transfer Trust Series 2018-3, 0.944%, 08/25/57 | 4.2% |
| Citigroup Mortgage Loan Trust 2007-AHL1, 4.535%, 12/25/36 | 3.6% |
| CIT Mortgage Loan Trust 2007-1, 5.567%, 10/25/37 | 3.5% |
| Carrington Mortgage Loan Trust Series 2007-RFC1, 4.178%, 12/25/36 | 3.4% |
| RAAC Series 2007-SP3 Trust, 7.642%, 09/25/47 | 3.0% |
| Nationstar Home Equity Loan Trust 2007-B, 4.479%, 04/25/37 | 2.6% |
No material changes occurred during the period ended September 30, 2024.
AlphaCentric Income Opportunities Fund
Semi-Annual Shareholder Report - September 30, 2024
Where can I find additional information about the Fund?
Additional information is available on the Fund's website ( https://alphacentricfunds.com/mutual-funds/ ), including its:
Prospectus
Financial information
Holdings
Proxy voting information
AlphaCentric Life Sciences and Healthcare Fund
Semi-Annual Shareholder Report - September 30, 2024
This semi-annual shareholder report contains important information about AlphaCentric Life Sciences and Healthcare Fund for the period of April 1, 2024 to September 30, 2024. You can find additional information about the Fund at https://alphacentricfunds.com/mutual-funds/. You can also request this information by contacting us at 1-844-223-8637. This report describes changes to the Fund that occurred during the reporting period.
What were the Fund’s costs for the last six months?
(based on a hypothetical $10,000 investment)
| Class Name | Costs of a $10,000 investment | Costs paid as a percentage of a $10,000 investment |
|---|
| Class A | $86 | 1.65%Footnote Reference* |
| Net Assets | $82,912,827 |
| Number of Portfolio Holdings | 68 |
| Advisory Fee (net of waivers) | $392,050 |
| Portfolio Turnover | 80% |
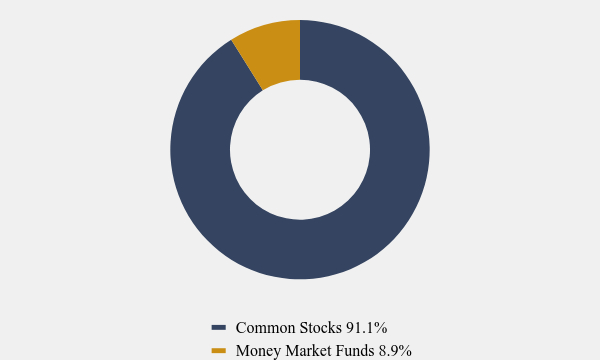
Asset Weighting (% of total investments)
| Value | Value |
|---|
| Common Stocks | 91.1% |
| Money Market Funds | 8.9% |
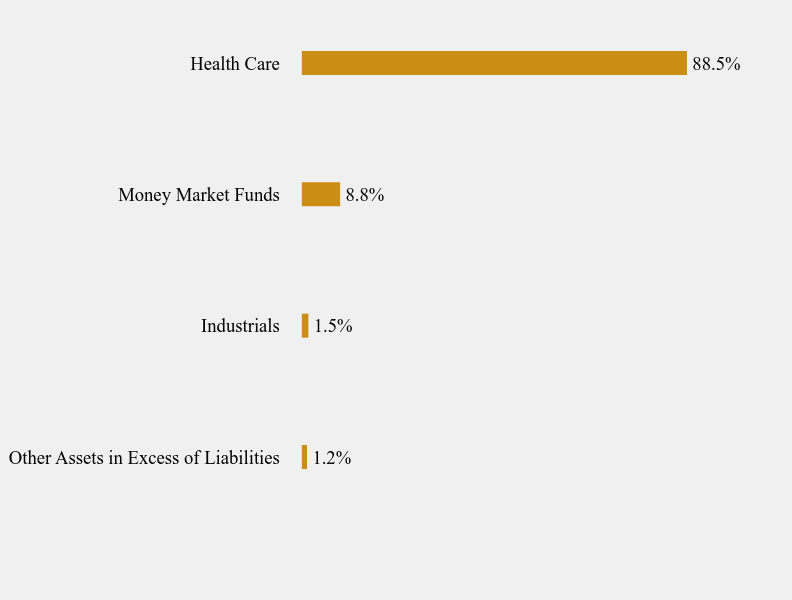
What did the Fund invest in?
Sector Weighting (% of net assets)
| Value | Value |
|---|
| Other Assets in Excess of Liabilities | 1.2% |
| Industrials | 1.5% |
| Money Market Funds | 8.8% |
| Health Care | 88.5% |
Top 10 Holdings (% of net assets)
| Holding Name | % of Net Assets |
| First American Treasury Obligations Fund, Class X | 8.8% |
| Harmony Biosciences Holdings, Inc. | 4.7% |
| Galapagos N.V. | 3.8% |
| Merck & Company, Inc. | 3.3% |
| Neurocrine Biosciences, Inc. | 3.1% |
| Argenx S.E. | 2.9% |
| Indivior plc | 2.9% |
| BioMarin Pharmaceutical, Inc. | 2.8% |
| Sarepta Therapeutics, Inc. | 2.7% |
| Dynavax Technologies Corporation | 2.7% |
This is a summary of certain changes to the Fund since April 1, 2024. For more complete information, you may review the Fund’s prospectus dated August 1, 2024 or call us at 1-844-223-8637. Effective November 1, 2024, the Fund’s name changed to “AlphaCentric Life Sciences and Healthcare Fund”. Also effective November 1, 2024, Kennedy Capital Management LLC (“KCM”) replaced LifeSci Fund Management LLC (“LifeSci”) as the sub-advisor of the Fund and Ryan Dunnegan, CPA and Portfolio Manager of KCM replaced Mark G. Charest as Portfolio Manager of the Fund.
AlphaCentric Life Sciences and Healthcare Fund
Semi-Annual Shareholder Report - September 30, 2024
Where can I find additional information about the Fund?
Additional information is available on the Fund's website ( https://alphacentricfunds.com/mutual-funds/ ), including its:
Prospectus
Financial information
Holdings
Proxy voting information
AlphaCentric Life Sciences and Healthcare Fund
Semi-Annual Shareholder Report - September 30, 2024
This semi-annual shareholder report contains important information about AlphaCentric Life Sciences and Healthcare Fund for the period of April 1, 2024 to September 30, 2024. You can find additional information about the Fund at https://alphacentricfunds.com/mutual-funds/. You can also request this information by contacting us at 1-844-223-8637. This report describes changes to the Fund that occurred during the reporting period.
What were the Fund’s costs for the last six months?
(based on a hypothetical $10,000 investment)
| Class Name | Costs of a $10,000 investment | Costs paid as a percentage of a $10,000 investment |
|---|
| Class C | $125 | 2.40%Footnote Reference* |
| Net Assets | $82,912,827 |
| Number of Portfolio Holdings | 68 |
| Advisory Fee (net of waivers) | $392,050 |
| Portfolio Turnover | 80% |
Asset Weighting (% of total investments)
| Value | Value |
|---|
| Common Stocks | 91.1% |
| Money Market Funds | 8.9% |
What did the Fund invest in?
Sector Weighting (% of net assets)
| Value | Value |
|---|
| Other Assets in Excess of Liabilities | 1.2% |
| Industrials | 1.5% |
| Money Market Funds | 8.8% |
| Health Care | 88.5% |
Top 10 Holdings (% of net assets)
| Holding Name | % of Net Assets |
| First American Treasury Obligations Fund, Class X | 8.8% |
| Harmony Biosciences Holdings, Inc. | 4.7% |
| Galapagos N.V. | 3.8% |
| Merck & Company, Inc. | 3.3% |
| Neurocrine Biosciences, Inc. | 3.1% |
| Argenx S.E. | 2.9% |
| Indivior plc | 2.9% |
| BioMarin Pharmaceutical, Inc. | 2.8% |
| Sarepta Therapeutics, Inc. | 2.7% |
| Dynavax Technologies Corporation | 2.7% |
This is a summary of certain changes to the Fund since April 1, 2024. For more complete information, you may review the Fund’s prospectus dated August 1, 2024 or call us at 1-844-223-8637. Effective November 1, 2024, the Fund’s name changed to “AlphaCentric Life Sciences and Healthcare Fund”. Also effective November 1, 2024, Kennedy Capital Management LLC (“KCM”) replaced LifeSci Fund Management LLC (“LifeSci”) as the sub-advisor of the Fund and Ryan Dunnegan, CPA and Portfolio Manager of KCM replaced Mark G. Charest as Portfolio Manager of the Fund.
AlphaCentric Life Sciences and Healthcare Fund
Semi-Annual Shareholder Report - September 30, 2024
Where can I find additional information about the Fund?
Additional information is available on the Fund's website ( https://alphacentricfunds.com/mutual-funds/ ), including its:
Prospectus
Financial information
Holdings
Proxy voting information
AlphaCentric Life Sciences and Healthcare Fund
Semi-Annual Shareholder Report - September 30, 2024
This semi-annual shareholder report contains important information about AlphaCentric Life Sciences and Healthcare Fund for the period of April 1, 2024 to September 30, 2024. You can find additional information about the Fund at https://alphacentricfunds.com/mutual-funds/. You can also request this information by contacting us at 1-844-223-8637. This report describes changes to the Fund that occurred during the reporting period.
What were the Fund’s costs for the last six months?
(based on a hypothetical $10,000 investment)
| Class Name | Costs of a $10,000 investment | Costs paid as a percentage of a $10,000 investment |
|---|
| Class I | $73 | 1.40%Footnote Reference* |
| Net Assets | $82,912,827 |
| Number of Portfolio Holdings | 68 |
| Advisory Fee (net of waivers) | $392,050 |
| Portfolio Turnover | 80% |
Asset Weighting (% of total investments)
| Value | Value |
|---|
| Common Stocks | 91.1% |
| Money Market Funds | 8.9% |
What did the Fund invest in?
Sector Weighting (% of net assets)
| Value | Value |
|---|
| Other Assets in Excess of Liabilities | 1.2% |
| Industrials | 1.5% |
| Money Market Funds | 8.8% |
| Health Care | 88.5% |
Top 10 Holdings (% of net assets)
| Holding Name | % of Net Assets |
| First American Treasury Obligations Fund, Class X | 8.8% |
| Harmony Biosciences Holdings, Inc. | 4.7% |
| Galapagos N.V. | 3.8% |
| Merck & Company, Inc. | 3.3% |
| Neurocrine Biosciences, Inc. | 3.1% |
| Argenx S.E. | 2.9% |
| Indivior plc | 2.9% |
| BioMarin Pharmaceutical, Inc. | 2.8% |
| Sarepta Therapeutics, Inc. | 2.7% |
| Dynavax Technologies Corporation | 2.7% |
This is a summary of certain changes to the Fund since April 1, 2024. For more complete information, you may review the Fund’s prospectus dated August 1, 2024 or call us at 1-844-223-8637. Effective November 1, 2024, the Fund’s name changed to “AlphaCentric Life Sciences and Healthcare Fund”. Also effective November 1, 2024, Kennedy Capital Management LLC (“KCM”) replaced LifeSci Fund Management LLC (“LifeSci”) as the sub-advisor of the Fund and Ryan Dunnegan, CPA and Portfolio Manager of KCM replaced Mark G. Charest as Portfolio Manager of the Fund.
AlphaCentric Life Sciences and Healthcare Fund
Semi-Annual Shareholder Report - September 30, 2024
Where can I find additional information about the Fund?
Additional information is available on the Fund's website ( https://alphacentricfunds.com/mutual-funds/ ), including its:
Prospectus
Financial information
Holdings
Proxy voting information
AlphaCentric Premium Opportunity Fund
Semi-Annual Shareholder Report - September 30, 2024
This semi-annual shareholder report contains important information about AlphaCentric Premium Opportunity Fund for the period of April 1, 2024 to September 30, 2024. You can find additional information about the Fund at https://alphacentricfunds.com/mutual-funds/. You can also request this information by contacting us at 1-844-223-8637.
What were the Fund’s costs for the last six months?
(based on a hypothetical $10,000 investment)
| Class Name | Costs of a $10,000 investment | Costs paid as a percentage of a $10,000 investment |
|---|
| Class A | $114 | 2.24%Footnote Reference* |
| Net Assets | $62,328,951 |
| Number of Portfolio Holdings | 55 |
| Advisory Fee (net of waivers) | $509,860 |
| Portfolio Turnover | 0% |
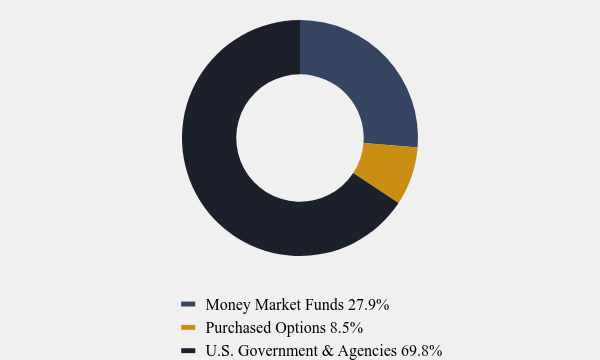
Asset Weighting (% of total investments)
| Value | Value |
|---|
| Money Market Funds | 27.9% |
| Purchased Options | 8.5% |
| U.S. Government & Agencies | 69.8% |
What did the Fund invest in?
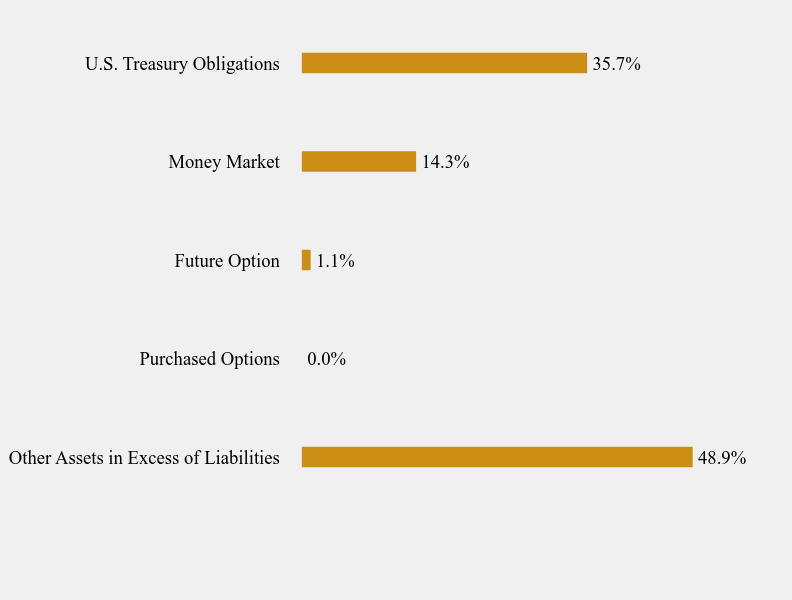
Sector Weighting (% of net assets)
| Value | Value |
|---|
| Other Assets in Excess of Liabilities | 48.9% |
| Purchased Options | 0.0% |
| Future Option | 1.1% |
| Money Market | 14.3% |
| U.S. Treasury Obligations | 35.7% |
Top 10 Holdings (% of net assets)
| Holding Name | % of Net Assets |
| United States Treasury Bill, 11/29/24 | 15.9% |
| United States Treasury Bill, 01/23/25 | 15.8% |
| First American Treasury Obligations Fund | 7.4% |
| Fidelity Government Portfolio | 6.9% |
| United States Treasury Note | 4.0% |
| S&P500 Emini Option, 10/31/24 5800.0 Call | 1.1% |
| S&P Emini 3rd Week, 11/15/24 5800.0 Call | 1.0% |
| S&P500 Emini Option, 11/29/24 5900.0 Call | 0.7% |
| S&P Emini 3rd Week, 10/18/24 5800.0 Call | 0.4% |
| S&P Emini 3rd Week, 10/18/24 5825.0 Call | 0.4% |
No material changes occurred during the period ended September 30, 2024.
AlphaCentric Premium Opportunity Fund
Semi-Annual Shareholder Report - September 30, 2024
Where can I find additional information about the Fund?
Additional information is available on the Fund's website ( https://alphacentricfunds.com/mutual-funds/ ), including its:
Prospectus
Financial information
Holdings
Proxy voting information
AlphaCentric Premium Opportunity Fund
Semi-Annual Shareholder Report - September 30, 2024
This semi-annual shareholder report contains important information about AlphaCentric Premium Opportunity Fund for the period of April 1, 2024 to September 30, 2024. You can find additional information about the Fund at https://alphacentricfunds.com/mutual-funds/. You can also request this information by contacting us at 1-844-223-8637.
What were the Fund’s costs for the last six months?
(based on a hypothetical $10,000 investment)
| Class Name | Costs of a $10,000 investment | Costs paid as a percentage of a $10,000 investment |
|---|
| Class C | $151 | 2.99%Footnote Reference* |
| Net Assets | $62,328,951 |
| Number of Portfolio Holdings | 55 |
| Advisory Fee (net of waivers) | $509,860 |
| Portfolio Turnover | 0% |
Asset Weighting (% of total investments)
| Value | Value |
|---|
| Money Market Funds | 27.9% |
| Purchased Options | 8.5% |
| U.S. Government & Agencies | 69.8% |
What did the Fund invest in?
Sector Weighting (% of net assets)
| Value | Value |
|---|
| Other Assets in Excess of Liabilities | 48.9% |
| Purchased Options | 0.0% |
| Future Option | 1.1% |
| Money Market | 14.3% |
| U.S. Treasury Obligations | 35.7% |
Top 10 Holdings (% of net assets)
| Holding Name | % of Net Assets |
| United States Treasury Bill, 11/29/24 | 15.9% |
| United States Treasury Bill, 01/23/25 | 15.8% |
| First American Treasury Obligations Fund | 7.4% |
| Fidelity Government Portfolio | 6.9% |
| United States Treasury Note | 4.0% |
| S&P500 Emini Option, 10/31/24 5800.0 Call | 1.1% |
| S&P Emini 3rd Week, 11/15/24 5800.0 Call | 1.0% |
| S&P500 Emini Option, 11/29/24 5900.0 Call | 0.7% |
| S&P Emini 3rd Week, 10/18/24 5800.0 Call | 0.4% |
| S&P Emini 3rd Week, 10/18/24 5825.0 Call | 0.4% |
No material changes occurred during the period ended September 30, 2024.
AlphaCentric Premium Opportunity Fund
Semi-Annual Shareholder Report - September 30, 2024
Where can I find additional information about the Fund?
Additional information is available on the Fund's website ( https://alphacentricfunds.com/mutual-funds/ ), including its:
Prospectus
Financial information
Holdings
Proxy voting information
AlphaCentric Premium Opportunity Fund
Semi-Annual Shareholder Report - September 30, 2024
This semi-annual shareholder report contains important information about AlphaCentric Premium Opportunity Fund for the period of April 1, 2024 to September 30, 2024. You can find additional information about the Fund at https://alphacentricfunds.com/mutual-funds/. You can also request this information by contacting us at 1-844-223-8637.
What were the Fund’s costs for the last six months?
(based on a hypothetical $10,000 investment)
| Class Name | Costs of a $10,000 investment | Costs paid as a percentage of a $10,000 investment |
|---|
| Class I | $101 | 1.99%Footnote Reference* |
| Net Assets | $62,328,951 |
| Number of Portfolio Holdings | 55 |
| Advisory Fee (net of waivers) | $509,860 |
| Portfolio Turnover | 0% |
Asset Weighting (% of total investments)
| Value | Value |
|---|
| Money Market Funds | 27.9% |
| Purchased Options | 8.5% |
| U.S. Government & Agencies | 69.8% |
What did the Fund invest in?
Sector Weighting (% of net assets)
| Value | Value |
|---|
| Other Assets in Excess of Liabilities | 48.9% |
| Purchased Options | 0.0% |
| Future Option | 1.1% |
| Money Market | 14.3% |
| U.S. Treasury Obligations | 35.7% |
Top 10 Holdings (% of net assets)
| Holding Name | % of Net Assets |
| United States Treasury Bill, 11/29/24 | 15.9% |
| United States Treasury Bill, 01/23/25 | 15.8% |
| First American Treasury Obligations Fund | 7.4% |
| Fidelity Government Portfolio | 6.9% |
| United States Treasury Note | 4.0% |
| S&P500 Emini Option, 10/31/24 5800.0 Call | 1.1% |
| S&P Emini 3rd Week, 11/15/24 5800.0 Call | 1.0% |
| S&P500 Emini Option, 11/29/24 5900.0 Call | 0.7% |
| S&P Emini 3rd Week, 10/18/24 5800.0 Call | 0.4% |
| S&P Emini 3rd Week, 10/18/24 5825.0 Call | 0.4% |
No material changes occurred during the period ended September 30, 2024.
AlphaCentric Premium Opportunity Fund
Semi-Annual Shareholder Report - September 30, 2024
Where can I find additional information about the Fund?
Additional information is available on the Fund's website ( https://alphacentricfunds.com/mutual-funds/ ), including its:
Prospectus
Financial information
Holdings
Proxy voting information
AlphaCentric Robotics and Automation Fund
Semi-Annual Shareholder Report - September 30, 2024
This semi-annual shareholder report contains important information about AlphaCentric Robotics and Automation Fund for the period of April 1, 2024 to September 30, 2024. You can find additional information about the Fund at https://alphacentricfunds.com/mutual-funds/. You can also request this information by contacting us at 1-844-223-8637.
What were the Fund’s costs for the last six months?
(based on a hypothetical $10,000 investment)
| Class Name | Costs of a $10,000 investment | Costs paid as a percentage of a $10,000 investment |
|---|
| Class A | $91 | 1.85%Footnote Reference* |
| Net Assets | $13,646,594 |
| Number of Portfolio Holdings | 25 |
| Advisory Fee (net of waivers) | $9,661 |
| Portfolio Turnover | 22% |
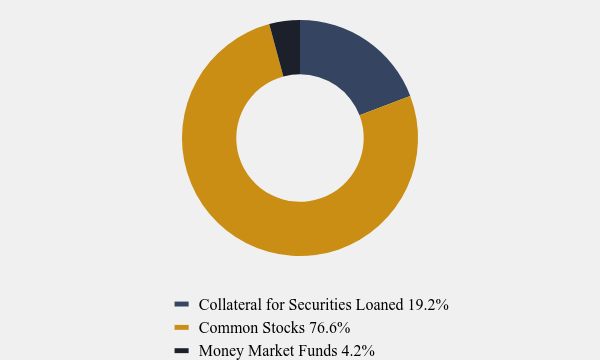
Asset Weighting (% of total investments)
| Value | Value |
|---|
| Collateral for Securities Loaned | 19.2% |
| Common Stocks | 76.6% |
| Money Market Funds | 4.2% |
What did the Fund invest in?
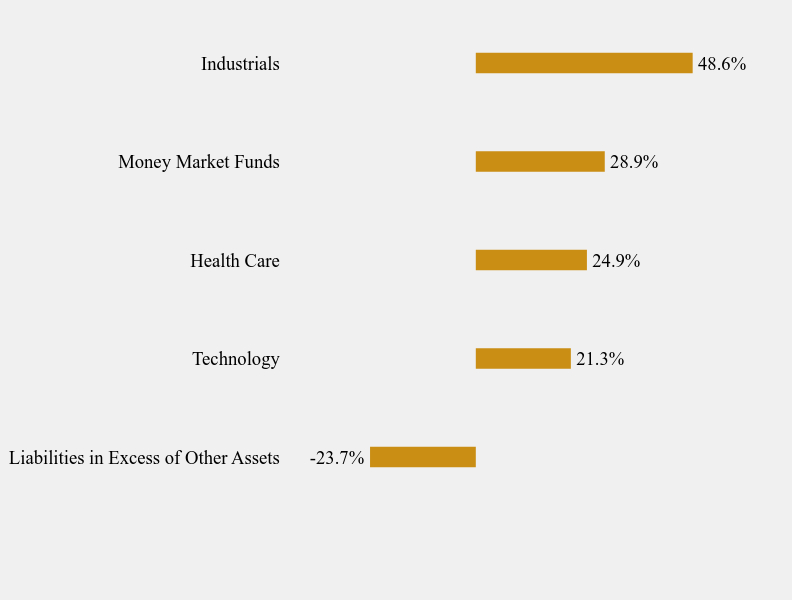
Sector Weighting (% of net assets)
| Value | Value |
|---|
| Liabilities in Excess of Other Assets | -23.7% |
| Technology | 21.3% |
| Health Care | 24.9% |
| Money Market Funds | 28.9% |
| Industrials | 48.6% |
Top 10 Holdings (% of net assets)
| Holding Name | % of Net Assets |
| Mount Vernon Liquid Assets Portfolio | 23.7% |
| Stereotaxis, Inc. | 9.0% |
| Keyence Corporation | 7.0% |
| Infineon Technologies A.G. | 6.4% |
| FANUC Corporation | 5.3% |
| Doosan Robotics, Inc. | 5.3% |
| First American Treasury Obligations Fund, Class X | 5.2% |
| Kraken Robotics, Inc. | 4.8% |
| PROCEPT BioRobotics Corporation | 4.7% |
| Accuray, Inc. | 4.6% |
No material changes occurred during the period ended September 30, 2024.
AlphaCentric Robotics and Automation Fund
Semi-Annual Shareholder Report - September 30, 2024
Where can I find additional information about the Fund?
Additional information is available on the Fund's website ( https://alphacentricfunds.com/mutual-funds/ ), including its:
Prospectus
Financial information
Holdings
Proxy voting information
AlphaCentric Robotics and Automation Fund
Semi-Annual Shareholder Report - September 30, 2024
This semi-annual shareholder report contains important information about AlphaCentric Robotics and Automation Fund for the period of April 1, 2024 to September 30, 2024. You can find additional information about the Fund at https://alphacentricfunds.com/mutual-funds/. You can also request this information by contacting us at 1-844-223-8637.
What were the Fund’s costs for the last six months?
(based on a hypothetical $10,000 investment)
| Class Name | Costs of a $10,000 investment | Costs paid as a percentage of a $10,000 investment |
|---|
| Class C | $128 | 2.60%Footnote Reference* |
| Net Assets | $13,646,594 |
| Number of Portfolio Holdings | 25 |
| Advisory Fee (net of waivers) | $9,661 |
| Portfolio Turnover | 22% |
Asset Weighting (% of total investments)
| Value | Value |
|---|
| Collateral for Securities Loaned | 19.2% |
| Common Stocks | 76.6% |
| Money Market Funds | 4.2% |
What did the Fund invest in?
Sector Weighting (% of net assets)
| Value | Value |
|---|
| Liabilities in Excess of Other Assets | -23.7% |
| Technology | 21.3% |
| Health Care | 24.9% |
| Money Market Funds | 28.9% |
| Industrials | 48.6% |
Top 10 Holdings (% of net assets)
| Holding Name | % of Net Assets |
| Mount Vernon Liquid Assets Portfolio | 23.7% |
| Stereotaxis, Inc. | 9.0% |
| Keyence Corporation | 7.0% |
| Infineon Technologies A.G. | 6.4% |
| FANUC Corporation | 5.3% |
| Doosan Robotics, Inc. | 5.3% |
| First American Treasury Obligations Fund, Class X | 5.2% |
| Kraken Robotics, Inc. | 4.8% |
| PROCEPT BioRobotics Corporation | 4.7% |
| Accuray, Inc. | 4.6% |
No material changes occurred during the period ended September 30, 2024.
AlphaCentric Robotics and Automation Fund
Semi-Annual Shareholder Report - September 30, 2024
Where can I find additional information about the Fund?
Additional information is available on the Fund's website ( https://alphacentricfunds.com/mutual-funds/ ), including its:
Prospectus
Financial information
Holdings
Proxy voting information
AlphaCentric Robotics and Automation Fund
Semi-Annual Shareholder Report - September 30, 2024
This semi-annual shareholder report contains important information about AlphaCentric Robotics and Automation Fund for the period of April 1, 2024 to September 30, 2024. You can find additional information about the Fund at https://alphacentricfunds.com/mutual-funds/. You can also request this information by contacting us at 1-844-223-8637.
What were the Fund’s costs for the last six months?
(based on a hypothetical $10,000 investment)
| Class Name | Costs of a $10,000 investment | Costs paid as a percentage of a $10,000 investment |
|---|
| Class I | $79 | 1.60%Footnote Reference* |
| Net Assets | $13,646,594 |
| Number of Portfolio Holdings | 25 |
| Advisory Fee (net of waivers) | $9,661 |
| Portfolio Turnover | 22% |
Asset Weighting (% of total investments)
| Value | Value |
|---|
| Collateral for Securities Loaned | 19.2% |
| Common Stocks | 76.6% |
| Money Market Funds | 4.2% |
What did the Fund invest in?
Sector Weighting (% of net assets)
| Value | Value |
|---|
| Liabilities in Excess of Other Assets | -23.7% |
| Technology | 21.3% |
| Health Care | 24.9% |
| Money Market Funds | 28.9% |
| Industrials | 48.6% |
Top 10 Holdings (% of net assets)
| Holding Name | % of Net Assets |
| Mount Vernon Liquid Assets Portfolio | 23.7% |
| Stereotaxis, Inc. | 9.0% |
| Keyence Corporation | 7.0% |
| Infineon Technologies A.G. | 6.4% |
| FANUC Corporation | 5.3% |
| Doosan Robotics, Inc. | 5.3% |
| First American Treasury Obligations Fund, Class X | 5.2% |
| Kraken Robotics, Inc. | 4.8% |
| PROCEPT BioRobotics Corporation | 4.7% |
| Accuray, Inc. | 4.6% |
No material changes occurred during the period ended September 30, 2024.
AlphaCentric Robotics and Automation Fund
Semi-Annual Shareholder Report - September 30, 2024
Where can I find additional information about the Fund?
Additional information is available on the Fund's website ( https://alphacentricfunds.com/mutual-funds/ ), including its:
Prospectus
Financial information
Holdings
Proxy voting information
AlphaCentric Real Income Fund
Semi-Annual Shareholder Report - September 30, 2024
This semi-annual shareholder report contains important information about AlphaCentric Real Income Fund for the period of April 1, 2024 to September 30, 2024. You can find additional information about the Fund at https://alphacentricfunds.com/mutual-funds/. You can also request this information by contacting us at 1-844-223-8637. This report describes changes to the Fund that occurred during the reporting period.
What were the Fund’s costs for the last six months?
(based on a hypothetical $10,000 investment)
| Class Name | Costs of a $10,000 investment | Costs paid as a percentage of a $10,000 investment |
|---|
| Class A | $91 | 1.74%Footnote Reference* |
| Net Assets | $59,181,192 |
| Number of Portfolio Holdings | 82 |
| Advisory Fee (net of waivers) | $251,872 |
| Portfolio Turnover | 9% |
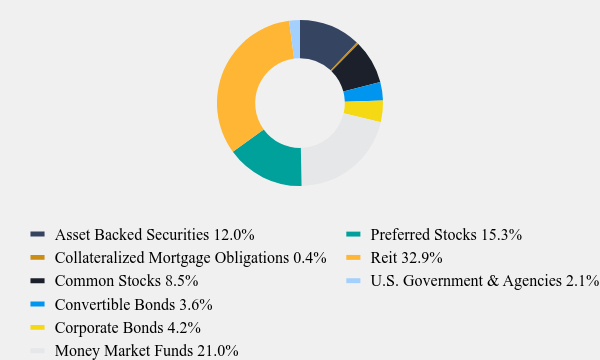
Asset Weighting (% of total investments)
| Value | Value |
|---|
| Asset Backed Securities | 12.0% |
| Collateralized Mortgage Obligations | 0.4% |
| Common Stocks | 8.5% |
| Convertible Bonds | 3.6% |
| Corporate Bonds | 4.2% |
| Money Market Funds | 21.0% |
| Preferred Stocks | 15.3% |
| Reit | 32.9% |
| U.S. Government & Agencies | 2.1% |
What did the Fund invest in?
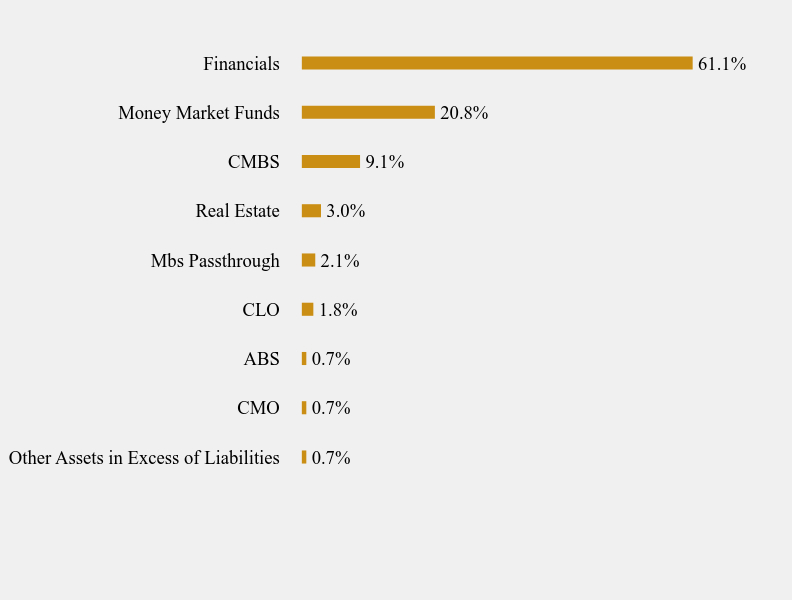
Sector Weighting (% of net assets)
| Value | Value |
|---|
| Other Assets in Excess of Liabilities | 0.7% |
| CMO | 0.7% |
| ABS | 0.7% |
| CLO | 1.8% |
| Mbs Passthrough | 2.1% |
| Real Estate | 3.0% |
| CMBS | 9.1% |
| Money Market Funds | 20.8% |
| Financials | 61.1% |
Top 10 Holdings (% of net assets)
| Holding Name | % of Net Assets |
| First American Treasury Obligations Fund, Class X | 20.8% |
| Rithm Capital Corporation | 7.3% |
| Ellington Financial, Inc. | 4.4% |
| MGIC Investment Corporation | 4.3% |
| Dynex Capital, Inc. | 3.9% |
| Redwood Trust, Inc. | 3.8% |
| MFA Financial, Inc. | 3.6% |
| AG Mortgage Investment Trust, Inc. | 2.7% |
| PHH Mortgage Corporation | 2.7% |
| Enact Holdings, Inc. | 2.6% |
This is a summary of certain changes to the Fund since April 1, 2024. For more complete information, you may review the Fund’s prospectus dated August 1, 2024 or call us at 1-844-223-8637. Effective November 1, 2024, the Fund’s name changed to “AlphaCentric Real Income Fund”. Also effective November 1, 2024, CrossingBridge Advisors, LLC (“CrossingBridge”) replaced Goshen Rock Capital, LLC (“GRC”) as the sub-advisor of the Fund. David K. Sherman, Founder and Chief Investment Officer of CrossingBridge, T. Kirk Whitney, CFA and Assistant Portfolio Manager of CrossingBridge, and Spencer Rolfe, Assistant Portfolio Manager of CrossingBridge, replaced David Gregory and Alex Cigolle, CFA, as Portfolio Managers of the Fund.
AlphaCentric Real Income Fund
Semi-Annual Shareholder Report - September 30, 2024
Where can I find additional information about the Fund?
Additional information is available on the Fund's website ( https://alphacentricfunds.com/mutual-funds/ ), including its:
Prospectus
Financial information
Holdings
Proxy voting information
AlphaCentric Real Income Fund
Semi-Annual Shareholder Report - September 30, 2024
This semi-annual shareholder report contains important information about AlphaCentric Real Income Fund for the period of April 1, 2024 to September 30, 2024. You can find additional information about the Fund at https://alphacentricfunds.com/mutual-funds/. You can also request this information by contacting us at 1-844-223-8637. This report describes changes to the Fund that occurred during the reporting period.
What were the Fund’s costs for the last six months?
(based on a hypothetical $10,000 investment)
| Class Name | Costs of a $10,000 investment | Costs paid as a percentage of a $10,000 investment |
|---|
| Class C | $130 | 2.49%Footnote Reference* |
| Net Assets | $59,181,192 |
| Number of Portfolio Holdings | 82 |
| Advisory Fee (net of waivers) | $251,872 |
| Portfolio Turnover | 9% |
Asset Weighting (% of total investments)
| Value | Value |
|---|
| Asset Backed Securities | 12.0% |
| Collateralized Mortgage Obligations | 0.4% |
| Common Stocks | 8.5% |
| Convertible Bonds | 3.6% |
| Corporate Bonds | 4.2% |
| Money Market Funds | 21.0% |
| Preferred Stocks | 15.3% |
| Reit | 32.9% |
| U.S. Government & Agencies | 2.1% |
What did the Fund invest in?
Sector Weighting (% of net assets)
| Value | Value |
|---|
| Other Assets in Excess of Liabilities | 0.7% |
| CMO | 0.7% |
| ABS | 0.7% |
| CLO | 1.8% |
| Mbs Passthrough | 2.1% |
| Real Estate | 3.0% |
| CMBS | 9.1% |
| Money Market Funds | 20.8% |
| Financials | 61.1% |
Top 10 Holdings (% of net assets)
| Holding Name | % of Net Assets |
| First American Treasury Obligations Fund, Class X | 20.8% |
| Rithm Capital Corporation | 7.3% |
| Ellington Financial, Inc. | 4.4% |
| MGIC Investment Corporation | 4.3% |
| Dynex Capital, Inc. | 3.9% |
| Redwood Trust, Inc. | 3.8% |
| MFA Financial, Inc. | 3.6% |
| AG Mortgage Investment Trust, Inc. | 2.7% |
| PHH Mortgage Corporation | 2.7% |
| Enact Holdings, Inc. | 2.6% |
This is a summary of certain changes to the Fund since April 1, 2024. For more complete information, you may review the Fund’s prospectus dated August 1, 2024 or call us at 1-844-223-8637. Effective November 1, 2024, the Fund’s name changed to “AlphaCentric Real Income Fund”. Also effective November 1, 2024, CrossingBridge Advisors, LLC (“CrossingBridge”) replaced Goshen Rock Capital, LLC (“GRC”) as the sub-advisor of the Fund. David K. Sherman, Founder and Chief Investment Officer of CrossingBridge, T. Kirk Whitney, CFA and Assistant Portfolio Manager of CrossingBridge, and Spencer Rolfe, Assistant Portfolio Manager of CrossingBridge, replaced David Gregory and Alex Cigolle, CFA, as Portfolio Managers of the Fund.
AlphaCentric Real Income Fund
Semi-Annual Shareholder Report - September 30, 2024
Where can I find additional information about the Fund?
Additional information is available on the Fund's website ( https://alphacentricfunds.com/mutual-funds/ ), including its:
Prospectus
Financial information
Holdings
Proxy voting information
AlphaCentric Real Income Fund
Semi-Annual Shareholder Report - September 30, 2024
This semi-annual shareholder report contains important information about AlphaCentric Real Income Fund for the period of April 1, 2024 to September 30, 2024. You can find additional information about the Fund at https://alphacentricfunds.com/mutual-funds/. You can also request this information by contacting us at 1-844-223-8637. This report describes changes to the Fund that occurred during the reporting period.
What were the Fund’s costs for the last six months?
(based on a hypothetical $10,000 investment)
| Class Name | Costs of a $10,000 investment | Costs paid as a percentage of a $10,000 investment |
|---|
| Class I | $78 | 1.49%Footnote Reference* |
| Net Assets | $59,181,192 |
| Number of Portfolio Holdings | 82 |
| Advisory Fee (net of waivers) | $251,872 |
| Portfolio Turnover | 9% |
Asset Weighting (% of total investments)
| Value | Value |
|---|
| Asset Backed Securities | 12.0% |
| Collateralized Mortgage Obligations | 0.4% |
| Common Stocks | 8.5% |
| Convertible Bonds | 3.6% |
| Corporate Bonds | 4.2% |
| Money Market Funds | 21.0% |
| Preferred Stocks | 15.3% |
| Reit | 32.9% |
| U.S. Government & Agencies | 2.1% |
What did the Fund invest in?
Sector Weighting (% of net assets)
| Value | Value |
|---|
| Other Assets in Excess of Liabilities | 0.7% |
| CMO | 0.7% |
| ABS | 0.7% |
| CLO | 1.8% |
| Mbs Passthrough | 2.1% |
| Real Estate | 3.0% |
| CMBS | 9.1% |
| Money Market Funds | 20.8% |
| Financials | 61.1% |
Top 10 Holdings (% of net assets)
| Holding Name | % of Net Assets |
| First American Treasury Obligations Fund, Class X | 20.8% |
| Rithm Capital Corporation | 7.3% |
| Ellington Financial, Inc. | 4.4% |
| MGIC Investment Corporation | 4.3% |
| Dynex Capital, Inc. | 3.9% |
| Redwood Trust, Inc. | 3.8% |
| MFA Financial, Inc. | 3.6% |
| AG Mortgage Investment Trust, Inc. | 2.7% |
| PHH Mortgage Corporation | 2.7% |
| Enact Holdings, Inc. | 2.6% |
This is a summary of certain changes to the Fund since April 1, 2024. For more complete information, you may review the Fund’s prospectus dated August 1, 2024 or call us at 1-844-223-8637. Effective November 1, 2024, the Fund’s name changed to “AlphaCentric Real Income Fund”. Also effective November 1, 2024, CrossingBridge Advisors, LLC (“CrossingBridge”) replaced Goshen Rock Capital, LLC (“GRC”) as the sub-advisor of the Fund. David K. Sherman, Founder and Chief Investment Officer of CrossingBridge, T. Kirk Whitney, CFA and Assistant Portfolio Manager of CrossingBridge, and Spencer Rolfe, Assistant Portfolio Manager of CrossingBridge, replaced David Gregory and Alex Cigolle, CFA, as Portfolio Managers of the Fund.
AlphaCentric Real Income Fund
Semi-Annual Shareholder Report - September 30, 2024
Where can I find additional information about the Fund?
Additional information is available on the Fund's website ( https://alphacentricfunds.com/mutual-funds/ ), including its:
Prospectus
Financial information
Holdings
Proxy voting information
AlphaCentric Symmetry Strategy Fund
Semi-Annual Shareholder Report - September 30, 2024
This semi-annual shareholder report contains important information about AlphaCentric Symmetry Strategy Fund for the period of April 1, 2024 to September 30, 2024. You can find additional information about the Fund at https://alphacentricfunds.com/mutual-funds/. You can also request this information by contacting us at 1-844-223-8637.
What were the Fund’s costs for the last six months?
(based on a hypothetical $10,000 investment)
| Class Name | Costs of a $10,000 investment | Costs paid as a percentage of a $10,000 investment |
|---|
| Class A | $94 | 1.85%Footnote Reference* |
| Net Assets | $40,878,273 |
| Number of Portfolio Holdings | 241 |
| Advisory Fee (net of waivers) | $196,465 |
| Portfolio Turnover | 130% |
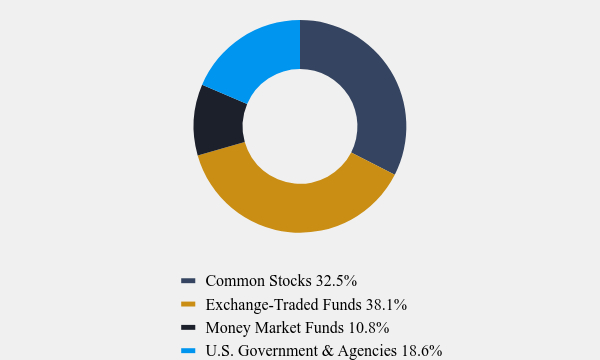
Asset Weighting (% of total investments)
| Value | Value |
|---|
| Common Stocks | 32.5% |
| Exchange-Traded Funds | 38.1% |
| Money Market Funds | 10.8% |
| U.S. Government & Agencies | 18.6% |
What did the Fund invest in?
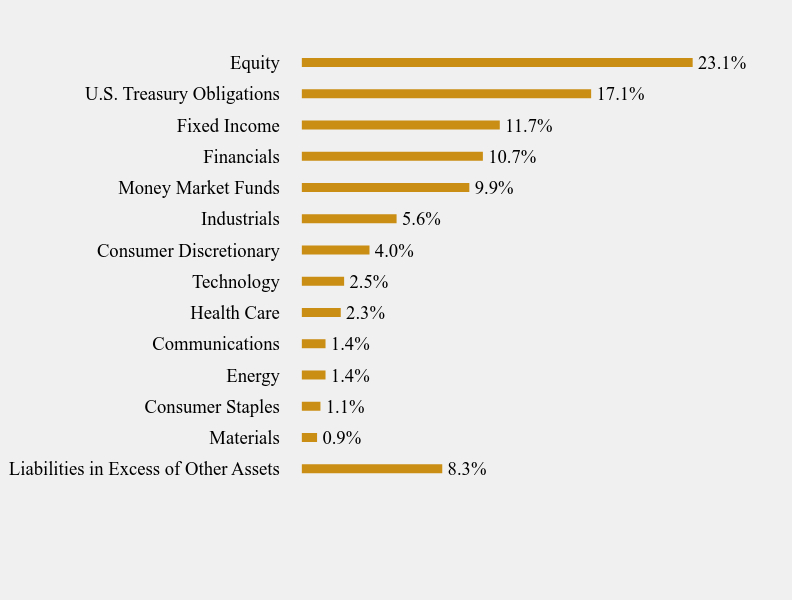
Sector Weighting (% of net assets)
| Value | Value |
|---|
| Liabilities in Excess of Other Assets | 8.3% |
| Materials | 0.9% |
| Consumer Staples | 1.1% |
| Energy | 1.4% |
| Communications | 1.4% |
| Health Care | 2.3% |
| Technology | 2.5% |
| Consumer Discretionary | 4.0% |
| Industrials | 5.6% |
| Money Market Funds | 9.9% |
| Financials | 10.7% |
| Fixed Income | 11.7% |
| U.S. Treasury Obligations | 17.1% |
| Equity | 23.1% |
Top 10 Holdings (% of net assets)
| Holding Name | % of Net Assets |
| First American Treasury Obligations Fund, Class X | 9.9% |
| Invesco QQQ Trust Series 1 | 5.0% |
| Invesco Nasdaq 100 ETF | 5.0% |
| United States Treasury Bill | 4.9% |
| United States Treasury Bill | 4.9% |
| United States Treasury Bill | 4.9% |
| United States Treasury Bill | 2.4% |
| Hartford Financial Services Group, Inc. (The) | 1.3% |
| iShares MSCI Australia ETF | 1.3% |
| JPMorgan BetaBuilders Japan ETF | 1.2% |
No material changes occurred during the period ended September 30, 2024.
AlphaCentric Symmetry Strategy Fund
Semi-Annual Shareholder Report - September 30, 2024
Where can I find additional information about the Fund?
Additional information is available on the Fund's website ( https://alphacentricfunds.com/mutual-funds/ ), including its:
Prospectus
Financial information
Holdings
Proxy voting information
AlphaCentric Symmetry Strategy Fund
Semi-Annual Shareholder Report - September 30, 2024
This semi-annual shareholder report contains important information about AlphaCentric Symmetry Strategy Fund for the period of April 1, 2024 to September 30, 2024. You can find additional information about the Fund at https://alphacentricfunds.com/mutual-funds/. You can also request this information by contacting us at 1-844-223-8637.
What were the Fund’s costs for the last six months?
(based on a hypothetical $10,000 investment)
| Class Name | Costs of a $10,000 investment | Costs paid as a percentage of a $10,000 investment |
|---|
| Class C | $132 | 2.60%Footnote Reference* |
| Net Assets | $40,878,273 |
| Number of Portfolio Holdings | 241 |
| Advisory Fee (net of waivers) | $196,465 |
| Portfolio Turnover | 130% |
Asset Weighting (% of total investments)
| Value | Value |
|---|
| Common Stocks | 32.5% |
| Exchange-Traded Funds | 38.1% |
| Money Market Funds | 10.8% |
| U.S. Government & Agencies | 18.6% |
What did the Fund invest in?
Sector Weighting (% of net assets)
| Value | Value |
|---|
| Liabilities in Excess of Other Assets | 8.3% |
| Materials | 0.9% |
| Consumer Staples | 1.1% |
| Energy | 1.4% |
| Communications | 1.4% |
| Health Care | 2.3% |
| Technology | 2.5% |
| Consumer Discretionary | 4.0% |
| Industrials | 5.6% |
| Money Market Funds | 9.9% |
| Financials | 10.7% |
| Fixed Income | 11.7% |
| U.S. Treasury Obligations | 17.1% |
| Equity | 23.1% |
Top 10 Holdings (% of net assets)
| Holding Name | % of Net Assets |
| First American Treasury Obligations Fund, Class X | 9.9% |
| Invesco QQQ Trust Series 1 | 5.0% |
| Invesco Nasdaq 100 ETF | 5.0% |
| United States Treasury Bill | 4.9% |
| United States Treasury Bill | 4.9% |
| United States Treasury Bill | 4.9% |
| United States Treasury Bill | 2.4% |
| Hartford Financial Services Group, Inc. (The) | 1.3% |
| iShares MSCI Australia ETF | 1.3% |
| JPMorgan BetaBuilders Japan ETF | 1.2% |
No material changes occurred during the period ended September 30, 2024.
AlphaCentric Symmetry Strategy Fund
Semi-Annual Shareholder Report - September 30, 2024
Where can I find additional information about the Fund?
Additional information is available on the Fund's website ( https://alphacentricfunds.com/mutual-funds/ ), including its:
Prospectus
Financial information
Holdings
Proxy voting information
AlphaCentric Symmetry Strategy Fund
Semi-Annual Shareholder Report - September 30, 2024
This semi-annual shareholder report contains important information about AlphaCentric Symmetry Strategy Fund for the period of April 1, 2024 to September 30, 2024. You can find additional information about the Fund at https://alphacentricfunds.com/mutual-funds/. You can also request this information by contacting us at 1-844-223-8637.
What were the Fund’s costs for the last six months?
(based on a hypothetical $10,000 investment)
| Class Name | Costs of a $10,000 investment | Costs paid as a percentage of a $10,000 investment |
|---|
| Class I | $81 | 1.60%Footnote Reference* |
| Net Assets | $40,878,273 |
| Number of Portfolio Holdings | 241 |
| Advisory Fee (net of waivers) | $196,465 |
| Portfolio Turnover | 130% |
Asset Weighting (% of total investments)
| Value | Value |
|---|
| Common Stocks | 32.5% |
| Exchange-Traded Funds | 38.1% |
| Money Market Funds | 10.8% |
| U.S. Government & Agencies | 18.6% |
What did the Fund invest in?
Sector Weighting (% of net assets)
| Value | Value |
|---|
| Liabilities in Excess of Other Assets | 8.3% |
| Materials | 0.9% |
| Consumer Staples | 1.1% |
| Energy | 1.4% |
| Communications | 1.4% |
| Health Care | 2.3% |
| Technology | 2.5% |
| Consumer Discretionary | 4.0% |
| Industrials | 5.6% |
| Money Market Funds | 9.9% |
| Financials | 10.7% |
| Fixed Income | 11.7% |
| U.S. Treasury Obligations | 17.1% |
| Equity | 23.1% |
Top 10 Holdings (% of net assets)
| Holding Name | % of Net Assets |
| First American Treasury Obligations Fund, Class X | 9.9% |
| Invesco QQQ Trust Series 1 | 5.0% |
| Invesco Nasdaq 100 ETF | 5.0% |
| United States Treasury Bill | 4.9% |
| United States Treasury Bill | 4.9% |
| United States Treasury Bill | 4.9% |
| United States Treasury Bill | 2.4% |
| Hartford Financial Services Group, Inc. (The) | 1.3% |
| iShares MSCI Australia ETF | 1.3% |
| JPMorgan BetaBuilders Japan ETF | 1.2% |
No material changes occurred during the period ended September 30, 2024.
AlphaCentric Symmetry Strategy Fund
Semi-Annual Shareholder Report - September 30, 2024
Where can I find additional information about the Fund?
Additional information is available on the Fund's website ( https://alphacentricfunds.com/mutual-funds/ ), including its:
Prospectus
Financial information
Holdings
Proxy voting information
(b) Not applicable
Item 2. Code of Ethics. Not applicable.
Item 3. Audit Committee Financial Expert. Not applicable.
Item 4. Principal Accountant Fees and Services. Not applicable.
Item 5. Audit Committee of Listed Companies. Not applicable to open-end investment companies.
Item 6. Schedule of Investments. The Registrant’s schedule of investments in unaffiliated issuers is included in the Financial Statements under Item 7 of this form.
Item 7. Financial Statements and Financial Highlights for Open-End Management Investment Companies.
(a)

Semi-Annual Financial Statements
AlphaCentric Income Opportunities Fund
Class A: IOFAX Class C: IOFCX Class I: IOFIX
AlphaCentric Premium Opportunity Fund
Class A: HMXAX Class C: HMXCX Class I: HMXIX
AlphaCentric Robotics and Automation Fund
Class A: GNXAX Class C: GNXCX Class I: GNXIX
AlphaCentric Symmetry Strategy Fund
Class A: SYMAX Class C: SYMCX Class I: SYMIX
AlphaCentric Life Science and Healthcare Fund
(formerly known as AlphaCentric LifeSci Healthcare Fund)
Class A: LYFAX Class C: LYFCX Class I: LYFIX
AlphaCentric Real Income Fund
(formerly known as AlphaCentric Strategic Income Fund)
Class A: SIIAX Class C: SIICX Class I: SIIIX
September 30, 2024
AlphaCentric Advisors LLC
53 Palmeras Street, Suite 601
San Juan, PR 00901
1-844-223-8637
| ALPHACENTRIC INCOME OPPORTUNITIES FUND (IOFAX, IOFCX, IOFIX) |
| SCHEDULE OF INVESTMENTS (Unaudited) |
| September 30, 2024 |
| Principal | | | | | | | Coupon | | | | | |
| Amount ($) | | | | | Spread | | Rate (%) | | Maturity | | Fair Value | |
| | | | | NON-AGENCY RESIDENTIAL MORTGAGE BACKED SECURITIES - 96.3% | | | | | | | | | | |
| | 1,290,228 | | | ABFS Mortgage Loan Trust 2003-2 Series 2003-2 B(a),(b) | | | | 6.1760 | | 04/25/34 | | $ | 659,219 | |
| | 39,963 | | | ACE Securities Corp Home Equity Loan Trust Series Series 2004-FM2 M3(c) | | TSFR1M + 2.139% | | 0.0001 | | 06/25/34 | | | 33,654 | |
| | 315,832 | | | ACE Securities Corp Home Equity Loan Trust Series Series 2004-RM2 M4(c) | | TSFR1M + 1.434% | | 3.4940 | | 01/25/35 | | | 312,917 | |
| | 4,535,817 | | | ACE Securities Corp Home Equity Loan Trust Series Series 2005-HE2 M7(c) | | TSFR1M + 1.959% | | 1.2910 | | 04/25/35 | | | 3,182,024 | |
| | 4,883,482 | | | ACE Securities Corp Home Equity Loan Trust Series Series 2006-ASP4 M1(c) | | TSFR1M + 0.549% | | 3.1300 | | 08/25/36 | | | 4,606,211 | |
| | 5,784,808 | | | Adjustable Rate Mortgage Trust 2005-2 Series 2005-2 6M3(c) | | TSFR1M + 1.464% | | 2.5670 | | 06/25/35 | | | 4,569,476 | |
| | 41,982 | | | Adjustable Rate Mortgage Trust 2005-3 Series 2005-3 1A2(b) | | | | 4.5930 | | 07/25/35 | | | 39,377 | |
| | 1,286,219 | | | Alternative Loan Trust 2006-OA22 Series 2006-OA22 A3(c) | | TSFR1M + 0.594% | | 4.4990 | | 02/25/47 | | | 1,084,140 | |
| | 4,124,922 | | | American Home Mortgage Investment Trust 2006-1 Series 2006-1 1A2(c) | | TSFR1M + 0.494% | | 5.7720 | | 03/25/46 | | | 3,564,014 | |
| | 1,037,239 | | | Ameriquest Mort Sec Inc Ass Bk Pas Thr Certs Ser Series 2002-2 M4(c) | | TSFR1M + 3.414% | | 4.4570 | | 08/25/32 | | | 937,093 | |
| | 1,296,315 | | | Ameriquest Mortgage Securities Asset-Backed Series 2005-R10 M7(c) | | TSFR1M + 2.289% | | 0.0001 | | 01/25/36 | | | 1,926,127 | |
| | 2,788 | | | Amresco Residential Securities Corp Mort Loan Series 1999-1 M2(c) | | TSFR1M + 1.464% | | 0.0001 | | 11/25/29 | | | 2,534 | |
| | 2,369,765 | | | Banc of America Mortgage 2004-K Trust Series 2004-K B1(b) | | | | 5.2990 | | 12/25/34 | | | 1,928,697 | |
| | 1,290,333 | | | Bear Stearns ALT-A Trust 2004-11 Series 2004-11 1M2(c) | | TSFR1M + 1.689% | | 4.9610 | | 11/25/34 | | | 1,213,933 | |
| | 9,804 | | | Bear Stearns ARM Trust 2003-8 Series 2003-8 1A2(b) | | | | 6.2490 | | 01/25/34 | | | 9,248 | |
| | 162,664 | | | Bear Stearns ARM Trust 2004-7 Series 2004-7 1A1(b) | | | | 0.0001 | | 10/25/34 | | | 125,605 | |
| | 1,753,617 | | | Bear Stearns Asset Backed Securities I Trust Series 2007-HE7 M2(c) | | TSFR1M + 1.864% | | 4.3140 | | 10/25/37 | | | 1,655,185 | |
| | 45,368,500 | | | Carrington Mortgage Loan Trust Series 2006-FRE1 Series 2006-FRE1 M1(c) | | TSFR1M + 0.414% | | 1.1260 | | 07/25/36 | | | 32,643,780 | |
| | 8,846,246 | | | Carrington Mortgage Loan Trust Series 2006-NC4 Series 2006-NC4 M1(c) | | TSFR1M + 0.414% | | 3.8100 | | 10/25/36 | | | 5,648,594 | |
| | 14,438,454 | | | Carrington Mortgage Loan Trust Series 2007-RFC1 Series 2007-RFC1 M1(c) | | TSFR1M + 0.374% | | 4.1780 | | 12/25/36 | | | 10,451,833 | |
| | 58,269 | | | Centex Home Equity Loan Trust 2004-B Series 2004-B M7(c) | | TSFR1M + 2.439% | | 5.7840 | | 03/25/34 | | | 2,553 | |
| | 14,454,834 | | | CIT Mortgage Loan Trust 2007-1 Series 2007-1 2M3(a),(c) | | TSFR1M + 1.864% | | 5.5670 | | 10/25/37 | | | 10,565,141 | |
| | 42,560,754 | | | CIT Mortgage Loan Trust 2007-1 Series 2007-1 1M3(a),(c) | | TSFR1M + 1.864% | | 6.0610 | | 10/25/37 | | | 32,456,772 | |
| | 4,771,429 | | | Citigroup Mortgage Loan Trust 2006-WMC1 Series 2006-WMC1 M2(c) | | TSFR1M + 0.729% | | 3.8750 | | 12/25/35 | | | 3,445,229 | |
| | 10,937,923 | | | Citigroup Mortgage Loan Trust 2007-AHL1 Series 2007-AHL1 M2(c) | | TSFR1M + 0.519% | | 4.5350 | | 12/25/36 | | | 10,869,611 | |
| | 541,772 | | | Citigroup Mortgage Loan Trust, Inc. Series 2005-OPT1 M8(c) | | TSFR1M + 2.049% | | 0.0001 | | 02/25/35 | | | 458,337 | |
| | 3,701,057 | | | Countrywide Asset-Backed Certificates Series 2007-BC2 M1(c) | | TSFR1M + 0.454% | | 4.4670 | | 06/25/37 | | | 2,242,655 | |
| | 4,008,172 | | | Countrywide Asset-Backed Certificates Series 2007-2 M1(c) | | TSFR1M + 0.334% | | 0.0001 | | 08/25/37 | | | 3,567,489 | |
| | 1,324,066 | | | Credit Suisse First Boston Mortgage Securities Series 2001-HE22 M1(c) | | TSFR1M + 1.614% | | 5.5140 | | 02/25/32 | | | 2,254,829 | |
| | 3,645,987 | | | Credit-Based Asset Servicing and Securitization, Series 2007-SP2 M7(a),(d) | | | | 3.8410 | | 03/25/46 | | | 1,299,711 | |
| | 1,395,018 | | | Delta Funding Home Equity Loan Trust 1997-3 Series 1997-3 B1F | | | | 7.6500 | | 10/25/28 | | | 1,327,274 | |
| | 1,188,267 | | | Delta Funding Home Equity Loan Trust 1998-1 Series 1998-1 M1F(c) | | TSFR1M + 0.939% | | 0.0001 | | 05/25/30 | | | 1,073,232 | |
| | 856,347 | | | Delta Funding Home Equity Loan Trust 1999-1 Series 1999-1 B(b) | | | | 4.3420 | | 03/15/28 | | | 779,513 | |
| | 1,722,206 | | | Delta Funding Home Equity Loan Trust 1999-2 Series 1999-2 M1 | | | | 2.8660 | | 08/15/30 | | | 1,417,140 | |
| | 5,666,067 | | | EMC Mortgage Loan Trust 2005-B Series 2005-B M2(a),(c) | | TSFR1M + 2.364% | | 4.8330 | | 04/25/42 | | | 5,628,036 | |
See accompanying notes to financial statements.
| ALPHACENTRIC INCOME OPPORTUNITIES FUND (IOFAX, IOFCX, IOFIX) |
| SCHEDULE OF INVESTMENTS (Unaudited) (Continued) |
| September 30, 2024 |
| Principal | | | | | | | Coupon | | | | | |
| Amount ($) | | | | | Spread | | Rate (%) | | Maturity | | Fair Value | |
| | | | | NON-AGENCY RESIDENTIAL MORTGAGE BACKED SECURITIES - 96.3% (Continued) | | | | | | | | | | |
| | 1,997,012 | | | First Franklin Mortgage Loan Trust 2006-FF7 Series 2006-FF7 M1(c) | | TSFR1M + 0.489% | | 0.0001 | | 05/25/36 | | $ | 1,735,666 | |
| | 8,315,722 | | | First Franklin Mortgage Loan Trust 2006-FF9 Series 2006-FF9 M1(c) | | TSFR1M + 0.489% | | 5.0220 | | 06/25/36 | | | 6,756,664 | |
| | 1,975,222 | | | Fremont Home Loan Trust 2004-3 Series 2004-3 M5(c) | | TSFR1M + 1.989% | | 0.0001 | | 11/25/34 | | | 1,343,654 | |
| | 7,110 | | | GSR Mortgage Loan Trust 2005-7F Series 2005-7F 3A1(c) | | TSFR1M + 0.614% | | 5.8920 | | 09/25/35 | | | 6,974 | |
| | 940,308 | | | GSRPM Mortgage Loan Trust Series 2004-1 Series 2004-1 B2(a),(c) | | TSFR1M + 5.364% | | 2.9380 | | 09/25/42 | | | 881,329 | |
| | 1,149,872 | | | HarborView Mortgage Loan Trust 2006-12 Series 2006-12 2A2B(c) | | TSFR1M + 0.614% | | 3.4780 | | 01/19/38 | | | 1,717,685 | |
| | 18,650 | | | IndyMac INDX Mortgage Loan Trust 2004-AR6 Series 2004-AR6 6A2(b) | | | | 5.8740 | | 10/25/34 | | | 17,370 | |
| | 1,009,939 | | | IXIS Real Estate Capital Trust 2005-HE2 Series 2005-HE2 M6(c) | | TSFR1M + 1.149% | | 6.4270 | | 09/25/35 | | | 1,262,151 | |
| | 274,865 | | | MAFI II Remic Trust 1998-A Series 1998-AX B2 | | | | 6.0000 | | 02/20/27 | | | 247,408 | |
| | 295,776 | | | MASTR Alternative Loan Trust 2002-2 Series 2002-2 B3(b) | | | | 7.1420 | | 10/25/32 | | | 3 | |
| | 1,497,751 | | | Mastr Asset Backed Securities Trust 2004-HE1 Series 2004-HE1 M10(c) | | TSFR1M + 5.364% | | 0.0001 | | 09/25/34 | | | 1,289,547 | |
| | 4,790,954 | | | Mastr Asset Backed Securities Trust 2007-HE1 Series 2007-HE1 M1(c) | | TSFR1M + 0.414% | | 3.1800 | | 05/25/37 | | | 4,052,005 | |
| | 1,462,000 | | | Mastr Specialized Loan Trust Series 2005-3 M2(a),(c) | | TSFR1M + 1.989% | | 3.6960 | | 11/25/35 | | | 1,015,082 | |
| | 6,128,255 | | | Mastr Specialized Loan Trust Series 2006-1 M2(a),(c) | | TSFR1M + 2.514% | | 3.3850 | | 01/25/36 | | | 4,295,892 | |
| | 13,370 | | | Merrill Lynch Mortgage Investors Trust MLMI Series Series 2003-A1 2A(c) | | TSFR12M + 2.340% | | 6.6250 | | 12/25/32 | | | 13,344 | |
| | 42,101 | | | Merrill Lynch Mortgage Investors Trust MLMI Series Series 2003-A2 2A2(c) | | TSFR6M + 1.928% | | 6.9960 | | 02/25/33 | | | 40,290 | |
| | 186,782 | | | Merrill Lynch Mortgage Investors Trust Series MLCC Series 2005-A B2(c) | | TSFR1M + 1.119% | | 6.3970 | | 03/25/30 | | | 137,311 | |
| | 2,879,193 | | | Merrill Lynch Mortgage Investors Trust Series MLCC Series 2006-1 M1(b) | | | | 1.4970 | | 02/25/36 | | | 2,133,091 | |
| | 3,179,059 | | | Mill City Mortgage Loan Trust 2018-3 Series 3 B6(a),(b) | | | | 1.2210 | | 08/25/58 | | | 1,525,948 | |
| | 7,043,983 | | | Mill City Mortgage Loan Trust 2018-3 Series 3 B3(a),(b) | | | | 3.2500 | | 08/25/58 | | | 4,467,377 | |
| | 3,522,491 | | | Mill City Mortgage Loan Trust 2018-3 Series 3 B5(a),(b) | | | | 3.6960 | | 08/25/58 | | | 1,827,950 | |
| | 7,464,280 | | | Mill City Mortgage Loan Trust 2018-4 Series 4 B5(a),(b) | | | | 3.0700 | | 04/25/66 | | | 4,168,690 | |
| | 317,872 | | | Morgan Stanley A.B.S Capital I Inc Trust 2004-WMC3 Series 2004-WMC3 M6(c) | | TSFR1M + 1.764% | | 3.5370 | | 01/25/35 | | | 402,132 | |
| | 5,792,397 | | | Morgan Stanley A.B.S Capital I Inc Trust 2005-WMC5 Series 2005-WMC5 B1(c) | | TSFR1M + 1.914% | | 0.6000 | | 06/25/35 | | | 4,620,493 | |
| | 4,668,895 | | | Morgan Stanley A.B.S Capital I Inc Trust 2007-HE6 Series 2007-HE6 M1(c) | | TSFR1M + 0.374% | | 0.0001 | | 05/25/37 | | | 5,932,163 | |
| | 34,853 | | | Morgan Stanley Mortgage Loan Trust 2004-7AR Series 2004-7AR 2A7(b) | | | | 6.2080 | | 09/25/34 | | | 34,418 | |
| | 6,852,005 | | | Nationstar Home Equity Loan Trust 2007-B Series 2007-B M2(c) | | TSFR1M + 0.584% | | 4.4790 | | 04/25/37 | | | 7,882,733 | |
| | 3,710,983 | | | New Century Home Equity Loan Trust 2006-2 Series 2006-2 M1(c) | | TSFR1M + 0.579% | | 0.0001 | | 08/25/36 | | | 3,068,459 | |
| | 16,451 | | | Nomura Asset Acceptance Corp Alternative Loan Series 2003-A1 A5 | | | | 7.0000 | | 04/25/33 | | | 16,739 | |
| | 4,061 | | | Nomura Asset Acceptance Corp Alternative Loan Series 2003-A1 A2 | | | | 6.0000 | | 05/25/33 | | | 4,085 | |
| | 3,126,335 | | | NovaStar Mortgage Funding Trust Series 2003-1 Series 2003-1 M2(c) | | TSFR1M + 3.114% | | 3.6100 | | 05/25/33 | | | 2,681,014 | |
| | 3,000,925 | | | Option One Mortgage Loan Trust 2005-5 Series 2005-5 M4(c) | | TSFR1M + 0.984% | | 3.6120 | | 12/25/35 | | | 2,553,774 | |
| | 15,091,440 | | | Option One Mortgage Loan Trust 2007-CP1 Series 2007-CP1 M1(c) | | TSFR1M + 0.414% | | 0.0001 | | 03/25/37 | | | 14,186,597 | |
| | 3,611,830 | | | Park Place Securities Inc Asset-Backed Series 2004-WHQ2 M7(c) | | TSFR1M + 2.739% | | 2.5640 | | 02/25/35 | | | 2,273,649 | |
| | 3,986,611 | | | RAAC Series 2006-RP2 Trust Series 2006-RP2 M2(a),(c) | | TSFR1M + 1.364% | | 6.6420 | | 02/25/37 | | | 3,518,084 | |
See accompanying notes to financial statements.
| ALPHACENTRIC INCOME OPPORTUNITIES FUND (IOFAX, IOFCX, IOFIX) |
| SCHEDULE OF INVESTMENTS (Unaudited) (Continued) |
| September 30, 2024 |
| Principal | | | | | | | Coupon | | | | | |
| Amount ($) | | | | | Spread | | Rate (%) | | Maturity | | Fair Value | |
| | | | | NON-AGENCY RESIDENTIAL MORTGAGE BACKED SECURITIES - 96.3% (Continued) | | | | | | | | | | |
| | 12,745,036 | | | RAAC Series 2007-SP3 Trust Series 2007-SP3 M1(c) | | TSFR1M + 2.364% | | 7.6420 | | 09/25/47 | | $ | 9,036,179 | |
| | 2,988,458 | | | RASC Series 2006-EMX1 Trust Series 2006-EMX1 M3(c) | | TSFR1M + 0.584% | | 0.0001 | | 01/25/36 | | | 2,203,807 | |
| | 316,541 | | | Renaissance Home Equity Loan Trust 2003-2 Series 2003-2 M2F(d) | | | | 3.8420 | | 08/25/33 | | | 260,249 | |
| | 7,003,670 | | | Renaissance Home Equity Loan Trust 2005-1 Series 2005-1 M2(d) | | | | 5.9050 | | 05/25/35 | | | 795,594 | |
| | 5,783,013 | | | Renaissance Home Equity Loan Trust 2005-2 Series 2005-2 M2(d) | | | | 5.6010 | | 08/25/35 | | | 1,329,590 | |
| | 107,303 | | | SASCO Mortgage Loan Trust 2003-GEL1 Series 2003-GEL1 M3(c) | | TSFR1M + 4.614% | | 9.8920 | | 10/25/33 | | | 101,370 | |
| | 4,790,187 | | | Saxon Asset Securities Trust 2007-3 Series 2007-3 1M2(c) | | TSFR1M + 1.014% | | 0.5720 | | 09/25/47 | | | 5,166,021 | |
| | 35,084,212 | | | Seasoned Credit Risk Transfer Trust Series 2018-3 Series 3 BX(b) | | | | 0.9440 | | 08/25/57 | | | 12,780,131 | |
| | 7,050,472 | | | Sequoia Mortgage Trust 2004-10 Series 2004-10 XA(b) | | | | 0.0001 | | 11/20/34 | | | 71 | |
| | 494,327 | | | Sequoia Mortgage Trust 2004-10 Series 2004-10 B1(c) | | TSFR1M + 0.864% | | 6.0650 | | 11/20/34 | | | 296,956 | |
| | 372,690 | | | Soundview Home Loan Trust 2005-A Series 2005-A M6(c) | | TSFR1M + 1.464% | | 5.2510 | | 04/25/35 | | | 373,800 | |
| | 5,321,456 | | | Soundview Home Loan Trust 2005-OPT1 Series 2005-OPT1 M5(c) | | TSFR1M + 1.164% | | 3.7530 | | 06/25/35 | | | 3,932,048 | |
| | 2,250,659 | | | Structured Asset Investment Loan Trust 2005-HE3 Series 2005-HE3 M3(c) | | TSFR1M + 0.909% | | 0.0001 | | 09/25/35 | | | 1,649,447 | |
| | 93,742 | | | Structured Asset Mortgage Investments II Trust Series 2004-AR5 1A2(b) | | | | 4.5900 | | 10/19/34 | | | 81,397 | |
| | 673,393 | | | Structured Asset Mortgage Investments Trust Series 2002-AR4 A2(c) | | TSFR1M + 0.939% | | 6.2810 | | 02/19/33 | | | 566,139 | |
| | 2,323,000 | | | Towd Point Mortgage Trust 2018-5 Series 5 B4(a),(b) | | | | 3.4740 | | 07/25/58 | | | 1,474,015 | |
| | 16,964,000 | | | Towd Point Mortgage Trust 2019-4(a),(b) | | | | 4.1610 | | 10/25/59 | | | 13,156,055 | |
| | 757,000 | | | Truman Capital Mortgage Loan Trust Series 2005-1 M3(a),(c) | | TSFR1M + 5.364% | | 4.1970 | | 03/25/37 | | | 699,214 | |
| | 383,030 | | | WaMu Mortgage Pass-Through Certificates Series Series 2003-AR10 B2(b) | | | | 0.0001 | | 10/25/33 | | | 288,125 | |
| | 104,292 | | | WaMu Mortgage Pass-Through Certificates Series Series 2002-AR17 2B1(c) | | COF 11 + 1.250% | | 0.0001 | | 11/25/42 | | | 97,265 | |
| | | | | TOTAL NON-AGENCY RESIDENTIAL MORTGAGE BACKED SECURITIES (Cost $225,927,621) | | | | | | | | | 292,378,427 | |
See accompanying notes to financial statements.
| ALPHACENTRIC INCOME OPPORTUNITIES FUND (IOFAX, IOFCX, IOFIX) |
| SCHEDULE OF INVESTMENTS (Unaudited) (Continued) |
| September 30, 2024 |
| Shares | | | | | Fair Value | |
| | | | | SHORT-TERM INVESTMENT - 3.2% | | | | |
| | | | | MONEY MARKET FUND - 3.2% | | | | |
| | 9,598,845 | | | First American Treasury Obligations Fund, Class X, 4.81% (Cost $9,598,845)(e) | | $ | 9,598,845 | |
| | | | | | | | | |
| | | | | TOTAL INVESTMENTS - 99.5% (Cost $235,526,466) | | $ | 301,977,272 | |
| | | | | OTHER ASSETS IN EXCESS OF LIABILITIES - 0.5% | | | 1,611,160 | |
| | | | | NET ASSETS - 100.0% | | $ | 303,588,432 | |
| REMIC | - Real Estate Mortgage Investment Conduit |
| | |
| COF 11 | - Cost of Funds for the 11th District of San Francisco |
| | |
| TSFR12M | - Term Secured Overnight Financing Rate (SOFR) 1 month |
| | |
| TSFR1M | - Term Secured Overnight Financing Rate (SOFR) 6 month |
| | |
| TSFR6M | - Term Secured Overnight Financing Rate (SOFR) 12 month |
| (a) | Security exempt from registration under Rule 144A or Section 4(2) of the Securities Act of 1933. The security may be resold in transactions exempt from registration, normally to qualified institutional buyers. As of September 30, 2024 the total market value of 144A securities is $87,638,515 or 28.9% of net assets. |
| | |
| (b) | Variable rate security; the rate shown represents the rate on September 30, 2024. |
| | |
| (c) | Floating rate security, the interest rate of which adjusts periodically based on changes in current interest rates and prepayments on the underlying pool of assets. |
| | |
| (d) | Step bond. Coupon rate is fixed rate that changes on a specified date. The rate shown is the current rate at September 30, 2024. |
| | |
| (e) | Rate disclosed is the seven day effective yield as of September 30, 2024. |
See accompanying notes to financial statements.
| ALPHACENTRIC PREMIUM OPPORTUNITY FUND (HMXAX, HMXCX, HMXIX) |
| SCHEDULE OF INVESTMENTS (Unaudited) |
| September 30, 2024 |
Principal
Amount ($) | | | | | Yield Rate (%) | | Maturity | | Fair Value | |
| | | | | U.S. GOVERNMENT & AGENCIES — 35.7% | | | | | | | | |
| | | | | | | | | | | | | |
| | | | | U.S. TREASURY BILLS — 31.7% | | | | | | | | |
| | 10,000,000 | | | United States Treasury Bill(a) | | 4.6900 | | 11/29/24 | | $ | 9,923,528 | |
| | 10,000,000 | | | United States Treasury Bill(a) | | 4.5000 | | 01/23/25 | | | 9,860,324 | |
| | | | | | | | | | | | 19,783,852 | |
| | | | | | | | | | | | | |
| | | | | | | Coupon Rate | | | | | | |
| | | | | | | (%) | | | | | | |
| | | | | U.S. TREASURY NOTES — 4.0% | | | | | | | | |
| | 2,500,000 | | | United States Treasury Note | | 2.8750 | | 06/15/25 | | | 2,477,534 | |
| | | | | | | | | | | | | |
| | | | | TOTAL U.S. GOVERNMENT & AGENCIES (Cost $22,239,484) | | | | | | | 22,261,386 | |
| | | | | | | | | | | | | |
| Shares | | | | | | | | | Fair Value | |
| | | | | SHORT-TERM INVESTMENTS - 14.3% | | | | | | | | |
| | | | | MONEY MARKET FUNDS – 14.3% | | | | | | | | |
| | 4,286,861 | | | Fidelity Government Portfolio, Institutional Class, 4.84%(b) | | | | | | | 4,286,861 | |
| | 4,610,315 | | | First American Treasury Obligations Fund, Class X, 4.81%(b) | | | | | | | 4,610,315 | |
| | | | | TOTAL SHORT-TERM INVESTMENTS (Cost $8,897,176) | | | | | | | 8,897,176 | |
| Contracts(c) | | | | | Broker/
Counterparty | | Expiration
Date | | Exercise
Price | | | Notional
Value | | | Fair Value | |
| | | | | INDEX OPTIONS PURCHASED - 0.1% | | | | | | | | | | | | | | | | |
| | | | | CALL OPTIONS PURCHASED - 0.1% | | | | | | | | | | | | | | | | |
| | 200 | | | Chicago Board Options Exchange VIX (h) | | IB | | 10/16/2024 | | $ | 45 | | | $ | 900,000 | | | $ | 3,922 | |
| | 200 | | | Chicago Board Options Exchange VIX (h) | | IB | | 11/20/2024 | | | 25 | | | | 500,000 | | | | 26,000 | |
| | | | | TOTAL CALL OPTIONS PURCHASED (Cost - $35,377) | | | | | 29,922 | |
| | | | | | | | | | | | | | | | | | | | | |
| | | | | PUT OPTIONS PURCHASED - 0.0%(e) | | | | | | | | | | | | | | | | |
| | 200 | | | Chicago Board Options Exchange VIX (h) | | IB | | 10/16/2024 | | $ | 16 | | | $ | 320,000 | | | $ | 2,200 | |
| | | | | TOTAL PUT OPTIONS PURCHASED (Cost - $4,791) | | | | | | |
| | | | | | | | | | | | | | | | | | | | | |
| | | | | | | | | | | | | | | | | | | | | |
| | | | | TOTAL INDEX OPTIONS PURCHASED (Cost - $40,168) | | | | | $ | 32,122 | |
| Contracts(d) | | | | | Broker/
Counterparty | | Expiration
Date | | Exercise
Price | | | Notional
Value | | | Fair Value | |
| | | | | FUTURE OPTIONS PURCHASED - 4.3% | | | | | | | | | | | | | | | | |
| | | | | CALL OPTIONS PURCHASED – 3.9% | | | | | | | | | | | | | | | | |
| | 65 | | | S&P Emini 3rd Week | | SXM | | 10/18/2024 | | $ | 5,800 | | | $ | 18,850,000 | | | $ | 239,687 | |
| | 75 | | | S&P Emini 3rd Week | | SXM | | 10/18/2024 | | | 5,825 | | | | 21,843,750 | | | | 219,375 | |
| | 20 | | | S&P Emini 3rd Week | | SXM | | 10/18/2024 | | | 5,900 | | | | 5,900,000 | | | | 26,750 | |
| | 100 | | | S&P Emini 3rd Week | | SXM | | 11/15/2024 | | | 5,800 | | | | 29,000,000 | | | | 648,750 | |
| | 50 | | | S&P Emini 3rd Week | | SXM | | 11/15/2024 | | | 6,000 | | | | 15,000,000 | | | | 94,375 | |
| | 150 | | | S&P500 Emini Option | | SXM | | 10/31/2024 | | | 5,800 | | | | 43,500,000 | | | | 691,875 | |
| | 100 | | | S&P500 Emini Option | | SXM | | 11/29/2024 | | | 5,900 | | | | 29,500,000 | | | | 436,250 | |
See accompanying notes to financial statements.
| ALPHACENTRIC PREMIUM OPPORTUNITY FUND (HMXAX, HMXCX, HMXIX) |
| SCHEDULE OF INVESTMENTS (Unaudited) (Continued) |
| September 30, 2024 |
| Contracts(d) | | | | | Broker/
Counterparty | | Expiration
Date | | Exercise
Price | | | Notional
Value | | | Fair Value | |
| | | | | FUTURE OPTIONS PURCHASED - 4.3% (Continued) | | | | | | | | | | | | | | | | |
| | | | | CALL OPTIONS PURCHASED – 3.9% (Continued) | | | | | | | | | | | | | | | | |
| | 15 | | | S&P500 Emini Option | | SXM | | 12/31/2024 | | $ | 6,000 | | | $ | 4,500,000 | | | $ | 69,188 | |
| | 10 | | | S&P500 Emini Option | | SXM | | 12/31/2024 | | | 6,200 | | | | 3,100,000 | | | | 15,125 | |
| | | | | TOTAL CALL OPTIONS PURCHASED (Cost - $1,080,450) | | | | | 2,441,375 | |
| | | | | | | | | | | | | | | | | | | | | |
| | | | | PUT OPTIONS PURCHASED - 0.4% | | | | | | | | | | | | | | | | |
| | 151 | | | Emini SP M Week Option | | SXM | | 10/07/2024 | | $ | 5,425 | | | $ | 40,958,750 | | | $ | 7,550 | |
| | 250 | | | S&P Emini 1st Week | | SXM | | 10/04/2024 | | | 5,350 | | | | 66,875,000 | | | | 5,000 | |
| | 50 | | | S&P Emini 3rd Week | | SXM | | 11/15/2024 | | | 5,150 | | | | 12,875,000 | | | | 45,625 | |
| | 102 | | | S&P Emini Thurs Week | | SXM | | 10/03/2024 | | | 5,450 | | | | 27,795,000 | | | | 1,530 | |
| | 60 | | | S&P Emini Tues Week | | SXM | | 10/01/2024 | | | 4,550 | | | | 13,650,000 | | | | 150 | |
| | 50 | | | S&P Emini Tues Week | | SXM | | 10/01/2024 | | | 4,600 | | | | 11,500,000 | | | | 125 | |
| | 110 | | | S&P Emini Tues Week | | SXM | | 10/01/2024 | | | 5,225 | | | | 28,737,500 | | | | 550 | |
| | 1 | | | S&P500 Emini Option | | SXM | | 12/20/2024 | | | 5,425 | | | | 271,250 | | | | 3,238 | |
| | 50 | | | S&P500 Emini Option | | SXM | | 12/31/2024 | | | 5,475 | | | | 13,687,500 | | | | 179,375 | |
| | | | | TOTAL PUT OPTIONS PURCHASED (Cost - $275,522) | | | | | 243,143 | |
| | | | | | | | | | | | | | | | | | | | | |
| | | | | TOTAL FUTURE OPTIONS PURCHASED (Cost - $1,355,972) | | | | | 2,684,518 | |
| | | | | | | | | | | | | | | | | | | | | |
| | | | | TOTAL INVESTMENTS - 54.4% (Cost $32,532,800) | | | | $ | 33,875,202 | |
| | | | | CALL OPTIONS WRITTEN - (3.0)% (Proceeds received - $1,000,753) | | | | | (1,872,184 | ) |
| | | | | PUT OPTIONS WRITTEN - (0.2)% (Proceeds received - $131,097) | | | | | (102,745 | ) |
| | | | | OTHER ASSETS IN EXCESS OF LIABILITIES - 48.8% | | | | | 30,428,678 | |
| | | | | NET ASSETS - 100.0% | | | | | $ | 62,328,951 | |
| Contracts(c) | | | | | Broker/
Counterparty | | Expiration
Date | | Exercise
Price | | | Notional
Value | | | Fair Value | |
| | | | | INDEX OPTIONS WRITTEN - (0.0)% (f) | | | | | | | | | | | | | | | | |
| | | | | CALL OPTIONS WRITTEN - (0.0)%(f) | | | | | | | | | | | | | | | | |
| | 200 | | | Chicago Board Options Exchange VIX (h) | | IB | | 10/16/2024 | | $ | 25 | | | $ | 500,000 | | | $ | 11,146 | |
| | 200 | | | Chicago Board Options Exchange VIX (h) | | IB | | 11/20/2024 | | | 45 | | | | 900,000 | | | | 9,400 | |
| | | | | TOTAL CALL OPTIONS WRITTEN (Proceeds - $24,050) | | | | | 20,546 | |
| | | | | | | | | | | | | | | | | | | | | |
| | | | | TOTAL INDEX OPTIONS WRITTEN (Proceeds - $24,050) | | | | $ | 20,546 | |
| Contracts(d) | | | | | Broker/
Counterparty | | Expiration
Date | | Exercise
Price | | | Notional
Value | | | Fair Value | |
| | | | | FUTURE OPTIONS WRITTEN - (3.2)% | | | | | | | | | | | | | | | | |
| | | | | CALL OPTIONS WRITTEN - (3.0)% | | | | | | | | | | | | | | | | |
| | 150 | | | Emini SP M Week Option | | SXM | | 10/07/2024 | | $ | 5,985 | | | $ | 44,887,500 | | | $ | 4,500 | |
| | 200 | | | Emini SP W Week Option | | SXM | | 10/02/2024 | | | 5,935 | | | | 59,350,000 | | | | 1,000 | |
| | 150 | | | S&P Emini 1st Week | | SXM | | 10/04/2024 | | | 5,975 | | | | 44,812,500 | | | | 2,625 | |
| | 150 | | | S&P Emini 3rd Week | | SXM | | 10/18/2024 | | | 5,950 | | | | 44,625,000 | | | | 99,375 | |
| | 115 | | | S&P Emini 3rd Week | | SXM | | 10/18/2024 | | | 6,000 | | | | 34,500,000 | | | | 33,925 | |
| | 165 | | | S&P Emini 3rd Week | | SXM | | 11/15/2024 | | | 5,900 | | | | 48,675,000 | | | | 620,813 | |
| | 10 | | | S&P Emini Thurs Week | | SXM | | 10/03/2024 | | | 5,965 | | | | 2,982,500 | | | | 75 | |
| | 100 | | | S&P Emini Tues Week | | SXM | | 10/01/2024 | | | 5,935 | | | | 29,675,000 | | | | 250 | |
| | 225 | | | S&P500 Emini Option | | SXM | | 10/31/2024 | | | 5,900 | | | | 66,375,000 | | | | 444,375 | |
See accompanying notes to financial statements.
| ALPHACENTRIC PREMIUM OPPORTUNITY FUND (HMXAX, HMXCX, HMXIX) |
| SCHEDULE OF INVESTMENTS (Unaudited) (Continued) |
| September 30, 2024 |
| Contracts(d) | | | | | Broker/
Counterparty | | Expiration
Date | | Exercise
Price | | | Notional
Value | | | Fair Value | |
| | | | | FUTURE OPTIONS WRITTEN - (3.2)% (Continued) | | | | | | | | | | | | | | | | |
| | | | | CALL OPTIONS WRITTEN - (3.0)% (Continued) | | | | | | | | | | | | | | | | |
| | 190 | | | S&P500 Emini Option | | SXM | | 11/29/2024 | | $ | 6,025 | | | $ | 57,237,500 | | | $ | 380,000 | |
| | 1 | | | S&P500 Emini Option | | SXM | | 12/20/2024 | | | 6,000 | | | | 300,000 | | | | 3,200 | |
| | 50 | | | S&P500 Emini Option | | SXM | | 12/31/2024 | | | 6,050 | | | | 15,125,000 | | | | 179,375 | |
| | 30 | | | S&P500 Emini Option | | SXM | | 12/31/2024 | | | 6,100 | | | | 9,150,000 | | | | 82,125 | |
| | | | | TOTAL CALL OPTIONS WRITTEN (Proceeds - $976,703) | | | | | 1,851,638 | |
| | | | | | | | | | | | | | | | | | | | | |
| | | | | PUT OPTIONS WRITTEN - (0.2)% | | | | | | | | | | | | | | | | |
| | 302 | | | Emini SP M Week Option | | SXM | | 10/07/2024 | | $ | 5,225 | | | $ | 78,897,500 | | | $ | 9,815 | |
| | 200 | | | Emini SP W Week Option | | SXM | | 10/02/2024 | | | 4,900 | | | | 49,000,000 | | | | 1,000 | |
| | 500 | | | S&P Emini 1st Week | | SXM | | 10/04/2024 | | | 5,100 | | | | 127,500,000 | | | | 7,500 | |
| | 100 | | | S&P Emini 3rd Week | | SXM | | 11/15/2024 | | | 4,750 | | | | 23,750,000 | | | | 40,750 | |
| | 204 | | | S&P Emini Thurs Week | | SXM | | 10/03/2024 | | | 5,150 | | | | 52,530,000 | | | | 1,530 | |
| | 220 | | | S&P Emini Tues Week | | SXM | | 10/01/2024 | | | 4,900 | | | | 53,900,000 | | | | 550 | |
| | 100 | | | S&P Emini Tues Week | | SXM | | 10/01/2024 | | | 4,950 | | | | 24,750,000 | | | | 250 | |
| | 1 | | | S&P500 Emini Option | | SXM | | 12/20/2024 | | | 4,575 | | | | 228,750 | | | | 725 | |
| | 50 | | | S&P500 Emini Option | | SXM | | 12/31/2024 | | | 4,600 | | | | 11,500,000 | | | | 40,625 | |
| | | | | TOTAL PUT OPTIONS WRITTEN (Proceeds - $131,097) | | | | | 102,745 | |
| | | | | | | | | | | | | | | | | | | | | |
| | | | | TOTAL FUTURE OPTIONS WRITTEN (Proceeds - $1,107,800) | | | | $ | 1,954,383 | |
| OPEN FUTURES CONTRACTS | |
| | | | | | | | | | | | |
Number of
Contracts | | | Open Long Futures Contracts | | Expiration | | Notional
Amount(g) | | | Value and
Unrealized
Appreciation
(Depreciation) | |
| | 151 | | | CBOE Volatility Index Future | | 10/16/2024 | | $ | 2,845,218 | | | $ | 41,577 | |
| | 1 | | | CBOE Volatility Index Future | | 11/21/2024 | | | 18,098 | | | | (302 | ) |
| | 4 | | | CME E-Mini NASDAQ 100 Index Future | | 12/23/2024 | | | 1,620,900 | | | | 54,094 | |
| | 20 | | | CME E-mini Russell 2000 Index Futures | | 12/23/2024 | | | 2,249,200 | | | | (14,150 | ) |
| | 175 | | | CME E-Mini Standard & Poor’s 500 Index Future | | 12/23/2024 | | | 50,874,687 | | | | 1,040,465 | |
| | | | | TOTAL OPEN LONG FUTURES CONTRACTS | | | | | | | | $ | 1,121,684 | |
| | | | | | | | | | | | | | | |
| | | | | TOTAL FUTURES CONTRACTS | | | | | | | | $ | 1,121,684 | |
| IB | - Interactive Brokers |
| | |
| SXM | - StoneX Financial Inc. |
| (b) | Rate disclosed is the seven day effective yield as of September 30, 2024. |
| (c) | Each option contract allows the holder of the option to purchase or sell 100 shares of the underlying security. |
| (d) | Each contract is equivalent to one futures contract. |
| (e) | Percentage rounds to less than 0.1%. |
| (f) | Percentage rounds to greater than (0.1)%. |
| (g) | The amounts shown are the underlying reference notional amounts to stock exchange indices and equities upon which the fair value of the futures contracts held by the Fund are based. Notional values do not represent the current fair value of, and are not necessarily indicative of the future cash flows of the Fund’s futures contracts. Further, the underlying price changes in relation to the variables specified by the notional values affects the fair value of these derivative financial instruments. The notional values as set forth within this schedule do not purport to represent economic value at risk to the Fund. |
| (h) | Illiquid security. Total illiquid securities represents 0.1% of net assets as of September 30, 2024. |
| (i) | All or a portion of this investment is segregated as collateral for option contracts and future contracts. |
See accompanying notes to financial statements.
| ALPHACENTRIC ROBOTICS AND AUTOMATION FUND (GNXAX, GNXCX, GNXIX) |
| SCHEDULE OF INVESTMENTS (Unaudited) |
| September 30, 2024 |
| Shares | | | | | Fair Value | |
| | | | | COMMON STOCKS - 94.8% | | | | |
| | | | | AEROSPACE & DEFENSE - 5.6% | | | | |
| | 2,500 | | | AeroVironment, Inc.(a) | | $ | 501,250 | |
| | 15,000 | | | Intuitive Machines, Inc.(a),(b) | | | 120,750 | |
| | 15,000 | | | Rocket Lab USA, Inc.(a),(b) | | | 145,950 | |
| | | | | | | | 767,950 | |
| | | | | ELECTRICAL EQUIPMENT - 8.9% | | | | |
| | 15,000 | | | Cognex Corporation | | | 607,500 | |
| | 2,250 | | | Rockwell Automation, Inc. | | | 604,035 | |
| | | | | | | | 1,211,535 | |
| | | | | MACHINERY - 34.0% | | | | |
| | 15,000 | | | Doosan Robotics, Inc.(a) | | | 725,380 | |
| | 25,000 | | | FANUC Corporation | | | 728,822 | |
| | 2,000 | | | Keyence Corporation | | | 951,261 | |
| | 500,000 | | | Kraken Robotics, Inc.(a) | | | 650,738 | |
| | 5,000 | | | Rainbow Robotics(a) | | | 531,035 | |
| | 350,000 | | | Scott Technology Ltd. | | | 449,174 | |
| | 25,000 | | | Symbotic, Inc.(a),(b) | | | 609,750 | |
| | | | | | | | 4,646,160 | |
| | | | | MEDICAL EQUIPMENT & DEVICES - 24.9% | | | | |
| | 350,000 | | | Accuray, Inc.(a) | | | 630,000 | |
| | 1,250 | | | Intuitive Surgical, Inc.(a),(b) | | | 614,088 | |
| | 100,000 | | | Microbot Medical, Inc.(a) | | | 89,400 | |
| | 50,000 | | | Myomo, Inc.(a) | | | 200,500 | |
| | 8,000 | | | PROCEPT BioRobotics Corporation(a),(b) | | | 640,960 | |
| | 600,000 | | | Stereotaxis, Inc.(a) | | | 1,224,000 | |
| | | | | | | | 3,398,948 | |
| | | | | SEMICONDUCTORS - 10.9% | | | | |
| | 25,000 | | | Infineon Technologies A.G. | | | 875,737 | |
| | 5,000 | | | NVIDIA Corporation(b) | | | 607,200 | |
| | | | | | | | 1,482,937 | |
See accompanying notes to financial statements.
| ALPHACENTRIC ROBOTICS AND AUTOMATION FUND (GNXAX, GNXCX, GNXIX) |
| SCHEDULE OF INVESTMENTS (Unaudited) (Continued) |
| September 30, 2024 |
| Shares | | | | | Fair Value | |
| | | | | COMMON STOCKS - 94.8% (Continued) | | | | |
| | | | | SOFTWARE - 10.5% | | | | |
| | 1,250 | | | Cadence Design Systems, Inc.(a) | | $ | 338,788 | |
| | 125,000 | | | SoundHound AI, Inc.(a),(b) | | | 582,500 | |
| | 1,000 | | | Synopsys, Inc.(a),(b) | | | 506,390 | |
| | | | | | | | 1,427,678 | |
| | | | | | | | | |
| | | | | TOTAL COMMON STOCKS (Cost $13,492,762) | | | 12,935,208 | |
| | | | | | | | | |
| | | | | SHORT-TERM INVESTMENTS - 28.9% | | | | |
| | | | | INVESTMENT PURCHASED AS SECURITIES LENDING COLLATERAL - 23.7% | | | | |
| | 3,240,513 | | | Mount Vernon Liquid Assets Portfolio, 4.95%(c)(d) | | | 3,240,513 | |
| | | | | | | | | |
| | | | | MONEY MARKET FUND - 5.2% | | | | |
| | 703,930 | | | First American Treasury Obligations Fund, Class X, 4.81% (Cost $703,930)(d) | | | 703,930 | |
| | | | | | | | | |
| | | | | TOTAL SHORT-TERM INVESTMENTS (Cost $3,944,443) | | | 3,944,443 | |
| | | | | | | | | |
| | | | | TOTAL INVESTMENTS – 123.7% (Cost $17,437,205) | | $ | 16,879,651 | |
| | | | | LIABILITIES IN EXCESS OF OTHER ASSETS - (23.7)% | | | (3,233,057 | ) |
| | | | | NET ASSETS - 100.0% | | $ | 13,646,594 | |
| (a) | Non-income producing security. |
| (b) | All or a portion of the security is on loan. The total value of the securities on loan as of September 30, 2044 was $3,110,048. |
| (c) | Security was purchased with cash received as collateral for securities on loan at September 30, 2024. Total collateral had a value of $3,240,513 at September 30, 2024. |
| (d) | Rate disclosed is the seven day effective yield as of September 30, 2024. |
See accompanying notes to financial statements.
| ALPHACENTRIC SYMMETRY STRATEGY FUND (SYMAX, SYMCX, SYMIX) |
| CONSOLIDATED SCHEDULE OF INVESTMENTS (Unaudited) |
| September 30, 2024 |
| Shares | | | | | Fair Value | |
| | | | | COMMON STOCKS — 29.9% | | | | |
| | | | | AEROSPACE & DEFENSE - 0.2% | | | | |
| | 455 | | | Howmet Aerospace, Inc. | | $ | 45,614 | |
| | 210 | | | Woodward, Inc. | | | 36,017 | |
| | | | | | | | 81,631 | |
| | | | | ASSET MANAGEMENT - 0.2% | | | | |
| | 688 | | | KKR & Company, Inc. | | | 89,839 | |
| | | | | | | | | |
| | | | | AUTOMOTIVE - 0.4% | | | | |
| | 7,900 | | | Ford Motor Company | | | 83,424 | |
| | 1,972 | | | General Motors Company | | | 88,424 | |
| | | | | | | | 171,848 | |
| | | | | BANKING - 1.4% | | | | |
| | 46 | | | First Citizens BancShares, Inc., Class A | | | 84,684 | |
| | 1,800 | | | JPMorgan Chase & Company | | | 379,548 | |
| | 1,825 | | | Wells Fargo & Company | | | 103,094 | |
| | | | | | | | 567,326 | |
| | | | | CABLE & SATELLITE - 0.4% | | | | |
| | 225 | | | Charter Communications, Inc., Class A(a) | | | 72,918 | |
| | 2,002 | | | Comcast Corporation, Class A | | | 83,624 | |
| | | | | | | | 156,542 | |
| | | | | CHEMICALS - 0.2% | | | | |
| | 591 | | | Celanese Corporation | | | 80,352 | |
| | | | | | | | | |
| | | | | COMMERCIAL SUPPORT SERVICES - 1.5% | | | | |
| | 1,012 | | | Cintas Corporation | | | 208,351 | |
| | 2,020 | | | Republic Services, Inc. | | | 405,696 | |
| | | | | | | | 614,047 | |
| | | | | E-COMMERCE DISCRETIONARY - 0.1% | | | | |
| | 21 | | | MercadoLibre, Inc.(a) | | | 43,091 | |
| | | | | | | | | |
| | | | | ELECTRICAL EQUIPMENT - 0.8% | | | | |
| | 2,650 | | | Amphenol Corporation, Class A | | | 172,674 | |
| | 1,371 | | | Vertiv Holdings Company | | | 136,401 | |
| | | | | | | | 309,075 | |
See accompanying notes to financial statements.
| ALPHACENTRIC SYMMETRY STRATEGY FUND (SYMAX, SYMCX, SYMIX) |
| CONSOLIDATED SCHEDULE OF INVESTMENTS (Unaudited) (Continued) |
| September 30, 2024 |
| Shares | | | | | Fair Value | |
| | | | | COMMON STOCKS — 29.9% (Continued) | | | | |
| | | | | ENGINEERING & CONSTRUCTION - 0.4% | | | | |
| | 251 | | | Comfort Systems USA, Inc. | | $ | 97,978 | |
| | 202 | | | EMCOR Group, Inc. | | | 86,967 | |
| | | | | | | | 184,945 | |
| | | | | ENTERTAINMENT CONTENT - 0.4% | | | | |
| | 979 | | | AppLovin Corporation, Class A(a) | | | 127,808 | |
| | 5,338 | | | Warner Bros Discovery, Inc.(a) | | | 44,039 | |
| | | | | | | | 171,847 | |
| | | | | HEALTH CARE FACILITIES & SERVICES - 2.3% | | | | |
| | 660 | | | Cardinal Health, Inc. | | | 72,943 | |
| | 1,396 | | | DaVita, Inc.(a) | | | 228,846 | |
| | 321 | | | HCA Healthcare, Inc. | | | 130,464 | |
| | 294 | | | McKesson Corporation | | | 145,359 | |
| | 1,426 | | | Tenet Healthcare Corporation(a) | | | 237,002 | |
| | 481 | | | Universal Health Services, Inc., Class B | | | 110,154 | |
| | | | | | | | 924,768 | |
| | | | | HOME CONSTRUCTION - 0.9% | | | | |
| | 587 | | | Lennar Corporation, Class A | | | 110,051 | |
| | 1,670 | | | PulteGroup, Inc. | | | 239,695 | |
| | | | | | | | 349,746 | |
| | | | | INDUSTRIAL SUPPORT SERVICES - 0.3% | | | | |
| | 167 | | | United Rentals, Inc. | | | 135,225 | |
| | | | | | | | | |
| | | | | INSTITUTIONAL FINANCIAL SERVICES - 1.3% | | | | |
| | 1,718 | | | Bank of New York Mellon Corporation (The) | | | 123,455 | |
| | 989 | | | Cboe Global Markets, Inc. | | | 202,617 | |
| | 857 | | | CME Group, Inc. | | | 189,097 | |
| | | | | | | | 515,169 | |
| | | | | INSURANCE - 7.1% | | | | |
| | 471 | | | Allstate Corporation (The) | | | 89,325 | |
| | 1,193 | | | American International Group, Inc. | | | 87,363 | |
| | 3,587 | | | Arch Capital Group Ltd.(a) | | | 401,313 | |
See accompanying notes to financial statements.
| ALPHACENTRIC SYMMETRY STRATEGY FUND (SYMAX, SYMCX, SYMIX) |
| CONSOLIDATED SCHEDULE OF INVESTMENTS (Unaudited) (Continued) |
| September 30, 2024 |
| Shares | | | | | Fair Value | |
| | | | | COMMON STOCKS — 29.9% (Continued) | | | | |
| | | | | INSURANCE - 7.1% (Continued) | | | | |
| | 731 | | | Arthur J Gallagher & Company | | $ | 205,681 | |
| | 1,017 | | | Assurant, Inc. | | | 202,241 | |
| | 1,917 | | | Brown & Brown, Inc. | | | 198,601 | |
| | 338 | | | Chubb Ltd. | | | 97,476 | |
| | 636 | | | Everest Re Group Ltd. | | | 249,204 | |
| | 4,451 | | | Hartford Financial Services Group, Inc. (The) | | | 523,481 | |
| | 4,953 | | | Loews Corporation | | | 391,535 | |
| | 1,297 | | | MetLife, Inc. | | | 106,977 | |
| | 363 | | | Progressive Corporation (The) | | | 92,115 | |
| | 670 | | | Prudential Financial, Inc. | | | 81,137 | |
| | 378 | | | Reinsurance Group of America, Inc. | | | 82,355 | |
| | 1,688 | | | W R Berkley Corporation | | | 95,760 | |
| | | | | | | | 2,904,564 | |
| | | | | INTERNET MEDIA & SERVICES - 0.1% | | | | |
| | 322 | | | DoorDash, Inc., Class A(a) | | | 45,959 | |
| | | | | | | | | |
| | | | | LEISURE FACILITIES & SERVICES - 1.5% | | | | |
| | 8,150 | | | Carnival Corporation(a) | | | 150,612 | |
| | 3,831 | | | DraftKings, Inc., Class A(a) | | | 150,175 | |
| | 1,518 | | | MGM Resorts International(a) | | | 59,339 | |
| | 3,214 | | | Norwegian Cruise Line Holdings Ltd.(a) | | | 65,919 | |
| | 1,029 | | | Royal Caribbean Cruises Ltd. | | | 182,504 | |
| | | | | | | | 608,549 | |
| | | | | METALS & MINING - 0.6% | | | | |
| | 26,181 | | | Kinross Gold Corporation | | | 245,055 | |
| | | | | | | | | |
| | | | | OIL & GAS PRODUCERS - 1.0% | | | | |
| | 479 | | | Diamondback Energy, Inc. | | | 82,580 | |
| | 14,966 | | | Permian Resources Corporation | | | 203,686 | |
| | 768 | | | Targa Resources Corporation | | | 113,672 | |
| | | | | | | | 399,938 | |
| | | | | OIL & GAS SERVICES & EQUIPMENT - 0.4% | | | | |
| | 6,355 | | | TechnipFMC plc | | | 166,692 | |
See accompanying notes to financial statements.
| ALPHACENTRIC SYMMETRY STRATEGY FUND (SYMAX, SYMCX, SYMIX) |
| CONSOLIDATED SCHEDULE OF INVESTMENTS (Unaudited) (Continued) |
| September 30, 2024 |
| Shares | | | | | Fair Value | |
| | | | | COMMON STOCKS — 29.9% (Continued) | | | | |
| | | | | RETAIL - CONSUMER STAPLES - 1.1% | | | | |
| | 499 | | | Costco Wholesale Corporation | | $ | 442,373 | |
| | | | | | | | | |
| | | | | RETAIL - DISCRETIONARY - 0.7% | | | | |
| | 330 | | | Burlington Stores, Inc.(a) | | | 86,948 | |
| | 1,614 | | | TJX Companies, Inc. (The) | | | 189,710 | |
| | | | | | | | 276,658 | |
| | | | | SEMICONDUCTORS - 0.4% | | | | |
| | 259 | | | Broadcom, Inc. | | | 44,678 | |
| | 981 | | | NVIDIA Corporation | | | 119,132 | |
| | | | | | | | 163,810 | |
| | | | | SOFTWARE – 1.0% | | | | |
| | 99 | | | Crowdstrike Holdings, Inc., Class A(a) | | | 27,767 | |
| | 267 | | | Datadog, Inc., Class A(a) | | | 30,721 | |
| | 195 | | | Duolingo, Inc.(a) | | | 54,994 | |
| | 339 | | | Elastic N.V.(a) | | | 26,022 | |
| | 59 | | | HubSpot, Inc.(a) | | | 31,364 | |
| | 327 | | | Roper Technologies, Inc. | | | 181,956 | |
| | 164 | | | Snowflake, Inc.(a) | | | 18,837 | |
| | 148 | | | Zscaler, Inc.(a) | | | 25,299 | |
| | | | | | | | 396,960 | |
| | | | | SPECIALTY FINANCE - 0.8% | | | | |
| | 6,243 | | | Synchrony Financial | | | 311,401 | |
| | | | | | | | | |
| | | | | TECHNOLOGY HARDWARE - 0.2% | | | | |
| | 139 | | | Arista Networks, Inc.(a) | | | 53,351 | |
| | 49 | | | Super Micro Computer, Inc.(a) | | | 20,404 | |
| | | | | | | | 73,755 | |
| | | | | TECHNOLOGY SERVICES - 0.9% | | | | |
| | 928 | | | Broadridge Financial Solutions, Inc. | | | 199,547 | |
| | 690 | | | Visa, Inc., Class A | | | 189,716 | |
| | | | | | | | 389,263 | |
| | | | | TELECOMMUNICATIONS - 0.5% | | | | |
| | 964 | | | T-Mobile US, Inc. | | | 198,931 | |
See accompanying notes to financial statements.
| ALPHACENTRIC SYMMETRY STRATEGY FUND (SYMAX, SYMCX, SYMIX) |
| CONSOLIDATED SCHEDULE OF INVESTMENTS (Unaudited) (Continued) |
| September 30, 2024 |
| Shares | | | | | Fair Value | |
| | | | | COMMON STOCKS — 29.9% (Continued) | | | | |
| | | | | TRANSPORTATION & LOGISTICS - 1.7% | | | | |
| | 6,951 | | | Delta Air Lines, Inc. | | $ | 353,041 | |
| | 1,068 | | | GXO Logistics, Inc.(a) | | | 55,611 | |
| | 5,213 | | | United Airlines Holdings, Inc.(a) | | | 297,454 | |
| | | | | | | | 706,106 | |
| | | | | TRANSPORTATION EQUIPMENT - 0.7% | | | | |
| | 2,769 | | | PACCAR, Inc. | | | 273,245 | |
| | | | | | | | | |
| | | | | WHOLESALE - DISCRETIONARY - 0.4% | | | | |
| | 3,702 | | | Copart, Inc.(a) | | | 193,985 | |
| | | | | | | | | |
| | | | | TOTAL COMMON STOCKS (Cost $10,365,996) | | | 12,192,695 | |
| | | | | | | | | |
| | | | | EXCHANGE-TRADED FUNDS — 34.8% | | | | |
| | | | | EQUITY - 23.1% | | | | |
| | 2,972 | | | Global X MSCI Greece ETF | | | 128,361 | |
| | 10,158 | | | Invesco Nasdaq 100 ETF | | | 2,040,234 | |
| | 4,182 | | | Invesco QQQ Trust Series 1 | | | 2,041,109 | |
| | 15,794 | | | Invesco S&P 500 BuyWrite ETF | | | 360,735 | |
| | 4,705 | | | iShares China Large-Cap ETF | | | 149,525 | |
| | 14,926 | | | iShares Mortgage Real Estate ETF | | | 354,194 | |
| | 19,248 | | | iShares MSCI Australia ETF | | | 521,813 | |
| | 4,751 | | | iShares MSCI Austria ETF | | | 108,442 | |
| | 1,556 | | | iShares MSCI Chile ETF | | | 42,448 | |
| | 2,775 | | | iShares MSCI France ETF | | | 112,110 | |
| | 3,391 | | | iShares MSCI Germany ETF | | | 114,751 | |
| | 2,157 | | | iShares MSCI India ETF(a) | | | 126,249 | |
| | 5,718 | | | iShares MSCI Indonesia ETF | | | 128,655 | |
| | 2,848 | | | iShares MSCI Italy ETF | | | 110,958 | |
| | 4,803 | | | iShares MSCI Malaysia ETF | | | 129,921 | |
| | 2,179 | | | iShares MSCI Netherlands ETF | | | 110,824 | |
| | 3,060 | | | iShares MSCI Peru and Global Exposure ETF | | | 132,131 | |
| | 4,517 | | | iShares MSCI Philippines ETF | | | 131,580 | |
See accompanying notes to financial statements.
| ALPHACENTRIC SYMMETRY STRATEGY FUND (SYMAX, SYMCX, SYMIX) |
| CONSOLIDATED SCHEDULE OF INVESTMENTS (Unaudited) (Continued) |
| September 30, 2024 |
| Shares | | | | | Fair Value | |
| | | | | EXCHANGE-TRADED FUNDS — 34.8% (Continued) | | | | |
| | | | | EQUITY - 23.1% (Continued) | | | | |
| | 5,067 | | | iShares MSCI Poland ETF | | $ | 122,824 | |
| | 2,651 | | | iShares MSCI South Africa ETF | | | 133,610 | |
| | 995 | | | iShares MSCI South Korea ETF | | | 63,640 | |
| | 3,265 | | | iShares MSCI Spain ETF | | | 115,222 | |
| | 2,624 | | | iShares MSCI Sweden ETF | | | 113,908 | |
| | 2,094 | | | iShares MSCI Switzerland ETF | | | 109,097 | |
| | 2,314 | | | iShares MSCI Taiwan ETF | | | 124,655 | |
| | 2,023 | | | iShares MSCI Thailand ETF | | | 140,153 | |
| | 2,948 | | | iShares MSCI United Kingdom ETF | | | 110,285 | |
| | 8,363 | | | JPMorgan BetaBuilders Japan ETF | | | 495,759 | |
| | 9,375 | | | SPDR S&P International Dividend ETF | | | 359,963 | |
| | 4,021 | | | Vanguard Global ex-U.S. Real Estate ETF | | | 188,625 | |
| | 2,815 | | | Vanguard High Dividend Yield ETF | | | 360,883 | |
| | 1,884 | | | Vanguard Real Estate ETF | | | 183,539 | |
| | | | | | | | 9,466,203 | |
| | | | | FIXED INCOME - 11.7% | | | | |
| | 5,827 | | | FlexShares High Yield Value-Scored Bond Index Fund | | | 242,782 | |
| | 17,016 | | | Invesco Senior Loan ETF | | | 357,506 | |
| | 5,583 | | | iShares 0-5 Year High Yield Corporate Bond ETF | | | 242,414 | |
| | 4,482 | | | iShares 1-3 Year Treasury Bond ETF | | | 372,678 | |
| | 1,909 | | | iShares 1-5 Year Investment Grade Corporate Bond | | | 100,528 | |
| | 3,126 | | | iShares 3-7 Year Treasury Bond ETF | | | 373,885 | |
| | 3,823 | | | iShares 7-10 Year Treasury Bond ETF | | | 375,113 | |
| | 8,857 | | | iShares Fallen Angels USD Bond ETF | | | 242,150 | |
| | 898 | | | iShares iBoxx $ Investment Grade Corporate Bond ETF | | | 101,456 | |
| | 9,401 | | | iShares J.P. Morgan EM High Yield Bond ETF | | | 366,827 | |
| | 3,908 | | | iShares J.P. Morgan USD Emerging Markets Bond ETF | | | 365,711 | |
| | 927 | | | iShares National Muni Bond ETF | | | 100,700 | |
| | 11,136 | | | iShares Preferred and Income Securities ETF | | | 370,049 | |
| | 5,312 | | | iShares US & Intl High Yield Corp Bond ETF | | | 243,177 | |
| | 1,885 | | | Schwab US TIPS ETF | | | 101,093 | |
| | 4,834 | | | SPDR Bloomberg Convertible Securities ETF | | | 370,236 | |
| | 2,482 | | | SPDR Bloomberg High Yield Bond ETF | | | 242,715 | |
| | 3,245 | | | SPDR Bloomberg Investment Grade Floating Rate ETF | | | 100,108 | |
See accompanying notes to financial statements.
| ALPHACENTRIC SYMMETRY STRATEGY FUND (SYMAX, SYMCX, SYMIX) |
| CONSOLIDATED SCHEDULE OF INVESTMENTS (Unaudited) (Continued) |
| September 30, 2024 |
| Shares | | | | | | | | | Fair Value | |
| | | | | EXCHANGE-TRADED FUNDS — 34.8% (Continued) | | | | | | | | |
| | | | | FIXED INCOME - 11.7% (Continued) | | | | | | | | |
| | 2,514 | | | SPDR FTSE International Government | | | | | | $ | 101,289 | |
| | | | | | | | | | | | 4,770,417 | |
| | | | | | | | | | | | | |
| | | | | TOTAL EXCHANGE-TRADED FUNDS (Cost $13,413,107) | | | | | | | 14,236,620 | |
| | | | | | | | | | | | | |
Principal
Amount ($) | | | | | Yield Rate (%) | | Maturity | | Fair Value | |
| | | | | U.S. GOVERNMENT & AGENCIES — 17.1% | | | | | | | | |
| | | | | U.S. TREASURY BILLS — 17.1% | | | | | | | | |
| | 2,000,000 | | | United States Treasury Bill(b) | | 3.1400 | | 10/03/24 | | | 1,999,484 | |
| | 1,000,000 | | | United States Treasury Bill(b) | | 4.6500 | | 10/29/24 | | | 996,319 | |
| | 2,000,000 | | | United States Treasury Bill(b) | | 4.6100 | | 11/05/24 | | | 1,990,945 | |
| | 2,000,000 | | | United States Treasury Bill(b) | | 4.6900 | | 11/29/24 | | | 1,984,706 | |
| | | | | TOTAL U.S. GOVERNMENT & AGENCIES (Cost $6,970,913) | | | | | | | 6,971,454 | |
| | | | | | | | | | | | | |
| | | | | SHORT-TERM INVESTMENT - 9.9% | | | | | | | | |
| | | | | MONEY MARKET FUND - 9.9% | | | | | | | | |
| | 4,064,644 | | | First American Treasury Obligations Fund, Class X, 4.81% (Cost $4,064,644)(c) (e) | | | 4,064,644 | |
| | | | | | | | | | | | | |
| | | | | TOTAL INVESTMENTS - 91.7% (Cost $34,814,600) | | | | | | $ | 37,465,413 | |
| | | | | OTHER ASSETS IN EXCESS OF LIABILITIES - 8.3% | | | | | | | 3,412,860 | |
| | | | | NET ASSETS - 100.0% | | | | | | $ | 40,878,273 | |
See accompanying notes to financial statements.
| ALPHACENTRIC SYMMETRY STRATEGY FUND (SYMAX, SYMCX, SYMIX) |
| CONSOLIDATED SCHEDULE OF INVESTMENTS (Unaudited) (Continued) |
| September 30, 2024 |
| OPEN FUTURES CONTRACTS | |
Number of
Contracts | | | Open Long Futures Contracts | | Expiration | | Notional
Amount(d) | | | Value and
Unrealized
Appreciation
(Depreciation) | |
| | 24 | | | 3 Month Euro Euribor Future | | 03/17/2025 | | $ | 6,528,449 | | | $ | 48,487 | |
| | 24 | | | 3 Month Euro Euribor Future | | 06/16/2025 | | | 6,549,159 | | | | 38,219 | |
| | 24 | | | 3 Month Euro Euribor Future | | 09/15/2025 | | | 6,557,510 | | | | 58,200 | |
| | 23 | | | 3 Month Euro Euribor Future | | 12/15/2025 | | | 6,286,522 | | | | 26,844 | |
| | 24 | | | 3 Month Euro Euribor Future | | 03/16/2026 | | | 6,558,512 | | | | 24,628 | |
| | 24 | | | 3 Month Euro Euribor Future | | 06/15/2026 | | | 6,555,840 | | | | 41,988 | |
| | 23 | | | 3 Month Euro Euribor Future | | 09/14/2026 | | | 6,279,479 | | | | 3,208 | |
| | 35 | | | 3-Month CORRA Futures | | 03/17/2025 | | | 6,287,944 | | | | 34,003 | |
| | 35 | | | 3-Month CORRA Futures | | 06/17/2025 | | | 6,302,826 | | | | 24,394 | |
| | 35 | | | 3-Month CORRA Futures | | 09/15/2025 | | | 6,308,650 | | | | 72,167 | |
| | 35 | | | 3-Month CORRA Futures | | 12/15/2025 | | | 6,311,238 | | | | 46,837 | |
| | 35 | | | 3-Month CORRA Futures | | 03/17/2025 | | | 6,312,532 | | | | 42,793 | |
| | 35 | | | 3-Month CORRA Futures | | 06/17/2025 | | | 6,313,179 | | | | 53,569 | |
| | 34 | | | 3-Month CORRA Futures | | 09/15/2025 | | | 6,132,488 | | | | (4,006 | ) |
| | 27 | | | CBOT 2 Year US Treasury Note Future | | 12/30/2024 | | | 5,622,538 | | | | 11,710 | |
| | 26 | | | CBOT 5 Year US Treasury Note | | 12/30/2024 | | | 2,856,953 | | | | 3,289 | |
| | 25 | | | CME Australian Dollar Currency Future | | 12/16/2024 | | | 1,731,125 | | | | 61,374 | |
| | 21 | | | CME British Pound Currency Future | | 12/16/2024 | | | 1,755,338 | | | | 42,466 | |
| | 1 | | | CME Canadian Dollar Currency Future | | 12/17/2024 | | | 74,090 | | | | (450 | ) |
| | 1 | | | CME E Mini Consumer Discretionary Select Sector | | 12/20/2024 | | | 204,680 | | | | 7,510 | |
| | 2 | | | CME E Mini Consumer Staples Select Sector Futures | | 12/20/2024 | | | 169,340 | | | | (220 | ) |
| | 1 | | | CME E Mini Financial Select Sector Futures | | 12/20/2024 | | | 141,038 | | | | 262 | |
| | 1 | | | CME E Mini Health Care Select Sector Futures | | 12/20/2024 | | | 157,100 | | | | (1,460 | ) |
| | 1 | | | CME E Mini Industrial Select Sector Futures | | 12/20/2024 | | | 137,750 | | | | 3,570 | |
| | 2 | | | CME E Mini Materials Select Sector Futures | | 12/20/2024 | | | 206,520 | | | | 6,210 | |
| | 1 | | | CME E Mini Technology Select Sector Futures | | 12/20/2024 | | | 229,950 | | | | 6,690 | |
| | 2 | | | CME E Mini Utilities Select Sector Futures | | 12/20/2024 | | | 164,640 | | | | 4,300 | |
| | 12 | | | CME Euro Foreign Exchange Currency Future | | 12/16/2024 | | | 1,674,975 | | | | 15,212 | |
| | 20 | | | CME Japanese Yen Currency Future | | 12/16/2024 | | | 1,757,625 | | | | (27,452 | ) |
| | 10 | | | CME Lean Hogs Future(e) | | 12/13/2024 | | | 293,100 | | | | (6,400 | ) |
| | 28 | | | CME New Zealand Dollar Currency Future | | 12/16/2024 | | | 1,779,260 | | | | 57,285 | |
| | 3 | | | CME Norwegian Krone Currency Future | | 12/16/2024 | | | 568,800 | | | | 5,530 | |
| | 37 | | | CME South African Rand Currency Future | | 12/16/2024 | | | 1,065,138 | | | | 39,988 | |
| | 9 | | | CME Swedish Krona Currency Future | | 12/16/2024 | | | 1,777,950 | | | | 33,150 | |
| | 12 | | | CME Swiss Franc Currency Future | | 12/16/2024 | | | 1,786,574 | | | | 3,337 | |
| | 4 | | | COMEX Copper Future(e) | | 12/27/2024 | | | 455,300 | | | | 37,900 | |
| | 3 | | | COMEX Gold 100 Troy Ounces Future(e) | | 12/27/2024 | | | 797,820 | | | | 45,120 | |
| | 5 | | | COMEX Silver Future(e) | | 12/27/2024 | | | 786,450 | | | | 54,850 | |
| | 2 | | | E-mini S&P Communication Services Select Sector | | 12/20/2024 | | | 238,750 | | | | 7,075 | |
| | 3 | | | E-mini S&P Real Estate Select Sector Stock Index | | 12/20/2024 | | | 165,675 | | | | (325 | ) |
| | 5 | | | Eurex 10 Year Euro BUND Future | | 12/06/2024 | | | 751,141 | | | | 4,763 | |
| | 22 | | | Eurex 2 Year Euro SCHATZ Future | | 12/06/2024 | | | 2,625,376 | | | | 8,552 | |
| | 11 | | | Eurex 5 Year Euro BOBL Future | | 12/06/2024 | | | 1,470,382 | | | | 8,422 | |
| | 8 | | | Euro-BTP Italian Bond Futures | | 12/06/2024 | | | 1,082,018 | | | | 16,327 | |
| | 36 | | | EUX Short term Euro-BTP Futures | | 12/06/2024 | | | 4,315,911 | | | | 21,996 | |
| | 14 | | | French Government Bond Futures | | 12/06/2024 | | | 1,977,241 | | | | 93 | |
| | 16 | | | KFE 10 Year Treasury Bond Future | | 12/17/2024 | | | 1,425,769 | | | | (5,427 | ) |
| | 48 | | | KFE 3 Year Treasury Bond Future | | 12/17/2024 | | | 3,875,376 | | | | (727 | ) |
See accompanying notes to financial statements.
| ALPHACENTRIC SYMMETRY STRATEGY FUND (SYMAX, SYMCX, SYMIX) |
| CONSOLIDATED SCHEDULE OF INVESTMENTS (Unaudited) (Continued) |
| September 30, 2024 |
| OPEN FUTURES CONTRACTS (Continued) | |
Number of
Contracts | | | Open Long Futures Contracts (Continued) | | Expiration | | Notional
Amount(d) | | | Value and
Unrealized
Appreciation
(Depreciation) | |
| | 16 | | | Long Gilt Future | | 12/27/2024 | | $ | 2,105,595 | | | $ | (8,493 | ) |
| | 23 | | | Montreal Exchange 10 Year Canadian Bond Future | | 12/18/2024 | | | 2,126,162 | | | | 17,389 | |
| | 109 | | | Montreal Exchange 2 Year Canadian Bond Future | | 12/18/2024 | | | 8,483,446 | | | | 38,095 | |
| | 4 | | | NYBOT CSC C Coffee Future(e) | | 12/18/2024 | | | 405,375 | | | | 65,775 | |
| | 5 | | | NYBOT CSC Cocoa Future(e) | | 12/13/2024 | | | 386,100 | | | | 52,300 | |
| | 23 | | | NYBOT CSC Number 11 World Sugar Future(e) | | 05/01/2025 | | | 542,248 | | | | (16,968 | ) |
| | 18 | | | NYMEX Henry Hub Natural Gas Futures(e) | | 03/03/2025 | | | 573,120 | | | | 46,700 | |
| | 8 | | | NYMEX Light Sweet Crude Oil Fu(e) | | 03/03/2025 | | | 537,600 | | | | (41,960 | ) |
| | 6 | | | NYMEX NY Harbor ULSD Futures(e) | | 03/03/2025 | | | 546,563 | | | | (29,333 | ) |
| | 2 | | | NYMEX Platinum Future(e) | | 01/30/2025 | | | 99,110 | | | | (1,545 | ) |
| | 18 | | | SFE 10 Year Australian Bond Future | | 12/16/2024 | | | 1,194,835 | | | | (14,774 | ) |
| | 53 | | | SFE 3 Year Australian Bond Future | | 12/16/2024 | | | 3,537,731 | | | | (6,700 | ) |
| | 22 | | | Three Month SONIA Index Futures | | 03/17/2025 | | | 7,056,722 | | | | (13,840 | ) |
| | 21 | | | Three Month SONIA Index Futures | | 06/16/2025 | | | 6,758,423 | | | | 50,491 | |
| | 21 | | | Three Month SONIA Index Futures | | 09/16/2025 | | | 6,770,707 | | | | 52,616 | |
| | 20 | | | Three Month SONIA Index Futures | | 12/17/2026 | | | 6,454,308 | | | | 18,007 | |
| | 20 | | | Three Month SONIA Index Futures | | 03/16/2026 | | | 6,455,645 | | | | 21,221 | |
| | 20 | | | Three Month SONIA Index Futures | | 06/15/2026 | | | 6,455,980 | | | | 18,088 | |
| | 20 | | | Three Month SONIA Index Futures | | 09/15/2026 | | | 6,455,645 | | | | (9,704 | ) |
| | 26 | | | Three-Month SOFR Futures | | 03/17/2025 | | | 6,271,525 | | | | (7,375 | ) |
| | 26 | | | Three-Month SOFR Futures | | 09/17/2025 | | | 6,300,775 | | | | 18,550 | |
| | 26 | | | Three-Month SOFR Futures | | 12/16/2025 | | | 6,305,000 | | | | 17,250 | |
| | 26 | | | Three-Month SOFR Futures | | 03/16/2026 | | | 6,306,625 | | | | 33,250 | |
| | 26 | | | Three-Month SOFR Futures | | 06/16/2026 | | | 6,306,300 | | | | 43,762 | |
| | 26 | | | Three-Month SOFR Futures | | 09/15/2026 | | | 6,304,675 | | | | (13,950 | ) |
| | 3 | | | TSE Japanese 10 Year Bond Futures | | 12/13/2024 | | | 3,019,308 | | | | 8,197 | |
| | 12 | | | Ultra 10-Year US Treasury Note Futures | | 12/19/2024 | | | 1,419,563 | | | | 1,157 | |
| | | | | TOTAL OPEN LONG FUTURES CONTRACTS | | | | | | | | $ | 1,314,057 | |
| OPEN FUTURES CONTRACTS | |
Number of
Contracts | | | Open Short Futures Contracts | | Expiration | | Notional
Amount(d) | | | Value and
Unrealized
Appreciation
(Depreciation) | |
| | 8 | | | Carbon Emissions Future(e) | | 12/16/2024 | | $ | 583,988 | | | $ | 15,313 | |
| | 25 | | | CBOT Corn Future(e) | | 03/14/2025 | | | 551,563 | | | | (11,025 | ) |
| | 31 | | | CBOT Corn Future(e) | | 12/13/2024 | | | 658,362 | | | | 58,088 | |
| | 10 | | | CBOT Soybean Future(e) | | 03/14/2025 | | | 544,250 | | | | (13,950 | ) |
| | 12 | | | CBOT Soybean Future(e) | | 11/14/2024 | | | 634,200 | | | | 53,713 | |
| | 18 | | | CBOT Soybean Meal Future(e) | | 12/13/2024 | | | 614,880 | | | | (45,720 | ) |
| | 25 | | | CBOT Soybean Oil Future(e) | | 12/13/2024 | | | 649,650 | | | | (28,182 | ) |
| | 18 | | | CBOT Wheat Future(e) | | 03/14/2025 | | | 543,825 | | | | 7,025 | |
| | 23 | | | CBOT Wheat Future(e) | | 12/13/2024 | | | 671,600 | | | | 18,450 | |
| | 59 | | | CME Brazilian Real Currency Future | | 11/01/2024 | | | 1,079,700 | | | | (6,490 | ) |
| | 4 | | | CME Feeder Cattle Future(e) | | 10/31/2024 | | | 492,400 | | | | 3,487 | |
| | 2 | | | CME Live Cattle Future(e) | | 12/01/2024 | | | 147,840 | | | | (4,740 | ) |
| | 41 | | | CME Mexican Peso Currency Future | | 12/16/2024 | | | 1,030,535 | | | | (8,910 | ) |
| | 5 | | | COMEX Copper Future(e) | | 03/27/2025 | | | 571,750 | | | | (5,375 | ) |
See accompanying notes to financial statements.
| ALPHACENTRIC SYMMETRY STRATEGY FUND (SYMAX, SYMCX, SYMIX) |
| CONSOLIDATED SCHEDULE OF INVESTMENTS (Unaudited) (Continued) |
| September 30, 2024 |
| OPEN FUTURES CONTRACTS (Continued) | |
Number of
Contracts | | | Open Short Futures Contracts (Continued) | | Expiration | | Notional
Amount(d) | | | Value and
Unrealized
Appreciation
(Depreciation) | |
| | 52 | | | Euronext Milling Wheat Future(e) | | 12/10/2024 | | $ | 643,414 | | | $ | (17,426 | ) |
| | 9 | | | ICE Brent Crude Oil Future(e) | | 12/12/2024 | | | 645,300 | | | | 24,880 | |
| | 9 | | | ICE Gas Oil Future(e) | | 12/12/2024 | | | 590,850 | | | | 8,450 | |
| | 15 | | | ICE Natural Gas Future(e) | | 12/31/2024 | | | 617,720 | | | | 35,222 | |
| | 6 | | | NYBOT CSC Number 11 World Sugar Future(e) | | 03/31/2024 | | | 150,998 | | | | (22,579 | ) |
| | 11 | | | NYBOT CTN Number 2 Cotton Future(e) | | 12/06/2024 | | | 404,855 | | | | (30,415 | ) |
| | 22 | | | NYMEX Henry Hub Natural Gas Futures(e) | | 12/31/2024 | | | 735,900 | | | | (31,400 | ) |
| | 9 | | | NYMEX Light Sweet Crude Oil Future(e) | | 12/31/2024 | | | 609,930 | | | | 24,530 | |
| | 7 | | | NYMEX NY Harbor ULSD Futures(e) | | 12/02/2024 | | | 635,951 | | | | 46,801 | |
| | 8 | | | NYMEX Reformulated Gasoline Blendstock for Oxygen(e) | | 12/02/2024 | | | 640,484 | | | | 34,834 | |
| | | | | TOTAL OPEN SHORT FUTURES CONTRACTS | | | | | | | | $ | 104,581 | |
| | | | | | | | | | | | | | | |
| | | | | TOTAL FUTURES CONTRACTS | | | | | | | | $ | 1,418,638 | |
CREDIT DEFAULT SWAPS
| | | | | | | | | | | | | | | | | | | | | Upfront | | | | |
| | | | | | | Fixed | | Implied | | Frequency | | | | | | | | | | Premiums | | | Unrealized | |
| | | | | Buy/Sell | | Rate | | Credit | | of | | Expiration | | Notional | | | | | | Paid/ | | | Apreciation/ | |
| Counterparty | | Index | | Protection | | Received | | Spread | | Payments | | Date | | Amount | | | Value | | | (Received) | | | (Depreciation) | |
| SOC | | Markit CDX North America High Yield Index(f) | | Sell | | 5.00% | | 329.22% | | Quarterly | | 6/20/2029 | | $ | 498,000 | | | $ | 39,469 | | | $ | 31,218 | | | $ | 8,251 | |
| SOC | | Markit CDX North America Investment Grade Index(f) | | Sell | | 1.00% | | 52.72% | | Quarterly | | 12/20/2029 | | | 498,000 | | | | 11,303 | | | | 11,233 | | | | 70 | |
| SOC | | Markit iTraxx Europe Index(f) | | Sell | | 1.00% | | 58.84% | | Quarterly | | 12/20/2029 | | | 455,000 | | | | 10,067 | | | | 10,117 | | | | (50 | ) |
| SOC | | Markit iTraxx Europe Crossover Index(f) | | Sell | | 5.00% | | 310.85% | | Quarterly | | 12/20/2029 | | | 455,000 | | | | 41,504 | | | | 40,893 | | | | 611 | |
| | | Net Unrealized Appreciation on Swap Contracts | | | $ | 93,461 | | | $ | 8,882 | |
| ETF | - Exchange-Traded Fund |
| | |
| LTD | - Limited Company |
| | |
| MSCI | - Morgan Stanley Capital International |
| | |
| NV | - Naamioze Vennootschap |
| | |
| PLC | - Public Limited Company |
| | |
| SPDR | - Standard & Poor’s Depositary Receipt |
| | |
| SOC | - Societe Generale |
| (a) | Non-income producing security. |
| | |
| (b) | Zero coupon bond. |
| | |
| (c) | Rate disclosed is the seven day effective yield as of September 30, 2024. |
| | |
| (d) | The amounts shown are the underlying reference notional amounts to stock exchange indices and equities upon which the fair value of the futures contracts held by the Fund are based. Notional values do not represent the current fair value of, and are not necessarily indicative of the future cash flows of the Fund’s futures contracts. Further, the underlying price changes in relation to the variables specified by the notional values affects the fair value of these derivative financial instruments. The notional values as set forth within this schedule do not purport to represent economic value at risk to the Fund. |
| | |
| (e) | All or a portion of this investment is a holding of the ACSSF Fund Limited. |
See accompanying notes to financial statements.
| ALPHACENTRIC LIFE SCIENCE AND HEALTHCARE FUND (LYFAX, LYFCX, LYFIX) |
| SCHEDULE OF INVESTMENTS (Unaudited) |
| September 30, 2024 |
| Shares | | | | | Fair Value | |
| | | | | COMMON STOCKS — 90.0% | | | | |
| | | | | BIOTECH & PHARMA - 79.8% | | | | |
| | 40,000 | | | ACADIA Pharmaceuticals, Inc.(a) | | $ | 615,200 | |
| | 205,000 | | | Amicus Therapeutics, Inc.(a) | | | 2,189,400 | |
| | 30,000 | | | Amphastar Pharmaceuticals, Inc.(a) | | | 1,455,900 | |
| | 47,500 | | | Apellis Pharmaceuticals, Inc.(a) | | | 1,369,900 | |
| | 8,500 | | | Apogee Therapeutics, Inc.(a) | | | 499,290 | |
| | 4,500 | | | Argenx S.E. - ADR(a) | | | 2,439,360 | |
| | 15,000 | | | ArriVent Biopharma, Inc.(a) | | | 352,500 | |
| | 85,000 | | | Astellas Pharma, Inc. - ADR | | | 973,250 | |
| | 10,500 | | | Axsome Therapeutics, Inc.(a) | | | 943,635 | |
| | 5,500 | | | BeiGene Ltd. - ADR(a) | | | 1,234,805 | |
| | 37,500 | | | Bicycle Therapeutics plc(a) | | | 848,625 | |
| | 32,500 | | | BioMarin Pharmaceutical, Inc.(a) | | | 2,284,425 | |
| | 30,000 | | | Celldex Therapeutics, Inc.(a) | | | 1,019,700 | |
| | 1,000 | | | CG oncology, Inc.(a) | | | 37,730 | |
| | 330,000 | | | Coherus Biosciences, Inc.(a) | | | 343,200 | |
| | 12,500 | | | Cytokinetics, Inc.(a) | | | 660,000 | |
| | 201,500 | | | Dynavax Technologies Corporation(a) | | | 2,244,710 | |
| | 10,000 | | | Dyne Therapeutics, Inc.(a) | | | 359,200 | |
| | 108,500 | | | Galapagos N.V. - ADR(a) | | | 3,123,715 | |
| | 3,500 | | | Gilead Sciences, Inc. | | | 293,440 | |
| | 35,000 | | | GSK plc - ADR | | | 1,430,800 | |
| | 97,000 | | | Harmony Biosciences Holdings, Inc.(a) | | | 3,879,999 | |
| | 25,000 | | | Immatics N.V.(a) | | | 285,250 | |
| | 35,000 | | | Immunovant, Inc.(a) | | | 997,850 | |
| | 242,500 | | | Indivior plc(a) | | | 2,364,375 | |
| | 5,000 | | | Insmed, Inc.(a) | | | 365,000 | |
| | 20,000 | | | Intra-Cellular Therapies, Inc.(a) | | | 1,463,400 | |
| | 17,500 | | | Jasper Therapeutics, Inc.(a) | | | 329,175 | |
| | 15,500 | | | Jazz Pharmaceuticals plc(a) | | | 1,726,855 | |
| | 1,125,000 | | | Karyopharm Therapeutics, Inc.(a) | | | 933,750 | |
| | 8,000 | | | Keros Therapeutics, Inc.(a) | | | 464,560 | |
| | 11,478 | | | Kiniksa Pharmaceuticals International plc(a) | | | 286,835 | |
| | 24,000 | | | Merck & Company, Inc. | | | 2,725,440 | |
| | 45,000 | | | Mirum Pharmaceuticals, Inc.(a) | | | 1,755,000 | |
See accompanying notes to financial statements.
| ALPHACENTRIC LIFE SCIENCE AND HEALTHCARE FUND (LYFAX, LYFCX, LYFIX) |
| SCHEDULE OF INVESTMENTS (Unaudited) (Continued) |
| September 30, 2024 |
| Shares | | | | | Fair Value | |
| | | | | COMMON STOCKS — 90.0% (Continued) | | | | |
| | | | | BIOTECH & PHARMA - 79.8% (Continued) | | | | |
| | 14,000 | | | MoonLake Immunotherapeutics(a) | | $ | 705,880 | |
| | 22,500 | | | Neurocrine Biosciences, Inc.(a) | | | 2,592,450 | |
| | 7,000 | | | Nuvalent, Inc.(a) | | | 716,100 | |
| | 135,000 | | | Nuvation Bio, Inc.(a) | | | 309,150 | |
| | 80,000 | | | Perspective Therapeutics, Inc.(a) | | | 1,068,000 | |
| | 35,000 | | | Pfizer, Inc. | | | 1,012,900 | |
| | 25,000 | | | Protagonist Therapeutics, Inc.(a) | | | 1,125,000 | |
| | 245,000 | | | Revance Therapeutics, Inc.(a) | | | 1,271,550 | |
| | 100,000 | | | Roivant Sciences Ltd.(a) | | | 1,154,000 | |
| | 67,500 | | | Royalty Pharma plc, Class A | | | 1,909,575 | |
| | 185,000 | | | Sagimet Biosciences, Inc.(a) | | | 512,450 | |
| | 17,500 | | | Sanofi - ADR | | | 1,008,525 | |
| | 18,000 | | | Sarepta Therapeutics, Inc.(a) | | | 2,248,020 | |
| | 26,000 | | | Structure Therapeutics, Inc. - ADR(a) | | | 1,141,140 | |
| | 80,000 | | | Takeda Pharmaceutical Company Ltd. - ADR | | | 1,137,600 | |
| | 5,500 | | | Tourmaline Bio, Inc. | | | 141,405 | |
| | 6,250 | | | United Therapeutics Corporation(a) | | | 2,239,688 | |
| | 118,000 | | | Valneva S.E. - ADR(a) | | | 717,440 | |
| | 7,500 | | | Vera Therapeutics, Inc.(a) | | | 331,500 | |
| | 50,000 | | | Verona Pharma plc - ADR(a) | | | 1,438,500 | |
| | 3,500 | | | Viking Therapeutics, Inc.(a) | | | 221,585 | |
| | 15,000 | | | Viridian Therapeutics, Inc.(a) | | | 341,250 | |
| | 268,485 | | | VYNE Therapeutics, Inc.(a) | | | 504,752 | |
| | | | | | | | 66,144,734 | |
| | | | | HEALTH CARE FACILITIES & SERVICES - 0.2% | | | | |
| | 7,500 | | | Progyny, Inc.(a) | | | 125,700 | |
| | | | | | | | | |
| | | | | MACHINERY - 1.4% | | | | |
| | 27,500 | | | Enovis Corporation(a) | | | 1,183,875 | |
| | | | | | | | | |
| | | | | MEDICAL EQUIPMENT & DEVICES - 8.6% | | | | |
| | 370,000 | | | Alphatec Holdings, Inc.(a) | | | 2,057,200 | |
| | 4,171 | | | DexCom, Inc.(a) | | | 279,624 | |
| | 36,000 | | | Embecta Corporation | | | 507,600 | |
See accompanying notes to financial statements.
| ALPHACENTRIC LIFE SCIENCE AND HEALTHCARE FUND (LYFAX, LYFCX, LYFIX) |
| SCHEDULE OF INVESTMENTS (Unaudited) (Continued) |
| September 30, 2024 |
| Shares | | | | | Fair Value | |
| | | | | COMMON STOCKS — 90.0% (Continued) | | | | |
| | | | | MEDICAL EQUIPMENT & DEVICES - 8.6% (Continued) | | | | |
| | 30,000 | | | Exact Sciences Corporation(a) | | $ | 2,043,600 | |
| | 9,000 | | | Lantheus Holdings, Inc.(a) | | | 987,750 | |
| | 5,000 | | | Medtronic PLC | | | 450,150 | |
| | 4,000 | | | Penumbra, Inc.(a) | | | 777,240 | |
| | | | | | | | 7,103,164 | |
| | | | | | | | | |
| | | | | TOTAL COMMON STOCKS (Cost $74,905,104) | | | 74,557,473 | |
| | | | | | | | | |
| | | | | SHORT-TERM INVESTMENTS — 8.8% | | | | |
| | | | | MONEY MARKET FUNDS - 8.8% | | | | |
| | 1 | | | Fidelity Government Portfolio, Institutional Class, 4.84%(b) | | | 1 | |
| | 7,319,369 | | | First American Treasury Obligations Fund, Class X, 4.81%(b) | | | 7,319,369 | |
| | | | | TOTAL MONEY MARKET FUNDS (Cost $7,319,370) | | | 7,319,370 | |
| | | | | | | | | |
| | | | | TOTAL SHORT-TERM INVESTMENTS (Cost $7,319,370) | | | 7,319,370 | |
| | | | | | | | | |
| | | | | TOTAL INVESTMENTS - 98.8% (Cost $82,224,474) | | $ | 81,876,843 | |
| | | | | OTHER ASSETS IN EXCESS OF LIABILITIES - 1.2% | | | 1,035,984 | |
| | | | | NET ASSETS - 100.0% | | $ | 82,912,827 | |
| ADR | - American Depositary Receipt |
| | |
| LTD | - Limited Company |
| | |
| NV | - Naamioze Vennootschap |
| | |
| PLC | - Public Limited Company |
| (a) | Non-income producing security. |
| | |
| (b) | Rate disclosed is the seven day effective yield as of September 30, 2024. |
See accompanying notes to financial statements.
| ALPHACENTRIC REAL INCOME FUND (SIIAX, SIICX, SIIIX) |
| SCHEDULE OF INVESTMENTS (Unaudited) |
| September 30, 2024 |
| Shares | | | | | Fair Value | |
| | | | | COMMON STOCKS — 41.1% | | | | |
| | | | | ASSET MANAGEMENT - 0.2% | | | | |
| | 7,744 | | | Star Holdings(a) | | $ | 107,177 | |
| | | | | | | | | |
| | | | | | | | | |
| | | | | MORTGAGE FINANCE - 4.3% | | | | |
| | 14,022 | | | Chimera Investment Corporation (g) | | | 221,968 | |
| | 181,492 | | | Dynex Capital, Inc. (g) | | | 2,315,838 | |
| | | | | | | | 2,537,806 | |
| | | | | MORTGAGE REITS - 25.3% | | | | |
| | 208,879 | | | AG Mortgage Investment Trust, Inc. (g) | | | 1,568,681 | |
| | 84,646 | | | AGNC Investment Corporation (g) | | | 885,397 | |
| | 201,602 | | | Ellington Financial, Inc. (g) | | | 2,598,651 | |
| | 167,725 | | | MFA Financial, Inc. (g) | | | 2,133,462 | |
| | 200,963 | | | New York Mortgage Trust, Inc. (g) | | | 1,272,096 | |
| | 288,343 | | | Redwood Trust, Inc. (g) | | | 2,228,891 | |
| | 380,966 | | | Rithm Capital Corporation (g) | | | 4,323,965 | |
| | | | | | | | 15,011,143 | |
| | | | | MULTI ASSET CLASS REIT - 0.5% | | | | |
| | 11,972 | | | Safehold, Inc. (g) | | | 314,026 | |
| | | | | | | | | |
| | | | | RESIDENTIAL REIT - 2.5% | | | | |
| | 20,611 | | | Equity LifeStyle Properties, Inc. (g) | | | 1,470,388 | |
| | | | | | | | | |
| | | | | SPECIALTY FINANCE - 8.3% | | | | |
| | 42,367 | | | Enact Holdings, Inc. | | | 1,539,193 | |
| | 99,379 | | | MGIC Investment Corporation | | | 2,544,102 | |
| | 25,567 | | | Onity Group, Inc.(a) | | | 816,610 | |
| | | | | | | | 4,899,905 | |
| | | | | | | | | |
| | | | | TOTAL COMMON STOCKS (Cost $22,922,503) | | | 24,340,445 | |
See accompanying notes to financial statements.
| ALPHACENTRIC REAL INCOME FUND (SIIAX, SIICX, SIIIX) |
| SCHEDULE OF INVESTMENTS (Unaudited) (Continued) |
| September 30, 2024 |
| Shares | | | | | Fair Value | |
| | | | | PREFERRED STOCKS — 15.2% | | | | |
| | | | | SPECIALTY FINANCE — 15.2% | | | | |
| | 19,450 | | | AG Mortgage Investment Trust, Inc. - Series C (d)(g) | | $ | 484,694 | |
| | 5,000 | | | AG Mortgage Investment Trust, Inc. - Series A (g) | | | 127,625 | |
| | 59,964 | | | AGNC Investment Corporation - Series F (d)(g) | | | 1,470,317 | |
| | 10,000 | | | Arbor Realty Trust, Inc. - Series E (g) | | | 197,500 | |
| | 20,000 | | | Arbor Realty Trust, Inc. - Series D (g) | | | 391,000 | |
| | 63,126 | | | Arbor Realty Trust, Inc. - Series F (d)(g) | | | 1,228,432 | |
| | 28,308 | | | Chimera Investment Corporation - Series B (d)(g) | | | 702,321 | |
| | 7,881 | | | Chimera Investment Corporation - Series C (d)(g) | | | 178,505 | |
| | 36,754 | | | Granite Point Mortgage Trust, Inc. - Series A (d)(g) | | | 654,221 | |
| | 12,789 | | | KKR Real Estate Finance Trust, Inc. - Series A (g) | | | 271,510 | |
| | 11,272 | | | MFA Financial, Inc. - Series C (d)(g) | | | 267,146 | |
| | 36,773 | | | New Residential Investment Corporation - Series C (d)(g) | | | 881,817 | |
| | 22,500 | | | New York Mortgage Trust, Inc. - Series F (d)(g) | | | 491,175 | |
| | 37,930 | | | Rithm Capital Corporation - Series D (d)(g) | | | 918,665 | |
| | 9,000 | | | Two Harbors Investment Corporation - Series A (d)(g) | | | 223,740 | |
| | 20,472 | | | Two Harbors Investment Corporation - Series C (d)(g) | | | 504,635 | |
| | | | | TOTAL PREFERRED STOCKS (Cost $9,510,152) | | | 8,993,303 | |
| Principal | | | | | | | Coupon | | | | | |
| Amount ($) | | | | | Spread | | Rate (%) | | Maturity | | Fair Value | |
| | | | | ASSET BACKED SECURITIES — 11.9% | | | | | | | | | | |
| | | | | AUTO LOAN — 0.4% | | | | | | | | | | |
| | 62,693 | | | Exeter Automobile Receivables Trust 2022-1 Series 1A C | | | | 2.5600 | | 06/15/28 | | | 62,340 | |
| | 155,000 | | | First Investors Auto Owner Trust 2022-2 Series 2A D(b) | | | | 8.7100 | | 10/16/28 | | | 164,497 | |
| | | | | | | | | | | | | | 226,837 | |
| | | | | | | | | | | | | | | |
| | | | | CLO — 1.8% | | | | | | | | | | |
| | 1,000,000 | | | ACRES Commercial Realty 2021-FL1 Ltd. Series FL1 C(b),(c) | | TSFR1M + 2.114% | | 7.1970 | | 06/15/36 | | | 973,740 | |
| | 100,000 | | | TRTX 2021-FL4 Issuer Ltd. Series FL4 AS(b),(c) | | TSFR1M + 1.514% | | 6.5970 | | 03/15/38 | | | 99,193 | |
| | | | | | | | | | | | | | 1,072,933 | |
| | | | | | | | | | | | | | | |
| | | | | COLLATERALIZED MORTGAGE OBLIGATIONS — 0.4% | | | | | | | | | | |
| | 38,391 | | | Adjustable Rate Mortgage Trust 2007-1 Series 2007-1 1A1(d) | | | | 5.4880 | | 03/25/37 | | | 31,152 | |
| | 56,388 | | | MFA 2020-NQM2 Trust Series NQM2 A3 (b),(d) | | | | 1.9470 | | 04/25/65 | | | 53,670 | |
| | 201,785 | | | Washington Mutual Mortgage Pass-Through Series 2007-HY1 A2A(c) | | TSFR1M + 0.4345% | | 5.2890 | | 02/25/37 | | | 154,909 | |
| | | | | | | | | | | | | | 239,731 | |
See accompanying notes to financial statements.
| ALPHACENTRIC REAL INCOME FUND (SIIAX, SIICX, SIIIX) |
| SCHEDULE OF INVESTMENTS (Unaudited) (Continued) |
| September 30, 2024 |
| Principal | | | | | | | Coupon | | | | | |
| Amount ($) | | | | | Spread | | Rate (%) | | Maturity | | Fair Value | |
| | | | | ASSET BACKED SECURITIES — 11.9% (Continued) | | | | | | | | | | |
| | | | | HOME EQUITY — 0.3% | | | | | | | | | | |
| | 184,709 | | | Terwin Mortgage Trust 2004-7HE Series 7HE A3(b),(c) | | TSFR1M + 1.5145% | | 6.3690 | | 07/25/34 | | $ | 178,808 | |
| | | | | | | | | | | | | | | |
| | | | | NON AGENCY CMBS — 9.0% | | | | | | | | | | |
| | 477,000 | | | CFCRE Commercial Mortgage Trust 2016-C6 Series C6 C(d) | | | | 4.3100 | | 11/10/49 | | | 430,985 | |
| | 115,000 | | | Citigroup Commercial Mortgage Trust 2017-C4 Series C4 AS | | | | 3.7640 | | 10/12/50 | | | 108,408 | |
| | 100,000 | | | COMM 2013-CCRE6 Mortgage Trust Series 2013-CR6 F(b),(d) | | | | 3.9880 | | 03/10/46 | | | 58,180 | |
| | 115,000 | | | COMM 2015-CCRE25 Mortgage Trust Series CR25 D(d) | | | | 3.9170 | | 08/10/48 | | | 103,250 | |
| | 81,000 | | | COMM 2015-LC19 Mortgage Trust Series 2015-LC19 D(b) | | | | 2.8670 | | 02/10/48 | | | 72,904 | |
| | 20,000 | | | COMM 2015-LC23 Mortgage Trust Series LC23 C(d) | | | | 4.6960 | | 10/10/48 | | | 18,971 | |
| | 825,000 | | | COMM 2015-PC1 Mortgage Trust Series PC1 AM(d) | | | | 4.2900 | | 07/10/50 | | | 814,420 | |
| | 150,000 | | | COMM 2016-CR28 Mortgage Trust Series CR28 B(d) | | | | 4.7390 | | 02/10/49 | | | 143,841 | |
| | 33,371 | | | CSAIL 2016-C5 Commercial Mortgage Trust Series 2016-C5 C(d) | | | | 4.7950 | | 11/15/48 | | | 31,925 | |
| | 100,000 | | | CSAIL 2016-C6 Commercial Mortgage Trust Series C6 B(d) | | | | 3.9240 | | 01/15/49 | | | 93,197 | |
| | 120,000 | | | CSAIL 2016-C6 Commercial Mortgage Trust Series C6 C(d) | | | | 5.0820 | | 01/15/49 | | | 110,750 | |
| | 185,000 | | | DBJPM 2016-C3 Mortgage Trust Series C3 B | | | | 3.2640 | | 08/10/49 | | | 168,231 | |
| | 1,314,046 | | | GS Mortgage Securities Trust 2014-GC26 Series GC26 XA(d),(e) | | | | 0.9060 | | 11/10/47 | | | 25 | |
| | 83,293 | | | JP Morgan Chase Commercial Mortgage Securities | | | | 3.2160 | | 04/15/46 | | | 76,479 | |
| | 45,000 | | | JPMBB Commercial Mortgage Securities Trust Series 2015-C30 B(d) | | | | 4.3690 | | 07/15/48 | | | 37,476 | |
| | 10,000 | | | JPMBB Commercial Mortgage Securities Trust Series 2015-C28 C(d) | | | | 4.2500 | | 10/15/48 | | | 9,316 | |
| | 150,000 | | | JPMDB Commercial Mortgage Securities Trust 2016-C2 Series C2 AS | | | | 3.4840 | | 06/15/49 | | | 138,273 | |
| | 145,000 | | | JPMDB Commercial Mortgage Securities Trust 2017-C7 Series C7 B | | | | 3.9850 | | 10/15/50 | | | 134,143 | |
| | 12,941 | | | Morgan Stanley Bank of America Merrill Lynch Trust Series 2013-C12 C(d) | | | | 4.9640 | | 10/15/46 | | | 11,964 | |
| | 450,000 | | | Morgan Stanley Bank of America Merrill Lynch Trust Series C28 C(d) | | | | 4.7540 | | 01/15/49 | | | 399,239 | |
| | 1,706,103 | | | SG Commercial Mortgage Securities Trust 2016-C5 Series C5 XA(d),(e) | | | | 1.9820 | | 10/10/48 | | | 38,049 | |
| | 370,000 | | | SG Commercial Mortgage Securities Trust 2016-C5 Series C5 B | | | | 3.9330 | | 10/10/48 | | | 344,118 | |
| | 220,000 | | | UBS Commercial Mortgage Trust 2018-C13 Series C13 B(d) | | | | 4.7860 | | 10/15/51 | | | 207,032 | |
| | 170,000 | | | Wells Fargo Commercial Mortgage Trust 2015-C26 Series C26 AS | | | | 3.5800 | | 02/15/48 | | | 168,370 | |
| | 40,000 | | | Wells Fargo Commercial Mortgage Trust 2015-C26 Series C26 C(d) | | | | 4.0710 | | 02/15/48 | | | 39,312 | |
| | 25,000 | | | Wells Fargo Commercial Mortgage Trust 2015-C27 Series 2015-C27 B(d) | | | | 4.1390 | | 02/15/48 | | | 23,660 | |
| | 75,000 | | | Wells Fargo Commercial Mortgage Trust 2015-NXS1 Series 2015-NXS1 D(d) | | | | 4.2200 | | 05/15/48 | | | 69,113 | |
| | 300,000 | | | Wells Fargo Commercial Mortgage Trust 2015-P2 Series P2 E(b),(d) | | | | 4.8180 | | 12/15/48 | | | 250,950 | |
| | 711,150 | | | Wells Fargo Commercial Mortgage Trust 2016-C33 Series C33 C | | | | 3.8960 | | 03/15/59 | | | 666,554 | |
| | 100,000 | | | Wells Fargo Commercial Mortgage Trust 2016-C36 Series C36 B(d) | | | | 3.6710 | | 11/15/59 | | | 89,310 | |
See accompanying notes to financial statements.
| ALPHACENTRIC REAL INCOME FUND (SIIAX, SIICX, SIIIX) |
| SCHEDULE OF INVESTMENTS (Unaudited) (Continued) |
| September 30, 2024 |
| Principal | | | | | | | Coupon | | | | | |
| Amount ($) | | | | | Spread | | Rate (%) | | Maturity | | Fair Value | |
| | | | | ASSET BACKED SECURITIES — 11.9% (Continued) | | | | | | | | | | |
| | | | | NON AGENCY CMBS — 9.0% (Continued) | | | | | | | | | | |
| | 100,000 | | | Wells Fargo Commercial Mortgage Trust 2016-NXS6 Series 2016-NXS6 B | | | | 3.8110 | | 11/15/49 | | $ | 95,065 | |
| | 270,000 | | | WFRBS Commercial Mortgage Trust 2013-C15 Series 2013-C15 B(d) | | | | 4.3270 | | 08/15/46 | | | 237,943 | |
| | 160,000 | | | WFRBS Commercial Mortgage Trust 2013-C15 Series 2013-C15 C(d) | | | | 4.3270 | | 08/15/46 | | | 126,632 | |
| | | | | | | | | | | | | | 5,318,085 | |
| | | | | | | | | | | | | | | |
| | | | | TOTAL ASSET BACKED SECURITIES (Cost $6,898,737) | | | | | | | | | 7,036,394 | |
| | | | | | | | | | | | | | | |
| | | | | COLLATERALIZED MORTGAGE OBLIGATIONS — 0.4% | | | | | | | | | | |
| | | | | CMBS — 0.2% | | | | | | | | | | |
| | 1,000,000 | | | Freddie Mac Multifamily Structured Pass Through Series K126 X3(d),(e) | | | | 2.7190 | | 01/25/49 | | | 136,963 | |
| | | | | | | | | | | | | | | |
| | | | | COLLATERALIZED MORTGAGE OBLIGATIONS — 0.2% | | | | | | | | | | |
| | 684,559 | | | Government National Mortgage Association Series 2019-110 SE(c),(e) | | TSFR1M + 5.986% | | 1.0250 | | 09/20/49 | | | 92,974 | |
| | | | | | | | | | | | | | | |
| | | | | TOTAL COLLATERALIZED MORTGAGE OBLIGATIONS (Cost $213,335) | | | | | | | | | 229,937 | |
| | | | | | | | | | | | | | | |
| | | | | CONVERTIBLE BONDS — 3.6% | | | | | | | | | | |
| | | | | SPECIALTY FINANCE — 3.6% | | | | | | | | | | |
| | 965,000 | | | PennyMac Corporation | | | | 5.5000 | | 11/01/24 | | | 961,381 | |
| | 1,205,000 | | | Two Harbors Investment Corporation | | | | 6.2500 | | 01/15/26 | | | 1,177,888 | |
| | | | | TOTAL CONVERTIBLE BONDS (Cost $2,048,557) | | | | | | | | | 2,139,269 | |
| | | | | | | | | | | | | | | |
| | | | | CORPORATE BONDS — 4.2% | | | | | | | | | | |
| | | | | SPECIALTY FINANCE — 4.2% | | | | | | | | | | |
| | 1,559,000 | | | PHH Mortgage Corporation(b) | | | | 7.8750 | | 03/15/26 | | | 1,567,968 | |
| | 888,000 | | | Rithm Capital Corporation(b) | | | | 8.0000 | | 04/01/29 | | | 897,457 | |
| | | | | TOTAL CORPORATE BONDS (Cost $2,339,612) | | | | | | | | | 2,465,425 | |
See accompanying notes to financial statements.
| ALPHACENTRIC REAL INCOME FUND (SIIAX, SIICX, SIIIX) |
| SCHEDULE OF INVESTMENTS (Unaudited) (Continued) |
| September 30, 2024 |
| Principal | | | | | Coupon | | | | | |
| Amount ($) | | | | | Rate (%) | | Maturity | | Fair Value | |
| | | | | U.S. GOVERNMENT & AGENCIES — 2.1% | | | | | | | | |
| | | | | AGENCY FIXED RATE — 1.1% | | | | | | | | |
| | 766,228 | | | Fannie Mae Pool BQ4516 | | 2.0000 | | 02/01/51 | | $ | 638,774 | |
| | | | | | | | | | | | | |
| | | | | AGENCY MBS OTHER — 1.0% | | | | | | | | |
| | 339,447 | | | Ginnie Mae II Pool MA8867 | | 5.5000 | | 05/20/53 | | | 341,442 | |
| | 260,900 | | | Ginnie Mae II Pool MA9007 | | 6.5000 | | 07/20/53 | | | 265,407 | |
| | | | | | | | | | | | 606,849 | |
| | | | | | | | | | | | | |
| | | | | TOTAL U.S. GOVERNMENT & AGENCIES (Cost $1,246,738) | | | | | | | 1,245,623 | |
| | | | | | | | | | | | | |
| Shares | | | | | | | | | Fair Value | |
| | | | | SHORT-TERM INVESTMENT — 20.8% | | | | | | | | |
| | | | | MONEY MARKET FUND - 20.8% | | | | | | | | |
| | 12,325,783 | | | First American Treasury Obligations Fund, Class X, 4.81% (Cost $12,325,783)(f) | | | | | | | 12,325,783 | |
| | | | | | | | | | | | | |
| | | | | TOTAL INVESTMENTS - 99.3% (Cost $57,505,417) | | | | | | $ | 58,776,179 | |
| | | | | OTHER ASSETS IN EXCESS OF LIABILITIES - 0.7% | | | | | | | 405,013 | |
| | | | | NET ASSETS - 100.0% | | | | | | $ | 59,181,192 | |
| LTD | - Limited Company |
| | |
| REIT | - Real Estate Investment Trust |
| | |
| TSFR1M | - Term Secured Overnight Financing Rate (SOFR) 1 month |
| | |
| TSFR3M | - Term Secured Overnight Financing Rate (SOFR) 3 month |
| (a) | Non-income producing security. |
| (b) | Security exempt from registration under Rule 144A or Section 4(2) of the Securities Act of 1933. The security may be resold in transactions exempt from registration, normally to qualified institutional buyers. As of September 30, 2024 the total market value of 144A securities is $4,317,367 or 7.3% of net assets. |
| (c) | Floating rate security, the interest rate of which adjusts periodically based on changes in current interest rates and prepayments on the underlying pool of assets. |
| (d) | Variable rate security; the rate shown represents the rate on September 30, 2024. |
| (e) | Interest only securities. |
| (f) | Rate disclosed is the seven day effective yield as of September 30, 2024. |
| (G) | REIT – Real Estate Investment Trust. |
See accompanying notes to financial statements.
| AlphaCentric Funds |
| STATEMENTS OF ASSETS AND LIABILITIES (Unaudited) |
| September 30, 2024 |
| | | | | | | | | | | | AlphaCentric | |
| | | AlphaCentric Income | | | AlphaCentric Premium | | | AlphaCentric Robotics | | | Symmetry Strategy | |
| | | Opportunities Fund | | | Opportunity Fund | | | and Automation Fund | | | Fund (Consolidated) | |
| ASSETS | | | | | | | | | | | | | | | | |
| Investment securities: | | | | | | | | | | | | | | | | |
| Investments, at cost | | $ | 235,526,466 | | | $ | 32,532,800 | | | $ | 17,437,205 | | | $ | 34,814,660 | |
| Investments, at value (including collateral for loaned securities $0, $0, $3,240,513, $0) | | $ | 301,977,272 | | | $ | 33,875,202 | | | $ | 16,879,651 | | | $ | 37,465,413 | |
| Cash & Cash Equivalents | | | — | | | | 625 | | | | — | | | | — | |
| Deposit with brokers for futures and swaps | | | — | | | | 29,334,699 | | | | — | | | | 1,883,984 | |
| Foreign currency (Cost $0, $0, $0, $1,114) | | | — | | | | — | | | | — | | | | 1,072 | |
| Receivable for fund shares sold | | | 223,064 | | | | 29,746 | | | | 209 | | | | 3,700 | |
| Dividends and interest receivable | | | 459,440 | | | | 73,106 | | | | 47,445 | | | | 28,592 | |
| Upfront payment on swap | | | — | | | | — | | | | — | | | | 93,461 | |
| Unrealized appreciation on open futures contracts | | | — | | | | 1,136,136 | | | | — | | | | 1,855,959 | |
| Unrealized appreciation on swap contracts | | | — | | | | — | | | | — | | | | 8,932 | |
| Prepaid expenses and other assets | | | 31,478 | | | | 37,202 | | | | 13,341 | | | | 32,330 | |
| Due from insurance | | | 1,667,124 | | | | — | | | | — | | | | — | |
| TOTAL ASSETS | | | 304,358,378 | | | | 64,486,716 | | | | 16,940,646 | | | | 41,373,443 | |
| | | | | | | | | | | | | | | | | |
| LIABILITIES | | | | | | | | | | | | | | | | |
| Options Written (Proceeds $1,131,850) | | | — | | | | 1,974,929 | | | | — | | | | — | |
| Unrealized depreciation on swap contracts | | | — | | | | — | | | | — | | | | 50 | |
| Payable upon return of securities loaned | | | — | | | | — | | | | 3,240,513 | | | | — | |
| Unrealized depreciation on open futures contracts | | | — | | | | 14,452 | | | | — | | | | 437,321 | |
| Payable for fund shares repurchased | | | 271,838 | | | | 46,962 | | | | 9,286 | | | | — | |
| Management fees payable | | | 304,230 | | | | 72,283 | | | | 6,894 | | | | 31,961 | |
| Distribution (12b-1) fees payable | | | — | | | | — | | | | 1,136 | | | | — | |
| Payable to related parties | | | 15,021 | | | | 2,962 | | | | 122 | | | | 1,436 | |
| Administration fees payable | | | 28,705 | | | | 8,041 | | | | 4,828 | | | | 5,000 | |
| Accrued expenses and other liabilities | | | 150,152 | | | | 38,136 | | | | 31,273 | | | | 19,402 | |
| TOTAL LIABILITIES | | | 769,946 | | | | 2,157,765 | | | | 3,294,052 | | | | 495,170 | |
| NET ASSETS | | $ | 303,588,432 | | | $ | 62,328,951 | | | $ | 13,646,594 | | | $ | 40,878,273 | |
| | | | | | | | | | | | | | | | | |
| Composition of Net Assets: | | | | | | | | | | | | | | | | |
| Paid in capital | | $ | 578,102,594 | | | $ | 62,322,832 | | | $ | 15,962,012 | | | $ | 40,597,918 | |
| Accumulated earning (loss) | | | (274,514,162 | ) | | | 6,119 | | | | (2,315,418 | ) | | | 280,355 | |
| NET ASSETS | | $ | 303,588,432 | | | $ | 62,328,951 | | | $ | 13,646,594 | | | $ | 40,878,273 | |
| | | | | | | | | | | | | | | | | |
| Net Asset Value Per Share: | | | | | | | | | | | | | | | | |
| Class A Shares (IOFAX, HMXAX, GNXAX, SYMAX): | | | | | | | | | | | | | | | | |
| Net Assets | | $ | 30,912,017 | | | $ | 3,287,574 | | | $ | 1,726,254 | | | $ | 151,895 | |
| Shares of beneficial interest outstanding (a) | | | 4,020,732 | | | | 117,668 | | | | 146,636 | | | | 12,134 | |
| Net asset value (Net Assets ÷ Shares Outstanding) and redemption price per share | | $ | 7.69 | | | $ | 27.94 | (d) | | $ | 11.77 | (d) | | $ | 12.52 | |
| Maximum offering price per share | | $ | 8.07 | (c) | | $ | 29.64 | (b)(d) | | $ | 12.49 | (b)(d) | | $ | 13.28 | (b) |
| | | | | | | | | | | | | | | | | |
| Class C Shares (IOFCX, HMXCX, GNXCX, SYMCX): | | | | | | | | | | | | | | | | |
| Net Assets | | $ | 20,515,962 | | | $ | 1,325,349 | | | $ | 432,605 | | | $ | 586,717 | |
| Shares of beneficial interest outstanding (a) | | | 2,680,660 | | | | 50,145 | | | | 38,988 | | | | 48,019 | |
| Net asset value (Net Assets ÷ Shares Outstanding) offering price and redemption price per share | | $ | 7.65 | | | $ | 26.43 | (d) | | $ | 11.10 | | | $ | 12.22 | |
| | | | | | | | | | | | | | | | | |
| Class I Shares (IOFIX, HMXIX, GNXIX, SYMIX): | | | | | | | | | | | | | | | | |
| Net Assets | | $ | 252,160,453 | | | $ | 57,716,028 | | | $ | 11,487,735 | | | $ | 40,139,661 | |
| Shares of beneficial interest outstanding (a) | | | 32,755,164 | | | | 2,010,552 | | | | 955,845 | | | | 3,217,624 | |
| Net asset value (Net Assets ÷ Shares Outstanding) offering price and redemption price per share | | $ | 7.70 | | | $ | 28.71 | (d) | | $ | 12.02 | | | $ | 12.47 | |
| (a) | Unlimited number of shares of beneficial interest authorized, no par value. |
| (b) | Net asset value plus maximum sales charge of 5.75% |
| (c) | Net asset value plus maximum sales charge of 4.75% |
| (d) | The Net Asset Value (“NAV”) and offering price shown above differs from the traded NAV on September 30, 2024 due to financial statement rounding and/or financial statement adjustments. |
See accompanying notes to financial statements.
| AlphaCentric Funds |
| STATEMENTS OF ASSETS AND LIABILITIES (Unaudited)(Continued) |
| September 30, 2024 |
| | | AlphaCentric Life | | | | |
| | | Sciences and | | | AlphaCentric Real | |
| | | Healthcare Fund | | | Income Fund | |
| ASSETS | | | | | | | | |
| Investment securities: | | | | | | | | |
| Investments, at cost | | $ | 82,224,474 | | | $ | 57,505,417 | |
| Investments, at value | | $ | 81,876,843 | | | $ | 58,776,179 | |
| Foreign currency (Cost $35,207, $0) | | | 35,110 | | | | — | |
| Receivable for securities sold | | | 930,641 | | | | — | |
| Receivable for fund shares sold | | | 40,596 | | | | 38,948 | |
| Dividends and interest receivable | | | 88,903 | | | | 375,656 | |
| Prepaid expenses and other assets | | | 54,177 | | | | 43,155 | |
| TOTAL ASSETS | | | 83,026,270 | | | | 59,233,938 | |
| | | | | | | | | |
| LIABILITIES | | | | | | | | |
| Payable for fund shares repurchased | | | 40,199 | | | | 672 | |
| Management fees payable | | | 62,065 | | | | 40,461 | |
| Distribution (12b-1) fees payable | | | 638 | | | | 250 | |
| Payable to related parties | | | 3,312 | | | | 1,393 | |
| Administration fees payable | | | 5,229 | | | | 2,114 | |
| Accrued expenses and other liabilities | | | 2,000 | | | | 7,856 | |
| TOTAL LIABILITIES | | | 113,443 | | | | 52,746 | |
| NET ASSETS | | $ | 82,912,827 | | | $ | 59,181,192 | |
| | | | | | | | | |
| Composition of Net Assets: | | | | | | | | |
| Paid in capital | | $ | 86,930,685 | | | $ | 57,893,209 | |
| Accumulated earning (loss) | | | (4,017,858 | ) | | | 1,287,983 | |
| NET ASSETS | | $ | 82,912,827 | | | $ | 59,181,192 | |
| | | | | | | | | |
| Net Asset Value Per Share: | | | | | | | | |
| Class A Shares (LYFAX,SIIAX): | | | | | | | | |
| Net Assets | | $ | 6,950,178 | | | $ | 2,109,093 | |
| Shares of beneficial interest outstanding (a) | | | 506,828 | | | | 122,968 | |
| Net asset value (Net Assets ÷ Shares Outstanding) and redemption price per share | | $ | 13.71 | | | $ | 17.15 | |
| Maximum offering price per share | | $ | 14.55 | (b) | | $ | 18.01 | (c) |
| | | | | | | | | |
| Class C Shares (LYFCX,SIICX): | | | | | | | | |
| Net Assets | | $ | 2,249,885 | | | $ | 2,501,094 | |
| Shares of beneficial interest outstanding (a) | | | 168,184 | | | | 146,186 | |
| Net asset value (Net Assets ÷ Shares Outstanding) offering price and redemption price per share | | $ | 13.38 | | | $ | 17.11 | |
| | | | | | | | | |
| Class I Shares (LYFIX,SIIIX): | | | | | | | | |
| Net Assets | | $ | 73,712,764 | | | $ | 54,571,005 | |
| Shares of beneficial interest outstanding (a) | | | 5,326,248 | | | | 3,174,195 | |
| Net asset value (Net Assets ÷ Shares Outstanding) offering price and redemption price per share | | $ | 13.84 | | | $ | 17.19 | |
| (a) | Unlimited number of shares of beneficial interest authorized, no par value. |
| (b) | Net asset value plus maximum sales charge of 5.75% |
| (c) | Net asset value plus maximum sales charge of 4.75% |
See accompanying notes to financial statements.
| AlphaCentric Funds |
| STATEMENTS OF OPERATIONS (Unaudited) |
| For the Six Months Ended September 30, 2024 |
| | | | | | AlphaCentric | | | | | | AlphaCentric | |
| | | | | | Premium | | | AlphaCentric | | | Symmetry Strategy | |
| | | AlphaCentric Income | | | Opportunity | | | Robotics and | | | Fund | |
| | | Opportunities Fund | | | Fund | | | Automation Fund | | | (Consolidated) | |
| INVESTMENT INCOME | | | | | | | | | | | | | | | | |
| Dividends (ARAF and ASSF: Net of tax witholding of $11,655 and $215, respectively) | | $ | — | | | $ | — | | | $ | 69,542 | | | $ | 348,165 | |
| Interest | | | 14,491,553 | | | | 1,273,237 | | | | 1 2,541 | | | | 300,286 | |
| Securities lending income | | | — | | | | — | | | | 62,827 | | | | — | |
| TOTAL INVESTMENT INCOME | | | 14,491,553 | | | | 1,273,237 | | | | 144,910 | | | | 648,451 | |
| | | | | | | | | | | | | | | | | |
| EXPENSES | | | | | | | | | | | | | | | | |
| Investment advisory fees | | | 1,989,142 | | | | 593,527 | | | | 105,005 | | | | 267,407 | |
| Distribution (12b-1) fees: | | | | | | | | | | | | | | | | |
| Class A | | | 39,061 | | | | 4,570 | | | | 2,564 | | | | 195 | |
| Class C | | | 109,209 | | | | 7,324 | | | | 2,408 | | | | 3,226 | |
| Legal fees | | | 474,937 | * | | | 9,081 | | | | 8,976 | | | | 12,475 | |
| Shareholder servicing fees | | | 122,409 | | | | 36,645 | | | | 16,301 | | | | 7,828 | |
| Financial administration/fund accounting fees | | | 116,802 | | | | 50,213 | | | | 22,084 | | | | 38,061 | |
| Line of credit fees | | | 104,575 | | | | — | | | | 8,985 | | | | — | |
| Legal administration/management services fees | | | 76,412 | | | | 16,856 | | | | 5,040 | | | | 9,904 | |
| Registration fees | | | 43,381 | | | | 25,058 | | | | 23,061 | | | | 20,047 | |
| Printing and postage expenses | | | 33,698 | | | | 3,411 | | | | 3,392 | | | | 2,629 | |
| Audit fees | | | 19,791 | | | | 7,976 | | | | 8,769 | | | | 9,726 | |
| Compliance officer fees | | | 10,224 | | | | 4,595 | | | | 6,441 | | | | 6,640 | |
| Custodian fees | | | 7,768 | | | | 2,470 | | | | 13,917 | | | | 7,145 | |
| Insurance expense | | | 5,984 | | | | 1,155 | | | | 427 | | | | 604 | |
| Trustees fees and expenses | | | 5,607 | | | | 5,554 | | | | 4,967 | | | | 3,920 | |
| Interest expense | | | — | | | | 898 | | | | — | | | | — | |
| Other expenses | | | 1,496 | | | | 1,365 | | | | 1,496 | | | | 1,496 | |
| TOTAL EXPENSES | | | 3,160,496 | | | | 770,698 | | | | 233,833 | | | | 391,303 | |
| Less: Fees waived by the Adviser | | | (165,453 | ) | | | (83,667 | ) | | | (95,344 | ) | | | (70,942 | ) |
| NET EXPENSES | | | 2,995,043 | | | | 687,031 | | | | 138,489 | | | | 320,361 | |
| | | | | | | | | | | | | | | | | |
| NET INVESTMENT INCOME | | | 11,496,510 | | | | 586,206 | | | | 6,421 | | | | 328,090 | |
| | | | | | | | | | | | | | | | | |
| REALIZED AND UNREALIZED GAIN (LOSS) FROM INVESTMENTS | | | | | | | | | | | | | | | | |
| Net realized gain (loss) from: | | | | | | | | | | | | | | | | |
| Investments | | | 2,021,132 | | | | (959,982 | ) | | | 4,096,155 | | | | 671,239 | |
| Foreign Currencies Translation | | | — | | | | — | | | | 10,462 | | | | 17,018 | |
| Futures Contracts | | | — | | | | 92,468 | | | | — | | | | (978,320 | ) |
| Options Written | | | — | | | | 798,660 | | | | — | | | | — | |
| Swap Contracts | | | — | | | | — | | | | — | | | | 34,508 | |
| | | | 2,021,132 | | | | (68,854 | ) | | | 4,106,617 | | | | (255,555 | ) |
| Net change in unrealized appreciation (depreciation) on: | | | | | | | | | | | | | | | | |
| Investments | | | (2,159,258 | ) | | | 1,345,039 | | | | (5,460,057 | ) | | | 196,574 | |
| Foreign Currencies Translation | | | — | | | | — | | | | 263 | | | | 5,879 | |
| Futures Contracts | | | — | | | | 551,470 | | | | — | | | | 825,697 | |
| Options Written | | | — | | | | (881,429 | ) | | | — | | | | — | |
| Swap Contracts | | | — | | | | — | | | | — | | | | 8,553 | |
| | | | (2,159,258 | ) | | | 1,015,080 | | | | (5,459,794 | ) | | | 1,036,703 | |
| | | | | | | | | | | | | | | | | |
| NET REALIZED AND UNREALIZED GAIN (LOSS) FROM INVESTMENTS | | | (138,126 | ) | | | 946,226 | | | | (1,353,177 | ) | | | 781,148 | |
| | | | | | | | | | | | | | | | | |
| NET INCREASE (DECREASE) IN NET ASSETS RESULTING FROM OPERATIONS | | $ | 11,358,384 | | | $ | 1,532,432 | | | $ | (1,346,756 | ) | | $ | 1,109,238 | |
| * | Includes legal fees that are extraordinary expenses that are outside the expense limitation. |
See accompanying notes to financial statements.
| AlphaCentric Funds |
| STATEMENTS OF OPERATIONS (Unaudited)(Continued) |
| For the Six Months Ended September 30, 2024 |
| | | AlphaCentric Life | | | | |
| | | Sciences and | | | AlphaCentric Real | |
| | | Healthcare Fund | | | Income Fund | |
| INVESTMENT INCOME | | | | | | | | |
| Dividends (ALHF : Net of tax witholding of $11,718) | | $ | 242,872 | | | $ | 1,214,576 | |
| Interest | | | 173,147 | | | | 826,473 | |
| TOTAL INVESTMENT INCOME | | | 416,019 | | | | 2,041,049 | |
| | | | | | | | | |
| EXPENSES | | | | | | | | |
| Investment advisory fees | | | 544,875 | | | | 423,289 | |
| Distribution (12b-1) fees: | | | | | | | | |
| Class A | | | 7,757 | | | | 2,054 | |
| Class C | | | 10,555 | | | | 11,192 | |
| Shareholder servicing fees | | | 51,130 | | | | 24,955 | |
| Financial administration/fund accounting fees | | | 56,216 | | | | 48,128 | |
| Registration fees | | | 32,534 | | | | 30,531 | |
| Legal administration/management services fees | | | 26,154 | | | | 14,094 | |
| Legal fees | | | 14,078 | | | | 13,100 | |
| Printing and postage expenses | | | 8,063 | | | | 12,654 | |
| Audit fees | | | 7,796 | | | | 8,243 | |
| Compliance officer fees | | | 7,386 | | | | 6,771 | |
| Trustees fees and expenses | | | 5,917 | | | | 5,907 | |
| Custodian fees | | | 5,047 | | | | 1,925 | |
| Insurance expense | | | 1,602 | | | | 902 | |
| Other expenses | | | 1,496 | | | | 1,376 | |
| TOTAL EXPENSES | | | 780,606 | | | | 605,121 | |
| Less: Fees waived by the Adviser | | | (152,825 | ) | | | (171,417 | ) |
| NET EXPENSES | | | 627,781 | | | | 433,704 | |
| | | | | | | | | |
| NET INVESTMENT INCOME (LOSS) | | | (211,762 | ) | | | 1,607,345 | |
| | | | | | | | | |
| REALIZED AND UNREALIZED GAIN (LOSS) FROM INVESTMENTS | | | | | | | | |
| Net realized gain (loss) from: | | | | | | | | |
| Investments | | | (1,353,603 | ) | | | 275,567 | |
| | | | (1,353,603 | ) | | | 275,567 | |
| Net change in unrealized appreciation on: | | | | | | | | |
| Investments | | | 6,994,742 | | | | 2,489,227 | |
| Foreign Currency Translation | | | 239 | | | | — | |
| | | | 6,994,981 | | | | 2,489,227 | |
| | | | | | | | | |
| NET REALIZED AND UNREALIZED GAIN FROM INVESTMENTS | | | 5,641,378 | | | | 2,764,794 | |
| | | | | | | | | |
| NET INCREASE IN NET ASSETS RESULTING FROM OPERATIONS | | $ | 5,429,616 | | | $ | 4,372,139 | |
See accompanying notes to financial statements.
| AlphaCentric Income Opportunities Fund |
| STATEMENTS OF CHANGES IN NET ASSETS |
| | | Six Months Ended | | | | |
| | | September 30, 2024 | | | Year Ended | |
| | | (Unaudited) | | | March 31, 2024 | |
| FROM OPERATIONS | | | | | | | | |
| Net investment income | | $ | 11,496,510 | | | $ | 16,519,126 | |
| Net realized gain from investments | | | 2,021,132 | | | | 27,915,351 | |
| Net change in unrealized depreciation on investments | | | (2,159,258 | ) | | | (62,412,233 | ) |
| Net increase (decrease) in net assets resulting from operations | | | 11,358,384 | | | | (17,977,756 | ) |
| | | | | | | | | |
| DISTRIBUTIONS TO SHAREHOLDERS | | | | | | | | |
| From return of capital: | | | | | | | | |
| Class A (IOFAX) | | | — | | | | (1,622,530 | ) |
| Class C (IOFCX) | | | — | | | | (1,241,809 | ) |
| Class I (IOFIX) | | | — | | | | (15,731,709 | ) |
| From distributable earnings: | | | | | | | | |
| Class A (IOFAX) | | | (1,183,423 | ) | | | (1,165,894 | ) |
| Class C (IOFCX) | | | (744,508 | ) | | | (850,032 | ) |
| Class I (IOFIX) | | | (9,828,745 | ) | | | (11,348,898 | ) |
| Total distributions to shareholders | | | (11,756,676 | ) | | | (31,960,872 | ) |
| | | | | | | | | |
| FROM SHARES OF BENEFICIAL INTEREST | | | | | | | | |
| Proceeds from shares sold: | | | | | | | | |
| Class A (IOFAX) | | | 3,159,838 | | | | 10,527,300 | |
| Class C (IOFCX) | | | (188,028 | ) | | | 408,041 | |
| Class I (IOFIX) | | | 27,519,562 | | | | 95,824,674 | |
| Net asset value of shares issued in reinvestment of distributions: | | | | | | | | |
| Class A (IOFAX) | | | 1,071,732 | | | | 2,540,582 | |
| Class C (IOFCX) | | | 698,690 | | | | 1,945,455 | |
| Class I (IOFIX) | | | 8,380,751 | | | | 22,747,343 | |
| Payments for shares repurchased: | | | | | | | | |
| Class A (IOFAX) | | | (7,453,128 | ) | | | (18,823,941 | ) |
| Class C (IOFCX) | | | (4,269,544 | ) | | | (20,283,519 | ) |
| Class I (IOFIX) | | | (67,949,162 | ) | | | (321,353,075 | ) |
| Net decrease in net assets from shares of beneficial interest | | | (39,029,289 | ) | | | (226,467,140 | ) |
| | | | | | | | | |
| TOTAL DECREASE IN NET ASSETS | | | (39,427,581 | ) | | | (276,405,768 | ) |
| | | | | | | | | |
| NET ASSETS | | | | | | | | |
| Beginning of Period | | | 343,016,013 | | | | 619,421,781 | |
| End of Period | | $ | 303,588,432 | | | $ | 343,016,013 | |
| | | | | | | | | |
| SHARE ACTIVITY | | | | | | | | |
| Class A (IOFAX): | | | | | | | | |
| Shares Sold | | | 475,681 | | | | 1,286,639 | |
| Shares Reinvested | | | 141,339 | | | | 312,476 | |
| Shares Repurchased | | | (982,555 | ) | | | (2,345,044 | ) |
| Net decrease in shares of beneficial interest outstanding | | | (365,535 | ) | | | (745,929 | ) |
| | | | | | | | | |
| Class C (IOFCX): | | | | | | | | |
| Shares Sold | | | 17,980 | | | | 48,477 | |
| Shares Reinvested | | | 92,585 | | | | 239,237 | |
| Shares Repurchased | | | (564,853 | ) | | | (2,482,686 | ) |
| Net decrease in shares of beneficial interest outstanding | | | (454,288 | ) | | | (2,194,972 | ) |
| | | | | | | | | |
| Class I (IOFIX): | | | | | | | | |
| Shares Sold | | | 4,089,998 | | | | 11,875,945 | |
| Shares Reinvested | | | 1,103,778 | | | | 2,786,459 | |
| Shares Repurchased | | | (8,893,466 | ) | | | (39,042,425 | ) |
| Net decrease in shares of beneficial interest outstanding | | | (3,699,690 | ) | | | (24,380,021 | ) |
See accompanying notes to financial statements.
| AlphaCentric Premium Opportunity Fund |
| STATEMENTS OF CHANGES IN NET ASSETS |
| | | Six Months Ended | | | | |
| | | September 30, 2024 | | | Year Ended | |
| | | (Unaudited) | | | March 31, 2024 | |
| FROM OPERATIONS | | | | | | | | |
| Net investment income | | $ | 586,206 | | | $ | 1,377,773 | |
| Net realized gain (loss) from investments, future contracts and options written | | | (68,854 | ) | | | 10,943,885 | |
| Net change in unrealized appreciation (depreciation) on investments, future contracts and options written | | | 1,015,080 | | | | (1,714,168 | ) |
| Net increase in net assets resulting from operations | | | 1,532,432 | | | | 10,607,490 | |
| | | | | | | | | |
| FROM SHARES OF BENEFICIAL INTEREST | | | | | | | | |
| Proceeds from shares sold: | | | | | | | | |
| Class A (HMXAX) | | | 183,021 | | | | 842,644 | |
| Class C (HMXCX) | | | 37,900 | | | | 291,648 | |
| Class I (HMXIX) | | | 4,184,117 | | | | 16,514,676 | |
| Payments for shares repurchased: | | | | | | | | |
| Class A (HMXAX) | | | (1,279,387 | ) | | | (4,816,502 | ) |
| Class C (HMXCX) | | | (387,551 | ) | | | (650,689 | ) |
| Class I (HMXIX) | | | (16,109,153 | ) | | | (37,834,728 | ) |
| Net decrease in net assets from shares of beneficial interest | | | (13,371,053 | ) | | | (25,652,951 | ) |
| | | | | | | | | |
| TOTAL DECREASE IN NET ASSETS | | | (11,838,621 | ) | | | (15,045,461 | ) |
| | | | | | | | | |
| NET ASSETS | | | | | | | | |
| Beginning of Period | | | 74,167,572 | | | | 89,213,033 | |
| End of Period | | $ | 62,328,951 | | | $ | 74,167,572 | |
| | | | | | | | | |
| SHARE ACTIVITY | | | | | | | | |
| Class A (HMXAX): | | | | | | | | |
| Shares Sold | | | 6,723 | | | | 33,881 | |
| Shares Repurchased | | | (46,922 | ) | | | (186,557 | ) |
| Net decrease in shares of beneficial interest outstanding | | | (40,199 | ) | | | (152,676 | ) |
| | | | | | | | | |
| Class C (HMXCX): | | | | | | | | |
| Shares Sold | | | 1,467 | | | | 12,402 | |
| Shares Repurchased | | | (14,766 | ) | | | (26,613 | ) |
| Net decrease in shares of beneficial interest outstanding | | | (13,299 | ) | | | (14,211 | ) |
| | | | | | | | | |
| Class I (HMXIX): | | | | | | | | |
| Shares Sold | | | 148,455 | | | | 637,575 | |
| Shares Repurchased | | | (570,163 | ) | | | (1,461,551 | ) |
| Net decrease in shares of beneficial interest outstanding | | | (421,708 | ) | | | (823,976 | ) |
See accompanying notes to financial statements.
| AlphaCentric Robotics and Automation Fund |
| STATEMENTS OF CHANGES IN NET ASSETS |
| | | Six Months Ended | | | | |
| | | September 30, 2024 | | | Year Ended | |
| | | (Unaudited) | | | March 31, 2024 | |
| FROM OPERATIONS | | | | | | | | |
| Net investment income (loss) | | $ | 6,421 | | | $ | (32,822 | ) |
| Net realized gain (loss) from investments and foreign currencies translation | | | 4,106,617 | | | | (3,256,010 | ) |
| Net change in unrealized appreciation (depreciation) on investments and foreign currencies translation | | | (5,459,794 | ) | | | 4,599,300 | |
| Net increase (decrease) in net assets resulting from operations | | | (1,346,756 | ) | | | 1,310,468 | |
| | | | | | | | | |
| FROM SHARES OF BENEFICIAL INTEREST | | | | | | | | |
| Proceeds from shares sold: | | | | | | | | |
| Class A (GNXAX) | | | 35,622 | | | | 255,659 | |
| Class C (GNXCX) | | | 447 | | | | 25,326 | |
| Class I (GNXIX) | | | 3,267,191 | | | | 7,598,050 | |
| Payments for shares repurchased: | | | | | | | | |
| Class A (GNXAX) | | | (1,182,673 | ) | | | (1,145,814 | ) |
| Class C (GNXCX) | | | (76,466 | ) | | | (185,585 | ) |
| Class I (GNXIX) | | | (13,667,294 | ) | | | (12,954,575 | ) |
| Net decrease in net assets from shares of beneficial interest | | | (11,623,173 | ) | | | (6,406,939 | ) |
| | | | | | | | | |
| TOTAL DECREASE IN NET ASSETS | | | (12,969,929 | ) | | | (5,096,471 | ) |
| | | | | | | | | |
| NET ASSETS | | | | | | | | |
| Beginning of Period | | | 26,616,523 | | | | 31,712,994 | |
| End of Period | | $ | 13,646,594 | | | $ | 26,616,523 | |
| | | | | | | | | |
| SHARE ACTIVITY | | | | | | | | |
| Class A (GNXAX): | | | | | | | | |
| Shares Sold | | | 3,019 | | | | 22,385 | |
| Shares Repurchased | | | (100,059 | ) | | | (99,783 | ) |
| Net decrease in shares of beneficial interest outstanding | | | (97,040 | ) | | | (77,398 | ) |
| | | | | | | | | |
| Class C (GNXCX): | | | | | | | | |
| Shares Sold | | | 40 | | | | 2,463 | |
| Shares Repurchased | | | (7,244 | ) | | | (17,295 | ) |
| Net decrease in shares of beneficial interest outstanding | | | (7,204 | ) | | | (14,832 | ) |
| | | | | | | | | |
| Class I (GNXIX): | | | | | | | | |
| Shares Sold | | | 270,525 | | | | 656,068 | |
| Shares Repurchased | | | (1,161,973 | ) | | | (1,121,664 | ) |
| Net decrease in shares of beneficial interest outstanding | | | (891,448 | ) | | | (465,596 | ) |
See accompanying notes to financial statements.
| AlphaCentric Symmetry Strategy Fund |
| CONSOLIDATED STATEMENTS OF CHANGES IN NET ASSETS |
| | | Six Months Ended | | | | |
| | | September 30, 2024 | | | Year Ended | |
| | | (Unaudited) | | | March 31, 2024 | |
| FROM OPERATIONS | | | | | | | | |
| Net investment income | | $ | 328,090 | | | $ | 848,558 | |
| Net realized gain (loss) from investments, foreign currencies translation, futures contracts and swap contracts | | | (255,555 | ) | | | 452,596 | |
| Distributions of capital gains from underlying investment companies | | | — | | | | 9,036 | |
| Net change in unrealized appreciation on investments, foreign currencies translation, futures contracts and swap contracts | | | 1,036,703 | | | | 2,591,539 | |
| Net increase in net assets resulting from operations | | | 1,109,238 | | | | 3,901,729 | |
| | | | | | | | | |
| DISTRIBUTIONS TO SHAREHOLDERS | | | | | | | | |
| From distributable earnings: | | | | | | | | |
| Class A (SYMAX) | | | — | | | | (2,237 | ) |
| Class C (SYMCX) | | | — | | | | (7,088 | ) |
| Class I (SYMIX) | | | — | | | | (782,964 | ) |
| Total distributions to shareholders | | | — | | | | (792,289 | ) |
| | | | | | | | | |
| FROM SHARES OF BENEFICIAL INTEREST | | | | | | | | |
| Proceeds from shares sold: | | | | | | | | |
| Class A (SYMAX) | | | 5,026 | | | | 15,582 | |
| Class C (SYMCX) | | | — | | | | 9,460 | |
| Class I (SYMIX) | | | 93,353 | | | | 2,331,934 | |
| Net asset value of shares issued in reinvestment of distributions: | | | | | | | | |
| Class A (SYMAX) | | | — | | | | 2,237 | |
| Class C (SYMCX) | | | — | | | | 6,778 | |
| Class I (SYMIX) | | | — | | | | 721,381 | |
| Payments for shares repurchased: | | | | | | | | |
| Class A (SYMAX) | | | (44,761 | ) | | | (718,592 | ) |
| Class C (SYMCX) | | | (161,436 | ) | | | (291,177 | ) |
| Class I (SYMIX) | | | (835,229 | ) | | | (15,248,186 | ) |
| Net decrease in net assets from shares of beneficial interest | | | (943,047 | ) | | | (13,170,583 | ) |
| | | | | | | | | |
| TOTAL INCREASE (DECREASE) IN NET ASSETS | | | 166,191 | | | | (10,061,143 | ) |
| | | | | | | | | |
| NET ASSETS | | | | | | | | |
| Beginning of Period | | | 40,712,082 | | | | 50,773,225 | |
| End of Period | | $ | 40,878,273 | | | $ | 40,712,082 | |
| | | | | | | | | |
| SHARE ACTIVITY | | | | | | | | |
| Class A (SYMAX): | | | | | | | | |
| Shares Sold | | | 431 | | | | 1,304 | |
| Shares Reinvested | | | — | | | | 196 | |
| Shares Repurchased | | | (3,782 | ) | | | (61,941 | ) |
| Net decrease in shares of beneficial interest outstanding | | | (3,351 | ) | | | (60,441 | ) |
| | | | | | | | | |
| Class C (SYMCX): | | | | | | | | |
| Shares Sold | | | — | | | | 826 | |
| Shares Reinvested | | | — | | | | 604 | |
| Shares Repurchased | | | (13,858 | ) | | | (25,397 | ) |
| Net decrease in shares of beneficial interest outstanding | | | (13,858 | ) | | | (23,967 | ) |
| | | | | | | | | |
| Class I (SYMIX): | | | | | | | | |
| Shares Sold | | | 7,846 | | | | 200,997 | |
| Shares Reinvested | | | — | | | | 63,502 | |
| Shares Repurchased | | | (70,663 | ) | | | (1,315,186 | ) |
| Net decrease in shares of beneficial interest outstanding | | | (62,817 | ) | | | (1,050,687 | ) |
See accompanying notes to financial statements.
| AlphaCentric Life Sciences and Healthcare Fund |
| STATEMENTS OF CHANGES IN NET ASSETS |
| | | Six Months Ended | | | | |
| | | September 30, 2024 | | | Year Ended | |
| | | (Unaudited) | | | March 31, 2024 | |
| FROM OPERATIONS | | | | | | | | |
| Net investment loss | | $ | (211,762 | ) | | $ | (425,154 | ) |
| Net realized gain (loss) from investments | | | (1,353,603 | ) | | | 2,990,059 | |
| Net change in unrealized appreciation (depreciation) on investments and foreign currency translation | | | 6,994,981 | | | | (4,727,571 | ) |
| Net increase (decrease) in net assets resulting from operations | | | 5,429,616 | | | | (2,162,666 | ) |
| | | | | | | | | |
| DISTRIBUTIONS TO SHAREHOLDERS | | | | | | | | |
| From distributable earnings: | | | | | | | | |
| Class A (LYFAX) | | | — | | | | (176,739 | ) |
| Class C (LYFCX) | | | — | | | | (48,424 | ) |
| Class I (LYFIX) | | | — | | | | (2,467,967 | ) |
| Total distributions to shareholders | | | — | | | | (2,693,130 | ) |
| | | | | | | | | |
| FROM SHARES OF BENEFICIAL INTEREST | | | | | | | | |
| Proceeds from shares sold: | | | | | | | | |
| Class A (LYFAX) | | | 1,143,050 | | | | 5,892,313 | |
| Class C (LYFCX) | | | 179,893 | | | | 1,589,653 | |
| Class I (LYFIX) | | | 6,316,602 | | | | 64,946,055 | |
| Net asset value of shares issued in reinvestment of distributions: | | | | | | | | |
| Class A (LYFAX) | | | — | | | | 172,476 | |
| Class C (LYFCX) | | | — | | | | 47,614 | |
| Class I (LYFIX) | | | — | | | | 2,069,949 | |
| Payments for shares repurchased: | | | | | | | | |
| Class A (LYFAX) | | | (1,235,007 | ) | | | (2,805,913 | ) |
| Class C (LYFCX) | | | (235,965 | ) | | | (158,332 | ) |
| Class I (LYFIX) | | | (31,822,501 | ) | | | (43,276,729 | ) |
| Net increase (decrease) in net assets from shares of beneficial interest | | | (25,653,928 | ) | | | 28,477,086 | |
| | | | | | | | | |
| TOTAL INCREASE (DECREASE) IN NET ASSETS | | | (20,224,312 | ) | | | 23,621,290 | |
| | | | | | | | | |
| NET ASSETS | | | | | | | | |
| Beginning of Period | | | 103,137,139 | | | | 79,515,849 | |
| End of Period | | $ | 82,912,827 | | | $ | 103,137,139 | |
| | | | | | | | | |
| SHARE ACTIVITY | | | | | | | | |
| Class A (LYFAX): | | | | | | | | |
| Shares Sold | | | 88,714 | | | | 439,166 | |
| Shares Reinvested | | | — | | | | 13,754 | |
| Shares Repurchased | | | (101,985 | ) | | | (220,086 | ) |
| Net increase (decrease) in shares of beneficial interest outstanding | | | (13,271 | ) | | | 232,834 | |
| | | | | | | | | |
| Class C (LYFCX): | | | | | | | | |
| Shares Sold | | | 14,684 | | | | 127,015 | |
| Shares Reinvested | | | — | | | | 3,868 | |
| Shares Repurchased | | | (19,546 | ) | | | (12,382 | ) |
| Net increase (decrease) in shares of beneficial interest outstanding | | | (4,862 | ) | | | 118,501 | |
| | | | | | | | | |
| Class I (LYFIX): | | | | | | | | |
| Shares Sold | | | 492,599 | | | | 4,881,707 | |
| Shares Reinvested | | | — | | | | 163,891 | |
| Shares Repurchased | | | (2,518,719 | ) | | | (3,356,199 | ) |
| Net increase (decrease) in shares of beneficial interest outstanding | | | (2,026,120 | ) | | | 1,689,399 | |
See accompanying notes to financial statements.
| AlphaCentric Real Income Fund |
| STATEMENTS OF CHANGES IN NET ASSETS |
| | | Six Months Ended | | | | |
| | | September 30, 2024 | | | Year Ended | |
| | | (Unaudited) | | | March 31, 2024 | |
| FROM OPERATIONS | | | | | | | | |
| Net investment income | | $ | 1,607,345 | | | $ | 2,941,790 | |
| Net realized gain from investments | | | 275,567 | | | | 835,826 | |
| Net change in unrealized appreciation on investments | | | 2,489,227 | | | | 5,066,385 | |
| Net increase in net assets resulting from operations | | | 4,372,139 | | | | 8,844,001 | |
| | | | | | | | | |
| DISTRIBUTIONS TO SHAREHOLDERS | | | | | | | | |
| From distributable earnings: | | | | | | | | |
| Class A (SIIAX) | | | (53,407 | ) | | | (59,336 | ) |
| Class C (SIICX) | | | (63,851 | ) | | | (87,689 | ) |
| Class I (SIIIX) | | | (1,722,528 | ) | | | (3,656,492 | ) |
| Total distributions to shareholders | | | (1,839,786 | ) | | | (3,803,517 | ) |
| | | | | | | | | |
| FROM SHARES OF BENEFICIAL INTEREST | | | | | | | | |
| Proceeds from shares sold: | | | | | | | | |
| Class A (SIIAX) | | | 737,871 | | | | 795,213 | |
| Class C (SIICX) | | | 692,543 | | | | 889,609 | |
| Class I (SIIIX) | | | 14,133,934 | | | | 28,850,469 | |
| Net asset value of shares issued in reinvestment of distributions: | | | | | | | | |
| Class A (SIIAX) | | | 44,406 | | | | 56,834 | |
| Class C (SIICX) | | | 57,682 | | | | 81,045 | |
| Class I (SIIIX) | | | 1,236,313 | | | | 2,627,713 | |
| Payments for shares repurchased: | | | | | | | | |
| Class A (SIIAX) | | | (23,305 | ) | | | (137,785 | ) |
| Class C (SIICX) | | | (215,077 | ) | | | (245,794 | ) |
| Class I (SIIIX) | | | (16,830,646 | ) | | | (29,103,103 | ) |
| Net increase (decrease) in net assets from shares of beneficial interest | | | (166,279 | ) | | | 3,814,201 | |
| | | | | | | | | |
| TOTAL INCREASE IN NET ASSETS | | | 2,366,074 | | | | 8,854,685 | |
| | | | | | | | | |
| NET ASSETS | | | | | | | | |
| Beginning of Period | | | 56,815,118 | | | | 47,960,433 | |
| End of Period | | $ | 59,181,192 | | | $ | 56,815,118 | |
| | | | | | | | | |
| SHARE ACTIVITY | | | | | | | | |
| Class A (SIIAX): | | | | | | | | |
| Shares Sold | | | 44,937 | | | | 50,383 | |
| Shares Reinvested | | | 2,683 | | | | 3,600 | |
| Shares Repurchased | | | (1,433 | ) | | | (8,615 | ) |
| Net increase in shares of beneficial interest outstanding | | | 46,187 | | | | 45,368 | |
| | | | | | | | | |
| Class C (SIICX): | | | | | | | | |
| Shares Sold | | | 42,500 | | | | 57,657 | |
| Shares Reinvested | | | 3,494 | | | | 5,149 | |
| Shares Repurchased | | | (12,998 | ) | | | (15,877 | ) |
| Net increase in shares of beneficial interest outstanding | | | 32,996 | | | | 46,929 | |
| | | | | | | | | |
| Class I (SIIIX): | | | | | | | | |
| Shares Sold | | | 859,825 | | | | 1,825,740 | |
| Shares Reinvested | | | 74,814 | | | | 166,606 | |
| Shares Repurchased | | | (1,032,687 | ) | | | (1,844,799 | ) |
| Net increase (decrease) in shares of beneficial interest outstanding | | | (98,048 | ) | | | 147,547 | |
See accompanying notes to financial statements.
| AlphaCentric Income Opportunities Fund |
| FINANCIAL HIGHLIGHTS |
Per Share Data and Ratios for a Share of Beneficial Interest Outstanding Throughout Each Period Presented
| | | Six Months Ended | | | Year Ended | | | Year Ended | | | Year Ended | | | Year Ended | | | Year Ended | |
| | | September 30, 2024 | | | March 31, | | | March 31, | | | March 31, | | | March 31, | | | March 31, | |
| Class A (IOFAX) | | (Unaudited) | | | 2024 | | | 2023 | | | 2022 | | | 2021 | | | 2020 | |
| Net asset value, beginning of period | | $ | 7.79 | | | $ | 8.68 | | | $ | 11.48 | | | $ | 11.50 | | | $ | 8.15 | | | $ | 12.28 | |
| Activity from investment operations: | | | | | | | | | | | | | | | | | | | | | | | | |
| Net investment income (1) | | | 0.28 | | | | 0.28 | | | | 0.22 | | | | 0.13 | | | | 0.19 | | | | 0.46 | |
| Net realized and unrealised gain (loss) on investments | | | (0.09 | ) | | | (0.60 | ) | | | (2.52 | ) | | | 0.30 | | | | 3.62 | | | | (4.02 | ) |
| Total from investment operations | | | 0.19 | | | | (0.32 | ) | | | (2.30 | ) | | | 0.43 | | | | 3.81 | | | | (3.56 | ) |
| Less distributions from: | | | | | | | | | | | | | | | | | | | | | | | | |
| Net investment income | | | (0.29 | ) | | | (0.25 | ) | | | (0.19 | ) | | | (0.26 | ) | | | (0.21 | ) | | | (0.48 | ) |
| Return of capital | | | — | | | | (0.32 | ) | | | (0.31 | ) | | | (0.19 | ) | | | (0.25 | ) | | | (0.09 | ) |
| Total distributions | | | (0.29 | ) | | | (0.57 | ) | | | (0.50 | ) | | | (0.45 | ) | | | (0.46 | ) | | | (0.57 | ) |
| Net asset value, end of period | | $ | 7.69 | | | $ | 7.79 | | | $ | 8.68 | | | $ | 11.48 | | | $ | 11.50 | | | $ | 8.15 | |
| Total return (2)(13) | | | 2.56 | % (11) | | | (3.63 | )% (11) | | | (20.20 | )% | | | 3.68 | % | | | 47.64 | % | | | (30.45 | )% |
| Net assets, at end of period (000s) | | $ | 30,912 | | | $ | 34,190 | | | $ | 44,561 | | | $ | 146,192 | | | $ | 221,961 | | | $ | 152,646 | |
| Ratio of gross expenses to average net assets before expense reimbursement (3)(12) | | | 2.22 | % (10) | | | 2.31 | % (9) | | | 2.18 | % (8) | | | 1.95 | % (7) | | | 1.97 | % (6) | | | 1.93 | % (5) |
| Ratio of net expenses to average net assets after expense reimbursement (12) | | | 2.11 | % (10) | | | 1.99 | % (9) | | | 1.90 | % (8) | | | 1.76 | % (7) | | | 1.75 | % (6) | | | 1.75 | % (5) |
| Ratio of net investment income to average net assets (4)(12) | | | 7.37 | % (10) | | | 3.46 | % (9) | | | 2.32 | % (8) | | | 1.09 | % (7) | | | 1.83 | % (6) | | | 3.67 | % (5) |
| Portfolio Turnover Rate (13) | | | 4 | % | | | 15 | % | | | 0 | % | | | 14 | % | | | 3 | % | | | 54 | % |
| (1) | Per share amounts calculated using the average shares method. |
| (2) | Total return in the above table is historical in nature and represents the rate that the investor would have earned or lost on an investment in the Fund assuming reinvestment of dividends and capital gain distributions, if any, and does not reflect the impact of sales charges. Had the adviser not waived a portion of the Fund’s expenses, total returns would have been lower. |
| (3) | Represents the ratio of expenses to average net assets absent fee waivers and/or expense reimbursements by the adviser. |
| (4) | Recognition of net investment income (loss) is affected by the timing and declaration of dividends by the underlying investment companies in which the Fund invests. |
| (5) | Includes 0.01% for the year ended March 31, 2020 attributed to line of credit fees which are not subject to waiver by the adviser. |
| (6) | Includes 0.01% for the year ended March 31, 2021 attributed to borrowing costs (line of credit fees) and extraordinary expenses which are not subject to waiver by the adviser. |
| (7) | Includes 0.02% for the year ended March 31, 2022 attributed to borrowing costs (line of credit fees) and extraordinary expenses which are not subject to waiver by the adviser. |
| (8) | Includes 0.16% for the year ended March 31, 2023 attributed to borrowing costs (line of credit fees) and extraordinary expenses which are not subject to waiver by the adviser. |
| (9) | Includes 0.25% for the year ended March 31, 2024 attributed to borrowing costs (line of credit fees) and extraordinary expenses which are not subject to waiver by the adviser. |
| (10) | Includes 0.37% for the six months ended September 30, 2024 attributed to borrowing costs (line of credit fees) and extraordinary expenses which are not subject to waiver by the adviser. |
| (11) | Includes adjustments in accordance with accounting principles generally accepted in the United States of America and, consequently, the net asset value for financial reporting purposes and the returns based upon those net asset values may differ from the net asset values and returns for shareholder transactions. |
| (12) | Annualized for periods less than one year. |
| (13) | Not annualized for periods less than one year. |
See accompanying notes to financial statements.
| AlphaCentric Income Opportunities Fund |
| FINANCIAL HIGHLIGHTS |
Per Share Data and Ratios for a Share of Beneficial Interest Outstanding Throughout Each Period Presented
| | | Six Months Ended | | | Year Ended | | | Year Ended | | | Year Ended | | | Year Ended | | | Year Ended | |
| | | September 30, 2024 | | | March 31, | | | March 31, | | | March 31, | | | March 31, | | | March 31, | |
| Class C (IOFCX) | | (Unaudited) | | | 2024 | | | 2023 | | | 2022 | | | 2021 | | | 2020 | |
| Net asset value, beginning of period | | $ | 7.76 | | | $ | 8.65 | | | $ | 11.43 | | | $ | 11.45 | | | $ | 8.12 | | | $ | 12.24 | |
| Activity from investment operations: | | | | | | | | | | | | | | | | | | | | | | | | |
| Net investment income (1) | | | 0.25 | | | | 0.23 | | | | 0.16 | | | | 0.04 | | | | 0.11 | | | | 0.37 | |
| Net realized and unrealised gain (loss) on investments | | | (0.10 | ) | | | (0.60 | ) | | | (2.51 | ) | | | 0.30 | | | | 3.61 | | | | (4.01 | ) |
| Total from investment operations | | | 0.15 | | | | (0.37 | ) | | | (2.35 | ) | | | 0.34 | | | | 3.72 | | | | (3.64 | ) |
| Less distributions from: | | | | | | | | | | | | | | | | | | | | | | | | |
| Net investment income | | | (0.26 | ) | | | (0.23 | ) | | | (0.17 | ) | | | (0.21 | ) | | | (0.14 | ) | | | (0.41 | ) |
| Return of capital | | | — | | | | (0.29 | ) | | | (0.26 | ) | | | (0.15 | ) | | | (0.25 | ) | | | (0.07 | ) |
| Total distributions | | | (0.26 | ) | | | (0.52 | ) | | | (0.43 | ) | | | (0.36 | ) | | | (0.39 | ) | | | (0.48 | ) |
| Net asset value, end of period | | $ | 7.65 | | | $ | 7.76 | | | $ | 8.65 | | | $ | 11.43 | | | $ | 11.45 | | | $ | 8.12 | |
| Total return (2)(13) | | | 2.06 | % (11) | | | (4.37 | )% (11) | | | (20.74 | )% | | | 2.92 | % | | | 46.47 | % | | | (30.98 | )% |
| Net assets, at end of period (000s) | | $ | 20,516 | | | $ | 24,330 | | | $ | 46,084 | | | $ | 100,794 | | | $ | 118,599 | | | $ | 87,724 | |
| Ratio of gross expenses to average net assets before expense reimbursement (3)(12) | | | 2.97 | % (10) | | | 3.06 | % (9) | | | 2.93 | % (8) | | | 2.71 | % (7) | | | 2.72 | % (6) | | | 2.68 | % (5) |
| Ratio of net expenses to average net assets after expense reimbursement (12) | | | 2.86 | % (10) | | | 2.74 | % (9) | | | 2.65 | % (8) | | | 2.51 | % (7) | | | 2.50 | % (6) | | | 2.50 | % (5) |
| Ratio of net investment income to average net assets (4)(12) | | | 6.61 | % (10) | | | 2.74 | % (9) | | | 1.66 | % (8) | | | 0.34 | % (7) | | | 1.08 | % (6) | | | 2.95 | % (5) |
| Portfolio Turnover Rate (13) | | | 4 | % | | | 15 | % | | | 0 | % | | | 14 | % | | | 3 | % | | | 54 | % |
| (1) | Per share amounts calculated using the average shares method. |
| (2) | Total return in the above table is historical in nature and represents the rate that the investor would have earned or lost on an investment in the Fund assuming reinvestment of dividends and capital gain distributions, if any, and does not reflect the impact of sales charges. Had the adviser not waived a portion of the Fund’s expenses, total returns would have been lower. |
| (3) | Represents the ratio of expenses to average net assets absent fee waivers and/or expense reimbursements by the adviser. |
| (4) | Recognition of net investment income (loss) is affected by the timing and declaration of dividends by the underlying investment companies in which the Fund invests. |
| (5) | Includes 0.01% for the year ended March 31, 2020 attributed to line of credit fees which are not subject to waiver by the adviser. |
| (6) | Includes 0.01% for the year ended March 31, 2021 attributed to borrowing costs (line of credit fees) and extraordinary expenses which are not subject to waiver by the adviser. |
| (7) | Includes 0.02% for the year ended March 31, 2022 attributed to borrowing costs (line of credit fees) and extraordinary expenses which are not subject to waiver by the adviser. |
| (8) | Includes 0.16% for the year ended March 31, 2023 attributed to borrowing costs (line of credit fees) and extraordinary expenses which are not subject to waiver by the adviser. |
| (9) | Includes 0.25% for the year ended March 31, 2024 attributed to borrowing costs (line of credit fees) and extraordinary expenses which are not subject to waiver by the adviser. |
| (10) | Includes 0.37% for the six months ended September 30, 2024 attributed to borrowing costs (line of credit fees) and extraordinary expenses which are not subject to waiver by the adviser. |
| (11) | Includes adjustments in accordance with accounting principles generally accepted in the United States of America and, consequently, the net asset value for financial reporting purposes and the returns based upon those net asset values may differ from the net asset values and returns for shareholder transactions. |
| (12) | Annualized for periods less than one year. |
| (13) | Not annualized for periods less than one year. |
See accompanying notes to financial statements.
| AlphaCentric Income Opportunities Fund |
| FINANCIAL HIGHLIGHTS |
Per Share Data and Ratios for a Share of Beneficial Interest Outstanding Throughout Each Period Presented
| | | Six Months Ended | | | Year Ended | | | Year Ended | | | Year Ended | | | Year Ended | | | Year Ended | |
| | | September 30, 2024 | | | March 31, | | | March 31, | | | March 31, | | | March 31, | | | March 31, | |
| Class I (IOFIX) | | (Unaudited) | | | 2024 | | | 2023 | | | 2022 | | | 2021 | | | 2020 | |
| Net asset value, beginning of period | | $ | 7.80 | | | $ | 8.69 | | | $ | 11.49 | | | $ | 11.51 | | | $ | 8.16 | | | $ | 12.30 | |
| Activity from investment operations: | | | | | | | | | | | | | | | | | | | | | | | | |
| Net investment income (1) | | | 0.29 | | | | 0.31 | | | | 0.25 | | | | 0.16 | | | | 0.22 | | | | 0.50 | |
| Net realized and unrealized gain (loss) on investments | | | (0.09 | ) | | | (0.60 | ) | | | (2.52 | ) | | | 0.30 | | | | 3.63 | | | | (4.03 | ) |
| Total from investment operations | | | 0.20 | | | | (0.29 | ) | | | (2.27 | ) | | | 0.46 | | | | 3.85 | | | | (3.53 | ) |
| Less distributions from: | | | | | | | | | | | | | | | | | | | | | | | | |
| Net investment income | | | (0.30 | ) | | | (0.26 | ) | | | (0.20 | ) | | | (0.28 | ) | | | (0.23 | ) | | | (0.52 | ) |
| Return of capital | | | — | | | | (0.34 | ) | | | (0.33 | ) | | | (0.20 | ) | | | (0.27 | ) | | | (0.09 | ) |
| Total distributions | | | (0.30 | ) | | | (0.60 | ) | | | (0.53 | ) | | | (0.48 | ) | | | (0.50 | ) | | | (0.61 | ) |
| Net asset value, end of period | | $ | 7.70 | | | $ | 7.80 | | | $ | 8.69 | | | $ | 11.49 | | | $ | 11.51 | | | $ | 8.16 | |
| Total return (2)(13) | | | 2.68 | % (11) | | | (3.38 | )% (11) | | | (19.99 | )% | | | 3.93 | % | | | 47.94 | % | | | (30.29 | )% |
| Net assets, at end of period (000s) | | $ | 252,160 | | | $ | 284,496 | | | $ | 528,778 | | | $ | 2,189,289 | | | $ | 3,315,245 | | | $ | 1,515,562 | |
| Ratio of gross expenses to average net assets before expense reimbursement (3)(12) | | | 1.97 | % (10) | | | 2.06 | % (9) | | | 1.93 | % (8) | | | 1.70 | % (7) | | | 1.72 | % (6) | | | 1.68 | % (5) |
| Ratio of net expenses to average net assets after expense reimbursement (12) | | | 1.86 | % (10) | | | 1.74 | % (9) | | | 1.65 | % (8) | | | 1.51 | % (7) | | | 1.50 | % (6) | | | 1.50 | % (5) |
| Ratio of net investment income to average net assets (4)(12) | | | 7.61 | % (10) | | | 3.74 | % (9) | | | 2.56 | % (8) | | | 1.34 | % (7) | | | 2.07 | % (6) | | | 3.91 | % (5) |
| Portfolio Turnover Rate (13) | | | 4 | % | | | 15 | % | | | 0 | % | | | 14 | % | | | 3 | % | | | 54 | % |
| (1) | Per share amounts calculated using the average shares method. |
| (2) | Total return in the above table is historical in nature and represents the rate that the investor would have earned or lost on an investment in the Fund assuming reinvestment of dividends and capital gain distributions, if any, and does not reflect the impact of sales charges. Had the adviser not waived a portion of the Fund’s expenses, total returns would have been lower. |
| (3) | Represents the ratio of expenses to average net assets absent fee waivers and/or expense reimbursements by the adviser. |
| (4) | Recognition of net investment income (loss) is affected by the timing and declaration of dividends by the underlying investment companies in which the Fund invests. |
| (5) | Includes 0.01% for the year ended March 31, 2020 attributed to line of credit fees which are not subject to waiver by the adviser. |
| (6) | Includes 0.01% for the year ended March 31, 2021 attributed to borrowing costs (line of credit fees) and extraordinary expenses which are not subject to waiver by the adviser. |
| (7) | Includes 0.02% for the year ended March 31, 2022 attributed to borrowing costs (line of credit fees) and extraordinary expenses which are not subject to waiver by the adviser. |
| (8) | Includes 0.16% for the year ended March 31, 2023 attributed to borrowing costs (line of credit fees) and extraordinary expenses which are not subject to waiver by the adviser. |
| (9) | Includes 0.25% for the year ended March 31, 2024 attributed to borrowing costs (line of credit fees) and extraordinary expenses which are not subject to waiver by the adviser. |
| (10) | Includes 0.37% for the six months ended September 30, 2024 attributed to borrowing costs (line of credit fees) and extraordinary expenses which are not subject to waiver by the adviser. |
| (11) | Includes adjustments in accordance with accounting principles generally accepted in the United States of America and, consequently, the net asset value for financial reporting purposes and the returns based upon those net asset values may differ from the net asset values and returns for shareholder transactions. |
| (12) | Annualized for periods less than one year. |
| (13) | Not annualized for periods less than one year. |
See accompanying notes to financial statements.
| AlphaCentric Premium Opportunity Fund |
| FINANCIAL HIGHLIGHTS |
Per Share Data and Ratios for a Share of Beneficial Interest Outstanding Throughout Each Period Presented
| | | Six Months Ended | | | Year Ended | | | Year Ended | | | Year Ended | | | Year Ended | | | Year Ended | |
| | | September 30, 2024 | | | March 31, | | | March 31, | | | March 31, | | | March 31, | | | March 31, | |
| Class A (HMXAX) | | (Unaudited) | | | 2024 | | | 2023 | | | 2022 | | | 2021 | | | 2020 | |
| Net asset value, beginning of period | | $ | 27.33 | | | $ | 24.00 | | | $ | 25.14 | | | $ | 25.80 | | | $ | 23.12 | | | $ | 18.70 | |
| Activity from investment operations: | | | | | | | | | | | | | | | | | | | | | | | | |
| Net investment income (loss) (1) | | | 0.21 | | | | 0.37 | | | | (0.07 | ) | | | (0.58 | ) | | | (0.53 | ) | | | (0.06 | ) |
| Net realized and unrealized gain (loss) on investments | | | 0.40 | | | | 2.96 | | | | (1.07 | ) | | | 1.19 | | | | 3.79 | | | | 4.48 | |
| Total from investment operations | | | 0.61 | | | | 3.33 | | | | (1.14 | ) | | | 0.61 | | | | 3.26 | | | | 4.42 | |
| Less distributions from: | | | | | | | | | | | | | | | | | | | | | | | | |
| Net realized gains | | | — | | | | — | | | | — | | | | (1.27 | ) | | | (0.58 | ) | | | — | |
| Total distributions | | | — | | | | — | | | | — | | | | (1.27 | ) | | | (0.58 | ) | | | — | |
| Net asset value, end of period | | $ | 27.94 | | | $ | 27.33 | | | $ | 24.00 | | | $ | 25.14 | | | $ | 25.80 | | | $ | 23.12 | |
| Total return (2)(9) | | | 2.23 | % (7) | | | 13.88 | % (7) | | | (4.53 | )% | | | 2.24 | % | | | 14.17 | % | | | 23.64 | % |
| Net assets, at end of period (000s) | | $ | 3,288 | | | $ | 4,314 | | | $ | 7,452 | | | $ | 6,187 | | | $ | 6,455 | | | $ | 1,722 | |
| Ratio of gross expenses to average net assets before expense reimbursement (3)(8) | | | 2.49 | % | | | 2.43 | % | | | 2.37 | % | | | 2.25 | % | | | 2.31 | % (6) | | | 3.19 | % (5) |
| Ratio of net expenses to average net assets after expense reimbursement (8) | | | 2.24 | % | | | 2.24 | % | | | 2.24 | % | | | 2.24 | % | | | 2.25 | % (6) | | | 2.33 | % (5) |
| Ratio of net investment income (loss) to average net assets (8) | | | 1.53 | % | | | 1.48 | % | | | (0.31 | )% | | | (2.22 | )% | | | (2.11 | )% (6) | | | (0.31 | )% (5) |
| Portfolio Turnover Rate (4)(9) | | | 0 | % | | | 0 | % | | | 0 | % | | | 0 | % | | | 9 | % | | | 0 | % |
| (1) | Per share amounts calculated using the average shares method. |
| (2) | Total return in the above table is historical in nature and represents the rate that the investor would have earned or lost on an investment in the Fund assuming reinvestment of dividends and capital gain distributions, if any, and does not reflect the impact of sales charges. Had the adviser not waived a portion of the Fund’s expenses, total returns would have been lower. |
| (3) | Represents the ratio of expenses to average net assets absent fee waivers and/or expense reimbursements by the adviser. |
| (4) | All securities whose maturity or expiration date at the time of acquisition were one year or less are excluded from the portfolio turnover calculation. |
| (5) | Includes 0.09% for the year ended March 31, 2020 attributable to margin expense on short sales, which is not subject to waiver by the adviser. |
| (6) | Includes 0.01% for the year ended March 31, 2021 attributable to margin expense on short sales, which is not subject to waiver by the adviser. |
| (7) | Includes adjustments in accordance with accounting principles generally accepted in the United States of America and, consequently, the net asset value for financial reporting purposes and the returns based upon those net asset values may differ from the net asset values and returns for shareholder transactions. |
| (8) | Annualized for periods less than one year. |
| (9) | Not annualized for periods less than one year. |
See accompanying notes to financial statements.
| AlphaCentric Premium Opportunity Fund |
| FINANCIAL HIGHLIGHTS |
Per Share Data and Ratios for a Share of Beneficial Interest Outstanding Throughout Each Period Presented
| | | Six Months Ended | | | Year Ended | | | Year Ended | | | Year Ended | | | Year Ended | | | Year Ended | |
| | | September 30, 2024 | | | March 31, | | | March 31, | | | March 31, | | | March 31, | | | March 31, | |
| Class C (HMXCX) | | (Unaudited) | | | 2,024 | | | 2023 | | | 2022 | | | 2021 | | | 2020 | |
| Net asset value, beginning of period | | $ | 25.95 | | | $ | 22.96 | | | $ | 24.24 | | | $ | 25.10 | | | $ | 22.68 | | | $ | 18.38 | |
| Activity from investment operations: | | | | | | | | | | | | | | | | | | | | | | | | |
| Net investment income (loss) (1) | | | 0.11 | | | | 0.18 | | | | (0.29 | ) | | | (0.75 | ) | | | (0.71 | ) | | | (0.25 | ) |
| Net realized and unrealized gain (loss) on investments | | | 0.37 | | | | 2.81 | | | | (0.99 | ) | | | 1.16 | | | | 3.71 | | | | 4.55 | |
| Total from investment operations | | | 0.48 | | | | 2.99 | | | | (1.28 | ) | | | 0.41 | | | | 3.00 | | | | 4.30 | |
| Less distributions from: | | | | | | | | | | | | | | | | | | | | | | | | |
| Net realized gains | | | — | | | | — | | | | — | | | | (1.27 | ) | | | (0.58 | ) | | | — | |
| Total distributions | | | — | | | | — | | | | — | | | | (1.27 | ) | | | (0.58 | ) | | | — | |
| Net asset value, end of period | | $ | 26.43 | | | $ | 25.95 | | | $ | 22.96 | | | $ | 24.24 | | | $ | 25.10 | | | $ | 22.68 | |
| Total return (2)(9) | | | 1.85 | % (7) | | | 13.02 | % (7) | | | (5.28 | )% | | | 1.50 | % | | | 13.29 | % | | | 23.40 | % |
| Net assets, at end of period (000s) | | $ | 1,325 | | | $ | 1,646 | | | $ | 1,783 | | | $ | 3,652 | | | $ | 2,079 | | | $ | 164 | |
| Ratio of gross expenses to average net assets before expense reimbursement (3)(8) | | | 3.24 | % | | | 3.18 | % | | | 3.12 | % | | | 3.00 | % | | | 3.06 | % (6) | | | 3.94 | % (5) |
| Ratio of net expenses to average net assets after expense reimbursement (8) | | | 2.99 | % | | | 2.99 | % | | | 2.99 | % | | | 2.99 | % | | | 3.00 | % (6) | | | 3.04 | % (5) |
| Ratio of net investment income (loss) to average net assets (8) | | | 0.77 | % | | | 0.73 | % | | | (1.30 | )% | | | (2.97 | )% | | | (2.88 | )% (6) | | | (1.23 | )% (5) |
| Portfolio Turnover Rate (4)(9) | | | 0 | % | | | 0 | % | | | 0 | % | | | 0 | % | | | 9 | % | | | 0 | % |
| (1) | Per share amounts calculated using the average shares method. |
| (2) | Total return in the above table is historical in nature and represents the rate that the investor would have earned or lost on an investment in the Fund assuming reinvestment of dividends and capital gain distributions, if any, and does not reflect the impact of sales charges. Had the adviser not waived a portion of the Fund’s expenses, total returns would have been lower. |
| (3) | Represents the ratio of expenses to average net assets absent fee waivers and/or expense reimbursements by the adviser. |
| (4) | All securities whose maturity or expiration date at the time of acquisition were one year or less are excluded from the portfolio turnover calculation. |
| (5) | Includes 0.05% for the year ended March 31, 2020 attributable to margin expense on short sales, which is not subject to waiver by the adviser. |
| (6) | Includes 0.01% for the year ended March 31, 2021 attributable to margin expense on short sales, which is not subject to waiver by the adviser. |
| (7) | Includes adjustments in accordance with accounting principles generally accepted in the United States of America and, consequently, the net asset value for financial reporting purposes and the returns based upon those net asset values may differ from the net asset values and returns for shareholder transactions. |
| (8) | Annualized for periods less than one year. |
| (9) | Not annualized for periods less than one year. |
See accompanying notes to financial statements.
| AlphaCentric Premium Opportunity Fund |
| FINANCIAL HIGHLIGHTS |
Per Share Data and Ratios for a Share of Beneficial Interest Outstanding Throughout Each Period Presented
| | | Six Months Ended | | | Year Ended | | | Year Ended | | | Year Ended | | | Year Ended | | | Year Ended | |
| | | September 30, 2024 | | | March 31, | | | March 31, | | | March 31, | | | March 31, | | | March 31, | |
| Class I (HMXIX) | | (Unaudited) | | | 2024 | | | 2023 | | | 2022 | | | 2021 | | | 2020 | |
| Net asset value, beginning of period | | $ | 28.04 | | | $ | 24.56 | | | $ | 25.67 | | | $ | 26.25 | | | $ | 23.46 | | | $ | 18.93 | |
| Activity from investment operations: | | | | | | | | | | | | | | | | | | | | | | | | |
| Net investment income (loss) (1) | | | 0.25 | | | | 0.45 | | | | (0.07 | ) | | | (0.52 | ) | | | (0.48 | ) | | | (0.03 | ) |
| Net realized and unrealized gain (loss) on investments | | | 0.42 | | | | 3.03 | | | | (1.04 | ) | | | 1.21 | | | | 3.85 | | | | 4.56 | |
| Total from investment operations | | | 0.67 | | | | 3.48 | | | | (1.11 | ) | | | 0.69 | | | | 3.37 | | | | 4.53 | |
| Less distributions from: | | | | | | | | | | | | | | | | | | | | | | | | |
| Net realized gains | | | — | | | | — | | | | — | | | | (1.27 | ) | | | (0.58 | ) | | | — | |
| Total distributions | | | — | | | | — | | | | — | | | | (1.27 | ) | | | (0.58 | ) | | | — | |
| Net asset value, end of period | | $ | 28.71 | | | $ | 28.04 | | | $ | 24.56 | | | $ | 25.67 | | | $ | 26.25 | | | $ | 23.46 | |
| Total return (2)(9) | | | 2.39 | % (7) | | | 14.17 | % | | | (4.32 | )% | | | 2.51 | % | | | 14.43 | % | | | 23.93 | % |
| Net assets, at end of period (000s) | | $ | 57,716 | | | $ | 68,207 | | | $ | 79,979 | | | $ | 167,686 | | | $ | 93,490 | | | $ | 26,792 | |
| Ratio of gross expenses to average net assets before expense reimbursement (3)(8) | | | 2.24 | % | | | 2.18 | % | | | 2.12 | % | | | 2.01 | % | | | 2.06 | % (6) | | | 2.94 | % (5) |
| Ratio of net expenses to average net assets after expense reimbursement (8) | | | 1.99 | % | | | 1.99 | % | | | 1.99 | % | | | 1.99 | % | | | 2.00 | % (6) | | | 2.05 | % (5) |
| Ratio of net investment income (loss) to average net assets (8) | | | 1.76 | % | | | 1.73 | % | | | (0.30 | )% | | | (1.97 | )% | | | (1.87 | )% (6) | | | (0.13 | )% (5) |
| Portfolio Turnover Rate (4)(9) | | | 0 | % | | | 0 | % | | | 0 | % | | | 0 | % | | | 9 | % | | | 0 | % |
| (1) | Per share amounts calculated using the average shares method. |
| (2) | Total return in the above table is historical in nature and represents the rate that the investor would have earned or lost on an investment in the Fund assuming reinvestment of dividends and capital gain distributions, if any, and does not reflect the impact of sales charges. Had the adviser not waived a portion of the Fund’s expenses, total returns would have been lower. |
| (3) | Represents the ratio of expenses to average net assets absent fee waivers and/or expense reimbursements by the adviser. |
| (4) | All securities whose maturity or expiration date at the time of acquisition were one year or less are excluded from the portfolio turnover calculation. |
| (5) | Includes 0.06% for the year ended March 31, 2020 attributable to margin expense on short sales, which is not subject to waiver by the adviser. |
| (6) | Includes 0.01% for the year ended March 31, 2021 attributable to margin expense on short sales, which is not subject to waiver by the adviser. |
| (7) | Includes adjustments in accordance with accounting principles generally accepted in the United States of America and, consequently, the net asset value for financial reporting purposes and the returns based upon those net asset values may differ from the net asset values and returns for shareholder transactions. |
| (8) | Annualized for periods less than one year. |
| (9) | Not annualized for periods less than one year. |
See accompanying notes to financial statements.
| AlphaCentric Robotics and Automation Fund |
| FINANCIAL HIGHLIGHTS |
Per Share Data and Ratios for a Share of Beneficial Interest Outstanding Throughout Each Period Presented
| | | Six Months Ended | | | Year Ended | | | Year Ended | | | Year Ended | | | Year Ended | | | Year Ended | |
| | | September 30, 2024 | | | March 31, | | | March 31, | | | March 31, | | | March 31, | | | March 31, | |
| Class A (GNXAX) | | (Unaudited) | | | 2024 | | | 2023 | | | 2022 | | | 2021 | | | 2020 | |
| Net asset value, beginning of period | | $ | 12.26 | | | $ | 11.61 | | | $ | 13.99 | | | $ | 17.06 | | | $ | 9.63 | | | $ | 11.46 | |
| Activity from investment operations: | | | | | | | | | | | | | | | | | | | | | | | | |
| Net investment loss (1) | | | (0.01 | ) (7) | | | (0.04 | ) | | | (0.02 | ) | | | (0.14 | ) | | | (0.14 | ) | | | (0.08 | ) |
| Net realized and unrealized gain (loss) on investments | | | (0.48 | ) | | | 0.69 | | | | (1.78 | ) | | | (2.20 | ) | | | 7.57 | | | | (1.75 | ) |
| Total from investment operations | | | (0.49 | ) | | | 0.65 | | | | (1.80 | ) | | | (2.34 | ) | | | 7.43 | | | | (1.83 | ) |
| Less distributions from: | | | | | | | | | | | | | | | | | | | | | | | | |
| Net realized gains | | | — | | | | — | | | | (0.58 | ) | | | (0.73 | ) | | | — | | | | — | |
| Total distributions | | | — | | | | — | | | | (0.58 | ) | | | (0.73 | ) | | | — | | | | — | |
| Net asset value, end of period | | $ | 11.77 | | | $ | 12.26 | | | $ | 11.61 | | | $ | 13.99 | | | $ | 17.06 | | | $ | 9.63 | |
| Total return (2)(9) | | | (4.00 | )% (6) | | | 5.60 | % | | | (12.70 | )% | | | (14.41 | )% | | | 77.15 | % | | | (15.97 | )% |
| Net assets, at end of period (000s) | | $ | 1,726 | | | $ | 2,988 | | | $ | 3,729 | | | $ | 5,853 | | | $ | 7,796 | | | $ | 4,711 | |
| Ratio of gross expenses to average net assets before expense reimbursement (3)(8) | | | 2.98 | % (5) | | | 2.34 | % (4) | | | 2.31 | % | | | 2.02 | % | | | 2.10 | % | | | 2.18 | % |
| Ratio of net expenses to average net assets after expense reimbursement (8) | | | 1.85 | % (5) | | | 1.65 | % (4) | | | 1.65 | % | | | 1.65 | % | | | 1.65 | % | | | 1.65 | % |
| Ratio of net investment loss to average net assets (8) | | | (0.17 | )% (5) | | | (0.32 | )% (4) | | | (0.20 | )% | | | (0.85 | )% | | | (0.96 | )% | | | (0.69 | )% |
| Portfolio Turnover Rate (9) | | | 22 | % | | | 54 | % | | | 38 | % | | | 73 | % | | | 125 | % | | | 315 | % |
| (1) | Per share amounts calculated using the average shares method. |
| (2) | Total return in the above table is historical in nature and represents the rate that the investor would have earned or lost on an investment in the Fund assuming reinvestment of dividends and capital gain distributions, if any, and does not reflect the impact of sales charges. Had the adviser not waived a portion of the Fund’s expenses, total returns would have been lower. |
| (3) | Represents the ratio of expenses to average net assets absent fee waivers and/or expense reimbursements by the adviser. |
| (4) | Includes 0.00% for the year ended March 31, 2024 attributed to borrowing costs (line of credit fees) which are not subject to waiver by the adviser. |
| (5) | Includes 0.20% for the six months ended September 30, 2024 attributed to borrowing costs (line of credit fees) and custody overdraft fees which are not subject to waiver by the adviser. |
| (6) | Includes adjustments in accordance with accounting principles generally accepted in the United States of America and, consequently, the net asset value for financial reporting purposes and the returns based upon those net asset values may differ from the net asset values and returns for shareholder transactions. |
| (7) | Net investment loss per share are balancing amounts necessary to reconcile the change in net asset value per share for the period, and may anot accord with the aggregate gains and losses in the Statement of Operations due to share transactions for the period. |
| (8) | Annualized for periods less than one year. |
| (9) | Not annualized for periods less than one year. |
See accompanying notes to financial statements.
| AlphaCentric Robotics and Automation Fund |
| FINANCIAL HIGHLIGHTS |
Per Share Data and Ratios for a Share of Beneficial Interest Outstanding Throughout Each Period Presented
| | | Six Months Ended | | | Year Ended | | | Year Ended | | | Year Ended | | | Year Ended | | | Year Ended | |
| | | September 30, 2024 | | | March 31, | | | March 31, | | | March 31, | | | March 31, | | | March 31, | |
| Class C (GNXCX) | | (Unaudited) | | | 2024 | | | 2023 | | | 2022 | | | 2021 | | | 2020 | |
| Net asset value, beginning of period | | $ | 11.60 | | | $ | 11.07 | | | $ | 13.47 | | | $ | 16.57 | | | $ | 9.43 | | | $ | 11.30 | |
| Activity from investment operations: | | | | | | | | | | | | | | | | | | | | | | | | |
| Net investment loss (1) | | | (0.06 | ) (6) | | | (0.11 | ) | | | (0.10 | ) | | | (0.26 | ) | | | (0.24 | ) | | | (0.16 | ) |
| Net realized and unrealized gain (loss) on investments | | | (0.44 | ) | | | 0.64 | | | | (1.72 | ) | | | (2.11 | ) | | | 7.38 | | | | (1.71 | ) |
| Total from investment operations | | | (0.50 | ) | | | 0.53 | | | | (1.82 | ) | | | (2.37 | ) | | | 7.14 | | | | (1.87 | ) |
| Less distributions from: | | | | | | | | | | | | | | | | | | | | | | | | |
| Net realized gains | | | — | | | | — | | | | (0. 58) | | | | (0.73 | ) | | | — | | | | — | |
| Total distributions | | | — | | | | — | | | | (0.58 | ) | | | (0.73 | ) | | | — | | | | — | |
| Net asset value, end of period | | $ | 11.10 | | | $ | 11.60 | | | $ | 11.07 | | | $ | 13.47 | | | $ | 16.57 | | | $ | 9.43 | |
| Total return (2)(8) | | | (4.31 | )% | | | 4.79 | % | | | (13.34 | )% | | | (15.03 | )% | | | 75.72 | % | | | (16.55 | )% |
| Net assets, at end of period (000s) | | $ | 433 | | | $ | 536 | | | $ | 676 | | | $ | 1,258 | | | $ | 1,258 | | | $ | 828 | |
| Ratio of gross expenses to average net assets before expense reimbursement (3)(7) | | | 3.73 | % (5) | | | 3.09 | % (4) | | | 3.06 | % | | | 2.78 | % | | | 2.85 | % | | | 2.93 | % |
| Ratio of net expenses to average net assets after expense reimbursement (7) | | | 2.60 | % (5) | | | 2.40 | % (4) | | | 2.40 | % | | | 2.40 | % | | | 2.40 | % | | | 2.40 | % |
| Ratio of net investment loss to average net assets (7) | | | (0.99 | )% (5) | | | (1.07 | )% (4) | | | (0.96 | )% | | | (1.61 | )% | | | (1.71 | )% | | | (1.47 | )% |
| Portfolio Turnover Rate (8) | | | 22 | % | | | 54 | % | | | 38 | % | | | 73 | % | | | 125 | % | | | 315 | % |
| (1) | Per share amounts calculated using the average shares method. |
| (2) | Total return in the above table is historical in nature and represents the rate that the investor would have earned or lost on an investment in the Fund assuming reinvestment of dividends and capital gain distributions, if any, and does not reflect the impact of sales charges. Had the adviser not waived a portion of the Fund’s expenses, total returns would have been lower. |
| (3) | Represents the ratio of expenses to average net assets absent fee waivers and/or expense reimbursements by the adviser. |
| (4) | Includes 0.00% for the year ended March 31, 2024 attributed to borrowing costs (line of credit fees) which are not subject to waiver by the adviser. |
| (5) | Includes 0.20% for the six months ended September 30, 2024 attributed to borrowing costs (line of credit fees) and custody overdraft fees which are not subject to waiver by the adviser. |
| (6) | Net investment loss per share are balancing amounts necessary to reconcile the change in net asset value per share for the period, and may anot accord with the aggregate gains and losses in the Statement of Operations due to share transactions for the period. |
| (7) | Annualized for periods less than one year. |
| (8) | Not annualized for periods less than one year. |
See accompanying notes to financial statements.
| AlphaCentric Robotics and Automation Fund |
| FINANCIAL HIGHLIGHTS |
Per Share Data and Ratios for a Share of Beneficial Interest Outstanding Throughout Each Period Presented
| | | Six Months Ended | | | Year Ended | | | Year Ended | | | Year Ended | | | Year Ended | | | Year Ended | |
| | | September 30, 2024 | | | March 31, | | | March 31, | | | March 31, | | | March 31, | | | March 31, | |
| Class I (GNXIX) | | (Unaudited) | | | 2024 | | | 2023 | | | 2022 | | | 2021 | | | 2020 | |
| Net asset value, beginning of period | | $ | 12.50 | | | $ | 11.81 | | | $ | 14.17 | | | $ | 17.23 | | | $ | 9.71 | | | $ | 11.52 | |
| Activity from investment operations: | | | | | | | | | | | | | | | | | | | | | | | | |
| Net investment income (loss) (1) | | | 0.01 | | | | (0.01 | ) | | | 0.01 | (4) | | | (0.10 | ) | | | (0.10 | ) | | | (0.05 | ) |
| Net realized and unrealized gain (loss) on investments | | | (0.49 | ) | | | 0.70 | | | | (1.79 | ) | | | (2.23 | ) | | | 7.62 | | | | (1.76 | ) |
| Total from investment operations | | | (0.48 | ) | | | 0.69 | | | | (1.78 | ) | | | (2.33 | ) | | | 7.52 | | | | (1.81 | ) |
| Less distributions from: | | | | | | | | | | | | | | | | | | | | | | | | |
| Net realized gains | | | — | | | | — | | | | (0.58 | ) | | | (0.73 | ) | | | — | | | | — | |
| Total distributions | | | — | | | | — | | | | (0.58 | ) | | | (0.73 | ) | | | — | | | | — | |
| Net asset value, end of period | | $ | 12.02 | | | $ | 12.50 | | | $ | 11.81 | | | $ | 14.17 | | | $ | 17.23 | | | $ | 9.71 | |
| Total return (2)(9) | | | (3.84 | )% | | | 5.84 | % (5) | | | (12.39 | )% | | | (14.21 | )% | | | 77.45 | % | | | (15.71 | )% |
| Net assets, at end of period (000s) | | $ | 11,488 | | | $ | 23,092 | | | $ | 27,309 | | | $ | 32,289 | | | $ | 34,754 | | | $ | 20,392 | |
| Ratio of gross expenses to average net assets before expense reimbursement (3)(8) | | | 2.73 | % (7) | | | 2.09 | % (6) | | | 2.06 | % | | | 1.78 | % | | | 1.85 | % | | | 1.93 | % |
| Ratio of net expenses to average net assets after expense reimbursement (8) | | | 1.60 | % (7) | | | 1.40 | % (6) | | | 1.40 | % | | | 1.40 | % | | | 1.40 | % | | | 1.40 | % |
| Ratio of net investment income (loss) to average net assets (8) | | | 0.15 | % (7) | | | (0.07 | )% (6) | | | 0.03 | % | | | (0.60 | )% | | | (0.70 | )% | | | (0.46 | )% |
| Portfolio Turnover Rate (9) | | | 22 | % | | | 54 | % | | | 38 | % | | | 73 | % | | | 125 | % | | | 315 | % |
| (1) | Per share amounts calculated using the average shares method. |
| (2) | Total return in the above table is historical in nature and represents the rate that the investor would have earned or lost on an investment in the Fund assuming reinvestment of dividends and capital gain distributions, if any, and does not reflect the impact of sales charges. Had the adviser not waived a portion of the Fund’s expenses, total returns would have been lower. |
| (3) | Represents the ratio of expenses to average net assets absent fee waivers and/or expense reimbursements by the adviser. |
| (4) | Net investment income (loss) per share are balancing amounts necessary to reconcile the change in net asset value per share for the period, and may anot accord with the aggregate gains and losses in the Statement of Operations due to share transactions for the period. |
| (5) | Includes adjustments in accordance with accounting principles generally accepted in the United States of America and, consequently, the net asset value for financial reporting purposes and the returns based upon those net asset values may differ from the net asset values and returns for shareholder transactions. |
| (6) | Includes 0.00% for the year ended March 31, 2024 attributed to borrowing costs (line of credit fees) which are not subject to waiver by the adviser. |
| (7) | Includes 0.20% for the six months ended September 30, 2024 attributed to borrowing costs (line of credit fees) and custody overdraft fees which are not subject to waiver by the adviser. |
| (8) | Annualized for periods less than one year. |
| (9) | Not annualized for periods less than one year. |
See accompanying notes to financial statements.
| AlphaCentric Symmetry Strategy Fund |
| CONSOLIDATED FINANCIAL HIGHLIGHTS |
Per Share Data and Ratios for a Share of Beneficial Interest Outstanding Throughout Each Period Presented
| | | Six Months Ended | | | Year Ended | | | Year Ended | | | Year Ended | | | Year Ended | | | Period Ended | |
| | | September 30, 2024 | | | March 31, | | | March 31, | | | March 31, | | | March 31, | | | March 31, | |
| Class A (SYMAX) | | (Unaudited) | | | 2024 | | | 2023 | | | 2022 | | | 2021 | | | 2020 (1) | |
| Net asset value, beginning of period | | $ | 12.19 | | | $ | 11.30 | | | $ | 12.76 | | | $ | 11.46 | | | $ | 9.75 | | | $ | 11.28 | |
| Activity from investment operations: | | | | | | | | | | | | | | | | | | | | | | | | |
| Net investment income (loss) (2) | | | 0.10 | | | | 0.19 | | | | 0.08 | | | | (0.08 | ) | | | (0.04 | ) | | | 0.05 | |
| Net realized and unrealized gain (loss) on investments | | | 0.23 | | | | 0.85 | | | | (0.43 | ) | | | 1.40 | | | | 1.89 | | | | (1.33 | ) (13) |
| Total from investment operations | | | 0.33 | | | | 1.04 | | | | (0.35 | ) | | | 1.32 | | | | 1.85 | | | | (1.28 | ) |
| Less distributions from: | | | | | | | | | | | | | | | | | | | | | | | | |
| Net investment income | | | — | | | | (0.15 | ) | | | (0.98 | ) | | | (0.02 | ) | | | (0.14 | ) | | | (0.25 | ) |
| Net realized gains | | | — | | | | — | | | | (0.13 | ) | | | — | | | | — | | | | — | |
| Total distributions | | | — | | | | (0.15 | ) | | | (1.11 | ) | | | (0.02 | ) | | | (0.14 | ) | | | (0.25 | ) |
| Net asset value, end of period | | $ | 12.52 | | | $ | 12.19 | | | $ | 11.30 | | | $ | 12.76 | | | $ | 11.46 | | | $ | 9.75 | |
| Total return (3)(12) | | | 2.71 | % | | | 9.28 | % | | | (2.86 | )% | | | 11.57 | % | | | 19.11 | % | | | (11.64 | )% |
| Net assets, at end of period (000s) | | $ | 152 | | | $ | 189 | | | $ | 858 | | | $ | 211 | | | $ | 1,016 | (5) | | $ | 865 | (5) |
| Ratio of gross expenses to average net assets before expense reimbursement (4)(11) | | | 2.21 | % (10) | | | 2.17 | % (9) | | | 1.95 | % | | | 2.38 | % (8) | | | 2.63 | % (7) | | | 2.51 | % (6) |
| Ratio of net expenses to average net assets after expense reimbursement (11) | | | 1.85 | % (10) | | | 1.85 | % (9) | | | 1.85 | % | | | 2.01 | % (8) | | | 2.26 | % (7) | | | 2.25 | % (6) |
| Ratio of net investment income (loss) to average net assets (11) | | | 1.66 | % (10) | | | 1.63 | % (9) | | | 0.65 | % | | | (0.54 | )% (8) | | | (0.45 | )% (7) | | | 0.38 | % (6) |
| Portfolio Turnover Rate (12) | | | 130 | % | | | 329 | % | | | 362 | % | | | 189 | % | | | 121 | % | | | 133 | % |
| (1) | AlphaCentric Symmetry Strategy Fund Class A commenced operations on August 8, 2019. |
| (2) | Per share amounts calculated using the average shares method. |
| (3) | Total return in the above table is historical in nature and represents the rate that the investor would have earned or lost on an investment in the Fund assuming reinvestment of dividends and capital gain distributions, if any, and does not reflect the impact of sales charges. Had the adviser not waived a portion of the Fund’s expenses, total returns would have been lower. |
| (4) | Represents the ratio of expenses to average net assets absent fee waivers and/or expense reimbursements by the adviser. |
| (5) | Actual net assets, not truncated. |
| (6) | Includes 0.01% for the period ended March 31, 2020 attributable to margin expense on futures, which is not subject to waiver by the adviser. |
| (7) | Includes 0.02% for the year ended March 31, 2021 attributable to margin expense on futures, which is not subject to waiver by the adviser. |
| (8) | Includes 0.02% for the year ended March 31, 2022 attributable to margin expense on futures, which is not subject to waiver by the adviser. |
| (9) | Includes 0.00% for the year ended March 31, 2024 attributed to borrowing costs (line of credit fees) which are not subject to waiver by the adviser. |
| (10) | Includes 0.00% for the six months ended September 30, 2024 attributed to borrowing costs (line of credit fees) which are not subject to waiver by the adviser. |
| (11) | Annualized for periods less than one year. |
| (12) | Not annualized for periods less than one year. |
| (13) | As required by SEC standard per share calculation methodology, this represents a rebalancing figure derived from other amounts in the financial highlights tables that captures all other changes affecting net asset value per share. This per share gain amount does not correlate to the aggregrate of the net realized and unrealized loss in the Statement of Operations for the period ended March 31, 2020, primarily due to the timing of sales and repurchases of the Fund’s shares in relation to fluctuating market values of the Fund’s |
See accompanying notes to financial statements.
| AlphaCentric Symmetry Strategy Fund |
| CONSOLIDATED FINANCIAL HIGHLIGHTS |
Per Share Data and Ratios for a Share of Beneficial Interest Outstanding Throughout Each Period Presented
| | | Six Months Ended | | | Year Ended | | | Year Ended | | | Year Ended | | | Year Ended | | | Period Ended | |
| | | September 30, 2024 | | | March 31, | | | March 31, | | | March 31, | | | March 31, | | | March 31, | |
| Class C (SYMCX) | | (Unaudited) | | | 2024 | | | 2023 | | | 2022 | | | 2021 | | | 2020 (1) | |
| Net asset value, beginning of period | | $ | 11.94 | | | $ | 11.11 | | | $ | 12.63 | | | $ | 11.42 | | | $ | 9.75 | | | $ | 11.28 | |
| Activity from investment operations: | | | | | | | | | | | | | | | | | | | | | | | | |
| Net investment income (loss) (2) | | | 0.05 | | | | 0.11 | | | | 0.01 | | | | (0.15 | ) | | | (0.12 | ) | | | (0.00 | ) (13) |
| Net realized and unrealized gain (loss) on investments | | | 0.23 | | | | 0.82 | | | | (0.44 | ) | | | 1.36 | | | | 1.88 | | | | (1.33 | ) (14) |
| Total from investment operations | | | 0.28 | | | | 0.93 | | | | (0.43 | ) | | | 1.21 | | | | 1.76 | | | | (1.33 | ) |
| Less distributions from: | | | | | | | | | | | | | | | | | | | | | | | | |
| Net investment income | | | — | | | | (0.10 | ) | | | (0.96 | ) | | | — | | | | (0.09 | ) | | | (0.20 | ) |
| Net realized gains | | | — | | | | — | | | | (0.13 | ) | | | — | | | | — | | | | — | |
| Total distributions | | | — | | | | (0.10 | ) | | | (1.09 | ) | | | — | | | | (0.09 | ) | | | (0.20 | ) |
| Net asset value, end of period | | $ | 12.22 | | | $ | 11.94 | | | $ | 11.11 | | | $ | 12.63 | | | $ | 11.42 | | | $ | 9.75 | |
| Total return (3)(12) | | | 2.35 | % | | | 8.46 | % | | | (3.53 | )% | | | 10.60 | % | | | 18.10 | % | | | (11.97 | )% |
| Net assets, at end of period (000s) | | $ | 587 | | | $ | 739 | | | $ | 954 | | | $ | 9 | | | $ | 1,013 | (5) | | $ | 864 | (5) |
| Ratio of gross expenses to average net assets before expense reimbursement (4)(11) | | | 2.96 | % (10) | | | 2.92 | % (9) | | | 2.70 | % | | | 3.12 | % (8) | | | 3.37 | % (7) | | | 3.26 | % (6) |
| Ratio of net expenses to average net assets after expense reimbursement (11) | | | 2.60 | % (10) | | | 2.60 | % (9) | | | 2.60 | % | | | 2.76 | % (8) | | | 3.01 | % (7) | | | 3.00 | % (6) |
| Ratio of net investment income (loss) to average net assets (11) | | | 0.91 | % (10) | | | 0.98 | % (9) | | | 0.06 | % | | | (1.29 | )% (8) | | | (1.20 | )% (7) | | | (0.16 | )% (6) |
| Portfolio Turnover Rate (12) | | | 130 | % | | | 329 | % | | | 362 | % | | | 189 | % | | | 121 | % | | | 133 | % |
| (1) | AlphaCentric Symmetry Strategy Fund Class C commenced operations on August 8, 2019. |
| (2) | Per share amounts calculated using the average shares method. |
| (3) | Total return in the above table is historical in nature and represents the rate that the investor would have earned or lost on an investment in the Fund assuming reinvestment of dividends and capital gain distributions, if any, and does not reflect the impact of sales charges. Had the adviser not waived a portion of the Fund’s expenses, total returns would have been lower. |
| (4) | Represents the ratio of expenses to average net assets absent fee waivers and/or expense reimbursements by the adviser. |
| (5) | Actual net assets, not truncated. |
| (6) | Includes 0.01% for the period ended March 31, 2020 attributable to margin expense on futures, which is not subject to waiver by the adviser. |
| (7) | Includes 0.02% for the year ended March 31, 2021 attributable to margin expense on futures, which is not subject to waiver by the adviser. |
| (8) | Includes 0.02% for the year ended March 31, 2022 attributable to margin expense on futures, which is not subject to waiver by the adviser. |
| (9) | Includes 0.00% for the year ended March 31, 2024 attributed to borrowing costs (line of credit fees) which are not subject to waiver by the adviser. |
| (10) | Includes 0.00% for the six months ended September 30, 2024 attributed to borrowing costs (line of credit fees) which are not subject to waiver by the adviser. |
| (11) | Annualized for periods less than one year. |
| (12) | Not annualized for periods less than one year. |
| (14) | As required by SEC standard per share calculation methodology, this represents a rebalancing figure derived from other amounts in the financial highlights tables that captures all other changes affecting net asset value per share. This per share gain amount does not correlate to the aggregrate of the net realized and unrealized loss in the Statement of Operations for the period ended March 31, 2020, primarily due to the timing of sales and repurchases of the Fund’s shares in relation to fluctuating market values of the Fund’s |
See accompanying notes to financial statements.
| AlphaCentric Symmetry Strategy Fund |
| CONSOLIDATED FINANCIAL HIGHLIGHTS |
Per Share Data and Ratios for a Share of Beneficial Interest Outstanding Throughout Each Period Presented
| | | Six Months Ended | | | Year Ended | | | Year Ended | | | Year Ended | | | Year Ended | | | Period Ended | |
| | | September 30, 2024 | | | March 31, | | | March 31, | | | March 31, | | | March 31, | | | March 31, | |
| Class I (SYMIX) | | (Unaudited) | | | 2024 | | | 2023 | | | 2022 | | | 2021 | | | 2020 (1) | |
| Net asset value, beginning of period | | $ | 12.13 | | | $ | 11.30 | | | $ | 12.75 | | | $ | 11.44 | | | $ | 9.75 | | | $ | 11.28 | |
| Activity from investment operations: | | | | | | | | | | | | | | | | | | | | | | | | |
| Net investment income (loss) (2) | | | 0.11 | | | | 0.23 | | | | 0.08 | | | | (0.04 | ) | | | (0.02 | ) | | | 0.07 | |
| Net realized and unrealized gain (loss) on investments | | | 0.23 | | | | 0.84 | | | | (0.40 | ) | | | 1.38 | | | | 1.89 | | | | (1.33 | ) (12) |
| Total from investment operations | | | 0.34 | | | | 1.07 | | | | (0.32 | ) | | | 1.34 | | | | 1.87 | | | | (1.26 | ) |
| Less distributions from: | | | | | | | | | | | | | | | | | | | | | | | | |
| Net investment income | | | — | | | | (0.24 | ) | | | (1.00 | ) | | | (0.03 | ) | | | (0.18 | ) | | | (0.27 | ) |
| Net realized gains | | | — | | | | — | | | | (0.13 | ) | | | — | | | | — | | | | — | |
| Total distributions | | | — | | | | (0.24 | ) | | | (1.13 | ) | | | (0.03 | ) | | | (0.18 | ) | | | (0.27 | ) |
| Net asset value, end of period | | $ | 12.47 | | | $ | 12.13 | | | $ | 11.30 | | | $ | 12.75 | | | $ | 11.44 | | | $ | 9.75 | |
| Total return (3)(11) | | | 2.80 | % | | | 9.57 | % | | | (2.65 | )% | | | 11.74 | % | | | 19.37 | % | | | (11.47 | )% |
| Net assets, at end of period (000s) | | $ | 40,140 | | | $ | 39,785 | | | $ | 48,961 | | | $ | 34,898 | | | $ | 36,619 | | | $ | 30,845 | |
| Ratio of gross expenses to average net assets before expense reimbursement (4)(10) | | | 1.96 | % (9) | | | 1.92 | % (8) | | | 1.70 | % | | | 2.12 | % (7) | | | 2.38 | % (6) | | | 2.26 | % (5) |
| Ratio of net expenses to average net assets after expense reimbursement (10) | | | 1.60 | % (9) | | | 1.60 | % (8) | | | 1.60 | % | | | 1.76 | % (7) | | | 2.01 | % (6) | | | 2.00 | % (5) |
| Ratio of net investment income (loss) to average net assets (10) | | | 1.91 | % (9) | | | 1.98 | % (8) | | | 0.71 | % | | | (0.29 | )% (7) | | | (0.21 | )% (6) | | | 0.96 | % (5) |
| Portfolio Turnover Rate (11) | | | 130 | % | | | 329 | % | | | 362 | % | | | 189 | % | | | 121 | % | | | 133 | % |
| (1) | AlphaCentric Symmetry Strategy Fund Class I commenced operations on September 1, 2014 and does not include performance prior to August 8, 2019 when Class I shares were previously shares of a private fund. |
| (2) | Per share amounts calculated using the average shares method. |
| (3) | Total return in the above table is historical in nature and represents the rate that the investor would have earned or lost on an investment in the Fund assuming reinvestment of dividends and capital gain distributions, if any, and does not reflect the impact of sales charges. Had the adviser not waived a portion of the Fund’s expenses, total returns would have been lower. |
| (4) | Represents the ratio of expenses to average net assets absent fee waivers and/or expense reimbursements by the adviser. |
| (5) | Includes 0.01% for the period ended March 31, 2020 attributable to margin expense on futures, which is not subject to waiver by the adviser. |
| (6) | Includes 0.02% for the year ended March 31, 2021 attributable to margin expense on futures, which is not subject to waiver by the adviser. |
| (7) | Includes 0.02% for the year ended March 31, 2022 attributable to margin expense on futures, which is not subject to waiver by the adviser. |
| (8) | Includes 0.00% for the year ended March 31, 2024 attributed to borrowing costs (line of credit fees) which are not subject to waiver by the adviser. |
| (9) | Includes 0.00% for the six months ended September 30, 2024 attributed to borrowing costs (line of credit fees) which are not subject to waiver by the adviser. |
| (10) | Annualized for periods less than one year. |
| (11) | Not annualized for periods less than one year. |
| (12) | As required by SEC standard per share calculation methodology, this represents a rebalancing figure derived from other amounts in the financial highlights tables that captures all other changes affecting net asset value per share. This per share gain amount does not correlate to the aggregrate of the net realized and unrealized loss in the Statement of Operations for the period ended March 31, 2020, primarily due to the timing of sales and repurchases of the Fund’s shares in relation to fluctuating market values of the Fund’s |
See accompanying notes to financial statements.
| AlphaCentric Life Sciences and Healthcare Fund |
| FINANCIAL HIGHLIGHTS |
Per Share Data and Ratios for a Share of Beneficial Interest Outstanding Throughout Each Period Presented
| | | Six Months Ended | | | Year Ended | | | Year Ended | | | Year Ended | | | Year Ended | | | Period Ended | |
| | | September 30, 2024 | | | March 31, | | | March 31, | | | March 31, | | | March 31, | | | March 31, | |
| Class A (LYFAX) | | (Unaudited) | | | 2024 | | | 2023 | | | 2022 | | | 2021 | | | 2020 (1) | |
| Net asset value, beginning of period | | $ | 12.73 | | | $ | 13.18 | | | $ | 13.38 | | | $ | 15.56 | | | $ | 9.55 | | | $ | 10.00 | |
| Activity from investment operations: | | | | | | | | | | | | | | | | | | | | | | | | |
| Net investment loss (2) | | | (0.04 | ) | | | (0.08 | ) | | | (0.09 | ) | | | (0.21 | ) | | | (0.19 | ) | | | (0.04 | ) |
| Net realized and unrealized gain (loss) on investments | | | 1.02 | | | | (0.03 | ) | | | 0.44 | | | | (0.32 | ) | | | 6.55 | | | | (0.41 | ) |
| Total from investment operations | | | 0.98 | | | | (0.11 | ) | | | 0.35 | | | | (0.53 | ) | | | 6.36 | | | | (0.45 | ) |
| Less distributions from: | | | | | | | | | | | | | | | | | | | | | | | | |
| Net investment income | | | — | | | | — | | | | — | | | | (0.07 | ) | | | — | | | | — | |
| Net realized gains | | | — | | | | (0.34 | ) | | | (0.55 | ) | | | (1.58 | ) | | | (0.35 | ) | | | — | |
| Total distributions | | | — | | | | (0.34 | ) | | | (0.55 | ) | | | (1.65 | ) | | | (0.35 | ) | | | — | |
| Net asset value, end of period | | $ | 13.71 | | | $ | 12.73 | | | $ | 13.18 | | | $ | 13.38 | | | $ | 15.56 | | | $ | 9.55 | |
| Total return (3)(9) | | | 7.70 | % | | | (0.79 | )% | | | 3.00 | % | | | (2.74 | )% | | | 66.70 | % | | | (4.50 | )% |
| Net assets, at end of period (000s) | | $ | 6,950 | | | $ | 6,622 | | | $ | 3,786 | | | $ | 1,815 | | | $ | 1,300 | | | $ | 10 | (10) |
| Ratio of gross expenses to average net assets before expense reimbursement (4)(8) | | | 2.00 | % | | | 1.90 | % | | | 2.00 | % (7) | | | 2.11 | % (6) | | | 2.78 | % (5) | | | 24.39 | % |
| Ratio of net expenses to average net assets after expense reimbursement (8) | | | 1.65 | % | | | 1.65 | % | | | 1.65 | % (7) | | | 1.66 | % (6) | | | 1.66 | % (5) | | | 1.65 | % |
| Ratio of net investment loss to average net assets (8) | | | (0.69 | )% | | | (0.62 | )% | | | (0.71 | )% (7) | | | (1.46 | )% (6) | | | (1.21 | )% (5) | | | (0.48 | )% |
| Portfolio Turnover Rate (9) | | | 80 | % | | | 134 | % | | | 142 | % | | | 167 | % | | | 141 | % | | | 215 | % |
| (1) | The AlphaCentric Life Sciences and Healthcare Fund Class A commenced operations on November 29, 2019. |
| (2) | Per share amounts calculated using the average shares method. |
| (3) | Total return in the above table is historical in nature and represents the rate that the investor would have earned or lost on an investment in the Fund assuming reinvestment of dividends and capital gain distributions, if any, and does not reflect the impact of sales charges. Had the adviser not waived and reimbursed a portion of the Fund’s expenses, total returns would have been lower. |
| (4) | Represents the ratio of expenses to average net assets absent fee waivers and/or expense reimbursements by the adviser. |
| (5) | Includes 0.01% for the year ended March 31, 2021 attributable to extraordinary expenses which are not subject to waiver by the adviser. |
| (6) | Includes 0.01% for the year ended March 31, 2022 attributed to line of credit fees which are not subject to waiver by the adviser. |
| (7) | Includes 0.00% for the year ended March 31, 2023 attributed to line of credit fees which are not subject to waiver by the adviser. |
| (8) | Annualized for periods less than one year. |
| (9) | Not annualized for periods less than one year. |
| (10) | Actual net assets, not truncated. |
See accompanying notes to financial statements.
| AlphaCentric Life Sciences and Healthcare Fund |
| FINANCIAL HIGHLIGHTS |
Per Share Data and Ratios for a Share of Beneficial Interest Outstanding Throughout Each Period Presented
| | | Six Months Ended | | | Year Ended | | | Year Ended | | | Year Ended | | | Year Ended | | | Period Ended | |
| | | September 30, 2024 | | | March 31, | | | March 31, | | | March 31, | | | March 31, | | | March 31, | |
| Class C (LYFCX) | | (Unaudited) | | | 2024 | | | 2023 | | | 2022 | | | 2021 | | | 2020 (1) | |
| Net asset value, beginning of period | | $ | 12.47 | | | $ | 13.01 | | | $ | 13.31 | | | $ | 15.53 | | | $ | 9.55 | | | $ | 10.00 | |
| Activity from investment operations: | | | | | | | | | | | | | | | | | | | | | | | | |
| Net investment loss (2) | | | (0.09 | ) | | | (0.16 | ) | | | (0.18 | ) | | | (0.32 | ) | | | (0.32 | ) | | | (0.06 | ) |
| Net realized and unrealized gain (loss) on investments | | | 1.00 | | | | (0.04 | ) | | | 0.43 | | | | (0.32 | ) | | | 6.65 | | | | (0.39 | ) |
| Total from investment operations | | | 0.91 | | | | (0.20 | ) | | | 0.25 | | | | (0.64 | ) | | | 6.33 | | | | (0.45 | ) |
| Less distributions from: | | | | | | | | | | | | | | | | | | | | | | | | |
| Net realized gains | | | — | | | | (0.34 | ) | | | (0.55 | ) | | | (1.58 | ) | | | (0.35 | ) | | | — | |
| Total distributions | | | — | | | | (0.34 | ) | | | (0.55 | ) | | | (1.58 | ) | | | (0.35 | ) | | | — | |
| Net asset value, end of period | | $ | 13.38 | | | $ | 12.47 | | | $ | 13.01 | | | $ | 13.31 | | | $ | 15.53 | | | $ | 9.55 | |
| Total return (3)(9) | | | 7.30 | % | | | (1.50 | )% | | | 2.26 | % | | | (3.54 | )% | | | 66.38 | % | | | (4.50 | )% |
| Net assets, at end of period (000s) | | $ | 2,250 | | | $ | 2,157 | | | $ | 709 | | | $ | 302 | | | $ | 215 | | | $ | 10 | (10) |
| Ratio of gross expenses to average net assets before expense reimbursement (4)(8) | | | 2.75 | % | | | 2.65 | % | | | 2.75 | % (7) | | | 2.86 | % (6) | | | 3.53 | % (5) | | | 25.14 | % |
| Ratio of net expenses to average net assets after expense reimbursement (8) | | | 2.40 | % | | | 2.40 | % | | | 2.40 | % (7) | | | 2.41 | % (6) | | | 2.41 | % (5) | | | 2.40 | % |
| Ratio of net investment loss to average net assets (8) | | | (1.44 | )% | | | (1.30 | )% | | | (1.49 | )% (7) | | | (2.21 | )% (6) | | | (1.96 | )% (5) | | | (1.23 | )% |
| Portfolio Turnover Rate (9) | | | 80 | % | | | 134 | % | | | 142 | % | | | 167 | % | | | 141 | % | | | 215 | % |
| (1) | The AlphaCentric Life Sciences and Healthcare Fund Class C commenced operations on November 29, 2019. |
| (2) | Per share amounts calculated using the average shares method. |
| (3) | Total return in the above table is historical in nature and represents the rate that the investor would have earned or lost on an investment in the Fund assuming reinvestment of dividends and capital gain distributions, if any, and does not reflect the impact of sales charges. Had the adviser not waived and reimbursed a portion of the Fund’s expenses, total returns would have been lower. |
| (4) | Represents the ratio of expenses to average net assets absent fee waivers and/or expense reimbursements by the adviser. |
| (5) | Includes 0.01% for the year ended March 31, 2021 attributable to extraordinary expenses which are not subject to waiver by the adviser. |
| (6) | Includes 0.01% for the year ended March 31, 2022 attributed to line of credit fees which are not subject to waiver by the adviser. |
| (7) | Includes 0.00% for the year ended March 31, 2023 attributed to line of credit fees which are not subject to waiver by the adviser. |
| (8) | Annualized for periods less than one year. |
| (9) | Not annualized for periods less than one year. |
| (10) | Actual net assets, not truncated. |
See accompanying notes to financial statements.
| AlphaCentric Life Sciences and Healthcare Fund |
| FINANCIAL HIGHLIGHTS |
Per Share Data and Ratios for a Share of Beneficial Interest Outstanding Throughout Each Period Presented
| | | Six Months Ended | | | Year Ended | | | Year Ended | | | Year Ended | | | Year Ended | | | Period Ended | |
| | | September 30, 2024 | | | March 31, | | | March 31, | | | March 31, | | | March 31, | | | March 31, | |
| Class I (LYFIX) | | (Unaudited) | | | 2024 | | | 2023 | | | 2022 | | | 2021 | | | 2020 (1) | |
| Net asset value, beginning of period | | $ | 12.83 | | | $ | 13.25 | | | $ | 13.42 | | | $ | 15.59 | | | $ | 9.55 | | | $ | 10.00 | |
| Activity from investment operations: | | | | | | | | | | | | | | | | | | | | | | | | |
| Net investment loss (2) | | | (0.03 | ) | | | (0.06 | ) | | | (0.06 | ) | | | (0.18 | ) | | | (0.14 | ) | | | (0.01 | ) |
| Net realized and unrealized gain (loss) on investments | | | 1.04 | | | | (0.02 | ) | | | 0.44 | | | | (0.31 | ) | | | 6.53 | | | | (0.44 | ) |
| Total from investment operations | | | 1.01 | | | | (0.08 | ) | | | 0.38 | | | | (0.49 | ) | | | 6.39 | | | | (0.45 | ) |
| Less distributions from: | | | | | | | | | | | | | | | | | | | | | | | | |
| Net investment income | | | — | | | | — | | | | — | | | | (0.10 | ) | | | (0.00 | ) (5) | | | — | |
| Net realized gains | | | — | | | | (0.34 | ) | | | (0.55 | ) | | | (1.58 | ) | | | (0.35 | ) | | | — | |
| Total distributions | | | — | | | | (0.34 | ) | | | (0.55 | ) | | | (1.68 | ) | | | (0.35 | ) | | | — | |
| Net asset value, end of period | | $ | 13.84 | | | $ | 12.83 | | | $ | 13.25 | | | $ | 13.42 | | | $ | 15.59 | | | $ | 9.55 | |
| Total return (3)(10) | | | 7.87 | % | | | (0.56 | )% | | | 3.22 | % | | | (2.47 | )% | | | 67.02 | % | | | (4.50 | )% |
| Net assets, at end of period (000s) | | $ | 73,713 | | | $ | 94,358 | | | $ | 75,021 | | | $ | 29,483 | | | $ | 26,404 | | | $ | 1,601 | |
| Ratio of gross expenses to average net assets before expense reimbursement (4)(9) | | | 1.75 | % | | | 1.65 | % | | | 1.75 | % (8) | | | 1.86 | % (7) | | | 2.53 | % (6) | | | 24.14 | % |
| Ratio of net expenses to average net assets after expense reimbursement (9) | | | 1.40 | % | | | 1.40 | % | | | 1.40 | % (8) | | | 1.41 | % (7) | | | 1.41 | % (6) | | | 1.40 | % |
| Ratio of net investment loss to average net assets (9) | | | (0.45 | )% | | | (0.40 | )% | | | (0.47 | )% (8) | | | (1.21 | )% (7) | | | (0.96 | )% (6) | | | (0.23 | )% |
| Portfolio Turnover Rate (10) | | | 80 | % | | | 134 | % | | | 142 | % | | | 167 | % | | | 141 | % | | | 215 | % |
| (1) | The AlphaCentric Life Sciences and Healthcare Fund Class I commenced operations on November 29, 2019. |
| (2) | Per share amounts calculated using the average shares method. |
| (3) | Total return in the above table is historical in nature and represents the rate that the investor would have earned or lost on an investment in the Fund assuming reinvestment of dividends and capital gain distributions, if any, and does not reflect the impact of sales charges. Had the adviser not waived and reimbursed a portion of the Fund’s expenses, total returns would have been lower. |
| (4) | Represents the ratio of expenses to average net assets absent fee waivers and/or expense reimbursements by the adviser. |
| (6) | Includes 0.01% for the year ended March 31, 2021 attributable to extraordinary expenses which are not subject to waiver by the adviser. |
| (7) | Includes 0.01% for the year ended March 31, 2022 attributed to line of credit fees which are not subject to waiver by the adviser. |
| (8) | Includes 0.00% for the year ended March 31, 2023 attributed to line of credit fees which are not subject to waiver by the adviser. |
| (9) | Annualized for periods less than one year. |
| (10) | Not annualized for periods less than one year. |
See accompanying notes to financial statements.
| AlphaCentric Real Income Fund |
| FINANCIAL HIGHLIGHTS |
Per Share Data and Ratios for a Share of Beneficial Interest Outstanding Throughout Each Period Presented
| | | Six Months Ended | | | Year Ended | | | Year Ended | | | Period Ended | |
| | | September 30, 2024 | | | March 31, | | | March 31, | | | March 31, | |
| Class A (SIIAX) | | (Unaudited) | | | 2024 | | | 2023 | | | 2022 (1) | |
| Net asset value, beginning of period | | $ | 16.38 | | | $ | 14.86 | | | $ | 17.67 | | | $ | 18.48 | |
| Activity from investment operations: | | | | | | | | | | | | | | | | |
| Net investment income (2) | | | 0.48 | | | | 0.83 | | | | 0.70 | | | | 0.40 | |
| Net realized and unrealized gain (loss) on investments | | | 0.81 | | | | 1.73 | | | | (2.54 | ) | | | (0.38 | ) (6) |
| Total from investment operations | | | 1.29 | | | | 2.56 | | | | (1.84 | ) | | | 0.02 | |
| Less distributions from: | | | | | | | | | | | | | | | | |
| Net investment income | | | (0.52 | ) | | | (1.04 | ) | | | (0.75 | ) | | | (0.55 | ) |
| Net realized gains | | | — | | | | — | | | | — | | | | (0.18 | ) |
| Return of capital | | | — | | | | — | | | | (0.22 | ) | | | (0.10 | ) |
| Total distributions | | | (0.52 | ) | | | (1.04 | ) | | | (0.97 | ) | | | (0.83 | ) |
| Net asset value, end of period | | $ | 17.15 | | | $ | 16.38 | | | $ | 14.86 | | | $ | 17.67 | |
| Total return (3)(10) | | | 8.04 | % | | | 17.77 | % | | | (10.58 | )% | | | 0.02 | % |
| Net assets, at end of period (000s) | | $ | 2,109 | | | $ | 1,257 | | | $ | 467 | | | $ | 246 | |
| Ratio of gross expenses to average net assets before expense reimbursement (4)(5)(9) | | | 2.35 | % | | | 2.27 | % (8) | | | 2.37 | % | | | 2.37 | % (7) |
| Ratio of net expenses to average net assets after expense reimbursement (5)(9) | | | 1.74 | % | | | 1.74 | % (8) | | | 1.74 | % | | | 1.75 | % (7) |
| Ratio of net investment income to average net assets (5)(9) | | | 5.77 | % | | | 5.21 | % (8) | | | 4.42 | % | | | 2.64 | % (7) |
| Portfolio Turnover Rate (10) | | | 9 | % | | | 44 | % | | | 22 | % | | | 20 | % |
| (1) | The AlphaCentric Real Income Fund Class A commenced operations on May 28, 2021. |
| (2) | Per share amounts calculated using the average shares method. |
| (3) | Total return in the above table is historical in nature and represents the rate that the investor would have earned or lost on an investment in the Fund assuming reinvestment of dividends and capital gain distributions, if any, and does not reflect the impact of sales charges. Had the adviser not waived and reimbursed a portion of the Fund’s expenses, total returns would have been lower. |
| (4) | Represents the ratio of expenses to average net assets absent fee waivers and/or expense reimbursements by the adviser. |
| (5) | Does not include the expenses of other investment companies in which the Fund invests. |
| (6) | The amount of net realized and unrealized gain (loss) on investments per share does not accord with the amounts in the Statements of Operations due to the timing of shareholder subscriptions and redemptions relative to fluctuating net asset values during the |
| (7) | Includes 0.01% for the period ended March 31, 2022 attributed to line of credit fees which are not subject to waiver by the adviser. |
| (8) | Includes 0.00% for the year ended March 31, 2024 attributed to borrowing costs (line of credit fees) which are not subject to waiver by the adviser. |
| (9) | Annualized for periods less than one year. |
| (10) | Not annualized for periods less than one year. |
See accompanying notes to financial statements.
| AlphaCentric Real Income Fund |
| FINANCIAL HIGHLIGHTS |
Per Share Data and Ratios for a Share of Beneficial Interest Outstanding Throughout Each Period Presented
| | | Six Months Ended | | | Year Ended | | | Year Ended | | | Period Ended | |
| | | September 30, 2024 | | | March 31, | | | March 31, | | | March 31, | |
| Class C (SIICX) | | (Unaudited) | | | 2024 | | | 2023 | | | 2022 (1) | |
| Net asset value, beginning of period | | $ | 16.34 | | | $ | 14.83 | | | $ | 17.64 | | | $ | 18.48 | |
| Activity from investment operations: | | | | | | | | | | | | | | | | |
| Net investment income (2) | | | 0.40 | | | | 0.68 | | | | 0.51 | | | | 0.21 | |
| Net realized and unrealized gain (loss) on investments | | | 0.83 | | | | 1.76 | | | | (2.47 | ) | | | (0.31) (6) | |
| Total from investment operations | | | 1.23 | | | | 2.44 | | | | (1.96 | ) | | | (0.10 | ) |
| Less distributions from: | | | | | | | | | | | | | | | | |
| Net investment income | | | (0.46 | ) | | | (0.93 | ) | | | (0.65 | ) | | | (0.47 | ) |
| Net realized gains | | | — | | | | — | | | | — | | | | (0.18 | ) |
| Return of capital | | | — | | | | — | | | | (0.20 | ) | | | (0.09 | ) |
| Total distributions | | | (0.46 | ) | | | (0.93 | ) | | | (0.85 | ) | | | (0.74 | ) |
| Net asset value, end of period | | $ | 17.11 | | | $ | 16.34 | | | $ | 14.83 | | | $ | 17.64 | |
| Total return (3)(10) | | | 7.68 | % | | | 16.88 | % | | | (11.24 | )% | | | (0.61 | )% |
| Net assets, at end of period (000s) | | $ | 2,501 | | | $ | 1,850 | | | $ | 983 | | | $ | 563 | |
| Ratio of gross expenses to average net assets before expense reimbursement(4)(5)(9) | | | 3.10 | % | | | 3.02 | % (8) | | | 3.12 | % | | | 3.12 | % (7) |
| Ratio of net expenses to average net assets after expense reimbursement (5)(9) | | | 2.49 | % | | | 2.49 | % (8) | | | 2.49 | % | | | 2.50 | % (7) |
| Ratio of net investment income to average net assets (5)(9) | | | 4.85 | % | | | 4.35 | % (8) | | | 3.26 | % | | | 1.41 | % (7) |
| Portfolio Turnover Rate (10) | | | 9 | % | | | 44 | % | | | 22 | % | | | 20 | % |
| (1) | The AlphaCentric Real Income Fund Class C commenced operations on May 28, 2021. |
| (2) | Per share amounts calculated using the average shares method. |
| (3) | Total return in the above table is historical in nature and represents the rate that the investor would have earned or lost on an investment in the Fund assuming reinvestment of dividends and capital gain distributions, if any, and does not reflect the impact of sales charges. Had the adviser not waived and reimbursed a portion of the Fund’s expenses, total returns would have been lower. |
| (4) | Represents the ratio of expenses to average net assets absent fee waivers and/or expense reimbursements by the adviser. |
| (5) | Does not include the expenses of other investment companies in which the Fund invests. |
| (6) | The amount of net realized and unrealized gain (loss) on investments per share does not accord with the amounts in the Statements of Operations due to the timing of shareholder subscriptions and redemptions relative to fluctuating net asset values during the |
| (7) | Includes 0.01% for the period ended March 31, 2022 attributed to line of credit fees which are not subject to waiver by the adviser. |
| (8) | Includes 0.00% for the year ended March 31, 2024 attributed to borrowing costs (line of credit fees) which are not subject to waiver by the adviser. |
| (9) | Annualized for periods less than one year. |
| (10) | Not annualized for periods less than one year. |
See accompanying notes to financial statements.
| AlphaCentric Real Income Fund |
| FINANCIAL HIGHLIGHTS |
Per Share Data and Ratios for a Share of Beneficial Interest Outstanding Throughout Each Period Presented
| | | Six Months Ended | | | Year Ended | | | Year Ended | | | Period Ended | |
| | | September 30, 2024 | | | March 31, | | | March 31, | | | March 31, | |
| Class I (SIIIX) | | (Unaudited) | | | 2024 | | | 2023 | | | 2022 (1) | |
| Net asset value, beginning of period | | $ | 16.41 | | | $ | 14.89 | | | $ | 17.69 | | | $ | 18.48 | |
| Activity from investment operations: | | | | | | | | | | | | | | | | |
| Net investment income (2) | | | 0.47 | | | | 0.83 | | | | 0.62 | | | | 0.35 | |
| Net realized and unrealized gain (loss) on investments | | | 0.85 | | | | 1.77 | | | | (2.42 | ) | | | (0.29 | ) (6) |
| Total from investment operations | | | 1.32 | | | | 2.60 | | | | (1.80 | ) | | | 0.06 | |
| Less distributions from: | | | | | | | | | | | | | | | | |
| Net investment income | | | (0.54 | ) | | | (1.08 | ) | | | (0.77 | ) | | | (0.56 | ) |
| Net realized gains | | | — | | | | — | | | | — | | | | (0.18 | ) |
| Return of capital | | | — | | | | — | | | | (0.23 | ) | | | (0.11 | ) |
| Total distributions | | | (0.54 | ) | | | (1.08 | ) | | | (1.00 | ) | | | (0.85 | ) |
| Net asset value, end of period | | $ | 17.19 | | | $ | 16.41 | | | $ | 14.89 | | | $ | 17.69 | |
| Total return (3)(10) | | | 7.68 | % | | | 18.00 | % | | | (10.29 | )% | | | 0.23 | % |
| Net assets, at end of period (000s) | | $ | 54,571 | | | $ | 53,708 | | | $ | 46,511 | | | $ | 45,539 | |
| Ratio of gross expenses to average net assets before expense reimbursement (4)(5)(9) | | | 2.10 | % | | | 2.02 | % (8) | | | 2.12 | % | | | 2.12 | % (7) |
| Ratio of net expenses to average net assets after expense reimbursement (5)(9) | | | 1.49 | % | | | 1.49 | % (8) | | | 1.49 | % | | | 1.50 | % (7) |
| Ratio of net investment income to average net assets (5)(9) | | | 5.73 | % | | | 5.30 | % (8) | | | 3.91 | % | | | 2.25 | % (7) |
| Portfolio Turnover Rate (10) | | | 9 | % | | | 44 | % | | | 22 | % | | | 20 | % |
| (1) | The AlphaCentric Real Income Fund Class I commenced operations on August 1, 2011 and financial highlights above does not include performance prior to May 28, 2021 when Class I shares were previously shares of a private fund. |
| (2) | Per share amounts calculated using the average shares method. |
| (3) | Total return in the above table is historical in nature and represents the rate that the investor would have earned or lost on an investment in the Fund assuming reinvestment of dividends and capital gain distributions, if any, and does not reflect the impact of sales charges. Had the adviser not waived and reimbursed a portion of the Fund’s expenses, total returns would have been lower. |
| (4) | Represents the ratio of expenses to average net assets absent fee waivers and/or expense reimbursements by the adviser. |
| (5) | Does not include the expenses of other investment companies in which the Fund invests. |
| (6) | The amount of net realized and unrealized gain (loss) on investments per share does not accord with the amounts in the Statements of Operations due to the timing of shareholder subscriptions and redemptions relative to fluctuating net asset values during the |
| (7) | Includes 0.01% for the period ended March 31, 2022 attributed to line of credit fees which are not subject to waiver by the adviser. |
| (8) | Includes 0.00% for the year ended March 31, 2024 attributed to borrowing costs (line of credit fees) which are not subject to waiver by the adviser. |
| (9) | Annualized for periods less than one year. |
| (10) | Not annualized for periods less than one year. |
See accompanying notes to financial statements.
| AlphaCentric Funds |
| NOTES TO CONSOLIDATED FINANCIAL STATEMENTS (Unaudited) |
| September 30, 2024 |
| (1) | ORGANIZATION AND SIGNIFICANT ACCOUNTING POLICIES |
Mutual Fund Series Trust (the “Trust”), was organized as an Ohio business trust on February 27, 2006. The Trust is registered as an open-end investment management company under the Investment Company Act of 1940, as amended (“1940 Act”). The Trust currently consists of thirty-five series. These financial statements include the following series: AlphaCentric Income Opportunities Fund, AlphaCentric Premium Opportunity Fund, AlphaCentric Robotics and Automation Fund, AlphaCentric Symmetry Strategy Fund, AlphaCentric Life Sciences and Healthcare Fund and AlphaCentric Real Income Fund. Each series is individually referred to as a “Fund” or collectively as the “Funds” throughout these financial statements. The AlphaCentric Symmetry Strategy Fund is registered as a non-diversified series of the Trust. The AlphaCentric Income Opportunities Fund, AlphaCentric Premium Opportunity Fund, AlphaCentric Robotics and Automation Fund, AlphaCentric Life Sciences and Healthcare Fund and AlphaCentric Real Income Fund are diversified series of the Trust. The Funds’ investment adviser is AlphaCentric Advisors, LLC (the “Adviser” or “AlphaCentric”).
AlphaCentric Income Opportunities Fund (“AIOF”), commenced operations on May 28, 2015. AIOF’s investment objective is current income. The Fund’s sub-advisor is Garrison Point Capital, LLC.
AlphaCentric Premium Opportunity Fund (“APOF”) , commenced operations as a series of the Trust on September 30, 2016. The predecessor fund of APOF Class I commenced operations on August 31, 2011, as a private investment fund. APOF’s investment objective is long-term capital appreciation.
AlphaCentric Robotics and Automation Fund (“ARAF”), commenced operations on May 31, 2017. ARAF’s investment objective is long-term capital appreciation. Effective December 1, 2018, the Fund’s sub-advisor is Contego Capital Group, Inc.
AlphaCentric Symmetry Strategy Fund (“ASSF”), class A and C commenced operations on August 8, 2019, and Class I commenced operations on September 1, 2014. ASSF’s investment objective is capital appreciation. The Fund’s sub-advisor is Mount Lucas Management LP.
AlphaCentric Life Sciences and Healthcare Fund (“ALSHF”), commenced operations on November 29, 2019. ALSHF’s investment objective is long-term capital appreciation. The Fund’s sub-advisor is LifeSci Fund Management LLC.
AlphaCentric Real Income Fund (“ARIF”), commenced operations on May 28, 2021. ARIF’s investment objective is total return through current income and capital appreciation. The Fund’s sub-advisor is Goshen Rock Capital, LLC.
Each Fund offers three classes of shares, Class A, Class C and Class I. Each share class represents an interest in the same assets of the respective Fund, has the same rights and is identical in all material respects except that (i) each class of shares may bear different distribution fees; (ii) each class of shares may be subject to different (or no) sales charges; (iii) certain other class specific expenses borne solely by the class to which such expenses are attributable; and (iv) each class has exclusive voting rights with respect to matters relating to its own distribution arrangements.
The following is a summary of significant accounting policies consistently followed by the Funds and are in accordance with accounting principles generally accepted in the United States of America (“GAAP”). Each Fund is an investment company and accordingly follows the investment company accounting and reporting guidance of the Financial Accounting Standards Board (“FASB”) Accounting Standards Codification Topic 946 - Financial Services – Investment Companies including FASB Accounting Standards Update (“ASU”) 2013-08.
a) Securities Valuation – Securities listed on an exchange are valued at the last reported sale price at the close of the regular trading session of the exchange on the business day the value is being determined, or in the case of securities listed on NASDAQ, at the NASDAQ Official Closing Price (“NOCP”). In the absence of a sale, such securities shall be valued at the last bid price on the day of valuation. Debt securities (other than short-term obligations) are valued each day by an independent pricing service approved by the Board of Trustees (the “Board”) using methods which include current market quotations from a major market maker in the securities and based on methods which include the consideration of yields or prices of securities of comparable quality, coupon, maturity and type. The Funds may invest in portfolios of open-end or closed-end investment companies (the “underlying funds”). Open-end funds are valued at their respective net asset values as reported by such investment companies. The underlying funds value securities in their portfolios for which market quotations are readily available at their market values (generally the last reported sale price) and all other securities and assets at their fair value by the methods established by the boards of the underlying funds. The shares of many closed-end investment companies, after their initial public offering, frequently trade at a price per share, which is different than the net asset value per share. The difference represents a market premium or market discount of such shares. There can be no assurances that the market discount or market premium on shares of any closed-end investment company purchased by the Funds will not change. The independent pricing service does not distinguish between smaller-sized bond positions known as “odd lots” and larger institutional-sized bond positions known as “round lots”. A Fund may fair value a particular bond if the Adviser does not believe that the round lot value provided by the independent pricing service reflects fair value of the Fund’s holding. Short-term debt obligations having 60 days or less remaining until maturity, at time of purchase, may be valued at amortized cost, provided each such valuation represent fair value. Investments in total return swap contracts are priced daily based on the underlying equity securities held in the
| AlphaCentric Funds |
| NOTES TO CONSOLIDATED FINANCIAL STATEMENTS (Unaudited)(Continued) |
| September 30, 2024 |
swap. Futures and future options are valued at the final settled price or, in the absence of a settled price, at the last sale price on the day of valuation. Options are valued at their closing price on the exchange they are traded on. When no closing price is available, options are valued at their mean price. Swap transactions are valued through an independent pricing service or at fair value based on daily price reporting from the swap counterparty issuing the swap.
Securities traded on a foreign exchange which has not closed by the valuation time or for which the official closing prices are not available at the time the net asset value (“NAV”) is determined will be valued using alternative market prices provided by a pricing service.
In certain circumstances, instead of valuing securities in the usual manner, the Funds may value securities at “fair value” as determined in good faith by the Board, pursuant to the procedures (the “Procedures”) approved by the Board. The Procedures consider, among others, the following factors to determine a security’s fair value: the nature and pricing history (if any) of the security; whether any dealer quotations for the security are available; and possible valuation methodologies that could be used to determine the fair value of the security. Fair value may also be used by the Board if extraordinary events occur after the close of the relevant world market but prior to the New York Stock Exchange close.
Exchange Traded Funds – The Funds may invest in exchange traded funds (“ETFs”). ETFs are a type of fund bought and sold on a securities exchange. An ETF trades like common stock and represents a fixed portfolio of securities. The risks of owning an ETF generally reflect the risks of owning the underlying securities they are designed to track, although the potential lack of liquidity on an ETF could result in it being more volatile. Additionally, ETFs have fees and expenses that reduce their value.
The Funds utilize various methods to measure the fair value of most of their investments on a recurring basis. GAAP establishes a hierarchy that prioritizes inputs to valuation methods. The three levels of input are:
Level 1 – Unadjusted quoted prices in active markets for identical assets and liabilities that the Funds have the ability to access.
Level 2 – Observable inputs other than quoted prices included in Level 1 that are observable for the asset or liability, either directly or indirectly. These inputs may include quoted prices for the identical instrument in an inactive market, prices for similar instruments, interest rates, prepayment speeds, credit risk, yield curves, default rates and similar data.
Level 3 – Unobservable inputs for the asset or liability, to the extent relevant observable inputs are not available, representing the Funds’ own assumptions about the assumptions a market participant would use in valuing the asset or liability, and would be based on the best information available.
The availability of observable inputs can vary from security to security and is affected by a wide variety of factors, including, for example, the type of security, whether the security is new and not yet established in the marketplace, the liquidity of markets, and other characteristics particular to the security. To the extent that valuation is based on models or inputs that are less observable or unobservable in the market, the determination of fair value requires more judgment. Accordingly, the degree of judgment exercised in determining fair value is greatest for instruments categorized in Level 3.
The inputs used to measure fair value may fall into different levels of the fair value hierarchy. In such cases, for disclosure purposes, the level in the fair value hierarchy within which the fair value measurement falls in its entirety, is determined based on the lowest level input that is significant to the fair value measurement in its entirety.
The inputs or methodology used for valuing securities are not necessarily an indication of the risk associated with investing in those securities.
The following tables summarize the inputs used as of September 30, 2024 for the Funds’ assets and liabilities measured at fair value:
| AIOF | | | | | | | | | | | | |
| Assets | | | | | | | | | | | | |
| | | | | | Level 2 | | | Level 3 | | | | |
| | | Level 1 | | | (Other Significant | | | (Unobservable | | | | |
| Security Classifications + | | (Quoted Prices) | | | Observable Inputs) | | | Inputs) | | | Totals | |
| Non-Agency Residential Mortgage Backed Securities | | $ | — | | | $ | 292,378,427 | | | $ | — | | | $ | 292,378,427 | |
| Short-Term Investment | | | 9,598,845 | | | | — | | | | — | | | | 9,598,845 | |
| Total | | $ | 9,598,845 | | | $ | 292,378,427 | | | $ | — | | | $ | 301,977,272 | |
| AlphaCentric Funds |
| NOTES TO CONSOLIDATED FINANCIAL STATEMENTS (Unaudited)(Continued) |
| September 30, 2024 |
| APOF | | | | | | | | | | | | |
| Assets | | | | | | | | | | | | |
| | | | | | Level 2 | | | Level 3 | | | | |
| | | Level 1 | | | (Other Significant | | | (Unobservable | | | | |
| Security Classifications + * | | (Quoted Prices) | | | Observable Inputs) | | | Inputs) | | | Totals | |
| U.S. Government & Agencies | | $ | — | | | $ | 22,261,386 | | | $ | — | | | $ | 22,261,386 | |
| Short-Term Investments | | | 8,897,176 | | | | — | | | | — | | | | 8,897,176 | |
| Call Options Purchased | | | 2,471,297 | | | | — | | | | — | | | | 2,471,297 | |
| Put Options Purchased | | | 245,343 | | | | — | | | | — | | | | 245,343 | |
| Unrealized Appreciation on Open Futures Contracts | | | 1,136,136 | | | | — | | | | — | | | | 1,136,136 | |
| Total | | $ | 12,749,952 | | | $ | 22,261,386 | | | $ | — | | | $ | 35,011,338 | |
| | | | | | | | | | | | | | | | | |
| Liabilities | | | | | | | | | | | | |
| | | | | | Level 2 | | | Level 3 | | | | |
| | | Level 1 | | | (Other Significant | | | (Unobservable | | | | |
| Security Classifications + * | | (Quoted Prices) | | | Observable Inputs) | | | Inputs) | | | Totals | |
| Call Options Written | | $ | 1,872,184 | | | $ | — | | | $ | — | | | $ | 1,872,184 | |
| Put Options Written | | | 102,745 | | | | — | | | | — | | | | 102,745 | |
| Unrealized Depreciation on Open Futures Contracts | | | 14,452 | | | | — | | | | — | | | | 14,452 | |
| Total | | $ | 1,989,381 | | | $ | — | | | $ | — | | | $ | 1,989,381 | |
| | | | | | | | | | | | | | | | | |
| ARAF | | | | | | | | | | | | |
| Assets | | | | | | | | | | | | |
| | | | | | Level 2 | | | Level 3 | | | | |
| | | Level 1 | | | (Other Significant | | | (Unobservable | | | | |
| Security Classifications + | | (Quoted Prices) | | | Observable Inputs) | | | Inputs) | | | Totals | |
| Common Stocks | | $ | 12,935,208 | | | $ | — | | | $ | — | | | $ | 12,935,208 | |
| Investment Purchased as Securities Lending Collateral (b) | | | — | | | | — | | | | — | | | | 3,240,513 | |
| Money Market Fund | | | 703,930 | | | | — | | | | — | | | | 703,930 | |
| Total | | $ | 13,639,138 | | | $ | — | | | $ | — | | | $ | 16,879,651 | |
| | | | | | | | | | | | | | | | | |
| ASSF | | | | | | | | | | | | |
| Assets | | | | | | | | | | | | |
| | | | | | Level 2 | | | Level 3 | | | | |
| | | Level 1 | | | (Other Significant | | | (Unobservable | | | | |
| Security Classifications (a) + * | | (Quoted Prices) | | | Observable Inputs) | | | Inputs) | | | Totals | |
| Common Stocks | | $ | 12,192,695 | | | $ | — | | | $ | — | | | $ | 12,192,695 | |
| Exchange-Traded Funds | | | 14,236,620 | | | | — | | | | — | | | | 14,236,620 | |
| U.S. Government & Agencies | | | — | | | | 6,971,454 | | | | — | | | | 6,971,454 | |
| Short-Term Investment | | | 4,064,644 | | | | — | | | | — | | | | 4,064,644 | |
| Unrealized Appreciation on Open Futures Contracts | | | 1,855,959 | | | | — | | | | — | | | | 1,855,959 | |
| Unrealized Appreciation on Swap Contracts | | | — | | | | 8,932 | | | | — | | | | 8,932 | |
| Total | | $ | 32,349,918 | | | $ | 6,980,386 | | | $ | — | | | $ | 39,330,304 | |
| | | | | | | | | | | | | | | | | |
| Liabilities | | | | | | | | | | | | |
| | | | | | Level 2 | | | Level 3 | | | | |
| | | Level 1 | | | (Other Significant | | | (Unobservable | | | | |
| Security Classifications + * | | (Quoted Prices) | | | Observable Inputs) | | | Inputs) | | | Totals | |
| Unrealized Depreciation on Open Futures Contracts | | $ | 437,321 | | | $ | — | | | $ | — | | | $ | 437,321 | |
| Unrealized Depreciation on Swap Contracts | | | — | | | | 50 | | | | — | | | | 50 | |
| Total | | $ | 437,321 | | | $ | 50 | | | $ | — | | | $ | 437,371 | |
| AlphaCentric Funds |
| NOTES TO CONSOLIDATED FINANCIAL STATEMENTS (Unaudited)(Continued) |
| September 30, 2024 |
| ALSHF | | | | | | | | | | | | |
| Assets | | | | | | | | | | | | |
| | | | | | Level 2 | | | Level 3 | | | | |
| | | Level 1 | | | (Other Significant | | | (Unobservable | | | | |
| Security Classifications + | | (Quoted Prices) | | | Observable Inputs) | | | Inputs) | | | Totals | |
| Common Stocks | | $ | 74,557,473 | | | $ | — | | | $ | — | | | $ | 74,557,473 | |
| Short-Term Investments | | | 7,319,370 | | | | — | | | | — | | | | 7,319,370 | |
| Total | | $ | 81,876,843 | | | $ | — | | | $ | — | | | $ | 81,876,843 | |
| | | | | | | | | | | | | | | | | |
| ARIF | | | | | | | | | | | | |
| Assets | | | | | | | | | | | | |
| | | | | | Level 2 | | | Level 3 | | | | |
| | | Level 1 | | | (Other Significant | | | (Unobservable | | | | |
| Security Classifications + | | (Quoted Prices) | | | Observable Inputs) | | | Inputs) | | | Totals | |
| Common Stocks | | $ | 24,340,445 | | | $ | — | | | $ | — | | | $ | 24,340,445 | |
| Preferred Stocks | | | 8,993,303 | | | | — | | | | — | | | | 8,993,303 | |
| Asset Backed Securities | | | — | | | | 7,036,394 | | | | — | | | | 7,036,394 | |
| Collateralized Mortgage Obligations | | | — | | | | 229,937 | | | | — | | | | 229,937 | |
| Convertible Bonds | | | — | | | | 2,139,269 | | | | — | | | | 2,139,269 | |
| Corporate Bonds | | | — | | | | 2,465,425 | | | | — | | | | 2,465,425 | |
| U.S. Government & Agencies | | | — | | | | 1,245,623 | | | | — | | | | 1,245,623 | |
| Short-Term Investment | | | 12,325,783 | | | | — | | | | — | | | | 12,325,783 | |
| Total | | $ | 45,659,531 | | | $ | 13,116,648 | | | $ | — | | | $ | 58,776,179 | |
| (a) | All ETFs held in the Fund are Level 1 securities. For a detailed break-out of ETFs by major index classification, please refer to the Schedules of Investments. |
| (b) | In accordance with Subtopic 820-10, certain investments that are measured at fair value using the net asset value per share (or its equivalent) have not been classified in the fair value hierarchy. The fair value amount presented in this table is intended to permit reconciliation of the fair value hierarchy to the amounts presented in the Statements of Assets and Liabilities. |
| + | See Schedules of Investments for industry classification. |
| * | Derivative instruments include cumulative net unrealized appreciation (depreciation) on futures contracts open as of September 30, 2024. |
Forward Foreign Currency Contracts – As foreign securities are purchased, a Fund generally enters into forward foreign currency exchange contracts in order to hedge against foreign currency exchange rate risks. The market value of the contract fluctuates with changes in currency exchange rates. The contract is marked-to-market daily and the change in market value is recorded by the Fund as an unrealized gain or loss. As foreign currency contracts are sold, a portion of the contract is generally closed and the Fund records a realized gain or loss equal to the difference between the value of the contract at the time it was opened and the value at the time it was closed. Realized gains and losses from contract transactions are included as a component of net realized gains (losses) from foreign currency contracts in the Statements of Operations.
Foreign Currency – Investment securities and other assets and liabilities denominated in foreign currencies are translated into U.S. dollar amounts at the date of valuation. Purchases and sales of investment securities and income and expense items denominated in foreign currencies are translated into U.S. dollar amounts on the respective dates of such transactions. Each Fund does not isolate that portion of the results of operations resulting from changes in foreign exchange rates on investments from the fluctuations arising from changes in market prices of securities held. Such fluctuations are included with the net realized and unrealized gain or loss from investments. Reported net realized foreign exchange gains or losses arise from sales of foreign currencies, currency gains or losses realized between the trade and settlement dates on securities transactions, and the difference between the amounts of dividends, interest, and foreign withholding taxes recorded on the Funds’ books and the U.S. dollar equivalent of the amounts actually received or paid. Net unrealized foreign exchange gains and losses arise from changes in the fair values of assets and liabilities, other than investments in securities at fiscal period-end, resulting from changes in exchange rates.
Futures Contracts – Each Fund may purchase and sell futures contracts. A Fund may use futures contracts to gain exposure to, or hedge against changes in the value of equities, interest rates or foreign currencies. Upon entering into a contract, a Fund deposits and maintains as collateral such initial margin as required by the exchange on which the transaction is affected. Pursuant to the contract, the Fund agrees to receive from or pay to the broker an amount of cash equal to the daily fluctuation in value of the contract. Such receipts or payments are known as “variation margin” and are recorded by the Fund as unrealized gains and losses. When the contract is closed, the Fund records a realized gain or loss equal to the difference between the value of the contract at the time it was opened and the value at the time it was closed. For the six months ended September 30, 2024, APOF and ASSF invested in futures contracts.
| AlphaCentric Funds |
| NOTES TO CONSOLIDATED FINANCIAL STATEMENTS (Unaudited)(Continued) |
| September 30, 2024 |
Swap Agreements – The Funds that invest in swaps are subject to equity price risk, interest rate risk, credit risk, currency risk, counterparty risk and/or commodity risk in the normal course of pursuing their investment objective. The Funds may enter into various swap transactions for investment purposes or to manage interest rate, equity, foreign exchange (currency), or credit risk. These would be two-party contracts entered into primarily to exchange the returns (or differentials in rates of returns) earned or realized on particular pre-determined investments or instruments.
The gross returns to be exchanged or “swapped” between parties are calculated with respect to a notional amount, i.e., the return on or increase in value of a particular dollar amount invested at a particular interest rate, in a particular foreign currency, or in a “basket” of securities representing a particular index or market segment. Changes in the value of swap agreements are recognized as unrealized gains or losses in the Statements of Operations by “marking to market” on a daily basis to reflect the value of the swap agreement at the end of each trading day. Payments received or paid at the beginning of the agreement are reflected as such on the Statements of Assets and Liabilities and may be referred to as upfront payments. The Funds amortize upfront payments and/or accrue for the fixed payment stream on swap agreements on a daily basis with the net amount recorded as a component of unrealized gain or loss on the Statements of Operations. Periodic payments and receipts and liquidation payments received or made at the termination of the swap agreement are recorded as realized gains or losses on the Statements of Operations. Entering into these agreements involves, to varying degrees, lack of liquidity and elements of credit, market, and counterparty risk in excess of amounts recognized on the Statements of Assets and Liabilities. A Fund’s maximum risk of loss from counterparty credit risk is the discounted net value of the cash flows to be received from the counterparty over the contract’s remaining life, to the extent that that amount is positive. For the six months ended September 30, 2024 only ASSF invested in swap contracts.
Accounting for Options – The Funds are subject to equity price risks in the normal course of pursuing their investment objective and may purchase or sell options to help hedge against risk. When the Funds write a call or put option, an amount equal to the premium received is included in the Statements of Assets and Liabilities as a liability. The amount of the liability is subsequently marked- to-market to reflect the current market value of the option. If an option expires on its stipulated expiration date or if the Funds enter into a closing purchase transaction, a gain or loss is realized. If a written put option is exercised, the purchase cost of the underlying security is reduced by the premium originally received. If a written call option is exercised, a gain or loss is realized for the sale of the underlying security and the proceeds from the sale are increased by the premium originally received. As writer of an option, the Funds have no control over whether the option will be exercised and, as a result, retain the market risk of an unfavorable change in the price of the security underlying the written option.
Certain Funds may purchase put and call options. Put options are purchased to hedge against a decline in the value of securities held in a Fund’s portfolio. If such a decline occurs, the put options will permit the Funds to sell the securities underlying such options at the exercise price, or to close out the options at a profit. The premium paid for a put or call option plus any transaction costs will reduce the benefit, if any, realized by the Funds upon exercise of the option, and, unless the price of the underlying security rises or declines sufficiently, the option may expire worthless to the Funds. In addition, in the event that the price of the security in connection with which an option was purchased moves in a direction favorable to the Funds, the benefits realized by the Funds as a result of such favorable movement will be reduced by the amount of the premium paid for the option and related transaction costs. Written and purchased options are non-income producing securities. With purchased options, there is minimal counterparty risk to the Funds since these options are exchange traded and the exchange’s clearinghouse, as counterparty to all exchange traded options, guarantees against a possible default. Initial margin deposits required upon entering into options contracts are satisfied by the deposits of cash as collateral for the account of the broker (the Funds’ agent in acquiring the options). For the six months ended September 30, 2024, APOF invested in options.
The derivatives are not accounted for as hedging instruments under GAAP. The effect of derivative instruments on the Statements of Assets and Liabilities at September 30, 2024 was as follows:
| | | | | | | | | Fair value of | |
| Fund | | Derivative | | Risk Type | | Location of derivatives on Statement of Assets and Liabilities | | asset/liability derivatives | |
| APOF | | | | | | | | | |
| | | Future Contracts | | Equity | | Unrealized appreciation on open futures contracts | | $ | 1,136,136 | |
| | | Future Contracts | | Equity | | Unrealized depreciation on open futures contracts | | | (14,452 | ) |
| | | | | | | Total | | $ | 1,121,684 | |
| | | | | | | | | | | |
| | | Options Purchased | | Equity | | Investments, At Value | | | 2,716,640 | |
| | | | | | | Total | | $ | 2,716,640 | |
| | | | | | | | | | | |
| | | Options Written | | Equity | | Options Written | | | 1,974,929 | |
| | | | | | | Total | | $ | 1,974,929 | |
| AlphaCentric Funds |
| NOTES TO CONSOLIDATED FINANCIAL STATEMENTS (Unaudited)(Continued) |
| September 30, 2024 |
| | | | | | | Location of derivatives on Statement of Assets and Liabilities | | Fair value of | |
| Fund | | Derivative | | Risk Type | | (Consolidated) | | asset/liability derivatives | |
| ASSF | | | | | | | | | |
| | | Credit Default Swap Contracts | | Equity | | Unrealized appreciation on swap contracts | | $ | 8,932 | |
| | | Credit Default Swap Contracts | | Equity | | Unrealized depreciation on swap contracts | | | (50 | ) |
| | | | | | | Total | | $ | 8,882 | |
| | | | | | | | | | | |
| | | Future Contracts | | Commodity | | Unrealized appreciation on open futures contracts | | $ | 633,438 | |
| | | | | Currency | | Unrealized appreciation on open futures contracts | | | 258,342 | |
| | | | | Equity | | Unrealized appreciation on open futures contracts | | | 35,617 | |
| | | | | Interest | | Unrealized appreciation on open futures contracts | | | 928,562 | |
| | | Future Contracts | | Commodity | | Unrealized depreciation on open futures contracts | | | (307,018 | ) |
| | | | | Currency | | Unrealized depreciation on open futures contracts | | | (43,302 | ) |
| | | | | Equity | | Unrealized depreciation on open futures contracts | | | (2,005 | ) |
| | | | | Interest | | Unrealized depreciation on open futures contracts | | | (84,996 | ) |
| | | | | | | Total | | $ | 1,418,638 | |
The effect of derivative instruments on the Statements of Operations for the six months ended September 30, 2024 were as follows:
| | | | | | | | | Realized and unrealized | |
| Fund | | Derivative | | Risk Type | | Location of gain (loss) on derivatives | | gain (loss) on derivatives | |
| APOF | | | | | | | | | |
| | | Future Contracts | | Equity | | Net realized gain (loss) from Futures Contracts | | $ | 92,468 | |
| | | Future Contracts | | Equity | | Net change in unrealized appreciation (depreciation) on Futures Contracts | | | 551,470 | |
| | | | | | | Total | | $ | 643,938 | |
| | | | | | | | | | | |
| | | Options Purchased | | Equity | | Net realized gain (loss) from Investments | | $ | (959,982 | ) |
| | | Options Purchased | | Equity | | Net change in unrealized appreciation (depreciation) on Investments | | | 1,298,431 | |
| | | | | | | Total | | $ | 338,449 | |
| | | | | | | | | | | |
| | | Options Written | | Equity | | Net realized gain (loss) from Options Written | | $ | 798,660 | |
| | | Options Written | | Equity | | Net change in unrealized appreciation (depreciation) on Options Written | | | (881,429 | ) |
| | | | | | | Total | | $ | (82,769 | ) |
| | | | | | | | | | | |
| | | | | | | | | Realized and unrealized | |
| Fund | | Derivative | | Risk Type | | Location of gain (loss) on derivatives (Consolidated) | | gain (loss) on derivatives | |
| ASSF | | | | | | | | | |
| | | Credit Default Swap Contracts | | Equity | | Net realized gain (loss) from Swap Contracts | | $ | 34,508 | |
| | | Credit Default Swap Contracts | | Equity | | Net change in unrealized appreciation (depreciation) on Swap Contracts | | | 8,553 | |
| | | | | | | Total | | $ | 43,061 | |
| | | | | | | | | | | |
| | | Future Contracts | | Commodity | | Net realized gain (loss) from Futures Contracts | | $ | (383,335 | ) |
| | | | | Currency | | Net realized gain (loss) from Futures Contracts | | | (278,335 | ) |
| | | | | Equity | | Net realized gain (loss) from Futures Contracts | | | 90,125 | |
| | | | | Interest | | Net realized gain (loss) from Futures Contracts | | | (406,775 | ) |
| | | | | | | Total | | $ | (978,320 | ) |
| | | | | | | | | | | |
| | | Future Contracts | | Commodity | | Net change in unrealized appreciation (depreciation) on Futures Contracts | | $ | 50,670 | |
| | | | | | | | | | | |
| | | | | Currency | | Net change in unrealized appreciation (depreciation) on Futures Contracts | | | (2,664 | ) |
| | | | | | | | | | | |
| | | | | Equity | | Net change in unrealized appreciation (depreciation) on Futures Contracts | | | 4,559 | |
| | | | | Interest | | Net change in unrealized appreciation (depreciation) on Futures Contracts | | | 773,132 | |
| | | | | | | Total | | $ | 825,697 | |
| | | | | | | | | | | |
| | | | | | | Total | | $ | (152,623 | ) |
| AlphaCentric Funds |
| NOTES TO CONSOLIDATED FINANCIAL STATEMENTS (Unaudited)(Continued) |
| September 30, 2024 |
During the six months ended September 30, 2024, APOF was subject to a master netting arrangement for the futures. The following table shows additional information regarding the offsetting of assets and liabilities at September 30, 2024.
| APOF |
| | | | | | | | | | | | | | Gross Amounts of Assets and Liabilities Not Offest in | |
| | | | | | | | | | | | | | the Statement of Assets and Liabilities | |
| | | | | Gross Amounts | | | Gross Amounts | | | | | | | | | | | | | |
| | | | | Recognized in | | | Offset in the | | | Net Amounts | | | | | | | | | | |
| | | | | the Statements | | | Statements of | | | Presented in the | | | | | | | | | | |
| | | | | of Assets and | | | Assets and | | | Statements of Assets | | | Financial | | | Cash Collateral | | | | |
| Assets: | | Counterparty | | Liabilities | | | Liabilities | | | and Liabilities | | | Instruments | | | Pledged/Received(1) | | | Net Amount | |
| Futures Contracts | | StoneX Financial Inc. | | $ | 1,136,136 | | | $ | — | | | $ | 1,136,136 | | | $ | (14,452 | ) | | $ | — | | | $ | 1,121,684 | |
| Total | | | | $ | 1,136,136 | | | $ | — | | | $ | 1,136,136 | | | $ | (14,452 | ) | | $ | — | | | $ | 1,121,684 | (2) |
| Liabilities: | | | | | | | | | | | | | | | | | | | | | | | | | | |
| Futures Contracts | | StoneX Financial Inc. | | $ | 14,452 | | | $ | — | | | $ | 14,452 | | | $ | (14,452 | ) | | $ | — | | | $ | — | |
| Total | | | | $ | 14,452 | | | $ | — | | | $ | 14,452 | | | $ | (14,452 | ) | | $ | — | | | $ | — | (2) |
| (1) | Collateral pledged is limited to the net outstanding amount due to/from one individual counterparty. The actual collateral amounts pledged may exceed these amounts and fluctuate in value. |
| (2) | Total reflects net amount offset with StoneX Financial Inc.. |
During the six months ended September 30, 2024, ASSF was subject to a master netting arrangement for the futures and swaps. The following table shows additional information regarding the offsetting of assets and liabilities at September 30, 2024.
| ASSF |
| | | | | | | | | | | | | | Gross Amounts of Assets and Liabilities Not Offset in | |
| | | | | | | | | | | | | | the Consolidated Statement of Assets and Liabilities | |
| | | | | Gross Amounts | | | | | | | | | | | | | | | | |
| | | | | Recognized in | | | Gross Amounts | | | | | | | | | | | | | |
| | | | | the | | | Offset in the | | | Net Amounts | | | | | | | | | | |
| | | | | Consolidated | | | Consolidated | | | Presented in the | | | | | | | | | | |
| | | | | Statements of | | | Statements of | | | Consolidated | | | | | | | | | | |
| | | | | Assets and | | | Assets and | | | Statements of Assets | | | Financial | | | Cash Collateral | | | | |
| Assets: | | Counterparty | | Liabilities | | | Liabilities | | | and Liabilities | | | Instruments | | | Pledged/Received(1) | | | Net Amount | |
| Futures Contracts | | Societe Generale | | $ | 1,855,959 | | | $ | — | | | $ | 1,855,959 | | | $ | (437,321 | ) | | $ | — | | | $ | 1,418,638 | |
| Swap Contracts | | Societe Generale | | | 8,932 | | | | — | | | | 8,932 | | | | (50 | ) | | | — | | | | 8,882 | |
| Total | | | | $ | 1,864,891 | | | $ | — | | | $ | 1,864,891 | | | $ | (437,371 | ) | | $ | — | | | $ | 1,427,520 | (2) |
| Liabilities: | | | | | | | | | | | | | | | | | | | | | | | | | | |
| Futures Contracts | | Societe Generale | | $ | 437,321 | | | $ | — | | | $ | 437,321 | | | $ | (437,321 | ) | | $ | — | | | $ | — | |
| Swap Contracts | | Societe Generale | | | 50 | | | | — | | | | 50 | | | | (50 | ) | | | — | | | | — | |
| Total | | | | $ | 437,371 | | | $ | — | | | $ | 437,371 | | | $ | (437,371 | ) | | $ | — | | | $ | — | (2) |
| (1) | Collateral pledged is limited to the net outstanding amount due to/from one individual counterparty. The actual collateral amounts pledged may exceed these amounts and fluctuate in value. |
| (2) | Total reflects net amount offset with Societe Generale. |
The value of derivative instruments outstanding as of September 30, 2024 as disclosed in the Schedules of Investments and the amounts realized and changes in unrealized gains and losses on derivative instruments during the six months ended September 30, 2024, as disclosed above and within the Statements of Operations serve as indicators of the volume of derivative activity for the APOF and ASSF.
b) Federal Income Tax – The Funds qualify as regulated investment companies and to comply with the applicable provisions of the Internal Revenue Code of 1986, as amended, and to distribute substantially all of their taxable income to their shareholders. Therefore, no federal income or excise tax provisions are required.
During the six months ended September 30, 2024, the Funds did not have a liability for any unrecognized tax expense. The Funds recognize interest and penalties, if any, related to unrecognized tax expense as income tax expense in the Statements of Operations as incurred. As of September 30, 2024, the Funds did not incur any interest or penalties. The Trust’s officers have analyzed the Fund’s tax positions and has
| AlphaCentric Funds |
| NOTES TO CONSOLIDATED FINANCIAL STATEMENTS (Unaudited)(Continued) |
| September 30, 2024 |
concluded that no liability for unrecognized tax benefits should be recorded related to uncertain tax positions taken on returns filed for open tax years ended March 31, 2021 to March 31, 2023, or expected to be taken in the Funds’ March 31, 2024 year-end tax returns.
c) Distribution to Shareholders – Distributions to shareholders, which are determined in accordance with income tax regulations and may differ from GAAP, are recorded on the ex-dividend date. Dividends from net investment income, if any, are declared and paid at least annually for APOF, ARAF, ASSF and ALSHF. AIOF and ARIF make monthly dividend distributions from net investment income. Distributable net realized gains, if any, are declared and distributed annually.
d) Multiple Class Allocations – Income, non-class specific expenses and realized/unrealized gains or losses are allocated to each class based on relative net assets. Expenses of the Trust that are directly identifiable to a specific Fund are charged to that Fund. Expenses, which are not readily identifiable to a specific Fund, are allocated in such a manner as deemed equitable, taking into consideration the nature and type of expense and the relative sizes of the Funds in the Trust. Distribution fees are charged to each respective share class in accordance with the distribution plan.
e) Other – Investment and shareholder transactions are recorded on the trade date. Interest income is recognized on an accrual basis. Discounts are accreted and premiums are amortized on securities purchased over the lives of the respective securities utilizing the effective interest method. Dividend income is recorded on the ex-dividend date. Realized gains or losses from sales of securities are determined by comparing the identified cost of the security lot sold with the net sales proceeds. Withholding taxes and capital gains on foreign dividends have been provided for in accordance with the Funds’ understanding of the applicable country’s tax rules and rates.
f) Use of Estimates – The preparation of financial statements in conformity with GAAP requires management to make estimates and assumptions that affect the reported amounts of assets and liabilities and disclosure of contingent assets and liabilities at the date of the financial statements and the reported amounts of increases and decreases in net assets resulting from operations during the reporting period. Actual results could differ from those estimates.
g) Commitments and Contingencies – In the normal course of business, the Trust may enter into contracts that contain a variety of representations and warranties and provide general indemnifications. The Funds’ maximum exposure under these arrangements is dependent on future claims that may be made against the Funds and, therefore, cannot be estimated; however, management considers the risk of loss from such claims to be remote.
h) Sales charges (loads) – A maximum sales charge of 5.75% is imposed on Class A shares of the APOF, ARAF, ASSF, and ALSHF. A maximum sales charge of 4.75% is imposed on Class A shares of AIOF and ARIF. Investments in Class A shares in all Funds made at or above $1 million breakpoint are not subject to an initial sales charge and may be subject to a 1.00% contingent deferred sales charge (“CDSC”) on shares redeemed within 18 months of purchase (excluding shares purchased with reinvested dividends and/or distributions). The respective shareholders pay such CDSC charges, which are not an expense of the Fund. For six months ended September 30, 2024, there were $0 CDSC fees paid.
i) Short Sales – The Funds may sell securities short. A short sale is a transaction in which the Funds sell securities they do not own in anticipation of a decline in the market price of the securities. To deliver the securities to the buyer, the Funds must arrange through a broker to borrow the securities and, in so doing, the Funds become obligated to replace the securities borrowed at their market price at the time of replacement, whatever that price may be. The Funds will make a profit or incur a loss as a result of a short sale depending on whether the price of the securities decrease or increase between the date of the short sale and the date on which the Funds purchased the securities to replace the borrowed securities that have been sold.
j) Cash and Cash Equivalents – The Funds consider their investment in a Federal Deposit Insurance Corporation (“FDIC”) insured interest bearing savings account to be cash. The Funds maintain cash balances, which, at times, may exceed federally insured limits. The Funds maintain these balances with a high quality financial institution.
Consolidation of Subsidiaries – ACSSF Fund Limited (“ASSF-CFC”) - The Consolidated Financial Statements of ASSF include the accounts of ASSF-CFC, which is a wholly-owned and controlled foreign subsidiary. ASSF consolidates the results of subsidiaries in which ASSF holds a controlling economic interest. Controlling economic interest is generally deemed to exist with investment interests comprising greater than 50% of the net asset value of the subsidiary. However, ASSF may also consider qualitative aspects of control in determining if a controlling economic interest exists. These qualitative control considerations include the nature and organizational structure of the investment, as well as ASSF’s ability to control the circumstances leading to majority ownership. All inter-company accounts and transactions have been eliminated in consolidation.
| AlphaCentric Funds |
| NOTES TO CONSOLIDATED FINANCIAL STATEMENTS (Unaudited)(Continued) |
| September 30, 2024 |
ASSF may invest up to 25% of its total assets in ASSF-CFC, which acts as an investment vehicle in order to effect certain investments consistent with ASSF’s investment objectives and policies.
A summary of ASSF’s investments in ASSF-CFC is as follows:
| | | | | Inception | | | | | | | |
| | | | | Date of | | | ASSF-CFC’s Net Assets at | | | % of Net Assets at | |
| | | | | ASSF-CFC | | | September 30, 2024 | | | September 30, 2024 | |
| | ASSF-CFC | | | 8/8/2019 | | | $ | 3,809,058 | | | 9.36% | |
ASSF-CFC utilizes commodity-based derivative products to facilitate ASSF’s pursuit of its investment objectives. In accordance with its investment objectives and through their exposure to the aforementioned commodity-based derivative products, ASSF may have increased or decreased exposure to one or more of the following risk factors defined below:
Taxation Risk – By investing in commodities indirectly through ASSF-CFC, ASSF obtains exposure to the commodities markets within the federal tax requirements that apply to ASSF.
For tax purposes, ASSF-CFC is an exempted Cayman investment company. ASSF-CFC has received an undertaking from the Government of the Cayman Islands exempting it from all local income, profits and capital gains taxes. No such taxes are levied in the Cayman Islands at the present time. For U.S. income tax purposes, ASSF-CFC is a controlled foreign corporation which generates and is allocated no income which is considered effectively connected with U.S. trade or business and as such is not subject to U.S. income tax. However, as a wholly-owned controlled foreign corporation, ASSF-CFC’s net income and capital gain, to the extent of its earnings and profits, will be included each year in the ASSF’s investment company taxable income.
| (2) | INVESTMENT TRANSACTIONS |
For the six months ended September 30, 2024, aggregate cost of purchases and proceeds from sales of investment securities (excluding short-term investments) for the Funds were as follows:
| | Fund | | Purchases | | | Sales | |
| | AIOF | | $ | 13,274,124 | | | $ | 83,897,917 | |
| | APOF | | $ | — | | | $ | — | |
| | ARAF | | $ | 3,835,842 | | | $ | 15,806,720 | |
| | ASSF | | $ | 33,844,613 | | | $ | 110,038,617 | |
| | ALSHF | | $ | 36,866,990 | | | $ | 64,735,983 | |
| | ARIF | | $ | 4,286,269 | | | $ | 11,847,512 | |
| (3) | INVESTMENT ADVISORY AGREEMENT AND OTHER RELATED PARTY TRANSACTIONS |
AlphaCentric acts as investment adviser to the Funds pursuant to the terms of the investment advisory agreement (the “Advisory Agreement”) with the Trust. Under the terms of the Advisory Agreement, the Adviser manages the investment operations of the Funds in accordance with the Funds’ investment policies and restrictions. The investment sub-advisers are responsible for the day-to-day management of their Fund’s portfolios. The Adviser provides the Funds with investment advice and supervision and furnishes an investment program for the Funds. For its investment advisory services, the Funds pay to the Adviser, as of the last day of each month, an annualized fee detailed in the table below. Such fees are computed daily based upon daily average net assets of the respective Fund. The Adviser pays expenses incurred by it in connection with acting as investment adviser to the Funds other than costs (including taxes and brokerage commissions, borrowing costs, costs of investing in underlying funds and extraordinary expenses, if any) of securities purchased for the Funds and certain other expenses paid by the Funds (as detailed in the Advisory Agreement).
| AlphaCentric Funds |
| NOTES TO CONSOLIDATED FINANCIAL STATEMENTS (Unaudited)(Continued) |
| September 30, 2024 |
The Adviser and the Trust, with respect to the Funds, have entered into Expense Limitation Agreements (the “Limitation”), approved annually, under which the Adviser has contractually agreed to waive fees and/or reimburse expenses to the extent necessary to maintain total annual operating expenses (excluding brokerage costs; borrowing costs, such as (a) interest and (b) dividends on securities sold short; taxes; costs of investing in underlying funds; and extraordinary expenses) that do not exceed the expense limitation shown in the table below, which is based on each Fund’s average daily net assets.
| | | | | | | | Expense Limitation | | | | | | | | | | |
| | | | | | | | | | | | | | | | | | | | | | | Advisory Fees | |
| | | | | Advisory | | | | | | | | | | | | | | | | | | Waived/ Expenses | |
| | Fund | | | Agreement | | | Class A | | | Class C | | | Class I | | | Expires | | | Total Advisory fee | | | Reimbursed | |
| | AIOF | | | 1.30% | | | 1.74% | | | 2.49% | | | 1.49% | | | July 31, 2025 | | | $ | 1,989,142 | | | $ | 165,453 | |
| | APOF | | | 1.75% | | | 2.24% | | | 2.99% | | | 1.99% | | | July 31, 2025 | | | | 593,527 | | | | 83,667 | |
| | ARAF | | | 1.25% | | | 1.65% | | | 2.40% | | | 1.40% | | | July 31, 2025 | | | | 105,005 | | | | 95,344 | |
| | ASSF | | | 1.35% | | | 1.85% | | | 2.60% | | | 1.60% | | | July 31, 2025 | | | | 267,407 | | | | 70,942 | |
| | ALSHF | | | 1.25% | | | 1.65% | | | 2.40% | | | 1.40% | | | July 31, 2025 | | | | 544,875 | | | | 152,825 | |
| | ARIF | | | 1.50% | | | 1.74% | | | 2.49% | | | 1.49% | | | July 31, 2025 | | | | 423,289 | | | | 171,417 | |
For the six months ended September 30, 2024, the Adviser waived management fees and reimbursed expenses. The Adviser may recapture a portion of the waived and/or reimbursed amounts. The Adviser may seek reimbursement only for fees waived or expenses reimbursed by a Fund within the three years following the date the waiver and/or reimbursement was incurred if the Fund is able to make the repayment without exceeding the limitation in effect at that time of the waiver and the Limitation in effect at the time of recoupment, no later than the dates as stated below:
| | Fund | | 2025 | | | 2026 | | | 2027 | |
| | AIOF | | $ | 7,341,886 | | | $ | 3,130,818 | | | $ | 686,763 | |
| | APOF | | $ | 30,209 | | | $ | 164,482 | | | $ | 153,036 | |
| | ARAF | | $ | 170,674 | | | $ | 211,574 | | | $ | 199,793 | |
| | ASSF | | $ | 132,579 | | | $ | 48,215 | | | $ | 138,723 | |
| | ALSHF | | $ | 148,768 | | | $ | 165,498 | | | $ | 245,808 | |
| | ARIF | | $ | 132,356 | | | $ | 287,380 | | | $ | 296,073 | |
Pursuant to the Management Services Agreement between the Trust and Mfund Services LLC (“Mfund”), an affiliate of the Adviser, MFund provides the Funds with various management and legal administrative services (the “Management Services Agreement”). For these services, the Funds pay MFund an annual asset-based fee in accordance with the following schedule applied at the Fund family level (i.e., all the Funds in the Trust advised by the Advisor): 0.10% of net assets up to $50 million; 0.07% of net assets from $50 million to $100 million; 0.05% of net assets from $ 100 million to $250 million; 0.04% of net assets from $250 million to $500 million; 0.03% of net assets from $500 million to $1 billion; 0.02% of net assets from $1 billion to $5 billion; and 0.01% of assets from $5 billion and above. In addition, the Funds reimburse MFund for any reasonable out of pocket expenses incurred in the performance of its duties under the Management Services Agreement. The amounts due to MFund for the Management Services Agreement are listed in the Statements of Assets and Liabilities under “Payable to related parties” and the amounts accrued for the year are shown in the Statements of Operations under “Legal administration/management services fees.”
Pursuant to the Compliance Services Agreement, MFund provides chief compliance officer services to the Funds. For these services, the Funds pay MFund $1,200 per month for the first fund in the fund family and $400 for each additional fund; $400 for each adviser and sub-adviser; and .0025% of the assets of each Fund. In addition, the Funds reimburse MFund for any reasonable out-of-pocket expenses incurred in the performance of its duties under the Compliance Services Agreement. The amounts due to MFund for chief compliance officer services are listed in the Statements of Assets and Liabilities under “Payable to related parties” and the amounts accrued for the year are shown in the Statements of Operations under “Compliance officer fees.”
A trustee of the Trust is also the controlling member of MFund, the Adviser and Catalyst Capital Advisors, LLC (an investment adviser to other series of the Trust) and is not paid any fees directly by the Trust for serving in such capacities.
Trustees who are not “interested persons” as that term is defined in the 1940 Act (the “Independent Trustees”), are paid a quarterly retainer and receive compensation for each special board meeting and risk and compliance committee meeting. The fees paid to the Independent Trustees for their attendance at a meeting will be shared equally by the funds of the Trust in which the meeting relates. The Lead Independent Trustee of the Trust and the Chairmen of the Trust’s Audit Committee and Risk and Compliance Committee receive an additional quarterly retainer. The “interested persons” of the Trust receive no compensation from the Funds. The Trust reimburses each trustee and officer for his or her travel and other expenses related to attendance at such meetings.
Ultimus Fund Solutions, LLC (“UFS”) provides financial administration, fund accounting, and transfer agency services to the Funds pursuant to agreements with the Trust, for which it receives from each Fund: (i) basis points in decreasing amounts as assets reach certain breakpoints; and (ii) any related out-of-pocket expenses. Certain officers of the Trust are also employees of UFS and MFund, and are not paid any fees directly by the Trust for serving in such capacity.
| AlphaCentric Funds |
| NOTES TO CONSOLIDATED FINANCIAL STATEMENTS (Unaudited)(Continued) |
| September 30, 2024 |
The Trust has adopted a Master Distribution Plan pursuant to rule 12b- 1 under the 1940 Act for each class of shares, that allows the Funds to pay distribution and shareholder servicing expenses of up to 0.50% per annum for the Class A shares and up to 1.00% for the Class C shares based on average daily net assets of each class. Class A shares are currently paying 0.25% per annum of 12b-1 fees and Class C shares are currently paying 1.00% per annum of 12b-1 fees. The fee may be used for a variety of purposes, including compensating dealers and other financial service organizations for eligible services provided by those parties to the Funds and their shareholders and to reimburse Northern Lights Distributors, LLC (“NLD”) and the Adviser for distribution related expenses. Brokers may receive a 1.00% commission from NLD for the sale of Class C shares.
For the six months ended September 30, 2024, the Distributor received the following in underwriter commissions from the sale of Class A shares of the Funds:
| | | | Underwriter | |
| | Fund | | Commissions | |
| | AIOF | | $ | 4,763 | |
| | APOF | | $ | 1,069 | |
| | ARAF | | $ | 1,274 | |
| | ASSF | | $ | 290 | |
| | ALSHF | | $ | 4,854 | |
| | ARIF | | $ | 28,284 | |
Effective January 25, 2023, the trust amended the Revolving Credit Agreement and entered into a new revolving, uncommitted $125,000,000 line of credit with U.S. Bank National Association (the “2023 Revolving Credit Agreement”) that applies to all of the Funds, that expired on January 24, 2024. Borrowings under the 2023 Revolving Credit Agreement bear an interest at Prime Rate minus 1% per month. There are no fees charged on the unused portion of the line of credit. For the period January 25, 2023 through January 24, 2024, amounts outstanding to Funds under the credit facility at no time were permitted to exceed in the aggregate the lessor of (a) $125,000,000; (b) 15% gross market value of AIOF, APOF, ARAF, ASSF, ALSHF and ARIF; or (c) 33.33% of a Fund’s daily market value.
Effective January 24, 2024, the trust amended the Revolving Credit Agreement and entered into a new revolving, uncommitted $100,000,000 line of credit with U.S. Bank National Association (the “2024 Revolving Credit Agreement”) that applies to all of the Funds, that is set to expire on January 22, 2025. Borrowings under the 2024 Revolving Credit Agreement bear an interest at Prime Rate minus 1% per month. There are no fees charged on the unused portion of the line of credit. For the period January 24, 2024 through September 30, 2024, amounts outstanding to Funds under the credit facility at no time were permitted to exceed in the aggregate the lessor of (a) $100,000,000; (b) 15% gross market value of AIOF, APOF, ARAF, ASSF, ALSHF and ARIF; or (c) 33.33% of a Fund’s daily market value. APOF, ASSF, ALSHF and ARIF did not borrow during the six months ended September 30, 2024. For the six months ended September 30, 2024, amounts outstanding to AIOF and ARAF were as follows:
| | | | | Periods the line of credit | | | Interest | | | Outstanding | | | Average | | | Average | | | Maximum | | | Maximum | |
| | Fund | | | was drawn on: | | | Expense | | | Borrowings | | | Borrowings | | | Borrowings Rate | | | Borrowings | | | Borrowings Rate | |
| | AIOF | | | 4/1/2024-8/21/2024 | | | $ | 104,575 | | | $ | — | | | $ | 14,341,714 | | | 7.50% | | | $ | 29,750,000 | | | 7.50% | |
| | ARAF | | | 5/3/2024-5/31/2024 | | | | 8,985 | | | | — | | | | 1,597,333 | | | 7.50% | | | | 2,500,000 | | | 7.50% | |
The beneficial ownership, either directly or indirectly, of more than 25% of the voting securities of a Fund creates presumption of the control of the Fund, under section 2(a)(9) of the 1940 Act. As of September 30, 2024, Charles Schwab owned 38.2% of AIOF. LPL Financial owned 29.2% of APOF. National Financial Services LLC owned 50.8% of ARAF. Hartz Capital Investments LLC owned 70.5% of ASSF. Charles Schwab owned 35.4% of ALSHF. The Trust has no knowledge as to whether all or any portion of the shares owned of record by Hartz Capital Investments LLC, Charles Schwab & Co. Inc., and National Financial Services LLC are also owned beneficially.
| AlphaCentric Funds |
| NOTES TO CONSOLIDATED FINANCIAL STATEMENTS (Unaudited)(Continued) |
| September 30, 2024 |
| (6) | DISTRIBUTIONS TO SHAREHOLDERS AND TAX COMPONENTS TO CAPITAL |
The tax character of fund distributions paid for the period ended March 31, 2024 (for the tax period-ended November 30, 2023 for the AlphaCentric Income Opportunities Fund) and March 31, 2023 (for the tax period-ended November 30, 2022 for the AlphaCentric Income Opportunities Fund) was as follows:
| For the period ended March 31, 2024: |
| |
| | | Ordinary | | | Long-Term | | | Return | | | Tax-Exempt | | | | |
| Portfolio | | Income | | | Capital Gains | | | of Capital | | | Income | | | Total | |
| AlphaCentric Income Opportunities Fund | | $ | 19,949,538 | | | $ | — | | | $ | 18,596,048 | | | $ | — | | | $ | 38,545,586 | |
| AlphaCentric Premium Opportunity Fund | | | — | | | | — | | | | — | | | | — | | | | — | |
| AlphaCentric Robotics and Automation Fund | | | — | | | | — | | | | — | | | | — | | | | — | |
| AlphaCentric Symmetry Strategy Fund | | | 792,289 | | | | — | | | | — | | | | — | | | | 792,289 | |
| AlphaCentric LifeSci Healthcare Fund | | | 2,693,130 | | | | — | | | | — | | | | — | | | | 2,693,130 | |
| AlphaCentric Strategic Income Fund | | | 2,952,718 | | | | 850,799 | | | | — | | | | — | | | | 3,803,517 | |
| | | | | | | | | | | | | | | | | | | | | |
| For the period ended March 31, 2023: |
| |
| | | Ordinary | | | Long-Term | | | Return | | | Tax-Exempt | | | | |
| Portfolio | | Income | | | Capital Gains | | | of Capital | | | Income | | | Total | |
| AlphaCentric Income Opportunities Fund | | $ | 47,153,857 | | | $ | — | | | $ | 40,594,714 | | | $ | — | | | $ | 87,748,571 | |
| AlphaCentric Premium Opportunity Fund | | | — | | | | — | | | | — | | | | — | | | | — | |
| AlphaCentric Robotics and Automation Fund | | | — | | | | 1,539,010 | | | | — | | | | — | | | | 1,539,010 | |
| AlphaCentric Symmetry Strategy Fund | | | 4,190,411 | | | | 561,388 | | | | — | | | | — | | | | 4,751,799 | |
| AlphaCentric LifeSci Healthcare Fund | | | 2,198,833 | | | | — | | | | — | | | | — | | | | 2,198,833 | |
| AlphaCentric Strategic Income Fund | | | 1,811,372 | | | | 363,940 | | | | 710,339 | | | | — | | | | 2,885,651 | |
As of each Fund’s tax year-ended of March 31, 2024 (for the tax period-ended November 30, 2023, for the AlphaCentric Income Opportunities Fund), the components of accumulated earnings/(deficit) on a tax basis were as follows:
| | | Undistributed | | | Undistributed | | | Undistributed | | | Post October Loss | | | Capital Loss | | | Other | | | Unrealized | | | Total | |
| | | Ordinary | | | Ordinary | | | Long-Term | | | and | | | Carry | | | Book/Tax | | | Appreciation/ | | | Accumulated | |
| Portfolio | | Tax-Exempt Income | | | Income | | | Capital Gains | | | Late Year Loss | | | Forwards | | | Differences | | | (Depreciation) | | | Earnings/(Deficits) | |
| AlphaCentric Income Opportunities Fund | | $ | — | | | $ | — | | | $ | — | | | $ | — | | | $ | (340,976,531 | ) | | $ | — | | | $ | 50,850,974 | | | $ | (290,125,557 | ) |
| AlphaCentric Premium Opportunity Fund | | | — | | | | 1,377,753 | | | | — | | | | — | | | | (3,024,578 | ) | | | — | | | | 120,512 | | | | (1,526,313 | ) |
| AlphaCentric Robotics and Automation Fund | | | — | | | | — | | | | — | | | | (1,559,877 | ) | | | (4,299,806 | ) | | | — | | | | 4,891,021 | | | | (968,662 | ) |
| AlphaCentric Symmetry Strategy Fund | | | — | | | | — | | | | — | | | | (222,586 | ) | | | (3,310,262 | ) | | | 275,750 | | | | 2,428,215 | | | | (828,883 | ) |
| AlphaCentric LifeSci Healthcare Fund | | | — | | | | — | | | | — | | | | (1,842,585 | ) | | | — | | | | — | | | | (7,604,889 | ) | | | (9,447,474 | ) |
| AlphaCentric Strategic Income Fund | | | — | | | | — | | | | — | | | | (8,012 | ) | | | — | | | | — | | | | (1,236,358 | ) | | | (1,244,370 | ) |
The difference between book basis and tax basis undistributed net investment income, accumulated net realized gains, and unrealized appreciation(depreciation) from investments is primarily attributable to the tax deferral of losses on wash sales, mark-to-market on open 1256 futures and options, swaps, and passive foreign investment companies, and adjustments for partnerships, and the ASSF Fund’s wholly owned subsidiary.
The unrealized appreciation in the table above includes unrealized foreign currency gains (losses) of $340, $(714) and $(336) for AlphaCentric Robotics and Automation Fund, AlphaCentric Symmetry Strategy Fund and AlphaCentric Life Sciences and Healthcare Fund, respectively
Late year losses incurred after December 31 within the fiscal year are deemed to arise on the first business day of the following fiscal year for tax purposes. The Funds incurred and elected to defer such late year losses as follows:
| | | Late Year | |
| Portfolio | | Losses | |
| AlphaCentric Income Opportunities Fund | | $ | — | |
| AlphaCentric Premium Opportunity Fund | | | — | |
| AlphaCentric Robotics and Automation Fund | | | 112 | |
| AlphaCentric Symmetry Strategy Fund | | | 222,586 | |
| AlphaCentric LifeSci Healthcare Fund | | | 63,689 | |
| AlphaCentric Strategic Income Fund | | | 8,012 | |
| AlphaCentric Funds |
| NOTES TO CONSOLIDATED FINANCIAL STATEMENTS (Unaudited)(Continued) |
| September 30, 2024 |
Capital losses incurred after October 31 within the fiscal year are deemed to arise on the first business day of the following fiscal year for tax purposes. The Funds incurred and elected to defer such capital losses as follows:
| | | Post October | |
| Portfolio | | Losses | |
| AlphaCentric Income Opportunities Fund | | $ | — | |
| AlphaCentric Premium Opportunity Fund | | | — | |
| AlphaCentric Robotics and Automation Fund | | | 1,559,765 | |
| AlphaCentric Symmetry Strategy Fund | | | — | |
| AlphaCentric LifeSci Healthcare Fund | | | 1,778,896 | |
| AlphaCentric Strategic Income Fund | | | — | |
At March 31, 2024, the Funds (for the tax period-ended November 30, 2023, for the AlphaCentric Income Opportunities Fund) had capital loss carry forwards for federal income tax purposes available to offset future capital gains and capital loss carry forwards utilized as follows:
| Portfolio | | Short-Term | | | Long-Term | | | Total | | | CLCF Utilized | |
| AlphaCentric Income Opportunities Fund | | $ | 340,976,531 | | | $ | — | | | $ | 340,976,531 | | | $ | 28,112,858 | |
| AlphaCentric Premium Opportunity Fund | | | 1,288,851 | | | | 1,735,727 | | | | 3,024,578 | | | | 9,236,458 | |
| AlphaCentric Robotics and Automation Fund | | | 3,404,941 | | | | 894,865 | | | | 4,299,806 | | | | — | |
| AlphaCentric Symmetry Strategy Fund | | | 702,356 | | | | 2,607,906 | | | | 3,310,262 | | | | — | |
| AlphaCentric LifeSci Healthcare Fund | | | — | | | | — | | | | — | | | | — | |
| AlphaCentric Strategic Income Fund | | | — | | | | — | | | | — | | | | — | |
Permanent book and tax differences, primarily attributable to the book/tax basis treatment of net operating losses, distributions in excess, and the ASSF Fund’s wholly owned subsidiary, resulted in reclassifications for the Funds for the year ended March 31, 2024 (except for the AlphaCentric Income Opportunities Fund in which its tax period-ended November 30, 2023 has been adjusted for March 31, 2024 activity) as follows:
| | | Paid | | | | |
| | | In | | | Accumulated | |
| Portfolio | | Capital | | | Earnings (Losses) | |
| AlphaCentric Income Opportunities Fund | | $ | (10,443,844 | ) | | $ | 10,443,844 | |
| AlphaCentric Premium Opportunity Fund | | | — | | | | — | |
| AlphaCentric Robotics and Automation Fund | | | (66,164 | ) | | | 66,164 | |
| AlphaCentric Symmetry Strategy Fund | | | 433,669 | | | | (433,669 | ) |
| AlphaCentric LifeSci Healthcare Fund | | | (121,518 | ) | | | 121,518 | |
| AlphaCentric Strategic Income Fund | | | — | | | | — | |
| (7) | AGGREGATE UNREALIZED APPRECIATION AND DEPRECIATION – TAX BASIS |
| | | | | | | | | | | | Tax Net Unrealized | |
| | | Cost for Federal | | | Unrealized | | | Unrealized | | | Appreciation/ | |
| Portfolio | | Tax purposes | | | Appreciation | | | Depreciation | | | (Depreciation) | |
| AlphaCentric Income Opportunities Fund | | $ | 235,526,466 | | | $ | 80,084,377 | | | $ | (13,633,571 | ) | | $ | 66,450,806 | |
| AlphaCentric Premium Opportunity Fund | | | 32,265,485 | | | | 2,471,555 | | | | (2,851,219 | ) | | | (379,664 | ) |
| AlphaCentric Robotics and Automation Fund | | | 17,449,027 | | | | 2,640,019 | | | | (3,209,395 | ) | | | (569,376 | ) |
| AlphaCentric Symmetry Strategy Fund | | | 35,534,177 | | | | 4,218,116 | | | | (765,899 | ) | | | 3,452,217 | |
| AlphaCentric Life Sciences and Healthcare Fund | | | 82,486,654 | | | | 10,213,718 | | | | (10,823,529 | ) | | | (609,811 | ) |
| AlphaCentric Real Income Fund | | | 59,176,890 | | | | 3,449,599 | | | | (3,850,310 | ) | | | (400,711 | ) |
The Funds in the normal course of business make investments in financial instruments and derivatives where the risk of potential loss exists due to changes in the market or failure or inability of the counterparty to a transaction to perform. See below for a detailed description of select principal risks.
| AlphaCentric Funds |
| NOTES TO CONSOLIDATED FINANCIAL STATEMENTS (Unaudited)(Continued) |
| September 30, 2024 |
Each underlying fund, including each ETF, is subject to specific risks, depending on the nature of the underlying fund. These risks could include liquidity risk, sector risk, foreign and related currency risk, as well as risks associated with real estate investments and commodities. Investors in the Funds will indirectly bear fees and expenses charged by the underlying investment companies in which the Funds invest in addition to the Funds’ direct fees and expenses.
Wholly-Owned Subsidiary Risk: ASSF-CFC is not registered under the 1940 Act and is not be subject to all of the investor protections of the 1940 Act. Changes in the laws of the United States and/or the Cayman Islands, under which ASSF and ASSF-CFC, respectively, are organized, could result in the inability of ASSF and/or ASSF-CFC to operate as described in the Prospectus and could negatively affect ASSF and their shareholders. Your cost of investing in ASSF will be higher because you indirectly bear the expenses of ASSF-CFC.
Credit Risk: There is a risk that issuers and counterparties will not make payments on securities and other investments held by a Fund, resulting in losses to the Fund. In addition, the credit quality of securities held by a Fund may be lowered if an issuer’s financial condition changes. Lower credit quality may lead to greater volatility in the price of a security and in shares of the Fund. Lower credit quality also may affect liquidity and make it difficult for a Fund to sell the security. The Funds may invest, directly or indirectly, in high yield fixed-income securities (also known as “junk bonds”), which are considered speculative with respect to the issuer’s capacity to pay interest and repay principal in accordance with the terms of the obligations. This means that, compared to issuers of higher rated securities, issuers of medium and lower rated securities are less likely to have the capacity to pay interest and repay principal when due in the event of adverse business, financial or economic conditions and/or may be in default or not current in the payment of interest or principal. The market values of medium- and lower-rated securities tend to be more sensitive to company-specific developments and changes in economic conditions than higher-rated securities. The companies that issue these securities often are highly leveraged, and their ability to service their debt obligations during an economic downturn or periods of rising interest rates may be impaired. In addition, these companies may not have access to more traditional methods of financing, and may be unable to repay debt at maturity by refinancing. The risk of loss due to default in payment of interest or principal by these issuers is significantly greater than with higher-rated securities because medium- and lower-rated securities generally are unsecured and subordinated to senior debt. Default, or the market’s perception that an issuer is likely to default, could reduce the value and liquidity of securities held by a Fund. In addition, default may cause a Fund to incur expenses in seeking recovery of principal or interest on its portfolio holdings.
Swap Counterparty Credit Risk: The Funds are subject to credit risk on the amount the Funds expect to receive from swap agreement counterparties. With certain exchange traded credit default swaps, there is minimal counterparty risk to a Fund in that the exchanges, clearinghouse, as counter party, guarantees against default.
Commodity Risk: Investing in the commodities markets may subject the Funds to greater volatility than investments in traditional securities. Commodity prices may be influenced by unfavorable weather, animal and plant disease, geologic and environmental factors as well as changes in government regulation such as tariffs, embargoes or burdensome production rules and restrictions.
Foreign Currency Risk: Currency trading risks include market risk, credit risk and country risk. Market risk results from adverse changes in exchange rates in the currencies the Fund is long or short. Credit risk results because a currency-trade counterparty may default. Country risk arises because a government may interfere with transactions in its currency.
Foreign Exchanges Risk: A portion of the derivatives trades made by the Funds may take place on foreign markets. Neither existing CFTC regulations nor regulations of any other U.S. governmental agency apply to transactions on foreign markets. Some of these foreign markets, in contrast to U.S. exchanges, are so-called principals’ markets in which performance is the responsibility only of the individual counterparty with whom the trader has entered into a commodity interest transaction and not of the exchange or clearing corporation. In these kinds of markets, there is risk of bankruptcy or other failure or refusal to perform by the counterparty.
Fixed Income Risk: When the Funds invest in fixed income securities, the value of your investment in each will fluctuate with changes in interest rates. Typically, a rise in interest rates causes a decline in the value of fixed income securities owned by the Funds. In general, the market price of fixed income securities with longer maturities will increase or decrease more in response to changes in interest rates than shorter-term securities. Other risk factors include credit risk (the debtor may default) and prepayment risk (the debtor may pay its obligation early, reducing the amount of interest payments). If the U.S. Federal Reserve’s Federal Open Market Committee (“FOMC”) raises the federal funds interest rate target, interest rates across the U.S. financial system may rise. However, the magnitude of rate changes across maturities and borrower sectors is uncertain. Rising rates may decrease liquidity and increase volatility, which may make portfolio management more difficult and costly to each Fund and its shareholders. Additionally, default risk increases if issuers must borrow at higher rates. These risks could affect the value of a particular investment by each Fund, possibly causing the Fund’s share price and total return to be reduced and fluctuate more than other types of investments.
Futures and Forwards Contract Risk: For APOF and ASSF the successful use of futures contracts draws upon the Adviser’s skill and experience with respect to such instruments and are subject to special risk considerations. The primary risks associated with the use of futures contracts are (a) the imperfect correlation between the change in market value of the instruments held by the Fund and the price of the forward or futures contract; (b) possible lack of a liquid secondary market for a forward or futures contract and the resulting inability to close a forward or
| AlphaCentric Funds |
| NOTES TO CONSOLIDATED FINANCIAL STATEMENTS (Unaudited)(Continued) |
| September 30, 2024 |
futures contract when desired; (c) losses caused by unanticipated market movements, which are potentially unlimited; (d) the Adviser’s inability to predict correctly the direction of securities prices, interest rates, currency exchange rates and other economic factors; (e) the possibility that the counterparty will default in the performance of its obligations; and (f) if the Fund has insufficient cash, it may have to sell securities from its portfolio to meet daily variation margin requirements, and the Fund may have to sell securities at a time when it may be disadvantageous to do so.
Derivatives Risk: APOF and ASSF may use derivatives (including options, futures, forwards, swaps and options on futures) to enhance returns or hedge against market declines. Each Fund’s use of derivative instruments involves risks different from, or possibly greater than, the risks associated with investing directly in securities and other traditional investments. These risks include (i) the risk that the counterparty to a derivative transaction may not fulfill its contractual obligations; (ii) risk of mispricing or improper valuation; and (iii) the risk that changes in the value of the derivative may not correlate perfectly with the underlying asset, rate or index. Derivative prices are highly volatile and may fluctuate substantially during a short period of time. Such prices are influenced by numerous factors that affect the markets, including, but not limited to: changing supply and demand relationships; government programs and policies; national and international political and economic events, changes in interest rates, inflation and deflation and changes in supply and demand relationships.
Options Risk: There are risks associated with the sale and purchase of call and put options. As the seller (writer) of a covered call option, APOF assumes the risk of a decline in the market price of the underlying security below the purchase price of the underlying security less the premium received, and gives up the opportunity for gain on the underlying security above the exercise option price. As the buyer of a put or call option, the Fund risks losing the entire premium invested in the option if the Fund does not exercise the option. As a seller (writer) of a put option, the Fund will lose money if the value of the security falls below the strike price. If unhedged, the Fund’s written calls exposes it to potentially unlimited losses.
Market Risk: Overall market risks may also affect the value of the Funds. The market values of securities or other investments owned by the Funds will go up or down, sometimes rapidly or unpredictably. Factors such as economic growth and market conditions, interest rate levels, exchange rates and political events affect the securities markets. Changes in market conditions and interest rates generally do not have the same impact on all types of securities and instruments. Unexpected local, regional or global events and their aftermath, such as war; acts of terrorism; financial, political or social disruptions; natural, environmental or man-made disasters; climate-change or climate-related events; the spread of infectious illnesses or other public health issues; recessions and depressions; or other tragedies, catastrophes and events could have a significant impact on the Funds and their investments and could result in increased premiums or discounts to a Fund’s net asset value, and may impair market liquidity, thereby increasing liquidity risk. Such events can cause investor fear and panic, which can adversely affect the economies of many companies, sectors, nations, regions and the market in general, in ways that cannot necessarily be foreseen. The Funds could lose money over short periods due to short-term market movements and over longer periods during more prolonged market downturns. During a general market downturn, multiple asset classes may be negatively affected. In times of severe market disruptions, you could lose your entire investment.
Please refer to each Fund’s prospectus for a full listing of risks associated with the investments.
ARAF has entered into a Securities Lending Agreement with the US Bank NA (“US Bank”). ARAF can lend its securities to brokers, dealers and other financial institutions approved by the Board to earn additional income. The cash collateral is invested in short-term investments as noted in the ARAF’s Schedule of Investments. ARAF also continues to receive interest or dividends on the securities loaned. Loans are collateralized at a value at least equal to 105% of the then current market value of any loaned security that are foreign, or 102% of the then current market value of any other loaned security. All interest and dividend payments received on securities which are held on loan, provided that there is no material default, will be paid to ARAF. A portion of the income generated by the investment in ARAF’s collateral, net of any rebates paid by US Bank to the borrowers is remitted to US Bank as lending agent and the remainder is paid to ARAF.
Although risk is mitigated by the collateral, the ARAF could experience a delay in recovering their securities and possible loss of income or value if the borrower fails to return them. Should the borrower of the securities fail financially, ARAF has the right to repurchase the securities using the collateral in the open market.
ARAF receives cash as collateral in return for securities lent as part of the securities lending program. The collateral is invested in the Mount Vernon Liquid Assets Portfolio, LLC of which the investment objective is to seek to maximize current income to the extent with the preservation of capital and liquidity and maintain a stable NAV of $1.00 per unit. ARAF held $3,240,513 as of September 30, 2024. The remaining contractual maturity of all securities lending transactions is overnight and continuous. ARAF is not subject to a master netting agreement with respect to securities lending; therefore no additional disclosures are required. The income earned by ARAF on investments of cash collateral received from borrowers for the securities loaned to them are reflected in the ARAF’s Statement of Operations.
| AlphaCentric Funds |
| NOTES TO CONSOLIDATED FINANCIAL STATEMENTS (Unaudited)(Continued) |
| September 30, 2024 |
The following table is a summary of the Funds’ securities loaned and related collateral which are subject to a netting agreement as of September 30, 2024:
| | | | | | | | | | | | | | | Gross Amounts Not Offset in the | |
| | | | | | | | | | | | | | | Statement of Assets & Liabilities | |
| | | | | | | | | Net Amounts of | | | | | | | | | | |
| | | | | | Gross Amounts | | | Assets | | | | | | | | | | |
| | | | | | Offset in the | | | Presented in the | | | | | | | | | | |
| | | Gross Amounts | | | Statement of | | | Statement of | | | Financial | | | Non-Cash | | | | |
| | | of Recognized | | | Assets & | | | Assets & | | | Instruments | | | Collateral | | | Net Amount of | |
| Assets: | | Assets | | | Liabilities | | | Liabilities | | | Pledged | | | Received * | | | Assets | |
| ARAF | | | | | | | | | | | | | | | | | | | | | | | | |
| Description: | | | | | | | | | | | | | | | | | | | | | | | | |
| Securities Loaned | | $ | 3,110,048 | | | $ | — | | | $ | 3,110,048 | | | | | | | $ | 3,110,048 | * | | $ | — | |
| Total | | $ | 3,110,048 | | | $ | — | | | $ | 3,110,048 | | | $ | — | | | $ | 3,110,048 | | | $ | — | |
| * | The amount is limited to the asset balance and accordingly does not include excess collateral pledged. |
The fair value of the securities loaned for ARAF totaled $3,110,048 as of September 30, 2024. The securities loaned are noted in the Schedule of Investments. The fair value of the “Collateral for Securities Loaned” on the Schedule of Investments includes cash collateral received and reinvested that totaled $3,240,513 for ARAF at September 30, 2024. This amount is offset by a liability recorded as “Payable upon return of securities loaned.” The contractual maturity of securities lending transactions is on an overnight and continuous basis. The Funds cannot pledge or resell the collateral.
On July 30, 2020, an investor in AIOF filed a putative class action in Florida state court, naming the adviser, the Trust, and others as defendants. Plaintiff alleges that AIOF misrepresented that it held no more than 15% of its assets in illiquid securities, among other things, and asserts violations of Sections I I, 12(a)(2) and 15 of the Securities Act of 1933. The Florida action was dismissed it prejudice on September 22, 2021.
On October 14, 2020, the same. Plaintiff filed a nearly identical putative class action in New York State Court against the same defendants. That complaint was amended on February 26, 2021, which added two additional defendants, including sub-advisor Garrison Point LLC. On February 16, 2023, the New York court dismissed all but one claim for failure to state a claim. The defendants believe the remaining claim is meritless and intend to contest it vigorously. An estimated $1,667,127 that is subject to insurance reimbursement in connection with this action is listed in the Statement of Assets and Liabilities for AIOF under “Due from insurance”.
Subsequent events after the date of the Statements of Assets and Liabilities have been evaluated through the date the financial statements were issued. Management has determined that no events or transactions occurred requiring adjustment or disclosure in the financial statements or than the following:
Effective November 1, 2024, the Fund’s name will change to “AlphaCentric Life Sciences and Healthcare Fund”. Also effective November 1, 2024, Kennedy Capital Management LLC (“KCM”) will replace LifeSci Fund Management LLC (“LifeSci”) as the sub-advisor of the Fund.
Effective November 1, 2024, the Fund’s name will change to “AlphaCentric Real Income Fund”. Also effective November 1, 2024, CrossingBridge Advisors, LLC (“CrossingBridge”) will replace Goshen Rock Capital, LLC (“GRC”) as the sub-advisor of the Fund.
| |
| |
| |
| |
| Mutual Fund Series Trust |
| 4221 North 203rd Street, Suite 100 |
| Elkhorn, NE 68022 |
| |
| ADVISER |
| AlphaCentric Advisors, LLC |
| 53 Palmeras Street, Suite 601 |
| San Juan, PR 00901 |
| |
| ADMINISTRATOR |
| Ultimus Fund Solutions, LLC |
| 225 Pictoria Drive, Suite 450 |
| Cincinnati, OH 45246 |
| |
| TRANSFER AGENT |
| Ultimus Fund Solutions, LLC |
| 225 Pictoria Drive, Suite 450 |
| Cincinnati, OH 45246 |
| |
| INDEPENDENT REGISTERED PUBLIC ACCOUNTING FIRM |
| Cohen & Company, Ltd. |
| 1835 Market St. |
| Suite 310 |
| Philadelphia, PA 19103 |
| |
| LEGAL COUNSEL |
| Thompson Hine LLP |
| 41 South High Street Suite 1700 |
| Columbus, OH 43215 |
| |
| CUSTODIAN BANK |
| U.S. Bank |
| 1555 N. Rivercenter Drive. Suite 302 |
| Milwaukee, WI 53212 |
| |
| |
| |
| |
| |
| |
| |
| |
| |
| |
| |
| |
Item 8. Changes in and Disagreements with Accountants for Open-End Management Investment Companies. Not applicable
Item 9. Proxy Disclosures for Open-End Management Investment Companies. Not applicable
Item 10. Remuneration Paid to Directors, Officers, and Others of Open-End Management Investment Companies. Included under Item 7 of this Form.
Item 11. Statement Regarding Basis for Approval of Investment Advisory Contract.
Not applicable.
Item 12. Disclosure of Proxy Voting Policies and Procedures for Closed-End Management Investment Companies.
Not applicable.
Item 13. Portfolio Managers of Closed-End Management Investment Companies.
Not applicable.
Item 14. Purchases of Equity Securities by Closed-End Management Investment Company and Affiliated Purchasers.
Not applicable.
Item 15. Submission of Matters to a Vote of Security Holders.
None
Item 16. Controls and Procedures.
(a) The registrant’s Principal Executive Officer and Principal Financial Officer have concluded that the registrant’s disclosure controls and procedures (as defined in Rule 30a-3(c) under the Act) are effective in design and operation and are sufficient to form the basis of the certifications required by Rule 30a-(2) under the Act, based on their evaluation of these disclosure controls and procedures as of a date within 90 days of this report on Form N-CSR.
(b) There were no changes in the registrant’s internal control over financial reporting (as defined in Rule 30a-3(d) under the Act) during the period covered by this report that have materially affected, or are reasonably likely to materially affect, the registrant’s internal control over financial reporting.
Item 17. Disclosure of Securities Lending Activities for Closed-End Management Investment Companies.
Not applicable.
Item 18. Recovery of Erroneously Awarded Compensation.
(a) Not applicable.
(b) Not applicable.
Item 19. Exhibits.
(a)(1) Not applicable.
(a)(2) Not applicable.
(a)(3) A separate certification for each principal executive officer and principal financial officer of the registrant as required by Rule 30a-2(a) under the Act (17 CFR 270.30a-2(a)): Attached hereto. Exhibit 99. CERT
(a)(4) Not applicable.
(b) Certifications required by Rule 30a-2(b) under the Act (17 CFR 270.30a-2(b)): Attached hereto Exhibit 99.906CERT
SIGNATURES
Pursuant to the requirements of the Securities Exchange Act of 1934 and the Investment Company Act of 1940, the registrant has duly caused this report to be signed on its behalf by the undersigned, thereunto duly authorized.
| (Registrant) Mutual Fund Series Trust |
| | |
| By (Signature and Title) | |
| /s/ Michael Schoonover | |
| Michael Schoonover, Principal Executive Officer/President |
Pursuant to the requirements of the Securities Exchange Act of 1934 and the Investment Company Act of 1940, this report has been signed below by the following persons on behalf of the registrant and in the capacities and on the dates indicated.
| By (Signature and Title) | |
| /s/ Michael Schoonover | |
| Michael Schoonover, Principal Executive Officer/President |
| By (Signature and Title) | |
| /s/ Erik Naviloff | |
| Erik Naviloff, Principal Financial Officer/Treasurer |