UNITED STATES
SECURITIES AND EXCHANGE COMMISSION
Washington, D.C. 20549
SECURITIES AND EXCHANGE COMMISSION
Washington, D.C. 20549
FORM N-CSR
CERTIFIED SHAREHOLDER REPORT OF REGISTERED
MANAGEMENT INVESTMENT COMPANIES
Investment Company Act file number 811-21897
Manager Directed Portfolios
(Exact name of registrant as specified in charter)
(Exact name of registrant as specified in charter)
615 East Michigan Street
Milwaukee, WI 53202
(Address of principal executive offices) (Zip code)
(Address of principal executive offices) (Zip code)
Douglas J. Neilson, President
Manager Directed Portfolios
c/o U.S. Bank Global Fund Services
811 East Wisconsin Avenue, 8th Floor
Milwaukee, WI 53202
(Name and address of agent for service)
(Name and address of agent for service)
(414) 287-3101
Registrant's telephone number, including area code
Date of fiscal year end: March 31, 2020
Date of reporting period: March 31, 2020
Item 1. Reports to Stockholders.
Pemberwick Fund
Annual Report
March 31, 2020
Pemberwick Fund
Table of Contents
Letter to Shareholders/Commentary | 3 | ||
Sector Allocation of Portfolio Assets | 6 | ||
Schedule of Investments | 7 | ||
Statement of Assets and Liabilities | 24 | ||
Statement of Operations | 25 | ||
Statements of Changes in Net Assets | 26 | ||
Financial Highlights | 27 | ||
Notes to the Financial Statements | 28 | ||
Report of Independent Registered Public Accounting Firm | 37 | ||
Expense Example | 38 | ||
Notice to Shareholders | 40 | ||
Trustees and Officers | 41 | ||
Approval of the Investment Advisory Agreement and Sub-Advisory Agreement | 44 | ||
Privacy Notice | 48 |
Pemberwick Fund (Unaudited)
We present the Pemberwick Fund annual report covering the year from April 1, 2019 through March 31, 2020. Portfolio performance information, market commentary and our outlook for the period ended March 31, 2020 follows. We encourage you to carefully review the enclosed information to stay informed.
PORTFOLIO PERFORMANCE AND MARKET REVIEW:
For the year ended March 31, 2020 Pemberwick Fund (“Pemberwick”) generated a periodic total investment return of -0.31% net of expenses. The Portfolio’s primary benchmark, the Bloomberg Barclays 1-3 Year US Government/Credit Index returned 4.53% during the same period (the benchmark index does not include expenses). Pemberwick underperformed the benchmark by 4.84% during the period from April 1, 2019 to March 31, 2020. The majority of this underperformance, 3.73%, occurred during the month of March 2020 which was a result of spreads on Pemberwick’s floating rate bonds widening out substantially due to the COVID-19 global pandemic and associated market downturn. The benchmark index holds approximately 72% Treasuries and Agencies vs. Pemberwick which holds approximately 12% Treasuries and Agencies and as such greatly outperformed Pemberwick during March 2020. Pemberwick has since outperformed the benchmark by 1.68% during the period from April 1, 2020 to April 30, 2020 as we have seen a turnaround in market sentiment. Spreads on floating rate bonds have tightened and prices have bounced off the lows largely due to the Federal Reserve’s support for the market and overall economy through various stimulus actions. Since its inception on February 1, 2010 Pemberwick has generated an annual return net of expenses of 1.14% vs. Pemberwick’s benchmark return of 1.61% for the same period (the benchmark index does not include expenses). Pemberwick’s annual return for the 5-year period from April 1, 2015 to March 31, 2020 was 0.97% net of expenses, vs. Pemberwick’s benchmark annual return of 1.90%. Pemberwick’s annual return for the 10-year period from April 1, 2010 to March 31, 2020 was 1.15% net of expenses, vs. Pemberwick’s benchmark annual return of 1.62% (the benchmark index does not include expenses).
Performance data quoted represents past performance; past performance does not guarantee future results. The investment return and principal value of an investment will change so that an investor’s shares, when redeemed, may be worth more or less than their original cost. Current performance of the Fund may be lower or higher than the performance quoted. Performance data current to the most recent month end may be obtained by calling 1-888-893-4491. The gross expense ratio of the Fund was 0.39% as of the 7/31/19 prospectus. Pemberwick Fund’s advisor has voluntarily undertaken to limit Fund expenses. Such expense limitations may fluctuate and are voluntary and temporary and may be terminated by Pemberwick Fund’s advisor at any time without notice. Pemberwick Fund’s advisor currently voluntarily waives 0.10% of its 0.25% management fee, resulting in a net expense ratio of 0.29% as of July 31, 2019. Please see page 27 for the gross and net expense ratios as of March 31, 2020.
During the year ended March 31, 2020 Pemberwick primarily continued its strategy of building a portfolio of investment grade floating rate bonds with laddered maturities during the period from April 1, 2019 through February 29, 2020. As Pemberwick has relatively level amounts of monthly maturities throughout the duration of the portfolio, Pemberwick should never need to sell bonds to cover redemptions thus greatly minimizing shareholders losses during times of economic distress. Since the end of February 2020, Pemberwick has remained on the sidelines with regards to adding investment grade floating rate bonds as spreads have widened out substantially due to the COVID-19 global pandemic and associated market downturn. During this time, we have been
3
Pemberwick Fund
monitoring potential redemptions daily and keeping them to a bare minimum. Total redemptions for the period February 29, 2020 to April 30, 2020 were $4.3 million vs. $12.5 million for the same period in 2019 and the average monthly redemptions for 2019 of $7.9 million. We will continue to closely monitor the market and look to gradually add investment grade floating rate bonds to the portfolio as we have maturities and the market recovers.
PORTFOLIO POSITIONING:
As of March 31, 2020, Pemberwick Fund continues to be invested primarily in investment grade floating rate bonds issued by financial institutions with assets greater than $200 billion (81% of Pemberwick’s net assets, with a weighted average duration of 2.02 years) and a small percentage of fixed rate bonds (4% of Pemberwick’s net assets, with a weighted average duration of 2.98 years) and securities issued by the US Treasury and Agencies (12% of Pemberwick’s net assets, with a weighted average duration of 1.20 years). In addition, as of March 31, 2020 Pemberwick had approximately 3% of its assets invested in short-term securities with maturities of less than 7 days. Pemberwick’s net assets decreased by $17.5 million, or approximately 4.8% during the year ended March 31, 2020: net assets have decreased from approximately $365.3 million as of March 31, 2019 to approximately $347.8 million as of March 31, 2020. $13.3 million of the decrease is due to Pemberwick’s decline in net asset value price per share from February 26, 2020 to March 31, 2020 due to COVID-19. Current net assets are $355.6 million as of April 30, 2020.
This letter is intended to assist shareholders in understanding how Pemberwick performed during the year ended March 31, 2020 and includes the views of the investment advisor at the time of this writing. Of course, these views may change and do not guarantee the future performance of Pemberwick or the markets. Portfolio composition is subject to change. The current and future portfolio holdings of Pemberwick are subject to investment risk.
Pemberwick Investment Advisors, LLC
Must be preceded or accompanied by a prospectus.
Mutual fund investing involves risk. Principal loss is possible. Fixed-income securities are or may be subject to interest rate, credit, liquidity, prepayment and extension risks. By concentrating its assets in the banking industry, the Fund is subject to the risk that economic, business, political or other conditions that have a negative effect on the banking industry will negatively impact the Fund to a greater extent than if the Fund’s assets were diversified across different industries or sectors. The municipal market is volatile and can be significantly affected by adverse tax, legislative or political changes and the financial condition of the issuers of municipal securities.
Bloomberg Barclays 1-3 Year US Government/Credit Total Return Index Value Unhedged – The Bloomberg Barclays 1-3 Year US Government/Credit Bond Index is a broad-based benchmark that measures the non-securitized component of the US Aggregate Index. It includes investment grade, US dollar-denominated, fixed-rate Treasuries, government-related and corporate securities. It is not possible to invest in an index.
Duration (Workout Date in Years) – The number of years from today to the workout of the instrument. The workout of the instrument is the call date (if applicable) or the maturity date. For mortgage backed instruments the weighted average life is used instead of the maturity.
Investment grade – issuer credit ratings are those that are above BBB- or Baa for S&P or Moody’s respectively.
The Pemberwick Fund is distributed by Quasar Distributors, LLC
4
Pemberwick Fund
Comparison of the Change in Value of a Hypothetical $10,000 Investment
in the Pemberwick Fund and
Bloomberg Barclays 1-3 Year US Government/Credit Index
(Unaudited)
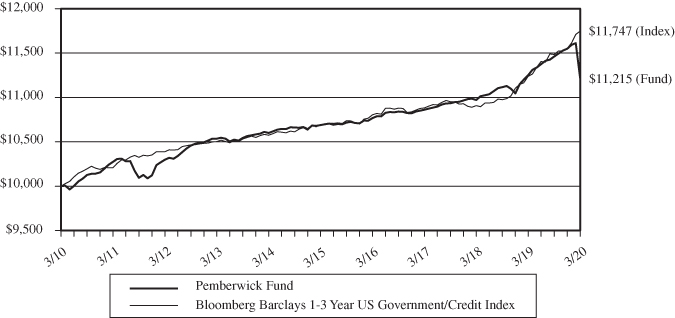
| Average Annual Return | Since Inception | ||||
| Periods Ended March 31, 2020: | 1 Year | 3 Years | 5 Years | 10 Years | (2/1/2010) |
| Pemberwick Fund (No Load) | -0.31% | 1.07% | 0.97% | 1.15% | 1.14% |
| Bloomberg Barclays 1-3 Year | |||||
| US Government/Credit Index | 4.53% | 2.58% | 1.90% | 1.62% | 1.61% |
Total Annual Fund Operating Expenses as of 7/31/2019 Prospectus: 0.39%
Performance data quoted represents past performance; past performance does not guarantee future results. The investment return and principal value of an investment will fluctuate so that an investor’s shares, when redeemed, may be worth more or less than their original cost. Current performance of the Fund may be lower or higher than the performance quoted. Performance data current to the most recent month end may be obtained by calling 1-888-893-4491.
This chart illustrates the performance of a hypothetical $10,000 investment made in the Fund on March 31, 2010. Returns reflect the reinvestment of income and capital gain distributions. The performance data shown reflects a voluntary waiver made by the Adviser. In the absence of fee waivers, returns would be reduced. The performance data and graph do not reflect the deduction of taxes that a shareholder may pay on dividends, capital gain distributions, or redemption of Fund shares. This chart does not imply any future performance.
The Bloomberg Barclays 1-3 Year US Government/Credit Index is an unmanaged market index and should not be considered indicative of any Pemberwick investment. One cannot invest directly in an index.
5
Pemberwick Fund
| SECTOR ALLOCATION OF PORTFOLIO ASSETS |
| at March 31, 2020 (Unaudited) |
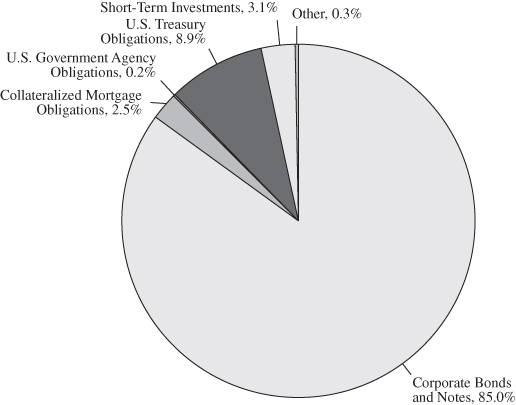
Percentages represent market value as a percentage of net assets.
6
Pemberwick Fund
| SCHEDULE OF INVESTMENTS |
| at March 31, 2020 |
| Par | ||||||||
| CORPORATE BONDS AND NOTES – 85.0% | Value | Value | ||||||
| Basic Materials – 0.0% | ||||||||
| Praxair, Inc. | ||||||||
| 2.250%, 09/24/2020 | $ | 30,000 | $ | 29,983 | ||||
| Communications – 1.8% | ||||||||
| AT&T, Inc. | ||||||||
| 2.781% (3 Month LIBOR USD + 0.950%), 07/15/2021 (a) | 5,000,000 | 4,914,583 | ||||||
| Cisco Systems, Inc. | ||||||||
| 3.000%, 06/15/2022 | 105,000 | 109,502 | ||||||
| Comcast Corp. | ||||||||
| 1.625%, 01/15/2022 | 60,000 | 60,187 | ||||||
| 2.850%, 01/15/2023 | 100,000 | 103,095 | ||||||
| 3.000%, 02/01/2024 | 150,000 | 157,806 | ||||||
| 3.600%, 03/01/2024 | 100,000 | 107,206 | ||||||
| 3.700%, 04/15/2024 | 100,000 | 107,529 | ||||||
| 3.375%, 02/15/2025 | 200,000 | 213,653 | ||||||
| 3.375%, 08/15/2025 | 100,000 | 106,400 | ||||||
| 3.950%, 10/15/2025 | 125,000 | 137,893 | ||||||
| TWDC Enterprises 18 Corp. | ||||||||
| 1.800%, 06/05/2020 | 30,000 | 29,984 | ||||||
| 2.150%, 09/17/2020 | 70,000 | 70,410 | ||||||
6,118,248 | ||||||||
| Consumer, Cyclical – 1.9% | ||||||||
| American Honda Finance Corp. | ||||||||
| 2.600%, 11/16/2022 | 50,000 | 49,519 | ||||||
| 3.625%, 10/10/2023 | 200,000 | 205,159 | ||||||
| 3.550%, 01/12/2024 | 50,000 | 51,618 | ||||||
| 2.150%, 09/10/2024 | 100,000 | 97,805 | ||||||
| AstraZeneca PLC | ||||||||
| 1.516% (3 Month LIBOR | ||||||||
| USD + 0.620%), 06/10/2022 (a)(e) | 2,000,000 | 1,900,715 | ||||||
| Medtronic, Inc. | ||||||||
| 3.150%, 03/15/2022 | 40,000 | 41,502 | ||||||
| PACCAR Financial Corp. | ||||||||
| 3.100%, 05/10/2021 | 62,000 | 62,316 | ||||||
| 3.400%, 08/09/2023 | 60,000 | 60,754 | ||||||
The accompanying notes are an integral part of these financial statements.
7
Pemberwick Fund
| SCHEDULE OF INVESTMENTS (Continued) |
| at March 31, 2020 |
| Par | ||||||||
| Value | Value | |||||||
| Consumer, Cyclical – 1.9% (Continued) | ||||||||
| Reckitt Benckiser Treasury Services PLC | ||||||||
| 1.764% (3 Month LIBOR USD + 0.560%), 06/24/2022 | ||||||||
| (Acquired 02/15/2018, Cost $3,770,632) (a)(d)(e) | $ | 3,775,000 | $ | 3,641,846 | ||||
| The Home Depot, Inc. | ||||||||
| 2.000%, 04/01/2021 | 130,000 | 130,214 | ||||||
| Toyota Motor Credit Corp. | ||||||||
| 3.400%, 09/15/2021 | 130,000 | 132,306 | ||||||
| 2.150%, 09/08/2022 | 30,000 | 29,872 | ||||||
| 2.900%, 04/17/2024 | 150,000 | 151,872 | ||||||
| Walmart, Inc. | ||||||||
| 1.900%, 12/15/2020 | 30,000 | 30,096 | ||||||
| 4.250%, 04/15/2021 | 60,000 | 61,838 | ||||||
6,647,432 | ||||||||
| Consumer, Non-cyclical – 0.5% | ||||||||
| Abbott Laboratories | ||||||||
| 3.875%, 09/15/2025 | 100,000 | 108,184 | ||||||
| Bristol-Myers Squibb Co. | ||||||||
| 7.150%, 06/15/2023 | 75,000 | 86,452 | ||||||
| 3.250%, 11/01/2023 | 125,000 | 130,670 | ||||||
| Colgate-Palmolive Co. | ||||||||
| 2.250%, 11/15/2022 | 75,000 | 74,823 | ||||||
| Eli Lilly & Co. | ||||||||
| 2.350%, 05/15/2022 | 70,000 | 71,422 | ||||||
| Johnson & Johnson | ||||||||
| 2.250%, 03/03/2022 | 60,000 | 62,217 | ||||||
| Merck & Co., Inc. | ||||||||
| 3.875%, 01/15/2021 | 50,000 | 50,614 | ||||||
| Novartis Capital Corp. | ||||||||
| 3.400%, 05/06/2024 | 50,000 | 53,849 | ||||||
| PepsiCo, Inc. | ||||||||
| 2.150%, 10/14/2020 | 60,000 | 60,048 | ||||||
| 3.600%, 03/01/2024 | 100,000 | 108,442 | ||||||
| The Coca-Cola Co. | ||||||||
| 2.200%, 05/25/2022 | 50,000 | 50,711 | ||||||
| 3.200%, 11/01/2023 | 60,000 | 65,313 | ||||||
The accompanying notes are an integral part of these financial statements.
8
Pemberwick Fund
| SCHEDULE OF INVESTMENTS (Continued) |
| at March 31, 2020 |
| Par | ||||||||
| Value | Value | |||||||
| Consumer, Non-cyclical – 0.5% (Continued) | ||||||||
| The Hershey Co. | ||||||||
| 3.100%, 05/15/2021 | $ | 150,000 | $ | 149,794 | ||||
| The Procter & Gamble Co. | ||||||||
| 2.300%, 02/06/2022 | 60,000 | 61,407 | ||||||
| Unilever Capital Corp. | ||||||||
| 2.750%, 03/22/2021 | 100,000 | 101,172 | ||||||
| UnitedHealth Group, Inc. | ||||||||
| 2.700%, 07/15/2020 | 155,000 | 155,024 | ||||||
| 3.500%, 02/15/2024 | 260,000 | 277,161 | ||||||
1,667,303 | ||||||||
| Energy – 0.4% | ||||||||
| BP Capital Markets America, Inc. | ||||||||
| 2.750%, 05/10/2023 | 100,000 | 100,449 | ||||||
| 3.790%, 02/06/2024 | 350,000 | 363,315 | ||||||
| 3.224%, 04/14/2024 | 200,000 | 204,936 | ||||||
| 3.796%, 09/21/2025 | 250,000 | 257,381 | ||||||
| Chevron Corp. | ||||||||
| 2.419%, 11/17/2020 | 50,000 | 49,822 | ||||||
| 3.191%, 06/24/2023 | 50,000 | 52,264 | ||||||
| Columbia Pipeline Group, Inc. | ||||||||
| 4.500%, 06/01/2025 | 180,000 | 177,690 | ||||||
| EOG Resources, Inc. | ||||||||
| 2.625%, 03/15/2023 | 100,000 | 98,147 | ||||||
1,304,004 | ||||||||
| Financial – 78.6% | ||||||||
| American Express Co. | ||||||||
| 2.100% (3 Month LIBOR USD + 0.330%), 10/30/2020 (a) | 2,750,000 | 2,720,291 | ||||||
| 2.217% (3 Month LIBOR USD + 0.525%), 05/17/2021 (a) | 1,300,000 | 1,264,982 | ||||||
| 2.373% (3 Month LIBOR USD + 0.610%), 08/01/2022 (a) | 1,391,000 | 1,347,549 | ||||||
| American Express Credit Corp. | ||||||||
| 2.163% (3 Month LIBOR USD + 0.700%), 03/03/2022 (a) | 6,990,000 | 6,813,303 | ||||||
| Banco Santander SA | ||||||||
| 3.408% (3 Month LIBOR USD + 1.560%), 04/11/2022 (a)(e) | 3,800,000 | 3,639,491 | ||||||
| 2.773% (3 Month LIBOR USD + 1.090%), 02/23/2023 (a)(e) | 9,750,000 | 9,240,445 | ||||||
| 2.968% (3 Month LIBOR USD + 1.120%), 04/12/2023 (a)(e) | 2,900,000 | 2,788,188 | ||||||
The accompanying notes are an integral part of these financial statements.
9
Pemberwick Fund
| SCHEDULE OF INVESTMENTS (Continued) |
| at March 31, 2020 |
| Par | ||||||||
| Value | Value | |||||||
| Financial – 78.6% (Continued) | ||||||||
| Bank of America Corp. | ||||||||
| 3.239% (3 Month LIBOR USD + 1.420%), 04/19/2021 (a) | $ | 3,500,000 | $ | 3,466,073 | ||||
| 2.479% (3 Month LIBOR USD + 0.660%), 07/21/2021 (a) | 1,000,000 | 994,329 | ||||||
| 2.083% (3 Month LIBOR USD + 0.650%), 10/01/2021 (a) | 2,000,000 | 1,955,480 | ||||||
| 1.866% (3 Month LIBOR USD + 0.650%), 06/25/2022 (a) | 2,500,000 | 2,442,666 | ||||||
| 2.999% (3 Month LIBOR USD + 1.180%), 10/21/2022 (a) | 5,400,000 | 5,217,641 | ||||||
| 2.979% (3 Month LIBOR USD + 1.160%), 01/20/2023 (a) | 850,000 | 813,270 | ||||||
| 2.801% (3 Month LIBOR USD + 1.000%), 04/24/2023 (a) | 1,000,000 | 971,158 | ||||||
| 2.104% (3 Month LIBOR USD + 0.790%), 03/05/2024 (a) | 1,850,000 | 1,733,634 | ||||||
| Bank of Montreal | ||||||||
| 2.202% (3 Month LIBOR USD + 0.400%), 01/22/2021 (a)(e) | 1,295,000 | 1,272,824 | ||||||
| 1.398% (3 Month LIBOR USD + 0.630%), 09/11/2022 (a)(e) | 3,300,000 | 3,137,068 | ||||||
| Canadian Imperial Bank of Commerce | ||||||||
| 1.461% (3 Month LIBOR USD + 0.720%), 06/16/2022 (a)(e) | 4,496,000 | 4,452,153 | ||||||
| Capital One Financial Corp. | ||||||||
| 2.473% (3 Month LIBOR USD + 0.760%), 05/12/2020 (a) | 7,983,000 | 7,972,876 | ||||||
| 2.490% (3 Month LIBOR USD + 0.720%), 01/30/2023 (a) | 4,583,000 | 4,285,288 | ||||||
| Capital One, N.A. | ||||||||
| 2.920% (3 Month LIBOR USD + 1.150%), 01/30/2023 (a) | 5,291,000 | 4,900,423 | ||||||
| Chubb INA Holdings, Inc. | ||||||||
| 2.300%, 11/03/2020 | 80,000 | 80,093 | ||||||
| Citibank, N.A. | ||||||||
| 2.119% (3 Month LIBOR USD + 0.300%), 10/20/2020 (a) | 2,000,000 | 1,984,418 | ||||||
| 2.063% (3 Month LIBOR USD + 0.350%), 02/12/2021 (a) | 1,375,000 | 1,362,499 | ||||||
| Citigroup, Inc. | ||||||||
| 2.755% (3 Month LIBOR USD + 1.380%), 03/30/2021 (a) | 550,000 | 546,071 | ||||||
| 2.953% (3 Month LIBOR USD + 1.190%), 08/02/2021 (a) | 1,570,000 | 1,560,068 | ||||||
| 2.069% (3 Month LIBOR USD + 1.070%), 12/08/2021 (a) | 5,000,000 | 4,919,017 | ||||||
| 2.751% (3 Month LIBOR USD + 0.950%), 07/24/2023 (a) | 4,800,000 | 4,536,149 | ||||||
| 3.010% (3 Month LIBOR USD + 1.430%), 09/01/2023 (a) | 2,000,000 | 1,956,254 | ||||||
| 2.792% (3 Month LIBOR USD + 1.100%), 05/17/2024 (a) | 900,000 | 860,190 | ||||||
| Credit Suisse Group AG | ||||||||
| 1.941% (3 Month LIBOR USD + 1.200%), 12/14/2023 | ||||||||
| (Acquired 09/11/2017, Cost $8,381,285) (a)(b)(d)(e) | 8,300,000 | 7,268,209 | ||||||
| 2.024% (3 Month LIBOR USD + 1.240%), 06/12/2024 | ||||||||
| (Acquired 06/06/2018 – 06/07/2018, | ||||||||
| Cost $1,014,440) (a)(b)(e) | 1,000,000 | 883,972 | ||||||
The accompanying notes are an integral part of these financial statements.
10
Pemberwick Fund
| SCHEDULE OF INVESTMENTS (Continued) |
| at March 31, 2020 |
| Par | ||||||||
| Value | Value | |||||||
| Financial – 78.6% (Continued) | ||||||||
| Credit Suisse Group Funding Guernsey Ltd. | ||||||||
| 4.109% (3 Month LIBOR | ||||||||
| USD + 2.290%), 04/16/2021 (a)(e) | $ | 1,000,000 | $ | 1,000,703 | ||||
| ERP Operating LP | ||||||||
| 4.625%, 12/15/2021 | 75,000 | 76,702 | ||||||
| Federal Realty Investment Trust | ||||||||
| 2.750%, 06/01/2023 | 150,000 | 149,359 | ||||||
| 3.950%, 01/15/2024 | 217,000 | 217,341 | ||||||
| HSBC Holdings PLC | ||||||||
| 3.239% (3 Month LIBOR USD + 2.240%), 03/08/2021 (a)(e) | 1,000,000 | 994,332 | ||||||
| 2.292% (3 Month LIBOR USD + 0.600%), 05/18/2021 (a)(e) | 6,300,000 | 6,171,744 | ||||||
| 3.400% (3 Month LIBOR USD + 1.500%), 01/05/2022 (a)(e) | 3,400,000 | 3,260,750 | ||||||
| 2.692% (3 Month LIBOR USD + 1.000%), 05/18/2024 (a)(e) | 4,810,000 | 4,488,610 | ||||||
| M&T Bank Corp. | ||||||||
| 2.474% (3 Month LIBOR USD + 0.680%), 07/26/2023 (a) | 6,000,000 | 5,495,355 | ||||||
| Manufacturers & Traders Trust Co. | ||||||||
| 2.220% (3 Month LIBOR USD + 0.640%), 12/01/2021 (a) | 5,000,000 | 4,858,835 | ||||||
| MetLife, Inc. | ||||||||
| 4.368%, 09/15/2023 | 150,000 | 158,302 | ||||||
| 3.000%, 03/01/2025 | 100,000 | 98,630 | ||||||
| 3.600%, 11/13/2025 | 125,000 | 130,952 | ||||||
| Mitsubishi UFJ Financial Group, Inc. | ||||||||
| 1.833% (3 Month LIBOR USD + 1.060%), 09/13/2021 (a)(e) | 2,000,000 | 1,970,202 | ||||||
| 2.320% (3 Month LIBOR USD + 0.740%), 03/02/2023 (a)(e) | 4,432,000 | 4,215,123 | ||||||
| 2.654% (3 Month LIBOR USD + 0.860%), 07/26/2023 (a)(e) | 1,000,000 | 918,834 | ||||||
| Mizuho Financial Group, Inc. | ||||||||
| 1.913% (3 Month LIBOR USD + 1.140%), 09/13/2021 (a)(e) | 4,000,000 | 3,885,167 | ||||||
| 2.553% (3 Month LIBOR USD + 0.940%), 02/28/2022 (a)(e) | 5,400,000 | 5,199,577 | ||||||
| 2.104% (3 Month LIBOR USD + 0.790%), 03/05/2023 (a)(e) | 7,420,000 | 6,926,496 | ||||||
| 2.683% (3 Month LIBOR USD + 0.840%), 07/16/2023 (a)(e) | 1,000,000 | 949,646 | ||||||
| Morgan Stanley | ||||||||
| 3.219% (3 Month LIBOR USD + 1.400%), 04/21/2021 (a) | 5,600,000 | 5,561,541 | ||||||
| 2.999% (3 Month LIBOR USD + 1.180%), 01/20/2022 (a) | 1,900,000 | 1,890,446 | ||||||
| 2.732% (3 Month LIBOR USD + 0.930%), 07/22/2022 (a) | 5,420,000 | 5,275,968 | ||||||
| 3.201% (3 Month LIBOR USD + 1.400%), 10/24/2023 (a) | 2,000,000 | 1,942,377 | ||||||
| 2.954% (3 Month LIBOR USD + 1.220%), 05/08/2024 (a) | 1,029,000 | 987,193 | ||||||
The accompanying notes are an integral part of these financial statements.
11
Pemberwick Fund
| SCHEDULE OF INVESTMENTS (Continued) |
| at March 31, 2020 |
| Par | ||||||||
| Value | Value | |||||||
| Financial – 78.6% (Continued) | ||||||||
| National Bank of Canada | ||||||||
| 1.344% (3 Month LIBOR USD + 0.560%), 06/12/2020 (a) | $ | 1,022,000 | $ | 1,019,593 | ||||
| Northern Trust Corp. | ||||||||
| 3.450%, 11/04/2020 | 25,000 | 25,062 | ||||||
| 3.375%, 08/23/2021 | 25,000 | 25,542 | ||||||
| PNC Bank, N.A. | ||||||||
| 2.052% (3 Month LIBOR USD + 0.250%), 01/22/2021 (a) | 1,960,000 | 1,929,361 | ||||||
| 1.206% (3 Month LIBOR USD + 0.310%), 06/10/2021 (a) | 4,500,000 | 4,424,825 | ||||||
| 2.252% (3 Month LIBOR USD + 0.450%), 07/22/2022 (a) | 1,000,000 | 969,835 | ||||||
| Public Storage | ||||||||
| 2.370%, 09/15/2022 | 180,000 | 178,052 | ||||||
| Realty Income Corp. | ||||||||
| 3.250%, 10/15/2022 | 150,000 | 150,761 | ||||||
| 4.650%, 08/01/2023 | 125,000 | 131,390 | ||||||
| 3.875%, 07/15/2024 | 146,000 | 145,683 | ||||||
| 3.875%, 04/15/2025 | 150,000 | 153,686 | ||||||
| Royal Bank of Canada | ||||||||
| 2.034% (3 Month LIBOR USD + 0.240%), 10/26/2020 (a)(e) | 4,000,000 | 3,927,085 | ||||||
| 2.194% (3 Month LIBOR USD + 0.400%), 01/25/2021 (a)(e) | 1,600,000 | 1,573,931 | ||||||
| 2.493% (3 Month LIBOR USD + 0.730%), 02/01/2022 (a)(e) | 5,355,000 | 5,204,669 | ||||||
| Simon Property Group LP | ||||||||
| 2.500%, 07/15/2021 | 120,000 | 118,442 | ||||||
| 2.350%, 01/30/2022 | 50,000 | 49,200 | ||||||
| 3.750%, 02/01/2024 | 100,000 | 100,755 | ||||||
| 2.000%, 09/13/2024 | 150,000 | 144,231 | ||||||
| 3.375%, 10/01/2024 | 100,000 | 99,798 | ||||||
| 3.500%, 09/01/2025 | 100,000 | 100,937 | ||||||
| Sumitomo Mitsui Banking Corp. | ||||||||
| 2.213% (3 Month LIBOR USD + 0.370%), 10/16/2020 (a)(e) | 5,100,000 | 5,034,188 | ||||||
| Sumitomo Mitsui Financial Group, Inc. | ||||||||
| 2.948% (3 Month LIBOR USD + 1.110%), 07/14/2021 (a)(e) | 6,013,000 | 5,742,289 | ||||||
| 2.959% (3 Month LIBOR USD + 1.140%), 10/19/2021 (a)(e) | 2,000,000 | 1,962,271 | ||||||
| 2.576% (3 Month LIBOR USD + 0.740%), 01/17/2023 (a)(e) | 1,980,000 | 1,777,560 | ||||||
| 2.679% (3 Month LIBOR USD + 0.860%), 07/19/2023 (a)(e) | 2,200,000 | 2,169,442 | ||||||
| State Street Corp. | ||||||||
| 1.950%, 05/19/2021 | 25,000 | 24,895 | ||||||
The accompanying notes are an integral part of these financial statements.
12
Pemberwick Fund
| SCHEDULE OF INVESTMENTS (Continued) |
| at March 31, 2020 |
| Par | ||||||||
| Value | Value | |||||||
| Financial – 78.6% (Continued) | ||||||||
| The Bank of New York Mellon Corp. | ||||||||
| 2.450%, 11/27/2020 | $ | 35,000 | $ | 34,867 | ||||
| 2.820% (3 Month LIBOR USD + 1.050%), 10/30/2023 (a) | 9,036,000 | 8,688,599 | ||||||
| The Goldman Sachs Group, Inc. | ||||||||
| 1.941% (3 Month LIBOR USD + 1.200%), 09/15/2020 (a) | 4,044,000 | 4,041,407 | ||||||
| 3.154% (3 Month LIBOR USD + 1.360%), 04/23/2021 (a) | 1,000,000 | 994,029 | ||||||
| 2.862% (3 Month LIBOR USD + 1.170%), 11/15/2021 (a) | 2,000,000 | 1,960,525 | ||||||
| 2.364% (3 Month LIBOR USD + 1.050%), 06/05/2023 (a) | 3,700,000 | 3,543,226 | ||||||
| 2.801% (3 Month LIBOR USD + 1.000%), 07/24/2023 (a) | 2,449,000 | 2,322,648 | ||||||
| 3.213% (3 Month LIBOR USD + 1.600%), 11/29/2023 (a) | 4,800,000 | 4,692,658 | ||||||
| The Bank of Nova Scotia | ||||||||
| 2.228% (3 Month LIBOR USD + 0.390%), 07/14/2020 (a)(e) | 3,000,000 | 2,977,366 | ||||||
| 1.639% (3 Month LIBOR USD + 0.640%), 03/07/2022 (a)(e) | 4,700,000 | 4,530,562 | ||||||
| The Toronto-Dominion Bank | ||||||||
| 1.048% (3 Month LIBOR USD + 0.280%), 06/11/2020 (a)(e) | 2,280,000 | 2,270,906 | ||||||
| 2.874% (3 Month LIBOR USD + 1.000%), 04/07/2021 (a)(e) | 1,500,000 | 1,491,061 | ||||||
| 1.198% (3 Month LIBOR USD + 0.430%), 06/11/2021 (a)(e) | 2,350,000 | 2,285,499 | ||||||
| 2.110% (3 Month LIBOR USD + 0.530%), 12/01/2022 (a)(e) | 2,000,000 | 1,924,571 | ||||||
| The Travelers Cos, Inc. | ||||||||
| 3.900%, 11/01/2020 | 110,000 | 110,926 | ||||||
| Trust Bank | ||||||||
| 2.294% (3 Month LIBOR USD + 0.500%), 10/26/2021 (a) | 3,000,000 | 2,919,546 | ||||||
| 2.353% (3 Month LIBOR USD + 0.590%), 08/02/2022 (a) | 6,700,000 | 6,325,674 | ||||||
| Trust Financial Corp. | ||||||||
| 1.311% (3 Month LIBOR USD + 0.570%), 06/15/2020 (a) | 2,000,000 | 1,993,966 | ||||||
| 2.083% (3 Month LIBOR USD + 0.650%), 04/01/2022 (a) | 3,600,000 | 3,404,668 | ||||||
| Visa, Inc. | ||||||||
| 2.200%, 12/14/2020 | 70,000 | 70,386 | ||||||
| Wells Fargo & Co. | ||||||||
| 2.682% (3 Month LIBOR USD + 0.880%), 07/22/2020 (a) | 7,490,000 | 7,451,054 | ||||||
| 2.500%, 03/04/2021 | 30,000 | 30,031 | ||||||
| 2.594% (3 Month LIBOR USD + 1.340%), 03/04/2021 (a) | 2,500,000 | 2,492,491 | ||||||
| 4.600%, 04/01/2021 | 60,000 | 61,324 | ||||||
| 2.100%, 07/26/2021 | 110,000 | 109,931 | ||||||
| 2.661% (3 Month LIBOR USD + 0.930%), 02/11/2022 (a) | 4,500,000 | 4,414,603 | ||||||
| 3.007% (3 Month LIBOR USD + 1.230%), 10/31/2023 (a) | 925,000 | 883,098 | ||||||
273,419,362 | ||||||||
The accompanying notes are an integral part of these financial statements.
13
Pemberwick Fund
| SCHEDULE OF INVESTMENTS (Continued) |
| at March 31, 2020 |
| Par | ||||||||
| Value | Value | |||||||
| Industrial – 0.6% | ||||||||
| Burlington Northern Santa Fe, LLC | ||||||||
| 3.000%, 04/01/2025 | $ | 100,000 | $ | 103,810 | ||||
| Caterpillar Financial Services Corp. | ||||||||
| 2.950%, 05/15/2020 | 50,000 | 50,030 | ||||||
| 1.850%, 09/04/2020 | 25,000 | 24,943 | ||||||
| 2.900%, 03/15/2021 | 75,000 | 75,642 | ||||||
| Caterpillar, Inc. | ||||||||
| 3.400%, 05/15/2024 | 60,000 | 63,078 | ||||||
| General Dynamics Corp. | ||||||||
| 3.000%, 05/11/2021 | 105,000 | 106,134 | ||||||
| 2.250%, 11/15/2022 | 60,000 | 60,413 | ||||||
| General Electric Co. | ||||||||
| 4.625%, 01/07/2021 | 250,000 | 252,439 | ||||||
| 4.000% (3 Month LIBOR USD + 2.280%), 12/29/2049 (a)(b) | 1,234,000 | 873,974 | ||||||
| Honeywell International, Inc. | ||||||||
| 1.850%, 11/01/2021 | 60,000 | 60,068 | ||||||
| John Deere Capital Corp. | ||||||||
| 1.950%, 06/22/2020 | 75,000 | 74,940 | ||||||
| 2.375%, 07/14/2020 | 50,000 | 49,982 | ||||||
| 2.650%, 01/06/2022 | 50,000 | 50,516 | ||||||
| 2.800%, 01/27/2023 | 60,000 | 61,107 | ||||||
| The Boeing Co. | ||||||||
| 2.800%, 03/01/2023 | 120,000 | 110,626 | ||||||
| 2.850%, 10/30/2024 | 100,000 | 91,339 | ||||||
| 2.500%, 03/01/2025 | 100,000 | 92,050 | ||||||
2,201,091 | ||||||||
| Technology – 0.6% | ||||||||
| Apple, Inc. | ||||||||
| 1.800%, 05/11/2020 | 50,000 | 50,038 | ||||||
| 2.250%, 02/23/2021 | 63,000 | 63,597 | ||||||
| 2.150%, 02/09/2022 | 155,000 | 158,563 | ||||||
| 2.400%, 05/03/2023 | 60,000 | 62,484 | ||||||
| 3.000%, 02/09/2024 | 80,000 | 84,916 | ||||||
| 3.200%, 05/13/2025 | 150,000 | 162,792 | ||||||
| IBM Credit LLC | ||||||||
| 1.800%, 01/20/2021 | 100,000 | 99,501 | ||||||
The accompanying notes are an integral part of these financial statements.
14
Pemberwick Fund
| SCHEDULE OF INVESTMENTS (Continued) |
| at March 31, 2020 |
| Par | ||||||||
| Value | Value | |||||||
| Technology – 0.6% (Continued) | ||||||||
| Intel Corp. | ||||||||
| 1.700%, 05/19/2021 | $ | 110,000 | $ | 110,035 | ||||
| 3.300%, 10/01/2021 | 33,000 | 34,473 | ||||||
| 3.100%, 07/29/2022 | 50,000 | 51,960 | ||||||
| International Business Machines Corp. | ||||||||
| 3.375%, 08/01/2023 | 150,000 | 158,111 | ||||||
| 3.625%, 02/12/2024 | 100,000 | 106,872 | ||||||
| 3.000%, 05/15/2024 | 100,000 | 104,767 | ||||||
| 7.000%, 10/30/2025 | 150,000 | 186,470 | ||||||
| Microsoft Corp. | ||||||||
| 1.550%, 08/08/2021 | 225,000 | 226,702 | ||||||
| Oracle Corp. | ||||||||
| 2.500%, 05/15/2022 | 190,000 | 193,297 | ||||||
| Texas Instruments, Inc. | ||||||||
| 1.850%, 05/15/2022 | 60,000 | 61,208 | ||||||
1,915,786 | ||||||||
| Utilities – 0.6% | ||||||||
| Berkshire Hathaway Energy Co. | ||||||||
| 3.500%, 02/01/2025 | 200,000 | 210,150 | ||||||
| DTE Electric Co. | ||||||||
| 3.900%, 06/01/2021 | 55,000 | 55,339 | ||||||
| Duke Energy Carolinas LLC | ||||||||
| 4.300%, 06/15/2020 | 25,000 | 25,089 | ||||||
| 3.900%, 06/15/2021 | 25,000 | 25,521 | ||||||
| Duke Energy Progress LLC | ||||||||
| 2.800%, 05/15/2022 | 70,000 | 71,058 | ||||||
| 3.250%, 08/15/2025 | 100,000 | 106,782 | ||||||
| Entergy Arkansas LLC | ||||||||
| 3.050%, 06/01/2023 | 250,000 | 239,399 | ||||||
| 3.700%, 06/01/2024 | 140,000 | 147,204 | ||||||
| Entergy Gulf States Louisiana LLC | ||||||||
| 3.950%, 10/01/2020 | 50,000 | 49,755 | ||||||
| Entergy Louisiana LLC | ||||||||
| 5.400%, 11/01/2024 | 100,000 | 113,460 | ||||||
| Evergy Kansas Central, Inc. | ||||||||
| 5.100%, 07/15/2020 | 75,000 | 75,368 | ||||||
The accompanying notes are an integral part of these financial statements.
15
Pemberwick Fund
| SCHEDULE OF INVESTMENTS (Continued) |
| at March 31, 2020 |
| Par | ||||||||
| Value | Value | |||||||
| Utilities – 0.6% (Continued) | ||||||||
| Kentucky Utilities Co. | ||||||||
| 3.250%, 11/01/2020 | $ | 30,000 | $ | 29,900 | ||||
| Louisville Gas & Electric Co. | ||||||||
| 3.300%, 10/01/2025 | 150,000 | 158,430 | ||||||
| Northern States Power Co. | ||||||||
| 2.200%, 08/15/2020 | 30,000 | 29,950 | ||||||
| PacifiCorp | ||||||||
| 3.600%, 04/01/2024 | 210,000 | 213,945 | ||||||
| PECO Energy Co. | ||||||||
| 3.150%, 10/15/2025 | 125,000 | 128,776 | ||||||
| Potomac Electric Power Co. | ||||||||
| 3.600%, 03/15/2024 | 140,000 | 143,806 | ||||||
| Public Service Co. of Colorado | ||||||||
| 3.200%, 11/15/2020 | 30,000 | 30,010 | ||||||
| Public Service Electric & Gas Co. | ||||||||
| 3.000%, 05/15/2025 | 175,000 | 180,121 | ||||||
| San Diego Gas & Electric Co. | ||||||||
| 3.000%, 08/15/2021 | 30,000 | 30,248 | ||||||
| 3.600%, 09/01/2023 | 100,000 | 105,550 | ||||||
| Southern California Edison Co. | ||||||||
| 3.875%, 06/01/2021 | 40,000 | 39,657 | ||||||
| 3.400%, 06/01/2023 | 50,000 | 51,301 | ||||||
2,260,819 | ||||||||
| TOTAL CORPORATE BONDS AND NOTES | ||||||||
| (Cost $307,581,093) | 295,564,028 | |||||||
| COLLATERALIZED | ||||||||
| MORTGAGE OBLIGATIONS – 2.5% | ||||||||
| Federal Home Loan Mortgage | ||||||||
| Corporation REMICS – 0.9% | ||||||||
| Series 3799, Class GK | ||||||||
| 2.750%, 01/15/2021 | 17,305 | 17,388 | ||||||
| Series 3784, Class BH | ||||||||
| 3.500%, 01/15/2021 | 32,936 | 33,195 | ||||||
| Series 2989, Class TG | ||||||||
| 5.000%, 06/15/2025 | 14,919 | 15,974 | ||||||
The accompanying notes are an integral part of these financial statements.
16
Pemberwick Fund
| SCHEDULE OF INVESTMENTS (Continued) |
| at March 31, 2020 |
| Par | ||||||||
| Value | Value | |||||||
| Federal Home Loan Mortgage | ||||||||
| Corporation REMICS – 0.9% (Continued) | ||||||||
| Series 3002, Class YD | ||||||||
| 4.500%, 07/15/2025 | $ | 6,412 | $ | 6,881 | ||||
| Series 3775, Class EM | ||||||||
| 3.500%, 11/15/2025 | 34,675 | 36,529 | ||||||
| Series 3990, Class UB | ||||||||
| 2.500%, 01/15/2026 | 67,343 | 68,144 | ||||||
| Series 4266, Class BG | ||||||||
| 2.500%, 04/15/2026 | 86,831 | 89,644 | ||||||
| Series 3917, Class AB | ||||||||
| 1.750%, 07/15/2026 | 57,595 | 58,317 | ||||||
| Series 3970, Class HB | ||||||||
| 3.000%, 12/15/2026 | 200,000 | 215,328 | ||||||
| Series 4020, Class PA | ||||||||
| 2.750%, 03/15/2027 | 66,378 | 68,640 | ||||||
| Series 2091, Class PG | ||||||||
| 6.000%, 11/15/2028 | 319,474 | 361,727 | ||||||
| Series 2097, Class PZ | ||||||||
| 6.000%, 11/15/2028 | 207,635 | 234,749 | ||||||
| Series 2526, Class FI | ||||||||
| 1.705% (1 Month LIBOR USD + 1.000%), 02/15/2032 (a) | 39,495 | 40,214 | ||||||
| Series 4203, Class DM | ||||||||
| 3.000%, 04/15/2033 | 132,494 | 140,009 | ||||||
| Series 4363, Class EJ | ||||||||
| 4.000%, 05/15/2033 | 104,289 | 113,148 | ||||||
| Series 2682, Class LD | ||||||||
| 4.500%, 10/15/2033 | 49,644 | 56,121 | ||||||
| Series 4453, Class DA | ||||||||
| 3.500%, 11/15/2033 | 199,552 | 211,904 | ||||||
| Series 2759, Class TC | ||||||||
| 4.500%, 03/15/2034 | 228,138 | 250,210 | ||||||
| Series 2881, Class AE | ||||||||
| 5.000%, 08/15/2034 | 3,870 | 4,031 | ||||||
| Series 2933, Class HD | ||||||||
| 5.500%, 02/15/2035 | 8,089 | 9,081 | ||||||
| Series 4305, Class KA | ||||||||
| 3.000%, 03/15/2038 | 7,402 | 7,425 | ||||||
The accompanying notes are an integral part of these financial statements.
17
Pemberwick Fund
| SCHEDULE OF INVESTMENTS (Continued) |
| at March 31, 2020 |
| Par | ||||||||
| Value | Value | |||||||
| Federal Home Loan Mortgage | ||||||||
| Corporation REMICS – 0.9% (Continued) | ||||||||
| Series 3843, Class GH | ||||||||
| 3.750%, 10/15/2039 | $ | 20,155 | $ | 20,992 | ||||
| Series 3824, Class PA | ||||||||
| 4.500%, 11/15/2039 | 94,566 | 95,975 | ||||||
| Series 3786, Class NA | ||||||||
| 4.500%, 07/15/2040 | 36,772 | 39,181 | ||||||
| Series 3928, Class HC | ||||||||
| 2.500%, 08/15/2040 | 56,557 | 57,882 | ||||||
| Series 3890, Class BA | ||||||||
| 2.500%, 11/15/2040 | 83,380 | 85,603 | ||||||
| Series 4045, Class HC | ||||||||
| 2.000%, 07/15/2041 | 89,316 | 91,523 | ||||||
| Series 4002, Class LB | ||||||||
| 2.000%, 09/15/2041 | 211,874 | 216,431 | ||||||
| Series 4171, Class NG | ||||||||
| 2.000%, 06/15/2042 | 248,959 | 253,401 | ||||||
| Series 4305, Class AL | ||||||||
| 2.500%, 10/15/2042 | 127,366 | 129,347 | ||||||
| Series 4309, Class JD | ||||||||
| 2.000%, 10/15/2043 | 29,653 | 30,401 | ||||||
| Series 4472, Class MA | ||||||||
| 3.000%, 05/15/2045 | 162,458 | 173,619 | ||||||
| Series 4305, Class A | ||||||||
| 3.500%, 06/15/2048 | 55,616 | 58,067 | ||||||
3,291,081 | ||||||||
| Federal National Mortgage | ||||||||
| Association REMICS – 1.3% | ||||||||
| Series 2005-40, Class YG | ||||||||
| 5.000%, 05/25/2025 | 13,391 | 14,151 | ||||||
| Series 2011-110, Class CA | ||||||||
| 3.500%, 06/25/2026 | 266,244 | 269,217 | ||||||
| Series 2011-110, Class CYA | ||||||||
| 3.500%, 11/25/2026 | 375,000 | 397,873 | ||||||
| Series 2007-27, Class MQ | ||||||||
| 5.500%, 04/25/2027 | 4,209 | 4,620 | ||||||
The accompanying notes are an integral part of these financial statements.
18
Pemberwick Fund
| SCHEDULE OF INVESTMENTS (Continued) |
| at March 31, 2020 |
| Par | ||||||||
| Value | Value | |||||||
| Federal National Mortgage | ||||||||
| Assocation REMICS – 1.3% (Continued) | ||||||||
| Series 2012-101, Class AB | ||||||||
| 1.500%, 06/25/2027 | $ | 127,715 | $ | 128,995 | ||||
| Series 2012-66, Class HE | ||||||||
| 1.500%, 06/25/2027 | 50,744 | 51,107 | ||||||
| Series 2012-148, Class BQ | ||||||||
| 1.250%, 01/25/2028 | 118,191 | 119,603 | ||||||
| Series 2013-124, Class BD | ||||||||
| 2.500%, 12/25/2028 | 136,026 | 139,662 | ||||||
| Series 2014-8, Class DA | ||||||||
| 4.000%, 03/25/2029 | 106,556 | 113,598 | ||||||
| Series 2002-56, Class PE | ||||||||
| 6.000%, 09/25/2032 | 101,649 | 118,804 | ||||||
| Series 2013-72, Class HG | ||||||||
| 3.000%, 04/25/2033 | 231,666 | 245,100 | ||||||
| Series 2003-127, Class EG | ||||||||
| 6.000%, 12/25/2033 | 121,640 | 142,112 | ||||||
| Series 2004-60, Class AB | ||||||||
| 5.500%, 04/25/2034 | 313,493 | 341,412 | ||||||
| Series 2005-48, Class AU | ||||||||
| 5.500%, 06/25/2035 | 89,410 | 100,367 | ||||||
| Series 2005-62, Class CQ | ||||||||
| 4.750%, 07/25/2035 | 1,080 | 1,098 | ||||||
| Series 2005-64, Class PL | ||||||||
| 5.500%, 07/25/2035 | 20,512 | 21,923 | ||||||
| Series 2005-68, Class PG | ||||||||
| 5.500%, 08/25/2035 | 17,169 | 19,558 | ||||||
| Series 2005-83A, Class LA | ||||||||
| 5.500%, 10/25/2035 | 9,052 | 10,209 | ||||||
| Series 2006-57, Class AD | ||||||||
| 5.750%, 06/25/2036 | 26,470 | 28,109 | ||||||
| Series 2014-23, Class PA | ||||||||
| 3.500%, 08/25/2036 | 47,368 | 48,914 | ||||||
| Series 2013-83, Class CA | ||||||||
| 3.500%, 10/25/2037 | 19,850 | 20,142 | ||||||
| Series 2011-9, Class LH | ||||||||
| 3.500%, 01/25/2039 | 328,980 | 348,661 | ||||||
The accompanying notes are an integral part of these financial statements.
19
Pemberwick Fund
| SCHEDULE OF INVESTMENTS (Continued) |
| at March 31, 2020 |
| Par | ||||||||
| Value | Value | |||||||
| Federal National Mortgage | ||||||||
| Assocation REMICS – 1.3% (Continued) | ||||||||
| Series 2009-47, Class PA | ||||||||
| 4.500%, 07/25/2039 | $ | 1,847 | $ | 1,924 | ||||
| Series 2010-68, Class EP | ||||||||
| 4.500%, 12/25/2039 | 83,967 | 90,721 | ||||||
| Series 2014-19, Class HA | ||||||||
| 2.000%, 06/25/2040 | 99,558 | 101,668 | ||||||
| Series 2010-123, Class FE | ||||||||
| 4.500%, 11/25/2040 | 134,231 | 150,916 | ||||||
| Series 2012-49, Class QJ | ||||||||
| 1.750%, 12/25/2040 | 178,574 | 181,551 | ||||||
| Series 2012-31, Class NP | ||||||||
| 2.000%, 04/25/2041 | 65,905 | 67,239 | ||||||
| Series 2012-38, Class PA | ||||||||
| 2.000%, 09/25/2041 | 46,341 | 47,351 | ||||||
| Series 2013-18, Class PA | ||||||||
| 2.000%, 11/25/2041 | 207,264 | 212,905 | ||||||
| Series 2012-102, Class HA | ||||||||
| 2.000%, 02/25/2042 | 109,484 | 111,722 | ||||||
| Series 2012-90, Class DA | ||||||||
| 1.500%, 03/25/2042 | 136,789 | 135,735 | ||||||
| Series 2012-134, Class VP | ||||||||
| 3.000%, 10/25/2042 | 146,249 | 153,354 | ||||||
| Series 2013-6, Class LD | ||||||||
| 2.000%, 02/25/2043 | 70,810 | 72,430 | ||||||
| Series 2013-14, QD | ||||||||
| 1.500%, 03/25/2043 | 87,191 | 86,915 | ||||||
| Series 2016-60, Class Q | ||||||||
| 1.750%, 09/25/2046 | 155,326 | 157,299 | ||||||
| Series 2017-77, Class RL | ||||||||
| 2.000%, 10/25/2047 | 118,994 | 122,436 | ||||||
4,379,401 | ||||||||
| Government National Mortgage | ||||||||
| Association REMICS – 0.3% | ||||||||
| Series 2013-88, Class WA | ||||||||
| 5.028%, 06/20/2030 (a) | 48,505 | 51,778 | ||||||
The accompanying notes are an integral part of these financial statements.
20
Pemberwick Fund
| SCHEDULE OF INVESTMENTS (Continued) |
| at March 31, 2020 |
| Par | ||||||||
| Value | Value | |||||||
| Government National Mortgage | ||||||||
| Association REMICS – 0.3% | ||||||||
| Series 2002-22, Class GF | ||||||||
| 6.500%, 03/20/2032 | $ | 22,223 | $ | 22,218 | ||||
| Series 2002-51, Class D | ||||||||
| 6.000%, 07/20/2032 | 25,740 | 25,734 | ||||||
| Series 2007-11, Class PE | ||||||||
| 5.500%, 03/20/2037 | 13,357 | 15,375 | ||||||
| Series 2009-127, Class PK | ||||||||
| 4.000%, 10/20/2038 | 48,301 | 48,694 | ||||||
| 3.000%, 11/20/2038 | 15,946 | 16,116 | ||||||
| Series 2010-58, Class YJ | ||||||||
| 3.000%, 05/16/2039 | 81,578 | 83,032 | ||||||
| Series 2011-18, Class NH | ||||||||
| 3.500%, 05/20/2039 | 3,666 | 3,664 | ||||||
| Series 2010-112, Class NG | ||||||||
| 2.250%, 09/16/2040 | 151,391 | 157,524 | ||||||
| Series 2013-64, Class LP | ||||||||
| 1.500%, 08/20/2041 | 235,018 | 238,933 | ||||||
| Series 2013-56, Class AP | ||||||||
| 2.000%, 11/16/2041 | 125,243 | 128,558 | ||||||
| Series 2012-106, Class MA | ||||||||
| 2.000%, 11/20/2041 | 164,404 | 169,053 | ||||||
| Series 2012-48, Class MA | ||||||||
| 2.500%, 04/16/2042 | 87,978 | 91,985 | ||||||
1,052,664 | ||||||||
| TOTAL COLLATERALIZED MORTGAGE OBLIGATIONS | ||||||||
| (Cost $8,341,650) | 8,723,146 | |||||||
| U.S. GOVERNMENT AGENCY OBLIGATIONS – 0.2% | ||||||||
| Federal Home Loan Mortgage Corp. – 0.1% | ||||||||
| 5.500%, 04/01/2021, Gold Pool #G11941 | 2,245 | 2,280 | ||||||
| 5.500%, 11/01/2021, Gold Pool #G12454 | 1,826 | 1,874 | ||||||
| 5.500%, 04/01/2023, Gold Pool #G13145 | 5,950 | 6,233 | ||||||
| 4.000%, 02/01/2026, Gold Pool #J14494 | 22,269 | 23,536 | ||||||
The accompanying notes are an integral part of these financial statements.
21
Pemberwick Fund
| SCHEDULE OF INVESTMENTS (Continued) |
| at March 31, 2020 |
| Par | ||||||||
| Value | Value | |||||||
| Federal Home Loan Mortgage Corp. – 0.1% (Continued) | ||||||||
| 4.000%, 06/01/2026, Gold Pool #J15974 | $ | 8,475 | $ | 8,955 | ||||
| 3.000%, 12/01/2026. Gold Pool #GN455993 | 73,983 | 77,657 | ||||||
| 4.500%, 06/01/2029, Gold Pool #C91251 | 8,879 | 9,689 | ||||||
| 4.500%, 12/01/2029, Gold Pool #C91281 | 16,905 | 18,441 | ||||||
| 4.500%, 04/01/2030, Gold Pool #C91295 | 9,165 | 10,002 | ||||||
158,667 | ||||||||
| Federal National Mortgage Association – 0.1% | ||||||||
| 2.000%, 01/05/2022 | 300,000 | 308,586 | ||||||
| 5.500%, 06/01/2020 , Pool #888601 | 5 | 5 | ||||||
| 5.000%, 05/01/2023, Pool #254762 | 4,335 | 4,684 | ||||||
| 5.500%, 01/01/2024, Pool #AD0471 | 1,990 | 2,049 | ||||||
| 5.000%, 12/01/2025, Pool #256045 | 12,271 | 13,272 | ||||||
| 5.500%, 05/01/2028, Pool #257204 | 11,673 | 12,807 | ||||||
| 4.000%, 08/01/2029, Pool #MA0142 | 14,923 | 16,079 | ||||||
| 5.500%, 04/01/2037, Pool #AD0249 | 18,252 | 20,574 | ||||||
| 5.000%, 10/01/2039, Pool #AC3237 | 39,552 | 43,937 | ||||||
421,993 | ||||||||
| TOTAL U.S. GOVERNMENT AGENCY OBLIGATIONS | ||||||||
| (Cost $555,827) | 580,660 | |||||||
| U.S. TREASURY OBLIGATIONS – 8.9% | ||||||||
| U.S. Treasury Notes – 8.9% | ||||||||
| 1.500%, 05/15/2020 | 200,000 | 200,343 | ||||||
| 1.500%, 05/31/2020 | 900,000 | 902,094 | ||||||
| 2.500%, 06/30/2020 | 3,500,000 | 3,520,934 | ||||||
| 1.625%, 07/31/2020 | 2,000,000 | 2,009,752 | ||||||
| 2.000%, 07/31/2020 | 910,000 | 915,865 | ||||||
| 1.375%, 08/31/2020 | 1,230,000 | 1,236,486 | ||||||
| 1.375%, 10/31/2020 | 1,335,000 | 1,344,674 | ||||||
| 1.750%, 10/31/2020 | 6,950,000 | 7,015,563 | ||||||
| 1.625%, 11/30/2020 | 490,000 | 494,929 | ||||||
| 2.000%, 11/30/2020 | 390,000 | 394,928 | ||||||
| 1.375%, 01/31/2021 | 2,720,000 | 2,749,113 | ||||||
| 1.125%, 02/28/2021 | 3,360,000 | 3,390,778 | ||||||
The accompanying notes are an integral part of these financial statements.
22
Pemberwick Fund
| SCHEDULE OF INVESTMENTS (Continued) |
| at March 31, 2020 |
| Par | ||||||||
| Value | Value | |||||||
| U.S. Treasury Notes – 8.9% (Continued) | ||||||||
| 1.250%, 03/31/2021 | $ | 2,135,000 | $ | 2,158,393 | ||||
| 1.375%, 04/30/2021 | 1,025,000 | 1,038,814 | ||||||
| 3.125%, 05/15/2021 | 1,205,000 | 1,245,622 | ||||||
| 2.000%, 11/30/2022 | 500,000 | 522,930 | ||||||
| 2.000%, 04/30/2024 | 720,000 | 768,459 | ||||||
| 1.375%, 01/31/2025 | 125,000 | 130,986 | ||||||
| 2.000%, 02/15/2025 | 300,000 | 323,391 | ||||||
| 2.125%, 05/15/2025 | 600,000 | 652,031 | ||||||
| TOTAL U.S. TREASURY OBLIGATIONS | ||||||||
| (Cost $30,558,790) | 31,016,085 | |||||||
| SHORT-TERM INVESTMENTS – 3.1% | ||||||||
| Money Market Funds – 3.1% | ||||||||
| First American Government | ||||||||
| Obligations Fund – Class X 0.43% (c) | 10,900,609 | 10,900,609 | ||||||
| TOTAL SHORT-TERM INVESTMENTS | ||||||||
| (Cost $10,900,609) – 3.1% | 10,900,609 | |||||||
| TOTAL INVESTMENTS | ||||||||
| (Cost $357,937,969) – 99.7% | 346,784,528 | |||||||
| Other Assets in Excess of Liabilities – 0.3% | 970,547 | |||||||
| TOTAL NET ASSETS – 100.0% | $ | 347,755,075 | ||||||
Percentages are stated as a percent of net assets.
PLC – Public Limited Company
REMICS – Real Estate Mortgage Investment Conduits
| (a) | Variable or Floating Rate Security. The rate shown represents the rate at March 31, 2020. |
| (b) | Security is a perpetual bond and has no definite maturity date. |
| (c) | The rate shown represents the fund’s 7-day yield as of March 31, 2020. |
| (d) | Security exempt from registration pursuant to Rule 144A under the Securities Act of 1933, as amended. These securities may be resold in transactions exempt from registration to qualified institutional investors. At March 31, 2020, the market value of these securities total $10,910,055 which represents 3.1% of total net assets. |
| (e) | U.S. traded security of a foreign issuer or corporation. |
The accompanying notes are an integral part of these financial statements.
23
Pemberwick Fund
| STATEMENT OF ASSETS AND LIABILITIES |
| at March 31, 2020 |
| Assets: | ||||
Investments in securities, at value (cost of $357,937,969) | $ | 346,784,528 | ||
Receivables: | ||||
| Securities sold | 523,752 | |||
| Dividends and interest | 1,359,758 | |||
Prepaid expenses and other assets | 4,952 | |||
| Total assets | 348,672,990 | |||
| Liabilities: | ||||
Payables: | ||||
| Due to custodian | 13 | |||
| Securities purchased | 656,841 | |||
| Distribution payable | 87,513 | |||
| Advisory fee | 45,030 | |||
| Administration and fund accounting fees | 78,572 | |||
| Reports to shareholders | 2,789 | |||
| Custody fees | 8,680 | |||
| Transfer agent fees and expenses | 16,602 | |||
| Other accrued expenses | 21,875 | |||
| Total liabilities | 917,915 | |||
| Net assets | $ | 347,755,075 | ||
| Net assets consist of: | ||||
Capital stock | $ | 359,734,502 | ||
Total accumulated deficit | (11,979,427 | ) | ||
| Net assets | $ | 347,755,075 | ||
Shares issued (Unlimited number of beneficial interest | ||||
authorized, $0.01 par value) | 35,856,751 | |||
| Net asset value, offering price and redemption price per share | $ | 9.70 | ||
The accompanying notes are an integral part of these financial statements.
24
Pemberwick Fund
| STATEMENT OF OPERATIONS |
| Year Ended March 31, 2020 |
| Investment income: | ||||
Interest income from unaffiliated securities | $ | 9,803,444 | ||
Total investment income | 9,803,444 | |||
| Expenses: | ||||
Investment advisory fees (Note 4) | 898,629 | |||
Administration and fund accounting fees (Note 4) | 320,832 | |||
Transfer agent fees and expenses | 63,625 | |||
Federal and state registration fees | 15,858 | |||
Audit fees | 17,000 | |||
Compliance expense | 16,105 | |||
Legal fees | 31,394 | |||
Reports to shareholders | 2,424 | |||
Trustees’ fees and expenses | 11,348 | |||
Custody fees | 34,492 | |||
Other | 14,210 | |||
| Total expenses before waiver from advisor | 1,425,917 | |||
| Expense waiver from advisor (Note 4) | (359,451 | ) | ||
| Net expenses | 1,066,466 | |||
| Net investment income | 8,736,978 | |||
| Realized and unrealized gain (loss) on investments: | ||||
| Net realized gain on investments | 4,189 | |||
| Net change in unrealized depreciation on investments | (9,821,299 | ) | ||
| Net realized and unrealized loss on investments | (9,817,110 | ) | ||
| Net decrease in net assets resulting from operations | $ | (1,080,132 | ) | |
The accompanying notes are an integral part of these financial statements.
25
Pemberwick Fund
| STATEMENTS OF CHANGES IN NET ASSETS |
| Year Ended | Year Ended | |||||||
| March 31, 2020 | March 31, 2019 | |||||||
| Operations: | ||||||||
Net investment income | $ | 8,736,978 | $ | 9,118,238 | ||||
Net realized gain (loss) on investments | 4,189 | (118,386 | ) | |||||
Net change in unrealized | ||||||||
depreciation on investments | (9,821,299 | ) | (434,219 | ) | ||||
| Net increase (decrease) in net assets | ||||||||
| resulting from operations | (1,080,132 | ) | 8,565,633 | |||||
| Distributions to Shareholders From: | ||||||||
Distributable earnings | (8,766,061 | ) | (9,138,771 | ) | ||||
| Total distributions | (8,766,061 | ) | (9,138,771 | ) | ||||
| Capital Share Transactions: | ||||||||
Proceeds from shares sold | 78,775,456 | 191,436,335 | ||||||
Proceeds from shares issued to holders | ||||||||
in reinvestment of dividends | 8,821,509 | 8,989,855 | ||||||
Cost of shares redeemed | (95,277,156 | ) | (114,891,314 | ) | ||||
| Net increase (decrease) in net assets | ||||||||
| from capital share transactions | (7,680,191 | ) | 85,534,876 | |||||
| Total increase (decrease) in net assets | (17,526,384 | ) | 84,961,738 | |||||
| Net Assets: | ||||||||
Beginning of year | 365,281,459 | 280,319,721 | ||||||
End of year | $ | 347,755,075 | $ | 365,281,459 | ||||
| Changes in Shares Outstanding: | ||||||||
Shares sold | 7,857,262 | 19,188,022 | ||||||
Proceeds from shares issued to | ||||||||
holders in reinvestment of dividends | 882,676 | 902,596 | ||||||
Shares redeemed | (9,518,534 | ) | (11,539,728 | ) | ||||
Net increase (decrease) in shares outstanding | (778,596 | ) | 8,550,890 | |||||
The accompanying notes are an integral part of these financial statements.
26
Pemberwick Fund
| FINANCIAL HIGHLIGHTS |
| For a capital share outstanding throughout each period |
| Eleven | ||||||||||||||||||||||||
| Months | ||||||||||||||||||||||||
| Ended | Year Ended | |||||||||||||||||||||||
| Year Ended March 31, | March 31, | April 30, | ||||||||||||||||||||||
| 2020 | 2019 | 2018 | 2017* | 2016 | 2015 | |||||||||||||||||||
| Net Asset Value – | ||||||||||||||||||||||||
| Beginning of Period | $ | 9.97 | $ | 9.98 | $ | 10.03 | $ | 10.05 | $ | 10.06 | $ | 10.08 | ||||||||||||
| Income from | ||||||||||||||||||||||||
| Investment Operations: | ||||||||||||||||||||||||
Net investment income | 0.24 | 0.26 | 0.15 | 0.09 | 0.09 | 1 | 0.09 | 1 | ||||||||||||||||
Net realized and unrealized | ||||||||||||||||||||||||
gain (loss) on investments | (0.27 | ) | (0.01 | ) | (0.05 | ) | (0.02 | ) | (0.01 | ) | (0.02 | ) | ||||||||||||
| Total from investment operations | (0.03 | ) | 0.25 | 0.10 | 0.07 | 0.08 | 0.07 | |||||||||||||||||
| Less Distributions: | ||||||||||||||||||||||||
Dividends from net | ||||||||||||||||||||||||
investment income | (0.24 | ) | (0.26 | ) | (0.15 | ) | (0.09 | ) | (0.09 | ) | (0.09 | ) | ||||||||||||
| Total distributions | (0.24 | ) | (0.26 | ) | (0.15 | ) | (0.09 | ) | (0.09 | ) | (0.09 | ) | ||||||||||||
| Net Asset Value – End of Period | $ | 9.70 | $ | 9.97 | $ | 9.98 | $ | 10.03 | $ | 10.05 | $ | 10.06 | ||||||||||||
Total Return2 | -0.31 | % | 2.53 | % | 1.02 | % | 0.68 | %^ | 0.85 | % | 0.74 | % | ||||||||||||
| Ratios and Supplemental Data: | ||||||||||||||||||||||||
Net assets, end of period (thousands) | $ | 347,755 | $ | 365,281 | $ | 280,320 | $ | 184,098 | $ | 177,808 | $ | 169,980 | ||||||||||||
Ratio of operating expenses | ||||||||||||||||||||||||
to average net assets3: | ||||||||||||||||||||||||
| Before reimbursements | 0.40 | % | 0.39 | % | 0.42 | % | 0.67 | %+ | 0.74 | % | 0.74 | % | ||||||||||||
| After reimbursements | 0.30 | % | 0.29 | % | 0.32 | % | 0.40 | %+ | 0.39 | % | 0.39 | % | ||||||||||||
Ratio of net investment income | ||||||||||||||||||||||||
to average net assets3: | ||||||||||||||||||||||||
| Before reimbursements | 2.33 | % | 2.51 | % | 1.42 | % | 0.68 | %+ | 0.57 | % | 0.56 | % | ||||||||||||
| After reimbursements | 2.43 | % | 2.61 | % | 1.52 | % | 0.95 | %+ | 0.92 | % | 0.91 | % | ||||||||||||
Portfolio turnover rate | 30 | % | 24 | % | 38 | % | 17 | %^ | 45 | % | 35 | % | ||||||||||||
| + | Annualized |
| ^ | Not Annualized |
1 | The net investment income per share was calculated using the average shares outstanding method. |
2 | Total investment return is calculated assuming a purchase of shares on the first day and a sale of shares on the last day of each period reported and includes reinvestment of dividends and distributions, if any. |
3 | During the period, certain fees were waived. If such fee waivers had not occurred, the ratios would have been as indicated (See Note 4). |
| * | Fund changed its fiscal year from April 30 to March 31. |
The accompanying notes are an integral part of these financial statements.
27
Pemberwick Fund
| NOTES TO FINANCIAL STATEMENTS |
| March 31, 2020 |
NOTE 1 – ORGANIZATION
The Pemberwick Fund (the “Pemberwick Fund” or the “Fund”) is a series of Manager Directed Portfolios (the “Trust”). The Trust is registered under the Investment Company Act of 1940, as amended (the “1940 Act”), and was organized as a Delaware statutory trust on April 4, 2006. The Fund is an open-end investment management company and is a non-diversified series of the Trust. The Pemberwick Fund, a series of FundVantage Trust (the “Predecessor Fund”) was reorganized into a newly created series of the Trust (the “Reorganization”) pursuant to an Agreement and Plan of Reorganization dated November 1, 2016. The Reorganization was approved by the shareholders of the Predecessor Fund at a meeting held on November 17, 2016. The Predecessor Fund transferred all its assets to the Fund in exchange for shares of the Fund and the assumption by the Fund of all the known liabilities of the Predecessor Fund. The Predecessor Fund commenced operations on February 1, 2010. Pemberwick Investment Advisors LLC (“Pemberwick” or the “Advisor”) serves as the investment advisor to the Fund, and J.P. Morgan Investment Management Inc. (“J.P. Morgan” or the “Sub-Advisor”) serves as the sub-advisor to the Fund. Pemberwick and J.P. Morgan also served as the advisor and sub-advisor, respectively, to the Predecessor Fund. The Fund changed its fiscal year end from April 30 to March 31 in 2017. The investment objective of the Fund is to seek maximum current income that is consistent with liquidity and stability of principal.
NOTE 2 – SIGNIFICANT ACCOUNTING POLICIES
The following is a summary of significant accounting policies consistently followed by the Fund. These policies are in conformity with U.S. generally accepted accounting principles (“GAAP”). The Fund is an investment company and accordingly follows the investment company accounting and reporting guidance of the Financial Accounting Standards Board (“FASB”) Accounting Standard Codification Topic 946 Financial Services – Investment Companies.
| A. | Security Valuation: All investments in securities are recorded at their estimated fair value, as described in Note 3. |
| B. | Federal Income Taxes: It is the Fund’s policy to comply with the requirements of Subchapter M of the Internal Revenue Code applicable to regulated investment companies and to distribute substantially all of its taxable income to its shareholders. Therefore, no federal income or excise tax provisions are required. |
| The Fund recognizes the tax benefits of uncertain tax positions only where the position is “more likely than not” to be sustained assuming examination by tax authorities. Management has analyzed the Fund’s tax positions, and has concluded that no liability for unrecognized tax benefits should be recorded related to uncertain tax positions taken or expected to be taken on a tax return. The tax returns for the Fund for the prior three fiscal years are open for examination. The Fund identifies its major tax jurisdictions as U.S. Federal and the state of Delaware. |
28
Pemberwick Fund
| NOTES TO FINANCIAL STATEMENTS (Continued) |
| March 31, 2020 |
| C. | Securities Transactions, Income and Distributions: Securities transactions are accounted for on the trade date. Realized gains and losses on securities sold are determined on the basis of identified cost. Interest income is recorded on an accrual basis. Dividend income and distributions to shareholders are recorded on the ex-dividend date. Discounts and premiums on fixed income securities are amortized using the effective interest method. |
| The Fund distributes substantially all of its net investment income, if any, daily, and net realized capital gains, if any, annually. Distributions from net realized gains for book purposes may include short-term capital gains. All short-term capital gains are included in ordinary income for tax purposes. The amount of dividends and distributions to shareholders from net investment income and net realized capital gains is determined in accordance with federal income tax regulations, which differ from GAAP. To the extent these book/tax differences are permanent, such amounts are reclassified within the capital accounts based on their federal tax treatment. | |
| The Fund is charged for those expenses that are directly attributable to it, such as investment advisory, custody and transfer agent fees. Expenses that are not attributable to a Fund are typically allocated among the funds in the Trust proportionately based on allocation methods approved by the Board of Trustees (the “Board”). Common expenses of the Trust are typically allocated among the funds in the Trust based on a fund’s respective net assets, or by other equitable means. | |
| D. | Use of Estimates: The preparation of financial statements in conformity with GAAP requires management to make estimates and assumptions that affect the reported amounts of assets and liabilities at the date of the financial statements and the reported amounts of increases and decreases in net assets during the reporting period. Actual results could differ from those estimates. |
| E. | Redemption Fees: The Fund does not charge redemption fees to shareholders. |
| F. | Reclassification of Capital Accounts: GAAP requires that certain components of net assets relating to permanent differences be reclassified between financial and tax reporting. These reclassifications have no effect on net assets or net asset value per share. |
| G. | Events Subsequent to the Fiscal Year End: In preparing the financial statements as of March 31, 2020, management considered the impact of subsequent events for potential recognition or disclosure in the financial statements and had concluded that no additional disclosures are necessary. On November 25, 2019, U.S. Bancorp, the parent company of Quasar Distributors, LLC, the Fund’s distributor, announced that it had signed a purchase agreement to sell Quasar to Foreside Financial Group, LLC such that Quasar will become a wholly-owned broker-dealer subsidiary of Foreside. The transaction closed at the end of March 2020. Quasar will remain the Fund’s distributor. |
29
Pemberwick Fund
| NOTES TO FINANCIAL STATEMENTS (Continued) |
| March 31, 2020 |
| H. | Recent Accounting Pronouncements and Rule Issuances: In August 2018, FASB issued ASU 2018-13, Fair Value Measurement (Topic 820): Disclosure Framework—Changes to the Disclosure Requirements for Fair Value Measurement (“ASU 2018-13”). The primary focus of ASU 2018-13 is to improve the effectiveness of the disclosure requirements for fair value measurements. The changes affect all companies that are required to include fair value measurement disclosures. In general, the amendments in ASU 2018-13 are effective for all entities for fiscal years and interim periods within those fiscal years, beginning after December 15, 2019. An entity is permitted to early adopt the removed or modified disclosures upon the issuance of ASU 2018-13 and may delay adoption of the additional disclosures, which are required for public companies only, until their effective date. Management has evaluated the impact of this change in guidance, and due to the permissibility of early adoption, modified the Fund’s fair value disclosures for the current reporting period. |
NOTE 3 – SECURITIES VALUATION
The Fund has adopted authoritative fair value accounting standards which establish an authoritative definition of fair value and set out a hierarchy for measuring fair value. These standards require additional disclosures about the various inputs and valuation techniques used to develop the measurements of fair value, a discussion of changes in valuation techniques and related inputs during the period, and expanded disclosure of valuation levels for major security types. These inputs are summarized in the three broad levels listed below:
| Level 1 – | Unadjusted quoted prices in active markets for identical assets or liabilities that the Fund has the ability to access. |
| Level 2 – | Observable inputs other than quoted prices included in level 1 that are observable for the asset or liability, either directly or indirectly. These inputs may include quoted prices for the identical instrument on an inactive market, prices for similar instruments, interest rates, prepayment speeds, credit risk, yield curves, default rates and similar data. |
| Level 3 – | Unobservable inputs for the asset or liability, to the extent relevant observable inputs are not available, representing the Fund’s own assumptions about the assumptions a market participant would use in valuing the asset or liability, and would be based on the best information available. |
Following is a description of the valuation techniques applied to the Fund’s major categories of assets and liabilities measured at fair value on a recurring basis.
Debt Securities: Debt securities, including corporate bonds, asset-backed securities, mortgage-backed securities, municipal bonds, U.S. Treasuries, and U.S. government agency issues, are generally valued at market on the basis of valuations furnished by an independent pricing service that utilizes both dealer-supplied valuations and formula-based techniques. The pricing service may consider recently executed transactions in securities of
30
Pemberwick Fund
| NOTES TO FINANCIAL STATEMENTS (Continued) |
| March 31, 2020 |
the issuer or comparable issuers, market price quotations (where observable), bond spreads, and fundamental data relating to the issuer. In addition, the model may incorporate market observable data, such as reported sales of similar securities, broker quotes, yields, bids, offers, and reference data. Certain securities are valued primarily using dealer quotations. To the extent these securities are actively traded and valuation adjustments are not applied, they are categorized in level 2 of the fair value hierarchy.
Registered Investment Companies: Investments in registered investment companies (e.g., mutual funds) are generally priced at the ending NAV provided by the applicable registered investment company’s service agent and will be classified in Level 1 of the fair value hierarchy.
Short-Term Debt Securities: Short-term debt instruments having a maturity of less than 60 days are valued at the evaluated mean price supplied by an approved pricing service. Pricing services may use various valuation methodologies including matrix pricing and other analytical pricing models as well as market transactions and dealer quotations. In the absence of prices from a pricing service, the securities will be priced in accordance with the procedures adopted by the Board. Short-term debt securities are generally classified in Level 1 or Level 2 of the fair market hierarchy depending on the inputs used and market activity levels for specific securities.
The Board delegated day-to-day valuation issues to a Valuation Committee of the Trust which, as of March 31, 2020, was comprised of officers of the Trust. The function of the Valuation Committee is to value securities where current and reliable market quotations are not readily available, or the closing price does not represent fair value, by following procedures approved by the Board. These procedures consider many factors, including the type of security, size of holding, trading volume and news events. All actions taken by the Valuation Committee are subsequently reviewed and ratified by the Board.
Depending on the relative significance of the valuation inputs, fair valued securities may be classified in either level 2 or level 3 of the fair value hierarchy.
The inputs or methodology used for valuing securities are not an indication of the risk associated with investing in those securities. The following is a summary of the fair valuation hierarchy of the Fund’s securities as of March 31, 2020:
| Level 1 | Level 2 | Level 3 | Total | |||||||||||||
| Corporate Bonds and Notes | $ | — | $ | 295,564,028 | $ | — | $ | 295,564,028 | ||||||||
| Collateralized | ||||||||||||||||
| Mortgage Obligations | — | 8,723,146 | — | 8,723,146 | ||||||||||||
| U.S. Government | ||||||||||||||||
| Agency Obligations | — | 580,660 | — | 580,660 | ||||||||||||
| U.S. Treasury Obligations | — | 31,016,085 | — | 31,016,085 | ||||||||||||
| Short-Term Investments | 10,900,609 | — | — | 10,900,609 | ||||||||||||
| Total Investments | ||||||||||||||||
| in Securities | $ | 10,900,609 | $ | 335,883,919 | $ | — | $ | 346,784,528 | ||||||||
31
Pemberwick Fund
| NOTES TO FINANCIAL STATEMENTS (Continued) |
| March 31, 2020 |
NOTE 4 – INVESTMENT ADVISORY FEE AND OTHER TRANSACTIONS WITH AFFILIATES
For the year ended March 31, 2020, the Advisor provided the Fund with investment management services under an Investment Advisory Agreement. The Advisor furnishes all investment advice, office space, and facilities, and provides most of the personnel needed by the Fund. As compensation for its services, the Advisor is entitled to a monthly fee at an annual rate of 0.25% from the Fund based upon the average daily net assets of the Fund. For the year ended March 31, 2020, the Fund incurred $898,629 in advisory fees. Advisory fees payable at March 31, 2020 for the Fund were $45,030. The Advisor has hired J.P. Morgan Investment Management Inc. as a sub-advisor to manage the U.S. Treasuries and agency debt portion of the Fund. The Advisor pays the Sub-Advisor fee for the Pemberwick Fund from its own assets and these fees are not an additional expense of the Fund.
The Fund is responsible for its own operating expenses. The Advisor voluntarily waives 10 basis points of the annual investment advisory fee Pemberwick is entitled to receive from the Fund pursuant to the advisory agreement between Pemberwick and the Fund. Such waiver will continue until Pemberwick notifies the Fund of a change in its voluntary waiver or its discontinuation. For the year ended March 31, 2020, the Advisor voluntarily waived fees in the amount of $359,451. The fees waived by the Advisor are not subject to recoupment.
U.S. Bancorp Fund Services, LLC, doing business as U.S. Bank Global Fund Services, LLC (“Fund Services” or the “Administrator”) acts as the Fund’s Administrator under an Administration Agreement. The Administrator prepares various federal and state regulatory filings, reports and returns for the Fund; prepares reports and materials to be supplied to the Trustees; monitors the activities of the Fund’s custodian, transfer agent and accountants; coordinates the preparation and payment of the Fund’s expenses and reviews the Fund’s expense accruals. Fund Services also serves as the fund accountant and transfer agent to the Fund. Vigilant Compliance, LLC serves as the Chief Compliance Officer to the Fund. U.S. Bank N.A., an affiliate of Fund Services, serves as the Fund’s custodian. For the year ended March 31, 2020, the Fund incurred the following expenses for administration, fund accounting, transfer agency and custody fees:
| Administration and fund accounting | $ | 320,832 | ||
| Custody | $ | 34,492 | ||
Transfer agency(a) | $ | 25,744 |
(a) | Does not include out-of-pocket expenses. |
At March 31, 2020, the Fund had payables due to Fund Services for administration, fund accounting and transfer agency fees and to U.S. Bank N.A. for custody fees in the following amounts:
| Administration and fund accounting | $ | 78,572 | ||
| Custody | $ | 8,680 | ||
Transfer agency(a) | $ | 6,414 |
(a) | Does not include out-of-pocket expenses. |
32
Pemberwick Fund
| NOTES TO FINANCIAL STATEMENTS (Continued) |
| March 31, 2020 |
Quasar Distributors, LLC (the “Distributor”) acts as the Fund’s principal underwriter in a continuous public offering of the Fund’s shares. The Distributor is an affiliate of the Administrator. A Trustee of the Trust is deemed to be an interested person of the Trust due to his former position with the Distributor.
Certain officers of the Fund are employees of the Administrator and are not paid any fees by the Fund for serving in such capacities.
NOTE 5 – SECURITIES TRANSACTIONS
For the year ended March 31, 2020, the cost of purchases and the proceeds from sales of securities, excluding short-term securities, were as follows:
| Purchases | |||||
U.S. Government Obligations | $ | 10,518,364 | |||
Other | $ | 95,226,039 | |||
| Sales | |||||
U.S. Government Obligations | $ | 14,531,935 | |||
Other | $ | 119,489,945 | |||
NOTE 6 – INCOME TAXES AND DISTRIBUTIONS TO SHAREHOLDERS
As of March 31, 2020, the components of accumulated earnings/(losses) on a tax basis were as follows:
Cost of investments(a) | $ | 357,938,107 | |||
| Gross unrealized appreciation | 996,524 | ||||
| Gross unrealized depreciation | (12,150,103 | ) | |||
| Net unrealized depreciation | (11,153,579 | ) | |||
| Undistributed ordinary income | 426 | ||||
| Undistributed long-term capital gain | — | ||||
| Total distributable earnings | 426 | ||||
| Other accumulated gains/(losses) | (826,274 | ) | |||
| Total accumulated earnings/(losses) | $ | (11,979,427 | ) |
(a) | The difference between the book basis and tax basis net unrealized appreciation and cost is attributable primarily to wash sales. |
At March 31, 2020, the Fund had short-term tax basis capital losses of $(211,798) with no expiration date and long-term tax basis capital losses of $(614,476) with no expiration date.
The tax character of distributions paid during the year ended March 31, 2020, and the year ended March 31, 2019 was as follows:
| Year Ended | Year Ended | ||
March 31, 2020 | March 31, 2019 | ||
Ordinary income | $8,766,061 | $9,138,771 |
33
Pemberwick Fund
| NOTES TO FINANCIAL STATEMENTS (Continued) |
| March 31, 2020 |
NOTE 7 – PRINCIPAL RISKS
The following is a list of certain risks that may apply to your investment in the Fund. Further information about investment risks is available in the Fund’s Statement of Additional Information.
Credit Risk: Credit risk is the risk that an issuer will not make timely payments of principal and interest. A credit rating assigned to a particular debt security is essentially the opinion of a nationally recognized statistical rating organization (“NRSRO”) as to the credit quality of an issuer and may prove to be inaccurate. There is also the risk that a bond issuer may “call,” or repay, its high yielding bonds before their maturity dates.
Concentration Risk: By concentrating its assets in the banking industry, the Fund is subject to the risk that economic, business, political or other conditions that have a negative effect on the banking industry will negatively impact the Fund to a greater extent than if the Fund’s assets were diversified across different industries or sectors.
Deflation Risk: Deflation to the U.S. economy may cause principal to decline and inflation-linked securities could underperform securities whose interest payments are not adjusted for inflation or linked to a measure of inflation.
Fixed Income Market Risks: Fixed-income securities are or may be subject to interest rate, credit, liquidity, prepayment and extension risks. There is also the risk that an issuer may “call,” or repay, its high yielding bonds before their maturity dates. Fixed-income securities subject to prepayment can offer less potential for gains during a declining interest rate environment and similar or greater potential for loss in a rising interest rate environment. Limited trading opportunities for certain fixed-income securities may make it more difficult to sell or buy a security at a favorable price or time.
Interest Rate Risk: Interest rates may go up resulting in a decrease in the value of the securities held by the Fund. Interest rates have been historically low, so the Fund faces a heightened risk that interest rates may rise. Debt securities subject to prepayment can offer less potential for gains during a declining interest rate environment and similar or greater potential for loss in a rising interest rate environment.
Management Risk: The Advisor’s or Sub-Advisor’s judgments about the attractiveness, value and potential appreciation of the Fund’s investments may prove to be incorrect and the investment strategies employed by the Advisor and the Sub-Advisor in selecting investments for the Fund may not result in an increase in the value of your investment or in overall performance equal to other similar investment vehicles having similar investment strategies.
Market Risk: Certain investments selected for the Fund’s portfolio may be worth less than the price originally paid for them, or less than they were worth at an earlier time. The value of the Fund’s investments may go up or down, sometimes dramatically and unpredictably, based on current market conditions, such as real or perceived adverse political or economic conditions, inflation, changes in interest rates, lack of liquidity in the fixed income markets or adverse investor sentiment.
34
Pemberwick Fund
| NOTES TO FINANCIAL STATEMENTS (Continued) |
| March 31, 2020 |
Recent Market Events; Market Risk. Market risk may affect a single issuer, industry, sector of the economy or the market as a whole. U.S. and international markets experienced significant volatility in recent months and years due to a number of economic, political and global macro factors including the impact of the coronavirus as a global pandemic and related public health issues, growth concerns in the U.S. and overseas, uncertainties regarding interest rates, trade tensions and the threat of tariffs imposed by the U.S. and other countries. In particular, the spread of the novel coronavirus worldwide has resulted in disruptions to supply chains and customer activity, stress on the global healthcare system, rising unemployment claims, quarantines, cancellations, market declines, the closing of borders, restrictions on travel and widespread concern and uncertainty. Health crises and related political, social and economic disruptions caused by the spread of the recent coronavirus outbreak may also exacerbate other pre-existing political, social and economic risks in certain countries. It is not possible to know the extent of these impacts, and they may be short term or may last for an extended period of time. These developments as well as other events, such as the U.S. presidential election, could result in further market volatility and negatively affect financial asset prices, the liquidity of certain securities and the normal operations of securities exchanges and other markets, despite government efforts to address market disruptions. In addition, the Fund may face challenges with respect to its day-to-day operations if key personnel of the Advisor or other service providers are unavailable due to quarantines and restrictions on travel related to the coronavirus outbreak. Global economies and financial markets are increasingly interconnected, which increases the probabilities that conditions in one country or region might adversely impact issues in a different country or region.
Non-Diversification Risk: Because the Fund is “non-diversified,” it may invest a greater percentage of its assets in the securities of a single issuer. As a result, a decline in the value of an investment in a single issuer could cause the Fund’s overall value to decline to a greater degree than if the Fund held a more diversified portfolio.
Prepayment Risk: In times of declining interest rates, the Fund’s higher yielding securities will be prepaid, and the Fund will have to replace them with securities having a lower yield.
U.S. Government Agencies and Instrumentalities Securities Risk: Securities issued by U.S. Government agencies and instrumentalities have different levels of U.S. Government credit support. Some are backed by the full faith and credit of the U.S. Government, while others are supported by only the discretionary authority of the U.S. Government or only by the credit of the agency or instrumentality. No assurance can be given that the U.S. Government will provide financial support to U.S. Government-sponsored instrumentalities because they are not obligated to do so by law. Guarantees of timely prepayment of principal and interest do not assure that the market prices and yields of the securities are guaranteed nor do they guarantee the net asset value or performance of the Fund, which will vary with changes in interest rates, the Advisor’s success and other market conditions.
35
Pemberwick Fund
| NOTES TO FINANCIAL STATEMENTS (Continued) |
| March 31, 2020 |
NOTE 8 – GUARANTEES AND INDEMNIFICATION
In the normal course of business, the Fund enters into contracts that contain a variety of representations and warranties and which provide general indemnifications. The Fund’s maximum exposure under these arrangements is unknown, as this would involve future claims that may be made against the Fund that have not yet occurred. However, based on experience, the Fund expects the risk of loss to be remote.
NOTE 9 – CONTROL OWNERSHIP
The beneficial ownership, either directly or indirectly of more than 25% of the voting securities of a Fund creates a presumption of control of the Fund, under Section 2(a)(9) of the Investment Company Act of 1940. While no individual shareholder has a position which exceeds 25% of the voting securities of the Fund, there are numerous shareholders who are affiliated with the Advisor. As of March 31, 2020, investors who are affiliated with the Advisor, when aggregated, owned 100% of the voting securities of the Fund.
36
Pemberwick Fund
| REPORT OF INDEPENDENT REGISTERED PUBLIC ACCOUNTING FIRM |
To the Board of Trustees of Manager Directed Portfolios
and the Shareholders of Pemberwick Fund
Opinion on the Financial Statements
We have audited the accompanying statement of assets and liabilities of Pemberwick Fund, a series of Manager Directed Portfolios (the “Fund”), including the schedule of investments, as of March 31, 2020, and the related statement of operations for the year then ended, the statements of changes in net assets for each of the years in the two-year period then ended and the financial highlights for each of the years in the three-year period then ended and for the period from May 1, 2016 through March 31, 2017, and the related notes (collectively referred to as the “financial statements”). In our opinion, the financial statements present fairly, in all material respects, the financial position of the Fund as of March 31, 2020, and the results of its operations for the year then ended, the changes in its net assets for each of the years in the two-year period then ended and its financial highlights for each of the years in the three-year period then ended and for the period from May 1, 2016 through March 31, 2017, in conformity with accounting principles generally accepted in the United States of America. The financial highlights for each of the two years in the period ended April 30, 2016 were audited by other auditors, whose report dated June 28, 2016 expressed an unqualified opinion on such financial highlights
Basis for Opinion
These financial statements are the responsibility of the Fund’s management. Our responsibility is to express an opinion on the Fund’s financial statements based on our audits. We are a public accounting firm registered with the Public Company Accounting Oversight Board (United States) (“PCAOB”) and are required to be independent with respect to the Fund in accordance with the U.S. federal securities law and the applicable rules and regulations of the Securities and Exchange Commission and the PCAOB.
We conducted our audits in accordance with the standards of the PCAOB. Those standards require that we plan and perform the audits to obtain reasonable assurance about whether the financial statements are free of material misstatement, whether due to error or fraud. The Fund is not required to have, nor were we engaged to perform, an audit of its internal control over financial reporting. As part of our audits we are required to obtain an understanding of internal control over financial reporting but not for the purpose of expressing an opinion on the effectiveness of the Fund’s internal control over financial reporting. Accordingly, we express no such opinion.
Our audits included performing procedures to assess the risk of material misstatement of the financial statements, whether due to error or fraud, and performing procedures that respond to those risks. Such procedures included examining, on a test basis, evidence regarding the amounts and disclosures in the financial statements. Our procedures included confirmation of securities owned as of March 31, 2020 by correspondence with the custodian or by other appropriate auditing procedures where replies from brokers were not received. Our audits also included evaluating the accounting principles used and significant estimates made by management, as well as evaluating the overall presentation of the financial statements. We believe that our audits provide a reasonable basis for our opinion.

BBD, LLP
We have served as the auditor of one or more of the Funds in the Manager Directed Portfolios and the former trust since 2007.
Philadelphia, Pennsylvania
May 28, 2020
37
Pemberwick Fund
| EXPENSE EXAMPLE |
| March 31, 2020 (Unaudited) |
As a shareholder of the Fund, you incur two types of costs: (1) transaction costs including sales charges (loads) and redemption fees, if applicable; and (2) ongoing costs, including management fees; and other Fund expenses. This Example is intended to help you understand your ongoing costs (in dollars) of investing in the Fund and to compare these costs with the ongoing costs of investing in other mutual funds.
The Example is based on an investment of $1,000 invested at the beginning of the period indicated and held for the entire period from October 1, 2019 to March 31, 2020.
Actual Expenses
The information in the table under the heading “Actual” provides information about actual account values and actual expenses. You may use the information in these columns together with the amount you invested, to estimate the expenses that you paid over the period. Simply divide your account value by $1,000 (for example, an $8,600 account value divided by $1,000 = 8.6), then multiply the result by the number in the row entitled “Expenses Paid During Period” to estimate the expenses you paid on your account during this period. There are some account fees that are charged to certain types of accounts, such as Individual Retirement Accounts (generally, a $15 fee is charged to the account annually) that would increase the amount of expenses paid on your account. The example below does not include portfolio trading commissions and related expenses and other extraordinary expenses as determined under generally accepted accounting principles.
Hypothetical Example for Comparison Purposes
The information in the table under the heading “Hypothetical (5% return before expenses)” provides information about hypothetical account values and hypothetical expenses based on the Fund’s actual expense ratio and assumed rate of return of 5% per year before expenses, which is not the Fund’s actual return. The hypothetical account values and expenses may not be used to estimate the actual ending account balance or expenses you paid for the period. You may use this information to compare the ongoing costs of investing in the Fund and other funds. To do so, compare this 5% hypothetical example with the 5% hypothetical examples that appear in the shareholder reports of the other funds. As noted above, there are some account fees that are charged to certain types of accounts that would increase the amount of expense paid on your account.
Please note that the expenses shown in the table are meant to highlight your ongoing costs only and do not reflect any transaction costs, such as sales charges (loads), redemption fees, or exchange fees. Therefore, the information under the heading “Hypothetical (5% return before expenses)” is useful in comparing ongoing costs only, and will not help you determine the relative total costs of owning different funds. In addition, if these transactional costs were included, your costs would have been higher.
38
Pemberwick Fund
| EXPENSE EXAMPLE (Continued) |
| March 31, 2020 (Unaudited) |
| Beginning | Ending | Expenses Paid | |
| Account Value | Account Value | During Period(1) | |
10/1/2019 | 3/31/2020 | 10/1/2019 – 3/31/2020 | |
| Actual | |||
| Total Fund | $1,000.00 | $ 978.60 | $1.43 |
| Hypothetical (5% return | |||
| before expenses) | |||
| Total Fund | $1,000.00 | $1,023.55 | $1.47 |
(1) | Expenses are equal to the fund’s annualized expense ratio of 0.29%, multiplied by the average account value over the period, multiplied by 183/366 (to reflect the period). |
39
Pemberwick Fund
| NOTICE TO SHAREHOLDERS |
| at March 31, 2020 (Unaudited) |
How to Obtain a Copy of the Fund’s Proxy Voting Policies
A description of the policies and procedures that the Fund uses to determine how to vote proxies relating to portfolio securities is available without charge, upon request, by calling 1-888-893-4491 or on the U.S. Securities and Exchange Commission’s (“SEC”) website at http://www.sec.gov.
How to Obtain a Copy of the Fund’s Proxy Voting Records for the most recent 12-Month Period Ended June 30
Information regarding how the Fund voted proxies relating to portfolio securities during the most recent 12-month period ended June 30 is available no later than August 31 without charge, upon request, by calling 1-888-893-4491. Furthermore, you can obtain the Fund’s proxy voting records on the SEC’s website at http://www.sec.gov.
Quarterly Filings on Form N-Q
The Fund files its complete schedule of portfolio holdings with the SEC for the first and third quarters of each fiscal year on Form N-Q or Part F of Form N-PORT (beginning with filings after March 31, 2020). The Fund’s Form N-Q or Part F of Form N-PORT (beginning with filings after March 31, 2020) is available on the SEC’s website at http://www.sec.gov. Information included in the Fund’s Form N-Q or Part F of Form N-PORT (beginning with filings after March 31, 2020) is also available, upon request, by calling 1-888-893-4491.
Householding
In an effort to decrease costs, the Fund intends to reduce the number of duplicate prospectuses and annual and semi-annual reports you receive by sending only one copy of each to those addresses shared by two or more accounts and to shareholders the Transfer Agent reasonably believes are from the same family or household. Once implemented, if you would like to discontinue householding for your accounts, please call toll-free at 1-888-893-4491 to request individual copies of these documents. Once the Transfer Agent receives notice to stop householding, the Transfer Agent will begin sending individual copies thirty days after receiving your request. This policy does not apply to account statements.
40
Pemberwick Fund
| TRUSTEES AND OFFICERS |
| (Unaudited) |
The business and affairs of the Trust are managed under the oversight of the Board, subject to the laws of the State of Delaware and the Trust’s Agreement and Declaration of Trust. The Board is currently comprised of three trustees who are not interested persons of the Trust within the meaning of the 1940 Act (the “Independent Trustees”) and one interested person of the Trust (the “Interested Trustee”). The Trustees are responsible for deciding matters of overall policy and overseeing the actions of the Trust’s service providers. The officers of the Trust conduct and supervise the Trust’s daily business operations.
| Number of | Other | |||
| Funds | Directorships | |||
| Position(s) Held | in Fund | Held by | ||
| Name, | with the Trust | Complex | Trustee | |
| (Year of Birth) | and Length of | Principal Occupation(s) | Overseen by | During the |
and Address(1) | Time Served(3) | During Past Five Years | Trustee | Past Five Years |
| INTERESTED TRUSTEE | ||||
| James R. | Trustee and | Distribution consultant since | 9 | None |
Schoenike(2) | Chairman | 2018, President and CEO, | ||
| (Born 1959) | since | Board of Managers, Quasar | ||
| July 2016 | Distributors, LLC (2013 – 2018). | |||
| INDEPENDENT TRUSTEES | ||||
| Gaylord B. Lyman | Trustee and Audit | Senior Portfolio Manager, | 9 | None |
| (Born 1962) | Committee | Affinity Investment Advisors, | ||
| Chairman, since | LLC, since 2017; Managing | |||
| April 2015 | Director of Kohala Capital | |||
| Partners, LLC (2011 – 2016). | ||||
| Scott Craven Jones | Trustee since | Managing Director, Carne | 9 | Trustee, |
| (Born 1962) | July 2016 | Global Financial Services | Madison Funds, | |
| and Lead | (US) LLC (a provider of | since 2019 | ||
| Independent | independent governance and | (18 portfolios); | ||
| Trustee since | distribution support for the | Trustee, XAI | ||
| May 2017 | asset management industry), | Octagon Floating | ||
| since 2013. | Rate & | |||
| Alternative | ||||
| Income Term | ||||
| Trust, since 2017 | ||||
| (2 portfolios); | ||||
| Director, | ||||
| Guestlogix Inc. | ||||
| (a provider of | ||||
| ancillary-focused | ||||
| technology to the | ||||
| travel industry) | ||||
| (2015 – 2016). | ||||
41
Pemberwick Fund
| TRUSTEES AND OFFICERS (Continued) |
| (Unaudited) |
| Number of | Other | |||
| Funds | Directorships | |||
| Position(s) Held | in Fund | Held by | ||
| Name, | with the Trust | Complex | Trustee | |
| (Year of Birth) | and Length of | Principal Occupation(s) | Overseen by | During the |
and Address(1) | Time Served(3) | During Past Five Years | Trustee | Past Five Years |
| Lawrence T. | Trustee since | Senior Vice President and | 9 | None |
| Greenberg | July 2016 | Chief Legal Officer, The Motley | ||
| (Born 1963) | Fool Holdings, Inc., since 1996; | |||
| Venture Partner and General | ||||
| Counsel, Motley Fool Ventures LP, | ||||
| since 2018; Manager, Motley | ||||
| Fool Wealth Management, LLC, | ||||
| since 2013; Adjunct Professor, | ||||
| Washington College of Law, | ||||
| American University, since 2006; | ||||
| General Counsel Motley Fool | ||||
| Asset Management, LLC | ||||
| (2008 - 2019). |
(1) | The address of each Trustee as it relates to the Trust’s business is c/o U.S. Bank Global Fund Services, 615 East Michigan Street, Milwaukee, WI 53202. |
(2) | Mr. Schoenike is an Interested Trustee by virtue of the fact that he was recently President of Quasar Distributors, LLC, the Fund’s distributor (the “Distributor”). |
(3) | Each Trustee serves during the continued lifetime of the Trust until he dies, resigns, is declared bankrupt or incompetent by a court of competent jurisdiction, or is removed. |
42
Pemberwick Fund
| TRUSTEES AND OFFICERS (Continued) |
| (Unaudited) |
As of the date of this report, no Independent Trustee nor any of his immediate family members (i.e., spouse or dependent children) serves as an officer or director or is an employee of the Advisor, Sub-Advisor or Distributor, or any of their respective affiliates, nor is such person an officer, director or employee of any company controlled by or under common control with such entities.
| Name | Position(s) Held with | |
| (Year of Birth) | the Trust and Length | |
and Address | of Time Served(3) | Principal Occupation(s) During Past Five Years |
OFFICERS | ||
Douglas J. Neilson(1) | President and Principal | Vice President, Compliance and Administration, |
(Born 1975) | Executive Officer, since | Fund Services, since 2001 |
July 1, 2016 | ||
Matthew J. McVoy(1) | Treasurer and Principal | Assistant Vice President, Compliance and |
(Born 1980) | Financial Officer, | Administration, Fund Services, since 2005 |
since July 1, 2016 | ||
Justin Dausch(2) | Chief Compliance | Director, Vigilant, since 2017; Compliance Associate, |
(Born 1989) | Officer and Anti- | HSBC (investment banking company), 2015 – 2017 |
Money Laundering | ||
Compliance Officer, | ||
since January 1, 2020 | ||
Alyssa M. Bernard(1) | Secretary, since | Assistant Vice President, Compliance and |
(Born 1988) | August 20, 2019 | Administration, Fund Services, since 2018; Attorney, |
Mutual Fund Disclosure, Waddell & Reed Financial, | ||
Inc., 2017 – 2018; Attorney, Corporate Governance, | ||
American Century Companies, Inc., 2014 – 2017 |
(1) | The mailing address of this officer is: 615 East Michigan Street, Milwaukee, Wisconsin 53202. |
(2) | The mailing address of this officer is: 223 Wilmington West Chester Pike, Suite 216, Chadds Ford, Pennsylvania 19317. |
(3) | Each officer is elected annually and serves until his or her successor has been duly elected and qualified. |
The Statement of Additional Information includes additional information about the Fund’s Trustees and Officers and is available, without charge, upon request by calling 1-888-893-4491.
43
Pemberwick Fund
| APPROVAL OF PEMBERWICK FUND INVESTMENT ADVISORY AGREEMENT |
| AND SUB-ADVISORY AGREEMENT (Unaudited) |
The Board of Trustees (the “Board”) of Manager Directed Portfolios (the “Trust”) met on November 12, 2019 to consider the renewal of the Investment Advisory Agreement (the “Advisory Agreement”) between the Trust, on behalf of the Pemberwick Fund (the “Fund”), a series of the Trust, and the Fund’s investment adviser, Pemberwick Investment Advisers, LLC (“Pemberwick”), and the investment sub-advisory agreement (the “Sub-Advisory Agreement”) between Pemberwick and J.P. Morgan Investment Management Inc. (“JPMIM”). At this meeting, and at a prior meeting held on October 28, 2019, the Board requested and received materials to assist it in considering the approval of the Advisory Agreement and the Sub-Advisory Agreement. The materials provided contained information with respect to the factors enumerated below, including copies of the Advisory Agreement and Sub-Advisory Agreement, a memorandum prepared by the Trust’s outside legal counsel discussing the Board’s fiduciary obligations and the factors the Board should consider in the renewal of the Advisory Agreement and Sub-Advisory Agreement, detailed comparative information relating to the performance of the Fund, as well as the management fee and other expenses of the Fund, due diligence materials relating to Pemberwick and JPMIM, including Pemberwick’s and JPMIM’s Form ADV, and other pertinent information. Based on their evaluation of the information provided as part of the November 12, 2019 and October 28, 2019 meetings, as well as information provided by Pemberwick and JPMIM over the course of the year, the Trustees (including a majority of the Trustees who are not “interested persons,” as that term is defined in the Investment Company Act of 1940, as amended (the “Independent Trustees”)), approved the continuation Advisory Agreement and Sub-Advisory Agreement, each for an additional one-year term. The Independent Trustees also met in executive session with legal counsel to review their duties in considering the Advisory Agreement and Sub-Advisory Agreement and the information provided. Below is a summary of the material factors considered by the Board and the conclusions that formed the basis for the Board’s approval of the Advisory Agreement and the Sub-Advisory Agreement.
| 1. | NATURE, EXTENT AND QUALITY OF SERVICES PROVIDED TO THE FUND |
The Trustees considered the nature, extent and quality of services provided by Pemberwick and JPMIM to the Fund. The Board considered the services provided by Pemberwick, including sub-adviser evaluation and oversight, security selection, and compliance, as well as the portfolio management and trading services provided by JPMIM. The Trustees considered the specific responsibilities of Pemberwick and JPMIM in all aspects of day-to-day management of the Fund, as well as the qualifications, experience and responsibilities of the Fund’s portfolio managers and overall resources available to the Fund through Pemberwick, JPMIM and their affiliates. The Trustees reviewed the information provided by Pemberwick and JPMIM in a due diligence questionnaire, including each firm’s experience and a summary of each firm’s compliance program, and Pemberwick’s continuing commitment to the Fund. The Trustees noted that they had met with representatives of Pemberwick in person at an earlier meeting to
44
Pemberwick Fund
| APPROVAL OF PEMBERWICK FUND INVESTMENT ADVISORY AGREEMENT |
| AND SUB-ADVISORY AGREEMENT (Unaudited) (Continued) |
discuss Pemberwick and JPMIM’s services to the Fund and various performance, marketing and compliance updates. The Trustees discussed Pemberwick’s and JPMIM’s compliance programs, including the reports of the Trust’s chief compliance officer to the Trustees on the effectiveness of Pemberwick’s and JPMIM’s compliance programs. The Trustees concluded that Pemberwick and JPMIM had sufficient quality and depth of personnel, resources, investment methods and compliance policies and procedures essential to performing their duties under the Advisory Agreement and Sub-Advisory Agreement, respectively, and that the nature, overall quality and extent of the management services provided to the Fund were satisfactory.
| 2. | INVESTMENT PERFORMANCE OF THE FUND AND THE SUB-ADVISER |
The Trustees discussed the performance of both the Fund and the sleeve managed by JPMIM for the year-to-date, one-year, three-year, five-year, and since inception periods ended June 30, 2019. In assessing the quality of the portfolio management services delivered by Pemberwick, the investment adviser, and JPMIM, the investment sub-adviser, the Trustees compared the performance of both the Fund and the sleeve managed by JPMIM, on an absolute basis and in comparison to the Bloomberg Barclays 1-3 Year U.S. Government/Credit Index. The Trustees noted that Pemberwick does not manage any accounts or composites of other separately managed accounts that are similar to the Fund in terms of investment strategy. The Trustees also reviewed information on the historical performance of a composite of other separately-managed accounts of JPMIM that are similar to the sleeve of the Fund that it manages in terms of investment strategy.
The Trustees noted the Fund outperformed the Bloomberg Barclays 1-3 Year U.S. Government/Credit Index for the three-year period ended June 30, 2019 and underperformed the Bloomberg Barclays 1-3 Year U.S. Government/Credit Index for the one-year, five-year, and since inception periods ended June 30, 2019. The Trustees further noted that the sleeve managed by JPMIM underperformed the Bloomberg Barclays 1-3 Year U.S. Government/Credit Index in all relevant time periods. The Trustees discussed the factors that accounted for the underperformance of both the Fund and the sleeve of the Fund managed by JPMIM, as discussed with Pemberwick.
After considering all of the information, the Trustees concluded the performance obtained by Pemberwick as the adviser and JPMIM as the subadviser of the Fund was satisfactory under applicable market conditions. Although past performance is not a guarantee or indication of future results, the Trustees determined that the Fund and its shareholders were likely to benefit from Pemberwick and JPMIM’s continued management.
| 3. | COSTS OF SERVICES PROVIDED AND PROFITS REALIZED BY THE ADVISER | |
The Trustees considered the cost of services provided by Pemberwick and Pemberwick’s advisory fee, including a review of comparative expense information and other pertinent material with respect to the Pemberwick Fund. The Trustees reviewed the
45
Pemberwick Fund
| APPROVAL OF PEMBERWICK FUND INVESTMENT ADVISORY AGREEMENT |
| AND SUB-ADVISORY AGREEMENT (Unaudited) (Continued) |
related statistical information and other materials provided, including the comparative expenses and peer group data. The Trustees considered the cost structure of the Fund relative to the Morningstar Peer Group.
The Trustees also considered the overall profitability of Pemberwick, reviewing Pemberwick’s financial information. The Trustees also examined a profitability analysis prepared by Pemberwick based on the fees payable under the Advisory Agreement. The Trustees noted that Pemberwick continues to voluntarily waive 0.10% of its management fee.
The Trustees noted that the Fund’s contractual management fee of 0.25% fell in the first quartile, and was below the Morningstar Peer Group average of 0.35%, which fell between the second and third quartiles. The Trustees observed that the Fund’s total expense ratio of 0.39% fell within the first quartile, while the average of 0.51% for the Morningstar Peer Group fell near the top of the second quartile. The Trustees noted that the Fund is the sole client of Pemberwick, so there are no separately managed accounts available for comparison. The Trustees concluded that the Fund’s expenses and the management fees paid to Pemberwick were fair and reasonable in light of the comparative performance, expense and management fee information. The Trustees concluded that Pemberwick’s level of profitability from its relationship with the Fund was reasonable.
The Trustees then considered the sub-advisory fee paid to JPMIM by Pemberwick for the services provided as the Fund’s sub-adviser, including Pemberwick’s discussion of the appropriateness of the subadvisory fee. The Trustees concluded that the sub-advisory fee paid to JPMIM by Pemberwick was reasonable. The Trustees also noted that the sub-advisory fee is paid by Pemberwick, not the Fund.
| 4. | EXTENT OF ECONOMIES OF SCALE AS THE FUND GROWS |
The Trustees compared the Fund’s expenses to the Morningstar Peer Group and discussed realized and potential economies of scale. The Trustees also reviewed the structure of the Fund’s management fee and whether the Fund was large enough to generate economies of scale for shareholders or whether economies of scale would be expected to be realized as Fund assets grow (and if so, how those economies of scale were being or would be shared with shareholders). The Trustees noted that the Fund’s management fee structure did not contain any breakpoint reductions as the Fund’s assets grow in size but was already set at an extremely low level and that Pemberwick has historically voluntarily waived a portion of its management fee. The Trustees concluded that the current fee structure was reasonable and reflects a sharing of economies of scale between Pemberwick and the Fund at the Fund’s current asset level.
Because the sub-advisory fees payable to JPMIM is not paid by the Fund, the Trustees did not consider whether the sub-advisory fees should reflect any potential economies of scale that might be realized as the Fund’s assets increase.
46
Pemberwick Fund
| APPROVAL OF PEMBERWICK FUND INVESTMENT ADVISORY AGREEMENT |
| AND SUB-ADVISORY AGREEMENT (Unaudited) (Continued) |
| 5. | BENEFITS DERIVED FROM THE RELATIONSHIP WITH THE FUND |
Based on the information presented, the Trustees did not consider any direct or indirect benefits that could be realized by Pemberwick and JPMIM from their association with the Fund to be material factors.
CONCLUSIONS
The Trustees considered all of the foregoing factors. In considering the renewal of the Advisory Agreement and the Sub-Advisory Agreement, the Trustees did not identify any one factor as all-important, but rather considered these factors collectively in light of the Fund’s surrounding circumstances. Based on this review, the Trustees, including a majority of the Independent Trustees, approved the continuation of the Advisory Agreement and Sub-Advisory Agreement, each for an additional term ending November 30, 2020, as being in the best interests of the Fund and its shareholders.
47
Pemberwick Fund
| NOTICE OF PRIVACY POLICY & PRACTICES |
Protecting the privacy of Fund shareholders is important to us. The following is a description of the practices and policies through which we protect the privacy and security of your non-public personal information.
What Information We Collect
We collect and maintain information about you so that we can open and maintain your account in the Fund and provide various services to you. We collect non-public personal information about you from the following sources:
| • | information we receive about you on applications or other forms; | |
| • | information you give us orally; and | |
| • | information about your transactions with us or others. |
The types of non-public personal information we collect and share can include:
| • | social security number; | |
| • | account balances; | |
| • | account transactions; | |
| • | transaction history; | |
| • | wire transfer instructions; and | |
| • | checking account information. |
What Information We Disclose
We do not disclose any non-public personal information about shareholders or former shareholders of the Fund without the shareholder’s authorization, except as permitted by law or in response to inquiries from governmental authorities. We may share information with affiliated parties and unaffiliated third parties with whom we have contracts for servicing the Fund. We will provide unaffiliated third parties with only the information necessary to carry out their assigned responsibility.
How We Protect Your Information
All shareholder records will be disposed of in accordance with applicable law. We maintain physical, electronic and procedural safeguards to protect your non-public personal information and require third parties to treat your non-public personal information with the same high degree of confidentiality.
In the event that you hold shares of the Fund through a financial intermediary, including, but not limited to, a broker-dealer, bank or trust company, the privacy policy of your financial intermediary would govern how your non-public personal information would be shared with unaffiliated third parties.
If you have any questions or concerns regarding this notice or our Privacy Policy, please contact us at 1-888-893-4491.
48
(This Page Intentionally Left Blank.)
Investment Advisor
Pemberwick Investment Advisors LLC
777 West Putnam Avenue
Greenwich, CT 06830
Distributor
Quasar Distributors, LLC
777 East Wisconsin Avenue, 6th Floor
Milwaukee, WI 53202
Transfer Agent
U.S. Bancorp Fund Services, LLC
615 East Michigan Street
Milwaukee, WI 53202
(888) 893-4491
Custodian
U.S. Bank National Association
Custody Operations
1555 North River Center Drive, Suite 302
Milwaukee, WI 53212
Independent Registered Public Accounting Firm
BBD, LLP
1835 Market Street, 3rd floor
Philadelphia, PA 19103
Legal Counsel
Godfrey & Kahn S.C.
833 East Michigan Street, Suite 1800
Milwaukee, WI 53202
This report is intended for shareholders of the Fund and may not be used as sales literature unless preceded or accompanied by a current prospectus.
Past performance results shown in this report should not be considered a representation of future performance. Share price and returns will fluctuate so that shares, when redeemed, may be worth more or less than their original cost. Statements and other information herein are dated and are subject to change.
Item 2. Code of Ethics.
The registrant has adopted a code of ethics that applies to the registrant’s principal executive officer and principal financial officer. The registrant has not made any substantive amendments to its code of ethics during the period covered by this report. The registrant has not granted any waivers from any provisions of the code of ethics during the period covered by this report.
A copy of the registrant’s Code of Ethics is filed herewith.
Item 3. Audit Committee Financial Experts.
The registrant’s Board of Trustees has determined that there are at least two audit committee financial experts serving on its audit committee. Messrs. Gaylord B. Lyman and Scott C. Jones are the “audit committee financial experts” and are considered to be “independent” as each term is defined in Item 3 of Form N‑CSR.
Item 4. Principal Accountant Fees and Services.
The registrant has engaged its principal accountant to perform audit services, audit-related services, tax services and other services during the past two fiscal years. “Audit services” refer to performing an audit of the registrant's annual financial statements or services that are normally provided by the accountant in connection with statutory and regulatory filings or engagements for those fiscal years. “Audit-related services” refer to the assurance and related services by the principal accountant that are reasonably related to the performance of the audit. “Tax services” refer to professional services rendered by the principal accountant for tax compliance, tax advice, and tax planning. There were no “other services” provided by the principal accountant. The following table details the aggregate fees billed or expected to be billed for each of the last two fiscal years for audit fees, audit-related fees, tax fees and other fees by the principal accountant.
FYE 3/31/2020 | FYE 3/31/2019 | |
Audit Fees | $14,000 | $14,000 |
Audit-Related Fees | N/A | N/A |
Tax Fees | $3,000 | $3,000 |
All Other Fees | N/A | N/A |
Pursuant to its charter, the Trust’s Audit Committee must review and approve in advance the engagement of the independent accountants, including each audit and non-audit service permitted by appropriate rules or regulations provided to the Trust and each non-audit service provided to the Trust’s investment advisers and any entity controlling, controlled by or under common control with the investment advisers that provides ongoing services to the Trust relating to the operations and financial reporting of the Trust. The Committee may delegate the authority to grant such pre-approval to one or more Committee members who are independent Trustees within the meaning of Section 10A(i) of the Securities Exchange Act of 1934, as amended, provided that the decision of such member(s) is presented to the full Committee at its next scheduled meeting. The Committee may approve each audit and non-audit service on a case-by-case basis, and/or adopt pre-approval policies and procedures that are detailed as to a particular service, provided that the Committee is informed of each service in a timely manner and the policies and procedures do not include delegation of the Committee’s responsibilities under the Securities Exchange Act of 1934 to management. The foregoing pre-approval requirement with respect to the provision of non-audit services to the Trust may be waived if (i) the aggregate amount of all such non-audit services provided to the Trust constitutes not more than 5 percent of the total amount of revenues paid by the Trust to its independent accountants during the fiscal year in which the non-audit services are provided; (ii) such services were not recognized by the Trust at the time of the engagement to be non-audit services; and (iii) such services are promptly brought to the attention of the Committee and approved prior to the completion of the audit by the Committee or by one or more members of the Committee to whom authority to grant such approvals has been delegated by the Committee.
The percentage of fees billed by BBD, LLP applicable to non-audit services pursuant to waiver of pre-approval requirement were as follows:
FYE 3/31/2020 | FYE 3/31/2019 | |
Audit-Related Fees | 0% | 0% |
Tax Fees | 0% | 0% |
All Other Fees | 0% | 0% |
All of the principal accountant’s hours spent on auditing the registrant’s financial statements were attributed to work performed by full‑time permanent employees of the principal accountant.
The following table indicates the non-audit fees billed or expected to be billed by the registrant’s accountant for services to the registrant and to the registrant’s investment adviser (and any other controlling entity, etc.—not sub-adviser) for the last two years. The audit committee of the Board of Trustees has considered whether the provision of non-audit services that were rendered to the registrant's investment adviser is compatible with maintaining the principal accountant's independence and has concluded that the provision of such non-audit services by the accountant has not compromised the accountant’s independence.
Non-Audit Related Fees | FYE 3/31/2020 | FYE 3/31/2019 |
Registrant | N/A | N/A |
Registrant’s Investment Adviser | N/A | N/A |
Item 5. Audit Committee of Listed Registrants.
(a) Not applicable to registrants who are not listed issuers (as defined in Rule 10A-3 under the Securities Exchange Act of 1934).
(b) Not Applicable.
Item 6. Investments.
(a) | Schedule of Investments is included as part of the report to shareholders filed under Item 1 of this Form. |
(b) | Not Applicable. |
Item 7. Disclosure of Proxy Voting Policies and Procedures for Closed-End Management Investment Companies.
Not applicable to open-end investment companies.
Item 8. Portfolio Managers of Closed-End Management Investment Companies.
Not applicable to open-end investment companies.
Item 9. Purchases of Equity Securities by Closed‑End Management Investment Company and Affiliated Purchasers.
Not applicable to open-end investment companies.
Item 10. Submission of Matters to a Vote of Security Holders.
There have been no material changes to the procedures by which shareholders may recommend nominees to the Registrant’s Board of Trustees.
Item 11. Controls and Procedures.
(a) | The Registrant’s President/Principal Executive Officer and Treasurer/Principal Financial Officer have reviewed the Registrant's disclosure controls and procedures (as defined in Rule 30a-3(c) under the Investment Company Act of 1940, as amended, (the “Act”)) as of a date within 90 days of the filing of this report, as required by Rule 30a-3(b) under the Act and Rules 13a-15(b) or 15d‑15(b) under the Securities Exchange Act of 1934. Based on their review, such officers have concluded that the disclosure controls and procedures are effective in ensuring that information required to be disclosed in this report is appropriately recorded, processed, summarized and reported and made known to them by others within the Registrant and by the Registrant’s service provider. |
(b) | There were no changes in the Registrant's internal control over financial reporting (as defined in Rule 30a-3(d) under the Act) that occurred during the fourth fiscal quarter of the period covered by this report that has materially affected, or is reasonably likely to materially affect, the Registrant's internal control over financial reporting. |
Item 12. Disclosure of Securities Lending Activities for Closed-End Management Investment Companies.
Not applicable to open-end investment companies.
Item 13. Exhibits.
(3) Any written solicitation to purchase securities under Rule 23c‑1 under the Act sent or given during the period covered by the report by or on behalf of the registrant to 10 or more persons. Not applicable to open-end investment companies.
(4) Change in the registrant’s independent public accountant. There was no change in the registrant’s independent public accountant for the period covered by this report.
SIGNATURES
Pursuant to the requirements of the Securities Exchange Act of 1934 and the Investment Company Act of 1940, as amended, the registrant has duly caused this report to be signed on its behalf by the undersigned, thereunto duly authorized.
(Registrant) Manager Directed Portfolios
By (Signature and Title)* /s/Douglas J. Neilson
Douglas J. Neilson, President/
Principal Executive Officer
Date 6/8/2020
Pursuant to the requirements of the Securities Exchange Act of 1934 and the Investment Company Act of 1940, as amended, this report has been signed below by the following persons on behalf of the registrant and in the capacities and on the dates indicated.
By (Signature and Title)* /s/Douglas J. Neilson
Douglas J. Neilson, President/
Principal Executive Officer
Date 6/8/2020
By (Signature and Title)* /s/Matthew J. McVoy
Matthew J. McVoy, Treasurer/
Principal Financial Officer
Date 6/8/2020
* Print the name and title of each signing officer under his or her signature.