UNITED STATES
SECURITIES AND EXCHANGE COMMISSION
Washington, D.C. 20549
SECURITIES AND EXCHANGE COMMISSION
Washington, D.C. 20549
FORM N-CSR
CERTIFIED SHAREHOLDER REPORT OF REGISTERED
MANAGEMENT INVESTMENT COMPANIES
MANAGEMENT INVESTMENT COMPANIES
Investment Company Act file number 811-21897
Manager Directed Portfolios
(Exact name of registrant as specified in charter)
(Exact name of registrant as specified in charter)
615 East Michigan Street
Milwaukee, WI 53202
(Address of principal executive offices) (Zip code)
(Address of principal executive offices) (Zip code)
Douglas J. Neilson, President
Manager Directed Portfolios
c/o U.S. Bank Global Fund Services
811 East Wisconsin Avenue, 8th Floor
Milwaukee, WI 53202
(Name and address of agent for service)
(Name and address of agent for service)
(414) 287-3101
Registrant's telephone number, including area code
Date of fiscal year end: October 31, 2020
Date of reporting period: October 31, 2020
Item 1. Reports to Stockholders.
Hardman Johnston
International Growth Fund
Retail Shares HJIRX
Institutional Shares HJIGX
Annual Report
October 31, 2020
Beginning on January 1, 2021, as permitted by regulations adopted by the U.S. Securities and Exchange Commission, paper copies of the Fund’s annual and semi-annual shareholder reports will no longer be sent by mail, unless you specifically request paper copies of the reports from the Fund or from your financial intermediary, such as a broker dealer or bank. Instead, the reports will be made available on the Fund’s website, www.hardmanjohnstonfunds.com, and you will be notified by mail each time a report is posted and provided with a website link to access the report. If you already elected to receive shareholder reports electronically, you will not be affected by this change and you need not take any action. You may elect to receive shareholder reports and other communications from the Fund electronically anytime by contacting your financial intermediary (such as a broker-dealer or a bank) or, if you are a direct investor, by calling 1-833-627-6668, sending an e-mail request to inquiry@dakotainvestments.com, or by enrolling at www.hardmanjohnstonfunds.com. You may elect to receive all future reports in paper free of charge. If you invest through a financial intermediary, you can contact your financial intermediary to request that you continue to receive paper copies of your shareholder reports. If you invest directly with the Fund, you can call 1-833-627-6668 or send an email request to inquiry@dakotainvestments.com to let the Fund know you wish to continue receiving paper copies of your shareholder reports. Your election to receive reports in paper will apply to all funds held in your account if you invest through your financial intermediary or all funds held with the fund complex if you invest directly with the Fund.
Hardman Johnston International Growth Fund
Table of Contents
| Letter to Shareholders | 3 | |
| Investment Highlights | 7 | |
| Sector Allocation | 8 | |
| Schedule of Investments | 9 | |
| Statement of Assets and Liabilities | 12 | |
| Statement of Operations | 13 | |
| Statements of Changes in Net Assets | 14 | |
| Financial Highlights | 16 | |
| Notes to the Financial Statements | 18 | |
| Report of Independent Registered Public Accounting Firm | 28 | |
| Matters Submitted to a Shareholder Vote | 29 | |
| Expense Example | 30 | |
| Notice to Shareholders | 32 | |
| Trustees and Officers | 34 | |
| Notice of Privacy Policy & Practices | 37 |
Hardman Johnston International Growth Fund
| LETTER TO SHAREHOLDERS |
Dear Shareholders,
For the fiscal year period ending October 31, 2020, the Hardman Johnston International Growth Fund (the “Fund”), formerly Marmont Redwood International Equity Fund, returned 14.68% (Institutional Shares) relative to the benchmark return of -2.61% during the same period. Hardman Johnston Global Advisors LLC became the sub-advisor to this fund on January 1, 2020. For the year-to-date period ending October 31, 2020, the Fund generated a return of 10.44% (Institutional Shares). During the same ten-month period, the MSCI AC World ex-USA Index (USD) generated a -7.47% return.
On a year-to-date basis as of October 31, 2020, the top five portfolio contributors for the portfolio were: Afterpay Limited, Daifuku Co., Ltd., Wuxi Biologics (Cayman) Inc., Tencent Holdings Ltd., and Alibaba Group Holding Ltd. All five of the top contributors remained in the Fund at the end of the period. Afterpay rebounded strongly after coming under pressure earlier in the year around concerns of potentially weak consumer spending and a challenging consumer credit environment due to the COVID-19 impact. While overall spending has been impacted, the combination of several factors has allowed Afterpay to perform well in these circumstances. First, over 75% of Afterpay’s revenue is tied to online spending versus in-store, and as spending has shifted towards online, Afterpay has been a beneficiary. Second, Afterpay is still early in its growth and adoption lifecycle and continued to benefit from new merchant and user growth, leaving it more economically resilient. Finally, from a credit profile, Afterpay does not extend an open line of credit to a consumer, which allows the company to more effectively manage its credit risk. As the buy-now-pay-later market continues to take share from traditional credit cards, we believe Afterpay stands to be a major beneficiary as a leader in the space. Daifuku Co., Ltd. has a global presence in material handling systems, with a diverse set of end market exposures including logistics, manufacturing, automotive, and semiconductor, among others. In our view, the company is well-placed to benefit from several secular trends including aging populations and the associated labor tightness in non-service jobs, increased demand for tighter inventory management, and the continued migration towards e-commerce. Furthermore, the recent coronavirus pandemic has highlighted a further benefit of higher levels of automation which safeguards the well-being of the workforce. As a global provider in material handling systems, Daifuku seeks to provide solutions to its customers who have had difficulty handling the surge in e-commerce related demand. We see both of these trends continuing and may accelerate the company’s growth potential. WuXi Biologics is a China market leader in biologic contract development and manufacturing. With the increased biologic drug demand in China and globally, WuXi Biologics benefited from this surge for biologic R&D and outsourcing. WuXi has effectively served as outsourced R&D and manufacturing for many of the world’s biggest pharmaceutical companies. Additionally, WuXi has supported small research companies that do not have the capability to test and manufacture drugs, let alone shepherd the drug through the trial process and the FDA or the FDA equivalent in Europe and China. We believe WuXi’s ability to provide virtually all facets to successful biologic drug launch and manufacturing, along with their ongoing relationship
3
Hardman Johnston International Growth Fund
with many of the world’s top pharma companies, may leave a long runway for growth. China’s lock-down during the first quarter gave Tencent Holdings Ltd.’s dominant gaming franchise a huge boost as stringently enforced stay-at-home orders left gamers with few entertainment options during the period. While the gaming business is expected to be up strongly, advertising and payments are more mixed. Overall, industry advertising budgets will inevitably be under pressure but we see strong momentum at Tencent, especially in social ads and performance based advertising. Alibaba Group Holding Ltd. has seen a meaningful rebound after the pandemic-induced lockdown in China during the first quarter. The release of pent-up demand in April, May and June resulted in still strong but more normalized growth thereafter. During this period, e-commerce adoption has accelerated forward with no signs of turning back. Our expectation is that user base growth and expanding frequency of online ordering to new categories such as groceries and household products could result in sustained higher levels of business activity for Alibaba. In addition, preparations for the Ant Financial IPO are well underway, with a forecasted valuation at US$230B-$250B. Alibaba owns a 33% equity stake in Ant Financial.
During the same period, the top five portfolio detractors for the portfolio were: Bayer AG, Melco Resorts & Entertainment, ICICI Bank, Airbus SE and Safran S.A. All five of the top detractors remained in the Fund at the end of the period. Bayer AG had a difficult period since the company reduced guidance based on a disappointing outlook for their Crop Sciences business. Guidance is being lowered due to a delayed renewal application for their newest soybeans which is impacting sales, reduced demand for corn due to lower biofuel demand which is lowering prices, and Covid-19 disruptions. While the Pharmaceutical and Consumer Health businesses are performing well, and the company has announced further cost cutting measures, it is not enough to offset the disappointing results in Crop Sciences in the near-term. Melco Resorts & Entertainment Ltd. is one of the leading gaming operators in Macau and is levered to both Chinese travel as well as consumer spending in China, both of which have become pressured due to the coronavirus. Ultimately, we believe that visitation to Macau will recover once fears of the coronavirus subside. Penetration of Macau tourism in China remains low and there are a number of infrastructure projects that have recently opened that should drive further visitation. At the same time, spend per visitor should also grow as disposable income grows in China. We are tracking the Chinese consumer very closely and have seen some encouraging signs, which should lead to the return of gaming. ICICI Bank Ltd. declined on worries coronavirus spread in India will impact business continuity and raise nonperforming loans along with impacting revenues as business slows precipitously. All banks will have increased corporate and retail stress, but ICICI has de-emphasized its corporate lending book and is in a strong capital position. In addition, the bank has dramatically improved its operating profitability and has a strong provision coverage ratio to absorb a higher percentage of nonperforming assets. We believe ICICI is well positioned to take share as the coronavirus pandemic subsides given its strong position among banks in India. Airbus SE (-1.6% total effect of portfolio holdings, -55.5% total return) declined during the first quarter as the coronavirus pandemic halted global air
4
Hardman Johnston International Growth Fund
traffic to a standstill. While we believe this is a near-term headwind, as has historically been the case in prior shocks (e.g., 9/11, Global Financial Crisis), air travel should eventually normalize and return to trend growth above GDP. Furthermore, with swift government responses to support airlines and boasting an 8-year backlog along with a net cash balance sheet, Airbus is well-placed to weather the current environment. In our view, looking beyond the coronavirus impact, the outlook for Airbus remains attractive given the duopolistic nature of the industry, continued low levels of air travel penetration in many parts of the world, and Airbus’s relative strength in the attractive narrow body market. Safran S.A. is a French multinational aircraft engine, rocket engine, aerospace-component and defense company. Long run demand outlook for new commercial aircraft was left uncertain as the coronavirus pandemic halted global air traffic to a standstill. While we see this as a near-term headwind, our conviction in the long-term outlook for both companies remains positive.
At the end of the period, the Fund held 25 stocks across various international regions and sectors. Relative to the benchmark, the Fund carried an overweight to Pacific Ex Japan and Japan, and a relative underweight to the Emerging Markets and North America. Relative sector exposure to the benchmark, the Fund was overweight to information technology and industrials, and a relative underweight to financials and materials.
The Covid-19 crisis will create winners and losers at a company level. Some business models have been hit hard by the crisis and will take a long time to recover, such as travel and leisure. Others in the retail sector, for instance, are coming back strongly from the initial lockdowns. There are also companies that have benefited strongly, namely those in ecommerce, cloud computing or online gaming. Indeed, the pandemic is accelerating secular growth trends, which could have a lasting effect on consumer behavior, working patterns and government regulation, in turn supporting a larger digital economy. However, most sectors and regions can present attractive opportunities for those prepared to look hard. Covid-19 has also accelerated the movement to greater corporate responsibility, as companies must show that they act responsibly towards employees, customers and the wider communities in which they operate. Environmental, Social and Corporate Governance (“ESG”) factors will become more important in the long-term sustainability of companies, their earnings and their valuations. We see an increasingly significant portion of executive compensation tied to meeting ESG criteria. Volatility and uncertainty are likely to remain high in the near term as the extent and impact of a Covid-19 second wave combines with a host of other issues, including U.S. elections, Brexit and tensions between China and western economies. It is impossible to predict the outcomes of any of these events, or indeed other macro factors such as interest rate rises and inflation, but investors can prepare for them. We believe a bottom-up approach that focuses on a company’s financial strength to weather the crisis, while identifying the traits that can enable a business to emerge stronger, such as market-leading positions and top-quality management, is the right way to create a resilient portfolio that can potentially outperform the benchmark.
5
Hardman Johnston International Growth Fund
This material represents the manager’s assessment of the portfolio and market environment at a specific point in time and should not be relied upon by the reader as research or investment advice.
Fund holdings and/or sector allocations are subject to change at any time and should not be considered recommendations to buy or sell any security. Please see the Schedule of Investments in this report for a complete list of Fund holdings.
Mutual fund investing involves risk, including the loss of principal. Investments in foreign securities involve greater volatility and political, economic, and currency risks and differences in accounting methods. These risks are greater in emerging markets.
A coverage ratio, broadly, is a metric intended to measure a company’s ability to service its debt and meet its financial obligations, such as interest payments or dividends.
The Morgan Stanley Capital International All Country World Index Ex-U.S. (MSCI ACWI Ex-U.S.) is a market-capitalization-weighted index maintained by Morgan Stanley Capital International (MSCI). It is designed to provide a broad measure of stock performance throughout the world, with the exception of U.S.-based companies. The MSCI ACWI Ex-U.S. includes both developed and emerging markets.
Diversification does not assure a profit, nor does it protect against a loss in a declining market.
Must be preceded or accompanied by a prospectus.
The Hardman Johnston International Growth Fund is distributed by Quasar Distributions, LLC.
You cannot invest directly into an index.
6
Hardman Johnston International Growth Fund
Investment Highlights (Unaudited)
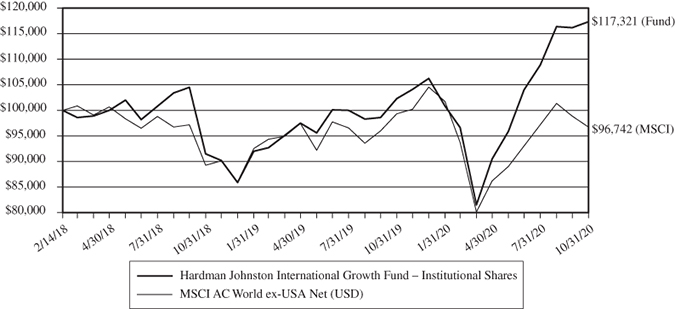
Comparison of the Change in Value of a Hypothetical $100,000 Investment
in the Hardman Johnston International Growth Fund – Institutional Shares and
MSCI AC World ex-USA Net (USD)
| Since Inception | ||
| Average Annual Total Return Periods Ended October 31, 2020: | 1 Year | (2/14/2018) |
| Hardman Johnston International Growth Fund – Institutional Shares | 14.68% | 6.07% |
Hardman Johnston International Growth Fund – Retail Shares(1) | 15.59% | 6.21% |
| MSCI AC World ex-USA Net (USD) | -2.61% | -1.21% |
| Expense ratios*: | Gross 4.57%, Net 1.00% (Institutional Shares); |
| Gross 4.88%, Net 1.25% (Retail Shares) |
Performance data quoted represents past performance; past performance does not guarantee future results. The investment return and principal value of an investment will fluctuate so that an investor’s shares, when redeemed, may be worth more or less than their original cost. Current performance of the Fund may be lower or higher than the performance quoted. Performance data current to the most recent month end may be obtained by calling 1-833-627-6668.
This chart illustrates the performance of a hypothetical $100,000 investment made in the Fund on February 14, 2018, the Fund’s inception date. Returns reflect the reinvestment of dividends and capital gain distributions. The performance data and expense ratios shown reflect a contractual fee waiver made by the Adviser, currently, through February 14, 2021. In the absence of fee waivers, returns would be reduced. The performance data and graph do not reflect the deduction of taxes that a shareholder may pay on dividends, capital gain distributions, or redemption of Fund shares. This chart does not imply any future performance.
(1) | The inception date of the Retail Shares is September 17, 2018. Performance shown prior to the inception of the Retail Shares reflects the performance of the Institutional Shares and does not include expenses applicable to the Retail Shares, and are higher than, those of the Institutional Shares. The actual performance during the period September 17, 2018 (Retail Share inception) through October 31, 2020 was 6.48% (annualized). |
| * | The expense ratios presented are from the most recent prospectus. |
7
Hardman Johnston International Growth Fund
| SECTOR ALLOCATION OF PORTFOLIO ASSETS |
| at October 31, 2020 (Unaudited) |

| COUNTRY ALLOCATION OF PORTFOLIO ASSETS |
| at October 31, 2020 (Unaudited) |
| Japan | 18.6% |
| China | 16.8% |
| United Kingdom | 9.0% |
| Germany | 6.4% |
| France | 5.9% |
| Netherlands | 5.3% |
| Australia | 4.2% |
| Denmark | 3.5% |
| Italy | 3.2% |
| Hong Kong | 3.0% |
| India | 2.1% |
| New Zealand | 1.5% |
| Short-Term Investments and Other | 20.5% |
Percentages represent market value as a percentage of net assets.
8
Hardman Johnston International Growth Fund
| SCHEDULE OF INVESTMENTS |
| at October 31, 2020 |
| Number of | ||||||||
| COMMON STOCKS – 79.5% | Shares | Value | ||||||
| Communication Services – 4.5% | ||||||||
| Tencent Holdings Ltd. | 10,435 | $ | 797,293 | |||||
| Consumer Discretionary – 16.8% | ||||||||
| Adidas AG (a) | 1,210 | 359,496 | ||||||
| Alibaba Group Holding Ltd. – ADR (a) | 2,810 | 856,179 | ||||||
| Aptiv Plc | 2,540 | 245,085 | ||||||
| Kering SA | 975 | 589,206 | ||||||
| Melco Resorts & Entertainment Ltd. – ADR | 29,240 | 471,349 | ||||||
| Puma SE (a) | 5,168 | 452,422 | ||||||
| 2,973,737 | ||||||||
| Consumer Staples – 1.5% | ||||||||
| a2 Milk Co. Ltd. (a) | 28,320 | 272,124 | ||||||
| Financials – 5.1% | ||||||||
| AIA Group Ltd. | 55,650 | 529,631 | ||||||
| ICICI Bank Ltd. – ADR (a) | 34,900 | 368,195 | ||||||
| 897,826 | ||||||||
| Health Care – 12.2% | ||||||||
| AstraZeneca Plc | 5,590 | 561,269 | ||||||
| Genmab A/S (a) | 1,870 | 624,627 | ||||||
| Orpea (a) | 1,305 | 130,348 | ||||||
| Wuxi Biologics Cayman, Inc. (a) | 29,890 | 839,423 | ||||||
| 2,155,667 | ||||||||
| Industrials – 16.5% | ||||||||
| Airbus SE (a) | 3,515 | 257,178 | ||||||
| Daifuku Co Ltd. | 8,425 | 868,768 | ||||||
| Nidec Corp. | 8,860 | 894,878 | ||||||
| Prysmian SpA | 20,515 | 558,261 | ||||||
| Safran SA (a) | 3,115 | 328,569 | ||||||
| 2,907,654 | ||||||||
The accompanying notes are an integral part of these financial statements.
9
Hardman Johnston International Growth Fund
| SCHEDULE OF INVESTMENTS (Continued) |
| at October 31, 2020 |
| Number of | ||||||||
| COMMON STOCKS – 79.5% (Continued) | Shares | Value | ||||||
| Information Technology – 22.9% | ||||||||
| Afterpay Ltd. (a) | 10,770 | $ | 733,318 | |||||
| ASML Holding NV | 1,880 | 680,187 | ||||||
| Atlassian Corp Plc (a) | 4,110 | 787,558 | ||||||
| Infineon Technologies AG | 11,485 | 319,755 | ||||||
| Keyence Corp. | 1,740 | 789,651 | ||||||
| Murata Manufacturing Co Ltd. | 10,380 | 727,935 | ||||||
| 4,038,404 | ||||||||
| TOTAL COMMON STOCKS | ||||||||
| (Cost $12,314,014) | 14,042,705 | |||||||
| SHORT-TERM INVESTMENTS – 1.8% | ||||||||
| MONEY MARKET FUNDS – 1.8% | ||||||||
| First American Government | ||||||||
| Obligations Fund – Class X, 0.05% (b) | 317,154 | 317,154 | ||||||
| TOTAL SHORT-TERM INVESTMENTS | ||||||||
| (Cost $317,154) | 317,154 | |||||||
| TOTAL INVESTMENTS | ||||||||
| (Cost $12,631,168) – 81.3% | 14,359,859 | |||||||
| Other Assets in Excess of Liabilities – 18.7% | 3,296,145 | |||||||
| TOTAL NET ASSETS – 100.00% | $ | 17,656,004 | ||||||
Percentages are stated as a percent of net assets.
PLC – Public Limited Company
| (a) | Non-income producing security. |
| (b) | The rate shown represents the fund’s 7-day yield as of October 31, 2020. |
The Global Industry Classification Standard (GICS®) was developed by and/or is the exclusive property of MSCI, Inc. and Standard & Poor’s Financial Services LLC (“S&P”). GICS is a service mark of MSCI and S&P and has been licensed for use by U.S. Bank Global Fund Services.
The accompanying notes are an integral part of these financial statements.
10
Hardman Johnston International Growth Fund
(This Page Intentionally Left Blank.)
11
Hardman Johnston International Growth Fund
| STATEMENT OF ASSETS AND LIABILITIES |
| at October 31, 2020 |
| Assets: | ||||
| Investments, at value (cost of $12,631,168) | $ | 14,359,859 | ||
| Receivables: | ||||
| Securities sold | 48,404 | |||
| Fund shares sold | 3,267,647 | |||
| Dividends and interest | 23,160 | |||
| Due from Advisor | 22,236 | |||
| Prepaid expenses | 17,036 | |||
| Total assets | 17,738,342 | |||
| Liabilities: | ||||
| Payables: | ||||
| Securities purchased | 9,248 | |||
| Administration and fund accounting fees | 28,072 | |||
| Custody fees | 6,526 | |||
| Legal Fees | 3,454 | |||
| Reports to shareholders | 5,851 | |||
| Transfer agent fees and expenses | 11,925 | |||
| Other accrued expenses | 17,262 | |||
| Total liabilities | 82,338 | |||
| Net assets | $ | 17,656,004 | ||
| Net assets consist of: | ||||
| Paid in capital | $ | 16,586,506 | ||
| Total accumulated earnings | 1,069,498 | |||
| Net assets | $ | 17,656,004 | ||
| Institutional Shares: | ||||
| Net assets applicable to outstanding Institutional Shares | $ | 17,328,512 | ||
| Shares issued (Unlimited number of beneficial | ||||
| interest authorized, $0.01 par value) | 1,559,095 | |||
| Net asset value, offering price and redemption price per share | $ | 11.11 | ||
| Retail Shares: | ||||
| Net assets applicable to outstanding Retail Shares | $ | 327,492 | ||
| Shares issued (Unlimited number of beneficial | ||||
| interest authorized, $0.01 par value) | 27,786 | |||
| Net asset value, offering price and redemption price per share | $ | 11.79 | ||
The accompanying notes are an integral part of these financial statements.
12
Hardman Johnston International Growth Fund
| STATEMENT OF OPERATIONS |
| For the Year Ended October 31, 2020 |
| Investment income: | ||||
| Dividends (net of foreign taxes withheld of $3,326) | $ | 31,153 | ||
| Interest | 1,162 | |||
| Total investment income | 32,315 | |||
| Expenses: | ||||
| Investment advisory fees (Note 4) | 60,282 | |||
| Administration and fund accounting fees (Note 4) | 115,825 | |||
| Distribution fees (Note 5) | ||||
| Distribution fees – Retail Shares | 850 | |||
| Transfer agent fees and expenses | 58,769 | |||
| Federal and state registration fees | 34,025 | |||
| Audit fees | 15,501 | |||
| Compliance expense | 16,478 | |||
| Legal fees | 20,120 | |||
| Reports to shareholders | 5,775 | |||
| Trustees’ fees and expenses | 10,561 | |||
| Custody fees | 40,882 | |||
| Other | 14,142 | |||
| Total expenses before reimbursement from advisor | 393,210 | |||
| Expense reimbursement from advisor (Note 4) | (332,022 | ) | ||
| Net expenses | 61,188 | |||
| Net investment loss | (28,873 | ) | ||
| Realized and unrealized gain (loss) on investments: | ||||
| Net realized gain on transactions from: | ||||
| Investments | 791,740 | |||
| Foreign currency related transactions | 2,573 | |||
| Net change in unrealized gain on: | ||||
| Investments | 656,183 | |||
| Foreign currency related translations | 117,417 | |||
| Net realized and unrealized gain on investments | 1,567,913 | |||
| Net increase in net assets resulting from operations | $ | 1,539,040 | ||
The accompanying notes are an integral part of these financial statements.
13
Hardman Johnston International Growth Fund
| STATEMENTS OF CHANGES IN NET ASSETS |
| Year Ended | Year Ended | |||||||
| October 31, 2020 | October 31, 2019 | |||||||
| Operations: | ||||||||
| Net investment income (loss) | $ | (28,873 | ) | $ | 86,374 | |||
| Net realized gain (loss) on investments | 794,313 | (1,249,293 | ) | |||||
| Net change in unrealized gain on investments | 773,600 | 2,007,506 | ||||||
| Net increase in net assets | ||||||||
| resulting from operations | 1,539,040 | 844,587 | ||||||
| Distributions to Shareholders From: | ||||||||
| Net investment income | ||||||||
| Investor class shares | — | — | ||||||
| Institutional shares | (84,081 | ) | — | |||||
| Total distributions | (84,081 | ) | — | |||||
| Capital Share Transactions: | ||||||||
| Proceeds from shares sold | ||||||||
| Retail shares | 277,898 | 174,168 | ||||||
| Institutional shares | 17,916,065 | 351,239 | ||||||
| Proceeds from shares issued to holders | ||||||||
| in reinvestment of dividends | ||||||||
| Retail shares | — | — | ||||||
| Institutional shares | 84,081 | — | ||||||
| Cost of shares redeemed | ||||||||
| Retail Shares | (2,459,859 | ) | (339,536 | ) | ||||
| Institutional shares | (9,164,582 | ) | (3,453,440 | ) | ||||
| Net increase (decrease) in net assets | ||||||||
| from capital share transactions | 6,653,603 | (3,267,569 | ) | |||||
| Total increase (decrease) in net assets | 8,108,562 | (2,422,982 | ) | |||||
| Net Assets: | ||||||||
| Beginning of year | 9,547,442 | 11,970,424 | ||||||
| End of year | $ | 17,656,004 | $ | 9,547,442 | ||||
The accompanying notes are an integral part of these financial statements.
14
Hardman Johnston International Growth Fund
| STATEMENTS OF CHANGES IN NET ASSETS (Continued) |
| Year Ended | Year Ended | |||||||
| October 31, 2020 | October 31, 2019 | |||||||
| Changes in Shares Outstanding: | ||||||||
| Shares sold | ||||||||
| Retail shares | 23,926 | 18,574 | ||||||
| Institutional shares | 1,792,699 | 37,976 | ||||||
| Proceeds from shares issued to holders | ||||||||
| in reinvestment of dividends | ||||||||
| Retail shares | — | — | ||||||
| Institutional shares | 8,536 | — | ||||||
| Shares redeemed | ||||||||
| Retail shares | (239,065 | ) | (37,012 | ) | ||||
| Institutional shares | (932,959 | ) | (394,325 | ) | ||||
| Net increase (decrease) in shares outstanding | 653,137 | (374,787 | ) | |||||
The accompanying notes are an integral part of these financial statements.
15
Hardman Johnston International Growth Fund
| FINANCIAL HIGHLIGHTS |
For a capital share outstanding throughout each period
Institutional Shares
| February 14, 2018* | ||||||||||||
| Year Ended | Year Ended | through | ||||||||||
| October 31, 2020 | October 31, 2019 | October 31, 2018 | ||||||||||
| Net Asset Value – | ||||||||||||
| Beginning of Period | $ | 10.23 | $ | 9.15 | $ | 10.00 | ||||||
| Income from Investment Operations: | ||||||||||||
Net investment income/(loss)1 | (0.05 | ) | 0.09 | — | 2 | |||||||
| Net realized and unrealized | ||||||||||||
| gain (loss) on investments | 1.48 | 0.99 | (0.85 | ) | ||||||||
| Total from investment operations | 1.43 | 1.08 | (0.85 | ) | ||||||||
| Less Distributions: | ||||||||||||
| Dividends from net investment income | (0.55 | ) | — | — | ||||||||
| Total distributions | (0.55 | ) | — | — | ||||||||
| Net Asset Value – End of Period | $ | 11.11 | $ | 10.23 | $ | 9.15 | ||||||
| Total Return | 14.68 | % | 11.80 | % | (8.50 | )%^ | ||||||
| Ratios and Supplemental Data: | ||||||||||||
| Net assets, end of period (thousands) | $ | 17,329 | $ | 7,069 | $ | 9,580 | ||||||
| Ratio of operating expenses | ||||||||||||
| to average net assets: | ||||||||||||
| Before reimbursements | 6.48 | % | 4.57 | % | 11.31 | %+ | ||||||
| After reimbursements | 1.00 | % | 1.00 | % | 1.00 | %+ | ||||||
| Ratio of net investment income/(loss) | ||||||||||||
| to average net assets: | ||||||||||||
| Before reimbursements | (5.94 | )% | (2.63 | )% | (10.25 | )%+ | ||||||
| After reimbursements | (0.46 | )% | 0.94 | % | 0.06 | %+ | ||||||
Portfolio turnover rate3 | 224 | % | 81 | % | 53 | %^ | ||||||
| * | Commencement of operations for Institutional Shares was February 14, 2018. |
+ | Annualized |
| ^ | Not Annualized |
1 | The net investment income per share was calculated using the average shares outstanding method. |
2 | Amount is less than $0.01 per share. |
3 | Portfolio turnover was calculated on the basis of the Fund as a whole. The rate presented represents portfolio turnover for the entire fiscal year. |
The accompanying notes are an integral part of these financial statements.
16
Hardman Johnston International Growth Fund
| FINANCIAL HIGHLIGHTS |
For a capital share outstanding throughout each period
Retail Shares
| September 17, 2018* | ||||||||||||
| Year Ended | Year Ended | through | ||||||||||
| October 31, 2020 | October 31, 2019 | October 31, 2018 | ||||||||||
| Net Asset Value – | ||||||||||||
| Beginning of Period | $ | 10.20 | $ | 9.15 | $ | 10.32 | ||||||
| Income from Investment Operations: | ||||||||||||
Net investment income/(loss)1 | (0.08 | ) | 0.07 | (0.01 | ) | |||||||
| Net realized and unrealized | ||||||||||||
| gain (loss) on investments | 1.67 | 0.98 | (1.16 | ) | ||||||||
| Total from investment operations | 1.59 | 1.05 | (1.17 | ) | ||||||||
| Net Asset Value – End of Period | $ | 11.79 | $ | 10.20 | $ | 9.15 | ||||||
| Total Return | 15.59 | % | 11.48 | % | (11.34 | )%^ | ||||||
| Ratios and Supplemental Data: | ||||||||||||
| Net assets, end of period (thousands) | $ | 327 | $ | 2,479 | $ | 2,390 | ||||||
| Ratio of operating expenses | ||||||||||||
| to average net assets: | ||||||||||||
| Before reimbursements | 7.30 | % | 4.88 | % | 4.43 | %+ | ||||||
| After reimbursements | 1.25 | % | 1.25 | % | 1.25 | %+ | ||||||
| Ratio of net investment income/(loss) | ||||||||||||
| to average net assets: | ||||||||||||
| Before reimbursements | (6.84 | )% | (2.87 | )% | (3.99 | )%+ | ||||||
| After reimbursements | (0.79 | )% | 0.76 | % | (0.81 | )%+ | ||||||
Portfolio turnover rate2 | 224 | % | 81 | % | 53 | %^ | ||||||
| * | Commencement of operations for Retail Shares was September 17, 2018. |
+ | Annualized |
| ^ | Not Annualized |
1 | The net investment income/(loss) per share was calculated using the average shares outstanding method. |
2 | Portfolio turnover was calculated on the basis of the Fund as a whole. The rate presented represents portfolio turnover for the entire fiscal year. |
The accompanying notes are an integral part of these financial statements.
17
Hardman Johnston International Growth Fund
| NOTES TO FINANCIAL STATEMENTS |
| at October 31, 2020 |
NOTE 1 – ORGANIZATION
The Hardman Johnston International Growth Fund (the “Fund”) is a series of Manager Directed Portfolios (the “Trust”). The Trust is registered under the Investment Company Act of 1940, as amended (the “1940 Act”), and the Fund is an open-end investment company and is a non-diversified series of the Trust and was organized as a Delaware statutory trust on April 4, 2006. The Fund’s Institutional Shares commenced operations on February 14, 2018. The Fund’s Retail Shares commenced operations on September 17, 2018. Each class of shares differs principally in its respective distribution expenses. Each class of shares has identical rights to earnings, assets and voting privileges, except for class-specific expenses and exclusive rights to vote on matters affecting only individual classes. Dakota Investments LLC (the “Advisor”) serves as the investment advisor to the Fund. Hardman Johnston Global Advisors LLC (the “Sub-Advisor”) serves as the sub-advisor to the Fund. Redwood Investments, LLC (“Redwood”) served as the International Growth Fund’s sub-advisor from the Fund’s inception to December 31, 2019. Effective January 1, 2020, Hardman Johnston replaced Redwood as the International Growth Fund’s sub-advisor. As an investment company, the Fund follows the investment company accounting and reporting guidance of the Financial Accounting Standards Board (“FASB”) Accounting Standard Codification Topic 946 Financial Services – Investment Companies. The investment objective of the Fund is to seek long term capital appreciation.
NOTE 2 – SIGNIFICANT ACCOUNTING POLICIES
The following is a summary of significant accounting policies consistently followed by the Fund. These policies are in conformity with U.S. generally accepted accounting principles (“GAAP”).
| A. | Security Valuation: All investments in securities are recorded at their estimated fair value, as described in Note 3. | |
| B. | Federal Income Taxes: It is the Fund’s policy to comply with the requirements of Subchapter M of the Internal Revenue Code applicable to regulated investment companies and to distribute substantially all of its taxable income to its shareholders. Therefore, no federal income or excise tax provisions are required. | |
| The Fund recognizes the tax benefits of uncertain tax positions only where the position is “more likely than not” to be sustained assuming examination by tax authorities. Management has analyzed the Fund’s tax positions and has concluded that no liability for unrecognized tax benefits should be recorded related to uncertain tax positions on returns filed for open tax years October 31, 2018 to October 31, 2019 or expected to be take in the Fund’s October 31, 2020 Tax Returns. The tax returns for the Fund for the prior three fiscal years are open for examination. The Fund identifies its major tax jurisdictions as U.S. Federal and the state of Delaware. | ||
| C. | Securities Transactions, Income and Distributions: Securities transactions are accounted for on the trade date. Realized gains and losses on securities sold are determined on the basis of identified cost. Interest income is recorded on an accrual basis. Dividend income and distributions to shareholders are recorded on |
18
Hardman Johnston International Growth Fund
| NOTES TO FINANCIAL STATEMENTS (Continued) |
| at October 31, 2020 |
| the ex-dividend date. Discounts and premiums on fixed income securities are amortized using the effective interest method. | ||
| The Fund distributes substantially all of its net investment income, if any, and net realized capital gains, if any, annually. Distributions from net realized gains for book purposes may include short-term capital gains. All short-term capital gains are included in ordinary income for tax purposes. The amount of dividends and distributions to shareholders from net investment income and net realized capital gains is determined in accordance with federal income tax regulations, which differ from GAAP. To the extent these book/tax differences are permanent, such amounts are reclassified within the capital accounts based on their federal tax treatment. | ||
| The Fund is charged for those expenses that are directly attributable to it, such as investment advisory, custody and transfer agent fees. Expenses that are not attributable to a Fund are typically allocated among the funds in the Trust proportionately based on allocation methods approved by the Board of Trustees (the “Board”). Common expenses of the Trust are typically allocated among the funds in the Trust based on a fund’s respective net assets, or by other equitable means. | ||
| D. | Use of Estimates: The preparation of financial statements in conformity with GAAP requires management to make estimates and assumptions that affect the reported amounts of assets and liabilities at the date of the financial statements and the reported amounts of increases and decreases in net assets during the reporting period. Actual results could differ from those estimates. | |
| E. | Redemption Fees: The Fund does not charge redemption fees to shareholders. | |
| F. | Reclassification of Capital Accounts: GAAP requires that certain components of net assets relating to permanent differences be reclassified between financial and tax reporting. These reclassifications have no effect on net assets or net asset value per share. | |
| For the fiscal year ended October 31, 2020, the Fund made the following permanent tax adjustments on the Statement of Assets and Liabilities: |
Accumulated Earnings | Paid in Capital | ||
| $27,201 | $(27,201) |
| G. | Foreign Currency: Values of investments denominated in foreign currencies are converted into U.S. dollars using the spot market rate of exchange at the time of valuation. Purchases and sales of investments and income are translated into U.S. dollars using the spot market rate of exchange prevailing on the respective dates of such transactions. The Fund does not isolate the portion of the results of operations resulting from fluctuations in foreign exchange rates on investments from fluctuations resulting from changes in the market prices of securities held. Such fluctuations are included with the net realized and unrealized gain/loss on investments. Foreign investments present additional risks due to currency |
19
Hardman Johnston International Growth Fund
| NOTES TO FINANCIAL STATEMENTS (Continued) |
| at October 31, 2020 |
| fluctuations, economic and political factors, lower liquidity, government regulations, differences in accounting standards, and other factors. | ||
| H. | Events Subsequent to the Fiscal Period End: In preparing the financial statements as of October 31, 2020, management considered the impact of subsequent events for potential recognition or disclosure in the financial statements. | |
| I. | Recent Accounting Pronouncements and Rule Issuances: In August 2018, FASB issued ASU 2018-13, Fair Value Measurement (Topic 820): Disclosure Framework—Changes to the Disclosure Requirements for Fair Value Measurement (“ASU 2018-13”). The primary focus of ASU 2018-13 is to improve the effectiveness of the disclosure requirements for fair value measurements. The changes affect all companies that are required to include fair value measurement disclosures. In general, the amendments in ASU 2018-13 are effective for all entities for fiscal years and interim periods within those fiscal years, beginning after December 15, 2019. An entity is permitted to early adopt the removed or modified disclosures upon the issuance of ASU 2018-13 and may delay adoption of the additional disclosures, which are required for public companies only, until their effective date. Management has evaluated the impact of this change in guidance, and due to the permissibility of early adoption, modified the Fund’s fair value disclosures for the current reporting period. |
NOTE 3 – SECURITIES VALUATION
The Fund has adopted authoritative fair value accounting standards which establish an authoritative definition of fair value and set out a hierarchy for measuring fair value. These standards require additional disclosures about the various inputs and valuation techniques used to develop the measurements of fair value, a discussion of changes in valuation techniques and related inputs during the period, and expanded disclosure of valuation levels for major security types. These inputs are summarized in the three broad levels listed below:
| Level 1 – | Unadjusted, quoted prices in active markets for identical assets or liabilities that the Fund has the ability to access at the date of measurement. | |
| Level 2 – | Other significant observable inputs (including, but not limited to, quoted prices in active markets for similar instruments, quoted prices in markets that are not active for identical or similar instruments, and model-derived valuations in which all significant inputs and significant value drivers are observable in active markets, such as interest rates, prepayment speeds, credit risk curves, default rates, and similar data). | |
| Level 3 – | Significant unobservable inputs for the asset or liability, to the extent relevant observable inputs are not available, representing the Fund’s own assumptions about the assumptions a market participant would use in valuing the asset or liability, and would be based on the best information available. |
20
Hardman Johnston International Growth Fund
| NOTES TO FINANCIAL STATEMENTS (Continued) |
| at October 31, 2020 |
Following is a description of the valuation techniques applied to the Fund’s major categories of assets and liabilities measured at fair value on a recurring basis.
Equity Securities: Equity securities, including common stocks, preferred stocks, foreign-issued common stocks, exchange-traded funds, closed-end mutual funds and real estate investment trusts (REITs), that are primarily traded on a national securities exchange shall be valued at the last sale price on the exchange on which they are primarily traded on the day of valuation or, if there has been no sale on such day, at the mean between the bid and asked prices. Securities primarily traded in the NASDAQ Global Market System for which market quotations are readily available shall be valued using the NASDAQ Official Closing Price (“NOCP”). If the NOCP is not available, such securities shall be valued at the last sale price on the day of valuation, or if there has been no sale on such day, at the mean between the bid and asked prices. Over-the-counter securities that are not traded on a listed exchange are valued at the last sale price in the over-the-counter market. Over-the-counter securities which are not traded in the NASDAQ Global Market System shall be valued at the mean between the bid and asked prices. To the extent these securities are actively traded and valuation adjustments are not applied, they are categorized in Level 1 of the fair value hierarchy. Securities traded on foreign exchanges generally are not valued at the same time the Fund calculates its net asset value (“NAV”) because most foreign markets close well before such time. The earlier close of most foreign markets gives rise to the possibility that significant events, including broad market moves, may have occurred in the interim. In certain circumstances, it may be determined that a security needs to be fair valued because it appears that the value of the security might have been materially affected by an event (a “Significant Event”) occurring after the close of the market in which the security is principally traded, but before the time the Fund calculates its NAV. A Significant Event may relate to a single issuer or to an entire market sector, or even occurrences not tied directly to the securities markets, such as natural disasters, armed conflicts, or significant government actions.
Registered Investment Companies: Investments in registered investment companies (e.g., mutual funds) are generally priced at the ending NAV provided by the applicable registered investment company’s service agent and will be classified in Level 1 of the fair value hierarchy.
Short-Term Debt Securities: Debt securities, including short-term debt instruments having a maturity of less than 60 days, are valued at the evaluated mean price supplied by an approved pricing service. Pricing services may use various valuation methodologies including matrix pricing and other analytical pricing models as well as market transactions and dealer quotations. In the absence of prices from a pricing service, the securities will be priced in accordance with the procedures adopted by the Board. Short-term securities are generally classified in Level 1 or Level 2 of the fair market hierarchy depending on the inputs used and market activity levels for specific securities.
The Board has delegated day-to-day valuation issues to a Valuation Committee of the Trust which, as of October 31, 2020, was comprised of officers of the Trust. The function
21
Hardman Johnston International Growth Fund
| NOTES TO FINANCIAL STATEMENTS (Continued) |
| at October 31, 2020 |
of the Valuation Committee is to value securities where current and reliable market quotations are not readily available, or the closing price does not represent fair value, by following procedures approved by the Board. These procedures consider many factors, including the type of security, size of holding, trading volume, news events and significant events such as those described previously. All actions taken by the Valuation Committee are subsequently reviewed and ratified by the Board.
Depending on the relative significance of the valuation inputs, fair valued securities may be classified in either level 2 or level 3 of the fair value hierarchy.
The fair valuation of foreign securities may be determined with the assistance of a pricing service using correlations between the movement of prices of such securities and indices of domestic securities and other appropriate indicators, such as closing market prices of relevant American Depositary Receipts or futures contracts. The Fund uses ICE Data Services (“ICE”) as a third-party fair valuation vendor. ICE provides a fair value for foreign securities in the Fund based on certain factors and methodologies applied by ICE in the event that there is a movement in the U.S. markets that exceeds a specific threshold established by the Valuation Committee. The effect of using fair value pricing is that the Fund’s NAV will reflect the affected portfolio securities’ values as determined by the Board or its designee instead of being determined by the market. Using a fair value pricing methodology to price a foreign security may result in a value that is different from the foreign security’s most recent closing price and from the prices used by other investment companies to calculate their NAVs and are generally classified in Level 2 of the fair valuation hierarchy. Because the Fund may invest in foreign securities, the value of the Fund’s portfolio securities may change on days when you will not be able to purchase or redeem your shares.
The inputs or methodology used for valuing securities are not an indication of the risk associated with investing in those securities.
| Common Stocks | Level 1 | Level 2 | Level 3 | Total | ||||||||||||
| Communication Services | $ | — | $ | 797,293 | $ | — | $ | 797,293 | ||||||||
| Consumer Discretionary | 1,572,613 | 1,401,124 | — | 2,973,737 | ||||||||||||
| Consumer Staples | — | 272,124 | — | 272,124 | ||||||||||||
| Financials | 368,195 | 529,631 | — | 897,826 | ||||||||||||
| Health Care | — | 2,155,667 | — | 2,155,667 | ||||||||||||
| Industrials | — | 2,907,654 | — | 2,907,654 | ||||||||||||
| Information Technology | 787,558 | 3,250,846 | — | 4,038,404 | ||||||||||||
| Total Common Stocks | 2,728,366 | 11,314,339 | — | 14,042,705 | ||||||||||||
| Short-Term Investments | 317,154 | — | — | 317,154 | ||||||||||||
| Total Investments in Securities | $ | 3,045,520 | $ | 11,314,339 | $ | — | $ | 14,359,859 | ||||||||
22
Hardman Johnston International Growth Fund
| NOTES TO FINANCIAL STATEMENTS (Continued) |
| at October 31, 2020 |
NOTE 4 – INVESTMENT ADVISORY FEE AND OTHER TRANSACTIONS WITH AFFILIATES
For the year ended October 31, 2020, the Advisor provided the Fund with investment management services under an Investment Advisory Agreement. The Advisor furnishes all investment advice, office space, and facilities, and provides most of the personnel needed by the Fund. For the year ended October 31, 2020, the Fund incurred $60,282 in advisory fees. The Advisor has hired Hardman Johnston Global Advisors LLC as a sub-advisor to the Fund. The Advisor pays the Sub-Advisor fee for the Fund from its own assets and these fees are not an additional expense of the Fund.
The Fund is responsible for its own operating expenses. The Advisor has contractually agreed to waive its management fees and/or absorb expenses of the Fund to ensure that the total annual operating expenses [excluding Acquired Fund Fees and Expenses, taxes, brokerage commissions, interest and extraordinary expenses (collectively, “Excludable Expenses”)] do not exceed the following amounts of the average daily net assets for each class of shares:
| Hardman Johnston International Growth Fund | |||
| Institutional Shares | 1.00% | ||
| Retail Shares | 1.25% | ||
For the year ended October 31, 2020, the Advisor reduced its fees and absorbed Fund expenses in the amount of $332,022 for the Fund. The waivers and reimbursements will remain in effect through February 14, 2021 unless terminated sooner by, or with the consent of, the Board.
The Advisor may request recoupment of previously waived fees and paid expenses in any subsequent month in the three-year period from the date of the management fee reduction and expense payment if the aggregate amount actually paid by the Fund toward the operating expenses for such fiscal year (taking into account the reimbursement) will not cause the Fund to exceed the lesser of: (1) the expense limitation in place at the time of the management fee reduction and expense payment; or (2) the expense limitation in place at the time of the reimbursement. Any such reimbursement is also contingent upon Board of Trustees review and approval at the time the reimbursement is made. Such reimbursement may not be paid prior to the Fund’s payment of current ordinary operating expenses. Cumulative expenses subject to recapture pursuant to the aforementioned conditions expire as follows:
10/31/2021 | 10/31/2022 | 10/31/2023 | Total | ||
| $198,676 | $346,262 | $332,022 | $876,960 |
U.S. Bancorp Fund Services, LLC, doing business as U.S. Bank Global Fund Services, LLC (“Fund Services” or the “Administrator”) acts as the Fund’s Administrator under an Administration Agreement. The Administrator prepares various federal and state regulatory filings, reports and returns for the Fund; prepares reports and materials to be supplied to the Trustees; monitors the activities of the Fund’s custodian, transfer agent and accountants; coordinates the preparation and payment of the Fund’s expenses and
23
Hardman Johnston International Growth Fund
| NOTES TO FINANCIAL STATEMENTS (Continued) |
| at October 31, 2020 |
reviews the Fund’s expense accruals. Fund Services also serves as the fund accountant and transfer agent to the Fund. Vigilant Compliance, LLC serves as the Chief Compliance Officer to the Fund. U.S. Bank N.A., an affiliate of Fund Services, serves as the Fund’s custodian. For the year ended October 31, 2020, the Fund incurred the following expenses for administration, fund accounting, transfer agency and custody fees:
| Administration & fund accounting | $ | 115,825 | |||
| Custody | $ | 40,882 | |||
Transfer agency(a) | $ | 41,936 | |||
(a) Does not include out-of-pocket expenses. |
At October 31, 2020, the Fund had payables due to Fund Services for administration, fund accounting and transfer agency fees and to U.S. Bank N.A. for custody fees in the following amounts:
| Administration & fund accounting | $ | 28,072 | |||
| Custody | $ | 6,526 | |||
Transfer agency(a) | $ | 8,729 | |||
(a) Does not include out-of-pocket expenses. |
Quasar Distributors, LLC (the “Distributor”) acts as the Fund’s principal underwriter in a continuous public offering of the Fund’s shares. A Trustee of the Trust is deemed to be an interested person of the Trust due to his former position with the Distributor.
Certain officers of the Fund are employees of the Administrator and are not paid any fees by the Fund for serving in such capacities.
NOTE 5 – DISTRIBUTION AGREEMENT AND PLAN
The Fund has adopted a Distribution Plan pursuant to Rule 12b-1 (the “Plan”). The Plan permits the Fund to pay for distribution and related expenses at an annual rate of up to 0.25% of the average daily net assets of the Fund’s Retail Shares. The expenses covered by the Plan may include costs in connection with the promotion and distribution of shares and the provision of personal services to shareholders, including, but not necessarily limited to, advertising, compensation to underwriters, dealers and selling personnel, the printing and mailing of prospectuses to other than current Fund shareholders, and the printing and mailing of sales literature. Payments made pursuant to the Plan will represent compensation for distribution and service activities, not reimbursements for specific expenses incurred. For the year ended October 31, 2020, the Hardman Johnston International Growth Fund incurred distribution expenses on its Retail Shares of $850.
NOTE 6 – SECURITIES TRANSACTIONS
For the year ended October 31, 2020, the cost of purchases and the proceeds from sales of securities, excluding short-term securities, were as follows:
Purchases | Sales | ||
| International Growth Fund | $17,447,964 | $14,191,727 |
There were no purchases or sales of long-term U.S. Government securities.
24
Hardman Johnston International Growth Fund
| NOTES TO FINANCIAL STATEMENTS (Continued) |
| at October 31, 2020 |
NOTE 7 – INCOME TAXES AND DISTRIBUTIONS TO SHAREHOLDERS
As of October 31, 2020, the components of accumulated earnings/(losses) on a tax basis were as follows:
Cost of investments(a) | $ | 12,907,746 | |||
| Gross unrealized appreciation | 2,011,299 | ||||
| Gross unrealized depreciation | (559,186 | ) | |||
| Net unrealized appreciation | 1,452,113 | ||||
| Undistributed ordinary income | — | ||||
| Undistributed long-term capital gain | — | ||||
| Total distributable earnings | — | ||||
| Other accumulated gains/(losses) | (382,615 | ) | |||
| Total accumulated earnings/(losses) | $ | 1,069,498 |
(a) | The difference between the book basis and tax basis net unrealized appreciation and cost is attributable primarily to wash sales, and the mark-to-market of passive foreign investment companies. |
As of October 31, 2020, the Fund had short-term tax basis loss carryforwards with no expiration date of $361,433.
At October 31, 2020, the Fund deferred, on a tax basis, post-October losses of:
Capital | Ordinary Late Year Loss | ||
| $ — | $22,056 |
The tax character of distributions paid during the year ended October 31, 2020 and the year ended October 31, 2019 was as follows:
| Year Ended | Year Ended | ||||||||
| October 31, 2020 | October 31, 2019 | ||||||||
| Ordinary income | $ | 84,081 | $ | — | |||||
| Long-term capital gains | — | — | |||||||
| $ | 84,081 | $ | — | ||||||
NOTE 8 – PRINCIPAL RISKS
Below are summaries of some, but not all, of the principal risks of investing in the Fund, each of which could adversely affect the Fund’s NAV, market price, yield, and total return. Further information about investment risks is available in the Fund’s prospectus and Statement of Additional Information.
Equity Market Risk: Equity securities are susceptible to general stock market fluctuations due to economic, market, political and issuer-specific considerations and to potential volatile increases and decreases in value as market confidence in and perceptions of their issuers change.
25
Hardman Johnston International Growth Fund
| NOTES TO FINANCIAL STATEMENTS (Continued) |
| at October 31, 2020 |
Foreign Securities and Currency Risk: Foreign securities are subject to risks relating to political, social and economic developments abroad and differences between U.S. and foreign regulatory requirements and market practices. Those risks are increased for investments in emerging markets. Securities that are denominated in foreign currencies are subject to further risk that the value of the foreign currency will fall in relation to the U.S. dollar and/or will be affected by volatile currency markets or actions of U.S. and foreign governments or central banks. Income earned on foreign securities may be subject to foreign withholding taxes.
Management Risk: The ability of the Fund to meet its investment objective is directly related to the Advisor’s and Sub-Advisor’s management of the Fund. The value of your investment in the Fund may vary with the effectiveness of the Advisor’s research, analysis and asset allocation among portfolio securities. If the investment strategies do not produce the expected results, the value of your investment could be diminished or even lost entirely.
Recent Market Events; Market Risk: Market risk may affect a single issuer, industry, sector of the economy or the market as a whole. U.S. and international markets experienced significant volatility in recent months and years due to a number of economic, political and global macro factors including the impact of the coronavirus as a global pandemic and related public health issues, growth concerns in the U.S. and overseas, uncertainties regarding interest rates, trade tensions and the threat of tariffs imposed by the U.S. and other countries. In particular, the spread of the novel coronavirus worldwide has resulted in disruptions to supply chains and customer activity, stress on the global healthcare system, rising unemployment claims, quarantines, cancellations, market declines, the closing of borders, restrictions on travel and widespread concern and uncertainty. Health crises and related political, social and economic disruptions caused by the spread of the recent coronavirus outbreak may also exacerbate other pre-existing political, social and economic risks in certain countries. It is not possible to know the extent of these impacts, and they may be short term or may last for an extended period of time. These developments as well as other events, such as the U.S. presidential election, could result in further market volatility and negatively affect financial asset prices, the liquidity of certain securities and the normal operations of securities exchanges and other markets, despite government efforts to address market disruptions. In addition, the Fund may face challenges with respect to its day-to-day operations if key personnel of the Advisor or other service providers are unavailable due to quarantines and restrictions on travel related to the coronavirus outbreak. Global economies and financial markets are increasingly interconnected, which increases the probabilities that conditions in one country or region might adversely impact issues in a different country or region.
New Fund Risk: There can be no assurance that the Fund will grow to or maintain an economically viable size, in which case the Board may determine to liquidate the Fund. Liquidation of the Fund can be initiated without shareholder approval by the Board if it determines that liquidation is in the best interest of shareholders. As a result, the timing of the Fund’s liquidation may not be favorable.
26
Hardman Johnston International Growth Fund
| NOTES TO FINANCIAL STATEMENTS (Continued) |
| at October 31, 2020 |
Emerging and Frontier Markets Risk: Countries in emerging markets are generally more volatile and can have relatively unstable governments, social and legal systems that do not protect shareholders, economies based on only a few industries, and securities markets that trade a small number of issues. Frontier market countries generally have smaller economies and even less developed capital markets than emerging markets. As a result, the risks of investing in emerging markets are magnified in frontier markets, and include potential for extreme price volatility and illiquidity; government ownership or control of parts of private sector and of certain companies; trade barriers, exchange controls, managed adjustments in relative currency values and other protectionist measures; and relatively new and unsettled securities laws.
Large Capitalization Risk: Larger, more established companies may be unable to respond quickly to new competitive challenges such as changes in technology and consumer tastes. Larger companies also may not be able to attain the high growth rates of successful smaller companies.
Medium and Small Capitalization Risk: Investing in medium and small capitalization companies may involve special risks because those companies may have narrower product lines, more limited financial resources, fewer experienced managers, dependence on a few key employees, and a more limited trading market for their stocks, as compared with larger companies. Securities of medium and smaller capitalization issuers may be subject to greater price volatility and may decline more significantly in market downturns than securities of larger companies.
NOTE 9 – GUARANTEES AND INDEMNIFICATIONS
In the normal course of business, the Fund enters into contracts that contain a variety of representations and warranties and which provide general indemnifications. The Fund’s maximum exposure under these arrangements is unknown, as this would involve future claims that may be made against the Fund that have not yet occurred. However, based on experience, the Fund expects the risk of loss to be remote.
NOTE 10 – CONTROL OWNERSHIP
The beneficial ownership, either directly or indirectly, of more than 25% of the voting securities of a fund creates a presumption of control of the fund, under Section 2(a)(9) of the 1940 Act. As of October 31, 2020, TD Ameritrade Inc. held 38% of the outstanding shares of the Fund and Charles Schwab & Co. Inc. held 38% of the outstanding shares of the Fund. The Fund has no knowledge as to whether all or any portion of the shares owned of record by TD Ameritrade Inc. or Charles Schwab & Co. Inc. are also beneficially owned.
27
Hardman Johnston International Growth Fund
| REPORT OF INDEPENDENT REGISTERED PUBLIC ACCOUNTING FIRM |
To the Board of Trustees of Manager Directed Portfolios
and the Shareholders of Hardman Johnston International Growth Fund
Opinion on the Financial Statements
We have audited the accompanying statement of assets and liabilities of Hardman Johnston International Growth Fund (formerly Marmont Redwood International Equity Fund), a series of shares of beneficial interest in Manager Directed Portfolios (the “Fund”), including the schedule of investments, as of October 31, 2020, and the related statement of operations for the year then ended, the statements of changes in net assets for each of the years in the two-year period then ended and the financial highlights for each of the years in the two-year period then ended and for the period from commencement of operations (February 14, 2018 for Institutional Shares and September 17, 2018 for Retail Shares) to October 31, 2018, and the related notes (collectively referred to as the “financial statements”). In our opinion, the financial statements present fairly, in all material respects, the financial position of the Fund as of October 31, 2020, and the results of its operations, the changes in its net assets and its financial highlights for the periods presented above, in conformity with accounting principles generally accepted in the United States of America.
Basis for Opinion
These financial statements are the responsibility of the Fund’s management. Our responsibility is to express an opinion on the Fund’s financial statements based on our audits. We are a public accounting firm registered with the Public Company Accounting Oversight Board (United States) (“PCAOB”) and are required to be independent with respect to the Fund in accordance with the U.S. federal securities law and the applicable rules and regulations of the Securities and Exchange Commission and the PCAOB.
We conducted our audits in accordance with the standards of the PCAOB. Those standards require that we plan and perform the audits to obtain reasonable assurance about whether the financial statements are free of material misstatement, whether due to error or fraud. The Fund is not required to have, nor were we engaged to perform, an audit of its internal control over financial reporting. As part of our audits we are required to obtain an understanding of internal control over financial reporting but not for the purpose of expressing an opinion on the effectiveness of the Fund’s internal control over financial reporting. Accordingly, we express no such opinion.
Our audits included performing procedures to assess the risk of material misstatement of the financial statements, whether due to error or fraud, and performing procedures that respond to those risks. Such procedures included examining, on a test basis, evidence regarding the amounts and disclosures in the financial statements. Our procedures included confirmation of securities owned as of October 31, 2020 by correspondence with the custodian or brokers, or by other appropriate auditing procedures where replies from brokers were not received. Our audits also included evaluating the accounting principles used and significant estimates made by management, as well as evaluating the overall presentation of the financial statements. We believe that our audits provide a reasonable basis for our opinion.

BBD, LLP
We have served as the auditor of one or more of the Funds in the Manager Directed Portfolios since 2007.
Philadelphia, Pennsylvania
December 29, 2020
28
Hardman Johnston International Growth Fund
| MATTERS SUBMITTED TO A SHAREHOLDER VOTE |
| at October 31, 2020 (Unaudited) |
A special meeting of shareholders of the Fund was held on January 21, 2020, and the following matters were approved by the Fund’s shareholders:
To approve a new sub-advisory agreement between Dakota Investments LLC and Hardman Johnston Global Advisors LLC:
For | Against | Abstain | ||
| 107,351 | — | 1,630 |
To change the Fund’s diversification status from being a “diversified fund” to being a “non-diversified fund”:
For | Against | Abstain | ||
| 107,351 | — | 1,630 |
29
Hardman Johnston International Growth Fund
| EXPENSE EXAMPLE |
| October 31, 2020 (Unaudited) |
As a shareholder of the Fund, you incur two types of costs: (1) transaction costs including sales charges (loads) and redemption fees, if applicable; and (2) ongoing costs, including management fees; distribution and/or service (12b-1 fees); and other Fund expenses. This Example is intended to help you understand your ongoing costs (in dollars) of investing in the Fund and to compare these costs with the ongoing costs of investing in other mutual funds.
The Example is based on an investment of $1,000 invested at the beginning of the period indicated and held for the entire period from May 1, 2020 to October 31, 2020 for the Institutional and Retail Shares.
Actual Expenses
The information in the table under the heading “Actual” provides information about actual account values and actual expenses. You may use the information in these columns together with the amount you invested, to estimate the expenses that you paid over the period. Simply divide your account value by $1,000 (for example, an $8,600 account value divided by $1,000 = 8.6), then multiply the result by the number in the row entitled “Expenses Paid During Period” to estimate the expenses you paid on your account during this period. There are some account fees that are charged to certain types of accounts, such as Individual Retirement Accounts (generally, a $15 fee is charged to the account annually) that would increase the amount of expenses paid on your account. The example below does not include portfolio trading commissions and related expenses and other extraordinary expenses as determined under generally accepted accounting principles.
Hypothetical Example for Comparison Purposes
The information in the table under the heading “Hypothetical (5% return before expenses)” provides information about hypothetical account values and hypothetical expenses based on the Fund’s actual expense ratio and assumed rate of return of 5% per year before expenses, which is not the Fund’s actual return. The hypothetical account values and expenses may not be used to estimate the actual ending account balance or expenses you paid for the period. You may use this information to compare the ongoing costs of investing in the Fund and other funds. To do so, compare this 5% hypothetical example with the 5% hypothetical examples that appear in the shareholder reports of the other funds. As noted above, there are some account fees that are charged to certain types of accounts that would increase the amount of expense paid on your account.
Please note that the expenses shown in the table are meant to highlight your ongoing costs only and do not reflect any transaction costs, such as sales charges (loads), redemption fees, or exchange fees. Therefore, the information under the heading “Hypothetical (5% return before expenses)” is useful in comparing ongoing costs only, and will not help you determine the relative total costs of owning different funds. In addition, if these transactional costs were included, your costs would have been higher.
30
Hardman Johnston International Growth Fund
| EXPENSE EXAMPLE (Continued) |
| October 31, 2020 (Unaudited) |
| Beginning | Ending | Expenses Paid | |
| Account Value | Account Value | During Period(1) | |
5/1/20 | 10/31/20 | 5/1/20 – 10/31/20 | |
| Actual | |||
| Institutional Shares | $1,000.00 | $1,296.40 | $5.77 |
| Retail Shares | $1,000.00 | $1,295.60 | $7.21 |
| Hypothetical (5% return | |||
| before expenses) | |||
| Institutional Shares | $1,000.00 | $1,020.11 | $5.08 |
| Retail Shares | $1,000.00 | $1,018.85 | $6.34 |
(1) | Expenses are equal to the Institutional and Retail Shares’ annualized expense ratio of 1.00% and 1.25%, respectively, multiplied by the average account value over the period, multiplied by 184/366 (to reflect the period). |
31
Hardman Johnston International Growth Fund
| NOTICE TO SHAREHOLDERS |
| at October 31, 2020 (Unaudited) |
How to Obtain a Copy of the Fund’s Proxy Voting Policies
A description of the policies and procedures that the Fund uses to determine how to vote proxies relating to portfolio securities is available without charge, upon request, by calling 1-833-627-6668 or on the U.S. Securities and Exchange Commission’s (“SEC”) website at http://www.sec.gov.
How to Obtain a Copy of the Fund’s Proxy Voting Records for the most recent 12-Month Period Ended June 30
Information regarding how the Fund voted proxies relating to portfolio securities during the most recent 12-month period ended June 30 is available no later than August 31 without charge, upon request, by 1-833-627-6668. Furthermore, you can obtain the Fund’s proxy voting records on the SEC’s website at http://www.sec.gov.
Quarterly Filings on Form N-Q/Form N-PORT
The Fund files its complete schedule of portfolio holdings with the SEC for the first and third quarters of each fiscal year on Form N-Q or Part F of Form N-PORT (beginning with filings after March 31, 2020). The Fund’s Form N-Q or Part F of Form N-PORT (beginning with filings after March 31, 2020) is available on the SEC’s website at http://www.sec.gov. Information included in the Fund’s Form N-Q or Part F of Form N-PORT (beginning with filings after March 31, 2020) is also available, upon request, by calling 1-833-627-6668.
Householding
In an effort to decrease costs, the Fund intends to reduce the number of duplicate prospectuses and annual and semi-annual reports you receive by sending only one copy of each to those addresses shared by two or more accounts and to shareholders the Transfer Agent reasonably believes are from the same family or household. Once implemented, if you would like to discontinue householding for your accounts, please call toll-free at 1-833-627-6668 to request individual copies of these documents. Once the Transfer Agent receives notice to stop householding, the Transfer Agent will begin sending individual copies thirty days after receiving your request. This policy does not apply to account statements.
32
Hardman Johnston International Growth Fund
| NOTICE TO SHAREHOLDERS (Continued) |
| at October 31, 2020 (Unaudited) |
Other Tax Information
For the year ended October 31, 2020, certain dividends paid by the Fund may be subject to a maximum tax rate of 15%, as provided by the Jobs and Growth Tax Relief Reconciliation Act of 2003. The percentage of dividends declared from ordinary income designated as qualified dividend income was as follows:
| International Growth Fund | 100% |
For corporate shareholders, the percent of ordinary income distributions qualifying for the corporate dividends received deduction for the year ended October 31, 2020 was as follows:
| International Growth Fund | 0% |
33
Hardman Johnston International Growth Fund
| TRUSTEES AND OFFICERS |
| (Unaudited) |
The business and affairs of the Trust are managed under the oversight of the Board, subject to the laws of the State of Delaware and the Trust’s Agreement and Declaration of Trust. The Board is currently comprised of three trustees who are not interested persons of the Trust within the meaning of the 1940 Act (the “Independent Trustees”) and one interested person of the Trust (the “Interested Trustee”). The Trustees are responsible for deciding matters of overall policy and overseeing the actions of the Trust’s service providers. The officers of the Trust conduct and supervise the Trust’s daily business operations.
| Number of | ||||
| Funds | Other | |||
| Position(s) Held | in Fund | Directorships | ||
| Name, | with the Trust | Complex | Held by Trustee | |
| Year of Birth | and Length of | Principal Occupation(s) | Overseen by | During the Past |
and Address(1) | Time Served(3) | During the Past Five Years | Trustee | Five Years |
| INTERESTED TRUSTEE | ||||
| James R. | Trustee and | Distribution consultant since | 9 | None |
Schoenike(2) | Chairman since | 2018, President and CEO, | ||
| (Born 1959) | July 2016 | Board of Managers, Quasar | ||
| Distributors, LLC | ||||
| (2013 – 2018). | ||||
| INDEPENDENT TRUSTEES | ||||
| Gaylord B. Lyman | Trustee and Audit | Senior Portfolio Manager, | 9 | None |
| (Born 1962) | Committee | Affinity Investment Advisors, | ||
| Chairman, since | LLC, since 2017; Managing | |||
| April 2015 | Director of Kohala Capital | |||
| Partners, LLC (2011 – 2016). | ||||
| Scott Craven Jones | Trustee since | Managing Director, Carne Global | 9 | Trustee, Madison |
| (Born 1962) | July 2016 and | Financial Services (US) LLC | Funds, since 2019 | |
| Lead Independent | (a provider of independent | (18 portfolios); | ||
| Trustee since | governance and distribution | Trustee, XAI | ||
| May 2017 | support for the asset management | Octagon Floating | ||
| industry), since 2013. | Rate & Alternative | |||
| Income Term | ||||
| Trust, since 2017 | ||||
| (2 portfolios); | ||||
| Director, | ||||
| Guestlogix Inc. | ||||
| (a provider of | ||||
| ancillary-focused | ||||
| technology to the | ||||
| travel industry) | ||||
| (2015 – 2016). |
34
Hardman Johnston International Growth Fund
| TRUSTEES AND OFFICERS (Continued) |
| (Unaudited) |
| Number of | ||||
| Funds | Other | |||
| Position(s) Held | in Fund | Directorships | ||
| Name, | with the Trust | Complex | Held by Trustee | |
| Year of Birth | and Length of | Principal Occupation(s) | Overseen by | During the Past |
and Address(1) | Time Served(3) | During the Past Five Years | Trustee | Five Years |
| Lawrence T. | Trustee since | Senior Vice President and Chief | 9 | None |
| Greenberg | July 2016 | Legal Officer, The Motley Fool | ||
| (Born 1963) | Holdings, Inc., since 1996; | |||
| Venture Partner and General | ||||
| Counsel, Motley Fool Ventures LP, | ||||
| since 2018; Manager, Motley Fool | ||||
| Wealth Management, LLC, | ||||
| since 2013; Adjunct Professor, | ||||
| Washington College of Law, | ||||
| American University, since 2006; | ||||
| General Counsel Motley Fool | ||||
| Asset Management, LLC | ||||
| (2008 – 2019). |
| (1) | The address of each Trustee as it relates to the Trust’s business is c/o U.S. Bank Global Fund Services, 615 East Michigan Street, Milwaukee, WI 53202. |
| (2) | Mr. Schoenike is an Interested Trustee by virtue of the fact that he was recently President of Quasar Distributors, LLC, the Fund’s distributor (the “Distributor”). |
| (3) | Each Trustee serves during the continued lifetime of the Trust until he dies, resigns, is declared bankrupt or incompetent by a court of competent jurisdiction, or is removed. |
35
Hardman Johnston International Growth Fund
| TRUSTEES AND OFFICERS (Continued) |
| (Unaudited) |
As of the date of this report, no Independent Trustee nor any of his immediate family members (i.e., spouse or dependent children) serves as an officer or director or is an employee of the Advisor, Sub-Advisor or Distributor, or any of their respective affiliates, nor is such person an officer, director or employee of any company controlled by or under common control with such entities.
| Name, | Position(s) Held with | |
| Year of Birth | Trust and Length | |
and Address | of Time Served(3) | Principal Occupation(s) During Past Five Years |
| OFFICERS | ||
Douglas J. Neilson(1) | President and Principal | Vice President, Compliance and Administration, |
| (Born 1975) | Executive Officer, | Fund Services, since 2001 |
| since July 1, 2016 | ||
Matthew J. McVoy(1) | Treasurer and Principal | Assistant Vice President, Compliance and |
| (Born 1980) | Financial Officer, | Administration, Fund Services, since 2005 |
| since July 1, 2016 | ||
Justin Dausch(2) | Chief Compliance | Director, Vigilant, since 2017; Compliance Associate, |
| (Born 1989) | Officer and | HSBC (investment banking company), 2015 – 2017 |
| Anti-Money Laundering | ||
| Compliance Officer, | ||
| since January 1, 2020 | ||
Alyssa M. Bernard(1) | Secretary, since | Assistant Vice President, Compliance and |
| (Born 1988) | August 20, 2019 | Administration, Fund Services, since 2018; Attorney, |
| Mutual Fund Disclosure, Waddell & Reed Financial, | ||
| Inc., 2017 – 2018; Attorney, Corporate Governance, | ||
| American Century Companies, Inc., 2014 – 2017 |
| (1) | The mailing address of this officer is: 615 East Michigan Street, Milwaukee, Wisconsin 53202. |
| (2) | The mailing address of this officer is: 223 Wilmington West Chester Pike, Suite 216, Chadds Ford, Pennsylvania 19317. |
| (3) | Each officer is elected annually and serves until his or her successor has been duly elected and qualified. |
The Statement of Additional Information includes additional information about the Fund’s Trustees and Officers and is available, without charge, upon request by calling 1-833-627-6668.
36
Hardman Johnston International Growth Fund
| NOTICE OF PRIVACY POLICY & PRACTICES |
Protecting the privacy of Fund shareholders is important to us. The following is a description of the practices and policies through which we protect the privacy and security of your non-public personal information.
What Information We Collect
We collect and maintain information about you so that we can open and maintain your account in the Fund and provide various services to you. We collect non-public personal information about you from the following sources:
• information we receive about you on applications or other forms;
• information you give us orally; and
• information about your transactions with us or others.
The types of non-public personal information we collect and share can include:
• social security number;
• account balances;
• account transactions;
• transaction history;
• wire transfer instructions; and
• checking account information.
What Information We Disclose
We do not disclose any non-public personal information about shareholders or former shareholders of the Fund without the shareholder’s authorization, except as permitted by law or in response to inquiries from governmental authorities. We may share information with affiliated parties and unaffiliated third parties with whom we have contracts for servicing the Fund. We will provide unaffiliated third parties with only the information necessary to carry out their assigned responsibility.
How We Protect Your Information
All shareholder records will be disposed of in accordance with applicable law. We maintain physical, electronic and procedural safeguards to protect your non-public personal information and require third parties to treat your non-public personal information with the same high degree of confidentiality.
In the event that you hold shares of the Fund through a financial intermediary, including, but not limited to, a broker-dealer, bank or trust company, the privacy policy of your financial intermediary would govern how your non-public personal information would be shared with unaffiliated third parties.
If you have any questions or concerns regarding this notice or our Privacy Policy, please contact us at 1-833-627-6668.
37
(This Page Intentionally Left Blank.)
Investment Advisor
Dakota Investments LLC
925 West Lancaster Avenue, Suite 220
Bryn Mawr, PA 19010
Investment Sub-Advisor
Hardman Johnston Global Advisors LLC
300 Atlantic Street, Suite 601
Stamford, CT 06901
Distributor
Quasar Distributors, LLC
111 East Kilbourn Avenue, Suite 2200
Milwaukee, WI 53202
Transfer Agent
U.S. Bancorp Fund Services, LLC
615 East Michigan Street
Milwaukee, WI 53202
(833) 627-6668
Custodian
U.S. Bank National Association
Custody Operations
1555 North River Center Drive, Suite 302
Milwaukee, WI 53212
Independent Registered Public Accounting Firm
BBD, LLP
1835 Market Street, 3rd floor
Philadelphia, PA 19103
Legal Counsel
Godfrey & Kahn S.C.
833 East Michigan Street, Suite 1800
Milwaukee, WI 53202
This report is intended for shareholders of the Fund and may not be used as sales literature unless preceded or accompanied by a current prospectus.
Past performance results shown in this report should not be considered a representation of future performance. Share price and returns will fluctuate so that shares, when redeemed, may be worth more or less than their original cost. Statements and other information herein are dated and are subject to change.
Item 2. Code of Ethics.
The registrant has adopted a code of ethics that applies to the registrant’s principal executive officer and principal financial officer. The registrant has not made any substantive amendments to its code of ethics during the period covered by this report. The registrant has not granted any waivers from any provisions of the code of ethics during the period covered by this report.
A copy of the registrant’s Code of Ethics is filed herewith.
Item 3. Audit Committee Financial Experts.
The registrant’s Board of Trustees has determined that there are at least two audit committee financial experts serving on its audit committee. Messrs. Gaylord B. Lyman and Scott C. Jones are the “audit committee financial experts” and are considered to be “independent” as each term is defined in Item 3 of Form N‑CSR.
Item 4. Principal Accountant Fees and Services.
The registrant has engaged its principal accountant to perform audit services, audit-related services, tax services and other services during the past two fiscal years. “Audit services” refer to performing an audit of the registrant's annual financial statements or services that are normally provided by the accountant in connection with statutory and regulatory filings or engagements for those fiscal years. “Audit-related services” refer to the assurance and related services by the principal accountant that are reasonably related to the performance of the audit. “Tax services” refer to professional services rendered by the principal accountant for tax compliance, tax advice, and tax planning. There were no ���other services” provided by the principal accountant. The following table details the aggregate fees billed or expected to be billed for each of the last two fiscal years for audit fees, audit-related fees, tax fees and other fees by the principal accountant.
| FYE 10/31/2020 | FYE 10/31/2019 | |
Audit Fees | $12,500 | $12,500 |
Audit-Related Fees | N/A | N/A |
Tax Fees | $3,000 | $3,000 |
All Other Fees | N/A | N/A |
Pursuant to its charter, the Trust’s Audit Committee must review and approve in advance the engagement of the independent accountants, including each audit and non-audit service permitted by appropriate rules or regulations provided to the Trust and each non-audit service provided to the Trust’s investment advisers and any entity controlling, controlled by or under common control with the investment advisers that provides ongoing services to the Trust relating to the operations and financial reporting of the Trust. The Committee may delegate the authority to grant such pre-approval to one or more Committee members who are independent Trustees within the meaning of Section 10A(i) of the Securities Exchange Act of 1934, as amended, provided that the decision of such member(s) is presented to the full Committee at its next scheduled meeting. The Committee may approve each audit and non-audit service on a case-by-case basis, and/or adopt pre-approval policies and procedures that are detailed as to a particular service, provided that the Committee is informed of each service in a timely manner and the policies and procedures do not include delegation of the Committee’s responsibilities under the Securities Exchange Act of 1934 to management. The foregoing pre-approval requirement with respect to the provision of non-audit services to the Trust may be waived if (i) the aggregate amount of all such non-audit services provided to the Trust constitutes not more than 5 percent of the total amount of revenues paid by the Trust to its independent accountants during the fiscal year in which the non-audit services are provided; (ii) such services were not recognized by the Trust at the time of the engagement to be non-audit services; and (iii) such services are promptly brought to the attention of the Committee and approved prior to the completion of the audit by the Committee or by one or more members of the Committee to whom authority to grant such approvals has been delegated by the Committee.
The percentage of fees billed by BBD, LLP applicable to non-audit services pursuant to waiver of pre-approval requirement were as follows:
| FYE 10/31/2020 | FYE 10/31/2019 | |
Audit-Related Fees | 0% | 0% |
Tax Fees | 0% | 0% |
All Other Fees | 0% | 0% |
All of the principal accountant’s hours spent on auditing the registrant’s financial statements were attributed to work performed by full‑time permanent employees of the principal accountant.
The following table indicates the non-audit fees billed or expected to be billed by the registrant’s accountant for services to the registrant and to the registrant’s investment adviser (and any other controlling entity, etc.—not sub-adviser) for the last two years. The audit committee of the Board of Trustees has considered whether the provision of non-audit services that were rendered to the registrant's investment adviser is compatible with maintaining the principal accountant's independence and has concluded that the provision of such non-audit services by the accountant has not compromised the accountant’s independence.
Non-Audit Related Fees | FYE 10/31/2020 | FYE 10/31/2019 |
Registrant | N/A | N/A |
Registrant’s Investment Adviser | N/A | N/A |
Item 5. Audit Committee of Listed Registrants.
(a) Not applicable to registrants who are not listed issuers (as defined in Rule 10A-3 under the Securities Exchange Act of 1934).
(b) Not Applicable.
Item 6. Investments.
(a) | Schedule of Investments is included as part of the report to shareholders filed under Item 1 of this Form. |
(b) | Not Applicable. |
Item 7. Disclosure of Proxy Voting Policies and Procedures for Closed-End Management Investment Companies.
Not applicable to open-end investment companies.
Item 8. Portfolio Managers of Closed-End Management Investment Companies.
Not applicable to open-end investment companies.
Item 9. Purchases of Equity Securities by Closed‑End Management Investment Company and Affiliated Purchasers.
Not applicable to open-end investment companies.
Item 10. Submission of Matters to a Vote of Security Holders.
There have been no material changes to the procedures by which shareholders may recommend nominees to the Registrant’s Board of Trustees.
Item 11. Controls and Procedures.
(a) | The Registrant’s President/Principal Executive Officer and Treasurer/Principal Financial Officer have reviewed the Registrant's disclosure controls and procedures (as defined in Rule 30a-3(c) under the Investment Company Act of 1940, as amended, (the “Act”)) as of a date within 90 days of the filing of this report, as required by Rule 30a-3(b) under the Act and Rules 13a-15(b) or 15d‑15(b) under the Securities Exchange Act of 1934. Based on their review, such officers have concluded that the disclosure controls and procedures are effective in ensuring that information required to be disclosed in this report is appropriately recorded, processed, summarized and reported and made known to them by others within the Registrant and by the Registrant’s service provider. |
(b) | There were no changes in the Registrant's internal control over financial reporting (as defined in Rule 30a-3(d) under the Act) that occurred during the fourth fiscal quarter of the period covered by this report that has materially affected, or is reasonably likely to materially affect, the Registrant's internal control over financial reporting. |
Item 12. Disclosure of Securities Lending Activities for Closed-End Management Investment Companies.
Not applicable to open-end investment companies.
Item 13. Exhibits.
(3) Any written solicitation to purchase securities under Rule 23c‑1 under the Act sent or given during the period covered by the report by or on behalf of the registrant to 10 or more persons. Not applicable to open-end investment companies.
(4) Change in the registrant’s independent public accountant. There was no change in the registrant’s independent public accountant for the period covered by this report.
SIGNATURES
Pursuant to the requirements of the Securities Exchange Act of 1934 and the Investment Company Act of 1940, as amended, the registrant has duly caused this report to be signed on its behalf by the undersigned, thereunto duly authorized.
(Registrant) Manager Directed Portfolios
By (Signature and Title)* /s/Douglas J. Neilson
Douglas J. Neilson, President/
Principal Executive Officer
Date 1/8/2021
Pursuant to the requirements of the Securities Exchange Act of 1934 and the Investment Company Act of 1940, as amended, this report has been signed below by the following persons on behalf of the registrant and in the capacities and on the dates indicated.
By (Signature and Title)* /s/Douglas J. Neilson
Douglas J. Neilson, President/
Principal Executive Officer
Date 1/8/2021
By (Signature and Title)* /s/Matthew J. McVoy
Matthew J. McVoy, Treasurer/
Principal Financial Officer
Date 1/8/2021
* Print the name and title of each signing officer under his or her signature.