Hardman Johnston
International Growth Fund
Retail Shares HJIRX
Institutional Shares HJIGX
Semi-Annual Report
April 30, 2020
Beginning on January 1, 2021, as permitted by regulations adopted by the U.S. Securities and Exchange Commission, paper copies of the Fund’s annual and semi-annual shareholder reports will no longer be sent by mail, unless you specifically request paper copies of the reports from the Fund or from your financial intermediary, such as a broker dealer or bank. Instead, the reports will be made available on the Fund’s website, www.marmontpartners.com, and you will be notified by mail each time a report is posted and provided with a website link to access the report. If you already elected to receive shareholder reports electronically, you will not be affected by this change and you need not take any action. You may elect to receive shareholder reports and other communications from the Fund electronically anytime by contacting your financial intermediary (such as a broker-dealer or a bank) or, if you are a direct investor, by calling 1-833-627-6668, sending an e-mail request to inquiries@marmontpartners.com, or by enrolling at www.marmontpartners.com. You may elect to receive all future reports in paper free of charge. If you invest through a financial intermediary, you can contact your financial intermediary to request that you continue to receive paper copies of your shareholder reports. If you invest directly with the Fund, you can call 1-833-627-6668 or send an email request to inquiries@marmontpartners.com to let the Fund know you wish to continue receiving paper copies of your shareholder reports. Your election to receive reports in paper will apply to all funds held in your account if you invest through your financial intermediary or all funds held with the fund complex if you invest directly with the Fund.
Hardman Johnston International Growth Fund
Table of Contents
| Sector Allocation | | 3 |
| Schedule of Investments | | 4 |
| Statement of Assets and Liabilities | | 6 |
| Statement of Operations | | 7 |
| Statements of Changes in Net Assets | | 8 |
| Financial Highlights | | 10 |
| Notes to Financial Statements | | 12 |
| Expense Example | | 22 |
| Notice to Shareholders | | 24 |
| Approval of Investment Advisory Agreement | | 25 |
| Approval of Investment Sub-Advisory Agreement | | 29 |
| Notice of Privacy Policy & Practices | | 33 |
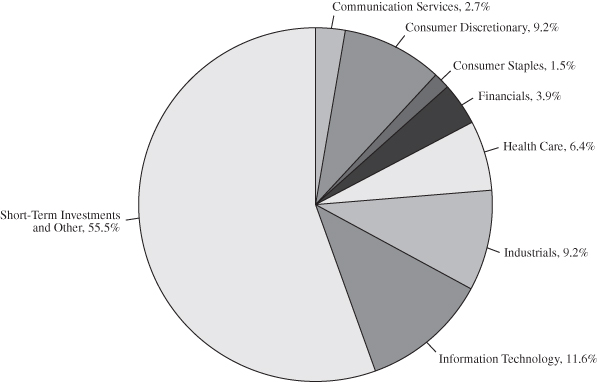
Hardman Johnston International Growth Fund
| SECTOR ALLOCATION OF PORTFOLIO ASSETS |
| at April 30, 2020 (Unaudited) |
| COUNTRY ALLOCATION OF PORTFOLIO ASSETS |
| at April 30, 2020 (Unaudited) |
| | Japan | 10.9% | |
| | Cayman Islands | 9.6% | |
| | France | 4.6% | |
| | Netherlands | 4.5% | |
| | Germany | 4.4% | |
| | United Kingdom | 2.6% | |
| | Hong Kong | 2.2% | |
| | India | 1.7% | |
| | New Zealand | 1.5% | |
| | Italy | 1.3% | |
| | Australia | 1.2% | |
| | Short-Term Investments and Other | 55.5% | |
Percentages represent market value as a percentage of net assets.
Hardman Johnston International Growth Fund
| SCHEDULE OF INVESTMENTS |
| at April 30, 2020 (Unaudited) |
| | | Number of | | | | |
| COMMON STOCKS – 44.5% | | Shares | | | Value | |
| | | | | | | |
| Communication Services – 2.7% | | | | | | |
| Tencent Holdings Ltd. | | | 1,490 | | | $ | 78,328 | |
| | | | | | | | | |
| Consumer Discretionary – 9.2% | | | | | | | | |
| adidas AG | | | 255 | | | | 58,378 | |
| Alibaba Group Holding Ltd. – ADR (a) | | | 445 | | | | 90,188 | |
| Kering SA | | | 128 | | | | 65,115 | |
| Melco Resorts & Entertainment Ltd. – ADR | | | 3,040 | | | | 48,093 | |
| Puma SE (a) | | | 103 | | | | 6,470 | |
| | | | | | | | 268,244 | |
| Consumer Staples – 1.5% | | | | | | | | |
| a2 Milk Co. Ltd. (a) | | | 3,640 | | | | 42,928 | |
| | | | | | | | | |
| Financials – 3.9% | | | | | | | | |
| AIA Group Ltd. | | | 7,080 | | | | 64,979 | |
| ICICI Bank Ltd. – ADR | | | 5,005 | | | | 48,849 | |
| | | | | | | | 113,828 | |
| Health Care – 6.4% | | | | | | | | |
| AstraZeneca Plc | | | 710 | | | | 74,260 | |
| Bayer AG | | | 305 | | | | 20,060 | |
| Orpea | | | 275 | | | | 30,589 | |
| Wuxi Biologics Cayman, Inc. (a) | | | 3,965 | | | | 61,721 | |
| | | | | | | | 186,630 | |
| Industrials – 9.2% | | | | | | | | |
| Airbus SE (a) | | | 550 | | | | 34,825 | |
| Daifuku Co Ltd. | | | 1,275 | | | | 89,225 | |
| Nidec Corp. | | | 1,160 | | | | 67,528 | |
| Prysmian SpA | | | 2,035 | | | | 38,397 | |
| Safran SA | | | 415 | | | | 38,583 | |
| | | | | | | | 268,558 | |
The accompanying notes are an integral part of these financial statements.
Hardman Johnston International Growth Fund
| SCHEDULE OF INVESTMENTS (Continued) |
| at April 30, 2020 (Unaudited) |
| | | Number of | | | | |
| COMMON STOCKS – 44.5% (Continued) | | Shares | | | Value | |
| | | | | | | |
| Information Technology – 11.6% | | | | | | |
| Afterpay Ltd. (a) | | | 1,825 | | | $ | 36,291 | |
| ASML Holding NV | | | 330 | | | | 96,389 | |
| Infineon Technologies AG | | | 2,355 | | | | 43,782 | |
| Keyence Corp. | | | 235 | | | | 83,898 | |
| Murata Manufacturing Co Ltd. | | | 1,355 | | | | 76,350 | |
| | | | | | | | 336,710 | |
| TOTAL COMMON STOCKS | | | | | | | | |
| (Cost $1,487,079) | | | | | | | 1,295,226 | |
| | | | | | | | | |
| SHORT-TERM INVESTMENT – 9.2% | | | | | | | | |
| | | | | | | | | |
| MONEY MARKET FUND – 9.2% | | | | | | | | |
| First American Government Obligations Fund – | | | | | | | | |
| Class X, 0.25% (b) | | | 266,129 | | | | 266,129 | |
| TOTAL SHORT-TERM INVESTMENT | | | | | | | | |
| (Cost $266,129) | | | | | | | 266,129 | |
| TOTAL INVESTMENTS | | | | | | | | |
| (Cost $1,753,208) – 53.7% | | | | | | | 1,561,355 | |
| Other Assets in Excess of Liabilities – 46.3% | | | | | | | 1,348,629 | |
| TOTAL NET ASSETS – 100.00% | | | | | | $ | 2,909,984 | |
PLC – Public Limited Company
| (a) | Non-income producing security. |
| (b) | The rate shown represents the fund’s 7-day yield as of April 30, 2020. |
The Global Industry Classification Standard (GICS®) was developed by and/or is the exclusive property of MSCI, Inc. and Standard & Poor’s Financial Services LLC (“S&P”). GICS is a service mark of MSCI and S&P and has been licensed for use by U.S. Bank Global Fund Services.
The accompanying notes are an integral part of these financial statements.
Hardman Johnston International Growth Fund
| STATEMENT OF ASSETS AND LIABILITIES |
| at April 30, 2020 (Unaudited) |
| Assets: | | | |
| Investments, at value (cost of $1,753,208) | | $ | 1,561,355 | |
| Receivables: | | | | |
| Fund shares sold | | | 1,442,400 | |
| Dividends and interest | | | 15,194 | |
| Due from Advisor | | | 25,624 | |
| Prepaid expenses | | | 21,068 | |
| Total assets | | | 3,065,641 | |
| | | | | |
| Liabilities: | | | | |
| Payables: | | | | |
| Securities purchased | | | 25,247 | |
| Administration and fund accounting fees | | | 45,565 | |
| Audit Fees | | | 23,217 | |
| Custody fees | | | 12,402 | |
| Legal Fees | | | 7,792 | |
| Reports to shareholders | | | 9,208 | |
| Transfer agent fees and expenses | | | 27,206 | |
| Other accrued expenses | | | 5,020 | |
| Total liabilities | | | 155,657 | |
| | | | | |
| Net assets | | $ | 2,909,984 | |
| | | | | |
| Net assets consist of: | | | | |
| Paid in capital | | $ | 3,529,667 | |
| Total accumulated deficit | | | (619,683 | ) |
| Net assets | | $ | 2,909,984 | |
| | | | | |
| Institutional Shares: | | | | |
| Net assets applicable to outstanding Institutional Shares | | $ | 2,798,687 | |
| Shares issued (Unlimited number of beneficial | | | | |
| interest authorized, $0.01 par value) | | | 326,677 | |
| Net asset value, offering price and redemption price per share | | $ | 8.57 | |
| | | | | |
| Retail Shares: | | | | |
| Net assets applicable to outstanding Retail Shares | | $ | 111,297 | |
| Shares issued (Unlimited number of beneficial | | | | |
| interest authorized, $0.01 par value) | | | 12,238 | |
| Net asset value, offering price and redemption price per share | | $ | 9.09 | |
The accompanying notes are an integral part of these financial statements.
Hardman Johnston International Growth Fund
| STATEMENT OF OPERATIONS |
| For the Six Months Ended April 30, 2020 (Unaudited) |
| Investment income: | | | |
| Dividends (net of foreign taxes withheld of $901) | | $ | 9,855 | |
| Interest | | | 898 | |
| Total investment income | | | 10,753 | |
| | | | | |
| Expenses: | | | | |
| Investment advisory fees (Note 4) | | | 14,867 | |
| Administration and fund accounting fees (Note 4) | | | 54,991 | |
| Distribution fees (Note 5) | | | | |
| Distribution fees – Retail Shares | | | 673 | |
| Transfer agent fees and expenses | | | 32,624 | |
| Federal and state registration fees | | | 18,800 | |
| Audit fees | | | 7,716 | |
| Compliance expense | | | 7,984 | |
| Legal fees | | | 10,920 | |
| Reports to shareholders | | | 4,095 | |
| Trustees’ fees and expenses | | | 5,464 | |
| Custody fees | | | 15,182 | |
| Other | | | 5,942 | |
| Total expenses before reimbursement from advisor | | | 179,258 | |
| Expense reimbursement from advisor (Note 4) | | | (163,718 | ) |
| Net expenses | | | 15,540 | |
| Net investment loss | | | (4,787 | ) |
| | | | | |
| Realized and unrealized gain (loss) on investments: | | | | |
| Net realized gain (loss) on transactions from: | | | | |
| Investments | | | 1,029,019 | |
| Foreign currency related transactions | | | 495 | |
| Net change in unrealized gain (loss) on: | | | | |
| Investments | | | (1,143,876 | ) |
| Foreign currency related transactions | | | (3,791 | ) |
| Net realized and unrealized loss on investments | | | (118,153 | ) |
| Net decrease in net assets resulting from operations | | $ | (122,940 | ) |
The accompanying notes are an integral part of these financial statements.
Hardman Johnston International Growth Fund
| STATEMENTS OF CHANGES IN NET ASSETS |
| |
| | | Six Months Ended | | | | |
| | | April 30, 2020 | | | Year Ended | |
| | | (Unaudited) | | | October 31, 2019 | |
| Operations: | | | | | | |
| Net investment income (loss) | | $ | (4,787 | ) | | $ | 86,374 | |
| Net realized gain (loss) on investments | | | 1,029,514 | | | | (1,249,293 | ) |
| Net change in unrealized gain (loss) on investments | | | (1,147,667 | ) | | | 2,007,506 | |
| Net increase (decrease) in net assets | | | | | | | | |
| resulting from operations | | | (122,940 | ) | | | 844,587 | |
| | | | | | | | | |
| Distributions to Shareholders From: | | | | | | | | |
| Net investment income | | | | | | | | |
| Investor class shares | | | — | | | | — | |
| Institutional shares | | | (84,081 | ) | | | — | |
| Total distributions | | | (84,081 | ) | | | — | |
| | | | | | | | | |
| Capital Share Transactions: | | | | | | | | |
| Proceeds from shares sold | | | | | | | | |
| Retail shares | | | 73,700 | | | | 174,168 | |
| Institutional shares | | | 1,610,245 | | | | 351,239 | |
| Proceeds from shares issued to holders | | | | | | | | |
| in reinvestment of dividends | | | | | | | | |
| Retail shares | | | — | | | | — | |
| Institutional shares | | | 84,081 | | | | — | |
| Cost of shares redeemed | | | | | | | | |
| Retail shares | | | (2,444,639 | ) | | | (339,536 | ) |
| Institutional shares | | | (5,753,824 | ) | | | (3,453,440 | ) |
| Net decrease in net assets | | | | | | | | |
| from capital share transactions | | | (6,430,437 | ) | | | (3,267,569 | ) |
| | | | | | | | | |
| Total decrease in net assets | | | (6,637,458 | ) | | | (2,422,982 | ) |
| | | | | | | | | |
| Net Assets: | | | | | | | | |
| Beginning of period | | | 9,547,442 | | | | 11,970,424 | |
| End of period | | $ | 2,909,984 | | | $ | 9,547,442 | |
The accompanying notes are an integral part of these financial statements.
Hardman Johnston International Growth Fund
| STATEMENTS OF CHANGES IN NET ASSETS (Continued) |
| |
| | | Six Months Ended | | | | |
| | | April 30, 2020 | | | Year Ended | |
| | | (Unaudited) | | | October 31, 2019 | |
| Changes in Shares Outstanding: | | | | | | |
| Shares sold | | | | | | |
| Retail shares | | | 6,998 | | | | 18,574 | |
| Institutional shares | | | 187,292 | | | | 37,976 | |
| Proceeds from shares issued to holders | | | | | | | | |
| in reinvestment of dividends | | | | | | | | |
| Retail shares | | | — | | | | — | |
| Institutional shares | | | 8,536 | | | | — | |
| Shares redeemed | | | | | | | | |
| Retail shares | | | (237,685 | ) | | | (37,012 | ) |
| Institutional shares | | | (559,970 | ) | | | (394,325 | ) |
| Net increase (decrease) in shares outstanding | | | (594,829 | ) | | | (374,787 | ) |
The accompanying notes are an integral part of these financial statements.
Hardman Johnston International Growth Fund
For a capital share outstanding throughout the period
Institutional Shares
| | | Six Months Ended | | | | | | February 14, 2018* | |
| | | April 30, 2020 | | | Year Ended | | | through | |
| | | (Unaudited) | | | October 31, 2019 | | | October 31, 2018 | |
| Net Asset Value – | | | | | | | | | |
| Beginning of Period | | $ | 10.23 | | | $ | 9.15 | | | $ | 10.00 | |
| | | | | | | | | | | | | |
| Income from Investment Operations: | | | | | | | | | | | | |
Net investment income1 | | | (0.01 | ) | | | 0.09 | | | | — | 2 |
| Net realized and unrealized | | | | | | | | | | | | |
| gain (loss) on investments | | | (1.10 | ) | | | 0.99 | | | | (0.85 | ) |
| Total from investment operations | | | (1.11 | ) | | | 1.08 | | | | (0.85 | ) |
| | | | | | | | | | | | | |
| Less Distributions: | | | | | | | | | | | | |
| Dividends from net investment income | | | (0.55 | ) | | | — | | | | — | |
| Total distributions | | | | | | | — | | | | — | |
| | | | | | | | | | | | |
| | | | | | | | | | | | | |
| Net Asset Value – End of Period | | $ | 8.57 | | | $ | 10.23 | | | $ | 9.15 | |
| | | | | | | | | | | | | |
| Total Return | | (11.54 | )%^ | | | 11.80 | % | | (8.50 | )%^ |
| | | | | | | | | | | | | |
| Ratios and Supplemental Data: | | | | | | | | | | | | |
| Net assets, end of period (thousands) | | $ | 2,799 | | | $ | 7,069 | | | $ | 9,580 | |
| Ratio of operating expenses | | | | | | | | | | | | |
| to average net assets: | | | | | | | | | | | | |
| Before reimbursements | | | 13.00 | %+ | | | 4.57 | % | | | 11.31 | %+ |
| After reimbursements | | | 1.00 | %+ | | | 1.00 | % | | | 1.00 | %+ |
| Ratio of net investment income | | | | | | | | | | | | |
| to average net assets: | | | | | | | | | | | | |
| Before reimbursements | | | (12.22 | )%+ | | | (2.63 | )% | | | (10.25 | )%+ |
| After reimbursements | | | (0.22 | )%+ | | | 0.94 | % | | | 0.06 | %+ |
Portfolio turnover rate3 | | 63 | %^ | | | 81 | % | | 53 | %^ |
| * | Commencement of operations for Institutional Shares was February 14, 2018. |
+ | Annualized |
| ^ | Not Annualized |
1 | The net investment income per share was calculated using the average shares outstanding method. |
2 | Amount is less than $0.01 per share. |
3 | Portfolio turnover was calculated on the basis of the Fund as a whole. The rate presented represents portfolio turnover for the entire fiscal year. |
The accompanying notes are an integral part of these financial statements.
Hardman Johnston International Growth Fund
For a capital share outstanding throughout the period
Retail Shares
| | | Six Months Ended | | | | | | September 17, 2018* | |
| | | April 30, 2020 | | | Year Ended | | | through | |
| | | (Unaudited) | | | October 31, 2019 | | | October 31, 2018 | |
| Net Asset Value – | | | | | | | | | |
| Beginning of Period | | $ | 10.20 | | | $ | 9.15 | | | $ | 10.32 | |
| | | | | | | | | | | | | |
| Income from Investment Operations: | | | | | | | | | | | | |
Net investment income/(loss)1 | | | (0.04 | ) | | | 0.07 | | | | (0.01 | ) |
| Net realized and unrealized | | | | | | | | | | | | |
| gain (loss) on investments | | | (1.07 | ) | | | 0.98 | | | | (1.16 | ) |
| Total from investment operations | | | (1.11 | ) | | | 1.05 | | | | (1.17 | ) |
| | | | | | | | | | | | | |
| Net Asset Value – End of Period | | $ | 9.09 | | | $ | 10.20 | | | $ | 9.15 | |
| | | | | | | | | | | | | |
| Total Return | | (10.78 | )%^ | | | 11.48 | % | | (11.34 | )%^ |
| | | | | | | | | | | | | |
| Ratios and Supplemental Data: | | | | | | | | | | | | |
| Net assets, end of period (thousands) | | $ | 111 | | | $ | 2,479 | | | $ | 2,390 | |
| Ratio of operating expenses | | | | | | | | | | | | |
| to average net assets: | | | | | | | | | | | | |
| Before reimbursements | | | 7.77 | %+ | | | 4.88 | % | | | 4.43 | %+ |
| After reimbursements | | | 1.23 | %+ | | | 1.25 | % | | | 1.25 | %+ |
| Ratio of net investment income | | | | | | | | | | | | |
| to average net assets: | | | | | | | | | | | | |
| Before reimbursements | | | (7.31 | )%+ | | | (2.87 | )% | | | (3.99 | )%+ |
| After reimbursements | | | (0.77 | )%+ | | | 0.76 | % | | | (0.81 | )%+ |
Portfolio turnover rate2 | | 63 | %^ | | | 81 | % | | 53 | %^ |
| * | Commencement of operations for Retail Shares was September 17, 2018. |
+ | Annualized |
| ^ | Not Annualized |
1 | The net investment income/(loss) per share was calculated using the average shares outstanding method. |
2 | Portfolio turnover was calculated on the basis of the Fund as a whole. The rate presented represents portfolio turnover for the entire fiscal year. |
The accompanying notes are an integral part of these financial statements.
Hardman Johnston International Growth Fund
| NOTES TO FINANCIAL STATEMENTS |
| at April 30, 2020 (Unaudited) |
NOTE 1 – ORGANIZATION
The Hardman Johnston International Growth Fund (the “Fund”) is a series of Manager Directed Portfolios (the “Trust”). The Trust is registered under the Investment Company Act of 1940, as amended (the “1940 Act”), and the Fund is a non-diversified series of the Trust, an open-end investment management company and was organized as a Delaware statutory trust on April 4, 2006. The Fund’s Institutional Shares commenced operations on February 14, 2018. The Fund’s Retail Shares commenced operations on September 17, 2018. Each class of shares differs principally in its respective distribution expenses. Each class of shares has identical rights to earnings, assets and voting privileges, except for class-specific expenses and exclusive rights to vote on matters affecting only individual classes. Marmont Partners LLC (the “Advisor”) serves as the investment advisor to the Fund. Hardman Johnston Global Advisors LLC (the “Sub-Advisor”) serves as the sub-advisor to the Fund. Redwood Investments, LLC (“Redwood”) served as the International Growth Fund’s sub-advisor from the Fund’s inception to December 31, 2019. Effective January 1, 2020, Hardman Johnston replaced Redwood as the International Growth Fund’s sub-advisor. As an investment company, the Fund follows the investment company accounting and reporting guidance of the Financial Accounting Standards Board (“FASB”) Accounting Standard Codification Topic 946 Financial Services – Investment Companies. The investment objective of the Fund is to seek long term capital appreciation.
NOTE 2 – SIGNIFICANT ACCOUNTING POLICIES
The following is a summary of significant accounting policies consistently followed by the Fund. These policies are in conformity with U.S. generally accepted accounting principles (“GAAP”).
| | A. | Security Valuation: All investments in securities are recorded at their estimated fair value, as described in Note 3. |
| | | |
| | B. | Federal Income Taxes: It is the Fund’s policy to comply with the requirements of Subchapter M of the Internal Revenue Code applicable to regulated investment companies and to distribute substantially all of its taxable income to its shareholders. Therefore, no federal income or excise tax provisions are required.
|
| | | The Fund recognizes the tax benefits of uncertain tax positions only where the position is “more likely than not” to be sustained assuming examination by tax authorities. Management has analyzed the Fund’s tax positions and has concluded that no liability for unrecognized tax benefits should be recorded related to uncertain tax positions to be taken or expected to be taken on a tax return. The tax returns for the Fund for the prior three fiscal years are open for examination. The Fund identifies its major tax jurisdictions as U.S. Federal and the state of Delaware.
|
| | C. | Securities Transactions, Income and Distributions: Securities transactions are accounted for on the trade date. Realized gains and losses on securities sold are determined on the basis of identified cost. Interest income is recorded on an |
Hardman Johnston International Growth Fund
| NOTES TO FINANCIAL STATEMENTS (Continued) |
| at April 30, 2020 (Unaudited) |
| | | accrual basis. Dividend income and distributions to shareholders are recorded on the ex-dividend date. Discounts and premiums on fixed income securities are amortized using the effective interest method. |
| | | |
| | | The Fund distributes substantially all of its net investment income, if any, and net realized capital gains, if any, annually. Distributions from net realized gains for book purposes may include short-term capital gains. All short-term capital gains are included in ordinary income for tax purposes. The amount of dividends and distributions to shareholders from net investment income and net realized capital gains is determined in accordance with federal income tax regulations, which differ from GAAP. To the extent these book/tax differences are permanent, such amounts are reclassified within the capital accounts based on their federal tax treatment. |
| | | |
| | | The Fund is charged for those expenses that are directly attributable to it, such as investment advisory, custody and transfer agent fees. Expenses that are not attributable to a Fund are typically allocated among the funds in the Trust proportionately based on allocation methods approved by the Board of Trustees (the “Board”). Common expenses of the Trust are typically allocated among the funds in the Trust based on a fund’s respective net assets, or by other equitable means. |
| | | |
| | D. | Use of Estimates: The preparation of financial statements in conformity with GAAP requires management to make estimates and assumptions that affect the reported amounts of assets and liabilities at the date of the financial statements and the reported amounts of increases and decreases in net assets during the reporting period. Actual results could differ from those estimates. |
| | | |
| | E. | Redemption Fees: The Fund does not charge redemption fees to shareholders. |
| | | |
| | F. | Reclassification of Capital Accounts: GAAP requires that certain components of net assets relating to permanent differences be reclassified between financial and tax reporting. These reclassifications have no effect on net assets or net asset value per share. |
| | | |
| | G. | Foreign Currency: Values of investments denominated in foreign currencies are converted into U.S. dollars using the spot market rate of exchange at the time of valuation. Purchases and sales of investments and income are translated into U.S. dollars using the spot market rate of exchange prevailing on the respective dates of such transactions. The Fund does not isolate the portion of the results of operations resulting from fluctuations in foreign exchange rates on investments from fluctuations resulting from changes in the market prices of securities held. Such fluctuations are included with the net realized and unrealized gain/loss on investments. Foreign investments present additional risks due to currency fluctuations, economic and political factors, lower liquidity, government regulations, differences in accounting standards, and other factors. |
Hardman Johnston International Growth Fund
| NOTES TO FINANCIAL STATEMENTS (Continued) |
| at April 30, 2020 (Unaudited) |
| | H. | Events Subsequent to the Fiscal Period End: In preparing the financial statements as of April 30, 2020, management considered the impact of subsequent events for potential recognition or disclosure in the financial statements. |
| | | |
| | I. | Recent Accounting Pronouncements and Rule Issuances: In August 2018, FASB issued ASU 2018-13, Fair Value Measurement (Topic 820): Disclosure Framework—Changes to the Disclosure Requirements for Fair Value Measurement (“ASU 2018-13”). The primary focus of ASU 2018-13 is to improve the effectiveness of the disclosure requirements for fair value measurements. The changes affect all companies that are required to include fair value measurement disclosures. In general, the amendments in ASU 2018-13 are effective for all entities for fiscal years and interim periods within those fiscal years, beginning after December 15, 2019. An entity is permitted to early adopt the removed or modified disclosures upon the issuance of ASU 2018-13 and may delay adoption of the additional disclosures, which are required for public companies only, until their effective date. Management has evaluated the impact of this change in guidance, and due to the permissibility of early adoption, modified the Fund’s fair value disclosures for the current reporting period. |
NOTE 3 – SECURITIES VALUATION
The Fund has adopted authoritative fair value accounting standards which establish an authoritative definition of fair value and set out a hierarchy for measuring fair value. These standards require additional disclosures about the various inputs and valuation techniques used to develop the measurements of fair value, a discussion of changes in valuation techniques and related inputs during the period, and expanded disclosure of valuation levels for major security types. These inputs are summarized in the three broad levels listed below:
| | Level 1 – | Unadjusted, quoted prices in active markets for identical assets or liabilities that the Fund has the ability to access at the date of measurement. |
| | | |
| | Level 2 – | Other significant observable inputs (including, but not limited to, quoted prices in active markets for similar instruments, quoted prices in markets that are not active for identical or similar instruments, and model-derived valuations in which all significant inputs and significant value drivers are observable in active markets, such as interest rates, prepayment speeds, credit risk curves, default rates, and similar data). |
| | | |
| | Level 3 – | Significant unobservable inputs for the asset or liability, to the extent relevant observable inputs are not available, representing the Fund’s own assumptions about the assumptions a market participant would use in valuing the asset or liability, and would be based on the best information available. |
Following is a description of the valuation techniques applied to the Fund’s major categories of assets and liabilities measured at fair value on a recurring basis.
Hardman Johnston International Growth Fund
| NOTES TO FINANCIAL STATEMENTS (Continued) |
| at April 30, 2020 (Unaudited) |
Equity Securities: Equity securities, including common stocks, preferred stocks, foreign-issued common stocks, exchange-traded funds, closed-end mutual funds and real estate investment trusts (REITs), that are primarily traded on a national securities exchange shall be valued at the last sale price on the exchange on which they are primarily traded on the day of valuation or, if there has been no sale on such day, at the mean between the bid and asked prices. Securities primarily traded in the NASDAQ Global Market System for which market quotations are readily available shall be valued using the NASDAQ Official Closing Price (“NOCP”). If the NOCP is not available, such securities shall be valued at the last sale price on the day of valuation, or if there has been no sale on such day, at the mean between the bid and asked prices. Over-the-counter securities that are not traded on a listed exchange are valued at the last sale price in the over-the-counter market. Over-the-counter securities which are not traded in the NASDAQ Global Market System shall be valued at the mean between the bid and asked prices. To the extent these securities are actively traded and valuation adjustments are not applied, they are categorized in Level 1 of the fair value hierarchy. Securities traded on foreign exchanges generally are not valued at the same time the Fund calculates its net asset value (“NAV”) because most foreign markets close well before such time. The earlier close of most foreign markets gives rise to the possibility that significant events, including broad market moves, may have occurred in the interim. In certain circumstances, it may be determined that a security needs to be fair valued because it appears that the value of the security might have been materially affected by an event (a “Significant Event”) occurring after the close of the market in which the security is principally traded, but before the time the Fund calculates its NAV. A Significant Event may relate to a single issuer or to an entire market sector, or even occurrences not tied directly to the securities markets, such as natural disasters, armed conflicts, or significant government actions.
Registered Investment Companies: Investments in registered investment companies (e.g., mutual funds) are generally priced at the ending NAV provided by the applicable registered investment company’s service agent and will be classified in Level 1 of the fair value hierarchy.
Short-Term Debt Securities: Debt securities, including short-term debt instruments having a maturity of less than 60 days, are valued at the evaluated mean price supplied by an approved pricing service. Pricing services may use various valuation methodologies including matrix pricing and other analytical pricing models as well as market transactions and dealer quotations. In the absence of prices from a pricing service, the securities will be priced in accordance with the procedures adopted by the Board. Short-term securities are generally classified in Level 1 or Level 2 of the fair market hierarchy depending on the inputs used and market activity levels for specific securities.
The Board has delegated day-to-day valuation issues to a Valuation Committee of the Trust which, as of April 30, 2020, was comprised of officers of the Trust. The function of the Valuation Committee is to value securities where current and reliable market quotations are not readily available, or the closing price does not represent fair value, by
Hardman Johnston International Growth Fund
| NOTES TO FINANCIAL STATEMENTS (Continued) |
| at April 30, 2020 (Unaudited) |
following procedures approved by the Board. These procedures consider many factors, including the type of security, size of holding, trading volume, news events and significant events such as those described previously. All actions taken by the Valuation Committee are subsequently reviewed and ratified by the Board.
Depending on the relative significance of the valuation inputs, fair valued securities may be classified in either level 2 or level 3 of the fair value hierarchy.
The fair valuation of foreign securities may be determined with the assistance of a pricing service using correlations between the movement of prices of such securities and indices of domestic securities and other appropriate indicators, such as closing market prices of relevant American Depositary Receipts or futures contracts. The Fund uses ICE Data Services (“ICE”) as a third-party fair valuation vendor. ICE provides a fair value for foreign securities in the Fund based on certain factors and methodologies applied by ICE in the event that there is a movement in the U.S. markets that exceeds a specific threshold established by the Valuation Committee. The effect of using fair value pricing is that the Fund’s NAV will reflect the affected portfolio securities’ values as determined by the Board or its designee instead of being determined by the market. Using a fair value pricing methodology to price a foreign security may result in a value that is different from the foreign security’s most recent closing price and from the prices used by other investment companies to calculate their NAVs and are generally classified in Level 2 of the fair valuation hierarchy. Because the Fund may invest in foreign securities, the value of the Fund’s portfolio securities may change on days when you will not be able to purchase or redeem your shares.
The inputs or methodology used for valuing securities are not an indication of the risk associated with investing in those securities.
| Common Stocks | | Level 1 | | | Level 2 | | | Level 3 | | | Total | |
| Communication Services | | $ | — | | | $ | 78,328 | | | $ | — | | | $ | 78,328 | |
| Consumer Discretionary | | | 138,281 | | | | 129,963 | | | | — | | | | 268,244 | |
| Consumer Staples | | | — | | | | 42,928 | | | | — | | | | 42,928 | |
| Financials | | | 48,849 | | | | 64,979 | | | | — | | | | 113,828 | |
| Health Care | | | — | | | | 186,630 | | | | — | | | | 186,630 | |
| Industrials | | | — | | | | 268,558 | | | | — | | | | 268,558 | |
| Information Technology | | | — | | | | 336,710 | | | | — | | | | 336,710 | |
| Total Common Stocks | | | 187,130 | | | | 1,108,096 | | | | — | | | | 1,295,226 | |
| Short-Term Investments | | | 266,129 | | | | — | | | | — | | | | 266,129 | |
| Total Investments in Securities | | $ | 453,259 | | | $ | 1,108,096 | | | $ | — | | | $ | 1,561,355 | |
NOTE 4 – INVESTMENT ADVISORY FEE AND OTHER TRANSACTIONS WITH AFFILIATES
For the six months ended April 30, 2020, the Advisor provided the Fund with investment management services under an Investment Advisory Agreement. The Advisor furnishes all investment advice, office space, and facilities, and provides most of the
Hardman Johnston International Growth Fund
| NOTES TO FINANCIAL STATEMENTS (Continued) |
| at April 30, 2020 (Unaudited) |
personnel needed by the Fund. For the six months ended April 30, 2020, the Fund incurred $14,867 in advisory fees. The Advisor has hired Hardman Johnston Global Advisors LLC as a sub-advisor to the Fund. The Advisor pays the Sub-Advisor fee for the Fund from its own assets and these fees are not an additional expense of the Fund.
The Fund is responsible for its own operating expenses. The Advisor has contractually agreed to waive its management fees and/or absorb expenses of the Fund to ensure that the total annual operating expenses [excluding Acquired Fund Fees and Expenses, taxes, brokerage commissions, interest and extraordinary expenses (collectively, “Excludable Expenses”)] do not exceed the following amounts of the average daily net assets for each class of shares:
Hardman Johnston International Growth Fund
| | Institutional Shares | 1.00% | |
| | Retail Shares | 1.25% | |
For the six months ended April 30, 2020, the Advisor reduced its fees and absorbed Fund expenses in the amount of $163,718 for the Fund. The waivers and reimbursements will remain in effect through February 14, 2021 unless terminated sooner by, or with the consent of, the Board.
The Advisor may request recoupment of previously waived fees and paid expenses in any subsequent month in the three-year period from the date of the management fee reduction and expense payment if the aggregate amount actually paid by the Fund toward the operating expenses for such fiscal year (taking into account the reimbursement) will not cause the Fund to exceed the lesser of: (1) the expense limitation in place at the time of the management fee reduction and expense payment; or (2) the expense limitation in place at the time of the reimbursement. Any such reimbursement is also contingent upon Board of Trustees review and approval at the time the reimbursement is made. Such reimbursement may not be paid prior to the Fund’s payment of current ordinary operating expenses. Cumulative expenses subject to recapture pursuant to the aforementioned conditions expire as follows:
| | 10/31/2021 | 10/31/2022 | 4/30/2023 | Total | |
| | $198,676 | $346,262 | $163,718 | $708,656 | |
U.S. Bancorp Fund Services, LLC, doing business as U.S. Bank Global Fund Services, LLC (“Fund Services” or the “Administrator”) acts as the Fund’s Administrator under an Administration Agreement. The Administrator prepares various federal and state regulatory filings, reports and returns for the Fund; prepares reports and materials to be supplied to the Trustees; monitors the activities of the Fund’s custodian, transfer agent and accountants; coordinates the preparation and payment of the Fund’s expenses and reviews the Fund’s expense accruals. Fund Services also serves as the fund accountant and transfer agent to the Fund. Vigilant Compliance, LLC serves as the Chief Compliance Officer to the Fund. U.S. Bank N.A., an affiliate of Fund Services, serves as
Hardman Johnston International Growth Fund
| NOTES TO FINANCIAL STATEMENTS (Continued) |
| at April 30, 2020 (Unaudited) |
the Fund’s custodian. For the six months ended April 30, 2020, the Fund incurred the following expenses for administration, fund accounting, transfer agency and custody fees:
| | Administration & fund accounting | $54,991 | |
| | Custody | $15,182 | |
| | Transfer agency(a) | $26,116 | |
| | | | |
| | (a) Does not include out-of-pocket expenses. | | |
At April 30, 2020, the Fund had payables due to Fund Services for administration, fund accounting and transfer agency fees and to U.S. Bank N.A. for custody fees in the following amounts:
| | Administration & fund accounting | $45,565 | |
| | Custody | $12,402 | |
| | Transfer agency(a) | $21,105 | |
| | | | |
| | (a) Does not include out-of-pocket expenses. | | |
Quasar Distributors, LLC (the “Distributor”) acts as the Fund’s principal underwriter in a continuous public offering of the Fund’s shares. The Distributor is an affiliate of the Administrator. A Trustee of the Trust is deemed to be an interested person of the Trust due to his former position with the Distributor.
Certain officers of the Fund are employees of the Administrator and are not paid any fees by the Fund for serving in such capacities.
NOTE 5 – DISTRIBUTION AGREEMENT AND PLAN
The Fund has adopted a Distribution Plan pursuant to Rule 12b-1 (the “Plan”). The Plan permits the Fund to pay for distribution and related expenses at an annual rate of up to 0.25% of the average daily net assets of the Fund’s Retail Shares. The expenses covered by the Plan may include costs in connection with the promotion and distribution of shares and the provision of personal services to shareholders, including, but not necessarily limited to, advertising, compensation to underwriters, dealers and selling personnel, the printing and mailing of prospectuses to other than current Fund shareholders, and the printing and mailing of sales literature. Payments made pursuant to the Plan will represent compensation for distribution and service activities, not reimbursements for specific expenses incurred. For the six months ended April 30, 2020, the Hardman Johnston International Growth Fund incurred distribution expenses on its Retail Shares of $673.
NOTE 6 – SECURITIES TRANSACTIONS
For the six months ended April 30, 2020, the cost of purchases and the proceeds from sales of securities, excluding short-term securities, were as follows:
| | | Purchases | Sales | |
| | International Growth Fund | $2,183,043 | $9,966,158 | |
There were no purchases or sales of long-term U.S. Government securities.
Hardman Johnston International Growth Fund
| NOTES TO FINANCIAL STATEMENTS (Continued) |
| at April 30, 2020 (Unaudited) |
NOTE 7 – INCOME TAXES AND DISTRIBUTIONS TO SHAREHOLDERS
As of October 31, 2019, the Fund’s most recent fiscal year, the components of accumulated earnings/(losses) on a tax basis were as follows:
| | Cost of investments(a) | | $ | 8,657,981 | |
| | Gross unrealized appreciation | | | 1,219,398 | |
| | Gross unrealized depreciation | | | (342,652 | ) |
| | Net unrealized appreciation | | | 876,746 | |
| | Undistributed ordinary income | | | 84,081 | |
| | Undistributed long-term capital gain | | | — | |
| | Total distributable earnings | | | 84,081 | |
| | Other accumulated gains/(losses) | | | (1,373,489 | ) |
| | Total accumulated earnings/(losses) | | $ | (412,662 | ) |
| | (a) | The difference between the book basis and tax basis net unrealized depreciation and cost is attributable primarily to wash sales, and the mark-to-market of passive foreign investment companies. |
As of October 31, 2019, the Fund had short-term tax basis capital losses with no expiration date of $1,373,489.
NOTE 8 – PRINCIPAL RISKS
Below are summaries of some, but not all, of the principal risks of investing in the Fund, each of which could adversely affect the Fund’s NAV, market price, yield, and total return. Further information about investment risks is available in the Fund’s prospectus and Statement of Additional Information.
Equity Market Risk: Equity securities are susceptible to general stock market fluctuations due to economic, market, political and issuer-specific considerations and to potential volatile increases and decreases in value as market confidence in and perceptions of their issuers change.
Foreign Securities and Currency Risk: Foreign securities are subject to risks relating to political, social and economic developments abroad and differences between U.S. and foreign regulatory requirements and market practices. Those risks are increased for investments in emerging markets. Securities that are denominated in foreign currencies are subject to further risk that the value of the foreign currency will fall in relation to the U.S. dollar and/or will be affected by volatile currency markets or actions of U.S. and foreign governments or central banks. Income earned on foreign securities may be subject to foreign withholding taxes.
Management Risk: The ability of the Fund to meet its investment objective is directly related to the Advisor’s and Sub-Advisor’s management of the Fund. The value of your investment in the Fund may vary with the effectiveness of the Advisor’s research, analysis
Hardman Johnston International Growth Fund
| NOTES TO FINANCIAL STATEMENTS (Continued) |
| at April 30, 2020 (Unaudited) |
and asset allocation among portfolio securities. If the investment strategies do not produce the expected results, the value of your investment could be diminished or even lost entirely.
Recent Market Events; Market Risk. Market risk may affect a single issuer, industry, sector of the economy or the market as a whole. U.S. and international markets experienced significant volatility in recent months and years due to a number of economic, political and global macro factors including the impact of the coronavirus as a global pandemic and related public health issues, growth concerns in the U.S. and overseas, uncertainties regarding interest rates, trade tensions and the threat of tariffs imposed by the U.S. and other countries. In particular, the spread of the novel coronavirus worldwide has resulted in disruptions to supply chains and customer activity, stress on the global healthcare system, rising unemployment claims, quarantines, cancellations, market declines, the closing of borders, restrictions on travel and widespread concern and uncertainty. Health crises and related political, social and economic disruptions caused by the spread of the recent coronavirus outbreak may also exacerbate other pre-existing political, social and economic risks in certain countries. It is not possible to know the extent of these impacts, and they may be short term or may last for an extended period of time. These developments as well as other events, such as the U.S. presidential election, could result in further market volatility and negatively affect financial asset prices, the liquidity of certain securities and the normal operations of securities exchanges and other markets, despite government efforts to address market disruptions. In addition, the Fund may face challenges with respect to its day-to-day operations if key personnel of the Advisor or other service providers are unavailable due to quarantines and restrictions on travel related to the coronavirus outbreak. Global economies and financial markets are increasingly interconnected, which increases the probabilities that conditions in one country or region might adversely impact issues in a different country or region.
New Fund Risk: There can be no assurance that the Fund will grow to or maintain an economically viable size, in which case the Board may determine to liquidate the Fund. Liquidation of the Fund can be initiated without shareholder approval by the Board if it determines that liquidation is in the best interest of shareholders. As a result, the timing of the Fund’s liquidation may not be favorable.
Emerging and Frontier Markets Risk: Countries in emerging markets are generally more volatile and can have relatively unstable governments, social and legal systems that do not protect shareholders, economies based on only a few industries, and securities markets that trade a small number of issues. Frontier market countries generally have smaller economies and even less developed capital markets than emerging markets. As a result, the risks of investing in emerging markets are magnified in frontier markets, and include potential for extreme price volatility and illiquidity; government ownership or control of parts of private sector and of certain companies; trade barriers, exchange controls, managed adjustments in relative currency values and other protectionist measures; and relatively new and unsettled securities laws.
Hardman Johnston International Growth Fund
| NOTES TO FINANCIAL STATEMENTS (Continued) |
| at April 30, 2020 (Unaudited) |
Large Capitalization Risk: Larger, more established companies may be unable to respond quickly to new competitive challenges such as changes in technology and consumer tastes. Larger companies also may not be able to attain the high growth rates of successful smaller companies.
Medium and Small Capitalization Risk: Investing in medium and small capitalization companies may involve special risks because those companies may have narrower product lines, more limited financial resources, fewer experienced managers, dependence on a few key employees, and a more limited trading market for their stocks, as compared with larger companies. Securities of medium and smaller capitalization issuers may be subject to greater price volatility and may decline more significantly in market downturns than securities of larger companies.
NOTE 9 – GUARANTEES AND INDEMNIFICATIONS
In the normal course of business, the Fund enters into contracts that contain a variety of representations and warranties and which provide general indemnifications. The Fund’s maximum exposure under these arrangements is unknown, as this would involve future claims that may be made against the Fund that have not yet occurred. However, based on experience, the Fund expects the risk of loss to be remote.
NOTE 10 – MATTERS SUBMITTED TO A SHAREHOLDER VOTE
A special meeting of shareholders of the Fund was held on January 21, 2020, and the following matters were approved by the Fund’s shareholders:
To approve a new sub-advisory agreement between Marmont Partners LLC and Hardman Johnston Global Advisors LLC:
| | For | Against | Abstain | |
| | 107,351 | — | 1,630 | |
To change the Fund’s diversification status from being a “diversified fund” to being a “non-diversified fund”:
| | For | Against | Abstain | |
| | 107,351 | — | 1,630 | |
Hardman Johnston International Growth Fund
| EXPENSE EXAMPLE |
| April 30, 2020 (Unaudited) |
As a shareholder of the Fund, you incur two types of costs: (1) transaction costs including sales charges (loads) and redemption fees, if applicable; and (2) ongoing costs, including management fees; distribution and/or service (12b-1 fees); and other Fund expenses. This Example is intended to help you understand your ongoing costs (in dollars) of investing in the Fund and to compare these costs with the ongoing costs of investing in other mutual funds.
The Example is based on an investment of $1,000 invested at the beginning of the period indicated and held for the entire period from November 1, 2019 to April 30, 2020 for the Institutional and Retail Shares.
Actual Expenses
The information in the table under the heading “Actual” provides information about actual account values and actual expenses. You may use the information in these columns together with the amount you invested, to estimate the expenses that you paid over the period. Simply divide your account value by $1,000 (for example, an $8,600 account value divided by $1,000 = 8.6), then multiply the result by the number in the row entitled “Expenses Paid During Period” to estimate the expenses you paid on your account during this period. There are some account fees that are charged to certain types of accounts, such as Individual Retirement Accounts (generally, a $15 fee is charged to the account annually) that would increase the amount of expenses paid on your account. The example below does not include portfolio trading commissions and related expenses and other extraordinary expenses as determined under generally accepted accounting principles.
Hypothetical Example for Comparison Purposes
The information in the table under the heading “Hypothetical (5% return before expenses)” provides information about hypothetical account values and hypothetical expenses based on the Fund’s actual expense ratio and assumed rate of return of 5% per year before expenses, which is not the Fund’s actual return. The hypothetical account values and expenses may not be used to estimate the actual ending account balance or expenses you paid for the period. You may use this information to compare the ongoing costs of investing in the Fund and other funds. To do so, compare this 5% hypothetical example with the 5% hypothetical examples that appear in the shareholder reports of the other funds. As noted above, there are some account fees that are charged to certain types of accounts that would increase the amount of expense paid on your account.
Please note that the expenses shown in the table are meant to highlight your ongoing costs only and do not reflect any transaction costs, such as sales charges (loads), redemption fees, or exchange fees. Therefore, the information under the heading “Hypothetical (5% return before expenses)” is useful in comparing ongoing costs only, and will not help you determine the relative total costs of owning different funds. In addition, if these transactional costs were included, your costs would have been higher.
Hardman Johnston International Growth Fund
| EXPENSE EXAMPLE (Continued) |
| April 30, 2020 (Unaudited) |
| | Beginning | Ending | Expenses Paid |
| | Account Value | Account Value | During Period(1) |
| | 11/1/19 | 4/30/20 | 11/1/19 – 4/30/20 |
| Actual | | | |
| Institutional Shares | $1,000.00 | $ 884.60 | $4.69 |
| Retail Shares | $1,000.00 | $ 892.20 | $5.79 |
| | | | |
| Hypothetical (5% return | | | |
| before expenses) | | | |
| Institutional Shares | $1,000.00 | $1,019.89 | $5.02 |
| Retail Shares | $1,000.00 | $1,018.75 | $6.17 |
(1) | Expenses are equal to the Institutional and Retail Shares’ annualized expense ratio of 1.00% and 1.23%, respectively, multiplied by the average account value over the period, multiplied by 182/366 (to reflect the period). |
Hardman Johnston International Growth Fund
| NOTICE TO SHAREHOLDERS |
| at April 30, 2020 (Unaudited) |
How to Obtain a Copy of the Fund’s Proxy Voting Policies
A description of the policies and procedures that the Fund uses to determine how to vote proxies relating to portfolio securities is available without charge, upon request, by calling 1-833-MAR-MONT or on the U.S. Securities and Exchange Commission’s (“SEC”) website at http://www.sec.gov.
How to Obtain a Copy of the Fund’s Proxy Voting Records for the most recent 12-Month Period Ended June 30
Information regarding how the Fund voted proxies relating to portfolio securities during the most recent 12-month period ended June 30 is available no later than August 31 without charge, upon request, by 1-833-MAR-MONT. Furthermore, you can obtain the Fund’s proxy voting records on the SEC’s website at http://www.sec.gov.
Quarterly Filings on Form N-Q
The Fund files its complete schedule of portfolio holdings with the SEC for the first and third quarters of each fiscal year on Form N-Q or Part F of Form N-PORT (beginning with filings after March 31, 2020). The Fund’s Form N-Q or Part F of Form N-PORT (beginning with filings after March 31, 2020) is available on the SEC’s website at http://www.sec.gov. Information included in the Fund’s Form N-Q or Part F of Form N-PORT (beginning with filings after March 31, 2020) is also available, upon request, by calling 1-833-MAR-MONT.
Householding
In an effort to decrease costs, the Fund intends to reduce the number of duplicate prospectuses and annual and semi-annual reports you receive by sending only one copy of each to those addresses shared by two or more accounts and to shareholders the Transfer Agent reasonably believes are from the same family or household. Once implemented, if you would like to discontinue householding for your accounts, please call toll-free at 1-833-MAR-MONT to request individual copies of these documents. Once the Transfer Agent receives notice to stop householding, the Transfer Agent will begin sending individual copies thirty days after receiving your request. This policy does not apply to account statements.
Hardman Johnston International Growth Fund
| APPROVAL OF INVESTMENT ADVISORY AGREEMENT |
| (Unaudited) |
The Board of Trustees (the “Board”) of Manager Directed Portfolios (the “Trust”) met on November 12, 2019 to consider the renewal of the Investment Advisory Agreement (the “Advisory Agreement”) between the Trust, on behalf of the Hardman Johnston International Growth Fund (the “Fund”), a series of the Trust, and the Fund’s investment adviser, Marmont Partners LLC (“Marmont Partners”). At this meeting, and at a prior meeting held on October 28, 2019, the Board requested and received materials to assist them in considering the approval of the Advisory Agreement. The materials provided contained information with respect to the factors enumerated below, including a copy of the Advisory Agreement, a memorandum prepared by the Trust’s outside legal counsel discussing the Board’s fiduciary obligations and the factors the Board should consider in the renewal of the Advisory Agreement, detailed comparative information relating to the performance of the Fund, as well as the management fee and other expenses of the Fund, due diligence materials relating to Marmont Partners, including Marmont Partners’ Form ADV, and other pertinent information. Based on their evaluation of the information provided as part of the November 12, 2019 and October 28, 2019 meetings, as well as information provided by Marmont Partners over the course of the year, the Trustees (including a majority of the Trustees who are not “interested persons,” as that term is defined in the Investment Company Act of 1940, as amended (the “Independent Trustees”)), approved the continuation Advisory Agreement for an additional one-year term. The Independent Trustees also met in executive session with legal counsel to review their duties in considering the Advisory Agreement and the information provided. Below is a summary of the material factors considered by the Board and the conclusions that formed the basis for the Board’s approval of the Advisory Agreement.
| | 1. | NATURE, EXTENT AND QUALITY OF SERVICES PROVIDED TO THE FUND |
The Trustees considered the nature, extent and quality of services provided by Marmont Partners to the Fund. The Board considered the services provided by Marmont Partners, including sub-adviser evaluation and oversight, compliance, and Fund marketing. The Trustees considered the specific responsibilities of Marmont Partners in all aspects of day-to-day management of the Fund, as well as the responsibilities of other key personnel at Marmont Partners involved in the day-to-day activities of the Fund. The Trustees reviewed the information provided by Marmont Partners in a due diligence questionnaire, including the firm’s experience and a summary of the firm’s compliance program, and Marmont Partners’ continuing commitment to the Fund. The Trustees considered a services agreement between the Dakota Funds Group, an affiliate of Marmont Partners, and Marmont Partners and the marketing services provided by the Dakota Funds Group to the Fund under that agreement. The Trustees noted that they had met with Marmont Partners in person earlier in the meeting to discuss Marmont Partners’ services to the Fund and various performance, marketing and compliance updates. The Trustees discussed Marmont Partners’ compliance programs, including the reports of the Trust’s chief compliance officer to the Trustees on the effectiveness of Marmont Partners’ compliance programs. The Trustees concluded that Marmont Partners had sufficient
Hardman Johnston International Growth Fund
| APPROVAL OF INVESTMENT ADVISORY AGREEMENT (Continued) |
| (Unaudited) |
quality and depth of personnel, resources, investment methods and compliance policies and procedures essential to performing its duties under the Advisory Agreement, and that the nature, overall quality and extent of the management services provided to the Fund were satisfactory.
| | 2. | INVESTMENT PERFORMANCE OF THE FUND |
The Trustees discussed the performance of the Fund for the year-to-date, one-year, and since inception periods ended June 30, 2019. In assessing the quality of the portfolio management services delivered by Marmont Partners, the investment adviser, and Redwood Investments LLC, the Fund’s current investment sub-adviser, the Trustees considered the performance of the Fund on both an absolute basis and in comparison to the MSC World Ex-USA Index. The Trustees also compared the Fund’s performance to a peer group of foreign large growth funds (the “Morningstar Peer Group”). The Board considered that Marmont Partners does not manage any accounts or composites of other separately managed accounts that are similar to the Fund in terms of investment strategy.
The Trustees noted the Fund’s performance for the year-to-date and one-year periods ended June 30, 2019 exceeded the MSCI World Ex-USA Index. The Fund underperformed the MSCI World Ex-USA Index for the since inception period ended June 30, 2019. The Trustees discussed the factors that accounted for the underperformance of the Fund as discussed with Marmont, as well as the Board’s decision to terminate Redwood Investments LLC and retain a new subadviser for the Fund.
After considering all of the information, the Trustees concluded the performance of the Fund was satisfactory under applicable market conditions. Although past performance is not a guarantee or indication of future results, the Trustees determined that the Fund and its shareholders were likely to benefit from Marmont Partners’ continued management.
| | 3. | COSTS OF SERVICES PROVIDED AND PROFITS REALIZED BY THE ADVISER |
The Trustees considered the cost of services provided by Marmont Partners and Marmont Partners’ advisory fee, including a review of comparative expense information and other pertinent material with respect to the Fund. The Trustees reviewed the related statistical information and other materials provided, including the comparative expenses and peer group data. The Trustees considered the cost structure of the Fund relative to the Morningstar Peer Group.
The Trustees also considered the overall profitability of Marmont Partners, reviewing Marmont Partners’ financial information. The Trustees also examined a profitability analysis prepared by Marmont Partners based on the fees payable under the Advisory Agreement. The Trustees noted that Marmont Partners continues to subsidize the Fund’s expense ratio. The Trustees considered information about payments made by Marmont Partners to financial intermediaries, noting that all marketing and distribution fees other than Rule 12b-1 fees payable by Retail Shares were paid by Marmont Partners out of its reasonable profits.
Hardman Johnston International Growth Fund
| APPROVAL OF INVESTMENT ADVISORY AGREEMENT (Continued) |
| (Unaudited) |
The Trustees noted that the Fund’s contractual management fee of 1.00% fell in the fourth quartile, and was above the Morningstar Peer Group average of 0.80%, which between the second and third quartiles. The Trustees noted that the Fund is the sole client of Marmont Partners, so there are no separately managed accounts available for comparison. The Trustees further noted that the total expense ratio for the Fund’s Retail Shares of 1.25% fell between the third and fourth quartiles and was above the Morningstar Peer Group average of 1.03%, which fell within the third quartile. The total expense ratio for the Fund’s Institutional Shares of 1.00% fell between the second and third quartiles. The Board noted that, pursuant to a contractual operating expense limitation agreement between Marmont Partners and the Fund, Marmont Partners has agreed to waive its management fees and/or reimburse Fund expenses to ensure that total annual fund operating expenses (excluding any front-end or contingent deferred loads, Rule 12b-1 plan fees, shareholder servicing plan fees, taxes, leverage made by the Fund), interest, brokerage commissions and other transactional expenses, expenses incurred in connection with any merger or reorganization, dividends or interest on short positions, acquired fund fees and expenses or extraordinary expenses such as litigation (collectively, “Excludable Expenses”)) do not exceed 1.00% of the Fund’s average daily net assets, through at least February 14, 2021, unless terminated sooner by, or with the consent of, the Board.
The Trustees concluded that the Fund’s expenses and the management fees paid to Marmont Partners were fair and reasonable in light of the comparative performance, expense and management fee information. The Trustees concluded that Marmont Partners’ level of profitability from its relationship with the Fund was reasonable.
| | 4. | EXTENT OF ECONOMIES OF SCALE AS THE FUND GROWS |
The Trustees compared the Fund’s expenses to the Morningstar Peer Group and discussed potential economies of scale. The Trustees also reviewed the structure of the Fund’s management fee and whether the Fund was large enough to generate economies of scale for shareholders or whether economies of scale would be expected to be realized as Fund assets grow (and if so, how those economies of scale were being or would be shared with shareholders). The Trustees noted that the Fund’s management fee structure did not contain any breakpoint reductions as the Fund’s assets grow in size. The Trustees concluded that the current fee structure was reasonable given the operating expense limitation agreement that is in place, and reflects a sharing of economies of scale between Marmont Partners and the Fund at the Fund’s current asset level.
| | 5. | BENEFITS DERIVED FROM THE RELATIONSHIP WITH THE FUND |
Based on the information presented, the Trustees did not consider any direct or indirect benefits that could be realized by Marmont Partners from its association with the Fund to be material factors.
Hardman Johnston International Growth Fund
| APPROVAL OF INVESTMENT ADVISORY AGREEMENT (Continued) |
| (Unaudited) |
CONCLUSIONS
The Trustees considered all of the foregoing factors. In considering the renewal of the Advisory Agreement, the Trustees did not identify any one factor as all-important, but rather considered these factors collectively in light of the Fund’s surrounding circumstances. Based on this review, the Trustees, including a majority of the Independent Trustees, approved the continuation of the Advisory Agreement for an additional term ending February 14, 2021, as being in the best interests of the Fund and its shareholders.
Hardman Johnston International Growth Fund
| APPROVAL OF INVESTMENT SUB-ADVISORY AGREEMENT |
| (Unaudited) |
The Board of Trustees (the “Board”) of Manager Directed Portfolios (the “Trust”) met on November 12, 2019 to consider the initial approval of the Sub-Advisory Agreement, (the “Sub-Advisory Agreement”) on behalf of the International Growth Fund, a series of the Trust, between the Fund’s investment adviser, Marmont Partners LLC (“Marmont Partners”) and the Fund’s sub-adviser, Hardman Johnston Global Advisors LLC (“Hardman Johnston”).
In the course of their review, the Trustees considered their legal responsibilities with regard to considering the Sub-Advisory Agreement. The Trustees also considered other matters, including, but not limited to the following: (1) the quality of services provided to the Fund in the past by Redwood Investments, LLC, the Fund’s previous sub-adviser (“Redwood Investments”) since the Fund’s inception in February 2018 compared to the quality of services expected to be provided to the Fund by Hardman Johnston going forward; (2) the performance of the Fund while sub-advised by Redwood Investments as well as performance of separately managed accounts managed by Hardman Johnston in accordance with an investment strategy similar to that of the Fund; (3) the fact that the terms of the Sub-Advisory Agreement are identical to the terms of the prior sub-advisory agreement with Redwood Investments in terms of the nature, extent, and quality of services to be provided; (4) the fact that Hardman Johnston’s investment management team is familiar with the Fund’s international equity investment strategy and has experience managing products similar to the Fund; (5) the fact that while the fee paid by Marmont Partners to Hardman Johnston under the Sub-Advisory Agreement is higher than the fee paid by Marmont Partners to Redwood Investments under the prior sub-advisory agreement, the change in sub-advisor would not result in an increased management fee or in the Fund’s total expense ratio paid by shareholders; (6) the Fund’s current asset size and prospects for asset growth with a new sub-advisor; and (7) potential tax consequences and trading costs associated with the change in sub-advisor.
The Trustees also evaluated the Sub-Advisory Agreement in light of information they had requested and received from Hardman Johnston prior to and at the meetings held on October 28, 2019 and November 12, 2019. At the November 12, 2019 meeting, the Trustees reviewed these materials with a senior executive of Marmont Partners, as well as a representative of Hardman Johnston. The Independent Trustees also discussed the Sub-Advisory Agreement in executive session with their legal counsel. The materials provided contained information with respect to the factors enumerated below, including a copy of the Sub-Advisory Agreement, a memorandum prepared by the Trust’s outside legal counsel discussing the Board’s fiduciary obligations and the factors the Board should consider in the approval of the Sub-Advisory Agreement, detailed comparative information relating to the performance of the Fund, as well as the management fee and other expenses of the Fund, due diligence materials relating to Hardman Johnston, including Hardman Johnston’s Form ADV, and other pertinent information. Below is a summary of the material factors considered by the Board in its deliberations as to whether
Hardman Johnston International Growth Fund
| APPROVAL OF INVESTMENT SUB-ADVISORY AGREEMENT (Continued) |
| (Unaudited) |
to approve the Sub-Advisory Agreement, and the Board’s conclusions. In their deliberations, the Trustees did not rank the importance of any particular piece of information or factor considered, but considered these matters in their totality.
| | 1. | NATURE, EXTENT AND QUALITY OF SERVICES TO BE PROVIDED TO THE FUND |
The Trustees evaluated the nature, extent, and quality of Hardman Johnston’s overall services to be provided to the Fund. The Trustees evaluated the quality and credentials of the proposed portfolio management team. The Trustees also reviewed Hardman Johnston’s Form ADV and responses to a due diligence questionnaire submitted to Hardman Johnston on behalf of the Board. The Trustees reviewed with the Trust’s Chief Compliance Officer Hardman Johnston’s compliance program and policies and concluded that the policies and procedures were reasonably designed to prevent violations of the federal securities laws.
The Trustees evaluated Hardman Johnston’s financial condition, noting that it appeared to have sufficient resources to sub-advise the Fund. The Trustees considered Hardman Johnston’s history, strategy for international equity investing and the experience of its investment personnel. The Board noted that Cassandra A. Hardman, CFA, CIO of International and Global Strategies and Chief Executive Officer of Hardman Johnston, would be primarily responsible for the day-to-day management of the Fund and will begin serving as the Fund’s Lead Portfolio Manager on January 1, 2020. Prior to joining the firm in 1997, Ms. Hardman was Managing Director and Principal at PCM International, Inc., an affiliate of Prudential Financial. She has spent her entire career focused on international equity markets and managing separate and commingled institutional accounts. Ms. Hardman has a BA in Economics and an MBA in Finance from Rutgers University, and is a member of the CFA Society New York. Ms. Hardman is a shareholder in the firm.
The following members of the Sub-Advisor’s International and Global Investment Team would support Ms. Hardman in her role as portfolio manager for the International Growth Fund: James G. Pontone, Portfolio Manager; and Henry Woo, CFA, Director of Research, Portfolio Manager.
James G. Pontone, is a Portfolio Manager of Hardman Johnston, and joined the firm in 2011. He is a member of the International and Global Investment Team and is responsible for covering global energy and financials. Prior to joining the firm, Mr. Pontone was a Principal and Senior Portfolio Manager at the Winchester Group. Prior to that, he was a Senior Portfolio Manager at Ark Asset Management for fourteen years. Mr. Pontone also held various positions at Morgan Stanley Asset Management, Mitchell Hutchins, and on the floor of the New York Stock Exchange. Mr. Pontone has a BA from Skidmore College and an MBA in Finance from New York University Stern School of Business. Mr. Pontone is a shareholder in the firm.
Hardman Johnston International Growth Fund
| APPROVAL OF INVESTMENT SUB-ADVISORY AGREEMENT (Continued) |
| (Unaudited) |
Henry Woo, CFA, is the Director of Research, Portfolio Manager for Hardman Johnston. Mr. Woo joined Hardman Johnston in 2007 and is responsible for the firm’s research function. In addition, Mr. Woo is a member of the International and Global Investment Team and is responsible for covering global communication services. Prior to joining the firm, Mr. Woo was an equity research analyst on both the buy-side and sell-side at First Republic Investment Management, Citigroup Asset Management, and Bank of America Securities, after spending twelve years in the technology and telecommunications industry, with responsibilities in engineering, marketing, and management. Mr. Woo earned an SB in Computer Science and Engineering from Massachusetts Institute of Technology, an MSE in Computer Information Science from the University of Pennsylvania, and an MBA from Wharton School of the University of Pennsylvania. He is a member of the CFA Society New York. Mr. Woo is a shareholder in the firm.
Based on the information provided, the Trustees concluded that the nature and extent of the services that Hardman Johnston would provide under the Sub-Advisory Agreement, as well as the quality of those services, would be satisfactory.
| | 2. | INVESTMENT PERFORMANCE OF THE SUB-ADVISOR |
The Trustees reviewed information concerning the Fund’s investment performance, both absolutely as well as compared to other funds in its peer group. The Trustees also considered information concerning Hardman Johnston’s management of similarly managed accounts. After considering all of the information, the Trustees concluded that, although past performance is not a guarantee of future results, the Fund and its shareholders were likely to benefit from Hardman Johnston taking over as sub-advisor to the Fund.
| | 3. | COSTS OF SERVICES PROVIDED AND PROFITS TO BE REALIZED BY THE SUB-ADVISOR |
Sub-Advisory Fee. The Board reviewed and considered the sub-advisory fee payable by Marmont Partners to Hardman Johnston under the Sub-Advisory Agreement, noting that the proposed fee is higher than the fee that was payable to Redwood Investments, LLC under the Prior Sub-Advisory Agreement, and considering information provided by Marmont Partners regarding the fee change. The Board determined that the sub-advisory fee was appropriate. In evaluating the sub-advisory fee, the Board noted that the fee is paid by Marmont Partners and therefore the overall advisory fee paid by the Fund is not directly affected by the sub-advisory fee.
Costs and Profitability. The Board did not consider the cost of services to be provided by Hardman Johnston under the Sub-Advisory Agreement or the profitability to Hardman Johnston from its relationship with the Fund to be material factors because the sub-advisory fee is paid by Marmont Partners. The Trustees considered that the Fund would not bear any expenses related to the change in sub-advisor, including expenses related to the proxy statement, but shareholders may experience indirect costs through increased brokerage commissions and capital gains distributions (which may be offset by capital loss carryforwards) as the portfolio is transitioned to Hardman Johnston’s investment strategy.
Hardman Johnston International Growth Fund
| APPROVAL OF INVESTMENT SUB-ADVISORY AGREEMENT (Continued) |
| (Unaudited) |
| | 4. | EXTENT OF ECONOMIES OF SCALE AS THE FUND GROWS |
Because the sub-advisory fee is not paid by the Fund, the Board did not consider whether the fee should reflect any potential economies of scale that might be realized as Fund assets increase.
| | 5. | BENEFITS TO BE DERIVED FROM THE RELATIONSHIP WITH THE FUND |
The Trustees considered any additional indirect benefits that Hardman Johnston expects to derive from its relationship with the Fund, including a larger asset base that would lead to larger trading commissions and soft dollar benefits. The Board concluded that this potential benefit was appropriate.
CONCLUSIONS
In considering the Sub-Advisory Agreement, the Trustees did not identify any one factor as all-important, but rather considered these factors collectively in light of the Fund’s surrounding circumstances. Based on this review, the Trustees, including a majority of the Independent Trustees, approved the Sub-Advisory Agreement for an initial two-year term following the approval of the Sub-Advisory Agreement at a special meeting of shareholders held on January 21, 2020.
Hardman Johnston International Growth Fund
| NOTICE OF PRIVACY POLICY & PRACTICES |
| |
Protecting the privacy of Fund shareholders is important to us. The following is a description of the practices and policies through which we protect the privacy and security of your non-public personal information.
What Information We Collect
We collect and maintain information about you so that we can open and maintain your account in the Fund and provide various services to you. We collect non-public personal information about you from the following sources:
| | • | information we receive about you on applications or other forms;
|
| | • | information you give us orally; and
|
| | • | information about your transactions with us or others.
|
The types of non public personal information we collect and share can include:
| | • | social security number;
|
| | • | account balances;
|
| | • | account transactions;
|
| | • | transaction history;
|
| | • | wire transfer instructions; and
|
| | • | checking account information. |
What Information We Disclose
We do not disclose any non-public personal information about shareholders or former shareholders of the Fund without the shareholder’s authorization, except as permitted by law or in response to inquiries from governmental authorities. We may share information with affiliated parties and unaffiliated third parties with whom we have contracts for servicing the Fund. We will provide unaffiliated third parties with only the information necessary to carry out their assigned responsibility.
How We Protect Your Information
All shareholder records will be disposed of in accordance with applicable law. We maintain physical, electronic and procedural safeguards to protect your non-public personal information and require third parties to treat your non-public personal information with the same high degree of confidentiality.
In the event that you hold shares of the Fund through a financial intermediary, including, but not limited to, a broker-dealer, bank or trust company, the privacy policy of your financial intermediary would govern how your non-public personal information would be shared with unaffiliated third parties.
If you have any questions or concerns regarding this notice or our Privacy Policy, please contact us at 1-833-MAR-MONT.
(This Page Intentionally Left Blank.)
Investment Advisor
Marmont Partners LLC
925 West Lancaster Avenue, Suite 220
Bryn Mawr, PA 19010
Investment Sub-Advisor
Hardman Johnston Global Advisors LLC
300 Atlantic Street, Suite 601
Stamford, CT 06901
Distributor
Quasar Distributors, LLC
111 East Kilbourn Avenue, Suite 2200
Milwaukee, WI 53202
Transfer Agent
U.S. Bancorp Fund Services, LLC
615 East Michigan Street
Milwaukee, WI 53202
(833) MAR-MONT
Custodian
U.S. Bank National Association
Custody Operations
1555 North River Center Drive, Suite 302
Milwaukee, WI 53212
Independent Registered Public Accounting Firm
BBD, LLP
1835 Market Street, 3rd Floor
Philadelphia, PA 19103
Legal Counsel
Godfrey & Kahn S.C.
833 East Michigan Street, Suite 1800
Milwaukee, WI 53202
This report is intended for shareholders of the Fund and may not be used as sales literature unless preceded or accompanied by a current prospectus.
Past performance results shown in this report should not be considered a representation of future performance. Share price and returns will fluctuate so that shares, when redeemed, may be worth more or less than their original cost. Statements and other information herein are dated and are subject to change.
Item 2. Code of Ethics.
Not applicable for semi-annual reports.
Item 3. Audit Committee Financial Experts.
Not applicable for semi-annual reports.
Item 4. Principal Accountant Fees and Services.
Not applicable for semi-annual reports.
Item 5. Audit Committee of Listed Registrants.
(a) Not applicable to registrants who are not listed issuers (as defined in Rule 10A-3 under the Securities Exchange Act of 1934).
(b) Not Applicable.
Item 6. Investments.
(a) | Schedule of Investments is included as part of the report to shareholders filed under Item 1 of this Form. |
Item 7. Disclosure of Proxy Voting Policies and Procedures for Closed-End Management Investment Companies.
Not applicable to open-end investment companies.
Item 8. Portfolio Managers of Closed-End Management Investment Companies.
Not applicable to open-end investment companies.
Item 9. Purchases of Equity Securities by Closed‑End Management Investment Company and Affiliated Purchasers.
Not applicable to open-end investment companies.
Item 10. Submission of Matters to a Vote of Security Holders.
There have been no material changes to the procedures by which shareholders may recommend nominees to the Registrant’s Board of Trustees.
Item 11. Controls and Procedures.
(a) | The Registrant’s President/Principal Executive Officer and Treasurer/Principal Financial Officer have reviewed the Registrant's disclosure controls and procedures (as defined in Rule 30a-3(c) under the Investment Company Act of 1940, as amended, (the “Act”)) as of a date within 90 days of the filing of this report, as required by Rule 30a-3(b) under the Act and Rules 13a-15(b) or 15d‑15(b) under the Securities Exchange Act of 1934. Based on their review, such officers have concluded that the disclosure controls and procedures are effective in ensuring that information required to be disclosed in this report is appropriately recorded, processed, summarized and reported and made known to them by others within the Registrant and by the Registrant’s service provider. |
(b) | There were no changes in the Registrant's internal control over financial reporting (as defined in Rule 30a-3(d) under the Act) that occurred during the second fiscal quarter of the period covered by this report that has materially affected, or is reasonably likely to materially affect, the Registrant's internal control over financial reporting. |
Item 12. Disclosure of Securities Lending Activities for Closed-End Management Investment Companies.
Not applicable to open-end investment companies.
Item 13. Exhibits.
| (a) | (1) Any code of ethics or amendment thereto, that is subject to the disclosure required by Item 2, to the extent that the registrant intends to satisfy Item 2 requirements through filing an exhibit. Not applicable. |
(3) Any written solicitation to purchase securities under Rule 23c‑1 under the Act sent or given during the period covered by the report by or on behalf of the registrant to 10 or more persons. Not applicable to open-end investment companies.
(4) Change in the registrant’s independent public accountant. There was no change in the registrant’s independent public accountant for the period covered by this report.
SIGNATURES
Pursuant to the requirements of the Securities Exchange Act of 1934 and the Investment Company Act of 1940, as amended, the registrant has duly caused this report to be signed on its behalf by the undersigned, thereunto duly authorized.
(Registrant) Manager Directed Portfolios
By (Signature and Title)* /s/Douglas J. Neilson
Douglas J. Neilson, President/
Principal Executive Officer
Date July 9, 2020
Pursuant to the requirements of the Securities Exchange Act of 1934 and the Investment Company Act of 1940, as amended, this report has been signed below by the following persons on behalf of the registrant and in the capacities and on the dates indicated.
By (Signature and Title)* /s/Douglas J. Neilson
Douglas J. Neilson, President/
Principal Executive Officer
Date July 9, 2020
By (Signature and Title)* /s/Matthew J. McVoy
Matthew J. McVoy, Treasurer/
Principal Financial Officer
Date July 9, 2020
* Print the name and title of each signing officer under his or her signature.