Hood River Small-Cap Growth Fund
Semi-Annual Report
December 31, 2020
Beginning on January 1, 2021, as permitted by regulations adopted by the U.S. Securities and Exchange Commission, paper copies of the Fund’s annual and semi-annual shareholder reports will no longer be sent by mail, unless you specifically request paper copies of the reports from the Fund or from your financial intermediary, such as a broker-dealer or bank. Instead, the reports will be made available on the Fund’s website, www.hoodrivercapital.com, and you will be notified by mail each time a report is posted and provided with a website link to access the report.
If you already elected to receive shareholder reports electronically, you will not be affected by this change and you need not take any action. You may elect to receive shareholder reports and other communications from the Fund electronically anytime by contacting your financial intermediary (such as a broker-dealer or a bank) or, if you are a direct investor, by calling 1-800-497-2960, sending an e-mail request to mflaherty@hoodrivercapital.com, or by enrolling at www.hoodrivercapital.com.
You may elect to receive all future reports in paper free of charge. If you invest through a financial intermediary, you can contact your financial intermediary to request that you continue to receive paper copies of your shareholder reports. If you invest directly with the Fund you can call 1-800-497-2960 or send an e-mail request to mflaherty@hoodrivercapital.com to let the Fund know you wish to continue receiving paper copies of your shareholder reports. Your election to receive reports in paper will apply to all funds held in your account if you invest through your financial intermediary or all funds held with the fund complex if you invest directly with the Fund.
Hood River Small-Cap Growth Fund
Table of Contents
Sector Allocation of Portfolio Assets | 3 |
| | |
Schedule of Investments | 4 |
| | |
Statement of Assets and Liabilities | 11 |
| | |
Statement of Operations | 13 |
| | |
Statements of Changes in Net Assets | 14 |
| | |
Financial Highlights | 16 |
| | |
Notes to the Financial Statements | 19 |
| | |
Expense Example | 30 |
| | |
Statement Regarding Liquidity Risk Management Program | 32 |
| | |
Notice to Shareholders | 33 |
| | |
Privacy Notice | 34 |
Hood River Small-Cap Growth Fund
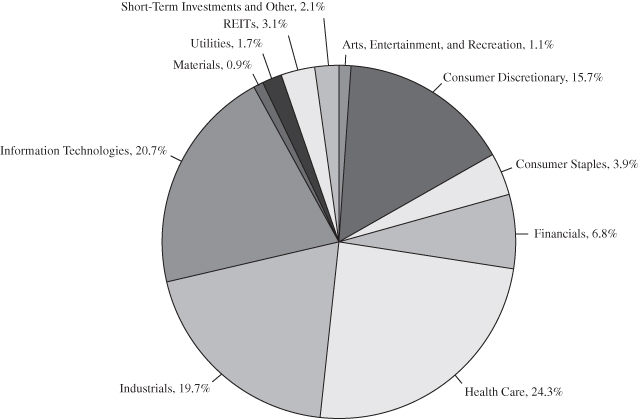
| SECTOR ALLOCATION OF PORTFOLIO ASSETS |
| at December 31, 2020 (Unaudited) |
Percentages represent market value as a percentage of net assets.
Note: For presentation purposes, the Fund has grouped some of the industry categories. For purposes of categorizing securities for compliance with Section 8(b)(1) of the Investment Company Act of 1940, as amended, the Fund uses more specific industry classifications.
Hood River Small-Cap Growth Fund
| SCHEDULE OF INVESTMENTS |
| at December 31, 2020 (Unaudited) |
| COMMON STOCKS – 94.8% | | Shares | | | Value | |
| | | | | | | |
| ARTS, ENTERTAINMENT, AND RECREATION – 1.1% | | | | | | |
| | | | | | | |
| Spectator Sports – 1.1% | | | | | | |
Rush Street Interactive, Inc. (a)(d) | | | 485,923 | | | $ | 10,520,233 | |
| TOTAL ARTS, ENTERTAINMENT, AND RECREATION | | | | | | | 10,520,233 | |
| | | | | | | | | |
| CONSUMER DISCRETIONARY – 15.7% | | | | | | | | |
| | | | | | | | | |
| Auto Components – 0.8% | | | | | | | | |
Fox Factory Holding Corp. (a) | | | 75,950 | | | | 8,028,674 | |
| | | | | | | | | |
| Diversified Consumer Services – 2.5% | | | | | | | | |
Chegg, Inc. (a) | | | 75,843 | | | | 6,850,898 | |
Franchise Group, Inc. | | | 422,391 | | | | 12,861,806 | |
Vivint Smart Home, Inc. (a)(d) | | | 179,951 | | | | 3,733,983 | |
| | | | | | | | 23,446,687 | |
| Hotels, Restaurants & Leisure – 8.4% | | | | | | | | |
Caesars Entertainment, Inc. (a) | | | 522,174 | | | | 38,781,863 | |
GAN Ltd. – ADR (a) | | | 256,839 | | | | 5,208,695 | |
Planet Fitness, Inc. (a)(d) | | | 213,122 | | | | 16,544,661 | |
SeaWorld Entertainment, Inc. (a)(d) | | | 211,734 | | | | 6,688,677 | |
Texas Roadhouse, Inc. (d) | | | 157,456 | | | | 12,306,761 | |
| | | | | | | | 79,530,657 | |
| Household Durables – 1.1% | | | | | | | | |
Lovesac Co. (a)(d) | | | 240,198 | | | | 10,350,132 | |
| | | | | | | | | |
| Specialty Retail – 2.9% | | | | | | | | |
Boot Barn Holdings, Inc. (a)(d) | | | 230,264 | | | | 9,984,247 | |
Rent-A-Center, Inc. | | | 444,641 | | | | 17,025,304 | |
| | | | | | | | 27,009,551 | |
| TOTAL CONSUMER DISCRETIONARY | | | | | | | 148,365,701 | |
| | | | | | | | | |
| CONSUMER STAPLES – 3.9% | | | | | | | | |
| | | | | | | | | |
| Beverages – 2.0% | | | | | | | | |
Celsius Holdings, Inc. (a)(d) | | | 372,056 | | | | 18,718,137 | |
The accompanying notes are an integral part of these financial statements.
Hood River Small-Cap Growth Fund
| SCHEDULE OF INVESTMENTS (Continued) |
| at December 31, 2020 (Unaudited) |
| COMMON STOCKS – 94.8% (Continued) | | Shares | | | Value | |
| | | | | | | |
| CONSUMER STAPLES – 3.9% (Continued) | | | | | | |
| | | | | | | |
| Food Products – 1.9% | | | | | | |
Freshpet, Inc. (a) | | | 89,291 | | | $ | 12,678,429 | |
Tattooed Chef, Inc. (a)(d) | | | 229,804 | | | | 5,260,214 | |
| | | | | | | | 17,938,643 | |
| TOTAL CONSUMER STAPLES | | | | | | | 36,656,780 | |
| | | | | | | | | |
| FINANCIALS – 6.8% | | | | | | | | |
| | | | | | | | | |
| Banks – 2.0% | | | | | | | | |
TriState Capital Holdings, Inc. (a) | | | 351,082 | | | | 6,108,827 | |
Western Alliance Bancorp | | | 214,466 | | | | 12,857,237 | |
| | | | | | | | 18,966,064 | |
| Capital Markets – 1.5% | | | | | | | | |
Open Lending Corp. (a)(d) | | | 405,331 | | | | 14,170,372 | |
| | | | | | | | | |
| Insurance – 3.3% | | | | | | | | |
James River Group Holdings Ltd. – ADR | | | 135,235 | | | | 6,646,800 | |
Kinsale Capital Group, Inc. (d) | | | 73,610 | | | | 14,731,569 | |
LF Capital Acquisition Corp. (a) | | | 254,255 | | | | 2,700,188 | |
Palomar Holdings, Inc. (a)(d) | | | 81,733 | | | | 7,261,160 | |
| | | | | | | | 31,339,717 | |
| TOTAL FINANCIALS | | | | | | | 64,476,153 | |
| | | | | | | | | |
| HEALTH CARE – 24.3% | | | | | | | | |
| | | | | | | | | |
| Biotechnology – 10.2% | | | | | | | | |
Acceleron Pharma, Inc. (a) | | | 40,703 | | | | 5,207,542 | |
Agios Pharmaceuticals, Inc. (a)(d) | | | 65,763 | | | | 2,849,511 | |
Amicus Therapeutics, Inc. (a) | | | 667,892 | | | | 15,421,626 | |
Arrowhead Pharmaceuticals, Inc. (a)(d) | | | 119,270 | | | | 9,151,587 | |
Biohaven Pharmaceutical Holding Co Ltd. – ADR (a)(d) | | | 63,962 | | | | 5,482,183 | |
Deciphera Pharmaceuticals, Inc. (a)(d) | | | 128,821 | | | | 7,351,815 | |
Esperion Therapeutics, Inc. (a)(d) | | | 93,681 | | | | 2,435,706 | |
Insmed, Inc. (a) | | | 157,886 | | | | 5,256,025 | |
Iovance Biotherapeutics, Inc. (a)(d) | | | 153,576 | | | | 7,125,926 | |
Karuna Therapeutics, Inc. (a)(d) | | | 40,829 | | | | 4,147,818 | |
The accompanying notes are an integral part of these financial statements.
Hood River Small-Cap Growth Fund
| SCHEDULE OF INVESTMENTS (Continued) |
| at December 31, 2020 (Unaudited) |
| COMMON STOCKS – 94.8% (Continued) | | Shares | | | Value | |
| | | | | | | |
| HEALTH CARE – 24.3% (Continued) | | | | | | |
| | | | | | | |
| Biotechnology – 10.2% (Continued) | | | | | | |
Karyopharm Therapeutics, Inc. (a)(d) | | | 283,634 | | | $ | 4,390,654 | |
Krystal Biotech, Inc. (a) | | | 79,310 | | | | 4,758,600 | |
MacroGenics, Inc. (a) | | | 215,971 | | | | 4,937,097 | |
Natera, Inc. (a) | | | 175,478 | | | | 17,463,571 | |
| | | | | | | | 95,979,661 | |
| Health Care Equipment & Supplies – 5.4% | | | | | | | | |
Axonics Modulation Technologies, Inc. (a)(d) | | | 159,481 | | | | 7,961,292 | |
Cerus Corp. (a) | | | 698,767 | | | | 4,835,468 | |
CONMED Corp. (d) | | | 70,993 | | | | 7,951,216 | |
Integer Holdings Corp. (a) | | | 75,744 | | | | 6,149,655 | |
Integra LifeSciences Holdings Corp. (a)(d) | | | 147,502 | | | | 9,575,830 | |
NuVasive, Inc. (a) | | | 168,449 | | | | 9,488,732 | |
Zynex, Inc. (a)(d) | | | 346,987 | | | | 4,670,445 | |
| | | | | | | | 50,632,638 | |
| Health Care Providers & Services – 5.2% | | | | | | | | |
HealthEquity, Inc. (a)(d) | | | 131,912 | | | | 9,195,586 | |
LHC Group, Inc. (a) | | | 64,491 | | | | 13,757,220 | |
Select Medical Holdings Corp. (a) | | | 937,659 | | | | 25,935,648 | |
| | | | | | | | 48,888,454 | |
| Health Care Technology – 1.4% | | | | | | | | |
Vocera Communications, Inc. (a)(d) | | | 319,821 | | | | 13,282,166 | |
| | | | | | | | | |
| Life Sciences Tools & Services – 1.4% | | | | | | | | |
Charles River Laboratories International, Inc. (a)(d) | | | 52,714 | | | | 13,171,120 | |
| | | | | | | | | |
| Pharmaceuticals – 0.7% | | | | | | | | |
Reata Pharmaceuticals, Inc. (a)(d) | | | 22,148 | | | | 2,737,936 | |
Zogenix, Inc. (a)(d) | | | 212,029 | | | | 4,238,459 | |
| | | | | | | | 6,976,395 | |
| TOTAL HEALTH CARE | | | | | | | 228,930,434 | |
The accompanying notes are an integral part of these financial statements.
Hood River Small-Cap Growth Fund
| SCHEDULE OF INVESTMENTS (Continued) |
| at December 31, 2020 (Unaudited) |
| COMMON STOCKS – 94.8% (Continued) | | Shares | | | Value | |
| | | | | | | |
| INDUSTRIALS – 19.7% | | | | | | |
| | | | | | | |
| Aerospace & Defense – 2.2% | | | | | | |
Axon Enterprise, Inc. (a)(d) | | | 46,742 | | | $ | 5,727,297 | |
Kratos Defense & Security Solutions, Inc. (a) | | | 536,357 | | | | 14,712,273 | |
| | | | | | | | 20,439,570 | |
| Air Freight & Logistics – 0.8% | | | | | | | | |
XPO Logistics, Inc. (a) | | | 64,652 | | | | 7,706,518 | |
| | | | | | | | | |
| Airlines – 1.7% | | | | | | | | |
Azul SA (a)(d) | | | 695,431 | | | | 15,869,735 | |
| | | | | | | | | |
| Building Products – 0.3% | | | | | | | | |
Masonite International Corp. – ADR (a) | | | 31,878 | | | | 3,134,883 | |
| | | | | | | | | |
| Commercial Services & Supplies – 0.9% | | | | | | | | |
Clean Harbors, Inc. (a) | | | 111,905 | | | | 8,515,970 | |
| | | | | | | | | |
| Construction & Engineering – 1.3% | | | | | | | | |
MasTec, Inc. (a)(d) | | | 178,398 | | | | 12,163,176 | |
| | | | | | | | | |
| Electrical Equipment – 4.8% | | | | | | | | |
American Superconductor Corp. (a) | | | 230,826 | | | | 5,405,945 | |
Plug Power, Inc. (a)(d) | | | 384,609 | | | | 13,042,091 | |
Vicor Corp. (a)(d) | | | 290,228 | | | | 26,764,826 | |
| | | | | | | | 45,212,862 | |
| Machinery – 3.9% | | | | | | | | |
Chart Industries, Inc. (a)(d) | | | 94,141 | | | | 11,088,869 | |
Colfax Corp. (a)(d) | | | 449,180 | | | | 17,176,643 | |
Kornit Digital Ltd. – ADR (a) | | | 99,926 | | | | 8,906,404 | |
| | | | | | | | 37,171,916 | |
| Marine – 0.7% | | | | | | | | |
Kirby Corp. (a) | | | 120,511 | | | | 6,246,085 | |
| | | | | | | | | |
| Road & Rail – 1.8% | | | | | | | | |
Knight-Swift Transportation Holdings – Class A | | | 104,066 | | | | 4,352,040 | |
TFI International, Inc. – ADR (d) | | | 242,995 | | | | 12,533,682 | |
| | | | | | | | 16,885,722 | |
| Trading Companies & Distributors – 0.7% | | | | | | | | |
Fortress Transportation and Infrastructure Investors LLC | | | 283,474 | | | | 6,650,300 | |
The accompanying notes are an integral part of these financial statements.
Hood River Small-Cap Growth Fund
| SCHEDULE OF INVESTMENTS (Continued) |
| at December 31, 2020 (Unaudited) |
| COMMON STOCKS – 94.8% (Continued) | | Shares | | | Value | |
| | | | | | | |
| INDUSTRIALS – 19.7% (Continued) | | | | | | |
| | | | | | | |
| Transportation Infrastructure – 0.6% | | | | | | |
Macquarie Infrastructure Corp. | | | 163,996 | | | $ | 6,158,050 | |
| TOTAL INDUSTRIALS | | | | | | | 186,154,787 | |
| | | | | | | | | |
| INFORMATION TECHNOLOGY – 20.7% | | | | | | | | |
| | | | | | | | | |
| Communications Equipment – 3.7% | | | | | | | | |
Calix, Inc. (a) | | | 356,676 | | | | 10,614,678 | |
Lumentum Holdings, Inc. (a)(d) | | | 254,897 | | | | 24,164,235 | |
| | | | | | | | 34,778,913 | |
| Electronic Equipment, Instruments & Components – 1.7% | | | | | | | | |
Jabil, Inc. | | | 130,720 | | | | 5,559,522 | |
Napco Security Technologies, Inc. (a)(d) | | | 96,190 | | | | 2,522,102 | |
nLight, Inc. (a)(d) | | | 256,056 | | | | 8,360,228 | |
| | | | | | | | 16,441,852 | |
| IT Services – 1.2% | | | | | | | | |
Euronet Worldwide, Inc. (a) | | | 46,309 | | | | 6,711,100 | |
I3 Verticals, Inc. (a) | | | 141,175 | | | | 4,687,010 | |
| | | | | | | | 11,398,110 | |
| Semiconductors & Semiconductor Equipment – 7.2% | | | | | | | | |
Cirrus Logic, Inc. (a) | | | 145,561 | | | | 11,965,114 | |
Ichor Holdings Ltd. – ADR (a) | | | 191,771 | | | | 5,780,937 | |
Kulicke & Soffa Industries, Inc. (d) | | | 250,976 | | | | 7,983,547 | |
Lattice Semiconductor Corp. (a)(d) | | | 245,788 | | | | 11,262,006 | |
ON Semiconductor Corp. (a)(d) | | | 281,895 | | | | 9,226,424 | |
Onto Innovation, Inc. (a)(d) | | | 174,704 | | | | 8,307,175 | |
SiTime Corp. (a)(d) | | | 118,796 | | | | 13,296,836 | |
| | | | | | | | 67,822,039 | |
| Software – 6.9% | | | | | | | | |
Elastic NV – ADR (a) | | | 48,706 | | | | 7,117,408 | |
Medallia, Inc. (a)(d) | | | 368,911 | | | | 12,255,223 | |
NICE Ltd. – ADR (a)(d) | | | 33,858 | | | | 9,600,097 | |
Talend SA – ADR (a)(d) | | | 461,228 | | | | 17,683,482 | |
Telos Corp. (a)(d) | | | 547,913 | | | | 18,070,171 | |
| | | | | | | | 64,726,381 | |
| TOTAL INFORMATION TECHNOLOGY | | | | | | | 195,167,295 | |
The accompanying notes are an integral part of these financial statements.
Hood River Small-Cap Growth Fund
| SCHEDULE OF INVESTMENTS (Continued) |
| at December 31, 2020 (Unaudited) |
| COMMON STOCKS – 94.8% (Continued) | | Shares | | | Value | |
| | | | | | | |
| MATERIALS – 0.9% | | | | | | |
| | | | | | | |
| Construction Materials – 0.9% | | | | | | |
Eagle Materials, Inc. | | | 80,579 | | | $ | 8,166,682 | |
| TOTAL MATERIALS | | | | | | | 8,166,682 | |
| | | | | | | | | |
| UTILITIES – 1.8% | | | | | | | | |
| | | | | | | | | |
| Independent Power and Renewable | | | | | | | | |
| Electricity Producers – 1.8% | | | | | | | | |
Sunnova Energy International, Inc. (a) | | | 366,810 | | | | 16,554,135 | |
| TOTAL UTILITIES | | | | | | | 16,554,135 | |
| TOTAL COMMON STOCKS | | | | | | | | |
(Cost $622,882,658) | | | | | | | 894,992,200 | |
| | | | | | | | | |
| REITS – 3.1% | | | | | | | | |
| | | | | | | | | |
| Mortgage Real Estate Investment Trusts (REITs) – 1.4% | | | | | | | | |
Hannon Armstrong Sustainable | | | | | | | | |
Infrastructure Capital, Inc. (d) | | | 211,045 | | | | 13,386,584 | |
| | | | | | | | | |
| Equity Real Estate Investment Trusts (REITs) – 1.7% | | | | | | | | |
Innovative Industrial Properties, Inc. (d) | | | 89,112 | | | | 16,319,081 | |
| TOTAL REITS | | | | | | | | |
(Cost $12,868,238) | | | | | | | 29,705,665 | |
| | | | | | | | | |
| SHORT-TERM INVESTMENT – 1.7% | | | | | | | | |
| | | | | | | | | |
| MONEY MARKET FUND – 1.7% | | | | | | | | |
First American Treasury Obligations Fund – | | | | | | | | |
Class Z – 0.04% (b) | | | | | | | 15,539,994 | |
| TOTAL SHORT-TERM INVESTMENT | | | | | | | | |
(Cost $15,539,994) | | | | | | | 15,539,994 | |
The accompanying notes are an integral part of these financial statements.
Hood River Small-Cap Growth Fund
| SCHEDULE OF INVESTMENTS (Continued) |
| at December 31, 2020 (Unaudited) |
| INVESTMENTS PURCHASED WITH CASH | | | | | | |
| PROCEEDS FROM SECURITIES LENDING – 31.8% | | Shares | | | Value | |
Mount Vernon Liquid Assets Portfolio, 0.16% (b) | | | 299,852,833 | | | $ | 299,852,833 | |
| TOTAL INVESTMENTS PURCHASED WITH CASH | | | | | | | | |
| PROCEEDS FROM SECURITIES LENDING | | | | | | | | |
(Cost 299,852,833) | | | | | | | 299,852,833 | |
| TOTAL INVESTMENTS (Cost $951,143,723) – 131.4% | | | | | | | 1,240,090,692 | |
Liabilities in Excess of Other Assets – (31.4)% | | | | | | | (295,976,684 | ) |
| TOTAL NET ASSETS – 100.00% | | | | | | $ | 944,114,008 | |
Percentages are stated as a percent of net assets.
PLC – Public Limited Company
REIT – Real Estate Investment Trust
| (a) | Non-income producing security. |
| (b) | The rate shown represents the fund’s 7-day yield as of December 31, 2020. |
| (c) | U.S. traded security of a foreign issuer or corporation. |
| (d) | This security or a portion of this security was out on loan at December 31, 2020. As of December 31, 2020, the total value of loaned securities was $294,842,426 or 31.2% of net assets. The remaining contractual maturity of all the securities lending transactions is overnight and continuous. |
The Global Industry Classification Standard (GICS®) was developed by and/or is the exclusive property of MSCI, Inc. and Standard & Poor’s Financial Services LLC (“S&P”). GICS is a service mark of MSCI and S&P and has been licensed for use by Hood River Capital Management LLC.
The accompanying notes are an integral part of these financial statements.
Hood River Small-Cap Growth Fund
| STATEMENT OF ASSETS AND LIABILITIES |
| at December 31, 2020 (Unaudited) |
| Assets: | | | |
Investments at value* | | | |
(Including securities on loan valued at $294,842,426) | | $ | 1,240,090,692 | |
Cash | | | 58,072 | |
Receivables: | | | | |
| Securities sold | | | 6,315,506 | |
| Fund shares sold | | | 882,267 | |
| Dividends and interest | | | 588,971 | |
| Securities lending income | | | 59,901 | |
Prepaid expenses | | | 111,662 | |
| Total assets | | | 1,248,107,071 | |
| | | | | |
| Liabilities: | | | | |
Payables: | | | | |
| Payable upon return of securities loaned | | | 299,852,833 | |
| Securities purchased | | | 2,064,692 | |
| Fund shares redeemed | | | 1,145,958 | |
| Advisory fee | | | 666,819 | |
| Administration and fund accounting fees | | | 86,636 | |
| Distribution fees | | | 9,300 | |
| Service fees | | | 91,664 | |
| Reports to shareholders | | | 15,662 | |
| Compliance expense | | | 1,069 | |
| Custody fees | | | 15,191 | |
| Transfer agent fees and expenses | | | 27,684 | |
| Other accrued expenses | | | 15,555 | |
| Total liabilities | | | 303,993,063 | |
| | | | | |
| Net assets | | $ | 944,114,008 | |
| | | | | |
| Net assets consist of: | | | | |
Capital stock | | $ | 567,497,716 | |
Total distributable earnings | | | 376,616,292 | |
| Net assets | | $ | 944,114,008 | |
| | | | | |
* Investments at cost | | $ | 951,143,723 | |
The accompanying notes are an integral part of these financial statements.
Hood River Small-Cap Growth Fund
| STATEMENT OF ASSETS AND LIABILITIES (Continued) |
| at December 31, 2020 (Unaudited) |
| Investor Shares: | | | |
| Net assets applicable to outstanding Investor Shares | | $ | 13,267,998 | |
| Shares issued (Unlimited number of beneficial | | | | |
| interest authorized, $0.01 par value) | | | 212,928 | |
| Net asset value, offering price and | | | | |
| redemption price per share | | $ | 62.31 | |
| | | | | |
| Institutional Shares: | | | | |
| Net assets applicable to outstanding Institutional Shares | | $ | 360,892,598 | |
| Shares issued (Unlimited number of beneficial | | | | |
| interest authorized, $0.01 par value) | | | 5,721,233 | |
| Net asset value, offering price and | | | | |
| redemption price per share | | $ | 63.08 | |
| | | | | |
| Retirement Shares: | | | | |
| Net assets applicable to outstanding Retirement Shares | | $ | 569,953,412 | |
| Shares issued (Unlimited number of beneficial | | | | |
| interest authorized, $0.01 par value) | | | 9,009,168 | |
| Net asset value, offering price and | | | | |
| redemption price per share | | $ | 63.26 | |
The accompanying notes are an integral part of these financial statements.
Hood River Small-Cap Growth Fund
| STATEMENT OF OPERATIONS |
| For the Six Months Ended December 31, 2020 (Unaudited) |
| Investment income: | | | |
Dividends | | $ | 1,334,100 | |
Interest | | | 1,467 | |
Securities lending income | | | 410,454 | |
| Total investment income | | | 1,746,021 | |
| | | | | |
| Expenses: | | | | |
Investment advisory fees (Note 4) | | | 3,215,443 | |
Administration and fund accounting fees (Note 4) | | | 161,705 | |
| Service fees (Note 6) | | | | |
| Service fees – Investor Shares | | | 4,923 | |
| Service fees – Institutional Shares | | | 87,755 | |
Transfer agent fees and expenses | | | 73,760 | |
Federal and state registration fees | | | 27,600 | |
Custody fees | | | 38,380 | |
Legal fees | | | 20,059 | |
Reports to shareholders | | | 9,200 | |
| Distribution fees (Note 5) | | | | |
| Distribution fees – Investor Shares | | | 9,300 | |
Audit fees | | | 7,909 | |
Compliance expense | | | 6,413 | |
Trustees’ fees and expenses | | | 5,097 | |
Other | | | 10,594 | |
| Total expenses before reimbursement from advisor | | | 3,678,138 | |
| Expense reimbursement from advisor (Note 4) | | | (40,776 | ) |
| Net expenses | | | 3,637,362 | |
| Net investment loss | | | (1,891,341 | ) |
| | | | | |
| Realized and unrealized gain (loss) on investments: | | | | |
Net realized gain on transactions from: | | | | |
| Investments | | | 158,179,230 | |
Foreign currency related transactions | | | 58 | |
Net change in unrealized appreciation on investments | | | 138,553,036 | |
| Net realized and unrealized gain on investments | | | 296,732,324 | |
| Net increase in net assets resulting from operations | | $ | 294,840,983 | |
The accompanying notes are an integral part of these financial statements.
Hood River Small-Cap Growth Fund
| STATEMENTS OF CHANGES IN NET ASSETS |
| |
| | | Six Months Ended | | | | |
| | | December 31, 2020 | | | Year Ended | |
| | | (Unaudited) | | | June 30, 2020 | |
| Operations: | | | | | | |
Net investment loss | | $ | (1,891,341 | ) | | $ | (3,475,024 | ) |
Net realized gain (loss) on investments | | | 158,179,288 | | | | (7,038,808 | ) |
Net change in unrealized appreciation on investments | | | 138,553,036 | | | | 50,325,243 | |
| Net increase in net assets | | | | | | | | |
| resulting from operations | | | 294,840,983 | | | | 39,811,411 | |
| Distributions: | | | | | | | | |
| Distributable earnings – Investor shares | | | (786,330 | ) | | | — | |
| Distributable earnings – Institutional shares | | | (21,557,677 | ) | | | — | |
| Distributable earnings – Retirement shares | | | (33,480,771 | ) | | | — | |
| Total distributions | | | (55,824,778 | ) | | | — | |
| Capital Share Transactions: | | | | | | | | |
Proceeds from shares sold | | | | | | | | |
| Investor shares | | | 1,163,980 | | | | 900,184 | |
| Institutional shares | | | 21,138,564 | | | | 65,619,356 | |
| Retirement shares | | | 129,974,393 | | | | 79,070,401 | |
Proceeds from shares issued to | | | | | | | | |
holders in reinvestment of dividends | | | | | | | | |
| Investor shares | | | 784,159 | | | | — | |
| Institutional shares | | | 19,289,147 | | | | — | |
| Retirement shares | | | 33,480,772 | | | | — | |
Cost of shares redeemed | | | | | | | | |
| Investor shares | | | (1,589,037 | ) | | | (3,435,271 | ) |
| Institutional shares | | | (39,854,019 | ) | | | (71,839,653 | ) |
| Retirement shares | | | (62,335,359 | ) | | | (83,114,922 | ) |
| Net increase (decrease) in net assets | | | | | | | | |
| from capital share transactions | | | 102,052,600 | | | | (12,799,905 | ) |
| Total increase in net assets | | | 341,068,805 | | | | 27,011,506 | |
| Net Assets: | | | | | | | | |
Beginning of period | | | 603,045,203 | | | | 576,033,697 | |
End of period | | $ | 944,114,008 | | | $ | 603,045,203 | |
The accompanying notes are an integral part of these financial statements.
Hood River Small-Cap Growth Fund
| STATEMENTS OF CHANGES IN NET ASSETS (Continued) |
| |
| | | Six Months Ended | | | | |
| | | December 31, 2020 | | | Year Ended | |
| | | (Unaudited) | | | June 30, 2020 | |
| Changes in Shares Outstanding: | | | | | | |
Shares sold | | | | | | |
| Investor shares | | | 21,504 | | | | 24,024 | |
| Institutional shares | | | 390,122 | | | | 1,677,043 | |
| Retirement shares | | | 2,155,805 | | | | 1,960,791 | |
Proceeds from shares issued to holders | | | | | | | | |
in reinvestment of dividends | | | | | | | | |
| Investor shares | | | 13,338 | | | | — | |
| Institutional shares | | | 324,133 | | | | — | |
| Retirement shares | | | 561,005 | | | | — | |
Shares redeemed | | | | | | | | |
| Investor shares | | | (30,789 | ) | | | (88,777 | ) |
| Institutional shares | | | (741,354 | ) | | | (1,836,115 | ) |
| Retirement shares | | | (1,175,179 | ) | | | (2,112,163 | ) |
Net increase in shares outstanding | | | 1,518,585 | | | | (375,197 | ) |
The accompanying notes are an integral part of these financial statements.
Hood River Small-Cap Growth Fund
For a capital share outstanding throughout each period
Investor Shares
| | | Six Months | | | | | | | | | | | | | | | July 7, | |
| | | Ended | | | Year | | | Year | | | Year | | | Year | | | 2015 | |
| | | December 31, | | | Ended | | | Ended | | | Ended | | | Ended | | | through | |
| | | 2020 | | | June 30, | | | June 30, | | | June 30, | | | June 30, | | | June 30, | |
| | | (Unaudited) | | | 2020 | | | 2019 | | | 2018 | | | 2017 | | | | 2016* |
|
| Net Asset Value – | | | | | | | | | | | | | | | | | | | |
| Beginning of Period | | $ | 44.40 | | | $ | 41.36 | | | $ | 41.36 | | | $ | 38.04 | | | $ | 28.25 | | | $ | 33.18 | |
| | | | | | | | | | | | | | | | | | | | | | | | | |
| Income from | | | | | | | | | | | | | | | | | | | | | | | | |
| Investment Operations: | | | | | | | | | | | | | | | | | | | | | | | | |
Net investment loss1 | | | (0.21 | ) | | | (0.34 | ) | | | (0.36 | ) | | | (0.28 | ) | | | (0.36 | ) | | | (0.19 | ) |
Net realized and | | | | | | | | | | | | | | | | | | | | | | | | |
unrealized gain (loss) | | | | | | | | | | | | | | | | | | | | | | | | |
on investments | | | 22.08 | | | | 3.38 | | | | 1.91 | | | | 6.14 | | | | 10.10 | | | | (3.05 | ) |
| Total from | | | | | | | | | | | | | | | | | | | | | | | | |
| investment operations | | | 21.87 | | | | 3.04 | | | | 1.55 | | | | 5.86 | | | | 9.74 | | | | (3.24 | ) |
| | | | | | | | | | | | | | | | | | | | | | | | | |
| Less Distributions: | | | | | | | | | | | | | | | | | | | | | | | | |
Distributions from net | | | | | | | | | | | | | | | | | | | | | | | | |
realized gains | | | (3.96 | ) | | | — | | | | (1.55 | ) | | | (2.55 | ) | | | — | | | | (1.69 | ) |
| Total distributions | | | (3.96 | ) | | | — | | | | (1.55 | ) | | | (2.55 | ) | | | — | | | | (1.69 | ) |
| | | | | | | | | | | | | | | | | | | | | | | | | |
Redemption fees4: | | | — | | | | — | | | | — | 2 | | | 0.01 | | | | 0.05 | | | | — | 2 |
| | | | | | | | | | | | | | | | | | | | | | | | | |
| Net Asset Value – | | | | | | | | | | | | | | | | | | | | | | | | |
| End of Period | | $ | 62.31 | | | $ | 44.40 | | | $ | 41.36 | | | $ | 41.36 | | | $ | 38.04 | | | $ | 28.25 | |
| | | | | | | | | | | | | | | | | | | | | | | | | |
| Total Return | | 49.83 | %^ | | | 7.35 | % | | | 4.30 | % | | | 16.35 | % | | | 34.65 | % | | (9.96 | )%^ |
| | | | | | | | | | | | | | | | | | | | | | | | | |
| Ratios and | | | | | | | | | | | | | | | | | | | | | | | | |
| Supplemental Data: | | | | | | | | | | | | | | | | | | | | | | | | |
Net assets, end of | | | | | | | | | | | | | | | | | | | | | | | | |
period (thousands) | | $ | 13,268 | | | $ | 9,274 | | | $ | 11,316 | | | $ | 11,470 | | | $ | 1,401 | | | $ | 39 | |
Ratio of operating expenses | | | | | | | | | | | | | | | | | | | | | | | | |
to average net assets: | | | | | | | | | | | | | | | | | | | | | | | | |
| Before reimbursements | | | 1.26 | %+ | | | 1.27 | % | | | 1.32 | % | | | 1.41 | % | | | 1.48 | % | | | 1.65 | %+ |
| After reimbursements | | | 1.25 | %+ | | | 1.25 | % | | | 1.27 | % | | | 1.32 | % | | | 1.33 | % | | | 1.34 | %+ |
Ratio of net investment | | | | | | | | | | | | | | | | | | | | | | | | |
income (loss) to | | | | | | | | | | | | | | | | | | | | | | | | |
average net assets: | | | | | | | | | | | | | | | | | | | | | | | | |
| Before reimbursements | | | (0.78 | )%+ | | | (0.90 | )% | | | (0.96 | )% | | | (0.81 | )% | | | (1.19 | )% | | | (0.99 | )%+ |
| After reimbursements | | | (0.77 | )%+ | | | (0.88 | )% | | | (0.91 | )% | | | (0.72 | )% | | | (1.04 | )% | | | (0.68 | )%+ |
Portfolio turnover rate | | 72 | %^ | | | 157 | % | | | 98 | % | | | 102 | % | | | 134 | % | | | 170 | %3 |
* | Operations commenced for the Investor Shares on July 7, 2015. |
+ | Annualized |
^ | Not Annualized |
1 | The net investment loss per share was calculated using the average shares outstanding method. |
2 | Amount is less than $0.01. |
3 | Portfolio turnover was calculated on the basis of the Fund as a whole. The rate presented represents portfolio turnover for the entire fiscal year. |
4 | The Fund’s redemption fee was eliminated on October 31, 2018. |
The accompanying notes are an integral part of these financial statements.
Hood River Small-Cap Growth Fund
For a capital share outstanding throughout each period
Institutional Shares
| | | Six Months | | | | | | | | | | | | | | | | |
| | | Ended | | | Year | | | Year | | | Year | | | Year | | | Year | |
| | | December 31, | | | Ended | | | Ended | | | Ended | | | Ended | | | Ended | |
| | | 2020 | | | June 30, | | | June 30, | | | June 30, | | | June 30, | | | June 30, | |
| | | (Unaudited) | | | 2020 | | | 2019 | | | 2018 | | | 2017 | | | 2016 | |
| Net Asset Value – | | | | | | | | | | | | | | | | | | |
| Beginning of Year | | $ | 44.87 | | | $ | 41.71 | | | $ | 41.61 | | | $ | 38.18 | | | $ | 28.32 | | | $ | 33.43 | |
| | | | | | | | | | | | | | | | | | | | | | | | | |
| Income from | | | | | | | | | | | | | | | | | | | | | | | | |
| Investment Operations: | | | | | | | | | | | | | | | | | | | | | | | | |
Net investment loss1 | | | (0.15 | ) | | | (0.27 | ) | | | (0.28 | ) | | | (0.18 | ) | | | (0.26 | ) | | | (0.13 | ) |
Net realized and | | | | | | | | | | | | | | | | | | | | | | | | |
unrealized gain (loss) | | | | | | | | | | | | | | | | | | | | | | | | |
on investments | | | 22.32 | | | | 3.43 | | | | 1.93 | | | | 6.16 | | | | 10.12 | | | | (3.29 | ) |
| Total from | | | | | | | | | | | | | | | | | | | | | | | | |
| investment operations | | | 22.17 | | | | 3.16 | | | | 1.65 | | | | 5.98 | | | | 9.86 | | | | (3.42 | ) |
| | | | | | | | | | | | | | | | | | | | | | | | | |
| Less Distributions: | | | | | | | | | | | | | | | | | | | | | | | | |
Distributions from | | | | | | | | | | | | | | | | | | | | | | | | |
net realized gains | | | (3.96 | ) | | | — | | | | (1.55 | ) | | | (2.55 | ) | | | — | | | | (1.69 | ) |
| Total distributions | | | (3.96 | ) | | | — | | | | (1.55 | ) | | | (2.55 | ) | | | — | | | | (1.69 | ) |
| | | | | | | | | | | | | | | | | | | | | | | | | |
Redemption fees3: | | | — | | | | — | | | | — | 2 | | | — | 2 | | | — | 2 | | | — | 2 |
| | | | | | | | | | | | | | | | | | | | | | | | | |
| Net Asset Value – | | | | | | | | | | | | | | | | | | | | | | | | |
| End of Year | | $ | 63.08 | | | $ | 44.87 | | | $ | 41.71 | | | $ | 41.61 | | | $ | 38.18 | | | $ | 28.32 | |
| | | | | | | | | | | | | | | | | | | | | | | | | |
| Total Return | | 50.01 | %^ | | | 7.55 | % | | 4.52 | %^ | | | 16.59 | % | | | 34.82 | % | | | (10.41 | )% |
| | | | | | | | | | | | | | | | | | | | | | | | | |
| Ratios and | | | | | | | | | | | | | | | | | | | | | | | | |
| Supplemental Data: | | | | | | | | | | | | | | | | | | | | | | | | |
Net assets, end of | | | | | | | | | | | | | | | | | | | | | | | | |
period (thousands) | | $ | 360,893 | | | $ | 257,909 | | | $ | 246,374 | | | $ | 246,859 | | | $ | 216,147 | | | $ | 133,339 | |
Ratio of operating expenses | | | | | | | | | | | | | | | | | | | | | | | | |
to average net assets: | | | | | | | | | | | | | | | | | | | | | | | | |
| Before reimbursements | | | 1.06 | %+ | | | 1.07 | % | | | 1.11 | %+ | | | 1.15 | % | | | 1.22 | % | | | 1.40 | % |
| After reimbursements | | | 1.05 | %+ | | | 1.05 | % | | | 1.06 | %+ | | | 1.06 | % | | | 1.08 | % | | | 1.09 | % |
Ratio of net investment | | | | | | | | | | | | | | | | | | | | | | | | |
income (loss) to | | | | | | | | | | | | | | | | | | | | | | | | |
average net assets: | | | | | | | | | | | | | | | | | | | | | | | | |
| Before reimbursements | | | (0.58 | )%+ | | | (0.65 | %) | | | (0.74 | )%+ | | | (0.55 | )% | | | (0.91 | )% | | | (0.75 | )% |
| After reimbursements | | | (0.57 | )%+ | | | (0.63 | %) | | | (0.69 | )%+ | | | (0.46 | )% | | | (0.77 | )% | | | (0.44 | )% |
Portfolio turnover rate | | 72 | %^ | | | 157 | % | | 98 | %^ | | | 102 | % | | | 134 | % | | | 170 | % |
+ | Annualized |
^ | Not Annualized |
1 | The net investment loss per share was calculated using the average shares outstanding method. |
2 | Amount is less than $0.01. |
3 | The Fund’s redemption fee was eliminated on October 31, 2018. |
The accompanying notes are an integral part of these financial statements.
Hood River Small-Cap Growth Fund
For a capital share outstanding throughout each period
Retirement Shares
| | | Six Months | | | | | | | | | | | | March 3, | |
| | | Ended | | | Year | | | Year | | | Year | | | 2017 | |
| | | December 31, | | | Ended | | | Ended | | | Ended | | | through | |
| | | 2020 | | | June 30, | | | June 30, | | | June 30, | | | June 30, | |
| | | (Unaudited) | | | 2020 | | | 2019 | | | 2018 | | | 2017* |
|
| Net Asset Value – | | | | | | | | | | | | | | | | |
| Beginning of Period | | $ | 44.98 | | | $ | 41.78 | | | $ | 41.66 | | | $ | 38.19 | | | $ | 35.31 | |
| | | | | | | | | | | | | | | | | | | | | |
| Income from Investment Operations: | | | | | | | | | | | | | | | | | | | | |
Net investment loss1 | | | (0.13 | ) | | | (0.25 | ) | | | (0.25 | ) | | | (0.15 | ) | | | (0.11 | ) |
Net realized and unrealized | | | | | | | | | | | | | | | | | | | | |
gain (loss) on investments | | | 22.37 | | | | 3.45 | | | | 1.92 | | | | 6.17 | | | | 2.99 | |
| Total from investment operations | | | 22.24 | | | | 3.20 | | | | 1.67 | | | | 6.02 | | | | 2.88 | |
| | | | | | | | | | | | | | | | | | | | | |
| Less Distributions: | | | | | | | | | | | | | | | | | | | | |
Distributions from net realized gains | | | (3.96 | ) | | | — | | | | (1.55 | ) | | | (2.55 | ) | | | — | |
| Total distributions | | | (3.96 | ) | | | — | | | | (1.55 | ) | | | (2.55 | ) | | | — | |
| | | | | | | | | | | | | | | | | | | | | |
Redemption fees4: | | | — | | | | — | | | | — | 2 | | | — | 2 | | | — | 2 |
| | | | | | | | | | | | | | | | | | | | | |
| Net Asset Value – End of Period | | $ | 63.26 | | | $ | 44.98 | | | $ | 41.78 | | | $ | 41.66 | | | $ | 38.19 | |
| | | | | | | | | | | | | | | | | | | | | |
| Total Return | | 50.04 | %^ | | | 7.61 | % | | 4.59 | %^
| | | 16.70 | % | | 8.16 | %^ |
| | | | | | | | | | | | | | | | | | | | | |
| Ratios and Supplemental Data: | | | | | | | | | | | | | | | | | | | | |
Net assets, end of period (thousands) | | $ | 569,953 | | | $ | 335,863 | | | $ | 318,344 | | | $ | 196,019 | | | $ | 20,784 | |
Ratio of operating expenses | | | | | | | | | | | | | | | | | | | | |
to average net assets: | | | | | | | | | | | | | | | | | | | | |
| Before reimbursements | | | 1.00 | %+ | | | 1.01 | % | | | 1.04 | %+ | | | 1.08 | % | | | 1.17 | %+ |
| After reimbursements | | | 0.99 | %+ | | | 0.99 | % | | | 0.99 | %+ | | | 0.99 | % | | | 0.99 | %+ |
Ratio of net investment income (loss) | | | | | | | | | | | | | | | | | | | | |
to average net assets: | | | | | | | | | | | | | | | | | | | | |
| Before reimbursements | | | (0.50 | )%+ | | | (0.64 | )% | | | (0.67 | )%+ | | | (0.47 | )% | | | (1.11 | )%+ |
| After reimbursements | | | (0.49 | )%+ | | | (0.62 | )% | | | (0.62 | )%+ | | | (0.38 | )% | | | (0.93 | )%+ |
Portfolio turnover rate | | 72 | %^ | | | 157 | % | | 98 | %^ | | | 102 | % | | | 134 | %3 |
* | Operations commenced for the Retirement Shares on March 3, 2017. |
+ | Annualized |
^ | Not Annualized |
1 | The net investment loss per share was calculated using the average shares outstanding method. |
2 | Amount is less than $0.01. |
3 | Portfolio turnover was calculated on the basis of the Fund as a whole. The rate presented represents portfolio turnover for the entire fiscal year. |
4 | The Fund’s redemption fee was eliminated on October 31, 2018. |
The accompanying notes are an integral part of these financial statements.
Hood River Small-Cap Growth Fund
| NOTES TO FINANCIAL STATEMENTS |
| December 31, 2020 (Unaudited) |
NOTE 1 – ORGANIZATION
The Hood River Small-Cap Growth Fund (formerly, the Roxbury/Hood River Small-Cap Growth Fund) (the “Small-Cap Growth Fund” or the “Fund”) is a series of Manager Directed Portfolios (formerly, The Roxbury Funds) (the “Trust”). The Trust is registered under the Investment Company Act of 1940, as amended (the “1940 Act”), and was organized as a Delaware statutory trust on April 4, 2006. The Fund is an open-end investment management company and is a diversified series of the Trust. The investment objective of the Fund is long-term growth of capital. The Fund’s Institutional Shares commenced operations on January 2, 2003. The Fund’s Investor Shares commenced operations on July 7, 2015. The Fund’s Retirement Shares commenced operations on March 3, 2017. Each class of shares differs principally in its respective distribution or shareholder servicing expenses. Each class of shares has identical rights to earnings, assets and voting privileges, except for class-specific expenses and exclusive rights to vote on matters affecting only individual classes.
NOTE 2 – SIGNIFICANT ACCOUNTING POLICIES
The following is a summary of significant accounting policies consistently followed by the Fund. These policies are in conformity with U.S. generally accepted accounting principles (“GAAP”). The Fund is an investment company and accordingly follows the investment company accounting and reporting guidance of the Financial Accounting Standards Board (FASB) Accounting Standard Codification Topic 946 “Financial Services – Investment Companies” including FASB Accounting Standard Update ASU 2013-08.
| | A. | Security Valuation: All investments in securities are recorded at their estimated fair value, as described in Note 3.
|
| | B. | Federal Income Taxes: It is the Fund’s policy to continue to comply with the requirements of Subchapter M of the Internal Revenue Code applicable to regulated investment companies and to distribute substantially all of its taxable income to its shareholders. Therefore, no federal income or excise tax provisions are required.
|
| | | The Fund recognizes the tax benefits of uncertain tax positions only where the position is “more likely than not” to be sustained assuming examination by tax authorities. Management has analyzed the Fund’s tax positions, and has concluded that no liability for unrecognized tax benefits should be recorded related to uncertain tax positions to be taken or expected to be taken on a tax return. The tax returns for the Fund for the prior three fiscal years are open for examination. The Fund identifies its major tax jurisdictions as U.S. Federal and the state of Delaware.
|
| | C. | Securities Transactions, Income and Distributions: Securities transactions are accounted for on the trade date. Realized gains and losses on securities sold are determined on the basis of identified cost. Interest income is recorded on an |
Hood River Small-Cap Growth Fund
| NOTES TO FINANCIAL STATEMENTS (Continued) |
| December 31, 2020 (Unaudited) |
| | | accrual basis. Dividend income and distributions to shareholders are recorded on the ex-dividend date. Withholding taxes on foreign dividends have been provided for in accordance with the Fund’s understanding of the applicable country’s tax rules and rates.
|
| | | The Fund distributes substantially all of its net investment income, if any, and net realized capital gains, if any, annually. Distributions from net realized gains for book purposes may include short-term capital gains. All short-term capital gains are included in ordinary income for tax purposes. The amount of dividends and distributions to shareholders from net investment income and net realized capital gains is determined in accordance with federal income tax regulations, which differ from GAAP. To the extent these book/tax differences are permanent, such amounts are reclassified within the capital accounts based on their federal tax treatment.
|
| | | Investment income, expenses (other than those specific to the class of shares), and realized and unrealized gains and losses on investments are allocated to the separate classes of the Fund’s shares based upon their relative net assets on the date income is earned or expensed and realized and unrealized gains and losses are incurred.
|
| | | The Fund is charged for those expenses that are directly attributable to it, such as investment advisory, custody and transfer agent fees. Expenses that are not attributable to the Fund are typically allocated among the funds in the Trust proportionately based on allocation methods approved by the Board of Trustees (the “Board”). Common expenses of the Trust are typically allocated among the funds in the Trust based on a fund’s respective net assets, or by other equitable means.
|
| | D. | Use of Estimates: The preparation of financial statements in conformity with GAAP requires management to make estimates and assumptions that affect the reported amounts of assets and liabilities at the date of the financial statements and the reported amounts of increases and decreases in net assets during the reporting period. Actual results could differ from those estimates.
|
| | E. | Reclassification of Capital Accounts: GAAP requires that certain components of net assets relating to permanent differences be reclassified between financial and tax reporting. These reclassifications have no effect on net assets or net asset value per share.
|
| | F. | Events Subsequent to the Fiscal Period End: In preparing the financial statements as of December 31, 2020, management considered the impact of subsequent events for potential recognition or disclosure in the financial statements and had concluded that no additional disclosures are necessary. |
NOTE 3 – SECURITIES VALUATION
The Fund has adopted authoritative fair value accounting standards which establish an authoritative definition of fair value and set out a hierarchy for measuring fair value. These standards require additional disclosures about the various inputs and valuation
Hood River Small-Cap Growth Fund
| NOTES TO FINANCIAL STATEMENTS (Continued) |
| December 31, 2020 (Unaudited) |
techniques used to develop the measurements of fair value, a discussion of changes in valuation techniques and related inputs during the period, and expanded disclosure of valuation levels for major security types. These inputs are summarized in the three broad levels listed below:
| | Level 1 – | Unadjusted quoted prices in active markets for identical assets or liabilities that the Fund has the ability to access.
|
| | Level 2 – | Observable inputs other than quoted prices included in Level 1 that are observable for the asset or liability, either directly or indirectly. These inputs may include quoted prices for the identical instrument on an inactive market, prices for similar instruments, interest rates, prepayment speeds, credit risk, yield curves, default rates and similar data.
|
| | Level 3 – | Unobservable inputs for the asset or liability, to the extent relevant observable inputs are not available, representing the Fund’s own assumptions about the assumptions a market participant would use in valuing the asset or liability, and would be based on the best information available. |
Following is a description of the valuation techniques applied to the Fund’s major categories of assets and liabilities measured at fair value on a recurring basis.
Equity Securities: Equity securities, including common stocks, preferred stocks, foreign-issued common stocks, exchange-traded funds, closed-end mutual funds and real estate investment trusts (REITs), that are primarily traded on a national securities exchange shall be valued at the last sale price on the exchange on which they are primarily traded on the day of valuation or, if there has been no sale on such day, at the mean between the bid and asked prices. Securities primarily traded in the NASDAQ Global Market System for which market quotations are readily available shall be valued using the NASDAQ Official Closing Price (“NOCP”). If the NOCP is not available, such securities shall be valued at the last sale price on the day of valuation, or if there has been no sale on such day, at the mean between the bid and asked prices. Over-the-counter securities that are not traded on a listed exchange are valued at the last sale price in the over-the-counter market. Over-the-counter securities which are not traded in the NASDAQ Global Market System shall be valued at the mean between the bid and asked prices. To the extent these securities are actively traded and valuation adjustments are not applied, they are categorized in Level 1 of the fair value hierarchy.
Registered Investment Companies: Investments in registered investment companies (e.g., mutual funds) are generally priced at the ending NAV provided by the applicable registered investment company’s service agent and will be classified in Level 1 of the fair value hierarchy.
Short-Term Debt Securities: Debt securities, including short-term debt instruments having a maturity of less than 60 days, are valued at the evaluated mean price supplied by an approved pricing service. Pricing services may use various valuation methodologies including matrix pricing and other analytical pricing models as well as market
Hood River Small-Cap Growth Fund
| NOTES TO FINANCIAL STATEMENTS (Continued) |
| December 31, 2020 (Unaudited) |
transactions and dealer quotations. In the absence of prices from a pricing service, the securities will be priced in accordance with the procedures adopted by the Board. Short-term securities are generally classified in Level 1 or Level 2 of the fair market hierarchy depending on the inputs used and market activity levels for specific securities.
The Board has delegated day-to-day valuation issues to a Valuation Committee of the Trust which, as of December 31, 2020, was comprised of officers of the Trust. The function of the Valuation Committee is to value securities where current and reliable market quotations are not readily available, or the closing price does not represent fair value, by following procedures approved by the Board. These procedures consider many factors, including the type of security, size of holding, trading volume and news events. All actions taken by the Valuation Committee are subsequently reviewed and ratified by the Board.
Depending on the relative significance of the valuation inputs, fair valued securities may be classified in either Level 2 or Level 3 of the fair value hierarchy.
The inputs or methodology used for valuing securities are not an indication of the risk associated with investing in those securities. The following is a summary of the fair valuation hierarchy of the Small-Cap Growth Fund’s securities as of December 31, 2020:
| | | Level 1 | | | Level 2 | | | Level 3 | | | Total | |
| Common Stocks | | | | | | | | | | | | |
| Arts, Entertainment, | | | | | | | | | | | | |
| & Recreation | | $ | 10,520,233 | | | $ | — | | | $ | — | | | $ | 10,520,233 | |
| Consumer Discretionary | | | 148,365,701 | | | | — | | | | — | | | | 148,365,701 | |
| Consumer Staples | | | 36,656,780 | | | | — | | | | — | | | | 36,656,780 | |
| Financials | | | 64,476,153 | | | | — | | | | — | | | | 64,476,153 | |
| Health Care | | | 228,930,434 | | | | — | | | | — | | | | 228,930,434 | |
| Industrials | | | 186,154,787 | | | | — | | | | — | | | | 186,154,787 | |
| Information Technology | | | 195,167,295 | | | | — | | | | — | | | | 195,167,295 | |
| Materials | | | 8,166,682 | | | | — | | | | — | | | | 8,166,682 | |
| Utilities | | | 16,554,135 | | | | — | | | | — | | | | 16,554,135 | |
| Total Common Stocks | | | 894,992,200 | | | | — | | | | — | | | | 894,992,200 | |
| REITs | | | 29,705,665 | | | | — | | | | — | | | | 29,705,665 | |
| Short-Term Investments | | | 15,539,994 | | | | — | | | | — | | | | 15,539,994 | |
| Investments Purchased | | | | | | | | | | | | | | | | |
| with Cash Proceeds | | | | | | | | | | | | | | | | |
| from Securities Lending | | | 299,852,833 | | | | — | | | | — | | | | 299,852,833 | |
| Total Investments | | | | | | | | | | | | | | | | |
| in Securities | | $ | 1,240,090,692 | | | $ | — | | | $ | — | | | $ | 1,240,090,692 | |
Hood River Small-Cap Growth Fund
| NOTES TO FINANCIAL STATEMENTS (Continued) |
| December 31, 2020 (Unaudited) |
NOTE 4 – INVESTMENT ADVISORY FEE AND OTHER TRANSACTIONS WITH AFFILIATES
For the six months ended December 31, 2020, Hood River Capital Management LLC, (the “Advisor”) provided the Fund with investment management services under an Investment Advisory Agreement. The Advisor furnishes all investment advice, office space, and facilities, and provides most of the personnel needed by the Fund. As compensation for its services, the Advisor is entitled to a monthly fee at an annual rate of 0.90% of the average daily net assets of the Fund. For the six months ended December 31, 2020, the Small-Cap Growth Fund incurred $3,215,443 in advisory fees. Advisory fees payable at December 31, 2020 for the Small-Cap Growth Fund were $666,819.
The Fund is responsible for its own operating expenses. The Advisor has contractually agreed to waive a portion of its fees and reimburse certain expenses for the Fund to ensure that the total annual fund operating expenses [excluding front-end or contingent deferred loads, Rule 12b-1 plan fees, shareholder servicing plan fees, taxes, leverage, interest, brokerage commissions and other transactional expenses, expenses in connection with a merger or reorganization, dividends or interest on short positions, acquired fund fees and expenses or extraordinary expenses (collectively, “Excludable Expenses”)] do not exceed the following amounts of the average daily net assets for each class of shares:
| | Investor Shares | 0.99% | |
| | Institutional Shares | 0.99% | |
| | Retirement Shares | 0.99% | |
For the six months ended December 31, 2020, the Advisor reduced its fees in the amount of $40,776 for the Small-Cap Growth Fund. The waivers and reimbursements will remain in effect through October 31, 2022 unless terminated sooner by mutual agreement of the Board and the Advisor.
U.S. Bancorp Fund Services, LLC, doing business as U.S. Bank Global Fund Services, LLC (“Fund Services” or the “Administrator”) acts as the Fund’s Administrator under an Administration Agreement. The Administrator prepares various federal and state regulatory filings, reports and returns for the Fund; prepares reports and materials to be supplied to the Trustees; monitors the activities of the Fund’s custodian, transfer agent and accountants; coordinates the preparation and payment of the Fund’s expenses and reviews the Fund’s expense accruals. Fund Services also serves as the fund accountant and transfer agent to the Fund. Vigilant Compliance, LLC serves as the Chief Compliance Officer to the Fund. U.S. Bank N.A., an affiliate of Fund Services, serves as the Fund’s custodian. For the six months ended December 31, 2020, the Fund incurred the following expenses for administration, fund accounting, transfer agency and custody fees:
| | Administration & fund accounting | $161,705 | |
| | Custody | $ 38,380 | |
| | Transfer agency(a) | $ 34,960 | |
| | | |
| | (a) Does not include out-of-pocket expenses. | |
Hood River Small-Cap Growth Fund
| NOTES TO FINANCIAL STATEMENTS (Continued) |
| December 31, 2020 (Unaudited) |
At December 31, 2020, the Fund had payables due to Fund Services for administration, fund accounting and transfer agency fees and to U.S. Bank N.A. for custody fees in the following amounts:
| | Administration & fund accounting | $86,636 | |
| | Custody | $15,191 | |
| | Transfer agency(a) | $13,682 | |
| | | |
| | (a) Does not include out-of-pocket expenses. | |
Quasar Distributors, LLC (the “Distributor”) acts as the Fund’s principal underwriter in a continuous public offering of the Fund’s shares.
Certain officers of the Fund are employees of the Administrator and are not paid any fees by the Fund for serving in such capacities.
NOTE 5 – DISTRIBUTION AGREEMENT AND PLAN
The Fund has adopted a Distribution Plan pursuant to Rule 12b-1 (the “Plan”). The Plan permits the Fund to pay for distribution and related expenses at an annual rate of up to 0.25% of the average daily net assets of the Fund’s Investor Shares. The expenses covered by the Plan may include costs in connection with the promotion and distribution of shares and the provision of personal services to shareholders, including, but not necessarily limited to, advertising, compensation to underwriters, dealers and selling personnel, the printing and mailing of prospectuses to other than current Fund shareholders, and the printing and mailing of sales literature. Payments made pursuant to the Plan will represent compensation for distribution and service activities, not reimbursements for specific expenses incurred. For the six months ended December 31, 2020, the Small-Cap Growth Fund incurred distribution expenses on its Investor Shares of $9,300.
NOTE 6 – SHAREHOLDER SERVICING FEE
The Fund has adopted a shareholder servicing plan (the “Plan”) on behalf of the Investor and Institutional Share classes. Under the Plan, the Investor and Institutional Share Classes are authorized to pay an annual shareholder servicing fee of up to 0.10% of each class’s average daily net assets. This fee is used to finance certain activities related to servicing and maintaining shareholder accounts. Payments made under the Plan may not be used to pay for any services in connection with the distribution and sale of the Investor and Institutional Shares.
Payments to the Advisor under the Plan may reimburse the Advisor for payments it makes to selected brokers, dealers and administrators which have entered into service agreements with the Advisor for services provided to Investor and Institutional Class shareholders of the Fund. The services provided by such intermediaries are primarily designed to assist Investor and Institutional Class shareholders of the Fund and include the furnishing of office space and equipment, telephone facilities, personnel, and assistance to the Fund in servicing such shareholders. Services provided by such intermediaries also include the provision of support services to the Fund and include
Hood River Small-Cap Growth Fund
| NOTES TO FINANCIAL STATEMENTS (Continued) |
| December 31, 2020 (Unaudited) |
establishing and maintaining shareholders’ accounts and record processing, purchase and redemption transactions, answering routine client inquiries regarding the Fund, and providing such other personal services to shareholders as the Fund may reasonably request. For the six months ended December 31, 2020, the Fund incurred, under the Agreement, shareholder servicing fees as follows:
| | Investor Shares | $ 4,923 | |
| | Institutional Shares | $87,755 | |
NOTE 7 – SECURITIES TRANSACTIONS
For the six months ended December 31, 2020, the cost of purchases and the proceeds from sales of securities, excluding short-term securities, were as follows:
| | | Purchases | Sales |
| | Small-Cap Growth Fund | $532,738,702 | $507,263,551 |
There were no purchases or sales of long-term U.S. Government securities.
NOTE 8 – INCOME TAXES AND DISTRIBUTIONS TO SHAREHOLDERS
As of June 30, 2020, the Fund’s most recent fiscal year end, the components of accumulated earnings/(losses) on a tax basis were as follows:
| | | | Small-Cap | |
| | | | Growth Fund | |
| | Cost of investments(a) | | $ | 459,085,309 | |
| | Gross unrealized appreciation | | | 164,572,758 | |
| | Gross unrealized depreciation | | | (19,123,578 | ) |
| | Net unrealized appreciation | | | 145,449,180 | |
| | Undistributed ordinary income | | | — | |
| | Undistributed long-term capital gain | | | — | |
| | Total distributable earnings | | | — | |
| | Other accumulated gains/(losses) | | | (7,849,093 | ) |
| | Total accumulated earnings/(losses) | | $ | 137,600,087 | |
| | (a) | The difference between the book ba.sis and tax basis net unrealized appreciation and cost is attributable primarily to wash sales. |
As of June 30, 2020, the Small-Cap Growth Fund had $6,303,758 of short-term tax basis capital losses to offset future capital gains.
Hood River Small-Cap Growth Fund
| NOTES TO FINANCIAL STATEMENTS (Continued) |
| December 31, 2020 (Unaudited) |
The tax character of distributions paid during 2020 was as follows:
| | | | Six Months Ended | | | | |
| | | | December 31, 2020 | | | Year Ended | |
| | | | (Unaudited) | | | June 30, 2020 | |
| | Small-Cap Growth Fund | | | | | | |
| | Ordinary income | | $ | 42,535,278 | | | $ | — | |
| | Long-term capital gains | | | 13,289,500 | | | | — | |
| | | | $ | 55,824,778 | | | $ | — | |
At June 30, 2020, the Fund deferred, on a tax basis, post-October losses of:
| | Capital | Ordinary Late Year Loss | |
| | $ — | $(1,545,867) | |
NOTE 9 – SECURITIES LENDING
The Fund participates in securities lending arrangements whereby it lends certain of its portfolio securities to brokers, dealers and financial institutions (not with individuals) in order to receive additional income and increase the rate of return of its portfolio. U.S. Bank, N.A. serves as the Fund’s securities lending agent.
U.S. Bank, N.A. oversees the securities lending process, which includes the screening, selection and ongoing review of borrowers, monitoring the availability of securities, negotiating rebates, daily marking to market of loans, monitoring and maintaining cash collateral levels, processing securities movements and reinvesting cash collateral as directed by the Adviser.
The Fund may lend securities pursuant to agreements that require the loans to be secured by collateral consisting of cash, securities of the U.S. Government or it agencies, or any combination of cash and such securities. At that time of loans, the collateral value should at least be equal to 102% of domestic securities and 105% of foreign securities. The value of loaned securities will then be marked-to-market daily and the collateral will be continuously secured by collateral equal to 100% of the market value of the loaned securities. Such loans will not be made if, as a result, the aggregate amount of all outstanding securities loans for the Fund exceeds one-third of the value of the Fund’s total assets taken at fair market value. The Fund will earn interest on the investment of the cash collateral in U.S. Government securities, short-term money market instruments or such other approved vehicle. However, the Fund will normally pay lending fees to such broker-dealers and related expenses from the interest earned on invested collateral. There may be risks of delay in receiving additional collateral or risks of delay in recovery of the securities and even loss of rights in the collateral should the borrower of the securities fail financially. However, loans are made only to borrowers deemed by the adviser to be of good standing and when, in the judgment of the adviser, the consideration that can be earned currently from such securities loans justifies the attendant risk. Either party, upon reasonable notice to the other party, may terminate the loan.
Hood River Small-Cap Growth Fund
| NOTES TO FINANCIAL STATEMENTS (Continued) |
| December 31, 2020 (Unaudited) |
As of December 31, 2020, the Fund had loaned securities that were collateralized by cash. The cash collateral received was invested in securities as listed in the Fund’s Schedule of Investments.
The following table presents the securities out on loan for the Fund, and the collateral delivered related to those securities, as of the end of the reporting period.
Securities Lending Transactions
| | | | Investments | | |
| | | | Purchased | Collateral | |
| | | | with Cash | Pledged | |
| | Overnight and | Asset Class | Proceeds from | (From) | Net |
| Continuous | out on Loan | Securities Lending | Counterparty^ | Exposure |
| | Hood River Small- | | | | |
| | Cap Growth Fund | Common Stock | $299,852,833 | $299,852,833 | $ — |
The Fund paid $28,506 in securities lending fees to U.S. Bank, N.A. during the period.
| | ^ | As of the end of the reporting period, the value of the collateral pledged from the counterparty exceeded the value of the securities out on loan. Refer to the Fund’s Schedule of Investments for details on the securities out on loan. |
NOTE 10 – PRINCIPAL RISKS
The following is a list of certain risks that may apply to your investment in the Fund. Further information about investment risks is available in the Fund’s Statement of Additional Information.
General Market Risk; Recent Market Events: The value of the Fund’s shares will fluctuate based on the performance of the Fund’s investments and other factors affecting the securities markets generally. Certain investments selected for the Fund’s portfolio may be worth less than the price originally paid for them, or less than they were worth at an earlier time. The value of the Fund’s investments may go up or down, sometimes dramatically and unpredictably, based on current market conditions, such as real or perceived adverse political or economic conditions, inflation, changes in interest rates, lack of liquidity in the fixed income markets or adverse investor sentiment.
U.S. and international markets have experienced volatility in recent months and years due to a number of economic, political and global macro factors, including the impact of the coronavirus (COVID-19) global pandemic, which has resulted in a public health crisis, business interruptions, growth concerns in the U.S. and overseas, layoffs, rising unemployment claims, changed travel and social behaviors and reduced consumer spending. The effects of COVID-19 may lead to a substantial economic downturn or recession in the U.S. and global economies, the recovery from which is uncertain and may last for an extended period of time.
Small-Cap Company Risk: Companies in which the Fund invests may be more vulnerable than larger companies to adverse business or economic developments. Small-cap companies may also have limited product lines, markets, or financial resources,
Hood River Small-Cap Growth Fund
| NOTES TO FINANCIAL STATEMENTS (Continued) |
| December 31, 2020 (Unaudited) |
may be dependent on relatively small or inexperienced management groups, and may operate in industries characterized by rapid technological obsolescence. Securities of such companies may be less liquid, more volatile and more difficult to value than securities of larger companies and therefore may involve greater risk than investing in large companies.
Growth-Style Investing Risk: An investment in a growth-oriented fund may be more volatile than the rest of the U.S. market as a whole. If the investment adviser’s assessment of a company’s prospects for earnings growth or how other investors will value the company’s earnings growth is incorrect, the stock may fail to reach the value that the adviser has placed on it. Growth stock prices tend to fluctuate more dramatically than the overall stock market.
Foreign Security Risk: Foreign investments involve risks relating to political, economic, regulatory, or social instability, military action or unrest, or diplomatic developments and may be affected by actions of foreign governments adverse to the interest of U.S. investors.
IPO Risk: The Fund may purchase securities of companies engaged in initial public offerings (“IPOs”). The price of securities purchased in IPOs can be very volatile. The Fund’s investments in IPO shares may include the securities of “unseasoned” companies (companies with less than three years of continuous operations), which present risks considerably greater than common stocks of more established companies. These companies may be involved in new and evolving businesses and may be vulnerable to competition and changes in technology, markets and economic conditions. They may be more dependent on key managers and third parties and may have limited product lines. The effect of IPO investments on a Fund’s performance depends on a variety of factors, including the number of IPOs the Fund invests in relative to the size of the Fund, and whether and to what extent a security purchased in an IPO appreciates or depreciates in value. When the Fund’s asset base is small, a significant portion of the Fund’s performance could be attributable to investments in IPOs because such investments would have a magnified impact on the Fund. As the Fund’s asset grow, the effect of the Fund’s investments in IPOs on the Fund’s performance probably will decline, which could reduce the Fund’s performance.
Liquidity Risk: Certain securities may be difficult or impossible to sell at the time and the price that the seller would like. While the markets in securities of small companies have grown rapidly in recent years, such securities may trade less frequently and in smaller volumes than more widely held securities. The values of these securities may fluctuate more sharply than those of other securities, and the Fund may experience some difficulty in establishing or closing out positions in these securities at prevailing market prices. There may be less publicly available information about the issuers of these securities or less market interest in such securities than in the case of larger companies, and it may take a longer period of time for the prices of such securities to reflect the full value of their issuers’ underlying earnings potential or assets.
Hood River Small-Cap Growth Fund
| NOTES TO FINANCIAL STATEMENTS (Continued) |
| December 31, 2020 (Unaudited) |
Mutual Fund and ETF Trading Risk: The Fund may invest in other mutual funds that are either open-end or closed-end investment companies as well as Exchange Traded Funds (“ETFs”). ETFs are investment companies that are bought and sold on a national securities exchange. Unlike mutual funds, ETFs do not necessarily trade at the net asset values of their underlying securities, which means an ETF could potentially trade above or below the value of the underlying portfolios. Additionally, because ETFs trade like stocks on exchanges, they are subject to trading and commission costs unlike mutual funds. Also, both mutual funds and ETFs have management fees that are part of its costs, and the Fund will indirectly bear their proportionate share of the costs.
NOTE 11 – GUARANTEES AND INDEMNIFICATIONS
In the normal course of business, the Fund enters into contracts that contain a variety of representations and warranties and which provide general indemnifications. The Fund’s maximum exposure under these arrangements is unknown, as this would involve future claims that may be made against the Fund that have not yet occurred. However, based on experience, the Fund expects the risk of loss to be remote.
NOTE 12 – CONTROL OWNERSHIP
The beneficial ownership, either directly or indirectly, of more than 25% of the voting securities of a fund creates a presumption of control of the fund, under Section 2(a)(9) of the 1940 Act. As of December 31, 2020, National Financial Services LLC held 48% of the outstanding shares of the Fund. The Fund has no knowledge as to whether all or any portion of the shares owned of record by National Financial Services LLC are also beneficially owned.
Hood River Small-Cap Growth Fund
| EXPENSE EXAMPLE |
| December 31, 2020 (Unaudited) |
As a shareholder of the Fund, you incur two types of costs: (1) transaction costs including sales charges (loads) and redemption fees, if applicable; and (2) ongoing costs, including management fees; distribution and/or service (12b-1 fees); and other Fund expenses. This Example is intended to help you understand your ongoing costs (in dollars) of investing in the Fund and to compare these costs with the ongoing costs of investing in other mutual funds.
The Example is based on an investment of $1,000 invested at the beginning of the period indicated and held for the entire period from July 1, 2020 to December 31, 2020 for the Investor, Institutional, and Retirement Shares.
Actual Expenses
The information in the table under the heading “Actual” provides information about actual account values and actual expenses. You may use the information in these columns together with the amount you invested, to estimate the expenses that you paid over the period. Simply divide your account value by $1,000 (for example, an $8,600 account value divided by $1,000 = 8.6), then multiply the result by the number in the row entitled “Expenses Paid During Period” to estimate the expenses you paid on your account during this period. There are some account fees that are charged to certain types of accounts, such as Individual Retirement Accounts (generally, a $15 fee is charged to the account annually) that would increase the amount of expenses paid on your account. The example below does not include portfolio trading commissions and related expenses and other extraordinary expenses as determined under generally accepted accounting principles.
Hypothetical Example for Comparison Purposes
The information in the table under the heading “Hypothetical (5% return before expenses)” provides information about hypothetical account values and hypothetical expenses based on the Fund’s actual expense ratio and assumed rate of return of 5% per year before expenses, which is not the Fund’s actual return. The hypothetical account values and expenses may not be used to estimate the actual ending account balance or expenses you paid for the period. You may use this information to compare the ongoing costs of investing in the Fund and other funds. To do so, compare this 5% hypothetical example with the 5% hypothetical examples that appear in the shareholder reports of the other funds. As noted above, there are some account fees that are charged to certain types of accounts that would increase the amount of expense paid on your account.
Please note that the expenses shown in the table are meant to highlight your ongoing costs only and do not reflect any transaction costs, such as sales charges (loads), redemption fees, or exchange fees. Therefore, the information under the heading “Hypothetical (5% return before expenses)” is useful in comparing ongoing costs only, and will not help you determine the relative total costs of owning different funds. In addition, if these transactional costs were included, your costs would have been higher.
Hood River Small-Cap Growth Fund
| EXPENSE EXAMPLE (Continued) |
| December 31, 2020 (Unaudited) |
| | Beginning | Ending | Expenses Paid |
| | Account Value | Account Value | During Period(1) |
| | 7/1/2020 | 12/31/2020 | 7/1/2020 – 12/31/2020 |
| Actual | | | |
Investor Shares | $1,000.00 | $1,498.30 | $7.87 |
Institutional Shares | $1,000.00 | $1,500.10 | $6.59 |
Retirement Shares | $1,000.00 | $1,500.40 | $6.24 |
| Hypothetical (5% return | | | |
| before expenses) | | | |
Investor Shares | $1,000.00 | $1,018.91 | $6.36 |
Institutional Shares | $1,000.00 | $1,019.93 | $5.33 |
Retirement Shares | $1,000.00 | $1,020.21 | $5.04 |
(1) | Expenses are equal to the Investor, Institutional, and Retirement Shares’ annualized expense ratios of 1.25%, 1.05%, and 0.99%, respectively, multiplied by the average account value over the period, multiplied by 184/365 (to reflect the period). |
Hood River Small-Cap Growth Fund
| STATEMENT REGARDING LIQUIDITY RISK MANAGEMENT PROGRAM |
| (Unaudited) |
In accordance with Rule 22e-4 under the Investment Company Act of 1940, as amended, the Fund, a series of Manager Directed Portfolios (the “Trust”), has adopted and implemented a liquidity risk management program tailored specifically to the Fund (the “Program”). The Program seeks to promote effective liquidity risk management for the Fund and to protect Fund shareholders from dilution of their interests. The Board has designated the Fund’s investment adviser to serve as the administrator of the Program (the “Program Administrator”). Personnel of the Fund’s investment adviser conduct the day-to-day operation of the Program pursuant to policies and procedures administered by the Program Administrator. The Program Administrator is required to provide a written annual report to the Board and the chief compliance officer of the Trust regarding the adequacy and effectiveness of the Program and any material changes to the Program.
Under the Program, the Program Administrator manages the Fund’s liquidity risk, which is the risk that the Fund could not meet shareholder redemption requests without significant dilution of remaining shareholders’ interests in the Fund. The Program assesses liquidity risk under both normal and reasonably foreseeable stressed market conditions. This risk is managed by monitoring the degree of liquidity of the Fund’s investments, limiting the amount of the Fund’s illiquid investments, and utilizing various risk management tools and facilities available to the Fund for meeting shareholder redemptions, among other means. The Program Administrator’s process of determining the degree of liquidity of the Fund’s investments is supported by one or more third-party liquidity assessment vendors.
On November 10, 2020, the Board reviewed the Program Administrator’s assessment of the operation and effectiveness of the Program for the period June 1, 2019 through June 30, 2020 (the “Report”) and a memorandum regarding the Report prepared by the Trust’s chief compliance officer. The Report noted that the Fund’s portfolio is expected to continue to primarily hold highly liquid investments and the determination that the Fund be designated as a “primarily highly liquid fund” (as defined in Rule 22e-4) remains appropriate. The Fund can therefore continue to rely on the exclusion in Rule 22e-4 from the requirements to determine and review a highly liquid investment minimum for the Fund and to adopt policies and procedures for responding to a highly liquid investment minimum shortfall. The Report noted that there were no breaches of the Fund’s restriction on holding illiquid investments exceeding 15% of its net assets during the review period. The Report confirmed that the Fund’s investment strategy was appropriate for an open-end management investment company. The Report also indicated that no material changes had been made to the Program during the review period.
The Program Administrator determined that the Fund is reasonably likely to be able to meet redemption requests without adversely affecting non-redeeming Fund shareholders through significant dilution. The Program Administrator concluded that the during the review period, the Program was adequately designed and effectively operating to monitor the liquidity risk to the Fund, taking into account the size of the Fund, the type of business conducted, and other relevant factors.
Hood River Small-Cap Growth Fund
| NOTICE TO SHAREHOLDERS |
| at December 31, 2020 (Unaudited) |
How to Obtain a Copy of the Fund’s Proxy Voting Policies
A description of the policies and procedures that the Fund uses to determine how to vote proxies relating to portfolio securities is available without charge, upon request, by calling 1-800-497-2960 or on the U.S. Securities and Exchange Commission’s (“SEC”) website at http://www.sec.gov.
How to Obtain a Copy of the Fund’s Proxy Voting Records for the most recent 12-Month Period Ended June 30
Information regarding how the Fund voted proxies relating to portfolio securities during the most recent 12-month period ended June 30 is available no later than August 31 without charge, upon request, by 1-800-497-2960. Furthermore, you can obtain the Fund’s proxy voting records on the SEC’s website at http://www.sec.gov.
Quarterly Filings on Form N-PORT
The Fund files its complete schedule of portfolio holdings with the SEC for the first and third quarters of each fiscal year on Part F of Form N-PORT. The Fund’s Part F of Form N-PORT is available on the SEC’s website at http://www.sec.gov. Information included in the Fund’s Part F of Form N-PORT is also available, upon request, by calling 1-800-497-2960.
Householding
In an effort to decrease costs, the Fund intends to reduce the number of duplicate prospectuses and annual and semi-annual reports you receive by sending only one copy of each to those addresses shared by two or more accounts and to shareholders the Transfer Agent reasonably believes are from the same family or household. Once implemented, if you would like to discontinue householding for your accounts, please call toll-free at 1-800-497-2960 to request individual copies of these documents. Once the Transfer Agent receives notice to stop householding, the Transfer Agent will begin sending individual copies thirty days after receiving your request. This policy does not apply to account statements.
Hood River Small-Cap Growth Fund
| NOTICE OF PRIVACY POLICY & PRACTICES |
| |
Protecting the privacy of Fund shareholders is important to us. The following is a description of the practices and policies through which we protect the privacy and security of your non-public personal information.
What Information We Collect
We collect and maintain information about you so that we can open and maintain your account in the Fund and provide various services to you. We collect non-public personal information about you from the following sources:
| | • | information we receive about you on applications or other forms; |
| | • | information you give us orally; and
|
| | • | information about your transactions with us or others.
|
The types of non-public personal information we collect and share can include:
| | • | social security number;
|
| | • | account balances;
|
| | • | account transactions;
|
| | • | transaction history;
|
| | • | wire transfer instructions; and
|
| | • | checking account information. |
What Information We Disclose
We do not disclose any non-public personal information about shareholders or former shareholders of the Fund without the shareholder’s authorization, except as permitted by law or in response to inquiries from governmental authorities. We may share information with affiliated parties and unaffiliated third parties with whom we have contracts for servicing the Fund. We will provide unaffiliated third parties with only the information necessary to carry out their assigned responsibility.
How We Protect Your Information
All shareholder records will be disposed of in accordance with applicable law. We maintain physical, electronic and procedural safeguards to protect your non-public personal information and require third parties to treat your non-public personal information with the same high degree of confidentiality.
In the event that you hold shares of the Fund through a financial intermediary, including, but not limited to, a broker-dealer, bank or trust company, the privacy policy of your financial intermediary would govern how your non-public personal information would be shared with unaffiliated third parties.
If you have any questions or concerns regarding this notice or our Privacy Policy, please contact us at 800-497-2960.
(This Page Intentionally Left Blank.)
Investment Advisor
Hood River Capital Management LLC
1 SW Columbia Street, Suite 630
Portland, OR 97204
Distributor
Quasar Distributors, LLC
111 East Kilbourn Avenue, Suite 2200
Milwaukee, WI 53202
Transfer Agent
U.S. Bancorp Fund Services, LLC
615 East Michigan Street
Milwaukee, WI 53202
(800) 497-2960
Custodian
U.S. Bank National Association
Custody Operations
1555 North River Center Drive, Suite 302
Milwaukee, WI 53212
Independent Registered Public Accounting Firm
BBD, LLP
1835 Market Street, 3rd Floor
Philadelphia, PA 19103
Legal Counsel
Godfrey & Kahn S.C.
833 East Michigan Street, Suite 1800
Milwaukee, WI 53202
This report is intended for shareholders of the Fund and may not be used as sales literature unless preceded or accompanied by a current prospectus.
Past performance results shown in this report should not be considered a representation of future performance. Share price and returns will fluctuate so that shares, when redeemed, may be worth more or less than their original cost. Statements and other information herein are dated and are subject to change.
Item 2. Code of Ethics.
Not applicable for semi-annual reports.
Item 3. Audit Committee Financial Experts.
Not applicable for semi-annual reports.
Item 4. Principal Accountant Fees and Services.
Not applicable for semi-annual reports.
Item 5. Audit Committee of Listed Registrants.
(a) Not applicable to registrants who are not listed issuers (as defined in Rule 10A-3 under the Securities Exchange Act of 1934).
(b) Not Applicable.
Item 6. Investments.
(a) | Schedule of Investments is included as part of the report to shareholders filed under Item 1 of this Form. |
Item 7. Disclosure of Proxy Voting Policies and Procedures for Closed-End Management Investment Companies.
Not applicable to open-end investment companies.
Item 8. Portfolio Managers of Closed-End Management Investment Companies.
Not applicable to open-end investment companies.
Item 9. Purchases of Equity Securities by Closed‑End Management Investment Company and Affiliated Purchasers.
Not applicable to open-end investment companies.
Item 10. Submission of Matters to a Vote of Security Holders.
There have been no material changes to the procedures by which shareholders may recommend nominees to the Registrant’s Board of Trustees.
Item 11. Controls and Procedures.
(a) | The Registrant’s President/Principal Executive Officer and Treasurer/Principal Financial Officer have reviewed the Registrant's disclosure controls and procedures (as defined in Rule 30a-3(c) under the Investment Company Act of 1940, as amended, (the “Act”)) as of a date within 90 days of the filing of this report, as required by Rule 30a-3(b) under the Act and Rules 13a-15(b) or 15d‑15(b) under the Securities Exchange Act of 1934. Based on their review, such officers have concluded that the disclosure controls and procedures are effective in ensuring that information required to be disclosed in this report is appropriately recorded, processed, summarized and reported and made known to them by others within the Registrant and by the Registrant’s service provider. |
(b) | There were no changes in the Registrant's internal control over financial reporting (as defined in Rule 30a-3(d) under the Act) that occurred during the second fiscal quarter of the period covered by this report that has materially affected, or is reasonably likely to materially affect, the Registrant's internal control over financial reporting. |
Item 12. Disclosure of Securities Lending Activities for Closed-End Management Investment Companies.
Not applicable to open-end investment companies.
Item 13. Exhibits.
| (a) | (1) Any code of ethics or amendment thereto, that is subject to the disclosure required by Item 2, to the extent that the registrant intends to satisfy Item 2 requirements through filing an exhibit. Not applicable. |
(3) Any written solicitation to purchase securities under Rule 23c‑1 under the Act sent or given during the period covered by the report by or on behalf of the registrant to 10 or more persons. Not applicable to open-end investment companies.
(4) Change in the registrant’s independent public accountant. There was no change in the registrant’s independent public accountant for the period covered by this report.
SIGNATURES
Pursuant to the requirements of the Securities Exchange Act of 1934 and the Investment Company Act of 1940, as amended, the registrant has duly caused this report to be signed on its behalf by the undersigned, thereunto duly authorized.
(Registrant) Manager Directed Portfolios
By (Signature and Title)* /s/Douglas J. Neilson
Douglas J. Neilson, President/
Principal Executive Officer
Date 3/10/2021
Pursuant to the requirements of the Securities Exchange Act of 1934 and the Investment Company Act of 1940, as amended, this report has been signed below by the following persons on behalf of the registrant and in the capacities and on the dates indicated.
By (Signature and Title)* /s/Douglas J. Neilson
Douglas J. Neilson, President/
Principal Executive Officer
Date 3/10/2021
By (Signature and Title)* /s/Matthew J. McVoy
Matthew J. McVoy, Treasurer/
Principal Financial Officer
Date 3/10/2021
* Print the name and title of each signing officer under his or her signature.