Hood River Small-Cap Growth Fund
Hood River International Opportunity Fund
Semi-Annual Report
December 31, 2023
Hood River Funds
Table of Contents
Sector Allocation of Portfolio Assets | 3 |
Schedule of Investments | 5 |
Statements of Assets and Liabilities | 18 |
Statements of Operations | 20 |
Statements of Changes in Net Assets | 22 |
Financial Highlights | 26 |
Notes to the Financial Statements | 32 |
Expense Examples | 48 |
Statement Regarding Liquidity Risk Management Program | 50 |
Approval of the Investment Advisory Agreement | 51 |
Notice to Shareholders | 55 |
Privacy Notice | 56 |
Hood River Small-Cap Growth Fund
| SECTOR ALLOCATION OF PORTFOLIO ASSETS |
| at December 31, 2023 (Unaudited) |
Percentages represent market value as a percentage of net assets.
Note: For presentation purposes, the Fund has grouped some of the industry categories. For purposes of categorizing securities for compliance with Section 8(b)(1) of the Investment Company Act of 1940, as amended, the Fund uses more specific industry classifications.
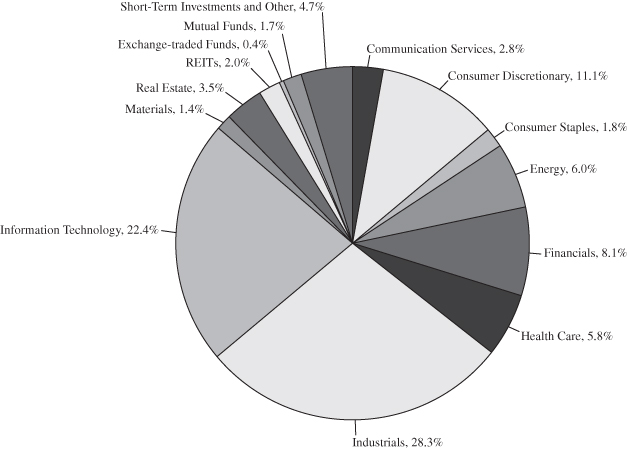
Hood River International Opportunity Fund
| SECTOR ALLOCATION OF PORTFOLIO ASSETS |
| at December 31, 2023 (Unaudited) |
Note: For presentation purposes, the Fund has grouped some of the industry categories. For purposes of categorizing securities for compliance with Section 8(b)(1) of the Investment Company Act of 1940, as amended, the Fund uses more specific industry classifications.
| COUNTRY ALLOCATION OF PORTFOLIO ASSETS |
| at December 31, 2023 (Unaudited) |
| United States | 6.9% |
| India | 21.6% |
| Japan | 13.3% |
| Canada | 12.6% |
| China | 5.8% |
| Italy | 4.7% |
| United Kingdom | 4.6% |
| Israel | 4.4% |
| Mexico | 3.7% |
| Luxembourg | 3.3% |
| Netherlands | 2.8% |
| Belgium | 2.6% |
| Switzerland | 1.9% |
| Guernsey | 1.5% |
| Australia | 1.3% |
| Liechtenstein | 1.2% |
| Austria | 1.2% |
| Germany | 0.9% |
| Brazil | 0.5% |
| Norway | 0.5% |
| Short-Term Investments | |
| and Other | 4.7% |
Percentages represent market value as a percentage of net assets.
Hood River Small-Cap Growth Fund
| SCHEDULE OF INVESTMENTS |
| at December 31, 2023 (Unaudited) |
| COMMON STOCKS – 97.3% | | Shares | | | Value | |
| COMMUNICATION SERVICES – 1.3% | | | | | | |
| | | | | | | |
| Diversified Telecommunication Services – 1.3% | | | | | | |
Cogent Communications Holdings, Inc.(a) | | | 311,523 | | | $ | 23,694,439 | |
| TOTAL COMMUNICATION SERVICES | | | | | | | 23,694,439 | |
| | | | | | | | | |
| CONSUMER DISCRETIONARY – 7.1% | | | | | | | | |
| | | | | | | | | |
| Automobile Components – 1.3% | | | | | | | | |
Modine Manufacturing Co.(b) | | | 406,167 | | | | 24,248,170 | |
| | | | | | | | | |
| Broadline Retail – 0.5% | | | | | | | | |
Ollie’s Bargain Outlet Holdings, Inc.(a)(b) | | | 130,892 | | | | 9,933,394 | |
| | | | | | | | | |
| Hotels, Restaurants & Leisure – 3.8% | | | | | | | | |
Caesars Entertainment, Inc.(b) | | | 474,136 | | | | 22,227,496 | |
Cava Group, Inc.(b) | | | 213,863 | | | | 9,191,832 | |
DraftKings, Inc. – Class A(b) | | | 845,397 | | | | 29,800,244 | |
Genius Sports Ltd.(b) | | | 1,621,899 | | | | 10,023,336 | |
| | | | | | | | 71,242,908 | |
| Household Durables – 1.0% | | | | | | | | |
Dream Finders Homes, Inc. – Class A(a)(b) | | | 226,437 | | | | 8,045,307 | |
Lovesac Co.(a)(b) | | | 393,351 | | | | 10,050,118 | |
| | | | | | | | 18,095,425 | |
| Specialty Retail – 0.5% | | | | | | | | |
Arhaus, Inc.(a)(b) | | | 837,457 | | | | 9,923,865 | |
| TOTAL CONSUMER DISCRETIONARY | | | | | | | 133,443,762 | |
| | | | | | | | | |
| CONSUMER STAPLES – 1.2% | | | | | | | | |
| | | | | | | | | |
| Beverages – 1.2% | | | | | | | | |
Celsius Holdings, Inc.(b) | | | 400,137 | | | | 21,815,469 | |
| TOTAL CONSUMER STAPLES | | | | | | | 21,815,469 | |
| | | | | | | | | |
| ENERGY – 3.0% | | | | | | | | |
| | | | | | | | | |
| Oil, Gas & Consumable Fuels – 3.0% | | | | | | | | |
Denison Mines Corp.(a)(b) | | | 12,751,865 | | | | 22,570,801 | |
Green Plains, Inc.(a)(b) | | | 537,182 | | | | 13,547,730 | |
The accompanying notes are an integral part of these financial statements.
Hood River Small-Cap Growth Fund
| SCHEDULE OF INVESTMENTS (Continued) |
| at December 31, 2023 (Unaudited) |
| COMMON STOCKS – 97.3% (Continued) | | Shares | | | Value | |
| ENERGY – 3.0% (Continued) | | | | | | |
| | | | | | | |
| Oil, Gas & Consumable Fuels – 3.0% (Continued) | | | | | | |
Northern Oil and Gas, Inc.(a) | | | 387,846 | | | $ | 14,377,451 | |
Scorpio Tankers, Inc. | | | 86,839 | | | | 5,279,811 | |
| | | | | | | | 55,775,793 | |
| TOTAL ENERGY | | | | | | | 55,775,793 | |
| | | | | | | | | |
| FINANCIALS – 8.4% | | | | | | | | |
| | | | | | | | | |
| Banks – 3.3% | | | | | | | | |
Customers Bancorp, Inc.(b) | | | 157,260 | | | | 9,061,321 | |
Western Alliance Bancorp | | | 791,323 | | | | 52,061,141 | |
| | | | | | | | 61,122,462 | |
| Consumer Finance – 2.4% | | | | | | | | |
FirstCash Holdings, Inc. | | | 418,955 | | | | 45,410,532 | |
| | | | | | | | | |
| Financial Services – 0.5% | | | | | | | | |
I3 Verticals, Inc. – Class A(b) | | | 425,228 | | | | 9,002,077 | |
| | | | | | | | | |
| Insurance – 2.4% | | | | | | | | |
BRP Group, Inc. – Class A(a)(b) | | | 130,761 | | | | 3,140,879 | |
HCI Group, Inc.(a) | | | 387,230 | | | | 33,843,902 | |
Kinsale Capital Group, Inc.(a) | | | 7,003 | | | | 2,345,375 | |
Skyward Specialty Insurance Group, Inc.(a)(b) | | | 149,475 | | | | 5,064,213 | |
| | | | | | | | 44,394,369 | |
| TOTAL FINANCIALS | | | | | | �� | 159,929,440 | |
| | | | | | | | | |
| HEALTH CARE – 20.3% | | | | | | | | |
| | | | | | | | | |
| Biotechnology – 6.5% | | | | | | | | |
Biohaven Ltd.(b) | | | 167,010 | | | | 7,148,028 | |
Blueprint Medicines Corp.(b) | | | 220,272 | | | | 20,317,889 | |
Cytokinetics, Inc.(a)(b) | | | 285,394 | | | | 23,827,545 | |
Insmed, Inc.(b) | | | 457,616 | | | | 14,181,520 | |
Iovance Biotherapeutics, Inc.(a)(b) | | | 994,366 | | | | 8,084,196 | |
Krystal Biotech, Inc.(a)(b) | | | 231,162 | | | | 28,677,958 | |
Neurocrine Biosciences, Inc.(b) | | | 106,010 | | | | 13,967,878 | |
Scholar Rock Holding Corp.(b) | | | 252,032 | | | | 4,738,202 | |
| | | | | | | | 120,943,216 | |
The accompanying notes are an integral part of these financial statements.
Hood River Small-Cap Growth Fund
| SCHEDULE OF INVESTMENTS (Continued) |
| at December 31, 2023 (Unaudited) |
| COMMON STOCKS – 97.3% (Continued) | | Shares | | | Value | |
| HEALTH CARE – 20.3% (Continued) | | | | | | |
| | | | | | | |
| Health Care Equipment & Supplies – 6.6% | | | | | | |
AtriCure, Inc.(a)(b) | | | 419,553 | | | $ | 14,973,847 | |
Axonics, Inc.(a)(b) | | | 658,143 | | | | 40,956,238 | |
CONMED Corp. | | | 122,148 | | | | 13,376,427 | |
Inspire Medical Systems, Inc.(a)(b) | | | 78,008 | | | | 15,869,167 | |
Lantheus Holdings, Inc.(b) | | | 608,696 | | | | 37,739,151 | |
| | | | | | | | 122,914,830 | |
| Health Care Providers & Services – 3.8% | | | | | | | | |
Alignment Healthcare, Inc.(b) | | | 1,064,324 | | | | 9,163,830 | |
DocGo, Inc.(a)(b) | | | 3,187,206 | | | | 17,816,482 | |
NeoGenomics, Inc.(a)(b) | | | 370,816 | | | | 5,999,803 | |
Option Care Health, Inc.(b) | | | 463,612 | | | | 15,619,088 | |
RadNet, Inc.(b) | | | 496,625 | | | | 17,267,651 | |
Select Medical Holdings Corp. | | | 225,992 | | | | 5,310,812 | |
| | | | | | | | 71,177,666 | |
| Health Care Technology – 1.8% | | | | | | | | |
Evolent Health, Inc. – Class A(a)(b) | | | 1,041,017 | | | | 34,384,792 | |
| | | | | | | | | |
| Pharmaceuticals – 1.7% | | | | | | | | |
Axsome Therapeutics, Inc.(a)(b) | | | 198,366 | | | | 15,787,950 | |
Cymabay Therapeutics, Inc.(b) | | | 282,323 | | | | 6,668,469 | |
Verona Pharma PLC – ADR(b) | | | 476,765 | | | | 9,478,088 | |
| | | | | | | | 31,934,507 | |
| TOTAL HEALTH CARE | | | | | | | 381,355,011 | |
| | | | | | | | | |
| INDUSTRIALS – 24.5% | | | | | | | | |
| | | | | | | | | |
| Aerospace & Defense – 2.5% | | | | | | | | |
Axon Enterprise, Inc.(b) | | | 100,975 | | | | 26,084,872 | |
Ducommun, Inc.(b) | | | 102,981 | | | | 5,361,191 | |
Kratos Defense & Security Solutions, Inc.(b) | | | 607,936 | | | | 12,335,021 | |
Lilium NV(a)(b) | | | 1,849,352 | | | | 2,182,235 | |
| | | | | | | | 45,963,319 | |
| Commercial Services & Supplies – 2.1% | | | | | | | | |
Clean Harbors, Inc.(b) | | | 220,492 | | | | 38,478,059 | |
The accompanying notes are an integral part of these financial statements.
Hood River Small-Cap Growth Fund
| SCHEDULE OF INVESTMENTS (Continued) |
| at December 31, 2023 (Unaudited) |
| COMMON STOCKS – 97.3% (Continued) | | Shares | | | Value | |
| INDUSTRIALS – 24.5% (Continued) | | | | | | |
| | | | | | | |
| Construction & Engineering – 6.1% | | | | | | |
API Group Corp.(b) | | | 329,080 | | | $ | 11,386,168 | |
Comfort Systems USA, Inc.(a) | | | 243,814 | | | | 50,145,225 | |
Construction Partners, Inc. – Class A(b) | | | 221,836 | | | | 9,654,303 | |
MasTec, Inc.(b) | | | 573,071 | | | | 43,392,936 | |
| | | | | | | | 114,578,632 | |
| Electrical Equipment – 2.8% | | | | | | | | |
Enovix Corp.(a)(b) | | | 789,230 | | | | 9,881,160 | |
Vertiv Holdings Co. – Class A | | | 874,465 | | | | 42,000,554 | |
| | | | | | | | 51,881,714 | |
| Ground Transportation – 3.8% | | | | | | | | |
FTAI Infrastructure, Inc. | | | 1,259,717 | | | | 4,900,299 | |
RXO, Inc.(b) | | | 847,367 | | | | 19,709,756 | |
TFI International, Inc.(a) | | | 106,525 | | | | 14,485,270 | |
XPO, Inc.(a)(b) | | | 364,053 | | | | 31,887,402 | |
| | | | | | | | 70,982,727 | |
| Marine Transportation – 1.5% | | | | | | | | |
Kirby Corp.(b) | | | 362,856 | | | | 28,476,939 | |
| | | | | | | | | |
| Professional Services – 0.2% | | | | | | | | |
WNS Holdings Ltd. – ADR(b) | | | 64,156 | | | | 4,054,659 | |
| | | | | | | | | |
| Trading Companies & Distributors – 5.6% | | | | | | | | |
Core & Main, Inc. – Class A(b) | | | 374,673 | | | | 15,140,536 | |
FTAI Aviation Ltd. | | | 1,740,629 | | | | 80,765,186 | |
Transcat, Inc.(a)(b) | | | 80,506 | | | | 8,801,721 | |
| | | | | | | | 104,707,443 | |
| TOTAL INDUSTRIALS | | | | | | | 459,123,492 | |
| | | | | | | | | |
| INFORMATION TECHNOLOGY – 27.3% | | | | | | | | |
| | | | | | | | | |
| Communications Equipment – 1.1% | | | | | | | | |
Applied Optoelectronics, Inc.(a)(b) | | | 732,396 | | | | 14,149,891 | |
Infinera Corp.(a)(b) | | | 1,485,725 | | | | 7,057,194 | |
| | | | | | | | 21,207,085 | |
The accompanying notes are an integral part of these financial statements.
Hood River Small-Cap Growth Fund
| SCHEDULE OF INVESTMENTS (Continued) |
| at December 31, 2023 (Unaudited) |
| COMMON STOCKS – 97.3% (Continued) | | Shares | | | Value | |
| INFORMATION TECHNOLOGY – 27.3% (Continued) | | | | | | |
| | | | | | | |
| Electronic Equipment, Instruments | | | | | | |
| & Components – 2.1% | | | | | | |
Fabrinet(b) | | | 102,087 | | | $ | 19,430,219 | |
OSI Systems, Inc.(b) | | | 155,605 | | | | 20,080,825 | |
| | | | | | | | 39,511,044 | |
| IT Services – 3.2% | | | | | | | | |
Applied Digital Corp.(b) | | | 4,268,248 | | | | 28,767,992 | |
Couchbase, Inc.(a)(b) | | | 784,774 | | | | 17,673,110 | |
DigitalOcean Holdings, Inc.(a)(b) | | | 349,854 | | | | 12,836,143 | |
| | | | | | | | 59,277,245 | |
| Semiconductors & Semiconductor Equipment – 13.3% | | | | | | | | |
Aehr Test Systems(a)(b) | | | 510,523 | | | | 13,544,175 | |
Camtek Ltd.(b) | | | 367,696 | | | | 25,510,749 | |
FormFactor, Inc.(b) | | | 975,640 | | | | 40,693,944 | |
indie Semiconductor, Inc. – Class A(a)(b) | | | 2,266,899 | | | | 18,384,551 | |
Kulicke & Soffa Industries, Inc. | | | 180,453 | | | | 9,874,388 | |
Onto Innovation, Inc.(b) | | | 318,365 | | | | 48,678,009 | |
Rambus, Inc.(b) | | | 991,185 | | | | 67,648,377 | |
SiTime Corp.(a)(b) | | | 204,177 | | | | 24,925,928 | |
| | | | | | | | 249,260,121 | |
| Software – 7.6% | | | | | | | | |
ACI Worldwide, Inc.(b) | | | 761,830 | | | | 23,311,998 | |
CyberArk Software Ltd.(b) | | | 68,569 | | | | 15,020,039 | |
Five9, Inc.(b) | | | 295,286 | | | | 23,236,055 | |
Intapp, Inc.(b) | | | 239,988 | | | | 9,124,344 | |
NICE Ltd. – ADR(a)(b) | | | 96,971 | | | | 19,346,684 | |
Rapid7, Inc.(b) | | | 466,064 | | | | 26,612,254 | |
Varonis Systems, Inc.(b) | | | 577,942 | | | | 26,169,214 | |
| | | | | | | | 142,820,588 | |
| TOTAL INFORMATION TECHNOLOGY | | | | | | | 512,076,083 | |
| | | | | | | | | |
| MATERIALS – 4.1% | | | | | | | | |
| | | | | | | | | |
| Chemicals – 1.4% | | | | | | | | |
Aspen Aerogels, Inc.(b) | | | 1,604,600 | | | | 25,320,588 | |
The accompanying notes are an integral part of these financial statements.
Hood River Small-Cap Growth Fund
| SCHEDULE OF INVESTMENTS (Continued) |
| at December 31, 2023 (Unaudited) |
| COMMON STOCKS – 97.3% (Continued) | | Shares | | | Value | |
| MATERIALS – 4.1% (Continued) | | | | | | |
| | | | | | | |
| Construction Materials – 2.7% | | | | | | |
Eagle Materials, Inc. | | | 126,542 | | | $ | 25,667,779 | |
Knife River Corp.(a)(b) | | | 383,145 | | | | 25,356,536 | |
| | | | | | | | 51,024,315 | |
| TOTAL MATERIALS | | | | | | | 76,344,903 | |
| TOTAL COMMON STOCKS | | | | | | | | |
(Cost $1,389,414,623) | | | | | | | 1,823,558,392 | |
| | | | | | | | | |
| REAL ESTATE INVESTMENT | | | | | | | | |
| TRUSTS (REITs) – 0.6% | | | | | | | | |
| Mortgage Real Estate Investment Trusts – 0.6% | | | | | | | | |
Hannon Armstrong Sustainable | | | | | | | | |
Infrastructure Capital, Inc.(a) | | | 380,455 | | | | 10,492,949 | |
| TOTAL REAL ESTATE INVESTMENT TRUSTS | | | | | | | | |
(Cost $8,445,434) | | | | | | | 10,492,949 | |
| | | | | | | | | |
| SHORT-TERM INVESTMENTS – 2.2% | | | | | | | | |
| Money Market Funds – 2.2% | | | | | | | | |
First American Treasury Obligations Fund – | | | | | | | | |
Class Z, 5.25%(c) | | | 41,993,331 | | | | 41,993,331 | |
| TOTAL SHORT-TERM INVESTMENTS | | | | | | | | |
(Cost $41,993,331) | | | | | | | 41,993,331 | |
The accompanying notes are an integral part of these financial statements.
Hood River Small-Cap Growth Fund
| SCHEDULE OF INVESTMENTS (Continued) |
| at December 31, 2023 (Unaudited) |
| INVESTMENTS PURCHASED WITH PROCEEDS | | | | | | |
| FROM SECURITIES LENDING – 15.5% | | Shares | | | Value | |
Mount Vernon Liquid Assets | | | | | | |
Portfolio, LLC, 5.55%(c) | | | 289,936,235 | | | $ | 289,936,235 | |
| TOTAL INVESTMENTS PURCHASED WITH | | | | | | | | |
| PROCEEDS FROM SECURITIES LENDING | | | | | | | | |
(Cost $289,936,235) | | | | | | | 289,936,235 | |
| TOTAL INVESTMENTS – 115.6% | | | | | | | | |
(Cost $1,729,789,623) | | | | | | | 2,165,980,907 | |
Liabilities in Excess of Other Assets – (15.6)% | | | | | | | (291,500,735 | ) |
| TOTAL NET ASSETS – 100.0% | | | | | | $ | 1,874,480,172 | |
Percentages are stated as a percent of net assets.
ADR – American Depositary Receipt
PLC – Public Limited Company
REIT – Real Estate Investment Trust
NV – Naamloze Vennootschap
| (a) | All or a portion of this security is on loan as of December 31, 2023. The total market value of these securities was $277,689,165 which represented 14.8% of net assets. |
| (b) | Non-income producing security. |
| (c) | The rate shown represents the 7-day effective yield as of December 31, 2023. |
The Global Industry Classification Standard (GICS®) was developed by and/or is the exclusive property of MSCI, Inc. and Standard & Poor’s Financial Services LLC (“S&P”). GICS is a service mark of MSCI, Inc. and S&P and has been licensed for use by U.S. Bank Global Fund Services.
The accompanying notes are an integral part of these financial statements.
Hood River International Opportunity Fund
| SCHEDULE OF INVESTMENTS |
| at December 31, 2023 (Unaudited) |
| COMMON STOCKS – 91.2% | | Shares | | | Value | |
| COMMUNICATION SERVICES – 2.8% | | | | | | |
| | | | | | | |
| Diversified Telecommunication Services – 0.8% | | | | | | |
Infrastrutture Wireless Italiane SpA | | | 3,400 | | | $ | 43,047 | |
| | | | | | | | | |
| Entertainment – 0.5% | | | | | | | | |
Nexon Co. Ltd. | | | 1,700 | | | | 30,921 | |
| | | | | | | | | |
| Interactive Media & Services – 1.0% | | | | | | | | |
Baltic Classifieds Group PLC | | | 19,458 | | | | 58,657 | |
| | | | | | | | | |
| Media – 0.4% | | | | | | | | |
Gambling.com Group Ltd.(a) | | | 2,500 | | | | 24,375 | |
| TOTAL COMMUNICATION SERVICES | | | | | | | 157,000 | |
| | | | | | | | | |
| CONSUMER DISCRETIONARY – 11.1% | | | | | | | | |
| | | | | | | | | |
| Automobile Components – 1.8% | | | | | | | | |
MRF Ltd. | | | 68 | | | | 105,854 | |
| | | | | | | | | |
| Broadline Retail – 1.0% | | | | | | | | |
Max Stock Ltd. | | | 29,000 | | | | 55,668 | |
| | | | | | | | | |
| Hotels, Restaurants & Leisure – 6.5% | | | | | | | | |
Basic-Fit NV(a) | | | 1,301 | | | | 40,504 | |
eDreams ODIGEO SA(a) | | | 12,000 | | | | 101,577 | |
Genius Sports Ltd.(a) | | | 13,595 | | | | 84,017 | |
HomeToGo SE(a) | | | 18,700 | | | | 50,992 | |
Inspired Entertainment, Inc.(a) | | | 3,106 | | | | 30,687 | |
Webjet Ltd.(a) | | | 12,100 | | | | 60,527 | |
| | | | | | | | 368,304 | |
| Leisure Products – 0.7% | | | | | | | | |
Ferretti SpA | | | 13,200 | | | | 41,905 | |
| | | | | | | | | |
| Textiles, Apparel & Luxury Goods – 1.1% | | | | | | | | |
On Holding AG – Class A(a) | | | 1,021 | | | | 27,536 | |
Vaibhav Global Limited (a) | | | 6,900 | | | | 32,880 | |
| | | | | | | | 60,416 | |
| TOTAL CONSUMER DISCRETIONARY | | | | | | | 632,147 | |
The accompanying notes are an integral part of these financial statements.
Hood River International Opportunity Fund
| SCHEDULE OF INVESTMENTS (Continued) |
| at December 31, 2023 (Unaudited) |
| COMMON STOCKS – 91.2% (Continued) | | Shares | | | Value | |
| CONSUMER STAPLES – 1.8% | | | | | | |
| | | | | | | |
| Consumer Staples Distribution & Retail – 0.5% | | | | | | |
DocMorris AG(a) | | | 300 | | | $ | 26,401 | |
| | | | | | | | | |
| Household Products – 1.3% | | | | | | | | |
Jyothy Labs Ltd. | | | 13,299 | | | | 76,476 | |
| TOTAL CONSUMER STAPLES | | | | | | | 102,877 | |
| | | | | | | | | |
| ENERGY – 6.0% | | | | | | | | |
| | | | | | | | | |
| Oil, Gas & Consumable Fuels – 6.0% | | | | | | | | |
Cameco Corp. | | | 1,400 | | | | 60,340 | |
Denison Mines Corp.(a) | | | 43,500 | | | | 76,995 | |
Great Eastern Shipping Co. Ltd. | | | 8,800 | | | | 103,214 | |
Iwatani Corp. | | | 900 | | | | 40,995 | |
NexGen Energy Ltd.(a) | | | 8,300 | | | | 58,100 | |
| | | | | | | | 339,644 | |
| TOTAL ENERGY | | | | | | | 339,644 | |
| | | | | | | | | |
| FINANCIALS – 8.1% | | | | | | | | |
| | | | | | | | | |
| Banks – 1.3% | | | | | | | | |
Sumitomo Mitsui Trust Holdings, Inc. | | | 3,800 | | | | 72,777 | |
| | | | | | | | | |
| Consumer Finance – 1.9% | | | | | | | | |
Sundaram Finance Ltd. | | | 2,496 | | | | 105,170 | |
| | | | | | | | | |
| Financial Services – 2.9% | | | | | | | | |
BFF Bank SpA | | | 4,800 | | | | 54,761 | |
Payfare, Inc.(a) | | | 23,800 | | | | 111,541 | |
| | | | | | | | 166,302 | |
| Insurance – 2.0% | | | | | | | | |
Just Group PLC | | | 38,000 | | | | 41,521 | |
Revo Insurance SpA(a) | | | 8,100 | | | | 75,113 | |
| | | | | | | | 116,634 | |
| TOTAL FINANCIALS | | | | | | | 460,883 | |
The accompanying notes are an integral part of these financial statements.
Hood River International Opportunity Fund
| SCHEDULE OF INVESTMENTS (Continued) |
| at December 31, 2023 (Unaudited) |
| COMMON STOCKS – 91.2% (Continued) | | Shares | | | Value | |
| HEALTH CARE – 5.8% | | | | | | |
| | | | | | | |
| Biotechnology – 2.8% | | | | | | |
Exscientia PLC – ADR(a) | | | 2,000 | | | $ | 12,820 | |
MDxHealth SA(a) | | | 37,637 | | | | 148,290 | |
| | | | | | | | 161,110 | |
| Health Care Equipment & Supplies – 1.3% | | | | | | | | |
Implantica AG(a) | | | 29,700 | | | | 70,377 | |
| | | | | | | | | |
| Health Care Technology – 1.2% | | | | | | | | |
Augmedix, Inc.(a) | | | 12,000 | | | | 70,200 | |
| | | | | | | | | |
| Pharmaceuticals – 0.5% | | | | | | | | |
Verona Pharma PLC – ADR(a) | | | 1,416 | | | | 28,150 | |
| TOTAL HEALTH CARE | | | | | | | 329,837 | |
| | | | | | | | | |
| INDUSTRIALS – 28.3% | | | | | | | | |
| | | | | | | | | |
| Commercial Services & Supplies – 4.9% | | | | | | | | |
DO & CO AG | | | 440 | | | | 65,283 | |
GFL Environmental, Inc. | | | 6,250 | | | | 215,687 | |
| | | | | | | | 280,970 | |
| Construction & Engineering – 2.5% | | | | | | | | |
Ahluwalia Contracts India Ltd. | | | 4,300 | | | | 40,041 | |
Larsen & Toubro Ltd. | | | 2,494 | | | | 105,616 | |
| | | | | | | | 145,657 | |
| Electrical Equipment – 4.7% | | | | | | | | |
Amara Raja Energy & Mobility Ltd. | | | 6,400 | | | | 62,716 | |
Triveni Turbine Ltd.(a) | | | 17,960 | | | | 91,509 | |
Voltamp Transformers Ltd. | | | 1,453 | | | | 113,792 | |
| | | | | | | | 268,017 | |
| Ground Transportation – 1.7% | | | | | | | | |
TFI International, Inc. | | | 700 | | | | 95,186 | |
| | | | | | | | | |
| Machinery – 7.0% | | | | | | | | |
AIA Engineering Ltd. | | | 830 | | | | 36,787 | |
CNH Industrial NV | | | 2,700 | | | | 32,886 | |
Elgi Equipments Ltd. | | | 5,900 | | | | 38,590 | |
The accompanying notes are an integral part of these financial statements.
Hood River International Opportunity Fund
| SCHEDULE OF INVESTMENTS (Continued) |
| at December 31, 2023 (Unaudited) |
| COMMON STOCKS – 91.2% (Continued) | | Shares | | | Value | |
| INDUSTRIALS – 28.3% (Continued) | | | | | | |
| | | | | | | |
| Machinery – 7.0% (Continued) | | | | | | |
Kawasaki Heavy Industries Ltd. | | | 2,200 | | | $ | 48,485 | |
Mitsubishi Heavy Industries Ltd. | | | 800 | | | | 46,579 | |
MTAR Technologies Ltd.(a) | | | 3,287 | | | | 87,176 | |
Silex Systems Ltd.(a) | | | 4,000 | | | | 11,835 | |
Thermax Ltd. | | | 1,100 | | | | 40,704 | |
VAT Group AG | | | 110 | | | | 55,248 | |
| | | | | | | | 398,290 | |
| Trading Companies & Distributors – 7.5% | | | | | | | | |
FTAI Aviation Ltd. | | | 2,982 | | | | 138,365 | |
Marubeni Corp. | | | 18,300 | | | | 288,125 | |
| | | | | | | | 426,490 | |
| TOTAL INDUSTRIALS | | | | | | | 1,614,610 | |
| | | | | | | | | |
| INFORMATION TECHNOLOGY – 22.4% | | | | | | | | |
| | | | | | | | | |
| Electronic Equipment, Instruments | | | | | | | | |
| & Components – 2.5% | | | | | | | | |
Fabrinet(a) | | | 446 | | | | 84,887 | |
Kaynes Technology India Ltd.(a) | | | 1,800 | | | | 56,442 | |
| | | | | | | | 141,329 | |
| IT Services – 3.6% | | | | | | | | |
Applied Digital Corp.(a) | | | 30,696 | | | | 206,891 | |
| | | | | | | | | |
| Semiconductors & Semiconductor Equipment – 11.3% | | | | | | | | |
ACM Research, Inc. – Class A(a) | | | 3,388 | | | | 66,202 | |
AIXTRON SE | | | 1,150 | | | | 48,964 | |
Alchip Technologies Ltd. | | | 605 | | | | 64,286 | |
BE Semiconductor Industries NV | | | 560 | | | | 84,546 | |
Camtek Ltd.(a) | | | 1,561 | | | | 108,303 | |
Micronics Japan Co. Ltd. | | | 4,400 | | | | 114,128 | |
Nordic Semiconductor ASA(a) | | | 2,215 | | | | 27,402 | |
Shibaura Mechatronics Corp. | | | 1,800 | | | | 75,499 | |
Technoprobe SpA(a) | | | 5,700 | | | | 54,489 | |
| | | | | | | | 643,819 | |
The accompanying notes are an integral part of these financial statements.
Hood River International Opportunity Fund
| SCHEDULE OF INVESTMENTS (Continued) |
| at December 31, 2023 (Unaudited) |
| COMMON STOCKS – 91.2% (Continued) | | Shares | | | Value | |
| INFORMATION TECHNOLOGY – 22.4% (Continued) | | | | | | |
| | | | | | | |
| Software – 5.0% | | | | | | |
Darktrace PLC(a) | | | 7,200 | | | $ | 33,589 | |
NICE Ltd. – ADR(a) | | | 440 | | | | 87,784 | |
Opera Ltd. – ADR | | | 3,180 | | | | 42,071 | |
Tata Elxsi Ltd. | | | 500 | | | | 52,567 | |
Zoo Digital Group PLC(a) | | | 78,000 | | | | 65,122 | |
| | | | | | | | 281,133 | |
| TOTAL INFORMATION TECHNOLOGY | | | | | | | 1,273,172 | |
| | | | | | | | | |
| MATERIALS – 1.4% | | | | | | | | |
| | | | | | | | | |
| Metals & Mining – 1.4% | | | | | | | | |
Ratnamani Metals & Tubes Ltd. | | | 2,031 | | | | 82,087 | |
| TOTAL MATERIALS | | | | | | | 82,087 | |
| | | | | | | | | |
| REAL ESTATE – 3.5% | | | | | | | | |
| | | | | | | | | |
| Real Estate Management & Development – 3.5% | | | | | | | | |
Altisource Portfolio Solutions SA(a) | | | 9,510 | | | | 33,856 | |
Corp. Inmobiliaria Vesta SAB de CV | | | 24,300 | | | | 96,365 | |
Lavvi Empreendimentos Imobiliarios SA | | | 16,000 | | | | 28,852 | |
Tosei Corp. | | | 3,000 | | | | 42,361 | |
| TOTAL REAL ESTATE | | | | | | | 201,434 | |
| TOTAL COMMON STOCKS | | | | | | | | |
(Cost $4,501,523) | | | | | | | 5,193,691 | |
| | | | | | | | | |
| REAL ESTATE INVESTMENT TRUSTS – 2.0% | | | | | | | | |
| Diversified REITs – 0.9% | | | | | | | | |
Fibra Uno Administracion SAB de CV | | | 29,200 | | | | 52,447 | |
| | | | | | | | | |
| Industrial REITs – 1.1% | | | | | | | | |
FIBRA Macquarie Mexico | | | 32,200 | | | | 63,069 | |
| TOTAL REAL ESTATE INVESTMENT TRUSTS | | | | | | | | |
(Cost $87,946) | | | | | | | 115,516 | |
The accompanying notes are an integral part of these financial statements.
Hood River International Opportunity Fund
| SCHEDULE OF INVESTMENTS (Continued) |
| at December 31, 2023 (Unaudited) |
| MUTUAL FUNDS – 1.7% | | Shares | | | Value | |
Sprott Physical Uranium Trust(a) | | | 4,643 | | | $ | 98,896 | |
| TOTAL MUTUAL FUNDS | | | | | | | | |
(Cost $58,413) | | | | | | | 98,896 | |
| | | | | | | | | |
| EXCHANGE TRADED FUNDS – 0.4% | | | | | | | | |
KraneShares Global Carbon Strategy ETF | | | 550 | | | | 20,070 | |
| TOTAL EXCHANGE TRADED FUNDS | | | | | | | | |
(Cost $24,894) | | | | | | | 20,070 | |
| | | | | | | | | |
| SHORT-TERM INVESTMENTS – 4.0% | | | | | | | | |
| Money Market Funds – 4.0% | | | | | | | | |
First American Treasury Obligations Fund – | | | | | | | | |
Class X, 5.29%(b) | | | 227,529 | | | | 227,529 | |
| TOTAL SHORT-TERM INVESTMENTS | | | | | | | | |
(Cost $227,529) | | | | | | | 227,529 | |
| TOTAL INVESTMENTS – 99.3% | | | | | | | | |
(Cost $4,900,305) | | | | | | | 5,655,702 | |
Other Assets in Excess of Liabilities – 0.7% | | | | | | | 39,726 | |
| TOTAL NET ASSETS – 100.0% | | | | | | $ | 5,695,428 | |
Percentages are stated as a percent of net assets.
ADR – American Depositary Receipt
PLC – Public Limited Company
REIT – Real Estate Investment Trust
AG – Aktiengesellschaft
ASA – Allmennaksjeselskap
NV – Naamloze Vennootschap
SG – Societas Europea
SpA – Societa per azioni
| (a) | Non-income producing security. |
| (b) | The rate shown represents the 7-day effective yield as of December 31, 2023. |
The Global Industry Classification Standard (GICS®) was developed by and/or is the exclusive property of MSCI, Inc. and Standard & Poor’s Financial Services LLC (“S&P”). GICS is a service mark of MSCI, Inc. and S&P and has been licensed for use by U.S. Bank Global Fund Services.
The accompanying notes are an integral part of these financial statements.
Hood River Funds
| STATEMENTS OF ASSETS AND LIABILITIES |
| at December 31, 2023 (Unaudited) |
| | | Hood River | | | Hood River | |
| | | Small-Cap | | | International | |
| | | Growth Fund | | | Opportunity Fund | |
| Assets: | | | | | | |
Investments at value* | | $ | 2,165,980,907 | | | $ | 5,655,702 | |
Foreign currency, at value** | | | — | | | | 20 | |
Receivables: | | | | | | | | |
| Securities sold | | | 17,094,555 | | | | — | |
| Fund shares sold | | | 9,541,792 | | | | 12,550 | |
| Dividends and interest | | | 596,320 | | | | 4,741 | |
| Securities lending income | | | 73,558 | | | | — | |
| Due From Advisor | | | — | | | | 17,232 | |
Prepaid expenses | | | 163,593 | | | | 55,381 | |
| Total assets | | | 2,193,450,725 | | | | 5,745,626 | |
| | | | | | | | | |
| Liabilities: | | | | | | | | |
Payables: | | | | | | | | |
| Payable upon return of securities loaned | | | 289,936,235 | | | | — | |
| Securities purchased | | | 22,196,913 | | | | 5,146 | |
| Fund shares redeemed | | | 4,972,514 | | | | — | |
| Advisory fee | | | 1,372,471 | | | | — | |
| Administration and fund accounting fees | | | 171,408 | | | | 5,390 | |
| Audit Fees | | | 8,457 | | | | 9,565 | |
| Distribution fees | | | 73,451 | | | | 31 | |
| Service fees | | | 155,992 | | | | — | |
| Compliance fees | | | 3,206 | | | | 3,144 | |
| Custody fees | | | 15,112 | | | | 8,373 | |
| Printing and mailing fees | | | — | | | | 5,793 | |
| Transfer agent fees and expenses | | | 54,483 | | | | 12,593 | |
| Other accrued expenses | | | 10,311 | | | | 163 | |
| Total liabilities | | | 318,970,553 | | | | 50,198 | |
| | | | | | | | | |
| Net assets | | $ | 1,874,480,172 | | | $ | 5,695,428 | |
| | | | | | | | | |
| Net assets consist of: | | | | | | | | |
Capital stock | | $ | 1,561,711,337 | | | $ | 5,689,935 | |
Total distributable earnings | | | 312,768,835 | | | | 5,493 | |
| Net assets | | $ | 1,874,480,172 | | | $ | 5,695,428 | |
* Investments at cost | | $ | 1,729,789,623 | | | $ | 4,900,305 | |
** Foreign currency at cost | | | — | | | | 20 | |
The accompanying notes are an integral part of these financial statements.
Hood River Funds
| STATEMENTS OF ASSETS AND LIABILITIES (Continued) |
| at December 31, 2023 (Unaudited) |
| | | Hood River | | | Hood River | |
| | | Small-Cap | | | International | |
| | | Growth Fund | | | Opportunity Fund | |
| Investor Shares: | | | | | | |
| Net assets applicable to outstanding | | | | | | |
| Investor Shares | | $ | 150,226,042 | | | $ | 106,798 | |
| Shares issued (Unlimited number of beneficial | | | | | | | | |
| interest authorized, $0.01 par value) | | | 2,700,202 | | | | 10,967 | |
| Net asset value, offering price and | | | | | | | | |
| redemption price per share | | $ | 55.64 | | | $ | 9.74 | |
| Institutional Shares: | | | | | | | | |
| Net assets applicable to outstanding | | | | | | | | |
| Institutional Shares | | $ | 879,283,597 | | | $ | 4,171,333 | |
| Shares issued (Unlimited number of beneficial | | | | | | | | |
| interest authorized, $0.01 par value) | | | 15,477,047 | | | | 427,989 | |
| Net asset value, offering price and | | | | | | | | |
| redemption price per share | | $ | 56.81 | | | $ | 9.75 | |
| Retirement Shares: | | | | | | | | |
| Net assets applicable to outstanding | | | | | | | | |
| Retirement Shares | | $ | 844,970,533 | | | $ | 1,417,297 | |
| Shares issued (Unlimited number of beneficial | | | | | | | | |
| interest authorized, $0.01 par value) | | | 14,787,194 | | | | 145,159 | |
| Net asset value, offering price and | | | | | | | | |
| redemption price per share | | $ | 57.14 | | | $ | 9.76 | |
The accompanying notes are an integral part of these financial statements.
Hood River Funds
| STATEMENTS OF OPERATIONS |
| For the Six Months Ended December 31, 2023 (Unaudited) |
| | | Hood River | | | Hood River | |
| | | Small-Cap | | | International | |
| | | Growth Fund | | | Opportunity Fund | |
| Investment income: | | | | | | |
Dividends (net of foreign taxes withheld | | | | | | |
of $11,671 and $3,344, respectively) | | $ | 4,260,760 | | | $ | 19,194 | |
Interest | | | 1,028,222 | | | | 10,110 | |
Securities lending income | | | 555,954 | | | | — | |
| Total investment income | | | 5,844,936 | | | | 29,304 | |
| | | | | | | | | |
| Expenses: | | | | | | | | |
Investment advisory fees (Note 4) | | | 7,186,412 | | | | 27,523 | |
Administration and fund accounting fees (Note 4) | | | 347,019 | | | | 12,074 | |
Service fees (Note 6) | | | | | | | | |
| Service fees – Investor Shares | | | 56,040 | | | | — | |
| Service fees – Institutional Shares | | | 277,089 | | | | — | |
Distribution fees (Note 5) | | | | | | | | |
| Distribution fees – Investor Shares | | | 116,908 | | | | 31 | |
Transfer agent fees and expenses | | | 115,128 | | | | 29,934 | |
Federal and state registration fees | | | 69,584 | | | | 21,170 | |
Custody fees | | | 44,636 | | | | 13,258 | |
Reports to shareholders | | | 32,584 | | | | 1,786 | |
Legal fees | | | 13,492 | | | | 11,334 | |
Trustees’ fees and expenses | | | 13,250 | | | | 13,250 | |
Audit fees | | | 8,464 | | | | 9,752 | |
Compliance expense | | | 6,256 | | | | 6,256 | |
Other | | | 21,092 | | | | 9,846 | |
| Total expenses before | | | | | | | | |
| reimbursement from advisor | | | 8,307,954 | | | | 156,214 | |
| Expense recoupment (reimbursement) | | | | | | | | |
| to advisor (Note 4) | | | 50,766 | | | | (126,333 | ) |
| Net expenses | | | 8,358,720 | | | | 29,881 | |
| Net investment loss | | $ | (2,513,784 | ) | | $ | (577 | ) |
The accompanying notes are an integral part of these financial statements.
Hood River Funds
| STATEMENTS OF OPERATIONS (Continued) |
| For the Six Months Ended December 31, 2023 (Unaudited) |
| | | Hood River | | | Hood River | |
| | | Small-Cap | | | International | |
| | | Growth Fund | | | Opportunity Fund | |
| Realized and unrealized gain (loss) on investments: | | | | | | |
Net realized gain (loss) on transactions from: | | | | | | |
| Investments | | $ | 11,831,316 | | | $ | (63,922 | ) |
| Foreign currency related transactions | | | — | | | | (473 | ) |
Net change in unrealized appreciation on: | | | | | | | | |
| Investments | | | 103,535,811 | | | | 434,254 | |
| Foreign currency related transactions | | | — | | | | 10,104 | |
| Net realized and unrealized | | | | | | | | |
| gain on investments | | | 115,367,127 | | | | 379,963 | |
| | | | | | | | | |
| Net increase in net assets | | | | | | | | |
| resulting from operations | | $ | 112,853,343 | | | $ | 379,386 | |
The accompanying notes are an integral part of these financial statements.
Hood River Small-Cap Growth Fund
| STATEMENTS OF CHANGES IN NET ASSETS |
| |
| | | Six Months Ended | | | | |
| | | December 31, 2023 | | | Year Ended | |
| | | (Unaudited) | | | June 30, 2023 | |
| Operations: | | | | | | |
Net investment loss | | $ | (2,513,784 | ) | | $ | (6,294,777 | ) |
Net realized gain (loss) on investments | | | 11,831,316 | | | | (107,293,666 | ) |
Net change in unrealized | | | | | | | | |
appreciation on investments | | | 103,535,811 | | | | 330,954,691 | |
| Net increase in net assets | | | | | | | | |
| resulting from operations | | | 112,853,343 | | | | 217,366,248 | |
| Capital Share Transactions: | | | | | | | | |
Proceeds from shares sold | | | | | | | | |
| Investor shares | | | 62,647,573 | | | | 51,175,497 | |
| Institutional shares | | | 189,890,922 | | | | 354,068,959 | |
| Retirement shares | | | 105,332,683 | | | | 177,286,523 | |
Cost of shares redeemed | | | | | | | | |
| Investor shares | | | (8,393,003 | ) | | | (15,412,272 | ) |
| Institutional shares | | | (89,671,678 | ) | | | (165,348,295 | ) |
| Retirement shares | | | (52,323,482 | ) | | | (92,821,897 | ) |
| Net increase in net assets | | | | | | | | |
| from capital share transactions | | | 207,483,015 | | | | 308,948,515 | |
| Total increase in net assets | | | 320,336,358 | | | | 526,314,763 | |
| Net Assets: | | | | | | | | |
Beginning of period | | | 1,554,143,814 | | | | 1,027,829,051 | |
End of period | | $ | 1,874,480,172 | | | $ | 1,554,143,814 | |
The accompanying notes are an integral part of these financial statements.
Hood River Small-Cap Growth Fund
| STATEMENTS OF CHANGES IN NET ASSETS (Continued) |
| |
| | | Six Months Ended | | | | |
| | | December 31, 2023 | | | Year Ended | |
| | | (Unaudited) | | | June 30, 2023 | |
| Changes in Shares Outstanding: | | | | | | |
Shares sold | | | | | | |
| Investor shares | | | 1,258,140 | | | | 1,027,397 | |
| Institutional shares | | | 3,726,577 | | | | 7,094,441 | |
| Retirement shares | | | 2,019,922 | | | | 3,525,994 | |
Shares redeemed | | | | | | | | |
| Investor shares | | | (167,810 | ) | | | (318,337 | ) |
| Institutional shares | | | (1,752,430 | ) | | | (3,330,574 | ) |
| Retirement shares | | | (1,014,151 | ) | | | (1,871,673 | ) |
Net increase in shares outstanding | | | 4,070,248 | | | | 6,127,248 | |
The accompanying notes are an integral part of these financial statements.
Hood River International Opportunity Fund
| STATEMENTS OF CHANGES IN NET ASSETS |
| |
| | | Six Months Ended | | | | |
| | | December 31, 2023 | | | Year Ended | |
| | | (Unaudited) | | | June 30, 2023 | |
| Operations: | | | | | | |
Net investment income/(loss) | | $ | (577 | ) | | $ | 12,606 | |
Net realized loss on investments | | | (64,395 | ) | | | (305,922 | ) |
Net change in unrealized | | | | | | | | |
appreciation on investments | | | 444,358 | | | | 797,701 | |
| Net increase in net assets | | | | | | | | |
| resulting from operations | | | 379,386 | | | | 504,385 | |
| Distributions: | | | | | | | | |
| Investor Shares | | | (1,367 | ) | | | — | |
| Institutional Shares | | | (59,140 | ) | | | — | |
| Retirement Shares | | | (20,029 | ) | | | — | |
| Total distributions | | | (80,536 | ) | | | — | |
| Capital Share Transactions: | | | | | | | | |
Proceeds from shares sold | | | | | | | | |
| Investor Shares | | | 102,241 | | | | — | |
| Institutional Shares | | | 2,448,300 | | | | 101,200 | |
| Retirement Shares | | | 401,937 | | | | 261,932 | |
Proceeds from shares issued to | | | | | | | | |
holders in reinvestment of dividends | | | | | | | | |
| Investor Shares | | | 1,367 | | | | — | |
| Institutional Shares | | | 56,155 | | | | — | |
| Retirement Shares | | | 20,029 | | | | — | |
Cost of shares redeemed | | | | | | | | |
| Investor Shares | | | (130 | ) | | | — | |
| Institutional Shares | | | (152,940 | ) | | | (400,015 | ) |
| Retirement Shares | | | (4,904 | ) | | | (28,888 | ) |
| Net increase/(decrease) in net assets | | | | | | | | |
| from capital share transactions | | | 2,872,055 | | | | (65,771 | ) |
| Total increase in net assets | | | 3,170,905 | | | | 438,614 | |
| Net Assets: | | | | | | | | |
Beginning of period | | | 2,524,523 | | | | 2,085,909 | |
End of period | | $ | 5,695,428 | | | $ | 2,524,523 | |
The accompanying notes are an integral part of these financial statements.
Hood River International Opportunity Fund
| STATEMENTS OF CHANGES IN NET ASSETS (Continued) |
| |
| | | Six Months Ended | | | | |
| | | December 31, 2023 | | | Year Ended | |
| | | (Unaudited) | | | June 30, 2023 | |
| Changes in Shares Outstanding: | | | | | | |
Shares sold | | | | | | |
| Investor Shares | | | 11,387 | | | | — | |
| Institutional Shares | | | 259,848 | | | | 11,256 | |
| Retirement Shares | | | 42,965 | | | | 33,400 | |
Proceeds from shares issued to | | | | | | | | |
holders in reinvestment of dividends | | | | | | | | |
| Investor Shares | | | 146 | | | | — | |
| Institutional Shares | | | 5,980 | | | | — | |
| Retirement Shares | | | 2,131 | | | | — | |
Shares redeemed | | | | | | | | |
| Investor Shares | | | (566 | ) | | | — | |
| Institutional Shares | | | (16,709 | ) | | | (58,999 | ) |
| Retirement Shares | | | (15 | ) | | | (3,881 | ) |
Net increase(decrease) in shares outstanding | | | 293,780 | | | | (18,224 | ) |
The accompanying notes are an integral part of these financial statements.
Hood River Small-Cap Growth Fund
For a capital share outstanding throughout each period
Investor Shares
| | | Six Months | | | | | | | | | | | | | | | | |
| | | Ended | | | Year | | | Year | | | Year | | | Year | | | Year | |
| | | December 31, | | | Ended | | | Ended | | | Ended | | | Ended | | | Ended | |
| | | 2023 | | | June 30, | | | June 30, | | | June 30, | | | June 30, | | | June 30, | |
| | | (Unaudited) | | | 2023 | | | 2022 | | | 2021 | | | 2020 | | | 2019 | |
| Net Asset Value – | | | | | | | | | | | | | | | | | | |
| Beginning of Period | | $ | 52.65 | | | $ | 44.26 | | | $ | 75.04 | | | $ | 44.40 | | | $ | 41.36 | | | $ | 41.36 | |
| Income from | | | | | | | | | | | | | | | | | | | | | | | | |
| Investment Operations: | | | | | | | | | | | | | | | | | | | | | | | | |
Net investment loss1 | | | (0.14 | ) | | | (0.34 | ) | | | (0.41 | ) | | | (0.42 | ) | | | (0.34 | ) | | | (0.36 | ) |
Net realized and unrealized | | | | | | | | | | | | | | | | | | | | | | | | |
gain (loss) on investments | | | 3.13 | | | | 8.73 | | | | (17.41 | ) | | | 35.02 | | | | 3.38 | | | | 1.91 | |
| Total from | | | | | | | | | | | | | | | | | | | | | | | | |
| investment operations | | | 2.99 | | | | 8.39 | | | | (17.82 | ) | | | 34.60 | | | | 3.04 | | | | 1.55 | |
| Less Distributions: | | | | | | | | | | | | | | | | | | | | | | | | |
Distributions from | | | | | | | | | | | | | | | | | | | | | | | | |
net realized gains | | | — | | | | — | | | | (12.96 | ) | | | (3.96 | ) | | | — | | | | (1.55 | ) |
| Total distributions | | | — | | | | — | | | | (12.96 | ) | | | (3.96 | ) | | | — | | | | (1.55 | ) |
| Net Asset Value – | | | | | | | | | | | | | | | | | | | | | | | | |
| End of Period | | $ | 55.64 | | | $ | 52.65 | | | $ | 44.26 | | | $ | 75.04 | | | $ | 44.40 | | | $ | 41.36 | |
| Total Return | | 5.68 | %^ | | | 18.96 | % | | | (28.85 | )% | | | 80.27 | % | | | 7.35 | % | | | 4.30 | % |
| Ratios and | | | | | | | | | | | | | | | | | | | | | | | | |
| Supplemental Data: | | | | | | | | | | | | | | | | | | | | | | | | |
Net assets, end of | | | | | | | | | | | | | | | | | | | | | | | | |
year (thousands) | | $ | 150,226 | | | $ | 84,753 | | | $ | 39,866 | | | $ | 18,428 | | | $ | 9,274 | | | $ | 11,316 | |
Ratio of operating expenses | | | | | | | | | | | | | | | | | | | | | | | | |
to average net assets: | | | | | | | | | | | | | | | | | | | | | | | | |
| Before recoupments/ | | | | | | | | | | | | | | | | | | | | | | | | |
| reimbursements | | | 1.28 | %+ | | | 1.24 | % | | | 1.25 | % | | | 1.26 | % | | | 1.27 | % | | | 1.32 | % |
| After recoupments/ | | | | | | | | | | | | | | | | | | | | | | | | |
| reimbursements | | | 1.29 | %+ | | | 1.24 | % | | | 1.25 | % | | | 1.25 | % | | | 1.25 | % | | | 1.27 | % |
Ratio of net investment loss | | | | | | | | | | | | | | | | | | | | | | | | |
to average net assets: | | | | | | | | | | | | | | | | | | | | | | | | |
| Before recoupments/ | | | | | | | | | | | | | | | | | | | | | | | | |
| reimbursements | | | (0.56 | )%+ | | | (0.71 | )% | | | (0.71 | )% | | | (0.69 | )% | | | (0.90 | )% | | | (0.96 | )% |
| After recoupments/ | | | | | | | | | | | | | | | | | | | | | | | | |
| reimbursements | | | (0.57 | )%+ | | | (0.71 | )% | | | (0.71 | )% | | | (0.68 | )% | | | (0.88 | )% | | | (0.91 | )% |
Portfolio turnover rate | | 52 | %^ | | | 95 | % | | | 77 | % | | | 119 | % | | | 157 | % | | | 98 | % |
+ | Annualized |
^ | Not Annualized |
1 | The net investment loss per share was calculated using the average shares outstanding method. |
The accompanying notes are an integral part of these financial statements.
Hood River Small-Cap Growth Fund
For a capital share outstanding throughout each period
Institutional Shares
| | | Six Months | | | | | | | | | | | | | | | | |
| | | Ended | | | Year | | | Year | | | Year | | | Year | | | Year | |
| | | December 31, | | | Ended | | | Ended | | | Ended | | | Ended | | | Ended | |
| | | 2023 | | | June 30, | | | June 30, | | | June 30, | | | June 30, | | | June 30, | |
| | | (Unaudited) | | | 2023 | | | 2022 | | | 2021 | | | 2020 | | | 2019 | |
| Net Asset Value – | | | | | | | | | | | | | | | | | | |
| Beginning of Period | | $ | 53.70 | | | $ | 45.07 | | | $ | 76.04 | | | $ | 44.87 | | | $ | 41.71 | | | $ | 41.61 | |
| Income from | | | | | | | | | | | | | | | | | | | | | | | | |
| Investment Operations: | | | | | | | | | | | | | | | | | | | | | | | | |
Net investment loss1 | | | (0.09 | ) | | | (0.26 | ) | | | (0.32 | ) | | | (0.30 | ) | | | (0.27 | ) | | | (0.28 | ) |
Net realized and unrealized | | | | | | | | | | | | | | | | | | | | | | | | |
gain (loss) on investments | | | 3.20 | | | | 8.89 | | | | (17.69 | ) | | | 35.43 | | | | 3.43 | | | | 1.93 | |
| Total from | | | | | | | | | | | | | | | | | | | | | | | | |
| investment operations | | | 3.11 | | | | 8.63 | | | | (18.01 | ) | | | 35.13 | | | | 3.16 | | | | 1.65 | |
| Less Distributions: | | | | | | | | | | | | | | | | | | | | | | | | |
Distributions from | | | | | | | | | | | | | | | | | | | | | | | | |
net realized gains | | | — | | | | — | | | | (12.96 | ) | | | (3.96 | ) | | | — | | | | (1.55 | ) |
| Total distributions | | | — | | | | — | | | | (12.96 | ) | | | (3.96 | ) | | | — | | | | (1.55 | ) |
| Net Asset Value – | | | | | | | | | | | | | | | | | | | | | | | | |
| End of Period | | $ | 56.81 | | | $ | 53.70 | | | $ | 45.07 | | | $ | 76.04 | | | $ | 44.87 | | | $ | 41.71 | |
| Total Return | | 5.79 | %^ | | | 19.15 | % | | | (28.71 | )% | | | 80.66 | % | | | 7.55 | % | | | 4.52 | % |
| Ratios and | | | | | | | | | | | | | | | | | | | | | | | | |
| Supplemental Data: | | | | | | | | | | | | | | | | | | | | | | | | |
Net assets, end of | | | | | | | | | | | | | | | | | | | | | | | | |
year (thousands) | | $ | 879,284 | | | $ | 725,117 | | | $ | 438,898 | | | $ | 433,921 | | | $ | 257,909 | | | $ | 246,374 | |
Ratio of operating expenses | | | | | | | | | | | | | | | | | | | | | | | | |
to average net assets: | | | | | | | | | | | | | | | | | | | | | | | | |
| Before recoupments/ | | | | | | | | | | | | | | | | | | | | | | | | |
| reimbursements | | | 1.06 | %+ | | | 1.07 | % | | | 1.06 | % | | | 1.06 | % | | | 1.07 | % | | | 1.11 | % |
| After recoupments/ | | | | | | | | | | | | | | | | | | | | | | | | |
| reimbursements | | | 1.06 | %+ | | | 1.07 | % | | | 1.06 | % | | | 1.05 | % | | | 1.05 | % | | | 1.06 | % |
Ratio of net investment loss | | | | | | | | | | | | | | | | | | | | | | | | |
to average net assets: | | | | | | | | | | | | | | | | | | | | | | | | |
| Before recoupments/ | | | | | | | | | | | | | | | | | | | | | | | | |
| reimbursements | | | (0.33 | )%+ | | | (0.53 | )% | | | (0.52 | )% | | | (0.49 | )% | | | (0.69 | %) | | | (0.74 | )% |
| After recoupments/ | | | | | | | | | | | | | | | | | | | | | | | | |
| reimbursements | | | (0.33 | )%+ | | | (0.53 | )% | | | (0.52 | )% | | | (0.48 | )% | | | (0.67 | %) | | | (0.69 | )% |
Portfolio turnover rate | | 52 | %^ | | | 95 | % | | | 77 | % | | | 119 | % | | | 157 | % | | | 98 | % |
+ | Annualized |
^ | Not Annualized |
1 | The net investment loss per share was calculated using the average shares outstanding method. |
The accompanying notes are an integral part of these financial statements.
Hood River Small-Cap Growth Fund
For a capital share outstanding throughout each period
Retirement Shares
| | | Six Months | | | | | | | | | | | | | | | | |
| | | Ended | | | Year | | | Year | | | Year | | | Year | | | Year | |
| | | December 31, | | | Ended | | | Ended | | | Ended | | | Ended | | | Ended | |
| | | 2023 | | | June 30, | | | June 30, | | | June 30, | | | June 30, | | | June 30, | |
| | | (Unaudited) | | | 2023 | | | 2022 | | | 2021 | | | 2020 | | | 2019 | |
| Net Asset Value – | | | | | | | | | | | | | | | | | | |
| Beginning of Period | | $ | 54.01 | | | $ | 45.28 | | | $ | 76.29 | | | $ | 44.98 | | | $ | 41.78 | | | $ | 41.66 | |
| Income from | | | | | | | | | | | | | | | | | | | | | | | | |
| Investment Operations: | | | | | | | | | | | | | | | | | | | | | | | | |
Net investment loss1 | | | (0.07 | ) | | | (0.22 | ) | | | (0.29 | ) | | | (0.26 | ) | | | (0.25 | ) | | | (0.25 | ) |
Net realized and unrealized | | | | | | | | | | | | | | | | | | | | | | | | |
gain (loss) on investments | | | 3.20 | | | | 8.95 | | | | (17.76 | ) | | | 35.53 | | | | 3.45 | | | | 1.92 | |
| Total from | | | | | | | | | | | | | | | | | | | | | | | | |
| investment operations | | | 3.13 | | | | 8.73 | | | | (18.05 | ) | | | 35.27 | | | | 3.20 | | | | 1.67 | |
| Less Distributions: | | | | | | | | | | | | | | | | | | | | | | | | |
Distributions from | | | | | | | | | | | | | | | | | | | | | | | | |
net realized gains | | | — | | | | — | | | | (12.96 | ) | | | (3.96 | ) | | | — | | | | (1.55 | ) |
| Total distributions | | | — | | | | — | | | | (12.96 | ) | | | (3.96 | ) | | | — | | | | (1.55 | ) |
| Net Asset Value – | | | | | | | | | | | | | | | | | | | | | | | | |
| End of Period | | $ | 57.14 | | | $ | 54.01 | | | $ | 45.28 | | | $ | 76.29 | | | $ | 44.98 | | | $ | 41.78 | |
| Total Return | | 5.80 | %^ | | | 19.28 | % | | | (28.66 | )% | | | 80.76 | % | | | 7.61 | % | | | 4.59 | % |
| Ratios and | | | | | | | | | | | | | | | | | | | | | | | | |
| Supplemental Data: | | | | | | | | | | | | | | | | | | | | | | | | |
Net assets, end of | | | | | | | | | | | | | | | | | | | | | | | | |
period (thousands) | | $ | 844,971 | | | $ | 744,273 | | | $ | 549,066 | | | $ | 710,935 | | | $ | 335,863 | | | $ | 318,344 | |
Ratio of operating expenses | | | | | | | | | | | | | | | | | | | | | | | | |
to average net assets: | | | | | | | | | | | | | | | | | | | | | | | | |
| Before recoupments/ | | | | | | | | | | | | | | | | | | | | | | | | |
| reimbursements | | | 0.98 | %+ | | | 0.99 | % | | | 0.99 | % | | | 1.00 | % | | | 1.01 | % | | | 1.04 | % |
| After recoupments/ | | | | | | | | | | | | | | | | | | | | | | | | |
| reimbursements | | | 0.99 | %+ | | | 0.99 | % | | | 0.99 | % | | | 0.99 | % | | | 0.99 | % | | | 0.99 | % |
Ratio of net investment loss | | | | | | | | | | | | | | | | | | | | | | | | |
to average net assets: | | | | | | | | | | | | | | | | | | | | | | | | |
| Before recoupments/ | | | | | | | | | | | | | | | | | | | | | | | | |
| reimbursements | | | (0.25 | )%+ | | | (0.43 | )% | | | (0.45 | )% | | | (0.41 | )% | | | (0.64 | )% | | | (0.67 | )% |
| After recoupments/ | | | | | | | | | | | | | | | | | | | | | | | | |
| reimbursements | | | (0.26 | )%+ | | | (0.43 | )% | | | (0.45 | )% | | | (0.40 | )% | | | (0.62 | )% | | | (0.62 | )% |
Portfolio turnover rate | | 52 | %^ | | | 95 | % | | | 77 | % | | | 119 | % | | | 157 | % | | | 98 | % |
+ | Annualized |
^ | Not Annualized |
1 | The net investment loss per share was calculated using the average shares outstanding method. |
The accompanying notes are an integral part of these financial statements.
Hood River International Opportunity Fund
For a capital share outstanding throughout each period presented
Investor Shares
| | | Period from | |
| | | August 12, 2023 | |
| | | through | |
| | | December 31, 2023* | |
| | | (Unaudited) | |
| Net Asset Value – Beginning of Period | | $ | 9.15 | |
| | | | | |
| Income from Investment Operations: | | | | |
Net investment loss1 | | | (0.02 | ) |
Net realized and unrealized gain on investments | | | 0.75 | |
| Total from investment operations | | | 0.73 | |
| | | | | |
| Less Distributions: | | | | |
Distributions from net realized gains | | | (0.14 | ) |
| Total distributions | | | (0.14 | ) |
| | | | | |
| Net Asset Value – End of Period | | $ | 9.74 | |
| | | | | |
| Total Return | | 8.01 | %^ |
| | | | | |
| Ratios and Supplemental Data: | | | | |
Net assets, end of period (thousands) | | $ | 107 | |
| Ratio of operating expenses to average net assets: | | | | |
| Before reimbursements | | | 6.60 | %+ |
| After reimbursements | | | 1.40 | %+ |
Ratio of net investment income (loss) to average net assets: | | | | |
| Before reimbursements | | | (5.63 | )%+ |
| After reimbursements | | | (0.43 | )%+ |
Portfolio turnover rate | | 54 | %^ |
* | Operations commenced for the Investor Shares on August 12, 2023. |
+ | Annualized |
^ | Not Annualized |
1 | The net investment income/(loss) per share was calculated using the average shares outstanding method. |
The accompanying notes are an integral part of these financial statements.
Hood River International Opportunity Fund
For a capital share outstanding throughout each period presented
Institutional Shares
| | | Six Months Ended | | | | | September 28, 2021* |
| | December 31, 2023 | | Year Ended | | | through | |
| | | (Unaudited) | | | June 30, 2023 | | | June 30, 2022 | |
| Net Asset Value – | | | | | | | | | |
| Beginning of Period | | $ | 9.04 | | | $ | 7.02 | | | $ | 10.00 | |
| | | | | | | | | | | | | |
| Income from | | | | | | | | | | | | |
| Investment Operations: | | | | | | | | | | | | |
Net investment income(loss)1 | | | — | 2 | | | 0.04 | | | | (0.03 | ) |
Net realized and unrealized | | | | | | | | | | | | |
gain (loss) on investments | | | 0.85 | | | | 1.98 | | | | (2.93 | ) |
| Total from | | | | | | | | | | | | |
| investment operations | | | 0.85 | | | | 2.02 | | | | (2.96 | ) |
| | | | | | | | | | | | | |
| Less Distributions: | | | | | | | | | | | | |
Distributions from | | | | | | | | | | | | |
net realized gains | | | (0.14 | ) | | | — | | | | (0.02 | ) |
| Total distributions | | | (0.14 | ) | | | — | | | | (0.02 | ) |
| | | | | | | | | | | | | |
| Net Asset Value – End of Period | | $ | 9.75 | | | $ | 9.04 | | | $ | 7.02 | |
| | | | | | | | | | | | | |
| Total Return | | 9.35 | %^ | | | 28.77 | % | | (29.65 | )%^ |
| | | | | | | | | | | | | |
| Ratios and Supplemental Data: | | | | | | | | | | | | |
Net assets, end of period (thousands) | | $ | 4,171 | | | $ | 1,618 | | | $ | 1,590 | |
Ratio of operating expenses | | | | | | | | | | | | |
to average net assets: | | | | | | | | | | | | |
| Before reimbursements | | | 6.81 | %+ | | | 15.95 | % | | | 12.57 | %+ |
| After reimbursements | | | 1.31 | %+ | | | 1.50 | % | | | 1.50 | %+ |
Ratio of net investment income (loss) | | | | | | | | | | | | |
to average net assets: | | | | | | | | | | | | |
| Before reimbursements | | | (5.52 | )%+ | | | (13.87 | )% | | | (11.57 | )%+ |
| After reimbursements | | | (0.02 | )%+ | | | 0.58 | % | | | (0.50 | )%+ |
Portfolio turnover rate | | 54 | %^ | | | 172 | % | | 98 | %^ |
* | Operations commenced for the Institutional Shares on September 28, 2021. |
+ | Annualized |
^ | Not Annualized |
1 | The net investment income/(loss) per share was calculated using the average shares outstanding method. |
2 | Amount is less than $0.005. |
The accompanying notes are an integral part of these financial statements.
Hood River International Opportunity Fund
For a capital share outstanding throughout each period presented
Retirement Shares
| | | Six Months Ended | | | | | December 22, 2021* |
| | December 31, 2023 | | Year Ended | | | through | |
| | | (Unaudited) | | | June 30, 2023 | | | June 30, 2022 | |
| Net Asset Value – | | | | | | | | | |
| Beginning of Period | | $ | 9.06 | | | $ | 7.02 | | | $ | 10.06 | |
| | | | | | | | | | | | | |
| Income from | | | | | | | | | | | | |
| Investment Operations: | | | | | | | | | | | | |
Net investment income1 | | | — | 2 | | | 0.05 | | | | 0.02 | |
Net realized and unrealized | | | | | | | | | | | | |
gain (loss) on investments | | | 0.84 | | | | 1.99 | | | | (3.06 | ) |
| Total from | | | | | | | | | | | | |
| investment operations | | | 0.84 | | | | 2.04 | | | | (3.04 | ) |
| | | | | | | | | | | | | |
| Less Distributions: | | | | | | | | | | | | |
Distributions from | | | | | | | | | | | | |
net realized gains | | | (0.14 | ) | | | — | | | | — | |
| Total distributions | | | (0.14 | ) | | | — | | | | — | |
| | | | | | | | | | | | | |
| Net Asset Value – End of Period | | $ | 9.76 | | | $ | 9.06 | | | $ | 7.02 | |
| | | | | | | | | | | | | |
| Total Return | | 9.34 | %^ | | | 29.06 | % | | (30.22 | )%^ |
| | | | | | | | | | | | | |
| Ratios and Supplemental Data: | | | | | | | | | | | | |
Net assets, end of period (thousands) | | $ | 1,417 | | | $ | 907 | | | $ | 496 | |
Ratio of operating expenses | | | | | | | | | | | | |
to average net assets: | | | | | | | | | | | | |
| Before reimbursements | | | 6.94 | %+ | | | 16.29 | % | | | 11.80 | %+ |
| After reimbursements | | | 1.31 | %+ | | | 1.40 | % | | | 1.40 | %+ |
Ratio of net investment income (loss) | | | | | | | | | | | | |
to average net assets: | | | | | | | | | | | | |
| Before reimbursements | | | (5.66 | )%+ | | | (14.22 | )% | | | (9.95 | )%+ |
| After reimbursements | | | (0.03 | )%+ | | | 0.67 | % | | | 0.45 | %+ |
Portfolio turnover rate | | 54 | %^ | | | 172 | % | | 98 | %^ |
* | Operations commenced for the Retirement Shares on December 22, 2021. |
+ | Annualized |
^ | Not Annualized |
1 | The net investment income per share was calculated using the average shares outstanding method. |
2 | Amount is less than $0.005. |
The accompanying notes are an integral part of these financial statements.
Hood River Funds
| NOTES TO FINANCIAL STATEMENTS |
| December 31, 2023 (Unaudited) |
NOTE 1 – ORGANIZATION
Manager Directed Portfolios Trust (the “Trust”) is registered under the Investment Company Act of 1940, as amended (the “1940 Act”), as an open-end management investment company consisting of multiple series, and was organized as a Delaware statutory trust on April 4, 2006. These financial statements include the Hood River Small-Cap Growth Fund and the Hood River International Opportunity Fund (each a “Fund” and collectively, the “Funds”). The Funds are both open-end investment management companies that are a diversified series of the Trust. The investment objective of the Funds is long-term growth of capital. The Hood River Small-Cap Growth Fund’s Institutional Shares commenced operations on January 2, 2003. The Hood River Small-Cap Growth Fund’s Investor Shares commenced operations on July 7, 2015. The Hood River Small-Cap Growth Fund’s Retirement Shares commenced operations on March 3, 2017. The Hood River International Opportunity Fund’s Institutional Shares commenced operations on September 28, 2021. The Hood River International Opportunity Fund’s Retirement Shares commenced operations on December 22, 2021. The Hood River International Opportunity Fund’s Investor Shares commenced operations on August 12, 2023. Each class of shares differs principally in its respective distribution or shareholder servicing expenses. Each class of shares has identical rights to earnings, assets and voting privileges, except for class-specific expenses and exclusive rights to vote on matters affecting only individual classes.
NOTE 2 – SIGNIFICANT ACCOUNTING POLICIES
The following is a summary of significant accounting policies consistently followed by the Funds. These policies are in conformity with U.S. generally accepted accounting principles (“GAAP”). Each Fund is an investment company and accordingly follows the investment company accounting and reporting guidance of the Financial Accounting Standards Board (FASB) Accounting Standard Codification Topic 946 “Financial Services – Investment Companies” including FASB Accounting Standard Update ASU 2013-08.
| | A. | Security Valuation: All investments in securities are recorded at their estimated fair value, as described in Note 3. |
| | | |
| | B. | Federal Income Taxes: It is each Fund’s policy to continue to comply with the requirements of Subchapter M of the Internal Revenue Code applicable to regulated investment companies and to distribute substantially all of its taxable income to its shareholders. Therefore, no federal income or excise tax provisions are required. |
| | | |
| | | The Funds recognize the tax benefits of uncertain tax positions only where the position is “more likely than not” to be sustained assuming examination by tax authorities. Management has analyzed the Funds’ tax positions, and has concluded that no liability for unrecognized tax benefits should be recorded related to uncertain tax positions to be taken or expected to be taken on a tax return. The tax |
Hood River Funds
| NOTES TO FINANCIAL STATEMENTS (Continued) |
| December 31, 2023 (Unaudited) |
| | | returns for the Funds for the prior three fiscal years are open for examination. The Funds identify their major tax jurisdictions as U.S. Federal and the state of Delaware. The Funds recognize interest and penalties, if any, related to unrecognized tax benefits as income tax expense on the Statements of Operations. Management of the Funds are required to determine whether a tax position taken by the Funds is more likely than not to be sustained upon examination by the applicable taxing authority. Based on its analysis, Management has concluded that the Funds do not have any unrecognized tax benefits or uncertain tax positions that would require a provision for income tax. Accordingly, the Funds did not incur any interest or penalties for the period ended December 31, 2023. |
| | | |
| | C. | Securities Transactions, Income and Distributions: Securities transactions are accounted for on the trade date. Realized gains and losses on securities sold are determined on the basis of identified cost. Interest income is recorded on an accrual basis. Dividend income and distributions to shareholders are recorded on the ex-dividend date. Withholding taxes on foreign dividends have been provided for in accordance with the Funds’ understanding of the applicable country’s tax rules and rates. |
| | | |
| | | The Funds distribute substantially all of their net investment income, if any, and net realized capital gains, if any, annually. Distributions from net realized gains for book purposes may include short-term capital gains. All short-term capital gains are included in ordinary income for tax purposes. The amount of dividends and distributions to shareholders from net investment income and net realized capital gains is determined in accordance with federal income tax regulations, which differ from GAAP. To the extent these book/tax differences are permanent, such amounts are reclassified within the capital accounts based on their federal tax treatment. |
| | | |
| | | Investment income, expenses (other than those specific to the class of shares), and realized and unrealized gains and losses on investments are allocated to the separate classes of the Funds’ shares based upon their relative net assets on the date income is earned or expensed and realized and unrealized gains and losses are incurred. |
| | | |
| | | The Funds are charged for those expenses that are directly attributable to it, such as investment advisory, custody and transfer agent fees. Expenses that are not attributable to the Funds are typically allocated among the funds in the Trust proportionately based on allocation methods approved by the Board of Trustees (the “Board”). Common expenses of the Trust are typically allocated among the funds in the Trust based on a fund’s respective net assets, or by other equitable means. |
| | | |
| | D. | Use of Estimates: The preparation of financial statements in conformity with GAAP requires management to make estimates and assumptions that affect the reported amounts of assets and liabilities at the date of the financial statements and the reported amounts of increases and decreases in net assets during the reporting period. Actual results could differ from those estimates. |
Hood River Funds
| NOTES TO FINANCIAL STATEMENTS (Continued) |
| December 31, 2023 (Unaudited) |
| | E. | Reclassification of Capital Accounts: GAAP requires that certain components of net assets relating to permanent differences be reclassified between financial and tax reporting. These reclassifications have no effect on net assets or net asset value per share. |
| | | |
| | F. | Foreign Currency: Values of investments denominated in foreign currencies are converted into U.S. dollars using the spot market rate of exchange at the time of valuation. Purchases and sales of investments and income are translated into U.S. dollars using the spot market rate of exchange prevailing on the respective dates of such transactions. The Funds do not isolate the portion of the results of operations resulting from fluctuations in foreign exchange rates on investments from fluctuations resulting from changes in the market prices of securities held. Such fluctuations are included with the net realized and unrealized gain/loss on investments. Foreign investments present additional risks due to currency fluctuations, economic and political factors, lower liquidity, government regulations, differences in accounting standards, and other factors. |
| | | |
| | G. | Events Subsequent to the Fiscal Period End: In preparing the financial statements as of December 31, 2023, and through the date the financial statements were available to be issued, management considered the impact of subsequent events for potential recognition or disclosure in the financial statements and had concluded that no additional disclosures are necessary. |
NOTE 3 – SECURITIES VALUATION
The Funds have adopted authoritative fair value accounting standards which establish an authoritative definition of fair value and set out a hierarchy for measuring fair value. These standards require additional disclosures about the various inputs and valuation techniques used to develop the measurements of fair value, a discussion of changes in valuation techniques and related inputs during the period, and expanded disclosure of valuation levels for major security types. These inputs are summarized in the three broad levels listed below:
| | Level 1 – | Unadjusted quoted prices in active markets for identical assets or liabilities that the Fund has the ability to access. |
| | | |
| | Level 2 – | Observable inputs other than quoted prices included in Level 1 that are observable for the asset or liability, either directly or indirectly. These inputs may include quoted prices for the identical instrument on an inactive market, prices for similar instruments, interest rates, prepayment speeds, credit risk, yield curves, default rates and similar data. |
| | | |
| | Level 3 – | Unobservable inputs for the asset or liability, to the extent relevant observable inputs are not available, representing the Fund’s own assumptions about the assumptions a market participant would use in valuing the asset or liability, and would be based on the best information available. |
Hood River Funds
| NOTES TO FINANCIAL STATEMENTS (Continued) |
| December 31, 2023 (Unaudited) |
Following is a description of the valuation techniques applied to the Funds’ major categories of assets and liabilities measured at fair value on a recurring basis.
Equity Securities: Equity securities, including common stocks, preferred stocks, foreign-issued common stocks, exchange-traded funds, closed-end mutual funds and real estate investment trusts (REITs), that are primarily traded on a national securities exchange shall be valued at the last sale price on the exchange on which they are primarily traded on the day of valuation or, if there has been no sale on such day, at the mean between the bid and asked prices. Securities primarily traded in the NASDAQ Global Market System for which market quotations are readily available shall be valued using the NASDAQ Official Closing Price (“NOCP”). If the NOCP is not available, such securities shall be valued at the last sale price on the day of valuation, or if there has been no sale on such day, at the mean between the bid and asked prices. Over-the-counter securities that are not traded on a listed exchange are valued at the last sale price in the over-the-counter market. Over-the-counter securities which are not traded in the NASDAQ Global Market System shall be valued at the mean between the bid and asked prices. To the extent these securities are actively traded and valuation adjustments are not applied, they are categorized in Level 1 of the fair value hierarchy.
Registered Investment Companies: Investments in registered investment companies (e.g., mutual funds) are generally priced at the ending NAV provided by the applicable registered investment company’s service agent and will be classified in Level 1 of the fair value hierarchy.
Short-Term Debt Securities: Debt securities, including short-term debt instruments having a maturity of less than 60 days, are valued at the evaluated mean price supplied by an approved pricing service. Pricing services may use various valuation methodologies including matrix pricing and other analytical pricing models as well as market transactions and dealer quotations. In the absence of prices from a pricing service, the securities will be priced in accordance with the procedures adopted by the Board. Short-term securities are generally classified in Level 1 or Level 2 of the fair market hierarchy depending on the inputs used and market activity levels for specific securities.
In the absence of prices from a pricing service or in the event that market quotations are not readily available, fair value will be determined under the Fund’s valuation procedures adopted pursuant to Rule 2a-5. Pursuant to those procedures, the Board has appointed the Advisor as the Fund’s valuation designee (the “Valuation Designee”) to perform all fair valuations of the Fund’s portfolio investments, subject to the Board’s oversight. As the Valuation Designee, the Advisor has established procedures for its fair valuation of the Fund’s portfolio investments. These procedures address, among other things, determining when market quotations are not readily available or reliable and the methodologies to be used for determining the fair value of investments, as well as the use and oversight of third-party pricing services for fair valuation.
Hood River Funds
| NOTES TO FINANCIAL STATEMENTS (Continued) |
| December 31, 2023 (Unaudited) |
The fair valuation of foreign securities may be determined with the assistance of a pricing service using correlations between the movement of prices of such securities and indices of domestic securities and other appropriate indicators, such as closing market prices of relevant American Depositary Receipts or futures contracts. The Hood River International Opportunity Fund uses ICE Data Services (“ICE”) as a third party fair valuation vendor. ICE provides a fair value for foreign securities in the Fund based on certain factors and methodologies applied by ICE in the event that there is a movement in the U.S. markets that exceeds a specific threshold established by the Valuation Committee. The effect of using fair value pricing is that the Fund’s NAV will reflect the affected portfolio securities’ values as determined by the Board or its designee instead of being determined by the market. Using a fair value pricing methodology to price a foreign security may result in a value that is different from the foreign security’s most recent closing price and from the prices used by other investment companies to calculate their NAVs and are generally classified in Level 2 of the fair valuation hierarchy. Because the Fund may invest in foreign securities, the value of the Fund’s portfolio securities may change on days when you will not be able to purchase or redeem your shares.
Depending on the relative significance of the valuation inputs, fair valued securities may be classified in either Level 2 or Level 3 of the fair value hierarchy.
Hood River Funds
| NOTES TO FINANCIAL STATEMENTS (Continued) |
| December 31, 2023 (Unaudited) |
The inputs or methodology used for valuing securities are not an indication of the risk associated with investing in those securities. The following is a summary of the fair valuation hierarchy of the Funds’ securities as of December 31, 2023:
Hood River Small-Cap Growth Fund
| | | Level 1 | | | Level 2 | | | Level 3 | | | Total | |
| Common Stocks | | | | | | | | | | | | |
| Communication Services | | $ | 26,694,439 | | | $ | — | | | $ | — | | | $ | 23,694,439 | |
| Consumer Discretionary | | | 133,443,762 | | | | — | | | | — | | | | 133,443,762 | |
| Consumer Staples | | | 21,815,469 | | | | — | | | | — | | | | 21,815,469 | |
| Energy | | | 55,775,793 | | | | — | | | | — | | | | 55,775,793 | |
| Financials | | | 159,929,440 | | | | — | | | | — | | | | 159,929,440 | |
| Health Care | | | 381,355,011 | | | | — | | | | — | | | | 381,355,011 | |
| Industrials | | | 459,123,492 | | | | — | | | | — | | | | 459,123,492 | |
| Information Technology | | | 512,076,083 | | | | — | | | | — | | | | 512,076,083 | |
| Materials | | | 76,344,903 | | | | — | | | | — | | | | 76,344,903 | |
| Total Common Stocks | | | 1,823,558,392 | | | | — | | | | — | | | | 1,823,558,392 | |
| REITs | | | 10,492,949 | | | | — | | | | — | | | | 10,492,949 | |
| Short-Term Investments | | | 41,993,331 | | | | — | | | | — | | | | 41,993,331 | |
| Investments Purchased | | | | | | | | | | | | | | | | |
| with Cash Proceeds | | | | | | | | | | | | | | | | |
| from Securities Lending* | | | — | | | | — | | | | — | | | | 289,936,235 | |
| Total Investments | | | | | | | | | | | | | | | | |
| in Securities | | $ | 1,876,044,672 | | | $ | — | | | $ | — | | | $ | 2,165,980,907 | |
| * | Investments valued using the NAV per share practical expedient in accordance with Topic 820, the investment is excluded from the fair value hierarchy. The investment is included in the total column for the purpose of reconciling the table to the schedule of investments. |
Hood River Funds
| NOTES TO FINANCIAL STATEMENTS (Continued) |
| December 31, 2023 (Unaudited) |
Hood River International Opportunity Fund
| | | Level 1 | | | Level 2 | | | Level 3 | | | Total | |
| Common Stocks | | | | | | | | | | | | |
| Communication Services | | $ | 83,032 | | | $ | 73,968 | | | $ | — | | | $ | 157,000 | |
| Consumer Discretionary | | | 197,909 | | | | 434,238 | | | | — | | | | 632,147 | |
| Consumer Staples | | | — | | | | 102,877 | | | | — | | | | 102,877 | |
| Energy | | | 195,435 | | | | 144,209 | | | | — | | | | 339,644 | |
| Financials | | | 186,654 | | | | 274,229 | | | | — | | | | 460,883 | |
| Health Care | | | 329,837 | | | | — | | | | — | | | | 329,837 | |
| Industrials | | | 547,407 | | | | 1,067,203 | | | | — | | | | 1,614,610 | |
| Information Technology | | | 661,259 | | | | 611,913 | | | | — | | | | 1,273,172 | |
| Materials | | | 82,087 | | | | — | | | | — | | | | 82,087 | |
| Real Estate | | | 130,220 | | | | 71,214 | | | | — | | | | 201,434 | |
| Total Common Stocks | | | 2,413,840 | | | | 2,779,851 | | | | — | | | | 5,193,691 | |
| REITs | | | 115,516 | | | | — | | | | — | | | | 115,516 | |
| Mutual Funds | | | 98,896 | | | | — | | | | — | | | | 98,896 | |
| Exchange Traded Funds | | | 20,070 | | | | — | | | | — | | | | 20,070 | |
| Short-Term Investments | | | 227,529 | | | | — | | | | — | | | | 227,529 | |
| Total Investments | | | | | | | | | | | | | | | | |
| in Securities | | $ | 2,875,851 | | | $ | 2,779,851 | | | $ | — | | | $ | 5,655,702 | |
NOTE 4 – INVESTMENT ADVISORY FEE AND OTHER TRANSACTIONS WITH AFFILIATES
For the six months ended December 31, 2023, Hood River Capital Management LLC, (the “Advisor”) provided the Funds with investment management services under an Investment Advisory Agreement. The Advisor furnishes all investment advice, office space, and facilities, and provides most of the personnel needed by the Fund. As compensation for its services, the Advisor is entitled to a monthly fee at an annual rate of 0.90% of the average daily net assets of the Small Cap-Growth Fund and 1.05% for the International Opportunity Fund. Prior to October 31, 2023, the Advisor was entitled to a monthly fee at an annual rate of 1.30% for the International Opportunity Fund. For the six months ended December 31, 2023, the Small-Cap Growth Fund incurred $7,186,412 in advisory fees. Advisory fees payable at December 31, 2023 for the Small-Cap Growth Fund were $1,372,471. For the six months ended December 31, 2023, the International Opportunity Fund incurred $27,523 in advisory fees. Advisory fees payable at December 31, 2023 for the International Opportunity Fund were $0, and the Fund had an expense reimbursement receivable in the amount of $17,232 due from the advisor.
Each Fund is responsible for its own operating expenses. The Advisor has contractually agreed to waive its management fees and/or absorb expenses of the Fund to ensure that the total annual operating expenses excluding front-end or contingent deferred
Hood River Funds
| NOTES TO FINANCIAL STATEMENTS (Continued) |
| December 31, 2023 (Unaudited) |
loads, Rule 12b-1 plan fees, shareholder servicing plan fees, taxes, leverage (i.e. any expenses incurred in connection with borrowings made by the Fund, interest (including interest incurred in connection with bank and custody overdrafts), brokerage commissions and other transactional expenses, expenses incurred with any merger or reorganization, dividends and interest on short positions, acquired fund fees and extraordinary expenses such as litigation) do not exceed the following amounts of the average daily net assets for each class of shares:
| | Hood River Small-Cap Growth Fund |
| | Investor Shares | 0.99% |
| | Institutional Shares | 0.99% |
| | Retirement Shares | 0.99% |
| | |
| | Hood River International Opportunity Fund |
| | Investor Shares | 1.15% |
| | Institutional Shares | 1.15% |
| | Retirement Shares | 1.15% |
Six months ended December 31, 2023, the Advisor waived fees and reimbursed expenses in the amounts of $0 and $126,333, respectively, for the Small-Cap Growth Fund and International Opportunity Fund. The Hood River Small-Cap Growth fund also paid recoupments to the advisor in the amount of $50,766 for the six months ended December 31, 2023. The waivers and reimbursements will remain in effect through October 31, 2024 for the Small-Cap Growth Fund and for the International Opportunity Fund, unless terminated sooner by mutual agreement of the Board and the Advisor.
The Advisor may request recoupment of previously waived fees and paid expenses in any subsequent month dating back to January 1, 2021 for the Hood River Small-Cap Growth fund, and September 28, 2021 for the Hood River International Opportunity Fund, if the aggregate amount actually paid by the Fund toward the operating expenses for such fiscal year (taking into account the reimbursement) will not cause the Funds to exceed the lesser of: (1) the expense limitation in place at the time of the management fee reduction and expense payment; or (2) the expense limitation in place at the time of the reimbursement. Any such reimbursement is also contingent upon Board of Trustees review and approval at the time the reimbursement is made. Such reimbursement may not be paid prior to the Funds’ payment of current ordinary operating expenses. Cumulative expenses subject to recapture pursuant to the aforementioned conditions expire as follows:
| | | | Amount | | Expiration | |
| | Small-Cap Growth Fund | | $ | 15,384 | | 6/30/2026 | |
| | | | $ | 7,125 | | 12/31/2026 | |
| | International Opportunity Fund | | $ | 191,498 | | 6/30/2025 | |
| | | | $ | 300,864 | | 6/30/2026 | |
| | | | $ | 126,333 | | 12/31/2026 | |
Hood River Funds
| NOTES TO FINANCIAL STATEMENTS (Continued) |
| December 31, 2023 (Unaudited) |
U.S. Bancorp Fund Services, LLC, doing business as U.S. Bank Global Fund Services, LLC (“Fund Services” or the “Administrator”) acts as the Fund’s Administrator under an Administration Agreement. The Administrator prepares various federal and state regulatory filings, reports and returns for the Fund; prepares reports and materials to be supplied to the Trustees; monitors the activities of the Funds’ custodian, transfer agent and accountants; coordinates the preparation and payment of the Funds’ expenses and reviews the Funds’ expense accruals. Fund Services also serves as the fund accountant, Chief Compliance Officer, and transfer agent to the Funds. U.S. Bank N.A., an affiliate of Fund Services, serves as the Funds’ custodian. For the six months ended December 31, 2023, the Funds incurred the following expenses for administration, fund accounting, transfer agency, custody, and compliance fees:
| | | | Small-Cap | | | International | |
| | | | Growth Fund | | | Opportunity Fund | |
| | Administration & fund accounting | | $ | 347,019 | | | $ | 12,074 | |
| | Custody | | $ | 44,636 | | | $ | 13,258 | |
| | Transfer agency | | $ | 115,128 | | | $ | 29,934 | |
| | Compliance | | $ | 6,256 | | | $ | 6,256 | |
At December 31, 2023, the Funds had payables due to Fund Services for administration, fund accounting and transfer agency fees, compliance fees and to U.S. Bank N.A. for custody fees in the following amounts:
| | | | Small-Cap | | | International | |
| | | | Growth Fund | | | Opportunity Fund | |
| | Administration & fund accounting | | $ | 171,408 | | | $ | 5,390 | |
| | Custody | | $ | 15,112 | | | $ | 8,373 | |
| | Transfer agency | | $ | 54,483 | | | $ | 12,593 | |
| | Compliance | | $ | 3,206 | | | $ | 3,144 | |
Quasar Distributors, LLC (the “Distributor”) acts as the Funds’ principal underwriter in a continuous public offering of the Fund’s shares.
Certain officers of the Fund are employees of the Administrator and are not paid any fees by the Fund for serving in such capacities.
NOTE 5 – DISTRIBUTION AGREEMENT AND PLAN
The Small-Cap Growth and International Opportunity Funds have adopted a Distribution Plan pursuant to Rule 12b-1 (the “Plan”). The Plan permits the Funds to pay for distribution and related expenses at an annual rate of up to 0.25% of the average daily net assets of the Funds’ Investor Shares. The expenses covered by the Plan may include costs in connection with the promotion and distribution of shares and the provision of personal services to shareholders, including, but not necessarily limited to, advertising, compensation to underwriters, dealers and selling personnel, the printing and mailing of prospectuses to other than current Fund shareholders, and the printing and mailing of
Hood River Funds
| NOTES TO FINANCIAL STATEMENTS (Continued) |
| December 31, 2023 (Unaudited) |
sales literature. Payments made pursuant to the Plan will represent compensation for distribution and service activities, not reimbursements for specific expenses incurred. For the six months ended December 31, 2023, the Small-Cap Growth Fund incurred distribution expenses on its Investor Shares of $116,908. For the six months ended December 31, 2023, the investor shares of the International Opportunity Fund incurred distribution expenses in the amount $31.
NOTE 6 – SHAREHOLDER SERVICING FEE
The Funds have adopted a shareholder servicing plan (the “Plan”) on behalf of the Small-Cap Growth Funds’ Investor and Institutional Share Classes and the International Opportunity Fund’s Institutional Share Class. Under the Plan, the Investor and Institutional Share Classes for each Fund are authorized to pay an annual shareholder servicing fee of up to 0.10% of each class’s average daily net assets. This fee is used to finance certain activities related to servicing and maintaining shareholder accounts. Payments made under the Plan may not be used to pay for any services in connection with the distribution and sale of the Investor and Institutional Shares.
Payments to the Advisor under the Plan may reimburse the Advisor for payments it makes to selected brokers, dealers and administrators which have entered into service agreements with the Advisor for services provided to Investor and Institutional Class shareholders of the Funds. The services provided by such intermediaries are primarily designed to assist Investor and Institutional Class shareholders of the Funds and include the furnishing of office space and equipment, telephone facilities, personnel, and assistance to the Funds in servicing such shareholders. Services provided by such intermediaries also include the provision of support services to the Funds and include establishing and maintaining shareholders’ accounts and record processing, purchase and redemption transactions, answering routine client inquiries regarding the Funds, and providing such other personal services to shareholders as the Funds may reasonably request. For the six months ended December 31, 2023, the Funds incurred, under the Agreement, shareholder servicing fees as follows:
| | | | Small-Cap | | | International | |
| | | | Growth Fund | | | Opportunity Fund | |
| | Investor Shares | | $ | 56,040 | | | | N/A | |
| | Institutional Shares | | $ | 277,089 | | | | N/A | |
NOTE 7 – SECURITIES TRANSACTIONS
For the six months ended December 31, 2023, the cost of purchases and the proceeds from sales of securities, excluding short-term securities, were as follows:
| | | | Purchases | | | Sales | |
| | Small-Cap Growth Fund | | $ | 1,041,035,101 | | | $ | 821,586,662 | |
| | International Opportunity Fund | | $ | 5,073,910 | | | $ | 2,248,624 | |
There were no purchases or sales of long-term U.S. Government securities.
Hood River Funds
| NOTES TO FINANCIAL STATEMENTS (Continued) |
| December 31, 2023 (Unaudited) |
NOTE 8 – INCOME TAXES AND DISTRIBUTIONS TO SHAREHOLDERS
As of June 30, 2023, the Funds’ most recent fiscal year end, the components of accumulated earnings/(losses) on a tax basis were as follows:
| | | | Small-Cap | | | International | |
| | | | Growth Fund | | | Opportunity Fund | |
| | Cost of investments(a) | | $ | 1,613,102,375 | | | $ | 2,213,203 | |
| | Gross unrealized appreciation | | | 376,918,099 | | | | 391,583 | |
| | Gross unrealized depreciation | | | (58,880,044 | ) | | | (87,996 | ) |
| | Net unrealized depreciation | | | 318,038,055 | | | | 303,587 | |
| | Undistributed ordinary income | | | — | | | | 17,290 | |
| | Undistributed long-term capital gain | | | — | | | | — | |
| | Total distributable earnings | | | — | | | | 17,290 | |
| | Other accumulated gains/(losses) | | | (118,122,563 | ) | | | (614,233 | ) |
| | Total accumulated earnings/(losses) | | $ | 199,915,492 | | | $ | (293,356 | ) |
| | (a) | The difference between the book basis and tax basis net unrealized appreciation and cost is attributable primarily to wash sales and partnership adjustments. |
As of June 30, 2023, the Small-Cap Growth Fund had short-term capital losses in the amount of $114,944,988 with no expiration to offset future capital gains. The International Opportunity Fund had short-term capital losses in the amount of $549,346, and long-term capital losses in the amount of $52,083, with no expiration to offset future capital gains.
As of June 30, 2023, the Funds deferred, on a tax basis, post-October losses of:
| | | | | | Ordinary Late Year |
| | | | Capital | | | Loss Deferral | |
| | Small-Cap Growth Fund | | $ | — | | | $ | 2,827,984 | |
| | International Opportunity Fund | | | — | | | | — | |
For the fiscal year ended June 30, 2023, the effect of permanent “book/tax” reclassifications resulted in increases and decreases to components of the Funds’ net assets as follows:
| | | | Total accumulated | | | Capital | |
| | | | earnings/(loss) | | | stock | |
| | Small-Cap Growth Fund | | $ | 5,833,720 | | | $ | (5,833,720 | ) |
| | International Opportunity Fund | | | — | | | | — | |
Hood River Funds
| NOTES TO FINANCIAL STATEMENTS (Continued) |
| December 31, 2023 (Unaudited) |
The tax character of distributions paid during the year ended June 30, 2023, and the year ended June 30, 2022 were as follows:
| | | | Year Ended | | | Year Ended | |
| | | | June 30, 2023 | | | June 30, 2022 | |
| | Small-Cap Growth Fund | | | | | | |
| | Ordinary income | | $ | — | | | $ | 117,432,276 | |
| | Long-term capital gains | | | — | | | | 96,815,103 | |
| | | | | — | | | $ | 214,247,379 | |
| | International Opportunity Fund | | | | | | | | |
| | Ordinary income | | $ | — | | | $ | 4,849 | |
NOTE 9 – SECURITIES LENDING
The Small-Cap Growth Fund participates in securities lending arrangements whereby it lends certain of its portfolio securities to brokers, dealers and financial institutions (not with individuals) in order to receive additional income and increase the rate of return of its portfolio. U.S. Bank, N.A. serves as the Fund’s securities lending agent.
U.S. Bank, N.A. oversees the securities lending process, which includes the screening, selection and ongoing review of borrowers, monitoring the availability of securities, negotiating rebates, daily marking to market of loans, monitoring and maintaining cash collateral levels, processing securities movements and reinvesting cash collateral as directed by the Adviser.
The Small-Cap Growth Fund may lend securities pursuant to agreements that require the loans to be secured by collateral consisting of cash, securities of the U.S. Government or it agencies, or any combination of cash and such securities. At the time of loans, the collateral value should at least be equal to 102% of domestic securities and 105% of foreign securities. The value of loaned securities will then be marked-to-market daily and the collateral will be continuously secured by collateral equal to 100% of the market value of the loaned securities. Such loans will not be made if, as a result, the aggregate amount of all outstanding securities loans for the Fund exceeds one-third of the value of the Small-Cap Growth Fund’s total assets taken at fair market value. The Small-Cap Growth Fund will earn interest on the investment of the cash collateral in U.S. Government securities, short-term money market instruments or such other approved vehicle. However, the Small-Cap Growth Fund will normally pay lending fees to such broker-dealers and related expenses from the interest earned on invested collateral. There may be risks of delay in receiving additional collateral or risks of delay in recovery of the securities and even loss of rights in the collateral should the borrower of the securities fail financially. However, loans are made only to borrowers deemed by the adviser to be of good standing and when, in the judgment of the adviser, the consideration that can be earned currently from such securities loans justifies the attendant risk. Either party, upon reasonable notice to the other party, may terminate the loan.
Hood River Funds
| NOTES TO FINANCIAL STATEMENTS (Continued) |
| December 31, 2023 (Unaudited) |
As of December 31, 2023, the Fund had loaned securities that were collateralized by cash. The cash collateral received was invested in securities as listed in the Fund’s Schedule of Investments.
The following table presents the securities out on loan for the Fund, and the collateral delivered related to those securities, as of the end of the reporting period.
Securities Lending Transactions
| | | | Investments | | |
| | | | Purchased with | Collateral | |
| | Overnight and | Asset Class | Proceeds from | Pledged | Net |
| | Continuous | out on Loan | Securities Lending | Counterparty^ | Exposure |
| | Hood River Small – | | | | |
| | Cap Growth Fund | Common Stock | $289,936,235 | $289,936,235 | $ — |
| | ^ | As of the end of the reporting period, the value of the collateral pledged from the counterparty exceeded the value of the securities out on loan. Refer to the Fund’s Schedule of Investments for details on the securities out on loan. |
NOTE 10 – PRINCIPAL RISKS
The following is a list of certain risks that may apply to your investment in the Funds. Further information about investment risks is available in the Funds’ Statement of Additional Information.
General Market Risk; Recent Market Events: The market value of a security may move up or down, sometimes rapidly and unpredictably. These fluctuations may cause a security to be worth less than the price originally paid for it, or less than it was worth at an earlier time. Market risk may affect a single issuer, industry, sector of the economy or the market as a whole. U.S. and international markets have experienced volatility in recent months and years due to a number of economic, political and global macro factors, including rising inflation, the war between Russia and Ukraine and the impact of the coronavirus (COVID-19) global pandemic. While U.S. and global economies are recovering from the effects of COVID-19, labor shortages and the inability to meet consumer demand have restricted growth. Uncertainties regarding the level of central banks’ interest rate increases, political events, the Russia-Ukraine conflict, trade tensions and the possibility of a national or global recession have also contributed to market volatility.
Global economies and financial markets are increasingly interconnected, which increases the possibility that conditions in one country or region might adversely impact issuers in a different country or region. Continuing market volatility because of recent market conditions or other events may have adverse effects on the Fund’s returns. The Adviser will monitor developments and seek to manage the Fund in a manner consistent with achieving the Fund’s investment objective, but there can be no assurance that they will be successful in doing so.
Hood River Funds
| NOTES TO FINANCIAL STATEMENTS (Continued) |
| December 31, 2023 (Unaudited) |
Small-Cap Company Risk: Companies in which the Funds invest may be more vulnerable than larger companies to adverse business or economic developments. Small-cap companies may also have limited product lines, markets, or financial resources, may be dependent on relatively small or inexperienced management groups, and may operate in industries characterized by rapid technological obsolescence. Securities of such companies may be less liquid, more volatile, and more difficult to value than securities of larger companies and therefore may involve greater risk than investing in large companies.
Equity Market Risk: Equity securities are susceptible to general stock market fluctuations due to economic, market, political and issuer-specific considerations and to potential volatile increases and decreases in value as market confidence in and perceptions of their issuers change.
Growth-Style Investing Risk: An investment in a growth-oriented fund may be more volatile than the rest of the U.S. market as a whole. If the investment adviser’s assessment of a company’s prospects for earnings growth or how other investors will value the company’s earnings growth is incorrect, the stock may fail to reach the value that the adviser has placed on it. Growth stock prices tend to fluctuate more dramatically than the overall stock market.
Foreign Securities and Currency Risk: Foreign securities are subject to risks relating to political, social and economic developments abroad and differences between U.S. and foreign regulatory requirements and market practices. Those risks are increased for investments in emerging markets. Securities that are denominated in foreign currencies are subject to further risk that the value of the foreign currency will fall in relation to the U.S. dollar and/or will be affected by volatile currency markets or actions of U.S. and foreign governments or central banks. Income earned on foreign securities may be subject to foreign withholding taxes.
IPO Risk: The Funds may purchase securities of companies engaged in initial public offerings (“IPOs”). The price of securities purchased in IPOs can be very volatile. The Funds’ investments in IPO shares may include the securities of “unseasoned” companies (companies with less than three years of continuous operations), which present risks considerably greater than common stocks of more established companies. These companies may be involved in new and evolving businesses and may be vulnerable to competition and changes in technology, markets and economic conditions. They may be more dependent on key managers and third parties and may have limited product lines. The effect of IPO investments on a Fund’s performance depends on a variety of factors, including the number of IPOs the Funds invest in relative to the size of the Funds, and whether and to what extent a security purchased in an IPO appreciates or depreciates in value. When the Funds’ asset base is small, a significant portion of the Funds’ performance could be attributable to investments in IPOs because such investments would have a magnified impact on the Funds. As the Funds’ assets grow, the effect of the Fund’s investments in IPOs on the Funds’ performance probably will decline, which could reduce the Funds’ performance.
Hood River Funds
| NOTES TO FINANCIAL STATEMENTS (Continued) |
| December 31, 2023 (Unaudited) |
Liquidity Risk: Certain securities may be difficult or impossible to sell at the time and the price that the seller would like. While the markets in securities of small companies have grown rapidly in recent years, such securities may trade less frequently and in smaller volumes than more widely held securities. The values of these securities may fluctuate more sharply than those of other securities, and the Funds may experience some difficulty in establishing or closing out positions in these securities at prevailing market prices. There may be less publicly available information about the issuers of these securities or less market interest in such securities than in the case of larger companies, and it may take a longer period of time for the prices of such securities to reflect the full value of their issuers’ underlying earnings potential or assets.
Mutual Fund and ETF Trading Risk: The Funds may invest in other mutual funds that are either open-end or closed-end investment companies as well as Exchange Traded Funds (“ETFs”). ETFs are investment companies that are bought and sold on a national securities exchange. Unlike mutual funds, ETFs do not necessarily trade at the net asset values of their underlying securities, which means an ETF could potentially trade above or below the value of the underlying portfolios. Additionally, because ETFs trade like stocks on exchanges, they are subject to trading and commission costs unlike mutual funds. Also, both mutual funds and ETFs have management fees that are part of its costs, and the Funds will indirectly bear their proportionate share of the costs.
Private Placements: The Funds may invest in private placement securities, which are securities that are subject to restrictions on resale as a matter of contract or under federal securities laws. Private placements are often issued by privately held companies that are not subject to the reporting requirements of the SEC and are not required to maintain their accounting records in accordance with generally accepted accounting principles. Because there may be relatively few potential purchasers for such securities, the Funds could find it more difficult to sell such securities, especially under adverse market or economic conditions or in the event of adverse changes in the financial condition of the issuer.
Due to the more limited financial information and lack of publicly available prices, it may be more difficult to determine the fair value of these securities for purposes of computing the Funds’ net asset value. Securities acquired in private placements generally are classified as illiquid. Disposing of securities acquired in private placements may involve time-consuming negotiations and legal expenses, and it may be difficult or impossible for the Funds to sell the security promptly at an acceptable price.
NOTE 11 – GUARANTEES AND INDEMNIFICATIONS
In the normal course of business, the Funds enters into contracts that contain a variety of representations and warranties and which provide general indemnifications. The Funds’ maximum exposure under these arrangements is unknown, as this would involve future claims that may be made against the Fund that have not yet occurred. However, based on experience, the Funds expect the risk of loss to be remote.
Hood River Funds
| NOTES TO FINANCIAL STATEMENTS (Continued) |
| December 31, 2023 (Unaudited) |
NOTE 12 – CONTROL OWNERSHIP
The beneficial ownership, either directly or indirectly, of more than 25% of the voting securities of a fund creates a presumption of control of the funds, under Section 2(a)(9) of the 1940 Act. As of December 31, 2023, National Financial Services LLC held 32% of the outstanding shares of the Small-Cap Growth Fund and Charles Schwab & Co., Inc. held 26% of the shares of the Small-Cap Growth Fund.The Fund has no knowledge as to whether all or any portion of the shares owned of record by National Financial Services LLC or by Charles Schwab & Co., Inc. are also beneficially owned.
The beneficial ownership, either directly or indirectly, of more than 25% of the voting securities of a fund creates a presumption of control of the funds, under Section 2(a)(9) of the 1940 Act. As of December 31, 2023, Mid Atlantic Trust Co. held 25% of the outstanding shares of the International Opportunity Fund and National Financial Services LLC held 37% of the outstanding shares of the International Fund. The Fund has no knowledge as to whether all or any portion of the shares owned of record by Mid Atlantic Trust Co. or by National Financial Services LLC are also beneficially owned.
NOTE 13 – TAILORED SHAREHOLDER REPORTS
In October 2022, the Securities and Exchange Commission (the “SEC”) adopted a final rule relating to Tailored Shareholder Reports for Mutual Funds and Exchange-Traded Funds; Fee Information in Investment Company Advertisements. The rule and form amendments will, among other things, require the Fund to transmit concise and visually engaging shareholder reports that highlight key information. The amendments will require that funds tag information in a structured data format and that certain more in-depth information be made available online and available for delivery free of charge to investors on request. The amendments became effective January 24, 2023. There is an 18-month transition period after the effective date of the amendment.
Hood River Funds
| EXPENSE EXAMPLES |
| December 31, 2023 (Unaudited) |
As a shareholder of the Fund, you incur two types of costs: (1) transaction costs including sales charges (loads) and redemption fees, if applicable; and (2) ongoing costs, including management fees; distribution and/or service (12b-1 fees); and other Fund expenses. This Example is intended to help you understand your ongoing costs (in dollars) of investing in the Fund and to compare these costs with the ongoing costs of investing in other mutual funds.
The Example is based on an investment of $1,000 invested at the beginning of the period indicated and held for the entire period from July 1, 2023 to December 31, 2023 for the Investor, Institutional, and Retirement Shares of the Hood River Small-Cap Growth Fund.
The Example is based on an investment of $1,000 invested at the beginning of the period indicated and held for the period from July 1, 2023 to December 31, 2023 for the Institutional and Retirement Shares of the Hood River International Opportunity Fund. For the Hood River International Opportunity Fund’s Investor shares, the example is based off of the period from August 12, 2023 through December 31, 2023.
Actual Expenses
The information in the table under the heading “Actual” provides information about actual account values and actual expenses. You may use the information in these columns together with the amount you invested, to estimate the expenses that you paid over the period. Simply divide your account value by $1,000 (for example, an $8,600 account value divided by $1,000 = 8.6), then multiply the result by the number in the row entitled “Expenses Paid During Period” to estimate the expenses you paid on your account during this period. There are some account fees that are charged to certain types of accounts, such as Individual Retirement Accounts (generally, a $15 fee is charged to the account annually) that would increase the amount of expenses paid on your account. The example below does not include portfolio trading commissions and related expenses and other extraordinary expenses as determined under generally accepted accounting principles.
Hypothetical Example for Comparison Purposes
The information in the table under the heading “Hypothetical (5% return before expenses)” provides information about hypothetical account values and hypothetical expenses based on the Fund’s actual expense ratio and assumed rate of return of 5% per year before expenses, which is not the Fund’s actual return. The hypothetical account values and expenses may not be used to estimate the actual ending account balance or expenses you paid for the period. You may use this information to compare the ongoing costs of investing in the Fund and other funds. To do so, compare this 5% hypothetical example with the 5% hypothetical examples that appear in the shareholder reports of the other funds. As noted above, there are some account fees that are charged to certain types of accounts that would increase the amount of expense paid on your account.
Hood River Funds
| EXPENSE EXAMPLES (Continued) |
| December 31, 2023 (Unaudited) |
Please note that the expenses shown in the table are meant to highlight your ongoing costs only and do not reflect any transaction costs, such as sales charges (loads), redemption fees, or exchange fees. Therefore, the information under the heading “Hypothetical (5% return before expenses)” is useful in comparing ongoing costs only, and will not help you determine the relative total costs of owning different funds. In addition, if these transactional costs were included, your costs would have been higher.
Hood River Small-Cap Growth Fund
| | Beginning | Ending | Expenses Paid |
| | Account Value | Account Value | During Period(1) |
| | 7/1/2023 | 12/31/2023 | 7/1/2023-12/31/2023 |
| Actual | | | |
Investor Shares | $1,000.00 | $1,056.80 | $6.67 |
Institutional Shares | $1,000.00 | $1,057.90 | $5.48 |
Retirement Shares | $1,000.00 | $1,058.00 | $5.12 |
| | | | |
| Hypothetical (5% return | | | |
| before expenses) | | | |
Investor Shares | $1,000.00 | $1,018.65 | $6.55 |
Institutional Shares | $1,000.00 | $1,019.81 | $5.38 |
Retirement Shares | $1,000.00 | $1,020.16 | $5.03 |
(1) | Expenses are equal to the Investor, Institutional, and Retirement Shares’ annualized expense ratios of 1.29%, 1.06%, and 0.99%, respectively, multiplied by the average account value over the period, multiplied by 184/366 (to reflect the period). |
Hood River International Opportunity Fund
| | Beginning | Ending | Expenses Paid |
| | Account Value | Account Value | During Period(1) |
| | 7/1/2023 | 12/31/2023 | 7/1/2023-12/31/2023 |
| Actual | | | |
Investor Shares(2) | $1,000.00 | $1,080.10 | $5.61 |
Institutional Shares | $1,000.00 | $1,093.50 | $6.89 |
Retirement Shares | $1,000.00 | $1,093.40 | $6.89 |
| | | | |
| Hypothetical (5% return | | | |
| before expenses) | | | |
Investor Shares(2) | $1,000.00 | $1,019.26 | $5.45 |
Institutional Shares | $1,000.00 | $1,025.14 | $6.67 |
Retirement Shares | $1,000.00 | $1,025.14 | $6.67 |
(1) | Expenses are equal to the Institutional Shares’ and Retirement Shares’ annualized expense ratios of 1.31%, multiplied by the average account value over the period, multiplied by 184/366 (to reflect the period). |
(2) | The Investor Class Shares of the Hood River International Opportunity Fund have an inception date of August 12, 2023, so their expenses for the period are reflected as 1.40% annualized multiplied by the period, 141/366. |
Hood River Funds
| STATEMENT REGARDING LIQUIDITY RISK MANAGEMENT PROGRAM |
| (Unaudited) |
In accordance with Rule 22e-4 under the Investment Company Act of 1940, as amended, the Fund, a series of Manager Directed Portfolios (the “Trust”), has adopted and implemented a liquidity risk management program tailored specifically to the Fund (the “Program”). The Program seeks to promote effective liquidity risk management for the Fund and to protect Fund shareholders from dilution of their interests. The Board has designated the Fund’s investment adviser to serve as the administrator of the Program (the “Program Administrator”). Personnel of the Fund’s investment adviser conduct the day-to-day operation of the Program pursuant to policies and procedures administered by the Program Administrator. The Program Administrator is required to provide a written annual report to the Board and the chief compliance officer of the Trust regarding the adequacy and effectiveness of the Program, including the operation of the Fund’s highly liquid investment minimum, and any material changes to the Program.
Under the Program, the Program Administrator manages the Fund’s liquidity risk, which is the risk that the Fund could not meet shareholder redemption requests without significant dilution of remaining shareholders’ interests in the Fund. The Program assesses liquidity risk under both normal and reasonably foreseeable stressed market conditions. This risk is managed by monitoring the degree of liquidity of the Fund’s investments, limiting the amount of the Fund’s illiquid investments, and utilizing various risk management tools and facilities available to the Fund for meeting shareholder redemptions, among other means. The Program Administrator’s process of determining the degree of liquidity of the Fund’s investments is supported by one or more third-party liquidity assessment vendors.
On May 9, 2023, the Board reviewed the Program Administrator’s assessment of the operation and effectiveness of the Program for the period January 1, 2022 through December 31, 2022 (the “Report”). The Report noted that there were no breaches of the Fund’s restriction on holding illiquid investments exceeding 15% of its net assets during the review period. The Report confirmed that the Fund’s investment strategy was appropriate for an open-end management investment company. The Report also indicated that no material changes had been made to the program during the review period.
The Program Administrator determined that the Fund is reasonably likely to be able to meet redemption requests without adversely affecting non-redeeming Fund shareholders through significant dilution. The Program Administrator concluded that the during the review period, the Program was adequately designed and effectively operating to monitor the liquidity risk to the Fund, taking into account the size of the Fund, the type of business conducted, and other relevant factors.
Hood River Funds
| APPROVAL OF THE INVESTMENT ADVISORY AGREEMENT |
| |
The Board of Trustees (the “Board” or the “Trustees”) of Manager Directed Portfolios (the “Trust”) met on November 13, 2023 to consider the renewal of the Investment Advisory Agreement (the “Advisory Agreement”) between the Trust, on behalf of the Hood River Small-Cap Growth Fund (the “Small Cap Growth Fund”) and the Hood River International Opportunity Fund (the “International Opportunity Fund”) (each, a “Fund”, and together, the “Funds”), each a series of the Trust, and the Funds’ investment adviser, Hood River Capital Management, LLC (“Hood River” or the “Adviser”). The Trustees, all of whom are not “interested persons” of the Trust, as that term is defined in the Investment Company Act of 1940 (the “Independent Trustees”), had previously met at a special meeting held on October 17, 2023 to discuss the renewal of the Advisory Agreement. Prior to these meetings, the Trustees requested and received materials to assist them in considering the continuation of the Advisory Agreement. The materials provided contained information with respect to the factors enumerated below, including a copy of the Advisory Agreement, a memorandum prepared by counsel to the Independent Trustees discussing factors relevant to the renewal of the Advisory Agreement, comparative performance information, Hood River’s Form ADV Part 1A, brochure and brochure supplements, due diligence materials provided by Hood River, including information regarding Hood River’s compliance program, personnel and financial condition, profitability information, and other pertinent information. The Board also reviewed the advisory fees payable by the Funds under the Advisory Agreement, the expense limitation agreements between Hood River and the Trust, on behalf of each Fund, and comparative fee and expense information as reported by a third-party analytics firm.
The Trustees met with the officers of the Trust and legal counsel to discuss the information provided and also met in executive session with legal counsel to the Independent Trustees to review their duties in considering the Advisory Agreement and the information provided. The Trustees noted that they had met in person with representatives of Hood River earlier in the year to discuss Hood River’s investment strategy for the Funds, each Fund’s performance, updates about the Adviser’s business and personnel and other matters. The Board took into account information reviewed periodically throughout the year regarding the services provided by the Adviser, the performance of each Fund, brokerage and trading services, Fund expenses, asset flows, compliance matters and other information deemed relevant.
Based on their evaluation of the information provided as part of the October and November meetings, as well as information provided over the course of the year, the Trustees approved the continuation of the Advisory Agreement for an additional one-year term. Below is a summary of the material factors considered by the Board and the conclusions that formed the basis for the Board’s approval of the Advisory Agreement.
1. NATURE, EXTENT AND QUALITY OF SERVICES PROVIDED TO THE FUND
The Trustees considered the nature, extent and quality of services provided by the Adviser in the management of the Funds, including portfolio management, research, trading and compliance monitoring, as well as the qualifications and experience of
Hood River Funds
| APPROVAL OF THE INVESTMENT ADVISORY AGREEMENT (Continued) |
| |
personnel at the Adviser who are involved in the day-to-day activities of the Funds. The Board considered the Adviser’s compliance program and past reports from the Trust’s Chief Compliance Officer (“CCO”) regarding the CCO’s review of the Adviser’s compliance program. The Board also considered its previous experience with the Adviser providing investment management services to the Funds. The Trustees considered the information provided by the Adviser in response to the due diligence questionnaire and as part of the presentation by the Adviser earlier in the year. The Trustees concluded that the nature, extent and quality of services provided to each Fund by the Adviser were appropriate and that each Fund was likely to continue to benefit from the services provided by the Adviser under the Advisory Agreement.
2. INVESTMENT PERFORMANCE OF THE FUND
Small-Cap Growth Fund. The Trustees discussed the performance of the Fund for the one-year, three-year, five-year and ten-year periods ended June 30, 2023 on an absolute basis and in comparison to (1) the Fund’s primary benchmark index, (2) the Morningstar small growth peer group and (3) a peer group of funds constructed using Morningstar, Inc. data and presented by Barrington Partners, an independent third-party analytics firm (the “Barrington Cohort”).
The Trustees noted that the Fund outperformed its benchmark, the Russell 2000 Growth Index, the Morningstar peer group average and its Barrington Cohort average for all periods.
International Opportunity Fund. The Trustees considered the performance of the Fund for the one-year and since inception periods ended June 30, 2023, on an absolute basis and in comparison to (1) the Fund’s primary benchmark index, (2) the Morningstar foreign small/mid growth peer group and (3) its Barrington Cohort.
The Trustees noted that the Fund outperformed its benchmark, the MSCI All Country World ex-USA Small Cap Index and the Morningstar peer group average for the one-year and since inception periods and that the Fund outperformed its Barrington Cohort average for the one-year period and underperformed the cohort for the since inception period. The Board considered that the Fund had less than three years of performance, which was a short period of time over which to evaluate the Fund’s performance.
The Trustees concluded that each Fund’s performance was satisfactory and that each Fund and its shareholders were likely to benefit from the Adviser’s continued management.
3. ADVISORY FEES AND EXPENSES
The Trustees considered Hood River’s advisory fee rates, related statistical information and the cost structure of the Funds relative to their Barrington Cohort fee and expense comparisons.
Small-Cap Growth Fund. The Trustees noted that the Fund’s contractual management fee of 0.90% was higher than the Barrington Cohort average. The Trustees noted that the total net expense ratio for the Institutional Shares was slightly higher than the Barrington
Hood River Funds
| APPROVAL OF THE INVESTMENT ADVISORY AGREEMENT (Continued) |
| |
Cohort average and lower than the Morningstar category average. The Trustees also considered Hood River’s commentary regarding the Fund’s advisory fee rate. The Trustees considered the fee waivers and expense reimbursements previously provided by Hood River and Hood River’s commitment to renew the Fund’s expense limitation agreement.
International Opportunity Fund. The Trustees noted that for the International Opportunity Fund, Hood River had recently reduced the management fee from 1.30% to 1.05% and expense cap from 1.40% to 1.15%. The Trustees noted that the Fund’s contractual management fee of 1.05% was higher than the Barrington Cohort average. The Trustees noted that the total net expense ratio for the Institutional Shares was higher than the Barrington Cohort average and lower than the Morningstar category average. The Trustees considered the fee waivers and expense reimbursements previously provided by Hood River and Hood River’s commitment to the new, lower expense limitation agreement.
The Trustees concluded that each Fund’s expenses and the management fees paid to Hood River were fair and reasonable in light of the comparative expense and management fee information and the quality of the services provided to the Funds by Hood River.
4. COSTS OF SERVICES PROVIDED AND PROFITS REALIZED BY THE ADVISER
The Trustees considered Hood River’s financial statements and a profitability analysis prepared by Hood River based on the fees payable under the Advisory Agreement. The Trustees concluded that Hood River’s level of profitability from its relationship with the Small-Cap Growth Fund was reasonable. Given that Hood River had not yet generated profits from the International Opportunity Fund, the Trustees did not consider profitability to be a material factor for this Fund.
5. ECONOMIES OF SCALE
The Trustees compared each Fund’s expenses relative to its cohort and Morningstar peer group and considered potential economies of scale. The Trustees noted that the Funds’ management fee structures did not contain any breakpoint reductions as the Funds’ assets grow in size but considered that Hood River has been waiving fees or reimbursing expenses since each Fund’s inception. With respect to the Small-Cap Growth Fund, the Trustees concluded that the current fee structure was reasonable and reflects a sharing of economies of scale between the Hood River and the Fund at the Fund’s current asset level. With respect to the International Opportunity Fund, the Trustees did not consider economies of scale to be a material factor given the current asset size of the Fund.
6. BENEFITS DERIVED FROM THE RELATIONSHIP WITH THE FUND
The Trustees considered the direct and indirect benefits that could be realized by Hood River from its association with the Funds. The Trustees concluded that the benefits Hood River may receive, such as soft dollar research, appear to be reasonable.
Hood River Funds
| APPROVAL OF THE INVESTMENT ADVISORY AGREEMENT (Continued) |
| |
CONCLUSION
In considering the renewal of the Advisory Agreement, the Trustees did not identify any one factor as all important but rather considered these factors collectively in light of each Fund’s surrounding circumstances. Based on this review, the Trustees, including a majority of the Independent Trustees, approved the renewal of the Advisory Agreement for an additional one-year term as being in the best interests of each Fund and its shareholders.
Hood River Funds
| NOTICE TO SHAREHOLDERS |
| at December 31, 2023 (Unaudited) |
How to Obtain a Copy of the Fund’s Proxy Voting Policies
A description of the policies and procedures that the Fund uses to determine how to vote proxies relating to portfolio securities is available without charge, upon request, by calling 1-800-497-2960 or on the U.S. Securities and Exchange Commission’s (“SEC”) website at http://www.sec.gov.
How to Obtain a Copy of the Fund’s Proxy Voting Records for the most recent 12-Month Period Ended June 30
Information regarding how the Fund voted proxies relating to portfolio securities during the most recent 12-month period ended June 30 is available no later than August 31 without charge, upon request, by 1-800-497-2960. Furthermore, you can obtain the Fund’s proxy voting records on the SEC’s website at http://www.sec.gov.
Quarterly Filings on Form N-PORT
The Fund files its complete schedule of portfolio holdings with the SEC for the first and third quarters of each fiscal year on Part F of Form N-PORT. The Fund’s Part F of Form N-PORT is available on the SEC’s website at http://www.sec.gov. Information included in the Fund’s Part F of Form N-PORT is also available, upon request, by calling 1-800-497-2960.
Householding
In an effort to decrease costs, the Fund intends to reduce the number of duplicate prospectuses and annual and semi-annual reports you receive by sending only one copy of each to those addresses shared by two or more accounts and to shareholders the Transfer Agent reasonably believes are from the same family or household. Once implemented, if you would like to discontinue householding for your accounts, please call toll-free at 1-800-497-2960 to request individual copies of these documents. Once the Transfer Agent receives notice to stop householding, the Transfer Agent will begin sending individual copies thirty days after receiving your request. This policy does not apply to account statements.
Hood River Funds
| NOTICE OF PRIVACY POLICY & PRACTICES |
| |
Protecting the privacy of Fund shareholders is important to us. The following is a description of the practices and policies through which we protect the privacy and security of your non-public personal information.
We collect non-public personal information about you from the following sources:
| | • | information we receive about you on applications or other forms; |
| | | |
| | • | information you give us orally; and |
| | | |
| | • | information about your transactions with us or others. |
The types of non-public personal information we collect and share can include:
| | • | social security number; |
| | | |
| | • | account balances; |
| | | |
| | • | account transactions; |
| | | |
| | • | transaction history; |
| | | |
| | • | wire transfer instructions; and |
| | | |
| | • | checking account information. |
What Information We Disclose
We do not disclose any non-public personal information about shareholders or former shareholders of the Fund without the shareholder’s authorization, except as permitted by law or in response to inquiries from governmental authorities. We may share information with affiliated parties and unaffiliated third parties with whom we have contracts for servicing the Fund. We will provide unaffiliated third parties with only the information necessary to carry out their assigned responsibility.
How We Protect Your Information
All shareholder records will be disposed of in accordance with applicable law. We maintain physical, electronic and procedural safeguards to protect your non-public personal information and require third parties to treat your non-public personal information with the same high degree of confidentiality.
In the event that you hold shares of the Fund through a financial intermediary, including, but not limited to, a broker-dealer, bank or trust company, the privacy policy of your financial intermediary would govern how your non-public personal information would be shared with unaffiliated third parties.
If you have any questions or concerns regarding this notice or our Privacy Policy, please contact us at 1-800-497-2960.
(This Page Intentionally Left Blank.)
Investment Advisor
Hood River Capital Management LLC
2373 PGA Boulevard, Suite 200
Palm Beach Gardens, FL 33410
Distributor
Quasar Distributors, LLC
111 East Kilbourn Avenue, Suite 2200
Milwaukee, WI 53202
Transfer Agent
U.S. Bancorp Fund Services, LLC
615 East Michigan Street
Milwaukee, WI 53202
(800) 497-2960
Custodian
U.S. Bank National Association
Custody Operations
1555 North River Center Drive, Suite 302
Milwaukee, WI 53212
Independent Registered Public Accounting Firm
Cohen & Company, Ltd.
1835 Market Street, Suite 310
Philadelphia, PA 19103
Legal Counsel
Godfrey & Kahn S.C.
833 East Michigan Street, Suite 1800
Milwaukee, WI 53202
This report is intended for shareholders of the Fund and may not be used as sales literature unless preceded or accompanied by a current prospectus.
Past performance results shown in this report should not be considered a representation of future performance. Share price and returns will fluctuate so that shares, when redeemed, may be worth more or less than their original cost. Statements and other information herein are dated and are subject to change.
Item 2. Code of Ethics.
Not applicable for semi-annual reports.
Item 3. Audit Committee Financial Experts.
Not applicable for semi-annual reports.
Item 4. Principal Accountant Fees and Services.
Not applicable for semi-annual reports.
Item 5. Audit Committee of Listed Registrants.
(a) Not applicable to registrants who are not listed issuers (as defined in Rule 10A-3 under the Securities Exchange Act of 1934).
(b) Not Applicable.
Item 6. Investments.
| (a) | Schedule of Investments is included as part of the report to shareholders filed under Item 1 of this Form. |
Item 7. Disclosure of Proxy Voting Policies and Procedures for Closed-End Management Investment Companies.
Not applicable to open-end investment companies.
Item 8. Portfolio Managers of Closed-End Management Investment Companies.
Not applicable to open-end investment companies.
Item 9. Purchases of Equity Securities by Closed‑End Management Investment Company and Affiliated Purchasers.
Not applicable to open-end investment companies.
Item 10. Submission of Matters to a Vote of Security Holders.
There have been no material changes to the procedures by which shareholders may recommend nominees to the Registrant’s Board of Trustees.
Item 11. Controls and Procedures.
| (a) | The Registrant’s President/Principal Executive Officer and Treasurer/Principal Financial Officer have reviewed the Registrant's disclosure controls and procedures (as defined in Rule 30a-3(c) under the Investment Company Act of 1940, as amended, (the “Act”)) as of a date within 90 days of the filing of this report, as required by Rule 30a-3(b) under the Act and Rules 13a-15(b) or 15d‑15(b) under the Securities Exchange Act of 1934. Based on their review, such officers have concluded that the disclosure controls and procedures are effective in ensuring that information required to be disclosed in this report is appropriately recorded, processed, summarized and reported and made known to them by others within the Registrant and by the Registrant’s service provider. |
| (b) | There were no changes in the Registrant's internal control over financial reporting (as defined in Rule 30a-3(d) under the Act) that occurred during the period covered by this report that has materially affected, or is reasonably likely to materially affect, the Registrant's internal control over financial reporting. |
Item 12. Disclosure of Securities Lending Activities for Closed-End Management Investment Companies.
Not applicable to open-end investment companies.
Item 13. Exhibits.
| (a) | (1) Any code of ethics or amendment thereto, that is subject to the disclosure required by Item 2, to the extent that the registrant intends to satisfy Item 2 requirements through filing an exhibit. Not applicable. |
(3) Any written solicitation to purchase securities under Rule 23c‑1 under the Act sent or given during the period covered by the report by or on behalf of the registrant to 10 or more persons. Not applicable to open-end investment companies.
(4) Change in the registrant’s independent public accountant. There was no change in the registrant’s independent public accountant for the period covered by this report
SIGNATURES
Pursuant to the requirements of the Securities Exchange Act of 1934 and the Investment Company Act of 1940, as amended, the registrant has duly caused this report to be signed on its behalf by the undersigned, thereunto duly authorized.
(Registrant) Manager Directed Portfolios
By (Signature and Title)* /s/Scott M. Ostrowski
Scott M. Ostrowski, President/
Principal Executive Officer
Date 3/5/2024
Pursuant to the requirements of the Securities Exchange Act of 1934 and the Investment Company Act of 1940, as amended, this report has been signed below by the following persons on behalf of the registrant and in the capacities and on the dates indicated.
By (Signature and Title)* /s/Scott M. Ostrowski
Scott M. Ostrowski, President/
Principal Executive Officer
Date 3/5/2024
By (Signature and Title)* /s/Ryan Frank
Ryan Frank,
Treasurer/Principal Financial Officer
Date 3/5/2024
* Print the name and title of each signing officer under his or her signature.