UNITED STATES
SECURITIES AND EXCHANGE COMMISSION
Washington, D.C. 20549
FORM N-CSR
CERTIFIED SHAREHOLDER REPORT OF REGISTERED
MANAGEMENT INVESTMENT COMPANIES
Investment Company Act file number 811-21897
Manager Directed Portfolios
(Exact name of registrant as specified in charter)
615 East Michigan Street Milwaukee, WI 53202
(Address of principal executive offices) (Zip code)
Scott M. Ostrowski, President
Manager Directed Portfolios
c/o U.S. Bank Global Fund Services
777 East Wisconsin Avenue, 6th Floor
Milwaukee, WI 53202
(Name and address of agent for service)
(414) 516-3087
Registrant’s telephone number, including area code
Date of fiscal year end: June 30, 2024
Date of reporting period: June 30, 2024
Item 1. Reports to Stockholders.
| | |
| Vert Global Sustainable Real Estate ETF | |
| VGSR (Principal U.S. Listing Exchange: NASDAQ Stock Market LLC ) |
| Annual Shareholder Report | June 30, 2024 |
This annual shareholder report contains important information about the Vert Global Sustainable Real Estate ETF for the period of July 1, 2023, to June 30, 2024. You can find additional information about the Fund at https://vertfunds.com/fund-information/. You can also request this information by contacting us at 1-844-740-VERT or by sending an email request to info@vertasset.com.
This report describes changes to the Fund that occurred during the reporting period.
WHAT WERE THE FUND COSTS FOR THE PAST YEAR? (based on a hypothetical $10,000 investment)
| | |
Fund Name | Costs of a $10,000 investment | Costs paid as a percentage of a $10,000 investment |
| Vert Global Sustainable Real Estate ETF | $50 | 0.47% |
HOW DID THE FUND PERFORM LAST YEAR AND WHAT AFFECTED ITS PERFORMANCE?
Over the trailing 12 months, the Fund has enjoyed positive returns and outperformed its strategy benchmark. Outperformance of this magnitude is not unexpected given the normal variation between the Fund and benchmark. Shareholders can often benefit from their discipline when they remain invested for the long term.
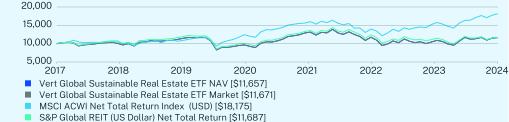
HOW DID THE FUND PERFORM SINCE INCEPTION?*
The $10,000 chart reflects a hypothetical $10,000 investment in the Fund. The chart uses total return NAV and Market performance and assumes reinvestment of dividends and capital gains. Fund expenses, including management fees and other expenses, were deducted.
CUMULATIVE PERFORMANCE (Initial Investment of $10,000)
ANNUAL AVERAGE TOTAL RETURN (%)
| | | |
| | 1 Year | 5 Year | Since Inception
(10/31/2017) |
Vert Global Sustainable Real Estate ETF NAV | 11.41 | 1.42 | 2.33 |
Vert Global Sustainable Real Estate ETF Market | 11.56 | 1.44 | 2.35 |
MSCI ACWI Net Total Return Index (USD) | 19.38 | 10.76 | 9.38 |
S&P Global REIT (US Dollar) Net Total Return | 5.10 | 0.65 | 2.37 |
Visit https://vertfunds.com/fund-information/ for more recent performance information.
| * | The Fund’s past performance is not a good predictor of the Fund’s future performance. The returns do not reflect the deduction of taxes that a shareholder would pay on Fund distributions or redemption of Fund shares. |
| Vert Global Sustainable Real Estate ETF | PAGE 1 | TSR_AR_56170L695 |
KEY FUND STATISTICS (as of June 30, 2024)
| |
Net Assets | $367,086,498 |
Number of Holdings | 154 |
Net Advisory Fee Paid | $1,020,774 |
Portfolio Turnover Rate | 11% |
30-Day SEC Yield | 3.59% |
30-Day SEC Yield Unsubsidized | 3.49% |
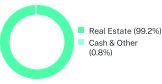
WHAT DID THE FUND INVEST IN? (as of June 30, 2024)
Sector Breakdown (% of net assets)
| |
Top 10 Holdings | (% of Net Assets) |
Digital Realty Trust, Inc. | 5.1% |
Welltower, Inc. | 5.1% |
Simon Property Group, Inc. | 5.0% |
Prologis, Inc. | 5.0% |
American Tower Corp. | 4.9% |
Equinix, Inc. | 4.7% |
Goodman Group | 4.4% |
Extra Space Storage, Inc. | 3.6% |
AvalonBay Communities, Inc. | 3.2% |
Iron Mountain, Inc. | 2.9% |
HOW HAS THE FUND CHANGED?
This is a summary of certain changes to the Fund that occurred on December 4, 2023. For more complete information, you may review the Fund’s prospectus, which is available at http://www.vertfunds.com/fund-information/#documents or upon request by calling (844) 740-VERT or by sending an e-mail request to info@vertasset.com.
On December 4, 2023, the Vert Global Sustainable Real Estate Fund (the “Predecessor Fund”), was reorganized within Manager Directed Portfolios as the Vert Global Sustainable Real Estate ETF, resulting in a change to the Fund’s name. In connection with the Predecessor Fund’s conversion to an exchange-traded fund (“ETF”), the Fund has a lower net expense ratio and is subject to ETF-related risks. There were no other material changes as a result of the conversion.
For additional information about the Fund, including its prospectus, financial information, holdings and proxy voting information, scan the QR code or visit https://vertfunds.com/fund-information/.
HOUSEHOLDING
To reduce Fund expenses, only one copy of most shareholder documents may be mailed to shareholders with multiple accounts at the same address (Householding). If you would prefer that your Vert Global Sustainable Real Estate ETF documents not be householded, please contact Vert Asset Management at 1-844-740-VERT, or contact your financial intermediary. Your instructions will typically be effective within 30 days of receipt by Vert Asset Management or your financial intermediary.
| Vert Global Sustainable Real Estate ETF | PAGE 2 | TSR_AR_56170L695 |
1018910865922012421108801046211657101891086592201242110880104621167110313109051113615508130651522518175103971131495141282711466111201168799.20.8
Item 2. Code of Ethics.
The registrant has adopted a code of ethics that applies to the registrant’s principal executive officer and principal financial officer. The registrant has not made any substantive amendments to its code of ethics during the period covered by this report. The registrant has not granted any waivers from any provisions of the code of ethics during the period covered by this report.
A copy of the registrant’s Code of Ethics is filed herewith.
Item 3. Audit Committee Financial Expert.
The registrant’s Board of Trustees has determined that there are at least two audit committee financial experts serving on its audit committee. Messrs. Gaylord B. Lyman and Scott C. Jones are the “audit committee financial experts” and are considered to be “independent” as each term is defined in Item 3 of Form N-CSR.
Item 4. Principal Accountant Fees and Services.
The registrant has engaged its principal accountant to perform audit services and tax services during the past two fiscal years. “Audit services” refer to performing an audit of the registrant’s annual financial statements or services that are normally provided by the accountant in connection with statutory and regulatory filings or engagements for those fiscal years. “Audit-related services” refer to the assurance and related services by the principal accountant that are reasonably related to the performance of the audit. “Tax services” refer to professional services rendered by the principal accountant for tax compliance, tax advice, and tax planning. There were no “other services” provided by the principal accountant. The following table details the aggregate fees billed or expected to be billed for each of the last two fiscal years for audit fees, audit-related fees, tax fees and other fees by the principal accountant.
| | FYE 6/30/2024 | FYE 6/30/2023 |
| Audit Fees | $13,500 | $12,500 |
| Audit-Related Fees | N/A | N/A |
| Tax Fees | $3,500 | $3,250 |
| All Other Fees | N/A | N/A |
The audit committee has adopted pre-approval policies and procedures that require the audit committee to pre-approve all audit and non-audit services of the registrant, as well as non-audit services provided to the registrant’s investment adviser and any entity controlling, controlled by or under common control with the investment adviser that provides ongoing services to the registrant relating to the operations and financial reporting of the registrant.
The percentage of fees billed by Cohen & Company Ltd. applicable to non-audit services pursuant to waiver of the pre-approval requirement were as follows:
| | FYE 6/30/2024 | FYE 6/30/2023 |
| Audit-Related Fees | 0% | 0% |
| Tax Fees | 0% | 0% |
| All Other Fees | 0% | 0% |
The following table indicates the non-audit fees billed or expected to be billed by the registrant’s accountant for services to the registrant and to the registrant’s investment adviser (and any other controlling entity, etc.—not sub-adviser) for the last two years.
| Non-Audit Related Fees | FYE 6/30/2024 | FYE 6/30/2023 |
| Registrant | N/A | N/A |
| Registrant’s Investment Adviser | N/A | N/A |
The audit committee of the Board of Trustees has considered whether the provision of non-audit services that were rendered to the registrant’s investment adviser is compatible with maintaining the principal accountant’s independence and has concluded that the provision of such non-audit services by the accountant has not compromised the accountant’s independence.
The registrant has not been identified by the U.S. Securities and Exchange Commission as having filed an annual report issued by a registered public accounting firm branch or office that is located in a foreign jurisdiction where the Public Company Accounting Oversight Board is unable to inspect or completely investigate because of a position taken by an authority in that jurisdiction.
The registrant is not a foreign issuer.
Item 5. Audit Committee of Listed Registrants.
(a) The registrant is a listed issuer as defined in Rule 10A-3 under the Securities Exchange Act of 1934 (the “Act”), and has a separately-designated standing audit committee established in accordance with Section 3(a)(58)(A) of the Act. The committee consists of the independent members of the entire Board.
(b) Not applicable
Item 6. Investments.
(a) Schedule of Investments is included as part of the financial statements filed under Item 7 of this Form.
(b) Not applicable.
Item 7. Financial Statements and Financial Highlights for Open-End Investment Companies.
Vert Global Sustainable Real Estate ETF
Core Financial Statements
Annual Report June 30, 2024
TABLE OF CONTENTS
Vert Global Sustainable Real Estate ETF
Schedule of Investments
as of June 30, 2024
| | | | | | | |
REAL ESTATE INVESTMENT TRUSTS - 99.2%
|
Diversified REITs - 6.9%
|
Activia Properties, Inc. | | | 258 | | | $ 585,416 |
American Assets Trust, Inc.(a) | | | 20,869 | | | 467,048 |
British Land Co. PLC | | | 354,821 | | | 1,846,139 |
Charter Hall Long Wale REIT | | | 283,965 | | | 616,351 |
Covivio SA | | | 22,335 | | | 1,062,352 |
Cromwell European Real Estate Investment Trust(b) | | | 59,419 | | | 89,156 |
Daiwa House REIT Investment Corp. | | | 960 | | | 1,466,915 |
Empire State Realty Trust, Inc. - Class A(a) | | | 53,349 | | | 500,414 |
GPT Group | | | 737,839 | | | 1,971,066 |
Growthpoint Properties Australia Ltd. | | | 118,508 | | | 171,746 |
Growthpoint Properties Ltd. | | | 1,452,574 | | | 968,913 |
Hulic Reit, Inc. | | | 585 | | | 530,959 |
ICADE | | | 17,476 | | | 429,666 |
KDX Realty Investment Corp. | | | 1,505 | | | 1,464,208 |
Land Securities Group PLC | | | 280,871 | | | 2,199,519 |
Merlin Properties Socimi SA | | | 130,952 | | | 1,459,623 |
Mirvac Group | | | 1,508,418 | | | 1,883,835 |
Mori Trust Reit, Inc. | | | 595 | | | 256,701 |
Nomura Real Estate Master Fund, Inc. | | | 1,648 | | | 1,461,952 |
NTT UD REIT Investment Corp. | | | 634 | | | 458,375 |
Picton Property Income Ltd. | | | 151,733 | | | 129,852 |
Redefine Properties Ltd. | | | 2,626,934 | | | 578,328 |
Schroder Real Estate Investment Trust Ltd. | | | 148,475 | | | 83,708 |
Sekisui House Reit, Inc. | | | 1,809 | | | 889,543 |
Stockland | | | 959,702 | | | 2,672,711 |
Suntec Real Estate Investment Trust | | | 873,300 | | | 676,602 |
Tokyu REIT, Inc. | | | 264 | | | 256,352 |
Tritax EuroBox PLC | | | 353,805 | | | 275,054 |
| | | | | | 25,452,504 |
Health Care REITs - 11.7%
|
Aedifica SA | | | 19,620 | | | 1,191,226 |
Alexandria Real Estate Equities, Inc.(a) | | | 64,716 | | | 7,569,831 |
Assura PLC | | | 986,173 | | | 502,885 |
Cofinimmo SA | | | 15,283 | | | 922,991 |
Healthpeak Properties, Inc. | | | 286,234 | | | 5,610,186 |
Ventas, Inc. | | | 162,635 | | | 8,336,670 |
Welltower, Inc. | | | 179,989 | | | 18,763,853 |
| | | | | | 42,897,642 |
Hotel & Resort REITs - 2.3%
|
CapitaLand Ascott Trust | | | 1,115,100 | | | 719,950 |
DiamondRock Hospitality Co.(a) | | | 80,841 | | | 683,106 |
Hoshino Resorts REIT, Inc. | | | 100 | | | 323,884 |
Host Hotels & Resorts, Inc.(a) | | | 281,274 | | | 5,057,307 |
Japan Hotel REIT Investment Corp. | | | 1,867 | | | 901,815 |
RLJ Lodging Trust(a) | | | 64,665 | | | 622,724 |
| | | | | | 8,308,786 |
| | | | | | | |
The accompanying notes are an integral part of these financial statements.
TABLE OF CONTENTS
Vert Global Sustainable Real Estate ETF
Schedule of Investments
as of June 30, 2024(Continued)
| | | | | | | |
REAL ESTATE INVESTMENT TRUSTS - (Continued)
|
Industrial REITs - 18.7%
|
Advance Logistics Investment Corp. | | | 283 | | | $ 211,291 |
Americold Realty Trust, Inc. | | | 111,967 | | | 2,859,637 |
CapitaLand Ascendas REIT | | | 1,476,000 | | | 2,788,091 |
Dexus Industria REIT | | | 22,306 | | | 42,010 |
Dream Industrial Real Estate Investment Trust | | | 52,319 | | | 484,439 |
Frasers Logistics & Commercial Trust | | | 1,270,700 | | | 890,732 |
GLP J-Reit | | | 1,837 | | | 1,499,429 |
Goodman Group | | | 689,057 | | | 15,991,512 |
Goodman Property Trust | | | 451,561 | | | 553,070 |
Industrial & Infrastructure Fund Investment Corp. | | | 1,044 | | | 821,649 |
Japan Logistics Fund, Inc. | | | 311 | | | 514,273 |
LaSalle Logiport REIT | | | 841 | | | 771,675 |
LXP Industrial Trust(a) | | | 119,138 | | | 1,086,539 |
Mapletree Logistics Trust | | | 1,351,500 | | | 1,286,431 |
Mitsubishi Estate Logistics REIT Investment Corp. | | | 210 | | | 497,389 |
Mitsui Fudosan Logistics Park, Inc. | | | 170 | | | 458,131 |
Nippon Prologis REIT, Inc. | | | 946 | | | 1,476,103 |
Prologis Property Mexico SAB de CV | | | 348,961 | | | 1,138,171 |
Prologis, Inc. | | | 162,289 | | | 18,226,678 |
Rexford Industrial Realty, Inc. | | | 89,057 | | | 3,971,052 |
Segro PLC | | | 508,224 | | | 5,770,425 |
SOSiLA Logistics REIT, Inc. | | | 306 | | | 223,898 |
STAG Industrial, Inc.(a) | | | 75,568 | | | 2,724,982 |
TF Administradora Industrial S de RL de CV | | | 314,268 | | | 670,454 |
Tritax Big Box REIT PLC | | | 915,473 | | | 1,794,886 |
Warehouses De Pauw CVA | | | 66,618 | | | 1,806,372 |
| | | | | | 68,559,319 |
Office REITs - 6.2%
|
Allied Properties Real Estate Investment Trust | | | 28,300 | | | 316,639 |
Brandywine Realty Trust | | | 66,296 | | | 297,006 |
BXP, Inc.(a) | | | 60,931 | | | 3,750,912 |
CLS Holdings PLC | | | 15,840 | | | 18,121 |
Cromwell Property Group | | | 647,533 | | | 168,658 |
Derwent London PLC | | | 38,334 | | | 1,095,146 |
Dexus(b) | | | 417,480 | | | 1,806,718 |
Dream Office Real Estate Investment Trust | | | 3,508 | | | 46,377 |
Gecina SA | | | 18,733 | | | 1,725,632 |
Global One Real Estate Investment Corp. | | | 406 | | | 257,189 |
Great Portland Estates PLC | | | 153,080 | | | 649,218 |
Hudson Pacific Properties, Inc. | | | 36,698 | | | 176,517 |
Inmobiliaria Colonial Socimi SA | | | 102,535 | | | 596,715 |
Japan Prime Realty Investment Corp. | | | 258 | | | 519,657 |
Japan Real Estate Investment Corp. | | | 546 | | | 1,724,282 |
JBG SMITH Properties(a) | | | 31,650 | | | 482,030 |
Kilroy Realty Corp. | | | 46,972 | | | 1,464,117 |
| | | | | | | |
The accompanying notes are an integral part of these financial statements.
TABLE OF CONTENTS
Vert Global Sustainable Real Estate ETF
Schedule of Investments
as of June 30, 2024(Continued)
| | | | | | | |
REAL ESTATE INVESTMENT TRUSTS - (Continued)
|
Office REITs - (Continued)
|
Manulife US Real Estate Investment Trust | | | 752,209 | | | $ 48,141 |
Nippon Building Fund, Inc. | | | 631 | | | 2,208,461 |
NSI NV | | | 9,879 | | | 203,499 |
Orix JREIT, Inc. | | | 1,059 | | | 1,048,072 |
Precinct Properties New Zealand Ltd.(b) | | | 567,414 | | | 385,516 |
SL Green Realty Corp.(a) | | | 26,675 | | | 1,510,872 |
Vornado Realty Trust(a) | | | 68,282 | | | 1,795,134 |
Workspace Group PLC | | | 64,887 | | | 487,218 |
| | | | | | 22,781,847 |
Residential REITs - 15.4%
|
Advance Residence Investment Corp. | | | 568 | | | 1,156,409 |
Altarea SCA | | | 1,655 | | | 146,690 |
AvalonBay Communities, Inc. | | | 57,356 | | | 11,866,383 |
Care Property Invest NV | | | 6,667 | | | 94,319 |
Centerspace(a) | | | 4,709 | | | 318,470 |
Comforia Residential REIT, Inc. | | | 168 | | | 332,115 |
Dream Residential Real Estate Investment Trust | | | 2,600 | | | 16,432 |
Equity LifeStyle Properties, Inc.(a) | | | 72,106 | | | 4,696,264 |
Equity Residential | | | 139,245 | | | 9,655,248 |
Essex Property Trust, Inc.(a) | | | 25,606 | | | 6,969,953 |
Home Reit PLC(b)(c) | | | 255,956 | | | 30,770 |
Irish Residential Properties REIT PLC | | | 75,550 | | | 73,360 |
Killam Apartment Real Estate Investment Trust | | | 23,142 | | | 288,186 |
Mid-America Apartment Communities, Inc.(a) | | | 46,671 | | | 6,655,751 |
Minto Apartment Real Estate Investment Trust | | | 11,500 | | | 124,215 |
Sun Communities, Inc.(a) | | | 50,795 | | | 6,112,670 |
UDR, Inc. | | | 129,533 | | | 5,330,283 |
UMH Properties, Inc. | | | 25,598 | | | 409,312 |
UNITE Group PLC | | | 148,588 | | | 1,675,437 |
Veris Residential, Inc.(a) | | | 31,690 | | | 475,350 |
Xior Student Housing NV | | | 6,822 | | | 218,980 |
| | | | | | 56,646,597 |
Retail REITs - 16.2%
|
Brixmor Property Group, Inc. | | | 116,756 | | | 2,695,896 |
CapitaLand Integrated Commercial Trust | | | 2,159,112 | | | 3,154,430 |
Carmila SA | | | 26,911 | | | 451,088 |
Charter Hall Retail REIT | | | 221,249 | | | 480,224 |
Choice Properties Real Estate Investment Trust | | | 71,734 | | | 673,121 |
Eurocommercial Properties NV | | | 17,241 | | | 415,758 |
Federal Realty Investment Trust | | | 29,239 | | | 2,952,262 |
First Capital Real Estate Investment Trust | | | 42,825 | | | 460,063 |
Frasers Centrepoint Trust | | | 462,500 | | | 726,895 |
Hammerson PLC(b) | | | 1,515,508 | | | 530,662 |
Immobiliare Grande Distribuzione SIIQ SpA(b) | | | 20,822 | | | 38,473 |
Japan Metropolitan Fund Invest | | | 2,784 | | | 1,566,281 |
| | | | | | | |
The accompanying notes are an integral part of these financial statements.
TABLE OF CONTENTS
Vert Global Sustainable Real Estate ETF
Schedule of Investments
as of June 30, 2024(Continued)
| | | | | | | |
REAL ESTATE INVESTMENT TRUSTS - (Continued)
|
Retail REITs - (Continued)
|
Kimco Realty Corp.(a) | | | 270,596 | | | $5,265,798 |
Kiwi Property Group Ltd. | | | 582,338 | | | 294,524 |
Klepierre SA | | | 86,392 | | | 2,312,922 |
Lar Espana Real Estate Socimi SA | | | 19,055 | | | 139,484 |
Lendlease Global Commercial REIT | | | 854,590 | | | 353,123 |
Macerich Co.(a) | | | 86,424 | | | 1,334,387 |
Mapletree Pan Asia Commercial Trust | | | 821,500 | | | 739,517 |
Mercialys SA | | | 37,847 | | | 419,012 |
Regency Centers Corp. | | | 70,329 | | | 4,374,464 |
RioCan Real Estate Investment Trust | | | 62,213 | | | 764,279 |
Scentre Group | | | 2,030,573 | | | 4,231,095 |
Shaftesbury Capital PLC | | | 527,293 | | | 927,835 |
Simon Property Group, Inc. | | | 121,231 | | | 18,402,866 |
Unibail-Rodamco-Westfield | | | 46,484 | | | 3,662,723 |
Vastned Belgium NV | | | 37 | | | 1,186 |
Vastned Retail NV | | | 4,372 | | | 108,708 |
Vicinity Ltd. | | | 1,426,042 | | | 1,761,910 |
Wereldhave Belgium Comm VA | | | 447 | | | 21,702 |
Wereldhave NV | | | 15,258 | | | 216,511 |
| | | | | | 59,477,199 |
Specialized REITs - 21.8%
|
American Tower Corp. | | | 92,500 | | | 17,980,150 |
Big Yellow Group PLC | | | 71,529 | | | 1,061,524 |
Charter Hall Social Infrastructure REIT | | | 151,621 | | | 239,987 |
Digital Realty Trust, Inc. | | | 123,937 | | | 18,844,621 |
Equinix, Inc. | | | 23,056 | | | 17,444,169 |
Extra Space Storage, Inc. | | | 85,515 | | | 13,289,886 |
Iron Mountain, Inc. | | | 118,008 | | | 10,575,877 |
Safestore Holdings PLC | | | 80,292 | | | 781,017 |
| | | | | | 80,217,231 |
TOTAL REAL ESTATE INVESTMENT TRUSTS
(Cost $347,360,885) | | | | | | 364,341,125 |
| | | Units | | | |
SHORT-TERM INVESTMENTS - 8.0%
|
Investments Purchased with Proceeds from Securities Lending - 7.8%
| |
Mount Vernon Liquid Assets Portfolio, LLC, 5.46%(d) | | | 28,598,645 | | | 28,598,645 |
| | | | | | 28,598,645 |
| | | | | | | |
The accompanying notes are an integral part of these financial statements.
TABLE OF CONTENTS
Vert Global Sustainable Real Estate ETF
Schedule of Investments
as of June 30, 2024(Continued)
| | | | | | | |
SHORT-TERM INVESTMENTS - (Continued)
|
Money Market Funds - 0.2%
|
Invesco Government & Agency Portfolio - Class Institutional, 5.25% | | | 688,794 | | | $688,794 |
TOTAL SHORT-TERM INVESTMENTS
(Cost $29,287,439) | | | | | | 29,287,439 |
TOTAL INVESTMENTS - 107.2%
(Cost $376,648,324) | | | | | | $393,628,564 |
Liabilities in Excess of Other Assets - (7.2)% | | | | | | (26,542,066) |
TOTAL NET ASSETS - 100.0% | | | | | | $367,086,498 |
| | | | | | | |
Percentages are stated as a percent of net assets.
NV - Naamloze Vennootschap
PLC - Public Limited Company
REIT - Real Estate Investment Trust
S de RL de CV - Sociedad de Responsabilidad Limitada de Capital Variable
SCA - Societate în comandită pe acţiuni
SA - Sociedad Anónima
CVA - coöperatieve vennootschap aansprakelijkheid
SAB de CV - Sociedad Anónima Bursátil de Capital Variable
SpA - Soceita per azioni
VA - Vennootschap op Aandelen
(a)
| All or a portion of this security is on loan as of June 30, 2024. The total market value of these securities was $28,182,004 which represented 7.7% of net assets. |
(b)
| Non-income producing security. |
(c)
| Fair value determined using significant unobservable inputs in accordance with procedures established by and under the supervision of Vert Asset Management LLC (the “Advisor”), acting as Valuation Designee. These securities represented $30,770 or 0.0% of net assets as of June 30, 2024. |
(d)
| The rate shown represents the 7-day effective yield as of June 30, 2024. |
The Global Industry Classification Standard (“GICS®”) was developed by and/or is the exclusive property of MSCI, Inc. (“MSCI”) and Standard & Poor’s Financial Services LLC (“S&P”). GICS® is a service mark of MSCI and S&P and has been licensed for use by U.S. Bank Global Fund Services.
The accompanying notes are an integral part of these financial statements.
TABLE OF CONTENTS
Vert Global Sustainable Real Estate ETF
Statement of Assets and Liabilities
as of June 30, 2024
| | | | |
ASSETS:
| | | |
Investments, at value | | | $393,628,564 |
Foreign currency, at value | | | 56,044 |
Dividends and interest receivable | | | 1,518,613 |
Receivable for fund shares sold | | | 965,570 |
Receivable for investments sold | | | 639,616 |
Securities lending income receivable | | | 2,140 |
Total assets | | | 396,810,547 |
LIABILITIES:
| | | |
Payable upon return of collateral for securities on loan | | | 28,598,645 |
Payable for investments purchased | | | 959,992 |
Payable to adviser | | | 83,223 |
Payable for fund administration and accounting fees | | | 32,917 |
Payable for custodian fees | | | 16,755 |
Payable for audit fees | | | 15,772 |
Payable for printing and mailing | | | 4,543 |
Payable for compliance fees | | | 2,619 |
Payable for transfer agent fees and expenses | | | 49 |
Payable for expenses and other liabilities | | | 9,534 |
Total liabilities | | | 29,724,049 |
NET ASSETS | | | $367,086,498 |
Net Assets Consists of:
| | | |
Paid-in capital | | | $368,777,727 |
Total accumulated losses | | | (1,691,229) |
Total net assets | | | $367,086,498 |
Shares issued and outstanding(a) | | | 38,017,962 |
Net asset value per share | | | $9.66 |
Cost:
| | | |
Investments, at cost | | | $376,648,324 |
Foreign currency, at cost | | | 56,743 |
LOANED SECURITIES:
| | | |
at value (included in investments) | | | $28,182,004 |
| | | | |
(a)
| Unlimited shares authorized without par value. |
The accompanying notes are an integral part of these financial statements.
TABLE OF CONTENTS
Vert Global Sustainable Real Estate ETF
Statement of Operations
For the Year Ended June 30, 2024
| |
INVESTMENT INCOME:
|
Dividend income | | | $11,954,842 |
Less: Dividend withholding taxes | | | (575,471) |
Interest income | | | 41,688 |
Securities lending income | | | 59,239 |
Total investment income | | | 11,480,298 |
EXPENSES:
| | | |
Investment advisory fee (Note 4) | | | 1,310,702 |
Fund administration and accounting fees (Note 4) | | | 207,280 |
Custodian fees | | | 92,616 |
Federal and state registration fees | | | 49,804 |
Trustees’ fees | | | 29,814 |
Transfer agent fees | | | 28,073 |
Reports to shareholders | | | 27,286 |
Legal fees | | | 23,854 |
Audit fees | | | 16,546 |
Compliance fees | | | 14,346 |
Other | | | 28,444 |
Total expenses | | | 1,828,765 |
Expense reimbursement by Adviser (Note 4) | | | (289,928) |
Net expenses | | | 1,538,837 |
NET INVESTMENT INCOME | | | 9,941,461 |
REALIZED AND UNREALIZED GAIN (LOSS)
| | | |
Net realized gain (loss) from:
| | | |
In-kind transactions | | | 6,476,224 |
Investments | | | (11,338,412) |
Foreign currency transactions | | | 36,788 |
Net realized loss | | | (4,825,400) |
Net change in unrealized appreciation (depreciation) on:
| | | |
Investments | | | 32,061,366 |
Foreign currency translation | | | (1,214) |
Net change in unrealized appreciation | | | 32,060,152 |
Net realized and unrealized gain | | | 27,234,752 |
NET INCREASE IN NET ASSETS RESULTING FROM OPERATIONS | | | $37,176,213 |
| | | | |
The accompanying notes are an integral part of these financial statements.
TABLE OF CONTENTS
Vert Global Sustainable Real Estate ETF
Statements of Changes in Net Assets
| | | | |
OPERATIONS:
| | | | | | |
Net investment income | | | $9,941,461 | | | $6,577,808 |
Net realized loss | | | (4,825,400) | | | (6,274,396) |
Net change in unrealized appreciation (depreciation) | | | 32,060,152 | | | (5,038,449) |
Net increase (decrease) in net assets from operations | | | 37,176,213 | | | (4,735,037) |
| |
DISTRIBUTIONS TO SHAREHOLDERS:
| | | | | | |
Distributions to shareholders | | | (16,350,404) | | | (2,751,991) |
Tax return of capital to shareholders | | | (1,283,216) | | | — |
Total distributions to shareholders | | | (17,633,620) | | | (2,751,991) |
|
CAPITAL TRANSACTIONS:
| | | | | | |
Subscriptions | | | 100,074,661 | | | 179,294,885 |
Redemptions | | | (44,380,856) | | | (42,029,899) |
ETF transaction fees (See Note #7) | | | 1,284 | | | — |
Distributions reinvested | | | — | | | 2,714,419 |
Net increase in net assets from capital transactions | | | 55,695,089 | | | 139,979,405 |
Net Increase in Net Assets | | | 75,237,682 | | | 132,492,377 |
|
NET ASSETS:
| | | | | | |
Beginning of the year | | | 291,848,816 | | | 159,356,439 |
End of the year | | | $367,086,498 | | | $291,848,816 |
|
SHARES TRANSACTIONS
| | | | | | |
Subscriptions | | | 10,836,661 | | | 19,806,638 |
Redemptions | | | (4,847,028) | | | (4,634,699) |
Distributions reinvested | | | — | | | 292,187 |
Total increase in shares outstanding | | | 5,989,633 | | | 15,464,126 |
| | | | | | | |
*
| Prior to December 4, 2023 the fund operated as a traditional open-end mutual fund See Note 1. |
The accompanying notes are an integral part of these financial statements.
TABLE OF CONTENTS
Vert Global Sustainable Real Estate ETF
Financial Highlights
For a capital share outstanding throughout each year presented.
| | | | |
PER SHARE DATA:
| | | | | | | | | | | | | | | |
Net asset value, beginning of year | | | $9.11 | | | $9.62 | | | $11.39 | | | $8.59 | | | $10.45 |
INVESTMENTS OPERATIONS:
| | | | | | | | | | | | | | | |
Net investment income(a) | | | 0.28 | | | 0.30 | | | 0.21 | | | 0.19 | | | 0.32 |
Net realized and unrealized gain (loss) on investments | | | 0.76 | | | (0.67) | | | (1.55) | | | 2.76 | | | (1.84) |
Total from investment operations | | | 1.04 | | | (0.37) | | | 1.34 | | | 2.95 | | | (1.52) |
LESS DISTRIBUTIONS FROM:
| | | | | | | | | | | | | | | |
From net investment income | | | (0.46) | | | (0.04) | | | (0.26) | | | (0.15) | | | (0.34) |
From net realized gains | | | — | | | (0.10) | | | (0.17) | | | — | | | — |
Return of capital | | | (0.03) | | | — | | | — | | | — | | | — |
Total distributions | | | (0.49) | | | (0.14) | | | (0.43) | | | (0.15) | | | (0.34) |
Redemption fee per share | | | 0.00 | | | — | | | — | | | — | | | — |
ETF transaction fees per share | | | 0.00(b) | | | — | | | — | | | — | | | — |
Net asset value, end of year | | | $9.66 | | | $9.11 | | | $9.62 | | | $11.39 | | | $8.59 |
Total return | | | 11.41%(d) | | | (3.84)% | | | (12.41)% | | | 34.72% | | | (15.14)% |
SUPPLEMENTAL DATA AND RATIOS:
| | | | | | | | | | | | |
Net assets, end of year (in thousands) | | | $367,086 | | | $291,849 | | | $159,356 | | | $125,923 | | | $50,637 |
Ratio of expenses to average net assets:
| | | | | | | | | | | | | | | |
Before expense reimbursement/
recoupment | | | 0.56% | | | 0.62% | | | 0.67% | | | 0.80% | | | 1.12% |
After expense reimbursement/
recoupment | | | 0.47% | | | 0.50% | | | 0.50% | | | 0.50% | | | 0.50% |
Ratio of net investment income to average
net assets
| | | | | | | | | | | | | | | |
Before reimbursements | | | 2.94% | | | 3.11% | | | 1.64% | | | 1.66% | | | 2.64% |
After reimbursements | | | 3.03% | | | 3.23% | | | 1.80% | | | 1.96% | | | 3.26% |
Portfolio turnover rate(c) | | | 11% | | | 9% | | | 11% | | | 19% | | | 18% |
| | | | | | | | | | | | | | | | |
(a)
| Net investment income per share has been calculated based on average shares outstanding during the year.
|
(b)
| Amount represents less than $0.005 per share. |
(c)
| Portfolio Turnover rate excludes in-kind transactions. |
(d)
| The performance for the Fund is calculated on a net asset value basis. |
(e)
| The Fund converted from a mutual fund to an ETF pursuant to an Agreement and Plan of Reorganization on December 4, 2023. See Note 1 in the Notes to Financial Statements for additional information about the Reorganization. The financial highlights in the above table reflect the performance of the mutual fund for the period prior to December 4, 2023 and the performance of the Fund as an ETF for the period from December 4, 2023 through June 30, 2024. |
The accompanying notes are an integral part of these financial statements.
TABLE OF CONTENTS
Vert Global Sustainable Real Estate ETF
NOTES TO FINANCIAL STATEMENTS
at June 30, 2024
NOTE 1 – ORGANIZATION
The Vert Global Sustainable Real Estate ETF (the “Fund”) is a series of Manager Directed Portfolios (the “Trust”). The Trust is registered under the Investment Company Act of 1940, as amended (the “1940 Act”), and was organized as a Delaware statutory trust on April 4, 2006. The Fund is an open-end investment management company and is a diversified series of the Trust. The Fund commenced operations on October 31, 2017. Vert Asset Management, LLC (the “Advisor”) serves as the investment advisor to the Fund. Dimensional Fund Advisors LP (the “Sub-Advisor”) serves as the sub-advisor to the Fund. The investment objective of the Fund is to seek long term capital appreciation.
The Fund is the accounting and performance survivor of the Vert Global Sustainable Real Estate Fund (the “Target Fund”) following a tax-free reorganization (“Reorganization”), pursuant to an Agreement and Plan of Reorganization, which resulted in the conversion of the Target Fund organized as a mutual fund to an exchange-traded fund (“ETF”) on December 4, 2023. The Advisor will bear all costs incurred in connection with the Reorganization whether or not the Reorganization is consummated. These costs and expenses include professional fees, charges by service providers and costs related to the printing and mailing of the Information Statement/Prospectus. The Fund was established as a “shell” fund organized solely in connection with the Reorganization for the purpose of acquiring the assets and liabilities of the Target Fund and continuing the operations of the Target Fund as an ETF. The Fund had no performance history prior to the Reorganization. The Fund has a substantially similar strategy as the Target Fund. Shares of the Target Fund were exchanged for shares of equal value of the Fund. The cost basis of the investments received from the Target Fund were carried forward to align ongoing reporting of the Fund’s realized and unrealized gains and losses with amounts distributable to shareholders for tax purposes. This is illustrated in the following table:
| | | | | | | | | | | | | |
$326,550,740(1)
| | | 34,417,962 | | | $ — | | | $326,550,740 | | | Non-taxable |
| | | | | | | | | | | | | |
(1)
| Includes accumulated net investment income, accumulated realized losses, and unrealized appreciation in the amounts of $12,595,314, $(13,381,718), and $(1,844,395) respectively. |
NOTE 2 – SIGNIFICANT ACCOUNTING POLICIES
The following is a summary of significant accounting policies consistently followed by the Fund. These policies are in conformity with U.S. generally accepted accounting principles (“GAAP”). The Fund is an investment company and accordingly follows the investment company accounting and reporting guidance of the Financial Accounting Standards Board (“FASB”) Accounting Standard Codification Topic 946 “Financial Services – Investment Companies” including FASB Accounting Standard Update ASU 2013-08.
A.
| Security Valuation: All investments in securities are recorded at their estimated fair value, as described in Note 3. |
B.
| Federal Income Taxes: It is the Fund’s policy to comply with the requirements of Subchapter M of the Internal Revenue Code applicable to regulated investment companies and to distribute substantially all of its taxable income to its shareholders. Therefore, no federal income or excise tax provisions are required. |
The Fund recognizes the tax benefits of uncertain tax positions only where the position is “more likely than not” to be sustained assuming examination by tax authorities. Management has analyzed the Fund’s tax positions, and has concluded that no liability for unrecognized tax benefits should be recorded related to uncertain tax positions to be taken or expected to be taken on a tax return. The tax returns for the Fund for the prior three fiscal years are open for examination. The Fund identifies its major tax jurisdictions as U.S. Federal and the state of Delaware. The Fund recognizes interest and penalties, if any, related to unrecognized tax benefits as income tax expense on the Statement of Operations. Management of the Fund is required to determine whether a tax position taken by the Fund is more likely than not to be sustained upon examination by the applicable taxing authority. Based on its analysis, Management has concluded that the Fund does not have any unrecognized tax benefits or uncertain tax positions that would require a provision for income tax. Accordingly, the Fund did not incur any interest or penalties for the fiscal year ended June 30, 2024.
TABLE OF CONTENTS
Vert Global Sustainable Real Estate ETF
NOTES TO FINANCIAL STATEMENTS
at June 30, 2024(Continued)
C.
| Securities Transactions, Income, Expenses and Distributions: Securities transactions are accounted for on the trade date. Realized gains and losses on securities sold are determined on the basis of identified cost. Interest income is recorded on an accrual basis. Dividend income and distributions to shareholders are recorded on the ex-dividend date. The Fund invests in real estate investment trusts (REITs) which report information on the source of their distributions annually. The Fund’s policy is to record all REIT distributions initially as dividend income on the ex-dividend date and then re-designate them as return of capital and/or capital gain distributions at the end of the reporting period based on information provided annually by each REIT, and management estimates such re-designations when actual information has not yet been reported. Income on REITs may be reclassified to realized gains or as an adjustment to cost in order to correctly recognize the true character of the distributions received by the Fund. Withholding taxes on foreign dividends have been provided for in accordance with the Fund’s understanding of the applicable country’s tax rules and rates. |
The Fund distributes substantially all of its net investment income, if any, quarterly, and net realized capital gains, if any, annually. Distributions from net realized gains for book purposes may include short-term capital gains. All short-term capital gains are included in ordinary income for tax purposes. The amount of dividends and distributions to shareholders from net investment income and net realized capital gains is determined in accordance with federal income tax regulations, which may differ from GAAP (Generally Accepted Accounting Principles). To the extent these book/tax differences are permanent, such amounts are reclassified within the capital accounts based on their federal tax treatment.
The Fund is charged for those expenses that are directly attributable to it, such as investment advisory, custody and transfer agent fees. Expenses that are not attributable to a Fund are typically allocated among the funds in the Trust proportionately based on allocation methods approved by the Board of Trustees (the “Board”). Common expenses of the Trust are typically allocated among the funds in the Trust based on a fund’s respective net assets, or by other equitable means.
D.
| Use of Estimates: The preparation of financial statements in conformity with GAAP requires management to make estimates and assumptions that affect the reported amounts of assets and liabilities, and disclosures of contingent assets and liabilities at the date of the financial statements and the reported amounts of increases and decreases in net assets during the reporting period. Actual results could differ from those estimates. |
E.
| Reclassification of Capital Accounts: GAAP requires that certain components of net assets relating to permanent differences be reclassified between financial and tax reporting. These reclassifications have no effect on net assets or net asset value per share. |
F.
| Foreign Currency: Values of investments denominated in foreign currencies are converted into U.S. dollars using the spot market rate of exchange at the time of valuation. Purchases and sales of investments and income are translated into U.S. dollars using the spot market rate of exchange prevailing on the respective dates of such transactions. The Fund does not isolate the portion of the results of operations resulting from fluctuations in foreign exchange rates on investments from fluctuations resulting from changes in the market prices of securities held. Such fluctuations are included with the net realized and unrealized gain/loss on investments. Foreign investments present additional risks due to currency fluctuations, economic and political factors, lower liquidity, government regulations, differences in accounting standards, and other factors. |
G.
| Events Subsequent to the Fiscal Period End: In preparing the financial statements as of June 30, 2024, management considered the impact of subsequent events for potential recognition or disclosure in the financial statements and has concluded that no additional recognition or disclosures are necessary. |
NOTE 3 – SECURITIES VALUATION
The Fund has adopted authoritative fair value accounting standards which establish an authoritative definition of fair value and set out a hierarchy for measuring fair value. These standards require additional disclosures about the
various inputs and valuation techniques used to develop the measurements of fair value, a discussion of changes in
TABLE OF CONTENTS
Vert Global Sustainable Real Estate ETF
NOTES TO FINANCIAL STATEMENTS
at June 30, 2024(Continued)
valuation techniques and related inputs during the fiscal period, and expanded disclosure of valuation levels for major security types. These inputs are summarized in the three broad levels listed below:
Level 1 –
Unadjusted, quoted prices in active markets for identical assets or liabilities that the Fund has the ability to access at the date of measurement.
Level 2 –
Other significant observable inputs (including, but not limited to, quoted prices in active markets for similar instruments, quoted prices in markets that are not active for identical or similar instruments, and model-derived valuations in which all significant inputs and significant value drivers are observable in active markets, such as interest rates, prepayment speeds, credit risk curves, default rates, and similar data).
Level 3 –
Significant unobservable inputs for the asset or liability, to the extent relevant observable inputs are not available, representing the Fund’s own assumptions about the assumptions a market participant would use in valuing the asset or liability, and would be based on the best information available.
Following is a description of the valuation techniques applied to the Fund’s major categories of assets and liabilities measured at fair value on a recurring basis.
Equity Securities: Equity securities, including common stocks, preferred stocks, foreign-issued common stocks, exchange-traded funds, closed-end mutual funds and real estate investment trusts (REITs), that are primarily traded on a national securities exchange shall be valued at the last sale price on the exchange on which they are primarily traded on the day of valuation or, if there has been no sale on such day, at the mean between the bid and asked prices. Securities primarily traded in the NASDAQ Global Market System for which market quotations are readily available shall be valued using the NASDAQ Official Closing Price (“NOCP”). If the NOCP is not available, such securities shall be valued at the last sale price on the day of valuation, or if there has been no sale on such day, at the mean between the bid and asked prices. Over-the-counter securities that are not traded on a listed exchange are valued at the last sale price in the over-the-counter market. Over-the-counter securities which are not traded in the NASDAQ Global Market System shall be valued at the mean between the bid and asked prices. To the extent these securities are actively traded and valuation adjustments are not applied, they are categorized in Level 1 of the fair value hierarchy. Securities traded on foreign exchanges generally are not valued at the same time the Fund calculates its net asset value (“NAV”) because most foreign markets close well before such time. The earlier close of most foreign markets gives rise to the possibility that significant events, including broad market moves, may have occurred in the interim. In certain circumstances, it may be determined that a security needs to be fair valued because it appears that the value of the security might have been materially affected by an event (a “Significant Event”) occurring after the close of the market in which the security is principally traded, but before the time the Fund calculates its NAV. A Significant Event may relate to a single issuer or to an entire market sector, or even occurrences not tied directly to the securities markets, such as natural disasters, armed conflicts, or significant government actions.
Registered Investment Companies: Investments in registered investment companies (e.g., mutual funds) are generally priced at the ending NAV provided by the applicable registered investment company’s service agent and will be classified in Level 1 of the fair value hierarchy.
Short-Term Debt Securities: Debt securities, including short-term debt instruments having a maturity of less than 60 days, are valued at the evaluated mean price supplied by an approved pricing service. Pricing services may use various valuation methodologies including matrix pricing and other analytical pricing models as well as market transactions and dealer quotations. Short-term securities are generally classified in Level 1 or Level 2 of the fair market hierarchy depending on the inputs used and market activity levels for specific securities.
In the absence of prices from a pricing service or in the event that market quotations are not readily available, fair value will be determined under the Fund’s valuation procedures adopted pursuant to Rule 2a-5. Pursuant to those procedures, the Board has appointed the Advisor as the Fund’s valuation designee (the “Valuation Designee”) to perform all fair valuations of the Fund’s portfolio investments, subject to the Board’s oversight. As the Valuation Designee, the Advisor has established procedures for its fair valuation of the Fund’s portfolio investments. These procedures address, among other things, determining when market quotations are not readily available or reliable and the methodologies to be used for determining the fair value of investments, as well as the use and oversight of third-party pricing services for fair valuation.
TABLE OF CONTENTS
Vert Global Sustainable Real Estate ETF
NOTES TO FINANCIAL STATEMENTS
at June 30, 2024(Continued)
Depending on the relative significance of the valuation inputs, fair valued securities may be classified in either Level 2 or Level 3 of the fair value hierarchy.
The fair valuation of foreign securities may be determined with the assistance of a pricing service using correlations between the movement of prices of such securities and indices of domestic securities and other appropriate indicators, such as closing market prices of relevant American Depositary Receipts or futures contracts. The effect of using fair value pricing is that the Fund’s NAV will reflect the affected portfolio securities’ values as determined by the Valuation Designee instead of being determined by the market. Using a fair value pricing methodology to price a foreign security may result in a value that is different from the foreign security’s most recent closing price and from the prices used by other investment companies to calculate their NAVs and are generally classified in Level 2 of the fair valuation hierarchy. Because the Fund may invest in foreign securities, the value of the Fund’s portfolio securities may change on days when you will not be able to purchase or redeem your shares.
The inputs or methodology used for valuing securities are not an indication of the risk associated with investing in those securities. The following is a summary of the fair valuation hierarchy of the Fund’s securities as of June 30, 2024:
| | | | | | | | | | | | | |
REITs | | | $364,310,355 | | | $ — | | | $ 30,770 | | | $ 364,341,125 |
Money Market Funds | | | 688,794 | | | — | | | — | | | 688,794 |
Investments Purchased with Proceeds from Securities Lending* | | | — | | | — | | | — | | | 28,598,645* |
Total Investments in Securities | | | $364,999,149 | | | $— | | | $30,770 | | | $393,628,564 |
| | | | | | | | | | | | | |
*
| Investment valued using the NAV per share practical expedient. In accordance with Topic 820, the investment is excluded from the fair value hierarchy. The investment is included in the total column for the purpose of reconciling the table to the schedule of investments. |
Level 3 Reconciliation Disclosure
The following is a reconciliation of Level 3 assets for which significant unobservable inputs were used to determine fair value.
| | | | |
July 1, 2023 Market Value | | | $30,914 |
Purchases | | | — |
Sales proceeds (and/or rights exercised) | | | — |
Accrued discounts/premiums net | | | — |
Change in unrealized appreciation/(depreciation) | | | (144) |
Transfer in and/or (out) of Level 3 | | | — |
Balance as of June 30, 2024 | | | $30,770 |
| | | | |
As of June 30, 2024, the change in unrealized depreciation on positions still held in the Fund was $(144) for Home REIT PLC.
Significant Unobservable Inputs
The following table summarizes the significant unobservable inputs used to value the level 3 investments as of June 30, 2024.
The table is not intended to be all-inclusive but instead identifies the significant unobservable inputs relevant to the determination of fair values.
TABLE OF CONTENTS
Vert Global Sustainable Real Estate ETF
NOTES TO FINANCIAL STATEMENTS
at June 30, 2024(Continued)
| | | | | | | | | | | | | | | | |
REIT | | | $30,770 | | | Discount to last
quoted price | | | Discount | | | 75% | | | Increase |
| | | | | | | | | | | | | | | | |
(a)
| Weighted Averages are calculated based on Fair Value of investments. |
NOTE 4 – INVESTMENT ADVISORY FEE AND OTHER TRANSACTIONS WITH AFFILIATES
For the fiscal year ended June 30, 2024, the Advisor provided the Fund with investment management services under an Investment Advisory Agreement. The Advisor furnishes all investment advice, office space, and facilities, and provides most of the personnel needed by the Fund. As compensation for its services, the Advisor is entitled to a monthly fee at an annual rate of 0.40% of the average daily net assets of the Fund, which has not changed from the Advisory fee rate of the target fund. For the fiscal year ended June 30, 2024, the Fund incurred $1,310,702 in advisory fees. The Advisor has hired Dimensional Fund Advisors LP as a sub-advisor to the Fund. The Advisor pays the Sub-Advisor fee for the Fund from its own assets and these fees are not an additional expense of the Fund.
The Fund is responsible for its own operating expenses. Under a new operating expense limitation agreement for the Fund, the Advisor has contractually agreed to waive a portion of its fees and reimburse certain expenses for the Fund to ensure that the total annual fund operating expenses excluding any front-end or contingent deferred loads, Rule 12b-1 plan fees, shareholder servicing plan fees (including sub-transfer agency fees), taxes, any expenses incurred in connection with borrowings made by a Fund, interest (including without limitation interest incurred in connection with bank and custody overdrafts), brokerage commissions and other transactional expenses, expenses incurred in connection with any merger or reorganization, dividends or interest on short positions, acquired fund fees and expenses or extraordinary expenses such as litigation do not exceed the following amounts of the average daily net assets of the Fund from July 1, 2023 through December 3, 2024 and the ETF from December 4, 2024 through June 30, 2024 respectively:
| | | | |
Vert Global Sustainable Real Estate Fund | | | 0.50% |
Vert Global Sustainable Real Estate ETF | | | 0.45% |
| | | | |
For the fiscal year ended June 30, 2024, the Advisor reduced its fees and absorbed Fund expenses in the amount of $289,928 for the Fund. The waivers and reimbursements will remain in effect through at least December 4, 2026, unless terminated sooner by, or with the consent of, the Board.
The Advisor may request recoupment of previously waived fees and paid expenses in any subsequent month in the three-year period from the date of the management fee reduction and expense payment if the aggregate amount actually paid by the Fund toward the operating expenses for such fiscal year (taking into account the reimbursement) will not cause the Fund to exceed the lesser of: (1) the expense limitation in place at the time of the management fee reduction and expense payment; or (2) the expense limitation in place at the time of the reimbursement. Any such reimbursement is also contingent upon the Trust’s prior review and approval at the time the reimbursement is made. Such reimbursement may not be paid prior to the Fund’s payment of current ordinary operating expenses. Cumulative expenses subject to recapture pursuant to the aforementioned conditions expire as follows:
U.S. Bancorp Fund Services, LLC, doing business as U.S. Bank Global Fund Services, LLC (“Fund Services” or the “Administrator”) acts as the Fund’s Administrator under an Administration Agreement. The Administrator prepares various federal and state regulatory filings, reports and returns for the Fund; prepares reports and materials to be supplied to the Trustees; monitors the activities of the Fund’s custodian, transfer agent and accountants; coordinates the preparation and payment of the Fund’s expenses and reviews the Fund’s expense accruals. Fund Services also serves as the fund accountant and transfer agent to the Fund, and provides Chief Compliance Officer services. U.S. Bank N.A., an affiliate of Fund Services, serves as the Fund’s custodian.
TABLE OF CONTENTS
Vert Global Sustainable Real Estate ETF
NOTES TO FINANCIAL STATEMENTS
at June 30, 2024(Continued)
For the fiscal year ended June 30, 2024, the Fund incurred the following expenses for administration, fund accounting, transfer agency, custody, and compliance fees:
| | | | |
Administration & fund accounting | | | $207,280 |
Custody | | | $92,616 |
Transfer agency | | | $28,073 |
Compliance | | | $14,346 |
| | | | |
At June 30, 2024, the Fund had payables due to Fund Services for administration, fund accounting and transfer agency fees, compliance fees, and to U.S. Bank N.A. for custody fees in the following amounts:
| | | | |
Administration & fund accounting | | | $32,917 |
Custody | | | $16,755 |
Transfer agency | | | $49 |
Compliance | | | $ 2,619 |
| | | | |
Quasar Distributors, LLC (the “Distributor”) acts as the Fund’s principal underwriter in a continuous public offering of the Fund’s shares.
Certain officers and Trustees of the Fund are employees of the Administrator and are not paid any fees by the Fund for serving in such capacities.
NOTE 5 – SECURITIES TRANSACTIONS
For the year ended June 30, 2024, the cost of purchases and the proceeds from sales of securities, excluding short-term securities and in-kind transactions, were as follows:
There were no purchases or sales of long-term U.S. Government securities.
For the year ended June 30, 2024 the in-kind transactions associated with creations and redemptions of the Fund were as follows:
NOTE 6 – INCOME TAXES AND DISTRIBUTIONS TO SHAREHOLDERS
As of June 30, 2024, the Fund’s most recent fiscal year end, the components of accumulated earnings/(losses) on a tax basis were as follows:
| | | | |
Cost of investments(a) | | | $383,268,136 |
Gross unrealized appreciation | | | 41,334,354 |
Gross unrealized depreciation | | | (30,973,926) |
Net unrealized appreciation | | | 10,360,428 |
Undistributed ordinary income | | | — |
Undistributed long-term capital gain | | | — |
Total distributable earnings | | | — |
Other accumulated losses | | | (12,051,657) |
Total accumulated deficit | | | $(1,691,229) |
| | | | |
(a)
| The difference between the book basis and tax basis net unrealized appreciation and cost is attributable primarily to wash sales and passive foreign investment companies. |
TABLE OF CONTENTS
Vert Global Sustainable Real Estate ETF
NOTES TO FINANCIAL STATEMENTS
at June 30, 2024(Continued)
As of June 30, 2024, the Fund had long term capital losses in the amount of $10,139,858 and short term capital losses in the amount of $1,905,018 to offset future capital gains.
For the fiscal year ended June 30, 2024, the effect of permanent “book/tax” reclassifications relating to redemptions in-kind resulted in increases and decreases to components of the Fund’s net assets as follows:
| | | | | | | |
Vert Global Sustainable Real Estate ETF | | | $(6,106,233) | | | $6,106,233 |
| | | | | | | |
The tax character of distributions paid during the fiscal year ended June 30, 2024, and the fiscal year ended June 30, 2023, was as follows:
| | | | |
Ordinary income | | | $16,350,404 | | | $1,656,103 |
Long-term capital gains | | | — | | | 1,095,888 |
Return of capital | | | 1,283,216 | | | — |
| | | $17,633,620 | | | $2,751,991 |
| | | | | | | |
NOTE 7 – CREATION AND REDEMPTION TRANSACTIONS
The Fund offers and issues Shares at their NAV only in aggregations of a specified number of Shares (each, a “Creation Unit”). The Fund generally offers and issues Shares in exchange for a basket of securities (“Deposit Securities”) together with the deposit of a specified cash payment (“Cash Component”). The Trust reserves the right to permit or require the substitution of a “cash in lieu” amount (“Deposit Cash”) to be added to the Cash Component to replace any Deposit Security. Shares are listed on the Nasdaq Stock Market LLC (the “Exchange”) and trade on the Exchange at market prices that may differ from the Shares’ NAV. Shares are also redeemable only in Creation Unit aggregations, primarily for a basket of Deposit Securities together with a Cash Component. A Creation Unit of the Fund generally consists of 25,000 Shares, though this may change from time to time. As a practical matter, only institutions or large investors purchase or redeem Creation Units. Except when aggregated in Creation Units, Shares are not redeemable securities.
Shares may be issued in advance of receipt of Deposit Securities subject to various conditions, including a requirement to maintain on deposit with the Trust cash at least equal to a specified percentage of the value of the missing Deposit Securities, as set forth in the Participant Agreement. The Trust may impose a transaction fee for each creation or redemption. In all cases, such fees will be limited in accordance with the requirements of the SEC applicable to management investment companies offering redeemable securities. As in the case of other publicly traded securities, brokers’ commissions on transactions in the secondary market will be based on negotiated commission rates at customary levels.
NOTE 8 – SECURITIES LENDING
The Fund participates in securities lending arrangements whereby it lends certain of its portfolio securities to brokers, dealers and financial institutions (not with individuals) in order to receive additional income and increase the rate of return of its portfolio. U.S. Bank, N.A. serves as the Fund’s securities lending agent.
U.S. Bank, N.A. oversees the securities lending process, which includes the screening, selection and ongoing review of borrowers, monitoring the availability of securities, negotiating rebates, daily marking to market of loans, monitoring and maintaining cash collateral levels, processing securities movements and reinvesting cash collateral as directed by the Advisor.
The Fund may lend securities pursuant to agreements that require the loans to be secured by collateral consisting of cash, securities of the U.S. Government or it agencies, or any combination of cash and such securities. At the time of loans, the collateral value should at least be equal to 102% of domestic securities and 105% of foreign securities. The value of loaned securities will then be marked-to-market daily and the collateral will be continuously secured by
TABLE OF CONTENTS
Vert Global Sustainable Real Estate ETF
NOTES TO FINANCIAL STATEMENTS
at June 30, 2024(Continued)
collateral equal to 100% of the market value of the loaned securities. Such loans will not be made if, as a result, the aggregate amount of all outstanding securities loans for the Fund exceeds one-third of the value of the Fund’s total assets taken at fair market value. The Fund will earn interest on the investment of the cash collateral in U.S. Government securities, short-term money market instruments or such other approved vehicle. However, the Fund will normally pay lending fees to such broker-dealers and related expenses from the interest earned on invested collateral. There may be risks of delay in receiving additional collateral or risks of delay in recovery of the securities and even loss of rights in the collateral should the borrower of the securities fail financially. However, loans are made only to borrowers deemed by the Advisor to be of good standing and when, in the judgment of the adviser, the consideration that can be earned currently from such securities loans justifies the attendant risk. Either party, upon reasonable notice to the other party, may terminate the loan.
As of June 30, 2024, the Fund had loaned securities that were collateralized by cash. The cash collateral received was invested in securities as listed in the Fund’s Schedule of Investments.
The following table presents the securities out on loan for the Fund, and the collateral delivered related to those securities, as of the end of the reporting period.
Securities Lending Transactions
| | | | | | | | | | | | | | | | |
Vert Global Sustainable Real
Estate ETF | | | $28,182,004 | | | Non-registered
money market
fund | | | $28,598,645 | | | $28,598,645 | | | $ — |
| | | | | | | | | | | | | | | | |
^
| As of the end of the reporting period, the value of the collateral pledged from the counterparty exceeded the value of the securities out on loan. Refer to the Fund’s Schedule of Investments for details on the securities out on loan.
|
NOTE 9 – GUARANTEES AND INDEMNIFICATIONS
In the normal course of business, the Fund enters into contracts that contain a variety of representations and warranties and which provide general indemnifications. The Fund’s maximum exposure under these arrangements is unknown, as this would involve future claims that may be made against the Fund that have not yet occurred. However, based on experience, the Fund expects the risk of loss to be remote. The Trust indemnifies its officers and Trustees for certain liabilities that may arise from the performance of their duties to the Trust.
NOTE 10 – CONTROL OWNERSHIP
The beneficial ownership, either directly or indirectly, of more than 25% of the voting securities of a fund creates a presumption of control of the fund, under Section 2(a)(9) of the 1940 Act. As of June 30, 2024 Pershing LLC, held nearly 100% of the outstanding Shares of the Fund and the Fund has no knowledge as to whether all of any of the shares owned of record by Pershing LLC are also beneficially owned.
TABLE OF CONTENTS
REPORT OF INDEPENDENT REGISTERED PUBLIC ACCOUNTING FIRM
To the Shareholders of Vert Global Sustainable Real Estate ETF and
Board of Trustees of Manager Directed Portfolios
Opinion on the Financial Statements
We have audited the accompanying statement of assets and liabilities, including the schedule of investments, of the Vert Global Sustainable Real Estate ETF (formerly known as Vert Global Sustainable Real Estate Fund) (the “Fund”), a series of Manager Directed Portfolios, as of June 30, 2024, the related statement of operations for the year then ended, the statements of changes in net assets and the financial highlights for each of the two years in the period then ended, and the related notes, (collectively referred to as the “financial statements”). In our opinion, the financial statements present fairly, in all material respects, the financial position of the Fund as of June 30, 2024, the results of its operations for the year then ended, and the changes in net assets and the financial highlights for each of the two years in the period then ended, in conformity with accounting principles generally accepted in the United States of America.
The Fund’s financial highlights for the year ended June 30, 2022, and prior, were audited by other auditors whose report dated August 29, 2022, expressed an unqualified opinion on those financial highlights.
Basis for Opinion
These financial statements are the responsibility of the Fund’s management. Our responsibility is to express an opinion on the Fund’s financial statements based on our audits. We are a public accounting firm registered with the Public Company Accounting Oversight Board (United States) (“PCAOB”) and are required to be independent with respect to the Fund in accordance with the U.S. federal securities laws and the applicable rules and regulations of the Securities and Exchange Commission and the PCAOB.
We conducted our audits in accordance with the standards of the PCAOB. Those standards require that we plan and perform the audits to obtain reasonable assurance about whether the financial statements are free of material misstatement whether due to error or fraud.
Our audits included performing procedures to assess the risks of material misstatement of the financial statements, whether due to error or fraud, and performing procedures that respond to those risks. Such procedures included examining, on a test basis, evidence regarding the amounts and disclosures in the financial statements. Our procedures included confirmation of securities owned as of June 30, 2024, by correspondence with the custodian and brokers; when replies were not received from brokers, we performed other auditing procedures. Our audits also included evaluating the accounting principles used and significant estimates made by management, as well as evaluating the overall presentation of the financial statements. We believe that our audits provide a reasonable basis for our opinion.
We have served as the Fund’s auditor since 2023.
COHEN & COMPANY, LTD.
Philadelphia, Pennsylvania
August 29, 2024
TABLE OF CONTENTS
NOTICE TO SHAREHOLDERS (Unaudited)
How to Obtain a Copy of the Fund’s Proxy Voting Policies
A description of the policies and procedures that the Fund uses to determine how to vote proxies relating to portfolio securities is available without charge, upon request, by calling 1-888-878-5680 or on the U.S. Securities and Exchange Commission’s (“SEC”) website at http://www.sec.gov.
How to Obtain a Copy of the Fund’s Proxy Voting Records for the most recent 12-Month Period Ended June 30
Information regarding how the Fund voted proxies relating to portfolio securities during the most recent 12-month period ended June 30 is available no later than August 31 without charge, upon request, by 1-888-878-5680. Furthermore, you can obtain the Fund’s proxy voting records on the SEC’s website at http://www.sec.gov.
Quarterly Filings on Form N-PORT
The Fund files its complete schedule of portfolio holdings with the SEC for the first and third quarters of each fiscal year on Part F of Form N-PORT. The Fund’s Part F of Form N-PORT is available on the SEC’s website at http://www.sec.gov. Information included in the Fund’s Part F of Form N-PORT is also available, upon request, by calling 1-888-878-5680.
Householding
In an effort to decrease costs, the Fund intends to reduce the number of duplicate prospectuses and annual and semi-annual reports you receive by sending only one copy of each to those addresses shared by two or more accounts and to shareholders the Transfer Agent reasonably believes are from the same family or household. Once implemented, if you would like to discontinue householding for your accounts, please call toll-free at 1-800-497-2960 to request individual copies of these documents. Once the Transfer Agent receives notice to stop householding, the Transfer Agent will begin sending individual copies thirty days after receiving your request. This policy does not apply to account statements.
Qualified Divided Income/Dividends Received Deduction
For the fiscal year ended June 30, 2024, certain dividends paid by the fund may be subject to a maximum tax rate of 15%, as provided for by the Jobs and Growth Tax Relief Reconciliation Act of 2003. The percentage of dividends declared from ordinary income, designated as qualified dividend income was as follows:
| | | | |
Vert Global Sustainable Real Estate ETF | | | 38.42% |
| | | | |
For Corporate shareholders, the percent of ordinary income distributions qualifying for corporate dividends received deduction for the fiscal year ended June 30, 2024 was as follows:
| | | | |
Vert Global Sustainable Real Estate ETF | | | 0.00% |
| | | | |
TABLE OF CONTENTS
Investment Advisor
Vert Asset Management, LLC
85 Liberty Ship Way, Suite 201
Sausalito, CA 94965
Distributor
Quasar Distributors, LLC
3 Canal Plaza, Suite 100
Portland, ME 04101
Transfer Agent
U.S. Bancorp Fund Services, LLC
615 East Michigan Street
Milwaukee, WI 53202
(844) 740-VERT
Custodian
U.S. Bank National Association
Custody Operations
1555 North River Center Drive, Suite 302
Milwaukee, WI 53212
Independent Registered Public Accounting Firm
Cohen & Company Ltd.
1835 Market Street, Suite 310
Philadelphia, PA 19103
Legal Counsel
Godfrey & Kahn S.C.
833 East Michigan Street, Suite 1800
Milwaukee, WI 53202
This report is intended for shareholders of the Fund and may not be used as sales
literature unless preceded or accompanied by a current prospectus.
Past performance results shown in this report should not be considered a representation of
future performance. Share price and returns will fluctuate so that shares, when redeemed,
may be worth more or less than their original cost. Statements and other information
herein are dated and are subject to change.
| (b) | Financial Highlights are included within the financial statements filed under Item 7 of this Form. |
Item 8. Changes in and Disagreements with Accountants for Open-End Investment Companies.
There were no changes in or disagreements with accountants during the period covered by this report.
Item 9. Proxy Disclosures for Open-End Investment Companies.
There were no matters submitted to a vote of shareholders during the period covered by this report.
Item 10. Remuneration Paid to Directors, Officers, and Others of Open-End Investment Companies.
See the Statement of Operations within Item 7(a).
Item 11. Statement Regarding Basis for Approval of Investment Advisory Contract.
Not applicable.
Item 12. Disclosure of Proxy Voting Policies and Procedures for Closed-End Management Investment Companies.
Not applicable to open-end investment companies.
Item 13. Portfolio Managers of Closed-End Management Investment Companies.
Not applicable to open-end investment companies.
Item 14. Purchases of Equity Securities by Closed-End Management Investment Company and Affiliated Purchasers.
Not applicable to open-end investment companies.
Item 15. Submission of Matters to a Vote of Security Holders.
There have been no material changes to the procedures by which shareholders may recommend nominees to the Registrant’s Board of Trustees.
Item 16. Controls and Procedures.
| (a) | The Registrant’s President/Principal Executive Officer and Treasurer/Principal Financial Officer have reviewed the Registrant’s disclosure controls and procedures (as defined in Rule 30a-3(c) under the Investment Company Act of 1940 (the “Act”)) as of a date within 90 days of the filing of this report, as required by Rule 30a-3(b) under the Act and Rules 13a-15(b) or 15d-15(b) under the Securities Exchange Act of 1934. Based on their review, such officers have concluded that the disclosure controls and procedures are effective in ensuring that information required to be disclosed in this report is appropriately recorded, processed, summarized and reported and made known to them by others within the Registrant and by the Registrant’s service providers. |
| (b) | There were no changes in the Registrant’s internal control over financial reporting (as defined in Rule 30a-3(d) under the Act) that occurred during the period covered by this report that have materially affected, or are reasonably likely to materially affect, the Registrant’s internal control over financial reporting. |
Item 17. Disclosure of Securities Lending Activities for Closed-End Management Investment Companies
Not applicable to open-end investment companies.
Item 18. Recovery of Erroneously Awarded Compensation.
(a) Not applicable.
(b) Not applicable.
Item 19. Exhibits.
(2) Any policy required by the listing standards adopted pursuant to Rule 10D-1 under the Exchange Act (17 CFR 240.10D-1) by the registered national securities exchange or registered national securities association upon which the registrant’s securities are listed. Not Applicable.
(3) A separate certification for each principal executive officer and principal financial officer of the registrant as required by Rule 30a-2(a) under the Investment Company Act of 1940 (17 CFR 270.30a-2(a). Filed herewith.
(4) Any written solicitation to purchase securities under Rule 23c-1 under the Act sent or given during the period covered by the report by or on behalf of the registrant to 10 or more persons. Not applicable.
| (5) | Change in the registrant’s independent public accountant. Not applicable. |
SIGNATURES
Pursuant to the requirements of the Securities Exchange Act of 1934 and the Investment Company Act of 1940, the registrant has duly caused this report to be signed on its behalf by the undersigned, thereunto duly authorized.
| | (Registrant) | Manager Directed Portfolios | |
| | By (Signature and Title)* | /s/ Scott M. Ostrowski | |
| | | Scott M. Ostrowski, President/ | |
| | | Principal Executive Officer | |
Pursuant to the requirements of the Securities Exchange Act of 1934 and the Investment Company Act of 1940, this report has been signed below by the following persons on behalf of the registrant and in the capacities and on the dates indicated.
| | By (Signature and Title)* | /s/ Scott M. Ostrowski | |
| | | Scott M. Ostrowski, President/ | |
| | | Principal Executive Officer | |
| | By (Signature and Title)* | /s/ Ryan Frank | |
| | | Ryan Frank, Treasurer/ | |
| | | Principal Financial Officer | |
* Print the name and title of each signing officer under his or her signature.