Use these links to rapidly review the document
TABLE OF CONTENTS
INDEX TO FINANCIAL STATEMENTS
TABLE OF CONTENTS 3
TABLE OF CONTENTS 4
Table of Contents
UNITED STATES
SECURITIES AND EXCHANGE COMMISSION
Washington, D.C. 20549
FORM 20-F
| | |
| (Mark One) | | |
o |
|
REGISTRATION STATEMENT PURSUANT TO SECTION 12(b) OR (g) OF THE SECURITIES EXCHANGE ACT OF 1934 |
OR |
ý |
|
ANNUAL REPORT PURSUANT TO SECTION 13 OR 15(d) OF THE SECURITIES EXCHANGE ACT OF 1934 |
| For the fiscal year ended March 31, 2009 |
OR |
o |
|
TRANSITION REPORT PURSUANT TO SECTION 13 OR 15(d) OF THE SECURITIES ACT OF 1934 |
| For such transition period from to |
OR |
o |
|
SHELL COMPANY REPORT PURSUANT TO SECTION 13 OR 15(d) OF THE SECURITIES EXCHANGE ACT OF 1934 |
| Date of event requiring this shell company report |
| For such transition period from to |
Commission file number:333-137371
Kabel Deutschland GmbH
(Exact name of Co-Registrant as specified in its charter)
Kabel Deutschland Vertrieb und Service GmbH & Co. KG
(Exact name of Co-Registrant as specified in its charter)
Federal Republic of Germany
(Jurisdiction of incorporation or organization)
Betastrasse 6-8
85774 Unterfoehring
Germany
+49-89-960-100
(Address of principal executive offices)
Securities registered or to be registered pursuant to Section 12(b) of the Act:
| | |
| |
|
|---|
| Title of each class | | Name of each exchange on which registered |
| None | | n/a |
Securities registered or to be registered pursuant to Section 12(g) of the Act.
None
(Title of Class)
None
(Title of Class)
Securities for which there is a reporting obligation pursuant to Section 15(d) of the Act:
€250 million 10.750% Senior Notes due 2014
$610 million 10.625% Senior Notes due 2014
(Title of Class)
As of March 31, 2009, the subscribed capital of KDG is held entirely by the sole shareholder Kabel Deutschland Holding GmbH and is represented by three shares in the following amounts:
| | | | |
Shareholders | | €
| |
|---|
Kabel Deutschland Holding GmbH | | | 24,750 | |
Kabel Deutschland Holding GmbH | | | 250 | |
Kabel Deutschland Holding GmbH | | | 1,000,000 | |
| | | | |
| | | 1,025,000 | |
| | | | |
Indicate by check mark if the registrant is a well-known seasoned issuer, as defined in Rule 405 of the Securities Act.
o Yes ý No
If this report is an annual or transition report, indicate by check mark if the registrant is not required to file reports pursuant to Section 13 or 15(d) of the Securities Exchange Act of 1934.
o Yes ý No
Note—Checking the box above will not relieve any registrant required to file reports pursuant to Section 13 or 15(d) of the Securities Exchange Act of 1934 from their obligations under those Sections.
Indicate by check mark whether the registrant (1) has filed all reports required to be filed by Section 13 or 15(d) of the Securities Exchange Act of 1934 during the preceding 12 months (or for such shorter period that the registrant was required to file such reports), and (2) has been subject to such filing requirements for the past 90 days.
ý Yes o No
Indicate by check mark whether the registrant has submitted electronically and posted on its corporate Web site, if any, every Interactive Data File required to be submitted and posted pursuant to Rule 405 of Regulation S-T (§232.405 of this chapter) during the preceding 12 months (or for such shorter period that the registrant was required to submit and post such files).
o Yes o No
Indicate by check mark whether the registrant is a large accelerated filer, an accelerated filer, or a non-accelerated filer. See definition of 'accelerated filer and large accelerated filer' in Rule 12b-2 of the Exchange Act. (Check one)
| | | | |
| Large accelerated filero | | Accelerated filero | | Non-accelerated filerý |
Indicate by check mark which basis of accounting the registrant has used to prepare the financial statements included in this filing:
| | | | |
| U.S.GAAP o | | International Financial Reporting Standards as issued by the International Accounting Standards Board ý | | Other o |
If 'Other' has been checked in response to the previous question, indicate by check mark which financial statement item the registrant has elected to follow.
o Item 17 o Item 18
If this is an annual report, indicate by check mark whether the registrant is a shell company (as defined in Rule 12b-2 of the Exchange Act).
o Yes ý No
(APPLICABLE ONLY TO ISSUERS INVOLVED IN BANKRUPTCY PROCEEDINGS DURING THE PAST FIVE YEARS)
Indicate by check mark whether the registrant has filed all documents and reports required to be filed by Sections 12, 13 or 15(d) of the Securities Exchange Act of 1934 subsequent to the distribution of securities under a plan confirmed by a court.
o Yes o No
Table of Contents
TABLE OF CONTENTS
Table of Contents
PART I
ITEM 1. IDENTITY OF DIRECTORS, SENIOR MANAGEMENT AND ADVISERS
Not applicable.
ITEM 2. OFFER STATISTICS AND EXPECTED TIMETABLE
Not applicable.
ITEM 3. KEY INFORMATION
A. Selected Financial Data
In this annual report on Form 20-F, 'Issuer', 'Registrant', 'we', 'us', 'our', 'Company', 'KDG' and other similar terms refer to Kabel Deutschland GmbH and its consolidated subsidiaries, except where the context otherwise requires.
The selected consolidated statements of operations and cash flow data set forth below for the fiscal years ended March 31, 2005, 2006, 2007, 2008 and 2009 and the selected consolidated balance sheet data set forth below as of March 31, 2005, 2006, 2007, 2008 and 2009, in each case, for KDG have been derived from KDG's consolidated financial statements. KDG's consolidated financial statements for fiscal years ended March 31, 2007, 2008 and 2009 are included in ITEM 17 Financial Statements of this annual report.
The selected consolidated data presented below should be read in conjunction with our consolidated financial statements included in ITEM 17 Financial Statements of this annual report.
1
Table of Contents
Consolidated Statement of Operations
| | | | | | | | | | | | | | | | | |
| | Fiscal Year Ended March 31, | |
|---|
| | 2009 | | 2008 | | 2007(1) | | 2006(1) | | 2005(1) | |
|---|
| |
| |
| |
| | (as adjusted)
| | (as adjusted)
| |
|---|
| | (€ millions, except percentages)
| |
|---|
| | Cable Access Revenue | | | 911.2 | | | 867.1 | | | 845.6 | | | 839.3 | | | 850.1 | |
| | TV/Radio Revenue | | | 192.3 | | | 179.8 | | | 163.0 | | | 137.8 | | | 126.4 | |
| | Internet & Phone Revenue | | | 231.9 | | | 121.4 | | | 56.5 | | | 9.8 | | | 2.8 | |
| | TKS Revenue | | | 34.9 | | | 28.6 | | | 28.1 | | | 25.2 | | | 23.9 | |
| | | | | | | | | | | | |
Revenues | | | 1,370.3 | | | 1,196.9 | | | 1,093.2 | | | 1,012.1 | | | 1,003.2 | |
| | Cost of Services Rendered(2) | | | (696.6 | ) | | (588.5 | ) | | (567.1 | ) | | (490.1 | ) | | (573.4 | ) |
| | Other Operating Income | | | 18.1 | | | 12.6 | | | 13.2 | | | 12.5 | | | 17.9 | |
| | Selling Expenses(3) | | | (425.6 | ) | | (352.8 | ) | | (318.7 | ) | | (277.0 | ) | | (262.5 | ) |
| | General and Administrative Expenses(4) | | | (129.4 | ) | | (128.7 | ) | | (140.9 | ) | | (102.4 | ) | | (110.3 | ) |
| | | | | | | | | | | | |
Profit from Ordinary Acivities | | | 136.8 | | | 139.5 | | | 79.7 | | | 155.1 | | | 74.9 | |
| | Interest Income | | | 3.5 | | | 2.1 | | | 3.6 | | | 2.8 | | | 11.4 | |
| | Interest Expense | | | (232.5 | ) | | (171.8 | ) | | (155.7 | ) | | (215.1 | ) | | (186.3 | ) |
| | Accretion/Depreciation on Investments and Other Securities | | | 0.1 | | | (3.8 | ) | | 0.3 | | | (0.1 | ) | | (0.3 | ) |
| | Income from Associates | | | 14.0 | | | 0.9 | | | 0.4 | | | 0.5 | | | 0.7 | |
| | | | | | | | | | | | |
Loss Before Taxes | | | (78.1 | ) | | (33.1 | ) | | (71.7 | ) | | (56.8 | ) | | (99.6 | ) |
Taxes on Income | | | 6.2 | | | (0.7 | ) | | (27.5 | ) | | (11.7 | ) | | (6.9 | ) |
| | | | | | | | | | | | |
Net Loss | | | (72.0 | ) | | (33.8 | ) | | (99.2 | ) | | (68.5 | ) | | (106.5 | ) |
| | | | | | | | | | | | |
Other Financial Data | | | | | | | | | | | | | | | | |
| | Adjusted EBITDA(5) | | | 570.7 | | | 457.8 | | | 382.5 | | | 401.3 | | | 408.0 | |
| | Adjusted EBITDA margin(6) | | | 41.6 | % | | 38.2 | % | | 35.0 | % | | 39.7 | % | | 40.7 | % |
- (1)
- Prior to March 31, 2007 the Company assessed hedge effectiveness of an interest rate swap in a cash flow hedge by applying the "change in variable cash flow method". Following the publication in the March 2007 IFRIC update of the IFRIC Agenda decision on "IAS 39 Financial Instruments: Recognition and Measurement—Assessing hedge effectiveness of an interest rate swap in a cash flow hedge" the Company has reconsidered its accounting treatment applied to those transactions and decided to adopt the treatment set out in the IFRIC agenda decision. Accordingly, the Company had adjusted its financial statements as of March 31, 2007 and comparative periods to reflect the fact that hedge accounting has no longer been historically applied and has, therefore, recorded all changes in fair value of the interest rate swap through profit and loss. This change in accounting treatment has been accounted for retroactively. This adjustment resulted in a decrease in other comprehensive income of €8.3 million, a decrease in interest expense of €13.7 million and an increase in deferred tax expense of €5.4 million for the fiscal year ended March 31, 2006.
- (2)
- Includes €205.5 million of depreciation and amortization in FY 2009; €154.7 million in FY 2008; €133.1 million in FY 2007; €117.4 million in FY 2006; €206.7 million in FY 2005.
- (3)
- Includes €169.3 million of depreciation and amortization in FY 2009; €115.5 million in FY 2008; €96 million in FY 2007; €88.2 million in FY 2006; €81.2 million in FY 2005.
- (4)
- Includes €27.8 million of depreciation and amortization in FY 2009; €23.8 in FY 2008; €17.5 million in FY 2007; €15.2 million in FY 2006; €9.8 million in FY 2005.
- (5)
- Profit from ordinary activities before depreciation, amortization, non-cash compensation, which consists primarily of expenses related to our Management Equity Participation programs and non-cash restructuring expenses ("Adjusted EBITDA"), is a measure used by management to measure our operating performance. Adjusted EBITDA is not a recognized accounting term, does not purport to be an alternative to profit from ordinary activities or cash flow from operating activities and should not be used as a measure of liquidity. We believe Adjusted EBITDA facilitates operating performance comparisons from period to period and company to company by eliminating potential differences caused by variations in tax positions (such as the impact on periods or companies of changes in effective tax rates or net operating losses) and the age and book depreciation of tangible assets (affecting relative depreciation expense). Because other companies may not calculate Adjusted EBITDA identically to us, our presentation of Adjusted EBITDA may not be comparable to similarly titled measures of other companies. In addition, Adjusted EBITDA is not calculated in the same way that 'Consolidated EBITDA' is calculated under the indenture governing the Notes or under the terms of our Senior Credit Facilities. However, Adjusted EBITDA is a commonly used term to compare the operating activities of cable companies.
- (6)
- Adjusted EBITDA margin is a calculation of Adjusted EBITDA as a percentage of total revenues.
2
Table of Contents
Reconciliation of non-GAAP measure Adjusted EBITDA to Profit from Ordinary Activities
| | | | | | | | | | | | | | | | |
| | Fiscal Year Ended March 31, | |
|---|
| | 2009 | | 2008 | | 2007 | | 2006 | | 2005 | |
|---|
| | (€ millions)
| |
|---|
Adjusted EBITDA | | | 570.7 | | | 457.8 | | | 382.5 | | | 401.3 | | | 408.0 | |
Depreciation and Amortization | | | (402.6 | ) | | (294.0 | ) | | (246.6 | ) | | (220.8 | ) | | (297.7 | ) |
MEP related non-cash Expenses | | | (2.1 | ) | | (23.0 | ) | | (41.8 | ) | | (19.2 | ) | | (35.4 | ) |
Restructuring Expenses | | | (29.2 | ) | | (1.3 | ) | | (14.4 | ) | | (6.2 | ) | | 0.0 | |
| | | | | | | | | | | | |
Profit from Ordinary Activities | | | 136.8 | | | 139.5 | | | 79.7 | | | 155.1 | | | 74.9 | |
| | | | | | | | | | | | |
Consolidated Balance Sheet Data
| | | | | | | | | | | | | | | | | |
| | As of March 31, | |
|---|
| | 2009 | | 2008 | | 2007 | | 2006 | | 2005 | |
|---|
| |
| |
| |
| | (as adjusted)
| | (as adjusted)
| |
|---|
| | (€ millions)
| |
|---|
| | Cash & Cash Equivalents | | | 51.9 | | | 15.5 | | | 54.1 | | | 225.1 | | | 132.8 | |
| | Other Current Assets | | | 178.1 | | | 192.1 | | | 162.5 | | | 171.4 | | | 128.0 | |
| | Intangible Assets | | | 904.0 | | | 431.9 | | | 477.3 | | | 519.7 | | | 582.4 | |
| | Tangible Assets | | | 1,214.1 | | | 1,086.0 | | | 986.6 | | | 902.7 | | | 900.5 | |
| | Other Non-current Assets | | | 23.0 | | | 26.8 | | | 25.0 | | | 7.0 | | | 14.5 | |
| | | | | | | | | | | | |
Total Assets | | | 2,371.1 | | | 1,752.3 | | | 1,705.5 | | | 1,825.9 | | | 1,758.2 | |
| | | | | | | | | | | | |
| | Liabilities to Banks/Bondholders | | | 2,436.7 | | | 1,941.5 | | | 1,895.8 | | | 1,988.1 | | | 1,952.2 | |
| | Other Liabilities | | | 939.0 | | | 743.4 | | | 706.0 | | | 647.2 | | | 560.8 | |
| | | | | | | | | | | | |
Total Liabilities | | | 3,375.7 | | | 2,684.9 | | | 2,601.8 | | | 2,635.3 | | | 2,513.0 | |
| | | | | | | | | | | | |
| | Subscribed Capital | | | 1.0 | | | 1.0 | | | 1.0 | | | 1.0 | | | 1.0 | |
Equity(7) | | | (1,004.6 | ) | | (932.6 | ) | | (896.3 | ) | | (809.4 | ) | | (754.8 | ) |
| | | | | | | | | | | | |
Cash Flow Statement Data | | | | | | | | | | | | | | | | |
| | Cash Flow from Operating Activities | | | 668.7 | | | 444.7 | | | 360.0 | | | 399.3 | | | 368.6 | |
| | Cash Flow Used in Investing Activities | | | (884.2 | ) | | (345.5 | ) | | (276.4 | ) | | (148.1 | ) | | (124.7 | ) |
| | Cash Flow Used in Financing Activities | | | 251.9 | | | (137.9 | ) | | (254.9 | ) | | (158.8 | ) | | (295.6 | ) |
- (7)
- Prior to March 31, 2007 the Company assessed hedge effectiveness of an interest rate swap in a cash flow hedge by applying the "change in variable cash flow method". Following the publication in the March 2007 IFRIC update of the IFRIC Agenda decision on "IAS 39 Financial Instruments: Recognition and Measurement—Assessing hedge effectiveness of an interest rate swap in a cash flow hedge" the Company has reconsidered its accounting treatment applied to those transactions and decided to adopt the treatment set out in the IFRIC agenda decision. Accordingly, the Company has adjusted its financial statements as of March 31, 2007 and comparative periods to reflect the fact that hedge accounting has no longer been historically applied and has, therefore, recorded all changes in fair value of the interest rate swap through profit and loss. This change in accounting treatment has been accounted for retroactively. This adjustment resulted in a decrease in other comprehensive income of €8.3 million, a decrease in interest expense of €13.7 million and an increase in deferred tax expense of €5.4 million for the fiscal year ended March 31, 2006.
3
Table of Contents
Network Data, Subscribers and Revenue Generating Units
| | | | | | | | | | | | | | | | |
| | As of March 31, | |
|---|
| | 2009 | | 2008 | | 2007 | | 2006 | | 2005 | |
|---|
| | (thousands, except percentages)
| |
|---|
Homes Passed | | | 15,293 | | | 15,257 | | | 15,333 | | | 15,462 | | | 15,600 | |
% penetration(8) | | | 60 | % | | 58 | % | | 60 | % | | 62 | % | | 62 | % |
Total Subscribers (Homes Connected) | | | 9,123 | | | 8,884 | | | 9,241 | | | 9,581 | | | 9,640 | |
—thereof Cable Access Subscribers (incl. TKS) | | | 9,013 | | | 8,845 | | | 9,241 | | | 9,581 | | | 9,640 | |
—thereof Kabel Internet und Phone Subscribers 'Solo'(9) | | | 110 | | | 39 | | | n/a | | | n/a | | | n/a | |
Cable Access RGUs (incl. TKS)(10) | | | 9,247 | | | 8,980 | | | 9,320 | | | 9,597 | | | 9,640 | |
Digital Video Recorder RGUs (Kabel Digital+) | | | 114 | | | 35 | | | 2 | | | n/a | | | n/a | |
Kabel Digital (pay-TV) RGUs | | | 849 | | | 779 | | | 690 | | | 479 | | | 224 | |
Kabel Internet RGUs | | | 707 | | | 393 | | | 179 | | | 61 | | | 12 | |
Kabel Phone RGUs | | | 710 | | | 361 | | | 152 | | | 40 | | | 0 | |
| | | | | | | | | | | | |
Total RGUs(11) | | | 11,627 | | | 10,548 | | | 10,343 | | | 10,177 | | | 9,876 | |
| | | | | | | | | | | | |
Upgrade | | | | | | | | | | | | | | | | |
Homes Upgraded for 2-way-communication | | | 12,008 | | | 10,901 | | | 8,634 | | | 5,786 | | | n/a | |
Homes Passed Upgraded Marketable for 2-way-communication | | | 8,580 | | | 6,685 | | | 4,025 | | | 1,379 | | | n/a | |
ARPUs(12)
| | | | | | | | | | | | | | | | |
| | Fiscal Year Ended March 31, | |
|---|
| | 2009 | | 2008 | | 2007 | | 2006 | | 2005 | |
|---|
| | (€)
| |
|---|
Cable Access(13) | | | 8.14 | | | 7.79 | | | 7.31 | | | 7.26 | | | 7.19 | |
Kabel Digital+ | | | 7.90 | | | 8.23 | | | n/a | | | n/a | | | n/a | |
Kabel Digital (pay-TV) | | | 7.95 | | | 7.73 | | | 7.71 | | | 6.97 | | | 6.38 | |
Kabel Internet | | | 13.25 | | | 14.12 | | | 16.30 | | | 21.08 | | | 26.40 | |
Kabel Phone | | | 20.95 | | | 24.79 | | | 28.02 | | | 27.40 | | | n/a | |
| | | | | | | | | | | | |
Total Blended ARPU(14) | | | 8.99 | | | 8.33 | | | 7.64 | | | 7.30 | | | 7.19 | |
| | | | | | | | | | | | |
- (8)
- Internet & Phone 'Solo' subscriber: Non-cable television access customers subscribing to Internet & Phone services only.
- (9)
- Includes Cable Access TV ('CATV') subscribers plus direct digital cable access customers within our B2B subscriber base.
- (10)
- Revenue generating units (RGU) relate to sources of revenue, which may not always be the same as subscriber numbers. For example, one person may subscribe to two different services, thereby accounting for only one subscriber, but two RGUs.
- (11)
- Average revenue per unit (ARPU) is calculated by dividing the subscription revenue (excluding installation fees) for a period by the average number of RGUs for that period and the number of months in that period.
- (12)
- Does not include Telepost Kabel-Service Kaiserslautern GmbH & Co. KG ('TKS').
- (13)
- Total blended ARPU is calculated by dividing Cable Access, Pay-TV, Kabel Digital+, Kabel Internet , Kabel Phone and TKS (cable television) subscription revenues (excluding installation fees) for the relevant period by the average number of RGUs for that period and the number of months in the period.
- (14)
- Total blended ARPU is calculated by dividing Cable Access, Pay-TV, Kabel Digital+, Kabel Internet , Kabel Phone and TKS (cable television) subscription revenues (excluding installation fees) for the relevant period by the average number of RGUs for that period and the number of months in the period.
4
Table of Contents
Operational Data
| | | | | | | | | | | | | | | | | |
| | Fiscal Year Ended March 31, | |
|---|
| | 2009 | | 2008 | | 2007 | | 2006 | | 2005 | |
|---|
| | (€ millions, except percentages)
| |
|---|
Cable Access Revenue | | | | | | | | | | | | | | | | |
| | Subscription Fees | | | 898.9 | | | 854.1 | | | 833.8 | | | 829.1 | | | 836.8 | |
| | % of Total Revenues | | | 65.6 | % | | 71.4 | % | | 76.3 | % | | 81.9 | % | | 83.4 | % |
| | Installation Fees | | | 7.9 | | | 7.6 | | | 7.0 | | | 5.7 | | | 8.3 | |
| | % of Total Revenues | | | 0.6 | % | | 0.6 | % | | 0.6 | % | | 0.6 | % | | 0.8 | % |
| | Other Revenue | | | 4.4 | | | 5.4 | | | 4.8 | | | 4.5 | | | 5.0 | |
| | % of total revenues | | | 0.3 | % | | 0.5 | % | | 0.4 | % | | 0.4 | % | | 0.5 | % |
| | | | | | | | | | | | |
TV/Radio Revenue | | | | | | | | | | | | | | | | |
| | Analog/Digital Carriage Fees | | | 97.2 | | | 100.0 | | | 99.6 | | | 99.0 | | | 97.7 | |
| | % of Total Revenues | | | 7.1 | % | | 8.4 | % | | 9.1 | % | | 9.8 | % | | 9.7 | % |
| | Pay-TV subscription fees | | | 87.4 | | | 71.3 | (15) | | 55.6 | | | 27.7 | | | 9.7 | |
| | % of Total Revenues | | | 6.4 | % | | 5.9 | % | | 5.1 | % | | 2.7 | % | | 1.0 | % |
| | Other Digital revenues | | | 7.7 | | | 8.5 | | | 7.8 | | | 11.1 | | | 19.0 | |
| | % of Total Revenues | | | 0.6 | % | | 0.7 | % | | 0.7 | % | | 1.1 | % | | 1.9 | % |
| | | | | | | | | | | | |
Internet & Phone Revenue(16) | | | 231.9 | | | 121.4 | | | 56.5 | | | 9.8 | | | 2.8 | |
| | % of Total Revenues | | | 16.9 | % | | 10.1 | % | | 5.2 | % | | 1.0 | % | | 0.3 | % |
| | | | | | | | | | | | |
TKS Revenue | | | 34.9 | | | 28.6 | | | 28.1 | | | 25.2 | | | 23.9 | |
| | % of Total Revenues | | | 2.5 | % | | 2.4 | % | | 2.6 | % | | 2.6 | % | | 2.4 | % |
| | | | | | | | | | | | |
Total Revenues | | | 1,370.3 | | | 1,196.9 | | | 1,093.2 | | | 1,012.1 | | | 1,003.2 | |
| | | | | | | | | | | | |
- (15)
- In the fiscal year ended March 31, 2009, €1.4 million have been reclassified from other digital revenues to pay TV subscription fees. Therefore the figures for 2008 differ from the published figures for the fiscal year ended March 31, 2008.
- (16)
- Fiscal year ended March 31, 2006 was the first year to include revenues from Phone activities.
Exchange Rate Information
The functional and reporting currency of KDG is the Euro.
Foreign currency transactions were converted to Euros at the exchange rate applicable on the date of the transaction. Monetary assets and liabilities denominated in foreign currencies existing as of the balance sheet date are converted to Euros at the exchange rate of the European Central Bank on the balance sheet date. Currency differences resulting from these adjustments are recognized in the consolidated statement of operations.
5
Table of Contents
Non-monetary assets and liabilities denominated in foreign currencies existing as of the balance sheet date, were converted to Euros at the rate as of the balance sheet date. The Company used the following exchange rates (spot rates):
USD Exchange Rates (in USD per EUR)
| | | | | | | | | | | | | | | |
| | Average | | High | | Low | | Period-End | |
|---|
Fiscal Year Ended March 31, | | | | | | | | | | | | | |
| | 2005 | | | 1.2587 | | | 1.3633 | | | 1.1802 | | | 1.2964 | |
| | 2006 | | | 1.2176 | | | 1.3077 | | | 1.1667 | | | 1.2104 | |
| | 2007 | | | 1.2831 | | | 1.3352 | | | 1.2063 | | | 1.3318 | |
| | 2008 | | | 1.4168 | | | 1.5812 | | | 1.3287 | | | 1.5812 | |
| | | October | | | 1.3322 | | | 1.4081 | | | 1.2460 | | | 1.2757 | |
| | | November | | | 1.2732 | | | 1.2935 | | | 1.2525 | | | 1.2727 | |
| | | December | | | 1.3449 | | | 1.4616 | | | 1.2608 | | | 1.3917 | |
| | 2009 | | | 1.4231 | | | 1.5990 | | | 1.2460 | | | 1.3308 | |
| | | January | | | 1.3239 | | | 1.3866 | | | 1.2795 | | | 1.2816 | |
| | | February | | | 1.2785 | | | 1.3008 | | | 1.2591 | | | 1.2644 | |
| | | March | | | 1.3050 | | | 1.3671 | | | 1.2555 | | | 1.3308 | |
| | | July 24, 2009 | | | | | | | | | | | | 1.4227 | |
GBP Exchange Rates (in GBP per EUR)
| | | | | | | | | | | | | | | |
| | Average | | High | | Low | | Period-End | |
|---|
Fiscal Year Ended March 31, | | | | | | | | | | | | | |
| | 2005 | | | 0.6820 | | | 0.7088 | | | 0.6556 | | | 0.6885 | |
| | 2006 | | | 0.6821 | | | 0.6964 | | | 0.6624 | | | 0.6964 | |
| | 2007 | | | 0.6778 | | | 0.7006 | | | 0.6549 | | | 0.6798 | |
| | 2008 | | | 0.7009 | | | 0.7958 | | | 0.6691 | | | 0.7958 | |
| | | October | | | 0.7864 | | | 0.8063 | | | 0.7717 | | | 0.7869 | |
| | | November | | | 0.8340 | | | 0.8598 | | | 0.7969 | | | 0.8299 | |
| | | December | | | 0.9040 | | | 0.9786 | | | 0.8416 | | | 0.9525 | |
| | 2009 | | | 0.8333 | | | 0.9786 | | | 0.7717 | | | 0.9308 | |
| | | January | | | 0.9171 | | | 0.9610 | | | 0.8893 | | | 0.8979 | |
| | | February | | | 0.8876 | | | 0.9034 | | | 0.8706 | | | 0.8931 | |
| | | March | | | 0.9197 | | | 0.9405 | | | 0.8900 | | | 0.9308 | |
| | | July 24, 2009 | | | | | | | | | | | | 0.8670 | |
B. Capitalization and Indebtedness
Not applicable.
C. Reasons for the Offer and Use of Proceeds
Not applicable.
D. Risk Factors
The risks described below are not the only risks we face. Additional risks and uncertainties not currently known to us or that we currently deem to be immaterial may also materially adversely affect our business, financial situation or results of operations. See also ITEM 4B-Our Business.
6
Table of Contents
Risks Relating to Our Business
We operate in highly competitive industries, and competitive pressures could have a material adverse effect on our business.
We face significant competition from established and new competitors. In some instances, we compete against companies subject to less regulation and with better access to financing, more comprehensive product offerings, greater personnel resources, greater brand name recognition and experience or longer-established relationships with regulatory authorities and customers.
Cable Television. We may not be able to successfully compete in the cable television market. This market may also be adversely affected by competition from other means of transmission and entertainment mediums. The market is becoming increasingly competitive, especially as new technologies emerge as viable alternatives.
- •
- Satellite. In particular, we face competition from satellite distribution of free-to-air television program streams, which has been gaining market share over recent years. Although data is limited, one satellite competitor source has published data indicating that the market share of satellite distribution increased from 36.6% to 44.1% between the end of 2003 and 2008 while the market share of cable television decreased from 56.5% to 51.3% (Source: AGF/GfK, 2009). In the same period, the number of our basic television access subscribers has declined.
Satellite has a number of competitive advantages over cable: among other things, it has a wider reach, especially in rural areas, and does not charge on-going subscription fees. Although cable television currently benefits from German zoning laws that restrict the installation of satellite dishes in certain areas, and housing association contracts with residents of multi-unit dwellings that frequently prohibit tenants from attaching satellite dishes to their apartments if cable is installed, these zoning laws may be changed in the future. As a result, this might ultimately further intensify competition with satellite providers. The acceptance of satellite dishes and technology to housing associations may also increase in the future.
The largest pay-TV operator in Germany, Sky Deutschland AG, which was known as Premiere until July 2009 ('Sky Deutschland') is currently promoting satellite services. Sky Deutschland promotes a pay-TV package to satellite customers, which is more attractive than the corresponding cable package. This may also result in a decrease of cable-TV's market share and therefore may have an adverse effect on our business.
- •
- Other delivery and entertainment systems. Our market share may also be adversely affected by terrestrial transmission of digital television ('DTT'), other means of TV signal delivery and emerging technologies (e.g. TV distribution via internet ('IPTV') and mobile TV). We expect DTT to be a meaningful competitor to cable and satellite. So far, market share of DTT does not exceed 5%, with a 4.6% share at the end of 2008 (Source: AGF/GfK 2009). Improvements are also being made to alternative means of transmission, such as the provision of video signals by providers of digital subscriber line ('DSL') broadband services. The leading provider of these IPTV and video-on-demand services in Germany is Deutsche Telekom AG ('DTAG'), which offers these services under the brand 'T-HOME Entertain' and has increased marketing efforts. They have reported 600,000 IPTV subscribers by March 31, 2009 (Source: DTAG Presentation Preliminary Results Q1/09).
Furthermore, DTAG has built a 'very high bit rate digital subscriber line' ('VDSL') network in 50 cities in Germany. With this premium VDSL/ADSL2+ (Asymmetric Digital Subscriber Line 2+: extends the capability of basic ADSL by doubling the number of downstream bits: In Germany upload 10Mbit/s and download speed up to 50Mbit/s) product offering DTAG reaches approximately 20.0 million homes according to DTAG's 'Investor Day Presentation 2008'. DTAG claims that the VDSL network delivers speeds of up to 50Mbit/s. In addition, other
7
Table of Contents
telecommunications network providers, which are regionally focused, also offer IPTV and video-on-demand services, in particular fiber, in selected cities. Furthermore, there are political considerations to free up frequencies currently devoted to terrestrial broadcasting for mobile, stationary and/or wireless technologies in order to close existing gaps in broadband availability in Germany mostly in rural areas and to foster competition (the so calledDigitale Dividende or 'digital dividend'). Although these services are not yet comparable with the quality, breadth and user convenience of our service, they could develop into a major competitive force in the market for television distribution. Our services also compete to varying degrees with other entertainment media, including home entertainment systems and cinema. The full extent to which these media and alternative technologies will compete effectively with our cable television system may not be visible for several years.
- •
- Level 4 network operators. We also compete with alternative providers of television and radio signals over cable networks, especially so called Level 4 network operators. As we continue to increase our number of direct customers, particularly within housing associations, we are in direct competition with the Level 4 network operators, who for historical reasons are often the traditional providers of services to such customers and have existing contractual relationships with them. Level 4 network operators typically enter into contracts with housing associations with an average term of ten to fifteen years, which limits our opportunities to win housing associations as new customers and may hinder our efforts to market our services effectively to their tenants. Level 4 network operators and housing associations also seek opportunities to build their own Level 3 networks where economically viable hereby disconnecting from our network. Competition from Level 4 network operators could increase in the future as the industry undergoes ownership changes and potentially consolidates. Moreover city carriers are entering the market for TV signal delivery while operating their own fiber based networks. We expect infrastructure competition form city carriers to increase over the coming years.
Pay-TV product operator. As we seek further subscribers to our pay-TV products, we may effectively be competing with the largest German pay-TV operator Sky Deutschland, that currently utilizes our network to reach its own subscribers. As a consequence, this pay-TV operator may decide to use increasingly alternative distribution platforms in the future, such as satellite, adversely affecting our ability to generate digital carriage fees, which we currently derive from distributing its signal over our network.
Moreover, Sky Deutschland is currently promoting satellite services. The company promotes a pay-TV package to satellite customers, which offers more channels than the corresponding cable package. This may result in a decrease of cable's market share and therefore may have an adverse effect on our business. Sky Deutschland has recently introduced a buy-through-model whereby a customer must subscribe to a basic tier before subscribing to its premium program packages. Their basic tier has a very similar channel line up to our primarily pay-TV product 'Kabel Digital Home'.
Internet services. The internet services business in Germany is highly competitive. We compete with companies that provide low-speed and low priced narrowband internet access services over traditional fixed telephone lines as well as broadband internet access distributed mostly over DSL. The major DSL service provider in Germany is DTAG, the dominant and incumbent fixed-line telephony provider in Germany. Major other competitors in the broadband market are resellers of DTAG's services and alternative network operators that rent the 'last mile' from DTAG (unbundled local loop). Increasingly, we see these alternative operators merging with and emerging from mobile operators such as Vodafone D2 GmbH ('Vodafone') or Telefonica O2 Germany GmbH & Co. oHG ('O2'). Competition also derives from city carriers who are deploying own fiber based networks. We also compete with service providers that use other alternative technologies for internet access, such as two-way satellite systems, power line connections and various wireless access, including: wireless local area networks ('WLAN') or wireless fidelity ('WiFi') access, Universal Mobile Telecommunication
8
Table of Contents
Services ('UMTS'), General Packet Radio Services ('GPRS'), an enlargement of global system for mobile communications ('GSM') coverage areas, and point-to-multipoint wireless access. We expect additional access technologies to be launched in the future that will further increase competition.
Residential telephony market. The market for residential telephony is highly competitive. The fixed-line telephony market is increasingly under pressure from resellers, alternative carriers, declining mobile phone charges and alternative access technologies like Voice over Internet Protocol ('VoIP') and internet telephony offered via DSL or other broadband connections. The German market for residential telephony services is relatively price sensitive and already on a low price level compared to international standards. We expect increasing competition, including price competition, from traditional and non-traditional telephony and mobile phone providers in the future. Most alternative carriers rely on regulated wholesale services from DTAG for their own telephony services. These wholesale services are currently subject to price regulation which commercially limits the ability of alternative carriers to lower prices on retail telephony markets. We cannot assure that these price regulations or other market regulations will remain in effect.
Mobile services. The mobile services business in Germany is highly competitive. The four mobile network operators in Germany are DTAG, Vodafone, E-Plus, subsidiary of Koninklijke KPN N.V. ('KPN'), and O2. Over recent years the mobile operators utilized their network by allowing mobile service providers or mobile virtual network operators ('MVNO') to sell their own branded mobile products. The wide acceptance of mobile services by Germans has been driving SIM-card (Subscriber Identity Module) penetration to approximately 130% (Source: O2-reports & O2-market Intelligence). To increase market share, not only have the incumbents introduced low cost products and pre-paid offerings, but also discounter and large retailers entered the market in cooperation with incumbents. The German market for mobile services is still growing slightly, but at the expense of lower price levels. We expect increasing competition, including price erosion, from new companies entering the market. There are different standards available in Germany: global system for mobile communications (GSM) and Universal Mobile Telecommunication Services ('UMTS'). To accelerate existing networks different methods can be applied: GPRS (General Packet Radio Service)/EDGE (Enhanced Data Rates for GSM Evolution), as well as UMTS/HSDPA (High Speed Downlink Packet Access) (also called 3G+) and HSUPA (High Speed Uplink Packet Access). We expect additional companies entering access technologies to be launched in the future that will further increase competition.
Failure to control customer churn may adversely affect our business.
Customer churn refers to those customers who stop subscribing to our services. Churn arises mainly as a result of relocation or death of subscribers, non-payment, price increases and competition. In addition, our customer churn rate may also increase as a result of competition from new technology access platforms or if we are unable to provide satisfactory service to our customers. Any increase in customer churn may lead to both reduced revenues from direct-subscribers, housing associations and Level 4 network operators and reduced revenues from broadcasters whose carriage fees are related to the number of subscribers we reach with our network.
We may not be able to renew our existing contracts with Level 4 network operators and housing associations upon their expiration on commercially attractive terms, if at all, or attract new subscribers by entering into new contracts with Level 4 network operators and housing associations.
The successful implementation of our business strategy depends, in part, upon how successful we are in renewing our existing agreements with Level 4 network operators and housing associations on favorable terms or in attracting Level 4 network operators and housing associations to enter into new contracts. A number of our largest contracts with Level 4 network operators are framework contracts and are due to expire between 2009 and 2012.
9
Table of Contents
Under those framework contracts, the terms and conditions of the signal delivery are set out. These terms and conditions in most cases do not include an obligation of the Level 4 operator to purchase our signal for a certain number of households. In such cases, the Level 4 operator can choose to disconnect from our signal and obtain their signal from alternative sources, such as a satellite provider, even before the end of the contract term.
Given that some of these Level 4 network operators are also our competitors in certain markets, we may experience continued disconnections from this customer group.
In addition, since 2007, we have been subject to the so called Market 18 regulation (as defined below). This regulation currently limits our pricing flexibility, which may have a negative impact on the extension of existing contracts or new contracts with Level 4 network operators and housing associations.
When existing contracts expire, Level 4 network operators and housing associations may attempt to negotiate discounts. Level 4 network operators and housing associations may also choose to completely disconnect from our network and obtain their signal from alternative sources, such as a satellite provider. Some Level 4 network operators and housing associations have chosen these alternatives in the past.
Our inability to renew our existing Level 4 and housing association contracts or enter into new contracts on commercially favorable terms, if at all, could lead to reduced sales and lower margins and could have a material adverse effect on our business, financial condition and results of operations.
Level 4 network operators and large housing associations may seek to reduce their signal delivery costs through clustering, which could adversely affect our profitability.
Our subscription fees are based on our published rate card, according to which the standard rates are linked to the number of subscribers per connection point. Our fee schedule provides for higher discounts depending on the number of subscribers aggregated behind one connection point. In addition, Level 4 network operators and large housing associations with large subscriber clusters may have a better bargaining position, allowing them to negotiate for discounts on our published rate card or establish their own head-end and disconnect from our network entirely.
If we fail to introduce and establish new or enhanced products and services successfully, our revenues and margins could be lower than expected.
Part of our business strategy is based on the expansion of the products and services we offer, including:
- •
- enhanced digital cable television services, including pay-TV channels, pay-per-view and personal video recorder services;
- •
- internet services;
- •
- phone services;
- •
- mobile internet services;
- •
- mobile phone services; and
- •
- other bundled offers consisting of TV, internet, phone and mobile services.
Digital cable television. KDG has secured and aims to secure TV distribution rights including certain rights for its pay-TV offering on a non-exclusive basis. We may not always be able to acquire the targeted rights or acquire them at economically attractive prices in the future. This might have a detrimental effect on our ability to gain and retain pay-TV as well as basic cable subscribers.
10
Table of Contents
Internet & Phone. Internet and phone markets are very competitive and any of the new or enhanced products or services we introduce or have introduced may fail to achieve market acceptance or new or enhanced products or services introduced by our competitors may be more appealing to customers. As a consequence, for example, if our new internet offering is not successful, our basic cable subscribers may decide to discontinue using our services altogether and choose other TV distribution platforms. This effect could be exacerbated by the fact that customer churn rates are generally higher for internet and phone services than for cable television services.
In addition, our 'Internet & Phone' products and services may not be able to recover the investments, such as the costs of network upgrades and marketing expenses, made to launch new products and services. Moreover, these new products and services may result in a decline of ARPU related to those products and services, due to promotional offers that generate less revenue and result in lower margins, and Adjusted EBITDA, due to the costs of implementation, distribution and technology enhancement of such products. Internet and phone over broadband cable are relatively new products that might present unknown technological challenges both to our own systems and resources and to those of our suppliers. In connection with the rollout of Internet & Phone, we rely on third parties to upgrade the hardware of the end customers and to connect our telephony customers to the German telephony networks. Demand for new products and services might exceed the capacities of these third parties creating a backlog of new customers to be connected and increased lead times which could in turn result in increased customer churn. Further, there can be no assurance that these third parties will meet our expectations with respect to quality and lead times.
Mobile internet and mobile phone. We introduced mobile offerings 'Mobile Phone' and 'Mobile Internet' in May 2009 for existing 'Internet & Phone' customers to complement our existing 'Internet & Phone' products. The mobile markets are very competitive and any of the new or enhanced products or services we introduce or have introduced may fail to achieve market acceptance or new or enhanced products or services introduced by our competitors may be more appealing to customers. As a consequence, for example, if our new mobile offering is not successful, our Internet & Phone subscribers may decide to discontinue using our services altogether and choose other providers. This effect could be exacerbated by the fact that customer churn rates are generally higher for mobile services than for cable television services.
Moreover, our mobile products and services may not generate profits for the time being and we may not be able to recover the investments, such as marketing expenses, made to launch new products and services. These new products and services may generate low margins and low Adjusted EBITDA, due to the costs of marketing such products. 'Mobile Internet' and 'Mobile Phone' for a cable operator are new products that might present unknown technological challenges both to our own systems and resources and to those of our cooperation partner. In connection with the rollout of mobile services we rely on O2 to provide SIM cards and to activate customers. Demand for new products and services might exceed the capacities of our cooperation partner creating a backlog of new customers to be connected and increased lead times, which could in turn result in increased customer churn. Further, there can be no assurance that O2 will meet our expectations with respect to quality and lead times.
Our move towards pay television services may erode our ability to generate revenue from carriage fees, as our pay television contracts would typically require us to pay for programs which we then resell to subscribers rather than having content providers pay us for transmission to the broadcaster's subscribers. If we fail to generate greater profits from our pay television subscription revenues than we would have achieved through providing carriage services to other operators, then our results of operations and financial condition, including our liquidity, will be adversely affected.
A number of contracts for access to pay-TV programs require us to pay prices for programs based on a guaranteed minimum number of subscribers, notwithstanding a lower number of actual
11
Table of Contents
subscribers. Therefore, if we misjudge anticipated demand for programs, the profitability of our business may be impaired.
Consent of Level 4 network operators and housing associations to market new products. We need the consent of Level 4 network operators and housing associations in order to market our pay-TV, internet and phone services to their end customers. Such marketing of pay television, internet or phone access subscriptions is generally not covered by our standard cable television signal delivery agreements. We have entered into agreements permitting us to market our pay-TV services directly to end customers with many of the Level 4 network operators using our cable television services. With respect to the marketing of our Internet & Phone services we currently have an agreement with different Level 4 network operators and a large number of housing associations. To the extent that we are unable to amend existing agreements or obtain new agreements with the remaining Level 4 network operators and housing associations, we may market our new products and services to our direct end customers only, which may adversely affect the penetration of our new products and services and may make the offering of such new products and services uneconomical.
The switch-off of analog satellite signals might adversely affect our business
Analog satellite signals serve as a major source for KDG's analog cable distribution according to carriage agreements with the broadcasters specifying the signal sources. Public and private channel groups will likely seek to reduce distribution costs by turning off analog satellite transponders and signals in 2011 or 2012. So far, there is no specific date fixed or roadmap for this decision of the broadcasters laid out. In order to continue analog TV signal distribution in its network, KDG would have to re-invest in its head ends to convert digital satellite signals back into analog cable signals. While todays feed-in contracts between KDG and broadcasters stipulate that the broadcasting channels have to bear these investments it is not guaranteed that broadcasters will still have this obligation in 2-3 years from now. In this case KDG might have to bear at least part of the investments to continue analog signal distribution.
We rely on DTAG and certain of its affiliates for a significant part of our network.
While we compete with DTAG in a number of areas, we also rely on various long-term agreements with DTAG and certain of its affiliates that are significant to our business, including for the lease of cable duct space for approximately 13% of our cable network as well as the use of fiber optic transmission systems and facility space. In addition, we purchase the electrical power required for the operation of our network through DTAG. Our ability to offer our services to our customers depends on the performance of DTAG and its affiliates of their respective obligations under these arrangements. In particular, we rely on DTAG to provide us with timely access to co-located facilities, especially for the purposes of maintaining and repairing our network and avoiding or rectifying network outages. Our increasing direct competition with DTAG could potentially have a negative impact on DTAG's performance of its obligations under these arrangements. Our rights under the Service Level Agreements (SLAs) cannot be assigned without the consent of DTAG, other than in exceptional cases, as defined in the SLAs (see ITEM 10 C—Material Contracts). DTAG has the right to terminate such arrangements in certain circumstances and under certain conditions. For example, if DTAG decides to discontinue using cable ducts carrying our cable without replacing the ducts it may terminate our rights to use the ducts unless we exercise rights to purchase such ducts from DTAG. If DTAG replaces the ducts it must offer us space in the new ducts. If we fail to fulfill our payment obligations or are otherwise in breach of contract under the SLAs, DTAG would be entitled to terminate the SLAs. The termination of any material portion or all of the SLAs by DTAG would seriously affect the value of our network or business. Continuing our business upon such termination would, if possible at all, require a sizeable payment to purchase the relevant facility from DTAG or a sizeable investment to replicate the lost facilities or services and could have a material adverse effect on our business, financial condition or
12
Table of Contents
results of operations. In many cases we would not be able to find suitable alternative service providers at comparable cost or within a reasonable timeframe.
KDG supplies signals to approximately 109,000 cable TV households using the so called 'OPAL' technology from DTAG. DTAG announced its intention to discontinue this technology by the end of 2010. In order to continue supplying these households thereafter, KDG is currently in the process of investigating the most economical alternative. Considered alternatives are leased lines from DTAG or other carriers, build-out of coax network, supply via satellite signal as well as disconnection of uneconomical households. The change of the signal supply of these customers may require a significant re-investment into KDG's network during 2010 to maintain its customer and revenue base in the OPAL areas.
We do not have guaranteed access to programs and are dependent on agreements with certain program providers, which may adversely affect our profitability.
We do not produce our own content. For the provision of programs distributed via our cable television network we enter into agreements with program providers, such as public and commercial broadcasters, all of these contracts having different durations. We generally derive revenue under these contracts from 'carriage fees' or 'feed-in fees', in exchange for distributing the programs to our subscriber base. We cannot assure that we will be able to renew our existing contracts with program providers on commercially favorable terms, if at all. Program providers may have considerable power to renegotiate the fees that we charge for carriage of their product. Any lowering of the carriage fees that we receive from program providers would adversely affect our results of operations.
We conclude agreements with various broadcasters for our pay-TV services. We pay the digital pay-TV content providers for the digital programs they provide us at prices that may be affected by our ability to guarantee a minimum audience to such content providers or require us to guarantee a minimum audience generally. In addition, if we do not meet certain subscriber targets with respect to these program contracts within 12 to 18 months after their respective launch, the content providers may have the right to cancel or renegotiate these contracts. We will need to extend existing licenses and negotiate access to additional programs in the future. Most premium content rights are already held by competing distributors and, to the extent such competitors obtain content on an exclusive basis, the availability of programs to us could be limited. As a consequence, we may be unable to obtain attractive content on favorable terms in the future, if at all, which could have a material adverse effect on our business and results of operations. Our inability to obtain attractively priced competitive programs/channels would reduce demand for our existing and planned pay-TV services, limiting our ability to maintain or increase revenues from these services.
Failure to extend agreements with content providers on carriage fees may adversely affect our business
In the years 2006 to 2008 KDG entered into new carriage agreements with public broadcasters ARD (Arbeitsgemeinschaft der öffentlich-rechtlichen Rundfunkanstalten der Bundesrepublik Deutschland)/ZDF (Zweites Deutsches Fernsehen, Anstalt des öffentlichen Rechts) and private broadcasters ProSiebenSat.1 Media AG ('ProSiebenSat.1') and RTL Group SA ('RTL') as well as with the pay-TV operator Sky Deutschland. The contracts will mature between 2009 and 2012 and at this point it is not clear under which terms and conditions these cooperations will be continued.
Failure to reach agreement with owners of copyright protected broadcast content may adversely affect our business.
Until the end of 2006 copyright expenses were governed by two primary contracts, one with VG Media—Geselllschaft zur Verwertung der Urheber- und Leistungsschutzrechte von Medienunternehmen mbH ('VG Media'), representing the majority of private broadcasters, and one
13
Table of Contents
with GEMA—Gesellschaft für musikalische Auffuehrungs- und mechanische Vervielfaeltigungsrechte eingetragener Verein ('GEMA'), representing a variety of other collecting societies as well as public broadcasters and a smaller part of private broadcasters (the so-called 'Kabelglobalvertrag'). With the parties of the Kabelglobalvertrag we concluded an open-ended agreement effective as of January 2007. With VG Media we are currently in a dispute regarding the tariff charged by VG Media. VG Media has started an arbitration proceeding against us with regard to the 2007 dispute. In April 2009, the arbitration board issued an arbitrational proposal which was objected by both parties and therefore did not become mandatory for KDG. As of 2007, when the arbitration proceedings were launched, until the end of the dispute (by either a final court decision, a settlement or an agreement between the parties), KDG has made and will continue to make conditional payments in accordance with a preliminary settlement reached in court. Depending on the outcome of the dispute, there is however a risk that KDG will need to make additional payments for copyright expenses to VG Media from the beginning of 2006 onwards, in addition to the conditional payments made in accordance with the preliminary settlement reached in court.
Our business is subject to rapid changes in technology and if we fail to respond to technological developments, our business may be adversely affected.
Technology in the cable television and telecommunications industry is changing rapidly. We will need to anticipate and react to these changes and to develop successful new and enhanced products and services quickly enough for the changing market. This could result in the need to make substantial investments in new or enhanced technologies, products or services, and we may not be able to adopt such technology due to insufficient funding to make the necessary capital expenditures or for other reasons, such as technological incompatibility with our systems. In addition, new technologies may become dominant in the future, rendering our current systems obsolete. These include the provision of video signals by DSL providers and also the provision of DTT. Some of these technological changes may also be mandated by regulation. Our ability to adapt successfully to changes in technology in our industry and provide new or enhanced services in a timely and cost-effective manner, or successfully anticipate the demands of our customers, will determine whether we will be able to increase or maintain our subscriber base. If we fail to respond adequately to technological changes, we could lose subscribers and, as a result, our business would be materially and adversely affected.
Failure to maintain and upgrade our cable television network or make other network improvements could have a material adverse effect on our operations and impair our financial situation.
Our current assumptions regarding the costs associated with upgrades and maintenance of our cable television network may prove to be inaccurate. In particular, we compete in providing internet services on the basis of technologies that may be implemented with low costs and without extensive upgrades to our existing network, which may not prove to be feasible on a network-wide basis. If capital expenditure exceeds our projections, for example because of the need to replace aging network components, or our operating cash flow is lower than expected, we may be required to seek additional financing. Our inability to secure additional financing on satisfactory terms (or at all) may adversely affect the maintenance of our cable television network and upgrades and other improvements to the network. This would negatively affect the service we provide to our subscribers, which could result in negative publicity and the loss of subscribers, and adversely affect our ability to attract new subscribers.
In addition, failure of Level 4 network operators or housing associations to maintain their own networks could have adverse consequences on our reputation, as customers may assume that we are responsible for maintenance of these networks and may terminate their subscription with us. Any new or enhanced products or services we introduce, including Internet & Phone, may require an upgrade of these local and in-house networks, in which case we may be required to cover a portion, or all, of the costs of such upgrade.
14
Table of Contents
We rely heavily on our digital playout facilities
Our digital playout facility in Frankfurt am Main/Roedelheim could suffer a catastrophic outage and we may be unable to serve our digital customers both with TV and radio for a significant period of time which could result in the substantial and permanent loss of subscribers, revenues and EBITDA.
The occurrence of events beyond our control could result in damage to our cable television network and digital playout facility
If any part of our cable television network is subject to a flood, fire or other natural disaster, terrorism, a power loss or other catastrophe, our operations and customer relations could be materially and adversely affected. In general, our network consists of a large number of independent sub-networks. Historically, these sub-networks are built in a tree-structure but star-networks have been prevalent for a number of years. Although major casualties affecting individual sub-networks should not generally affect the entire network, this cannot be ruled out. Some of our network is built in resilient rings to promote the continuity of network availability in the event of damage to our underground fibers, however, if any ring is cut twice in different locations, transmission signals will not be able to pass through, which could cause significant damage to our business. Disaster recovery, security and service continuity protection measures that we have or may in the future undertake, and our monitoring of network performance, may be insufficient to prevent losses. A substantial part of our cable network is not insured. Any catastrophe or other damage that affects our network could result in substantial uninsured losses.
In case of a breakdown of a satellite transponder or a complete loss of the entire satellite system, our digital playout facility (which transmits digital signals via satellite to the head ends of our cable network) will be affected, interrupting the distribution of certain channels in the entire network until the transponder or system is fully operational again. Our transponder contract does not provide for back-up transponder capacity in the event of a breakdown of a satellite transponder. The satellite link between our playout facility in Frankfurt am Main/Roedelheim and the head ends is a particularly critical point as any failure of a transponder on this link or loss of control of the relevant satellite may affect all digital channels.
In the event of a power outage in our playout facility we may be unable to serve several or even all of our channels in the entire network even though we have back-up systems in place for most of our technical equipment. In the event of a power outage in our network or other shortage, we usually do not have a back-up or alternative supply source. A power outage in one segment of the network could cause sub-networks to shut down.
In addition, our business is dependent on certain sophisticated critical systems, including our playout facility and billing and customer service systems. The hardware supporting those systems is housed in a relatively small number of locations and if damage were to occur to any of these locations, or if those systems were to develop other problems, it could have a material adverse effect on our business.
The security of our encryption system was compromised by illegal piracy and may in the future again be compromised by illegal piracy.
We use a conditional access system to encrypt TV, radio and data that either form part of our free and pay-TV offerings or that are marketed by third parties, such as the above mentioned pay-TV operator. A compromised security of the conditional access system might have a negative impact on the revenue generation of such services. As the security of our current conditional access system was compromised by illegal piracy, we decided to migrate to a new conditional access system, provided by Nagravision S.A. (Nagravision). Even though we required Nagravision to provide state-of-the-art
15
Table of Contents
security for the new conditional access system, the security of the system could be compromised again by illegal piracy at some point in time
The installation of a new information technology system and changes to our financial accounting systems and personnel may result in higher costs than expected.
KDG is currently introducing new IT systems with major improvements to its billing, accounting and customer care systems. Higher expenses than initially anticipated can occur when assumptions turn out to be unrealistic or wrong regarding timing, problems with data migration, factual change requests during realization, changing ancillary conditions during the development, potential wrong adaptation of business processes or even lack of training related to the new processes.
New software systems for support of our day-to-day-work might be more complex than anticipated and may have an impact on our business.
We are developing new software for billing, customer care and business intelligence. The complexity of such systems may result in unrealistic or wrong timelines. This could especially be the case when ancillary conditions change resulting in additional adaptation of products or business processes or even when additional training related to the new processes is required. This could result in substantial budget overruns and the inability of the Company to improve customer service leading to higher churn.
The insolvency risk of major customers or suppliers may have an adverse impact on our revenues.
We rely on a few major suppliers to provide us with customer or network equipment as well as with TV-signals. In case one or more of these entities face financial difficulties, this might have a negative effect on our revenues, our Adjusted EBITDA and our ability to provide services.
Our subscriber data may not be representative of our actual results and data
As subscriber data (contracts, cancellation etc.) is partly entered manually in the systems, e.g. by call center agents, process errors may occur. There might also be erroneous subscriber data in the historical data set (previous system migration errors, data entry errors) of the source system. Subscriber figures are reported automatically by data warehouse systems. As no software can be proven to be fault free, system anomalies/errors might affect reported data. Likewise, the extraction of subscriber data out of the source system might extract erroneous data.
Sensitive customer data is an important part of our daily business and leakage of such data may adversely affect our business
We accumulate, store and use in our operating business data which is protected by data security laws. The data security agencies, both on federal and state level, have the right to audit KDG and if we have not followed the laws and adequately protected the data we could be subject to fines. To manage data security in the KDG group we recently reorganized our data security team and appointed a new data protection officer (Konzerndatenschutzbeauftragter).
Loss of our key management and other personnel, or an inability to attract such key management and other personnel, could impact our business
The Managing Directors are initially appointed for up to three years. After this initial period, appointments are for an indefinite period whereby either party can give notice and terminate. Some of the managing director's service contracts can be terminated by the management with a twelve months prior notice. The potential loss of our experienced management team could have an adverse affect on the performance of our company.
16
Table of Contents
We also depend on our key management and other personnel to run our business, including to market our products, to introduce and establish new or enhanced products and services, to negotiate or renegotiate agreements with DTAG and certain of its affiliates and with public and commercial broadcasters and to respond to technological developments to develop new products and technologies. The loss of any of key personnel could materially adversely affect our business. Competition for qualified employees among companies is intense, and the loss of qualified employees or an inability to attract, retain and motivate highly skilled employees required for the operation of our business could hinder our ability to successfully run and develop our business.
Risks in relation to outsourcing of services may adversely affect our business and may cause higher costs than initially anticipated
Over recent years we have restructured our technical operations department resulting in outsourcing of most of our technical services. Since these processes have not yet been fully established, our service partners may not be able to deliver the same high level of services. Additionally, they may incur financial difficulties and therefore this might have an adverse affect on our customer service. In general, outsourcing of services may lead to higher severance costs than initially anticipated.
Strikes or other industrial actions could disrupt our operations or make it more costly to operate our facilities.
We are exposed to the risk of strikes and other industrial actions. Approximately 20% of our employees are members of a labor union. Historically, we have enjoyed good labor relationships and we are committed to maintaining these relationships. We take a constructive approach to union relationships, and have been able to secure the cooperation of the unions and our workforce with regard to significant changes and the process of continuous improvements. We have negotiated various collective bargaining agreements directly with the labor union. These collective bargaining agreements cover the general labor conditions of our employees (other than executives), such as working hours, holidays, termination, provisions and general payment schemes for wages.
U.S. military redeployment may adversely impact our Telepost Kabel-Service Kaiserslautern GmbH & Co. KG ('TKS') business.
Our TKS business operates a broadband and telephony telecommunications business that mainly serves NATO military bases in Germany. TKS is permitted to build and maintain its networks on U.S. military bases located on premises owned by the Federal Republic of Germany pursuant to agreements with an agency representing the Federal Republic of Germany. In the event that any of the U.S. military bases are vacated, the Federal Republic of Germany may terminate the applicable agreement with TKS. The U.S. military has announced that it is planning to restructure its operations in Germany, which could lead to a significant reduction in the number of American troops stationed in Germany. Any such reduction in U.S. military personnel or the closure of U.S. military bases in Germany would likely have an adverse effect on TKS' results of operations.
Termination of Services for Deutsche Telekom AG (DTAG) may adversely affect our TKS business
At the end of July 2009, TKS and DTAG mutually agreed to extend the contract governing our business relationship and according to a DTAG officer the signed contracts will be delivered within two weeks time. We expect the agreements to be effective but there is no assurance as long as the written contracts are not returned. If the contract is not extended it could be detrimental to the TKS business.
17
Table of Contents
We have acquired and may in the future plan to acquire assets which could potentially deliver less revenues and earnings than anticipated and we may not be able to integrate these assets in a timely manner which may delay the roll out of Internet & Phone services and not allow us to recognize anticipated synergies.
The anticipated synergies out of recent acquisitions have not yet been fully validated. Differing network structures and underlying channel allocations could turn out to become major obstacles in the timing of the network upgrade and the roll-out of voice and internet services.
We may pursue acquisitions in the future that, if consummated, could decrease the availability of cash to repay our indebtedness. In addition, our management may be distracted by such acquisitions and the integration of the acquired businesses. Thus, if we consummate any further acquisitions, there could be a material adverse effect on our business, financial condition or results of operations.
The financial crisis in the global capital and credit markets and the resulting global recession could affect our strategically important suppliers and service providers, reduce consumer spending and severely impact our pension liabilities and costs.
The global capital and credit markets have been experiencing extreme volatility and disruption. This has had a severe negative impact on businesses around the world and depressed the global economy. The financial crisis and the fact that financial institutions have consolidated or gone out of business have resulted in a tightening in the credit markets, a low level of liquidity in many financial markets, and extreme volatility in fixed income, credit, currency and equity markets, strongly reducing the availability of financing in general. The impact of this crisis on our strategically important suppliers and service providers cannot be predicted and may be severe. The current economic crisis could lead to the insolvency of strategically important suppliers and service providers. In case of a shortfall of single suppliers and service providers this could lead to significant disruptions to our operations (e.g. in the supply of end devices, in the maintenance of devices and in the installation of new devices) and to unplanned increased costs for replacement suppliers and service providers. This could also negatively impact on our image, which could in turn result in increased customer losses. In addition, the global economic crisis could further lead to reduced consumer spending in the foreseeable future, which could lead to a significant reduction in their consumption of our products and the inability or failure on their part to meet their payment obligations to us. Similarly, the impact of this crisis on our pension liabilities and costs cannot be predicted and may be severe.
Risks Relating to Regulatory and Legislative Matters
We are subject to significant government regulation which may increase our costs and otherwise adversely affect our business and further changes could also adversely affect our business.
Our existing and planned activities as a cable network operator in Germany (including our Internet & Phone services) are subject to significant regulation and supervision by various regulatory bodies, including state, federal and European Union ('EU') authorities. Such governmental regulation and supervision as well as future changes in laws, regulations or government policy (or in the interpretation or enforcement of existing laws or regulations) that affect us, our competitors or our industry, generally strongly influence our viability and how we operate our business. Complying with existing regulations is burdensome and future changes may increase our operational and administrative expenses and limit our revenues. In particular, we are subject to:
- •
- licensing and notification requirements;
- •
- price regulation for certain services that we provide, in particular with respect to carriage fees to broadcasters and fees for the delivery of signals to other Level 4 operators;
18
Table of Contents
- •
- rules regarding the interconnection of our telecommunications cable network with those of other network operators and, under certain circumstances, the granting of access to our network to competitors or the resale of our services on a wholesale basis;
- •
- requirements that a cable network operator carries certain channels;
- •
- rules relating to data and customer protection, as well as protection of minors;
- •
- rules regarding the use and allocation of frequencies and analog and digital transmission capacities;
- •
- rules regarding the fair, reasonable and non-discriminating treatment of broadcasters;
- •
- rules regarding fair trade and competition;
- •
- rules relating to conditional access systems and application interfaces;
- •
- rules to block certain kinds of content as an internet access provider;
- •
- rules regarding the duty to disclose personal data of customers committing certain severe criminal acts; and
- •
- other requirements covering a variety of areas such as environmental protection, technical standards and subscriber service requirements:
Our business would be materially and adversely affected if there were any adverse changes in relevant laws or regulations (or in their interpretation or enforcement) regarding, for example, the imposition of access or resale obligations, price regulation, interconnection agreements, frequency allocation requirements or the imposition of universal service obligations, or any change in policy allowing more favorable conditions for other operators. Our ability to introduce new products and services may also be affected if we cannot predict how existing or future laws, regulations or policies would apply to such product or service.
In the future, our internet access and telephony business may be subject to new laws and regulations, the impacts of which are difficult to predict.
To prevent the publication and distribution of child pornographic material on the internet, we had committed ourselves in April 2009 along with other large internet access providers to block the publication and distribution of such material. Meanwhile, in June 2009, the German government adopted legislation obliging all German internet access providers to block the publication and distribution of such material. Furthermore, some copyright holders try to impose obligations to record and disclose personal data, to warn customers, to decrease internet capacity and/or to block URLs or internet access in the case of copyright infringements. Any new laws or regulations affecting the internet, or amendments to or new interpretations of existing laws and regulations to cover internet related activities, could increase the costs of regulatory compliance to us or force us to change our business practices or otherwise have a material adverse effect on our business.
Under the current regulatory regime based on federal and European legislation, the Federal Network Agency ('FNA') is entitled to impose certain obligations on operators of telecommunications networks which have significant market power or which, despite the absence of significant market power, control end user access. Amongst other things, it may impose the obligation on such operators to grant access to, or interconnection with, their telecommunications networks and to offer third parties the re-sale of their telecommunications services on a wholesale basis. Moreover, the prices that operators with significant market power or operators controlling end user access charge to their competitors and customers may be subject to regulation.
In 2003, the European Commission had issued a recommendation identifying a number of markets potentially susceptible to ex-ante regulation. One of these markets concerned broadcasting transmission
19
Table of Contents
services to deliver broadcast content to end-users (Market 18 regulation). In 2006, the FNA performed an analysis of this Market 18 regulation and came to the conclusion that we have significant market power (SMP), as described in the next paragraph. At the end of 2007, the European Commission has revised its recommendation and has, inter alia, removed Market 18 regulation from the list of markets warranting special observation. This should have consequences for the review of the market analysis to be performed periodically by the FNA, which is due since fall of 2008 and has actually been started in April 2009. Depending on the outcome of such analysis, this could lead to less strict regulation. However, it is too early to predict the consequences of such review of Market 18 regulation as of now.
The FNA has declared within a regulatory ordinance as of April 2007 that we have significant market power ('SMP') in the regional, network-based cable television markets in which we operate.
In its decision, the FNA has imposed certain remedies for the feed-in market for broadcasters (Einspeisemarkt) and the signal delivery market to Level 4 network operators (Signallieferungsmarkt). We have filed complaints against this regulatory ordinance with the competent court. These complaints have partly been overturned and/or are still pending. With respect to KDG's SMP, the court has upheld the FNA's view. However KDG has again appealed against this decision. The final decisions in these cases are pending.
These regulatory obligations (remedies) include for our feed-in market:
- 1)
- A transparency obligation with regard to technical specifications, network features, provisional conditions and fees. This information on all different kinds of our feed-in offers must be published for interested parties (but not for the public).
- 2)
- Feed-in fees are subject to ex-post regulation, but there is no obligation to disclose fees in advance to the FNA.
For our signal delivery market to Level 4 network operators the remedies include:
- 1)
- An access obligation for the delivery of broadcasting signals to downstream operators (Level 4) for connection point (Uebergabepunkt) clusters up to 500 households (Wohneinheiten) including a shared use of connection points. Therefore access to our network cannot be denied to Level 4 network operators if technically feasible.
- 2)
- A non-discrimination obligation. Access agreements must be impartial, comprehensible, and adequate and include equal opportunities for all Level 4 network operators. Individual deviations are feasible for 'objective' reasons only.
- 3)
- A separate accounting obligation: Access prices and internal transfer prices for signal delivery must be configured transparently. On request, sales volumes and revenues of external and internal signal delivery products must be provided to the FNA.
- 4)
- Signal delivery fees are subject to ex post regulation including an obligation to disclose fees in advance to the FNA.
- 5)
- We are obliged to publish a reference offer (Standardangebot) for our signal delivery products to Level 4 network operators. The reference offer must include all necessary technical and commercial information including prices and shall enable Level 4 network operators to accept such offer without any further negotiations.
Furthermore, in the future, it cannot be ruled out that we may be required to offer our services to third parties for resale on a wholesale basis. Granting such access or interconnection would limit the bandwidth available for us to provide other products and services to customers served by our networks.
20
Table of Contents
The actual and possible future regulation could:
- •
- impair our ability to use our bandwidth in ways that would generate maximum revenue;
- •
- create a shortage of capacity on our networks, which could limit the types and variety of services we seek to provide our customers;
- •
- strengthen our competitors by granting them access and lowering their costs to enter into our markets; and
- •
- have a material adverse impact on our profitability.
Due to regulation, we do not have complete control over the prices that we charge to broadcasters or wholesale offers to Level 4 network operators, and this may adversely affect our future cash flows and profitability. This may also affect our pricing flexibility for housing associations and subscribers.
In the case of an ex post review of our feed-in or signal delivery fees, the FNA may declare our fees invalid if it finds that they are abusive and may either direct us to adjust our fees or provide for fees that are not abusive. Therefore, we may not be able to enforce future changes to our carriage and signal delivery fees. This may have an adverse impact on our revenues, profitability of new products and services and ability to respond to changes in the cable television market.
We presently use a range of rebate or volume-related pricing mechanisms. Due to actual regulation with regard to the feed-in and signal delivery market we may be restricted from imposing or enforcing certain pricing mechanism. There is a potential risk that broadcasters may try to seek help from or initiate review proceedings by the FNA with respect to the carriage fees charged by us. Volume-based discounts reflecting cost savings, one means of avoiding churn to competing infrastructures, are presumably not affected. We cannot entirely rule out the possibility, however, that, if other clauses were subjected to challenge within a regulatory proceeding, these clauses would be found to be unenforceable. In such cases, we could, under certain circumstances, be found liable for fines or damages if these clauses were successfully challenged. This could adversely affect our competitiveness, financial condition and results of operations.
According to the State Broadcasting Treaty (Rundfunkstaatsvertrag), our analog and digital carriage fees are, in addition to the price regulation by FNA mentioned above, subject to certain notification obligations to the state media authorities. The state media authorities are entitled to review whether the prices we apply are restrictive or discriminatory with respect to certain content providers. As a result, we may be further constrained in respect of the pricing models we agree with content providers for both analog and digital products and our results of operations may be adversely affected.
In addition, we are prohibited from charging carriage fees to certain legally privileged radio and television channels operated by non-profit organizations.
Our general terms and conditions may be held unenforceable by the German civil courts, which could adversely affect our business and results of operations.
There is a risk that some of the provisions of our general terms and conditions (Allgemeine Geschaeftsbedingungen), which we have in place with our customers, may be held invalid and therefore unenforceable by German civil courts. Accordingly, we may no longer be able to unilaterally amend the terms and conditions applicable to our service offering or relating to the fees we charge customers for our services. This could adversely affect our business and results of operations.
21
Table of Contents
We are required to carry certain programs on our network, which may adversely affect our competitive position and results of operations.
We are required to carry certain broadcasting and other channels on our cable system that we might not necessarily carry voluntarily. Whereas in the digital range, the scale and scope of so-called must-carry obligations is quite balanced, the scope of the must-carry obligations in the analog range varies from state to state. In some states also television channels broadcasted via DTT fall, as asserted by the respective media authorities, within the scope of the must-carry obligation, which therefore takes up a significant portion of our analog bandwidth in such states.
We may become subject to more onerous must-carry rules upon a change in the current regulatory regimes. The European Court of Justice has recently confirmed state legislators' ample powers to shape must-carry rules as they see fit. Re-allocation of analog capacity in various German federal states requires at least to reach informal understandings with the competent state media authority, which decreases planning reliability and could have a material adverse effect on our business, considering that both the digitization of a channel earmarked for future transmission of broadcasting or other media content and each network upgrade to establish internet require a re-allocation of analog capacity.
Analog television and radio distribution may be phased out, which may adversely affect our competitive position and could result in increased costs or a loss of revenue
The German federal and state governments aim to switch from analog to DTT distribution platforms. This switch-over is now complete. In accordance with the telecommunications act and the regulations promulgated thereunder, the FNA is generally required to revoke all allocations of terrestrial frequencies for analog television transmission by 2010, and for analog terrestrial frequency-modulated radio transmission by 2015. Even though the relevant provisions of the telecommunications act and related regulations are not directly applicable to us, as the operation of cable television networks, in principle, does not require frequency allocations, we may be required to invest in the exchange of some of our head-end equipment as some broadcasters could cease to deliver their signals in analog format. The same is true if plans to cease analog satellite distribution within the next two or three years, as recently announced by most broadcasters, will be executed. In addition, future legislation or market needs may require us to digitize our entire cable network and may also require a hard switch-over. Recent changes in the law that came into effect in May 2009 aim at the mandatory digitization of two analog channels in the lower frequency spectrum for security reasons (such as to mitigate interference with air traffic, etc.). This could potentially adversely affect our business. The changes in the law provide for a digitization or switch-off in several steps before the end of the year 2011. Similarly, the future use of certain high frequency ranges of terrestrial spectrum, formerly devoted to broadcasting services, for new (mobile) broadband applications (Digitale Dividende or 'digital dividend') could potentially adversely affect our business, as it could limit our ability to use the same frequencies in our networks and/or on end devices connected to our network.
The advent of digitization may promote new technologies that compete with us. DTT has to some extent become a competitive delivery system for television programs and may continue to grow even more if the digital terrestrial capacity will be enhanced as compression technology evolves. This could adversely affect our results of operations and financial condition.
In addition, we are dependent on program providers for the provision of programming and, as the market moves towards digital transmission and a multiplication of digital platforms by facility-based and/or non-facility based operators, we may find that we are unable to generate carriage fees for carrying digital programming at similar levels to those we obtain for carrying analog programming, or at all. This could adversely affect our results of operations and financial condition.
22
Table of Contents
Changes in German tax law may mean that we will not be able to fully deduct interest on our debt instruments. In any such event, we may choose to release guarantees in favor of the Senior Notes, which would require us to fund the repurchase of the Senior Notes outstanding at such time.
The Business Tax Reform Act 2008 dated August 14, 2007—amongst others—changed the taxation net interest expense and limits the interest expense deduction to 30% of the pre-interest taxable income. Since the escape clause might not be applicable to KDG, the new rule could have a material adverse impact on our cash flow from operations.
Risks Relating to Our Indebtedness and Our Structure
The financial crisis in the global capital and credit markets and the resulting global recession could affect our ability to maintain sufficient liquidity or to seek additional financing.
The financial crisis in the global capital and credit markets and the resulting global recession could affect our ability to maintain sufficient liquidity to fund our working capital, service our outstanding indebtedness and meet our liabilities, including any principal due on our debt. If our resources do not satisfy our liquidity requirements, we may have to seek additional financing, but may not be able to successfully obtain any necessary additional financing on favorable terms, or at all, especially in light of the crisis in the credit markets. In addition, the financial crisis may cause banks who are parties to our senior credit facility (the 'Senior Credit Facility' or the 'Senior Credit Facilities') to refuse or be unable to fund future drawings. Similarly, we may not be able to refinance our existing Senior Credit Facilities or to incur additional indebtedness to fund future operations and capital expenditures. Without sufficient liquidity, we could be forced to curtail our operations and may, inter alia, be forced to:
- •
- reduce or delay our business activities and capital expenditures, including our continued network upgrade and rollout of 'triple play' services;
- •
- sell assets;
- •
- obtain additional debt or inject equity; or
- •
- restructure or refinance all or a portion of our debt on or before maturity.
We cannot assure that we would be able to accomplish any of these measures on a timely basis or on satisfactory terms, if at all. In addition, the terms of our debt, including the Senior Notes and the Senior Credit Facilities, limit, and any future debt may limit, our ability to pursue any of these alternatives.
Moreover, any failure of any such financial institution may negatively impact our treasury operations.
Our high leverage and debt service obligations could materially and adversely affect our business, financial condition or results of operations.
We are highly leveraged and have significant debt service obligations. As of March 31, 2009, we had €2,440.6 million of indebtedness (before netting, with transaction costs and exchange rate effects), of which €1,685.0 million under the Senior Credit Facilities and €755.6 million under the Senior Notes ('Senior Notes'). The Senior Credit Facilities currently comprise three tranches: a €1,150.0 million term loan facility ('Term Loan Facility' or 'Tranche A'), a €325.0 million revolving credit facility ('Revolving Credit Facility' or 'Tranche B') which was undrawn as of March 31, 2009, and a €535.0 million senior add-on facility ('Senior Add-on Facility' or 'Tranche C'). The Revolving Credit Facility, Tranche B, was increased by €125.0 million from €200.0 million to €325.0 million on July 19, 2007. The Senior Add-on Facility, Tranche C, secured for an amount of €650.0 million on October 30, 2007 but subsequently reduced by €115.0 million to €535.0 million as of May 9, 2008, was drawn on April 30, 2008 to fund the acquisition of the CATV assets from Orion ('the Acquisition').
23
Table of Contents
On top of the debt instruments mentioned above, we have issued at Kabel Deutschland Holding company level additional debt (PIK loan) in the nominal amount of €480.0 million on May 17, 2006 and at Cayman Cable Holding a PIK note in the notional amount of €140.0 million was issued on February 3, 2006. The PIK interest is paid in additional debt and is non-cash (payment in kind). This debt is not subject to the KDG group as defined herein.
We anticipate that our high leverage will continue for the foreseeable future. Our high leverage could have important consequences, including, but not limited to:
- •
- increasing our vulnerability to a downturn in our business or economic and industry conditions;
- •
- limiting our ability to obtain additional financing to fund future operations, capital expenditures, business opportunities and other corporate requirements;
- •
- requiring the dedication of a substantial portion of our cash flows from operations to the payment of principal of, and interest on, our indebtedness, which means that these cash flows will not be available to fund our operations, capital expenditures or other corporate purposes; and
- •
- limiting our flexibility in planning for, or reacting to, changes in our business, the competitive environment and the industries in which we operate.
Any of these or other consequences or events could have a material adverse effect on our ability to satisfy our debt obligations or on the ability of Kabel Deutschland Holding GmbH or Cayman Cable Holding L.P. to satisfy their debt obligations.
We may incur substantial additional indebtedness in the future. The terms of the indentures governing the Senior Notes and the agreements governing our Senior Credit Facilities and the agreements governing PIK loans entered into by our parent companies may restrict us from incurring additional indebtedness, but do not prohibit us from doing so. In addition, the terms of such indentures and such credit agreement do not restrict our parent companies from incurring future indebtedness for any purpose, including the funding of further distributions to our ultimate shareholders. The incurrence of additional indebtedness would increase the leverage-related risks described in this report.
We require a significant amount of cash to service our debt, and our ability to generate sufficient cash depends on many general economic, financial and market factors beyond our control.
Our ability to make payments on and to refinance our debt, and to fund future operations and capital expenditures, will depend on our future operating performance and ability to generate sufficient cash. This depends, to some extent, on many general economic, financial and market factors, many of which are beyond our control, as well as on other factors discussed in these 'Risk Factors'. Considering those factors, we cannot assure that our business will generate sufficient cash flows from operations or that future debt and equity financing will be available to us in an amount sufficient to enable us to pay our debts when due, or to fund our other liquidity needs.
Our operating performance could be affected by a significant or prolonged economic downturn. Such downturn could adversely affect our business by reducing the demand for our services or depressing pricing of those services. This could have a material adverse effect on our operating performance. Accordingly, our ability to service our debt may be affected and we may be unable to make principal and interest payments on our outstanding debt service obligations when due.
�� If our future cash flows from operations and other capital resources (including borrowings under the Senior Credit Facilities) are insufficient to pay our obligations as they mature or to fund our liquidity needs, we could be forced to curtail our operations and forced to take any of the measures described above under 'The financial crisis in the global capital and credit markets and the resulting global recession could affect our ability to maintain sufficient liquidity or to seek additional financing.
24
Table of Contents
We depend on payments from our subsidiaries to make payments on the Senior Notes, and our subsidiaries will be subject to various restrictions on making such payments.
Kabel Deutschland GmbH's main activity is the holding of ownership interests in Kabel Deutschland Vertrieb und Service GmbH & Co. KG (`KDVS') and Kabel Deutschland Verwaltungs GmbH (`KDV'), the general partner of KDVS. In addition, it provides certain corporate services, in particular accounting services, controlling, information management and legal services. KDG currently holds no material assets and has no sources of revenue other than the ownership interests in its subsidiaries and the right to any dividends thereon. In addition, KDVS will be subject to corporate law restrictions on its ability to pay dividends. In particular, under sections 172 and 172a of the German Commercial Code (Handelsgesetzbuch), in conjunction with sections 30 and 31 of the German Act on Limited Liability Companies (GmbH Gesetz), KDVS may neither make an upstream loan nor pay a dividend except to the extent that it has positive net equity calculated on the basis of KDVS' commercial balance sheet on the date of the proposed distribution. Otherwise, the partnership's managing directors will be personally liable for any negative net equity, consisting of any amounts distributed (either by way of loan or dividend) in excess of the partnership's net equity. This net equity may be increased by the contribution of further equity or by the accumulation of operating profits by KDVS, and decreased by dividends or distributions from KDVS and by continued operating losses at KDVS. There can be no assurance that the dividend and distribution capacity of KDVS will be adequate to service scheduled payments of interest and principal on the Senior Notes, particularly as we have a history of losses. In addition, the terms of the Senior Notes permit further debt to be incurred by Kabel Deutschland GmbH, KDVS will also be required to service this debt by means of dividends or other distributions which are subject to the same restrictions.
If payments are not made by KDVS to Kabel Deutschland GmbH, for whatever reason, KDG may not have any other sources of funds available to it that would permit it to make payments on the Senior Notes. In such event, holders of the Senior Notes would have to rely upon claims for payment under the guarantee.
KDG only has a shareholder's claim in the assets of its subsidiaries. This shareholder's claim is junior to the claims that creditors or preferred stockholders of our subsidiaries have against our subsidiaries. Holders of the Senior Notes will only be creditors of the issuer and KDVS, as guarantor of the Senior Notes. In the case of KDVS, any existing and future senior obligations of KDVS, including all obligations under the Senior Credit Facilities, will be senior in right of payment to the Guarantee. In the case of subsidiaries that are not guarantors of the Senior Notes, all the existing and future liabilities of these subsidiaries, including any claims of trade creditors and preferred stockholders, will be effectively senior to the Senior Notes. These subsidiaries include entities that are borrowers or guarantors under the Senior Credit Facilities.
We undertook an Asset Step-Up in the year 2004 and may undertake further Asset Step-Ups in the future that may be prejudicial to our existing business and subject KDG to additional liability.
In accordance with the terms of the Senior Notes, we have undertaken an asset step-up (Asset Step-Up), whereby substantially all of the assets of the company formerly known as Kabel Deutschland Vertrieb und Service GmbH & Co. KG, the initial guarantor of the Senior Notes ('OldKDS'), have been transferred to a newly incorporated asset corporation (AssetCo). Subsequently, OldKDS has been merged into KDG, and AssetCo was renamed Kabel Deutschland Vertrieb und Service GmbH & Co. KG ('KDVS'). The purpose of the Asset Step-Up was to substitute a subsidiary with higher balance sheet equity (KDVS) for OldKDS in order to facilitate, among other things, up-stream loans or dividend distributions from KDVS to KDG under German corporate law. See 'We depend on payments from our subsidiaries to make payments on the Senior Notes, and our subsidiaries will be subject to various restrictions on making such payments'.
25
Table of Contents
We believe that we have been able to transfer the material assets of OldKDS to KDVS, including OldKDS' rights under various SLAs with DTAG, without the need for the consent of our counterparties. It can not be ruled out that consent from DTAG and other companies may have been required in connection with the Asset Step-Up and that we would therefore be in breach of certain agreements by having purportedly transferred them to KDVS. The transfer of contracts to KDVS has not, under German law, relieved OldKDS of liability on those contracts and KDG has now become liable under these contracts, including the Senior Credit Facilities.
The interests of our principal shareholders may be inconsistent with the interests of the holders of Senior Notes and of each other.
Private equity investment funds affiliated with or advised or managed by Providence Equity Partners ('Providence') indirectly own the vast majority of our equity. The interests of Providence and its affiliates could conflict with other interests, particularly if we encounter financial difficulties or are unable to pay our debts when due. Providence and its affiliates could also have an interest in pursuing acquisitions, divestitures, financings or other transactions that, in their judgment, could enhance their equity investments, although such transactions might involve risks to the holders of the Senior Notes or other debt instruments. In addition, Providence and its affiliates may own businesses that directly compete with ours or may own businesses with interests that conflict with ours.
We are subject to significant restrictive debt covenants which limit our operating flexibility.
The Senior Credit Facilities and the indenture governing the Senior Notes contain covenants significantly restricting our ability to, among other things:
- •
- incur or guarantee additional indebtedness;
- •
- pay dividends or make other distributions or repurchase or redeem our stock;
- •
- make investments or other restricted payments;
- •
- dispose of assets;
- •
- create liens;
- •
- enter into certain transactions with affiliates;
- •
- enter into agreements that restrict our subsidiaries' ability to pay dividends; and
- •
- consolidate, merge or sell all or substantially all of our assets.
These covenants could limit our ability to finance our future operations and capital needs and our ability to pursue acquisitions and other business activities that may be in our interest.
The Senior Credit Facilities also require us to maintain specified financial ratios and satisfy specified financial tests. Our ability to meet these financial ratios and tests may be affected by events beyond our control and, as a result, we cannot ensure that we will be able to meet these ratios and tests. In the event of a default under the Senior Credit Facilities or certain other defaults under other agreements, the lenders could terminate their commitments and declare all amounts owed to them to be due and payable. Borrowings under other debt instruments that contain cross-default or cross-acceleration provisions, including the Senior Notes, may, as a result, also be accelerated and become due and payable. We may be unable to pay these debts in such circumstances.
On February 11, 2009 KDG approached the lenders of its Senior Credit Facilities via its facility agent with a request to agree to certain minor amendments to the Company's credit covenants in order to increase headroom for the continued business expansion. KDG proposed to change the senior net debt to EBITDA covenant for the quarters starting from December 2010 to December 2011 as well as
26
Table of Contents
to extend senior net debt to EBITDA and EBITDA to net interest covenants beyond March 2012, until maturity of its Senior Add-on Facility, Tranche C, in March 2013. On February 25, 2009, the deadline ended for the amendment. Approximately 92% were consenting to the request. The amendments were thereby approved.
The borrowings under our Senior Credit Facilities bear interest at floating rates that could rise significantly, increasing our costs and reducing our cash flow.
The borrowings under our Senior Credit Facilities bear interest rates equal to EURIBOR, as adjusted periodically, plus a spread. This interest rate has been lowered but could rise again in the future, increasing our interest expense associated with these obligations, reducing cash flow available for capital expenditures and hindering our ability to make payments.
We are exposed to foreign exchange risk that may adversely affect our financial condition and results of operations.
Because substantially all our revenues are denominated in Euro, we may become further exposed to foreign exchange risk by incurring debt in the future that is not denominated in Euro. This risk could lead to increased cash requirements for debt service, higher leverage levels, greater levels of risk in relation to repaying or refinancing such debt when due, and significant costs (including tax costs) incurred in order to hedge these risks. We are exposed under the US dollar bonds but are fully hedged through July 2011.
Risks Associated with Financial Instruments
The Company is exposed to market risks from changes in interest rates and currency exchange rates which can impact its operating results and overall financial condition. The Company manages its exposure to these market risks through its operating and financing activities and, when deemed appropriate or required by other agreements, through the use of derivative financial instruments. The main strategy is to avoid or to mitigate risks, e.g. currency risks (by entering into currency swaps) or the risk of varying interest payments (by entering into payer swaps and buying caps).
Derivative financial instruments are used exclusively for the purpose of hedging foreign currency and interest rate risks arising from operating, financing and investing activities. In accordance with IAS 39, all derivative financial instruments are accounted for at fair value. Changes in the fair value of the derivative financial instruments for which hedge accounting is used are either recorded in profit and loss or in equity under the fair value reserve, depending on whether it is a fair value hedge or a cash flow hedge. The current volatility in the financial markets and overall economic uncertainty increases the risk that the actual amounts realized in the future on our financial instruments could differ significantly from the fair values currently assigned to them. Other income and expense could also vary materially from expectations depending on gains or losses realized on the sale or exchange of financial instruments, impairment charges related to debt securities as well as equity and other investments, interest rates, cash balances and changes in fair value of derivative instruments.
The interest rate swaps effectively convert the variable interest rates (EURIBOR) on the Company's bank loans to a fixed interest rate of 3.705% per annum. The Company initially entered into interest rate swaps with a notional amount of €778.1 million which will be amortized through June 2009. As per March 31, 2009, the notional amount was €379.6 million. As of April 30, 2008 the Company entered into an additional floating to fix interest rate swap. This swap with a fixed rate of 4.41% per annum and a notional amount of €250.0 million had a one year duration until April 30, 2009.
In general, these swaps entitle the Company to receive a payment from the counterparty if the market variable interest rate exceeds the fixed interest rate, and obligate the Company to make a payment to the counterparty if the fixed interest rate exceeds the market variable interest rate. These types of agreements are entered into to effectively convert the interest rates on the Company's long-term liabilities to banks from variable to fix.
27
Table of Contents
In 2003 KDG also purchased interest rate caps with a cap level of 4.2% per annum with a notional amount of €259.4 which will be amortized through June 2009. As per March 31, 2009, the notional amount was €126.5 million. These caps entitle the Company to receive a payment from the counterparty equal to the excess, if any, of the hypothetical interest expense on a specified notional amount at a current market interest rate over an amount specified in the agreement.
Since all of our existing interest rate hedges matured by the end of June 2009 we will closely keep track of ongoing market developments but currently have no concrete plans to purchase new hedging instruments as we regard the interest rate environment as very favorable. Nevertheless we will stay in contact with several potential bank counterparties in order to assure that we can lock-in interest rate hedges quickly whenever we think it becomes favorable. There is no guarantee that we will be able to consummate these hedges under acceptable terms and conditions if at all.
With respect to the Company's 2014 Senior Notes, the Company also entered into a hedge agreement swapping 100% of the US-Dollar denominated principal (US$610 million) and interest payments into Euro denominated principal and interest payments at a fixed rate over five years starting in July 2004 with various banks. The agreed exchange rate is US$1.2066 for each Euro. The weighted average interest rate across all Euro denominated debt until July 2009 considering derivatives currently in place is 10.2046%. From December 2008 until March 2009, we successfully negotiated new swap agreements which effectively prolonged the existing currency hedges by two years until July 2011. By March 31, 2009 100% of the US-Dollar denominated principal and interest payments with respect to the Company's 2014 Senior Notes were swapped into Euro at the same rate of US$1.2066 for each Euro. The new swap agreements run from July 2009 until July 2011 with a weighted average Euro fixed rate of 11.1695%.
The impact of the financial crisis on the various banks with which we entered into a hedge agreement cannot be predicted, but could lead any of them to refuse or be unable to respect their terms and conditions.
ITEM 4. INFORMATION ON THE COMPANY
A. History and Development of the Company
Our legal and commercial name is Kabel Deutschland GmbH and we were incorporated under the laws of Germany on December 17, 2002. We were formed from the combination of cable assets in six of the nine regional cable television regions previously operated by DTAG, together with other network assets owned by DTAG. We are a limited liability company ('GmbH') organized under the laws of the Federal Republic of Germany. Our principal executive offices are located at Betastrasse 6-8, 85774 Unterfoehring, Germany. Our telephone number is +49-89-960-100. We are registered with the commercial register of the local court of Munich under number HRB 145837.
KDVS is a limited partnership and was formed under the laws of Germany on November 4, 2003 (date of entry in the commercial register—partners' resolution already adopted on October 16, 2003). The registered office of KDVS is Betastrasse 6-8, 85774 Unterfoehring, Germany. KDVS is registered with the commercial register of the local court of Munich under number HRA 83902.
We maintain websites atwww.kabeldeutschland.de andwww.kabeldeutschland.com. However, any information provided on our websites does not form part of this annual report and is not incorporated by reference herein.
We are currently operating in 13 of the 16 federal states (with the exception of Hesse, North Rhine-Westphalia and Baden-Wuerttemberg), including Germany's three major cities of Berlin, Hamburg and Munich. KDG primarily provides cable access connections, offers fixed line 'Internet & Phone' services and also mobile internet and web services in cooperation with O2 to its customers. Furthermore, KDG delivers digital television signals through its digital playout center. KDG carries and
28
Table of Contents
offers its own pay-TV packages and PPV ('Pay per view') as well as packages of an unaffiliated German pay television operator, and the free-to-air digital programs offered by the public and private broadcasters.
Over the past three years, we have made significant investments, primarily to upgrade our network, using cash flows of €268.8 million, €316.4 million and €373.0 million, respectively, for the years ended March 31, 2007, 2008 and 2009. These investments have been funded principally from operating cash flows. We expect to fund our capital expenditures to upgrade our network with cash flows from our operating activities, but also with cash on hand and, if necessary, from borrowings under the Revolving Credit Facility, Tranche B. See also ITEM 5B Liquidity and Capital Resources.
| | | | | | | | | | |
| | Fiscal Year Ended March 31, | |
|---|
| | 2009 | | 2008 | | 2007 | |
|---|
| | (€ million)
| |
|---|
Cash Paid for Investments in Intangible Assets | | | (85.3 | ) | | (63.0 | ) | | (63.6 | ) |
Cash Paid for Investments in Property and Equipment | | | (287.7 | ) | | (253.4 | ) | | (205.2 | ) |
| | | | | | | | |
Investments Network and Operational Business | | | (373.0 | ) | | (316.4 | ) | | (268.8 | ) |
| | | | | | | | |
Cash Received from Sale of Investments | | | 13.0 | | | 38.1 | | | 0.0 | |
Cash Paid for Acquisitions | | | (527.8 | ) | | (29.7 | ) | | (5.1 | ) |
Cash Paid for Investments in Financial Assets | | | 0.0 | | | (39.7 | ) | | (6.8 | ) |
| | | | | | | | |
Net Investments Acquisitions and Financial Assets | | | (514.8 | ) | | (31.3 | ) | | (11.9 | ) |
| | | | | | | | |
In addition, in the course of the fiscal year 2008/2009, we also made considerable acquisitions with the strategic aim of increasing our marketable base and becoming the leading triple play company in Germany.
We acquired networks serving approximately 1.1 million cable television subscribers in eight German federal states from the Orion Cable Group ('Orion') as announced on September 20, 2007. The FCO approved the transaction on April 4, 2008. The transaction was closed on April 30, 2008. This acquisition was financed through securing an additional Tranche C under the Senior Credit Facility. Under this transaction we acquired shares of a total of 12 companies. For the following acquired companies, KDG did not have a previous ownership:
- (i)
- 100.00% of shares of Tele Columbus Nord GmbH;
- (ii)
- 100.00% of shares of Kabel Deutschland Sued GmbH;
- (iii)
- 100.00% of shares of Kabel Deutschland West GmbH;
- (iv)
- 100.00% of shares of Kabel Deutschland Nord GmbH;
- (v)
- 100.00% of shares of AEP Plueckhahn Kabel GmbH;
- (vi)
- 70.00% of shares of KMG Kabel-Fernsehen Hannover GmbH;
- (vii)
- 70.00% of shares of Urbana Teleunion Rostock GmbH & Co. KG; and
- (viii)
- 50.00% of shares of Verwaltung Urbana Teleunion Rostock GmbH.
For the following companies, KDG did have minority holdings prior to the acquisition:
- (ix)
- 75.58% of shares of KABELCOM Braunschweig Gesellschaft fuer Breitbandkabel-Kommunikation mbH. Together with our existing minority ownership of 24.00% total interest increased to 99.58%;
29
Table of Contents
- (x)
- 72.49% of shares of KABELCOM Wolfsburg Gesellschaft fuer Breitbandkabel-Kommunikation mbH. Together with our existing minority ownership of 24.00% total interest increased to 96.49%;
- (xi)
- 43.15% of shares of RKS Niedersaechsische Kabel-Servicegesellschaft mbH & Co. KG. Together with our existing ownership of 52.63% total interest increased to 95.78%; and
- (xii)
- 51.20% of shares of RKS Niedersaechsische Kabel-Service-Beteiligungsgesellschaft mbH. Together with our existing minority ownership of 43.80% total interest increased to 95.00%.
On October 23, 2008, the mergers of Kabel Deutschland Sued GmbH, Kabel Deutschland West GmbH, Kabel Deutschland Nord GmbH and Tele Columbus Nord GmbH into Kabel Deutschland Vertrieb und Service GmbH & Co. KG became effective retroactively to May 1, 2008.
In addition, to the shares acquired on April 30/May 1, 2008, the Company acquired on June 30, 2008, the following stakes from Verlagsgesellschaft Madsack GmbH & Co. KG and thereby increased its interest in the respective companies to 100%:
- (i)
- 30.00% of the shares of KMG Kabel-Fernsehen Hannover GmbH;
- (ii)
- 4.22% of the shares of RKS Niedersaechsische Kabel-Servicegesellschaft mbH & Co. KG, and
- (iii)
- 5.00% of the shares of RKS Niedersaechsische Kabel-Service-Beteiligungsgesellschaft mbH.
The net purchase price for all disclosed acquisitions consisted of a cash payment of €527.8 million. However, on May 21, 2009, KDG agreed with Orion, as part of a contractually agreed standard purchase price adjustment process, to reduce the original purchase price by €67.5 million. All outstanding amounts were received until May 2009. As part of the purchase price adjustment process, KDG is in arbitration regarding a further possible reduction of the purchase price, in addition to the original purchase price reduction of €67.5 million, resulting from the allocation of certain central overhead costs.
On April 30, 2008 (Closing Date of the Acquisition), an amount of €535.0 million was drawn down under the Senior Add-on Facility to pay the purchase price. See also ITEM 5B Liquidity and Capital Resources.
As of April 30, 2008 the Company sold and transferred its share in Kabel-Service-Berlin GmbH to Tele Columbus GmbH for total consideration of €13.0 million.
KDG generally also improved its product line-up throughout the year. Accordingly, KDG made the following significant business product announcements:
- •
- on May 7, 2008, the Company announced that it had agreed a new five year contract running until 2012 with pay-TV operator Sky Deutschland. The contract governs the feed-in of the existing Sky Deutschland pay-TV channels over the Company's cable network;
- •
- on June 11, 2008, KDG and the public broadcasters ARD, ZDF as well as Deutschlandradio and ARTE Deutschland TV GmbH ('ARTE') agreed on the extension of KDG's feed in contract until 2012. The signals will be carried in analog and digital quality;
- •
- on July 31, 2008, the Company reported about its successful test of DOCSIS 3.0 in the city of Hamburg.Test customers were able to download files via a 100 Mbit/s connection with speeds of up to 200 Mbit/s;
- •
- on August 4, 2008, KDG announced to feed in thefirst free-to-air HD TV channel in its network, Anixe HD;
- •
- on March 11, 2009, KDG launched its internet and phone products for small businesses (SoHo); and
30
Table of Contents
- •
- on March 30, 2009, KDG upgraded its standard cable internet product to 32 Mbit/s from 20 Mbit/s.
- •
- on May 25, 2009, KDG announced a cooperation with the telecommunications company Telefónica O2 Germany in the mobile sector. The new mobile services "Mobile Phone" and "Mobile Internet" are offered along with the Company's existing video, internet and fixed line phone offerings, without any minimum term of contract, monthly basic fee or minimum revenue. Calls with the "Mobile Phone" offering are free of charge within the entire Kabel Deutschland network. With "Mobile Internet", users can also surf the internet within their daily flat rate while travelling. The new products are available to existing as well as new customers of Kabel Internet & Phone.
From December 2008 until March 2009, we successfully negotiated new swap agreements; which effectively prolonged the existing currency hedges, by two years until July 2011. On March 31, 2009 100% of the US-Dollar denominated principal and interest payments with respect to the Company's 2014 Senior Notes were swapped into Euro at the same rate of US$1.2066 for each Euro. The new swap agreements run from July 2009 until July 2011 with a weighted average Euro fixed rate of 11.1695%.
In April 2008, KDG entered into a new 24-month collective bargaining agreement with the labor union representing its unionized employees. As a result, wages for employees increased by 3.7% from June 1, 2008 and by another 3.3% from April 1, 2009.
On April 30, 2008, the Company entered into an additional floating to fix interest rate swap. This swap with a fixed rate of 4.410% per annum has a notional amount of €250.0 million and one year duration.
As of May 1, 2008, the companies acquired from Orion were consolidated for the first time. The acquisition has been accounted for using the purchase method of accounting.
Since August 2008, the FCO is examining KDG's business policy regarding the use of set top boxes with proprietary functions in connection with KDG's digital platform, alleging that it amounts to an abuse of a dominant market position by KDG. KDG has defended its policy on various legal and technical grounds and the examinations are still pending. A negative outcome could adversely affect KDG's future policy with regard to set top boxes. Based on similar allegations, the FCO has also initiated individual proceedings against the network operators Unitymedia, Kabel Baden-Wuerttemberg and the largest German pay-TV provider Sky Deutschland.
On September 30, 2008, Herbert R. Hribar resigned as Chief Operating Officer (COO), and as of October 1, 2008, Dr. Adrian v. Hammerstein took over responsibility for the Operations Division in addition to his CEO responsibility.
On October 23, 2008, the mergers of Kabel Deutschland Sued GmbH, Kabel Deutschland West GmbH, Kabel Deutschland Nord GmbH and Telecolumbus Nord GmbH into Kabel Deutschland Vertrieb und Service GmbH & Co. KG became effective retroactively to May 1, 2008.
On February 11, 2009, KDG approached the lenders of its Senior Credit Facilities via its facility agent with a request to agree to certain minor amendments to the Company's Senior Credit Facilities. KDG proposed to change the senior net debt to EBITDA covenant for the quarters starting from December 2010 to December 2011 as well as to extend senior net debt to EBITDA and EBITDA to net interest covenants beyond March 2012 until maturity of Term Loan C in March 2013. On February 25, 2009, the deadline ended for the amendment. Approximately 92% were consenting to the request. The amendments were thereby approved.
On March 31, 2009, KDG appointed Erik Adams as Chief Marketing Officer (CMO) to become effective as of April 1, 2009. As a member of the management board he will be responsible for the
31
Table of Contents
Internet and Phone products as well as the marketing activities. At the same time, Dr. Manuel Cubero took over Technical Operations and IT in addition to his responsibilities for the TV product, sales and customer services to become Chief Operating Officer.
On April 30, 2009, KDG entered into an agreement with NDS Group Ltd ('NDS') to develop new digital TV features and entertainment services.
B. Business Overview
Our Business
Kabel Deutschland GmbH ('KDG') was founded on December 17, 2002 with its legal seat registered in Unterfoehring (commercial register Munich HRB 145837). The operating business is predominantly performed by Kabel Deutschland Vertrieb und Services GmbH & Co. KG ('KDVS'), a wholly owned subsidiary of KDG.
As of March 31, 2009, the Company's cable television network passed approximately 15.3 million homes and served approximately 9,013 thousand direct and indirect cable subscribers and 110 thousand solo subscribers (non-cable television access customers subscribing to Internet & Phone services only).
Our Business Segments
As of March 31, 2009, our business was divided into 4 segments, including (i) the cable access business segment, (ii) the TV/Radio segment, (iii) the 'Internet & Phone' segment, and (iv) the 'Telepost Kabel-Service' segment.
Cable Access Business. Cable access contains all activities and services linked to the customer's physical access to the Company's cable network, either directly to end customers or indirectly through commercial Level 4 network operators or housing associations for which the Company charges a fee. Cable access subscribers are segmented into direct customers ('B2C'), indirect customers through housing associations ('B2B') and wholesale customers. The increase in cable access subscribers in the period under review primarily derives from the acquisition of certain assets from Orion.
Cable access is the basis for free and paid services offered by the Company, including TV and radio services.
Our cable access business generates revenues through subscription fees, installation fees and other ancillary fees. Through our cable access business we generated €911.2 million, or approximately 66.5% of our total revenues for the twelve months ended March 31, 2009:
- •
- Cable access subscription fees. Cable access subscription fees paid for the access to our network and the delivery of analog and digital signals are generated from individuals, businesses and housing associations. Our cable access offering consists of between 32 and 41 analog television channels (depending on the region served) and up to 36 analog radio channels. In April 2006, the Company discontinued the analog access product offering for new single family homes and, ever since, solely offers a digital access product instead, which includes digital TV signals. The basic digital service is offered under the brand name of 'Digitaler Kabelanschluss' and provides access to the digital programs offered by the public broadcasters and most of the commercial broadcasters in Germany, totaling up to 104 free-to-air digital channels. The product also includes a smartcard and a set top box and access to a pay per view service comprising content from 'Hollywood Studios' within the pay-per-view ('PPV') licensing window under the brand 'Select Kino', as well as adult content under the brand 'redXclub'. Monthly subscription rates depend on payment terms and, in the B2B segment, on the number of subscribers connected at a single network connection point. Single family homes currently pay €16.90 per month. One-time fees of €49.90 and €9.90 are typically charged for the activation and handling of
32
Table of Contents
TV/Radio. In addition to the cable access business described above, the Company offers its own digital pay-TV packages. The Company's pay-TV packages are branded as 'Kabel Digital Home' and 'Kabel Digital International'. Kabel Digital Home offers 43 pay-TV channels within seven genres (documentaries, movies and series, sports, entertainment, kids, music and erotic). The product portfolio Kabel Digital International comprises 42 foreign language pay-TV channels grouped in nine language-specific packages. The Company sells its pay-TV packages directly to consumers and, to a lesser extent, indirectly through certain Level 4 network operators. The number of digital pay-TV subscribers increased slightly in the period under review.
In 2006 pay-per-view ('PPV') services were introduced. They are marketed under the names 'Select Kino' and 'redXclub'.
The Company also delivers the pay-TV packages of an unaffiliated pay-TV operator. We also sell our digital pay packages to an unaffiliated regional cable television operator. Under these wholesale agreements the operator typically receives a discount to our listed retail subscription fee.
Our TV/Radio business generates revenue through subscription fees, sales of customer premises equipment ('CPE') and carriage fees. Through our TV/Radio business we generated €192.3 million, or approximately 14.0% of our total revenues for the twelve months ended March 31, 2009.
- •
- Pay-TV subscription fees, on-demand fees and CPE sales. Homes connected to our network and having a CPE installed can receive the digital programming of the public broadcasters and the major private broadcasters free of charge if they are digital cable access subscribers and have an activated smartcard. Pay-TV subscription fees include revenues from our pay-TV packages 'Kabel Digital International', 'Kabel Digital Home' and pay-per-view-services 'Select Kino' and 'redXclub'. In addition, customers can subscribe to the Company's Digital Video Recorder (DVR) product, Kabel Digital+, which contains an enhanced digital receiver with an integrated hard disc drive and a more sophisticated EPG.
- •
- Digital carriage fees. Digital carriage fees are derived from the transmission of digital television programs of third party program providers, such as the public broadcasters, private free-to-air broadcasters and the programs transmitted by an unaffiliated pay-TV operator in Germany. Typically fees are based on the number of homes into which the Company delivers the signal; and
- •
- Analog carriage fees. In addition to providing basic cable access services to its subscribers, the Company charges more than 250 national, regional and local television broadcasters carriage fees for delivering their television signals over the Company's network. These carriage fees are typically based on the number of homes into which the signal is delivered. The Company also charges carriage fees for radio signals delivered over the network into subscriber homes.
Internet & Phone. The Company offers 'Internet & Phone' services on a monthly subscription basis to those homes which are passed by its upgraded bi-directional network (630 MHz or more) and where the Company has or can have a direct relationship with the customer, or where the Level 4 network operators or housing association allow us to either directly or indirectly provide our services
33
Table of Contents
('Marketable Homes'). Phone customers are also charged certain variable fees based on usage. Internet and phone products may be subscribed to even without subscribing to CATV services. As of March 31, 2009, the Company passed approximately 12.0 million homes with upgraded network for increased capacity plus return path to enable a two-way communication. The company offers stand-alone internet and stand-alone phone products, however most customers subscribe to bundled offerings of 'Internet & Phone' together. As of March 31, 2009, the Company served approximately 806 thousand subscribers, which amounts to approximately 707 thousand internet and 710 thousand phone RGUs.
Through our Internet & Phone business we generated €231.9 million, or approximately 16.9% of our total revenues for the twelve months ended March 31, 2009.
On May 25, 2009, KDG announced the cooperation with the telecommunications company Telefónica O2 Germany in the mobil sector. The new mobile services 'Mobile Phone' and 'Mobile Internet' are offered along with the Company's existing video, internet and fixed phone line offerings. The new products are available to existing as well as new customers of KDG's 'Internet & Phone'.
TKS—Telepost Kabel-Service Kaiserslautern GmbH & Co. KG. TKS, a wholly owned subsidiary of KDVS, provides cable access, 'Internet & Phone' services to the NATO military personnel based in Germany. It also provides billing services for telephone customers of DTAG who prefer English language bills and customer service for Eutelsat Pay-TV customers of KDG.
Revenue and Revenue Breakdown
We generate revenues through (i) subscription fees from our cable access business, our pay-TV and PPV business, our broadband 'Internet & Phone' business and from other activities and (ii) distribution fees from the Free-TV-channels.
Monthly subscription rates paid by our cable access customers depend on the underlying contractual relationship and the agreed service levels. The customer base of the access business is split into three segments: (i) B2C customers, (ii) B2B customers, typically housing associations, which pass on the signals to their tenants as part of the ancillary costs of a flat, and (iii) so called Level 4 network operators (wholesale business) that typically own in-house wiring in multi dwelling units and predominantly sell on our signals to housing associations. In our B2B and wholesale business the cable access subscription rates primarily depend on the number of subscribers connected at a network connection point, typically the basement of a multi-dwelling unit. In general, single family direct customers pay a higher monthly subscription fee on a per subscriber basis than households connected via a B2B contract.
We also charge installation fees related to the connection of subscribers to the network. In addition to providing basic cable television services to its subscribers, the Company charges television broadcasters carriage fees for delivering their television signals over the Company's network. These carriage fees are typically based on the number of homes into which the signal is delivered. The Company also delivers and charges carriage fees for radio signals delivered over the network into subscriber homes.
The following table sets forth our revenues per business segment for the fiscal years ended March 31, 2005, 2006, 2007, 2008 and 2009:
| | | | | | | | | | | | | | | | | | | | | | | | | | | | | | | |
| | Fiscal Year Ended March 31, | |
|---|
| | 2009 | | 2008 | | 2007 | | 2006 | | 2005 | |
|---|
| | (€ millions, except percentages)
| |
|---|
Cable Access revenues | | | 911.2 | | | 66.5 | % | | 867.1 | | | 72.4 | % | | 845.6 | | | 77.4 | % | | 839.3 | | | 82.9 | % | | 850.1 | | | 84.7 | % |
TV/Radio revenues | | | 192.3 | | | 14.0 | % | | 179.8 | | | 15.0 | % | | 163.0 | | | 14.8 | % | | 137.8 | | | 13.5 | % | | 126.4 | | | 12.6 | % |
Internet & Phone revenues | | | 231.9 | | | 16.9 | % | | 121.4 | | | 10.2 | % | | 56.5 | | | 5.2 | % | | 9.8 | | | 1.0 | % | | 2.8 | | | 0.3 | % |
TKS revenues | | | 34.9 | | | 2.6 | % | | 28.6 | | | 2.4 | % | | 28.1 | | | 2.6 | % | | 25.2 | | | 2.6 | % | | 23.9 | | | 2.4 | % |
| | | | | | | | | | | | | | | | | | | | | | |
Total Revenues | | | 1,370.3 | | | 100.0 | % | | 1,196.9 | | | 100.0 | % | | 1,093.2 | | | 100.0 | % | | 1,012.1 | | | 100.0 | % | | 1,003.2 | | | 100.0 | % |
| | | | | | | | | | | | | | | | | | | | | | |
34
Table of Contents
Seasonality
Certain aspects of our business are subject to seasonal factors. For example, television usage, and the levels of new subscriptions for television services, is typically lower during the summer months. Our customer churn rates include persons who disconnect service due to moving, resulting in a seasonal increase in our churn rates during the summer months when higher levels of moves occur.
In addition, we have a disproportionately high level of annual prepayments in our cable access business in the months between November and February, which results in higher cash flow from operations in these months of the year.
Raw Materials
Due to the nature of our business, raw materials and the sources and availability of raw materials, hence the price volatility of commodities etc., is not relevant.
Our Markets
As the leading cable company in Germany, KDG operates in two converging markets in Germany: the Cable TV and the Telecommunications Market.
Cable TV Market
The German television market is the largest in Europe with about 35 million television homes (according to AGF/GfK, January 2009). Cable is the leading television signal distribution platform in Germany, with approximately 18 million, or 51.3%, of television homes watching cable TV, followed by satellite (approximately 15.4 million, or 44.1% of television homes) and digital terrestrial reception via antenna (approximately 1.6 million, or 4.6% of television homes). TV distribution via internet (IPTV) was only recently introduced in Germany with DTAG having reported 0.6 million subscribers as of March 31, 2009.
Across these distribution platforms 53% of all television-homes receive digital programming. Analog terrestrial television has been completely replaced by DTT, which can be received by more than 90% of all TV households via antenna (July 2008). Digital penetration for satellite at 69% is significantly higher than for cable at 31%. This is due to the fact that the sale of analog satellite equipment had been stopped several years ago, whereas analog cable TV is still perceived as a convenient and attractive plug-and-play product since no set-top box and no second remote control is required. However, KDG's TV network is almost fully digitized and digital TV programming is broadcasted in parallel to analog signals. Thus, customers decide whether they prefer to watch digital or analog TV via cable.
The least comprehensive program offering is provided by DTT with 24 to 31 channels, depending on the area where the viewer is located. In contrast, cable television typically offers 33 to 45 analog and more than 200 digital free and pay-TV channels. The highest number of channels can typically be received by satellite viewers via Astra, with up to 43 analog and more than 300 digital channels for the German market. Both satellite and cable subscribers have access to the programming of smaller regional and local broadcasters as well as to a broad range of foreign language free and pay-TV channels.
For historic reasons, the German TV market developed a structure of regional and local cable distribution networks (so called Level 3 network operators) and the in-house cable network (so called Level 4 network operators). DTAG constructed Level 3 networks and, to a limited extent, also Level 4 in-house networks. These former DTAG networks are now owned by the three integrated regional cable companies—KDG, Unitymedia and KabelBW—each of them operating in separate regions. KDG
35
Table of Contents
provides its services in 13 out of 16 German states including the three biggest cities Berlin, Hamburg and Munich.
In recent years industry consolidation of Level 4 network operators has accelerated. This consolidation process is driven by growing demand for telecom services (broadband, telephony), which requires cable operators to gain scale and network density. As a consequence, two major Level 4 players have emerged, the Orion group (including Primacom) and the Pepcom Group. Next to the two major Level 4 players, a number of smaller operators continue to exist.
Free television broadcasters, media services and third party pay-TV operators such as Sky Deutschland buy capacity for the terrestrial transmission of their programming and for transmission via satellite. Similarly, they pay carriage fees to Level 3 cable network operators and, to some extent, also to Level 4 cable network operators for the distribution of their programming on cable networks. KDG receives carriage fees for delivering digital as well as analog TV and radio programming.
In addition to carriage fees, cable network operators derive most of their revenues from subscription fees, either directly or indirectly, from households receiving their television signals from cable. We offer our services directly to consumers or via landlords and housing associations. We also offer our services indirectly through Level 4 network operators. Subscription fees per subscriber are generally higher for single family homes and small apartment blocks as compared to fees from Level 4 network operators or large housing associations, both of which aggregate large numbers of buildings and subscribers behind individual connection points. Of our approximately 9.0 million cable access subscribers as of March 31, 2009, approximately 3.0 million have a direct contractual relationship with us (B2C segment), the remainder being tenants or landlords and housing associations (B2B segment, approximately 4.4 million). We serve approximately 1.6 million subscribers via Level 4 network operators (wholesale segment).
To our digital subscribers we also provide basic pay-TV and PPV services. Sky Deutschland, the incumbent pay-TV operator, is focused on the premium segment (movies and sport). As of March 31, 2009, we served approximately 849 thousand pay-TV RGUs and offered program packages under the brand names 'Kabel Digital Home' and 'Kabel Digital International'.
As a recent development new competition arises in the cable TV market from regional and local utility companies and city carriers such as MNet, wilhelm.tel, EWE-Tel or Versatel that continuously expand and upgrade their local infrastructure. In addition IPTV, particularly marketed by DTAG, emerges as a competing delivery platform for TV signals.
Telecommunications Market
Since 2005 KDG has actively upgraded its network in order to be able to provide telecommunications services. Meanwhile 12.0 million households or 78.5% of homes have been upgraded. As of March 31, 2009, we served approximately 710 thousand telephony RGUs ('Kabel Phone') and 707 thousand internet RGUs ('Kabel Internet') of which more than 70% have access lines with more than 20 Mbit/s.
Germany is the largest broadband market in Europe. Access lines with speeds higher than 1 Mbit/s are generally classified as broadband. These include all fixed-line technologies such as DSL, VDSL, fiber-to-the-building (FTTB), fiber-to-the-home (FTTH) and internet access via cable.
Due to rapid growth over recent years, broadband penetration in German households has been catching up and increased to around 58.7% in December 2008. After massive network upgrades cable operators are now playing a major role in the German broadband market. According to statistics published by the Bundesnetzagentur, cable operators are able to provide broadband internet and telephony to some 23 million households (almost 70%). At the end of 2008, cable accounted for 1.6 million (2007: 1.0 million) or 7% out of 22.6 million broadband customers and was by far the
36
Table of Contents
largest and fastest growing alternative access platform, continuing to gain market share from DSL segment (20.9 million customers or 92%).
For years to come cable will be the only alternative broadband infrastructure to DSL/VDSL with an extensive coverage. In contrast coverage of fiber-to-the-home technology will most likely be constrained to a few hot spot markets due to high build-out costs. Furthermore cable is a natural high-speed network providing 32 Mbit/s at this stage (twice the speed of DSL) and can be increased to 100 Mbit/s or even more with the introduction of the new cable standard DOCSIS 3.0. VDSL delivers speeds up to 50 Mbit/s and has relative low network coverage. As a consequence cable should play an important role in the broadband strategy, proclaimed by the German federal government, aiming for 75% of all households to have access to 50 Mbit/s lines by 2014.
The market for fixed-line residential telephony is well established in Germany and is the largest in Europe. DTAG clearly dominates the market. However, as a result of deregulation, the market share of DTAG has been decreasing both in terms of fixed-line telephone channels and minutes sold since 1998. Furthermore, the introduction of VoIP services further opens up this market to allow internet service providers to offer telephony in conjunction with broadband internet services. At the end of 2008, cable operators accounted for 1.5 million (2007: 0.8 million) out of 39.1 million fixed line access customers, according to statistics provided by the Bundesnetzagentur.
Since May 2009, KDG also offers mobile telephony and data services to its customers via its cooperation with Telefonica O2 Germany. According to the Bundesnetzagentur, the number of mobile subscribers had increased to 107.2 million by end of 2008, which translates into a penetration rate of 130.6%. Market leader is DTAG's T-Mobile with a share of 36.5%, closely followed by Vodafone (33.7%) and with some distance by the two smaller operators E-Plus (16.6%) and O2 Germany (13.2%).
The German Cable Network
The structure of the German cable network is strongly influenced by historical factors, in particular the previous monopoly of DTAG and its predecessors on telecommunication services until 1996 and the manner in which the subsequent deregulation of the telecommunications market was implemented. As a result, the cable network in Germany can be divided into four functional levels, ranging from the content generation (broadcasters) to the distribution of the signal to the end customer.
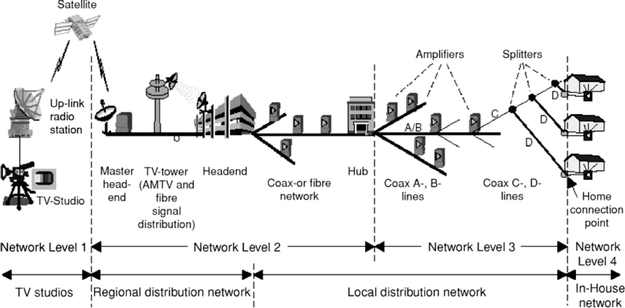
37
Table of Contents
Level 1 encompasses the production of content, the transmission of the signal to the satellite Earth station or a terrestrial transmitter, and the up-link to the satellite.
Level 2 is the part of the cable television network comprising (i) the down-link from the satellite or the terrestrial transmitter, (ii) the satellite or terrestrial reception equipment, (iii) the signal distribution from the reception equipment to the master-head ends and the hubs, (iv) the master-head end and head end functions and (v) the distribution of the signals from the head ends to the hubs.
Level 3 is the part of the cable television network which distributes the signal primarily via coaxial cable from Level 2 to the home connection points.
Level 4 is the part of the cable network which distributes the signal from the Level 3 connection point to the wall socket inside the home. Level 4 infrastructure primarily consists of the in-house coaxial wiring.
The vast majority of the Level 2 and Level 3 cable television network was constructed by DTAG's predecessor between 1980 and 1988. Another wave of construction activity followed after the reunification of Germany in 1990. Due to political decisions of the German federal government, electricians, housing associations and Level 4 network operators initially constructed the majority of the Level 4 network infrastructure. This decision resulted in the development of a dual ownership network structure serving cable subscribers. This dual ownership structure is distinct from the single ownership cable structure prevalent in the United States and in most EU countries, in which private operators own the network entirely from the head end to the wall socket inside the home.
Most of the network infrastructure from Level 2 to Level 4 was originally constructed as one-way coaxial cable with a bandwidth of 470 MHz. Within this bandwidth in our network, the standard allocation was 32 channels for analog and 20 channels for digital television services. As a result of digital compression technologies, each digital channel can carry up to 12 program streams (64 QAMQuadrature Amplitude Modulation) or up to 16 program streams (256 QAM), resulting in approximately 200 potential program streams. Technically, it is possible to convert every analog channel into a digital channel by using specific digital head end equipment for such channels. In addition, this network infrastructure can be upgraded to permit the transmission of bi-directional 630 MHz signals, thereby allowing internet and phone products to be distributed via the network.
Since DTAG's predecessors initially constructed both the fixed-line telephony networks and the cable television network, the telephony and cable television networks share a high degree of common infrastructure, in particular cable ducts, co-location facilities, towers and fiber optic systems. Today, this infrastructure is owned by DTAG and we are permitted to use it under long-term lease agreements. In addition, we purchase electrical power from DTAG. The relevant agreements with DTAG are an essential component of our operations and historically have accounted for our single largest expense item each year. See the following section 'Our Network'.
Our Network
In total, our network extends over more than 262,000 kilometers throughout the regions in which we currently operate and it passes approximately 15.3 million households. DTAG and its predecessors constructed both the cable television and fixed-line telephony networks, and certain parts of the infrastructure (including cable ducts, towers, fiber optic transmission systems and equipment locations) are shared by both the DTAG telephony service and our cable television businesses. We lease these assets from DTAG under the SLAs. For a description of the SLAs, see ITEM 10 C. Material Contracts. We rely on DTAG and certain of its affiliates for a significant part of our network.
Our standard analog cable television network was originally constructed using tree architecture to deliver 470 MHz one-way signals. Within this bandwidth in our network the standard allocation uses 32 * 8 MHz slots for analog and 20 * 8 MHz slots for digital television services. We started to upgrade
38
Table of Contents
our current compression technology to a higher and enhanced modulation technology (QAM 256) in September 2006. It allows us to assign up to 16 digital television program streams to one digital 8 MHz slot. We started to convert analog channels into digital channels by upgrading our head end equipment to feed such channels. In these head ends one digital channel is assigned for HD-TV distribution.
Our standard network is served by approximately 50 master head ends that receive analog television broadcast signals from satellite, terrestrial or in some cases direct feeds from program providers or broadcasters. The incoming signals are processed, assigned to channel positions and amplified for distribution. These approximately 50 master head ends transmit the signals to approximately 370 supply areas, primarily via fiber optic transmission. We also have approximately 1,600 local head ends (including Level 4 head ends) that receive signals or direct feeds from program providers or broadcasters for distribution independently of a master head end. Most of these local head ends were part of CATV assets acquired from Orion in May 2008 and will become redundant as homes are re-connected to KDG's network. A total of approximately 330 head ends (master and local head ends) also receive digital signals via satellite from our digital playout center for distribution through the cable television network. Head ends acquired in recent M&A transactions are often located in customer's buildings, e.g. on top of the roof of a housing association while the vast majority of original KDG head ends (master and local head ends) are located in facilities owned by DTAG. We lease these facilities from DTAG under the SLAs. The received signals at the head ends are nowadays distributed primarily by fiber to approximately 1,900 hubs. In cases we use the coaxial cable, it is owned by the Company. Most of the fiber optic network is leased from DTAG under the SLAs and other agreements. The hubs are pure distribution points where no content is added.
Approximately 80% of homes are in upgraded networks, where we provide Internet and Phone services. For these services we have installed more than 200 cable-PoP with CMTS, router and other equipment. Roughly 50% of the PoPs are placed in the same location as the TV-head-end.
From the hubs, A-lines (primarily extension lines) extend through public right of ways (oeffentlich-rechtliche Wegerechte) to approximately 2.2 million splitters. Extension lines and drops then extend from the splitters to connection points. In total there are approximately 4.3 million connection points available on the network. In the case of multi-unit dwellings the connection point may be located in the basement of the building and serve several individual units depending on the size of the building. At the connection point, our own Level 4 network, housing associations or other Level 4 network operators connect to our network. All third parties connecting to the network are required to meet our technical standards.
In general, the network is comprised of coaxial cables that are either buried in the ground or housed in cable ducts. The ducts are typically owned by DTAG and we lease duct space for our network under the SLAs. The distribution plant is powered by approximately 134,700 amplifiers. With the exception of the duct and fiber, we operate all of the distribution plant and associated electronics ourselves. We purchase the electrical power required to operate the master head ends, local head ends and amplifiers through DTAG under the SLAs. Purchasing the power from DTAG is necessary because, in many cases, the same power source supplies DTAG's telephone plant and our cable plant. In general, DTAG sells the power to us at cost plus a margin of approximately 5%. We believe that we would not be able to purchase power on better terms from another source because we benefit from DTAG's buying power.
Since our formation we have upgraded additional portions of our Level 3 network based on a technology allowing us to transmit bi-directional 630 MHz-signals which enables us to deliver internet and phone services. This technology does not require fundamental changes to our network structure. To upgrade our Level 3 network we only need to replace the active components of the amplifiers and the hubs and install additional head end equipment to monitor and deliver internet traffic. In addition, internet and phone services typically also require an upgrade of the Level 4 in-house networks.
39
Table of Contents
Presently, the upgraded portion of our Level 3 network passes approximately 12.0 million homes. The upgrade of the network Level 3 has been largely completed with only limited upgrade projects to be completed in the future.
Moreover, we are segmenting our Level 3 network step by step. We build or lease fiber in order to penetrate the Hybrid fiber-coax ('HFC') network and reduce the number of Level 3 homes served by a single Level 3 line and thus reducing the size of the 'cluster'. This segmentation upgrade is driven by customer growth. In some supply areas we use the spectrum of 862 MHz already and we plan to use the spectrum of 862 MHz in the following years through the further segmentation of the Level 3 network.
Our Strengths
Full ownership of high speed network
Size, reach and density of the German cable network are unique for a large European country. Our access network covers over 70% of homes in 13 federal states. It passes 15.3 million homes of which 12.0 million or 78.5% have already been upgraded with a return path for telecom services (Internet & Phone). The network is almost fully digitized, has deep fiber potential (ducts access) and is under our full ownership and control. It comprises 50 master head ends, 1,770 local head ends, 134,700 amplifiers—of which 98,500 have been exchanged to two-way-communication—and 262,000 kilometers of cable lines. Cable is the only broadly available fixed line infrastructure in Germany apart from DTAG's network with the physical "last mile" to the customer. Our standard network configuration uses a bandwidth of 630 MHz for parallel delivery of between 32 and 41 analog TV channels, more than 250 digital TV channels, a variety of analog and digital radio programs, broadband internet with up to 32 Mbit/s downstream and telephony services. Furthermore we have ample additional capacity that can be exploited by using the spectrum above 630 MHz up to 862 MHz and by application of more efficient modulation techniques.
Large customer base
End of March 2009 we had 9.0 million basic CATV subscribers—almost 60% of homes passed. These can be split into 3.0 million customers with a direct contractual relationship (B2C segment), 4.4 million subscribers serviced by landlords and housing associations (B2B segment) and 1.6 million customers serviced by Level 4 network operators (wholesale segment).
This large customer base, characterized by a high degree of customer satisfaction and low churn rates, provides us with significant up-selling potential. End of March 2009 we had 1.9 million digital TV RGUs, thereof 1.1 million digital access RGUs (Free TV), 0.8 million pay-TV RGUs ("Kabel Digital Home" and "Kabel Digital International") and 0.1 million Personal Video Recorder service RGUs ("Kabel Digital +" introduced in 2008). After rapid growth for the last three years KDG now has 1.4 million internet and phone RGUs that will continue to increase at above average rates.
As a consequence the ratio of RGUs per cable access subscriber increased to 1.27 from 1.19 a year ago. In March 2005 this ratio was only 1.02.
In the last years we have established "Kabel Deutschland" as a strong and well-received brand for cable TV, phone and internet services in Germany. Especially in the telecommunications area our brand stands for a sustained leadership in price and performance.
Experienced organization and efficient operations
KDG has a very experienced team of management, advisors and shareholders. Over the past five years this team has established a highly effective organization with efficient structures in marketing and sales as well as customer and network operations. Moreover KDG is complemented by a network of business partners that support KDG's market approach and operations.
40
Table of Contents
Management team. Our management team and their advisors have significant experience in the cable, television and telecommunications industries in Germany.
Dr. Adrian v. Hammerstein was appointed Chief Executive Officer of Kabel Deutschland in May 2007. Before that, Dr. v. Hammerstein was Chief Executive Officer at Siemens Business Services. Prior to that, he had been Chief Executive Officer of Fujitsu Siemens Computers.
The Chief Financial Officer of KDG, Paul Thomason, was part of the team that bought KDG from DTAG in 2003. Previously he was CEO and CFO of Primacom and, prior to that, CFO of KabelMedia, a predecessor of Primacom.
The Chief Operating Officer, Dr. Manuel Cubero del Castillo-Olivares, has been a member of the Management Board since 2005. He is responsible for Cable Television, Sales, Customer Care, Technical Operations and IT. Before he joined KDG in 2003, he worked for Kirch Media Group in various management positions.
In April 2009, Erik Adams was appointed Chief Marketing Officer responsible for marketing and the 'Internet & Phone' business. Before he joined KDG in 2007 he was responsible for marketing and B2C-Sales at Cablecom in Switzerland.
In 2005, Tony Ball joined the Company as Chairman of our Advisory Board. Mr. Ball was formerly CEO of BSkyB, the largest pay-TV operator in the United Kingdom and recently joined the board of non-executive directors of British Telecom.
Our principal owners are funds affiliated with or advised or managed by Providence. Providence is focused on media and telecommunications investments with significant experience in European cable.
Operations. Over the past years KDG has established a broad spectrum of efficient, volume generating sales channels comprising online sales channels, direct marketing sales channels, retail sales channels and door-to-door sales channels. Our sales, marketing and product management team totals 500 full-time employees and has a proven track record to capture market share against cable TV and DSL competition. More than 650 full-time employees and 750 temporary employees work for our call centers to provide customer care and technical support services that aim at high levels of customer satisfaction and low churn rates. In addition, we have built a technical operations team with about 600 full-time employees that is focused on network planning and maintenance, but also manages and coordinates the external installation partners.
Partner Network. In addition, KDG has built a comprehensive partner network to support its business. On the sales side we have 700 active door-to-door agents targeting B2C customers and 150 active sales agents targeting B2B clients. Furthermore we run 60 exclusive KDG shops and have a presence in 1,500 other retail outlets. We have created a scalable and efficient base of co-operation partners with dedicated installation companies, enabling more than 2,000 internet and phone installations as well as Level 4 upgrades (in-house networks) of approximately 1,000 homes per working day.
KDG has also established long standing and well established relationships with housing associations as well as with the commercial and public broadcasters.
Our Strategies
We aim to leverage our high quality infrastructure and our large customer base to grow the business with new services. At the same time we are focused to continuously improve the efficiency of our organization.
41
Table of Contents
The key components of our strategy are as follows:
Fully exploit network advantages
Extensive reach and superior technology of our cable infrastructure combined with the size of our customer base result in competitive advantages over other Level 4 and telecom operators in converging TV signal delivery and telecommunications markets.
Cable has been designed and built for high bandwidth communication. Currently cable can provide 32 Mbit/s access lines to about 60% of the German households whereas VDSL only covers 21%. Going beyond their current reach fixed-line telecom operators have to bear massive upfront investments before being able to market VDSL speeds to their customers. In contrast we can upgrade our cable network on an incremental basis in line with our business development so that required investments will be covered by operating cash flows. With the roll-out of DOCSIS 3.0 cable technology has the ability to deliver access lines with more than 100 Mbit/s—twice the speed of standard VDSL offers. As a consequence we should be able to maintain our current price/performance leadership position for the foreseeable future. This will help us to continuously grow our share in the broadband and telecommunications market.
The extensive coverage of our network, our strong relationships and long-term contracts with housing associations and our ability to offer triple play services at attractive prices will continue to strengthen our position as leading cable operator.
Going forward KDG will focus to fully exploit these advantages of the cable network to generate profits and cash flows.
Sell new services to our customer base
We will continue to grow our business by introducing new, competitive and innovative services. This will allow us to attract new subscriptions and to increase average revenues per subscriber due to cross-selling, up-selling and bundling activities. Furthermore this will support our efforts to keep churn rates low.
Since the launch of our pay-TV products, such as Kabel Digital Home, we have continued to add new channels to improve customer experience. In addition to our pay-TV packages we have rolled out a Personal Video Recorder service (Kabel Digital+). On the free TV side we constantly optimize the digital channel line-up to enhance the quality and quantity of our services. Going forward we intend to introduce interactive TV features with video-on-demand and attractive High Definition (HD) programming.
We will also continue to grow 'Internet & Phone' subscriptions in our customer base. In May 2009 we introduced KDG branded mobile telephony and data services in cooperation with Telefonica O2 Germany. This allows us to offer and market the full range of telecommunications services to our subscribers.
Continuously improve operational excellence
In order to further increase customer satisfaction and to keep churn rates on attractive levels we have enhanced our customer care efforts and capacities over recent years. We have established ongoing programs to increase the availability and service of our call centers, thereby improving performance on our service hotline and reaction time with respect to network outages. We aim at 80% of all inbound calls being taken after a maximum of 20 seconds and are going to introduce toll free numbers for all of our technical service centers. Thus we will continue to improve the customer experience while emphasizing efficiency and reliability.
42
Table of Contents
We continuously control and evaluate the effectiveness of our different sales channels and marketing efforts i.e. by tracking developments in net adds and costs per order. Furthermore we consecutively screen our organization for potential efficiency gains. As an example we successfully implemented substantial and ongoing restructuring projects within the Technical Operations department leading to considerable cost savings and increased flexibility due to co-operation with dedicated external installation partners. Tight cost controls especially in overhead shall ensure that we fully exploit economies of scale imminent to our business.
The following table gives an indication of the economies of scale and improving operations. For the last two financial years revenues per RGU have been growing at much higher rates than operating expenses per RGU. Hence our EBITDA margin increased from 35% in March 2007 to 41% in March 2009.
| | | | | | | | | | | | | |
| | As of March 31, | |
| |
|---|
| | CAGR 07-09 | |
|---|
| | 2009 | | 2008 | | 2007 | |
|---|
| | (€, except percentages)
| |
| |
|---|
Revenues per RGU | | | 125 | | | 114 | | | 107 | | | 8,4 | % |
OPEX per RGU | | | 74 | | | 71 | | | 69 | | | 3,2 | % |
EBITDA per RGU | | | 51 | | | 44 | | | 37 | | | 17,5 | % |
EBITDA margin | | | 41 | % | | 38 | % | | 35 | % | | | |
If opportunities arise we will continue to participate in the consolidation of Level 4 networks within our footprint pursuing a disciplined M&A approach. Strategically Level 4 acquisitions and consolidation contributes to our growth strategy in broadband and phone. Bringing us one step closer to the customer acquisition will increase our ability to attract subscribers and improve our margin as intermediaries disappear.
Over the past years we have established a proven track record in M&A transactions as we closed numerous smaller deals as well as one larger transaction in 2008. In this transaction we acquired several entities from Orion with a total of 1.1 million subscribers. The integration of these assets in 2008 and 2009 has been successful and is almost completed.
Material Contracts
We have entered into various long-term Service Level Agreements ('SLAs') with DTAG and certain of its affiliates that are significant to our business. The various services offered by DTAG are defined under so-called 'Term Sheets' that are part of the SLAs. For a complete list of material contracts see ITEM 10C 'Material Contracts'.
The Risk Management System for KDG
The risk management system is an integral component of all processes within our organization. It is designed to ensure that risks can be identified early and can be actively controlled by management.
KDG's risk environment can change quickly and unexpectedly as a result of various factors. It is therefore necessary to be able to react quickly so that no situation can cause substantial damage to the assets, financial position or earnings of KDG. An early warning system has therefore been put in place.
In general, the operating units are responsible for the identification and the taking of risks. Therefore, all managers of KDG perform an additional task as risk managers. The system is supported by the central risk management unit, which carries out risk controlling.
The central risk management unit has process responsibility and produces the quarterly reports for the Management Board, which enables a detailed assessment and guarantees full transparency of any risk situation. In addition to the regular standard reporting, immediate reporting is put in place if the
43
Table of Contents
early warning system shows a certain risk measure to exceed a critical value or if special circumstances demand investigations. Furthermore, the central risk management unit is responsible for the continuous development of the risk management system and for setting organization-wide standards. Risks which overlap departments are also monitored at the central risk management unit.
Regulation
German law and regulation draws a distinction between telecommunications and media laws. Telecommunications law applies to the establishment and operation of technical infrastructures for communication. Media laws apply to the content of such communication. Additionally, KDG is also subject to antitrust regulation, zoning laws and certain environmental laws and regulations.
Telecommunications Regulation
Telecommunications services and the operation of telecommunications networks are subject to the regulatory regime of the telecommunications act (Telekommunikationsgesetz) of June 22, 2004 (the 'Telecommunications Act') and certain regulations under the Telecommunications Act. These regulations contain further provisions in respect of, and in addition to, certain sections of the Telecommunications Act. The Telecommunications Act implements the European Regulatory Framework for Electronic Communications Networks and Services (the Framework) that consists of, amongst other things, the Framework Directive (2002/21/EC), the Authorization Directive (2002/20/EC), the Access Directive (2002/19/EC), the Universal Service Directive (2002/22/EC), and the Directive on Privacy and Electronic Communications (2002/58/EC). The Framework with its various directives is currently under revision. Changes will most likely not become effective before 2009 or even later. It is further expected that the member states will from then on have two years to transform such changes into their national law.
The Telecommunications Act contains provisions regarding, among other things, (i) the establishment and powers of a regulatory body; (ii) notification requirements; (iii) the granting of rights of way; (iv) the allocation of frequencies; (v) access obligations; (vi) the regulation of fees for the provision of telecommunications services; and (vii) abusive behavior. In principle, regulation of access and fees applies to providers which have significant market power in the respective market. However, under certain preconditions, the FNA may impose certain obligations on operators with control over end-user access even if those operators do not have significant market power.
Important aspects concerning the regulation of access and fees for broadcasting and cable television markets are determined by a market definition and market analysis procedure which is conducted by the FNA. The outcome of this market analysis must be in line with the Framework Directive (2002/21/EC) and further directives of the Framework. In particular, national regulators must take into account the European Commission Recommendation (2003/311/EC) of May 8, 2003 (the Recommendation) on relevant product and service markets within the electronic communications sector. The recommendation presumes only one relevant market for the broadcasting sector:Broadcasting transmission services to deliver broadcast content to end-users on the wholesale level (Market 18 of the Recommendation). In Germany, (i) the TV signal feed-in market and (ii) the market for TV signal delivery to other operators are associated to this market pursuant to a final market analysis published by the FNA in October 2006. Nevertheless the FNA is entitled to define further markets for regulation even though they are not listed in the Recommendation. At the end of 2007, the European Commission has revised the Recommendation and has removed, inter alia, Market 18 from the list of markets warranting special observation. This should have consequences on the current periodical market analysis performed by the FNA.
Pursuant to the current final market definition and market analysis published by the FNA in October 2006 and a regulatory ordinance published in April 2007, KDG, together with Kabel BW,
44
Table of Contents
Unitymedia and T-Systems, were found to have SMP (i) in the TV signal feed-in market and (ii) the market for TV signal delivery to other operators.
In addition, the Act on Radio Equipment and Telecommunications Terminal Equipment (Gesetz ueber Funkanlagen und Telekommunikationsendeinrichtungen) of January 31, 2001, as amended, and the Act on Electromagnetic Compatibility of Equipment (Gesetz ueber elektromagnetische Vertraeglichkeit von Geraeten) of September 18, 1998, as amended, contain provisions applicable to the operation of telecommunications networks and equipment. In particular, telecommunications equipment must satisfy health and safety requirements and conform to certain technical standards. The Act on Electromagnetic Compatibility of Equipment has been amended in 2007.
In 2006, DTAG announced its intention to build a fiber optic network in Germany's 50 largest cities. The FNA has announced that this network generally falls within its regulatory competence, in particular with respect to the wholesale broadband internet access market, so long as the products and services provided via this network are merely a substitute to existing products and services. If the products and services provided via this network are deemed not to be mere substitutes for previously existing products and services, then DTAG may operate this network without any regulation, for at least some initial period. In addition, pursuant to an amendment to the Telecommunications Act effective since February 2007, new markets shall in the future be exempted from regulation upon the FNA's discretion. The term of this exemption period is also to be determined by the FNA upon its discretion. The European Commission has raised serious concerns about the conformity of this regulatory exemption with the existing regulatory framework. After sending a letter of formal notice to Germany on the grounds that Germany's approach could in effect grant a 'regulatory holiday' to the incumbent fixed network operator as it would reduce the discretion of the German national regulatory authorities ('NRA') and bypass the consultation and consolidation mechanism provided for in the EU regulatory framework. The case was referred to the European Court of Justice in the course of 2007 and the Court decided in the beginning of 2009 that such exemption rule from regulation within the German Telecom Act is not in line with the regulatory framework.
The Regulatory Body. The FNA is responsible for the regulation of the German telecommunications market. It has various powers in respect of the enforcement of telecommunications laws and regulations. All decisions of the FNA may be challenged before the competent courts.
Notification Requirements. The operation of telecommunications networks and the provision of telecommunications services do not require any licenses from any regulatory body. However, commercial operators of public telecommunications networks and commercial providers of telecommunications services for the general public have to notify the FNA of the commencement, any modification and the termination of their business activities.
Granting of Rights of Way. Operators of public telecommunications networks that wish to use public streets, squares, bridges and public waters for the laying and operating of telecommunications lines have to apply to the FNA for the granting of respective rights of way. In particular, the FNA has to determine whether the applicant has demonstrated sufficient professional expertise, reliability and financial capability to operate telecommunications lines. On October 26, 2004, KDG was granted by the FNA all necessary rights of way throughout the territory in which it operates telecommunications networks.
Allocation of frequencies. In principle, a frequency allocation by the FNA is required for the use of frequencies. However, under the regulation regarding the frequency range allocation plan (Frequenzbereichszuweisungsplanverordnung), frequencies in cable networks within the frequency range of 9 kHz to 3 GHz may be used without allocation by the FNA provided that (i) the frequencies are not used in frequency ranges within which security relevant radio services are operated and (ii) electromagnetic interferences do not exceed a specified threshold. In cases where these
45
Table of Contents
preconditions are not satisfied, the FNA is authorized to issue specifications for the use of the relevant frequencies. The operation of KDG's telecommunications cable networks may in the future, either generally or in certain areas, become subject to such specifications. There are political considerations to amend the regulation (in a first step) to free up frequencies currently devoted to broadcasting for mobile, stationary and/or wireless technologies in order to close existing gaps in broadband availability in Germany and to foster competition ('digital dividend'). Recent changes in a regulation concerning the protection of public telecommunication networks (Verordnung zum Schutz von oeffentlichen Telekommunkationsnetzen und Sende und Empfangsanlagen) aim at the mandatory digitization or even complete switch-off of a specified number of analog channels in the lower frequency spectrum for security reasons (such as to mitigate interference with air traffic, etc.). The regulation provides for the digitization of two analog channels in several steps before 2011. The regulation has been adopted in May 2008.
Access Obligations. The FNA may impose on operators of public telecommunications networks with significant market power the obligation to grant other companies access to provide telecommunications services to their telecommunications networks. In particular, the FNA may impose the obligation to grant access for certain telecommunications services on an unbundled basis. For this purpose, the operator must offer access to its network in a manner that allows the other undertaking not to purchase any services that it does not require. Under certain conditions, the FNA may also impose access obligations on operators of telecommunications networks if those operators do not have significant market power but control end-user access.
Among other things, the FNA is authorized to impose on operators of public telecommunications networks either having significant market power or controlling the end-user access the obligation (i) to grant access to certain network components and certain facilities as designated by the FNA, and (ii) to offer the re-sale of their telecommunications services on a wholesale basis. The FNA has discretion to determine whether access must be granted or re-sale must be offered. However, any such obligation imposed by the FNA must be reasonable in light of the circumstances of each individual case and in line with the directives and recommendations of the European Regulatory Framework.
Regardless of whether or not an operator of public telecommunications networks has significant market power, it is obliged to offer any other operator upon its request the interconnection of both parties' telecommunications networks, provided the interconnection is technically feasible. KDG is subject to such obligation in respect of those parts of its telecommunications networks that have bi-directional transmission capability.
If the FNA were to impose the obligation on an operator to grant access to its telecommunications networks or to offer the re-sale of its telecommunications services on a wholesale basis, and if any third-party requested an offer from such operator for access to its telecommunications networks or for re-sale of its telecommunications services and failed to come to an agreement in this respect with such operator, the FNA would, upon application, be entitled to order the access or re-sale and provide for the terms and conditions (including fees) of such access or re-sale. Moreover, if an operator possesses significant market power, the FNA, upon application, has the authority to order the interconnection of such operator's and any third-party's public telecommunications networks and to provide for the terms and conditions (including fees) of such interconnection.
To date the FNA has not imposed any obligations on KDG to grant third parties access to its telecommunications networks or to offer third parties the re-sale of its telecommunications services on a wholesale basis.
Regulatory Framework. Before the revised Telecommunications Act of June 22, 2004 came into force, KDG was considered by the FNA, under the former Telecommunications Act of 1996, to have a dominant position in the regional markets of (i) the feed-in of radio and television programs into telecommunications cable networks and (ii) the distribution of radio and television programs via
46
Table of Contents
telecommunications cable networks to subscribers. In October 2006, the FNA has published the final market definition and market analysis for Market 18 based on the recommendation and a regulatory ordinance as of April 2007, according to which KDG, Kabel BW and Unitymedia in each case are considered to have Significant Market Power (SMP) (i) in the market for analog and digital TV signal feed-in and (ii) the market for analog and digital TV signal delivery to other operators. KDG has filed various complaints against this ordinance with the competent court. These complaints have partly been overturned and/or are still pending. With respect to KDG's SMP the court has upheld the FNA's view. However, KDG has appealed against this decision. Furthermore, as mentioned above, the European Commission has per the end of 2007 revised the Recommendation and has abolished Market 18. As the FNA has only started to review the Market 18 again in April 2009 the consequences of such removal and review are unclear as of yet.
As stated above, the European regulatory framework as a whole is currently under revision. However it is at the current stage unlikely that access obligations will be significantely modified.
Regulation of Fees for Telecommunications Services. Under the Telecommunications Act, an operator of a telecommunications network which has significant market power must not abuse its position in the market when it charges fees. In particular, it is deemed abusive if any such operator charges fees that (i) only prevail in the market due to the significant market power of the operator, (ii) unjustifiably place its competitors at a significant competitive disadvantage, or (iii) are discriminatory. Amongst other things, an unjustified competitive disadvantage for the competitors of the operator is presumed by law if the fees such operator charges its customers do not cover the costs of the relevant service.
Furthermore, under the Telecommunications Act, the fees for telecommunications services provided by an operator with significant market power or provided by an operator controlling the end-user access may be subject to regulation by the FNA.
KDG's fees for signal delivery to Level 4 network operators and carriage of feed-in signals from broadcasters are subject to ex post regulation. During an ex post review, the FNA examines the fees charged as to whether they are abusive. If any such fees are found to infringe the requirements of the Telecommunications Act, the FNA must declare such fees void and it may either direct the affected operator to adjust its fees or provide for fees that are not abusive.
In the case of an ex ante review, the operator is required to apply to the FNA for fees approval before the fees can be introduced in the market. The FNA examines the fees as to whether they exceed the costs of efficient service provision. To date the FNA has not required us to submit any fee proposals and/or cost statements to it for anex-ante review.
In a complaint brought forward by a small regional broadcaster, the FNA is currently examining whether it might be justified that KDG's reduces the feed-in fees for small regional broadcasters to a certain extent. The outcome is unclear as of now, but will most likely not substantially affect KDG's business.
Abusive Behavior. In addition to prohibiting the charging of abusive fees, the Telecommunications Act provides for a general prohibition of abusive behavior in the telecommunications markets by operators of telecommunications networks which possess significant market power. In particular, such abuse includes discriminatory and restrictive practices.
The FNA may prohibit abusive behavior and declare particular agreements to be void. The FNA may also confiscate profits generated from abusive behavior if certain conditions are met. Moreover, the FNA has the authority to impose an administrative fine on any company that fails to comply with its rulings as regards abusive behavior.
To date the FNA has not objected to the business practices of KDG on the basis that they constituted abusive behavior.
47
Table of Contents
Fixed-Line Telephony and Internet Access Regulation. With respect to the commercial provision of (narrowband) telephony services to end-customers based on a self-operated fixed-line telecommunications network, the aforementioned provisions of the Telecommunications Act as regards notification, granting of rights of way, allocation of frequencies, access obligations, regulation of fees and abusive behavior also apply. See 'Telecommunications Regulation'. In particular, if the Company is deemed either to have significant market power in the relevant market or to control end-user access, the FNA may impose access obligations on the Company, order the interconnection of end-customers or regulate the fees charged to end-customers.
Mobile Telephony and Mobile Web Services. In May 2009, KDG started to offer KDG-branded mobile telephony services to individual customers in co-operation with a German mobile network provider. In this capacity, KDG is not subject to any specific licensing or access obligations, nor is KDG in a dominant market position. The general telecommunication-related laws concerning, e. g., data and consumer protection issues, as well as general competition law, apply. As mobile service provider, KDG is subject to the supervision of the FNA
Regulation of Call Termination Fees. As regards market 3 (call termination on individual public telephone networks of alternative network operators provided at a fixed location) of the recommendation, the Company is deemed to have significant market power pursuant to a draft ruling by the FNA of November 2008. Under said draft ruling, the fees for call termination services in our telecommunications network are subject to an ex-post review by the FNA. In addition all termination agreements must be non-discriminatory and respect certain transparency standards. The final ruling has not yet become effective.
Interconnection. Alternative telephony service providers generally enter into an interconnection agreement with DTAG in order to allow their fixed-line telephony customers to call subscribers of other fixed and mobile telecommunications networks and to be called by third parties. The fees DTAG charges for its interconnection services are subject to an ex-ante review by the FNA. In addition, the FNA has ordered DTAG to publish a reference interconnection offer. DTAG's reference offer has been under review by the FNA. The currently existing interconnection agreement between alternative telephony service providers and DTAG may be terminated by DTAG and replaced with a standardized agreement based on the reference interconnection offer approved by the FNA. The Company has entered into an interconnection agreement with DTAG.
Pursuant to the above mentioned draft ruling by the FNA of November 2008, our company is likewise obliged to grant interconnection to alternative network operators seeking termination in our network on a transparent and non-discriminatory basis. This includes our obligation to publish a reference interconnection offer.
Consumer Protection. Pursuant to the telecommunications act KDG is obliged to comply with various provisions for the special protection of end-users (customers) regarding, among other things, (i) the formation of agreements, (ii) the subject matter and the termination of contracts and certain rights and obligations of the contracting parties and of third parties engaged in telecommunications traffic, (iii) quality of service, (iv) details of delivery periods, (v) the operator's liability vis-à-vis the end-customers, (vi) the way in which reference is made to standard terms and conditions and fees, (vii) requirements deriving from the Universal Service Directive, (viii) entries in directories and directory enquiry service databases, (ix) the blocking of the subscriber's line, (x) itemized bills, (xi) out-of-court dispute resolution procedures for customers, and (xii) declaration from property owners.
The telecommunications act and other federal acts have been amended in 2009, to take into account certain consumer protection issues. The changes aim, inter alia, to facilitate the termination of
48
Table of Contents
agreements and enforcement of legal remedies by end-users and to provide for stricter rules for operator customer acquisition practices, especially with regard to unwanted telephone marketing.
Number Portability. Each public telephone network operator is obliged to enable its customers to retain their telephone number, in the case of geographic numbers, at a specific location, and to allow for number portability.
Numbering Issues. The FNA is the competent authority for the administration of numbering issues. It is responsible for structuring and configuring the national number space in Germany. The FNA also allocates (technical) numbers to telecommunications network operators, telecommunications service providers and end-users. When KDG is allocated numbers (for example, local numbers for end-customers or a technical number in order to implement number portability) it is obliged to comply with certain conditions (for example, with regard to the transfer of numbers), as set out in the respective number allocation rules issued by the FNA. Furthermore, KDG has to observe certain statutory provisions with regard to premium-rate numbers. The FNA is authorized to impose fines of up to €0.5 million in order to enforce its regulations on numbering.
Privacy of Telecommunications, Data Protection and Public Safety. Each provider of telecommunications services is obliged to maintain telecommunications privacy. This means that the content and detailed circumstances of telecommunications, in particular the fact of whether or not a person is or was engaged in a telecommunications activity, shall not be disclosed to third parties.
In addition, each operator of telecommunications services is obliged to protect the personal data of telecommunications subscribers and users in connection with the collection and use of such data. The relevant sections of the telecommunications act provide for the collection and use of personal data.
Furthermore, any person offering publicly available telephone services is obliged to provide all users with free access to emergency services by using the European-wide emergency call number '112' and any additional national emergency call numbers.
Each service provider is obliged to make appropriate technical arrangements or take other measures in order to protect the privacy of telecommunications and personal data and telecommunications and data processing systems against (i) unauthorized access, (ii) any faults which would result in considerable harm to telecommunications networks and (iii) external attacks and the effects of natural disasters. In addition, it is obliged to nominate a security commissioner (Sicherheitsbeauftragten) and to draw up a security concept (Sicherheitskonzept) setting out (i) which telecommunications systems are to be used and which publicly available telecommunications services are provided, (ii) any potential hazards, and (iii) which technical arrangements or other safeguards have been made or put in place or are planned.
Interception and Information Requests from Law Enforcement Authorities. Each operator of a telecommunications system on which publicly available telecommunications services are provided has to provide, at its own expense, technical facilities for telecommunications interception by law enforcement authorities. The administrative and procedural details of the telecommunications interception are specified in the revised telecommunications interception regulation (Telekommunikations- Ueberwachungsverordnung), whereas the technical details (for example, relating to transmission protocols) are specified in the 'technical guideline: requirements for the implementing of statutory telecommunications monitoring operations' (Technische Richtlinie zur Beschreibung der Anforderungen an die Umsetzung gesetzlicher Massnahmen zur Ueberwachung der Telekommunikation). The FNA regularly updates the technical guideline in order to reflect developments in technology, such as the use of e-mail and VoIP, for example.
49
Table of Contents
Each operator of a telecommunications network or provider of telecommunications services is obliged to collect and store certain data with regard to the telecommunications traffic across its network in order to comply with statutory provisions related to law enforcement.
Telecommunications Contribution Charges. Telecommunications network operators and telecommunications service providers must pay a contribution charge to offset costs incurred by the activities of the FNA. The FNA has published its regulation setting out the criteria determining the amount of the contribution charges at the beginning of 2009. The market share in the fixed telephony market is the relevant factor in calculating the amount of the contribution charges.
Internet Access. With respect to the commercial provision of internet access services to end customers based on a self-operated fixed-line telecommunications network, the same provisions of the telecommunications act apply. The regulations under the telecommunications act do not differentiate between content (voice telephony or internet data) transmitted via the telecommunications network.
Even though the Recommendation does not provide for a national market for internet access, the FNA has already conducted a market analysis with respect to internet access services in Germany. However, within this market analysis, the Company was not deemed to have any significant market power within the market for internet access services. Therefore we are not subject to any regulation due to the FNA's market analysis for the internet access market.
With regard to the provision of internet access via our network, certain statutory provisions apply. Internet access providers are generally not obliged to monitor the content transmitted via their telecommunications infrastructure if their role is strictly limited to the technical transport of the signals. Otherwise, certain monitoring obligations pursuant to the state broadcasting treaty (see below) may apply. As a result of an initiative brought forward by the German federal family ministry, KDG and four other large internet access providers have signed a public contract in April 2009 with the German federal criminal office (BKA) to block internet websites that have been identified by the BKA as containing child pornography. Meanwhile, the federal government has proposed legislation that will oblige German internet access providers by law to block child pornography content on the internet. Such law has been passed in June 2009. It overrules the above-mentioned public contract. See also ITEM 4 D—'Risks Relating to Regulatory and Legislative Matters'.
Media Regulation
Regulation of the media is subject to the legislative authority of each of the 16 German federal states (Bundeslaender). Each federal state has its own media law; the states have however also harmonized certain parts of their media laws in the overarching state broadcasting treaty concerning broadcasting and so-called telemedia services (Rundfunkstaatsvertrag) (the 'State Broadcasting Treaty'). The State Broadcasting Treaty establishes the framework of the German broadcasting system. In particular, it provides for a regime designed to ensure that a diversity of views and opinions is secured and delivered in the mix of public and private radio and television channels and their respective programming. The State Broadcasting Treaty, together with the media laws of each of the federal states, regulates (i) the establishment and powers of regulatory bodies, (ii) the licensing of private broadcasters, (iii) notification requirements in connection with the (re-)transmission of radio and television programs, (iv) the allocation and use of transmission capacities and digital platforms, and provides for (v) certain non-discrimination rules with respect to technical and business aspects of the transmission of programs. The State Broadcasting Treaty—and as a corollary the media laws of the federal states—are under permanent revision, as the legislators see the need to adapt the law to technological and economical changes in the media field constantly.
The State Broadcasting Treaty has been amended in 2008 to introduce a distinctive 'platform' regulation and specific rules concerning the scale and scope of obligatory digital retransmission of programs or bundles of programs. The scale and scope of such must-carry obligations has in certain
50
Table of Contents
parts been narrowed down, which has had a beneficial effect on our capacity to manage digital bandwidth in our networks. The revised treaty came into force on September 1, 2008. The European Directive 89/552/EEC on the provision of audiovisual media services (the 'Audiovisual Media Services Directive'), which forms the basis of certain of the provisions in the State Broadcasting Treaty, has been amended at the end of 2007. The amendments provide for reductions of the regulatory burden on Europe's providers of TV and TV-like services to allow for more flexibility for financing audiovisual content by new kinds of advertising. They also include new definitions of linear and non-linear services having an effect on the German distinction between broadcasting and telemedia services. Some of the Directive's amendments have been implemented into national law in June 2009. This did not lead to an adverse effect on our business so far, as the near-video-on-demand services offered by KDG continue to be considered as telemedia services. Other sections of the Directive will have to be implemented into national law by the end of 2009. The outcome and the implications, in particular with respect to potential future on-demand services, are not yet clear as of now.
The establishment, the functions and the obligations of the public broadcasters are regulated separately.
The Regulatory Bodies. As a rule, each German federal state has established its own independent regulatory body, the state media authority (Landesmedienanstalt), for the regulation of the private broadcasting sector and platform providers. The states of Berlin/Brandenburg and Hamburg/Schleswig-Holstein have established a joint regulatory body. A number of joint committees among the state media authority exist to coordinate certain aspects of media regulation. In an effort to further concentrate regulatory competences, a new commission has been formed in 2008 to handle central aspects of media regulation (Kommission fuer Zulassung und Aufsicht, the 'ZAK').
The state media authorities and the ZAK are primarily responsible for the licensing and supervision of private broadcasters and the allocation of transmission capacities for radio and television channels. In most states, they are also required to run, or to supervise, 'open channels' (amateur radio and television channels). The state media authorities have the power to supervise the compliance with, and to intervene against infringements of the provisions of the State Broadcasting Treaty regulating matters as the use of conditional access systems, application programming interfaces and electronic program guides and the charging of fees from broadcasters and other content providers.
The state media authorities have various powers to enforce compliance with the law. Any decisions of the state media authorities can be challenged before the competent administrative courts. The regulatory body in the field of telecommunications, the FNA, has similar jurisdiction and powers with respect to the subject matters mentioned above. Such double regulation has a potential adverse effect on our business.
License and Notification Requirements. Private broadcasters are required to obtain broadcasting licenses from the competent state media authority in accordance with applicable state laws. In contrast, the operation of cable networks for the transmission of radio and television programs does not currently require a license from a state media authority. In certain states, however, a notification to the state media authority is required in connection with the operation of cable networks. The State Broadcasting Treaty has introduced a general notification requirement for digital platform providers. In addition, the analog and/or digital transmission of radio and television channels transmitted via cable networks must be notified. The operators of cable networks and other relevant parties are also required to notify the state media authorities of (i) the use of conditional access systems and electronic program guides, (ii) title to application programming interfaces, and (iii) their feed-in fees. This requirement also applies with respect to subsequent changes of the foregoing.
Allocation and Use of Transmission Capacities. The State Broadcasting Treaty sets forth the rules for the allocation and use of digital transmission capacities and digital platforms for television channels.
51
Table of Contents
In addition, the allocation and use of analog transmission capacities for both radio and television channels and digital transmission of radio channels is governed by the laws of the respective states. The State Broadcasting Treaty expressly clarifies that rules for the allocation and use of analog transmission capacities are permitted to be established by the states only to the extent that they are necessary to meet clearly defined general interest objectives.
Article 31, Section 1 of the Universal Service Directive of the European Union (the 'Universal Service Directive') is the blueprint of such clarification. It requires a proportional 'must-carry' regime and does not distinguish between analog and digital transmission of radio and television channels. In addition, the Universal Service Directive requires a periodic review of the 'must-carry' regime.
Consequently, the State Broadcasting Treaty provides for a review of the currently applicable 'must-carry' regime on a regular basis. Said requirements of the Universal Service Directive must also be implemented into the other relevant legislation of the states. Therefore, the 'must-carry' regime must be reviewed periodically on all national levels, in particular with respect to the analog transmission of radio and television channels. In order to push for deregulation, the German cable association (Deutscher Kabelverband) filed a complaint with the European Commission in 2006, which has led the European Commission to open formal infringement proceedings against Germany. Similarly, KDG had filed a suit against a ruling of September 2005 by the media authority of Lower-Saxony pursuant to which the full analog cable spectrum is allocated in accordance with the authorities' decision under the current regulatory regime. The claim was based, inter alia, on the argument that the allocation of the full analog spectrum is a violation of Article 31, Section 1 of the Universal Service Directive. The German administrative court in charge of the matter had referred the case to the European Court of Justice (ECJ) for a preliminary ruling. In its judgment of December 2008, the ECJ ruled against KDG and found that, unless a cable operator is unreasonably affected, even the allocation of the full analog spectrum by the media authority is not in violation of the Universal Service Directive. The ruling could have an adverse effect on KDG's business as it gives national legislators a very wide discretion to tighten (analog) allocation rules or return to stricter must-carry regimes. Whether and to what extent they will do so is unclear as of now. In light of the ECJ ruling, it appears unlikely that the Commission will continue to pursue the infringement proceedings against Germany.
Allocation and Use of Analog Transmission Capacities. As stated above, regulations regarding the analog transmission of radio and television channels vary from state to state and cable network operators are generally not entirely free to allocate analog channels in their networks. Rather, the state media authorities make—in varying degrees in accordance with the respective state's media law—allocation decisions regarding which programs will be carried over the cable networks, in keeping with the states' responsibility for ensuring that a diversity of views and opinions is secured in the mix and delivery of channels and programming.
Regulations as of now do not explicitly state whether cable network operators are entitled to decide on the amount of capacity they devote or use for the broadcasting of radio or television channels and which amount they devote or use for other services such as internet access. However, the State Broadcasting Treaty as of September 2008 contains, at least for digital capacities, provisions confirming the cable operators' entitlement to make such allocation decision. It is also not clearly stated whether or not the cable network operators can freely determine which capacities they use for analog and for digital transmission. Some of the state media authorities seem to be of the opinion that it is not the cable network operators who are entitled to decide on these questions. Some state media laws or statutes of the state media authorities expressly state the number of cable channels that must be used for the analog transmission of television programs. Channels will be given preference by the state media authorities if they are deemed to contribute to the diversity of views and opinions in the respective state so that the state's mix of channels and programs reflects a range of political, religious, cultural, social and ethnic views.
52
Table of Contents
In general, state media authorities prioritize the allocations of channels based on the following order:
- •
- channels of the respective state's public broadcasters;
- •
- channels of private broadcasters (including local and regional channels) licensed in the respective state and open channels;
- •
- general interest channels of private broadcasters;
- •
- special interest channels of private broadcasters; and
- •
- other programs
- •
- telemedia services.
The specific allocation of channels varies from state to state, and rules relating to the allocation of radio channels are usually somewhat less strict than those relating to television channels. In certain states, the state media authorities make allocation decisions regarding all or almost all of the analog channels available in the network. In other states, the law defines a number of 'must-carry' channels, while the network operator is entitled to allocate the remainder of the capacity. An increasing number of states have adopted more liberal allocation regimes which grant network operators the right to allocate a limited number of channels, subject to certain legal constraints and as long as such allocations do not conflict with the state media authority's policy with respect to the diversity of opinions. In some cases, a certain portion of channels is given to the network operator to be allocated as they see fit under purely economic considerations (within the confines of the general laws).
In those states where the state media law grants preference to channels that are terrestrially receivable within the state, the introduction of DTT in several metropolitan areas in Germany also affects the allocation of analog cable capacities. DTT allows—under the current compression technology—for the reception of 24 to 31 channels, which according to the interpretation of the law by some media authorities leads to a 'must-carry' status of the digital terrestrial channels. KDG had challenged in court such interpretation of the law in the case that went before the European Court of Justice (see above). The ECJ found the must-carry status of digital terrestrial channels not to be a violation of the Universal Service Directive. Therefore, it could adversely affect KDG's business if legislators will adhere to or even newly introduce this kind of must-carry rules. Whether and to what extent they will do so, is unclear as of now.
Broadcasters have the right to file a complaint with the relevant state media authority in the event that cable network operators unlawfully refuse to transmit their signals. The state media authorities are vested with the power to order the transmission of channels upon such complaints, provided that the respective broadcasters programs enjoy 'must-carry' status or that the network has sufficient excess capacity. Whether or not the broadcasters, in particular those enjoying 'must-carry' status, are entitled to assert claims for distribution directly against the cable network operator is unclear. It is also not uncontested, yet asserted by us and now standard practice, that a cable network operator's obligation to transmit 'must-carry' programs is subject to the conclusion of a carriage agreement with the respective broadcaster. In the absence of such a carriage agreement, it has proven difficult for the cable network operator to claim carriage fees.
Allocation and Use of Digital Transmission Capacities. As pointed out above, the State Broadcasting Treaty also governs the digital transmission of television channels. The State Broadcasting Treaty prioritizes the allocation of digital transmission capacities in three different categories of channels:
- •
- First Tier: Each operator of a telecommunications cable network must reserve the equivalent capacity of a maximum of three analog channels for the transmission of all channels of the respective state's public broadcasters. According to current political discussions, such limit might
53
Table of Contents
be removed in the future, the consequences of which for our business are unclear as of now. Furthermore, each network operator must allocate the transmission capacity equivalent to one analog television channel to regional and local television channels of private broadcasters licensed to broadcast in the relevant state and open channels (where those exist). In the new State Broadcasting Treaty effective from September 1, 2008, this capacity limit is no longer mentioned, which might have a beneficial effect on our capacity management. Cable network operators are also required to transmit the two television channels of private broadcasters that are distributed nationwide and achieve the largest coverage in Germany, as these are obliged by law to include local programming windows in order to foster diversity of views and opinions.
- •
- Second Tier: Each cable network operator must allocate transmission capacity equivalent to one third of the total digital transmission capacity of his network on the basis that this mix of channels ensures a diversity of views and opinions, which allows for a certain degree of discretion.
- •
- Third Tier: Cable network operators are free to allocate the remainder of the capacity subject only to certain general legal constraints.
As mentioned above, the State Broadcasting Treaty effective from September 1, 2008 includes a provision implicitly confirming that it is in the cable operator's discretion to determine which portion of capacity they allocate to the transmission of radio and television channels and telemedia services on the one hand, and telecommunications services on the other.
The cable network operator is not entitled to de-bundle the digital program packages of public and private broadcasters and to compile their contents and other programs into new program packages for its own marketing without the broadcaster's consent. However, the Treaty as of September 2008 acknowledges the cable operator's right to make changes that serve to enhance technical efficiency as long as such changes do not have negative effects on the agreed-upon delivery standard. It is uncertain whether this entitlement includes the right to encrypt the digital broadcasting signal without the broadcaster's consent, in order to make sure that only entitled subscribers can watch the digital broadcasted contents.
The rules regarding the allocation of digital transmission capacities for radio channels vary from state to state. The Treaty as of September 2008 has introduced unified must-carry obligations for radio channels.
Use of Technical Digital Platforms. The operation of technical digital platforms for television is also governed by the State Broadcasting Treaty. A digital platform in the technical sense can be defined as the entirety of all infrastructure and technical means (e.g. CAS, subscriber management, transmission paths, etc.), which enable customers to receive, and providers to distribute, digital content of any kind. The Treaty as of September 2008 has introduced a general, technology-neutral platform regulation (see above) in an attempt to extend must-carry and related obligations to other digital delivery systems as well.
Providers of telecommunication services via technical digital platforms, which distribute broadcast or comparable telemedia services, must guarantee that the distribution technology used in the technical digital platform allows diversity of offers. They are prohibited from restricting or discriminating against broadcasters or providers of telemedia, in particular, through the use of conditional access systems, application programming interfaces and navigators or pricing models. Moreover, providers of telecommunications services are required to notify the state media authorities of the use of conditional access systems and navigators and of the title to any application programming interfaces. See 'License and notification requirements'.
The Bavarian state media authority (Bayerische Landesanstalt fuer Neue Medien—BLM) confirmed by order of July 23, 2004 that the navigator offered by KDG at that time complied with the regulatory
54
Table of Contents
requirements of the predecessor version of the State Broadcasting Treaty. Furthermore, in dismissing an objection to this order filed by an alliance of public broadcasters, the BLM stated that our navigator also satisfied the applicable regulatory requirements of the State Broadcasting Treaty as amended. However, at the present time, KDG does not use or offer this navigator expect as in the original digital receiver population the navigator was designed for.
The Telecommunications Act also includes provisions applicable to the use and the licensing of conditional access systems and application programming interfaces. As pointed out above, the relationship between the provisions of the Telecommunications Act and of the State Broadcasting Treaty and between the authority of the FNA and the state media authorities has not been clarified by the latest legislation.
Regulation of Fees. Under the State Broadcasting Treaty, fees for the transmission of radio and television channels and of telemedia services may not be restrictive or discriminatory. It is unclear whether this requirement also applies to fees for the licensing of conditional access systems, application programming interfaces and electronic program guides. The Treaty as of September 2008 makes such interpretation more likely. The operators of cable networks are required to notify the state media authorities of their feed-in fees (see License and notification requirements) and the state media authorities are authorized to review these fees. State media authorities are required to consult with the FNA before they decide upon investigated infringements of the State Broadcasting Treaty. However, due to the split of the legislative authority between the Federal government and the states, it is doubtful whether the introduction of regulation by the state media authorities of the fees that operators of cable networks charge broadcasters is in line with German constitutional law.
Provision of Telemedia Services. Under German law, the provision of electronic content offerings other than broadcasting services or pure telecommunications services, such as electronic press or video-on-demand offers, are regulated, as far as economic aspects are concerned, by the Telemedia Act in force since March 1, 2007 (Telemediengesetz) and, as far as content aspects are concerned, by the State Broadcasting Treaty. For the regulations to apply it does not matter whether the electronic content service is delivered via fixed-line telephony networks, cable networks or other means of distribution or whether the delivery is based on the internet protocol or any other transmission standard. The amendments to the State Broadcasting Treaty and Telemediengesetz which are still necessary to fully implement the Audiovisual Media Services Directive into German law until the end of 2009 (see above) may lead to changes in the differentiation between broadcasting and telemedia services, the outcomes and effects of which are however unclear at the moment.
The provision of a telemedia service does not require a license from, or a notification to, any regulatory body, as long as it is not a telemedia service 'comparable to broadcasting'. However, a notification to the state media authority of telemedia services distributed via typical television distribution platforms, such as cable networks, is best practice. In a decision, the European Court of Justice has ruled that so called near-video-on-demand offers qualify as broadcasting services under European law. According to this decision providers of near-video-on-demand services must comply with program quotas for European productions. In the same vein, the Audiovisual Media Services Directive defines near-video-on-demand services as linear, that is, broadcasting services. However, the revised State Broadcasting Treaty coming into force on June 1, 2009 will qualify near-video-on-demand offerings as telemedia services, so that cable operators can continue to offer their near-video-on-demand services as they did before without falling under the stricter broadcasting rules, namely with regard to adult content offerings.
In this context, the State Broadcasting Treaty on the Protection of Minors in Broadcasting and Telemedia (Jugendmedienschutz-Staatsvertrag), as amended, provide for the admissibility of adult content offerings under specified conditions, namely ensuring that such content is only made available to closed groups of users. The competent regulatory bodies of the German states have issued guidelines how a
55
Table of Contents
provider of telemedia services can meet the legal conditions, e. g. by way of identification and age verification systems. As regards the current adult content telemedia service available via KDG's digital platform, the regulatory bodies have found that the system installed by KDG fully meets the safeguarding conditions.
Antitrust Regulation
�� In 2007, the Federal Cartel Office (FCO) initiated proceedings against, inter alia, KDG and the two largest German free TV broadcasters, RTL and ProSiebenSat.1, alleging that certain aspects of the retransmission agreements between KDG and the broadcasters in connection with the introduction of so-called basic encryption in KDG's broadband cable network served to restrain competition and therefore amounted to an abuse of a dominant market position. The proceedings are still pending.
In October 2007, the FCO also started examining KDG's pay-TV offering (Kabel Digital Home) and whether KDG is abusing a market dominant position. This examination was closed in June 2008 as the FCO (i) could not find indications that KDG had a dominant position in the market for the acquisition of broadcasting rights of TV channels with comprehensive programming such as ARD, ZDF, RTL and ProSiebenSat.1 and; (ii) could not find that KDG impeded competition.
As from August 2008, the FCO is examining KDG's business policy regarding the use of set top boxes with proprietary functions in connection with KDG's digital platform, alleging that it amounts to an abuse of a dominant market position by KDG. KDG has defended its policy on various legal and technical grounds and the examinations are still pending. A negative outcome could adversely affect KDG's future policy with regard to set top boxes. Based on similar allegations, the FCO has also initiated individual proceedings against the network operators Unitymedia, Kabel Baden-Wuerttemberg and the largest German pay-TV provider Sky Deutschland AG.
Zoning Laws
German zoning laws currently restrict the installation of satellite dishes in certain areas. In addition, contracts with residents of multi-unit dwellings may, and usually do, prohibit tenants from attaching satellite dishes to their apartments if they are connected to a cable network. However, this may change in the future. The European Commission published a communication claiming that the EU's rules on free movement of goods and services prohibit national restrictions on the individual reception of satellite television signals. While restrictions on individuals resulting from contracts with housing associations do not fall under these rules, the EU's current communication seems to exhibit a determination to remove this perceived barrier to the free movement of goods and services. As a result, German law may change in the future, which may ultimately result in an increase in the number of satellite users and intensify competition with satellite providers.
Environmental
We are subject to a variety of laws and regulations relating to land use and environmental protection, including those governing the clean-up of contaminated sites. For example, asbestos-containing materials and polychlorinated biphenyls have been identified at approximately 20 to 30 of the facilities which we lease from DTAG under the SLAs. We believe these facilities have been refurbished by DTAG in accordance with applicable law.
While we could incur costs, such as clean up costs, fines and third-party claims for property damage or personal injury, as a result of violations of environmental laws and regulations, we believe that we are in substantial compliance with the applicable requirements of such laws and regulations.
56
Table of Contents
C. Organizational Structure
As of March 31, 2009, the following is a list of our significant group companies and our proportion of share-holding in each company: See also ITEM 6E Group Structure.
| | | | | | | | |
Fully consolidated companies (IFRS 3) | | Registered office | | Shareholding
in % | |
|---|
1 | | Kabel Deutschland GmbH | | Unterfoehring | | | | |
2 | | Kabel Deutschland Verwaltungs GmbH | | Unterfoehring | | | 100.00 | |
3 | | Kabel Deutschland Vertrieb und Service GmbH & Co. KG | | Unterfoehring | | | 100.00 | |
4 | | Kabel Deutschland Breitband Services GmbH | | Unterfoehring | | | 100.00 | |
5 | | TKS Telepost Kabel-Service Kaiserslautern Beteiligungs-GmbH | | Kaiserslautern | | | 100.00 | |
6 | | TKS Telepost Kabel-Service Kaiserslautern GmbH & Co. KG | | Kaiserslautern | | | 100.00 | |
7 | | Urbana Teleunion Rostock GmbH & Co. KG | | Rostock | | | 70.00 | |
8 | | Verwaltung Urbana Teleunion Rostock GmbH | | Rostock | | | 50.00 | |
9 | | KABELCOM Braunschweig Gesellschaft fuer Breitbandkabel-Kommunikation mit beschraenkter Haftung | | Braunschweig | | | 99.58 | |
10 | | KABELCOM Wolfsburg Gesellschaft fuer Breitbandkabel-Kommunikation mit beschraenkter Haftung | | Wolfsburg | | | 97.65 | |
11 | | AEP Plueckhahn Kabel GmbH | | Unterfoehring | | | 100.00 | |
12 | | RKS Niedersaechsische Kabel-Service-Beteiligungsgesellschaft mbH | | Hanover | | | 100.00 | |
| | | | | | | | |
Companies consolidated at equity (IAS 28)
| | | | | | |
13 | | Kabelfernsehen Muenchen Servicenter Gesellschaft mit beschraenkter Haftung—Beteiligungsgesellschaft— | | Munich | | | 24.00 | |
14 | | Kabelfernsehen Muenchen Servicenter GmbH & Co. KG | | Munich | | | 30.22 | |
D. Property and Equipment
The Company does not own any land or buildings. All buildings are leased. Leasehold improvements have to be removed from many of our properties at the end of the lease. These obligations are accrued by the Company and the respective amount is capitalized in property and equipment.
Most of the Level 2, 3 and 4 equipment needed for the core operations is owned by KDG and amortized on a straight-line basis.
The Company owns and operates an advanced digital play-out facility capable of delivering encrypted digital television signals via satellite up-links to all of Germany.
In many cases KDG leases space in the cable ducts of DTAG to house KDG's cable network. In relation to these leases, KDG is subject to contractual asset retirement obligations. Depreciation is charged over the normal useful life of the respective assets.
Customer premise equipment is presented as part of the technical equipment. For customer premise equipment classified as operating lease, historical costs include the present value of estimated future costs and expenses necessary for the reverse logistics of the equipment after the termination of the contract with the customer.
Also, the Company has satellite transponders leased on a finance lease agreement which are capitalized as technical equipment in property and equipment. The satellite transponders equipment is amortized on a straight-line basis.
We believe that our properties are in good condition and are suitable and adequate for our business operations.
57
Table of Contents
The Senior Credit Facility is secured by all the assets of KDVS. See also ITEM 10C Additional Information.
ITEM 4A. UNRESOLVED STAFF COMMENTS
None.
ITEM 5. OPERATING AND FINANCIAL REVIEW AND PROSPECTS
A. Operating Results
We operate the business through four operating segments: Cable Access, TV/Radio, Internet & Phone, TKS. Additionally, our central reconciliation segment primarily provides for central services and corporate activities.
We measure our financial performance in large part with reference to EBITDA. We define EBITDA as profit from ordinary activities before depreciation, amortization, non-cash compensation, which consists primarily of expenses related to our management equity programs and non-cash restructuring expenses (Adjusted EBITDA). Adjusted EBITDA is not a recognized accounting term, does not purport to be an alternative to profit from ordinary activities or cash flow from operating activities and should not be used as a measure of liquidity. We believe Adjusted EBITDA facilitates operating performance comparisons from period to period and company to company by eliminating potential differences caused by variations in tax positions (such as the impact on periods or companies of changes in effective tax rates or net operating losses) and the age and book depreciation of tangible assets (affecting relative depreciation expense). Because other companies may not calculate Adjusted EBITDA identically to us, our presentation of Adjusted EBITDA may not be comparable to similarly titled measures of other companies. In addition, Adjusted EBITDA is not calculated in the same way that 'Consolidated EBITDA' is calculated under the indenture governing the Senior Notes or under the terms of our Senior Credit Facilities. However, Adjusted EBITDA is a commonly used term to compare the operating activities of cable television companies.
Impact of Inflation
A portion of our costs is affected by inflation. We attempt to restrict increases in our costs below the rate of inflation through productivity improvements and capital expenditure. However, general inflation affects costs for our competitors, suppliers and us.
Impact of Exchange Rate Fluctuations
Our functional and reporting currency is the Euro. We have almost no revenues, and almost no expenses or liabilities that are denominated in currencies other than Euro other than described below. We could incur significant currency exchange risks in relation to the Dollar denominated Senior Notes, although we fully hedged this exposure at the time of closing the Senior Notes over the initial five years or up until the first call date of the Company on July 1, 2009. Meanwhile we have rolled over these hedging instruments for an additional two years until July, 2011. In case we would incur other debt denominated in other currencies, such as Dollar denominated bank or bond debt, we could incur additional currency risk and related hedging costs.
The exchange rate underlying our currency hedge was fixed at USD/EUR 1.2066 until 2011. A 100 bps increase (decrease) in the USD/EUR exchange rate subsequently to that would result in an incremental increased (decreased) notional amount to be repaid in 2014 of approximately €5.1 million. Further a 100bps increase (decrease) in the USD/EUR exchange rate would result in an incremental increased (decreased) annual interest payment of approximately €0.5 million after expiry of the currency hedge in 2011.
58
Table of Contents
Impact of Interest Rate Changes
Our exposure to market risk for changes in interest rates relates primarily to our floating rate debt obligations. We have no cash flow exposure due to rate changes on the Senior Notes because they will bear interest at a fixed rate.
As of March 31, 2009, we had interest rate swaps with a notional amount of approximately €379.6 million which effectively exchanged the floating EURIBOR-based interest rate into a fixed interest rate of 3.705% per annum. As of April 30, 2008 we entered into an additional floating to fix interest rate swap. This swap with a fixed rate of 4.41% per annum and a notional amount of €250.0 million had an one year duration until April 30, 2009. In addition, we had interest rate caps of 4.2% per annum with a notional amount of approximately €126.5 million as of March 31, 2009. The remaining balance of the Senior Credit Facilities Tranche A, Tranche B and Tranche C of up to €1,253.9 million was not hedged and is therefore subject to fluctuations in the EURIBOR-based interest rate. Furthermore, all of the existing interest rate derivatives mature in June 2009.
Due to the very short maturity of the derivatives mentioned above, their interest rate sensitivity would be insignificant in that the negative/positive effect on net income and equity for a 100bps parallel increase/decrease of the interest curve would be below €4 thousand. Therefore, a 100 basis points change in the current EURIBOR rate would result in a change of €16.9 million annual interest payments related to Tranche A and Tranche C. This would also be the maximum effect on net income and equity.
Critical Accounting Estimates
The preparation of our financial statements requires management to apply accounting methods and policies that are based on difficult or subjective judgments, estimates based on past experience and assumptions determined to be reasonable and realistic based on the related circumstances. The application of these estimates and assumptions affects the reported amounts of assets and liabilities and the disclosure of contingent assets and liabilities at the balance sheet date and the reported amounts of revenues and expenses during the reporting period. Actual results may differ from these estimates given the uncertainty surrounding the assumptions and conditions upon which the estimates are based.
We have summarized below our accounting policies that require the more subjective judgment of our management in making assumptions or estimates regarding the effects of matters that are inherently uncertain and for which changes in conditions may significantly affect our results of operations and financial condition. For more information see the notes to our consolidated financial statements included elsewhere in this Form 20-F.
Property and Equipment
Property and equipment are recognized at cost less accumulated depreciation and accumulated impairment losses. Borrowing costs are not capitalized. Rebates, trade discounts and bonuses are deducted from the purchase price.
For technical equipment located on leased property, historical costs include the present value of estimated future costs and expenses necessary for restoration of the leased property after termination of the lease agreement.
59
Table of Contents
Leases
Operating lease
A lease is accounted for as an operating lease when all the risks and benefits incidental to ownership of the leased item remain with the lessor. Operating lease payments are therefore recorded on a straight-line basis over the lease term as an expense in the consolidated statement of operations.
Operating Lease for Customer Premises Equipment (CPE)
To get connection to internet & phone services as well as to receive digital TV, the Company leases the necessary equipment to the customers (Customer Premise Equipment or CPE). These leases, for which the Company is the lessor, are classified as an operating lease. Therefore, the Company capitalizes the CPE as fixed assets based on acquisition cost and the cost of removing the asset at the end of the lease. Over the useful life of 3 years, the assets are depreciated using the straight-line method.
Finance Lease
In accordance with IAS 17 "Leases", assets leased under finance leases are recorded at the lower of fair value at the inception of the lease or the present value of the lease payments. The assets are depreciated using the straight-line method over the shorter of the estimated useful life or over the lease period. The obligations related to future lease payments are recognized as liabilities. Lease payments are apportioned between the finance charges and reductions of the lease liability so as to achieve a constant rate of interest on the remaining balance of the liability. Finance charges are charged directly against income.
Subsequent Expenses
Rental costs are expensed. Repair and maintenance charges are expensed during the financial period in which they are incurred. The cost of significant renovations and additions are included in the carrying amount of the asset when it is probable that future economic benefits in excess of the originally assessed standard of performance will be realized by the Company. Significant renovations are depreciated over the shorter of the remaining useful life of the related asset or the lease term.
Depreciation of Fixed Assets
Depreciation is calculated based on the straight-line method over each asset's estimated useful life as follows:
| | |
Buildings and leasehold improvements | | 3 to 10 years |
Technical equipment and machines | | 3 to 20 years |
Property and equipment | | 3 to 15 years |
Gains and losses from derecognition of fixed assets are determined by deducting the carrying amount of the asset being sold from the proceeds received at the time of derecognition. The results are included in other operating income or in the corresponding expense line item. The assets' residual values, useful lives and depreciation methods are reviewed, and adjusted if appropriate, at each financial year end.
60
Table of Contents
Intangible Assets
Customer List
In connection with the initial acquisition of the cable business by the Company in March 2003, approximately €681.7 million of the purchase price was allocated to the customer list. Further additions to the customer list that occurred during the twelve months ended March 31, 2009 and in the previous years are primarily related to the acquisition of Level 4 companies and subscribers. The weighted remaining useful life of the customer list is 4.84 years, 3.92 years and 4.61 years as of March 31, 2009, March 31, 2008 and March 31, 2007, respectively.
Other Intangible Assets
Intangible assets which are purchased separately are recorded at cost. Intangible assets that have been acquired as part of an acquisition of a business are capitalized at fair value if they can be reliably measured at the acquisition date.
Computer software is recorded at cost as an intangible asset.
The Company recognizes intangible assets developed internally (consisting of software used by the Company) to the extent the criteria in IAS 38 "Intangible Assets" are met. Development costs for internally generated intangible assets are recognized at cost to the extent the Company can demonstrate the technical feasibility of completing the asset, how the asset will generate future economic benefit, the availability of resources to complete the asset and the ability to measure reliably the expenditure during the development. If the requirements for capitalization are not fulfilled, development costs are expensed as incurred.
The Company recognizes subscriber acquisition costs incurred to obtain new subscribers if the costs are directly attributable to obtaining specific contracts, are incremental, can be measured reliably and meet the definition and recognition criteria of an intangible asset in accordance with IAS 38. Subscriber acquisition costs incurred to obtain new contracts without an initial contract period (open-ended contracts) are expensed as incurred.
Following initial recognition, intangible assets are carried at cost less any accumulated depreciation and any accumulated impairment loss.
Subsequent Expenses
Subsequent investments in intangible assets will be capitalized if they qualify for recognition as an intangible asset.
Amortization of Intangible Assets
The estimated useful life of the customer list is based on the average number of terminations and the term of the average contract life of individual end users who generate significant contribution margins.
The amortization of other intangible assets with definite useful lives is based on the straight-line method over the assets' estimated useful lives. Amortization begins when the intangible asset is ready for use.
The Company recognizes subscriber acquisition costs incurred to obtain new subscribers. The Company amortizes these costs over the initial contract period except for contracts where there is past evidence regarding the expected customer relationship period.
The amortization expense is recognized in the statement of operations in the expense category consistent with the function of the intangible assets.
61
Table of Contents
The useful lives are estimated as follows:
| | |
• Customer list | | 8.5 years |
• Software and licenses | |
1-10 years |
• Subscriber acquisition costs | |
1-8.5 years |
The appropriateness of the useful life for the customer list is validated on an annual basis.
Financial Instruments
Recognition and Derecognition of Financial Instruments
Financial assets and liabilities are recognized when the Company enters into a contractual relationship with the respective counterparty or issuer. A financial asset is derecognized when:
- •
- the rights to receive cash flows from the asset have expired;
- •
- the Company retains the right to receive cash flows from the asset but has assumed an obligation to pay those cash flows in full without material delay to a third party under a 'pass-through' arrangement; or
- •
- the Company has transferred its rights to receive cash flows from the asset and either (a) has transferred substantially all the risks and rewards of the asset, or (b) has neither transferred nor retained substantially all the risks and rewards of the asset but has transferred control of the asset.
A financial liability is derecognized when the obligation under the liability is discharged, canceled or expired.
Where an existing financial liability is replaced by another one from the same lender on substantially different terms, or the terms of an existing liability are substantially modified, such an exchange or modification is treated as a derecognition of the original liability and the recognition of a new liability, and the difference in the respective carrying amounts is recorded in the consolidated statement of operations.
Financial Assets
Financial assets in the scope of IAS 39 'Financial Instruments: Recognition and Measurement' are classified as either financial assets at fair value through profit or loss, loans and receivables, held-to-maturity investments, or available-for-sale financial assets, as appropriate. When financial assets are initially recognized they are measured at fair value plus, in the case of investments not at fair value through profit or loss, directly attributable transaction costs. The Company determines the classification of its financial assets after initial recognition and, where allowed and appropriate, reevaluates this designation at each financial year-end. All purchases and sales of financial assets are recognized on the trade date, which is the date that the Company commits to purchase the asset.
Financial Assets at Fair Value through Profit or Loss
Financial assets classified as held for trading are included in the category "financial assets at fair value through profit or loss". Financial assets are held for trading if they are acquired for the purpose of selling in the near term. Derivatives are also classified as held for trading unless they are designated and effective hedging instruments. Gains or losses on investments held for trading are recognized in the consolidated statement of operations.
62
Table of Contents
Loans and Receivables
Loans and receivables are non-derivative financial assets with fixed or determinable payments that are not quoted in an active market. Such assets are carried at amortized cost using the effective interest method. Gains and losses are recognized in the consolidated statement of operations when the loans and receivables are extinguished or impaired as well as through the amortization process.
Available-for-sale Financial Assets
Available-for-sale financial assets are those non-derivative financial assets that are designated as available-for-sale or are not classified in any of the three preceding categories. After initial recognition available-for-sale financial assets are measured at fair value with gains or losses being recognized as a separate component of equity until the investment is sold or until the investment is determined to be impaired at which time the cumulative gain or loss previously reported in equity is included in the statement of operations.
Financial Liabilities
Financial liabilities (loans) are initially recognized at cost which corresponds to the fair value of the given consideration received net of issue costs associated with the financial liabilities. In subsequent periods, liabilities are measured at amortized cost using the effective interest method with the exception of derivative financial instruments which are measured at their fair market value.
Derivative Financial Instruments
Derivative financial instruments are used exclusively for the purpose of hedging foreign currency and interest rate risks arising from financing activities. In accordance with IAS 39, all derivative financial instruments are accounted for at fair value irrespective of the purpose or the intention for which they were incurred. Depending on whether it is a fair value hedge or a cash flow hedge, changes in the fair value of the derivative financial instruments for which hedge accounting is used are either reported in the statement of operations or in the statement of changes in equity under cash flow hedge reserve. In the case of a fair value hedge, the gains or losses from the measurement of derivative financial instruments at fair value and the gains or losses related to the underlying contracts are recognized in the consolidated statement of operations. In the case of changes in the fair value of cash flow hedges which are used to offset future cash flow risks arising from underlying transactions or planned transactions and which have proved to be 100% effective in accordance with IAS 39, unrealized gains and losses are initially recognized in equity as a cash flow hedge reserve.
If the cash flow hedge is not 100% effective, the ineffective portion of changes in the fair value of the derivative designated as cash flow hedge is recognized in consolidated statement of operations. If hedge accounting cannot be used by the Company, the change in the fair value of derivative financial instruments is recorded in the consolidated statement of operations.
Equity Investments in Associates
Investments in associates are accounted for using the equity method at the investor's share of equity pursuant to IAS 28 "Investments in Associates". The Company's share of income, reduced by distributions and amortization of write-ups in amortizable assets from purchase accounting is disclosed in the fixed asset register as a change in equity investment.
Trade and Other Receivables
Trade and other receivables are disclosed at their nominal amount less bad debt allowances for any amounts deemed uncollectible. In relation to trade receivables, a provision for impairment is made
63
Table of Contents
when there is objective evidence (such as the probability of insolvency or significant financial difficulties of the debtor) that the Company will not be able to collect all of the amounts due under the original terms of the invoice. The carrying amount of the receivable is reduced through use of an allowance account. Impaired debts are derecognized when they are assessed as uncollectible.
Impairment
The carrying amount of intangible assets and property and equipment is reviewed at every balance sheet date to determine whether there are any indications of impairment. If such indications exist or when annual impairment testing is required, the recoverable amount is estimated. Impairment is necessary when the carrying amount of an asset or the related cash-generating unit exceeds the recoverable amount. The corresponding impairment is expensed.
Goodwill is tested for impairment annually (as at March 31) and when circumstances indicate that the carrying amount value may be impaired. Impairment is determined for goodwill by assessing the recoverable amount of each cash-generating unit to which the goodwill relates. Where the recoverable amount of the cash-generating unit is less than their carrying amount, an impairment loss is recognized. Impairment losses for goodwill are not reversed in subsequent periods.
If there is objective evidence that an impairment loss on loans and receivables carried at amortized cost has been incurred, the amount of the loss is measured as the difference between the asset's carrying amount and recoverable amount, i.e. the higher of the present value of estimated future cash flows discounted at the financial asset's original effective interest rate and fair value less cost to sell. The carrying amount of the receivable is reduced through use of an allowance account. Impaired debts are derecognized when they are assessed as uncollectible.
Determination of Recoverable Amount
The recoverable amount of an asset is the greater of its fair value less costs to sell and its value in use. Value in use is determined by discounting the estimated future cash flows to be derived from continuing use of the asset until its ultimate disposal. The discount rate is based on a pre-tax interest rate that reflects current market assessments of the fair value of money and the risks specific to the asset.
For assets to which no cash flows can be directly attributed, the recoverable amount is determined for the cash-generating unit to which the asset belongs.
Reversal of Impairment Loss
Impairment losses on assets are reversed when assumptions relating to the recoverable amount of the assets change. Impairment losses are only reversed up to the carrying amount of the asset which would have been recorded if the asset had been subject to standard depreciation without impairment.
Employee Benefits
Under the Company's pension plans, KDG provides employees post-employment benefits under a defined benefit plan. The benefits are unfunded.
The present value of future claims of participants is estimated using actuarial methods based on the amount of benefit earned for their service in the current and prior periods. The liabilities to be recognized in the consolidated balance sheet result from the present value of the defined benefit obligation adjusted for any actuarial gains or losses, and less any past service cost not yet recognized. The discount rate is determined by reference to the capital markets and takes into account the expected maturity of the obligation. KDG engaged qualified external actuaries to perform the necessary actuarial calculations. The obligation is determined using the projected unit credit method.
64
Table of Contents
If the benefits of the pension plan improve, the share of those plan improvements relating to the employees' previous years of service will be recognized as an expense on a straight-line basis over the period in which the claims vest. If the claims have already vested, the prior service cost is expensed immediately.
In measuring the obligations arising from the defined benefit plans, actuarial gains and losses arising after April 1, 2003 are not recognized in the consolidated statement of operations until the cumulative outstanding amounts exceed a corridor of 10% (corridor approach) of the defined benefit obligation as of the measurement date. The portion of the amount exceeding the corridor is amortized to the consolidated statement of operations over the remaining average service life of the employees entitled to pensions.
Other Provisions
Other provisions are recognized in the consolidated balance sheet pursuant to IAS 37 "Provisions, Contingent Liabilities and Contingent Assets" when a legal or constructive obligation to a third party arises as a result of past events. An outflow of resources embodying economic benefits will be required to settle the obligation and the anticipated amount of the provision can be reliably estimated. Non-current other provisions are stated at their discounted settlement value on the balance sheet date where the effect of the time value of money is material.
Revenue and Other Income
Revenue is recognized to the extent it is probable that the economic benefits will flow to the Company and revenue can be reliably measured. The different types of revenue are recognized as follows:
Installation and Network Connection
Revenue from the installation of the cable connection and the network connection is recognized when the services have been rendered, the costs incurred can be measured reliably and the Company is not obliged to provide any future network connection or installation services.
Rendering of Services
Revenue generated by the delivery of analog and digital pay products, internet and telephone services, as well as carriage fees and digital playout facility fees paid by television broadcasters, are recognized when services have been provided, the costs incurred can be measured reliably and the Company is not obliged to provide any future services. Prepayments are accounted for by deferring the received payments and amortizing them straight-line over the service period.
When free months are offered to customers in relation to a subscription, the Company recognizes the total amount of billable revenue in equal monthly installments over the term of the contract, provided that the Company has the enforceable and contractual right to deliver the customer with the products after the promotional free month period. If free months are given without a contract at the beginning of a subscription period, the company does not recognize revenues during the free months as the customer's continuance is not assured.
Sale of Goods
Revenue from the sale of digital set top boxes, cable modems, and other goods is recognized when the significant risks and rewards of ownership of the goods have passed to the buyer. If the Company acts as an agent, revenue is only recognized in the amount of the sales commissions.
65
Table of Contents
Multiple Elements Arrangements
For bundled services in multiple element arrangements the Company recognizes revenue for each element on the basis of the relative fair value of each item in the transaction if there is evidence of fair value.
Share-Based Payments
The Company applies IFRS 2 "Share-Based Payment". Under IFRS 2, plans which result in share-based payment transactions have to be accounted for as cash-settled if the interest holder will receive a payment in cash upon settlement rather than the underlying equity instruments. Due to the terms of the different programs at KDG, it is highly likely that the general partner of Cayman Cable Holding L.P. (the Partnership) will exercise the existing repurchase option in most cases of the interest holders' termination of employment and settle in cash. Alternatively, employees leaving the Company may have the option to put their vested interests to Cayman Cable for cash. In the case of a put or call, the employee is generally protected from decreases in fair value below their initial investment amount. For such cash-settled share-based payment transactions, IFRS 2 requires the entity to account for share-based payments to management as personnel expense and a corresponding increase in other liabilities. For interests in the Management Equity Participation Program I (MEP I) and in the Management Equity Participation Program IV (Indirect MEP IV), which are share acquisition programs, the costs of cash-settled transactions are measured initially based on the notional amount paid.
For MEP II and III, as well as the MEP IV Option program and MEP V, which all are option programs, the costs of cash-settled transactions are measured initially at fair value at the grant date using the Black-Scholes model taking into account the terms and conditions upon which the instruments were granted because it is typically not possible to reliably estimate the fair value of employee services received. This fair value is expensed over the period until vesting with recognition of a corresponding liability.
For all MEP programs the services received during the vesting periods and, therefore, the corresponding liabilities, are remeasured at each balance sheet date up to and including the settlement date with changes in fair value recognized in the consolidated statement of operations.
Benefits/Taxes on Income
Current income tax assets and liabilities are measured at the amount expected to be recovered from or paid to the taxation authorities. The tax rates and tax laws used to compute the amounts are those that are enacted or substantively enacted by the balance sheet date.
Except for those cases described below, deferred income tax is provided using the liability method on all temporary differences between the tax basis of assets and liabilities and their carrying amounts for financial reporting purposes at the balance sheet date.
Deferred income tax liabilities are recognized for all taxable temporary differences, except:
- •
- where the deferred income tax liability arises from the initial recognition of goodwill or of an asset or liability in a transaction that is not a business combination and, at the time of the transaction, affects neither the accounting profit nor taxable profit or loss; and
- •
- for temporary taxable differences associated with investments in subsidiaries, associates and interests in joint ventures, where the timing of the reversal of the temporary differences can be controlled and it is probable that the temporary differences will not reverse in the foreseeable future.
66
Table of Contents
Deferred income tax assets are recognized for all temporary deductible differences, carry forward of unused tax credits and unused tax losses to the extent that it is probable that taxable profit will be available against which the deductible temporary differences and the carry forward of unused tax credits and unused tax losses can be utilized:
- •
- except where the deferred income tax asset relating to the temporary deductible difference arises from the initial recognition of an asset or liability in a transaction that is not a business combination and, at the time of the transaction, affects neither the accounting profit or loss nor taxable profit or loss;
- •
- except that temporary deductible differences associated with investments in subsidiaries, associates and interests in joint ventures, deferred tax assets are only recognized to the extent that it is probable that the temporary differences will reverse in the foreseeable future and taxable profit will be available against which the temporary differences can be utilized.
The carrying amount of deferred income tax assets is reviewed at each balance sheet date and reduced to the extent that it is no longer probable that sufficient taxable profit will be available to allow all or part of the deferred income tax asset to be utilized.
Deferred income tax assets and liabilities are measured at the tax rates that are expected to apply to the year when the asset is realized or the liability is settled, based on tax rates (and tax laws) that have been enacted or substantively enacted at the balance sheet date.
Income taxes relating to items recognized directly in equity are recognized in equity and not in the statement of operations.
Deferred tax assets and deferred tax liabilities are offset if a legally enforceable right exists to set off current tax assets against current tax liabilities and the deferred taxes relate to the same taxable entity and the same taxation authority.
Key Judgments and Estimation Uncertainty
The preparation of the consolidated financial statements in accordance with IFRS requires judgments and estimations to be made which have an effect on the carrying amounts of recognized assets and liabilities, income and expenses and contingent liabilities. In some cases, the actual values may differ from the judgments and estimations. Changes are recognized in the consolidated statement of operations when better information is available.
Key Judgments
In the process of applying KDG's accounting policies, management has made the following judgments, apart from those involving estimations, which have the most significant effect on the amounts recognized in the consolidated financial statements.
Derivatives
The Company has entered into interest rate swaps, interest rate caps and currency swaps to hedge its risks resulting from exposure to changes in interest rates and foreign currency rates. All of these derivative instruments have been accounted for in accordance with IAS 39 at fair value irrespective of the purpose or the intention for which they were used. The currency swaps with a maturity in June 2009 were consistently classified as cash flow hedges.
Operating Leases for CPE
The Company offers products that contain signal delivery and the right to use hardware devices. The hardware devices are essential for the signal delivery to the customer. Since the fulfillment of these
67
Table of Contents
arrangements is dependent on the use of a specific asset and the arrangements convey a right to use the asset, the contracts contain a lease in accordance with IFRIC 4 (KDG as lessor).
Hardware devices are recognized as equipment in accordance with IAS 16 and amortized over the useful life of three years.
Operating Lease Cable Ducts
In certain cases KDG leases space in the cable ducts of Deutsche Telekom AG (DTAG) to house KDG's network cable. The Company has determined that it retains no significant risks and rewards of ownership of these cable ducts and, therefore, accounts for the leases as operating leases.
Finance Lease Transponders
The Company has leased specific satellite transponders in order to transmit audio and video signals. The Company has determined that the rights to use specific transponders have been transferred and that the lease term of specific transponders covers the major part of the economic life of the transponders. Therefore, the Company has classified and accounted for the leases as finance leases according to IAS 17.
Estimation Uncertainty
The key assumptions concerning the future and other key sources of estimation uncertainty at the balance sheet date that have a significant risk of causing a material adjustment to the carrying amounts of assets and liabilities within the next financial year are discussed below.
Derivatives
The fair values of the derivative financial instruments as of the balance sheet date have been estimated at the net present values (discounted by market yield curves) of the future payments and using standard models (in the case of caps). The total fair values of the derivative financial instruments amounted to liabilities of €57.7 million, €116.3 million and €53.2 million as of March 31, 2009, March 31, 2008 and 2007, respectively.
Share-Based Payments
As of March 31, 2006 and for periods prior to this, it was management's intention to settle MEP I using the formula price as stated in the respective limited partnership agreement. Effective April 19, 2006 and in connection with the 5th amendment to the limited partnership agreement, the controlling shareholders of Cayman Cable modified the settlement terms of MEP I interests in Cayman Cable Holding L.P to better reflect current market value conditions, changing the settlement formula from an EBITDA formula with fixed multiples to estimated fair value. The change in the fair price estimation resulted in an increase in personnel expenses in the amount of €36.8 million for the fiscal year ended March 31, 2007.
Based on the 5th amendment to the limited partnership agreement, the fair value measurement for MEP IV interests is based on the same valuation method as is used for MEP I.
The measurement of the fair value at grant date with respect to the MEP II and MEP III option plans as well as to the MEP IV Option Program and MEP V is based on the Black-Scholes option pricing model. The main parameters, the expected volatility of the values of the shares, the estimated term of the options and the risk free interest rate on grant date were estimated by the Company.
68
Table of Contents
The Company recognized expenses with respect to all MEP plans in an amount of €2.0 million, €23.0 million and €41.8 million for the years ended March 31, 2009, March 31, 2008 and March 31, 2007, respectively.
Internally Developed Software
The Company recognized intangible assets developed internally (consisting of software used by the Company) to the extent the criteria of IAS 38 were met. Development costs for internally generated intangible assets are recognized at cost to the extent the assets are economically usable and the costs can be reliably measured. For the years ended March 31, 2009, March 31, 2008 and March 31, 2007, respectively, approximately €3.9 million, €2.5 million and €1.0 million of costs for internally developed software were capitalized.
Customer List
The customer list is primarily amortized on a straight-line basis over 8.5 years. The estimated useful life is based on the average number of terminations and the term of the average contract life. The book value of the customer list amounted to €433.1 million, €317.8 million and €382.4 million for the years ended March 31, 2009, March 31, 2008 and March 31, 2007, respectively.
Provision for Pensions
With respect to the actuarial calculation of the provision for pensions, the Company estimated the future salary increases, future pension increases and the discount rate. As of March 31, 2009, March 31, 2008 and March 31, 2007, the provision for pensions amounted to €35.3 million, €29.1 million and €24.2 million, respectively.
Asset Retirement Obligations
The amount of the accrual is based on an estimate of the costs expected for the demolition and restoration of the technical facilities. Expectations regarding the lessor waiving asset retirement performance requirements are factored into the calculation of best estimate of the obligation related to the leased cable ducts under IFRS. Approximately 93% of KDG's obligations are related to technical equipment, including different kinds of cable and signal transmitting and receiving technology in cable ducts of DTAG. KDG assumes that 6% of the technical equipment will be replaced by other technologies after 10 years, 28% will be replaced after 15 years and the remaining 66% of the technical equipment is expected to be replaced after 30 years. The remaining 7% of the asset retirement obligations are divided into accruals for furniture, fixtures and miscellaneous restoration obligations. The asset retirement obligations amounted to €23.0 million, €20.7 million and €20.6 million as of March 31, 2009, March 31, 2008 and March 31, 2007, respectively.
In the following comparisons of financials between the fiscal years ended March 31, 2009 with March 31, 2008 as well as the fiscal years ended March 31, 2008 with March 31, 2007 the percentages are taken out of the audited annual report, which is available on our website www.kabeldeutschland.com. In the audited annual report all numbers are calculated in €thousand as compared to €million in the annual report on 20-F. Therefore there may be a deviation in the percentage numbers.
69
Table of Contents
Comparison of Operating Results for the fiscal years ended March 31, 2009 with March 31, 2008
Revenues
The following chart gives an overview of the Company's revenues. Total revenues for the fiscal year ended March 31, 2009 increased by €173.4 million or 14.5% to €1,370.3 million from €1,196.9 million for the fiscal year ended March 31, 2008.
| | | | | | | |
| | Fiscal Year Ended
March 31, | |
|---|
| | 2009 | | 2008 | |
|---|
| | (€ million)
| |
|---|
Cable Access | | | 911.2 | | | 867.1 | |
TV/Radio | | | 192.3 | | | 179.8 | |
Internet & Phone | | | 231.9 | | | 121.4 | |
TKS | | | 34.9 | | | 28.6 | |
| | | | | | |
Total Revenues | | | 1,370.3 | | | 1,196.9 | |
| | | | | | |
Cable Access
Cable Access contains all activities and services linked to the customer's physical access to the Company's cable network, either directly to end customers or indirectly through commercial level 4 operators for which the Company charges a fee.
Cable Access has historically been the primary basis for services offered by the Company, including TV/Radio and Internet & Phone services. In September 2007, the Company revised its strategy of requiring cable access as a basis for subscribing to Internet & Phone in order to reach customers not using cable television.
Our Cable Access business generates revenues through subscription fees, installation fees and other revenues. Through our cable television access business we generated €911.2 million or approximately 66.5% of our total revenues for the fiscal year ended March 31, 2009.
- •
- Cable Access Subscription Fees paid for the access to our network and the delivery of analog and digital signals are generated from individuals, businesses and housing associations. Our primary cable access offering consists of between 32 and 41 analog television channels (depending on the region served) and up to 36 analog radio channels. Since April 2006 a basic digital service for single family homes has been offered under the brand name "Digitaler Kabelanschluss". This product includes the digital programs offered by the public broadcasters and most of the commercial broadcasters in Germany. In total, up to 104 digital free-to-air (FTA) channels and 74 free digital radio channels are offered in the digital access product. The product includes an enhanced electronic program guide (EPG) and access to a pay-per-view service. Additionally, the Company provides the customer with a set top box free of charge to upgrade to digital access.
- •
- Installation and network connection fees and reimbursements. Generally, first-time subscribers are charged an installation fee upon initial connection to our network. In addition, we generate fees and receive reimbursements for connecting newly built homes to our network.
- •
- Other revenues are primarily generated from Level 4 services (e.g. maintenance service).
70
Table of Contents
Cable Access Revenues
| | | | | | | |
| | Fiscal Year
Ended
March 31, | |
|---|
| | 2009 | | 2008 | |
|---|
| | (€ million)
| |
|---|
Cable Access Subscription Fees | | | 898.9 | | | 854.1 | |
Installation Fees | | | 7.9 | | | 7.6 | |
Other Revenues | | | 4.4 | | | 5.4 | |
| | | | | | |
Total Cable Access Revenues | | | 911.2 | | | 867.1 | |
| | | | | | |
| | | | | | | |
ARPU(17) | | (€) | |
|---|
Cable Access | | | 8.14 | | | 7.79 | |
| | | | | | |
| | | | | | | |
| | As of March 31, | |
|---|
RGUs(18) | | 2009 | | 2008 | |
|---|
| | (in thousand)
| |
|---|
Cable Access | | | 9,208 | | | 8,936 | |
| | | | | | |
- (17)
- The cable access ARPU only relates to cable access subscription fees.
- (18)
- TKS RGUs are not included; therefore the figures differ from Cable Access RGUs on page 4.
For the fiscal year ended March 31, 2009Cable Access Subscription Fees increased by €44.8 million or 5.2% to €898.9 million from €854.1 million for the fiscal year ended March 31, 2008. The increase primarily results from additional revenues as a result of the Acquisition.
For the fiscal year ended March 31, 2009Installation Fees increased by €0.3 million or 3.8% to €7.9 million from €7.6 million for the fiscal year ended March 31, 2008.
For the fiscal year ended March 31, 2009Other Revenues decreased by €1.0 million or 18.7% to €4.4 million from €5.4 million for the fiscal year ended March 31, 2008. The decrease is related to the completion of a construction project in the fiscal year ended March 31, 2008, where we acted as a subcontractor and built the Level 4 network for which we charged a housing association.
The Cable AccessARPU increased by €0.35 or 4.5% to €8.14 in the fiscal year ended March 31, 2009 from €7.79 in the fiscal year ended March 31, 2008. This increase is primarily due to the Acquisition, as subscribers were reclassified from the low wholesale ARPU segment into higher B2C and B2B ARPU segments.
TV/Radio
In addition to the Cable Access subscription business described above, the Company offers its own pay-TV product portfolio. The Company's pay-TV packages are branded as Kabel Digital Home and Kabel Digital International. Kabel Digital Home offers 43 basic pay-TV channels within seven genres (documentaries, feature films and series, sports, entertainment, children's TV, music and adult programming) dedicated to a German-speaking audience. Kabel Digital International comprises 42 foreign-language pay-TV channels catering to the demand of Germany's ethnic populations. The Company sells its pay-TV packages directly to consumers and, to a lesser extent, indirectly through certain Level 4 operators and an unaffiliated regional cable television operator. Under these agreements, the wholesale customer typically receives a discount on our listed retail subscription fee.
71
Table of Contents
Our TV/Radio business generates revenue through carriage fees, subscription fees and customer premise equipment (CPE; e.g. receivers) sales.
- •
- Analog carriage fees. In addition to providing basic cable television services to its subscribers, the Company charges more than 250 international, national, regional and local broadcasters' carriage fees for delivering their television and radio signals over the Company's network. These carriage fees are typically based on the number of homes into which the signal is delivered.
- •
- Digital carriage fees are derived from the transmission of digital television programs on behalf of third party program providers. The Company also delivers digital television programming offered by the public broadcasters, most of the large private free-to-air (FTA) broadcasters and an unaffiliated pay-TV operator in Germany. The unaffiliated pay-TV operator pays fixed carriage fees as well as conditional access-service fees.
- •
- Pay-TV subscription fees and CPE sales. Homes connected to our network can receive the digital programming of the public broadcasters and most private broadcasters free of charge if they are digital cable access subscribers and have a digital receiver (set top box) and an activated smartcard. Customers can also subscribe to the Company's pay-TV product portfolio containing Kabel Digital Home and Kabel Digital International as well as to a pay-per-view service. In addition, customers can subscribe to the Company's Digital Video Recorder (DVR) product, Kabel Digital+, which contains an enhanced digital receiver with an integrated hard disc drive and a more sophisticated EPG.
Revenues TV/Radio
| | | | | | | |
| | Fiscal Year
Ended
March 31, | |
|---|
| | 2009 | | 2008 | |
|---|
| | (€ million)
| |
|---|
Analog/Digital Carriage Fees | | | 97.2 | | | 100.0 | |
Pay TV Subscription Fees | | | 87.4 | | | 71.3 | (19) |
Other Digital Revenues | | | 7.7 | | | 8.5 | (19),(20) |
| | | | | | |
Total TV/Radio revenues | | | 192.3 | | | 179.8 | |
| | | | | | |
| | | | | | | |
ARPU | | (€) | |
|---|
TV/Radio blended | | | 7.94 | | | 7.74 | (21) |
| | | | | | |
| | | | | | | |
| | As of March 31, | |
|---|
RGUs | | 2009 | | 2008 | |
|---|
| | (in thousand)
| |
|---|
Pay TV | | | 849 | | | 779 | |
Kabel Digital+ | | | 114 | | | 35 | (21) |
| | | | | | |
Total TV/Radio RGUs | | | 963 | | | 814 | |
| | | | | | |
- (19)
- Revenues from our product Kabel Digital+ for the fiscal year ended March 31, 2008 in the amount of €1.4 million have been reclassified from other digital revenues to pay TV subscription fees. Therefore the figures for 2008 differ from the published figures for the fiscal year ended March 31, 2008 and from the figures on page 82.
- (20)
- Until September 30, 2008 Playout Facility Fees were shown separately and are now classified as other revenues. Therefore the figure for 2008 differs from the published figure for the fiscal year ended March 31, 2008.
- (21)
- To be able to compare the figures for both dates an adjustment of the figure as of March 31, 2008 was necessary due to a change of the calculation method in 2009.
72
Table of Contents
Carriage Fees decreased by €2.8 million or 2.8% to €97.2 million in the fiscal year ended March 31, 2009 from €100.0 million for the fiscal year ended March 31, 2008. This decrease is due to a decrease of digital carriage fees which were generated by serving the subscribers of two unaffiliated regional operators until December 2007. The future development of carriage fees will depend on the number of subscribers connected to our network.
Pay-TV Subscription Fees increased by €16.1 million or 22.6% to €87.4 million in the fiscal year ended March 31, 2009 from €71.3 million for the fiscal year ended March 31, 2008 primarily resulting from a growing subscriber base.
Other Digital Revenues decreased by €0.8 million or 9.0% to €7.7 million in the fiscal year ended March 31, 2009 from €8.5 million in the fiscal year ended March 31, 2008 primarily due to a decrease of playout facility fees.
The total blended TV/RadioARPU increased by €0.20 or 2.6% to €7.94 in the fiscal year ended March 31, 2009 from €7.74 in the fiscal year ended March 31, 2008. The increase primarily relates to a price increase for new customers to the core Kabel Digital Home product in May 2008.
Internet & Phone
The Company can offer Internet & Phone services to those homes that are passed by its upgraded bi-directional network (630 MHz) and where we have the ability to market our products (Marketable Homes). As of March 31, 2009, the Company passed approximately 12.0 million homes with an upgraded network that had return path capability to enable two-way communication. The Company offers Internet & Phone products independently; however, most customers subscribe to bundled offerings. Prior to September 2007, the Internet & Phone product was only offered to customers who subscribed to cable television access; since then we also offer Internet & Phone to non-cable television access subscribers. As of March 31, 2009, the Company served approximately 806,000 subscribers that generated approximately 707,000 Internet and 710,000 Phone RGUs.
Internet & Phone Revenues
| | | | | | | |
| | Fiscal Year
Ended
March 31, | |
|---|
| | 2009 | | 2008 | |
|---|
| | (€ million)
| |
|---|
Subscription Fees (recurring) | | | 222.1 | | | 115.8 | |
Installation Fees and other non-recurring revenues | | | 9.8 | | | 5.6 | |
| | | | | | |
Total Internet & Phone Revenues | | | 231.9 | | | 121.4 | |
| | | | | | |
| | | | | | | |
ARPU | | (€) | |
|---|
Kabel Internet & Kabel Phone blended | | | 17.04 | | | 19.11 | |
| | | | | | |
| | | | | | | |
| | As of March 31, | |
|---|
RGUs | | 2009 | | 2008 | |
|---|
| | (in thousand)
| |
|---|
Kabel Internet | | | 707 | | | 393 | |
Kabel Phone | | | 710 | | | 361 | |
| | | | | | |
Total Internet & Phone RGUs | | | 1,417 | | | 754 | |
| | | | | | |
73
Table of Contents
Revenues for Internet & Phone include recurring revenue from monthly subscription fees and non-recurring revenue from installation fees and the sale of CPE.
In the fiscal year ended March 31, 2009,Subscription Fees increased rapidly by €106.3 million to €222.1 million from €115.8 million for the fiscal year ended March 31, 2008. This increase was primarily due to the strong increase of Internet & Phone RGUs.
In the fiscal year ended March 31, 2009,Installation Fees and other non-recurring revenues increased by €4.2 million or 78.2% to €9.8 million from €5.6 million for the fiscal year ended March 31, 2008. This increase is primarily related to an increase in the number of installations of Internet & Phone connections and an increase in revenues from the sale of CPE (e.g. DECT phones and WLAN router).
The Internet & PhoneARPU decreased by €2.07 or 10.8% to €17.04 in the fiscal year ended March 31, 2009 from €19.11 for the fiscal year ended March 31, 2008 which was primarily driven by promotional activities in order to be more competitive in the fast growing Internet & Phone market.
TKS—Telepost Kabel-Service Kaiserslautern GmbH & Co. KG
TKS, a wholly owned subsidiary of KDVS, provides cable access, internet and phone services to NATO military personnel based in Germany. It also provides billing services for telephone customers of Deutsche Telekom AG (DTAG) who prefer English-language bills.
Additionally, TKS sells certain telecommunication products to personnel on NATO military bases, such as prepaid mobile phones, cash cards, and telecommunication related products and services.
TKS Revenues
| | | | | | | |
| | Fiscal Year
Ended
March 31, | |
|---|
| | 2009 | | 2008 | |
|---|
| | (€ million)
| |
|---|
Internet Revenues | | | 8.8 | | | 6.4 | |
Phone Service Revenues | | | 7.3 | | | 1.3 | |
Billing services revenues | | | 6.6 | | | 7.2 | |
Merchandise | | | 4.7 | | | 4.0 | |
Cable Television Revenues | | | 4.5 | | | 4.6 | |
Mobile Phone Service Revenues | | | 2.1 | | | 4.5 | |
Other Revenues | | | 0.9 | | | 0.6 | |
| | | | | | |
Total TKS Revenues | | | 34.9 | | | 28.6 | |
| | | | | | |
TKS revenues increased by €6.3 million or 21.9% to €34.9 million for the fiscal year ended March 31, 2009 from €28.6 million for the fiscal year ended March 31, 2008. The increase is primarily related to the TKS bundled product 'Surf'n'Talk', which was introduced in November 2007 and which combines Internet services and Phone services. Partly offsetting this positive impact was a decrease in revenues from Mobile Phone services. This product was not actively offered in the fiscal year ended March 31, 2009.
74
Table of Contents
Expenses
Total expenses for the fiscal year ended March 31, 2009 increased by €181.6 million or 17.0% to €1,251.6 million from €1,070.0 million for the fiscal year ended March 31, 2008.
| | | | | | | |
| | Fiscal Year Ended
March 31, | |
|---|
| | 2009 | | 2008 | |
|---|
| | (€ million)
| |
|---|
Cost of Services Rendered | | | 696.6 | | | 588.5 | |
Selling Expenses | | | 425.6 | | | 352.8 | |
General and Administrative Expenses | | | 129.4 | | | 128.7 | |
| | | | | | |
Total Expenses | | | 1,251.6 | | | 1,070.0 | |
| | | | | | |
Included in total operating expenses for the fiscal year ended March 31, 2009 are accrued costs regarding different restructuring plans in the amount of €29.2 million compared to €1.4 million for the fiscal year ended March 31, 2008.
Cost of Services Rendered
Cost of Services Rendered are primarily costs related to providing services to our customers.
| | | | | | | |
| | Fiscal Year
Ended
March 31, | |
|---|
| | 2009 | | 2008 | |
|---|
| | (€ million)
| |
|---|
Cost of Materials and Services | | | 344.5 | | | 314.0 | |
Personnel Expenses | | | 62.3 | | | 44.2 | |
Depreciation and Amortization | | | 205.5 | | | 154.7 | |
Other Cost and Expenses | | | 84.3 | | | 75.6 | |
| | | | | | |
Total Cost of Services Rendered | | | 696.6 | | | 588.5 | |
| | | | | | |
In the fiscal year ended March 31, 2009, cost of services rendered increased by €108.1 million or 18.4% to €696.6 million from €588.5 million for the fiscal year ended March 31, 2008. Included in costs of services rendered for the fiscal year ended March 31, 2009 are accrued expenses for the restructuring of the technical department in the amount of €22.1 million. In the fiscal year ended March 31, 2008 costs of services rendered included accrued expenses for restructuring of €1.1 million.
Cost of Materials and Services primarily include Service Level Agreements (SLA) with DTAG which are related to the lease of duct space, co-location facilities, fiber optic systems and energy. In addition to SLA payments, cost of materials and services include content expenses, maintenance of our network, conditional access license expenses, special services for Internet & Phone and other materials and services. In the fiscal year ended March 31, 2009, cost of materials and services increased by €30.5 million or 9.7% to €344.5 million from €314.0 million for the fiscal year ended March 31, 2008. Cost of materials and services in the fiscal year ended March 31, 2009 corresponds to 25.1% of our total revenues compared to 26.2% in the fiscal year ended March 31, 2008.
Expenses for SLAs increased by €10.8 million or 6.6% to €175.8 million for the fiscal year ended March 31, 2009 from €165.0 million in the fiscal year ended March 31, 2008 primarily due to the need for more network capacity due to the growth of the Company's Internet & Phone business.
In the fiscal year ended March 31, 2009, content costs, primarily for pay-TV activities, increased slightly by €2.5 million or 5.7% to €47.4 million from €44.9 million in the fiscal year ended March 31, 2008.
75
Table of Contents
Costs for interconnect increased by €11.5 million or 70.2% to €27.9 million for the fiscal year ended March 31, 2009 from €16.4 million for the fiscal year ended March 31, 2008 primarily related to the increase in phone subscribers. Interconnection costs will continue to increase as the number of phone subscribers increases.
Network expenses increased by €6.0 million or 42.6% to €20.2 million for the fiscal year ended March 31, 2009 from €14.2 million for the fiscal year ended March 31, 2008 primarily due to the continued expansion of our upgraded networks and the addition of broadband capacity (e.g. by leasing of regional backbones). As long as the Company continues to extend the upgraded network and to add additional capacity and customers, network costs will continue to increase.
Expenses for installation increased by €3.0 million to €3.2 million for the fiscal year ended March 31, 2009 from €0.2 million for the fiscal year ended March 31, 2008 primarily due to a new full service PC installation offering related to a HSI installation.
In the fiscal year ended March 31, 2009 other cost of materials and services decreased by €3.3 million or 4.6% to €70.0 million from €73.3 million for the fiscal year ended March 31, 2008.
Personnel Expenses include wages, salaries, social security and pension costs related to the technical staff as well as expenses for restructuring and to a smaller extent non-cash expenses related to the Management Equity Participation program. In the fiscal year ended March 31, 2009 personnel expenses included €20.8 million restructuring expenses compared to €2.4 million in the fiscal year ended March 31, 2008. The increase is primarily due to the restructuring of our technical department which was agreed with the Company's works council in December 2008. In the fiscal year ended March 31, 2009 personnel expenses included non-cash expenses related to the Management Equity Participation program ('MEP') in the amount of €0.1 million compared to €0.8 million in the fiscal year ended March 31, 2008. Personnel expenses adjusted by restructuring expenses and the Management Equity Participation program remained relatively stable at €41.4 million in the fiscal year ended March 31, 2009 compared to €41.0 million for the fiscal year ended March 31, 2008.
Depreciation and Amortization expenses primarily include the depreciation of the network and capitalized leased transponders. In the fiscal year ended March 31, 2009, depreciation and amortization expenses increased by €50.8 million or 32.9% to €205.5 million from €154.7 million for the fiscal year ended March 31, 2008, primarily due to substantial investments made to upgrade the network for two way capacity during the last year. The increase is also related to increased expenses due to the amortization of the fixed assets purchased in the Acquisition.
Other Cost and Expenses primarily include copyright fees, IT, rent for technical infrastructure and other miscellaneous expenses. In the fiscal year ended March 31, 2009, other cost and expenses increased by €8.7 million or 11.3% to €84.3 million from €75.6 million for the fiscal year ended March 31, 2008 primarily due to accrued expenses for the restructuring of the technical department, increased expenses for temporary employees regarding the integration process of the Acquisition and increased IT expenses for the expansion of our Internet & Phone business.
76
Table of Contents
Selling Expenses
Selling Expenses are expenses incurred to support the sales effort of the Company's products and services.
| | | | | | | |
| | Fiscal Year
Ended
March 31, | |
|---|
| | 2009 | | 2008 | |
|---|
| | (€ million)
| |
|---|
Cost of Materials and Services | | | 23.1 | | | 26.1 | |
Personnel Expenses | | | 84.9 | | | 71.4 | |
Depreciation and Amortization | | | 169.4 | | | 115.5 | |
Other Cost and Expenses | | | 148.2 | | | 139.8 | |
| | | | | | |
Total Selling Expenses | | | 425.6 | | | 352.8 | |
| | | | | | |
In the fiscal year ended March 31, 2009, selling expenses increased by €72.8 million or 20.6% to €425.6 million from €352.8 million for the fiscal year ended March 31, 2008.
Cost of Materials and Services included in selling expenses are services related to the general distribution of our products and services. Cost of materials and services decreased by €3.0 million or 11.5% to €23.1 million for the fiscal year ended March 31, 2009 from €26.1 million for the fiscal year ended March 31, 2008. This decrease primarily relates to a decrease in CPE expenses because of a change in the business model; CPE is now rented out instead of being purchased by the customers.
Personnel Expenses include wages, salaries, social security costs and pension costs related to the sales, marketing and call center personnel as well as expenses for restructuring and non-cash expenses related to the Management Equity Participation program. In the fiscal year ended March 31, 2009 personnel expenses included restructuring expenses in the amount of €3.8 million compared to minor amounts in the fiscal year ended March 31, 2008. This primarily results from the accrued expenses associated with the restructuring plan related to the Acquisition and the restructuring program for outsourcing certain functions of the sales back office. In the fiscal year ended March 31, 2009 personnel expenses included non-cash expenses related to the Management Equity Participation program in the amount of €0.6 million compared to €1.6 million in the fiscal year ended March 31, 2008. Personnel expenses adjusted by restructuring expenses and the Management Equity Participation program increased by €10.8 million or 15.5% to €80.6 million in the fiscal year ended March 31, 2009 from €69.8 million in the fiscal year ended March 31, 2008. The increase primarily resulted from an increase in the number of sales and marketing employees.
Depreciation and Amortization expenses primarily include the amortization of the customer list, capitalized sales commissions paid to the Company's sales agents and call center representatives and CPE. The amortization period for the capitalized subscriber acquisition costs depends on the product offered and is 8.5 years for our access products, which corresponds to the expected average life of the contracts, and 12 or 24 months for our pay-TV and Internet & Phone products, which corresponds to the fixed contract duration. Depreciation and amortization expenses increased by €53.9 million or 46.6% to €169.4 million for the fiscal year ended March 31, 2009 from €115.5 million for the fiscal year ended March 31, 2008 due to the additional amortization of the customer list from the Acquisition, higher amortization of capitalized subscriber acquisition costs primarily for Internet & Phone and an increase in depreciation of capitalized CPE.
Other Cost and Expenses within selling expenses primarily include costs for advertising, marketing and sales support, bad debt expenses, sales commissions and other miscellaneous expenses. These costs increased by €8.4 million or 6.0% to €148.2 million for the fiscal year ended March 31, 2009 from €139.8 million for the fiscal year ended March 31, 2008 primarily due to increased expenses for the
77
Table of Contents
promotion and sale of our products. This increase was partially offset by a decrease in bad debt expenses as the result of our enhanced dunning and collection process.
General and Administrative Expenses
General and Administrative Expenses are related to headquarter functions such as senior management, legal, regulatory, finance, human resources, purchasing, IT and investor relations. These are expenses that are not directly allocated to cost of services rendered or to selling expenses.
| | | | | | | |
| | Fiscal Year
Ended
March 31, | |
|---|
| | 2009 | | 2008 | |
|---|
| | (€ million)
| |
|---|
Personnel Expenses | | | 47.6 | | | 64.5 | |
Depreciation and Amortization | | | 27.8 | | | 23.8 | |
Other Cost and Expenses | | | 54.0 | | | 40.4 | |
| | | | | | |
Total General and Administrative Expenses | | | 129.4 | | | 128.7 | |
| | | | | | |
In the fiscal year ended March 31, 2009, general and administrative expenses remained relatively stable at €129.4 million compared to €128.7 million for the fiscal year ended March 31, 2008.
Personnel Expenses include wages, salaries, social security costs and pension costs related to general and administrative personnel as well as non-cash expenses related to the Management Equity Participation program and to a smaller extent expenses for restructuring. In the fiscal year ended March 31, 2009 personnel expenses include non-cash expenses related to the Management Equity Participation program in the amount of €1.3 million compared to €20.6 million in the fiscal year ended March 31, 2008. Personnel expenses adjusted by the Management Equity Participation program and restructuring expenses increased by €2.4 million to €46.1 million in the fiscal year ended March 31, 2009 from €43.7 million in the fiscal year ended March 31, 2008 primarily due to an increase in number of employees. In addition, in the fiscal year ended March 31, 2009 we had less company-produced and capitalized assets, resulting from a greater use of third-party service providers instead of our employees.
Depreciation and Amortization expenses primarily include the depreciation and amortization of IT and standard software licenses. In the fiscal year ended March 31, 2009, these expenses increased by €4.0 million or 16.8% to €27.8 million from €23.8 million for the fiscal year ended March 31, 2008 primarily due to the amortization of several recently deployed IT-applications.
Other Cost and Expenses within general and administrative expenses primarily include costs for IT, external consultants and other miscellaneous expenses. In the fiscal year ended March 31, 2009, other cost and expenses increased by €13.6 million or 33.6% to €54.0 million from €40.4 million for the fiscal year ended March 31, 2008. This primarily results from expenses related to the interim Service Level Agreements for the Acquisition that will be cancelled after completion of the integration phase.
Profit from Ordinary Activities
Profit from ordinary activities for the fiscal year ended March 31, 2009 decreased slightly by €2.7 million to €136.8 million from €139.5 million for the fiscal year ended March 31, 2008.
The change in profit from ordinary activities is primarily related to the issues discussed in the above sections.
78
Table of Contents
Interest Income
Interest income is derived from our bank deposits. In the fiscal year ended March 31, 2009 interest income increased by €1.4 million to €3.5 million from €2.1 million in the fiscal year ended March 31, 2008.
Interest Expenses
Interest expenses include interest accrued on bank loans, the Company's 2014 Senior Notes, amortization of financing fees, interest on finance leases and other interest. Interest expenses increased by €60.7 million or 35.3% to €232.5 million for the fiscal year ended March 31, 2009 from €171.8 million for the fiscal year ended March 31, 2008. This increase is related to an increase in interest expense on the Senior Credit primarily due to the additional borrowings under Tranche C to make the Acquisition, expenses regarding the interest hedges and the mark to market impact of the recently executed forward foreign exchange swaps.
Between December 2008 and March 2009 the Company acquired on a forward currency hedges to effectively prolong the existing swaps which mature in July 2009. The new swap agreements run through July 2011. These swaps are currently not part of a hedge accounting relationship; therefore net gains or losses in fair values are recognized as interest expenses.
In the fiscal year ended March 31, 2009 the Company paid interest in the amount of €206.8 million compared to €177.1 million in the fiscal year ended March 31, 2008.
| | | | | | | |
| | Fiscal Year
Ended
March 31, | |
|---|
| | 2009 | | 2008 | |
|---|
| | (€ million)
| |
|---|
Senior Credit Facility | | | 122.8 | | | 81.6 | |
Senior Notes | | | 78.5 | | | 78.5 | |
Amortization of Capitalized Finance Fees | | | 11.7 | | | 8.3 | |
Currency Hedge | | | 6.9 | | | n/a | |
Interest Hedge | | | 4.3 | | | (3.1 | ) |
Finance Lease | | | 2.4 | | | 2.9 | |
Pensions | | | 1.7 | | | 1.4 | |
Asset Retirement Obligations | | | 1.1 | | | 1.0 | |
Other | | | 3.1 | | | 1.2 | |
| | | | | | |
Total Interest Expenses | | | 232.5 | | | 171.8 | |
| | | | | | |
Outstanding interest bearing indebtedness as of March 31, 2009 increased by €475.0 million to €2,440.6 million from €1,965.6 million as of March 31, 2008 due to higher borrowings primarily related to the Acquisition.
Accretion or Depreciation on Investments and other Securities
In the fiscal year ended March 31, 2009 income of €0.1 million was recorded compared to expenses in the amount of €3.7 million for the fiscal year ended March 31, 2008.
Income from Associates
Income from associates increased by €13.1 million to €14.0 million for the fiscal year ended March 31, 2009 from €0.9 million in the fiscal year ended March 31, 2008 due to the sale of our minority shareholding in KS Berlin.
79
Table of Contents
Loss before Taxes
Loss before taxes increased by €45.0 million to €78.1 million for the fiscal year ended March 31, 2009 from €33.1 million in the fiscal year ended March 31, 2008.
This increase is related to the issues discussed in the above sections.
Benefit/Taxes on Income
Tax income was €6.2 million for the fiscal year ended March 31, 2009 compared to tax expenses of €0.8 million for the fiscal year ended March 31, 2008. For the fiscal year ended March 31, 2009 taxes are comprised of current tax expenses of €12.1 million and deferred tax income of €18.3 million. For the fiscal year ended March 31, 2008 taxes were comprised of current tax expenses of €0.9 million and deferred tax income of €0.1 million.
Net Loss
For the fiscal year ended March 31, 2009, a net loss was recorded in the amount of €72.0 million compared to €33.8 million for the fiscal year ended March 31, 2008.
The change in net loss is related to the issues discussed in the above sections.
Adjusted EBITDA
Earnings before interest, taxes, depreciation, amortization and non-cash compensation, which consists primarily of expenses related to our Management Equity Participation Program and non-cash restructuring expenses (Adjusted EBITDA) increased by €112.9 million or 24.7% to €570.7 million in the fiscal year ended March 31, 2009 from €457.8 million for the fiscal year ended March 31, 2008. The increase primarily relates to the rapid growth in adjusted EBITDA from the Internet & Phone segment, the growth from Access segment also due to the Acquisition and from increased subscription revenues from pay-TV. Adjusted EBITDA is not a recognized accounting term and should not be used as a measure of liquidity. However, Adjusted EBITDA is a common term used to compare the operating activities of cable television companies.
| | | | | | | |
| | Fiscal Year
Ended
March 31, | |
|---|
| | 2009 | | 2008 | |
|---|
| | (€ million)
| |
|---|
Profit from Ordinary Activities | | | 136.8 | | | 139.5 | |
Depreciation and Amortization | | | 402.6 | | | 293.9 | |
MEP related non-cash Expenses | | | 2.1 | | | 23.0 | |
Restructuring Expenses | | | 29.2 | | | 1.4 | |
| | | | | | |
Adjusted EBITDA | | | 570.7 | | | 457.8 | |
| | | | | | |
80
Table of Contents
Segment Reporting
The following tables reflect the allocation of Adjusted EBITDA to Cable Access, TV/Radio, Internet & Phone, TKS and Reconciliation(22) for the fiscal years ended March 31, 2009 and 2008:
- (22)
- Reconciliation primarily includes corporate and administrative functions of the Company such as senior management, legal and regulatory, finance, controlling, human resources, internal audit, corporate communication, investor relations, purchasing, IT and corporate finance.
| | | | | | | | | | | | | | | | | | | |
Fiscal Year Ended March 31, 2009 | | Cable
Access | | TV/Radio | | Internet &
Phone | | TKS | | Reconciliation | | Total | |
|---|
| | (€ million)
| |
|---|
Profit/Loss from Ordinary Activities | | | 252.2 | | | 24.8 | | | (16.0 | ) | | 3.4 | | | (127.7 | ) | | 136.8 | |
Depreciation and Amortization | | | 252.9 | | | 29.8 | | | 89.1 | | | 1.9 | | | 29.0 | | | 402.6 | |
MEP related non-cash Expenses | | | 0.5 | | | 0.1 | | | 0.1 | | | 0.0 | | | 1.4 | | | 2.1 | |
Restructuring Expenses | | | 27.4 | | | 0.0 | | | 0.0 | | | 0.0 | | | 1.8 | | | 29.2 | |
| | | | | | | | | | | | | | |
Adjusted EBITDA | | | 533.0 | | | 54.7 | | | 73.2 | | | 5.3 | | | (95.5 | ) | | 570.7 | |
| | | | | | | | | | | | | | |
| | | | | | | | | | | | | | | | | | | |
Fiscal Year Ended March 31, 2008 | | Cable
Access | | TV/Radio | | Internet &
Phone | | TKS | | Reconciliation | | Total | |
|---|
| | (€ million)
| |
|---|
Profit/Loss from Ordinary Activities | | | 271.1 | | | 28.4 | | | (35.2 | ) | | 2.8 | | | (127.6 | ) | | 139.5 | |
Depreciation and Amortization | | | 207.9 | | | 20.2 | | | 39.0 | | | 1.7 | | | 25.1 | | | 293.9 | |
MEP related non-cash Expenses | | | 1.8 | | | 0.1 | | | 0.4 | | | 0.1 | | | 20.6 | | | 23.0 | |
Restructuring Expenses | | | 1.1 | | | 0.0 | | | 0.0 | | | 0.0 | | | 0.3 | | | 1.4 | |
| | | | | | | | | | | | | | |
Adjusted EBITDA | | | 481.9 | | | 48.7 | | | 4.2 | | | 4.6 | | | (81.6 | ) | | 457.8 | |
| | | | | | | | | | | | | | |
Comparison of Operating Results for the fiscal years ended March 31, 2008 with March 31, 2007
Revenues
| | | | | | | |
| | Fiscal Year
Ended
March 31, | |
|---|
| | 2008 | | 2007 | |
|---|
| | (€ million)
| |
|---|
Cable Access Subscription Fees | | | 854.1 | | | 833.8 | |
Installation Fees | | | 7.6 | | | 7.0 | |
Other Revenues | | | 5.4 | | | 4.8 | |
| | | | | | |
Total Cable Access Revenues | | | 867.1 | | | 845.6 | |
| | | | | | |
| | | | | | | |
ARPU | | (€) | |
|---|
Cable Access | | | 7.79 | | | 7.31 | |
| | | | | | |
| | | | | | | |
| | As of March 31, | |
|---|
RGUs(23) | | 2008 | | 2007 | |
|---|
| | (in thousand)
| |
|---|
Cable Access | | | 8,936 | | | 9,276 | |
| | | | | | |
- (23)
- TKS RGUs are not included; therefore the figures differ from Cable Access RGUs on page 9.
81
Table of Contents
For the fiscal year ended March 31, 2008Cable Access Subscription Fees increased by €20.3 million or 2.4% to €854.1 million from €833.8 million for the fiscal year ended March 31, 2007. The increase in revenue primarily resulted from a price increase implemented in March 2007.
For the fiscal year ended March 31, 2008Installation Fees increased by €0.6 million or 8.6% to €7.6 million from €7.0 million for the fiscal year ended March 31, 2007 primarily due to cost reimbursements received from housing associations for the upgrade of our two way capable network.
| | | | | | | |
| | Fiscal Year
Ended
March 31, | |
|---|
| | 2008 | | 2007 | |
|---|
| | (€ million)
| |
|---|
Analog/Digital Carriage Fees | | | 100.0 | | | 99.6 | |
Pay TV Subscription Fees | | | 69.9 | | | 55.6 | |
Playout Facility Fees | | | 1.1 | | | 2.0 | |
Other Digital Revenues | | | 8.8 | | | 5.8 | |
| | | | | | |
Total TV/Radio revenues | | | 179.8 | | | 163.0 | |
| | | | | | |
| | | | | | | |
ARPU | | (€) | |
|---|
TV/Radio blended | | | 7.74 | (24) | | 7.71 | |
| | | | | | |
| | | | | | | |
| | As of March 31, | |
|---|
RGUs | | 2008 | | 2007 | |
|---|
| | (in thousand)
| |
|---|
Pay TV | | | 779 | | | 690 | |
Kabel Digital+ | | | 35 | (24) | | 2 | |
| | | | | | |
Total TV/Radio RGUs | | | 814 | | | 692 | |
| | | | | | |
- (24)
- To be able to compare the figures for 2009 and 2008 an adjustment of the figure as of March 31, 2008 and 2007 was necessary due to a change of the calculation method in 2009.
Carriage Fees increased slightly by €0.4 million to €100.0 million in the fiscal year ended March 31, 2008 from €99.6 million for the fiscal year ended March 31, 2007.
Pay-TV Subscription Fees increased by €14.3 million or 25.7% to €69.9 million for the fiscal year ended March 31, 2008 from €55.6 million for the fiscal year ended March 31, 2007 primarily resulting from a rapidly growing subscriber base.
Playout Facility Fees decreased by €0.9 million or 45.0% to €1.1 million in the fiscal year ended March 31, 2008 from €2.0 million for the fiscal year ended March 31, 2007.
Other Digital Revenues increased by €3.0 million or 51.7% to €8.8 million in the fiscal year ended March 31, 2008 from €5.8 million in the fiscal year ended March 31, 2007. This increase was primarily related to Kabel Digital+ revenues.
The total blended TV/RadioARPU increased slightly to €7.74 in the fiscal year ended March 31, 2008 from €7.71 in the fiscal year ended March 31, 2007.
82
Table of Contents
| | | | | | | |
| | Fiscal Year
Ended
March 31, | |
|---|
| | 2008 | | 2007 | |
|---|
| | (€ million)
| |
|---|
Subscription Fees (recurring) | | | 115.8 | | | 55.2 | |
Installation Fees and other non-recurring revenues | | | 5.6 | | | 1.3 | |
| | | | | | |
Total Internet & Phone Revenues | | | 121.4 | | | 56.5 | |
| | | | | | |
| | | | | | | |
ARPU | | (€) | |
|---|
Kabel Internet & Kabel Phone blended | | | 19.11 | | | 21.53 | |
| | | | | | |
| | | | | | | |
| | As of March 31, | |
|---|
RGUs | | 2008 | | 2007 | |
|---|
| | (in thousand)
| |
|---|
Kabel Internet | | | 393 | | | 179 | |
Kabel Phone | | | 361 | | | 152 | |
| | | | | | |
Total Internet & Phone RGUs | | | 754 | | | 331 | |
| | | | | | |
In the fiscal year ended March 31, 2008,Subscription Fees increased substantially by €60.6 million to €115.8 million from €55.2 million for the fiscal year ended March 31, 2007. This increase was primarily due to the doubling of Internet & Phone RGUs.
In the fiscal year ended March 31, 2008,Installation Fees and other non-recurring revenues increased by €4.3 million to €5.6 million from €1.3 million for the fiscal year ended March 31, 2007. This increase was related to an installation fee which was introduced in April 2007 by the company for all Internet & Phone products.
The Internet & PhoneARPU decreased by €2.42 or 11.2% to €19.11 in the fiscal year ended March 31, 2008 from €21.53 for the fiscal year ended March 31, 2007 which was primarily driven by price decreases in order to be more competitive in the fast growing Internet & Phone market.
| | | | | | | |
| | Fiscal Year
Ended
March 31, | |
|---|
| | 2008 | | 2007 | |
|---|
| | (€ million)
| |
|---|
Billing services revenues | | | 7.2 | | | 8.5 | |
Internet Revenues | | | 6.4 | | | 5.9 | |
Cable Television Revenues | | | 4.6 | | | 5.0 | |
Mobile Phone Services | | | 4.5 | | | 1.2 | |
Merchandise | | | 4.0 | | | 6.6 | |
Phone Services | | | 1.3 | | | n/a | |
Other Revenues | | | 0.6 | | | 0.9 | |
| | | | | | |
Total TKS Revenues | | | 28.6 | | | 28.1 | |
| | | | | | |
TKS revenues increased by €0.5 million or 1.8% to €28.6 million for the fiscal year ended March 31, 2008 from €28.1 million for the fiscal year ended March 31, 2007. The increase was primarily
83
Table of Contents
related to higher revenues from Mobile Phone Services and the new TKS bundled product "Surf'n'Talk" which was introduced in November 2007. Partly offsetting this positive impact was a decrease in revenues from billing services related to a reduction of military personnel based in Germany and a decrease in sale of merchandise.
Expenses
Total expenses for the fiscal year ended March 31, 2008 increased by €43.3 million or 4.2% to T€1,070.0 million from €1,026.7 million for the fiscal year ended March 31, 2007.
| | | | | | | |
| | Fiscal Year Ended
March 31, | |
|---|
| | 2008 | | 2007 | |
|---|
| | (€ million)
| |
|---|
Cost of Services Rendered | | | 588.5 | | | 567.1 | |
Selling Expenses | | | 352.8 | | | 318.7 | |
General and Administrative Expenses | | | 128.7 | | | 140.9 | |
| | | | | | |
Total Expenses | | | 1,070.0 | | | 1,026.7 | |
| | | | | | |
Cost of Services Rendered
| | | | | | | |
| | Fiscal Year
Ended
March 31, | |
|---|
| | 2008 | | 2007 | |
|---|
| | (€ million)
| |
|---|
Cost of Materials and Services | | | 314.0 | | | 288.2 | |
Personnel Expenses | | | 44.2 | | | 63.0 | |
Depreciation and Amortization | | | 154.7 | | | 133.1 | |
Other Cost and Expenses | | | 75.6 | | | 82.8 | |
| | | | | | |
Total Cost of Services Rendered | | | 588.5 | | | 567.1 | |
| | | | | | |
In the fiscal year ended March 31, 2008,Cost of Services Rendered increased by €21.4 million or 3.8% to €588.5 million from €567.1 million for the fiscal year ended March 31, 2007.
Included in cost of services rendered for the fiscal year ended March 31, 2008 were costs related to the restructuring of the technical department of €5.5 million. These costs primarily related to external service providers and should be eliminated as the restructuring process will be finalized.
In the fiscal year ended March 31, 2008,Cost of Materials and Services increased by €25.8 million or 9.0% to €314.0 million from €288.2 million for the fiscal year ended March 31, 2007. Cost of materials and services in the fiscal year ended March 31, 2008 corresponded to 26.2% of our total revenues compared to 26.4% in the fiscal year ended March 31, 2007.
Expenses for SLAs decreased by €4.5 million or 2.7% to €165.0 million for the fiscal year ended March 31, 2008 from €169.5 million(25) in the fiscal year ended March 31, 2007. Due to the upgrade and roll out of our two way capable network in the state of Bavaria and Lower Saxony the Company entered into agreements to lease a fiber backbone covering the region. The Company was partly able to offset the increased cost of this backbone through unit price reductions related to other service level agreements.
- (25)
- To be able to compare the SLA expenses for the fiscal years ended March 31, 2007 and 2008 the figure for the fiscal year ended March 31, 2007 have been reclassified.
84
Table of Contents
In the fiscal year ended March 31, 2008, content costs, primarily for pay-TV activities, increased by €8.9 million or 24.7% to €44.9 million from €36.0 million in the fiscal year ended March 31, 2007. The increase was related to the subscriber growth and the addition of certain channels.
Costs for interconnect increased by €8.3 million or 102.5% to €16.4 million for the fiscal year ended March 31, 2008 from €8.1 million for the fiscal year ended March 31, 2007 related to the variable usage cost of phone subscribers.
Network expenses increased by €6.0 million or 73.2% to €14.2 million for the fiscal year ended March 31, 2008 from €8.2 million for the fiscal year ended March 31, 2007 primarily due to the continued upgrade of our networks.
Costs for installation of modems decreased by €4.2 million or 95.5% to €0.2 million for the fiscal year ended March 31, 2008 from €4.4 million for the fiscal year ended March 31, 2007 due to the full impact of the capitalization of these costs which had started in November 2006.
Other cost of materials and services increased by €11.3 million or 18.2% to €73.3 million for the fiscal year ended March 31, 2008 from €62.0 million for the fiscal year ended March 31, 2007. The increase primarily resulted from an increase of the maintenance costs and cost of materials from upgraded networks and substantial growth in our Internet & Phone product offerings.
In the fiscal year ended March 31, 2008Personnel Expenses included €2.4 million(26) for current restructuring and in the fiscal year ended March 31, 2007 €11.6 million were accrued for the restructuring of the technical department. In the fiscal year ended March 31, 2008 personnel expenses included non-cash expenses related to the Management Equity Participation program in the amount of €0.8 million compared to €0.3 million in the fiscal year ended March 31, 2007. Personnel expenses adjusted by the Management Equity Participation program and restructuring expenses decreased by €10.1 million or 19.8% to €41.0 million in the fiscal year ended March 31, 2008 from €51.1 million for the fiscal year ended March 31, 2007, primarily due to an achieved decrease in the number of employees as a result of the restructuring of the technical departments.
- (26)
- Thereof €1.1 million non-cash expenses are adjusted in terms of EBITDA.
Depreciation and Amortization increased by €21.6 million or 16.2% to €154.7 million in the fiscal year ended March 31, 2008 from €133.1 million for the fiscal year ended March 31, 2007 primarily due to substantial investments made to upgrade the network for two way capacity.
Other Cost and Expenses in the fiscal year ended March 31, 2008 decreased by €7.2 million or 8.7% to €75.6 million from €82.8 million for the fiscal year ended March 31, 2007. This decrease primarily resulted from the abolition of the fees paid to the "Bayerische Medienanstalt" due to a change in law which took effect on January 1, 2008 and decreased consulting expenses as the consulting process for restructuring measures was completed.
Selling Expenses
| | | | | | | |
| | Fiscal Year
Ended
March 31, | |
|---|
| | 2008 | | 2007 | |
|---|
| | (€ million)
| |
|---|
Cost of Materials and Services | | | 26.1 | | | 27.1 | |
Personnel Expenses | | | 71.4 | | | 70.5 | |
Depreciation and Amortization | | | 115.5 | | | 96.0 | |
Other Cost and Expenses | | | 139.8 | | | 125.1 | |
| | | | | | |
Total Selling Expenses | | | 352.8 | | | 318.7 | |
| | | | | | |
85
Table of Contents
In the fiscal year ended March 31, 2008,Selling Expenses increased by €34.1 million or 10.7% to €352.8 million from €318.7 million for the fiscal year ended March 31, 2007. This was primarily due to the items discussed below.
Cost of Materials and Services decreased by €1.0 million or 3.7% to €26.1 million for the fiscal year ended March 31, 2008 from €27.1 million for the fiscal year ended March 31, 2007.
Personnel Expenses in the fiscal year ended March 31, 2008 included expenses related to the Management Equity Participation program in the amount of €1.6 million compared to €2.7 million for the fiscal year ended March 31, 2007. In the fiscal year ended March 31, 2008 minor amounts related to the restructuring expenses were included compared to €1.0 million for the fiscal year ended March 31, 2007. Personnel expenses adjusted by the Management Equity Participation program and restructuring expenses increased by €3.0 million or 4.5% to €69.8 million in the fiscal year ended March 31, 2008 from €66.8 million in the fiscal year ended March 31, 2007. The increase primarily resulted from an increase in the number of call center employees and from scheduled salary increases.
Depreciation and Amortization expenses increased by €19.5 million or 20.3% to €115.5 million for the fiscal year ended March 31, 2008 from €96.0 million for the fiscal year ended March 31, 2007 due to higher amortization of capitalized subscriber acquisition costs and an increase in depreciation of capitalized CPE.
Other Cost and Expenses within selling expenses increased by €14.7 million or 11.8% to €139.8 million for the fiscal year ended March 31, 2008 from €125.1 million for the fiscal year ended March 31, 2007 primarily due to increased bad debt.
General and Administrative Expenses
| | | | | | | |
| | Fiscal Year
Ended
March 31, | |
|---|
| | 2008 | | 2007 | |
|---|
| | (€ million)
| |
|---|
Personnel Expenses | | | 64.5 | | | 76.1 | |
Depreciation and Amortization | | | 23.8 | | | 17.5 | |
Other Cost and Expenses | | | 40.4 | | | 47.3 | |
| | | | | | |
Total General and Administrative Expenses | | | 128.7 | | | 140.9 | |
| | | | | | |
In the fiscal year ended March 31, 2008General and Administrative Expenses decreased by €12.3 million or 8.7% to €128.7 million from €141.0 million for the fiscal year ended March 31, 2007. This was primarily due to the items discussed below.
In the fiscal year ended March 31, 2008Personnel Expenses included non-cash expenses related to the Management Equity Participation program in the amount of €20.6 million compared to €38.8 million in the fiscal year ended March 31, 2007. In the fiscal year ended March 31, 2008 restructuring expenses in the amount of €0.2 million were included compared to €1.8 million for the fiscal year ended March 31, 2007. Personnel expenses adjusted by the Management Equity Participation program and restructuring expenses increased by €8.2 million or 23.1% to €43.7 million in the fiscal year ended March 31, 2008 from €35.5 million in the fiscal year ended March 31, 2007. This increase was primarily resulting from an increase in the number of employees and from scheduled salary increases.
In the fiscal year ended March 31, 2008Depreciation and Amortization expenses increased by €6.3 million or 36.0% to €23.8 million from €17.5 million for the fiscal year ended March 31, 2007
86
Table of Contents
primarily due to amortization related to the Company's customer care and billing system, a new SAP system and other IT-applications.
Other Cost and Expenses in the fiscal year ended March 31, 2008 decreased by €6.9 million or 14.6% to €40.4 million from €47.3 million for the fiscal year ended March 31, 2007. This primarily resulted from a decrease in IT expenses.
Profit from Ordinary Activities
Profit from ordinary activities for the fiscal year ended March 31, 2008 increased by €59.8 million or 75.0% to €139.5 million from €79.7 million for the fiscal year ended March 31, 2007.
The increase was primarily related to the issues discussed in the above sections.
Interest Income
Interest income was derived from our bank deposits. In the fiscal year ended March 31, 2008 interest income decreased by €1.5 million or 41.7% to €2.1 million from €3.6 million in the fiscal year ended March 31, 2007.
Interest Expenses
Interest expenses include interest accrued on bank loans, the Company's 2014 Senior Notes, amortization of financing fees, interest on finance leases and other interest. Interest expenses increased by €16.1 million or 10.3% to €171.8 million for the fiscal year ended March 31, 2008 from €155.7 million for the fiscal year ended March 31, 2007. This increase was primarily related to higher interest expenses on the Senior Credit Facility in the amount of €13.0 million.
| | | | | | | |
| | Fiscal Year
Ended
March 31, | |
|---|
| | 2008 | | 2007 | |
|---|
| | (€ million)
| |
|---|
Senior Credit Facility | | | 81.6 | | | 68.6 | |
Senior Notes | | | 78.5 | | | 78.5 | |
Amortization of Capitalized Finance Fees | | | 8.3 | | | 9.8 | |
Finance Lease | | | 2.9 | | | 2.7 | |
Pensions | | | 1.4 | | | 1.2 | |
Asset Retirement Obligations | | | 1.0 | | | 0.9 | |
Interest Hedge | | | (3.1 | ) | | (8.7 | ) |
Other | | | 1.2 | | | 2.7 | |
| | | | | | |
Total Interest Expenses | | | 171.8 | | | 155.7 | |
| | | | | | |
Outstanding interest bearing indebtedness as of March 31, 2008 increased by €60.0 million to €1,965.6 million from €1,905.6 million as of March 31, 2007 due to a higher capital need for the network acquisition, investments and upgrade of our network.
Accretion or Depreciation on Investments and other Securities
In the fiscal year ended March 31, 2008 expenses in the amount of €3.8 million were recorded, whereas in the fiscal year ended March 31, 2007 income in the amount of €0.3 million was recorded. 2008 expenses resulted from a devaluation of the Company's current investments which were sold in October 2007.
87
Table of Contents
Income from Associates
Income from associates increased by €0.5 million or 125.0% to €0.9 million for the fiscal year ended March 31, 2008 from €0.4 million in the fiscal year ended March 31, 2007.
Loss before Taxes
Loss before taxes decreased by €38.6 million or 53.8% to €33.1 million for the fiscal year ended March 31, 2008 from €71.7 million in the fiscal year ended March 31, 2007.
This decrease was related to the issues discussed in the above sections.
Benefit/Taxes on Income
Tax expenses amounted to €0.7 million for the fiscal year ended March 31, 2008 compared to €27.5 million in the fiscal year ended March 31, 2007. For the fiscal year ended March 31, 2008 taxes were comprised of current tax expense of €0.8 million and deferred tax income in the amount of €0.1 million. For the fiscal year ended March 31, 2007 taxes were comprised of deferred tax expense in the amount of €26.8 million and current tax expense of €0.7 million.
As a result of the 2008 corporate tax reform, the combined income tax was 29.79% for the fiscal year 2008. The anticipated tax rate of 29.79% (2007 and 2006: 39.19%) was based on the corporate income tax rate of 15.0%, a solidarity surcharge of 5.5% on corporate income tax and a trade tax rate of 13.96%.
Net Loss
Net loss decreased by €65.4 million or 65.9% to €33.8 million for the fiscal year ended March 31, 2008 from €99.2 million in the fiscal year ended March 31, 2007.
The decrease was related to the issues discussed in the above sections.
Adjusted EBITDA
Earnings before interest, taxes, depreciation, amortization and non-cash compensation, which consists primarily of expenses related to our Management Equity Participation program and non-cash restructuring expenses (Adjusted EBITDA) increased by €75.3 million or 19.7% to €457.8 million in the fiscal year ended March 31, 2008 from €382.5 million for the fiscal year ended March 31, 2007. The increase primarily related to the rate increase implemented in relation to the roll-out of the digital access product, the growth from the Internet & Phone business and the growth in subscription revenues from pay-TV. In regard to cost and expenses, approximately €5.5 million of total cost and expenses were related to the restructuring of the technical department and were one-time in nature.
| | | | | | | |
| | Fiscal Year
Ended
March 31, | |
|---|
| | 2008 | | 2007 | |
|---|
| | (€ million)
| |
|---|
Profit from Ordinary Activities | | | 139.5 | | | 79.7 | |
Depreciation and Amortization | | | 293.9 | | | 246.6 | |
MEP related non-cash Expenses | | | 23.0 | | | 41.8 | |
Restructuring Expenses | | | 1.4 | | | 14.4 | |
| | | | | | |
Adjusted EBITDA | | | 457.8 | | | 382.5 | |
| | | | | | |
88
Table of Contents
Segment Reporting
The following tables reflect the allocation of Adjusted EBITDA to Cable Access, TV/Radio, Internet & Phone, TKS and Reconciliation for the fiscal years ended March 31, 2008 and 2007:
| | | | | | | | | | | | | | | | | | | |
Fiscal Year Ended March 31, 2008 | | Cable
Access | | TV/Radio | | Internet &
Phone | | TKS | | Reconciliation | | Total | |
|---|
| | (€ million)
| |
|---|
Profit/Loss from Ordinary Activities | | | 271.1 | | | 28.4 | | | (35.2 | ) | | 2.8 | | | (127.6 | ) | | 139.5 | |
Depreciation and Amortization | | | 207.9 | | | 20.2 | | | 39.0 | | | 1.7 | | | 25.1 | | | 293.9 | |
MEP related non-cash Expenses | | | 1.8 | | | 0.1 | | | 0.4 | | | 0.1 | | | 20.6 | | | 23.0 | |
Restructuring Expenses | | | 1.1 | | | 0.0 | | | 0.0 | | | 0.0 | | | 0.3 | | | 1.4 | |
| | | | | | | | | | | | | | |
Adjusted EBITDA | | | 481.9 | | | 48.7 | | | 4.2 | | | 4.6 | | | (81.6 | ) | | 457.8 | |
| | | | | | | | | | | | | | |
| | | | | | | | | | | | | | | | | | | |
Fiscal Year Ended March 31, 2007 | | Cable
Access | | TV/Radio | | Internet &
Phone | | TKS | | Reconciliation | | Total | |
|---|
| | (€ million)
| |
|---|
Profit/Loss from Ordinary Activities | | | 238.3 | | | 13.2 | | | (51.9 | ) | | 8.3 | | | (128.2 | ) | | 79.7 | |
Depreciation and Amortization | | | 202.9 | | | 12.9 | | | 12.2 | | | 1.4 | | | 17.2 | | | 246.6 | |
MEP related non-cash Expenses | | | 1.6 | | | 0.0 | | | 0.0 | | | 0.0 | | | 40.2 | | | 41.8 | |
Restructuring Expenses | | | 12.9 | | | 0.0 | | | 0.0 | | | 0.0 | | | 1.5 | | | 14.4 | |
| | | | | | | | | | | | | | |
Adjusted EBITDA | | | 455.7 | | | 26.1 | | | (39.7 | ) | | 9.7 | | | (69.3 | ) | | 382.5 | |
| | | | | | | | | | | | | | |
Subsequent Events
On May 21, 2009, KDG settled the outstanding purchase price adjustment with Orion on the 1.1 million cable subscribers acquired on April 30, 2008. The preliminary purchase price was reduced by €67.5 million. Thereof €8.9 million and corresponding interest of €0.6 million had already been repaid as of March 31, 2009. Another €10.5 million and corresponding interest of €0.6 million were considered as other receivables. The remaining outstanding amounts were settled at the end of May 2009.
As part of the purchase price adjustment process, KDG is in arbitration regarding a further possible reduction of the purchase price, in addition to the original purchase price reduction of €67.5 million, resulting from the allocation of certain central overhead costs.
On May 25, 2009, KDG announced the cooperation with the telecommunications company Telefónica O2 Germany in the mobile sector. The new mobile services "Mobile Phone" and "Mobile Internet" are offered along with the Company's existing video, Internet and fixed line phone offerings, without any minimum term of contract, monthly basic fee or minimum revenue. Calls with the "Mobile Phone" offering are free of charge within the entire Kabel Deutschland network. With "Mobile Internet", users can also surf the Internet within their daily flat rate while travelling. The new products are available to existing as well as new customers of Kabel Internet & Phone.
See also ITEM 4A History and Development of the Company.
B. Liquidity and Capital Resources
Covenants
The Senior Credit Facilities and the indenture governing the Senior Notes contain covenants significantly restricting our ability to, among other things:
- •
- incur additional indebtedness;
- •
- pay dividends or make other distributions;
89
Table of Contents
- •
- make certain other restricted payments and investments;
- •
- create liens;
- •
- impose restrictions on the ability of our subsidiaries to pay dividends or make other payments to us;
- •
- transfer or sell assets;
- •
- merge or consolidate with other entities; and
- •
- enter into transactions with affiliates.
These covenants could limit our ability to finance our future operations and capital needs and our ability to pursue acquisitions and other business activities that may be in our interest.
The Senior Credit Facility is subject to several affirmative and negative covenants including, but not limited to the following:
| | | | |
Test | | Requirement Range | |
|---|
EBITDA to Net Interest | | | 1.75 x–3.00 x | |
Senior Net Debt to EBITDA | | | 4.00 x–2.00 x | |
As of March 31, 2009 the EBITDA to Net Interest and the Senior Net Debt to EBITDA covenant was as following:
| | |
Test | | Requirement as of March 31, 2009 |
|---|
• EBITDA to Net Interest | | Greater than 2.00x |
• Senior Net Debt to EBITDA | | Less than 3.50x |
As of March 31, 2009 the ratio of EBITDA to Net Interest amounted to 2.77. The ratio of Senior Net Debt to EBITDA amounted to 2.76.
Our ability to meet these financial ratios and tests may be affected by events beyond our control and, as a result, we cannot ensure that we will be able to meet these ratios and tests in the future. In the event of a default under the Senior Credit Facilities or certain other defaults under other agreements, the lenders could terminate their commitments and declare all amounts owed to them to be due and payable. Borrowings under other debt instruments that contain cross-default or cross-acceleration provisions, including the Senior Notes, may, as a result, also be accelerated and become due and payable. We may be unable to pay these debts in such circumstances.
The 2014 Senior Notes are subject to several affirmative and negative covenants which are generally less restrictive than under the Senior Credit Facility. The 2014 Senior Notes contain covenants including but not limited to limitations on indebtedness, limitations on asset disposals, limitations on distributions and reporting requirements. Each of the covenants is subject to a number of important exceptions and qualifications.
Our principal source of liquidity on an ongoing basis is our operating cash flow. Our ability to generate cash depends on our future operating performance, which in turn depends to some extent on general economic, financial, industry, regulatory and other factors, many of which are beyond our control, as well as the other factors discussed in ITEM 3D–Risk Factors. In particular, our emphasis on pay-TV, Internet & Phone as well as mobile services could lead to increased volatility in our cash flows.
For our strategy of investing in digital cable television, Internet & Phone and mobile services, our main Capital Expenditures are related to installation of new Internet & Phone customers and upgrading Level 4 related to contract extensions. As a result, our principal uses of cash will be for incremental operational expenditures, to fund the development, marketing and distribution of the new products, capital expenditures for upgrading our network to make it two-way capable installing new
90
Table of Contents
Internet & Phone customers and upgrading the inhouse wiring of housing associations, as well as to fund working capital and our interest bearing debt service.
On October 30, 2007 KDG secured a Tranche C under the Senior Credit Facilities in the amount of €650 million for an acquisition of Level 4 assets from Orion announced on September 20, 2007. On closing of the transaction on April 30, 2008, the Tranche C was drawn in the amount of €535 million and the remaining €115 million were cancelled on May 9, 2008.
On February 11, 2009 KDG approached the lenders of its Senior Credit Facilities via its facility agent, the Royal Bank of Scotland, with a request to agree to certain minor amendments to the Company's credit covenants. KDG proposed to change the senior net debt to EBITDA covenant for the quarters starting from December 2010 to December 2011 as well as to extend senior net debt to EBITDA and EBITDA to net interest covenants beyond March 2012, until maturity of its Senior Add-on Facility, Tranche C, in March 2013. On February 25, 2009 approximately 92% of the lenders of its Senior Credit Facilities have consented to the amendments, which were thereby approved.
For further information on the balance of borrowings and maturity please refer to ITEM 17.
In addition to our operating cash flows and cash on our balance sheet, we will have access to credit under Tranche B (see above, subject to certain conditions). In our opinion, our existing availability is sufficient for our present requirements.
Although we believe that our expected cash flows from operations, together with headroom under the revolver, will be adequate to meet our anticipated liquidity and debt service needs, we cannot be certain that our business will generate sufficient cash flows from operations or that future debt and equity financing will be available in an amount sufficient to enable KDG to pay debts on maturity, including the Senior Notes, or to fund the digital cable television rollout, our network upgrade, Intenet & Phone installations and Level 4 upgrades or our other liquidity needs. See ITEM 3D–Risks relating to our indebtedness and our structure.
Cash flow for the Fiscal Year Ended March 31, 2009 compared to the Fiscal Year Ended March 31, 2008
As of March 31, 2009 our cash balance amounted to €51.9 million and we had €316.0 million credit available under our revolver.
The following table shows a condensed version of our cash flows for the periods ended March 31, 2009, 2008 and 2007:
| | | | | | | | | | |
| | Fiscal Year Ended March 31, | |
|---|
| | 2009 | | 2008 | | 2007 | |
|---|
| | (€ million)
| |
|---|
Cash Flow from Operating Activities | | | 668.7 | | | 444.7 | | | 360.0 | |
Net Cash used in Investing Activities | | | (884.2 | ) | | (345.4 | ) | | (276.4 | ) |
Net Cash used in Financing Activities | | | 251.9 | | | (137.9 | ) | | (254.9 | ) |
Change in Cash and Cash Equivalents | | |
36.4 | | |
(38.6 |
) | |
(171.2 |
) |
Cash and Cash Equivalents at the beginnig of the period | | | 15.5 | | | 54.1 | | | 225.1 | |
Accretion/Depreciation on Investments and Other Securities | | | 0.0 | | | 0.0 | | | 0.3 | |
| | | | | | | | |
Cash and Cash Equivalents at the end of the period | | | 51.9 | | | 15.5 | | | 54.1 | |
| | | | | | | | |
Cash flow from Operating Activities
Our cash flows provided from operating activities in the fiscal year ended March 31, 2009 increased by €224.0 million to €668.7 million from €444.7 million in the fiscal year ended March 31,
91
Table of Contents
2008. This increase was driven by an increase in revenues of 14.5%, a substantially improved operating performance and an improved working capital performance.
In the fiscal year ended March 31, 2008 cash flows provided from operating activities increased by €84.7 million to €444.7 million from €360.0 million in the fiscal year ended March 31, 2007. This increase was driven by a significant lower net loss as a result of the revenue growth of 9.5% compared to the fiscal year ended March 31, 2007 and the containment of costs and expenses.
Net cash used in Investing Activities
Net cash used in investing activities increased by €538.8 million or 156.0% to €884.2 million for the fiscal year ended March 31, 2009 from €345.4 million for the fiscal year ended March 31, 2008. The increase was primarily used to acquire the Level 4 assets from Orion closed on April 30, 2008.
In the fiscal year ended March 31, 2008, net cash used in investing activities increased by €69.0 million or 25.0% to €345.4 million from €276.4 million for the fiscal year ended March 31, 2007. The increase was primarily related to increased investments in our network to pass additional homes with two way capability and increased sales and installation costs of premium services.
Net cash used in Financing Activities
Cash flows from financing activities was €251.9 million in the fiscal year ended March 31, 2009, compared to a cash use of €137.9 million in the fiscal year ended March 31, 2008.
The Senior Credit Facility is comprised of three tranches, a €1,150.0 million Term Loan Facility (Tranche A), a €325.0 million Revolving Credit Facility (Tranche B) and a €535.0 million Term Loan Facility (Tranche C), which was used for the Acquisition. Tranche A and Tranche B mature on March 31, 2012. The final maturity date of Tranche C is March 31, 2013. The Company's Senior Notes amount to €755.6 million and mature on July 1, 2014.
Interest rates on the Senior Credit Facility are based on one, two, three or six months EURIBOR plus a margin. The current margin on the Senior Credit Facilities, Tranche A and Tranche B is EURIBOR + 175 bps. The margin on the Senior Credit Facility, Tranche C is EURIBOR + 325 bps. See ITEM 10C–Material Contracts. Interest rates on the Senior Notes are fixed at 10.75% for the Euro-denominated Senior Notes and at 10.625% for the US$-denominated Senior Notes.
Included in the cash flows from financing activities in the fiscal year ended March 31, 2009 are the new Tranche C in the amount of €535.0 million, proceeds of €250.0 million from Facility B and repayments of €310.0 million from Facility B. €206.8 million was used to pay interest and transaction costs. Cash payments to shareholders and minorities amounted to €8.0 million; thereof €1.1 million are dividends to minorities.
Included in cash flows from financing activities in the fiscal year ended March 31, 2008 were net proceeds of €60.0 million from Facility B, resulting from proceeds of €391.0 million and repayments of €331.0 million. €177.1 million were used to pay interest and transaction costs.
KDG is highly leveraged and has significant debt service obligations. We believe that the funds generated from operations, together with existing cash and cash equivalents and revolving credit facility availability will be sufficient to meet operating and debt service requirements. We regularly assess our investment approach in view of our current and potential future needs.
Our ability to make payments on and to refinance our debt, and to fund future operations and capital expenditures, will depend on our future operating performance and ability to generate sufficient cash. This depends, to some extent, on many general economic, financial and market factors, many of which are beyond our control, as well as on other factors discussed in ITEM 3 D 'Risk Factors'. Considering those factors, we cannot assure that our business will generate sufficient cash flows from operations or that future debt and equity financing will be available to us in an amount sufficient to enable us to pay our debts when due, or to fund our other liquidity needs.
92
Table of Contents
Capital Expenditures
In the fiscal year ended March 31, 2009, capital expenditures amounted to €884.2 million. Of this amount the Company used approximately €527.8 million primarily for the Acquisition of Level 4 assets from Orion closed on April 30, 2008 and approximately €211.6 million for the upgrade of the network for Internet & Phone business.
Capital expenditures related to IT systems, licenses, software and intangible assets amounted to €85.3 million for the fiscal year ended March 31, 2009.
In the fiscal year ended March 31, 2008, capital expenditures amounted to €353.4 million. Of this amount the Company used approximately €175.4 million for the upgrade of the network for Internet & Phone services.
C. Research and Development, Patents and Licenses, etc.
The Company has not undertaken any significant research or development over the past four years. Therefore, there were no significant amounts spent on company-sponsored research and development activities during each of the fiscal years ended March 31, 2006, 2007, 2008 and 2009.
D. Trend Information
See ITEM 5 A Operating Results and 5 B Liquidity and Capital Resources.
E. Off-Balance Sheet Arrangements
There are no significant off-balance sheet arrangements that are likely to have a current or future effect on our financial condition, results of operations, liquidity, capital expenditure or capital resources.
F. Tabular Disclosure of Contractual Obligations
| | | | | | | | | | | | | | | | |
| | Payments Due by Period | |
|---|
| | Total | | Less than
1 year | | 1–3 years | | 3–5 years | | More than
5 years | |
|---|
| | (€ million)
| |
|---|
1. Long-term Debt Obligations(27) | | | 3,120.5 | | | 121.9 | (28) | | 1,483.1 | (29) | | 1,515.5 | (30) | | 0.0 | |
2. Agreements with DTAG and Subsidiaries | | | 592.2 | | | 215.4 | | | 275.8 | | | 30.3 | | | 70.7 | |
3. License, Rental and Operating Lease Commitments | | | 80.4 | | | 27.0 | | | 34.5 | | | 16.4 | | | 2.5 | |
4. Finance Lease Commitments(31) | | | 32.2 | | | 10.7 | | | 21.0 | | | 0.5 | | | 0.0 | |
5. Purchase Agreements | | | 23.7 | | | 16.9 | | | 4.5 | | | 1.1 | | | 1.2 | |
| | | | | | | | | | | | |
Total | | | 3,849.0 | | | 391.9 | | | 1,818.9 | | | 1,563.3 | | | 74.4 | |
| | | | | | | | | | | | |
- (27)
- Gross payment for debt and interest in Tranche A, B and C of the Senior Credit Facilities and Senior Notes until maturity:
- (28)
- As of March 31, 2009 the €325.0 million revolving facility under Tranche B of our Senior Credit Facilities was undrawn.
- (29)
- Tranche A and B of the Senior Credit Facilities mature on March 31, 2012.
- (30)
- Tranche C of the Senior Credit Facilities matures on March 31, 2013. Senior Notes US$ and €-denominated mature on July 1, 2014.
- (31)
- Agreements on transponders.
93
Table of Contents
G. Safe Harbor
Forward-looking statements
This annual report includes forward-looking statements. These forward-looking statements include all matters that are not historical facts. These forward-looking statements can be identified by the use of forward-looking terminology, including terms such as 'anticipate', 'believe', 'could', 'estimate', 'expect', 'intend', 'may', 'plan', 'predict', 'project', 'will' and similar terms and phrases, including references to assumptions. They appear in a number of places throughout this annual report and include statements regarding our intentions, beliefs or current expectations concerning, among other things, our results of operations, financial condition, liquidity, prospects, growth, strategies and the industry in which we operate.
By their nature, forward-looking statements involve risks and uncertainties because they relate to events and depend on circumstances that may or may not occur in the future. We caution you that forward-looking statements are by no means guarantees of future performance and that our actual results of operations, financial condition and liquidity and the development of the industry in which we operate may differ materially from those made in or suggested by the forward-looking statements contained in this annual report. In addition, even if our results of operations, financial condition and liquidity and the development of the industry in which we operate are consistent with the forward-looking statements contained in this annual report, those results or developments may not be indicative of results or developments in subsequent periods.
Important factors that could cause those differences include, but are not limited to:
- •
- competition from other companies in our industry and our ability to retain market shares;
- •
- our ability to control customer churn;
- •
- our ability to retain Level 4 network operators and large housing associations as customers and attract new customers;
- •
- our ability to renew carriage fee contracts;
- •
- our ability to successfully introduce new products and services and control costs;
- •
- our reliance on Deutsche Telekom AG and its affiliates for a significant part of our network and various services;
- •
- our ability to ensure access to attractive programming;
- •
- changes in technology and our ability to respond to new technological developments;
- •
- a failure to successfully upgrade our network within budget;
- •
- the failure to maintain our network or the occurrence of events that result in damages to our network;
- •
- changes in applicable German laws or regulations (or in their interpretation or enforcement);
- •
- our ability to comply with regulations affecting our business and our ability to respond to changes in the regulatory environment;
- •
- our substantial leverage and ability to generate sufficient cash to service our debt;
- •
- risks associated with our structure and our indebtedness;
- •
- potential conflicts of interests with our shareholders;
- •
- risks from the current economic downturn and
- •
- general economic conditions.
94
Table of Contents
The risks described above and in the other sections of this annual report are not exhaustive. We operate in a very competitive and rapidly changing environment. New risks, uncertainties and other factors emerge from time to time and it is not possible for us to predict all such risks, nor can we assess the impact of all such risks on our business or the extent to which any risk, or combination of risks, may cause actual results to differ materially from those contained in any forward-looking statements.
Please read the sections of this annual report entitled ITEM 3D Risk Factors, ITEM 4B Business Overview, ITEM 5A Operating Results and ITEM 5B Liquidity and Capital Resources for a complete picture of factors that could affect our future performance and the industry in which we operate. In light of these risks, uncertainties and assumptions, the forward-looking events described in this annual report may not occur.
We are subject to the reporting requirements of the U.S. Securities Exchange Act of 1934, as amended, (the Exchange Act), and we are required to make periodic reports to the U.S. Securities and Exchange Commission (SEC) about KDG and KDG's business that are publicly available. In addition, we are subject to the ongoing reporting requirements of the Irish Stock Exchange. Apart from any requirements pursuant to these laws and rules we have no obligation to update publicly or revise any forward-looking statements in this annual report, whether as a result of new information, future events or otherwise. You are cautioned not to rely unduly on forward-looking statements when evaluating the information presented in this annual report.
We operate in an industry in which it is difficult to obtain precise industry and market information. We have generally obtained the market and competitive position data in this annual report from industry publications and from surveys or studies conducted by third party sources.
We believe that these industry publications, surveys and studies are reliable. However, we cannot assure you of the accuracy and completeness of such information and we have not independently verified such industry and market data.
In addition, in many cases we have made statements in this annual report regarding our industry and our position in the industry based on our experience and our own investigation of market conditions. We cannot assure you that any of these assumptions are accurate or reflect our position in the industry correctly, and none of our internal surveys or information have been verified by any independent sources.
ITEM 6 DIRECTORS, SENIOR MANAGEMENT AND EMPLOYEES
A. Directors and Senior Management
In accordance with German corporate law we are managed by a management board (Geschaeftsfuehrung) and supervised by a supervisory board (Aufsichtsrat). These two boards are separate. No individual may be a member of both boards. The management board is responsible for the day-to-day management of our business. The supervisory board appoints members of the management board and is authorized to remove members from the management board. The principal function of the supervisory board is to monitor the management board. The management board is obliged to report to the supervisory board on our business activities and strategy regularly, and the supervisory board may request additional reports at any time. The management board must obtain prior approval from the supervisory board with respect to certain material matters, but the supervisory board is generally not entitled to assume management functions or interfere with the day-to-day management of our business.
The management board of KDG is advised by our Advisory Board. No family relationships exist between the members of any of our management board, Supervisory Board or Advisory Board.
95
Table of Contents
Our Management Board
In the course of the financial year ending on March 31, 2009, our management board consisted of four members from April 2008 until September 2008 and of three members from October 2008 until March 2009. The following table sets out the name, age, position and the year of appointment for each of the members of our Management Board. The Managing Directors are initially appointed for up to three years. After this initial period, appointments are for an indefinite period.
| | | | | | | | | |
Name | | Born | | Position | | Year first
appointed | |
|---|
Dr. Adrian v. Hammerstein | | | 1953 | | Chairman of the Management Board,
Chief Executive Officer since May 2007 | | | 2007 | |
Paul Thomason | | | 1955 | | Chief Financial Officer | | | 2003 | |
Dr. Manuel Cubero del Castillo-Olivares | | | 1963 | | Chief Commercial Officer | | | 2005 | |
Herbert H. Hribar | | | 1951 | | Chief Operating Officer
(until September 30, 2008) | | | 2006 | |
Dr. Adrian v. Hammerstein has been Chairman of the Management Board and Chief Executive Officer of Kabel Deutschland since May 2007. He holds a doctorate in economics and has been working as an executive in the information and communication industry for 20 years. Prior to joining KDG, Dr. v. Hammerstein was Chief Executive Officer at Siemens Business Services, an IT service provider. Before that, Dr. v. Hammerstein managed the business of Fujitsu Siemens Computers for five years, first as CFO then as CEO. Under his management, the joint venture evolved into a profitable and recognized supplier of IT hardware and infrastructure. Former stages of his occupational history have been group Chief Financial Officer of Information and Communications products at Siemens AG, Chief Financial Officer of the Open Enterprise Computing Division at Siemens Nixdorf and System Business Finance Manager at Digital Equipment.
Paul Thomason is Chief Financial Officer and has been a member of the Management Board since 2003. From 1999 to 2002, he held the position of Chief Financial Officer at Primacom. Between 1996 and 1998 Mr. Thomason served as Chief Financial Officer of KabelMedia, a predecessor to Primacom. Prior to joining KabelMedia, Mr. Thomason served as Senior Vice President of the First Union National Bank (Wachovia) in Charlotte, North Carolina, where he was responsible for the bank's media investment and loan portfolio. Mr. Thomason received a BA in Business Administration from Georgia State University.
Dr. Manuel Cubero del Castillo-Olivares had been Vice President at Kabel Deutschland since November 2003. He was appointed Managing Director, responsible for Cable TV and content in December 2005. Since November 2006 he also takes responsibility for the product segment 'Internet & Phone'. Since April 2007 he is also responsible for sales and marketing. This includes sales to private customers, small and medium-sized companies, large corporations, and housing associations. Before joining KDG he held various positions within the German media-company Kirch Group. He, among other positions, has taken responsibility for the digital playout center and was managing director of Beta Technik Beteiligungs-GmbH. He was also founder and managing director of an internet betting company in Austria and worked as a consultant. Dr. Cubero holds a doctorate degree in physics from Darmstadt Technical University, Germany, and an MBA from INSEAD Business School in Fontainebleau, France. He has been President of Cable Europe (European Cable Communications Association) from February 2006 until January 2008.
Herbert H. Hribar was a member of the Management Board from November 2006 until September 30, 2008. As Chief Operating Officer he was responsible for operations at Kabel Deutschland. He was in charge of Central Engineering, Technical Services, IT and Customer Services. Before joining KDG Herbert Hribar worked for the Swiss cable network operator Cablecom, where he
96
Table of Contents
was responsible for the operation and modernization of the cable network as well as marketing and sales in his position as managing director. Among other things Mr. Hribar improved the performance of internet and phone services at Cablecom, including network planning and customer service. Previous to his position at Cablecom, Mr. Hribar worked for the Irish telecommunication-provider Eircom.
Our Supervisory Board
Our Supervisory Board currently consists of twelve members, comprising six representatives of the shareholders and six employee representatives. Each Supervisory Board member has been appointed for a term of five years and can be reelected. The shareholder representatives have the ultimate right to elect the Chairman of the Supervisory Board. Resolutions of the Supervisory Board generally require a simple majority of the votes cast. In case of a tie-vote, the Chairman has an additional vote.
The following table sets out the name, age, position and the year of appointment for each of the members of our Supervisory Board as well as member changes that occurred during the last financial year.
| | | | | | | | | |
Name | | Born | | Position | | Year first
appointed | |
|---|
Prof. Dr. Heinz Riesenhuber | | | 1935 | | Chairman | | | 2004 | |
Sibylle Spoo | | | 1961 | | Member; Vice Chairwoman | | | 2003 | |
Walter Ruland | | | 1957 | | Member (until October 2008) | | | 2003 | |
John Hahn | | | 1958 | | Member | | | 2003 | |
Biswajit Subramanian | | | 1965 | | Member | | | 2003 | |
Toni Krüger | | | 1961 | | Member | | | 2003 | |
Petra Hesse | | | 1965 | | Member | | | 2005 | |
Tony Ball | | | 1955 | | Member | | | 2006 | |
Torsten Winkler | | | 1971 | | Member | | | 2006 | |
Robert Sudo | | | 1976 | | Member | | | 2006 | |
Norbert Michalik | | | 1960 | | Member | | | 2006 | |
Joachim Pütz | | | 1953 | | Member | | | 2008 | |
Rita Billmann | | | 1950 | | Member (since November 2008) | | | 2008 | |
Prof. Dr. Heinz Riesenhuber was appointed Chairman of our Supervisory Board in December 2004. He has been a member of the German Federal Parliament since 1976. He is also in the Supervisory Boards of EVOTEC AG and of Frankfurter Allgemeine Zeitung GmbH, in the Verwaltungsrat of HBM BioVentures AG and in other Boards. From 1982 to 1993 he served as the German Federal Minister for Research and Technology. Prior to 1982, Mr. Riesenhuber was CEO of Synthomer Chemie GmbH Frankfurt and Erzgesellschaft mbH (a subsidiary of Metallgesellschaft AG). Mr. Riesenhuber is an honorary Professor of Johann-Wolfgang-Goethe University Frankfurt and holds a Ph.D. in chemical engineering.
Sibylle Spoo was appointed as Vice Chairwoman of our Supervisory Board in September 2007. She is an employee representative and has been a member of the Supervisory Board since 2003. Ms. Spoo works at the ver.di Bundesverwaltung (federal administration of the German union representing the public sector employees) as head of the workers participation and industry politics. Prior to this she was a secretary of the works council at the German postal union.
Walter Ruland is an employee representative and has been a member of the Supervisory Board from 2003 until October, 2008. Mr. Ruland has been the chairman of the works council for the region of Bavaria since 2000 and is the vice chairman of our group works council. Prior to 2000 Mr. Ruland was a broadband cable technician.
97
Table of Contents
John Hahn is a shareholder representative and has been a member of the Supervisory Board since 2003. Mr. Hahn is a managing director of Providence Equity Partners Limited and he is responsible for Providence's European investment activities. He is also a director of Nordic Cable Acquisition Company (com hem), Digital Platform lletisim Hizmetleri (Digiturk), Grupo Corporativo Ono and Volia Cable. Prior to joining Providence in 2000, Mr. Hahn was a Managing Director at Morgan Stanley. Prior to Morgan Stanley, Mr. Hahn worked with Price Waterhouse and Federal Data Corporation. Mr. Hahn received a Master of Business Administration from the Anderson School at the University of California at Los Angeles and a Bachelor of Business Administration from the University of Notre Dame.
Biswajit Subramanian is a shareholder representative and has been a member of the Supervisory Board since 2003. Mr. Subramanian is a managing director of Providence Equity Advisors India Private Limited and is a director of the board of Idea Cellular Ltd. and Aditya Birla Telecom Limited. Previously he was a member of the board of directors of eircom Limited, Ireland, and its holding company Valentia Telecommunications. Before joining Providence, he was a Vice President at Morgan Stanley & Co. International Ltd. in the European telecommunications investment banking team and, prior to that, worked at Credit Suisse First Boston, McKinsey & Co., and Intel Corporation. Mr. Subramanian received an MBA from the Wharton School of the University of Pennsylvania, a Master's degree in electrical engineering from the University of California Santa Barbara and a Bachelor's degree in electrical engineering from the Indian Institute of Technology.
Toni Krüger is an employee representative and has been a member of the Supervisory Board since 2003. Mr. Krüger has been working in the cable industry for 20 years. Since our spin-off from DTAG Mr. Krüger represents the interests of our employees on a full-time basis as a member of our group works council.
Petra Hesse is an employee representative and has been a member of the Supervisory Board since July 2005. Ms. Hesse worked for the controlling department of Deutsche Telekom AG and joined Kabel Deutschland in 1999. She has been representing the employees' interests as chairwoman of the works council of the region Lower Saxony/Bremen since 2002.
Tony Ball was appointed Chairman of our Advisory Board in June 2005 and became a member of the Supervisory Board in 2006 following the completion of the change in ownership in February 2006. Previously he was CEO of BSkyB plc (2001-2005) and before that CEO of Fox-Liberty Networks (1996-1999). He is a board member of the London 2012 Olympic Delivery Authority, a director of ONO SA (Spain) and a trustee of the Media Trust. In July 2009, Mr. Ball became a non-executive director of British Telecom PLC. Mr. Ball received an MBA from Kingston University and an honorary doctorate from Middlesex University. He is a fellow of the Royal Television Society.
Torsten Winkler was appointed to our Supervisory Board in 2006 following the completion of the change in ownership in February 2006. Mr. Winkler is a partner of Vitruvian Partners LLP where he is responsible for investments in German speaking Europe. Prior to that he was a Director of Providence Equity Partners Limited and a member of the London-based team responsible for Providence's European investment activities. Prior to joining Providence Mr. Winkler worked for Morgan Stanley Dean Witter in corporate finance and mergers & acquisitions, where he focused on the telecommunications and technology industries. Mr. Winkler received Bachelor of Science degrees in Mathematics and Industrial Engineering from Karlsruhe University and a Master of Engineering Economic Systems & Operations Research degree from Karlsruhe University.
Robert Sudo was appointed to our Supervisory Board in 2006 following the completion of the change in ownership in February 2006. Mr. Sudo is a Vice President of Providence Equity Partners Limited and is a member of the London-based team responsible for Providence's European investment activities. Prior to joining Providence Mr. Sudo worked as an Analyst for Goldman Sachs in Mergers &
98
Table of Contents
Acquisitions and Corporate Finance. He received a Diploma in Business Administration from HHL Leipzig Graduate School of Management.
Norbert Michalik is an employee representative and has been a member of the Supervisory Board since 2006. Mr. Michalik is the head of our Internal Audit/Risk management and SOX Compliance department. He is responsible for an independent and objective assurance activity designed to add value and improve on organization's operations by bringing a systematic, disciplined approach to evaluate and improve the effectiveness of the internal control system (ICS), control and governance processes. He studied economics (main focuses on accounting and controlling) at the University in Duisburg.
Joachim Pütz is an employee representative and has been a member of the Supervisory Board since 2008. Mr. Pütz is working as Secretary of Workers Union at ver.di (German Union representing the public sector employees) in Berlin.
Rita Billmann is an employee representative and has been a member of the Supervisory Board since November 2008. Ms. Billmann is the chairwoman of the works council (Customer Services) and is also a member of our group works council.
According to the articles of association, the members of the Supervisory Board are appointed by the shareholder meeting for a term of four years, not including the fiscal year in which the term begins. On October 17, 2008, the shareholder representatives have been reelected.
Representatives of the Shareholders
| | |
Prof. Dr. Heinz Riesenhuber | | Chairman of the Board |
Tony Ball | | External Advisor |
John Carl Hahn | | Managing Director
Providence Equity |
Biswajit Anna Subramanian | | Director
Providence Equity |
Robert Sudo | | Vice President
Providence Equity |
Torsten Winkler | | Partner
Vitruvian Partners |
Employee Representatives
The first election in KDG's company history of employee representatives was held in October and November 2008. All elected representatives, as listed below, accepted their election.
| | |
Sybille Spoo | | Secretary of Workers Union
(Gewerkschaftssekretaerin)
Vice Chairwoman of the Board |
Walter Ruland | | Technical Secretary for Telecommunication
(Technischer Fernmeldehauptsekretaer) |
Toni Krüger | | Engineering Employee
(Technischer Angestellter) |
99
Table of Contents
| | |
Joachim Pütz | | Secretary of Workers Union
(Gewerkschaftssekretaer) |
Petra Hesse | | Chairwoman of Workers Council for Region Niedersachsen/Bremen
(Betriebsratsvorsitzende der Region Niedersachsen/Bremen) |
Norbert Michalik | | Executive Employee
(leitender Angestellter) |
Rita Billmann | | Chairwoman of Workers Council (Customer Services—KSC)
(Betriebsratsvorsitzende KSC)
(since November, 2008) |
Our Advisory Board
Our Advisory Board currently consists of five members. Two of these members are shareholder representatives and three are external advisors. The Advisory Board advises the Management Board and approves principal strategy decisions.
| | | | |
Name | | Year first
appointed | |
|---|
John Hahn | | | 2003 | |
Biswajit Subramanian | | | 2003 | |
Ian West | | | 2003 | |
Prof. Dr. Heinz Riesenhuber | | | 2004 | |
Tony Ball | | | 2006 | |
For details onTony Ball,Prof. Dr. Heinz Riesenhuber,John Hahn andBiswajit Subramanian, please see above under ITEM 6A 'Our Supervisory Board'.
Ian West has been a member of the Advisory Board since September 2003. Mr. West is Founder and Chairman of the nettv247.com Ltd group, specializing in internet TV and also Co-Founder & Vice-Chairman of Top Up TV founded in 2003 in the UK. Mr. West has held senior management and board positions at both BSkyB and its subsidiaries (1989 – 2000) and ntl (2001 – 2003), as well as being an advisor/investor with a range of private equity companies and via his own stand alone investments in a range of companies. Mr. West has a BA (honors) in Business Studies and is a member of the Chartered Institute of Marketing.
B. Compensation
The aggregate compensation paid to the members of our Management Board for the year ended March 31, 2009 amounted to approximately €3.3 million.
In the same period, the aggregated remuneration of the Supervisory Board members was €71 thousand and the aggregated remuneration of the Advisory Board members was €276 thousand.
We also maintain a directors' and officers' insurance policy with respect to the members of our Management Board and senior officers.
In the fiscal year ended March 31, 2009, €228 thousand were set aside for the Management Board by the Company for pension, retirement or similar benefits.
100
Table of Contents
Benefits
Annual Bonus
In addition to their base salary, Managing Directors have the opportunity to earn a target bonus. This target bonus differs according to the individual service agreement, but is never lower than 80% of the base salary. The annual bonus paid to the management in the fiscal year ended March 31, 2009, amounted to €1.8 million.
Annual bonus payments were determined by the Personnel and Executive Committee of the Supervisory Board based on the performance of the Company and the extent that individual goals have been achieved. 80% of the bonus target relates to company goals, 20% relate to performance based on individual objectives.
Non-Cash Benefits
All Managing Directors are entitled to a company car including petrol, to a mobile phone, to a private health insurance plan and are enrolled in the company's pension scheme with immediate non-forfeiture. The Company also has five 'Management Equity Participation' programs in place. See ITEM 7—Major Shareholders and Related Party Transactions. Other than that, management does not receive any other direct benefits in kind.
Managing Directors' Service Contracts
The notice periods of the Managing Director's service contracts differ, but all of the managing director's service contracts can be terminated either with a notice period of twelve months.
Managing Equity Participation Program
See ITEM 7—Major Shareholders and Related Party Transactions.
Other Transactions
Dr. Adrian v. Hammerstein obtained a loan with an interest of 5.0% p.a. in the amount of €1.2 million from Cayman Cable Holding L.P.; accrued interest as of March 31, 2009 amounted to €114 thousand. Dr. Manual Cubero obtained a loan with an interest rate of 5.5% p.a. in the amount of €960 thousand from Cayman Cable Holding L.P.; accrued interest as of March 31, 2009 amounted to €99 thousand. As of March 31, 2009, the principal amount of each of these loans is outstanding.
C. Board Practices
In addition to the supervision of our Management Board by the Supervisory Board and Advisory Board, certain decisions of our Management Board are subject to prior shareholder approval in accordance with our Management Board's rules of procedure. The Managing Directors of Cable Holding S.à r.l (Cable Holding) have the authority to grant such approval. In many cases, however, their approval requires prior consent of Cable Holding S.à r.l.'s advisory board. This Advisory Board currently consists out of three members.
Our Audit Committee
Our Advisory Board has established an Audit Committee. The current members of the audit committee are Torsten Winkler and Robert Sudo. The purpose of the Audit Committee is to assist the Advisory Board in fulfilling its responsibilities to oversee the accounting and financial reporting processes at the Company. These responsibilities include the oversight of the quality and integrity of the Company's consolidated financial statements and related disclosure and its internal control, risk
101
Table of Contents
management and audit functions. The committee furthermore oversees the performance, qualifications and independence of the external auditor. The Audit Committee meets with representatives of management and the external auditor at least twice annually. In the fiscal year ended March 31, 2009, there was no remuneration for the members of the Audit Committee.
For further details on Torsten Winkler and Robert Sudo, please see above under ITEM 6A 'Our Supervisory Board'.
Our Personnel and Executive Committee
Our Supervisory Board also has established a Personnel and Executive Committee (Praesidial- und Personalausschuss), which, among other things, determines the remuneration to be received by our board members in accordance with the agreements KDG has in place with them and sets the annual bonus payments to be received by our Managing Directors. The current members of the Personnel and Executive Committee are Prof. Dr. Heinz Riesenhuber, Torsten Winkler, Sybille Spoo and Toni Krüger.
For details on Prof. Dr. Heinz Riesenhuber, Torsten Winkler, Sybille Spoo and Toni Krüger, please see above under ITEM 6A 'Our Supervisory Board'.
D. Employees
The following table sets forth our headcount numbers as of March 31, 2005, 2006, 2007, 2008 and 2009:
| | | | | | | | | | | | | | | | |
| | As of March 31, | |
|---|
Employees | | 2009 | | 2008 | | 2007 | | 2006 | | 2005 | |
|---|
Sales & Marketing | | | 508 | | | 464 | | | 560 | (32) | | 659 | | | 602 | |
Network and Infrastructure | | | 948 | | | 948 | | | 1,105 | | | 1,194 | | | 1,160 | |
Overhead | | | 469 | (32) | | 475 | (32) | | 318 | | | 282 | | | 274 | |
Call Center | | | 677 | | | 707 | | | 701 | | | 433 | | | 363 | |
TKS | | | 131 | | | 154 | | | 155 | | | 149 | | | 141 | |
| | | | | | | | | | | | |
Total Employees | | | 2,733 | | | 2,748 | | | 2,839 | | | 2,717 | | | 2,540 | |
| | | | | | | | | | | | |
- (32)
- Including Order Management.
As of March 31, 2009, approximately 14% of our workforce were civil servants and still had the right to cease working for us and return to work for DTAG or its affiliates.
Approximately 20% of our employees are members of a labor union. Historically, we have enjoyed good labor relationships and we are committed to maintaining these relationships. We take a constructive approach to union relationships and have been able to secure the cooperation of the unions and our workforce with regard to significant changes and the process of continuous improvements. We have negotiated various collective bargaining agreements directly with the labor union. These collective bargaining agreements cover the general labor conditions of our employees (other than executives), such as working hours, holidays, termination, provisions and general payment schemes for wages.
In April 2008, we entered into a new 24-month collective bargaining agreement with the labor union representing our unionized employees. As a result, wages for employees increased by 3.7% from June 1, 2008 and by another 3.3% from April 1, 2009.
In November 2008 we signed a collective agreement with the labor union concerning a 'collective severance plan' with defined rules in case of possible upcoming restructuring measures. For the Technical Operation unit we also negotiated several shop floor agreements to reduce work force, costs and modernize work conditions.
102
Table of Contents
The Company took a restructuring accrual of €29.2 million in the fiscal year 2008/2009 following several announced restructurings, e.g. for the restructuring related to the integration of acquired Orion assets in May 2008, for a restructuring of the technical operations department announced in December 2008 and for the outsourcing of certain functions of the sales back office announced in February 2009. The restructuring will result in savings in the technical operations department of approximately €13 million in fiscal year 2009/2010 and approximately €17 million per year thereafter. After completion we will have reduced our workforce by approximately 200 employees.
In the fiscal year 2009/2010 we plan to reorganize the Call Centers and negotiate this with the labor union and the workers councils. All current restructuring efforts will be substantially completed by September 2010.
E. Share Ownership
Information required by this item is set forth under ITEM 7 'Major Shareholders and Related Party Transactions'.
ITEM 7. MAJOR SHAREHOLDERS AND RELATED PARTY TRANSACTIONS
The tables in this section present information regarding the beneficial ownership of our shares as of March 31, 2009 by each person who is known by us to own shares of Cayman Cable Holding G.P. Co. Ltd. and partnership interests in Cayman Cable Holding L.P. (the 'Partnership').
The amounts and percentages of shares beneficially owned by each shareholder are reported on the basis of SEC rules governing the determination of beneficial ownership, and the information is not necessarily indicative of beneficial ownership for any other purposes. Under such rules, a person is deemed to be a beneficial owner of a security if that person has or shares voting power, which includes the power to vote or direct the voting of a security, or investment power, which includes the power to dispose of or direct the disposition of a security, and includes securities for which a person holds the right to acquire beneficial ownership within 60 days. Except as otherwise indicated in the footnotes to the table below, we believe each beneficial owner named in the table has sole voting or investment power with respect to all shares beneficially owned by that owner. For a discussion of voting rights, see ITEM 7B 'Partnership Arrangements'.
A. Major Shareholders
As of March 31, 2009, the shareholder of Cayman Cable Holding G.P. Co. Ltd. is:
| | | | | | | |
| | Number
of Shares | | Percentage
of Shares | |
|---|
Providence | | | 270 | | | 100 | % |
On February 6, 2006, Providence, which has significant experience in investing in the telecommunications and media sectors and which had invested in the initial acquisition of KDG, completed the acquisition of the beneficial ownership interests in our parent company, Cayman Cable Holding L.P., previously owned by Apax and GS Capital Partners as well as those of several minority investors. Following this acquisition, Providence and its co-investing party Ontario Teachers' Pension Plan Board now own approximately 96% of the entity that indirectly controls the Company, with the remainder owned by members of our management.
Our group structure
KDG's sole shareholder is Kabel Deutschland Holding GmbH which in turn is wholly owned by Cable Holding S.à r.l., Luxembourg. Cable Holding S.à r.l. is wholly owned by Cayman Cable Holding L.P., a limited partnership under Cayman law. The general partner of Cayman Cable
103
Table of Contents
Holding L.P. is Cayman Cable Holding G.P. Co. Ltd., a corporation under Cayman law. Cayman Cable Holding G.P. Co. Ltd. has the primary responsibility for the management of the limited partnership.
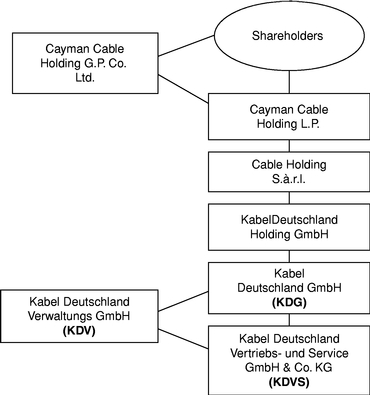
Major Interest Holders
As of March 31, 2009, the principal partnership interest holders of Cayman Cable Holding L.P. are the following:
| | | | | | | | | | |
| | Number of Investor
Common LP Interests | | Number of Management
Common LP Interests(33) | | Number of Options
Representing Interest
in Management
Common LP Interests | |
|---|
Providence(34) | | | 919,696 | | | | | | | |
Ontario Teachers' Pension Plan Board | | | 80,304 | | | | | | | |
Direct MEP I(35) | | | | | | 3,736,186 | | | | |
Indirect MEP I(36) | | | | | | 419,860 | | | | |
MEP II and MEP III(37) | | | | | | | | | 434,897 | |
MEP IV(38) | | | | | | 474,071 | | | 2,013,654 | |
MEP V(39) | | | | | | | | | 685,688 | |
- (33)
- The economic interest attached to a Management Common LP Interest is approximately one hundredth of the economic interest of an Investor Common LP Interest. As of May 21, 2007 the rights attached to the Management Common LP Interests were amended so they rank equally with the Investor Common LP Interests as to entitlement to distributions. At the same time, each Investor Common LP Interest was sub-divided to reflect that Management Common LP Interests and Investor Common LP Interests rank equally in terms of economic interest.
- (34)
- Held by Providence Equity Offshore Partners IV, L.P., Providence Equity Operating Partners IV, L.P., and Providence Equity Offshore Partners V, L.P.
- (35)
- (As at 31 March 2009) Direct MEP I has 3,736,186 Management Common LP Interests held by participants via the Management Equity Participation program established for our senior management, including Prof. Dr. Heinz Riesenhuber
104
Table of Contents
(62,252) and Basil Management Inc. (2,693,698), members or the associates of members of our Supervisory Board and our Advisory Board and Paul Thomason (839,720), member of our Management Board and certain other senior managers holding in total 140,516 Management Common LP Interests.
- (36)
- Indirect MEP I is established via Kabel Management Beteiligungs GbR, a German partnership established to implement the Management Equity Participation program for other managers. None of the participants of the Direct MEP I referred to in footnote 35 above are participants of the Indirect MEP I. 419,860 Management Common LP Interests are held by the Kabel Management Beteiligungs GbR. Manuel Cubero, a member of our Management Board, indirectly holds 209,930 Management Common LP Interests through Indirect MEP I. See ITEM 7 B MEP I.
- (37)
- MEP II and MEP III represent options to acquire interests in the Partnership.
- (38)
- Since March 31, 2007, an additional management participation plan MEP IV has been implemented, holding 474,071 Management Common LP Interests. Dr. Adrian v. Hammerstein and Dr. Manuel Cubero indirectly hold 125,000 and 100,000 of such Management Common LP Interests, respectively. During the fiscal year ended March 31, 2008 and in conjunction with the implementation of MEP IV 2,085,908 options have been granted and as of March 31, 2008, a total of 2,013,654 options were outstanding to the participants in MEP IV. See ITEM 7 B MEP IV.
- (39)
- During the fiscal year ended March 31, 2008 and in conjunction with the implementation of the additional plan MEP V 481,688 options have been granted. During the fiscal year ended March 31, 2009, additional 204,000 options have been granted in conjunction with MEP V. See ITEM 7 B MEP V.
KDG's record holder is Cayman Cable Holding L.P. and therefore, there are no host country holders of record. Management Common LP Interests and the Investor Common LP Interests rank equally as to entitlement to distributions and voting rights.
B. Related Party Transactions
Partnership Arrangements
The Limited Partners of Cayman Cable Holding L.P. (the Partnership) entered into an amended and restated exempted limited partnership agreement on February 8, 2006 following the Acquisition. This agreement (the Partnership Agreement) sets out the terms of the investment of the Limited Partners in the Partnership. Under the Partnership Agreement the primary right to manage and control the affairs of the Partnership assets, including its investment in KDG, is vested in the general partner of the Partnership, Cayman Cable Holding G.P. Co. Limited, an entity wholly owned by Providence (the GP). The limited partners in the Partnership have no independent right to manage separately from the GP although they have certain very limited consent rights. In relation to the votes cast by the limited partners each holder of an LP Interest (being an Investor Common LP Interest or a Management Common LP Interest) has one vote for each LP Interest it is deemed to hold. No limited partners have a right to board seats on KDG or its subsidiaries.
Management Equity Participation Programs
The Company has five Management Equity Participation programs (MEP I, MEP II, MEP III, MEP IV and MEP V) in place. MEP I provides interests in the Partnership, the parent company of KDG, MEP II and III provide options on interests in the Partnership. MEP IV provides indirect interests in the Partnership and options on indirect interests in the Partnership. MEP V provides options on interests in the Partnership if certain events take place. The interests and options on interests of certain members of our Management Equity Participation programs were purchased by Providence in connection with the privatization of the Kabel Deutschland cable networks in 2003. There are no special voting rights for MEP I, MEP II, MEP III, MEP IV and MEP V.
MEP I
The management of KDG participates in the Partnership, in part directly, as limited partners of the Partnership (Direct MEP I) and in part indirectly, through interests in Kabel Management Beteiligungs-GbR, a separate partnership which is itself a limited partner in the Partnership (Indirect MEP I). The terms of both programs are substantially the same.
105
Table of Contents
The members of both the Direct MEP I and the Indirect MEP I were required to pay a capital contribution upon admission. The Partnership and the Kabel Management Beteiligungs-GbR, respectively, have financed up to 70% of the managers' contributions with a loan from the Partnership. Interest accrues on such loans at a rate between 3.0% and 5.5% per annum, compounded annually, and is repayable in accordance with an amortization schedule in the relevant agreement. The managers are entitled to distributions. With distributions by the Partnership and Kabel Management Beteiligungs GbR to the Managers dated March 29 and November 19, 2004 (such distributions financed through the sale of shares in the subsidiary Cable Holding S.à r.l.), the granted loans were settled. Put or call provisions apply to the managers' Management Common LP Interests in the event that such managers cease to be employed by KDG or its subsidiaries.
Owners of Management Common LP Interests may not transfer their interests in the Partnership. Providence has a 'right of first refusal' with respect to any transfer of interests held by Ontario Teachers' Pension Plan Board. Ontario Teachers' Pension Plan Board also has the right to 'tag' on any transfer of interests by Providence, apart from certain permitted transfers. Notwithstanding the foregoing, no transfers shall be valid or effective if the transfer would violate any applicable securities laws or if it would cause the Partnership to lose any of its exemptions or favorable treatment under the U.S. Federal income tax laws, ERISA or the U.S. Investment Company Act of 1940. Cayman Cable Holding G.P. Co. Ltd. may also decide to issue new partnership interests to new limited partners under certain circumstances.
MEP II and MEP III
MEP II and MEP III are option programs that differ from MEP I in the fact that an exercise option price and a grant date exists. Under these programs the participants were granted options on interests in the Partnership.
MEP IV
Further management of KDG participate in the Partnership indirectly through interests in Kabel Management Beteiligungs (MEP IV) GbR, a separate partnership which is itself a limited partner in the Partnership (Indirect MEP IV). Options were also issued under MEP IV on interests in the Partnership. The terms of both the MEP IV option program and the indirect MEP IV program are substantially the same.
The members of the indirect MEP IV were required to pay a capital contribution upon admission. The Partnership and the Kabel Management Beteiligungs (MEP IV) GbR, respectively, have financed 80% of the managers' contributions with a loan from the Partnership. Interest accrues on such loans at a rate of 5.0% per annum, compounded annually. The managers are entitled to distributions. Put or call provisions apply to the managers' Management Common LP Interests in the event that such managers cease to be employed by KDG or its subsidiaries.
MEP V
MEP V is an option program that grants an option to purchase limited partnership interests (Management Common LP Interests) in the Partnership if Kabel Deutschland GmbH (or its parent entity) is listed or sold to a third party, therefore allowing the management to potentially benefit from any relevant listing or sale. The General Partner also has discretion to allow options to become exercisable on an earlier date where any transaction occurs which would materially affect the value of options. Any unused options expire ten years from the date of the grant of such options.
106
Table of Contents
Grant date
The grant date determines the point in time at which the fair value of the services of the management is measured. The managers who are members of the Direct MEP I participate in Cayman Cable Holding L.P. with a deemed grant date of March 13, 2003. The managers who are members of the Indirect MEP I participate with a deemed grant date of November 27, 2003. For one limited partner in the Partnership the deemed grant date is September 7, 2003. For some of the additionally issued interests in 2006 the deemed grant date is April 2, 2005, for the rest the grant date is February 2, 2006. For the managers who are members of the MEP IV program, the grant date is March 29, 2007. The options under MEP V have been issued with a grant date as of December 3, 2007 and, for additional options given out in fiscal year ended March 31, 2009, with a grant date as of January 23, 2009.
Certain Relationships and Related Party Transaction
The holders of preferred limited partnership interests (subsequently exchanged for Investor Common A LP Interests) were originally entitled to receive a preferred share of any distributions of the Partnership, up to an amount of €5,873.53 per Partnership interest, plus interest. Following a one-time distribution made by the Partnership in March 2004, the preferred distribution rights were satisfied in full. Following an amendment to the Partnership agreement on May 21, 2007 and a sub-division of the Investor Common LP Interests on that date, the Management Common LP Interests and the Investor Common LP Interests rank equally as to entitlement to distributions and voting rights.
Management Equity Participation Programs
Part of the management of KDG, including two members of the supervisory board, participates in Cayman Cable Holding L.P. either by means of the equity participation program set out in the amended and restated exempted limited partnership agreement dated May 21, 2007 (Equity Participation Program), or by means of Kabel Management Beteiligungs-GbR and Kabel Management Beteiligungs (MEP IV) GbR, separate partnerships which are themselves limited partners in Cayman Cable Holding L.P. (Management Scheme). The terms of the programs are substantially the same. Most of the managers who are members of the Equity Participation Program participate in Cayman Cable Holdings L.P. with effect from March 13, 2003. The managers who are members of the Management scheme participate with effect from November 27, 2003 and March 29, 2007. The members of both programs were required to pay a capital contribution upon admission. Up to 80% of the managers' contributions were financed by a loan from Cayman Cable Holding L.P.
Financial Advisory Arrangements
We are currently receiving services from Providence based on a management contract approximating €2.0 million per year. Ontario Teachers' Pension Plan Board may in the future provide services to KDG, for which they will receive customary fees in compliance with our financing documents or otherwise.
Other Transactions
Prof. Dr. Heinz Riesenhuber obtained separate loans in the amounts of €70 thousand and €379 thousand with an interest rate of 5.5% p.a. from Cayman Cable Holding L.P. As of March 31, 2009, approximately €135 thousand remained outstanding (including accrued interest).
In April and May 2007 KDVS entered into loan agreements with Cayman Cable Holding L.P.. The first agreement of €1.0 million with an interest rate of 6.0% p.a. payable on February 1 of each year (or 11.0% p.a. on the overdue amount if the borrower fails to pay any amount), entered into on April 4, 2007 was fully drawn at the same date. The second agreement from May 21, 2007 provides for
107
Table of Contents
loans of up to €19.0 million with an interest rate of 6.0% p.a. payable on April 15 of each year (or 11.0% p.a. on the overdue amount if the borrower fails to pay any amount) in total to be drawn in tranches based on request and subject to management and board approval. As of March 31, 2009 an amount of €18.4 million in total was drawn. The cash loaned to the holding company was used in relation to purchases of MEP interests from management leaving the company.
C. Interests of Experts and counsel
Not applicable.
ITEM 8. FINANCIAL INFORMATION
A. Consolidated statements and other financial information
See ITEM 17 Financial Statements.
B. Significant Changes
See ITEM 17 Financial Statements.
ITEM 9. THE OFFER AND LISTING
A. Offer and Listing Details
All of our common stock is owned by our parent company, Cayman Cable Holding L.P. (See ITEM 7 Major Shareholders and Related Party Transactions). There is no established public trading market for our common stocks.
B. Plan of Distribution
Not applicable.
C. Markets
The Senior Notes have been listed on the Irish Stock Exchange and are registered with the SEC.
D. Selling Shareholder
Not applicable.
E. Dilution
Not applicable.
F. Expenses of the Issue
Not applicable.
ITEM 10. ADDITIONAL INFORMATION
A. Share Capital
Not applicable.
B. Memorandum and Articles of Association
There have been no changes to our Memorandum and Articles of Association during the last financial year. Please refer to the information provided for in our first annual report in Form 20-F.
108
Table of Contents
C. Material Contracts
Senior Credit Facility
On May 12, 2006, KDG entered into a new Senior Credit Facility. As from May 16, 2006, this agreement was comprised of two tranches, a €1,150.0 million Term Loan Facility, Tranche A, and a €200.0 million Revolving Credit Facility, Tranche B. Term Loan Facility and Revolving Credit Facility mature on March 31, 2012. The Senior Credit Facility is secured by all the assets of Kabel Deutschland Vertrieb und Service GmbH & Co. KG ('KDVS') and a first pledge on 100% of the shares of KDVS which are owned and offered as security by Kabel Deutschland GmbH under its guarantee. The carrying amount of KDVS' shares amounts to €3.3 million. As of March 31, 2009, the Term Loan Facility was fully drawn.
On June 22, 2007 the amount of the Revolving Credit Facility was increased by €125.0 million to €325.0 million. The Revolving Credit Facility may be borrowed, repaid and re-borrowed up until one month prior to the final maturity date. Borrowings under the Revolving Credit Facility may be used for general corporate purposes. As of March 31, 2009, the Revolving Credit Facility was undrawn.
On October 22, 2007, KDG entered into a Senior Add-on Facility accession agreement for a Tranche C in the amount of €650.0 million. The purpose of the facility was the funding of the acquisition of CATV assets from the Orion group. On April 30, 2008, KDG drew €535.0 million under the facility to fund the acquisition. As of May 9, 2008 the granted loan amount of the Senior Add-on Facility was reduced by €115.0 million to €535.0 million. The final maturity date of Tranche C is March 31, 2013. As of March 31, 2009, the Senior Add-on Facility Tranche C was fully drawn.
On February 11, 2009 KDG approached the lenders of its Senior Credit Facilities via its facility agent, the Royal Bank of Scotland, with a request to agree to certain minor amendments to the Company's credit covenants. KDG proposed to change the senior net debt to EBITDA covenant for the quarters starting from December 2010 to December 2011 as well as to extend senior net debt to EBITDA and EBITDA to net interest covenants beyond March 2012, until maturity of its Senior Add-on Facility, Tranche C, in March 2013. Approximately 92% of the lenders of its Senior Credit Facilities have consented to the amendments, which were thereby approved.
Interest rates on the Senior Credit Facility are based on one, two, three or six months EURIBOR plus a margin.
The current margin on the Senior Credit Facilities, Tranche A and Tranche B is EURIBOR + 175bps. The margin is based on the ratio of consolidated total net borrowings to Consolidated EBITDA (as defined in the Senior Credit Facility agreement) as follows:
| | | | |
Ratio of Consolidated Total Net Borrowings to Consolidated EBITDA | | Margin
(percent. p.a.) | |
|---|
Greater than 4:1 | | | 2.00 | |
Less than or equal to 4:1, but greater than 3.5:1 | | | 1.875 | |
Less than or equal to 3.5:1 | | | 1.75 | |
The margin on the Senior Credit Facility, Tranche C is EURIBOR + 325bps.
KDG pays an annual commitment fee of 0.625% on the undrawn commitment under Tranche B.
The Senior Credit Facility is subject to several affirmative and negative covenants including, but not limited to the following:
| | | | |
Test | | Requirement Range | |
|---|
EBITDA to Net Interest | | | 1.75x–3.00x | |
Senior Net Debt to EBITDA | | | 4.00x–2.00x | |
109
Table of Contents
Mandatory prepayments are required in case of (i) a change of control, public flotation or sale of the business, (ii) certain third party receipts, (iii) the sale of shares on the public market (if consolidated total senior net borrowings to consolidated EBITDA is greater than or equal 2:1).
The Company entered into interest rate caps and swaps in order to mitigate the exposure to interest rate risks. Since all of our existing interest rate hedges matured by end of June 2009 we will closely keep track of ongoing market developments but currently have no concrete plans to purchase new hedging instruments as we regard the interest rate environment as favorable. Nevertheless we will stay in contact with several potential bank counterparties in order to assure that we can lock-in interest rate hedges quickly whenever we think it becomes favorable.
SLAs with DTAG
We have entered into various long-term service level agreements (SLAs) with DTAG and certain of its affiliates that are significant to our business, in particular for the lease of cable duct space for approximately 13% of our cable network as well as the use of fiber optic transmission systems, tower and facility space. In addition, we purchase the electrical power required for the operation of our network through DTAG under such agreements. The various services offered by DTAG are defined under so-called 'Term Sheets' that are part of the SLAs. Generally, the term of the SLAs is unlimited, but the Term Sheets are subject to certain termination rights and, according to German law, lease agreements are subject to a termination right of either party after a term of 30 years. We renegotiated with DTAG in January 2003 to reduce our payments under the SLAs. Our total operational expenditures under the SLAs for the year ended March 31, 2009, amounted to €169.0 million. We believe our payments under the SLAs, coupled with other contracted services with DTAG affiliates, make us one of the larger customers of DTAG.
110
Table of Contents
The following chart provides an overview of the services covered by the SLAs:
| | | | | | | | | | |
SLA Term Sheet | | Service | | Duration | | Approx. annual cost
(based on 2009
figures) | | Termination rights |
|---|
1. | | Co-use of cable ducts | | Usage of cable ducts within DTAG's conduit system for existing broadband cable lines (13% of our coaxial cable is located in cable ducts leased from DTAG under this Term Sheet; the remainder is directly buried underground). | | Unlimited | | €102 million; possible increases based on actual cost, but subject to a cap at the German consumer price index ('CPI') rate until 2015. | | We can terminate the Term Sheet upon 12 months' notice to the end of the calendar year. We can also partially terminate the Term Sheet upon 15 months' notice period to the end of a calendar month. DTAG cannot terminate the Term Sheet except for good cause (Wichtiger Grund). If DTAG ceases to use part of the conduit system it can terminate with a 12-month notice period. In such a case DTAG must offer us the conduits for sale; provided that such conduits are owned by DTAG. If conduits are replaced, DTAG must offer us space for our cable in the new conduits with the same conditions. |
2. | | Offer of co-use of further cable ducts | | Non-binding offer to lease additional cable duct capacities in existing or newly built systems at pre-determined prices. The offer is subject to individual agreements for specific cable ducts. | | Term of offer unlimited but offer can be terminated by DTAG upon 12 months' notice. | | €1.7 million; possible increases based on actual cost, but subject to a cap at the German CPI rate until 2015. | | Both parties can terminate the individual agreements that are based on the non-binding offer upon 3 years notice to the end of a calendar year, but not for a period of 10 years. The Term Sheet itself can be terminated as described in the duration column. |
3. | | Fiber optic transmission system | | DTAG provides for the distribution of receiving certain analog and digital broadcasting signals via fiber optic transmission systems. | | Unlimited | | €3.6 million; possible increases based on actual cost, but subject to a cap at the German CPI rate until 2015. | | We can terminate the Term Sheet upon 24 months' notice to the end of each calendar year or upon four weeks' notice if reliability of the system is below 99%. We can also terminate the Term Sheet with respect to individual locations. DTAG cannot terminate except for good cause. The systems can be shut down by DTAG only to a limited extent; for example, the analog systems can only be shut down at a rate of up to 3% of the systems per year and up to 15% over the first 15 years. |
4. | | Opal network | | DTAG provides for the distribution to 109,000 analog and digital households. | | Terminated | | €3.5 million | | DTAG announced it will discontinue this technology by the end of 2010. |
5. | | Rental spaces for network equipment | | Lease of space of DTAG's premises which are used for broadband equipment such as transmission equipment, satellite receivers, antennae and microwave equipment. | | Unlimited | | €4.6 million; (if the landlord is a third party, fees are those paid to that third party plus a margin of 5%), plus €5.2 million for rental of antenna space. | | We can terminate the Term Sheet upon 24 months' notice period to the end of a calendar year. We can also terminate the Term Sheet with respect to certain locations upon 24 months' notice to the end of each calendar month. DTAG cannot terminate the Term Sheet except for good cause. DTAG can cease to operate the premises but only to a very limited extent and only upon a notice period of 24 months in most cases. |
6. | | Electrical power supply | | Purchase of electrical power from DTAG required for the operation of our network equipment. | | Unlimited | | €19.1 million; equal to price paid by DTAG plus a margin of 5%. | | The termination of the rental of network equipment automatically terminates the corresponding power supply; any separate termination of indoor power supply is prohibited. For outdoor power supply, we can terminate upon six months' notice to the end of a calendar month (also partially for individual locations upon six months notice period) and DTAG can terminate upon 12 months' notice to the end of a calendar month. |
111
Table of Contents
| | | | | | | | | | |
SLA Term Sheet | | Service | | Duration | | Approx. annual cost
(based on 2009
figures) | | Termination rights |
|---|
7. | | Rental rooms for network equipment | | Framework agreement for the lease of rooms which are used for broadband equipment such as transmission equipment, satellite receivers, antennae and microwave equipment. | | Unlimited | | €4 million. | | The framework agreement can be terminated with a notice period of 24 month to the end of a year, at the earliest to the end of the year 2021. KDG and DTAG can terminate rental contracts based on the framework agreement with either 6 or 12 month prior notice at the earliest to end of the minimum contract term. |
As DTAG has decided to gradually terminate the operation of its so-called OPAL fiber optic transmission system between December 31, 2004 and December 31, 2007, we will have to find alternative transmission capabilities if we wish to serve the affected subscribers in the future. We extended the contract for OPAL with the same financial conditions until December 31, 2010. As of March 31, 2009 we had approximately 109,000 subscribers in the OPAL areas.
In 2004 we entered into two agreements with DTAG:
- •
- Under the 'BRN-AMTV' agreement it was agreed to replace 254 of our point-to-point radio systems on A-mode TV base (AMTV-Richtfunk) by 254 optic broadband connection lines of DTAG. As a result, we have been able to terminate the lease for several transmission systems under Term Sheet 3, as well as to reduce our obligations under Term Sheet 5 (energy) of the SLAs. The implementation of this contract allowed us to reduce our operating expenses by a total of €13.0 million per year.
- •
- Under the 'BRN 2.2d' agreement it was agreed to transfer the lease of the existing 436 analog broadband connection lines under Term Sheet 3 of the SLAs to corresponding leases under the 'BRN 2.2d' agreement, reducing the prices at the same time by 10%. Further, this agreement provides for an option to upgrade the current analog broadband connection lines to optic broadband connection lines (optische BK VL) with up to 862 MHz with feedback channel. In this context, an agreement regarding the use of the relevant spaces for interactive services (internet, voice and data services) under Term Sheet 4 of the SLAs was made.
In November 2007 we entered into the following agreements with DTAG:
- •
- The aforementioned contracts from 2004, 'BRN-AMTV' and 'BRN 2.2d' where replaced by a new contract that includes all connection lines of the contracts 'BRN-AMTV' and 'BRN 2.2d' and gives KDG a formal way to order further connection lines. The average price per line could be reduced by about 20 percent. Lines can be canceled with a cancellation period of 24 months (for cancellations before 2013) or 12 months for cancellations in 2013 or later. The new contract has an annual volume of about €32.0 million.
- •
- In 2008 DTAG will deliver backbones to interconnect KDG?s cable pops in Bavaria und lower Saxony. The solution is a managed service using a technology called resilient packet ring (RPR). The contracts run from January 2, 2008 until June 13, 2022.
Cooperation agreement between TKS and Deutsche Telekom AG
In December 1998 TKS (as a 100% subsidiary of DTAG) and DTAG entered into a cooperation agreement regarding services of TKS for English speaking customers of DTAG (mainly U.S.-troops). The contract was continued after the sale of TKS to KDVS. In June 2008, DTAG terminated the contract as from the end of December 2008. TKS could reach an extension of the existing contract until May 2009 and orally agreed with DTAG on a new cooperation model. At the end of July 2009, TKS and DTAG mutually agreed to extend the contract governing our business relationship and
112
Table of Contents
according to a DTAG officer the signed contracts will be delivered within two weeks time. We expect the agreements to be effective but there is no assurance as long as the written contracts are not returned.
Other Supply Agreements
Transponder Capacity for Our Digital Television Platform
A key component of our digital television platform is the up-link and transponder capacity needed to transmit the digital signals from our play out facility in Frankfurt am Main/Roedelheim to our local head ends and the head ends of the other regional cable companies. We currently sublease these mainly from T-Systems, a subsidiary of DTAG, and, as of January 1, 2006, partly from SES ASTRA. The contract with T-Systems for seven transponders terminates in 2013. We also lease five transponders from SES ASTRA, which have a minimum term until 2012. We are currently deploying fiber backbones which are supposed to eliminate the need for transponders at the end of the existing transponder contracts.
Conditional access system for digital television
Our digital free-to-air cable access offering (except for the public broadcasters' channels), our pay-TV packages and the offering of an unaffiliated pay-TV operator that is distributed over our network are only offered to the subscribers of these services based on a conditional access system. The conditional access system (consisting of certain head end functionalities in the digital playout system and a smartcard for each subscriber's CPE which is delivered to the customer upon request for digital free-to-air television or subscription to pay television services) is necessary to encrypt (on the network side) and to decrypt (on the subscriber side) digital television and radio content. This system allows operators to provide pay-TV services and the respective billing on an individual subscriber basis. Once we activate the subscriber's smartcard, the encrypted digital signal is decoded, decompressed and converted to an analog signal and can be viewed by the respective subscriber.
Cable set-top boxes
As part of our launch of our digital television services we entered into agreements with various producers of set-top boxes for the activation and presentation of KDG products as well as the use of the trademark 'Kabel Digital'. On February 1, 2005, we announced the implementation of a self-certification process for Kabel Digital set-top boxes. In order to be 'Kabel Digital geeignet' (Kabel Digital ready), the producers have to self-certify that their boxes provide copyright protection (a requirement of the content providers), comply with parental control requirements required by law and are compatible with the specification of our conditional access system. The inclusion of other functions, like an electronic program guide, interactive TV interfaces or other software features are at the discretion of the producers. The self-certification should simplify and shorten the introduction of new cable set-top boxes and help to avoid shortages.
Call center framework agreements
In addition to our internal call center, we have assigned 10 external service providers with various call center activities based on framework agreements. The contracts with the service providers are standard agreements and have no defined volume per annum.
Delphi and Wizard/Infinys® Series 3 Rating and Billing (IRB)
The application DELPHI is an enhancement of the preceding SMILE system with workforce and trouble ticket functionality. In the course of the financial year ending March 31, 2009, two releases with major enhancements in the workforce management and network planning capabilities have been rolled
113
Table of Contents
out. The applications Wizard and Infinys are the Customer Care and Billing systems for Kabel Deutschland. We have a support and maintenance agreement with Convergys, the vendor of these systems, which approximates €1.2 million in maintenance fees. These fees will decrease to €0.84 million with the launch of the NGBS program (Next Generation Billing System). New developments and adoptions in the course of NGBS are the subject of ongoing negotiations. It will deliver new components for the accounts receivables functionality (SAP RM/CA) and billing (IRB Series 4). With the first phase of this program (NGBS I) we integrated usage-based billing functionalities into our system. The project was successfully delivered in March 2008. With the second phase of the program (NGBS II) we plan to rebuild the architecture of our billing (IRB Series 4) and accounting systems (SAP RM/CA). The project started in May 2008 and is still running. In FY 2008 we entered into various contracts with service partners, including Convergys, Jacada, GTW and SAP to deliver the project. As of July 2009 the system components are still under integration tests.
Orion Share Purchase Agreement
On September 18, 2007, Kabel Deutschland Erste Beteiligunsgesellschaft mbh, as purchaser ('KDG'), a wholly owned subsidiary of KDVS, entered into a share purchase agreement, as amended (the 'Orion Share Purchase Agreement'), with Tele Columbus GmbH and ewt Holding GmbH, as Sellers, guaranteed by Orion Cable GmbH ('Orion'). The Orion Share Purchase Agreement provides for the acquisition by KDG of the following operating companies (the 'Acquisition'):
- (i)
- 100.00% of shares of Tele Columbus Nord GmbH;
- (ii)
- 100.00% of shares of Kabel Deutschland Sued GmbH;
- (iii)
- 100.00% of shares of Kabel Deutschland West GmbH;
- (iv)
- 100.00% of shares of Kabel Deutschland Nord GmbH;
- (v)
- 100.00% of shares of AEP Plueckhahn Kabel GmbH;
- (vi)
- 70.00% of shares of KMG Kabel-Fernsehen Hannover GmbH;
- (vii)
- 70.00% of shares of Urbana Teleunion Rostock GmbH & Co. KG;
- (viii)
- 50.00% of shares of Verwaltung Urbana Teleunion Rostock GmbH;
- (ix)
- 75.58% of shares of KABELCOM Braunschweig Gesellschaft fuer Breitbandkabel Kommunikation mbH (together with KDG's pre-existing minority ownership of 24.00%, the total percentage of shares held by KDG increased to 99.58%);
- (x)
- 72.49% of shares of KABELCOM Wolfsburg Gesellschaft fuer Breitbandkabel Kommunikation mbH (together with KDG's pre-existing minority ownership of 24.00%, the total percentage of shares held by KDG increased to 96.49%);
- (xi)
- 43.15% of shares of RKS Niedersaechsische Kabel-Servicegesellschaft mbH & Co. KG (together with KDG's pre-existing minority ownership of 52.63%, the total percentage of shares held by KDG increased to 95.78%); and
- (xii)
- 51.20% of shares of RKS Niedersaechsische Kabel-Service-Beteiligungsgesellschaft mbH (together with KDG's pre-existing minority ownership of 43.80%, the total percentage of shares held by KDG increased to 95.00%).
FCO approval for the Acquisition was obtained on April 4, 2008, and the Acquisition closed on April 30, 2008.
The net purchase price for the Acquisition consisted of a cash payment of €527.8 million. However, in accordance with the Orion Share Purchase Agreement and the purchase price adjustment
114
Table of Contents
mechanism provided therein, Orion agreed with KDG to reduce the original purchase price by €67.5 million on May 21, 2009. In addition, as part of the purchase price adjustment mechanism provided for in the Orion Share Purchase Agreement, arbitration proceedings are currently still pending between KDG and Orion regarding a further possible reduction of the purchase price, in addition to the original purchase price reduction of €67.5 million, resulting from the allocation of certain central overhead costs. A final decision with regard to these arbitration proceedings is expected in autumn 2009.
The Acquisition was fully financed by means of the Senior Add-on Facility (Tranche C), which KDG secured for an amount of €650.0 million on October 30, 2007 and which was subsequently reduced by €115.0 million to €535.0 million as of May 9, 2008. The Senior Add-on Facility was fully drawn on April 30, 2008, upon the closing of the Acquisition.
In addition to customary terms and conditions, including certain representations and warranties made by Orion and terms and conditions detailing Orion's future liability exposure with respect to the Acquisition, KDG also has an option, in accordance with the second amendment to the Orion Share Purchase Agreement, to purchase certain additional Level 4 and Level 5 cable networks.
Please note that, KDG acquired on June 30, 2008, in a transaction separate from the Acquisition, 30.00% of the shares of KMG Kabel-Fernsehen Hannover GmbH, 4.22% of the shares of RKS Niedersaechsische Kabel-Servicegesellschaft mbH & Co. KG and 5.00% of the shares of RKS Niedersaechsische Kabel-Service-Beteiligungsgesellschaft mbH, directly or indirectly, from Verlagsgesellschaft Madsack GmbH & Co. KG, thereby increasing its stake in these companies to 100%.
D. Exchange Controls
There are currently no legal restrictions in Germany on international capital movements and foreign-exchange transactions, except in limited embargo circumstances relating to certain areas, entities or persons as a result of applicable resolutions adopted by the United Nations and the European Union.
For statistical purposes, there are, however, limited reporting requirements regarding transactions involving cross-border monetary transfers. With some exceptions, every corporation or individual residing in Germany must report to the German Central Bank (i) any payment received from, or made to, a non-resident corporation or individual that exceeds €12,500 (or the equivalent in a foreign currency) and (ii) any claim against, or liability payable to, a non-resident or corporation in excess of €5 million (or the equivalent in a foreign currency) at the end of any calendar month.
Corporations residing in Germany with assets in excess of €3 million must also report annually to the German Central Bank any shares or voting rights of 10% held by a non-resident.
E. Taxation
The following summary of certain German income tax considerations for holders of the Senior Notes (the 'Noteholders') is based on the effective tax law at the date of this filing which may change, even with retroactive effect. The summary does not describe all tax considerations that may be relevant for an individual's decision to purchase and exchange Senior Notes. It is not a substitute for tax advice.
German Tax Considerations
Prospective purchasers and current holders of Senior Notes are advised to consult their own tax advisors for the tax consequences of the purchase, the exchange, the ownership and the disposition of Senior Notes, including the effect of any state or local taxes under the tax laws of the Federal Republic of Germany as well as in each other country of which they are residents.
115
Table of Contents
The summary will also outline the amendments regarding the new tax regime of investment income and capital gains as it will come into effect from January 1, 2009.
Tax Residents (Tax treatment until December 31, 2008)
Interest payments
Interest paid to a noteholder resident in Germany (a person whose residence, habitual abode, statutory seat, or place of effective management and control is located in Germany) is subject to German personal or corporate income tax. On the basis of the assessed personal or corporate income tax, solidarity surcharge (Solidaritaetszuschlag) of 5.5% is levied. In addition, if Senior Notes are held as assets of a German commercial business, any interest is subject to trade tax. Accrued interest (Stueckzinsen) paid by an individual upon the acquisition of Senior Notes may give rise to negative income and may, therefore, reduce a Noteholder's personal tax liability.
If Senior Notes are held in a custodial account which the noteholder maintains with a bank or financial services institution in Germany, including branches of foreign banks or financial services institutions in Germany (the 'Disbursing Agent'—inlaendische auszahlende Stelle), such Disbursing Agent will withhold tax (Zinsabschlag) at a rate of 30% of the gross amount of all interest payments to the Noteholder plus 5.5% solidarity surcharge (Solidaritaetszuschlag) thereon. As a result, 31.65% of the gross amount of interest paid to a noteholder will be withheld by the Disbursing Agent.
The tax withheld by the Disbursing Agent will be credited against the Noteholder's total annual tax burden for German personal or corporate income tax purposes.
The Issuer of the Senior Notes, unless it qualifies as Disbursing Agent, is not obliged under German law to withhold any withholding tax from the interest payments.
Sale or Redemption of Senior Notes
Senior Notes as private assets
If the Senior Notes are held as private assets, according to recent changes in the jurisprudence of the Federal Fiscal Court, gains and losses from the sale or redemption of financial innovations providing for a stated yield (Emissionsrendite)—such as the Senior Notes—are taxable only as gains from private sales transactions. Therefore, gains from the sale or redemption of the Senior Notes—except for accrued interest (Stückzinsen)—are taxable and losses are deductible only if the Senior Notes were held for not more than one year by the private investor. Gains from private sales transactions are fully taxable, provided that such gains—alone or together with other gains from private sales transactions—equal or exceed €600. Gains falling short of this threshold are tax exempt. Losses realized within the one year period described above, can only be set off against other gains from private sales transactions. To the extent such a set off is not possible in the calendar year in which the loss has been realized, such loss can be carried back one year or can be carried forward into future years without any limitation and—subject to certain restrictions—can be set off against gains from private sales transactions generated in other assessment periods. In case the Senior Notes are held for more than one year, gains from the sale or the redemption are not taxable provided that the Senior Notes are held as private assets. Conversely, any loss is also not recognized for tax purposes.
To the extent the Senior Notes are denominated in a currency other than Euro (USD), the gains from the sale or redemption (except for accrued interest) are computed as the excess of the proceeds from the sale or redemption expressed in Euro over the purchase price expressed in Euro where the Euro amounts are determined on the basis of the prevailing foreign exchange rate.
If Senior Notes are held in a custodial account maintained with a Disbursing Agent since the acquisition of the Senior Notes, tax is deducted at a rate of 30% (plus solidarity surcharge of 5.5%
116
Table of Contents
thereon) from the excess of the proceeds arising from the sale or redemption over the purchase price paid for the Senior Notes. If custody has changed since the acquisition of the Senior Notes, tax is withheld from the amount equal to 30% of the proceeds arising from the sale or redemption of the Senior Notes. In computing the tax to be withheld, the Disbursing Agent may deduct any accrued interest paid by the Noteholder to the Disbursing Agent during the calendar year of the taxable gain from the basis of assessment. The tax withheld will be credited against the Noteholder's annual tax liability for personal income tax purposes.
The Issuer of the Senior Notes, unless it qualifies as Disbursing Agent, is not obliged under German law to withhold any withholding tax from the sale or redemption proceeds.
Senior Notes as business assets
Gains from the sale or redemption of the Senior Notes are subject to income tax or corporate income tax as well as solidarity surcharge and trade tax if the Senior Notes are held as assets of a German commercial trade or business. Losses are fully deductible when realized.
The procedure of the withholding tax deduction on payments from the sale or redemption of the Senior Notes is similar to the procedure outlined above for private investors.
Any withholding tax withheld is credited against the Noteholder's personal or corporate income tax liability in the course of the tax assessment procedure. Any potential surplus for the benefit of the Noteholder will be paid out to the Noteholder.
The Issuer of the Senior Notes is not obliged to withhold any withholding tax from the proceeds from the sale or redemption of the Senior Notes under German law, unless it qualifies as Disbursing Agent.
Tax Residents (Tax treatment from January 1, 2009 onward)
The Business Tax Reform Act 2008 dated August 14, 2007 (Bundesgesetzblatt ('BGBl'). I 2007, page 1912)—amongst others—changes the taxation of investment income for a German tax resident private investor significantly.
Interest Payments
Senior Notes as private assets
Current interest payments from the Senior Notes qualify as investment income pursuant to Sec. 20 paragraph 1 No. 7 EStG (Einkommensteuergesetz) and are subject to tax at a rate of 25% (plus solidarity surcharge).
If the Senior Notes are held in custody with or administered by a German Disbursing Agent current interest payments are subject to a tax at a rate of 25% (plus solidarity surcharge) that is withheld by such institution. The list of entities qualifying as Disbursing Agent is enlarged by including securities trading companies or securities trading banks as of January 1, 2009 onward. The withholding tax is definitive (flat tax;Abgeltungsteuer) i.e. the withholding tax is satisfying the personal income tax of the Noteholder. Noteholders having a lower personal income tax rate may include the capital investment income in their personal income tax return to achieve a lower tax rate. Income not subject to a definitive withholding tax will be subject to a special tax rate of 25% (plus solidarity surcharge) upon assessment.
The Issuer of the Senior Notes is not obliged to withhold any withholding tax from the interest payments under German law, unless it qualifies as Disbursing Agent.
117
Table of Contents
Senior Notes as business assets
If the Senior Notes are held as business assets any current interest payments from the Senior Notes qualify as business income and are subject to personal or corporate income tax plus solidarity surcharge. Further, such interest payments are recognized for trade tax purposes.
The procedure of the withholding tax deduction on interest payments is similar to the procedure outlined above for private Noteholders. Any withholding tax withheld is credited against the Noteholder's personal or corporate income tax liability in the course of the tax assessment procedure. Any potential surplus for the benefit of the Noteholder will be paid out to the Noteholder.
The Issuer of the Senior Notes is not obliged to withhold any withholding tax from the interest payments under German law, unless it qualifies as Disbursing Agent.
Sale or Redemption of Senior Notes
Senior Notes as private assets
Capital gains from the sale or redemption of the Senior Notes qualify as investment income pursuant to Sec. 20 paragraph 2 No. 7 EStG and are subject to personal income tax plus solidarity surcharge. Losses from the sale or redemption of the Senior Notes can only be off-set against other investment income. In the event that an off-set is not possible in the assessment period in which the losses have been realized, such losses can be carried forward into future assessment periods only and can be off-set against investment income generated in future assessment periods.
To the extent the Senior Notes are denominated in a currency other than Euro (USD), the gains and losses are computed as the excess of the proceeds from the Senior Note's sale or redemption expressed in Euro over the purchase price expressed in Euro where the Euro amounts are determined on the basis of the foreign exchange rate as of the acquisition date and the sale or redemption date respectively.
If the Senior Notes are held in custody with or administered by a German credit institution, financial services institution (including a German permanent establishment of such foreign institution), securities trading company or securities trading bank, a tax at a rate of 25% (plus solidarity surcharge thereon) is withheld by such institution upon sale or redemption of the Senior Notes. The withholding tax is imposed on the excess of the proceeds from the sale or redemption over the purchase price paid for the Senior Notes, if the Senior Notes were held in custody by such institution since their acquisition. If custody has changed since the acquisition and the acquisition data is not proved, the tax at a rate of 25% (plus solidarity surcharge) will be imposed on an amount equal to 30% of the proceeds from the sale or redemption of the Senior Notes. The withholding tax is definitive, i.e. the withholding tax is satisfying the personal income tax of the Noteholder. Noteholders having a lower personal income tax rate may include the capital investment income in their personal income tax return to achieve a lower tax rate. Income not subject to a definitive withholding tax (e.g. since there is no German custodian institution) will be subject to a special tax rate of 25% (plus solidarity surcharge) upon assessment.
The Issuer of the Senior Notes, unless it qualifies as Disbursing Agent, is not obliged under German law to withhold any withholding tax upon the sale or redemption of the Senior Notes.
Senior Notes as business assets
If the Senior Notes are held as business assets capital gains from the sale or redemption of the Senior Notes qualify as business income and are subject to personal or corporate income tax plus solidarity surcharge. Further, such gains and losses are recognized for trade tax purposes.
118
Table of Contents
The procedure of the withholding tax deduction is similar to the procedure outlined above for private Noteholders. Any withholding tax withheld is credited against the Noteholder's personal income tax liability in the course of the tax assessment procedure. Any potential surplus for the benefit of the Noteholder will be paid out to the Noteholder. No withholding tax deduction applies where the Senior Notes are held by a corporation.
No withholding tax is to be deducted by the Issuer of the Senior Notes upon the sale or redemption of the Senior Notes, unless it qualifies as Disbursing Agent.
Transition Rules
The above flat tax regime applies (i) to Senior Notes acquired from January 1, 2009 onward, (ii) to interest income received from January 1, 2009 onward, (iii) to gains/losses from the sale or redemption of Senior Notes acquired prior to January 1, 2009 provided the gains/losses are generated from January 1, 2009 onward.
Non-residents
Interest paid to a Noteholder and capital gains realized by a Noteholder not resident in Germany will generally not be taxable in Germany and no tax will be withheld (even if the Senior Notes are kept with a Disbursing Agent). Exceptions apply, however, if (i) the Senior Notes are held as a business asset of a German permanent establishment or by a permanent representative of the non-resident Noteholder, if (ii) the interest income of such Senior Notes does otherwise constitute German source income (such as income from the letting and leasing of certain German situs property) or if (iii) the non-resident Noteholder does not comply with the procedural rules to prove his status as a non-tax resident. In these cases, the Noteholder not resident in Germany will be subject to a tax regime similar to that described above under 'German Tax Considerations—Tax Residents.'
Inheritance and gift tax
The receipt of Senior Notes in case of succession upon death, or by way of a gift among living persons is subject to German inheritance and/or gift tax, if the deceased, donor and/or the recipient is a German resident. German inheritance and gift tax is also triggered, if neither the deceased, the donor nor the recipient of the Senior Notes are German residents, if the Senior Notes are attributable to German business activities and if for such business activities a German permanent establishment is maintained or a permanent representative is appointed in Germany. In specific situations, German expatriates that were tax residents in Germany may be subject to inheritance and gift tax. Double taxation treaties may provide for exceptions to the domestic inheritance and gift tax regulations.
Other taxes
No stamp, issue, registration or similar direct or indirect taxes or duties will be payable in Germany in connection with the issuance, delivery or execution of the Senior Notes. Currently, net assets tax is not levied in Germany.
EU Directive on the Taxation of Savings Income
Directive 2003/48/EC of the Council of the European Union, relating to the taxation of savings income, became effective on July 1, 2005. Under this directive, if a paying agent for interest on a debt claim is resident in one member state of the European Union and an individual who is the beneficial owner of the interest is a resident of another member state, then the former member state will be required to provide information (including the identity of the recipient) to authorities of the latter member state. 'Paying agent' is defined broadly for this purpose and generally includes any agent of either the payor or the payee. Belgium, Luxembourg and Austria have opted instead to withhold tax on
119
Table of Contents
the interest during a transitional period (initially at a rate of 15% but rising in steps to 35% after six years), subject to the ability of the individual to avoid withholding tax through voluntary disclosure of the investment to the individual's member state. In addition, certain non-members of the European Union (Switzerland, Liechtenstein, Andorra, Monaco and San Marino), as well as dependent and associated territories of the United Kingdom and the Netherlands, have adopted equivalent measures effective on the same date, and some (including Switzerland) have exercised the option to apply withholding taxes as described above.
F. Dividends and Paying Agents
Not applicable.
G. Statement by Experts
Not applicable.
H. Documents on Display
We are subject to the informational requirements of the Securities Exchange Act of 1934, as amended. In accordance with these requirements we file annual reports and other information with the SEC. It is possible to read and copy documents referred to in this annual report on Form 20-F that have been filed with the SEC at the SEC's public reference room at the following location:
Public Reference Room
450 Fifth Street, N.W.
Washington, D.C. 20549
Please call the SEC at 1-800-SEC-0330 for further information on the public reference room and their copy charges. The Company's SEC filings are also publicly available through the SEC's website athttp://www.sec.gov.
I. Subsidiary Information
Not applicable.
ITEM 11. QUANTITATIVE AND QUALITATIVE DISCLOSURES ABOUT MARKET RISK
See ITEM 5A Operating Results and ITEM 17 Financial Statements.
ITEM 12. DESCRIPTION OF SECURITIES OTHER THAN EQUITY SECURITIES
Not applicable.
120
Table of Contents
PART II
ITEM 13. DEFAULTS, DIVIDENDS, ARREARAGES AND DELINQUENCIES
Not applicable.
ITEM 14. MATERIAL MODIFICATIONS TO THE RIGHTS OF SECURITY HOLDERS AND USE OF PROCEEDS
Not applicable.
ITEM 15. CONTROLS AND PROCEDURES
Not applicable.
ITEM 15T. CONTROLS AND PROCEDURES
Disclosure Controls and Procedures
The Company's disclosure controls and procedures (as defined in Exchange Act rule 13a-15(e)) are designed in a way that the information required to be disclosed in reports under the Exchange Act is accumulated and communicated to management, including our principal executive and principal financial officers, or persons performing similar functions, as appropriate, to allow timely decisions regarding required disclosure. We have, under the supervision and with the participation of our management, including the CEO and CFO (our principal executive and financial officers) performed an evaluation of the effectiveness of our disclosure controls and procedures (as defined in Securities Exchange Act rule 15d-15(e)) as of March 31, 2009. Based on this evaluation, we concluded as of such date that, our disclosure controls and procedures were effective to ensure that information required to be disclosed by Kabel Deutschland GmbH in the reports that it files or submits under the Exchange Act is recorded, processed, summarized and reported, within the time periods specified in the SEC's rules and forms.
Management's Annual Report on Internal Control over Financial Reporting and Attestation Report of Registered Public Accounting Firm
Our Management is also responsible for establishing and maintaining adequate internal control over financial reporting. Internal control over financial reporting is defined in rule 13a-15(f) promulgated under the Exchange Act as a process designed by, or under the supervision of, our CEO and CFO, and effected by our board of directors, management and other personnel, to provide reasonable assurance regarding the reliability of financial reporting and the preparation of financial statements for external purposes in accordance with generally accepted accounting principles and includes those policies and procedures that:
- •
- Pertain to the maintenance of records that in reasonable detail accurately and fairly reflect the transactions and dispositions of the assets of our company;
- •
- Provide reasonable assurance that transactions are recorded as necessary to permit preparation of financial statements in accordance with generally accepted accounting principles, and that receipts and expenditures of our company are being made only in accordance with authorizations of management and board of our company; and
- •
- Provide reasonable assurance regarding prevention or timely detection of unauthorized acquisition, use or disposition of our company's assets that could have a material effect on our financial statements.
Our management assessed the effectiveness of our internal control over financial reporting as of March 31, 2009. In making this assessment, our management used the criteria set forth by the
121
Table of Contents
Committee of Sponsoring Organizations of the Treadway Commission (COSO) in the Internal Control-Integrated Framework. Based on our assessment, management concluded that, as of March 31, 2009 our internal control over financial reporting is effective based on those criteria.
This annual report does not include an attestation report of our registered public accounting firm regarding internal control over financial reporting. Management's report was not subject to attestation by our registered public accounting firm pursuant to temporary rules of the Securities and Exchange Commission that permit the company to provide only management's report in this annual report.
Change in Internal Control over Financial Reporting
During the period covered by this annual report on Form 20-F, there have been no changes to the Company's internal control over financial reporting that have materially affected or are reasonably likely to materially affect KDG's internal control over financial reporting.
Limitations
There are inherent limitations to the effectiveness of any system of disclosure and internal controls, including the possibilities of faulty judgments in decision-making, simple error or mistake, fraud, the circumvention of controls by individual acts or the collusion of two or more people, or management override of controls. Accordingly, even an effective disclosure and internal control system can provide only reasonable assurance with respect to disclosures and financial statement preparation. Furthermore, because of changes in conditions, the effectiveness of a disclosure and internal control system may vary over time.
ITEM 16A. AUDIT COMMITTEE FINANCIAL EXPERT
One of the members of the Supervisory Board and the Audit Committee Torsten Winkler has an extensive knowledge of financial and economic matters. Prior to joining Vitruvian Partners, Mr. Winkler worked for Providence. Prior to that he worked for Morgan Stanley Dean Witter in Corporate Finance and Mergers & Acquisitions, where he focused on telecommunication and technology industries. However, currently he does not meet all criteria for the Audit Committee financial expert as defined in the Corporate Governance Code. Therefore no Audit Committee financial expert has been currently designated.
ITEM 16B. CODE OF ETHICS
The Company has adopted a Code of Ethics ('Code') that applies to the Company and its officers in order to promote honesty, integrity, transparency and ethical conduct in our officers' performance of their management responsibilities.
Effective as of February 2008, we amended our Code of Ethics in order to clarify the group of people to whom the Code applies. Accordingly, the Code now specifies that the officers covered by the Code include the managing directors (including the chief executive officer and the chief financial officer), the director of finance and any other directors directly reporting to the managing directors. Also, the Code now specifies that all conflicts or potential conflicts of interest should immediately be reported to the supervisory board and/or, in addition, the advisory board. No further changes were made to the Code.
For a full version, please refer to our previous report in Form 20-F.
122
Table of Contents
ITEM 16C. PRINCIPAL ACCOUNTANT FEES AND SERVICES
Auditor's Remuneration
a Audit Fees
Fees for audit services totaled approximately €1.1 million in fiscal year ended March 31, 2009 and approximately €1.3 million in fiscal year ended March 31, 2008, including fees associated with the annual audits and statutory audits required.
b Audit-Related Fees
Fees for audit-related services totaled approximately €7.6 million in fiscal year ended March 31, 2009 and approximately €1.5 million in fiscal year ended March 31, 2008. Audit-related services principally include due diligence services until final settlement in connection with the Acquisition, and to a lesser extent internal controls review and information systems audits.
c Tax Fees
Fees for tax services, including tax compliance and tax advice, totaled approximately €0.5 million in fiscal year ended March 31, 2009 and approximately €0.3 million in fiscal year ended March 31, 2008.
d Other Services than a to c
Other fees not included in a to c amounted to approximately €2.0 million in fiscal year ended March 31, 2009 compared to €0.0 million in the fiscal year ended March 31, 2008. These fees mainly relate to services provided principally including support and advisory services related to transaction and integration of acquisitions.
e Audit Committee's Pre-Approval Policy
Our Audit Committee has adopted rules of procedures, which include policies and procedures for the pre-approval of audit and non-audit services rendered by our independent public accountants. Pre-approval is given on an individual basis. The procedures prohibit retention of the independent public accountants to perform the prohibited non-audit functions defined in Section 201 of the Sarbanes-Oxley Act or the rules of the SEC, and also consider whether proposed services are compatible with the independence of the public accountants. All fees incurred described in this Item 16C have been approved in accordance with these policies and procedures.
f Accountant's Engagement
Not applicable.
ITEM 16D. EXEMPTIONS FROM THE LISTING STANDARDS FOR AUDIT COMMITTEES
Not applicable.
ITEM 16E. PURCHASES OF EQUITY SECURITIES BY THE ISSUER AND AFFILIATED PURCHASERS
Not applicable.
ITEM 16F. CHANGE IN REGISTRANT'S CERTIFYING ACCOUNTANT
Not applicable.
ITEM 16G. CORPORATE GOVERNANCE
Not applicable.
123
Table of Contents
PART III
ITEM 17. FINANCIAL STATEMENTS
See pages F-1 to F-158.
ITEM 18. FINANCIAL STATEMENTS
The Registrant has responded to ITEM 17 Financial Statements in lieu of responding to this item.
ITEM 19. EXHIBITS
| | | | | |
Exhibit
Number | | Description of Exhibit | |
|
|---|
| | 12.1 | | Certification Rule 13A-14(A) CEO Kabel Deutschland GmbH | | F-159 |
| | 12.2 | | Certification Rule 13A-14(A) CFO Kabel Deutschland GmbH | | F-160 |
| | 12.3 | | Certification Rule 13A-14(A) CEO Kabel Deutschland Vertrieb und Service GmbH & Co. KG | | F-161 |
| | 12.4 | | Certification Rule 13A-14(A) CFO Kabel Deutschland Vertrieb und Service GmbH & Co. KG | | F-162 |
| | 13.1 | | Certification Rule 13A-14(B) CEO Kabel Deutschland GmbH | | F-163 |
| | 13.2 | | Certification Rule 13A-14(B) CFO Kabel Deutschland GmbH | | F-164 |
| | 13.3 | | Certification Rule 13A-14(B) CEO Kabel Deutschland Vertrieb und Service GmbH & Co. KG | | F-165 |
| | 13.4 | | Certification Rule 13A-14(B) CFO Kabel Deutschland Vertrieb und Service GmbH & Co. KG | | F-166 |
| | 15.1 | | Report of Independent Registered Public Accounting Firm | | F-167 |
| | 15.2 | | Report of Independent Registered Public Accounting Firm | | F-168 |
124
Table of Contents
SIGNATURES KDG
The registrant hereby certifies that it meets all of the requirements for filing on Form 20-F and that it has duly caused and authorized the undersigned to sign this annual report on its behalf.
| | | | |
KABEL DEUTSCHLAND GMBH
|
By: |
|
|
|
|
| | | | |
Signature | | Title | | Date |
|---|
|
|
|
|
|
/s/ DR. ADRIAN V. HAMMERSTEIN
Dr. Adrian v. Hammerstein
| | Chief Executive Officer | | July 29, 2009 |
/s/ PAUL THOMASON
Paul Thomason
|
|
Chief Financial Officer |
|
July 29, 2009 |
/s/ DR. MANUEL CUBERO DEL CASTILLO-OLIVARES
Dr. Manuel Cubero del Castillo-Olivares
|
|
Chief Operating Officer |
|
July 29, 2009 |
/s/ ERIK ADAMS
Erik Adams
|
|
Chief Marketing Officer |
|
July 29, 2009 |
125
Table of Contents
SIGNATURES KDVS
The registrant hereby certifies that it meets all of the requirements for filing on Form 20-F and that it has duly caused and authorized the undersigned to sign this annual report on its behalf.
| | | | |
KABEL DEUTSCHLAND VERTRIEB UND SERVICE GMBH & CO. KG
|
By: |
|
|
|
|
| | | | |
Signature | | Title | | Date |
|---|
|
|
|
|
|
/s/ DR. ADRIAN V. HAMMERSTEIN
Dr. Adrian v. Hammerstein
| | Chief Executive Officer | | July 29, 2009 |
/s/ PAUL THOMASON
Paul Thomason
|
|
Chief Financial Officer |
|
July 29, 2009 |
/s/ DR. MANUEL CUBERO DEL CASTILLO-OLIVARES
Dr. Manuel Cubero del Castillo-Olivares
|
|
Chief Operating Officer |
|
July 29, 2009 |
/s/ ERIK ADAMS
Erik Adams
|
|
Chief Marketing Officer |
|
July 29, 2009 |
126
Table of Contents
INDEX TO FINANCIAL STATEMENTS
| | |
Kabel Deutschland GmbH, Unterfoehring | | F-2 |
Consolidated Balance Sheet as of March 31, 2009 | | F-3 |
Consolidated Statement of Operations for the period from April 1, 2008 to March 31, 2009 | | F-4 |
Consolidated Statement of Cash Flows for the period from April 1, 2008 to March 31, 2009 | | F-5 |
Statement of Changes in Consolidated Equity for the period from April 1, 2008 to March 31, 2009 | | F-6 |
Notes to the Consolidated Financial Statements as of March 31, 2009 | | F-7 |
Analysis of Fixed Assets for the period from April 1, 2008 to March 31, 2009 | | F-80 |
Kabel Deutschland Vertrieb und Service GmbH & Co. KG, Unterfoehring | |
F-83 |
Consolidated Balance Sheet as of March 31, 2009 | | F-84 |
Consolidated Statement of Operations for the period from April 1, 2008 to March 31, 2009 | | F-86 |
Consolidated Statement of Cash Flows for the period from April 1, 2008 to March 31, 2009 | | F-87 |
Statement of Changes in Consolidated Equity for the period from April 1, 2008 to March 31, 2009 | | F-88 |
Notes to the Consolidated Financial Statements as of March 31, 2009 | | F-89 |
Analysis of Fixed Assets for the period from April 1, 2008 to March 31, 2009 | | F-156 |
F-1
Table of Contents
Kabel Deutschland GmbH
Unterfoehring
Consolidated Financial Statements
March 31, 2009
F-2
Table of Contents
Kabel Deutschland GmbH, Unterfoehring
Consolidated Balance Sheet as of March 31, 2009
| | | | | | | | | | | | | | |
| | Note | | March 31,
2009 | | March 31,
2008 | | March 31,
2007 | |
|---|
| |
| | €
| | T€
| | T€
| |
|---|
Assets | | | | | | | | | | | | |
| | Current Assets | | | | | | | | | | | | |
| | | Cash and Cash Equivalents | | 4.1 | | | 51,922,416.94 | | | 15,463 | | | 54,108 | |
| | | Trade Receivables | | 4.2 | | | 106,578,606.85 | | | 130,878 | | | 101,370 | |
| | | Receivables from Affiliates | | | | | 834,396.59 | | | 922 | | | 1,019 | |
| | | Receivables from Associates | | | | | 0.00 | | | 31 | | | 108 | |
| | | Inventories | | 4.3 | | | 15,929,200.67 | | | 26,201 | | | 24,265 | |
| | | Receivables from Tax Authorities | | 4.4 | | | 5,199,925.52 | | | 6,881 | | | 6,266 | |
| | | Other Current Financial Assets | | 4.5 | | | 36,461,273.04 | | | 7,272 | | | 8,771 | |
| | | Prepaid Expenses | | 4.5 | | | 13,085,985.93 | | | 19,903 | | | 20,698 | |
| | | | | | | | | | |
| | Total Current Assets | | | | | 230,011,805.54 | | | 207,551 | | | 216,605 | |
| | | | | | | | | | |
| | Non-Current Assets | | | | | | | | | | | | |
| | | Intangible Assets | | 4.6 | | | 903,954,245.44 | | | 431,878 | | | 477,343 | |
| | | Property and Equipment | | 4.7 | | | 1,214,055,303.01 | | | 1,085,952 | | | 986,608 | |
| | | Equity Investments in Associates | | 4.8 | | | 5,630,079.04 | | | 6,354 | | | 5,681 | |
| | | Other Non-Current Financial Assets | | | | | 0.00 | | | 4,632 | | | 7,510 | |
| | | Deferred Tax Assets | | 3.9 | | | 292,558.00 | | | 537 | | | 366 | |
| | | Non-Current Financial Assets | | | | | 0.00 | | | 4,239 | | | 5,414 | |
| | | Prepaid Expenses | | | | | 17,191,189.96 | | | 11,166 | | | 5,959 | |
| | | | | | | | | | |
| | Total Non-Current Assets | | | | | 2,141,123,375.45 | | | 1,544,758 | | | 1,488,881 | |
| | | | | | | | | | |
Total Assets | | | | | 2,371,135,180.99 | | | 1,752,309 | | | 1,705,486 | |
| | | | | | | | | | |
| | | | | | | | | | | | | | | |
| | Note | | March 31,
2009 | | March 31,
2008 | | March 31,
2007 | |
|---|
| |
| | €
| | T€
| | T€
| |
|---|
Equity and Liabilities | | | | | | | | | | | | | |
| | | Current Liabilities | | | | | | | | | | | | | |
| | | Current Financial Liabilities | | | 4.11.1 | | | 39,521,811.78 | | | 25,674 | | | 36,997 | |
| | | Trade Payables | | | | | | 260,778,359.37 | | | 218,293 | | | 175,518 | |
| | | Liabilities to Associates | | | | | | 0.00 | | | 323 | | | 324 | |
| | | Other Current Provisions | | | 4.13 | | | 40,441,808.19 | | | 6,493 | | | 18,107 | |
| | | Liabilities due to Income Taxes | | | 3.9 | | | 23,127,038.95 | | | 12,961 | | | 14,157 | |
| | | Deferred Income | | | 4.10 | | | 241,687,838.00 | | | 199,510 | | | 216,818 | |
| | | Other Current Liabilities | | | 4.9 | | | 87,166,085.13 | | | 59,640 | | | 60,399 | |
| | | | | | | | | | | |
| | Total Current Liabilities | | | | | | 692,722,941.42 | | | 522,894 | | | 522,320 | |
| | | | | | | | | | | |
| | Non-Current Liabilities | | | | | | | | | | | | | |
| | | Senior Notes | | | 4.11.2 | | | 680,129,784.72 | | | 603,840 | | | 672,782 | |
| | | Non-Current Financial Liabilities | | | 4.11.3 | | | 1,717,073,896.77 | | | 1,311,989 | | | 1,186,042 | |
| | | Deferred Tax Liabilities | | | 3.9 | | | 118,855,869.00 | | | 87,531 | | | 82,660 | |
| | | Provisions for Pension | | | 4.12 | | | 35,308,704.57 | | | 29,148 | | | 24,171 | |
| | | Other Non-Current Provisions | | | 4.13 | | | 25,994,627.19 | | | 22,270 | | | 21,246 | |
| | | Other Non-Current Liabilities | | | 4.14 | | | 102,492,165.61 | | | 105,380 | | | 92,352 | |
| | | Deferred Income | | | | | | 1,626,182.10 | | | 1,826 | | | 270 | |
| | | | | | | | | | | |
| | Total Non-Current Liabilities | | | | | | 2,681,481,229.96 | | | 2,161,984 | | | 2,079,523 | |
| | | | | | | | | | | |
| | Equity | | | 4.15 | | | | | | | | | | |
| | | Subscribed Capital | | | | | | 1,025,000.00 | | | 1,025 | | | 1,025 | |
| | | Capital Reserve | | | | | | 50,113,702.91 | | | 49,590 | | | 45,415 | |
| | | Cash Flow Hedge Reserve | | | | | | (58,674.13 | ) | | 1,289 | | | (6,293 | ) |
| | | Available-for-Sale Reserve | | | | | | 0.00 | | | 0 | | | 625 | |
| | | Asset Revaluation Surplus | | | | | | 1,351,681.06 | | | 0 | | | 0 | |
| | | Accumulated Deficit | | | | | | (1,064,027,764.24 | ) | | (984,473 | ) | | (937,129 | ) |
| | | | | | | | | | | |
| | | | | | (1,011,596,054.40 | ) | | (932,569 | ) | | (896,357 | ) |
| | | Minority Interests | | | | | | 8,527,064.01 | | | 0 | | | 0 | |
| | | | �� | | | | | | | |
| | Total Equity (Deficit) | | | | | | (1,003,068,990.39 | ) | | (932,569 | ) | | (896,357 | ) |
| | | | | | | | | | | |
| | Total Equity and Liabilities | | | | | | 2,371,135,180.99 | | | 1,752,309 | | | 1,705,486 | |
| | | | | | | | | | | |
The accompanying notes to this statement of operations form an integral part to these
consolidated financial statements.
F-3
Table of Contents
Kabel Deutschland GmbH, Unterfoehring
Consolidated Statement of Operations
for the Period from April 1, 2008 to March 31, 2009
| | | | | | | | | | | | | | |
| | Note | | April 1, 2008-
March 31, 2009 | | April 1, 2007-
March 31, 2008 | | April 1, 2006-
March 31, 2007 | |
|---|
| |
| | €
| | T€
| | T€
| |
|---|
Revenues | | | 3.1 | | | 1,370,331,371.04 | | | 1,196,870 | | | 1,093,179 | |
Cost of Services Rendered | | | 3.2 | | | (696,555,334.12 | ) | | (588,461 | ) | | (567,090 | ) |
thereof depreciation/amortization T€205,504 (prior year T€154,676; for the fiscal year ending March 31, 2007 T€133,123) | | | | | | | | | | | | | |
Other Operating Income | | | 3.3 | | | 18,079,342.22 | | | 12,613 | | | 13,215 | |
Selling Expenses | | | 3.4 | | | (425,621,943.33 | ) | | (352,836 | ) | | (318,652 | ) |
thereof depreciation/amortization T€169,348 (prior year T€115,478; for the fiscal year ending March 31, 2007 T€95,983) | | | | | | | | | | | | | |
General and Administrative Expenses | | | 3.5 | | | (129,418,576.36 | ) | | (128,667 | ) | | (140,954 | ) |
thereof depreciation/amortization T€27,802 (prior year T€23,795; for the fiscal year ending March 31, 2007 T€17,512) | | | | | | | | | | | | | |
| | | | | | | | | | | |
Profit from Ordinary Activities | | | | | | 136,814,859.45 | | | 139,519 | | | 79,698 | |
Interest Income | | | 3.7 | | | 3,485,978.59 | | | 2,057 | | | 3,563 | |
Interest Expense | | | 3.7 | | | (232,539,215.78 | ) | | (171,839 | ) | | (155,670 | ) |
Accretion/Depreciation on Investments and other Securities | | | | | | 75,500.00 | | | (3,712 | ) | | 265 | |
Income from Associates | | | 3.8 | | | 14,051,528.85 | | | 899 | | | 440 | |
| | | | | | | | | | | |
Loss before Taxes | | | | | | (78,111,348.89 | ) | | (33,076 | ) | | (71,704 | ) |
Benefit/(Taxes) on Income | | | 3.9 | | | 6,151,746.24 | | | (764 | ) | | (27,565 | ) |
| | | | | | | | | | | |
Net loss for the period | | | | | | (71,959,602.65 | ) | | (33,840 | ) | | (99,269 | ) |
| | | | | | | | | | | |
Attributable to: | | | | | | | | | | | | | |
| | Equity holders of the parent | | | | | | (72,818,469.16 | ) | | (33,840 | ) | | (99,269 | ) |
| | Minority interests | | | 4.15 | | | 858,866.51 | | | 0 | | | 0 | |
| | | | | | | | | | | |
| | | | | | (71,959,602.65 | ) | | (33,840 | ) | | (99,269 | ) |
| | | | | | | | | | | |
The accompanying notes to this statement of operations form an integral part to these
consolidated financial statements.
F-4
Table of Contents
Kabel Deutschland GmbH, Unterfoehring
Consolidated Statement of Cash Flows
for the Period from April 1, 2008 to March 31, 2009
| | | | | | | | | | | | | | | |
| | Note | | April 1, 2008-
March 31, 2009 | | April 1, 2007-
March 31, 2008 | | April 1, 2006-
March 31, 2007 | |
|---|
| |
| | T€
| | T€
| | T€
| |
|---|
1. Cash flows from operating activities | | | | | | | | | | | | | |
Net loss for the period | | | | | | (71,959 | ) | | (33,840 | ) | | (99,269 | ) |
Adjustments to reconcile net loss to cash provided by operations: | | | | | | | | | | | | | |
| | Benefit/(Taxes) on income | | | | | | (6,152 | ) | | 764 | | | 27,564 | |
| | Interest expense | | | | | | 232,539 | | | 171,839 | | | 155,670 | |
| | Interest income | | | | | | (3,486 | ) | | (2,057 | ) | | (3,563 | ) |
| | Accretion/Depreciation and amortization on fixed assets | | | | | | 402,654 | | | 293,949 | | | 246,618 | |
| | Accretion/Depreciation on investments and other securities | | | | | | (76 | ) | | 3,712 | | | (265 | ) |
| | Gain/Loss on disposal/sale of fixed assets (intangible assets; | | | | | | | | | | | | | |
| | | property and equipment; financial assets) | | | | | | 1,407 | | | 822 | | | 1,878 | |
| | Income from associates | | | | | | (14,052 | ) | | (899 | ) | | (440 | ) |
| | Compensation expense relating to share-based payments | | | | | | 2,063 | | | 23,042 | | | 41,791 | |
| | | | | | | | | | | |
| | | | | | 542,938 | | | 457,332 | | | 369,984 | |
Changes in assets and liabilities: | | | | | | | | | | | | | |
| | Increase (-)/decrease (+) of inventories | | | | | | 10,359 | | | (1,936 | ) | | (10,812 | ) |
| | Increase (-)/decrease (+) of trade receivables | | | | | | 27,758 | | | (29,507 | ) | | 19,429 | |
| | Increase (-)/decrease (+) of other assets | | | | | | (14,084 | ) | | 4,544 | | | 1,513 | |
| | Increase (+)/decrease (-) of trade payables | | | | | | 38,759 | | | 42,691 | | | 22,363 | |
| | Increase (+)/decrease (-) of other provisions | | | | | | 23,154 | | | (11,658 | ) | | 8,965 | |
| | Increase (+)/decrease (-) of deferred income | | | | | | 27,737 | | | (15,753 | ) | | (29,656 | ) |
| | Increase (+)/decrease (-) of provisions for pensions | | | | | | 3,352 | | | 3,582 | | | 3,187 | |
| | Increase (+)/decrease (-) of other liabilities | | | | | | 12,287 | | | (2,125 | ) | | (14,531 | ) |
| | | | | | | | | | | |
Cash provided by operations | | | | | | 672,260 | | | 447,170 | | | 370,442 | |
Income taxes paid (-)/received (+) | | | | | | (3,576 | ) | | (2,487 | ) | | (10,461 | ) |
| | | | | | | | | | | |
Net cash from operating activities | | | | | | 668,684 | | | 444,683 | | | 359,981 | |
| | | | | | | | | | | |
2. Cash flows from investing activities | | | | | | | | | | | | | |
Cash received from disposal/sale of fixed assets (intangible assets; | | | | | | | | | | | | | |
| | property and equipment; financial assets) | | | | | | 1,107 | | | 258 | | | 876 | |
Cash received from sale of investments | | | | | | 13,000 | | | 38,076 | | | 0 | |
Cash paid for investments in intangible assets | | | | | | (85,285 | ) | | (63,020 | ) | | (63,571 | ) |
Cash paid for investments in property and equipment | | | | | | (287,729 | ) | | (253,413 | ) | | (205,194 | ) |
Cash paid for acquisitions, net of cash acquired | | | 1.3.2 | | | (527,827 | ) | | (29,696 | ) | | (5,092 | ) |
Cash paid for investments in financial assets | | | | | | 0 | | | (39,666 | ) | | (6,790 | ) |
Interest received | | | | | | 2,509 | | | 1,777 | | | 3,085 | |
Dividends received from associates | | | | | | 0 | | | 227 | | | 321 | |
| | | | | | | | | | | |
Net cash used in investing activities | | | | | | (884,225 | ) | | (345,457 | ) | | (276,365 | ) |
| | | | | | | | | | | |
3. Cash flows from financing activities | | | | | | | | | | | | | |
Cash payments to shareholders/minorities | | | | | | (8,009 | ) | | (13,504 | ) | | 0 | |
Cash received non-current financial liabilities | | | | | | 785,000 | | | 391,000 | | | 1,205,000 | |
Cash repayments of non-current financial liabilities | | | | | | (310,000 | ) | | (331,000 | ) | | (1,205,000 | ) |
Cash repayments of current financial liabilities | | | | | | 0 | | | 0 | | | (75,848 | ) |
Cash payments for reduction of finance lease liabilities | | | | | | (8,229 | ) | | (7,240 | ) | | (5,610 | ) |
Interest and transaction costs paid | | | | | | (206,838 | ) | | (177,127 | ) | | (173,407 | ) |
| | | | | | | | | | | |
Net cash from financing activities | | | | | | 251,924 | | | (137,871 | ) | | (254,865 | ) |
| | | | | | | | | | | |
4. Cash and cash equivalents at the end of the period | | | | | | | | | | | | | |
Changes in cash and cash equivalents (subtotal of 1 to 3) | | | | | | 36,383 | | | (38,645 | ) | | (171,249 | ) |
Valuation adjustments on cash and cash equivalents | | | | | | 76 | | | 0 | | | 265 | |
Cash and cash equivalents at the beginning of the period | | | | | | 15,463 | | | 54,108 | | | 225,092 | |
| | | | | | | | | | | |
Cash and cash equivalents at the end of the period | | | 4.1 | | | 51,922 | | | 15,463 | | | 54,108 | |
| | | | | | | | | | | |
Additional Information | | | | | | | | | | | | | |
Investments relating to capital lease | | | | | | 0 | | | 2,447 | | | 15,311 | |
Other non cash investments | | | | | | 0 | | | 0 | | | 0 | |
The accompanying notes to this statement of cash flows form an integral part to these
consolidated financial statements.
F-5
Table of Contents
Kabel Deutschland GmbH, Unterfoehring
Statement of Changes in Consolidated Equity
for the Period from April 1, 2008 to March 31, 2009
| | | | | | | | | | | | | | | | | | | | | | | | | | | | | | | |
| |
| | Attributable to equity holders of the parent | |
| |
| |
|---|
| | Note | | Subscribed
capital | | Capital
reserve | | Cash flow
hedge
reserve | | Available-
for-sale
reserve | | Asset
Revaluation
Surplus | | Accumulated
deficit | | Total | | Minority
Interests | | Total
Equity
(Deficit) | |
|---|
| |
| | T€
| | T€
| | T€
| | T€
| | T€
| | T€
| | T€
| | T€
| | T€
| |
|---|
Balance as of March 31, 2006 | | | | | | 1,025 | | | 40,840 | | | (13,403 | ) | | 0 | | | 0 | | | (837,860 | ) | | (809,398 | ) | | 0 | | | (809,398 | ) |
Additions relating to share-based payment | | | | | | 0 | | | 4,575 | | | 0 | | | 0 | | | 0 | | | 0 | | | 4,575 | | | 0 | | | 4,575 | |
Changes in fair value of hedging instruments (net of tax) | | | 5.5 | | | 0 | | | 0 | | | 7,110 | | | 0 | | | 0 | | | 0 | | | 7,110 | | | 0 | | | 7,110 | |
Changes in fair value of financial assets classified as available-for-sale | | | | | | 0 | | | 0 | | | 0 | | | 624 | | | 0 | | | 0 | | | 624 | | | 0 | | | 624 | |
Net loss for the period | | | | | | 0 | | | 0 | | | 0 | | | 0 | | | 0 | | | (99,269 | ) | | (99,269 | ) | | 0 | | | (99,269 | ) |
| | | | | | | | | | | | | | | | | | | | | | | |
Total income and expense for the period | | | | | | | | | | | | 7,110 | | | 624 | | | 0 | | | (99,269 | ) | | (91,535 | ) | | 0 | | | (91,535 | ) |
| | | | | | | | | | | | | | | | | | | | | | | |
Balance as of March 31, 2007 | | | | | | 1,025 | | | 45,415 | | | (6,293 | ) | | 624 | | | 0 | | | (937,129 | ) | | (896,358 | ) | | 0 | | | (896,358 | ) |
Additions relating to share-based payment | | | | | | 0 | | | 4,175 | | | 0 | | | 0 | | | 0 | | | 0 | | | 4,175 | | | 0 | | | 4,175 | |
Transactions with parents | | | | | | 0 | | | 0 | | | 0 | | | 0 | | | 0 | | | (13,504 | ) | | (13,504 | ) | | 0 | | | (13,504 | ) |
Changes in fair value of hedging instruments (net of tax) | | | 5.5 | | | 0 | | | 0 | | | 7,582 | | | 0 | | | 0 | | | 0 | | | 7,582 | | | 0 | | | 7,582 | |
Changes in fair value of financial assets classified as available-for-sale | | | | | | 0 | | | 0 | | | 0 | | | (624 | ) | | 0 | | | 0 | | | (624 | ) | | 0 | | | (624 | ) |
Net loss for the period | | | | | | 0 | | | 0 | | | 0 | | | 0 | | | 0 | | | (33,840 | ) | | (33,840 | ) | | 0 | | | (33,840 | ) |
| | | | | | | | | | | | | | | | | | | | | | | |
Total income and expense for the period | | | | | | | | | | | | 7,582 | | | (624 | ) | | 0 | | | (33,840 | ) | | (26,882 | ) | | 0 | | | (26,882 | ) |
| | | | | | | | | | | | | | | | | | | | | | | |
Balance as of March 31, 2008 | | | | | | 1,025 | | | 49,590 | | | 1,289 | | | 0 | | | 0 | | | (984,473 | ) | | (932,569 | ) | | 0 | | | (932,569 | ) |
Additions relating to share-based payment | | | | | | 0 | | | 524 | | | 0 | | | 0 | | | 0 | | | 0 | | | 524 | | | 0 | | | 524 | |
Transactions with parents | | | | | | 0 | | | 0 | | | 0 | | | 0 | | | 0 | | | (6,900 | ) | | (6,900 | ) | | 0 | | | (6,900 | ) |
Additions relating to acquisitions | | | | | | 0 | | | 0 | | | 0 | | | 0 | | | 1,515 | | | 0 | | | 1,515 | | | 8,777 | | | 10,292 | |
Dividend distribution to minorities | | | | | | 0 | | | 0 | | | 0 | | | 0 | | | 0 | | | 0 | | | 0 | | | (1,109 | ) | | (1,109 | ) |
Reclassification of Asset Revaluation Surplus | | | | | | 0 | | | 0 | | | 0 | | | 0 | | | (163 | ) | | 163 | | | 0 | | | 0 | | | 0 | |
Changes in fair value of hedging instruments (net of tax) | | | 5.5 | | | 0 | | | 0 | | | (1,348 | ) | | 0 | | | 0 | | | 0 | | | (1,348 | ) | | 0 | | | (1,348 | ) |
Net loss for the period | | | | | | 0 | | | 0 | | | 0 | | | 0 | | | 0 | | | (72,818 | ) | | (72,818 | ) | | 859 | | | (71,959 | ) |
| | | | | | | | | | | | | | | | | | | | | | | |
Total income and expense for the period | | | | | | | | | | | | (1,348 | ) | | 0 | | | 1,352 | | | (72,818 | ) | | (72,814 | ) | | 859 | | | (71,955 | ) |
| | | | | | | | | | | | | | | | | | | | | | | |
Balance as of March 31, 2009 | | | | | | 1,025 | | | 50,114 | | | (59 | ) | | 0 | | | 1,352 | | | (1,064,028 | ) | | (1,011,596 | ) | | 8,527 | | | (1,003,069 | ) |
| | | | | | | | | | | | | | | | | | | | | | | |
The accompanying notes to statement of changes in consolidated equity form an
integral part to these consolidated financial statements
F-6
Table of Contents
Notes to the Consolidated
Financial Statements for
Kabel Deutschland GmbH
as of March 31, 2009
F-7
Table of Contents
F-8
Table of Contents
F-9
Table of Contents
1. General Information
Kabel Deutschland GmbH (hereinafter referred to as KDG GmbH) and its consolidated subsidiaries (KDG or the Company) is the market leader in the German cable television business in terms of homes passed, subscribers and revenues. The Company provides cable access connections, delivers digital television signals and offers Internet and telephony services to its customers.
Kabel Deutschland GmbH was founded on December 17, 2002. KDG GmbH's registered office is in Unterfoehring, Betastrasse 6-8 (commercial register of Munich HRB 145837) Germany. KDG GmbH's sole shareholder is Kabel Deutschland Holding GmbH (KDGHoldCo GmbH) which is wholly owned by Cable Holding S.à r.l. (LuxCo). LuxCo is wholly owned by Cayman Cable Holding LP (Cayman Cable), George Town, Cayman Islands which is owned by Providence Equity Partners, London, United Kingdom, the ultimate parent. The operating business is predominantly performed by Kabel Deutschland Vertrieb und Service GmbH & Co. KG (KDVS), a wholly owned subsidiary of KDG GmbH.
The annual consolidated financial statements of the Company were authorized for issue in accordance with a resolution of the directors on July 22, 2009.
1.1 Acknowledgement
The consolidated financial statements of KDG GmbH for the three years ended March 31, 2009, have been prepared in accordance with International Financial Reporting Standards (IFRS) as issued by the International Accounting Standards Board (IASB). The consolidated financial statements also comply with the regulations under German Commercial Law pursuant to Sec. 315a (3) German Commercial Code. All IFRSs issued by the IASB, effective at the time of preparing the consolidated financial statements and applied by KDG GmbH, have been adopted for use in the European Union (EU) by the European Commission. Therefore, the consolidated financial statements also comply with IFRS as adopted by the EU.
1.2 Basis of Presentation
The Company's fiscal year is the twelve month period ending March 31.
The consolidated financial statements and notes are presented in Euros and all values are rounded to nearest thousand (T€) except where otherwise stated. The Company's financial statements have been prepared using consistent accounting and consolidation methods for all periods presented. The Company's statement of operations has been prepared using the cost of sales method under IFRS. The consolidated financial statements have been prepared on a historical cost basis except for derivative financial instruments and liabilities related to its Management Equity Participation Program that have been measured at fair value.
The preparation of financial statements in conformity with International Financial Reporting Standards requires management to make estimates and assumptions that affect the reported amounts of assets and liabilities and disclosure of contingent assets and liabilities at the date of the financial statements and the reported amounts of revenues and expenses during the reporting period. Although these estimates are based on management's best knowledge of current events and actions, actual results ultimately may differ from those estimates.
With respect to key judgments and estimation uncertainty, refer to note 2.15.
F-10
Table of Contents
1.3 Consolidation
1.3.1 Scope of Consolidation
In addition to the parent company KDG, the consolidated financial statements as of March 31, 2009 include eleven (2008: six; 2007: seven) companies in which KDG GmbH holds a direct or indirect interest of more than 50% of the outstanding voting rights of an entity and are under the control of KDG GmbH as defined by IAS 27 "Consolidated and Separate Financial Statements". The number of companies consolidated increased in total by five year-on-year.
Additions to companies consolidated in 2009 comprise the acquisition of twelve companies from the Orion Group, a Level 4 cable TV operator in Germany ("the Acquisition"). Seven companies, thereof six companies concerning the Acquisition, were merged during the current fiscal year.
1.3.2 Changes in the Consolidation Group and Acquisitions
Merger
As of February 26, 2009 RKS Niedersaechsische Kabel-Servicegesellschaft mbH & Co. KG, Hanover was merged with KDVS.
On February 23, 2009, the merger of KMG KABEL-FERNSEHEN HANNOVER GmbH into KDVS became effective, retroactively, to July 1, 2008.
On October 23, 2008, the mergers of Kabel Deutschland Sued GmbH, Kabel Deutschland West GmbH, Kabel Deutschland Nord GmbH and Telecolumbus Nord GmbH into KDVS became effective, retroactively, to May 1, 2008.
In addition, Leto GmbH was merged with KDVS as of July 7, 2008.
Business Combination and Goodwill
The accounting for business combinations in the KDG consolidated financial statements is performed according to IFRS 3 "Business Combinations" by allocating the cost of a business combination to the acquiree's identifiable assets, liabilities and contingent liabilities at their fair value at the time of the acquisition.
Goodwill corresponds to the difference between the acquisition cost and the fair value of the acquired assets and liabilities of a business combination. Goodwill is not subject to amortization; it is tested for impairment at least annually and, if necessary, written down to the extent impaired.
Share Acquisitions
On April 30, 2008, KDG closed the acquisition of twelve companies from the Orion Group with 1.1 million CATV subscribers.
F-11
Table of Contents
In total, the acquisitions include the following entities:
| | | | |
Company | | Ownership | |
|---|
Tele Columbus Nord GmbH | | | 100.00 | % |
Kabel Deutschland Süd GmbH(40) | | | 100.00 | % |
Kabel Deutschland West GmbH(40) | | | 100.00 | % |
Kabel Deutschland Nord GmbH(40) | | | 100.00 | % |
AEP Plückhahn Kabel GmbH | | | 100.00 | % |
KMG Kabel-Fernsehen Hannover GmbH | | | 100.00 | % |
Urbana Teleunion Rostock GmbH & Co. KG | | | 70.00 | % |
Verwaltung Urbana Teleunion Rostock GmbH | | | 50.00 | % |
- (40)
- Kabel Deutschland Süd GmbH, Kabel Deutschland West GmbH and Kabel Deutschland Nord GmbH previously known respectively as Cor H Erste GmbH, Cor H Zweite GmbH and Cor H Dritte GmbH.
For the above acquired companies KDG GmbH did not have any previous ownership.
For the following companies, KDG GmbH did have minority holdings prior to the acquisition.
| | | | | | | | | | |
Company | | Acquired | | Existing Minority
Ownership | | Total | |
|---|
KABELCOM Braunschweig Gesellschaft für Breitbandkabel-Kommunikation mbH | | | 75.58 | % | | 24.00 | % | | 99.58 | % |
KABELCOM Wolfsburg Gesellschaft für Breitbandkabel-Kommunikation mbH | | | 72.49 | % | | 24.00 | % | | 96.49 | % |
RKS Niedersächsische Kabel-Servicegesellschaft mbH & Co. KG | | | 47.37 | % | | 52.63 | % | | 100.00 | % |
RKS Niedersächsische Kabel-Service-Beteili-gungsgesellschaft mbH | | | 56.20 | % | | 43.80 | % | | 100.00 | % |
As of April 30/May 1, 2008, the acquired companies were consolidated for the first time. The Acquisition has been accounted for using the purchase method of accounting. The financial statements include the results of the acquired companies for the eleven month period ended March 31, 2009. An additional 1.16% in KABELCOM Wolfsburg Gesellschaft fuer Breitbandkabel-Kommunikation mbH was acquired from the City of Wolfsburg by contract as of December 17, 2008; resulting in a total ownership of 97.65%.
F-12
Table of Contents
The fair value of the identifiable assets and liabilities of the Acquisition as at the date of acquisition and the corresponding carrying amounts immediately prior to the Acquisition were:
| | | | | | | |
| | Fair value
recognized
on acquisition | | Previous
carrying
value | |
|---|
| | T€
| | T€
| |
|---|
Customer List | | | 226,847 | | | 33,962 | |
Property and equipment | | | 70,265 | | | 71,359 | |
Cash and Cash equivalents | | | 5,652 | | | 5,652 | |
Trade receivables | | | 3,553 | | | 6,518 | |
Other assets | | | 8,566 | | | 8,566 | |
| | | | | | |
| | | 314,883 | | | 126,057 | |
| | | | | | |
Trade payables | | | (9,608 | ) | | (9,608 | ) |
Other liabilities | | | (23,371 | ) | | (20,071 | ) |
Deferred income | | | (14,242 | ) | | (14,242 | ) |
Deferred income tax liabilities | | | (50,276 | ) | | 0 | |
| | | | | | |
| | | (97,497 | ) | | (43,921 | ) |
Net assets | | | 217,386 | | | 82,136 | |
| | | | | | | |
Minority interest | | | (8,777 | ) | | | |
| | | | | | | |
Total net assets acquired | | | 208,609 | | | | |
Goodwill arising on acquisition | | | 335,337 | | | | |
| | | | | | | |
Total acquisition cost | | | 543,946 | | | | |
| | | | | | | |
The goodwill recognized on the Acquisition represents future economic benefits anticipated from the acquisition of 1.1 million connected cable households. One notable such benefit is the increase of the Company's direct marketable customer base. Moreover, a significant number of the acquired households get access to the Company's triple play products and non upgraded networks will be largely upgraded for Internet and Phone.
The total cost of acquisition amounted to T€543,946 and was comprised of T€509,538 for the purchase price and an amount of T€34,408 for directly attributable costs to the Acquisition such as professional fees for lawyers, due diligence and other professional advisers, M&A fees and fees for the closing of the Acquisition.
Acquisition Cost
| | | | |
Purchase price | | | 509,538 | |
Cost associated with the acquisition | | | 34,408 | |
| | | | |
Total acquisition cost | | | 543,946 | |
| | | | |
The preliminary purchase price was reduced by T€19,437 in the fiscal year ended March 31, 2009. The final purchase price settlement was agreed on May 21, 2009. For further information, reference is made to Note 5.7.
F-13
Table of Contents
Cash outflow on acquisition:
| | | | |
Total acquisition cost | | | 543,946 | |
Purchase price repayment—not yet received | | | 10,508 | |
Cost associated with the acquisition—not yet paid | | | (14,915 | ) |
Cost associated with the acquisition—paid prior year | | | (4,608 | ) |
Shares of acquisition already owned | | | (1,452 | ) |
| | | | |
Subtotal | | | 533,479 | |
Net cash acquired with the acquisition | | | (5,652 | ) |
| | | | |
Net cash outflow from the acquisition | | | 527,827 | |
| | | | |
From the date of acquisition until fiscal year ended March 31, 2009, the Acquisition has contributed T€10,881 to the net income of the Company. Considering if the business combination had been effected at the beginning of the year the net loss for the Company would have been T€71,041 and revenue from continuing operations would have been T€1,379,174.
1.3.3 Basis of Consolidation
Intercompany transactions, balances and unrealized gains on transactions between KDG GmbH and its subsidiaries are eliminated in consolidation. The accounting policies of the consolidated subsidiaries are consistent with the policies adopted by KDG GmbH. Acquisitions are accounted for using the purchase method of accounting.
Subsidiaries are fully consolidated from the date of acquisition, being the date on which the Group obtains control and continue to be consolidated until the date that such control ceases.
Companies in which KDG GmbH has significant influence over the business and the financial policies as defined by IAS 28 "Investments in Associates" are recorded in the consolidated financial statements using the equity method. Intercompany profits and losses of associated companies are eliminated in consolidation in relation to their shareholding ratio.
1.4 Currency Translation
The functional and reporting currency of KDG is the Euro.
Foreign currency transactions were converted to Euros at the exchange rate applicable on the date of the transaction. Monetary assets and liabilities denominated in foreign currencies existing as of the balance sheet date are converted to Euros at the exchange rate of the European Central Bank on the balance sheet date. Currency differences resulting from these adjustments are recognized in the consolidated statement of operations.
Non-monetary assets and liabilities denominated in foreign currencies existing as of the balance sheet date which are to be carried at fair value were converted to Euros at the rate as of the balance sheet date. The Company used the following exchange rates (spot rates):
| | | | | | | |
| | March 31,
2009 | | March 31,
2008 | | March 31,
2007 | |
|---|
1 € | | US$1.3308 | | US$1.5812 | | US$1.3318 | |
1 € | | GBP 0.9308 | | GBP 0.7958 | | GBP 0.6798 | |
F-14
Table of Contents
2. Accounting and Valuation Methods
2.1 Property and Equipment
2.1.1 Property and Equipment
Property and equipment are recognized at cost less accumulated depreciation and accumulated impairment losses. Borrowing costs are not capitalized. Rebates, trade discounts and bonuses are deducted from the purchase price.
For technical equipment located on leased property, historical costs include the present value of estimated future costs and expenses necessary for restoration of the leased property after termination of the lease agreement.
2.1.2 Leases
Operating lease
A lease is accounted for as an operating lease when all the risks and benefits incidental to ownership of the leased item remain with the lessor. Operating lease payments are therefore recorded on a straight-line basis over the lease term as an expense in the consolidated statement of operations.
Operating lease for Customer Premises Equipment (CPE)
To get a connection to Internet & Phone services as well as to receive digital TV, the Company leases the necessary equipment to the customers (Customer Premise Equipment or CPE). These leases, for which the Company is the lessor, are classified as an operating lease. Therefore, the Company capitalizes the CPE as fixed assets based on acquisition cost and the cost of removing the asset at the end of the lease. Over the useful life of 3 years, the assets are depreciated using the straight-line method.
Finance lease
In accordance with IAS 17 "Leases", assets leased under finance leases are recorded at the lower of fair value at the inception of the lease or the present value of the lease payments. The assets are depreciated using the straight-line method over the shorter of the estimated useful life or over the lease period. The obligations related to future lease payments are recognized as liabilities. Lease payments are apportioned between the finance charges and reductions of the lease liability so as to achieve a constant rate of interest on the remaining balance of the liability. Finance charges are charged directly against income.
2.1.3 Subsequent Expenses
Rental costs are expensed. Repair and maintenance charges are expensed during the financial period in which they are incurred. The cost of significant renovations and additions are included in the carrying amount of the asset when it is probable that future economic benefits in excess of the originally assessed standard of performance will be realized by the Company. Significant renovations are depreciated over the shorter of the remaining useful life of the related asset or the lease term.
F-15
Table of Contents
2.1.4 Depreciation of Fixed Assets
Depreciation is calculated based on the straight-line method over each asset's estimated useful life as follows:
| | |
Buildings and leasehold improvements | | 3 to 10 years |
Technical equipment and machines | | 3 to 20 years |
Property and equipment | | 3 to 15 years |
Gains and losses from derecognition of fixed assets are determined by deducting the carrying amount of the asset being sold from the proceeds received at the time of derecognition. The results are included in other operating income or in the corresponding expense line item. The assets' residual values, useful lives and depreciation methods are reviewed, and adjusted if appropriate, at each financial year end.
2.2 Intangible Assets
2.2.1 Customer List
In connection with the initial acquisition of the cable business by the Company in March 2003, approximately T€681,659 of the purchase price was allocated to the customer list. Further additions to the customer list that occurred during the twelve months ended March 31, 2009 and in the previous years are primarily related to the acquisition of Level 4 companies and subscribers. The weighted remaining useful life of the customer list is 4.84 years, 3.92 years and 4.61 years as of March 31, 2009, March 31, 2008 and March 31, 2007, respectively.
2.2.2 Other Intangible Assets
Intangible assets which are purchased separately are recorded at cost. Intangible assets that have been acquired as part of an acquisition of a business are capitalized at fair value if they can be reliably measured at the acquisition date.
Computer software is recorded at cost as an intangible asset.
The Company recognizes intangible assets developed internally (consisting of software used by the company) to the extent the criteria in IAS 38 "Intangible Assets" are met. Development costs for internally generated intangible assets are recognized at cost to the extent the Company can demonstrate the technical feasibility of completing the asset, how the asset will generate future economic benefit, the availability of resources to complete the asset and the ability to measure reliably the expenditure during the development. If the requirements for capitalization are not fulfilled, development costs are expensed as incurred.
The Company recognizes subscriber acquisition costs incurred to obtain new subscribers if the costs are directly attributable to obtaining specific contracts, are incremental, can be measured reliably and meet the definition and recognition criteria of an intangible asset in accordance with IAS 38. Subscriber acquisition costs incurred to obtain new contracts without an initial contract period (open-ended contracts) are expensed as incurred.
Following initial recognition, intangible assets are carried at cost less any accumulated depreciation and any accumulated impairment loss.
2.2.3 Subsequent Expenses
Subsequent investments in intangible assets will be capitalized if they qualify for recognition as an intangible asset.
F-16
Table of Contents
2.2.4 Amortization of intangible assets
The estimated useful life of the customer list is based on the average number of terminations and the term of the average contract life of individual end users who generate significant contribution margins.
The amortization of other intangible assets with definite useful lives is based on the straight-line method over the assets' estimated useful lives. Amortization begins when the intangible asset is ready for use.
The Company recognizes subscriber acquisition costs incurred to obtain new subscribers. The Company amortizes these costs over the initial contract period except for contracts where there is past evidence regarding the expected customer relationship period.
The amortization expense is recognized in the statement of operations in the expense category consistent with the function of the intangible assets.
The useful lives are estimated as follows:
| | | | |
| • | | Customer list | | 8.5 years |
| • | | Software and licenses | | 1-10 years |
| • | | Subscriber Acquisition Costs | | 1-8.5 years |
The appropriateness of the useful life for the customer list is validated on an annual basis.
2.3 Financial Instruments
Recognition and Derecognition of Financial Instruments
Financial assets and liabilities are recognized when the Company enters into a contractual relationship with the respective counterparty or issuer. A financial asset is derecognized when:
- •
- the rights to receive cash flows from the asset have expired;
- •
- the Company retains the right to receive cash flows from the asset but has assumed an obligation to pay those cash flows in full without material delay to a third party under a 'pass-through' arrangement; or
- •
- the Company has transferred its rights to receive cash flows from the asset and either (a) has transferred substantially all the risks and rewards of the asset, or (b) has neither transferred nor retained substantially all the risks and rewards of the asset but has transferred control of the asset.
A financial liability is derecognized when the obligation under the liability is discharged, canceled or expired.
Where an existing financial liability is replaced by another one from the same lender on substantially different terms, or the terms of an existing liability are substantially modified, such an exchange or modification is treated as a derecognition of the original liability and the recognition of a new liability, and the difference in the respective carrying amounts is recorded in the consolidated statement of operations.
Financial Assets
Financial assets in the scope of IAS 39 are classified as either financial assets at fair value through profit or loss, loans and receivables, held-to-maturity investments, or available-for-sale financial assets, as appropriate. When financial assets are initially recognized they are measured at fair value plus, in the case of investments not at fair value through profit or loss, directly attributable transaction costs.
F-17
Table of Contents
The Company determines the classification of its financial assets after initial recognition and, where allowed and appropriate, reevaluates this designation at each financial year-end. All purchases and sales of financial assets are recognized on the trade date, which is the date that the Company commits to purchase the asset.
Financial assets at fair value through profit or loss
Financial assets classified as held for trading are included in the category "financial assets at fair value through profit or loss". Financial assets are held for trading if they are acquired for the purpose of selling in the near term. Derivatives are also classified as held for trading unless they are designated and effective hedging instruments. Gains or losses on investments held for trading are recognized in the consolidated statement of operations.
Loans and receivables
Loans and receivables are non-derivative financial assets with fixed or determinable payments that are not quoted in an active market. Such assets are carried at amortized cost using the effective interest method. Gains and losses are recognized in the consolidated statement of operations when the loans and receivables are extinguished or impaired as well as through the amortization process.
Available-for-sale financial assets
Available-for-sale financial assets are those non-derivative financial assets that are designated as available-for-sale or are not classified in any of the three preceding categories. After initial recognition available-for-sale financial assets are measured at fair value with gains or losses being recognized as a separate component of equity until the investment is sold or until the investment is determined to be impaired at which time the cumulative gain or loss previously reported in equity is included in the statement of operations.
Financial Liabilities
Financial liabilities (loans) are initially recognized at cost which corresponds to the fair value of the given consideration received net of issue costs associated with the financial liabilities. In subsequent periods, liabilities are measured at amortized cost using the effective interest method with the exception of derivative financial instruments which are measured at their fair market value.
Derivative Financial Instruments
Derivative financial instruments are used exclusively for the purpose of hedging foreign currency and interest rate risks arising from financing activities. In accordance with IAS 39 "Financial Instruments: Recognition and Measurement", all derivative financial instruments are accounted for at fair value irrespective of the purpose or the intention for which they were incurred. Depending on whether it is a fair value hedge or a cash flow hedge, changes in the fair value of the derivative financial instruments for which hedge accounting is used are either reported in the statement of operations or in the statement of changes in equity under cash flow hedge reserve. In the case of a fair value hedge, the gains or losses from the measurement of derivative financial instruments at fair value and the gains or losses related to the underlying contracts are recognized in the consolidated statement of operations. In the case of changes in the fair value of cash flow hedges which are used to offset future cash flow risks arising from underlying transactions or planned transactions and which have proved to be 100% effective in accordance with IAS 39, unrealized gains and losses are initially recognized in equity as a cash flow hedge reserve.
If the cash flow hedge is not 100% effective, the ineffective portion of changes in the fair value of the derivative designated as a cash flow hedge is recognized in the consolidated statement of
F-18
Table of Contents
operations. If hedge accounting cannot be used by the Company, the change in the fair value of derivative financial instruments is recorded in the consolidated statement of operations.
Equity Investments in Associates
Investments in associates are accounted for using the equity method at the investor's share of equity pursuant to IAS 28 "Investments in Associates". The Company's share of income, reduced by distributions and amortization of write-ups in amortizable assets from purchase accounting is disclosed in the fixed asset register as a change in equity investment.
2.4 Inventories
Raw materials, consumables, supplies, finished goods and merchandise are recorded at the lower of cost or net realizable value. Cost is generally determined using a moving average cost.
2.5 Trade and Other Receivables
Trade and other receivables are disclosed at their nominal amount less bad debt allowances for any amounts deemed uncollectible. In relation to trade receivables, a provision for impairment is made when there is objective evidence (such as the probability of insolvency or significant financial difficulties of the debtor) that the Company will not be able to collect all of the amounts due under the original terms of the invoice. The carrying amount of the receivable is reduced through use of an allowance account. Impaired debts are derecognized when they are assessed as uncollectible.
2.6 Cash and Cash Equivalents
Cash and cash equivalents are mainly comprised of cash on hand and other short-term, highly liquid investments with an original maturity of three months or less. Cash in hand and at banks are carried at nominal value.
For purposes of the consolidated cash flow statement, cash and cash equivalents consist of cash and cash equivalents as defined above, net of outstanding bank overdrafts.
2.7 Impairment
The carrying amount of intangible assets and property and equipment is reviewed at every balance sheet date to determine whether there are any indications of impairment. If such indications exist or when annual impairment testing is required, the recoverable amount is estimated. Impairment is necessary when the carrying amount of an asset or the related cash-generating unit exceeds the recoverable amount. The corresponding impairment is expensed.
Goodwill is tested for impairment annually (as at March 31) and when circumstances indicate that the carrying amount value may be impaired. Impairment is determined for goodwill by assessing the recoverable amount of each cash-generating unit to which the goodwill relates. Where the recoverable amount of the cash-generating unit is less than their carrying amount, an impairment loss is recognized. Impairment losses for goodwill are not reversed in subsequent periods.
If there is objective evidence that an impairment loss on loans and receivables carried at amortized cost has been incurred, the amount of the loss is measured as the difference between the asset's carrying amount and recoverable amount, i.e. the higher of the present value of estimated future cash flows discounted at the financial asset's original effective interest rate and fair value less cost to sell. The carrying amount of the receivable is reduced through use of an allowance account. Impaired debts are derecognized when they are assessed as uncollectible.
F-19
Table of Contents
2.7.1 Determination of Recoverable Amount
The recoverable amount of an asset is the greater of its fair value less costs to sell and its value in use. Value in use is determined by discounting the estimated future cash flows to be derived from continuing use of the asset until its ultimate disposal. The discount rate is based on a pre-tax interest rate that reflects current market assessments of the fair value of money and the risks specific to the asset.
For assets to which no cash flows can be directly attributed, the recoverable amount is determined for the cash-generating unit to which the asset belongs.
2.7.2 Reversal of Impairment Loss
Impairment losses on assets are reversed when assumptions relating to the recoverable amount of the assets change. Impairment losses are only reversed up to the carrying amount of the asset which would have been recorded if the asset had been subject to standard depreciation without impairment.
2.8 Equity
Subscribed capital and the capital reserve are stated at nominal value. Capital reserves are set up for additional paid in capital and for changes relating to share-based payments.
2.9 Employee Benefits
Under the Company's pension plans, KDG provides employees post-employment benefits under a defined benefit plan. The benefits are unfunded.
The present value of future claims of participants is estimated using actuarial methods based on the amount of benefit earned for their service in the current and prior periods. The liabilities to be recognized in the consolidated balance sheet result from the present value of the defined benefit obligation adjusted for any actuarial gains or losses, and less any past service cost not yet recognized. The discount rate is determined by reference to the capital markets and takes into account the expected maturity of the obligation. KDG engaged qualified external actuaries to perform the necessary actuarial calculations. The obligation is determined using the projected unit credit method.
If the benefits of the pension plan improve, the share of those plan improvements relating to the employees' previous years of service will be recognized as an expense on a straight-line basis over the period in which the claims vest. If the claims have already vested, the prior service cost is expensed immediately.
In measuring the obligations arising from the defined benefit plans, actuarial gains and losses arising after April 1, 2003 are not recognized in the consolidated statement of operations until the cumulative outstanding amounts exceed a corridor of 10% (corridor approach) of the defined benefit obligation as of the measurement date. The portion of the amount exceeding the corridor is amortized to the consolidated statement of operations over the remaining average service life of the employees entitled to pensions.
2.10 Other Provisions
Other provisions are recognized in the consolidated balance sheet pursuant to IAS 37 "Provisions, Contingent Liabilities and Contingent Assets" when a legal or constructive obligation to a third party arises as a result of past events. An outflow of resources embodying economic benefits will be required to settle the obligation and the anticipated amount of the provision can be reliably estimated. Non-current other provisions are stated at their discounted settlement value on the balance sheet date where the effect of the time value of money is material.
F-20
Table of Contents
2.11 Trade Payables and Other Liabilities
Trade payables and other liabilities are recorded at amortized cost.
2.12 Revenue and Other Income
Revenue is recognized to the extent it is probable that the economic benefits will flow to the Company and revenue can be reliably measured. The different types of revenue are recognized as follows:
Installation and network connection
Revenue from the installation of the cable connection and the network connection is recognized when the services have been rendered, the costs incurred can be measured reliably and the Company is not obliged to provide any future network connection or installation services.
Rendering of services
Revenue generated by the delivery of analog and digital pay products, Internet and telephone services, as well as carriage fees and digital playout facility fees paid by television broadcasters, are recognized when services have been provided, the costs incurred can be measured reliably and the Company is not obliged to provide any future services. Prepayments are accounted for by deferring the received payments and amortizing them straight-line over the service period.
When free months are offered to customers in relation to a subscription, the Company recognizes the total amount of billable revenue in equal monthly installments over the term of the contract, provided that the Company has the enforceable and contractual right to deliver the customer with the products after the promotional free month period. If free months are given without a contract at the beginning of a subscription period, the company does not recognize revenues during the free months as the customer's continuance is not assured.
Sale of goods
Revenue from the sale of digital set top boxes, cable modems, and other goods is recognized when the significant risks and rewards of ownership of the goods have passed to the buyer. If the Company acts as an agent, revenue is only recognized in the amount of the sales commissions.
Multiple Elements Arrangements
For bundled services in multiple element arrangements the Company recognizes revenue for each element on the basis of the relative fair value of each item in the transaction if there is evidence of fair value.
2.13 Share-based Payments
The Company applies IFRS 2 "Share-Based Payment". Under IFRS 2, plans which result in share-based payment transactions have to be accounted for as cash-settled if the interest holder will receive a payment in cash upon settlement rather than the underlying equity instruments. Due to the terms of the different programs at KDG, it is highly likely that the general partner of Cayman Cable Holding L.P. (the Partnership) will exercise the existing repurchase option in most cases of the interest holders' termination of employment and settle in cash. Alternatively, employees leaving the Company may have the option to put their vested interests to Cayman for cash. In the case of a put or call, the employee is generally protected from decreases in fair value below their initial investment amount. For such cash-settled share-based payment transactions, IFRS 2 requires the entity to account for share-based payments to management as personnel expense and a corresponding increase in other liabilities.
F-21
Table of Contents
For interests in the Management Equity Participation Program I (MEP I) and in the Management Equity Participation Program IV (Indirect MEP IV), which are share acquisition programs, the costs of cash-settled transactions are measured initially based on the notional amount paid.
For MEP II and III, as well as the MEP IV Option program and MEP V, which all are option programs, the costs of cash-settled transactions are measured initially at fair value at the grant date using the Black-Scholes model taking into account the terms and conditions upon which the instruments were granted because it is typically not possible to reliably estimate the fair value of employee services received. This fair value is expensed over the period until vesting with recognition of a corresponding liability.
For all MEP programs the services received during the vesting periods and, therefore, the corresponding liabilities, are remeasured at each balance sheet date up to and including the settlement date with changes in fair value recognized in the consolidated statement of operations.
2.14 Benefit/Taxes on Income
Current income tax assets and liabilities are measured at the amount expected to be recovered from or paid to the taxation authorities. The tax rates and tax laws used to compute the amounts are those that are enacted or substantively enacted by the balance sheet date.
Except for those cases described below, deferred income tax is provided using the liability method on all temporary differences between the tax basis of assets and liabilities and their carrying amounts for financial reporting purposes at the balance sheet date.
Deferred income tax liabilities are recognized for all taxable temporary differences, except:
- •
- where the deferred income tax liability arises from the initial recognition of goodwill or of an asset or liability in a transaction that is not a business combination and, at the time of the transaction, affects neither the accounting profit nor taxable profit or loss; and
- •
- for temporary taxable differences associated with investments in subsidiaries, associates and interests in joint ventures, where the timing of the reversal of the temporary differences can be controlled and it is probable that the temporary differences will not reverse in the foreseeable future.
Deferred income tax assets are recognized for all temporary deductible differences, carry forward of unused tax credits and unused tax losses to the extent that it is probable that taxable profit will be available against which the deductible temporary differences and the carry forward of unused tax credits and unused tax losses can be utilized:
- •
- except where the deferred income tax asset relating to the temporary deductible difference arises from the initial recognition of an asset or liability in a transaction that is not a business combination and, at the time of the transaction, affects neither the accounting profit or loss nor taxable profit or loss;
- •
- except that temporary deductible differences associated with investments in subsidiaries, associates and interests in joint ventures, deferred tax assets are only recognized to the extent that it is probable that the temporary differences will reverse in the foreseeable future and taxable profit will be available against which the temporary differences can be utilized.
The carrying amount of deferred income tax assets is reviewed at each balance sheet date and reduced to the extent that it is no longer probable that sufficient taxable profit will be available to allow all or part of the deferred income tax asset to be utilized.
F-22
Table of Contents
Deferred income tax assets and liabilities are measured at the tax rates that are expected to apply to the year when the asset is realized or the liability is settled, based on tax rates (and tax laws) that have been enacted or substantively enacted at the balance sheet date.
Income taxes relating to items recognized directly in equity are recognized in equity and not in the statement of operations.
Deferred tax assets and deferred tax liabilities are offset if a legally enforceable right exists to set off current tax assets against current tax liabilities and the deferred taxes relate to the same taxable entity and the same taxation authority.
2.15 Key Judgments and Estimation Uncertainty
The preparation of the consolidated financial statements in accordance with IFRS requires judgments and estimations to be made which have an effect on the carrying amounts of recognized assets and liabilities, income and expenses and contingent liabilities. In some cases, the actual values may differ from the judgments and estimations. Changes are recognized in the consolidated statement of operations when better information is available.
2.15.1 Key Judgments
In the process of applying KDG's accounting policies, management has made the following judgments, apart from those involving estimations, which have the most significant effect on the amounts recognized in the consolidated financial statements.
Derivatives
The Company has entered into interest rate swaps, interest rate caps and currency swaps to hedge its risks resulting from exposure to changes in interest rates and foreign currency rates. All of these derivative instruments have been accounted for in accordance with IAS 39 at fair value irrespective of the purpose or the intention for which they were used. The currency swaps with a maturity in June 2009 were consistently classified as cash flow hedges.
Operating Leases for CPE
The Company offers products that contain signal delivery and the right to use hardware devices. The hardware devices are essential for the signal delivery to the customer. Since the fulfillment of these arrangements is dependent on the use of a specific asset and the arrangements convey a right to use the asset, the contracts contain a lease in accordance with IFRIC 4 (KDG as lessor).
Hardware devices are recognized as equipment in accordance with IAS 16 and amortized over the useful life of three years.
Operating lease cable ducts
In certain cases KDG leases space in the cable ducts of Deutsche Telekom AG (DTAG) to house KDG's network cable. The Company has determined that it retains no significant risks and rewards of ownership of these cable ducts and, therefore, accounts for the leases as operating leases.
Finance lease transponders
The Company has leased specific satellite transponders in order to transmit audio and video signals. The Company has determined that the rights to use specific transponders have been transferred and that the lease term of specific transponders covers the major part of the economic life of the
F-23
Table of Contents
transponders. Therefore, the Company has classified and accounted for the leases as finance leases according to IAS 17.
2.15.2 Estimation Uncertainty
The key assumptions concerning the future and other key sources of estimation uncertainty at the balance sheet date that have a significant risk of causing a material adjustment to the carrying amounts of assets and liabilities within the next financial year are discussed below.
Derivatives
The fair values of the derivative financial instruments as of the balance sheet date have been estimated at the net present values (discounted by market yield curves) of the future payments and using standard models (in the case of caps). The total fair values of the derivative financial instruments amounted to liabilities of T€57,746, T€116,346 and T€53,191 as of March 31, 2009, March 31, 2008 and 2007, respectively.
Share-based payments
As of March 31, 2006 and for periods prior to this, it was management's intention to settle MEP I using the formula price as stated in the respective limited partnership agreement. Effective April 19, 2006 and in connection with the 5th amendment to the limited partnership agreement, the controlling shareholders of Cayman Cable modified the settlement terms of MEP I interests in Cayman Cable Holding L.P to better reflect current market value conditions, changing the settlement formula from an EBITDA formula with fixed multiples to estimated fair value. The change in the fair price estimation resulted in an increase in personnel expenses in the amount of T€36,836 for the fiscal year ended March 31, 2007.
Based on the 5th amendment to the limited partnership agreement, the fair value measurement for MEP IV interests is based on the same valuation method as is used for MEP I.
The measurement of the fair value at grant date with respect to the MEP II and MEP III option plans as well as to the MEP IV Option Program and MEP V is based on the Black-Scholes option pricing model. The main parameters, the expected volatility of the values of the shares, the estimated term of the options and the risk free interest rate on grant date were estimated by the Company.
The Company recognized expenses with respect to all MEP plans in an amount of T€2,063, T€23,042 and T€41,791 for the years ended March 31, 2009, March 31, 2008 and March 31, 2007, respectively.
Internally Developed Software
The Company recognized intangible assets developed internally (consisting of software used by the Company) to the extent the criteria of IAS 38 were met. Development costs for internally generated intangible assets are recognized at cost to the extent the assets are economically usable and the costs can be reliably measured. For the years ended March 31, 2009, March 31, 2008 and March 31, 2007, respectively, approximately T€3,871, T€2,528 and T€1,048 of costs for internally developed software were capitalized.
Customer List
The customer list is primarily amortized on a straight-line basis over 8.5 years. The estimated useful life is based on the average number of terminations and the term of the average contract life. The book value of the customer list amounted to T€433,101, T€317,813 and T€382,387 for the years ended March 31, 2009, March 31, 2008 and March 31, 2007, respectively.
F-24
Table of Contents
Trade Receivables
The latest experience regarding the collectability of past due receivables has shown that the collection rate of receivables of more than 180 days past due has improved from nearly 0% to 20%. Therefore, the Company has revised the provision for allowance for such receivables from 100% down to 80%. The effect of this revision is a decrease of bad debt allowance by T€3,067 from T€56,312 to T€53,245 as of March 31, 2009.
Provision for Pensions
With respect to the actuarial calculation of the provision for pensions, the Company estimated the future salary increases, future pension increases and the discount rate. As of March 31, 2009, March 31, 2008 and March 31, 2007, the provision for pensions amounted to T€35,309, T€29,148 and T€24,171, respectively.
Asset Retirement Obligations
The amount of the accrual is based on an estimate of the costs expected for the demolition and restoration of the technical facilities. Expectations regarding the lessor waiving asset retirement performance requirements are factored into the calculation of best estimate of the obligation related to the leased cable ducts under IFRS. Approximately 93% of KDG's obligations are related to technical equipment, including different kinds of cable and signal transmitting and receiving technology in cable ducts of DTAG. KDG assumes that 6% of the technical equipment will be replaced by other technologies after 10 years, 28% will be replaced after 15 years and the remaining 66% of the technical equipment is expected to be replaced after 30 years. The remaining 7% of the asset retirement obligations are divided into accruals for furniture, fixtures and miscellaneous restoration obligations. The asset retirement obligations amounted to T€22,971, T€20,665 and T€20,562 as of March 31, 2009, March 31, 2008 and March 31, 2007, respectively.
2.16 Accounting Standards Recently Issued by the IASB
The Company applied all IFRSs and IFRIC interpretations issued by the IASB, London, which are effective as of March 31, 2009, adopted by the EU and applicable to the Company. The designation IFRS also includes all valid IAS. All interpretations of the IFRIC, formerly the SIC, were also applied.
Accounting Standards recently issued by the IASB and applied by the Company
In addition to the IFRSs and IFRIC interpretations already applied by the Company in the fiscal year ending March 31, 2008, it has adopted the following amended IFRS standards and IFRIC interpretations during the year ended March 31, 2009. Adoption of these revised standards and interpretations did not have any effect on the financial performance or position of the Company. They did however give rise to additional disclosures:
- •
- IFRIC 12 "Service Concession Arrangements"
- •
- IFRIC 14 "IAS 19—The Limit on a Defined Benefit Asset, Minimum Funding and their Interaction"
- •
- Amendments to IAS 39 "Financial Instruments: Recognition and Measurement" and IFRS 7 "Financial Instruments: Disclosures"
The principle effects of these changes are as follows:
In November 2006, the IFRIC issued the interpretation IFRIC 12 "Service Concession Arrangements". This interpretation applies to service concession operators and explains how to account for the obligations undertaken and rights received in service concession arrangements. Service
F-25
Table of Contents
concessions are arrangements whereby a government or other public sector entity as the grantor grants contracts for the supply of public services to private sector entities as operators. Depending on the consideration the operator receives from the grantor, the operator recognizes a financial asset or an intangible asset. A financial asset is recognized if the operator has an unconditional contractual right to receive cash or another financial asset from the grantor. If, however, the consideration the operator receives from the grantor is a right to impose charges upon users, which does not represent an absolute right to receive payments, an intangible asset is recognized. Depending on the contractual arrangements, recognition of both a financial asset and an intangible asset is also possible. No member of the Company is an operator and, therefore, this interpretation has no impact on the Company.
The IFRIC Interpretation IFRIC 14 "IAS 19—The Limit on a Defined Benefit Asset, Minimum Funding and their Interaction" provides guidance on how to assess the limit on the amount of surplus in a defined benefit scheme that can be recognized as an asset under IAS 19 Employee Benefits. Since the Company does not have plan assets this interpretation has no impact on the Company.
An amendment to IAS 39 "Financial Instruments: Recognition and Measurement" and IFRS 7 "Financial Instruments: Disclosures" issued in October 2008, permits an entity to reclassify non-derivative financial assets (other than those designated at fair value through profit or loss by the entity upon initial recognition) out of the fair value through profit or loss category in particular circumstances. The amendment also permits an entity to transfer from the available-for-sale category to the loans and receivables category a financial asset that would have met the definition of loans and receivables (if the financial asset had not been designated as available for sale), if the entity has the intention and ability to hold that financial asset for the foreseeable future. The changes in IFRS 7 require additional disclosures about the situations in which any such reclassification is made, and the effects on the financial statements. In the reporting period, the Company did not hold any financial assets eligible for reclassification under the amendment to IAS 39 in its portfolio. The application of the amended IAS 39 and IFRS 7 therefore has no effect on the presentation of the Company's results of operations, financial position or cash flows.
Accounting Standards recently issued by the IASB and not yet applied by the Company
The Company has not applied any of the following standards or interpretations that have been issued and have been endorsed by the EU as of July 8, 2009 but are not effective for the Company as of March 31, 2009.
The revised IAS 1 "Presentation of Financial Statements" was issued in September 2007 and becomes effective for financial years beginning on or after January 1, 2009. The standard separates owner and non-owner changes in equity. The statement of changes in equity will include only details of transactions with owners, with non-owner changes in equity presented as a single line. In addition, the standard introduces the statement of comprehensive income: it presents all items of recognized income and expense, either in one single, or in two linked statements. As the amendment to IAS 1 only affects disclosure requirements, it will not have an impact on the Company's results of operations, financial position or cash flows.
A revised IAS 23 "Borrowing cost" was issued in March 2007, and applies to borrowing costs relating to qualifying assets for which the commencement date for capitalization is on or after January 1, 2009. The standard has been revised to require capitalization of borrowing costs when such costs relate to a qualifying asset. A qualifying asset is an asset that necessarily takes a substantial period of time to get ready for its intended use or sale. In accordance with the transitional requirement in the Standard, the Company will adopt this prospective change. Accordingly, borrowing costs will be capitalized on qualifying assets with a commencement date after April 1, 2009. No changes will be made for borrowing costs incurred to this date that have been expensed.
F-26
Table of Contents
The revised standard of IAS 27 "Consolidated and Separate Financial Statements" was issued in January 2008 and becomes effective for financial years beginning on or after July 1, 2009. Within the scope of revision of valuation and accounting regulations for business combinations, IASB and FASB enhanced IAS 27. The modifications primarily concern the reporting of holdings without a controlling character (minority holdings) which will in future fully form part of the Company's losses and transactions that lead to a loss of control at a subsidiary company and whose effects are to be treated in a manner affecting net income. In contrast, the consequences of company sell-offs that do not lead to loss of control are not to be included in equity in a manner that affects net income. The transitional provisions provide for several exceptions from the basically retrospective adoption of this revision. The Company expects that this standard will have no impact on its financial position or performance of the Company.
The amendments to IAS 32 "Financial Instruments: Presentation—Amendments relating to Puttable Instruments and Obligations Arising on Liquidation" and IAS 1 "Presentation of Financial Statements—Amendments relating to disclosure of Puttable Instruments and Obligations Arising on Liquidation" were issued in February 2008 and become effective for financial years beginning on or after January 1, 2009. The revisions provide a limited scope exception for puttable instruments to be classified as equity if they fulfill a number of specified features. This means that some financial instruments currently falling under the definition of financial liabilities will be classified as equity. IAS 32 contains detailed criteria applied to identifying such instruments. The amendments to the standards are not expected to have a material impact on the presentation of the Company's results of operations, financial position or cash flows.
The amendments to IFRS 1 "First time Adoption of International Financial Reporting Standards" allow an entity to determine the 'cost' of investments in subsidiaries, jointly controlled entities or associates in its opening IFRS financial statements in accordance with IAS 27 "Consolidated and Separate Financial Statements" or using a deemed cost. The amendment to IAS 27 requires that all dividends from subsidiaries, jointly managed companies, or associated companies are booked through the statement of operations in the separate single-entity financial statements. Both revisions will be effective for financial years beginning on or after January 1, 2009. The revision to IAS 27 will have to be applied prospectively. The new requirements affect only the parent's separate financial statement and do not have an impact on the consolidated financial statements. In December 2008 the IASB decided to change the effective date from January 1, 2009 to July 1, 2009. IFRS 1 retains the substance of the previous version, but within a changed structure. The amendment to the standards is not expected to have a material impact on the presentation of the Company's results of operations, financial position or cash flows.
A revised version of IFRS 2 "Share based Payment" was issued in January 2008 and becomes effective for annual periods beginning on or after January 1, 2009. This revised standard clarifies the definition of vesting conditions in share-based payments and stipulates that all cancellations of share-based payments should receive identical accounting treatment, regardless of the party responsible for cancellation. The Company plans to adopt the amended IFRS 2 beginning April 1, 2009. Due to the scope of share-based payments at the Company, no serious consequences are expected for the financial asset and profit situation from the initial application of this new regulation.
The revised standards of IFRS 3 "Business Combinations" and IAS 27 "Consolidated and Separate Financial Statements" were issued in January 2008 and become effective for financial years beginning on or after July 1, 2009. IFRS 3 introduces a number of changes in the accounting for business combinations occurring after this date that will impact the amount of goodwill recognized, the reported results in the period that an acquisition occurs, and future reported results. IAS 27 requires that a change in the ownership interest of a subsidiary (without loss of control) is accounted for as an equity transaction. Therefore, such transactions will no longer give rise to goodwill, nor will it give rise to a gain or loss. Furthermore, the amended standard changes the accounting for losses incurred by the
F-27
Table of Contents
subsidiary as well as the loss of control of a subsidiary. Other consequential amendments were made to IAS 7 "Statement of Cash Flows", IAS 12 "Income Taxes", IAS 21 "The Effects of Changes in Foreign Exchange Rates", IAS 28 "Investment in Associates" and IAS 31 "Interests in Joint Ventures". The changes by IFRS 3 and IAS 27 will affect future acquisitions or loss of control and transactions with minority interests. The standard may be adopted early. However, the Company does not intend to take advantage of this possibility.
In November 2006, the IASB issued IFRS 8 "Operating Segments". The standard becomes effective for annual periods beginning on or after January 1, 2009. This standard requires an entity to report financial and descriptive information about its reportable segments. IFRS 8 requires identification of operating segments based on internal reports that are regularly reviewed by the entity's chief operating decision maker in order to allocate resources to the segment and assess its performance. The standard also requires an explanation of how segment profit or loss and segment assets and liabilities are measured for each reportable segment. IFRS 8 requires an entity to report information about revenues derived from its products or services, about the countries in which it earns revenues and holds assets, and about major customers. The provisions of IFRS 8 are effective for annual periods beginning on or after January 1, 2009. The Company adopts the amended IFRS 8 beginning April 1, 2009. The standard will have no material impact on the segment presentation. However, there will be additional and changed disclosures. Changes will mainly refer to the segments "Other" and "Unallocated" that have been presented separately in the past.
Improvements to IFRSs:
In May 2008 the Board issued its first omnibus of amendments to its standards, primarily with a view to removing inconsistencies and clarifying wording. There are separate transitional provisions for each standard. The Company has not yet adopted the following amendments and anticipates that these changes will have no material effect on the financial statements:
- •
- IAS 1 "Presentation of Financial Statements" clarifies that Assets and liabilities classified as held for trading in accordance with IAS 39 "Financial Instruments: Recognition and Measurement" are not automatically classified as current in the balance sheet.
- •
- IAS 8 "Accounting Policies, Change in Accounting Estimates and Errors" clarifies that only implementation guidance that is an integral part of an IFRS is mandatory when selecting accounting policies.
- •
- IAS 10 "Events after the Reporting Period" clarifies that dividends declared after the end of the reporting period are not obligations.
- •
- IAS 16 "Property, Plant and Equipment" replaces the term 'net selling price' with 'fair value less costs to sell'. Items of property, plant and equipment held for rental that are routinely sold in the ordinary course of business after rental, are transferred to inventory when rental ceases and they are held for sale.
- •
- IAS 18 "Revenue" replaces the term 'direct costs' with 'transaction costs' as defined in IAS 39.
- •
- IAS 19 "Employee Benefits" revised the definition of 'past service costs', 'return on plan assets' and 'short term' and 'other long-term' employee benefits. Amendments to plans that result in a reduction in benefits related to future services are accounted for as curtailment. The changed standard refrains from the reference to the recognition of contingent liabilities to ensure consistency with IAS 37.
- •
- IAS 20 "Accounting for Government Grants and Disclosure of Government Assistance" clarifies that loans granted in the future with no or low interest rates will not be exempt from the requirement to impute interest. The difference between the amount received and the discounted
F-28
Table of Contents
F-29
Table of Contents
- •
- IAS 41 "Agriculture" removed the reference to the use of a pre-tax discount rate to determine fair value. Also the prohibition to take into account cash flows resulting from any additional transformations when estimating fair value has been removed and the term 'point-of-sale costs'has been replaced with 'costs to sell'.
- •
- To IFRS 5 "Non-current Assets Held for Sale and Discontinued Operations" the paragraphs 8A and 36A were added.
- •
- From IFRS 7 "Financial Instruments—Disclosures" the reference to 'total interest income' as a component of finance costs were removed.
The interpretation IFRIC 16 "Hedges of a Net Investment in a Foreign Operation" was issued in July 2008 and becomes effective for financial years beginning on or after October 1, 2008. The interpretation is to be applied prospectively. IFRIC 16 provides guidance on the accounting for a hedge of a net investment. As such it provides guidance on identifying the foreign currency risks that qualify for hedge accounting in the hedge of a net investment, where within the group the hedging instruments can be held in the hedge of a net investment and how an entity should determine the amount of foreign currency gain or loss, relating to both the net investment and the hedging instrument, to be recycled on disposal of the net investment. The adoption of IFRIC 16 is not expected to have a material impact on the presentation of the Company's results of operations, financial position or cash flows, as the Company has no net investments in foreign operations.
The Company has not applied any of the following IFRSs and IFRIC interpretations that have been issued but have not yet been endorsed by the EU as of July 8, 2009 and are not effective as of March 31, 2009.
The amendments to IAS 39 "Financial Instruments: Recognition and Measurement—Amendments for Eligible Hedged Items" were issued in August 2008 and become effective for financial years beginning on or after July 1, 2009. The amendment addresses the designation of a one-sided risk in a hedged item, and the designation of inflation as a hedged risk or portion in particular situations. lt clarifies that an entity is permitted to designate a portion of the fair value changes or cash flow variability of a financial instrument as a hedged item. The Company does not expect this amendment to affect its hedge instruments.
On March 5, 2009, the IASB issued Improving Disclosures about Financial Instruments in the Standard IFRS 7 "Financial Instruments: Disclosures" that become effective for annual periods beginning on or after January 1, 2009, with earlier application permitted. However, the Company does not intend to take advantage of this possibility.
The amendments require enhanced disclosures about fair value measurements and liquidity risk. Among other things, the amendments introduce a three-level hierarchy for fair value measurement disclosures and require entities to provide additional disclosures about the relative reliability of fair value measurements. In addition, the amendments clarify and enhance the existing requirements for the disclosure of liquidity risk. This is aimed at ensuring that the information disclosed enables users of an entity's financial statements to evaluate the nature and extent of liquidity risk arising from financial instruments and how the entity manages that risk. An entity will not be required comparative disclosures in the first year of application.
In March 2009, the IASB issued amendments to IFRIC 9 "Reassessment of Embedded Derivatives" and IAS 39 to clarify that on reclassification of a financial asset out of the 'at fair value through profit or loss' category all embedded derivatives have to be assessed and, if necessary, separately accounted for in financial statements. The amendments are effective for annual periods beginning on or after June 30, 2009. The Company will consider the revised IFRIC 9 in case of future reclassifications.
F-30
Table of Contents
The interpretation of IFRIC 13 "Customer Loyalty Programs" was issued in June 2007 and becomes effective for annual periods beginning on or after July 1, 2008. This interpretation requires customer loyalty award credits to be accounted for as a separate component of the sales transaction in which they are granted and therefore part of the fair value of the consideration received is allocated to the award credits and deferred over the period that the award credits are fulfilled. The portion of the proceeds allocated to the goods or service already delivered is recognized as revenue. The portion of the proceeds allocated to the award credits is deferred as an advance payment until the customer redeems the credit award, or the obligation in respect of the credit award is fulfilled. The adoption of IFRIC 13 is not expected to have a material impact on the presentation of the Company's results of operations, financial position or cash flows. For possible future customer loyalty programs the Company might set up, it currently evaluates the detailed effects from this new interpretation.
In July 2008, the IFRIC issued the interpretation IFRIC 15 "Agreements for the Construction of Real Estate" which becomes effective for financial years beginning on or after January 1, 2009. The interpretation is to be applied retrospectively. It clarifies when and how revenue and related expenses from the sale of a real estate unit should be recognized if an agreement between a developer and a buyer is reached before the construction of the real estate is completed. Furthermore, the interpretation provides guidance on how to determine whether an agreement is within the scope of IAS 11 or IAS 18. IFRIC 15 is expected to have no impact on the consolidated financial statements because the Company does not conduct such activity.
In November 2008, the IFRIC issued the interpretation IFRIC 17 "Distributions of Non-cash Assets to Owners" which becomes effective for financial years beginning on or after July 1, 2009. The interpretation is to be applied prospectively. The interpretation clarifies that a dividend payable should be recognized when the dividend is appropriately authorized and is no longer at the discretion of the entity. Furthermore it clarifies that an entity should measure the dividend payable at the fair value of the net assets to be distributed, and that an entity should recognize the difference between the dividend paid and the carrying amount of the net assets distributed in profit or loss. The interpretation also requires an entity to provide additional disclosures if the net assets being held for distribution to owners meet the definition of a discontinued operation. IFRIC 17 applies to pro rata distributions of non-cash assets except for common control transactions. IFRIC 17 is not expected to have a material impact on the financial position or performance of the Company, as the Company does not pay pro rata distributions of non-cash assets to owners.
In January 2009, the IFRIC issued the interpretation IFRIC 18 "Transfers of Assets from Customers" which becomes effective for transfers of assets from customers received on or after July 1, 2009. The IFRIC clarifies the requirements of IFRSs for agreements in which an entity receives from a customer an item of property, plant and equipment that the entity must then use either to connect the customer or provide the customer with ongoing access to a supply of goods or services (such as supply of electricity, gas or water). In some cases, the entity receives cash from a customer which must be used only to acquire or construct the item of property, plant and equipment in order to connect the customer to a network or provide the customer with ongoing access to a supply of goods or services (or to do both). The Company is currently analyzing the impact of applying IFRIC 18 on the presentation of its results of operations, financial position or cash flows but does not expect any effects since no assets are transferred in such a way IFRIC 18 deals with.
F-31
Table of Contents
3. Notes to the Statement of Operations
3.1 Revenues
Revenues were generated in Germany as follows:
| | | | | | | | | | |
| | April 1, 2008-
March 31, 2009 | | April 1, 2007-
March 31, 2008 | | April 1, 2006-
March 31, 2007 | |
|---|
| | T€
| | T€
| | T€
| |
|---|
Cable access revenues | | | 911,155 | | | 867,066 | | | 845,562 | |
TV/Radio revenues | | | 192,331 | | | 179,802 | | | 162,987 | |
Internet revenues | | | 93,253 | | | 48,591 | | | 24,241 | |
Phone revenues | | | 138,689 | | | 72,776 | | | 32,299 | |
TKS revenues | | | 34,903 | | | 28,635 | | | 28,090 | |
| | | | | | | | |
| | | 1,370,331 | | | 1,196,870 | | | 1,093,179 | |
| | | | | | | | |
Cable access revenues are primarily made up of monthly subscription fees paid for access to KDG's network and the delivery of analog and digital signals to both, direct and indirect subscribers. The Company also receives one time fees for the installation of a cable television or network connection.
| | | | | | | | | | |
| | April 1, 2008-
March 31, 2009 | | April 1, 2007-
March 31, 2008 | | April 1, 2006-
March 31, 2007 | |
|---|
| | T€
| | T€
| | T€
| |
|---|
Cable Access Subscription Fees | | | 898,895 | | | 854,087 | | | 833,786 | |
Installation Fees | | | 7,876 | | | 7,590 | | | 6,965 | |
Other Revenues | | | 4,384 | | | 5,389 | | | 4,811 | |
| | | | | | | | |
Total Cable Access Revenues | | | 911,155 | | | 867,066 | | | 845,562 | |
| | | | | | | | |
TV/Radio revenues are primarily generated by subscription fees paid by the Companies, customers for pay-TV digital packages, Kabel Digital International and Kabel Digital Home. The Company sells its pay-TV packages on a subscription basis directly to consumers and indirectly through certain Level 4 operators. Additional revenues are generated by sales of CPE, digital and analog carriage fees.
Internet revenues are primarily comprised of monthly subscription fees for Internet services and, to a much lesser extent, revenues from one time installation fees and the sale of CPE.
Phone revenues are primarily comprised of monthly subscription fees and variable fees based on usage and, to a much lesser extent, revenues from one time installation fees and the sale of CPE.
TKS revenues primarily relate to revenues generated by TKS Telepost Kabel-Service Kaiserslautern GmbH & Co. KG (TKS) for providing cable television, and Internet & Phone services to the NATO military personnel based in Germany. It also provides billing services for telephone customers of Deutsche Telekom AG (DTAG) who prefer English language bills. Additionally, TKS sells
F-32
Table of Contents
certain telecommunication products in its shops to personnel on NATO military bases such as prepaid mobile phones, cash cards and telecommunication related products and services.
| | | | | | | | | | |
| | April, 2008-
March 31, 2009 | | April, 2007-
March 31, 2008 | | April, 2006-
March 31, 2007 | |
|---|
| | T€
| | T€
| | T€
| |
|---|
Internet Revenues | | | 8,817 | | | 6,364 | | | 5,863 | |
Phone Service Revenues | | | 7,303 | | | 1,307 | | | 0 | |
Billing Service Revenues | | | 6,595 | | | 7,228 | | | 8,454 | |
Merchandise | | | 4,726 | | | 3,992 | | | 6,608 | |
Cable Television Revenues | | | 4,462 | | | 4,537 | | | 4,994 | |
Mobile Phone Service Revenues | | | 2,124 | | | 4,514 | | | 1,228 | |
Other Revenues | | | 876 | | | 693 | | | 943 | |
| | | | | | | | |
Total TKS Revenues | | | 34,903 | | | 28,635 | | | 28,090 | |
| | | | | | | | |
3.2 Cost of Services Rendered
| | | | | | | | | | | |
| | April 1, 2008-
March 31, 2009 | | April 1, 2007-
March 31, 2008 | | April 1, 2006-
March 31, 2007 | |
|---|
| | T€
| | T€
| | T€
| |
|---|
Cost of materials and services | | | 344,508 | | | 313,976 | | | 288,120 | |
| | thereof service level agreements | | | 175,805 | | | 164,992 | | | 169,486 | |
Personnel expenses | | | 62,321 | | | 44,171 | | | 63,018 | |
Depreciation and amortization | | | 205,504 | | | 154,676 | | | 133,123 | |
| | thereof intangible assets | | | 7,072 | | | 4,943 | | | 4,976 | |
| | thereof tangible assets | | | 198,432 | | | 149,733 | | | 128,147 | |
Other cost and expenses | | | 84,222 | | | 75,638 | | | 82,829 | |
| | | | | | | | |
Total Cost of Services Rendered | | | 696,555 | | | 588,461 | | | 567,090 | |
| | | | | | | | |
Cost of services rendered include primarily costs of materials and services, including charges related to service level agreements for services provided by DTAG, maintenance of the network, conditional access license expenses and special services for Internet & Phone as well as personnel expenses, depreciation and amortization and other cost and expenses. These other costs and expenses are primarily comprised of copyright expenses, IT support and other miscellaneous expenses. In the fiscal years ended March 31, 2009, March 31, 2008 and March 31, 2007, personnel expenses included expenses for restructuring in the amount of T€20,775, T€2,383 and T€11,639, respectively, that were not paid as of year end.
3.3 Other Operating Income
Other operating income amounts to T€18,079, T€12,613 and T€13,215, respectively, for the years ended March 31, 2009, March 31, 2008 and March 31, 2007, and primarily consists of other service income, especially advertising reimbursement amounting to T€4,169, T€3,324 and T€2,534, respectively, for the years ended March 31, 2009, March 31, 2008 and March 31, 2007, and reimbursement of collection charges amounting to T€2,157, T€205 and T€312, respectively, for the years ended March 31, 2009, March 31, 2008 and March 31, 2007. Furthermore, administrative fees charged to customers who do not pay their subscription fee by direct debit amounting to T€2,621, T€3,024 and T€3,348, respectively, for the years ended March 31, 2009, March 31, 2008 and March 31, 2007, and insurance recoveries related to damaged property, marketing subsidies and other amounting to T€1,807, T€3,502 and T€3,897 for the years ended March 31, 2009, March 31, 2008 and March 31, 2007, respectively.
F-33
Table of Contents
3.4 Selling Expenses
| | | | | | | | | | | |
| | April 1, 2008-
March 31, 2009 | | April 1, 2007-
March 31, 2008 | | April 1, 2006-
March 31, 2007 | |
|---|
| | T€
| | T€
| | T€
| |
|---|
Cost of materials and services | | | 23,093 | | | 26,080 | | | 27,139 | |
Personnel expenses | | | 84,949 | | | 71,445 | | | 70,515 | |
Depreciation and amortization | | | 169,348 | | | 115,478 | | | 95,983 | |
| | thereof intangible assets | | | 147,993 | | | 104,525 | | | 92,783 | |
| | thereof tangible assets | | | 21,355 | | | 10,953 | | | 3,200 | |
Other cost and expenses | | | 148,232 | | | 139,833 | | | 125,015 | |
| | | | | | | | |
Total Selling Expenses | | | 425,622 | | | 352,836 | | | 318,652 | |
| | | | | | | | |
Selling expenses primarily consist of costs of materials and services, personnel expenses for sales and marketing employees, depreciation and amortization expense primarily relating to the customer list and other cost and expenses including marketing and advertising expenses, sales commissions and other miscellaneous expenses.
3.5 General and Administrative Expenses
| | | | | | | | | | | |
| | April 1, 2008-
March 31, 2009 | | April 1, 2007-
March 31, 2008 | | April 1, 2006-
March 31, 2007 | |
|---|
| | T€
| | T€
| | T€
| |
|---|
Personnel expenses | | | 47,606 | | | 64,453 | | | 76,065 | |
Depreciation and amortization | | | 27,802 | | | 23,795 | | | 17,512 | |
| | thereof intangible assets | | | 22,419 | | | 19,783 | | | 13,941 | |
| | thereof tangible assets | | | 5,383 | | | 4,012 | | | 3,571 | |
Other cost and expenses | | | 54,011 | | | 40,419 | | | 47,377 | |
| | | | | | | | |
Total General and Administrative Expenses | | | 129,419 | | | 128,667 | | | 140,954 | |
| | | | | | | | |
General and administrative expenses which are related to headquarter functions primarily include personnel expenses related to headquarter personnel, depreciation and amortization for IT and standard software licenses and other cost and expenses including external consulting expense, IT-support and other miscellaneous expenses.
3.6 Personnel Expenses
Personnel expenses are comprised of the following:
| | | | | | | | | | |
| | April 1, 2008-
March 31, 2009 | | April 1, 2007-
March 31, 2008 | | April 1, 2006-
March 31, 2007 | |
|---|
| | T€
| | T€
| | T€
| |
|---|
Wages and salaries | | | 165,121 | | | 152,005 | | | 179,202 | |
Social security | | | 29,755 | | | 28,064 | | | 30,396 | |
| | | | | | | | |
| | | 194,876 | | | 180,069 | | | 209,598 | |
| | | | | | | | |
F-34
Table of Contents
Included in wages and salaries:
| | | | | | | | | | | |
| | April 1, 2008-
March 31, 2009 | | April 1, 2007-
March 31, 2008 | | April 1, 2006-
March 31, 2007 | |
|---|
| | T€
| | T€
| | T€
| |
|---|
MEP | | | 2,063 | | | 23,042 | | | 41,791 | |
| | thereof cost of services rendered | | | 120 | | | 797 | | | 295 | |
| | thereof selling expense | | | 615 | | | 1,687 | | | 2,731 | |
| | thereof general and administrative expenses | | | 1,328 | | | 20,558 | | | 38,765 | |
Restructuring | | |
24,688 | | |
2,593 | | |
14,381 | |
| | thereof cost of services rendered | | | 20,775 | | | 2,383 | | | 11,639 | |
| | thereof selling expense | | | 3,758 | | | 5 | | | 987 | |
| | thereof general and administrative expenses | | | 155 | | | 205 | | | 1,755 | |
For further information regarding restructuring plans see Section 4.13.
Included in social security:
| | | | | | | | | | | |
| | April 1, 2008-
March 31, 2009 | | April 1, 2007-
March 31, 2008 | | April 1, 2006-
March 31, 2007 | |
|---|
| | T€
| | T€
| | T€
| |
|---|
Personnel expenses related to defined benefit pension plan | | | 3,530 | | | 3,781 | | | 3,477 | |
| | thereof cost of services rendered | | | 918 | | | 1,120 | | | 1,030 | |
| | thereof selling expense | | | 1,452 | | | 1,499 | | | 1,368 | |
| | thereof general and administrative expenses | | | 1,160 | | | 1,162 | | | 1,079 | |
Statutory social security contribution | | |
21,788 | | |
19,710 | | |
20,458 | |
| | thereof cost of services rendered | | | 6,867 | | | 6,419 | | | 7,725 | |
| | thereof selling expense | | | 9,887 | | | 8,578 | | | 8,611 | |
| | thereof general and administrative expenses | | | 5,034 | | | 4,713 | | | 4,122 | |
For the fiscal years ended March 31, 2009, 2008 and 2007, social security included T€10,867, T€10,003 and T€8,420, respectively, for expenses related to the defined contribution plans from the governmental pension scheme.
During the years ended March 31, 2009, March 31, 2008 and March 31, 2007, an average of 2,807, 2,702 and 2,781, respectively, people were employed.
F-35
Table of Contents
3.7 Interest Expense and Income
Interest Expense
| | | | | | | | | | | |
| | April 1, 2008-
March 31, 2009 | | April 1, 2007-
March 31, 2008 | | April 1, 2006-
March 31, 2007 | |
|---|
| | T€
| | T€
| | T€
| |
|---|
Interest Expenses on financial instruments that are not at fair value through profit or loss | | | | | | | | | | |
| | Senior Notes | | | 78,465 | | | 78,465 | | | 78,465 | |
| | Senior Credit Facility | | | 122,748 | | | 81,645 | | | 65,670 | |
| | Amortization of Capitalized Finance Fees | | | 11,723 | | | 8,296 | | | 9,819 | |
| | Finance Lease | | | 2,437 | | | 2,873 | | | 2,675 | |
| | Other | | | 1,712 | | | 588 | | | 1,704 | |
Interest Expenses on financial instruments at fair value through profit or loss | | | 11,265 | | | (3,122 | ) | | (5,718 | ) |
Interest expense on provisions and non-financial liabilities | | | | | | | | | | |
| | Pensions | | | 1,696 | | | 1,395 | | | 1,186 | |
| | Asset Retirement Obligations | | | 1,144 | | | 999 | | | 888 | |
| | Other | | | 1,349 | | | 700 | | | 981 | |
| | | | | | | | |
Total Interest Expenses | | | 232,539 | | | 171,839 | | | 155,670 | |
| | | | | | | | |
Interest expense includes interest accrued on bank loans, the Company's 2014 Senior Notes, amortization of financing fees, interest on finance leases and other.
Interest expenses on financial instruments at fair value through profit or loss includes net interest payments to the counterparties of interest rate swaps and caps as well as effects from fair value measurement of such financial instruments.
(See the definition of all terms above in Section 4.11 and 5.5).
Interest Income
Interest income for the fiscal years ended March 31, 2009, March 31, 2008 and March 31, 2007 amounts to T€3,486, T€2,057 and T€3,563, respectively, and primarily relates to interest income on bank deposits. Of the total interest income, amounts of T€497, T€45 and T€603 relate to non-financial assets and liabilities mainly in connection with tax issues. Interest income will remain a small contributor to the Company's operating results in the future.
3.8 Income from Associates
Income from associates for the fiscal years ended March 31, 2009, March 31, 2008 and March 31, 2007 amounts to T€14,052, T€899 and T€440, respectively. For the fiscal years ended March 31, 2009, income from associates included income from the sale of Kabel Service Berlin GmbH which amounts to T€13,000.
F-36
Table of Contents
3.9 Benefit/Taxes on Income
Major components of income tax expense for the years ended March 31, 2009, March 31, 2008 and March 31, 2007 are:
| | | | | | | | | | |
| | Apr. 1, 2008-
Mar. 31, 2009 | | Apr. 1, 2007-
Mar. 31, 2008 | | Apr. 1, 2006-
Mar. 31, 2007 | |
|---|
| | T€
| | T€
| | T€
| |
|---|
Consolidated statement of operations | | | | | | | | | | |
Current income tax | | | | | | | | | | |
Current income tax charge | | | 9,275 | | | 1,985 | | | 2,907 | |
Prior year income tax charge/release | | | 2,840 | | | (1,118 | ) | | (2,138 | ) |
Deferred income tax | | | | | | | | | | |
Relating to origination and reversal of temporary differences | | | (18,267 | ) | | (104 | ) | | 26,796 | |
| | | | | | | | |
Income tax expense (+)/income (-) reported in consolidated statement of operations | | | (6,152 | ) | | 763 | | | 27,565 | |
| | | | | | | | |
| | | | | | | | | | | |
| | Apr. 1, 2008-
Mar. 31, 2009 | | Apr. 1, 2007-
Mar. 31, 2008 | | Apr. 1, 2006-
Mar. 31, 2007 | |
|---|
| | T€
| | T€
| | T€
| |
|---|
Consolidated statement of changes in equity | | | | | | | | | | |
Deferred income tax | | | | | | | | | | |
| | Net deferred income on revaluation of hedges | | | 20,818 | | | (12,446 | ) | | (13,421 | ) |
| | Net loss/profit on revaluation of financial instruments | | | (21,377 | ) | | 17,048 | | | 18,003 | |
| | | | | | | | |
Income tax benefit (-)/expense (+) reported in equity | | | (559 | ) | | 4,602 | | | 4,582 | |
| | | | | | | | |
As a result of the companies purchased in the fiscal year 2009, the combined income tax will be 30.3% in 2009. The anticipated tax rate of 30.3% (2008: 29.79% and 2007: 39.19%) is based on the corporate income tax rate of 15%, a solidarity surcharge of 5.5% on corporate income tax and a trade tax rate of 14.48%.
F-37
Table of Contents
A reconciliation of income taxes for the fiscal years ended March 31, 2009, March 31, 2008 and March 31, 2007, determined using a combined statutory rate of 30.3% for corporate and trade tax to actual income tax expense as recorded on the statement of operations, is as follows:
| | | | | | | | | | |
| | Apr. 1, 2008-
Mar. 31, 2009 | | Apr. 1, 2007-
Mar. 31, 2008 | | Apr. 1, 2006-
Mar. 31, 2007 | |
|---|
| | T€
| | T€
| | T€
| |
|---|
Loss (-) before income tax | | | (78,111 | ) | | (33,076 | ) | | (71,705 | ) |
Notional tax income at KDG's statutory income tax rate of 30.30% (2008: 29.79%; 2007: 39.19%) | | |
(23,668 |
) | |
(9,852 |
) | |
(28,101 |
) |
Adjustments in respect of current income tax of previous years | | |
2,840 | | |
1,118 | | |
(2,138 |
) |
Unrecognized tax losses | | | (9,713 | ) | | 9,958 | | | 30,679 | |
Non-deductible expenses | | | 25,532 | | | 15,722 | | | 25,940 | |
Tax-free income portions | | | (3,684 | ) | | (255 | ) | | (77 | ) |
Tax-rate changes | | | 2,129 | | | (13,461 | ) | | 0 | |
Tax-effects by minority partners | | | 246 | | | 0 | | | 0 | |
Other | | | 166 | | | (231 | ) | | 1,262 | |
| | | | | | | | |
Income tax benefit (-)/expense (+) according to the statement of operations | | | (6,152 | ) | | 763 | | | 27,565 | |
| | | | | | | | |
F-38
Table of Contents
Deferred income taxes
Deferred income taxes at March 31, 2009, March 31, 2008 and March 31, 2007 relate to the following:
| | | | | | | | | | | | | | | | | | | |
| |
| |
| |
| | Consolidated statement of operations | |
|---|
| | Consolidated balance sheet | |
|---|
| | Apr. 1, 2008-
Mar. 31, 2009 | | Apr. 1, 2007-
Mar. 31, 2008 | | Apr. 1, 2006-
Mar. 31, 2007 | |
|---|
| | 2009 | | 2008 | | 2007 | |
|---|
| | T€
| | T€
| | T€
| | T€
| | T€
| | T€
| |
|---|
Deferred income tax liabilities | | | | | | | | | | | | | | | | | | | |
Debt issuance cost | | |
20,177 | | |
18,357 | | |
24,157 | | |
1,819 | | |
(5,800 |
) | |
7,645 | |
Fair value adjustments customer list | | | 62,240 | | | 16,983 | | | 28,103 | | | (9,381 | ) | | (11,321 | ) | | (5,884 | ) |
Accelerated depreciation for tax purposes | | | 89,635 | | | 94,354 | | | 95,038 | | | (4,719 | ) | | (684 | ) | | 37,214 | |
Asset Retirement Obligation | | | 6,030 | | | 6,491 | | | 9,083 | | | (461 | ) | | (2,592 | ) | | 4,062 | |
Fair value adjustments fixed assets | | | 0 | | | 0 | | | 1,751 | | | 0 | | | (1,751 | ) | | (2,749 | ) |
Intangible assets | | | 2,584 | | | 2,323 | | | 3,149 | | | 261 | | | (826 | ) | | (576 | ) |
Financial instruments | | | 14,296 | | | 35,673 | | | 18,625 | | | 0 | | | 0 | | | 0 | |
Finance lease contracts | | | 0 | | | 0 | | | 0 | | | 0 | | | 0 | | | (88 | ) |
Revenue Recognition | | | 15,670 | | | 9,795 | | | 6,479 | | | 5,875 | | | 3,316 | | | 6,479 | |
Other | | | 73 | | | 71 | | | 88 | | | 2 | | | (17 | ) | | 88 | |
| | | | | | | | | | | | | | | | | |
Gross deferred income tax | | | | | | | | | | | | | | | | | | | |
liabilities | | | 210,705 | | | 184,047 | | | 186,473 | | | | | | | | | | |
| | | | | | | | | | | | | | | | | |
Offsetting with deferred tax assets | | | (91,849 | ) | | (96,517 | ) | | (103,814 | ) | | | | | | | | | |
| | | | | | | | | | | | | | | | | |
Net deferred income tax liability | | | 118,856 | | | 87,530 | | | 82,659 | | | | | | | | | | |
| | | | | | | | | | | | | | | | | |
Deferred income tax | | | | | | | | | | | | | | | | | | | |
Tangible assets | | |
341 | | |
571 | | |
0 | | |
230 | | |
(571 |
) | |
0 | |
Hedges | | | 17,188 | | | 33,839 | | | 20,559 | | | (4,168 | ) | | (834 | ) | | 3,360 | |
Receivables | | | 7,233 | | | 9,988 | | | 17,027 | | | 2,755 | | | 7,039 | | | (4,862 | ) |
Other accruals | | | 7,191 | | | 1,526 | | | 65 | | | (1,420 | ) | | (1,461 | ) | | 1,370 | |
Pension | | | 1,793 | | | 1,372 | | | 1,191 | | | (421 | ) | | (181 | ) | | (443 | ) |
Finance Lease contracts | | | 1,199 | | | 1,170 | | | 1,319 | | | (29 | ) | | 149 | | | (239 | ) |
Tax loss carryforwards | | | 57,197 | | | 48,588 | | | 64,018 | | | (8,610 | ) | | 15,430 | | | (18,580 | ) |
| | | | | | | | | | | | | | | | | |
Gross deferred income tax assets | | | 92,142 | | | 97,054 | | | 104,179 | | | | | | | | | | |
| | | | | | | | | | | | | | | | | |
Offsetting with deferred tax liabilities | | | (91,849 | ) | | (96,517 | ) | | (103,814 | ) | | | | | | | | | |
| | | | | | | | | | | | | | | | | |
Net deferred income tax asset | | | 293 | | | 537 | | | 365 | | | | | | | | | | |
| | | | | | | | | | | | | | |
Deferred income tax charge | | | | | | | | | | | | (18,267 | ) | | (104 | ) | | 26,797 | |
| | | | | | | | | | | | | | | | | |
For the years ended March 31, 2009, March 31, 2008 and March 31, 2007, deferred tax assets on corporate income tax loss carry forwards of KDG in the amount of T€298,318 T€268,229 and T€219,621, respectively and trade tax loss carry forwards of KDG in the amount of T€ 5,797, T€43,987 and T€47,550, respectively were recognized. In accordance with IAS 12, the Company has assessed that
F-39
Table of Contents
the deferred tax assets for these tax loss carry forwards are probable to be realized under consideration of the German minimum taxation rules. Furthermore, interest carry forwards of KDG in the amount of T€34,289, T€0 and T€0 were recognized under the new German interest barrier rules. The tax loss carry forwards do not expire under current law.
Deferred tax assets on further corporate income tax loss carry forwards of KDG in an amount of approximately T€230,915, T€280,000 and T€250,000, respectively for the years ended March 31, 2009, March 31, 2008 and March 31, 2007 and trade tax loss carry forwards in the amount of approximately T€194,028, T€226,000 and T€176,000 as well as interest carry forwards under the new German interest barrier rules in the amount of T€48,641, T€0 and T€0, respectively, have not been recognized due to uncertain recoverability.
Liabilities due to Income Taxes
The liabilities due to income taxes of T€23,127, T€12,961 and T€14,157, respectively for the years ended March 31, 2009, March 31, 2008 and March 31, 2007 in the balance sheet relate to corporate and trade tax.
4. Notes to the Balance Sheet
4.1 Cash and Cash Equivalents
| | | | | | | | | | |
| | Mar. 31, 2009 | | Mar. 31, 2008 | | Mar. 31, 2007 | |
|---|
| | T€
| | T€
| | T€
| |
|---|
Cash at banks | | | 51,883 | | | 15,435 | | | 54,079 | |
Cash in hand | | | 39 | | | 28 | | | 29 | |
| | | | | | | | |
| | | 51,922 | | | 15,463 | | | 54,108 | |
| | | | | | | | |
Cash and cash equivalents are primarily comprised of cash in hand and cash at banks.
4.2 Receivables
| | | | | | | | | | |
| | Mar. 31, 2009 | | Mar. 31, 2008 | | Mar. 31, 2007 | |
|---|
| | T€
| | T€
| | T€
| |
|---|
Gross Trade receivables | | | 159,824 | | | 215,206 | | | 160,683 | |
Bad debt allowance | | | (53,245 | ) | | (84,328 | ) | | (59,313 | ) |
| | | | | | | | |
Trade Receivables | | | 106,579 | | | 130,878 | | | 101,370 | |
| | | | | | | | |
| | | | | | | | | | | | | |
| | Balance at
Beginning of
Period | | Provision for
Bad Debt | | Deduction/
Write-Offs
and other
Charges | | Balance at
End of Period | |
|---|
| | T€
| | T€
| | T€
| | T€
| |
|---|
Fiscal Year ended March 31, 2009 Allowance for doubtful accounts | | | (84,328 | ) | | (18,899 | ) | | 49,982 | | | (53,245 | ) |
| | | | | | | | | | |
Fiscal Year ended March 31, 2008 Allowance for doubtful accounts | | | (59,313 | ) | | (39,324 | ) | | 14,309 | | | (84,328 | ) |
| | | | | | | | | | |
Fiscal Year ended March 31, 2007 Allowance for doubtful accounts | | | (39,831 | ) | | (25,014 | ) | | 5,532 | | | (59,313 | ) |
| | | | | | | | | | |
F-40
Table of Contents
As of March 31, the analyses of trade receivables that were past due but not impaired were as follows:
| | | | | | | | | | | | | | | | | | | | | | |
| |
| | Net Carrying amount past due but not impaired
at the reporting date | |
| |
|---|
in T€ | | Not
past due | | less than
30 days | | 31–60 days | | 61–90 days | | more than
90 days | | Total
past due | | Total | |
|---|
March 31, 2009 | | | 44,390 | | | 27,259 | | | 9,820 | | | 9,625 | | | 15,485 | | | 62,189 | | | 106,579 | |
March 31, 2008 | | | 48,220 | | | 47,173 | | | 8,033 | | | 5,444 | | | 22,008 | | | 82,658 | | | 130,878 | |
March 31, 2007 | | | 34,420 | | | 28,398 | | | 19,556 | | | 12,326 | | | 6,670 | | | 66,950 | | | 101,370 | |
The latest experience regarding the collectability of past due receivables has shown that the collection rate of receivables of more than 180 days past due has improved from nearly 0% to 20%. Therefore, the Company has revised the provision for allowance for such receivables from 100% down to 80%. The effect of this revision is a decrease of bad debt allowance by T€3,067 from T€56,312 to T€53,245 as of March 31, 2009.
Receivables with an invoice amount of T€31,830, T€50,739 and T€14,974 excluding VAT at March 31, 2009, March 31, 2008 and March 31, 2007, respectively, were individually determined to be impaired and were written off by 100%.
Accounts receivable past due but not impaired are expected to ultimately be collected.
Also no indications of defaults are recognizable for accounts receivable that are neither past due nor impaired.
Receivables of Kabel Deutschland Vertrieb und Service GmbH & Co. KG in the amount of T€106,579 were pledged as security in accordance with the Senior Credit Facility Agreement (see 4.11 Financial Liabilities) as of March 31, 2009.
4.3 Inventories
| | | | | | | | | | | |
| | March 31,
2009 | | March 31,
2008 | | March 31,
2007 | |
|---|
| | T€
| | T€
| | T€
| |
|---|
Raw materials, consumables and supplies | | | 4,590 | | | 6,138 | | | 2,949 | |
Work in process | | | 790 | | | 74 | | | 0 | |
Finished goods and merchandise | | | 10,549 | | | 19,989 | | | 21,316 | |
| | thereof carried at net realizable value | | | 430 | | | 1,293 | | | 1,723 | |
| | | | | | | | |
| | | 15,929 | | | 26,201 | | | 24,265 | |
| | | | | | | | |
The total amount of inventories recognized as an expense amounts to T€8,808, T€20,580 and T€26,020 for the years ended March 31, 2009, March 31, 2008 and March 31, 2007, respectively. Inventories in an amount of T€6,683, T€7,238 and T€6,373 were pledged in accordance with the Senior Credit Facility Agreement (see 4.11 Financial Liabilities) at March 31, 2009, March 31, 2008 and March 31, 2007, respectively.
4.4 Receivables from Tax Authorities
Receivables from tax authorities relate to corporate income tax, trade tax and solidarity tax contributions and amounted to T€5,200, T€6,881 and T€6,266 as of March 31, 2009, March 31, 2008 and March 31, 2007, respectively.
F-41
Table of Contents
4.5 Other Current Financial Assets and Prepaid Expenses
| | | | | | | | | | | |
| | March 31,
2009 | | March 31,
2008 | | March 31,
2007 | |
|---|
| | T€
| | T€
| | T€
| |
|---|
Receivables from purchase price reimbursement | | | 11,093 | | | 0 | | | 0 | |
Receivables from counterparties currency hedges | | | 9,799 | | | 0 | | | 0 | |
Payments in advance for commission fees | | | 2,585 | | | 315 | | | 0 | |
Deposits | | | 2,406 | | | 2,422 | | | 1,691 | |
Creditors with debit balances | | | 1,645 | | | 1,653 | | | 1,768 | |
Miscellaneous other receivables | | | 8,933 | | | 2,882 | | | 5,312 | |
| | | | | | | | |
Other current assets | | | 36,461 | | | 7,272 | | | 8,771 | |
| | | | | | | | |
Current prepaid expenses | | | | | | | | | | |
| | Deferred costs for equipment located at customer locations | | | 1,567 | | | 6,571 | | | 9,916 | |
| | Insurance | | | 839 | | | 1,780 | | | 2,937 | |
| | Other | | | 10,680 | | | 11,552 | | | 7,846 | |
| | | | | | | | |
Prepaid expenses | | | 13,086 | | | 19,903 | | | 20,699 | |
| | | | | | | | |
In the fiscal year ended March 31, 2009 an amount of T€9,799 was recorded for the Company's new currency hedge agreement and T€11,093 for a reimbursement of the preliminary purchase price relating to the Acquisition. Miscellaneous other receivables for the fiscal year ended March 31, 2009 are comprised of several other minor amounts.
As of March 31, 2009, other current prepaid expenses primarily consisted of prepaid cost for transaction cost, interest, fees and contributions, broadband fees and prepaid expenses for maintenance.
4.6 Intangible Assets
Software and Licenses and other Contractual and Legal Rights
Software and licenses primarily consist of software licenses for standard business software and costs related to the customer care and billing system. The software is being amortized on a straight-line basis over three to six years through October 2010.
Beginning April 1, 2006, the Company modified the conditions related to the minimum duration of customer contracts. Due to this modification, the Company began to capitalize the related sales commissions of its sales agents and the costs of call center representatives based on future contractual revenue streams. The amortization period of these amounts is 8.5 years for cable access contracts, which is based on the estimated average life of an access customer relationship, and 12 or 24 months for digital pay-TV and Internet & Phone contracts which is based on the fixed term period of those customer contracts. Amortization is calculated based on the straight-line method. For the fiscal years ended March 31, 2009, March 31, 2008 and March 31, 2007, sales commissions in an amount of T€47,659, of T€28,091 and T€17,384, respectively, were capitalized in software and licenses and other contractual and legal rights. The amortization of sales commissions was T€32,562, T€13,507 and T€4,806 for the fiscal years ended March 31, 2009, March 31, 2008 and March 31, 2007, respectively.
Internally Developed Software
For the years ended March 31, 2009, March 31, 2008 and March 31, 2007 approximately T€3,871, T€2,528 and T€1,048, respectively, of costs for internally developed software were capitalized. Included in costs for internally developed software for the fiscal year ended March 31, 2009, are T€2,008 for closed projects and T€1,863 for running projects which are accounted for as prepayments for internally
F-42
Table of Contents
developed software. These amounts relate to costs incurred in the further development of company-specific software applications, particularly for its billing system, Delphi and digital pay-TV. The software of the billing system is being amortized over a period of 6 years, the software of Delphi and digital pay-TV are being amortized over a period of 4 years. The remaining useful life of all internally developed software is between 0.5–4.7 years.
Customer List
For the years ended March 31, 2009, March 31, 2008 and March 31, 2007 the Company recorded additions in the customer list of T€226,706, T€20,936 and T€5,713, respectively. The addition for the years ended March 31, 2009 comprises T€226,847 of customer list relating to the Acquisition as well as T€-141 relating to retroactive purchase price reimbursement for the customer list of leto GmbH and RKS Sued-West GmbH which were acquired in fiscal year 2008. The remaining useful life of the customer list is between 2.5–8.5 years.
For further information relating to intangible assets, reference is made to the fixed asset register in Appendix 1, Appendix 2 and Appendix 3.
4.7 Property and Equipment
Asset Retirement Obligation
In many cases KDG leases space in the cable ducts of DTAG to house KDG's cable network. Related to these leases, KDG is subject to contractual asset retirement obligations. The costs were estimated at T€17,477 and were capitalized as of April 1, 2003. Further additions related to new asset retirement obligations in an amount of T€1,254, T€723 and T€933 were recognized for the years ended March 31, 2009, March 31, 2008 and March 31, 2007, respectively. Depreciation is charged over the normal useful life of the respective assets which resulted in a depreciation expense of T€1,340, T€1,398 and T€1,509 for the years ended March 31, 2009, March 31, 2008 and March 31, 2007, respectively.
Operating Lease for CPE
To get connection to Internet and phone services as well as to receive digital pay-TV, the Company leases the necessary equipment to the customers. These leases, for which the Company is the lessor, are classified as operating leases. Therefore, the Company capitalizes the CPE as fixed assets based on acquisition cost and the cost of removing the asset at the end of the lease. Over the useful life of 3 years for modems and receivers and 5 years for smartcards, respectively, the assets are depreciated using the straight-line method. In the Fixed Asset Schedule CPE is presented as part of technical equipment. For the fiscal years ended March 31, 2009, March 31, 2008 and March 31, 2007, the net book value of total CPE (including modems, receiver and smartcards) amounted to T€79,202, T€54,040 and T€17,578, respectively.
The future minimum lease payments under non-cancellable operating leases for CPE will amount to T€12,522 within one year, T€12 after one year but not more than five years and T€0 after five years. Total contingent rents recognized as income amounted T€47,281, T€20,285 and T€4,006 for the fiscal years ended March 31, 2009, March 31, 2008 and March 31, 2007, respectively.
Finance Lease
As of March 31, 2009, the Company leased certain transponders under finance leases through 2012. As of March 31, 2009, March 31, 2008 and March 31, 2007, the net book value of the capitalized transponders totaled T€24,878, T€33,136 and T€38,449, respectively. During the fiscal years ended March 31, 2009, March 31, 2008 and March 31, 2007, KDG recorded depreciation expense of T€8,259, T€7,759 and T€5,664, respectively. The Company also recorded interest expense related to these
F-43
Table of Contents
finance leases of T€2,437, T€2,853 and T€2,504 for the fiscal years ended March 31, 2009, 2008 and 2007, and paid T€8,228, T€7,197 and T€5,145, to reduce the financial liability, respectively.
There is an option to extend the contract duration related to the lease of certain transponders by another five year period by mutual agreement of the parties, which must be reached at least six months before the expiry of the first five year period.
Future minimum lease payments under finance leases together with the present value of the net minimum lease payments are as follows:
| | | | | | | | | | | | | | | | | | | |
| | 2009 | | 2008 | | 2007 | |
|---|
| | Minimum
payments | | Present
value of
payments | | Minimum
payments | | Present
value of
payments | | Minimum
payments | | Present
value of
payments | |
|---|
| | T€
| | T€
| | T€
| | T€
| | T€
| | T€
| |
|---|
Within one year | | | 10,665 | | | 8,858 | | | 10,645 | | | 8,228 | | | 10,008 | | | 7,184 | |
After one year but not more than five years | | | 21,517 | | | 19,978 | | | 32,113 | | | 28,836 | | | 39,481 | | | 34,141 | |
After five years | | | 0 | | | 0 | | | 0 | | | 0 | | | 536 | | | 534 | |
| | | | | | | | | | | | | | |
Total minimum lease payments | | | 32,182 | | | 28,836 | | | 42,758 | | | 37,064 | | | 50,025 | | | 41,859 | |
| | | | | | | | | | | | | | |
Less amounts representing finance charges | | | 3,346 | | | | | | 5,694 | | | | | | 8,166 | | | | |
| | | | | | | | | | | | | | | | | |
Present value of minimum lease payments | | | 28,836 | | | | | | 37,064 | | | | | | 41,859 | | | | |
| | | | | | | | | | | | | | | | | |
For further information relating to property and equipment, reference is made to the fixed asset registers in Appendix 1, Appendix 2 and Appendix 3.
4.8 Equity Investments in Associates
The carrying value of equity investments in associates is increased by the Company's share of income and reduced by dividends received. The formally associated companies Kabelcom Braunschweig Gesellschaft fuer Breitbandkabel-Kommunikation mbH, Kabelcom Wolfsburg Gesellschaft fuer Breitbandkabel-Kommunikation mbH, RKS Niedersaechsische Kabel-Servicegesellschaft mbH & Co. KG and RKS Niedersaechsische Kabel-Service-Beteiligungsgesellschaft mbH were accounted for using the equity method until the acquisition date and have been fully consolidated beginning with May 1, 2008. Net additions from associates amounted to T€1,052, T€672 and T€120 for the years ended March 31, 2009, March 31, 2008 and March 31, 2007, respectively, and reflect KDG's share of income recorded by associates in the amount of T€1,052, T€899 and T€440, and the receipt of dividends in the amount of T€227 and T€320 for the years ended March 31, 2008 and March 31, 2007. The fiscal year of all associates is the period from January 1 to December 31.
| | | | | | | | | | |
Associates' accumulated balance sheets | | Dec. 31,
2008 | | Dec. 31,
2007 | | Dec. 31,
2006 | |
|---|
| | T€
| | T€
| | T€
| |
|---|
Assets | | | 68,734 | | | 113,635 | | | 103,230 | |
Liabilities | | | 53,106 | | | 94,505 | | | 86,846 | |
| | | | | | | | | | |
Associates' accumulated revenue and profit | | Jan. 1-
Dec. 31,
2008 | | Jan. 1-
Dec. 31,
2007 | | Jan. 1-
Dec. 31,
2006 | |
|---|
| | T€
| | T€
| | T€
| |
|---|
Revenue | | | 42,007 | | | 78,852 | | | 71,203 | |
Profit | | | 3,030 | | | 1,442 | | | 737 | |
For further information relating to financial assets, reference is made to the fixed asset register in Appendix 1, Appendix 2 and Appendix 3.
F-44
Table of Contents
4.9 Other Current Liabilities
| | | | | | | | | | |
| | March 31,
2009 | | March 31,
2008 | | March 31,
2007 | |
|---|
| | T€
| | T€
| | T€
| |
|---|
Liabilities for personnel expenses | | | 37,497 | | | 32,090 | | | 28,627 | |
Liabilities for silent partnerships | | | 12,653 | | | 0 | | | 0 | |
Finance leases | | | 8,858 | | | 8,228 | | | 7,184 | |
Value added and employment taxes | | | 7,693 | | | 10,116 | | | 7,742 | |
Provision for onerous contracts | | | 3,300 | | | 0 | | | 0 | |
Debtors with credit balances | | | 1,148 | | | 818 | | | 7,882 | |
Miscellaneous other Liabilities | | | 16,017 | | | 8,388 | | | 8,964 | |
| | | | | | | | |
| | | 87,166 | | | 59,640 | | | 60,399 | |
| | | | | | | | |
In the fiscal year ended March 31, 2009 T€12,653 results from the Company's silent partnerships acquired in the Acquisition and T€3,300 from provisions for onerous contracts.
4.10 Deferred Income
Deferred income primarily consists of customer prepayments on a quarterly, semi-annual or annual basis.
4.11 Financial Liabilities (current and non-current) and Senior Notes
4.11.1 Current Financial liabilities
| | | | | | | | | | | | |
| | March 31,
2009 | | March 31,
2008 | | March 31,
2007 | |
|---|
| | T€
| | T€
| | T€
| |
|---|
Accrued interest related to | | | | | | | | | | |
| | Senior Credit Facility | | | | | | | | | | |
| | | Tranche A | | | 960 | | | 6,192 | | | 17,335 | |
| | | Tranche B | | | 147 | | | 119 | | | 0 | |
| | | Tranche C | | | 18,799 | | | 1,264 | | | 0 | |
| | Senior Notes | | | 19,616 | | | 16,966 | | | 18,885 | |
| | Other | | | 0 | | | 1,133 | | | 777 | |
| | | | | | | | |
Current financial liabilities | | | 39,522 | | | 25,674 | | | 36,997 | |
| | | | | | | | |
4.11.2 Senior Notes
| | | | | | | | | | |
| | March 31,
2009 | | March 31,
2008 | | March 31,
2007 | |
|---|
| | T€
| | T€
| | T€
| |
|---|
Notes issued | | | 755,553 | | | 755,553 | | | 755,553 | |
Financing and transaction cost | | | (42,587 | ) | | (42,587 | ) | | (42,587 | ) |
Accretion | | | 14,346 | | | 10,644 | | | 7,342 | |
Foreign exchange rate effect | | | (47,182 | ) | | (119,770 | ) | | (47,526 | ) |
| | | | | | | | |
| | | 680,130 | | | 603,840 | | | 672,782 | |
| | | | | | | | |
On July 2, 2004, KDG GmbH issued T€250,000 of 10.75% Senior Notes (Euro Notes) due in 2014 and TUS$610,000 of 10.625% Senior Notes (US$ Notes) due in 2014 (together 2014 Senior Notes). The Dollar denominated Senior Notes were swapped into Euros using a currency swap.
F-45
Table of Contents
Interest on the 2014 Senior Notes is payable every six months on January 1 and July 1. The principle becomes due and payable on July 1, 2014. The 2014 Senior Notes contain several financial covenants limiting, among other things, our ability to:
- •
- incur additional indebtedness;
- •
- pay dividends or make other distributions;
- •
- make certain other restricted payments and investments;
- •
- create liens;
- •
- impose restrictions on the ability of our subsidiaries to pay dividends or make other payments to us;
- •
- transfer or sell assets;
- •
- merge or consolidate with other entities; and
- •
- enter into transactions with affiliates.
Each of the covenants is subject to a number of important exceptions and qualifications. See "Description of the Notes—Certain Covenants." in the Registration Statement.
The 2014 Senior Notes are subject to several affirmative and negative covenants which are less restrictive than under the Senior Credit Facility.
At any time prior to July 1, 2009, KDG GmbH may redeem all or part of the 2014 Senior Notes by paying a "make whole premium" which is the sum of:
- i)
- the present value of the redemption price of such Euro or US$ Note at July 1, 2009 (i.e. 105.375% for the Euro Note and 105.313% for the US$ Note)
- ii)
- the present value of all required interest payments due on such Notes to and including July 1, 2009 using a discount rate for the Euro Notes equal to the Bund Rate (as defined in the 2014 Senior Notes agreement) and for the US$ Notes equal to the US Treasury Rate (as defined in the 2014 Senior Notes agreement) at such redemption date, plus 50 basis points.
At any time after July 1, 2009, the following redemption prices apply beginning on the day after July 1 in each of the following years:
| | | | | | | |
| | Redemption Price | |
|---|
| | Euro Notes | | US$ Notes | |
|---|
2009 | | | 105.375 | % | | 105.313 | % |
2010 | | | 103.583 | % | | 103.542 | % |
2011 | | | 101.792 | % | | 101.771 | % |
2012 and thereafter | | | 100.000 | % | | 100.000 | % |
F-46
Table of Contents
4.11.3 Non-Current Financial liabilities
| | | | | | | | | | |
| | March 31,
2009 | | March 31,
2008 | | March 31,
2007 | |
|---|
| | T€
| | T€
| | T€
| |
|---|
Senior Credit Facility Tranche A | | | 1,150,000 | | | 1,150,000 | | | 1,150,000 | |
Senior Credit Facility Tranche B | | | 0 | | | 60,000 | | | 0 | |
Senior Credit Facility Tranche C | | | 535,000 | | | 0 | | | 0 | |
| | | | | | | | |
Senior Credit Facility | | | 1,685,000 | | | 1,210,000 | | | 1,150,000 | |
Financing and transaction costs, Tranche A | | | (32,872 | ) | | (25,932 | ) | | (25,932 | ) |
Accretion of Tranche A | | | 11,739 | | | 7,336 | | | 3,368 | |
Financing and transaction costs, Tranche C | | | (16,135 | ) | | 0 | | | 0 | |
Accretion of Tranche C | | | 2,519 | | | 0 | | | 0 | |
Swaps/Cap | | | 66,823 | | | 120,585 | | | 58,606 | |
| | | | | | | | |
Non-current financial liabilities | | | 1,717,074 | | | 1,311,989 | | | 1,186,042 | |
| | | | | | | | |
On May 12, 2006, Kabel Deutschland Vertrieb und Service GmbH & Co. KG (KDVS) entered into a Senior Credit Facility. This agreement was comprised of two facilities, a T€1,150,000 term loan facility (Tranche A) and a T€200,000 revolving credit facility (Tranche B). Tranche A and Tranche B mature on March 31, 2012 (together the "Senior Credit Facility"). On July 19, 2007 the Company amended its Senior Credit Facility and increased Tranche B to T€325,000 under the same terms and conditions as the original Tranche B. The Senior Credit Facility is secured by all the assets of KDVS and a first pledge on 100% of the shares of KDVS owned by Kabel Deutschland GmbH under its guarantee. The carrying amount of KDVS' shares in KDG's financials is T€3,598,100. Since the closing date, Tranche A (T€1,150,000) has been fully drawn.
Tranche B may be borrowed, repaid and reborrowed up until one month prior to the final maturity date. Borrowings under Tranche B may be used for general corporate purposes. As of March 31, 2009, no amounts were outstanding under Tranche B.
The financing and transaction costs related to Tranche B are shown under non-current assets (prepaid expenses) in the amount of T€2,484 and under current prepaid expenses in the amount of T€1,116.
On October 22, 2007 KDVS signed a T€650,000 Senior Add-on Facility or Tranche C, which ranks pari passu with the existing Senior Credit Facility. As of May 9, 2008 the Tranche C commitment was reduced by T€115,000 to T€535,000. Tranche C was drawn down on May 9, 2008 and remains fully drawn. Tranche C matures in March 2013.
Interest rates on the Senior Credit Facility are based on one, two, three or six months EURIBOR plus a margin.
The margin on Tranche A and B of the Senior Credit Facility is based on the ratio of consolidated senior net borrowings to consolidated EBITDA (as defined in the Senior Credit Facility agreement) as follows:
| | | | |
Ratio of Consolidated Total Net Borrowings to Consolidated EBITDA | | Margin
(percentage
per annum) | |
|---|
Greater than 4:1 | | | 2.00 | |
Less than or equal to 4:1, but greater than 3.5:1 | | | 1.875 | |
Less than or equal to 3.5:1 | | | 1.75 | |
F-47
Table of Contents
As of March 31, 2009 the ratio of Consolidated Senior Net Borrowings to Consolidated EBITDA amounted to 2.76:1. Therefore, the applicable margin was EURIBOR + 175bps as of March 31, 2009. KDG pays an annual commitment fee of 0.625% on the undrawn commitment under Tranche B. Tranche C carries a coupon of EURIBOR + 325bps.
The Senior Credit Facility is subject to several affirmative and negative covenants including, but not limited to, the following:
| | |
Test | | Requirement as of March 31, 2009 |
|---|
• EBITDA to Net Interest | | Greater than 2.00 x |
• Senior Net Debt to EBITDA | | Less than 3.50 x |
�� As of March 31, 2009 the ratio of EBITDA to Net Interest amounted to 2.77. The ratio of Senior Net Debt to EBITDA amounted to 2.76.
On February 11, 2009 KDG approached the lenders of its Senior Credit Facilities via its facility agent, the Royal Bank of Scotland, with a request to agree to certain minor amendments to the Company's Senior Credit Facilities. KDG proposed to change the senior net debt to EBITDA covenant for the quarters starting from December 2010 to December 2011 as well as to extend senior net debt to EBITDA and EBITDA to net interest covenants beyond March 2012 until maturity of Term Loan C in March 2013. On February 25, 2009, the deadline ended for the amendment. As a result approximately 92% were consenting to the request.
The Company's ability to meet these financial ratios and tests may be affected by events beyond its control and, as a result, the Company cannot be sure to meet these ratios and tests in the future. In the event of a default under the Senior Credit Facilities the lenders could terminate their commitments and declare all amounts owed to them to be due and payable.
Mandatory prepayments are required in case of (i) a change of control, public flotation or sale of the business, (ii) certain third party receipts and (iii) the sale of shares on the public market (if consolidated total senior net borrowings to consolidated EBITDA is greater than or equal to 2:1).
At March 31, 2009, T€1,150,000 was outstanding under Tranche A at an interest rate of approximately 2.898% and T€535,000 was outstanding under Tranche C at an interest rate of approximately 8.214%. The Company entered into interest rate caps and swaps that mature in June 2009 in order to mitigate the exposure to interest rate risks, although these are not accounted for as hedges.
4.12 Provisions for Pension
The following tables summarize the components of net benefit expense recognized in the statement of operations and the funded status and amounts recognized in the balance sheet for the respective plans:
Net benefit expenses recognized in the consolidated statement of operations
| | | | | | | | | | |
| | Apr. 1, 2008-
Mar. 31, 2009 | | Apr. 1, 2007-
Mar. 31, 2008 | | Apr. 1, 2006-
Mar. 31, 2007 | |
|---|
| | T€
| | T€
| | T€
| |
|---|
Current service cost | | | 3,530 | | | 3,637 | | | 3,302 | |
Interest expense | | | 1,696 | | | 1,395 | | | 1,186 | |
Net actuarial losses | | | 0 | | | 144 | | | 273 | |
Plan disbursements | | | 0 | | | 0 | | | (98 | ) |
| | | | | | | | |
Net benefit expense | | | 5,226 | | | 5,176 | | | 4,663 | |
| | | | | | | | |
F-48
Table of Contents
The expenses arising from the accrual of interest on pension obligations are recorded in interest expense.
The recognized expense is recorded in the following items in the statement of operations:
| | | | | | | | | | |
| | Apr. 1, 2008-
Mar. 31, 2009 | | Apr. 1, 2007-
Mar. 31, 2008 | | Apr. 1, 2006-
Mar. 31, 2007 | |
|---|
| | T€
| | T€
| | T€
| |
|---|
Cost of services rendered | | | 918 | | | 1,120 | | | 1,030 | |
Selling expenses | | | 1,452 | | | 1,499 | | | 1,368 | |
General and administrative expenses | | | 1,160 | | | 1,162 | | | 1,079 | |
Interest expense | | | 1,696 | | | 1,395 | | | 1,186 | |
| | | | | | | | |
| | | 5,226 | | | 5,176 | | | 4,663 | |
| | | | | | | | |
Benefit Liability
| | | | | | | | | | |
| | Mar. 31,
2009 | | Mar. 31,
2008 | | Mar. 31,
2007 | |
|---|
| | T€
| | T€
| | T€
| |
|---|
Defined benefit obligation | | | 32,257 | | | 29,119 | | | 29,149 | |
Unrecognized actuarial gains (losses) | | | 3,052 | | | 29 | | | (4,978 | ) |
| | | | | | | | |
Benefit liability | | | 35,309 | | | 29,148 | | | 24,171 | |
| | | | | | | | |
The Company has several defined benefit pension plans for different groups of employees (collective agreement (CA) employees, non-collective agreement (NCA) employees and other). The majority of the plans are average salary plans, which are in accordance with regulations applicable for public servants. These plans were continued with substantially the same terms upon the purchase of the business from DTAG. The plans for other employees represent individual commitments.
The annual contributions for CA and NCA employees amount to 2.5% of their contractually agreed annual fixed salaries. The annual contributions for NCA employees increase by 9% for salaries lying above the income threshold for contributions to the statutory pension scheme. Each contribution is translated into an insured sum.
The insured sum is calculated by multiplying the contribution by the respective age factor of the employee and is credited to a pension account. From the age of 61 to the onset of retirement, each employee receives an additional annual bonus sum amounting to 6% of the most recent pension account balance. The contribution rates for individual pension commitments are determined on an individual basis.
Changes in the present value of the defined benefit obligation are as follows:
| | | | | | | | | | |
| | Apr. 1, 2008-
Mar. 31, 2009 | | Apr. 1, 2007-
Mar. 31, 2008 | | Apr. 1, 2006-
Mar. 31, 2007 | |
|---|
| | T€
| | T€
| | T€
| |
|---|
Defined Benefit Obligation at April 1 | | | 29,119 | | | 29,149 | | | 26,385 | |
Current Service Cost | | | 3,530 | | | 3,637 | | | 3,302 | |
Interest Cost | | | 1,696 | | | 1,395 | | | 1,186 | |
Actual Benefit Payments | | | (131 | ) | | (199 | ) | | (72 | ) |
Acquisition/Business Combination | | | 1,066 | | | 0 | | | (316 | ) |
Actuarial (Gains)/Losses | | | (3,023 | ) | | (4,863 | ) | | (1,336 | ) |
| | | | | | | | |
Defined Benefit Obligation at March 31 | | | 32,257 | | | 29,119 | | | 29,149 | |
| | | | | | | | |
F-49
Table of Contents
The principal assumptions used in determining pension benefit obligations for the Company plans are shown below:
Underlying actuarial assumptions
| | | | | | | | | | |
| | Apr. 1, 2008-
Mar. 31, 2009 | | Apr. 1, 2007-
Mar. 31, 2008 | | Apr. 1, 2006-
Mar. 31, 2007 | |
|---|
| | %
| | %
| | %
| |
|---|
Discount rate as of March 31 | | | 6.00 | | | 5.65 | | | 4.80 | |
Future salary increases | | | 3.25 | | | 3.25 | | | 2.75 | |
Future pension increases | | | 1.00–1.50 | | | 1.00–1.50 | | | 1.00–1.50 | |
Staff turnover | | | 4.50 | | | 4.50 | | | 5.00 | |
Amounts for the current and the previous four periods are as follows:
| | | | | | | | | | | | | | | | |
| | Mar. 31,
2009 | | Mar. 31,
2008 | | Mar. 31,
2007 | | Mar. 31,
2006 | | Mar. 31,
2005 | |
|---|
| | T€
| | T€
| | T€
| | T€
| | T€
| |
|---|
Defined benefit obligation | | | 32,257 | | | 29,119 | | | 29,149 | | | 26,385 | | | 19,441 | |
Plan assets | | | 0 | | | 0 | | | 0 | | | 0 | | | 0 | |
Deficit | | | 32,257 | | | 29,119 | | | 29,149 | | | 26,385 | | | 19,441 | |
Experience adjustments on plan liabilities | | | (1,366 | ) | | (626 | ) | | 210 | | | 0 | | | 0 | |
4.13 Other Provisions (current and non-current)
| | | | | | | | | | | | | | | | | | | |
| | Balance
as of
April 1,
2008 | | Utilization | | Reversal | | Addition | | Interest | | Balance
as of
March 31,
2009 | |
|---|
| | T€
| | T€
| | T€
| | T€
| | T€
| | T€
| |
|---|
Anniversary payments | | | 184 | | | (35 | ) | | 0 | | | 30 | | | 0 | | | 179 | |
Asset retirement obligations | | | 22,086 | | | (92 | ) | | 0 | | | 2,677 | | | 1,144 | | | 25,815 | |
Restructuring | | | 2,164 | | | (1,364 | ) | | (151 | ) | | 25,924 | | | 0 | | | 26,573 | |
Legal fees and litigation costs | | | 1,901 | | | 0 | | | (1,870 | ) | | 162 | | | 0 | | | 193 | |
Other | | | 2,428 | | | (76 | ) | | (942 | ) | | 12,266 | | | 0 | | | 13,676 | |
| | | | | | | | | | | | | | |
Total provisions | | | 28,763 | | | (1,567 | ) | | (2,963 | ) | | 41,059 | | | 1,144 | | | 66,436 | |
| | | | | | | | | | | | | | |
Other provisions can be segregated into current obligations (T€40,442) and non-current obligations (T€25,994).
Additions to the restructuring provisions for the new programs announced by the company in the current fiscal year are shown as adjusted by utilization or reversal within the same year.
| | | | | | | | | | | | | | | | | | | |
| | Balance
as of April 1,
2007 | | Utilization | | Reversal | | Addition | | Interest | | Balance
as of
March 31,
2008 | |
|---|
| | T€
| | T€
| | T€
| | T€
| | T€
| | T€
| |
|---|
Anniversary payments | | | 226 | | | (57 | ) | | 0 | | | 15 | | | 0 | | | 184 | |
Asset retirement obligations | | | 21,020 | | | (330 | ) | | (32 | ) | | 1,686 | | | (258 | ) | | 22,086 | |
Restructuring | | | 14,636 | | | (12,293 | ) | | (1,465 | ) | | 1,286 | | | 0 | | | 2,164 | |
Legal fees and litigation costs | | | 1,750 | | | 0 | | | 0 | | | 151 | | | 0 | | | 1,901 | |
Other | | | 1,721 | | | (727 | ) | | (52 | ) | | 1,486 | | | 0 | | | 2,428 | |
| | | | | | | | | | | | | | |
Total provisions | | | 39,353 | | | (13,407 | ) | | (1,549 | ) | | 4,624 | | | (258 | ) | | 28,763 | |
| | | | | | | | | | | | | | |
F-50
Table of Contents
Other provisions can be segregated into current obligations (T€6,493) and non-current obligations (T€22,270).
A change in estimate with respect to the interest rate as of March 31, 2008 resulted in a decrease of the provision amounting to T€2,308.
| | | | | | | | | | | | | | | | | | | |
| | Balance
as of
April 1,
2006 | | Utilization | | Reversal | | Addition | | Interest | | Balance
as of
March 31,
2007 | |
|---|
| | T€
| | T€
| | T€
| | T€
| | T€
| | T€
| |
|---|
Anniversary payments | | | 249 | | | (27 | ) | | 0 | | | 4 | | | 0 | | | 226 | |
Asset retirement obligations | | | 19,964 | | | (41 | ) | | 0 | | | 1,391 | | | (294 | ) | | 21,020 | |
Restructuring | | | 6,439 | | | (6,065 | ) | | (40 | ) | | 14,302 | | | 0 | | | 14,636 | |
Legal fees and litigation costs | | | 1,807 | | | (35 | ) | | (433 | ) | | 411 | | | 0 | | | 1,750 | |
Other | | | 1,041 | | | 0 | | | (100 | ) | | 780 | | | 0 | | | 1,721 | |
| | | | | | | | | | | | | | |
Total provisions | | | 29,500 | | | (6,168 | ) | | (573 | ) | | 16,888 | | | (294 | ) | | 39,353 | |
| | | | | | | | | | | | | | |
Other provisions can be segregated into current obligations (T€18,107) and non-current obligations (T€21,246).
Due to a change in estimate with respect to the interest rate as of March 31, 2007, the reduction in interest of T€294 related to asset retirement obligations consists of T€1,182 for the change in estimate and T€888 for the accretion in interest, which is considered in interest expense.
Provisions for restructuring
As of March 31, 2008 existing restructuring programs had remaining accruals in the amount of T€2,164. Due to this programs an amount of T€1,364 were utilized, T€151 were reversed and T€23 have been added to the provision for restructuring during the fiscal year ended March 31, 2009.
The Acquisition in May 2008 has necessitated a restructuring plan. For this purpose a restructuring provision was accrued for in the fiscal year ended March 31, 2009. Due to this restructuring plan an amount of T€4,012 was recorded as personnel expenses which are primarily severance payments and T€1,710 related to other operating expenses. These other amounts are primarily service level agreements, office rental fees, severance related consulting fees and fleet costs for leasing contracts.
For a restructuring plan for the reorganization of the regional technical department, which the Company announced in December 2008, a restructuring provision was accrued for in the fiscal year ended March 31, 2009. Of this provision an amount of T€19,318 was recorded as personnel expenses which are primarily comprised of severance payments and T€2,775 related to other operating expenses. These other amounts are primarily comprised of severance related lawyer fees and fleet costs for leasing contracts.
The restructuring program for outsourcing certain functions of the sales back office announced in February 2009 required a restructuring provision. Of this provision an amount of T€1,486 was recorded as personnel expenses which are primarily comprised of severance payments and T€37 related to other operating expenses.
For the new restructuring programs, announced in the current fiscal year, an amount of T€3,437 were utilized during the fiscal year ended March 31, 2009.
As of March 31, 2009, an amount of T€26,573 remained as total provision for restructuring.
F-51
Table of Contents
Provisions for asset retirement obligation
All asset retirement obligation calculations as of March 31, 2009 utilize an inflation rate of 2.19% (20-year-OECD-average) and a risk-free interest refinancing rate of 6% (prior period: 5.65% and for the period ended March 31, 2007: 4.8%). The obligation is accreted to the expected payment amount using the effective interest method.
Approximately 93% of KDG's obligations are related to technical equipment, including different kinds of cable and signal transmitting and receiving technology in cable ducts of DTAG. KDG assumes that 6% of the technical equipment will be replaced by other technologies after 10 years, 28% will be replaced after 15 years and the remaining 66% of the technical equipment is expected to be replaced after 30 years.
The remaining 7% of the asset retirement obligations are divided into accruals for furniture and fixtures and miscellaneous restoration obligations.
Further additions for new asset retirement obligations recognized in the fiscal year ended March 31, 2009, March 31, 2008 and March 31, 2007 increased the provision by T€2,677, T€1,686 and T€1,391, respectively.
Other
As of March 31, 2008 T€2,428 remained as other provision. In the fiscal year ended March 31, 2009 the provision increased by T€12,266 due to the final settlement of the Acquisition. Due to the utilization of T€76 and the reversal of T€942, an amount of T€13,676 remained as the liability as of March 31, 2009.
4.14 Other Non-Current Liabilities
| | | | | | | | | | |
| | Mar. 31,
2009 | | Mar. 31,
2008 | | Mar. 31,
2007 | |
|---|
| | T€
| | T€
| | T€
| |
|---|
Finance leases | | | 19,978 | | | 28,836 | | | 34,675 | |
Liabilities related to share-based payments (MEP) | | | 78,083 | | | 76,544 | | | 57,677 | |
Smartcard provider | | | 4,431 | | | 0 | | | 0 | |
| | | | | | | | |
| | | 102,492 | | | 105,380 | | | 92,352 | |
| | | | | | | | |
For the fiscal year ended March 31, 2009 the Company incurred liabilities in the amount of T€4,431 in relation to purchased smartcards. The smartcards were purchased in the fiscal year ended March 31, 2009 and payment terms imply pro rata payments on a monthly basis over the total payment period.
4.15 Equity
Subscribed capital and capital reserves are stated at nominal value. Shareholders have paid in the full amount of subscribed capital and capital reserves.
F-52
Table of Contents
Subscribed capital
As of March 31, 2009, the subscribed capital of KDG GmbH is held entirely by the sole shareholder Kabel Deutschland Holding GmbH and is represented by three shares in the following amounts (unchanged since April 1, 2003):
| | | | |
Shareholder | | € per share | |
|---|
Kabel Deutschland Holding GmbH | | | 24,750 | |
Kabel Deutschland Holding GmbH | | | 250 | |
Kabel Deutschland Holding GmbH | | | 1,000,000 | |
| | | | |
| | | 1,025,000 | |
| | | | |
Capital reserve
For the years ended March 31, 2009, March 31, 2008 and March 31, 2007, changes in the capital reserve relate to share-based payments of T€524, T€10,665 and T€4,575, respectively resulting from the repurchase of interests granted under the Company's interest programs and the repurchase of interests granted by the Company for exercised options under the Company's option programs. There was no additional increase in capital reserve due to interests granted in addition to existing schemes (prior year: T€6,489, for the fiscal year ended March 31, 2007: T€0).
Cash flow hedge reserve
Changes in the fair value of the currency cash flow hedges are recognized directly in equity under cash flow hedge reserve. The accumulated amount is released to profit or loss insofar as the hedged transaction affects profit or loss of the year.
Available-for-sale reserve
Changes in the fair value of financial assets classified as available-for-sale are recognized directly in equity under available-for-sale reserve.
Asset Revaluation Surplus
The additional acquired shares of Kabelcom Braunschweig Gesellschaft fuer Breitbandkabel-Kommunikation mbH and Kabelcom Wolfsburg Gesellschaft fuer Breitbandkabel-Kommunikation mbH, RKS Niedersaechsische Kabel-Servicegesellschaft mbH & Co. KG and RKS Niedersaechsische Kabel-Service-Beteiligungsgesellschaft mbH caused a step acquisition. Therefore, the difference of the fair values for acquired assets as of the original acquisition date in 2003 and the date of transfer of control due to additional acquired shares in 2008 is presented in an asset revaluation surplus. The asset revaluation surplus in equity relates directly to the identifiable asset customer list and therefore transferred directly to retained earnings as the asset is amortized.
Accumulated deficit
For the years ended March 31, 2009, March 31, 2008 and March 31, 2007, the accumulated deficit was T€1,064,191, T€984,473 and T€937,129, respectively.
Included in this amount are loans granted to Cayman Cable Holding L.P. in its capacity as parent of Kabel Deutschland GmbH in the amount of T€20,404 as of March 31, 2009 (prior year: T€13,504) repayable on March 2016. The granted loans are classified as transactions with parents and therefore included in Equity.
F-53
Table of Contents
Minority Interests
Minority interests are presented in the subsidiaries "Urbana Teleunion" Rostock GmbH & Co. KG, Kabelcom Braunschweig Gesellschaft fuer Breitbandkabel-Kommunikation mbH and Kabelcom Wolfsburg Gesellschaft fuer Breitbandkabel-Kommunikation mbH. Therefore, the Company has allocated the respective net assets in the amount of T€8,777 representing the share of equity relating to the minority interests upon initial acquisition. Additionally dividends distributed to minority interests amounted to T€1,109 in the fiscal year ended March 31, 2009. Net profit relating to minority interest for the fiscal year ended March 31, 2009 amounts to T€859.
5. Other Notes
5.1 Other Financial Obligations and Contingencies
Leasing and Rental Obligations
KDG has entered into several long-term service agreements with DTAG as well as its subsidiary T-Systems International GmbH. These agreements include but are not limited to usage and access agreements for underground cable ducts, fiber optic cables, co-location facilities and energy. The agreements have primarily fixed prices, either based on a monthly or unit basis, and are valid for up to thirty years. However, KDG can terminate the agreements with a notice period of 12 to 24 months.
The financial obligations as of March 31, 2009, March 31, 2008 and March 31, 2007 include the obligations arising due to the earliest possible termination date of KDG and are as follows:
| | | | | | | | | | | | | | | | | | | | | | | | | | | |
| |
| |
| | March 31, 2009
Due | |
| |
| | March 31, 2008
Due | |
| |
|---|
Type of liability | | Due
up to
1 year | | between
1 and
5 years | | more
than
5 years | | Total | | Due
up to
1 year | | between
1 and
5 years | | more
than
5 years | | Total | |
|---|
| |
| | in T€
| |
|---|
| 1. | | Agreements with DTAG and subsidiaries | | | 215,432 | | | 306,089 | | | 70,720 | | | 592,241 | | | 237,391 | | | 310,822 | | | 85,845 | | | 634,058 | |
| 2. | | License, rental and operating lease commitments | | | 27,022 | | | 50,943 | | | 2,469 | | | 80,434 | | | 29,736 | | | 61,075 | | | 5,472 | | | 96,283 | |
| 3. | | Other | | | 16,853 | | | 5,568 | | | 1,240 | | | 23,661 | | | 606,595 | | | 8,395 | | | 1,700 | | | 616,690 | |
| | | | | | | | | | | | | | | | | | | | |
| Total | | | 259,307 | | | 362,600 | | | 74,429 | | | 696,336 | | | 873,722 | | | 380,292 | | | 93,017 | | | 1,347,031 | |
| | | | | | | | | | | | | | | | | | | | |
| | | | | | | | | | | | | | | |
| |
| |
| | March 31, 2007
Due | |
| |
|---|
Type of liability | | Due up
to 1 year | | between
1 and
5 years | | more
than
5 years | | Total | |
|---|
| |
| | in T€
| |
|---|
| 1. | | Agreements with DTAG and subsidiaries | | | 209,623 | | | 292,102 | | | 31,897 | | | 533,622 | |
| 2. | | License, rental and operating lease commitments | | | 44,490 | | | 77,802 | | | 15,760 | | | 138,052 | |
| 3. | | Other | | | 30,554 | | | 18,380 | | | 1,922 | | | 50,856 | |
| | | | | | | | | | | | |
| Total | | | 284,667 | | | 388,284 | | | 49,579 | | | 722,530 | |
| | | | | | | | | | | | |
The lease payments for cable ducts are T€103,558, T€103,492 and T€103,450 for the fiscal years ended March 31, 2009, March 31, 2008 and March 31, 2007, respectively. While the Company has the legal right to cancel the agreements for the lease of the cable ducts with a notice period of 12 to 24 months, the technological requirements to replace leased capacity represent economic penalties which would result in the reasonably assured renewal of the leases for a certain period of time. Management expects that for 30% of the leased capacity the economic penalties will require renewal of
F-54
Table of Contents
the contracts for 15 years, when the Company believes it will have the ability to replace the capacity. This results in a non-cancelable lease term of 15 years for this portion of the leased cable ducts. For the remaining 70%, the lease term is expected to include all renewal periods under the agreement, resulting in a non-cancelable lease term of 30 years through March 31, 2033, after which time the lease can be canceled at the option of DTAG. As of March 31, 2009, 2008 and 2007 the total financial obligations for cable ducts amounted to T€2,013,670, T€2,116,935 and T€2,220,200, respectively.
In the fiscal years ended March 31, 2009, March 31, 2008 and March 31, 2007, KDG had leasing expenses amounting to T€169,367, T€167,890 and T€176,058, respectively.
In the fiscal year ended March 31, 2009 other financial obligations due up to one year were T€261,470 compared to T€873,722 for the year ended March 31, 2008. The decrease results from the purchase agreement with Orion Cable during the previous fiscal year which became effective in the current fiscal year.
Contingencies
On December 23, 2008 the collecting society GEMA filed arbitration proceedings against KDG and KDVS claiming information about the number of subscribers of the Pay-TV package Kabel Digital Home and claiming for damages due to an alleged copyright infringement from the launch date of the package until now. The companies believe that these claims are either unjustified since the content owners licensed any required rights to KDVS or are obliged to indemnify KDVS in case of an infringement of third party rights. The amount of the claim for damages has not yet been quantified.
General Risks
In the course of its business activities, the Company faces general economic risks due to relationships with customers, suppliers and employees. In addition, general risks exist regarding obligations under legal and tax authorities. Currently there are no proceedings related to these risks.
5.2 Related Parties
In accordance with IAS 24, persons or companies which are in control of or controlled by KDG GmbH must be disclosed, unless they are already included as consolidated companies in KDG GmbH's consolidated financial statements. Control exists if a shareholder owns more than one half of the voting rights in KDG GmbH or, by virtue of an agreement, has the power to control the financial and operating policies of KDG GmbH's management.
The disclosure requirements under IAS 24 also extend to transactions with associated companies as well as transactions with persons who have significant influence on KDG GmbH's financial and operating policies, including close family members and intermediate entities. Significant influence is deemed to be exerted by persons holding an interest in KDG GmbH of 20% or more, a seat on the management board or the supervisory board, or other key management positions.
The transactions of KDG with associated companies are all attributable to the ordinary activities of these respective entities.
The parent company of KDG GmbH is KDG HoldCo. The latter company is wholly owned by LuxCo, which in turn is wholly owned by Cayman Cable. Cayman Cable is owned by Providence Equity Partners, the ultimate parent.
The KDG Financials are consolidated into the direct parent's Group Accounts of KDG HoldCo and the group accounts of the indirect parent LuxCo.
F-55
Table of Contents
KDG GmbH conducted the following transactions with related parties in the fiscal years ended March 31, 2009, 2008 and 2007 (in T€).
| | | | | | | | | | | | | | | | | | | | | | | | | | | | | | | |
| | Cayman Cable | | Kabel
Holding GmbH | | Cable
Holding S.à r.l. | | Kabelcenter
München(41) |
|---|
| | 2008/
2009 | | 2007/
2008 | | 2006/
2007 | | 2008/
2009 | | 2007/
2008 | | 2006/
2007 | | 2008/
2009 | | 2007/
2008 | | 2006/
2007 | | 2008/
2009 | | 2007/
2008 | | 2006/
2007 |
|---|
Goods and services sold | | 0 | | 0 | | | 0 | | 0 | | 0 | | | 0 | | | 0 | | | 0 | | | 0 | | | 1,098 | | | 906 | | 0 |
Goods and services purchased | | 0 | | 0 | | | (253 | ) | 0 | | 0 | | | 0 | | | 0 | | | 0 | | | 1 | | | 0 | | | 0 | | 0 |
Interest income | | 0 | | 0 | | | 0 | | 0 | | 0 | | | 99 | | | 37 | | | 37 | | | 37 | | | 0 | | | 0 | | 0 |
Interest expense | | 0 | | 0 | | | 0 | | 0 | | 0 | | | 0 | | | 0 | | | 0 | | | 0 | | | 0 | | | 0 | | |
Receivables | | 0 | | 0 | | | 253 | | 0 | | 0 | | | 0 | | | 834 | | | 797 | | | 760 | | | 0 | | | 31 | | 0 |
Liabilities | | 0 | | 0 | | | 0 | | 0 | | 0 | | | 0 | | | 0 | | | 0 | | | 0 | | | 0 | | | 0 | | 0 |
- (41)
- Kabelfernsehen München Servicenter GmbH—Beteiligungsgesellschaft und Kabelfernsehen München Servicenter GmbH & Co. KG, Munich.
Most of the significant contracts with associated companies are signal delivery agreements concluded in the ordinary course of business.
Transactions with Members of the Management Board and the Supervisory Board
Supervisory Board
The Supervisory Board Members received remuneration in the amount of T€65, T€48 and T€68 for the fiscal years ended March 31, 2009, March 31, 2008 and March 31, 2007, respectively.
Certain Supervisory Board Members participate in the Company's Management Equity Participation Program and hold interests in Cayman Cable Holding L.P. of approximately 2.76%, unchanged since prior years. In the fiscal year ended March 31, 2009, March 31, 2008 and March 31, 2007, the holders of those interests have received non-cash share-based payments due to changes in the carrying amount of the underlying interests in the amount of T€6, T€9,270 and T€14,680, respectively.
In total the Supervisory Board Members received remuneration of T€71, T€9,318 and T€14,748 for the fiscal year ended March 31, 2009, March 31, 2008 and March 31, 2007, respectively.
Management
Management received short-term employee benefits of T€2,774, T€3,594 and T€3,871 as well as post-employment benefits in the amount of T€228, T€300 and T€383 for the fiscal years ended March 31, 2009, March 31, 2008 and March 31, 2007, respectively.
Additionally, Management participates in the Company's Management Equity Participation Program and holds interests in Cayman Cable Holding L.P. of 1.28% (prior year: 1.28%, as of March 31, 2007: 1.47%) upon which they have received non-cash share-based payments due to changes in the measurement of the carrying amount of the underlying interests in the fiscal years ending March 31, 2009, March 31, 2008 and March 31, 2007 in the amount of T€126, T€3,451 and T€15,913, respectively. During the period ended March 31, 2009 no cash has been paid for the repurchase of interests from former members of Management (prior year: T€7,557). During the fiscal year ending March 31, 2007, non-cash share-based payments to members of the Management amounted to T€15,913.
In total, Management received remuneration in the amount of T€3,128, T€14,902 and T€20,167 for the fiscal years ended March 31, 2009, March 31, 2008 and March 31, 2007, respectively.
F-56
Table of Contents
For further details regarding share-based payments refer to note 5.4.
Former Members of Management and their surviving dependents
For former Members of Management and their surviving dependents related to pension claims liabilities of T€121, T€129 and T€144 have been recorded for the fiscal years ended March 31, 2009, March 31, 2008 and March 31, 2007, respectively.
Other transactions with Members of the Management Board and the Supervisory Board
A supervisory board member obtained separate loans in the amounts of T€70 and T€379 (prior year: T€70 and T€379, as of March 31, 2007: T€0) from Cayman Cable Holding L.P. As of March 31, 2009, approximately T€135 remained outstanding including accrued interest (prior year: T€128, as of March 31, 2007: T€0).
Management board members obtained loans in the amount of T€2,160 (prior year: T€2,160, as of March 31, 2007: T€0) with interest rates ranging from 5% to 5.5% p.a. from Cayman Cable Holding L.P. As of March 31, 2009, the principal amounts outstanding were T€2,160, accrued interest amounted to T€213 (prior year: T€95, as of March 31, 2007: T€0).
Transactions with Shareholders
In the fiscal year ended March 31, 2009, Providence Equity Partners (ultimate Shareholder) received Management fees, Director fees and Transaction fees in the total amount of T€1,767 (prior year: T€1,671, for the fiscal year ended March 31, 2007: T€1,882).
5.3 Segment Reporting
For the purposes of segment reporting, KDG's activities are split into business segments in accordance with IAS 14. Business segments are the primary reporting format. This breakdown is based on the internal management and reporting system and takes into account the different risks and earnings structures of the business segments.
The business activities of KDG and its subsidiaries focus on the operation of cable television networks in Germany. Risks and rewards do not differ within Germany. Therefore, operations do not need to be segmented into geographical segments and the secondary reporting format is not required.
Segment information on intangible and tangible fixed assets, receivables, liabilities and profit or loss is provided in the primary reporting format. This segment information is obtained using the same disclosure and measurement methods as for the consolidated financial statements. There are no significant relationships between the individual segments, and therefore no intersegment relationships need to be eliminated. Any intrasegment relationships have been eliminated.
Cable Access contains all activities and services linked to the customer's physical access to the Company's cable network either directly to end customers or indirectly through commercial Level 4 operators or housing associations for which the Company charges a fee.
Cable television access is the basis for free and paid services offered by the Company, including TV and radio services, Internet & Phone services. Recently the Company revised its strategy of requiring cable access as a basis for subscribing to Internet & Phone. Non-cable access customers may now subscribe to Internet & Phone services.
The Company's cable access business generates revenues through subscription fees, installation fees and other revenues.
F-57
Table of Contents
TV/Radio
In addition to the access cable television business described in the above section, the Company offers its own pay-TV packages. The Company sells its pay-TV packages directly to consumers and to a lesser extent indirectly through certain Level 4 operators and an unaffiliated regional cable television operator.
The Company's TV/Radio business generates revenue through subscription fees, CPE sales and carriage fees.
Internet & Phone
The Company can offer Internet & Phone services to those homes which are passed by its upgraded bidirectional network (630 MHz) and where the Company has the ability to market its products (Marketable Homes).
TKS—Telepost Kabel-Service Kaiserslautern GmbH & Co. KG
TKS, a wholly owned subsidiary of KDVS, provides cable television, Internet and phone services to NATO military personnel based in Germany. It also provides billing services for telephone customers of Deutsche Telekom AG (DTAG) who prefer English language bills. Additionally, TKS sells certain telecommunication products in its shops to personnel on NATO military bases such as prepaid mobile phones, cash cards, and telecommunication related products and services.
Reconciliation
Reconciliation includes all headquarter functions of the Company such as managing directors, legal and regulatory, finance, human resources, internal audit, corporate communication, investor relations, purchasing, IT and intercompany elimination.
F-58
Table of Contents
The segment reporting is as follows:
| | | | | | | | | | | | | | | | | | | | | | | | | | | | |
| | Cable Access | | TV/Radio | | Internet & Phone | |
|---|
| | 2008/2009 | | 2007/2008 | | 2006/2007 | | 2008/2009 | | 2007/2008 | | 2006/2007 | | 2008/2009 | | 2007/2008 | | 2006/2007 | |
|---|
| | T€
| | T€
| | T€
| |
|---|
Revenues | | | 911,155 | | | 867,066 | | | 845,562 | | | 192,331 | | | 179,802 | | | 162,987 | | | 231,942 | | | 121,367 | | | 56,540 | |
Profit or loss from ordinary activities | | | 252,221 | | | 271,100 | | | 238,302 | | | 24,837 | | | 28,352 | | | 13,263 | | | (15,956 | ) | | (35,146 | ) | | (51,898 | ) |
Net finance cost | | | 0 | | | 0 | | | 0 | | | 0 | | | 0 | | | 0 | | | 0 | | | 0 | | | 0 | |
Depreciation on investments | | | 0 | | | 0 | | | 0 | | | 0 | | | 0 | | | 0 | | | 0 | | | 0 | | | 0 | |
Income from associates | | | 0 | | | 0 | | | 0 | | | 0 | | | 0 | | | 0 | | | 0 | | | 0 | | | 0 | |
Taxes on income | | | 0 | | | 0 | | | 0 | | | 0 | | | 0 | | | 0 | | | 0 | | | 0 | | | 0 | |
Net loss for the fiscal year | | | | | | | | | | | | | | | | | | | | | | | | | | | | |
Fixed assets | | | 1,420,385 | | | 1,098,821 | | | 1,228,322 | | | 89,517 | | | 69,112 | | | 57,967 | | | 523,086 | | | 266,027 | | | 100,743 | |
Trade Receivables | | | 44,523 | | | 63,813 | | | 73,719 | | | 24,801 | | | 41,661 | | | 19,992 | | | 29,194 | | | 17,386 | | | 4,787 | |
Unallocated | | | 0 | | | 0 | | | 0 | | | 0 | | | 0 | | | 0 | | | 0 | | | 0 | | | 0 | |
| | | | | | | | | | | | | | | | | | | | |
Assets | | | 1,464,908 | | | 1,162,634 | | | 1,302,041 | | | 114,318 | | | 110,773 | | | 77,959 | | | 552,280 | | | 283,413 | | | 105,530 | |
| | | | | | | | | | | | | | | | | | | | |
Depreciation and amortization | | | 252,858 | | | 207,855 | | | 202,892 | | | 29,824 | | | 20,204 | | | 12,975 | | | 89,073 | | | 38,967 | | | 12,175 | |
Additions fixed assets | | | 582,862 | | | 95,279 | | | 101,020 | | | 43,165 | | | 28,771 | | | 30,183 | | | 340,758 | | | 175,356 | | | 125,695 | |
Trade Payables | | | 87,552 | | | 80,897 | | | 80,881 | | | 68,870 | | | 62,882 | | | 45,423 | | | 63,341 | | | 49,086 | | | 27,379 | |
Other current liabilities | | | 25,773 | | | 15,175 | | | 24,840 | | | 11,058 | | | 10,570 | | | 10,910 | | | 7,642 | | | 6,120 | | | 3,705 | |
Provisions for Pension | | | 17,951 | | | 15,441 | | | 16,093 | | | 1,219 | | | 1,073 | | | 1,820 | | | 1,240 | | | 960 | | | 1,363 | |
Current and non-current provisions | | | 46,752 | | | 20,622 | | | 33,399 | | | 635 | | | 2,998 | | | 2,838 | | | 1,932 | | | 1,053 | | | 935 | |
Deferred Income | | | 215,470 | | | 195,390 | | | 216,493 | | | 25,993 | | | 4,027 | | | 0 | | | 1,626 | | | 1,832 | | | 0 | |
Other non-current liabilities | | | 4,754 | | | 4,362 | | | 2,771 | | | 24,616 | | | 28,979 | | | 35,094 | | | 524 | | | 402 | | | 0 | |
Unallocated | | | 0 | | | 0 | | | 0 | | | 0 | | | 0 | | | 0 | | | 0 | | | 0 | | | 0 | |
| | | | | | | | | | | | | | | | | | | | |
Liabilities | | | 398,252 | | | 331,887 | | | 374,477 | | | 132,391 | | | 110,529 | | | 96,085 | | | 76,305 | | | 59,453 | | | 33,382 | |
| | | | | | | | | | | | | | | | | | | | |
| | | | | | | | | | | | | | | | | | | | | | | | | | | | |
| | TKS | | Reconciliation | | Total Group | |
|---|
| | 2008/2009 | | 2007/2008 | | 2006/2007 | | 2008/2009 | | 2007/2008 | | 2006/2007 | | 2008/2009 | | 2007/2008 | | 2006/2007 | |
|---|
| | T€
| | T€
| | T€
| |
|---|
Revenues | | | 34,903 | | | 28,635 | | | 28,090 | | | 0 | | | 0 | | | 0 | | | 1,370,331 | | | 1,196,870 | | | 1,093,179 | |
Profit or loss from ordinary activities | | | 3,420 | | | 2,803 | | | 8,274 | | | (127,708 | ) | | (127,590 | ) | | (128,245 | ) | | 136,814 | | | 139,519 | | | 79,696 | |
Net finance cost | | | 2 | | | (20 | ) | | 0 | | | (229,055 | ) | | (169,762 | ) | | (152,107 | ) | | (229,053 | ) | | (169,782 | ) | | (152,107 | ) |
Depreciation on investments | | | 0 | | | 0 | | | 0 | | | 76 | | | (3,712 | ) | | 265 | | | 76 | | | (3,712 | ) | | 265 | |
Income from associates | | | 0 | | | 0 | | | 0 | | | 14,052 | | | 899 | | | 440 | | | 14,052 | | | 899 | | | 440 | |
Taxes on income | | | (306 | ) | | 154 | | | 0 | | | 6,458 | | | (918 | ) | | (27,565 | ) | | 6,152 | | | (764 | ) | | (27,565 | ) |
Net loss for the financial year | | | | | | | | | | | | | | | | | | | | | (71,959 | ) | | (33,840 | ) | | (99,269 | ) |
Fixed assets | | | 6,092 | | | 6,765 | | | 6,674 | | | 84,560 | | | 88,091 | | | 83,436 | | | 2,123,640 | | | 1,528,816 | | | 1,477,142 | |
Trade Receivables | | | 6,892 | | | 6,867 | | | 2,872 | | | 1,168 | | | 1,151 | | | 0 | | | 106,578 | | | 130,878 | | | 101,370 | |
Unallocated | | | 0 | | | 0 | | | 0 | | | 140,917 | | | 92,615 | | | 126,975 | | | 140,917 | | | 92,615 | | | 126,975 | |
| | | | | | | | | | | | | | | | | | | | |
Assets | | | 12,984 | | | 13,632 | | | 9,546 | | | 226,645 | | | 181,857 | | | 210,411 | | | 2,371,135 | | | 1,752,309 | | | 1,705,487 | |
| | | | | | | | | | | | | | | | | | | | |
Depreciation and amortization | | | 1,892 | | | 1,700 | | | 1,393 | | | 29,007 | | | 25,223 | | | 17,183 | | | 402,654 | | | 293,949 | | | 246,618 | |
Additions fixed assets | | | 1,219 | | | 1,791 | | | 3,006 | | | 32,711 | | | 52,188 | | | 38,040 | | | 1,000,715 | | | 353,385 | | | 297,944 | |
Trade Payables | | | 3,308 | | | 3,901 | | | 3,599 | | | 37,707 | | | 21,527 | | | 18,236 | | | 260,778 | | | 218,293 | | | 175,518 | |
Other current liabilities | | | 2,671 | | | 2,554 | | | 1,208 | | | 40,022 | | | 25,221 | | | 19,736 | | | 87,166 | | | 59,640 | | | 60,399 | |
Provisions for Pension | | | 392 | | | 343 | | | 457 | | | 14,507 | | | 11,331 | | | 4,438 | | | 35,309 | | | 29,148 | | | 24,171 | |
Current and non-current provisions | | | 9 | | | 85 | | | 0 | | | 17,108 | | | 4,005 | | | 2,181 | | | 66,436 | | | 28,763 | | | 39,353 | |
Deferred Income | | | 217 | | | 65 | | | 325 | | | 8 | | | 21 | | | 270 | | | 243,314 | | | 201,335 | | | 217,088 | |
Other non-current liabilities | | | 553 | | | 536 | | | 0 | | | 72,045 | | | 71,101 | | | 54,487 | | | 102,492 | | | 105,380 | | | 92,352 | |
Unallocated | | | 0 | | | 0 | | | 0 | | | 2,578,709 | | | 2,042,319 | | | 1,992,963 | | | 2,578,709 | | | 2,042,319 | | | 1,992,963 | |
| | | | | | | | | | | | | | | | | | | | |
Liabilities | | | 7,150 | | | 7,484 | | | 5,589 | | | 2,760,106 | | | 2,175,525 | | | 2,092,311 | | | 3,374,204 | | | 2,684,878 | | | 2,601,844 | |
| | | | | | | | | | | | | | | | | | | | |
In regard to the Acquisition goodwill of T€335,337 was allocated to the segment cable access in the amount of T€246,473, to the segment TV/Radio in the amount of T€10,731 and to the segment
F-59
Table of Contents
Internet & Phone in the amount of T€78,133. Furthermore, customer list of T€226,847 was allocated to the segment cable access in the amount of T€169,999, to the segment TV/Radio in the amount of T€4,707 and to the segment Internet & Phone in the amount of T€52,141. Additionally property and equipment and other intangible assets of T€70,124 has been completely allocated to the segment cable access.
5.4 Share-based Payments
Management Equity Participation (MEP) Programs
At March 31, 2009, the Company has five Management Equity Participation Programs (MEP I, MEP II, MEP III, MEP IV and MEP V) in place. MEP I provides direct and indirect—via Kabel Management Beteiligungs-GbR—ownership in Cayman Cable Holding L.P., the parent company of KDG and LuxCo. MEP II and III provide options in Cayman Cable Holding L.P. interests. MEP IV is split into an interest program providing indirect—via Kabel Management Beteiligungs—(MEP IV) GbR—ownership in Cayman Cable Holding L.P. and an option program providing options in Cayman Cable Holding L.P. interests. MEP V also provides options in Cayman Cable Holding L.P. interests. Certain employees (including senior executives) of the Company receive remuneration in the form of share-based payment transactions.
MEP I
Certain members of KDG GmbH Management and the Supervisory Board participate in the Cayman Cable Holding L.P. directly as limited partners (the Direct Management Equity Participation program I—direct MEP I) and certain members participate indirectly through interests in Kabel Management Beteiligungs-GbR, a separate partnership which is itself a limited partner in Cayman Cable Holding L.P. (the Indirect Management Equity Participation program I—indirect MEP I). The terms of both programs are substantially the same.
On February 11, 2004, Cayman Cable Holding G.P. Co. Ltd. (the general partner) and the limited partners of the Partnership entered into a second amended and restated limited partnership agreement. This agreement sets forth the structure relating to the governance and ownership of the Partnership and the terms of the direct MEP I. Under the direct MEP I, certain members of Management and the Supervisory Board were admitted to the Partnership as limited partners holding common interests in the Partnership. Other members of Management were admitted to the program through ownership in Kabel Management Beteiligungs-GbR, a limited partner in the Partnership holding common interests in the Partnership.
The members both of the direct MEP I and indirect MEP I were required to pay a capital contribution upon admission. The direct MEP I and the indirect MEP I members have financed up to 70% of the members' contributions with a loan from the Partnership.
Interest accrues on such loans at a rate between 3.0% and 5.5% per annum, compounded annually, and is repayable in accordance with an amortization schedule in the relevant agreement. The members are entitled to proceeds resulting from the sale of shares in LuxCo by Cayman L.P. With these proceeds the granted loans were repaid.
Put or call provisions apply to the members' Partnership interests in the event that such member ceases to be employed by KDG GmbH or its subsidiaries.
Certain limits apply with respect to the transfer of interests in the Partnership. Limited partners are not permitted to transfer their interests in the Partnership (subject to certain exceptions for affiliate transfers and transfers to subsidiaries or family vehicles) without the consent of the general partner, Cayman Cable Holding G.P. Co. Ltd. Such consent may be given subject to conditions or restrictions or may be withheld at the general partner's absolute discretion. Notwithstanding the foregoing, no
F-60
Table of Contents
transfers shall be valid or effective if the transfer would violate any applicable securities laws or it would cause the Partnership to lose any of its exemptions or favorable treatment under the U.S. Federal income tax laws, ERISA or the U.S. Investment Company Act of 1940.
As of April 19, 2006, Cayman Cable Holding L.P. agreed to assume obligations under PIK-Notes issued by P4 Cayman Cable Ltd. As a result of that, the Partnership decided to adjust the number of interests to reflect the decrease in the value of MEP I members shares resulting in the issuance of additional interests to the MEP I holders. The number of interests additionally issued as an adjustment without any consideration was 724,102 in the direct MEP I and 136,227 in the indirect MEP I.
During the fiscal year ended March 31, 2009, 20,993 interests of members of indirect MEP I were sold by the respective members (prior year: 629,790 interests of members of the direct MEP I and 83,972 interests of members of the indirect MEP I, for the fiscal year ended March 31, 2007: 293,902 interests of members of the indirect MEP I). These interests were repurchased by Cayman Cable Holding L.P. at an average price of €14.66 per interest (prior year: €12.00 per interest in direct MEP I and €14.66 per interest in indirect MEP I, for the fiscal year ended March 31, 2007: €9,86 per interest in indirect MEP I). Since Cayman Cable Holding L.P. repurchased these interests for cash and has not required KDG to fund the repurchase, the liabilities related to these interests have been treated as a contribution from the parent when settled, resulting in an increase in capital reserve of T€308 (prior year: T€8,789).
Grant date
The grant date determines the point in time at which the fair value of the services of the members of MEP is measured. The persons who are members of the direct MEP I participate in Cayman Cable Holding L.P. with a grant date as of March 13, 2003. The persons who are members of the indirect MEP I participate with a grant date as of November 27, 2003. For one limited partner in the Partnership the grant date was October 1, 2003. The grant date for 14,250 of the additional 2,259,723 interests granted during the fiscal year ending March 31, 2006 was February 28, 2006. For the other 2,245,473 interests which were granted on February 2, 2006, Cayman Cable Holding L.P. awarded the holders immediate additional vesting as if the interests had been granted on April 26, 2005.
On April 19, 2006, Cayman Cable Holding L.P. granted the holders of interests an additional year vesting. As a result, the vested part of the interests of the MEP I holders increased by 25% in addition to the scheduled vesting.
Number of interests granted
As of March 31, 2009, Management holds direct and indirect interests of 3.74% and 0.42%, respectively, in the Cayman Cable Holding L.P.(prior year: 3.74% and 0.44%, as of March 31, 2007: 4,37% and 0,52%, respectively). The total consideration paid for these interests amounts to T€13,957 and T€291, respectively (prior year: T€13,957 and T€312, as of March 31, 2007: T€14,482 and T€389).
Measurement
Under the direct MEP I as of March 13, 2003, the fair value of the interests at March 31, 2009 amounts to T€15,074 (prior year: T€15,074, as of March 31, 2007: T€19,432). Under the indirect MEP I as of November 27, 2003, the fair value of the interests in Kabel Management Beteiligungs-GbR, which is valued by the fair value of its contribution in the Cayman Cable Holding L.P. amounts to T€6,155 (prior year: T€6,463, as of March 31, 2007: T€6,151). The fair value of the interests of the new members of direct MEP I granted in February 2006 at March 31, 2009 amounts to T€39,699 (prior year: T€39,699, as of March 31, 2007: T€31,737).
F-61
Table of Contents
At each balance sheet date through March 31, 2006, the carrying value of the repurchase obligation related to vested MEP I interests has been based on a formula defined in the partnership agreement for fair price estimation of the respective shares, which have been negotiated between the partners and are documented in the partnership agreement (third amendment) and a letter of grant (for certain of the interests granted in February 2006). Effective April 19, 2006 and in connection with the 5th amendment to the limited partnership agreement, the controlling shareholders of Cayman Cable modified the settlement terms of MEP I interests in Cayman Cable Holding L.P. to change the settlement formula from an EBITDA formula with fixed multiples to a fair value based model. The difference between repurchase obligation as computed at each reporting date and the consideration for the interests is accounted for as personnel expense. This amount is recognized over a vesting period of four years commencing at grant date using the accelerated recognition method in accordance with IFRS 2 whereby 25% are vested at each anniversary. Therefore the program is split into 4 different layers, for which fair value is calculated at each reporting date. As of March 31, 2009, March 31, 2008 and March 31, 2007 T€60,863, T€61,229 and T€56,146, respectively, have vested. The liability was recorded in other liabilities. Included in these amounts is the contribution made by the members of MEP I since such contributions are a liability in case of the sale of the interests. Due to additional vesting, the Company recognized an increase in expenses and an increase in other liabilities for the fiscal year ended March 31, 2009 in the amount of T€6 (prior year: T€13,695, for the fiscal year ended March 31, 2007 (including the change from a formula based price to a fair value based price) T€37,585). Additionally, T€3 (prior year: T€207, for the fiscal year ended March 31, 2007: decrease in the amount of T€352) was recognized as an increase in personnel expense due to the sale of interests resulting in a net income effect in total of T€9 (prior year: T€13,902, for the fiscal year ended March 31, 2007: T€37,233).
MEP II and III
MEP II and MEP III are option programs that differ in the exercise price only. Under these programs, the participants were granted options on interests in the Cayman Cable Holding L.P.
As of April 19, 2006, Cayman Cable Holding L.P. agreed to assume obligations under PIK-Notes issued by P4 Cayman Cable Ltd. As a result of this equity restructuring, the Partnership adjusted the number of options to reflect the decrease in value of the underlying interests resulting in the issuance of additional options to the MEP II and III holders. The number of options issued for that adjustment was 26,961 in MEP II and 109,344 in MEP III. At the same time, the strike price for the options was adjusted by the same proportion to keep the total strike price constant. The value of the total outstanding options before and after this adjustment was the same.
Number of options granted
In May 2006, KDG granted 300,000 additional options at a strike price of €7.01 each.
As of March 31, 2009, March 31, 2008 and March 31, 2007, a total of 434,897, 434,897 and 734,897, respectively, options have been granted to the participants in MEP II and MEP III representing a 0.43% interest in the Cayman Cable Holding L.P (prior year: 0.43%, for the fiscal ended March 31, 2007: 0.73%).
Grant date and terms
The maximum term of the options is ten years after grant date. The options will be forfeited if they are not exercised. The weighted average remaining life of the options is 0.97 years as of March 31, 2009 (prior year: 1.97 years, as of March 31, 2007: 3.45 years).
F-62
Table of Contents
On April 19, 2006, Cayman Cable Holding L.P. granted the holders of existing options—except the holders of the options granted in March 2006—an additional year vesting. As a result, the vested part of those options within MEP II and MEP III increased by 25% in addition to the scheduled vesting.
Method and extent of exercise
The options will become immediately vested and exercisable upon any of the following events:
- •
- the date of completion of the sale, or disposal in any other manner, of all or substantially all of the business and assets of the Cayman Cable Holding L.P. and its subsidiaries (Group) to a third party purchaser;
- •
- the effective date of a public offering of the shares in KDG and their shareholders (Group) companies representing substantially all of the business.
In addition, the general partner of Cayman Cable Holding L.P. may, at its absolute discretion, allow options to become exercisable, in whole or in part, prior to an exit event if any other transaction occurs which would materially affect the value of the options.
The general partner may decide that, instead of procuring the issue or transfer of interests in Cayman Cable Holding L.P. (LP interests) on exercise of an option that it will:
- •
- pay to the option holder (after deduction of any taxes, social security contributions duties or other expenses) a cash amount equal to the difference between the market value of the LP interests which would otherwise be issued or transferred and the exercise price for those LP interests; or
- •
- transfer to the option holder a number of the shares of any Group company which has a market value equal to the difference between the market value of the LP interests which would otherwise be issued or transferred and the exercise price for those LP interests; or
- •
- transfer to the option holder a number of the shares which are admitted to listing which has a market value of the difference between the market value of the LP Interests which would otherwise be issued or transferred and the exercise price for those LP interests.
Any other transfer of options is restricted to certain limited options (e.g. ceasing employment). Any transfer of an option otherwise than permitted in this program would cause the option to lapse.
Measurement
The measurement of the fair value at grant date and each consecutive reporting period is based on the Black-Scholes option pricing model. The main parameters are the estimated fair value of the interests, expected volatility of the values of the interests, the estimated term of the options and the risk free interest rate on grant date (based on the estimated average life of the options of six years). The grant of the options is not dependent on market conditions, whereby expected future distributions have been included in the calculation.
The volatility was estimated at 25% by benchmarking historical volatilities of listed international cable companies that are comparable regarding the parameters that typically influence the volatility.
F-63
Table of Contents
The strike prices are €1.17 for MEP II and €4.53 for MEP III and €0.83 for options granted in March 2006. The strike price for the options granted in May 2006 is €7.01.
| | | | | | | | | | | | | | | | | | | | | | | | | | | | |
| | Number of options | | Risk free
interest
rate at
grant
date | | Fair
value of
option at
grant
date | | Fair
value of
shares at
grant
date | | Fair
value of
option at
measurement
date | |
|---|
Grant date | | March 31,
2008 | | Granted | | Called | | Exercised | | March 31,
2009 | |
|---|
| |
| |
| |
| |
| |
| | (%)
| | in T€
| | in T€
| | in T€
| |
|---|
October 1, 2004 MEP II | | | 161,962 | | | 0 | | | 0 | | | 0 | | | 161,962 | | | 3.33 | | | 3,689 | | | 8,085 | | | 2,186 | |
January 1, 2005 MEP III | | | 62,985 | | | 0 | | | 0 | | | 0 | | | 62,985 | | | 2.99 | | | 1,222 | | | 2,079 | | | 640 | |
June 1, 2005 MEP III | | | 149,964 | | | 0 | | | 0 | | | 0 | | | 149,964 | | | 2.58 | | | 852 | | | 1,437 | | | 1,530 | |
March 31, 2006 MEP III | | | 59,986 | | | 0 | | | 0 | | | 0 | | | 59,986 | | | 3.59 | | | 379 | | | 420 | | | 831 | |
| | | | | | | | | | | | | | | | | | | | | | | | |
| | | 434,897 | | | 0 | | | 0 | | | 0 | | | 434,897 | | | | | | | | | | | | | |
| | | | | | | | | | | | | | | | | | | | | | | | |
| | | | | | | | | | | | | | | | | | | | | | | | | | | | |
| | Number of options | | Risk free
interest
rate at
grant
date | | Fair
value of
option at
grant
date | | Fair
value of
shares at
grant
date | | Fair
value of
option at
measurement
date | |
|---|
Grant date | | March 31,
2007 | | Granted | | Called | | Exercised | | March 31,
2008 | |
|---|
| |
| |
| |
| |
| |
| | (%)
| | in T€
| | in T€
| | in T€
| |
|---|
October 1, 2004 MEP II | | | 161,962 | | | 0 | | | 0 | | | 0 | | | 161,962 | | | 3.33 | | | 3,689 | | | 8,085 | | | 2,195 | |
January 1, 2005 MEP III | | | 62,985 | | | 0 | | | 0 | | | 0 | | | 62,985 | | | 2.99 | | | 1,222 | | | 2,079 | | | 656 | |
June 1, 2005 MEP III | | | 149,964 | | | 0 | | | 0 | | | 0 | | | 149,964 | | | 2.58 | | | 852 | | | 1,437 | | | 1,570 | |
March 31, 2006 MEP III | | | 59,986 | | | 0 | | | 0 | | | 0 | | | 59,986 | | | 3.59 | | | 379 | | | 420 | | | 834 | |
May 22, 2006 MEP III | | | 300,000 | | | 0 | | | 0 | | | 300,000 | | | 0 | | | 3.88 | | | 546 | | | 2,103 | | | | |
| | | | | | | | | | | | | | | | | | | | | | | | |
| | | 734,897 | | | 0 | | | 0 | | | 300,000 | | | 434,897 | | | | | | | | | | | | | |
| | | | | | | | | | | | | | | | | | | | | | | | |
| | | | | | | | | | | | | | | | | | | | | | | | | | | | | | | |
| | Number of options | | Risk free
interest
rate at
grant
date | | Fair
value of
option at
grant
date | | Fair
value of
shares at
grant
date | | Fair
value of
option at
measurement
date | |
|---|
Grant date | | March 31,
2006 | | Granted | | Adjustment* | | Called | | Exercised | | March 31,
2007 | |
|---|
| |
| |
| |
| |
| |
| |
| | (%)
| | in T€
| | in T€
| | in T€
| |
|---|
October 1, 2004 MEP II | | | 135,000 | | | 0 | | | 26,961 | | | 0 | | | 0 | | | 161,962 | | | 3.33 | | | 3,689 | | | 8,085 | | | 1,727 | |
January 1, 2005 MEP III | | | 52,500 | | | 0 | | | 10,485 | | | 0 | | | 0 | | | 62,985 | | | 2.99 | | | 1,222 | | | 2,079 | | | 483 | |
February 2, 2005 MEP III | | | 140,000 | | | 0 | | | 27,960 | | | 0 | | | 167,960 | | | 0 | | | 2.78 | | | 906 | | | 1,552 | | | — | |
May 1, 2005 MEP III | | | 180,000 | | | 0 | | | 35,949 | | | 0 | | | 215,949 | | | 0 | | | 2.58 | | | 1,227 | | | 2,069 | | | — | |
June 1, 2005 MEP III | | | 125,000 | | | 0 | | | 24,964 | | | 0 | | | 0 | | | 149,964 | | | 2.58 | | | 852 | | | 1,437 | | | 1,161 | |
March 31, 2006 MEP III | | | 50,000 | | | 0 | | | 9,986 | | | 0 | | | 0 | | | 59,986 | | | 3.59 | | | 379 | | | 420 | | | 661 | |
May 22, 2006 MEP III | | | 0 | | | 300,000 | | | 0 | | | 0 | | | 0 | | | 300,000 | | | 3.88 | | | 546 | | | 2,103 | | | 1,788 | |
| | | | | | | | | | | | | | | | | | | | | | | | | | |
| | | 682,500 | | | 300,000 | | | 136,305 | | | 0 | | | 383,909 | | | 734,897 | | | | | | | | | | | | | |
| | | | | | | | | | | | | | | | | | | | | | | | | | |
- *
- For Explanation, see section MEP II and III, paragraphs 1 and 2
For MEP II and III the Company recognized a decrease in compensation expense and a corresponding decrease in other liabilities in the amount of T€26 in fiscal year ended March 31, 2009 due to changes in the option value, of which the entire amount has vested (prior year: increase in the amount of T€1,940, for the fiscal year ended March 31, 2007: increase in the amount of T€4,558). None of the options granted have been canceled since granting. Therefore, all options shown are fully vested and outstanding as of year end March 31, 2009 (prior year: 382,409 vested and 52,488 remained unvested, as of March 31, 2007: 258,688 vested and 476,209 unvested).
The net book value of the liability relating to MEP II and III at March 31, 2009 amounts to T€5,187 (prior year: T€5,252, as of March 31, 2007: T€4,736).
Indirect MEP IV
Since March 2007, an additional management participation plan has been implemented, including options on interests in the Partnership (MEP IV option program) and interests in the Partnership
F-64
Table of Contents
which are held indirectly via Kabel Management Beteiligungs- (MEP IV) GbR (Indirect MEP IV). Kabel Management Beteiligungs- (MEP IV) GbR is itself a limited partner in the Partnership.
The general rules of the indirect MEP IV plan are substantially the same as for the indirect MEP I. All members of the indirect MEP IV were admitted to the program through ownership in Kabel Management Beteiligungs- (MEP IV) GbR, a limited partner in the Partnership holding common interests in the Partnership.
The members of the indirect MEP IV were required to pay a capital contribution upon admission. The Partnership and the Kabel Management Beteiligungs- (MEP IV) GbR, respectively, have financed 80% of the managers' contributions with a loan from the Partnership. Interest accrues on such loan at a rate of 5.0% per annum, compounded annually, and is repayable in accordance with an amortization schedule in the relevant agreement. The members are entitled to proceeds received by them in respect of their interests.
Put or call provisions apply to the members' Partnership interests in the event that such member ceases to be employed by KDG GmbH or its subsidiaries.
The total number of interests in Kabel Management Beteiligungs- (MEP IV) GbR issued under the Indirect MEP IV amounts to 540,758. During the fiscal year ended March 31, 2009, 26,674 of these interests were sold at a price of €14.66 per interest by the respective members and 40,013 of these interest was called due to ceasing employment (prior year: no interests sold or called).
Grant date
The grant date determines the point in time at which the fair value of the services of the members of MEP is measured. The persons who are members of the indirect MEP IV participate in Kabel Management Beteiligungs- (MEP IV) GbR with a grant date as of March 29, 2007.
Number of interests granted
As of March 31, 2009, the members of that management participation plan indirectly hold interests in Cayman Cable Holding L.P. of 0.47% (prior year: 0.54%). The total consideration paid for these interests amounts to T€5,689 (prior year: T€6,489).
Measurement
Under the Indirect MEP IV as of March 29, 2007, the fair value of the interests at March 31, 2009 amounts to T€6,950 (prior year: T€7,928).
As for the MEP I, the carrying amount of the repurchase obligation related to vested MEP IV interests at each reporting date is measured based on estimated fair value. This amount is recognized over a vesting period of four years commencing at grant date using the accelerated recognition method in accordance with IFRS 2 whereby 25% are vested at each anniversary. Therefore the program is split into 4 different layers, for which fair value is calculated at each reporting date. As of March 31, 2009, T€6,687 have vested (prior year: T€7,238). The liability was recorded in other liabilities. Included in these amounts is the contribution made by the members of indirect MEP IV since such contributions are a liability in case of the sale of the interests. Due to changes in the fair value of the interests and due to additional vesting, the Company recognized an increase in expenses and an increase in other liabilities for the fiscal year ended March 31, 2009 in the amount of T€278 (prior year: T€749).
F-65
Table of Contents
MEP IV Option Program
Under the MEP IV Option Program, the participants were granted options on interests in the Cayman Cable Holding L.P. The terms and conditions of this management participation plan are substantially the same as for the other option programs.
Number of options granted
During the fiscal year ended March 31, 2008 and in conjunction with the implementation of the additional plan, 2,085,908 options have been granted. Furthermore, 24,084 options have been called in that period based on the regulations in the amended and restated Cayman Cable Holding L.P. option plan—MEP IV (prior year: 48,170).
As of March 31, 2009, a total of 2,013,654 options (prior year: 2,037,738 options) have been granted to the participants in MEP IV representing a 2.01% interest (prior year: 2.04%) in the Cayman Cable Holding L.P.
Grant date and terms
The options under the MEP IV Option program have been issued with a grant date as of March 29, 2007. The weighted average remaining life of the options is 2.99 years as of March 31, 2009 (prior year: 3.99 years).
Method and extent of exercise
The Options will become immediately vested and exercisable upon any of the following events:
- •
- the date of completion of the sale, or disposal in any other manner, of all or substantially all of the business and assets of the Group to a third party purchaser (which is not itself a Group undertaking or under common ownership with a Group undertaking);
- •
- the effective date of a Flotation whereby Flotation means any underwritten public offering of the shares of a holding undertaking of Group Companies; or
- •
- the date of an Approved Offer whereby Approved Offer means an offer to acquire all of the issued limited partnership interests in the Partnership,
after which they will lapse if unexercised.
In addition, the general partner of Cayman Cable Holding L.P. may, at its absolute discretion, allow options to become exercisable, in whole or in part, prior to an exit event.
The general partner may decide that, instead of procuring the issue or transfer of interests in Cayman Cable Holding L.P. (LP interests) on exercise of an option that it will:
- •
- pay to the option holder (after deduction of any taxes, social security contributions duties or other expenses) a cash amount equal to the difference between the market value of the LP interests which would otherwise be issued or transferred and the exercise price for those LP interests; or
- •
- transfer to the option holder a number of the shares of any Group company which has a market value equal to the difference between the market value of the LP interests which would otherwise be issued or transferred and the exercise price for those LP interests; or
- •
- transfer to the option holder a number of the shares which are admitted to listing which has a market value of the difference between the market value of the LP interests which would otherwise be issued or transferred and the exercise price for those LP interests.
F-66
Table of Contents
Any other transfer of options is restricted to certain limited options (e.g. ceasing employment). Any transfer of an option otherwise than permitted in this program would cause the option to lapse.
Measurement
The measurement of the fair value at grant date and each consecutive reporting period is based on the Black-Scholes option pricing model. The main parameters are the estimated fair value of the interests, expected volatility of the values of the interests, the estimated term of the options and the risk free interest rate on grant date (based on the estimated average life of the options of five years). The grant of the options is not dependent on market conditions, whereby expected future distributions are included in the calculation.
The volatility was estimated at 25% by benchmarking historical volatilities of listed international cable companies that are comparable regarding the parameters that typically influence the volatility.
The strike price is €12.00 for all options in the MEP IV Option Program.
| | | | | | | | | | | | | | | | | | | | | | | | | | | | |
| |
| |
| |
| |
| |
| | Risk
free
interest
rate at
grant
date | |
| |
| |
| |
|---|
| | Number of options | |
| |
| |
| |
|---|
| | Fair value
of option
at grant
date | | Fair value
of shares
at grant
date | | Fair value of
option at
measurement
date | |
|---|
Grant date | | March 31,
2008 | | Granted | | Called | | Exercised | | March 31,
2009 | |
|---|
| |
| |
| |
| |
| |
| | (%)
| | in T€
| | in T€
| | in T€
| |
|---|
March 29, 2007 MEP IV Option Program | | | 2,037,738 | | | 0 | | | 24,084 | | | 0 | | | 2,013,654 | | | 4.00 | | | 7,165 | | | 24,447 | | | 8,477 | |
| | | | | | | | | | | | | | | | | | | | | | | | | | | | |
| |
| |
| |
| |
| |
| | Risk
free
interest
rate at
grant
date | |
| |
| |
| |
|---|
| | Number of options | |
| |
| |
| |
|---|
| | Fair value
of option
at grant
date | | Fair value
of shares
at grant
date | | Fair value of
option at
measurement
date | |
|---|
Grant date | | March 31,
2007 | | Granted | | Called | | Exercised | | March 31,
2008 | |
|---|
| |
| |
| |
| |
| |
| | (%)
| | in T€
| | in T€
| | in T€
| |
|---|
March 29, 2007 MEP IV Option Program | | | 0 | | | 2,085,908 | | | 48,170 | | | 0 | | | 2,037,738 | | | 4.00 | | | 7,165 | | | 24,447 | | | 10,509 | |
For the MEP IV Option Program, the Company recognized compensation expense and a corresponding increase in other liabilities in the amount of T€1,238 in the fiscal year ended March 31, 2009, of which the entire amount has vested (prior year: T€5,514). None of the options granted have been canceled since granting. Therefore all options shown are outstanding as of year end March 31, 2009 of which 1,006,827 vested and 1,006,827 remain unvested (prior year: 509,435 vested and 1,528,303 remained unvested).
The net book value of the liability relating to the MEP IV Option Program at March 31, 2009 amounts to T€6,711 (prior year: T€5,473).
MEP V
Under MEP V, the participants were granted options on interests in the Cayman Cable Holding L.P. The terms and conditions of this management participation plan are substantially the same as for the other option programs.
Number of options granted
During the fiscal year ended March 31, 2008 and in conjunction with the implementation of the additional plan, 481,688 options have been granted. All these options representing a 0.48% interest in the Cayman Cable Holding L.P. are outstanding as of March 31, 2009.
F-67
Table of Contents
Under the MEP V option plan, 204,000 additional options have been granted during the fiscal year ended March 31, 2009. All these options representing a 0.20% interest in the Cayman Cable Holding L.P. are outstanding as of March 31, 2009.
Grant date and terms
The options under MEP V have been issued with a grant date as of December 3, 2007 and—for the additional option—January 23, 2009 respectively. The weighted average remaining life of the options is 4.01 years as of March 31, 2009 (prior year: 4.67 years).
Method and extent of exercise
The options will become immediately vested and exercisable upon any of the following events:
- •
- the date of completion of the sale, or disposal in any other manner, of all or substantially all of the business and assets of the Group to a third party purchaser (which is not itself a Group undertaking or under common ownership with a Group undertaking);
- •
- the effective date of a Flotation whereby Flotation means any underwritten public offering of the shares of a holding undertaking of Group Companies; or
- •
- the date of an Approved Offer whereby Approved Offer means an offer to acquire all of the issued limited partnership interests in the Partnership,
after which they will lapse if unexercised.
In addition, the general partner of Cayman Cable Holding L.P. may, at its absolute discretion, allow options to become exercisable, in whole or in part, prior to an exit event.
The general partner may decide that, instead of procuring the issue or transfer of interests in Cayman Cable Holding L.P. (LP interests) on exercise of an option that it will:
- •
- pay to the option holder (after deduction of any taxes, social security contributions duties or other expenses) a cash amount equal to the difference between the market value of the LP interests which would otherwise be issued or transferred and the exercise price for those LP interests; or
- •
- transfer to the option holder a number of the shares of any Group company which has a market value equal to the difference between the market value of the LP interests which would otherwise be issued or transferred and the exercise price for those LP interests; or
- •
- transfer to the option holder a number of the shares which are admitted to listing which has a market value of the difference between the market value of the LP interests which would otherwise be issued or transferred and the exercise price for those LP interests.
Any other transfer of options is restricted to certain limited options (e.g. ceasing employment). Any transfer of an option otherwise than permitted in this program would cause the option to lapse.
Measurement
The measurement of the fair value at grant date and each consecutive reporting period is based on the Black-Scholes options pricing model. The main parameters are the estimated fair value of the interests, expected volatility of the values of the interests, the estimated term of the options and the risk free interest rate on grant date (based on the estimated average life of the options of five years). The grant of the options is not dependent on market conditions, whereby expected future distributions are included in the calculation.
F-68
Table of Contents
The volatility was estimated at 25% by benchmarking historical volatilities of listed international cable companies that are comparable regarding the parameters that typically influence the volatility.
The strike price is €14.66 for all options in the MEP V Option Program.
| | | | | | | | | | | | | | | | | | | | | | | | | | | | |
| |
| |
| |
| |
| |
| | Risk
free
interest
rate at
grant
date | |
| |
| |
| |
|---|
| | Number of options | |
| |
| |
| |
|---|
| | Fair value
of option
at grant
date | | Fair value
of shares
at grant
date | | Fair value of
option at
measurement
date | |
|---|
Grant date | | March 31,
2008 | | Granted | | Called | | Exercised | | March 31,
2009 | |
|---|
| |
| |
| |
| |
| |
| | (%)
| | in T€
| | in T€
| | in T€
| |
|---|
December 3, 2007 MEP V | | | 481,688 | | | 0 | | | 0 | | | 0 | | | 481,688 | | | 3.90 | | | 2,127 | | | 7,062 | | | 1,555 | |
January 23, 2009 MEP V | | | 0 | | | 204,000 | | | 0 | | | 0 | | | 204,000 | | | 2.57 | | | 815 | | | 2,991 | | | 781 | |
| | | | | | | | | | | | | | | | | | | | | | | | |
| | | 481,688 | | | 204,000 | | | 0 | | | 0 | | | 685,688 | | | | | | | | | | | | | |
| | | | | | | | | | | | | | | | | | | | | | | | | | | | |
| |
| |
| |
| |
| |
| | Risk
free
interest
rate at
grant
date | |
| |
| |
| |
|---|
| | Number of options | |
| |
| |
| |
|---|
| | Fair value
of option
at grant
date | | Fair value
of shares
at grant
date | | Fair value of
option at
measurement
date | |
|---|
Grant date | | March 31,
2007 | | Granted | | Called | | Exercised | | March 31,
2008 | |
|---|
| |
| |
| |
| |
| |
| | (%)
| | in T€
| | in T€
| | in T€
| |
|---|
December 3, 2007 MEP V | | | 0 | | | 481,688 | | | 0 | | | 0 | | | 481,688 | | | 3.90 | | | 2,127 | | | 7,062 | | | 2,014 | |
For MEP V, the Company recognized compensation expense and a corresponding increase in other liabilities in the amount of T€564 in fiscal year ended March 31, 2009, of which the entire amount has vested (prior year: T€524). None of the options granted have been canceled since granting. Therefore all options shown are outstanding as of year end March 31, 2009 of which 120,422 vested and 565,266 remain unvested (prior year: none vested and 481,688 remained unvested).
The net book value of the liability relating to the MEP V Option Program at March 31, 2009 amounts to T€1,088 (prior year: T€524).
5.5 Financial Instruments
KDG is exposed to market risks from changes in interest rates and currency exchange rates which can impact its operating results and overall financial condition. KDG manages its exposure to these market risks through its operating and financing activities and, when deemed appropriate or required by other agreements, through hedging strategies that utilize derivative financial instruments. The main strategy is to avoid or to mitigate risks, e.g. currency risk by entering into currency swaps or the risk of variable interest payments by entering into interest rate swaps and buying caps. Derivative instruments are only used to hedge existing or prospective transactions.
Of KDG's financial instruments, only the Senior Notes bear fixed interest and a fair value interest rate risk, whereas the bank loans bear variable interests and cash flow interest rate risks.
The Company has incurred debt that is denominated in US Dollars and Euros, primarily via bond issues and bank borrowings. The total notional amount of debt denominated in US Dollar is TUS$610,000 as of March 31, 2009, March 31, 2008 and March 31, 2007. As a result, KDG is exposed to risks from changes in interest rates and exchange rates.
Risks are initially hedged by way of naturally closed positions in which the values or the cash flows of primary financial instruments are matched in terms of maturity and amounts. Any residual risks are mitigated by way of conventional derivative financial instruments.
F-69
Table of Contents
As of the balance sheet date, derivative financial instruments consisted of the following (notional amounts):
| | | | | | | | | | |
| | March 31,
2009 | | March 31,
2008 | | March 31,
2007 | |
|---|
| | T€
| | T€
| | T€
| |
|---|
Interest Rate Swaps | | | | | | | | | | |
Within one year | | | 629,568 | | | 75,960 | | | 71,863 | |
One to five years | | | 0 | | | 379,568 | | | 455,528 | |
More than 5 years | | | 0 | | | 0 | | | 0 | |
| | | | | | | | |
Total | | | 629,568 | | | 455,528 | | | 527,391 | |
Interest Rate Cap | | | | | | | | | | |
Within one year | | | 126,523 | | | 25,320 | | | 23,954 | |
One to five years | | | 0 | | | 126,523 | | | 151,843 | |
More than 5 years | | | 0 | | | 0 | | | 0 | |
| | | | | | | | |
Total | | | 126,523 | | | 151,843 | | | 175,797 | |
Currency Swaps | | | | | | | | | | |
Within one year | | | 505,553 | | | 0 | | | 0 | |
One to five years | | | 505,553 | | | 505,553 | | | 505,553 | |
More than 5 years | | | 0 | | | 0 | | | 0 | |
| | | | | | | | |
Total | | | 1,011,106 | | | 505,553 | | | 505,553 | |
Total nominal volume | | |
1,767,197 | | |
1,112,924 | | |
1,208,741 | |
| | | | | | | | |
The nominal volume is the sum total of all purchase and sale amounts of the interest rate and currency derivatives. The nominal amounts are equal to the volume of the hedged items.
Currency swaps are accounted for using cash flow hedge accounting. Changes in the fair value of the currency swaps are recognized directly in equity under cash flow hedge reserve. The accumulated amount is released to profit or loss insofar as the hedged transaction is ineffective or affects profit or loss of the year. The currency swaps accounted for using the cash flow hedge accounting expire on June 30, 2009.
Interest Rate Swaps and Caps
Approximately T€1,037,500 borrowed under the Company's initial senior loan facility in 2003 was used to fund the acquisition of the cable television business. The interest rate volatility related to these outstanding loans was mitigated with a combination of interest rate swaps and caps at the time the bank loans were incurred. The loans were extended by the lending banks subject to the condition that the Company would enter into appropriate interest rate swaps and interest caps.
With the interest rate swaps, the variable interest rates (EURIBOR) on KDG's bank loans are effectively exchanged for a fixed interest rate of 3.705% per annum. KDG initially entered into interest rate swaps with a notional amount of T€778,125 which will be amortized until June 2009. These swaps entitle KDG to receive a payment from the counterparty if the variable market interest rate exceeds the fixed interest rate, and oblige KDG to make a payment to the counterparty if the fixed interest rate exceeds the variable market interest rate. These types of agreements are entered into to effectively convert the interest rates on a portion of KDG's long-term liabilities to banks from variable to fix. KDG also purchased interest rate caps with a cap level of 4.2% per annum with a notional amount of T€259,375 which will be amortized until June 2009. These caps entitle KDG to receive a payment from
F-70
Table of Contents
the counterparty equal to the excess, if any, of the hypothetical interest expense on a specified notional amount at a current market interest rate over an amount specified in the agreement.
In September 2004, the aforementioned interest rate swaps and caps had been restructured. Originally, these derivatives had a maturity until 2015 and the effective interest rate on the swaps was 4.0495%.
As of April 30, 2008 the Company entered into an additional floating to fix interest rate swap. This swap with a fixed rate of 4.41% per annum and a notional amount of T€250,000 had a one year duration until April 30, 2009.
Currency Swaps
KDG GmbH issued TUS$610,000 of 10.625% Senior Notes on July 2, 2004. Interest payment dates are semi-annual each January 1 and July 1, commencing in January 2005. Interest accrues from the issue date of the notes on July 2, 2004. The Senior Notes are not callable until after the fifth anniversary of the issuance date.
KDG GmbH entered into a derivative agreement swapping 100% of the US Dollar denominated principal and interest payments into Euro denominated principal and interest payments at a fixed rate over five consecutive years with various banks. The agreed exchange rate is US$1.2066 for each Euro. The weighted average Euro fixed rate considering derivatives currently in place is 10.2046%. The Cross Currency swap matures on July 1, 2009.
With respect to the Company's 2014 Senior Notes, the Company also entered into a hedge agreement swapping 100% of the US-Dollar denominated principal (TUS$610,000) and interest payments into Euro denominated principal and interest payments at a fixed rate over five starting in July 2004 with various banks. The agreed exchange rate is US$1.2066 for each Euro. The weighted average interest rate across all Euro denominated debt until July 2009 considering derivatives currently in place is 10.2046%. We successfully negotiated new swap agreements which effectively prolonged the existing currency hedges by two years until July 2011. By March 31, 2009 100% of the US-Dollar denominated principal and interest payments with respect to the Company's 2014 Senior Notes were swapped into Euro at the same rate of US$1.2066 for each Euro. The new swap agreements run from July 2009 until July 2011 with a weighted average Euro fixed rate of 11.1695%.
Credit Risk
Credit risk is the risk of a financial loss if a customer or counterparty to a financial instrument fails to meet its contractual obligations. It arises principally from receivables of customers. The exposure to credit risk is influenced mainly by the individual characteristics of each customer. The maximum exposure to credit risk amounts to T€106,579.
For all payments underlying the financial instruments, collateral like guarantees must be requested, credit ratings/references obtained and a track record of prior business relations used in order to minimize the credit risk depending on the nature and extent of the respective payments. Without taking into account any collateral or other credit enhancements, the carrying amount of financial assets represents the maximum exposure to credit risk.
Impairment losses are recognized for any credit risks associated with the financial assets. The credit risk associated with derivative financial instruments is minimized in that only counterparties with top credit ratings are selected. For this reason, the general credit risk relating to the derivatives used by the Company is not considered to be significant. No concentration of credit risks from business relations with individual debtors is evident.
F-71
Table of Contents
Interest Rate Risk
Of KDG's financial liabilities, only the Senior Notes bear fixed interest and a fair value interest rate risk, whereas the bank loans bear cash flow interest rate risks linked to EURIBOR. Until June 2009 KDG's interest payment risk is mitigated by the derivatives described.
Liquidity risk
Liquidity risk represents the risk that liquidity reserves will prove to be insufficient to meet financial obligations in a timely manner. In order to ensure liquidity the Company has unused Senior Credit Facilities and other lines of credit amounting to T€325,000, T€909,000 and T€200,000 at March 31, 2009, March 31, 2008 and March 31, 2007, respectively. In the fiscal year 2008 an amount of T€650,000 was included relating to the Senior Credit Facility Tranche C.
Future cash outflows arising from financial liabilities that are recognized in the Consolidated Balance Sheet are presented in the following table. This includes payments to settle the liabilities and interest payments as well as cash outflows from cash settled derivatives with a negative market value. Financial liabilities that are repayable on demand are included on the basis of the earliest date of repayment. Cash flows for variable interest liabilities are determined with reference to the market conditions at the balance sheet date.
| | | | | | | | | | | | | | | | |
March 31, 2009 | | Up to
1 year | | Between 1
and 3 years | | Between 3
and 5 years | | After
5 years | | Total | |
|---|
| | T€
| | T€
| | T€
| | T€
| | T€
| |
|---|
Senior Notes | | | 78,465 | | | 156,930 | | | 156,930 | | | 794,785 | | | 1,187,110 | |
Financial liabilities | | | 57,208 | | | 1,318,497 | | | 572,753 | | | 0 | | | 1,948,458 | |
Trade payables | | | 260,778 | | | 0 | | | 0 | | | 0 | | | 260,778 | |
Finance lease liabilities | | | 10,665 | | | 20,980 | | | 537 | | | 0 | | | 32,182 | |
Other financial liabilities | | | 18,507 | | | 0 | | | 0 | | | 0 | | | 18,507 | |
Derivative financial liabilities | | | 5,391 | | | 58,849 | | | 0 | | | 0 | | | 64,240 | |
| | | | | | | | | | | | |
Total | | | 431,014 | | | 1,555,256 | | | 730,220 | | | 794,785 | | | 3,511,275 | |
| | | | | | | | | | | | |
| | | | | | | | | | | | | | | | |
March 31, 2008 | | Up to
1 year | | Between 1
and 3 years | | Between 3
and 5 years | | After
5 years | | Total | |
|---|
| | T€
| | T€
| | T€
| | T€
| | T€
| |
|---|
Senior Notes | | | 78,465 | | | 156,930 | | | 156,929 | | | 873,250 | | | 1,265,574 | |
Financial liabilities | | | 70,350 | | | 133,369 | | | 1,223,810 | | | 0 | | | 1,427,529 | |
Trade payables | | | 218,293 | | | 0 | | | 0 | | | 0 | | | 218,293 | |
Finance lease liabilities | | | 10,645 | | | 21,285 | | | 10,828 | | | 0 | | | 42,758 | |
Other financial liabilities | | | 3,463 | | | 0 | | | 0 | | | 0 | | | 3,463 | |
Derivative financial liabilities | | | 9,910 | | | 107,351 | | | 0 | | | 0 | | | 117,261 | |
| | | | | | | | | | | | |
Total | | | 391,126 | | | 418,935 | | | 1,391,567 | | | 873,250 | | | 3,074,878 | |
| | | | | | | | | | | | |
| | | | | | | | | | | | | | | | |
March 31, 2007 | | Up to
1 year | | Between 1
and 3 years | | Between 3
and 5 years | | After
5 years | | Total | |
|---|
| | T€
| | T€
| | T€
| | T€
| | T€
| |
|---|
Senior Notes | | | 78,465 | | | 156,930 | | | 156,930 | | | 951,715 | | | 1,344,040 | |
Financial liabilities | | | 77,593 | | | 136,677 | | | 1,293,386 | | | 0 | | | 1,507,656 | |
Trade payables | | | 175,518 | | | 0 | | | 0 | | | 0 | | | 175,518 | |
Finance lease liabilities | | | 10,008 | | | 19,889 | | | 19,592 | | | 536 | | | 50,025 | |
Other financial liabilities | | | 8,460 | | | 0 | | | 0 | | | 0 | | | 8,460 | |
Derivative financial liabilities | | | 3,196 | | | 54,877 | | | 0 | | | 0 | | | 58,073 | |
| | | | | | | | | | | | |
Total | | | 353,240 | | | 368,373 | | | 1,469,908 | | | 952,251 | | | 3,143,772 | |
| | | | | | | | | | | | |
F-72
Table of Contents
Capital management
The primary objective of the Company's capital management is to ensure that it maintains a strong credit rating to reduce risks from its highly leveraged financing structure.
This is monitored using the debt covenants of the Senior Credit Facility and the indenture of the Senior Notes.
The Company's ability to make payments and to refinance its debt, and to fund future operations and capital expenditures, will depend on future operating performance and the ability to generate sufficient cash. Accordingly the Company manages its capital structure and makes adjustments to it in light of changes in economic conditions.
Carrying amounts of Financial Instruments
The following table presents the carrying amounts of financial instruments according to categories of IAS 39:
| | | | | | | | | | |
| | Mar. 31,
2009 | | Mar. 31,
2008 | | Mar. 31,
2007 | |
|---|
| | T€
| | T€
| | T€
| |
|---|
Financial assets at fair value through profit or loss | | | 0 | | | 4,239 | | | 5,414 | |
Loans and Receivables | | | 187,107 | | | 148,956 | | | 158,379 | |
Available-for-Sale financial assets | | | 0 | | | 0 | | | 7,510 | |
| | | | | | | | |
| | | 187,107 | | | 153,195 | | | 171,303 | |
| | | | | | | | |
Financial liabilities at fair value through profit or loss | | | 18,848 | | | 0 | | | 0 | |
Financial liabilities measured at amortized cost | | | 2,649,188 | | | 2,163,259 | | | 2,079,799 | |
| | | | | | | | |
| | | 2,668,036 | | | 2,163,259 | | | 2,079,799 | |
| | | | | | | | |
The category Available-for-Sale financial assets in the prior years included equity instruments measured at amortized cost because they did not have a quoted market price and their value could not be measured reliably amounting to T€156 for the year ended March 31, 2007.
The following table shows net gains or losses of financial instruments according to categories of IAS 39 recognized in the Consolidated Statement of Operations:
| | | | | | | | | | |
| | Fiscal Year Ended March 31, | |
|---|
| | 2009 | | 2008 | | 2007 | |
|---|
| | (in T€)
| |
|---|
Financial assets and liabilities at fair value through profit or loss | | | (7,069 | ) | | (1,175 | ) | | 8,655 | |
Loans and Receivables | | | (9,011 | ) | | (27,964 | ) | | (19,695 | ) |
Available-for-Sale financial assets | | | 394 | | | 2,337 | | | 0 | |
Financial liabilities measured at amortized cost | | | (79,529 | ) | | 72,244 | | | 45,939 | |
| | | | | | | | |
| | | (95,215 | ) | | 45,442 | | | 34,899 | |
| | | | | | | | |
Net gains or losses on financial assets and liabilities at fair value through profit or loss include the effects from the fair value measurement of the derivatives that are not part of a hedge accounting relationship.
Net gains and losses on loans and receivables comprise mainly impairment losses and reversals.
Net gains or losses of Available-for-Sale financial assets result from the sale of interests in other companies. In the fiscal year 2008 the amount relates to the sale of Primacom.
Net gains and losses on financial liabilities measured at amortized cost include effects from foreign currency translation and from early settlement.
F-73
Table of Contents
Net gains and losses on financial liabilities measured at amortized cost include effects from foreign currency translation from the Senior Notes denominated in US Dollar which is accounted for under hedge accounting provisions. The effects are completely compensated through the hedging instruments.
Fair Values of Financial Instruments
The following table presents the carrying amounts and fair values of financial assets and liabilities included in each balance sheet item.
| | | | | | | | | | | | | | | | | | | | | | | |
| |
| | March 31, 2009 | | March 31, 2008 | | March 31, 2007 | |
|---|
| | Category
according to
IAS 39 | | Carrying
Amount | | Fair Value | | Carrying
Amount | | Fair Value | | Carrying
Amount | | Fair Value | |
|---|
| |
| | T€
| | T€
| | T€
| |
|---|
Financial assets measured at cost or amortized cost | | | | | | | | | | | | | | | | | | | | | |
| | Cash and Cash Equivalents | | LaR | | | 51,922 | | | 51,922 | | | 15,463 | | | 15,463 | | | 54,108 | | | 54,108 | |
| | Trade Receivables | | LaR | | | 106,579 | | | 106,579 | | | 130,878 | | | 130,878 | | | 101,370 | | | 101,370 | |
| | Receivables from Affiliates | | LaR | | | 834 | | | 834 | | | 922 | | | 922 | | | 1,019 | | | 1,019 | |
| | Receivables from Associates | | LaR | | | 0 | | | 0 | | | 31 | | | 31 | | | 108 | | | 108 | |
| | Other Current financial assets | | LaR | | | 27,772 | | | 27,772 | | | 1,662 | | | 1,662 | | | 1,774 | | | 1,774 | |
| | Other Financial Assets* | | AfS | | | 0 | | | 0 | | | 0 | | | 0 | | | 156 | | | 0 | |
Financial assets measured at fair value | | | | | | | | | | | | | | | | | | | | | |
| | Other Financial Assets | | AfS | | | 0 | | | 0 | | | 0 | | | 0 | | | 7,354 | | | 7,354 | |
| | Other non-current Assets Derivatives without a hedging relationship | | FAHfT | | | 0 | | | 0 | | | 4,239 | | | 4,239 | | | 5,414 | | | 5,414 | |
Financial liabilities measured at cost or amortized cost | | | | | | | | | | | | | | | | | | | | | |
| | Current Financial Liabilities | | FLAC | | | 39,522 | | | 39,522 | | | 25,674 | | | 25,674 | | | 36,997 | | | 36,997 | |
| | Trade payables | | FLAC | | | 260,778 | | | 260,778 | | | 218,293 | | | 218,293 | | | 175,518 | | | 175,518 | |
| | Liabilities to Associates | | FLAC | | | 0 | | | 0 | | | 323 | | | 323 | | | 324 | | | 324 | |
| | Other Current financial Liabilities | | | | | | | | | | | | | | | | | | | | | |
| | | Other financial liabilities | | FLAC | | | 18,507 | | | 18,507 | | | 3,140 | | | 3,140 | | | 8,398 | | | 8,398 | |
| | | Finance lease liabilities | | n/a | | | 8,858 | | | 8,858 | | | 8,228 | | | 8,228 | | | 7,184 | | | 7,184 | |
| | Senior Notes | | FLAC | | | 680,130 | | | 709,620 | | | 603,840 | | | 624,996 | | | 672,782 | | | 804,915 | |
| | Senior Credit Facility | | FLAC | | | 1,650,251 | | | 1,650,251 | | | 1,191,404 | | | 1,191,404 | | | 1,127,436 | | | 1,127,436 | |
| | Other non-current Liabilities | | | | | | | | | | | | | | | | | | | | | |
| | | Finance lease liabilities | | n/a | | | 19,978 | | | 19,886 | | | 28,836 | | | 28,744 | | | 34,675 | | | 34,587 | |
Financial liabilities measured at fair value | | | | | | | | | | | | | | | | | | | | | |
| | Non-current Financial Liabilities | | | | | | | | | | | | | | | | | | | | | |
| | | Derivatives without a hedging relationship | | FLHfT | | | 18,848 | | | 18,848 | | | 0 | | | 0 | | | 0 | | | 0 | |
| | | Derivatives with a hedging relationship | | n/a | | | 47,975 | | | 47,975 | | | 120,585 | | | 120,585 | | | 58,606 | | | 58,606 | |
- *
- This line consists of equity instruments classified as available-for-sale, for which a fair value could not be reliably measured and which are recognized at cost.
F-74
Table of Contents
The terms have the following respective meanings:
"LaR" refers to Loans and Receivables
"AfS" refers to Available-for-Sale
"FAHfT" refers to Financial Assets Held for Trading
"FLAC" refers to Financial Liabilities Measured at Amortized Cost
"FLHfT" refers to Financial Liabilities Held for Trading
The carrying amounts of the Company's cash and cash equivalents, trade receivables and payables, short-term loans, as well as other current liabilities, in view of their short terms as of March 31, 2009, 2008, and 2007, are effectively equal to their fair values as they have interest rates based on variable interest rates that change in line with the market. Using a discounted cash flow analysis based on the current lending rate for an identical loan term, the fair value of the Company's long-term, fixed-rate liabilities is estimated as the net present value of future payments, using yield curves obtained by banks and money market observations. Due to the complexity inherent in such an estimate, the estimate may not necessarily reflect actual market values. Different market assessments or procedures may therefore significantly influence the fair value estimate.
The fair value of the Euro denominated portion of the Senior Notes as of March 31, 2009 amounts to approximately T€251,250 (100.50% of nominal value). The fair value of the US Dollar denominated portion of the Senior Notes amounts to approximately T€458,370 (100.00% of nominal value). These values are determined by reference to published price quotations. With respect to the carrying amounts of the financial assets and liabilities please refer to the respective sections in the Notes.
The fair values of the derivative financial instruments as of the balance sheet date have been estimated as net present values (discounted by market yield curves) of the future payments and using standard models (in the case of caps). They are as follows:
| | | | | | | | | | | | | |
Instrument | | Notional
amount
March 31,
2009 | | Fair value
March 31,
2009 | | Recognized
in statement
of operations
April 1, 2008-
March 31,
2009 | | Recognized
in equity
April 1, 2008-
March 31,
2009 | |
|---|
| | T€
| | T€
| | T€
| | T€
| |
|---|
Interest rate swap | | | 629,568 | | | (2,830 | ) | | (6,455 | ) | | 0 | |
Interest rate cap | | | 126,523 | | | 0 | | | (614 | ) | | 0 | |
Currency swap | | | 1,011,106 | | | (54,916 | ) | | (79,529 | ) | | 1,906 | |
| | | | | | | | | | |
Total | | | 1,767,197 | | | (57,746 | ) | | (86,598 | ) | | 1,906 | |
| | | | | | | | | | |
Deferred Taxes | | | 0 | | | 0 | | | 0 | | | (559 | ) |
| | | | | | | | | | |
Total | | | 1,767,197 | | | (57,746 | ) | | (86,598 | ) | | 1,347 | |
| | | | | | | | | | |
F-75
Table of Contents
| | | | | | | | | | | | | |
Instrument | | Notional
amount
March 31,
2008 | | Fair value
March 31,
2008 | | Recognized
in statement
of operations
April 1, 2007-
March 31,
2008 | | Recognized
in equity
April 1, 2007-
March 31,
2008 | |
|---|
| | T€
| | T€
| | T€
| | T€
| |
|---|
Interest rate swap | | | 455,528 | | | 3,625 | | | (1,358 | ) | | 0 | |
Interest rate cap | | | 151,843 | | | 614 | | | 183 | | | 0 | |
Currency swap | | | 505,553 | | | (120,585 | ) | | 72,244 | | | 12,184 | |
| | | | | | | | | | |
Total | | | 1,112,924 | | | (116,346 | ) | | 71,069 | | | 12,184 | |
| | | | | | | | | | |
Deferred Taxes | | | 0 | | | 0 | | | 0 | | | (4,602 | ) |
| | | | | | | | | | |
Total | | | 1,112,924 | | | (116,346 | ) | | 71,069 | | | 7,582 | |
| | | | | | | | | | |
| | | | | | | | | | | | | |
Instrument | | Notional
amount
March 31,
2007 | | Fair value
March 31,
2007 | | Recognized
in statement
of operations
April 1, 2006-
March 31,
2007 | | Recognized
in equity
April 1, 2006-
March 31,
2007 | |
|---|
| | T€
| | T€
| | T€
| | T€
| |
|---|
Interest rate swap | | | 527,391 | | | 4,983 | | | 8,827 | | | 0 | |
Interest rate cap | | | 175,797 | | | 432 | | | (172 | ) | | 0 | |
Currency swap | | | 505,553 | | | (58,606 | ) | | (35,386 | ) | | 11,694 | |
| | | | | | | | | | |
Total | | | 1,208,741 | | | (53,191 | ) | | (26,731 | ) | | 11,694 | |
| | | | | | | | | | |
Deferred Taxes | | | 0 | | | 0 | | | 0 | | | (4,583 | ) |
| | | | | | | | | | |
Total | | | 1,208,741 | | | (53,191 | ) | | (26,731 | ) | | 7,111 | |
| | | | | | | | | | |
Amounts removed from equity and recognized in income for currency swaps that are part of cash flow hedge accounting according to the tables above are included in interest expense or interest income, respectively.
Sensitivity analysis
KDG prepares sensitivity analysis that shows how net income and equity would have been affected by changes in the relevant market risk variables that were reasonably possible at the reporting date.
Foreign currency risks result from the US Dollar denominated Senior Notes as described in Note 4.11. Future cash flows for the repayment of the principal and interest payments are fully hedged with derivative instruments through to July 2011. A 1% increase (decrease) in the USD/EUR exchange rate subsequently to that would result in an incremental increased (decreased) notional amount to be repaid in 2014 of approximately T€5,100. Further a 1% increase (decrease) in the USD/EUR exchange rate would result in an incremental increased (decreased) annual interest payment of approximately T€500 after expiry of the currency hedge in 2011.
Interest rate risks result from the variable interest rates (EURIBOR) on KDG's bank loans and are hedged with interest rate swaps and caps that are accounted for at fair value through profit or loss. In determining the sensitivity concerning interest rate risks the fair values for interest rate swaps and caps were calculated based on the hypothetical market interest rates with the resulting effects on net income and equity. Due to the very short maturity of these derivatives interest rate sensitivity has shown to be insignificant: The negative/positive effect on net income and equity for a 100 basis point parallel increase/decrease of the interest curve would be below T€4. The effect of interest rate changes on interest expense for bank loans with variable interest rates is calculated based on the risk exposure at the balance sheet date. Excluded from the analysis is the fixed rate Senior Note that is measured at
F-76
Table of Contents
amortized cost so that changes in interest rates do not affect net income. Under this approach and assuming constant foreign exchange rate the interest rate sensitivity is as follows.
| | | | | | | |
| | Effect on net income and equity | |
|---|
| | Parallel increase
of the interest
curve of 100
basis points | | Parallel decrease
of the interest
curve of 100
basis points | |
|---|
| | in T€
| |
|---|
March 31, 2009 | | | (16,850 | ) | | 16,850 | |
Bank loans with variable interest rate | | | 4 | | | (4 | ) |
| | | | | | |
Derivative financial instruments | | | (16,846 | ) | | 16,846 | |
| | | | | | |
March 31, 2008 | | | (12,100 | ) | | 12,100 | |
Bank loans with variable interest rate | | | 3,523 | | | (3,851 | ) |
| | | | | | |
Derivative financial instruments | | | (8,577 | ) | | 8,249 | |
| | | | | | |
March 31, 2007 | | | (11,500 | ) | | 11,500 | |
Bank loans with variable interest rate | | | 6,469 | | | (6,190 | ) |
| | | | | | |
Derivative financial instruments | | | (5,031 | ) | | 5,310 | |
| | | | | | |
5.6 Group Companies
| | | | | | | | |
| |
| | Registered Office | | Share-
Holding
in % | |
|---|
Fully consolidated companies (IFRS 3) | | | | | | |
1 | | Kabel Deutschland GmbH | | Unterfoehring | | | | |
2 | | Kabel Deutschland Verwaltungs GmbH | | Unterfoehring | | | 100.00 | |
3 | | Kabel Deutschland Vertrieb und Service GmbH & Co. KG | | Unterfoehring | | | 100.00 | |
4 | | Kabel Deutschland Breitband Services GmbH | | Unterfoehring | | | 100.00 | |
5 | | TKS Telepost Kabel-Service Kaiserslautern Beteiligungs-GmbH | | Kaiserslautern | | | 100.00 | |
6 | | TKS Telepost Kabel-Service Kaiserslautern GmbH & Co. KG | | Kaiserslautern | | | 100.00 | |
7 | | Urbana Teleunion Rostock GmbH & Co. KG | | Rostock | | | 70.00 | |
8 | | Verwaltung Urbana Teleunion Rostock GmbH | | | | | 50.00 | |
9 | | KABELCOM Braunschweig Gesellschaft für Breitbandkabel-Kommunikation mit beschränkter Haftung | | Braunschweig | | | 99.58 | |
10 | | KABELCOM Wolfsburg Gesellschaft für Breitbandkabel-Kommunikation mit beschränkter Haftung | | Braunschweig | | | 97.65 | |
11 | | AEP Plückhahn GmbH | | Unterfoehring | | | 100.00 | |
12 | | RKS Niedersächsische Kabel-Service-Beteiligungs-gesellschaft mbH | | Hanover | | | 100.00 | |
| | | | | | | | |
| |
| | Registered Office | | Share-
Holding
in % | |
|---|
Companies consolidated at equity (IAS 28) | | | | | | |
13 | | Kabelfernsehen München Servicenter Gesellschaft mit beschränkter Haftung-Beteiligungsgesellschaft | | Munich | | | 24.00 | |
14 | | Kabelfernsehen München Servicenter GmbH & Co. KG | | Munich | | | 30.22 | |
As of April 30, 2008 Kabel-Service Berlin GmbH that had been accounted for by use of the equity method was sold for a total consideration of T€13,000 which is completely discharged by cash and cash
F-77
Table of Contents
equivalents. For further information relating to the sale of Kabel-Service Berlin GmbH, reference is made to note 3.8.
5.7 Particular Events after the Balance Sheet Date
On May 21, 2009, KDG settled the outstanding purchase price adjustment with Orion on the 1.1 million cable subscribers acquired on April 30, 2008. The preliminary purchase price was reduced by T€67,500. Thereof T€8,929 and corresponding interest of T€628 had already been repaid as of March 31, 2009. Another T€10,508 and corresponding interest of T€585 were considered as other receivables. The remaining outstanding amounts were settled at the end of May 2009.
As part of the purchase price adjustment process, KDG is in arbitration regarding a further possible reduction of the purchase price, in addition to the original purchase price reduction of T€67,500, resulting from the allocation of certain central overhead costs.
On May 25, 2009, KDG announced the cooperation with the telecommunications company Telefónica O2 Germany in the mobile sector. The new mobile services 'Mobile Phone' and 'Mobile Internet' are offered along with the Company's existing video, Internet and fixed line phone offerings, without any minimum term of contract, monthly basic fee or minimum revenue. Calls with the 'Mobile Phone' offering are free of charge within the entire Kabel Deutschland network. With 'Mobile Internet', users can also surf the Internet within their daily flat rate while travelling. The new products are available to existing as well as new customers of Kabel Internet & Phone.
5.8 Management and Supervisory Board
Management
| | |
| Dr. Adrian v. Hammerstein | | Chairman of the Management Board,
Chief Executive Officer |
Paul Thomason |
|
Chief Financial Officer |
Dr. Manuel Cubero del Castillo-Olivares |
|
Chief Commercial Officer until March 31, 2009
Chief Operating Officer since April 1, 2009 |
Herbert R. Hribar |
|
Chief Operating Officer until September 30, 2008 |
Erik Adams |
|
Chief Marketing Officer since April 1, 2009 |
Supervisory Board
Representatives of the Shareholders:
| | |
| Prof. Dr. Heinz Riesenhuber | | Chairman of the Board |
Tony Ball |
|
External Advisor |
John Carl Hahn |
|
Providence Equity, Managing Director |
Biswajit Anna Subramanian |
|
Providence Equity, Managing Director |
Robert Sudo |
|
Providence Equity, Senior Associate |
Torsten Winkler |
|
Providence Equity Director until April 30, 2009,
External Advisor since May 1, 2009 |
F-78
Table of Contents
Employee Representatives:
| | |
| Sibylle Spoo | | Secretary of Workers Union
(Gewerkschaftssekretaerin),
Vice Chairman of the Board |
Petra Hesse |
|
Chairman of Workers Council for Region Lower Saxony/Bremen
(Betriebsratsvorsitzende der Region Niedersachsen/Bremen) |
Toni Krüger |
|
Engineering Employee
(Technischer Angestellter) |
Norbert Michalik |
|
Executive Employee
(leitender Angestellter) |
Joachim Pütz |
|
Secretary of Workers Union
(Gewerkschaftssekretaer) |
Rita Billmann |
|
Chairman of Workers Council for Customer Service Center
(Betriebsratvorsitzende Kundenservice Center) |
5.9 Other Mandatory Disclosures According to German Commercial Code
Auditor's remuneration
During the fiscal year ended March 31, 2009, the Company expensed the following amounts for services of its auditor:
| | |
| • Audit fees: | | T€1,284 |
| • Audit-related fees: | | T€7,129 |
| • Tax fees: | | T€516 |
| • All other fees: | | T€2,028 |
5.10 Authorization of Financial Statements
The consolidated financial statements were released for publication on July 22, 2009 (date of management authorization for issue to the supervisory board).
Unterfoehring, July 22, 2009
Kabel Deutschland GmbH
| | |
Dr. Adrian von Hammerstein
Chief Executive Officer | |
Paul Thomason
Chief Financial Officer |
Dr. Manuel Cubero del Castillo-Olivares
Chief Operating Officer | |
Erik Adams
Chief Marketing Officer |
F-79
Table of Contents
Kabel Deutschland GmbH, Unterfoehring
Appendix 1 to the Notes
Analysis of Fixed Assets for Period from April 1, 2008 to March 31, 2009
| | | | | | | | | | | | | | | | | | | | | | | | | | | | | | | | | | | | | | | | | | | | |
| |
| |
| | Acquisition and production costs | | Accumulated depreciation and amortization | | Net book value | |
|---|
| |
| |
| | April 1,
2008 | | Acquisitions | | Additions | | Disposals | | Reclassifications | | March 31,
2009 | | April 1,
2008 | | Additions | | Disposals | | Reclassification | | Change in
at-equity
investments | | March 31,
2009 | | March 31,
2009 | |
|---|
| |
| |
| | €
| | €
| | €
| | €
| | €
| | €
| | €
| | €
| | €
| | €
| | €
| | €
| | €
| |
|---|
| I. | | Intangible assets | | | | | | | | | | | | | | | | | | | | | | | | | | | | | | | | | | | | | | | | |
| | | 1. | | Software and Licences and other Contractual and Legal Rights | | | 214,786,136.69 | | | 1,666,155.97 | | | 68,154,753.45 | | | 0.00 | | | 8,301,539.29 | | | 292,908,585.40 | | | 116,587,456.24 | | | 64,185,272.39 | | | 0.00 | | | 576.78 | | | 0.00 | | | 180,773,305.41 | | | 112,135,279.99 | |
| | | 2. | | Internally generated software | | | 16,365,133.15 | | | 0.00 | | | 3,871,758.99 | | | 0.00 | | | 0.00 | | | 20,236,892.14 | | | 8,553,674.92 | | | 3,142,650.69 | | | 0.00 | | | 0.00 | | | 0.00 | | | 11,696,325.61 | | | 8,540,566.53 | |
| | | 3. | | Customer List | | | 736,463,043.35 | | | 226,705,555.49 | | | 0.00 | | | 18,950.94 | | | 0.00 | | | 963,149,647.90 | | | 418,650,064.24 | | | 111,410,198.31 | | | 12,050.53 | | | 0.00 | | | 0.00 | | | 530,048,212.02 | | | 433,101,435.88 | |
| | | 4. | | Goodwill | | | 0.00 | | | 330,730,172.33 | | | 0.00 | | | 0.00 | | | 4,606,721.62 | | | 335,336,893.95 | | | 0.00 | | | 0.00 | | | 0.00 | | | 0.00 | | | 0.00 | | | 0.00 | | | 335,336,893.95 | |
| | | 5. | | Prepayments | | | 8,055,054.13 | | | 0.00 | | | 13,258,466.54 | | | 0.00 | | | (6,473,451.58 | ) | | 14,840,069.09 | | | 0.00 | | | 0.00 | | | 0.00 | | | 0.00 | | | 0.00 | | | 0.00 | | | 14,840,069.09 | |
| | | | | | | | | | | | | | | | | | | | | | | | | | | | | | | | |
| | | | | | | | 975,669,367.32 | | | 559,101,883.79 | | | 85,284,978.98 | | | 18,950.94 | | | 6,434,809.33 | | | 1,626,472,088.48 | | | 543,791,195.40 | | | 178,738,121.39 | | | 12,050.53 | | | 576.78 | | | 0.00 | | | 722,517,843.04 | | | 903,954,245.44 | |
| | | | | | | | | | | | | | | | | | | | | | | | | | | | | | | | |
| II. | | Property and equipment | | | | | | | | | | | | | | | | | | | | | | | | | | | | | | | | | | | | | | | | |
| | | 1. | | Buildings on non-owned land | | | 12,887,738.70 | | | 73,321.55 | | | 2,484,214.16 | | | 0.00 | | | 1,915,079.36 | | | 17,360,353.77 | | | 3,638,237.83 | | | 1,781,073.09 | | | 0.00 | | | 0.00 | | | 0.00 | | | 5,419,310.92 | | | 11,941,042.85 | |
| | | 2. | | Technical equipment | | | 1,837,617,142.28 | | | 65,130,891.27 | | | 235,110,110.32 | | | 5,221,866.20 | | | 42,307,743.28 | | | 2,174,944,020.95 | | | 849,404,662.24 | | | 211,702,626.36 | | | 3,006,929.26 | | | (223,054.9 | ) | | 0.00 | | | 1,057,877,304.43 | | | 1,117,066,716.52 | |
| | | 3. | | Other equipment, furniture and fictures | | | 70,499,598.12 | | | 462,497.21 | | | 14,193,076.20 | | | 2,041,062.78 | | | 4,053,909.40 | | | 87,168,018.15 | | | 43,526,536.49 | | | 10,431,813.16 | | | 1,917,527.43 | | | 222,478.13 | | | 0.00 | | | 52,263,300.35 | | | 34,904,717.80 | |
| | | 4. | | Construction in progress | | | 61,517,050.93 | | | 2,932,331.30 | | | 35,941,593.05 | | | 143,329.69 | | | (50,104,819.75 | ) | | 50,142,825.84 | | | 0.00 | | | 0.00 | | | 0.00 | | | 0.00 | | | 0.00 | | | 0.00 | | | 50,142,825.84 | |
| | | | | | | | | | | | | | | | | | | | | | | | | | | | | | | | |
| | | | | | | | 1,982,521,530.03 | | | 68,599,041.33 | | | 287,728,993.73 | | | 7,406,258.67 | | | (1,828,087.71 | ) | | 2,329,615,218.71 | | | 896,569,436.56 | | | 223,915,512.61 | | | 4,924,456.69 | | | (576.8 | ) | | 0.00 | | | 1,115,559,915.70 | | | 1,214,055,303.01 | |
| | | | | | | | | | | | | | | | | | | | | | | | | | | | | | | | |
| III. | | Financial Assets | | | | | | | | | | | | | | | | | | | | | | | | | | | | | | | | | | | | | | | | |
| | | 1. | | Equity investments in Associates | | | 5,820,595.03 | | | 0.00 | | | 0.00 | | | 4,019,685.95 | * | | 0.00 | | | 1,800,909.08 | | | (533,117.3 | ) | | 0.00 | | | 2,244,523.83 | * | | 0.00 | | | (1,051,528.9 | ) | | (3,829,170.0 | ) | | 5,630,079.04 | |
| | | 2. | | Other | | | 4,631,722.13 | | | 0.00 | | | 0.00 | | | 25,000.51 | | | (4,606,721.62 | ) | | 0.00 | | | 0.00 | | | 0.00 | | | 0.00 | | | 0.00 | | | 0.00 | | | 0.00 | | | 0.00 | |
| | | | | | | | | | | | | | | | | | | | | | | | | | | | | | | | |
| | | | | | | | 10,452,317.16 | | | 0.00 | | | 0.00 | | | 4,044,686.46 | | | (4,606,721.62 | ) | | 1,800,909.08 | | | (533,117.3 | ) | | 0.00 | | | 2,244,523.83 | | | 0.00 | | | (1,051,528.9 | ) | | (3,829,170.0 | ) | | 5,630,079.04 | |
| | | | | | | | | | | | | | | | | | | | | | | | | | | | | | | | |
| | | | | | | | 2,968,643,214.51 | | | 627,700,925.12 | | | 373,013,972.71 | | | 11,469,896.07 | | | 0.00 | | | 3,957,888,216.27 | | | 1,439,827,514.68 | | | 402,653,634.00 | | | 7,181,031.05 | | | 0.00 | | | (1,051,528.9 | ) | | 1,834,248,588.78 | | | 2,123,639,627.49 | |
| | | | | | | | | | | | | | | | | | | | | | | | | | | | | | | | |
- *
- Includes the figures of the former associated companies, following the acquisitions these are classified as affiliated companies
F-80
Table of Contents
Kabel Deutschland GmbH, Unterfoehring
Appendix 2 to the Notes
Analysis of Fixed Assets for Period from April 1, 2007 to March 31, 2008
| | | | | | | | | | | | | | | | | | | | | | | | | | | | | | | | | | | | | | | | | | | | |
| |
| |
| | Acquisition and production costs | | Accumulated depreciation and amortization | | Net book value | |
|---|
| |
| |
| | April 1,
2007 | | Acquisitions | | Additions | | Disposals | | Reclassifications | | March 31,
2008 | | April 1,
2007 | | Additions | | Disposals | | Reclassifications | | Change in
at-equity
investment | | March 31,
2008 | | March 31,
2008 | |
|---|
| |
| |
| | €
| | €
| | €
| | €
| | €
| | €
| | €
| | €
| | €
| | €
| | €
| | €
| | €
| |
|---|
| I. | | Intangible assets | | | | | | | | | | | | | | | | | | | | | | | | | | | | | | | | | | | | | | | | |
| | | 1. | | Software and Licences and other Contractual and Legal Rights | | | 151,699,402.32 | | | 0.00 | | | 52,696,913.36 | | | 6,066.75 | | | 10,395,887.76 | | | 214,786,136.69 | | | 75,718,874.80 | | | 40,874,595.07 | | | 6,066.75 | | | 53.12 | | | 0.00 | | | 116,587,456.24 | | | 98,198,680.45 | |
| | | 2. | | Internally generated software | | | 13,837,173.00 | | | 0.00 | | | 2,527,960.15 | | | 0.00 | | | 0.00 | | | 16,365,133.15 | | | 5,787,914.48 | | | 2,765,760.44 | | | 0.00 | | | 0.00 | | | 0.00 | | | 8,553,674.92 | | | 7,811,458.23 | |
| | | 3. | | Customer List | | | 715,426,567.68 | | | 20,936,112.22 | | | 111,394.43 | | | 11,030.98 | | | 0.00 | | | 736,463,043.35 | | | 333,039,392.45 | | | 85,611,086.83 | | | 415.04 | | | 0.00 | | | 0.00 | | | 418,650,064.24 | | | 317,812,979.11 | |
| | | 4. | | Prepayments | | | 10,926,153.95 | | | 0.00 | | | 7,683,386.95 | | | 275.56 | | | (10,554,211.21 | ) | | 8,055,054.13 | | | 0.00 | | | 0.00 | | | 0.00 | | | 0.00 | | | 0.00 | | | 0.00 | | | 8,055,054.13 | |
| | | | | | | | | | | | | | | | | | | | | | | | | | | | | | | | |
| | | | | | | | 891,889,296.95 | | | 20,936,112.22 | | | 63,019,654.89 | | | 17,373.29 | | | (158,323.45 | ) | | 975,669,367.32 | | | 414,546,181.73 | | | 129,251,442.34 | | | 6,481.79 | | | 53.12 | | | 0.00 | | | 543,791,195.40 | | | 431,878,171.92 | |
| | | | | | | | | | | | | | | | | | | | | | | | | | | | | | | | |
| II. | | Property and equipment | | | | | | | | | | | | | | | | | | | | | | | | | | | | | | | | | | | | | | | | |
| | | 1. | | Buildings on non-owned land | | | 7,185,148.98 | | | 0.00 | | | 2,573,705.68 | | | 0.00 | | | 3,128,884.04 | | | 12,887,738.70 | | | 2,424,677.72 | | | 1,212,954.48 | | | 0.00 | | | 605.63 | | | 0.00 | | | 3,638,237.83 | | | 9,249,500.87 | |
| | | 2. | | Technical equipment | | | 1,603,466,977.78 | | | 8,962,186.68 | | | 194,121,088.50 | | | 3,382,762.56 | | | 34,449,651.88 | | | 1,837,617,142.28 | | | 697,586,347.10 | | | 154,889,282.60 | | | 2,504,661.65 | | | (566,305.81 | ) | | 0.00 | | | 849,404,662.24 | | | 988,212,480.04 | |
| | | 3. | | Other equipment, furniture and fictures | | | 62,883,526.27 | | | 0.00 | | | 9,545,309.13 | | | 3,230,180.78 | | | 1,300,943.50 | | | 70,499,598.12 | | | 37,536,561.86 | | | 8,595,136.46 | | | 3,170,808.89 | | | 565,647.06 | | | 0.00 | | | 43,526,536.49 | | | 26,973,061.63 | |
| | | 4. | | Construction in progress | | | 50,619,484.08 | | | 0.00 | | | 49,620,116.66 | | | 1,393.84 | | | (38,721,155.97 | ) | | 61,517,050.93 | | | 0.00 | | | 0.00 | | | 0.00 | | | 0.00 | | | 0.00 | | | 0.00 | | | 61,517,050.93 | |
| | | | | | | | | | | | | | | | | | | | | | | | | | | | | | | | |
| | | | | | | | 1,724,155,137.11 | | | 8,962,186.68 | | | 255,860,219.97 | | | 6,614,337.18 | | | 158,323.45 | | | 1,982,521,530.03 | | | 737,547,586.68 | | | 164,697,373.54 | | | 5,675,470.54 | | | (53.12 | ) | | 0.00 | | | 896,569,436.56 | | | 1,085,952,093.47 | |
| | | | | | | | | | | | | | | | | | | | | | | | | | | | | | | | |
| III. | | Financial Assets | | | | | | | | | | | | | | | | | | | | | | | | | | | | | | | | | | | | | | | | |
| | | 1. | | Equity investments in Associates | | | 5,820,595.03 | | | 0.00 | | | 0.00 | | | 0.00 | | | 0.00 | | | 5,820,595.03 | | | 139,097.84 | | | 0.00 | | | 0.00 | | | 0.00 | | | (672,215.12 | ) | | (533,117.28 | ) | | 6,353,712.31 | |
| | | 2. | | Other | | | 7,509,863.31 | | | 4,606,721.62 | | | 0.00 | | | 7,484,862.80 | | | 0.00 | | | 4,631,722.13 | | | 0.00 | | | 0.00 | | | 0.00 | | | 0.00 | | | 0.00 | | | 0.00 | | | 4,631,722.13 | |
| | | | | | | | | | | | | | | | | | | | | | | | | | | | | | | | |
| | | | | | | | 13,330,458.34 | | | 4,606,721.62 | | | 0.00 | | | 7,484,862.80 | | | 0.00 | | | 10,452,317.16 | | | 139,097.84 | | | 0.00 | | | 0.00 | | | 0.00 | | | (672,215.12 | ) | | (533,117.28 | ) | | 10,985,434.44 | |
| | | | | | | | | | | | | | | | | | | | | | | | | | | | | | | | |
| | | | | | | | 2,629,374,892.40 | | | 34,505,020.52 | | | 318,879,874.86 | | | 14,116,573.27 | | | 0.00 | | | 2,968,643,214.51 | | | 1,152,232,866.25 | | | 293,948,815.88 | | | 5,681,952.33 | | | 0.00 | | | (672,215.12 | ) | | 1,439,827,514.68 | | | 1,528,815,699.83 | |
| | | | | | | | | | | | | | | | | | | | | | | | | | | | | | | | |
F-81
Table of Contents
Kabel Deutschland GmbH, Unterfoehring
Appendix 3 to the Notes
Analysis of Fixed Assets for Period from April 1, 2006 to March 31, 2007
| | | | | | | | | | | | | | | | | | | | | | | | | | | | | | | | | | | | | | | | | | | | |
| |
| |
| | Acquisition and production cost | | Accumulated depreciation and amortization | | Net book value | |
|---|
| |
| |
| | April 1,
2006 | | Acquisitions | | Additions | | Disposals | | Reclassifications | | March 31,
2007 | | April 1,
2006 | | Additions | | Disposals | | Reclassifications | | Change in
at-equity
investment | | March 31,
2007 | | March 31,
2007 | |
|---|
| |
| |
| | €
| | €
| | €
| | €
| | €
| | €
| | €
| | €
| | €
| | €
| | €
| | €
| | €
| |
|---|
| I. | | Intangible assets | | | | | | | | | | | | | | | | | | | | | | | | | | | | | | | | | | | | | | | | |
| | | 1. | | Software and Licences and other Contractual and Legal Rights | | | 100,549,175.37 | | | 0.00 | | | 52,348,547.59 | | | 3,239,616.88 | | | 2,041,296.24 | | | 151,699,402.32 | | | 53,584,726.12 | | | 25,373,765.56 | | | 3,239,616.88 | | | 0.00 | | | 0.00 | | | 75,718,874.80 | | | 75,980,527.52 | |
| | | 2. | | Internally generated software | | | 12,789,484.77 | | | 0.00 | | | 1,047,688.23 | | | 0.00 | | | 0.00 | | | 13,837,173.00 | | | 3,271,505.03 | | | 2,516,409.45 | | | 0.00 | | | 0.00 | | | 0.00 | | | 5,787,914.48 | | | 8,049,258.52 | |
| | | 3. | | Customer List | | | 709,713,538.37 | | | 5,713,029.31 | | | 0.00 | | | 0.00 | | | 0.00 | | | 715,426,567.68 | | | 249,230,050.39 | | | 83,809,342.06 | | | 0.00 | | | 0.00 | | | 0.00 | | | 333,039,392.45 | | | 382,387,175.23 | |
| | | 4. | | Prepayments | | | 2,719,177.16 | | | 0.00 | | | 10,174,463.03 | | | 0.00 | | | (1,967,486.24 | ) | | 10,926,153.95 | | | 0.00 | | | 0.00 | | | 0.00 | | | 0.00 | | | 0.00 | | | 0.00 | | | 10,926,153.95 | |
| | | | | | | | | | | | | | | | | | | | | | | | | | | | | | | | |
| | | | | | | | 825,771,375.67 | | | 5,713,029.31 | | | 63,570,698.85 | | | 3,239,616.88 | | | 73,810.00 | | | 891,889,296.95 | | | 306,086,281.54 | | | 111,699,517.07 | | | 3,239,616.88 | | | 0.00 | | | 0.00 | | | 414,546,181.73 | | | 477,343,115.22 | |
| | | | | | | | | | | | | | | | | | | | | | | | | | | | | | | | |
| II. | | Property and equipment | | | | | | | | | | | | | | | | | | | | | | | | | | | | | | | | | | | | | | | | |
| | | 1. | | Buildings on non-owned land | | | 5,340,718.78 | | | 0.00 | | | 1,777,558.40 | | | 640.83 | | | 67,512.63 | | | 7,185,148.98 | | | 1,722,880.78 | | | 701,860.77 | | | 63.83 | | | 0.00 | | | 0.00 | | | 2,424,677.72 | | | 4,760,471.26 | |
| | | 2. | | Technical equipment | | | 1,425,843,167.38 | | | 741,174.20 | | | 162,952,692.29 | | | 17,258,248.20 | | | 31,188,192.11 | | | 1,603,466,977.78 | | | 585,965,045.25 | | | 126,614,504.51 | | | 14,983,155.99 | | | (10,046.67 | ) | | 0.00 | | | 697,586,347.10 | | | 905,880,630.68 | |
| | | 3. | | Other equipment, furniture and fixtures | | | 51,138,809.34 | | | 0.00 | | | 12,794,280.71 | | | 1,819,658.85 | | | 770,095.07 | | | 62,883,526.27 | | | 31,671,730.39 | | | 7,602,185.64 | | | 1,747,400.84 | | | 10,046.67 | | | 0.00 | | | 37,536,561.86 | | | 25,346,964.41 | |
| | | 4. | | Construction in progress | | | 39,748,427.85 | | | 0.00 | | | 42,979,545.25 | | | 8,879.21 | | | (32,099,609.81 | ) | | 50,619,484.08 | | | 0.00 | | | 0.00 | | | 0.00 | | | 0.00 | | | 0.00 | | | 0.00 | | | 50,619,484.08 | |
| | | | | | | | | | | | | | | | | | | | | | | | | | | | | | | | |
| | | | | | | | 1,522,071,123.35 | | | 741,174.20 | | | 220,504,076.65 | | | 19,087,427.09 | | | (73,810.00 | ) | | 1,724,155,137.11 | | | 619,359,656.42 | | | 134,918,550.92 | | | 16,730,620.66 | | | 0.00 | | | 0.00 | | | 737,547,586.68 | | | 986,607,550.43 | |
| | | | | | | | | | | | | | | | | | | | | | | | | | | | | | | | |
| III. | | Financial assets | | | | | | | | | | | | | | | | | | | | | | | | | | | | | | | | | | | | | | | | |
| | | 1. | | Equity investments in Associates | | | 5,820,595.03 | | | 0.00 | | | 0.00 | | | 0.00 | | | 0.00 | | | 5,820,595.03 | | | 258,913.10 | | | 0.00 | | | 0.00 | | | 0.00 | | | (119,815.26 | ) | | 139,097.84 | | | 5,681,497.19 | |
| | | 2. | | Others | | | 491,561.62 | | | 0.00 | | | 7,414,800.37 | | | 396,498.68 | | | 0.00 | | | 7,509,863.31 | | | 0.00 | | | 0.00 | | | 0.00 | | | 0.00 | | | 0.00 | | | 0.00 | | | 7,509,863.31 | |
| | | | | | | | | | | | | | | | | | | | | | | | | | | | | | | | |
| | | | | | | | 6,312,156.65 | | | 0.00 | | | 7,414,800.37 | | | 396,498.68 | | | 0.00 | | | 13,330,458.34 | | | 258,913.10 | | | 0.00 | | | 0.00 | | | 0.00 | | | (119,815.26 | ) | | 139,097.84 | | | 13,191,360.50 | |
| | | | | | | | | | | | | | | | | | | | | | | | | | | | | | | | |
| | | | | | | | 2,354,154,655.67 | | | 6,454,203.51 | | | 291,489,575.87 | | | 22,723,542.65 | | | 0.00 | | | 2,629,374,892.40 | | | 925,704,851.06 | | | 246,618,067.99 | | | 19,970,237.54 | | | 0.00 | | | (119,815.26 | ) | | 1,152,232,866.25 | | | 1,477,142,026.15 | |
| | | | | | | | | | | | | | | | | | | | | | | | | | | | | | | | |
F-82
Table of Contents
Kabel Deutschland Vertrieb und Service GmbH & Co. KG
Unterfoehring
Consolidated Financial Statements
March 31, 2009
F-83
Table of Contents
Kabel Deutschland Vertrieb und Service GmbH & Co. KG, Unterfoehring
Consolidated Balance Sheet as of March 31, 2009
| | | | | | | | | | | | | | | |
| | Note | | March 31,
2009 | | March 31,
2008 | | March 31,
2007 | |
|---|
| |
| | €
| | T€
| | T€
| |
|---|
Assets | | | | | | | | | | | | | |
| | Current Assets | | | | | | | | | | | | | |
| | | Cash and Cash Equivalents | | | 4.1 | | | 51,881,962.75 | | | 15,422 | | | 54,108 | |
| | | Trade Receivables | | | 4.2 | | | 106,578,606.85 | | | 130,530 | | | 101,158 | |
| | | Receivables from Affiliates | | | | | | 0.00 | | | 0 | | | 256 | |
| | | Inventories | | | 4.3 | | | 15,929,200.67 | | | 26,201 | | | 24,265 | |
| | | Receivables from Tax Authorities | | | 4.4 | | | 3,893,623.77 | | | 2,336 | | | 751 | |
| | | Other Current Financial Assets | | | 4.5 | | | 38,394,313.06 | | | 5,861 | | | 7,266 | |
| | | Prepaid Expenses | | | 4.5 | | | 12,128,214.42 | | | 18,221 | | | 18,263 | |
| | | | | | | | | | | |
| | Total Current Assets | | | | | | 228,805,921.52 | | | 198,572 | | | 206,067 | |
| | | | | | | | | | | |
| | Non-Current Assets | | | | | | | | | | | | | |
| | | Intangible Assets | | | 4.6 | | | 903,864,958.79 | | | 431,395 | | | 476,426 | |
| | | Property and Equipment | | | 4.7 | | | 1,213,713,464.20 | | | 1,085,509 | | | 986,022 | |
| | | Equity Investments in Associates | | | 4.8 | | | 0.00 | | | 1,332 | | | 1,630 | |
| | | Other Non-Current Financial Assets | | | | | | 0.00 | | | 4,632 | | | 7,446 | |
| | | Deferred Tax Assets | | | 3.10 | | | 292,558.00 | | | 537 | | | 366 | |
| | | Non-Current Financial Assets | | | | | | 0.00 | | | 4,239 | | | 5,414 | |
| | | Prepaid Expenses | | | | | | 17,191,189.96 | | | 11,166 | | | 5,959 | |
| | | | | | | | | | | |
| | Total Non-Current Assets | | | | | | 2,135,062,170.95 | | | 1,538,810 | | | 1,483,263 | |
| | | | | | | | | | | |
Total Assets | | | | | | 2,363,868,092.47 | | | 1,737,382 | | | 1,689,330 | |
| | | | | | | | | | | |
The accompanying notes to this statement of operations form an integral part to these
consolidated financial statements.
F-84
Table of Contents
Kabel Deutschland Vertrieb und Service GmbH & Co. KG, Unterfoehring
Consolidated Balance Sheet as of March 31, 2009 (Continued)
| | | | | | | | | | | | | | | |
| | Note | | March 31,
2009 | | March 31,
2008 | | March 31,
2007 | |
|---|
| |
| | €
| | €
| | T€
| |
|---|
Equity and Liabilities | | | | | | | | | | | | | |
| | Current Liabilities | | | | | | | | | | | | | |
| | | Current Financial Liabilities | | | 4.11.1 | | | 19,854,612.33 | | | 8,708 | | | 18,112 | |
| | | Trade Payables | | | | | | 251,366,651.62 | | | 210,408 | | | 167,907 | |
| | | Other Current Provisions | | | 4.13 | | | 39,546,359.53 | | | 5,584 | | | 18,054 | |
| | | Liabilities due to Income Taxes | | | 3.10 | | | 20,138,079.09 | | | 12,960 | | | 14,157 | |
| | | Deferred Income | | | 4.10 | | | 241,680,821.65 | | | 199,489 | | | 216,818 | |
| | | Other Current Liabilities | | | 4.9 | | | 78,090,030.91 | | | 48,039 | | | 50,633 | |
| | | | | | | | | | | |
| | Total Current Liabilities | | | | | | 650,676,555.13 | | | 485,187 | | | 485,681 | |
| | | | | | | | | | | |
| | Non-Current Liabilities | | | | | | | | | | | | | |
| | | Non-Current Financial Liabilities | | | 4.11.2 | | | 1,665,254,896.77 | | | 1,191,404 | | | 1,127,436 | |
| | | Deferred Tax Liabilities | | | 3.10 | | | 81,104,064.00 | | | 55,778 | | | 57,272 | |
| | | Provisions for Pension | | | 4.12 | | | 31,162,739.57 | | | 25,850 | | | 21,579 | |
| | | Other Non-Current Provisions | | | 4.13 | | | 25,992,957.01 | | | 22,268 | | | 21,244 | |
| | | Capital attributable to the Limited Partners | | | 4.15 | | | 2,398,700,000.00 | | | 2,185,500 | | | 1,882,600 | |
| | | Other Non-Current Liabilities | | | 4.14 | | | 32,460,341.34 | | | 36,072 | | | 36,494 | |
| | | Deferred Income | | | | | | 1,626,182.10 | | | 1,825 | | | 270 | |
| | | | | | | | | | | |
| | Total Non-Current Liabilities | | | | | | 4,236,301,180.79 | | | 3,518,697 | | | 3,146,895 | |
| | | | | | | | | | | |
| | Equity | | | 4.16 | | | | | | | | | | |
| | | Limited Partnership Capital | | | | | | 1,000.00 | | | 1 | | | 1 | |
| | | Capital Reserve | | | | | | 27,686,393.71 | | | 27,327 | | | 29,728 | |
| | | Available-for-Sale Reserve | | | | | | 0.00 | | | 0 | | | 625 | |
| | | Asset Revaluation Surplus | | | | | | 1,351,681.06 | | | 0 | | | 0 | |
| | | Accumulated Deficit | | | | | | (2,560,675,782.23 | ) | | (2,293,830 | ) | | (1,973,600 | ) |
| | | | | | | | | | | |
| | | | | | (2,531,636,707.46 | ) | | (2,266,502 | ) | | (1,943,246 | ) |
| | | Minority Interests | | | | | | 8,527,064.01 | | | 0 | | | 0 | |
| | | | | | | | | | | |
| | Total Equity (Deficit) | | | | | | (2,523,109,643.45 | ) | | (2,266,502 | ) | | (1,943,246 | ) |
| | | | | | | | | | | |
| | Total Equity and Liabilities | | | | | | 2,363,868,092.47 | | | 1,737,382 | | | 1,689,330 | |
| | | | | | | | | | | |
The accompanying notes to this statement of operations form an integral part to these
consolidated financial statements.
F-85
Table of Contents
Kabel Deutschland Vertrieb und Service GmbH & Co. KG, Unterfoehring
Consolidated Statement of Operations
for the Period from April 1, 2008 to March 31, 2009
| | | | | | | | | | | | | | |
| | Note | | Apr. 1, 2008-
Mar. 31, 2009 | | Apr. 1, 2007-
Mar. 31, 2008 | | Apr. 1, 2006-
Mar. 31, 2007 | |
|---|
| |
| | €
| | T€
| | T€
| |
|---|
Revenues | | | 3.1 | | | 1,370,331,371.04 | | | 1,196,870 | | | 1,093,179 | |
Cost of Services Rendered | | |
3.2 | | |
(696,555,334.12 |
) | |
(588,461 |
) | |
(567,090 |
) |
thereof depreciation/amortization T€205,504 (prior year T€154,676; for the fiscal year ending March 31, 2007 T€133,123) | | | | | | | | | | | | | |
Other Operating Income | | |
3.3 | | |
18,822,189.21 | | |
13,118 | | |
14,354 | |
Selling Expenses | | |
3.4 | | |
(425,624,751.73 |
) | |
(352,836 |
) | |
(318,663 |
) |
thereof depreciation/amortization T€169,348 (prior year T€115,478; for the fiscal year ending March 31, 2007 T€95,983) | | | | | | | | | | | | | |
General and Administrative Expenses | | |
3.5 | | |
(124,122,086.56 |
) | |
(104,075 |
) | |
(99,456 |
) |
thereof depreciation/amortization T€27,251 (prior year T€23,136; for the fiscal year ending March 31, 2007 T€16,313) | | | | | | | | | | | | | |
| | | | | | | | | | | |
Profit from Ordinary Activities | | | | | | 142,851,387.84 | | | 164,616 | | | 122,323 | |
Interest Income | | |
3.7 | | |
3,425,236.26 | | |
1,944 | | |
2,875 | |
Interest Expense | | |
3.7 | | |
(143,161,817.04 |
) | |
(89,909 |
) | |
(73,510 |
) |
Accretion/Depreciation on Investments and other Securities | | | | | |
75,500.00 | | |
(3,712 |
) | |
265 | |
Income from Associates | | |
3.9 | | |
(7,917.82 |
) | |
(142 |
) | |
(40 |
) |
Expense due to Changes in Capital Attributable to the Limited Partners | | |
3.8 | | |
(213,200,000.00 |
) | |
(302,900 |
) | |
(462,600 |
) |
| | | | | | | | | | | |
Loss before Taxes | | | | | | (210,017,610.76 | ) | | (230,104 | ) | | (410,687 | ) |
Benefit/(Taxes) on Income | | | 3.10 | | | 15,954,488.02 | | | 282 | | | (19,351 | ) |
| | | | | | | | | | | |
Net loss for the period | | | | | | (194,063,122.74 | ) | | (229,822 | ) | | (430,038 | ) |
| | | | | | | | | | | |
Attributable to: | | | | | | | | | | | | | |
| | Equity holders of the parent | | | | | | (194,921,989.25 | ) | | (229,822 | ) | | (430,038 | ) |
| | Minority interests | | | 4.16 | | | 858,866.51 | | | 0 | | | 0 | |
| | | | | | | | | | | |
| | | | | | (194,063,122.74 | ) | | (229,822 | ) | | (430,038 | ) |
| | | | | | | | | | | |
The accompanying notes to this statement of operations form an integral part to these
consolidated financial statements.
F-86
Table of Contents
Kabel Deutschland Vertrieb & Service GmbH & Co. KG, Unterfoehring
Consolidated Statement of Cash Flows
for the Period from April 1, 2008 to March 31, 2009
| | | | | | | | | | | | | | |
| | Note | | April 1, 2008-
March 31, 2009 | | April 1, 2007-
March 31, 2008 | | April 1, 2006-
March 31, 2007 | |
|---|
| |
| | T€
| | T€
| | T€
| |
|---|
1. Cash flows from operating activities | | | | | | | | | | | | | |
Net loss for the period | | | | | | (194,063 | ) | | (229,822 | ) | | (430,038 | ) |
Adjustments to reconcile net income/net loss to cash provided by operations: | | | | | | | | | | | | | |
| | Benefit/(Taxes) on income | | | | | | (15,954 | ) | | (282 | ) | | 19,351 | |
| | Interest expense | | | | | | 143,162 | | | 89,909 | | | 73,510 | |
| | Interest income | | | | | | (3,425 | ) | | (1,944 | ) | | (2,875 | ) |
| | Accretion/Depreciation and amortization on fixed assets | | | | | | 402,103 | | | 293,290 | | | 245,419 | |
| | Accretion/Depreciation on investments and other securities | | | | | | (76 | ) | | 3,712 | | | (265 | ) |
| | Gain/Loss on disposal/sale of fixed assets (intangible assets; property and equipment; financial assets) | | | | | | 1,407 | | | 758 | | | 2,096 | |
| | Income from associates | | | | | | 8 | | | 142 | | | 40 | |
| | Compensation expense relating to share-based payments | | | | | | 885 | | | 3,016 | | | 4,216 | |
| | Fair value increase (decrease) of capital attributed to the limited partners | | | | | | 213,200 | | | 302,900 | | | 462,600 | |
| | | | | | | | | | | |
| | | | | | 547,247 | | | 461,679 | | | 374,054 | |
Changes in assets and liabilities: | | | | | | | | | | | | | |
| | Increase (-)/decrease (+) of inventories | | | | | | 10,359 | | | (1,936 | ) | | (10,812 | ) |
| | Increase (-)/decrease (+) of trade receivables | | | | | | 27,410 | | | (29,372 | ) | | 19,631 | |
| | Increase (-)/decrease (+) of other assets | | | | | | (14,799 | ) | | 3,792 | | | (3,632 | ) |
| | Increase (+)/decrease (-) of trade payables | | | | | | 37,233 | | | 42,417 | | | 29,173 | |
| | Increase (+)/decrease (-) of other provisions | | | | | | 23,167 | | | (12,514 | ) | | 9,006 | |
| | Increase (+)/decrease (-) of deferred income | | | | | | 27,751 | | | (15,774 | ) | | (29,656 | ) |
| | Increase (+)/decrease (-) of provisions for pensions | | | | | | 2,705 | | | 3,029 | | | 2,555 | |
| | Increase (+)/decrease (-) of other liabilities | | | | | | 13,839 | | | (3,547 | ) | | 4,301 | |
| | | | | | | | | | | |
Cash provided by operations | | | | | | 674,912 | | | 447,774 | | | 394,620 | |
Income taxes paid (-)/received (+) | | | | | | (6,552 | ) | | (4,637 | ) | | (10,270 | ) |
| | | | | | | | | | | |
Net cash from operating activities | | | | | | 668,360 | | | 443,137 | | | 384,350 | |
| | | | | | | | | | | |
2. Cash flows from investing activities | | | | | | | | | | | | | |
Cash received from disposal/sale of fixed assets (intangible assets; property and equipment; financial assets) | | | | | | 1,107 | | | 258 | | | 584 | |
Cash received from sale of investments | | | | | | 0 | | | 38,076 | | | 0 | |
Cash paid for investments in intangible assets | | | | | | (85,247 | ) | | (62,956 | ) | | (63,420 | ) |
Cash paid for investments in property and equipment | | | | | | (287,711 | ) | | (253,395 | ) | | (205,042 | ) |
Cash paid for acquisitions | | | 1.3.2 | | | (527,827 | ) | | (29,696 | ) | | (5,093 | ) |
Cash paid for investments in financial assets | | | | | | 0 | | | (39,666 | ) | | (6,769 | ) |
Interest received | | | | | | 2,485 | | | 1,701 | | | 2,777 | |
Dividends received from associates | | | | | | 0 | | | 156 | | | 188 | |
| | | | | | | | | | | |
Net cash used in investing activities | | | | | | (897,193 | ) | | (345,522 | ) | | (276,775 | ) |
| | | | | | | | | | | |
3. Cash flows from financing activities | | | | | | | | | | | | | |
Cash payments to shareholders/minorities | | | | | | (73,196 | ) | | (90,408 | ) | | (100,995 | ) |
Cash received non-current financial liabilities | | | | | | 785,000 | | | 391,000 | | | 1,205,000 | |
Cash repayments of non-current financial liabilities | | | | | | (310,000 | ) | | (331,000 | ) | | (1,205,000 | ) |
Cash repayments of current financial liabilities | | | | | | 0 | | | 0 | | | (75,848 | ) |
Cash payments for reduction of finance lease liabilities | | | | | | (8,229 | ) | | (7,240 | ) | | (5,610 | ) |
Interest and transaction costs paid | | | | | | (128,358 | ) | | (98,653 | ) | | (94,349 | ) |
| | | | | | | | | | | |
Net cash used from financing activities | | | | | | 265,217 | | | (136,301 | ) | | (276,802 | ) |
| | | | | | | | | | | |
4. Cash and cash equivalents at the end of the period | | | | | | | | | | | | | |
Changes in cash and cash equivalents (subtotal of 1 to 3) | | | | | | 36,384 | | | (38,686 | ) | | (169,227 | ) |
Valuation adjustments on cash and cash equivalents | | | | | | 76 | | | 0 | | | 265 | |
Cash and cash equivalents at the beginning of the period | | | | | | 15,422 | | | 54,108 | | | 223,070 | |
| | | | | | | | | | | |
Cash and cash equivalents at the end of the period | | | 4.1 | | | 51,882 | | | 15,422 | | | 54,108 | |
| | | | | | | | | | | |
Additional Information | | | | | | | | | | | | | |
Investments relating to capital lease | | | | | | 0 | | | 2,447 | | | 15,311 | |
Other non cash investments | | | | | | 0 | | | 0 | | | 0 | |
The accompanying notes to this cash flow statement form an integral part to these
consolidated financial statements.
F-87
Table of Contents
Kabel Deutschland Vertrieb und Service GmbH & Co. KG, Unterfoehring
Statement of Changes in Consolidated Equity
for the Period from April 1, 2008 to March 31, 2009
| | | | | | | | | | | | | | | | | | | | | | | | | | | | |
| |
| | Attributable to equity holders of the parent | |
| |
| |
|---|
| | Note | | Limited
Partnership
capital | | Capital
reserve | | Available-
for-sale
reserve | | Asset
Revaluation
Surplus | | Accumulated
deficit | | Total | | Minority
Interests | | Total
Equity
(Deficit) | |
|---|
| |
| | T€
| | T€
| | T€
| | T€
| | T€
| | T€
| | T€
| | T€
| |
|---|
Balance as of March 31, 2006 | | | 4.16 | | | 1 | | | 26,577 | | | 0 | | | 0 | | | (1,453,156 | ) | | (1,426,578 | ) | | 0 | | | (1,426,578 | ) |
Changes in fair value of hedging instruments (net of tax) | | | | | | 0 | | | 0 | | | 0 | | | 0 | | | 0 | | | 0 | | | 0 | | | 0 | |
Capital contributions | | | | | | 0 | | | 0 | | | 0 | | | 0 | | | 0 | | | 0 | | | 0 | | | 0 | |
Additions relating to share-based payment | | | | | | 0 | | | 3,151 | | | 0 | | | 0 | | | 0 | | | 3,151 | | | 0 | | | 3,151 | |
Transactions with parents | | | | | | 0 | | | 0 | | | 0 | | | 0 | | | (90,407 | ) | | (90,407 | ) | | 0 | | | (90,407 | ) |
Changes in fair value of financial assets classified as available-for-sale | | | | | | 0 | | | 0 | | | 624 | | | 0 | | | 0 | | | 624 | | | 0 | | | 624 | |
Net loss for the period | | | | | | 0 | | | 0 | | | 0 | | | 0 | | | (430,037 | ) | | (430,037 | ) | | 0 | | | (430,037 | ) |
| | | | | | | | | | | | | | | | | | | | | |
Total income and expense for the period | | | | | | | | | | | | 624 | | | 0 | | | (430,037 | ) | | (429,413 | ) | | 0 | | | (429,413 | ) |
| | | | | | | | | | | | | | | | | | | | | |
Balance as of March 31, 2007 | | | 4.16 | | | 1 | | | 29,728 | | | 624 | | | 0 | | | (1,973,600 | ) | | (1,943,247 | ) | | 0 | | | (1,943,247 | ) |
Changes in fair value of hedging instruments (net of tax) | | | | | | 0 | | | 0 | | | 0 | | | 0 | | | 0 | | | 0 | | | 0 | | | 0 | |
Capital contributions | | | | | | 0 | | | 0 | | | 0 | | | 0 | | | 0 | | | 0 | | | 0 | | | 0 | |
Additions relating to share-based payment | | | | | | 0 | | | (2,401 | ) | | 0 | | | 0 | | | 0 | | | (2,401 | ) | | 0 | | | (2,401 | ) |
Transactions with parents | | | | | | 0 | | | 0 | | | 0 | | | 0 | | | (90,408 | ) | | (90,408 | ) | | 0 | | | (90,408 | ) |
Changes in fair value of financial assets classified as available-for-sale | | | | | | 0 | | | 0 | | | (624 | ) | | 0 | | | 0 | | | (624 | ) | | 0 | | | 0
(624 |
) |
Net loss for the period | | | | | | 0 | | | 0 | | | 0 | | | 0 | | | (229,822 | ) | | (229,822 | ) | | 0 | | | (229,822 | ) |
| | | | | | | | | | | | | | | | | | | | | |
Total income and expense for the period | | | | | | | | | | | | (624 | ) | | 0 | | | (229,822 | ) | | (230,446 | ) | | 0 | | | (230,446 | ) |
| | | | | | | | | | | | | | | | | | | | | |
Balance as of March 31, 2008 | | | 4.16 | | | 1 | | | 27,327 | | | 0 | | | 0 | | | (2,293,830 | ) | | (2,266,502 | ) | | 0 | | | (2,266,502 | ) |
Changes in fair value of hedging instruments (net of tax) | | | | | | 0 | | | 0 | | | 0 | | | 0 | | | 0 | | | 0 | | | 0 | | | 0 | |
Capital contributions | | | | | | 0 | | | 0 | | | 0 | | | 0 | | | 0 | | | 0 | | | 0 | | | 0 | |
Additions relating to share-based payment | | | | | | 0 | | | 70 | | | 0 | | | 0 | | | 0 | | | 70 | | | 0 | | | 70 | |
Additions relating to acquisitions | | | | | | 0 | | | 289 | | | 0 | | | 1,515 | | | 0 | | | 1,804 | | | 8,777 | | | 10,581 | |
Dividend distribution to minorities | | | | | | 0 | | | 0 | | | 0 | | | 0 | | | 0 | | | 0 | | | (1,109 | ) | | (1,109 | ) |
Reclassification of Asset Revaluation Surplus | | | | | | 0 | | | 0 | | | 0 | | | (163 | ) | | 163 | | | 0 | | | 0 | | | 0 | |
Transactions with parents | | | | | | 0 | | | 0 | | | 0 | | | 0 | | | (72,087 | ) | | (72,087 | ) | | 0 | | | (72,087 | ) |
Net loss for the period | | | | | | 0 | | | 0 | | | 0 | | | 0 | | | (194,922 | ) | | (194,922 | ) | | 859 | | | (194,063 | ) |
| | | | | | | | | | | | | | | | | | | | | |
Total income and expense for the period | | | | | | | | | | | | 0 | | | 0 | | | (194,922 | ) | | (194,922 | ) | | 859 | | | (194,063 | ) |
| | | | | | | | | | | | | | | | | | | | | |
Balance as of March 31, 2009 | | | 4.16 | | | 1 | | | 27,686 | | | 0 | | | 1,352 | | | (2,560,676 | ) | | (2,531,637 | ) | | 8,527 | | | (2,523,110 | ) |
| | | | | | | | | | | | | | | | | | | | | |
The accompanying notes to statement of changes in consolidated equity form an integral part to these consolidated financial statements.
F-88
Table of Contents
Notes to the Consolidated
Financial Statements for
Kabel Deutschland Vertrieb und Service GmbH & Co. KG
as of March 31, 2009
F-89
Table of Contents
F-90
Table of Contents
F-91
Table of Contents
1. General Information
Kabel Deutschland Vertrieb und Service GmbH & Co. KG and its subsidiaries (KDVS Group or the Group) is the market leader in the German cable television business in terms of homes passed, subscribers and revenues. The Group provides cable access connections, and Internet and telephony services to its customers.
Kabel Deutschland Vertrieb und Service GmbH & Co. KG (KDVS), formerly Kabel Asset GmbH & Co. KG, was founded on October 16, 2003. KDVS' registered office is in Unterfoehring, Betastrasse 6-8 (commercial register of Munich HRA 83902), Germany. Since its formation, KDVS has been a wholly owned subsidiary of Kabel Deutschland GmbH, Unterfoehring (KDG) which is owned by Cayman Cable Holding L.P., George Town, Cayman Islands (Cayman Cable). Since February 8, 2006, Cayman Cable is owned by Providence Partners, the ultimate parent.
The annual consolidated financial statements of the Group were authorized for issue in accordance with a resolution of the directors on July 22, 2009.
1.1 Acknowledgement
The consolidated financial statements of KDVS for the three years ended March 31, 2009, have been prepared in accordance with International Financial Reporting Standards (IFRS) as issued by the International Accounting Standards Board (IASB). The consolidated financial statements also comply with the regulations under German Commercial Law pursuant to Sec. 315a (3) German Commercial Code. All IFRSs issued by the IASB, effective at the time of preparing the consolidated financial statements and applied by the Group, have been adopted for use in the European Union (EU) by the European Commission. Therefore the consolidated financial statements also comply with IFRS as adopted by the EU.
1.2 Basis of Presentation
The Group's fiscal year is the twelve month period ending March 31.
The consolidated financial statements and notes are presented in Euros and all values are rounded to nearest thousand (T€) except where otherwise stated. The Group's financial statements have been prepared using consistent accounting and consolidation methods for all periods presented. The Group's statement of operations has been prepared using the cost of sales method under IFRS. The consolidated financial statements have been prepared on a historical cost basis except for derivative financial instruments and liabilities related to its Management Equity Participation Program that have been measured at fair value.
The preparation of financial statements in conformity with International Financial Reporting Standards requires management to make estimates and assumptions that affect the reported amounts of assets and liabilities and disclosure of contingent assets and liabilities at the date of the financial statements and the reported amounts of revenues and expenses during the reporting period. Although these estimates are based on management's best knowledge of current events and actions, actual results ultimately may differ from those estimates.
With respect to key judgments and estimation uncertainty, refer to note 2.16.
1.3 Consolidation
1.3.1 Scope of Consolidation
KDVS' consolidated financial statements as of March 31, 2009 are comprised of KDVS and ten consolidated subsidiaries (fiscal year ended March 31, 2008: five consolidated subsidiaries; fiscal year ended March 31, 2007: six consolidated subsidiaries). Investments are consolidated if KDVS directly or
F-92
Table of Contents
indirectly owns more than 50% of the outstanding voting rights of an entity and are under the control of KDVS as defined by IAS 27 "Consolidated and Separate Financial Statements". The number of companies consolidated increased in total by five year-on-year.
Additions to companies consolidated in 2009 comprise the acquisition of twelve companies from the Orion Group, a Level 4 cable TV operator in Germany ("the Acquisition"). Seven companies, thereof six companies concerning the Acquisition, were merged during the current fiscal year.
1.3.2 Changes in the Consolidation Group and Acquisitions
Merger
As of February 26, 2009 RKS Niedersaechsische Kabel-Servicegesellschaft mbH & Co. KG, Hanover was merged with KDVS.
On February 23, 2009, the merger of KMG KABEL-FERNSEHEN HANNOVER GmbH into KDVS became effective, retroactively, to July 1, 2008.
On October 23, 2008, the mergers of Kabel Deutschland Süd GmbH, Kabel Deutschland West GmbH, Kabel Deutschland Nord GmbH and Telecolumbus Nord GmbH into KDVS became effective, retroactively, to May 1, 2008.
In addition, Leto GmbH was merged with KDVS as of July 7, 2008.
Business Combination and Goodwill
The accounting for business combinations in the KDVS consolidated financial statements is performed according to IFRS 3 "Business Combinations" by allocating the cost of a business combination to the acquiree's identifiable assets, liabilities and contingent liabilities at their fair value at the time of the acquisition.
Goodwill corresponds to the difference between the acquisition cost and the fair value of the acquired assets and liabilities of a business combination. Goodwill is not subject to amortization; it is tested for impairment at least annually and, if necessary, written down to the extent impaired.
Share Acquisitions
On April 30, 2008, KDVS closed the acquisition of twelve companies from the Orion Group with 1.1 million CATV subscribers.
In total, the Acquisitions include the following entities:
| | | | |
Company | | Ownership | |
|---|
| Tele Columbus Nord GmbH | | | 100.00 | % |
| Kabel Deutschland Sued GmbH(42) | | | 100.00 | % |
| Kabel Deutschland West GmbH(42) | | | 100.00 | % |
| Kabel Deutschland Nord GmbH(42) | | | 100.00 | % |
| AEP Plückhahn Kabel GmbH | | | 100.00 | % |
| KMG Kabel-Fernsehen Hannover GmbH | | | 100.00 | % |
| Urbana Teleunion Rostock GmbH & Co. KG | | | 70.00 | % |
| Verwaltung Urbana Teleunion Rostock GmbH | | | 50.00 | % |
- (42)
- Kabel Deutschland Süd GmbH, Kabel Deutschland West GmbH and Kabel Deutschland Nord GmbH previously known respectively as Cor H Erste GmbH, Cor H Zweite GmbH and Cor H Dritte GmbH.
For the above acquired companies KDVS did not have any previous ownership.
F-93
Table of Contents
For the following companies, KDVS did have minority holdings prior to the Acquisition.
| | | | | | | | | | |
| | Existing Minority | |
|---|
Company | | Acquired | | Ownership | | Total | |
|---|
KABELCOM Braunschweig Gesellschaft für Breitbandkabel-Kommunikation mbH | | | 75.58 | % | | 24.00 | % | | 99.58 | % |
KABELCOM Wolfsburg Gesellschaft für Breitbandkabel-Kommunikation mbH | | | 72.49 | % | | 24.00 | % | | 96.49 | % |
Prior to the Acquisition, KDG GmbH did have minority holdings in RKS Niedersächsische Kabel-Servicegesellschaft mbH & Co. KG of 52.63% and in RKS Niedersächsische Kabel-Service-Beteiligungsgesellschaft mbH of 43.80% which were transferred to KDVS by contract of July 17, 2008, effective retroactively at May 1, 2008. This transfer together with the Acquisition resulted in a total holding of 100% in both companies.
| | | | | | | | | | |
| | [ILLEGIBLE] | |
|---|
Company | | Acquired | | Ownership | | Total | |
|---|
RKS Niedersächsische Kabel-Servicegesellachaft mbH & Co. KG | | | 47.37 | % | | 52.63 | % | | 100.00 | % |
RKS Niedersächsische Kabel-Service-Beteiligungsgesellschaft mbH | | | 56.20 | % | | 43.80 | % | | 100.00 | % |
As of April 30/May 1, 2008, the acquired companies were consolidated for the first time. The Acquisition has been accounted for using the purchase method of accounting. The financial statements include the results of the acquired companies for the eleven month period ended March 31, 2009. An additional 1.16% in KABELCOM Wolfsburg Gesellschaft für Breitbandkabel-Kommunikation mbH was acquired from the City of Wolfsburg by contract as of December 17, 2008; resulting in a total ownership of 97.65%.
F-94
Table of Contents
The fair value of the identifiable assets and liabilities of the Acquisition as at the date of Acquisition and the corresponding carrying amounts immediately prior to the Acquisition were:
| | | | | | | |
| | Fair value
recognized
on acquisition | | Previous
carrying
value | |
|---|
| | T€
| | T€
| |
|---|
Customer List | | | 226,847 | | | 33,962 | |
Property and equipment | | | 70,265 | | | 71,359 | |
Cash and Cash equivalents | | | 5,652 | | | 5,652 | |
Trade receivables | | | 3,553 | | | 6,518 | |
Other assets | | | 8,566 | | | 8,566 | |
| | | | | | |
| | | 314,883 | | | 126,057 | |
| | | | | | |
Trade payables | | | (9,608 | ) | | (9,608 | ) |
Other liabilities | | | (23,371 | ) | | (20,071 | ) |
Deferred income | | | (14,242 | ) | | (14,242 | ) |
Deferred income tax liabilities | | | (50,276 | ) | | 0 | |
| | | | | | |
| | | (97,497 | ) | | (43,921 | ) |
Net assets | | | 217,386 | | | 82,136 | |
| | | | | | | |
Minority interest | | | (8,777 | ) | | | |
| | | | | | | |
Total net assets acquired | | | 208,609 | | | | |
Goodwill arising on acquisition | | | 335,337 | | | | |
| | | | | | | |
Total acquisition cost | | | 543,946 | | | | |
| | | | | | | |
The goodwill recognized on the Acquisition represents future economic benefits anticipated from the acquisition of 1.1 million connected cable households. One notable such benefit is the increase of the Group's direct marketable customer base. Moreover, a significant number of the acquired households get access to the Group's triple play products and non upgraded networks will be largely upgraded for Internet and Phone.
The total cost of acquisition amounted to T€543,946 was comprised of T€509,538 for the purchase price and of T€34,408 for directly attributable costs to the Acquisition such as professional fees for lawyers, due diligence and other professional advisers, M&A fees and fees for the closing of the Acquisition.
| | | | |
Acquisition Cost | |
| |
|---|
Purchase price | | | 509,538 | |
Cost associated with the acquisition | | | 34,408 | |
| | | | |
Total acquisition cost | | | 543,946 | |
| | | | |
F-95
Table of Contents
The preliminary purchase price was reduced by T€19,437 in the fiscal year ended March 31, 2009. The final purchase price settlement was agreed on May 21, 2009. For further information, reference is made to Note 5.6.
| | | | |
Cash outflow on acquisition: | |
| |
|---|
Total acquisition cost | | | 543,946 | |
Purchase price repayment—not yet received | | | 10,508 | |
Cost associated with the acquisition—not yet paid | | | (14,915 | ) |
Cost associated with the acquisition—paid prior year | | | (4,608 | ) |
Shares of acquisition already owned | | | (1,452 | ) |
| | | | |
Subtotal | | | 533,479 | |
Net cash acquired with the acquisition | | | (5,652 | ) |
| | | | |
Net cash outflow from the acquisition | | | 527,827 | |
| | | | |
From the date of acquisition until fiscal year ended March 31, 2009, the Acquisition has contributed T€10,881 to the net income of the Group. Considering if the business combination had been effected at the beginning of the year the net loss for the Group would have been T€71,041 and revenue from continuing operations would have been T€1,379,174.
1.3.3 Basis of Consolidation
Intercompany transactions, balances and unrealized gains on transactions between KDVS and its subsidiaries are eliminated in consolidation. The accounting policies of the consolidated subsidiaries are consistent with the policies adopted by KDVS. Acquisitions are accounted for using the purchase method of accounting.
Subsidiaries are fully consolidated from the date of acquisition, being the date on which the Group obtains control and continue to be consolidated until the date that such control ceases.
Companies in which KDVS has significant influence over the business and the financial policies as defined by IAS 28 "Investments in Associates" are recorded in the consolidated financial statements using the equity method. Intercompany profits and losses of associated companies are eliminated in consolidation in relation to their shareholding ratio.
1.4 Currency Translation
The functional and reporting currency of KDVS Group is the Euro.
Foreign currency transactions were converted to Euros at the exchange rate applicable on the date of the transaction. Monetary assets and liabilities denominated in foreign currencies existing as of the balance sheet date are converted to Euros at the exchange rate of the European Central Bank on the balance sheet date. Currency differences resulting from these adjustments are recognized in the consolidated statement of operations.
Non-monetary assets and liabilities denominated in foreign currencies existing as of the balance sheet date which are to be carried at fair value were converted to Euros at the rate. The Group used the following exchange rates (spot rates):
| | | | | | | |
| | March 31,
2009 | | March 31,
2008 | | March 31,
2007 | |
|---|
1 € | | US$1.3308 | | US$1.5812 | | US$1.3318 | |
1 € | | GBP 0.9308 | | GBP 0.7958 | | GBP 0.6798 | |
F-96
Table of Contents
2. Accounting and Valuation Methods
2.1 Property and Equipment
2.1.1 Property and Equipment
Property and equipment are recognized at cost less accumulated depreciation and accumulated impairment losses. Borrowing costs are not capitalized. Rebates, trade discounts and bonuses are deducted from the purchase price.
For technical equipment located on leased property, historical costs include the present value of estimated future costs and expenses necessary for restoration of the leased property after termination of the lease agreement.
2.1.2 Leases
Operating lease
A lease is accounted for as an operating lease when all the risks and benefits incidental to ownership of the leased item remain with the lessor. Operating lease payments are therefore recorded on a straight-line basis over the lease term as an expense in the consolidated statement of operations.
Operating lease for Customer Premises Equipment (CPE)
To get a connection to Internet & Phone services as well as to receive digital TV, the Group leases the necessary equipment to the customers (Customer Premise Equipment of CPE). These leases, for which the Group is the lessor, are classified as an operating lease. Therefore, the Group capitalizes the CPE as fixed assets based on acquisition cost and the cost of removing the asset at the end of the lease. Over the useful life of 3 years the assets are depreciated using the straight-line method.
Finance lease
In accordance with IAS 17 "Leases", assets leased under finance leases are recorded at the lower of fair value at the inception of the lease or the present value of the lease payments. The assets are depreciated using the straight-line method over the shorter of the estimated useful life or over the lease period. The obligations related to future lease payments are recognized as liabilities. Lease payments are apportioned between the finance charges and reductions of the lease liability so as to achieve a constant rate of interest on the remaining balance of the liability. Finance charges are charged directly against income.
2.1.3 Subsequent Expenses
Rental costs are expensed. Repair and maintenance charges are expensed during the financial period in which they are incurred. The cost of significant renovations and additions are included in the carrying amount of the asset when it is probable that future economic benefits in excess of the originally assessed standard of performance will be realized by the Group. Significant renovations are depreciated over the shorter of the remaining useful life of the related asset or the lease term.
2.1.4 Depreciation of Fixed Assets
Depreciation is calculated based on the straight-line method over each asset's estimated useful life as follows:
| | |
Buildings and leasehold improvements | | 3 to 10 years |
Technical equipment and machines | | 3 to 20 years |
Property and equipment | | 3 to 15 years |
F-97
Table of Contents
Gains and losses from derecognition of fixed assets are determined by deducting the carrying amount of the asset being sold from the proceeds received at the time of derecognition. The results are included in other operating income or in the corresponding expense line item. The assets' residual values, useful lives and depreciation methods are reviewed, and adjusted if appropriate, at each financial year end.
2.2 Intangible Assets
2.2.1 Customer List
In connection with the initial acquisition of the cable business by the Group in March 2003, approximately T€681,659 of the purchase price was allocated to the customer list. Further additions to the customer list that occurred during the twelve months ended March 31, 2009 and in the previous years are primarily related to the acquisition of Level 4 companies and subscribers. The weighted remaining useful life of the customer list is 4.84 years, 3.92 years and 4.61 years as of March 31, 2009, March 31, 2008 and March 31, 2007, respectively.
2.2.2 Other Intangible Assets
Intangible assets which are purchased separately are recorded at cost. Intangible assets that have been acquired as part of an acquisition of a business are capitalized at fair value if they can be reliably measured at the acquisition date.
Computer software is recorded at cost as an intangible asset.
The Group recognizes intangible assets developed internally (consisting of software used by the Group) to the extent the criteria in IAS 38 "Intangible Assets" are met. Development costs for internally generated intangible assets are recognized at cost to the extent the Group can demonstrate the technical feasibility of completing the asset, how the asset will generate future economic benefit, the availability of resources to complete the asset and the ability to measure reliably the expenditure during the development. If the requirements for capitalization are not fulfilled, development costs are expensed as incurred.
The Group recognizes subscriber acquisition costs incurred to obtain new subscribers if the costs are directly attributable to obtaining specific contracts, are incremental, can be measured reliably and meet the definition and recognition criteria of an intangible asset in accordance with IAS 38. Subscriber acquisition costs incurred to obtain new contracts without an initial contract period (open-ended contracts) are expensed as incurred.
Following initial recognition, intangible assets are carried at cost less any accumulated depreciation and any accumulated impairment loss.
2.2.3 Subsequent Expenses
Subsequent investments in intangible assets will be capitalized if they qualify for recognition as an intangible asset.
2.2.4 Amortization of intangible assets
The estimated useful life of the customer list is based on the average number of terminations and the term of the average contract life of individual end users who generate significant contribution margins.
The amortization of other intangible assets with definite useful lives is based on the straight line method over the assets' estimated useful lives. Amortization begins when the intangible asset is ready for use.
F-98
Table of Contents
The Group recognizes subscriber acquisition costs incurred to obtain new subscribers. The Group amortizes these costs over the initial contract period except for contracts where there is past evidence regarding the expected customer relationship period.
The amortization expense is recognized in the statement of operations in the expense category consistent with the function of the intangible assets.
The useful lives are estimated as follows:
| | | | |
| • | | Customer list | | 8.5 years |
| • | | Software and licenses | | 1–10 years |
| • | | Subscriber Acquisition Costs | | 1–8.5 years |
The appropriateness of the useful life for the customer list is validated on an annual basis.
2.3 Financial Instruments
Recognition and Derecognition of Financial Instruments
Financial assets and liabilities are recognized when the Group enters into a contractual relationship with the respective counterparty or issuer. A financial asset is derecognized when:
- •
- the rights to receive cash flows from the asset have expired;
- •
- the Group retains the right to receive cash flows from the asset but has assumed an obligation to pay those cash flows in full without material delay to a third party under a 'pass-through' arrangement; or
- •
- the Group has transferred its rights to receive cash flows from the asset and either (a) has transferred substantially all the risks and rewards of the asset, or (b) has neither transferred nor retained substantially all the risks and rewards of the asset but has transferred control of the asset.
A financial liability is derecognized when the obligation under the liability is discharged, canceled or expired.
Where an existing financial liability is replaced by another one from the same lender on substantially different terms, or the terms of an existing liability are substantially modified, such an exchange or modification is treated as a derecognition of the original liability and the recognition of a new liability, and the difference in the respective carrying amounts is recorded in the consolidated statement of operations.
Financial Assets
Financial assets in the scope of IAS 39 are classified as either financial assets at fair value through profit or loss, loans and receivables, held-to-maturity investments, or available-for-sale financial assets, as appropriate. When financial assets are initially recognized, they are measured at fair value, plus, in the case of investments not at fair value through profit or loss, directly attributable transaction costs. The Group determines the classification of its financial assets after initial recognition and, where allowed and appropriate, reevaluates this designation at each financial year-end. All purchases and sales of financial assets are recognized on the trade date, which is the date that the Company commits to purchase the asset.
Financial assets at fair value through profit or loss
Financial assets classified as held for trading are included in the category "financial assets at fair value through profit or loss". Financial assets are held for trading if they are acquired for the purpose
F-99
Table of Contents
of selling in the near term. Derivatives are also classified as held for trading unless they are designated and effective hedging instruments. Gains or losses on investments held for trading are recognized in the consolidated statement of operations.
Loans and receivables
Loans and receivables are non-derivative financial assets with fixed or determinable payments that are not quoted in an active market. Such assets are carried at amortized cost using the effective interest method. Gains and losses are recognized in the consolidated statement of operations when the loans and receivables are extinguished or impaired as well as through the amortization process.
Available-for-sale financial assets
Available-for-sale financial assets are those non-derivative financial assets that are designated as available-for-sale or are not classified in any of the three preceding categories. After initial recognition available-for-sale financial assets are measured at fair value with gains or losses being recognized as a separate component of equity until the investment is sold or until the investment is determined to be impaired at which time the cumulative gain or loss previously reported in equity is included in the statement of operations.
Financial Liabilities
Financial liabilities (loans) are initially recognized at cost which corresponds to the fair value of the given consideration received net of issue costs associated with the financial liabilities. In subsequent periods, liabilities are measured at amortized cost using the effective interest method with the exception of derivative financial instruments which are measured at their fair market value.
Derivative Financial Instruments
Derivative financial instruments are used exclusively for the purpose of hedging foreign currency and interest rate risks arising from financing activities. In accordance with IAS 39 "Financial Instruments: Recognition and Measurement", all derivative financial instruments are accounted for at fair value irrespective of the purpose or the intention for which they were incurred. Depending on whether it is a fair value hedge or a cash flow hedge, changes in the fair value of the derivative financial instruments for which hedge accounting is used are either reported in the statement of operations or in the statement of changes in equity under cash flow hedge reserve. In the case of a fair value hedge, the gains or losses from the measurement of derivative financial instruments at fair value and the gains or losses related to the underlying contracts are recognized in the consolidated statement of operations. In the case of changes in the fair value of cash flow hedges which are used to offset future cash flow risks arising from underlying transactions or planned transactions and which have proved to be 100% effective in accordance with IAS 39, unrealized gains and losses are initially recognized in equity as a cash flow hedge reserve.
If the cash flow hedge is not 100% effective, the ineffective portion of changes in the fair value of the derivative designated as a cash flow hedge is recognized in the consolidated statement of operations. If hedge accounting cannot be used by the Group, the change in the fair value of derivative financial instruments is recorded in the consolidated statement of operations.
Equity Investments in Associates
Investments in associates are accounted for using the equity method at the investor's share of equity pursuant to IAS 28 "Investments in Associates". The Group's share of income, reduced by distributions and amortization of write-ups in amortizable assets from purchase accounting is disclosed in the fixed asset register as a change in equity investment.
F-100
Table of Contents
2.4 Inventories
Raw materials, consumables, supplies, finished goods and merchandise are recorded at the lower of cost or net realizable value. Cost is generally determined using a moving average cost.
2.5 Trade and Other Receivables
Trade and other receivables are disclosed at their nominal amount less bad debt allowances for any amounts deemed uncollectible. In relation to trade receivables, a provision for impairment is made when there is objective evidence (such as the probability of insolvency or significant financial difficulties of the debtor) that the Group will not be able to collect all of the amounts due under the original terms of the invoice. The carrying amount of the receivable is reduced through use of an allowance account. Impaired debts are derecognized when they are assessed as uncollectible.
2.6 Cash and Cash Equivalents
Cash and cash equivalents are mainly comprised of cash on hand and other short-term, highly liquid investments with an original maturity of three months or less. Cash in hand and at banks are carried at nominal value.
For purposes of the consolidated cash flow statement, cash and cash equivalents consist of cash and cash equivalents as defined above, net of outstanding bank overdrafts.
2.7 Impairment
The carrying amount of intangible assets and property and equipment is reviewed at every balance sheet date to determine whether there are any indications of impairment. If such indications exist or when annual impairment testing is required, the recoverable amount is estimated. Impairment is necessary when the carrying amount of an asset or the related cash-generating unit exceeds the recoverable amount. The corresponding impairment is expensed.
Goodwill is tested for impairment annually (as at March 31) and when circumstances indicate that the carrying amount value may be impaired. Impairment is determined for goodwill by assessing the recoverable amount of each cash-generating unit to which the goodwill relates. Where the recoverable amount of the cash-generating unit is less than their carrying amount, an impairment loss is recognized. Impairment losses for goodwill are not reversed in subsequent periods.
If there is objective evidence that an impairment loss on loans and receivables carried at amortized cost has been incurred, the amount of the loss is measured as the difference between the asset's carrying amount and recoverable amount, i.e. the higher of the present value of estimated future cash flows discounted at the financial asset's original effective interest rate and fair value less cost to sell. The carrying amount of the receivable is reduced through use of an allowance account. Impaired debts are derecognized when they are assessed as uncollectible.
2.7.1 Determination of Recoverable Amount
The recoverable amount of an asset is the greater of its fair value less costs to sell and its value in use. Value in use is determined by discounting the estimated future cash flows to be derived from continuing use of the asset until its ultimate disposal. The discount rate is based on a pre-tax interest rate that reflects current market assessments of the fair value of money and the risks specific to the asset.
For assets to which no cash flows can be directly attributed, the recoverable amount is determined for the cash-generating unit to which the asset belongs.
F-101
Table of Contents
2.7.2 Reversal of Impairment Loss
Impairment losses on assets are reversed when assumptions relating to the recoverable amount of the assets change. Impairment losses are only reversed up to the carrying amount of the asset which would have been recorded if the asset had been subject to standard depreciation without impairment.
2.8 Equity
Limited partnership capital and the capital reserve are stated at nominal value after the reclassification of the capital attributable to Limited Partners which is recored as a liability and accounted for at fair value. Capital reserves contain contributions from partners and changes relating to share-based payments.
2.9 Capital attributable to the Limited Partners
Financial instruments which grant the holder a right of repayment of the capital contributed to the partnership are classified as liabilities in accordance with IAS 32 "Financial Instruments". KDVS and its legal predecessors have been structured in the legal form of commercial partnerships in which the limited partners can obligate the partnership to repay capital contributions and the related attributable profit interest by exercising a legal right of notice.
The rights of the limited partners to the net assets of the partnerships are therefore reported in the IFRS consolidated financial statements of KDVS as liabilities under the item "Capital attributable to the Limited Partners". The liability is measured at the present value of the repayment right of the limited partner that, in accordance with the provisions of the partnership agreements, amounts to2/3 of the fair value of the interest in the limited partnership. The fair value of the interest is determined by reference to market transactions or by applying the discounted cash flow method (DCF method).
2.10 Employee Benefits
Under the Group's pension plans, KDVS provides employees post-employment benefits under a defined benefit plan. The benefits are unfunded.
The present value of future claims of participants is estimated using actuarial methods based on the amount of benefit earned for their service in the current and prior periods. The liabilities to be recognized in the consolidated balance sheet result from the present value of the defined benefit obligation adjusted for any actuarial gains or losses, and less any past service cost not yet recognized. The discount rate is determined by reference to the capital markets and takes into account the expected maturity of the obligation. KDVS engaged qualified external actuaries to perform the necessary actuarial calculations. The obligation is determined using the projected unit credit method.
If the benefits of the pension plan improve, the share of those plan improvements relating to the employees' previous years of service will be recognized as an expense on a straight-line basis over the period in which the claims vest. If the claims have already vested, the prior service cost is expensed immediately.
In measuring the obligations arising from the defined benefit plans, actuarial gains and losses arising after April 1, 2003 are not recognized in the consolidated statement of operations until the cumulative outstanding amounts exceed a corridor of 10% (corridor approach) of the defined benefit obligation as of the measurement date. The portion of the amount exceeding the corridor is amortized to the consolidated statement of operations over the remaining average service life of the employees entitled to pensions.
F-102
Table of Contents
2.11 Other Provisions
Other provisions are recognized in the consolidated balance sheet pursuant to IAS 37 "Provisions, Contingent Liabilities and Contingent Assets" when a legal or constructive obligation to a third party arises as a result of past events. An outflow of resources embodying economic benefits will be required to settle the obligation and the anticipated amount of the provision can be reliably estimated. Non-current other provisions are stated at their discounted settlement value on the balance sheet date where the effect of the time value of money is material.
2.12 Trade Payables and Other Liabilities
Trade payables and other liabilities are recorded at amortized cost.
2.13 Revenue and Other Income
Revenue is recognized to the extent it is probable that the economic benefits will flow to the Group and revenue can be reliably measured. The different types of revenue are recognized as follows:
Installation and network connection
Revenue from the installation of the cable connection and the network connection is recognized when the services have been rendered, the costs incurred can be measured reliably and the Group is not obliged to provide any future network connection or installation services.
Rendering of services
Revenue generated by the delivery of analog and digital pay products, Internet and telephone services as well as carriage fees and digital playout facility fees paid by television broadcasters are recognized when services have been provided, the costs incurred can be measured reliably and the Group is not obliged to provide any future services. Prepayments are accounted for by deferring the received payments and amortizing them straight-line over the service period.
When free months are offered to customers in relation to a subscription, the Group recognizes the total amount of billable revenue in equal monthly installments over the term of the contract, provided that the Group has the enforceable and contractual right to deliver the customer with the products after the promotional free month period. If free months are given without a contract at the beginning of a subscription period, the Group does not recognize revenues during the free months as the customer's continuance is not assured.
Sale of goods
Revenue from the sale of digital set top boxes, cable modems, and other goods is recognized when the significant risks and rewards of ownership of the goods have passed to the buyer. If the Group acts as an agent, revenue is only recognized in the amount of the sales commissions.
Multiple Elements Arrangements
For bundled services in multiple element arrangements the Group recognizes revenue for each element on the basis of the relative fair value of each item in the transaction if there is evidence of fair value.
2.14 Share-Based Payments
The Group applies IFRS 2 "Share-based Payment". Under IFRS 2, plans which result in share-based payment transactions have to be accounted for as cash-settled if the interest holder will receive a
F-103
Table of Contents
payment in cash upon settlement rather than the underlying equity instruments. Due to the terms of the different programs at KDVS, it is highly likely that the general partner of Cayman Cable Holding L.P. (the Partnership) will exercise the existing repurchase option in most cases of the interest holders' termination of employment and settle in cash. Alternatively, employees leaving the Group may have the option to put their vested interests to Cayman for cash. In the case of a put or call, the employee is generally protected from decreases in fair value below their initial investment amount. For such cash-settled share-based payment transactions, IFRS 2 requires the entity to account for share-based payments to management as personnel expense and a corresponding increase in other liabilities. For interests in the Management Equity Participation Program I (MEP I) and in the Management Equity Participation Program IV (Indirect MEP IV) which are share acquisition programs, the costs of cash-settled transactions are measured initially based on the notional amount paid.
For MEP II and III as well as the MEP IV Option program and MEP V, which all are option programs, the costs of cash-settled transactions are measured initially at fair value at the grant date using the Black-Scholes model taking into account the terms and conditions upon which the instruments were granted because it is typically not possible to reliably estimate the fair value of employee services received. This fair value is expensed over the period until vesting with recognition of a corresponding liability.
For all MEP programs the services received during the vesting periods and, therefore, the corresponding liabilities are remeasured at each balance sheet date up to and including the settlement date with changes in fair value recognized in the consolidated statement of operations.
2.15 Benefit/Taxes on Income
Current income tax assets and liabilities are measured at the amount expected to be recovered from or paid to the taxation authorities. The tax rates and tax laws used to compute the amounts are those that are enacted or substantively enacted by the balance sheet date.
Except for those cases described below, deferred income tax is provided using the liability method on all temporary differences between the tax basis of assets and liabilities and their carrying amounts for financial reporting purposes at the balance sheet date.
Deferred income tax liabilities are recognized for all taxable temporary differences, except:
- •
- where the deferred income tax liability arises from the initial recognition of goodwill or of an asset or liability in a transaction that is not a business combination and, at the time of the transaction, affects neither the accounting profit nor taxable profit or loss; and
- •
- for temporary taxable differences associated with investments in subsidiaries, associates and interests in joint ventures, where the timing of the reversal of the temporary differences can be controlled and it is probable that the temporary differences will not reverse in the foreseeable future.
Deferred income tax assets are recognized for all temporary deductible differences, carry forward of unused tax credits and unused tax losses to the extent that it is probable that taxable profit will be available against which the deductible temporary differences and the carry forward of unused tax credits and unused tax losses can be utilized:
- •
- except where the deferred income tax asset relating to the temporary deductible difference arises from the initial recognition of an asset or liability in a transaction that is not a business combination and, at the time of the transaction, affects neither the accounting profit or loss nor taxable profit or loss;
- •
- except that temporary deductible differences associated with investments in subsidiaries, associates and interests in joint ventures, deferred tax assets are only recognized to the extent
F-104
Table of Contents
The carrying amount of deferred income tax assets is reviewed at each balance sheet date and reduced to the extent that it is no longer probable that sufficient taxable profit will be available to allow all or part of the deferred income tax asset to be utilized.
Deferred income tax assets and liabilities are measured at the tax rates that are expected to apply to the year when the asset is realized or the liability is settled, based on tax rates (and tax laws) that have been enacted or substantively enacted at the balance sheet date.
Income taxes relating to items recognized directly in equity are recognized in equity and not in the statement of operations.
Deferred tax assets and deferred tax liabilities are offset if a legally enforceable right exists to set off current tax assets against current tax liabilities and the deferred taxes relate to the same taxable entity and the same taxation authority.
2.16 Key Judgments and Estimation Uncertainty
The preparation of the consolidated financial statements in accordance with IFRS requires judgments and estimations to be made which have an effect on the carrying amounts of recognized assets and liabilities, income and expenses and contingent liabilities. In some cases, the actual values may differ from the judgments and estimations. Changes are recognized in the consolidated statement of operations when better information is available.
2.16.1 Key Judgments
In the process of applying KDVS' accounting policies, management has made the following judgments, apart from those involving estimations, which have the most significant effect on the amounts recognized in the consolidated financial statements.
Derivatives
The Group has entered into interest rate swaps, interest rate caps and currency swaps to hedge its risks resulting from exposure to changes in interest rates and foreign currency rates. All of these derivative instruments have been accounted for in accordance with IAS 39 at fair value irrespective of the purpose or the intention for which they were used. The currency swaps with a maturity in June 2009 were consistently classified as cash flow hedges.
Operating Leases for CPE
The Group offers products that contain signal delivery and the right to use hardware devices. The hardware devices are essential for the signal delivery to the customer. Since the fulfillment of these arrangements is dependent on the use of a specific asset and the arrangements convey a right to use the asset, the contracts contain a lease in accordance with IFRIC 4 (KDVS as lessor).
Hardware devices are recognized as equipment in accordance with IAS 16 and amortized over the useful life of three years.
Operating lease cable ducts
In certain cases KDVS leases space in the cable ducts of Deutsche Telekom AG (DTAG) to house KDVS' network cable. The Group has determined that it retains no significant risks and rewards of ownership of these cable ducts and, therefore, accounts for the leases as operating leases.
F-105
Table of Contents
Finance lease transponders
The Group has leased specific satellite transponders in order to transmit audio and video signals. The Group has determined that the rights to use specific transponders have been transferred and that the lease term of specific transponders covers the major part of the economic life of the transponders. Therefore, the Group has classified and accounted for the leases as finance leases according to IAS 17.
Capital attributable to the Limited Partners
The rights of the limited partners to the net assets of the partnership are recorded as liability (under the item "Capital attributable to the Limited Partners"). If the limited partner (KDG) left KDVS, KDVS would not exist in the same way as before. Management expects that KDVS would not continue its business. As in that case no deductible temporary difference would arise KDVS did not recognize any deferred tax assets due to the revalued limited partnership.
2.16.2 Estimation Uncertainty
The key assumptions concerning the future and other key sources of estimation uncertainty at the balance sheet date that have a significant risk of causing a material adjustment to the carrying amounts of assets and liabilities within the next financial year are discussed below.
Derivatives
The fair values of the derivative financial instruments as of the balance sheet date have been estimated at the net present values (discounted by market yield curves) of the future payments and using standard models (in the case of caps). The total fair values of the derivative financial instruments amounted to T€-1,698, T€4,239 and T€5,415 as of March 31, 2009, March 31, 2008 and March 31, 2007, respectively.
Share-based payments
As of March 31, 2006 and for periods prior to this, it was management's intention to settle MEP I using the formula price as stated in the respective limited partnership agreement. Effective April 19, 2006 and in connection with the 5th amendment to the limited partnership agreement, the controlling shareholders of Cayman Cable modified the settlement terms of MEP I interests in Cayman Cable Holding L.P to better reflect current market value conditions, changing the settlement formula from an EBITDA formula with fixed multiples to estimated fair value. The change in the fair price estimation resulted in an increase in personnel expenses in the amount of T€1,493 for the fiscal year ended March 31, 2007.
Based on the 5th amendment to the limited partnership agreement, the fair value measurement for MEP IV interests is based on the same valuation method as is used for MEP I.
The measurement of the fair value at grant date with respect to the MEP II and MEP III option plans as well as to the MEP IV Option Program and MEP V is based on the Black-Scholes option pricing model. The main parameters, the expected volatility of the values of the shares, the estimated term of the options and the risk free interest rate on grant date were estimated by the Group.
The Group recognized expenses with respect to all MEP plans in an amount of T€885, T€3,017 and T€4,217 for the years ended March 31, 2009, March 31, 2008 and March 31, 2007, respectively.
Internally Developed Software
The Group recognized intangible assets developed internally (consisting of software used by the Group) to the extent the criteria of IAS 38 were met. Development costs for internally generated
F-106
Table of Contents
intangible assets are recognized at cost to the extent the assets are economically usable and the costs can be reliably measured. For the years ended March 31, 2009, March 31, 2008 and March 31, 2007, respectively, approximately T€3,871, T€2,528 and T€1,048 of costs for internally developed software were capitalized.
Customer List
The customer list is primarily amortized on a straight-line basis over 8.5 years. The estimated useful life is based on the average number of terminations and the term of the average contract life. The book value of the customer list amounted to T€433,101, T€317,813 and T€382,387 for the years ended March 31, 2009, March 31, 2008 and March 31, 2007, respectively.
Trade Receivables
The latest experience regarding the collectability of past due receivables has shown that the collection rate of receivables of more than 180 days past due has improved from nearly 0% to 20%. Therefore, the Group has revised the provision for allowance for such receivables from 100% down to 80%. The effect of this revision is a decrease of bad debt allowance by T€3,067 from T€56,312 to T€53,245 as of March 31, 2009.
Provision for Pensions
With respect to the actuarial calculation of the provision for pensions, the Group estimated future salary increases, future pension increases and the discount rate. As of March 31, 2009, March 31, 2008 and March 31, 2007, the provision for pensions amounted to T€31,163, T€25,849 and T€21,579, respectively.
Asset Retirement Obligations
The amount of the accrual is based on an estimate of the costs expected for the demolition and restoration of the technical facilities. Expectations regarding the lessor waiving asset retirement performance requirements are factored into the calculation of best estimate of the obligation related to the leased cable ducts under IFRS. Approximately 93% of KDVS' obligations are related to technical equipment, including different kinds of cable and signal transmitting and receiving technology in cable ducts of DTAG. KDVS assumes that 6% of the technical equipment will be replaced by other technologies after 10 years, 28% will be replaced after 15 years and the remaining 66% of the technical equipment is expected to be replaced after 30 years. The remaining 7% of the asset retirement obligations are divided into accruals for furniture, fixtures and miscellaneous restoration obligations. The asset retirement obligations amounted to T€22,971, T€20,665 and T€20,562 as of March 31, 2009, March 31, 2008 and March 31, 2007, respectively.
2.17 Accounting Standards Recently Issued by the IASB
The Group applied all IFRSs and IFRIC interpretations issued by the IASB, London, which are effective as of March 31, 2009, adopted by the EU and applicable to the Group. The designation IFRS also includes all valid IAS. All interpretations of the IFRIC, formerly the SIC, were also applied.
Accounting Standards recently issued by the IASB and applied by the Group
In addition to the IFRSs and IFRIC interpretations already applied by the Group in the fiscal year ending March 31, 2008, it has adopted the following amended IFRS standards and IFRIC interpretations during the year ended March 31, 2009. Adoption of these revised standards and
F-107
Table of Contents
interpretations did not have any effect on the financial performance or position of the Group. They did however give rise to additional disclosures:
- •
- IFRIC 12 "Service Concession Arrangements"
- •
- IFRIC 14 "IAS 19—The Limit on a Defined Benefit Asset, Minimum Funding and their Interaction"
- •
- Amendments to IAS 39 "Financial Instruments: Recognition and Measurement" and IFRS 7 "Financial Instruments: Disclosures"
The principle effects of these changes are as follows:
In November 2006, the IFRIC issued the interpretation IFRIC 12 "Service Concession Arrangements". This interpretation applies to service concession operators and explains how to account for the obligations undertaken and rights received in service concession arrangements. Service concessions are arrangements whereby a government or other public sector entity as the grantor grants contracts for the supply of public services to private sector entities as operators. Depending on the consideration the operator receives from the grantor, the operator recognizes a financial asset or an intangible asset. A financial asset is recognized if the operator has an unconditional contractual right to receive cash or another financial asset from the grantor. If, however, the consideration the operator receives from the grantor is a right to impose charges upon users, which does not represent an absolute right to receive payments, an intangible asset is recognized. Depending on the contractual arrangements, recognition of both a financial asset and an intangible asset is also possible. No member of the Group is an operator and, therefore, this interpretation has no impact on the Group.
The IFRIC Interpretation IFRIC 14 "IAS 19—The Limit on a Defined Benefit Asset, Minimum Funding and their Interaction" provides guidance on how to assess the limit on the amount of surplus in a defined benefit scheme that can be recognized as an asset under IAS 19 Employee Benefits. Since the Group does not have plan assets this interpretation has no impact on the Group.
An amendment to IAS 39 "Financial Instruments: Recognition and Measurement" and IFRS 7 "Financial Instruments: Disclosures" issued in October 2008, permits an entity to reclassify non-derivative financial assets (other than those designated at fair value through profit or loss by the entity upon initial recognition) out of the fair value through profit or loss category in particular circumstances. The amendment also permits an entity to transfer from the available-for-sale category to the loans and receivables category a financial asset that would have met the definition of loans and receivables (if the financial asset had not been designated as available for sale), if the entity has the intention and ability to hold that financial asset for the foreseeable future. The changes in IFRS 7 require additional disclosures about the situations in which any such reclassification is made, and the effects on the financial statements. In the reporting period, the Group did not hold any financial assets eligible for reclassification under the amendment to IAS 39 in its portfolio. The application of the amended IAS 39 and IFRS 7 therefore has no effect on the presentation of the Group's results of operations, financial position or cash flows.
Accounting Standards recently issued by the IASB and not yet applied by the Group
The Group has not applied any of the following standards or interpretations that have been issued and have been endorsed by the EU as of July 8, 2009 but are not effective for the Group as of March 31, 2009.
The revised IAS 1 "Presentation of Financial Statements" was issued in September 2007 and becomes effective for financial years beginning on or after January 1, 2009. The standard separates owner and non-owner changes in equity. The statement of changes in equity will include only details of transactions with owners, with non-owner changes in equity presented as a single line. In addition, the
F-108
Table of Contents
standard introduces the statement of comprehensive income: it presents all items of recognized income and expense, either in one single, or in two linked statements. As the amendment to IAS 1 only affects disclosure requirements, it will not have an impact on the Group's results of operations, financial position or cash flows.
A revised IAS 23 "Borrowing cost" was issued in March 2007, and applies to borrowing costs relating to qualifying assets for which the commencement date for capitalization is on or after January 1, 2009. The standard has been revised to require capitalization of borrowing costs when such costs relate to a qualifying asset. A qualifying asset is an asset that necessarily takes a substantial period of time to get ready for its intended use or sale. In accordance with the transitional requirement in the Standard, the Group will adopt this prospective change. Accordingly, borrowing costs will be capitalized on qualifying assets with a commencement date after April 1, 2009. No changes will be made for borrowing costs incurred to this date that have been expensed.
The revised standard of IAS 27 "Consolidated and Separate Financial Statements" was issued in January 2008 and becomes effective for financial years beginning on or after July 1, 2009. Within the scope of revision of valuation and accounting regulations for business combinations, IASB and FASB enhanced IAS 27. The modifications primarily concern the reporting of holdings without a controlling character (minority holdings) which will in future fully form part of the Group's losses and transactions that lead to a loss of control at a subsidiary company and whose effects are to be treated in a manner affecting net income. In contrast, the consequences of company sell-offs that do not lead to loss of control are not to be included in equity in a manner that affects net income. The transitional provisions provide for several exceptions from the basically retrospective adoption of this revision. The Group expects that this standard will have no impact on its financial position or performance of the Group.
The amendments to IAS 32 "Financial Instruments: Presentation—Amendments relating to Puttable Instruments and Obligations Arising on Liquidation" and IAS 1 "Presentation of Financial Statements—Amendments relating to disclosure of Puttable Instruments and Obligations Arising on Liquidation" were issued in February 2008 and become effective for financial years beginning on or after January 1, 2009. The revisions provide a limited scope exception for puttable instruments to be classified as equity if they fulfill a number of specified features. This means that some financial instruments currently falling under the definition of financial liabilities will be classified as equity. IAS 32 contains detailed criteria applied to identifying such instruments. The amendments to the standards are not expected to have a material impact on the presentation of the Group's results of operations, financial position or cash flows.
The amendments to IFRS 1 "First-time Adoption of International Financial Reporting Standards" allow an entity to determine the 'cost' of investments in subsidiaries, jointly controlled entities or associates in its opening IFRS financial statements in accordance with IAS 27 "Consolidated and Separate Financial Statements" or using a deemed cost. The amendment to IAS 27 requires that all dividends from subsidiaries, jointly managed companies, or associated companies are booked through the statement of operations in the separate single-entity financial statements. Both revisions will be effective for financial years beginning on or after January 1, 2009. The revision to IAS 27 will have to be applied prospectively. The new requirements affect only the parent's separate financial statement and do not have an impact on the consolidated financial statements. In December 2008 the IASB decided to change the effective date from January 1, 2009 to July 1, 2009. IFRS 1 retains the substance of the previous version, but within a changed structure. The amendment to the standards is not expected to have a material impact on the presentation of the Group's results of operations, financial position or cash flows.
A revised version of IFRS 2 "Share based Payment" was issued in January 2008 and becomes effective for annual periods beginning on or after January 1, 2009. This revised standard clarifies the definition of vesting conditions in share-based payments and stipulates that all cancellations of
F-109
Table of Contents
share-based payments should receive identical accounting treatment, regardless of the party responsible for cancellation. The Group plans to adopt the amended IFRS 2 beginning April 1, 2009. Due to the scope of share-based payments at the Group, no serious consequences are expected for the financial asset and profit situation from the initial application of this new regulation.
The revised standards of IFRS 3 "Business Combinations" and IAS 27 "Consolidated and Separate Financial Statements" were issued in January 2008 and become effective for financial years beginning on or after July 1, 2009. IFRS 3 introduces a number of changes in the accounting for business combinations occurring after this date that will impact the amount of goodwill recognized, the reported results in the period that an acquisition occurs, and future reported results. IAS 27 requires that a change in the ownership interest of a subsidiary (without loss of control) is accounted for as an equity transaction. Therefore, such transactions will no longer give rise to goodwill, nor will it give rise to a gain or loss. Furthermore, the amended standard changes the accounting for losses incurred by the subsidiary as well as the loss of control of a subsidiary. Other consequential amendments were made to IAS 7 "Statement of Cash Flows", IAS 12 "Income Taxes", IAS 21 "The Effects of Changes in Foreign Exchange Rates", IAS 28 "Investment in Associates" and IAS 31 "Interests in Joint Ventures". The changes by IFRS 3 and IAS 27 will affect future acquisitions or loss of control and transactions with minority interests. The standard may be adopted early. However, the Group does not intend to take advantage of this possibility.
In November 2006, the IASB issued IFRS 8 "Operating Segments". The standard becomes effective for annual periods beginning on or after January 1, 2009. This standard requires an entity to report financial and descriptive information about its reportable segments. IFRS 8 requires identification of operating segments based on internal reports that are regularly reviewed by the entity's chief operating decision maker in order to allocate resources to the segment and assess its performance. The standard also requires an explanation of how segment profit or loss and segment assets and liabilities are measured for each reportable segment. IFRS 8 requires an entity to report information about revenues derived from its products or services, about the countries in which it earns revenues and holds assets, and about major customers. The provisions of IFRS 8 are effective for annual periods beginning on or after January 1, 2009. The Group adopts the amended IFRS 8 beginning April 1, 2009. The standard will have no material impact on the segment presentation. However, there will be additional and changed disclosures. Changes will mainly refer to the segments "Other" and "Unallocated" that have been presented separately in the past.
Improvements to IFRSs:
In May 2008 the Board issued its first omnibus of amendments to its standards, primarily with a view to removing inconsistencies and clarifying wording. There are separate transitional provisions for each standard. The Group has not yet adopted the following amendments and anticipates that these changes will have no material effect on the financial statements:
- •
- IAS 1 "Presentation of Financial Statements" clarifies that Assets and liabilities classified as held for trading in accordance with IAS 39 "Financial Instruments: Recognition and Measurement" are not automatically classified as current in the balance sheet.
- •
- IAS 8 "Accounting Policies, Change in Accounting Estimates and Errors" clarifies that only implementation guidance that is an integral part of an IFRS is mandatory when selecting accounting policies.
- •
- IAS 10 "Events after the Reporting Period" clarifies that dividends declared after the end of the reporting period are not obligations.
- •
- IAS 16 "Property, Plant and Equipment" replaces the term 'net selling price' with 'fair value less costs to sell'. Items of property, plant and equipment held for rental that are routinely sold in
F-110
Table of Contents
F-111
Table of Contents
removed from, or included in, the 'fair value through profit or loss' classification after initial recognition. The changed standard refrains from the reference in IAS 39 to a 'segment' when determining whether an instrument qualifies as a hedge. Also it requires the use of the revised effective interest rate when remeasuring a debt instrument on the cessation of fair value hedge accounting.
- •
- IAS 40 "Investment Property" revised the scope in a way that property under construction or development for future use as an investment property is classified as investment property. lf fair value cannot be reliably determined, the investment under construction will be measured at cost until such time as fair value can be determined or construction is complete. Also revised by the improvement's project the conditions for a voluntary change in accounting policy are revised to be consistent with IAS 8 and it is clarified that the carrying amount of investment property held under lease is the valuation obtained, increased by any recognized liability.
- •
- IAS 41 "Agriculture" removed the reference to the use of a pre-tax discount rate to determine fair value. Also the prohibition to take into account cash flows resulting from any additional transformations when estimating fair value has been removed and the term 'point-of-sale costs' has been replaced with 'costs to sell'.
- •
- To IFRS 5 "Non-current Assets Held for Sale and Discontinued Operations" the paragraphs 8A and 36A were added.
- •
- From IFRS 7 "Financial Instruments—Disclosures" the reference to 'total interest income' as a component of finance costs were removed.
The interpretation IFRIC 16 "Hedges of a Net Investment in a Foreign Operation" was issued in July 2008 and becomes effective for financial years beginning on or after October 1, 2008. The interpretation is to be applied prospectively. IFRIC 16 provides guidance on the accounting for a hedge of a net investment. As such it provides guidance on identifying the foreign currency risks that qualify for hedge accounting in the hedge of a net investment, where within the group the hedging instruments can be held in the hedge of a net investment and how an entity should determine the amount of foreign currency gain or loss, relating to both the net investment and the hedging instrument, to be recycled on disposal of the net investment. The adoption of IFRIC 16 is not expected to have a material impact on the presentation of the Group's results of operations, financial position or cash flows, as the Group has no net investments in foreign operations.
The Group has not applied any of the following IFRSs and IFRIC interpretations that have been issued but have not yet been endorsed by the EU as of July 8, 2009 and are not effective as of March 31, 2009.
The amendements to IAS 39 "Financial Instruments: Recognition and Measurement—Amendements for Eligible Hedged Items" were issued in August 2008 and become effective for financial years beginning on or after July 1, 2009. The amendment addresses the designation of a one-sided risk in a hedged item, and the designation of inflation as a hedged risk or portion in particular situations. lt clarifies that an entity is permitted to designate a portion of the fair value changes or cash flow variability of a financial instrument as hedged item. The Group does not expect this amendment to affect its hedge instruments.
On March 5, 2009, the IASB issued Improving Disclosures about Financial Instruments in the Standard IFRS 7 "Financial Instruments: Disclosures" that become effective for annual periods beginning on or after January 1, 2009, with earlier application permitted. However, the Group does not intend to take advantage of this possibility.
F-112
Table of Contents
The amendments require enhanced disclosures about fair value measurements and liquidity risk. Among other things, the amendments introduce a three-level hierarchy for fair value measurement disclosures and require entities to provide additional disclosures about the relative reliability of fair value measurements. In addition, the amendments clarify and enhance the existing requirements for the disclosure of liquidity risk. This is aimed at ensuring that the information disclosed enables users of an entity's financial statements to evaluate the nature and extent of liquidity risk arising from financial instruments and how the entity manages that risk. An entity will not be required comparative disclosures in the first year of application.
In March 2009, the IASB issued amendments to IFRIC 9 "Reassessment of Embedded Derivatives" and IAS 39 to clarify that on reclassification of a financial asset out of the 'at fair value through profit or loss' category all embedded derivatives have to be assessed and, if necessary, separately accounted for in financial statements. The amendments are effective for annual periods beginning on or after June 30, 2009. The Group will consider the revised IFRIC 9 in case of future reclassifications.
The interpretation of IFRIC 13 "Customer Loyalty Programes" was issued in June 2007 and becomes effective for annual periods beginning on or after July 1, 2008. This interpretation requires customer loyalty award credits to be accounted for as a separate component of the sales transaction in which they are granted and therefore part of the fair value of the consideration received is allocated to the award credits and deferred over the period that the award credits are fulfilled. The portion of the proceeds allocated to the goods or service already delivered is recognized as revenue. The portion of the proceeds allocated to the award credits is deferred as an advance payment until the customer redeems the credit award, or the obligation in respect of the credit award is fulfilled. The adoption of IFRIC 13 is not expected to have a material impact on the presentation of the Group's results of operations, financial position or cash flows. For possible future customer loyalty programs the Group might set up, it currently evaluates the detailed effects from this new interpretation.
In July 2008, the IFRIC issued the interpretation IFRIC 15 "Agreements for the Construction of Real Estate" which becomes effective for financial years beginning on or after January 1, 2009. The interpretation is to be applied retrospectively. It clarifies when and how revenue and related expenses from the sale of a real estate unit should be recognized if an agreement between a developer and a buyer is reached before the construction of the real estate is completed. Furthermore, the interpretation provides guidance on how to determine whether an agreement is within the scope of IAS 11 or IAS 18. IFRIC 15 is expected to have no impact on the consolidated financial statements because the Group does not conduct such activity.
In November 2008, the IFRIC issued the interpretation IFRIC 17 "Distributions of Non-cash Assets to Owners" which becomes effective for financial years beginning on or after July 1, 2009. The interpretation is to be applied prospectively. The interpretation clarifies that a dividend payable should be recognized when the dividend is appropriately authorized and is no longer at the discretion of the entity. Furthermore it clarifies that an entity should measure the dividend payable at the fair value of the net assets to be distributed, and that an entity should recognize the difference between the dividend paid and the carrying amount of the net assets distributed in profit or loss. The interpretation also requires an entity to provide additional disclosures if the net assets being held for distribution to owners meet the definition of a discontinued operation. IFRIC 17 applies to pro rata distributions of non-cash assets except for common control transactions. IFRIC 17 is not expected to have a material impact on the financial position or performance of the Group, as the Group does not pay pro rata distributions of non-cash assets to owners.
In January 2009, the IFRIC issued the interpretation IFRIC 18 "Transfers of Assets from Customers" which becomes effective for transfers of assets from customers received on or after July 1, 2009. The IFRIC clarifies the requirements of IFRSs for agreements in which an entity receives from a
F-113
Table of Contents
customer an item of property, plant and equipment that the entity must then use either to connect the customer or provide the customer with ongoing access to a supply of goods or services (such as supply of electricity, gas or water). In some cases, the entity receives cash from a customer which must be used only to acquire or construct the item of property, plant and equipment in order to connect the customer to a network or provide the customer with ongoing access to a supply of goods or services (or to do both). The Group is currently analyzing the impact of applying IFRIC 18 on the presentation of its results of operations, financial position or cash flows but does not expect any effects since no assets are transferred in such a way IFRIC 18 deals with.
3. Notes to the Statement of Operations
3.1 Revenues
Revenues were generated in Germany as follows:
| | | | | | | | | | |
| | April 1, 2008-
March 31, 2009 | | April 1, 2007-
March 31, 2008 | | April 1, 2006-
March 31, 2007 | |
|---|
| | T€
| | T€
| | T€
| |
|---|
Cable access revenues | | | 911,155 | | | 867,066 | | | 845,562 | |
TV/Radio revenues | | | 192,331 | | | 179,802 | | | 162,987 | |
Internet revenues | | | 93,253 | | | 48,591 | | | 24,241 | |
Phone revenues | | | 138,689 | | | 72,776 | | | 32,299 | |
TKS revenues | | | 34,903 | | | 28,635 | | | 28,090 | |
| | | | | | | | |
| | | 1,370,331 | | | 1,196,870 | | | 1,093,179 | |
| | | | | | | | |
Cable access revenues are primarily made up of monthly subscription fees paid for access to KDVS' network and the delivery of analog and digital signals to both, direct and indirect subscribers. The Group also receives one time fees for the installation of a cable television or network connection.
| | | | | | | | | | |
| | April 1, 2008-
March 31, 2009 | | April 1, 2007-
March 31, 2008 | | April 1, 2006-
March 31, 2007 | |
|---|
| | T€
| | T€
| | T€
| |
|---|
Cable Access Subscription Fees | | | 898,895 | | | 854,087 | | | 833,786 | |
Installation Fees | | | 7,876 | | | 7,590 | | | 6,965 | |
Other Revenues | | | 4,384 | | | 5,389 | | | 4,811 | |
| | | | | | | | |
Total Cable Access Revenues | | | 911,155 | | | 867,066 | | | 845,562 | |
| | | | | | | | |
TV/Radio revenues are primarily generated by subscription fees paid by the Group's customers for the Group's pay-TV digital packages, Kabel Digital International and Kabel Digital Home. The Group sells its pay-TV packages on a subscription basis directly to consumers and indirectly through certain Level 4 operators. Additional revenues are generated by sales of CPE, digital and analog carriage fees.
Internet revenues are primarily comprised of monthly subscription fees for Internet services and, to a much lesser extent, revenues from one time installation fees and the sale of CPE.
Phone revenues are primarily comprised of monthly subscription fees and variable fees based on usage and, to a much lesser extent, revenues from one time installation fees and the sale of CPE.
TKS revenues primarily relate to revenues generated by TKS Telepost Kabel-Service Kaiserslautern GmbH & Co. KG (TKS) for providing cable television and Internet & Phone services to the NATO military personnel based in Germany. It also provides billing services for telephone customers of Deutsche Telekom AG (DTAG) who prefer English language bills. Additionally, TKS sells
F-114
Table of Contents
certain telecommunication products in its shops to personnel on NATO military bases such as prepaid mobile phones, cash cards and telecommunication related products and services.
| | | | | | | | | | |
| | April 1, 2008-
March 31, 2009 | | April 1, 2007-
March 31, 2008 | | April 1, 2006-
March 31, 2007 | |
|---|
| | T€
| | T€
| | T€
| |
|---|
Internet Revenues | | | 8,817 | | | 6,364 | | | 5,863 | |
Phone Service Revenues | | | 7,303 | | | 1,307 | | | 0 | |
Billing Service Revenues | | | 6,595 | | | 7,228 | | | 8,454 | |
Merchandise | | | 4,726 | | | 3,992 | | | 6,608 | |
Cable Television Revenues | | | 4,462 | | | 4,537 | | | 4,994 | |
Mobile Phone Service Revenues | | | 2,124 | | | 4,514 | | | 1,228 | |
Other Revenues | | | 876 | | | 693 | | | 943 | |
| | | | | | | | |
Total TKS Revenues | | | 34,903 | | | 28,635 | | | 28,090 | |
| | | | | | | | |
3.2 Cost of Services Rendered
| | | | | | | | | | | |
| | April 1, 2008-
March 31, 2009 | | April 1, 2007-
March 31, 2008 | | April 1, 2006-
March 31, 2007 | |
|---|
| | T€
| | T€
| | T€
| |
|---|
Cost of materials and services | | | 344,508 | | | 313,976 | | | 288,120 | |
| | thereof service level agreements | | | 175,805 | | | 164,992 | | | 169,486 | |
Personnel expenses | | | 62,321 | | | 44,171 | | | 63,018 | |
Depreciation and amortization | | | 205,504 | | | 154,676 | | | 133,123 | |
| | thereof intangible assets | | | 7,072 | | | 4,943 | | | 4,976 | |
| | thereof tangible assets | | | 198,432 | | | 149,733 | | | 128,147 | |
Other cost and expenses | | | 84,222 | | | 75,638 | | | 82,829 | |
| | | | | | | | |
Total Cost of Services Rendered | | | 696,555 | | | 588,461 | | | 567,090 | |
| | | | | | | | |
Cost of services rendered include primarily costs of materials and services, including charges related to service level agreements for services provided by DTAG, maintenance of the network, conditional access license expenses and special services for Internet & Phone as well as personnel expenses, depreciation and amortization and other cost and expenses. These other costs and expenses are primarily comprised of copyright expenses, IT support and other miscellaneous expense. In the fiscal years ended March 31, 2009, March 31, 2008 and March 31, 2007, personnel expenses included expenses for restructuring in the amount of T€20,775, T€2,383 and T€11,639, respectively, that were not paid as of year end.
3.3 Other Operating Income
Other operating income amounts to T€18,822, T€13,118 and T€14,354, respectively, for the years ended March 31, 2009, March 31, 2008 and March 31, 2007, and primarily consists of other service income especially advertising reimbursement amounting to T€4,169, T€3,324, and T€2,534 respectively, for the years ended March 31, 2009, March 31, 2008 and March 31, 2007, and reimbursement of collection charges amounting to T€2,157, T€205 and T€312, respectively, for the years ended March 31, 2009, March 31, 2008 and March 31, 2007. Furthermore, administrative fees charged to customers who do not pay their subscription fee by direct debit amounting to T€2,621, T€3,024 and T€3,348, respectively, for the years ended March 31, 2009, March 31, 2008 and March 31, 2007, and insurance recoveries related to damaged property, marketing subsidies and others amounting to T€1,807, T€3,502 and T€3,897 for the years ended March 31, 2009, March 31, 2008 and March 31, 2007, respectively.
F-115
Table of Contents
3.4 Selling Expenses
| | | | | | | | | | | |
| | April 1, 2008-
March 31, 2009 | | April 1, 2007-
March 31, 2008 | | April 1, 2006-
March 31, 2007 | |
|---|
| | T€
| | T€
| | T€
| |
|---|
Cost of materials and services | | | 23,093 | | | 26,080 | | | 27,139 | |
Personnel expenses | | | 84,952 | | | 71,445 | | | 70,526 | |
Depreciation and amortization | | | 169,348 | | | 115,478 | | | 95,983 | |
| | thereof intangible assets | | | 147,993 | | | 104,525 | | | 92,783 | |
| | thereof tangible assets | | | 21,355 | | | 10,953 | | | 3,200 | |
Other cost and expenses | | | 148,232 | | | 139,833 | | | 125,015 | |
| | | | | | | | |
Total Selling Expenses | | | 425,625 | | | 352,836 | | | 316,663 | |
| | | | | | | | |
Selling expenses primarily consist of costs of materials and services, personnel expenses for sales and marketing employees, depreciation and amortization expense primarily relating to the customer list and other cost and expenses including marketing and advertising expenses, sales commissions and other miscellaneous expenses.
3.5 General and Administrative Expenses
| | | | | | | | | | | |
| | April 1, 2008-
March 31, 2009 | | April 1, 2007-
March 31, 2008 | | April 1, 2006-
March 31, 2007 | |
|---|
| | T€
| | T€
| | T€
| |
|---|
Personnel expenses | | | 23,741 | | | 22,178 | | | 19,116 | |
Depreciation and amortization | | | 27,251 | | | 23,136 | | | 16,313 | |
| | thereof intangible assets | | | 21,987 | | | 19,286 | | | 12,946 | |
| | thereof tangible assets | | | 5,264 | | | 3,850 | | | 3,367 | |
Other cost and expenses | | | 73,130 | | | 58,761 | | | 64,027 | |
| | | | | | | | |
Total General and Administrative Expenses | | | 124,122 | | | 104,075 | | | 99,456 | |
| | | | | | | | |
General and administrative expenses which are related to headquarter functions primarily include personnel expenses related to headquarter personnel, depreciation and amortization for IT and standard software licenses and other cost and expenses including external consulting expense IT-support and other miscellaneous expenses.
3.6 Personnel Expenses
Personnel expenses are comprised of the following:
| | | | | | | | | | |
| | April 1, 2008-
March 31, 2009 | | April 1, 2007-
March 31, 2008 | | April 1, 2006-
March 31, 2007 | |
|---|
| | T€
| | T€
| | T€
| |
|---|
Wages and salaries | | | 144,113 | | | 112,646 | | | 124,969 | |
Social security | | | 26,901 | | | 25,148 | | | 27,691 | |
| | | | | | | | |
| | | 171,014 | | | 137,794 | | | 152,660 | |
| | | | | | | | |
F-116
Table of Contents
Included in wages and salaries:
| | | | | | | | | | |
| | April 1, 2008-
March 31, 2009 | | April 1, 2007-
March 31, 2008 | | April 1, 2006-
March 31, 2007 | |
|---|
| | T€
| | T€
| | T€
| |
|---|
MEP | | | 885 | | | 3,017 | | | 4,217 | |
thereof cost of services rendered | | | 120 | | | 797 | | | 295 | |
thereof selling expense | | | 615 | | | 1,687 | | | 2,743 | |
thereof general and administrative expenses | | | 150 | | | 533 | | | 1,179 | |
Restructuring | | | 24,688 | | | 2,593 | | | 14,381 | |
thereof cost of services rendered | | | 20,775 | | | 2,383 | | | 11,639 | |
thereof selling expense | | | 3,758 | | | 5 | | | 987 | |
thereof general and administrative expenses | | | 155 | | | 205 | | | 1,755 | |
For further information regarding restructuring plans see Section 4.13.
Included in social security:
| | | | | | | | | | |
| | April 1, 2008-
March 31, 2009 | | April 1, 2007-
March 31, 2008 | | April 1, 2006-
March 31, 2007 | |
|---|
| | T€
| | T€
| | T€
| |
|---|
Personnel expenses related to defined benefit pension plan | | | 2,854 | | | 3,096 | | | 2,734 | |
thereof cost of services rendered | | | 918 | | | 1,120 | | | 1,030 | |
thereof selling expense | | | 1,452 | | | 1,499 | | | 1,368 | |
thereof general and administrative expenses | | | 484 | | | 477 | | | 336 | |
During the years ended March 31, 2009, March 31, 2008 and March 31, 2007, an average of 2,593, 2,488 and 2,585, respectively, people were employed.
3.7 Interest Expense and Income
Interest Expense
| | | | | | | | | | | |
| | April 1, 2008-
March 31, 2009 | | April 1, 2007-
March 31, 2008 | | April 1, 2006-
March 31, 2007 | |
|---|
| | T€
| | T€
| | T€
| |
|---|
Interest Expenses on financial instruments that are not at fair value through profit or loss | | | | | | | | | | |
| | Senior Credit Facility | | | 122,748 | | | 81,645 | | | 65,670 | |
| | Amortization of Capitalized Finance Fees | | | 8,021 | | | 4,995 | | | 6,869 | |
| | Finance Lease | | | 2,437 | | | 2,873 | | | 2,675 | |
| | Other | | | 1,647 | | | 579 | | | 1,081 | |
Interest Expenses on financial instruments at fair value through profit or loss | | | 4,324 | | | (3,122 | ) | | (5,718 | ) |
Interest expense on provisions and non-financial liabilities | | | | | | | | | | |
| | Pensions | | | 1,498 | | | 1,242 | | | 1,064 | |
| | Asset Retirement Obligations | | | 1,144 | | | 999 | | | 888 | |
| | Other | | | 1,343 | | | 698 | | | 981 | |
| | | | | | | | |
Total Interest Expenses | | | 143,162 | | | 89,909 | | | 73,510 | |
| | | | | | | | |
Interest expense includes interest accrued on bank loans, amortization of financing fees, interest on finance leases and other.
F-117
Table of Contents
Interest expenses on financial instruments at fair value through profit or loss includes net interest payments to the counterparties of interest rate swaps and caps as well as effects from fair value measurement of such financial instruments.
(See the definition of all terms above in Section 4.11 and 5.4).
Interest Income
Interest income for the fiscal years ended March 31, 2009, March 31, 2008 and March 31, 2007 amounts to T€3,425, T€1,944 and T€2,875, respectively, and primarily relates to cash pooling. Of the total interest income, amounts of T€480, T€2 and T€3 relate to non-financial assets and liabilities mainly in connection with tax issues. In April 2004 the cash pooling was transferred to KDVS. As a result, all of KDVS' cash receipts were remitted to KDG and all cash disbursements were funded by KDG.
3.8 Expense due to Changes in Capital Attributable to the Limited Partners
The expense in the amount of T€213,200, T€302,900 and T€462,600 for the period ended March 31, 2009, March 31, 2008 and March 31, 2007, respectively, is based on changes in the fair value of the liability for "Capital attributable to the Limited Partners".
3.9 Income from Associates
Income from associates for the fiscal years ended March 31, 2009, March 31, 2008 and March 31, 2007 amounts to T€8, T€142 and T€40, respectively.
3.10 Benefit/Taxes on Income
Major components of income tax expense for the years ended March 31, 2009, March 31, 2008 and March 31, 2007 are:
| | | | | | | | | | |
| | Apr. 1, 2008-
Mar. 31, 2009 | | Apr. 1, 2007-
Mar. 31, 2008 | | Apr. 1, 2006-
Mar. 31, 2007 | |
|---|
| | T€
| | T€
| | T€
| |
|---|
Consolidated statement of operations | | | | | | | | | | |
Current income tax | | | | | | | | | | |
Current income tax charge | | | 7,033 | | | 1,985 | | | 2,907 | |
Prior year income tax charge/release | | | 1,837 | | | (399 | ) | | (469 | ) |
Deferred income tax | | | | | | | | | | |
Relating to origination and reversal of temporary differences | | | (24,824 | ) | | (1,867 | ) | | 16,913 | |
| | | | | | | | |
Income tax expense (+)/income (-) reported in consolidated statement of operations | | | (15,954 | ) | | (281 | ) | | 19,351 | |
| | | | | | | | |
No deferred taxes were recorded in equity in the period under review.
F-118
Table of Contents
A reconciliation of income taxes for the years ended March 31, 2009, March 31, 2008 and March 31, 2007, determined using a combined statutory rate of 14.50% for corporate and trade tax to actual income tax expense as recorded on the statement of operations, is as follows:
| | | | | | | | | | |
| | Apr. 1, 2008-
Mar. 31, 2009 | | Apr. 1, 2007-
Mar. 31, 2008 | | Apr. 1, 2006-
Mar. 31, 2007 | |
|---|
| | T€
| | T€
| | T€
| |
|---|
Profit (+)/Loss (-) before income tax | | | (210,018 | ) | | (230,104 | ) | | (410,687 | ) |
Notional tax income at KDVS' statutory income tax rate of 14.50% (2008: 13.96%; 2007: 17.40%) | | |
(30,453 |
) | |
(32,123 |
) | |
(71,460 |
) |
Adjustments in respect of current income tax of previous years | | |
1,837 | | |
(399 |
) | |
(469 |
) |
Unrecognized tax losses/gains | | | (2,761 | ) | | (1,337 | ) | | 3,053 | |
Non-deductible expenses | | | 40,777 | | | 53,102 | | | 92,884 | |
Tax-free income portions | | | (99 | ) | | (5 | ) | | (12 | ) |
Tax-effects by minority partners | | | 118 | | | 0 | | | 0 | |
Special business expenses | | | (6,838 | ) | | (6,631 | ) | | (8,404 | ) |
Corporate income tax of subsidiaries | | | (21,158 | ) | | 394 | | | 3,670 | |
Tax-rate changes | | | 2,003 | | | (12,934 | ) | | 0 | |
Other | | | 620 | | | (348 | ) | | (198 | ) |
| | | | | | | | |
Income tax benefit (-)/expense (+) according to the statement of operations | | | (15,954 | ) | | (281 | ) | | 19,351 | |
| | | | | | | | |
The anticitpated tax rate of 14.50% (2008: 13.96%; 2007: 17.40%) is based only on the trade tax rate of 14.50%.
The special business expense includes expenses and income, respectively, of the partners which are subject to taxation at the level of the partnership.
Subsidiaries of the KDVS Group corporations which are subject to corporate income tax and trade tax. The combined tax rate for these corporations is 30.30% which deviates from the expected tax rate of KDVS Group.
F-119
Table of Contents
Deferred income taxes
Deferred income taxes at March 31, 2009, March 31, 2008 and March 31, 2007 relate to the following:
| | | | | | | | | | | | | | | | | | | |
| | Consolidated balance sheet | | Consolidated statement of operations | |
|---|
| | 2009 | | 2008 | | 2007 | | Apr. 1, 2008-
Mar. 31, 2009 | | Apr. 1, 2007-
Mar. 31, 2008 | | Apr. 1, 2006-
Mar. 31, 2007 | |
|---|
| | T€
| | T€
| | T€
| | T€
| | T€
| | T€
| |
|---|
Deferred income tax liabilties | | | | | | | | | | | | | | | | | | | |
Debt issuance cost | | | 5,551 | | | 4,145 | | | 4,593 | | | 1,406 | | | (448 | ) | | 3,908 | |
Fair value adjustments customer list | | | 33,259 | | | 7,960 | | | 12,478 | | | (29,334 | ) | | (4,719 | ) | | (3,385 | ) |
Accelerated depreciation for tax purposes | | | 42,821 | | | 44,223 | | | 42,195 | | | (1,402 | ) | | 2,028 | | | 16,521 | |
Asset Retirement Obligation | | | 2,936 | | | 3,107 | | | 4,033 | | | (171 | ) | | (926 | ) | | 1,804 | |
Fair value adjustments fixed assets | | | 0 | | | 0 | | | 778 | | | 0 | | | (778 | ) | | (1,220 | ) |
Intangible assets | | | 2,568 | | | 2,302 | | | 3,140 | | | 266 | | | (838 | ) | | (585 | ) |
Hedges | | | 0 | | | 604 | | | 942 | | | (604 | ) | | (338 | ) | | 942 | |
Finance lease contracts | | | 0 | | | 0 | | | 0 | | | 0 | | | 0 | | | (39 | ) |
Revenue Recognition | | | 8,851 | | | 6,052 | | | 3,791 | | | 2,799 | | | 2,261 | | | 3,791 | |
Other | | | 35 | | | 34 | | | 38 | | | 1 | | | (4 | ) | | 38 | |
| | | | | | | | | | | | | | | | | |
Gross deferred income tax liabilities | | | 96,021 | | | 68,427 | | | 71,988 | | | | | | | | | | |
| | | | | | | | | | | | | | | | | |
Offsetting with deferred tax assets | | | (14,917 | ) | | (12,649 | ) | | (14,716 | ) | | | | | | | | | |
| | | | | | | | | | | | | | | | | |
Net deferred income tax liability | | | 81,104 | | | 55,778 | | | 57,272 | | | | | | | | | | |
| | | | | | | | | | | | | | | | | |
Deferred income tax | | | | | | | | | | | | | | | | | | | |
Tangible assets | | | 154 | | | 261 | | | 0 | | | 107 | | | (261 | ) | | 0 | |
Hedges | | | 371 | | | 0 | | | 0 | | | (371 | ) | | 0 | | | 394 | |
Receivables | | | 3,544 | | | 4,681 | | | 7,560 | | | 1,137 | | | 2,879 | | | (2,159 | ) |
Other accruals | | | 4,659 | | | 858 | | | 81 | | | 438 | | | (777 | ) | | 934 | |
Pension | | | 983 | | | 810 | | | 685 | | | (173 | ) | | (125 | ) | | 354 | |
Finance Lease contracts | | | 1,199 | | | 1,170 | | | 1,319 | | | (29 | ) | | 149 | | | (239 | ) |
Tax loss carryforwards | | | 4,300 | | | 5,406 | | | 5,436 | | | 1,106 | | | 30 | | | (4,146 | ) |
| | | | | | | | | | | | | | | | | |
Gross deferred income tax assets | | | 15,210 | | | 13,186 | | | 15,081 | | | | | | | | | | |
| | | | | | | | | | | | | | | | | |
Offsetting with deferred tax liabilities | | | (14,917 | ) | | (12,649 | ) | | (14,716 | ) | | | | | | | | | |
| | | | | | | | | | | | | | | | | |
Net deferred income tax asset | | | 293 | | | 537 | | | 365 | | | | | | | | | | |
| | | | | | | | | | | | | | |
Deferred income tax charge | | | | | | | | | | | | (24,824 | ) | | (1,867 | ) | | 16,913 | |
| | | | | | | | | | | | | | | | | |
As of March 31, 2009, deferred tax assets on corporate income tax loss carryforwards of KDVS in the amount of T€2,261 (prior year T€1,561; period ending March 31, 2007: T€0) and trade tax loss carryforwards of KDVS in the amount of T€1,517 (prior year: T€36,953; period ending March 31, 2007: T€42,434) were recognized. Pursuant to IAS 12, the Group has assessed that the deferred tax assets for these tax loss carryforwards are probable to be realized under consideration of the German minimum taxation rules. The tax loss carryforwards do not expire under current law.
Furthermore, interest carry forwards of KDVS under the new German interest barrier rule in the amount of T€34,289, T€0 and T€0 were recognized.
F-120
Table of Contents
Deferred tax assets on further corporate income tax loss carryforwards of KDVS in an amount of approximately T€1,534 (prior year: T€1,041; prior year ending March 31, 2007: T€0) and trade tax loss carry forwards of KDVS in the amount of T€1,038 (prior year: T€24,635; prior year ending March 31, 2007: T€28,289) have not been recognized due to uncertain recoverability.
Liabilities due to Income Taxes
The liabilities due to income taxes of T€20,138 (prior year: T€12,960; period ending March 31, 2007: T€14,157) in the balance sheet relate to corporate and trade tax.
4. Notes to the Balance Sheet
4.1 Cash and Cash Equivalents
| | | | | | | | | | |
| | Mar. 31, 2009 | | Mar. 31, 2008 | | Mar. 31, 2007 | |
|---|
| | T€
| | T€
| | T€
| |
|---|
Cash at banks | | | 51,843 | | | 15,394 | | | 54,079 | |
Cash in hand | | | 39 | | | 28 | | | 29 | |
| | | | | | | | |
| | | 51,882 | | | 15,422 | | | 54,108 | |
| | | | | | | | |
Cash and cash equivalents are primarily comprised of cash in hand and cash at banks.
4.2 Receivables
| | | | | | | | | | |
| | Mar. 31, 2009 | | Mar. 31, 2008 | | Mar. 31, 2007 | |
|---|
| | T€
| | T€
| | T€
| |
|---|
Gross Trade receivables | | | 159,824 | | | 214,858 | | | 160,434 | |
Bad debt allowance | | | (53,245 | ) | | (84,328 | ) | | (59,276 | ) |
| | | | | | | | |
Trade Receivables | | | 106,579 | | | 130,530 | | | 101,158 | |
| | | | | | | | |
| | | | | | | | | | | | | |
| | Balance at
Beginning of
Period | | Provision for
Bad Debt | | Deduction/
Write-Offs
and other
Charges | | Balance at
End of Period | |
|---|
| | T€
| | T€
| | T€
| | T€
| |
|---|
Fiscal Year ended March 31, 2009 | | | | | | | | | | | | | |
Allowance for doubtful accounts | | | (84,328 | ) | | (18,899 | ) | | 49,982 | | | (53,245 | ) |
| | | | | | | | | | |
Fiscal Year ended March 31, 2008 | | | | | | | | | | | | | |
Allowance for doubtful accounts | | | (59,276 | ) | | (39,324 | ) | | 14,272 | | | (84,328 | ) |
| | | | | | | | | | |
Fiscal Year ended March 31, 2007 | | | | | | | | | | | | | |
Allowance for doubtful accounts | | | (39,794 | ) | | (25,014 | ) | | 5,532 | | | (59,276 | ) |
| | | | | | | | | | |
F-121
Table of Contents
As of March 31, the analyses of trade receivables that were past due but not impaired were as follows:
| | | | | | | | | | | | | | | | | | | | | | |
| |
| | Net Carrying amount past due but not impaired
at the reporting date | |
| |
|---|
| | Not
past due | | less than
30 days | | 31-60 days | | 61-90 days | | more than
90 days | | Total
past due | | Total | |
|---|
| | in T€
| |
|---|
Mar. 31, 2009 | | | 44,390 | | | 27,259 | | | 9,820 | | | 9,625 | | | 15,485 | | | 62,189 | | | 106,579 | |
Mar. 31, 2008 | | | 47,872 | | | 47,173 | | | 8,033 | | | 5,444 | | | 22,008 | | | 82,658 | | | 130,530 | |
Mar. 31, 2007 | | | 34,208 | | | 28,398 | | | 19,556 | | | 12,326 | | | 6,670 | | | 66,950 | | | 101,158 | |
The latest experience regarding the collectability of past due receivables has shown that the collection rate of receivables of more than 180 days past due has improved from 0% to 20%. Therefore, the Group has revised the provision for allowance for such receivables from 100% down to 80%. The effect of this revision is a decrease of bad debt allowance by T€3,067 from T€56,312 to T€53,245 as of March 31, 2009.
Receivables with an invoice amount of T€31,830, T€50,739 and T€14,937 excluding VAT at March 31, 2009, March 31, 2008 and March 31, 2007, respectively, were individually determined to be impaired and were written off by 100%.
Accounts receivable past due but not impaired are expected to ultimately be collected.
Also no indications of defaults are recognizable for accounts receivable that are neither past due nor impaired.
Receivables in the amount of T€106,579 were pledged as security in accordance with the Senior Credit Facility Agreement (see 4.11 Financial Liabilities) as of March 31, 2009.
4.3 Inventories
| | | | | | | | | | |
| | March 31, 2009 | | March 31, 2008 | | March 31, 2007 | |
|---|
| | T€
| | T€
| | T€
| |
|---|
Raw materials, consumables and supplies | | | 4,590 | | | 6,138 | | | 2,949 | |
Work in process | | | 790 | | | 74 | | | 0 | |
Finished goods and merchandise | | | 10,549 | | | 19,989 | | | 21,316 | |
thereof carried at net realizable value | | | 430 | | | 1,293 | | | 1,723 | |
| | | | | | | | |
| | | 15,929 | | | 26,201 | | | 24,265 | |
| | | | | | | | |
The total amount of inventories recognized as an expense amounts to T€8,808, T€20,580 and T€26,020 for the years ended March 31, 2009, March 31, 2008 and March 31, 2007, respectively. Inventories in an amount of T€6,683, T€7,238 and T€6,373 were pledged in accordance with the Senior Credit Facility Agreement (see 4.11 Financial Liabilities) at March 31, 2009, March 31, 2008 and March 31, 2007, respectively.
4.4 Receivables from Tax Authorities
Receivables from tax authorities relate to corporate income tax, trade tax and solidarity tax contributions and amounted to T€3,894, T€2,336 and T€751 as of March 31, 2009, March 31, 2008 and March 31, 2007, respectively.
F-122
Table of Contents
4.5 Other Current Financial Assets and Prepaid Expenses
| | | | | | | | | | | |
| | March 31,
2009 | | March 31,
2008 | | March 31,
2007 | |
|---|
| | T€
| | T€
| | T€
| |
|---|
Receivables from counterparties currency hedges | | | 13,306 | | | 0 | | | 0 | |
Receivables from purchase price reimbursement | | | 11,093 | | | 0 | | | 0 | |
Creditors with debit balances | | | 1,642 | | | 1,649 | | | 1,713 | |
Deposits | | | 1,607 | | | 1,623 | | | 891 | |
Payments in advance for commission fees | | | 371 | | | 1,041 | | | 0 | |
Miscellaneous other receivables | | | 10,375 | | | 1,548 | | | 4,662 | |
| | | | | | | | |
other current assets | | | 38,394 | | | 5,861 | | | 7,266 | |
| | | | | | | | |
Current prepaid expenses | | | | | | | | | | |
| | Deferred costs for equipment located at customer locations | | | 1,567 | | | 6,571 | | | 9,915 | |
| | Insurance | | | 13 | | | 205 | | | 649 | |
| | Other | | | 10,548 | | | 11,445 | | | 7,699 | |
| | | | | | | | |
prepaid expenses | | | 12,128 | | | 18,221 | | | 18,263 | |
| | | | | | | | |
In the fiscal year ended March 31, 2009 an amount of T€13,306 was recorded for the Group's new currency hedge agreement and T€11,093 for a reimbursement of the preliminary purchase price relating to the Acquisition. Miscellaneous other receivables for the fiscal year ended March 31, 2009 are comprised of several other minor amounts.
As of March 31, 2009, other current prepaid expenses primarily consisted of prepaid cost for transaction, interest, fees and contributions, broadband fees and prepaid expenses for maintenance.
4.6 Intangible Assets
Software and Licenses and other Contractual and Legal Rights
Software and licenses primarily consist of software licenses for standard business software and costs related to the customer care and billing system. The software is being amortized on a straight-line basis over three to six years through October 2010.
Beginning April 1, 2006, the Group modified the conditions related to the minimum duration of customer contracts. Due to this modification, the Group began to capitalize the related sales commissions of its sales agents and the costs of call center representatives based on future contractual revenue streams. The amortization period of these amounts is 8.5 years for cable access contracts, which is based on the estimated average life of an access customer relationship, and 12 or 24 months for digital pay-TV and Internet & Phone contracts which is based on the fixed term period of those customer contracts. Amortization is calculated based on the straight-line method. For the fiscal years ended March 31, 2009, March 31, 2008 and March 31, 2007, sales commissions in an amount of T€47,659, of T€28,091 and T€17,384, respectively, were capitalized in software and licenses and other contractual and legal rights. The amortization of sales commissions was T€32,562, T€13,507 and T€4,806 for the fiscal years ended March 31, 2009, March 31, 2008 and March 31, 2007, respectively.
Internally Developed Software
For the years ended March 31, 2009, March 31, 2008 and March 31, 2007 approximately T€3,871, T€2,528 and T€1,048, respectively, of costs for internally developed software were capitalized. Included in costs for internally developed software for the fiscal year ended March 31, 2009, are T€2,008 for
F-123
Table of Contents
closed projects and T€1,863 for running projects which are accounted for as prepayments for internally developed software. These amounts relate to costs incurred in the further development of group-specific software applications, particularly for its billing system, Delphi and digital pay-TV. The software of the billing system is being amortized over a period of 6 years, the software of Delphi and digital pay-TV are being amortized over a period of 4 years. The remaining useful life of all internally developed software is between 0.5-4.7 years.
Customer List
For the years ended March 31, 2009, March 31, 2008 and March 31, 2007 the Group recorded additions in the customer list of T€226,706, T€20,936 and T€5,713, respectively. The addition for the years ended March 31, 2009 comprises T€226,847 of customer list relating to the Acquisition as well as T€-141 relating to retroactive purchase price reimbursement for the customer list of leto GmbH and RKS Sued-West GmbH which were acquired in fiscal year 2008. The remaining useful life of the customer list is between 2.5-8.5 years.
For further information relating to intangible assets, reference is made to the fixed asset register in Appendix 1, Appendix 2 and Appendix 3.
4.7 Property and Equipment
Asset Retirement Obligation
In many cases KDVS leases space in the cable ducts of DTAG to house KDVS` cable network. Related to these leases, KDVS is subject to contractual asset retirement obligations. The costs were estimated at T€17,477 and were capitalized as of April 1, 2003. Further additions related to new asset retirement obligations in an amount of T€1,254, T€723 and T€933 were recognized for the years ended March 31, 2009, March 31, 2008 and March 31, 2007, respectively. Depreciation is charged over the normal useful life of the respective assets which resulted in a depreciation expense of T€1,340, T€1,398 and T€1,509 for the years ended March 31, 2009, March 31, 2008 and March 31, 2007, respectively.
Operating Lease for CPE
To get connection to Internet and phone services as well as to receive digital pay-TV, the Group leases the necessary equipment to the customers. These leases for which the Group is the lessor, are classified as operating leases. Therefore, the Group capitalizes the CPE as fixed assets based on acquisition cost and the cost of removing the asset at the end of the lease. Over the useful life of 3 years for modems and receivers and 5 years for smartcards, respectively, the assets are depreciated using the straight-line method. In the Fixed Asset Schedule CPE is presented as part of technical equipment. For the fiscal years ended March 31, 2009, March 31, 2008 and March 31, 2007, the net book value of total CPE (including modems, receiver and smartcards) amounted to T€79,202, T€54,040 and T€17,578, respectively.
The future minimum lease payments under non-cancellable operating leases for CPE will amount to T€12,522 within one year, T€12 after one year but not more than five years and T€0 after five years. Total contingent rents recognized as income amounted T€47,281, T€20,285 and T€4,006 for the fiscal years ended March 31, 2009, March 31, 2008 and March 31, 2007, respectively.
Finance Lease
As of March 31, 2009, the Group leased certain transponders under finance leases through 2012. As of March 31, 2009, March 31, 2008 and March 31, 2007, the net book value of the capitalized transponders totaled T€24,878, T€33,136 and T€38,449, respectively. During the fiscal year ended March 31, 2009, March 31, 2008 and March 31, 2007, KDVS recorded depreciation expense of T€8,259,
F-124
Table of Contents
T€7,759 and T€5,664, respectively. The Group also recorded interest expense related to these finance leases of T€2,437, T€2,853 and T€2,504 for the fiscal years ended March 31, 2009, March 31, 2008 and March 31, 2007, and paid T€8,228, T€7,197 and T€5,145, to reduce the financial liability, respectively.
There is an option to extend the contract duration related to the lease of certain transponders by another five year period by mutual agreement of the parties, which must be reached at least six months before the expiry of the first five year period.
Future minimum lease payments under finance leases together with the present value of the net minimum lease payments are as follows:
| | | | | | | | | | | | | | | | | | | |
| | 2009 | | 2008 | | 2007 | |
|---|
| | Minimum
payments | | Present value
of payments | | Minimum
payments | | Present value
of payments | | Minimum
payments | | Present value
of payments | |
|---|
| | T€
| | T€
| | T€
| | T€
| | T€
| | T€
| |
|---|
Within one year | | | 10,665 | | | 8,858 | | | 10,645 | | | 8,228 | | | 10,008 | | | 7,184 | |
After one year but not more than five years | | | 21,517 | | | 19,978 | | | 32,113 | | | 28,836 | | | 39,481 | | | 34,141 | |
After five years | | | 0 | | | 0 | | | 0 | | | 0 | | | 536 | | | 534 | |
| | | | | | | | | | | | | | |
Total minimum lease payments | | | 32,182 | | | 28,836 | | | 42,758 | | | 37,064 | | | 50,025 | | | 41,859 | |
| | | | | | | | | | | | | | |
Less amounts representing finance charges | | | 3,346 | | | | | | 5,694 | | | | | | 8,166 | | | | |
| | | | | | | | | | | | | | | | | |
Present value of minimum lease payments | | | 28,836 | | | | | | 37,064 | | | | | | 41,859 | | | | |
| | | | | | | | | | | | | | | | | |
For further information relating to property and equipment, reference is made to the fixed asset registers in Appendix 1, Appendix 2 and Appendix 3.
4.8 Equity Investments in Associates
The carrying value of equity investments in associates is increased by the Group's share of income and reduced by dividends received. The formally associated companies Kabelcom Braunschweig Gesellschaft fuer Breitbandkabel-Kommunikation mbH and Kabelcom Wolfsburg Gesellschaft fuer Breitbandkabel-Kommunikation mbH were accounted for using the equity method until the acquisition date and have been fully consolidated beginning with May 1, 2008. Net deductions to associates amounted to T€8, T€298 and T€227, for the years ended March 31, 2009, March 31, 2008 and March 31, 2007, respectively, and reflect KDVS' share of income recorded by associates in the amount of T€-8, T€-142 and T€-40, and the receipt of dividends in the amount of T€156 and T€187 for the years ended March 31, 2008 and March 31, 2007. The fiscal year of all associates is the period from January 1 to December 31.
| | | | | | | | | | |
Associates' accumulated balance sheets | | Dec. 31,
2008 | | Dec. 31,
2007 | | Dec. 31,
2006 | |
|---|
| | T€
| | T€
| | T€
| |
|---|
Assets | | | 0 | | | 9,386 | | | 8,671 | |
Liabilities | | | 0 | | | 6,736 | | | 6,103 | |
F-125
Table of Contents
| | | | | | | | | | |
Associates' accumulated revenue and profit | | Jan. 1-
Dec. 31,
2008 | | Jan. 1-
Dec. 31,
2007 | | Jan. 1-
Dec. 31,
2006 | |
|---|
| | T€
| | T€
| | T€
| |
|---|
Revenue | | | 0 | | | 10,377 | | | 9,764 | |
Profit | | | 0 | | | 733 | | | 651 | |
For further information relating to financial assets, reference is made to the fixed asset registers in Appendix 1, Appendix 2 and Appendix 3.
4.9 Other Current Liabilities
| | | | | | | | | | |
| | March 31,
2009 | | March 31,
2008 | | March 31,
2007 | |
|---|
| | T€
| | T€
| | T€
| |
|---|
Liabilities for personnel expenses | | | 32,051 | | | 26,410 | | | 23,795 | |
Liabilities for silent partnerships | | | 12,653 | | | 0 | | | 0 | |
Finance leases | | | 8,858 | | | 8,228 | | | 7,184 | |
Value added and employment taxes | | | 7,073 | | | 8,038 | | | 7,397 | |
Provision for onerous contracts | | | 3,300 | | | 0 | | | 0 | |
Debtors with credit balances | | | 1,148 | | | 818 | | | 7,882 | |
Miscellaneous other Liabilities | | | 13,007 | | | 4,545 | | | 4,375 | |
| | | | | | | | |
| | | 78,090 | | | 48,039 | | | 50,633 | |
| | | | | | | | |
In the fiscal year ended March 31, 2009 T€12,653 results from the Group's silent partnerships acquired in the Acquisition and T€3,300 from provisions for onerous contracts.
4.10 Deferred Income
Deferred income primarily consists of customer prepayments on a quarterly, semi-annual or annual basis.
4.11 Financial Liabilities (current and non-current)
4.11.1 Current Financial liabilities
| | | | | | | | | | | | |
| | March 31,
2009 | | March 31,
2008 | | March 31,
2007 | |
|---|
| | T€
| | T€
| | T€
| |
|---|
Accrued interest related to
Senior Credit Facility | | | | | | | | | | |
| | | Tranche A | | | 960 | | | 6,192 | | | 17,335 | |
| | | Tranche B | | | 96 | | | 119 | | | 0 | |
| | | Tranche C | | | 18,799 | | | 1,264 | | | 0 | |
| | Other | | | 0 | | | 1,133 | | | 777 | |
| | | | | | | | |
Current financial liabilities | | | 19,855 | | | 8,708 | | | 18,112 | |
| | | | | | | | |
F-126
Table of Contents
4.11.2 Non-Current Financial liabilities
| | | | | | | | | | |
| | March 31,
2009 | | March 31,
2008 | | March 31,
2007 | |
|---|
| | T€
| | T€
| | T€
| |
|---|
Senior Credit Facility Tranche A | | | 1,150,000 | | | 1,150,000 | | | 1,150,000 | |
Senior Credit Facility Tranche B | | | 0 | | | 60,000 | | | 0 | |
Senior Credit Facility Tranche C | | | 535,000 | | | 0 | | | 0 | |
| | | | | | | | |
Senior Credit Facility | | | 1,685,000 | | | 1,210,000 | | | 1,150,000 | |
Financing and transaction costs, Tranche A | | | (32,872 | ) | | (25,932 | ) | | (25,932 | ) |
Accretion of Tranche A | | | 11,739 | | | 7,336 | | | 3,368 | |
Financing and transaction costs, Tranche C | | | (16,135 | ) | | 0 | | | 0 | |
Accretion of Tranche C | | | 2,519 | | | 0 | | | 0 | |
Swaps | | | 15,004 | | | 0 | | | 0 | |
| | | | | | | | |
Non-current financial liabilities | | | 1,665,255 | | | 1,191,404 | | | 1,127,436 | |
| | | | | | | | |
On May 12, 2006, KDVS entered into a Senior Credit Facility agreement. This agreement was comprised of two facilities, a T€1,150,000 term loan facility (Tranche A) and a T€200,000 revolving credit facility (Tranche B). Tranche A and Tranche B mature on March 31, 2012 (together the "Senior Credit Facility"). On July 19, 2007 the Group amended its Senior Credit Facility and increased Tranche B to T€325,000 under the same terms and conditions as the original Tranche B. The Senior Credit Facility is secured by all the assets of KDVS and a first pledge on 100% of the shares of KDVS which are owned and offered as security by Kabel Deutschland GmbH under its guarantee. The carrying amount of KDVS' shares amounts to T€3,598,100. Since the closing date, Tranche A (T€1,150,000) has been fully drawn.
Tranche B may be borrowed, repaid and reborrowed up until one month prior to the final maturity date. Borrowings under Tranche B may be used for general corporate purposes. As of March 31, 2009, no amounts were outstanding under Tranche B.
The financing and transaction costs related to Tranche B are shown under non-current assets (prepaid expenses) in the amount of T€2,484 and under current prepaid expenses in the amount of T€1,116.
On October 22, 2007 KDVS signed a T€650,000 Senior Add-on Facility or Tranche C, which ranks pari-passu with the existing Senior Credit Facility. As of May 9, 2008 the Tranche C commitment was reduced by T€115,000 to T€535,000. Tranche C was drawn down on May 9, 2008 and remains fully drawn. Tranche C matures in March 2013.
Interest rates on the Senior Credit Facility are based on one, two, three or six months EURIBOR plus a margin.
The margin on Tranche A and B of the Senior Credit Facility is based on the ratio of consolidated senior net borrowings to consolidated EBITDA (as defined in the Senior Credit Facility agreement) as follows:
| | | | |
Ratio of Consolidated Total Net Borrowings to Consolidated EBITDA | | Margin
(percentage
per
annum) | |
|---|
Greater than 4:1 | | | 2.00 | |
Less than or equal to 4:1, but greater than 3.5:1 | | |
1.875 | |
Less than or equal to 3.5:1 | | |
1.75 | |
F-127
Table of Contents
As of March 31, 2009 the ratio of Consolidated Senior Net Borrowings to Consolidated EBITDA amounted to 2.76:1. Therefore, the applicable margin was EURIBOR + 175bps as of March 31, 2009. KDVS pays an annual commitment fee of 0.625% on the undrawn commitment under Tranche B. Tranche C carries a coupon of EURIBOR + 325bps.
The Senior Credit Facility is subject to several affirmative and negative covenants including, but not limited to, the following:
| | | | |
Test | | Requirement as of
March 31, 2009 | |
|---|
| • EBITDA to Net Interest | | | Greater than 2.00 x | |
| • Senior Net Debt to EBITDA | | | Less than 3.50 x | |
As of March 31, 2009 the ratio of EBITDA to Net Interest amounted to 2.77. The ratio of Senior Net Debt to EBITDA amounted to 2.76.
On February 11, 2009 KDVS approached the lenders of its Senior Credit Facilities via its facility agent, the Royal Bank of Scotland, with a request to agree to certain minor amendments to the Group's Senior Credit Facilities. KDVS proposed to change the senior net debt to EBITDA covenant for the quarters starting from December 2010 to December 2011 as well as to extend senior net debt to EBITDA and EBITDA to net interest covenants beyond March 2012 until maturity of Term Loan C in March 2013. On February 25, 2009, the deadline ended for the amendment. As a result approximately 92% were consenting to the request.
The Group's ability to meet these financial ratios and tests may be affected by events beyond its control and, as a result, the Group cannot be sure to meet these ratios and tests in the future. In the event of a default under the Senior Credit Facilities the lenders could terminate their commitments and declare all amounts owed to them to be due and payable.
Mandatory prepayments are required in case of (i) a change of control, public flotation or sale of the business, (ii) certain third party receipts, (iii) the sale of shares on the public market (if consolidated senior total net borrowings to consolidated EBITDA is greater than or equal to 2:1).
At March 31, 2009, T€1,150,000 was outstanding under Tranche A at an interest rate of approximately 2.898% and T€535,000 was outstanding under Tranche C at an interest rate of approximately 8.214%. The Group entered into interest rate caps and swaps in order to mitigate the exposure to interest rate risks, although these are not accounted for as hedges. KDVS also entered into currency swaps swapping US dollar denominated principal and interest related payments into Euro-denominated principal and interest related payments at a fixed rate of USD 1.2066 for each Euro. Simultaneously KDVS entered into respective back to back swap agreements with KDG GmbH on identical terms and conditions in order to transfer all swap related cash flows to KDG GmbH that issued the underlying TUSD 610,000, 10.625% Senior Notes on July 2, 2004.
F-128
Table of Contents
4.12 Provisions for Pension
The following tables summarize the components of net benefit expense recognized in the statement of operations and the funded status and amounts recognized in the balance sheet for the respective plans:
Net benefit expenses recognized in the consolidated statement of operations
| | | | | | | | | | |
| | Apr. 1, 2008-
Mar. 31, 2009 | | Apr. 1, 2007-
Mar. 31, 2008 | | Apr. 1, 2006-
Mar. 31, 2007 | |
|---|
| | T€
| | T€
| | T€
| |
|---|
Current service cost | | | 2,854 | | | 2,956 | | | 2,578 | |
Interest expense | | | 1,498 | | | 1,242 | | | 1,064 | |
Net actuarial losses | | | 0 | | | 124 | | | 233 | |
Plan disbursements | | | 4 | | | 16 | | | -77 | |
| | | | | | | | |
Net benefit expense | | | 4,356 | | | 4,338 | | | 3,798 | |
| | | | | | | | |
The expenses arising from the accrual of interest on pension obligations are recorded in interest expense.
The recognized expense is recorded in to the following items in the statement of operations:
| | | | | | | | | | |
| | Apr. 1, 2008-
Mar. 31, 2009 | | Apr. 1, 2007-
Mar. 31, 2008 | | Apr. 1, 2006-
Mar. 31, 2007 | |
|---|
| | T€
| | T€
| | T€
| |
|---|
Cost of services rendered | | | 918 | | | 1,120 | | | 1,030 | |
Selling expenses | | | 1,452 | | | 1,499 | | | 1,368 | |
General and administrative expenses | | | 484 | | | 477 | | | 336 | |
Other | | | 4 | | | 0 | | | 0 | |
Interest expense | | | 1,498 | | | 1,242 | | | 1,064 | |
| | | | | | | | |
| | | 4,356 | | | 4,338 | | | 3,798 | |
| | | | | | | | |
Benefit Liability
| | | | | | | | | | |
| | Mar. 31,
2009 | | Mar. 31,
2008 | | Mar. 31,
2007 | |
|---|
| | T€
| | T€
| | T€
| |
|---|
Defined benefit obligation | | | 28,422 | | | 25,596 | | | 25,931 | |
Unrecognized actuarial gains (losses) | | | 2,741 | | | 253 | | | (4,352 | ) |
| | | | | | | | |
Benefit liability | | | 31,163 | | | 25,849 | | | 21,579 | |
| | | | | | | | |
The Group has several defined benefit pension plans for different groups of employees (collective agreement (CA) employees, non-collective agreement (NCA) employees and other). The majority of the plans are average salary plans, which are in accordance with regulations applicable for public servants. These plans were continued with substantially the same terms upon the purchase of the business from DTAG. The plans for other employees represent individual commitments.
The annual contributions for CA and NCA employees amount to 2.5% of their contractually agreed annual fixed salaries. The annual contributions for NCA employees increase by 9% for salaries lying above the income threshold for contributions to the statutory pension scheme. Each contribution is translated into an insured sum.
F-129
Table of Contents
The insured sum is calculated by multiplying the contribution by the respective age factor of the employee and is credited to a pension account. From the age of 61 to the onset of retirement, each employee receives an additional annual bonus sum amounting to 6% of the most recent pension account balance. The contribution rates for individual pension commitments are determined on an individual basis.
Changes in the present value of the defined benefit obligation are as follows:
| | | | | | | | | | |
| | Apr. 1, 2008-
Mar. 31, 2009 | | Apr. 1, 2007-
Mar. 31, 2008 | | Apr. 1, 2006-
Mar. 31, 2007 | |
|---|
| | T€
| | T€
| | T€
| |
|---|
Defined Benefit Obligation at April 1 | | | 25,596 | | | 25,931 | | | 23,675 | |
Current Service Cost | | | 2,854 | | | 2,956 | | | 2,578 | |
Interest Cost | | | 1,498 | | | 1,242 | | | 1,064 | |
Actual Benefit Payments | | | (99 | ) | | (81 | ) | | (39 | ) |
Acquisition/Business Combination | | | 1,060 | | | 30 | | | (217 | ) |
Actuarial (Gains)/Losses | | | (2,487 | ) | | (4,482 | ) | | (1,130 | ) |
| | | | | | | | |
Defined Benefit Obligation at March 31 | | | 28,422 | | | 25,596 | | | 25,931 | |
| | | | | | | | |
The principal assumptions used in determining pension benefit obligations for the Group plans are shown below:
Underlying actuarial assumptions:
| | | | | | | | | | |
| | Apr. 1, 2008-
Mar. 31, 2009 | | Apr. 1, 2007-
Mar. 31, 2008 | | Apr. 1, 2006-
Mar. 31, 2007 | |
|---|
| | %
| | %
| | %
| |
|---|
Discount rate as of March 31 | | | 6.00 | | | 5.65 | | | 4.80 | |
Future salary increases | | | 3.25 | | | 3.25 | | | 2.75 | |
Future pension increases | | | 1.00–1.50 | | | 1.00–1.50 | | | 1.00–1.50 | |
Staff turnover | | | 4.50 | | | 4.50 | | | 5.00 | |
Amounts for the current and the previous four periods are as follows:
| | | | | | | | | | | | | | | | |
| | Mar. 31,
2009 | | Mar. 31,
2008 | | Mar. 31,
2007 | | Mar. 31,
2006 | | Mar. 31,
2005 | |
|---|
| | T€
| | T€
| | T€
| | T€
| | T€
| |
|---|
Defined benefit obligation | | | 28,422 | | | 25,596 | | | 25,931 | | | 23,675 | | | 17,199 | |
Plan assets | | | 0 | | | 0 | | | 0 | | | 0 | | | 0 | |
Deficit | | | 28,422 | | | 25,596 | | | 25,931 | | | 23,675 | | | 17,199 | |
Experience adjustments on plan liabilities | | | (1,017 | ) | | (715 | ) | | 277 | | | 0 | | | 0 | |
F-130
Table of Contents
4.13 Other Provisions (current and non-current)
| | | | | | | | | | | | | | | | | | | |
| | Balance
as of
April 1,
2008 | | Utilization | | Reversal | | Addition | | Interest | | Balance
as of
March 31,
2009 | |
|---|
| | T€
| | T€
| | T€
| | T€
| | T€
| | T€
| |
|---|
Anniversary payments | | | 182 | | | (34 | ) | | 0 | | | 30 | | | 0 | | | 178 | |
Asset retirement obligations | | | 22,086 | | | (92 | ) | | 0 | | | 2,677 | | | 1,144 | | | 25,815 | |
Restructuring | | | 2,148 | | | (1,349 | ) | | (151 | ) | | 25,924 | | | 0 | | | 26,572 | |
Legal fees and litigation costs | | | 1,901 | | | 0 | | | (1,870 | ) | | 162 | | | 0 | | | 193 | |
Other | | | 1,535 | | | (77 | ) | | (942 | ) | | 12,265 | | | 0 | | | 12,781 | |
| | | | | | | | | | | | | | |
Total provisions | | | 27,852 | | | (1,552 | ) | | (2,963 | ) | | 41,058 | | | 1,144 | | | 65,539 | |
| | | | | | | | | | | | | | |
Other provisions can be segregated into current obligations (T€39,546) and non-current obligations (T€25,993).
Additions to the restructuring provisions for the new programs announced by the Group in the current fiscal year are shown as adjusted by utilization or reversal within the same year.
| | | | | | | | | | | | | | | | | | | |
| | Balance
as of
April 1,
2007 | | Utilization | | Reversal | | Addition | | Interest | | Balance
as of
March 31,
2008 | |
|---|
| | T€
| | T€
| | T€
| | T€
| | T€
| | T€
| |
|---|
Anniversary payments | | | 224 | | | (56 | ) | | 0 | | | 14 | | | 0 | | | 182 | |
Asset retirement obligations | | | 21,020 | | | (330 | ) | | (32 | ) | | 1,686 | | | (258 | ) | | 22,086 | |
Restructuring | | | 14,636 | | | (12,328 | ) | | (1,465 | ) | | 1,305 | | | 0 | | | 2,148 | |
Legal fees and litigation costs | | | 1,750 | | | 0 | | | 0 | | | 151 | | | 0 | | | 1,901 | |
Other | | | 1,668 | | | (674 | ) | | (52 | ) | | 593 | | | 0 | | | 1,535 | |
| | | | | | | | | | | | | | |
Total provisions | | | 39,298 | | | (13,388 | ) | | (1,549 | ) | | 3,749 | | | (258 | ) | | 27,852 | |
| | | | | | | | | | | | | | |
Other provisions can be segregated into current obligations (T€5,584) and non-current obligations (T€22,268).
A change in estimate with respect to the interest rate as of March 31, 2008 resulted in a decrease of the provision amounting to T€2,308.
| | | | | | | | | | | | | | | | | | | |
| | Balance
as of
April 1,
2006 | | Utilization | | Reversal | | Addition | | Interest | | Balance
as of
March 31,
2007 | |
|---|
| | T€
| | T€
| | T€
| | T€
| | T€
| | T€
| |
|---|
Anniversary payments | | | 246 | | | (25 | ) | | 0 | | | 3 | | | 0 | | | 224 | |
Asset retirement obligations | | | 19,964 | | | (41 | ) | | 0 | | | 1,391 | | | (294 | ) | | 21,020 | |
Restructuring | | | 6,393 | | | (6,059 | ) | | 0 | | | 14,302 | | | 0 | | | 14,636 | |
Legal fees and litigation costs | | | 1,807 | | | (35 | ) | | (436 | ) | | 414 | | | 0 | | | 1,750 | |
Other | | | 994 | | | 0 | | | (100 | ) | | 774 | | | 0 | | | 1,668 | |
| | | | | | | | | | | | | | |
Total provisions | | | 29,404 | | | (6,160 | ) | | (536 | ) | | 16,884 | | | (294 | ) | | 39,298 | |
| | | | | | | | | | | | | | |
Other provisions can be segregated into current obligations (T€18,054) and non-current obligations (T€21,244).
F-131
Table of Contents
Due to a change in estimate with respect to the interest rate as of March 31, 2007, the reduction in interest of T€294 related to asset retirement obligations consists of T€1,182 for the change in estimate and T€888 for the accretion in interest, which is considered in interest expense.
Provisions for restructuring
As of March 31, 2008 existing restructuring programs had remaining accruals in the amount of T€2,148. Due to this programs an amount of T€1,349 were utilized, T€151 were reversed and T€23 have been added to the provision for restructuring during the fiscal year ended March 31, 2009.
The Acquisition in May 2008 has necessitated a restructuring plan. For this purpose a restructuring provision was accrued for in the fiscal year ended March 31, 2009. Due to this restructuring plan an amount of T€4,012 was recorded as personnel expenses which are primarily severance payments and T€1,710 related to other operating expenses. These other amounts are primarily service level agreements, office rental fees, severance related consulting fees and fleet costs for leasing contracts.
For a restructuring plan for the reorganization of the regional technical department, which the Group announced in December 2008, a restructuring provision was accrued for in the fiscal year ended March 31, 2009. Of this provision an amount of T€19,318 was recorded as personnel expenses which are primarily comprised of severance payments and T€2,775 related to other operating expenses. These other amounts are primarily comprised of severance related lawyer fees and fleet costs for leasing contracts.
The restructuring program for outsourcing certain functions of the sales back office announced in February 2009 required a restructuring provision. Of this provision an amount of T€1,486 was recorded as personnel expenses which are primarily comprised of severance payments and T€37 related to other operating expenses.
For the new restructuring programs, announced in the current fiscal year, an amount of T€3,437 were utilized during the fiscal year ended March 31, 2009.
As of March 31, 2009, an amount of T€26,572 remained as total provision for restructuring.
Provisions for asset retirement obligation
All asset retirement obligation calculations as of March 31, 2009 utilize an inflation rate of 2.19% (20-year-OECD-average) and a risk-free interest refinancing rate of 6% (prior period: 5.65% and for the period ended March 31, 2007: 4.8%). The obligation is accreted to the expected payment amount using the effective interest method.
Approximately 93% of KDVS' obligations are related to technical equipment, including different kinds of cable and signal transmitting and receiving technology in cable ducts of DTAG. KDVS assumes that 6% of the technical equipment will be replaced by other technologies after 10 years, 28% will be replaced after 15 years and the remaining 66% of the technical equipment is expected to be replaced after 30 years.
The remaining 7% of the asset retirement obligations are divided into accruals for furniture and fixtures and miscellaneous restoration obligations.
Further additions for new asset retirement obligations recognized in the fiscal years ended March 31, 2009, March 31, 2008 and March 31, 2007 increased the provision by T€2,677, T€1,686 and T€1,391, respectively.
F-132
Table of Contents
Other
As of March 31, 2008 T€1,535 remained as other provision. In the fiscal year ended March 31, 2009 the provision increased by T€12,265 due to the final settlement of the Acquisition. Due to the utilization of T€77 and the reversal of T€942, an amount of T€12,781 remained as the liability as of March 31, 2009.
4.14 Other Non-Current Liabilities
| | | | | | | | | | |
| | Mar. 31,
2009 | | Mar. 31,
2008 | | Mar. 31,
2007 | |
|---|
| | T€
| | T€
| | T€
| |
|---|
Finance leases | | | 19,978 | | | 28,836 | | | 34,675 | |
Liabilities related to share-based payments (MEP) | | | 8,051 | | | 7,236 | | | 1,819 | |
Smartcard provider | | | 4,431 | | | 0 | | | 0 | |
| | | | | | | | |
| | | 32,460 | | | 36,072 | | | 36,494 | |
| | | | | | | | |
For the fiscal year ended March 31, 2009 the Group incurred liabilities in the amount of T€4,431 in relation to purchased smartcards. The smartcards were purchased in the fiscal year ended March 31, 2009 and payment terms imply pro rata payments on a monthly basis over the total payment period.
4.15 Capital attributable to the Limited Partners
The rights of limited partners regarding repayment of the capital contribution to KDVS are reported in the IFRS consolidated financial statements of KDVS as liabilities under the item "Capital attributable to the Limited Partners".
4.16 Equity
Kabel Deutschland Verwaltungs GmbH (KDG Verwaltung) is the general partner of KDVS. KDG Verwaltung is fully owned by KDG.
Limited Partnership capital
KDG as the limited partner of KDVS owns a capital share of T€1. The second limited partner, Kabel Deutschland Vertrieb and Service Beteiligungs GmbH & Co. KG (KDVS Beteiligung), has no shares and is liable with an amount of T€1.
Capital reserve
For the years ended March 31, 2009, March 31, 2008 and March 31, 2007, other additions relate to share-based payments of T€70, T€656 and T€3,151, respectively resulting from the repurchase of interests granted under the Group's interest programs and the repurchase of interests granted by the Group for exercised options the Group's option programs. There was no additional increase in capital reserve due to interests granted in addition to existing schemes (prior year: T€3,469, for the fiscal year ended March 31, 2007: T€0).
Available-for-sale reserve
Changes in the fair value of financial assets classified as available-for-sale are recognized directly in equity under available-for-sale reserve.
F-133
Table of Contents
Asset Revaluation Surplus
The additional acquired shares of Kabelcom Braunschweig Gesellschaft fuer Breitbandkabel-Kommunikation mbH and Kabelcom Wolfsburg Gesellschaft fuer Breitbandkabel-Kommunikation mbH caused a step acquisition. Therefore, the difference of the fair values for acquired assets as of the original acquisition date in 2003 and the date of transfer of control due to additional acquired shares in 2008 is presented in an asset revaluation surplus. The asset revaluation surplus in equity relates directly to the identifiable asset customer list and therefore transferred directly to retained earnings as the asset is amortized.
Accumulated deficit
For the fiscal years ended March 31, 2009, March 31, 2008 and March 31, 2007, the accumulated deficit was T€2,560,839, T€2,293,830 and T€1,973,600, respectively.
Included in this amount are loans granted to Cayman Cable Holding L.P. in its capacity as parent of the Group in the amount of T€19,653 as of March 31, 2009 (prior year: T€12,753) repayable on March 2016. The granted loans are classified as transactions with parents and therefore included in Equity. Also included in accumulated loss are partner transactions in the amount of T€521,620, T€456,433 and T€378,778 as of March 31, 2009, March 31, 2008 and March 31, 2007, respectively, between KDG in its capacity as parent of KDVS Group and KDVS as a single entity.
Minority Interests
Minority interests are presented in the subsidiaries "Urbana Teleunion" Rostock GmbH & Co. KG, Kabelcom Braunschweig Gesellschaft fuer Breitbandkabel-Kommunikation mbH and Kabelcom Wolfsburg Gesellschaft fuer Breitbandkabel-Kommunikation mbH. Therefore, the Group has allocated the respective net assets in the amount of T€8,777 representing the share of equity relating to the minority interests upon initial acquisition. Additionally dividends distributed to minority interests amounted to T€1,109 in the fiscal year ended March 31, 2009. Net profit relating to minority interest for the fiscal year ended March 31, 2009 amounts to T€859.
5. Other Notes
5.1 Other Financial Obligations and Contingencies
Leasing and Rental Obligations
KDVS has entered into several long-term service agreements with DTAG as well as its subsidiary T-Systems International GmbH. These agreements include but are not limited to usage and access agreements for underground cable ducts, fiber optic cables, co-location facilities and energy. The agreements have primarily fixed prices; either based on a monthly or unit basis, and are valid for up to thirty years. However, KDVS can terminate the agreements with a notice period of 12 to 24 months.
F-134
Table of Contents
The financial obligations as of March 31, 2009, March 31, 2008 and March 31, 2007 include the obligations arising due to the earliest possible termination date of KDVS and are as follows:
| | | | | | | | | | | | | | | | | | | | | | | | | | | |
| |
| |
| | March 31, 2009
Due | |
| |
| | March 31, 2008
Due | |
| |
|---|
Type of liability | | Due
up to
1 year | | between
1 and
5 years | | more
than
5 years | | Total | | Due
up to
1 year | | between
1 and
5 years | | more
than
5 years | | Total | |
|---|
| |
| | (in T€)
| |
|---|
| 1. | | Agreements with DTAG and subsidiaries | | | 215,079 | | | 306,089 | | | 70,720 | | | 591,888 | | | 237,391 | | | 310,822 | | | 85,845 | | | 634,058 | |
| 2. | | License, rental and operating lease commitments | | | 22,056 | | | 42,043 | | | 2,423 | | | 66,522 | | | 29,265 | | | 60,806 | | | 5,472 | | | 95,543 | |
| 3. | | Other | | | 16,227 | | | 5,172 | | | 1,240 | | | 22,639 | | | 603,969 | | | 8,286 | | | 1,701 | | | 613,956 | |
| | | | | | | | | | | | | | | | | | | | |
| | | Total | | | 253,362 | | | 353,304 | | | 74,383 | | | 681,049 | | | 870,625 | | | 379,914 | | | 93,018 | | | 1,343,557 | |
| | | | | | | | | | | | | | | | | | | | |
| | | | | | | | | | | | | |
| |
| | March 31, 2007
Due | |
| |
|---|
Type of liability | | Due
up to
1 year | | between
1 and
5 years | | more
than
5 years | | Total | |
|---|
| | (in T€)
| |
|---|
1. Agreements with DTAG and subsidiaries | | | 208,897 | | | 291,054 | | | 31,897 | | | 531,848 | |
2. License, rental and operating lease commitments | | | 36,455 | | | 64,471 | | | 13,233 | | | 114,159 | |
3. Other | | | 28,921 | | | 18,092 | | | 1,922 | | | 48,935 | |
| | | | | | | | | | |
Total | | | 274,273 | | | 373,617 | | | 47,052 | | | 694,942 | |
| | | | | | | | | | |
The lease payments for cable ducts are T€103,558, T€103,492 and T€103,450 for the fiscal years ended March 31, 2009, March 31, 2008 and March 31, 2007, respectively. While the Group has the legal right to cancel the agreements for the lease of the cable ducts with a notice period of 12 to 24 months, the technological requirements to replace leased capacity represent economic penalties which would result in the reasonably assured renewal of the leases for a certain period of time. Management expects that for 30% of the leased capacity the economic penalties will require renewal of the contracts for 15 years, when the Group believes it will have the ability to replace the capacity. This results in a non-cancelable lease term of 15 years for this portion of the leased cable ducts. For the remaining 70%, the lease term is expected to include all renewal periods under the agreement, resulting in a non-cancelable lease term of 30 years through March 31, 2033, after which time the lease can be canceled at the option of DTAG. As of March 31, 2009, 2008 and 2007 the total financial obligations for cable ducts amounted to T€2,013,670, T€2,116,935 and T€2,220,200, respectively.
In the fiscal years ended March 31, 2009, March 31, 2008 and March 31, 2007, KDVS had leasing expenses amounting to T€169,367, T€167,890 and T€176,058, respectively.
In the fiscal year ended March 31, 2009 other financial obligations due up to one year were T€261,470 compared to T€873,722 for the year ended March 31, 2008. The decrease results from the purchase agreement with Orion Cable during the previous fiscal year which became effective in the current fiscal year.
Contingencies
On December 23, 2008 the collecting society GEMA filed arbitration proceedings against KDVS claiming information about the number of subscribers of the Pay-TV package Kabel Digital Home and claiming for damages due to an alleged copyright infringement from the launch date of the package
F-135
Table of Contents
until now. KDVS believes that these claims are either unjustified since the content owners licensed any required rights to KDVS or are obliged to indemnify KDVS in case of an infringement of third party rights. The amount of the claim for damages has not yet been quantified.
General Risks
In the course of its business activities, the Group faces general economic risks due to relationships with customers, suppliers and employees. In addition, general risks exist regarding obligations under legal and tax authorities. Currently there are no proceedings related to these risks.
5.2 Related Parties
In accordance with IAS 24, persons or companies which are in control of or controlled by KDVS must be disclosed, unless they are already included as consolidated companies in KDVS' consolidated financial statements. Control exists if a shareholder owns more than one half of the voting rights in KDVS or, by virtue of an agreement, has the power to control the financial and operating policies of KDVS' management.
The disclosure requirements under IAS 24 also extend to transactions with associated companies as well as transactions with persons who have significant influence on KDVS' financial and operating policies, including close family members and intermediate entities. Significant influence is deemed to be exerted by persons holding an interest in KDVS of 20% or more, a seat on the management board or the supervisory board, or other key management positions.
The transactions of KDVS with associated companies are all attributable to the ordinary activities of these respective entities.
The parent companies of KDVS are:
- —
- Kabel Deutschland Verwaltungs GmbH (general partner)
- —
- Kabel Deutschland GmbH (limited partner)
The parent company of KDG GmbH is KDGHoldCo. The latter company is wholly owned by LuxCo which in turn is wholly owned by Cayman Cable. Cayman Cable is owned by Providence Equity Partners, the ultimate parent.
F-136
Table of Contents
Related Party Transactions
KDVS conducted the following transactions with related parties in the years ended March 31, 2009, 2008 and 2007 (in T€).
| | | | | | | | | | |
| | Cayman Cable | |
|---|
| | 2008/
2009 | | 2007/
2008 | | 2006/
2007 | |
|---|
Goods and services sold | | | 0 | | | 0 | | | 0 | |
Goods and services purchased | | | 0 | | | 0 | | | (253 | ) |
Interest income | | | 0 | | | 0 | | | 0 | |
Interest expense | | | 0 | | | 0 | | | 0 | |
Receivables | | | 0 | | | 0 | | | 253 | |
Liabilities | | | 0 | | | 0 | | | 0 | |
| | | | | | | | | | | | | | | | | | | |
| | Kabel Holding GmbH | | Kabel Deutschland GmbH | |
|---|
| | 2008/
2009 | | 2007/
2008 | | 2006/
2007 | | 2008/
2009 | | 2007/
2008 | | 2006/
2007 | |
|---|
Goods and services sold | | | 0 | | | 0 | | | 0 | | | 847 | | | 725 | | | 1,435 | |
Goods and services purchased | | | 0 | | | 0 | | | 0 | | | 29,156 | | | 28,476 | | | 22,191 | |
Interest income | | | 0 | | | 0 | | | 98 | | | 0 | | | 20,457 | | | 13,228 | |
Interest expense | | | 0 | | | 0 | | | 0 | | | 0 | | | 0 | | | 0 | |
Reveivables | | | 0 | | | 0 | | | 0 | | | 0 | | | 0 | | | 481,598 | |
Liabilities | | | 0 | | | 0 | | | 0 | | | 0 | | | 0 | | | 78,327 | |
Most of the significant contracts with associated companies are signal delivery agreements concluded in the ordinary course of business.
Goods and services purchased mainly relate to cost allocations for management services provided by KDG to its operating subsidiaries. The year-on-year increase is mainly the result of increased cost allocations for Management Services due to the launch of "Kabel Digital". Management Services are allocated to general and administrative expenses in the amount of T€29,046 (prior year: T€28,418; period ending March 31, 2007: T€21,914).
In the fiscal years ended March 31, 2009, 2008 and 2007 KDVS received Management fees in the amount of T€847, T€725 and T€1,435, respectively, for rental expenses from KDG.
Related Party Guarantees
On July 2, 2004 KDG issued senior notes with a nominal value of T€250,000 as well as senior notes with a nominal value of TUSD 610,000, both with a maturity date in 2014 (2014 Senior Notes). The outstanding loan amount is due and payable on July 1, 2014. The 2014 Senior Notes are senior liabilities that rank pari passu with all existing and future liabilities of KDG. The 2014 Senior Notes are secured by a second-ranking lien on the shares held by KDG in KDVS.
KDVS itself is the guarantor of the KDG's debt. The Guarantee is a senior subordinated obligation of KDVS and ranks junior in right of payment to all of its existing and future unsubordinated debt. The Guarantee will rank senior to all existing and future obligations of KDVS expressly subordinated to the Guarantee. The Guarantee is effectively subordinated in right of payment to all of KDVS' existing and future secured debt (including under the Senior Credit Facilities), to the extent of the value of the assets securing such debt, and to all liabilities of any subsidiary of KDVS.
F-137
Table of Contents
Transactions with Members of the Management Board
The Group is presented by its general partner Kabel Deutschland Verwaltungs GmbH. The Management equals to the one of KDG and therefore payments to the management board are made by KDG directly.
Management received short-term employee benefits of T€2,774, T€3,594 and T€3,871 as well as post-employment benefits in the amount of T€228, T€300 and T€383 for the fiscal years ended March 31, 2009, March 31, 2008 and March 31, 2007, respectively.
Additionally, Management participates in the Group's Management Equity Participation Program and holds interests in Cayman Cable Holding L.P. of 1.28% (prior year: 1.28%, as of March 31,2007: 1.47%) upon which they have received non-cash share-based payments due to changes in the measurement of the carrying amount of the underlying interests in the fiscal years ending March 31, 2009, March 31, 2008 and March 31, 2007 in the amount of T€126, T€3,451 and T€15,913, respectively. During the period ended March 31, 2009 no cash has been paid for the repurchase of interests from former members of Management (prior year: T€7,557). During the fiscal year ending March 31, 2007, non-cash share-based payments to members of the Management amounted to T€15,913.
In total, Management received remuneration in the amount of T€3,128, T€14,902 and T€20,167 for the fiscal years ended March 31, 2009, March 31, 2008 and March 31, 2007, respectively.
For further details regarding share-based payments refer to note 5.3.
Former Members of Management and their surviving dependents
For former Members of Management and their surviving dependents related to pension claims liabilities of T€121, T€129 and T€144 have been recorded for the fiscal years ended March 31, 2009, March 31, 2008 and March 31, 2007, respectively.
Other transactions with Members of the Management Board and the Supervisory Board
Management board members obtained loans in the amount of T€2,160 (prior year: T€2,160, as of March 31, 2007: T€0) with interest rates ranging from 5% to 5.5% p.a. from Cayman Cable Holding L.P. As of March 31, 2009, the principal amounts outstanding were T€2,160, accrued interest amounted to T€213 (prior year: T€95, as of March 31, 2007: T€0)
Transactions with Shareholders
In the fiscal year ended March 31, 2009, Providence Equity Partners (ultimate Shareholder) received Management fees, Director fees and Transaction fees in the total amount of T€1,767 (prior year: T€1,671, for the fiscal year ended March 31, 2007: T€1,882).
5.3 Share-Based Payments
Management Equity Participation (MEP) Programs
At March 31, 2009, the Group has five Management Equity Participation Programs (MEP I, MEP II, MEP III, MEP IV and MEP V) in place. MEP I provides direct and indirect—via Kabel Management Beteiligungs GbR—ownership in Cayman Cable Holding L.P., the parent company of KDG and LuxCo. MEP II and III provide options in Cayman Cable Holding L.P. interests. MEP IV is split into an interest program providing indirect—via Kabel Management Beteiligungs- (MEP IV) GbR—ownership in Cayman Cable Holding L.P. and an option program providing options in Cayman Cable Holding L.P. interests. MEP V also provides options in Cayman Cable Holding L.P. interests. Certain employees (including senior executives) of the Group receive remuneration in the form of share-based payment transactions.
F-138
Table of Contents
MEP I
In the fiscal year ended March 31, 2008 no members of KDVS Management and the Supervisory Board participate in the Cayman Cable Holding L.P. directly as limited partners (the Direct Management Equity Participation program I—direct MEP I). Certain members participate indirectly through interests in Kabel Management Beteiligungs GbR, a separate partnership which is itself a limited partner in Cayman Cable Holding L.P. (the Indirect Management Equity Participation program I—indirect MEP I). The terms of both programs are substantially the same.
On February 11, 2004, Cayman Cable Holding G.P. Co. Ltd. (the general partner) and the limited partners of the Partnership entered into a second amended and restated limited partnership agreement. This agreement sets forth the structure relating to the governance and ownership of the Partnership and the terms of the direct MEP I. Under the direct MEP I, certain members of Management and the Supervisory Board were admitted to the Partnership as limited partners holding common interests in the Partnership. Other members of Management were admitted to the program through ownership in Kabel Management Beteiligungs GbR, a limited partner in the Partnership holding common interests in the Partnership.
The members both of the direct MEP I and indirect MEP I were required to pay a capital contribution upon admission. The direct MEP I and the indirect MEP I members have financed up to 70% of the members' contributions with a loan from the Partnership.
Interest accrues on such loans at a rate of 5.5% per annum, compounded annually, and is repayable in accordance with an amortization schedule in the relevant agreement. The members are entitled to proceeds resulting from the sale of shares in LuxCo by Cayman L.P. With these proceeds the granted loans were repaid.
Put or call provisions apply to the members' Partnership interests in the event that such member ceases to be employed by KDVS or its subsidiaries.
Certain limits apply with respect to the transfer of interests in the Partnership. Limited partners are not permitted to transfer their interests in the Partnership (subject to certain exceptions for affiliate transfers and transfers to subsidiaries or family vehicles) without the consent of the general partner, Cayman Cable Holding G.P. Co. Ltd. Such consent may be given subject to conditions or restrictions or may be withheld at the general partner's absolute discretion. Notwithstanding the foregoing, no transfers shall be valid or effective if the transfer would violate any applicable securities laws or it would cause the Partnership to lose any of its exemptions or favorable treatment under the U.S. Federal income tax laws, ERISA or the U.S. Investment Company Act of 1940.
As of April 19, 2006, Cayman Cable Holding L.P. agreed to assume obligations under PIK-Notes issued by P4 Cayman Cable Ltd. As a result of that, the Partnership decided to adjust the number of interests to reflect the decrease in the value of MEP I members shares resulting in the issuance of additional interests to the MEP I holders. The number of interests additionally issued as an adjustment without any consideration was 8,313 in the direct MEP I and 97,804 in the indirect MEP I.
During the fiscal year ended March 31, 2009, no interests of members of indirect MEP I were sold (prior year: 41,986 interests of members of the indirect MEP I were repurchased at an average price of €14.66 per interest, for the fiscal year ended March 31, 2007: 293,902 interests of members of indirect MEP I were repurchased at an average price of €9.86 per interest).
One member of MEP I was reallocated from KDVS to KDG during the fiscal year ended March 31, 2008 due to a change in its responsibilities, resulting in a decrease of the number of MEP I interests to be recognized by the Group of 209,930.
F-139
Table of Contents
Grant date
The grant date determines the point in time at which the fair value of the services of the members of MEP is measured. The persons who are members of the direct MEP I participate in Cayman Cable Holding L.P. with a grant date as of March 13, 2003. The persons who are members of the indirect MEP I participate with a grant date as of November 27, 2003. For one limited partner in the Partnership the grant date was October 1, 2003.
On April 19, 2006, Cayman Cable Holding L.P. granted the holders of interests an additional year vesting. As a result, the vested part of the interests of the MEP I holders increased by 25% in addition to the scheduled vesting.
Number of interests granted
As of March 31, 2009, Management holds indirect interests of 0.04% in the Cayman Cable Holding L.P. (prior year: 0.04%, as of March 31, 2007: 0.29%). The total consideration paid for these interests amounts to T€30 (prior year: T€30, as of March 31, 2007: T€217).
Measurement
Under the indirect MEP I as of November 27, 2003, the fair value of the interests in Kabel Management Beteiligungs GbR, which is valued by the fair value of its contribution in the Cayman Cable Holding L.P. amounts to T€616 (prior year: T€616, as of March 31, 2007: T€3,445).
At each balance sheet date through March 31, 2006, the carrying value of the repurchase obligation related to vested MEP I interests has been based on a formula defined in the partnership agreement for fair price estimation of the respective shares, which have been negotiated between the partners and are documented in the partnership agreement (third amendment) and a letter of grant (for certain of the interests granted in February 2006). Effective April 19, 2006 and in connection with the 5th amendment to the limited partnership agreement, the controlling shareholders of Cayman Cable modified the settlement terms of MEP I interests in Cayman Cable Holding L.P. to change the settlement formula from an EBITDA formula with fixed multiples to a fair value based model. The difference between repurchase obligation as computed at each reporting date and the consideration for the interests is accounted for as personnel expense. This amount is recognized over a vesting period of four years commencing at grant date using the accelerated recognition method in accordance with IFRS 2 whereby 25% are vested at each anniversary. Therefore the program is split into 4 different layers, for which fair value is calculated at each reporting date. As of March 31, 2009, March 31, 2008 and March 31, 2007 T€1,342, T€1,402 and T€4,030, respectively, have vested. The liability was recorded in other liabilities. Included in these amounts is the contribution made by the members of MEP I since such contributions are a liability in case of the sale of the interests. Due to additional vesting, the Group recognized no increase in expenses and no increase in other liabilities for the fiscal year ended March 31, 2009 (prior year: T€415, for the fiscal year ended March 31, 2007 (including the change from a formula based price to a fair value based price): T€4,392). In the fiscal year ended March 31, 2009, no changes in personnel expenses due to the sale of interests have been recognized (prior year: T€0, for the fiscal year ended March 31, 2007: decrease of T€352).
MEP II and III
MEP II and MEP III are option programs that differ in the exercise price only. Under these programs, the participants were granted options on interests in the Cayman Cable Holding L.P.
As of April 19, 2006, Cayman Cable Holding L.P. agreed to assume obligations under PIK-Notes issued by P4 Cayman Cable Ltd. As a result of this equity restructuring, the Partnership adjusted the number of options to reflect the decrease in value of the underlying interests resulting in the issuance
F-140
Table of Contents
of additional options to the MEP II and III holders. The number of options issued for that adjustment was 34,950 in MEP III. At the same time, the strike price for the options was adjusted by the same proportion to keep the total strike price constant. The value of the total outstanding options before and after this adjustment was the same.
Number of options granted
As of March 31, 2009, March 31, 2008 and March 31, 2007, a total of 62,985, 62,985 and 41,990,respectively, options have been granted to the participants in MEP III representing a 0.06% interest in the Cayman Cable Holding L.P. (prior year: 0.06%, as of March 31, 2007: 0.04%). The increase in the number of options granted compared to March 31, 2007 is due to the change of responsibilities of one member of MEP III from KDG to KDVS. This change resulted in a reallocation of 20,995 options.
Grant date and terms
The maximum term of the options is ten years after grant date. The options will be forfeited if they are not exercised. The weighted average remaining life of the options is 0.75 years as of March 31, 2009 (prior year: 1.75 years, as of March 31, 2007: 2.75 years).
On April 19, 2006, Cayman Cable Holding L.P. granted the holders of existing options—except the holders of the options granted in March 2006—an additional year vesting. As a result, the vested part of those options within MEP II and MEP III increased by 25% in addition to the scheduled vesting.
Method and extent of exercise
The options will become immediately vested and exercisable upon any of the following events:
- •
- the date of completion of the sale, or disposal in any other manner, of all or substantially all of the business and assets of the Cayman Cable Holding L.P. and its subsidiaries (Group) to a third party purchaser;
- •
- the effective date of a public offering of the shares in KDG and their shareholders (Group) companies representing substantially all of the business.
In addition, the general partner of Cayman Cable Holding L.P. may, at its absolute discretion, allow options to become exercisable, in whole or in part, prior to an exit event if any other transaction occurs which would materially affect the value of the options.
The general partner may decide that, instead of procuring the issue or transfer of interests in Cayman Cable Holding L.P. (LP interests) on exercise of an option that it will:
- •
- pay to the option holder (after deduction of any taxes, social security contributions duties or other expenses) a cash amount equal to the difference between the market value of the LP interests which would otherwise be issued or transferred and the exercise price for those LP interests; or
- •
- transfer to the option holder a number of the shares of any Group company which has a market value equal to the difference between the market value of the LP interests which would otherwise be issued or transferred and the exercise price for those LP interests; or
- •
- transfer to the option holder a number of the shares which are admitted to listing which has a market value of the difference between the market value of the LP Interests which would otherwise be issued or transferred and the exercise price for those LP interests.
Any other transfer of options is restricted to certain limited options (e.g. ceasing employment). Any transfer of an option otherwise than permitted in this program would cause the option to lapse.
F-141
Table of Contents
Measurement
The measurement of the fair value at grant date and each consecutive reporting period is based on the Black-Scholes option pricing model. The main parameters are the estimated fair value of the interests, expected volatility of the values of the interests, the estimated term of the options and the risk free interest rate on grant date (based on the estimated average life of the options of six years). The grant of the options is not dependent on market conditions, whereby expected future distributions have been included in the calculation.
The volatility was estimated at 25% by benchmarking historical volatilities of listed international cable companies that are comparable regarding the parameters that typically influence the volatility.
The strike price is €4.53 for MEP III.
| | | | | | | | | | | | | | | | | | | | | | | | | | | | |
| | Number of options | |
| |
| |
| |
| |
|---|
| | Risk free
interest
rate at
grant date | | Fair value
of option
at grant
date | | Fair value
of shares
at grant
date | | Fair value of
option at
measurement
date | |
|---|
Grant date | | March 31,
2008 | | Granted | | Called | | Exercised | | March 31,
2009 | |
|---|
| |
| |
| |
| |
| |
| | (%)
| | in T€
| | in T€
| | in T€
| |
|---|
January 1, 2005 MEP III | | | 62,985 | | | 0 | | | 0 | | | 0 | | | 62,985 | | | 2.99 | | | 228 | | | 388 | | | 640 | |
| | | | | | | | | | | | | | | | | | | | | | | | |
| | | 62,985 | | | 0 | | | 0 | | | 0 | | | 62,985 | | | | | | | | | | | | | |
| | | | | | | | | | | | | | | | | | | | | | | | |
| | | | | | | | | | | | | | | | | | | | | | | | | | | | | | | |
| | Number of options | |
| |
| |
| |
| |
|---|
| | Risk free
interest
rate at
grant date | | Fair value
of option
at grant
date | | Fair value
of shares
at grant
date | | Fair value of
option at
measurement
date | |
|---|
Grant date | | March 31,
2007 | | Granted | | Reallocation | | Called | | Exercised | | March 31,
2008 | |
|---|
| |
| |
| |
| |
| |
| |
| | (%)
| | in T€
| | in T€
| | in T€
| |
|---|
January 1, 2005 MEP III | | | 41,990 | | | 0 | | | 20,995 | | | 0 | | | 0 | | | 62,985 | | | 2,99 | | | 228 | | | 388 | | | 656 | |
| | | | | | | | | | | | | | | | | | | | | | | | | | |
| | | 41,990 | | | 0 | | | 20,995 | | | 0 | | | 0 | | | 62,985 | | | | | | | | | | | | | |
| | | | | | | | | | | | | | | | | | | | | | | | | | |
For MEP III the Group recognized a decrease in compensation expense and a corresponding decrease in other liabilities in the amount of T€15 in fiscal year ended March 31, 2009 due to changes in the option value, of which the entire amount has vested (prior year: increase in the amount of T€192, for the fiscal year ended March 31, 2007: T€228). None of the options granted have been canceled since granting. Therefore, all options shown are fully vested and outstanding as of year end March 31, 2009 (prior year: all have vested, as of March 31, 2007; 31,493 vested and 10,497 unvested).
The net book value of the liability relating to MEP III at March 31, 2009 amounts to T€640 (prior year: T€656, as of March 31, 2007: T€307).
Indirect MEP IV
Since March 2007, an additional management participation plan has been implemented, including options on interests in the Partnership (MEP IV option program) and interests in the Partnership which are held indirectly via Kabel Management Beteiligungs- (MEP IV) GbR (Indirect MEP IV). Kabel Management Beteiligungs- (MEP IV) GbR is itself a limited partner in the Partnership.
The general rules of the indirect MEP IV plan are substantially the same as for the indirect MEP I. All members of the indirect MEP IV were admitted to the program through ownership in Kabel Management Beteiligungs- (MEP IV) GbR, a limited partner in the Partnership holding common interests in the Partnership.
The members of the indirect MEP IV were required to pay a capital contribution upon admission. The Partnership and the Kabel Management Beteiligungs- (MEP IV) GbR, respectively, have financed 80% of the managers' contributions with a loan from the Partnership. Interest accrues on such loan at a rate of 5.0% per annum, compounded annually, and is repayable in accordance with an amortization
F-142
Table of Contents
schedule in the relevant agreement. The members are entitled to proceeds received by them in respect of their interests.
Put or call provisions apply to the members' Partnership interests in the event that such member ceases to be employed by KDG GmbH or its subsidiaries.
The total number of interests in Kabel Management Beteiligungs- (MEP IV) GbR issued under the Indirect MEP IV amounts to 289,084. During the fiscal year ended March 31, 2009, 40,013 of these interests were called due to ceasing employment (prior year: no interests sold or called).
Grant date
The grant date determines the point in time at which the fair value of the services of the members of MEP is measured. The persons who are members of the indirect MEP IV participate in Kabel Management Beteiligungs- (MEP IV) GbR with a grant date as of March 29, 2007.
Number of interests granted
As of March 31, 2009, the members of that management participation plan indirectly hold interests in Cayman Cable Holding L.P. of 0.25% (prior year: 0.29%). The total consideration paid for these interests amounts to T€2,989 (prior year: T€3,469).
Measurement
Under the Indirect MEP IV as of March 29, 2007, the fair value of the interests at March 31, 2009 amounts to T€3,651 (prior year: T€4,238).
As for the MEP I, the carrying amount of the repurchase obligation related to vested MEP IV interests at each reporting date is measured based on estimated fair value. This amount is recognized over a vesting period of four years commencing at grant date using the accelerated recognition method in accordance with IFRS 2 whereby 25% are vested at each anniversary. Therefore the program is split into 4 different layers, for which fair value is calculated at each reporting date. As of March 31, 2009, T€3,513 have vested (prior year: T€3,870). The liability was recorded in other liabilities. Included in these amounts is the contribution made by the members of indirect MEP IV since such contributions are a liability in case of the sale of the interests. Due to changes in the fair value of the interests and due to additional vesting, the Group recognized an increase in expenses and an increase in other liabilities for the fiscal year ended March 31, 2009 in the amount of T€118 (prior year: T€401).
MEP IV Option Program
Under the MEP IV Option Program, the participants were granted options on interests in the Cayman Cable Holding L.P. The terms and conditions of this management participation plan are substantially the same as for the other option programs.
Number of options granted
During the fiscal year ended March 31, 2008 and in conjunction with the implementation of the additional plan, 432,143 options have been granted. During that period no options have been called based on the regulations in the amended and restated Cayman Cable Holding L.P. option plan—MEP IV (prior year: 48,170).
As of March 31, 2009, a total of 383,973 options (prior year: 383,973 options) have been granted to the participants in MEP IV representing a 0.04% interest (prior year: 0.04%) in the Cayman Cable Holding L.P.
F-143
Table of Contents
Grant date and terms
The options under the MEP IV Option program have been issued with a grant date as of March 29, 2007. The weighted average remaining life of the options is 2.99 years as of March 31, 2009 (prior year: 3.99 years).
Method and extent of exercise
The Options will become immediately vested and exercisable upon any of the following events:
- •
- the date of completion of the sale, or disposal in any other manner, of all or substantially all of the business and assets of the Group to a third party purchaser (which is not itself a Group undertaking or under common ownership with a Group undertaking);
- •
- the effective date of a Flotation whereby Flotation means any underwritten public offering of the shares of a holding undertaking of Group Companies; or
- •
- the date of an Approved Offer whereby Approved Offer means an offer to acquire all of the issued limited partnership interests in the Partnership,
after which they will lapse if unexercised.
In addition, the general partner of Cayman Cable Holding L.P. may, at its absolute discretion, allow options to become exercisable, in whole or in part, prior to an exit event.
The general partner may decide that, instead of procuring the issue or transfer of interests in Cayman Cable Holding L.P. (LP interests) on exercise of an option that it will:
- •
- pay to the option holder (after deduction of any taxes, social security contributions duties or other expenses) a cash amount equal to the difference between the market value of the LP interests which would otherwise be issued or transferred and the exercise price for those LP interests; or
- •
- transfer to the option holder a number of the shares of any Group company which has a market value equal to the difference between the market value of the LP interests which would otherwise be issued or transferred and the exercise price for those LP interests; or
- •
- transfer to the option holder a number of the shares which are admitted to listing which has a market value of the difference between the market value of the LP interests which would otherwise be issued or transferred and the exercise price for those LP interests.
Any other transfer of options is restricted to certain limited options (e.g. ceasing employment). Any transfer of an option otherwise than permitted in this program would cause the option to lapse.
Measurement
The measurement of the fair value at grant date and each consecutive reporting period is based on the Black-Scholes option pricing model. The main parameters are the estimated fair value of the interests, expected volatility of the values of the interests, the estimated term of the options and the risk free interest rate on grant date (based on the estimated average life of the options of five years). The grant of the options is not dependent on market conditions, whereby expected future distributions are included in the calculation.
The volatility was estimated at 25% by benchmarking historical volatilities of listed international cable companies that are comparable regarding the parameters that typically influence the volatility.
F-144
Table of Contents
The strike price is €12.00 for all options in the MEP IV Option Program.
| | | | | | | | | | | | | | | | | | | | | | | | | | | | |
| |
| |
| |
| |
| |
| | Risk
free
interest
rate at
grant
date | |
| |
| |
| |
|---|
| | Number of options | |
| |
| |
| |
|---|
| | Fair value
of option
at grant
date | | Fair value
of shares
at grant
date | | Fair value of
option at
measurement
date | |
|---|
Grant date | | March 31,
2008 | | Granted | | Called | | Exercised | | March 31,
2009 | |
|---|
| |
| |
| |
| |
| |
| | (%)
| | in T€
| | in T€
| | in T€
| |
|---|
March 29, 2007 MEP IV Option Program | | | 383,973 | | | 0 | | | 0 | | | 0 | | | 383,973 | | | 4.00 | | | 1,484 | | | 5,065 | | | 1,616 | |
| | | | | | | | | | | | | | | | | | | | | | | | | | | | |
| |
| |
| |
| |
| |
| | Risk
free
interest
rate at
grant
date | |
| |
| |
| |
|---|
| | Number of options | |
| |
| |
| |
|---|
| | Fair value
of option
at grant
date | | Fair value
of shares
at grant
date | | Fair value of
option at
measurement
date | |
|---|
Grant date | | March 31,
2007 | | Granted | | Called | | Exercised | | March 31,
2008 | |
|---|
| |
| |
| |
| |
| |
| | (%)
| | in T€
| | in T€
| | in T€
| |
|---|
March 29, 2007 MEP IV Option Program | | | 0 | | | 432,143 | | | 48,170 | | | 0 | | | 383,973 | | | 4.00 | | | 1,484 | | | 5,065 | | | 1,980 | |
For the MEP IV Option Program, the Group recognized compensation expense and a corresponding increase in other liabilities in the amount of T€234 in the fiscal year ended March 31, 2009, of which the entire amount has vested (prior year: T€1,072). None of the options granted have been canceled since granting. Therefore all options shown are outstanding as of year end March 31, 2009 of which 191,986 vested and 191,986 remain unvested (prior year: 95,993 vested and 287,980 remained unvested).
The net book value of the liability relating to the MEP IV Option Program at March 31, 2009 amounts to T€1,280 (prior year: T€1,031).
MEP V
Under MEP V, the participants were granted options on interests in the Cayman Cable Holding L.P. The terms and conditions of this management participation plan are substantially the same as for the other option programs.
Number of options granted
During the fiscal year ended March 31, 2008 and in conjunction with the implementation of the additional plan, 481,688 options have been granted. All these options representing a 0.48% interest in the Cayman Cable Holding L.P. are outstanding as of March 31, 2009.
Under the MEP V option plan, 156,000 additional options have been granted during the fiscal year ended March 31, 2009. All these options representing a 0.16% interest in the Cayman Cable Holding L.P. are outstanding as of March 31, 2009.
Grant date and terms
The options under MEP V have been issued with a grant date as of December 3, 2007 and—for the additional option—January 23, 2009 respectively. The weighted average remaining life of the options is 3.95 years as of March 31, 2009 (prior year: 4.67 years).
F-145
Table of Contents
Method and extent of exercise
The options will become immediately vested and exercisable upon any of the following events:
- •
- the date of completion of the sale, or disposal in any other manner, of all or substantially all of the business and assets of the Group to a third party purchaser (which is not itself a Group undertaking or under common ownership with a Group undertaking);
- •
- the effective date of a Flotation whereby Flotation means any underwritten public offering of the shares of a holding undertaking of Group Companies; or
- •
- the date of an Approved Offer whereby Approved Offer means an offer to acquire all of the issued limited partnership interests in the Partnership,
after which they will lapse if unexercised.
In addition, the general partner of Cayman Cable Holding L.P. may, at its absolute discretion, allow options to become exercisable, in whole or in part, prior to an exit event.
The general partner may decide that, instead of procuring the issue or transfer of interests in Cayman Cable Holding L.P. (LP interests) on exercise of an option that it will:
- •
- pay to the option holder (after deduction of any taxes, social security contributions duties or other expenses) a cash amount equal to the difference between the market value of the LP interests which would otherwise be issued or transferred and the exercise price for those LP interests; or
- •
- transfer to the option holder a number of the shares of any Group company which has a market value equal to the difference between the market value of the LP interests which would otherwise be issued or transferred and the exercise price for those LP interests; or
- •
- transfer to the option holder a number of the shares which are admitted to listing which has a market value of the difference between the market value of the LP interests which would otherwise be issued or transferred and the exercise price for those LP interests.
Any other transfer of options is restricted to certain limited options (e.g. ceasing employment). Any transfer of an option otherwise than permitted in this program would cause the option to lapse.
Measurement
The measurement of the fair value at grant date and each consecutive reporting period is based on the Black-Scholes options pricing model. The main parameters are the estimated fair value of the interests, expected volatility of the values of the interests, the estimated term of the options and the risk free interest rate on grant date (based on the estimated average life of the options of five years). The grant of the options is not dependent on market conditions, whereby expected future distributions are included in the calculation.
The volatility was estimated at 25% by benchmarking historical volatilities of listed international cable companies that are comparable regarding the parameters that typically influence the volatility.
F-146
Table of Contents
The strike price is €14.66 for all options in the MEP V Option Program.
| | | | | | | | | | | | | | | | | | | | | | | | | | | | |
| |
| |
| |
| |
| |
| | Risk
free
interest
rate at
grant
date | |
| |
| |
| |
|---|
| | Number of options | |
| |
| |
| |
|---|
| | Fair value
of option
at grant
date | | Fair value
of shares
at grant
date | | Fair value of
option at
measurement
date | |
|---|
Grant date | | March 31,
2008 | | Granted | | Called | | Exercised | | March 31,
2009 | |
|---|
| |
| |
| |
| |
| |
| | (%)
| | in T€
| | in T€
| | in T€
| |
|---|
December 3, 2007 MEP V | | | 481,688 | | | 0 | | | 0 | | | 0 | | | 481,688 | | | 3.90 | | | 2,127 | | | 7,062 | | | 1,555 | |
January 23, 2009 MEP V | | | 0 | | | 156,000 | | | 0 | | | 0 | | | 156,000 | | | 2.57 | | | 623 | | | 2,287 | | | 597 | |
| | | | | | | | | | | | | | | | | | | | | | | | |
| | | 481,688 | | | 156,000 | | | 0 | | | 0 | | | 637,688 | | | | | | | | | | | | | |
| | | | | | | | | | | | | | | | | | | | | | | | | | | | |
| |
| |
| |
| |
| |
| | Risk
free
interest
rate at
grant
date | |
| |
| |
| |
|---|
| | Number of options | |
| |
| |
| |
|---|
| | Fair value
of option
at grant
date | | Fair value
of shares
at grant
date | | Fair value of
option at
measurement
date | |
|---|
Grant date | | March 31,
2007 | | Granted | | Called | | Exercised | | March 31,
2008 | |
|---|
| |
| |
| |
| |
| |
| | (%)
| | in T€
| | in T€
| | in T€
| |
|---|
December 3, 2007 MEP V | | | 0 | | | 481,688 | | | 0 | | | 0 | | | 481,688 | | | 3.90 | | | 2,127 | | | 7,062 | | | 2,014 | |
For MEP V, the Group recognized compensation expense and a corresponding increase in other liabilities in the amount of T€548 in fiscal year ended March 31, 2009, of which the entire amount has vested (prior year: T€524). None of the options granted have been canceled since granting. Therefore all options shown are outstanding as of year end March 31, 2009 of which 120,422 vested and 517,266 remain unvested (prior year: none vested and 481,688 remained unvested).
The net book value of the liability relating to the MEP V Option Program at March 31, 2009 amounts to T€1,072 (prior year: T€524).
5.4 Financial Instruments
KDVS is exposed to market risks from changes in interest rates and currency exchange rates which can impact its operating results and overall financial condition. KDVS manages its exposure to these market risks through its operating and financing activities and, when deemed appropriate or required by other agreements, through hedging strategies that utilize derivative financial instruments. The main strategy is to avoid or to mitigate risks, e.g. currency risk by entering into currency swaps or the risk of variable interest payments by entering into interest rate swaps and buying caps. Derivative instruments are only used to hedge existing or prospective transactions.
Of KDVS' financial instruments, only the interest swaps bear a fair value interest rate risk, whereas the bank loans bear variable interests and cash flow interest rate risks.
The Group has incurred debt that is denominated in US Dollars and Euros, primarily via bond issues and bank borrowings. As a result, KDVS is exposed to risks from changes in interest rates and exchange rates.
Risks are initially hedged by way of naturally closed positions in which the values or the cash flows of primary financial instruments are matched in terms of maturity and amounts. Any residual risks are mitigated by way of conventional derivative financial instruments.
F-147
Table of Contents
As of the balance sheet date, derivative financial instruments consisted of the following (notional amounts):
| | | | | | | | | | |
| | March 31,
2009 | | March 31,
2008 | | March 31,
2007 | |
|---|
| | T€
| | T€
| | T€
| |
|---|
Interest Rate Swaps | | | | | | | | | | |
Within one year | | | 629,568 | | | 75,960 | | | 71,863 | |
One to five years | | | 0 | | | 379,568 | | | 455,528 | |
More than 5 years | | | 0 | | | 0 | | | 0 | |
| | | | | | | | |
Total | | | 629,568 | | | 455,528 | | | 527,391 | |
Interest Rate Cap | | | | | | | | | | |
Within one year | | | 126,523 | | | 25,320 | | | 23,954 | |
One to five years | | | 0 | | | 126,523 | | | 151,843 | |
More than 5 years | | | 0 | | | 0 | | | 0 | |
| | | | | | | | |
Total | | | 126,523 | | | 151,843 | | | 175,797 | |
Currency Swaps | | | | | | | | | | |
Within one year | | | 82,878 | | | 0 | | | 0 | |
One to five years | | | 161,611 | | | 0 | | | 0 | |
More than 5 years | | | 0 | | | 0 | | | 0 | |
| | | | | | | | |
Total | | | 244,489 | | | 0 | | | 0 | |
Total nominal volume | | |
1,000,580 | | |
607,371 | | |
703,188 | |
| | | | | | | | |
The nominal volume is the sum total of all purchase and sale amounts of the interest rate and currency derivatives. The nominal amounts are equal to the volume of the hedged items.
Interest Rate Swaps and Caps
Approximately T€1,037,500 borrowed under the Group's initial senior loan facility in 2003 was used to fund the acquisition of the cable television business. The interest rate volatility related to these outstanding loans was mitigated with a combination of interest rate swaps and caps at the time the bank loans were incurred. The loans were extended by the lending banks subject to the condition that the Group would enter into appropriate interest rate swaps and interest caps.
With the interest rate swaps, the variable interest rates (EURIBOR) on KDVS' bank loans are effectively exchanged for a fixed interest rate of 3.705% per annum. KDVS initially entered into interest rate swaps with a notional amount of T€778,125 which will be amortized until June 2009. These swaps entitle KDVS to receive a payment from the counterparty if the variable market interest rate exceeds the fixed interest rate, and oblige KDVS to make a payment to the counterparty if the fixed interest rate exceeds the variable market interest rate. These types of agreements are entered into to effectively convert the interest rates on a portion of KDVS' long-term liabilities to banks from variable to fix. KDVS also purchased interest rate caps with a cap level of 4.2% per annum with a notional amount of T€259,375 which will be amortized until June 2009. These caps entitle KDVS to receive a payment from the counterparty equal to the excess, if any, of the hypothetical interest expense on a specified notional amount at a current market interest rate over an amount specified in the agreement.
In September 2004, the aforementioned interest rate swaps and caps had been restructured. Originally, these derivatives had a maturity until 2015 and the effective interest rate on the swaps was 4.0495%.
F-148
Table of Contents
As of April 30, 2008 the Group entered into an additional floating to fix interest rate swap. This swap with a fixed rate of 4.41% per annum and a notional amount of T€250,000 had a one year duration until April 30, 2009.
Currency Swaps
KDVS entered into three derivative agreements swapping US Dollar denominated principal and interest related payments into Euro-denominated principal and interest related payments at a fixed rate of US$1.2066 for each Euro with two banks. Simultaneously KDVS entered into respective back to back swap agreements with KDG GmbH on identical terms and conditions in order to transfer all swap related cash flows to KDG GmbH that issued the underlying TUS$610,000, 10.625% Senior Notes on July 2, 2004. Interest payment dates for that notes are semi-annual each January 1 and July 1, commencing in January 2005. Interest accrues from the issue date of the notes on July 2, 2004. The Senior Notes are not callable until after the fifth anniversary of the issuance date.
One of the three currency swaps (where KDG GmbH was replaced by KDVS as swap counterparty of the respective bank in December 2008), matures on July 1, 2009. Two new swap agreements run from July 2009 until July 2011. By March 31, 2009 100% of the US Dollar denominated principal and interest payments with respect to KDG GmbH's 2014 Senior Notes were swapped into EUR.
Credit Risk
Credit risk is the risk of a financial loss if a customer or counterparty to a financial instrument fails to meet its contractual obligations. It arises principally from receivables from customers. The exposure to credit risk is influenced mainly by the individual characteristics of each customer. The maximum exposure to credit risk amounts to T€106,579.
For all payments underlying the financial instruments, collateral like guarantees must be requested, credit ratings/references obtained and a track record of prior business relations used in order to minimize the credit risk depending on the nature and extent of the respective payments. Without taking into account any collateral or other credit enhancements, the carrying amount of financial assets represents the maximum exposure to credit risk.
Impairment losses are recognized for any credit risks associated with the financial assets. The credit risk associated with derivative financial instruments is minimized in that only counterparties with top credit ratings are selected. For this reason, the general credit risk relating to the derivatives used by the Group is not considered to be significant. No concentration of credit risks from business relations with individual debtors is evident.
Interest Rate Risk
KDVS' interest payment risk is mitigated by the derivatives described. As of year-end 2009, 2008 and 2007, all of the interest-bearing liabilities are due in 5 years, which is why the interest rate derivative structure is long term.
Liquidity risk
Liquidity risk represents the risk that liquidity reserves will prove to be insufficient to meet financial obligations in a timely manner. In order to ensure liquidity the Group has unused Senior Credit Facilities and other lines of credit amounting to T€325,000, T€909,000 and T€200,000 at March 31, 2009, March 31, 2008 and March 31, 2007, respectively. In the fiscal year 2008 an amount of T€650,000 was included relating to the Senior Credit Facility Tranche C.
Future cash outflows arising from financial liabilities that are recognized in the Consolidated Balance Sheet are presented in the following table. This includes payments to settle the liabilities and
F-149
Table of Contents
interest payments as well as cash outflows from cash settled derivatives with a negative market value. Financial liabilities that are repayable on demand are included on the basis of the earliest date of repayment. Cash flows for variable interest liabilities are determined with reference to the market conditions at the balance sheet date.
| | | | | | | | | | | | | | | | |
March 31, 2009 | | Up to 1 year | | Between 1
and 3 years | | Between 3
and 5 years | | After
5 years | | Total | |
|---|
| | T€
| | T€
| | T€
| | T€
| | T€
| |
|---|
Financial liabilities | | | 57,208 | | | 1,318,497 | | | 572,753 | | | 0 | | | 1,948,458 | |
Trade payables | | | 251,367 | | | 0 | | | 0 | | | 0 | | | 251,367 | |
Finance lease liabilities | | | 10,665 | | | 20,980 | | | 537 | | | 0 | | | 32,182 | |
Other financial liabilities | | | 18,746 | | | 0 | | | 0 | | | 0 | | | 18,746 | |
Derivative financial liabilities | | | (6,078 | ) | | 18,225 | | | 0 | | | 0 | | | 12,147 | |
| | | | | | | | | | | | |
Total | | | 331,908 | | | 1,357,702 | | | 573,290 | | | 0 | | | 2,262,900 | |
| | | | | | | | | | | | |
| | | | | | | | | | | | | | | | |
March 31, 2008 | | Up to 1 year | | Between 1
and 3 years | | Between 3
and 5 years | | After
5 years | | Total | |
|---|
| | T€
| | T€
| | T€
| | T€
| | T€
| |
|---|
Financial liabilities | | | 70,350 | | | 133,369 | | | 1,223,810 | | | 0 | | | 1,427,529 | |
Trade payables | | | 210,408 | | | 0 | | | 0 | | | 0 | | | 210,408 | |
Finance lease liabilities | | | 10,645 | | | 21,285 | | | 10,828 | | | 0 | | | 42,758 | |
Other financial liabilities | | | 3,091 | | | 0 | | | 0 | | | 0 | | | 3,091 | |
Derivative financial liabilities | | | 0 | | | 0 | | | 0 | | | 0 | | | 0 | |
| | | | | | | | | | | | |
Total | | | 294,494 | | | 154,654 | | | 1,234,638 | | | 0 | | | 1,683,786 | |
| | | | | | | | | | | | |
| | | | | | | | | | | | | | | | |
March 31, 2007 | | Up to 1 year | | Between 1
and 3 years | | Between 3
and 5 years | | After
5 years | | Total | |
|---|
| | T€
| | T€
| | T€
| | T€
| | T€
| |
|---|
Financial liabilities | | | 77,593 | | | 136,677 | | | 1,293,386 | | | 0 | | | 1,507,656 | |
Trade payables | | | 167,907 | | | 0 | | | 0 | | | 0 | | | 167,907 | |
Finance lease liabilities | | | 10,008 | | | 19,889 | | | 19,592 | | | 536 | | | 50,025 | |
Other financial liabilities | | | 8,335 | | | 0 | | | 0 | | | 0 | | | 8,335 | |
Derivative financial liabilities | | | 0 | | | 0 | | | 0 | | | 0 | | | 0 | |
| | | | | | | | | | | | |
Total | | | 263,843 | | | 156,566 | | | 1,312,978 | | | 536 | | | 1,733,923 | |
| | | | | | | | | | | | |
Capital management
The primary objective of the Group's capital management is to ensure that it maintains a strong credit rating to reduce risks from its highly leveraged financing structure.
This is monitored using the debt covenants of the Senior Credit Facility.
The Group's ability to make payments and to refinance its debt, and to fund future operations and capital expenditures, will depend on future operating performance and the ability to generate sufficient cash. Accordingly the Group manages its capital structure and makes adjustments to it in light of changes in economic conditions.
F-150
Table of Contents
Carrying amounts of Financial Instruments
The following table presents the carrying amounts of financial instruments according to categories of IAS 39:
| | | | | | | | | | |
| | Mar. 31,
2009 | | Mar. 31,
2008 | | Mar. 31,
2007 | |
|---|
| | T€
| | T€
| | T€
| |
|---|
Financial assets at fair value through profit or loss | | | 0 | | | 4,239 | | | 5,414 | |
Loans and Receivables | | | 189,737 | | | 147,610 | | | 157,241 | |
Available-for-Sale financial assets | | | 0 | | | 0 | | | 7,446 | |
| | | | | | | | |
| | | 189,737 | | | 151,849 | | | 170,101 | |
| | | | | | | | |
Financial liabilities at fair value through profit or loss | | | 15,004 | | | 0 | | | 0 | |
Financial liabilities measured at amortized cost | | | 1,940,219 | | | 1,413,611 | | | 1,321,790 | |
| | | | | | | | |
| | | 1,955,223 | | | 1,413,611 | | | 1,321,790 | |
| | | | | | | | |
The category Available-for-Sale financial assets in the prior years included equity instruments measured at amortized cost because they did not have a quoted market price and their value could not be measured reliably amounting to T€156 for the year ended March 31, 2007.
The following table shows net gains or losses of financial instruments according to categories of IAS 39 recognized in the Consolidated Statement of Operations:
| | | | | | | | | | |
| | Fiscal Year Ended March 31, | |
|---|
| | 2009 | | 2008 | | 2007 | |
|---|
| | (in T€)
| |
|---|
Financial assets and liabilities at fair value through profit or loss | | | (7,069 | ) | | (1,175 | ) | | 8,655 | |
Loans and Receivables | | | (9,024 | ) | | (27,863 | ) | | (19,268 | ) |
Available-for-Sale financial assets | | | 394 | | | 2,337 | | | 0 | |
| | | | | | | | |
| | | (15,699 | ) | | (26,701 | ) | | (10,613 | ) |
| | | | | | | | |
Net gains or losses on financial assets and liabilities at fair value through profit or loss include the effects from the fair value measurement of the derivatives that are not part of a hedge accounting relationship.
Net gains and losses on loans and receivables comprise mainly impairment losses and reversals.
Net gains or losses of Available-for-Sale financial assets result from the sale of interests in other companies. In the fiscal year 2008 the amount relates to the sale of Primacom.
Net gains and losses on financial liabilities measured at amortised cost include effects from foreign currency translation and from early settlement.
F-151
Table of Contents
Fair Values of Financial Instruments
The following table presents the carrying amounts and fair values of financial assets and liabilities included in each balance sheet item.
| | | | | | | | | | | | | | | | | | | | | | | |
| |
| | Mar. 31, 2009 | | Mar. 31, 2008 | | Mar. 31, 2007 | |
|---|
| | Category
according
to IAS 39 | | Carrying
Amount | | Fair
Value | | Carrying
Amount | | Fair
Value | | Carrying
Amount | | Fair
Value | |
|---|
| |
| | T€
| | T€
| | T€
| |
|---|
Financial assets measured at cost or amortized cost | | | | | | | | | | | | | | | | | | | | | |
| | Cash and Cash Equivalents | | LaR | | | 51,882 | | | 51,882 | | | 15,422 | | | 15,422 | | | 54,108 | | | 54,108 | |
| | Trade Receivables | | LaR | | | 106,579 | | | 106,579 | | | 130,530 | | | 130,530 | | | 101,158 | | | 101,158 | |
| | Receivables from Affiliates | | LaR | | | 0 | | | 0 | | | 0 | | | 0 | | | 256 | | | 256 | |
| | Receivables from Associates | | LaR | | | 0 | | | 0 | | | 0 | | | 0 | | | 0 | | | 0 | |
| | Other Current financial assets | | LaR | | | 31,276 | | | 31,276 | | | 1,658 | | | 1,658 | | | 1,719 | | | 1,719 | |
| | Other Financial Assets * | | AfS | | | 0 | | | 0 | | | 0 | | | 0 | | | 156 | | | 0 | |
Financial assets measured at fair value | | | | | | | | | | | | | | | | | | | | | |
| | Other Financial Assets | | AfS | | | 0 | | | 0 | | | 0 | | | 0 | | | 7,290 | | | 7,290 | |
| | Other non-current Assets | | | | | | | | | | | | | | | | | | | | | |
| | | Derivatives without a hedging relationship | | FAHfT | | | 0 | | | 0 | | | 4,239 | | | 4,239 | | | 5,414 | | | 5,414 | |
Financial liabilities measured at cost or amortized cost | | | | | | | | | | | | | | | | | | | | | |
| | Current Financial Liabilities | | FLAC | | | 19,855 | | | 19,855 | | | 8,708 | | | 8,708 | | | 18,112 | | | 18,112 | |
| | Trade payables | | FLAC | | | 251,367 | | | 251,367 | | | 210,408 | | | 210,408 | | | 167,907 | | | 167,907 | |
| | Other Current financial Liabilities | | | | | | | | | | | | | | | | | | | | | |
| | | Other financial liabilities | | FLAC | | | 18,746 | | | 18,746 | | | 3,091 | | | 3,091 | | | 8,398 | | | 8,398 | |
| | | Finance lease liabilities | | n/a | | | 8,858 | | | 8,858 | | | 8,228 | | | 8,228 | | | 7,184 | | | 7,184 | |
| | Senior Credit Facility | | FLAC | | | 1,650,251 | | | 1,650,251 | | | 1,191,404 | | | 1,191,404 | | | 1,127,436 | | | 1,127,436 | |
| | Other non-current Liabilities | | | | | | | | | | | | | | | | | | | | | |
| | | Finance lease liabilities | | n/a | | | 19,978 | | | 19,886 | | | 28,836 | | | 28,744 | | | 34,675 | | | 34,587 | |
Financial liabilities measured at fair value | | | | | | | | | | | | | | | | | | | | | |
| | Non-current Financial Liabilities | | | | | | | | | | | | | | | | | | | | | |
| | | Derivatives without a hedging relationship | | FLHfT | | | 15,004 | | | 15,004 | | | 0 | | | 0 | | | 0 | | | 0 | |
- *
- This line consists of equity instruments classified as available-for-sale, for which a fair value could not be reliably measured and which are recognized at cost.
The terms have the following respective meanings:
"LaR" refers to Loans and Receivables
"AfS" refers to Available-for-Sale
"FAHfT" refers to Financial Assets Held for Trading
"FLAC" refers to Financial Liabilities Measured at Amortized Cost
"FLHfT" refers to Financial Liabilities Held for Trading
The carrying amounts of the Group's cash and cash equivalents, trade receivables and payables, short-term loans, as well as other current liabilities, in view of their short terms as of March 31, 2009, 2008, and 2007, are effectively equal to their fair values as they have interest rates based on variable interest rates that change in line with the market. Using a discounted cash flow analysis based on the current lending rate for an identical loan term, the fair value of the Group's long-term, fixed-rate liabilities is estimated as the net present value of future payments, using yield curves obtained by banks and money market observations. Due to the complexity inherent in such an estimate, the estimate may not necessarily reflect actual market values. Different market assessments or procedures may therefore significantly influence the fair value estimate.
F-152
Table of Contents
The carrying amount of the Senior Credit Facility materially approximates its fair value. With respect to the carrying amounts of the financial assets and liabilities please refer to the respective sections in the Notes.
The fair values of the derivative financial instruments as of the balance sheet date have been estimated as net present values (discounted by market yield curves) of the future payments and using standard models (in the case of caps). They are as follows:
| | | | | | | | | | | | | |
Instrument | | Notional
amount
March 31,
2009 | | Fair value
March 31,
2009 | | Recognized
in statement
of operations
April 1, 2008-
March 31,
2009 | | Recognized
in equity
April 1, 2008-
March 31,
2009 | |
|---|
| | T€
| | T€
| | T€
| | T€
| |
|---|
Interest rate swap | | | 629,568 | | | (2,830 | ) | | (6,455 | ) | | 0 | |
Interest rate cap | | | 126,523 | | | 0 | | | (614 | ) | | 0 | |
Currency swap | | | 244,489 | | | 1,132 | | | 0 | | | 0 | |
| | | | | | | | | | |
Total | | | 1,000,580 | | | (1,698 | ) | | (7,069 | ) | | 0 | |
| | | | | | | | | | |
Deferred Taxes | | | 0 | | | 0 | | | 0 | | | 0 | |
| | | | | | | | | | |
Total | | | 1,000,580 | | | (1,698 | ) | | (7,069 | ) | | 0 | |
| | | | | | | | | | |
| | | | | | | | | | | | | |
Instrument | | Notional
amount
March 31,
2008 | | Fair value
March 31,
2008 | | Recognized
in statement
of operations
April 1, 2007-
March 31,
2008 | | Recognized
in equity
April 1, 2007-
March 31,
2008 | |
|---|
| | T€
| | T€
| | T€
| | T€
| |
|---|
Interest rate swap | | | 455,528 | | | 3,625 | | | (1,358 | ) | | 0 | |
Interest rate cap | | | 151,843 | | | 614 | | | 183 | | | 0 | |
| | | | | | | | | | |
Total | | | 607,371 | | | 4,239 | | | (1,175 | ) | | 0 | |
| | | | | | | | | | |
Deferred Taxes | | | 0 | | | 0 | | | 0 | | | 0 | |
| | | | | | | | | | |
Total | | | 607,371 | | | 4,239 | | | (1,175 | ) | | 0 | |
| | | | | | | | | | |
| | | | | | | | | | | | | |
Instrument | | Notional
amount
March 31,
2007 | | Fair value
March 31,
2007 | | Recognized
in statement
of operations
April 1, 2006-
March 31,
2007 | | Recognized
in equity
April 1, 2006-
March 31,
2007 | |
|---|
| | T€
| | T€
| | T€
| | T€
| |
|---|
Interest rate swap | | | 527,391 | | | 4,983 | | | 8,827 | | | 0 | |
Interest rate cap | | | 175,797 | | | 432 | | | (172 | ) | | 0 | |
| | | | | | | | | | |
Total | | | 703,188 | | | 5,415 | | | 8,655 | | | 0 | |
| | | | | | | | | | |
Deferred Taxes | | | 0 | | | 0 | | | 0 | | | | |
| | | | | | | | | | |
Total | | | 703,188 | | | 5,415 | | | 8,655 | | | 0 | |
| | | | | | | | | | |
Sensitivity analysis
KDVS prepares sensitivity analysis that shows how net income and equity would have been affected by changes in the relevant market risk variables that were reasonably possible at the reporting date.
F-153
Table of Contents
Interest rate risks result from the variable interest rates (EURIBOR) on KDVS' bank loans and are hedged with interest rate swaps and caps that are accounted for at fair value through profit or loss. In determining the sensitivity concerning interest rate risks the fair values for interest rate swaps and caps were calculated based on the hypothetical market interest rates with the resulting effects on net income and equity. Due to the very short maturity of these derivatives interest rate sensitivity has shown to be insignificant: The negative/positive effect on net income and equity for a 100 basis point parallel increase/decrease of the interest curve would be below T€4. The effect of interest rate changes on interest expense for bank loans with variable interest rates is calculated based on the risk exposure at the balance sheet date. Excluded from the analysis is the fixed rate Senior Note that is measured at amortized cost so that changes in interest rates do not affect net income. Under this approach and assuming constant foreign exchange rate the interest rate sensitivity is as follows.
| | | | | | | |
| | Effect on net income and equity | |
|---|
| | Parallel increase
of the interest
curve of 100
basis points | | Parallel decrease
of the interest
curve of 100
basis points | |
|---|
| | in T€
| |
|---|
March 31, 2009 | | | (16,850 | ) | | 16,850 | |
Bank loans with variable interest rate | | | 4 | | | (4 | ) |
| | | | | | |
Derivative financial instruments | | | (16,846 | ) | | 16,846 | |
| | | | | | |
March 31, 2008 | | | (12,100 | ) | | 12,100 | |
Bank loans with variable interest rate | | | 3,523 | | | (3,851 | ) |
| | | | | | |
Derivative financial instruments | | | (8,577 | ) | | 8,249 | |
| | | | | | |
March 31, 2007 | | | (11,500 | ) | | 11,500 | |
Bank loans with variable interest rate | | | 6,469 | | | (6,190 | ) |
| | | | | | |
Derivative financial instruments | | | (5,031 | ) | | 5,310 | |
| | | | | | |
5.5 Group Companies
| | | | | | | | |
| |
| | Registered Office | | Share-Holding | |
|---|
| |
| |
| | in %
| |
|---|
Fully consolidated companies (IFRS 3) | | | | | | |
1 | | Kabel Deutschland Vertrieb und Service GmbH & Co. KG | | Unterfoehring | | | | |
2 | | Kabel Deutschland Breitband Services GmbH | | Unterfoehring | | | 100.00 | |
3 | | TKS Telepost Kabel-Service Kaiserslautern Beteiligungs-GmbH | | Kaiserslautern | | | 100.00 | |
4 | | TKS Telepost Kabel-Service Kaiserslautern GmbH & Co. KG | | Kaiserslautern | | | 100.00 | |
5 | | Urbana Teleunion Rostock GmbH & Co. KG | | Rostock | | | 70.00 | |
6 | | Verwaltung Urbana Teleunion Rostock GmbH | | | | | 50.00 | |
7 | | KABELCOM Braunschweig Gesellschaft für Breitbandkabel- | | Braunschweig | | | 99.58 | |
8 | | Kommunikation mit beschränkter Haftung | | | | | | |
9 | | KABELCOM Wolfsburg Gesellschaft für Breitbandkabel-Kommunikation mit beschränkter Haftung | | Braunschweig | | | 97.65 | |
10 | | AEP Plückhahn GmbH | | Unterfoehring | | | 100.00 | |
5.6 Particular Events after the Balance Sheet Date
On May 21, 2009, KDVS settled the outstanding purchase price adjustment with Orion on the 1.1 million cable subscribers acquired on April 30, 2008. The preliminary purchase price was reduced by T€67,500. Thereof T€8,929 and corresponding interest of T€628 had already been repaid as of
F-154
Table of Contents
March 31, 2009. Another T€10,508 and corresponding interest of T€585 were considered as other receivables. The remaining outstanding amounts were settled at the end of May 2009.
As part of the purchase price adjustment process, KDG is in arbitration regarding a further possible reduction of the purchase price, in addition to the original purchase price reduction of T€67,500, resulting from the allocation of certain central overhead costs.
On May 25, 2009, KDG announced the cooperation with the telecommunications company Telefónica O2 Germany in the mobile sector. The new mobile services 'Mobile Phone' and 'Mobile Internet' are offered along with the Company's existing video, Internet and fixed line phone offerings, without any minimum term of contract, monthly basic fee or minimum revenue. Calls with the 'Mobile Phone' offering are free of charge within the entire Kabel Deutschland network. With 'Mobile Internet', users can also surf the Internet within their daily flat rate while travelling. The new products are available to existing as well as new customers of Kabel Internet & Phone.
5.7 Management
The Group is represented by its general partner Kabel Deutschland Verwaltungs GmbH. No further representatives are registered in the commercial register.
The Management and Advisory Board of Kabel Deutschland Verwaltungs GmbH are the following:
Management
| | |
Dr. Adrian v. Hammerstein | | Chairman of the Management Board,
Chief Executive Officer |
Paul Thomason | | Chief Financial Officer |
Dr. Manuel Cubero del Castillo-Olivares | | Chief Commercial Officer until March 31, 2009 |
| | Chief Operating Officer since April 1, 2009 |
Herbert R. Hribar | | Chief Operating Officer until September 30, 2008 |
Erik Adams | | Chief Marketing Officer since April 1, 2009 |
5.8 Authorization of Financial Statements
The consolidated financial statements were released for publication on July 22, 2009.
Unterfoehring, July 22, 2009
Kabel Deutschland Vertrieb und Service GmbH & Co. KG
| | |
Dr. Adrian von Hammerstein
Chief Executive Officer | | Paul Thomason
Chief Financial Officer |
Dr. Manuel Cubero del Castillo-Olivares
Chief Operating Officer |
|
Erik Adams
Chief Marketing Officer |
F-155
Table of Contents
Kabel Deutschland Vetrieb und Service GmbH & Co. KG, Unterfoehring
Appendix 1 to the Notes
Analysis of Fixed Assets for Period from April 1, 2008 to March 31, 2009
| | | | | | | | | | | | | | | | | | | | | | | | | | | | | | | | | | | | | | | | | |
| | Acquisition and Production Costs | | Accumulated Depreciation and Amortization | | Net Book Value | |
|---|
| | April 1, 2008 | | Acquisitions | | Additions | | Disposals | | Reclassifications | | March 31, 2009 | | April 1, 2008 | | Additions | | Disposals | | Reclassification | | Change in
at-equity
investments | | March 31, 2009 | | March 31, 2009 | |
|---|
| | €
| | €
| | €
| | €
| | €
| | €
| | €
| | €
| | €
| | €
| | €
| | €
| | €
| |
|---|
I. Intangible assets | | | | | | | | | | | | | | | | | | | | | | | | | | | | | | | | | | | | | | | | |
| | 1. Software and Licences and other Contractual and Legal Rights | | | 211,904,271.20 | | | 1,666,155.97 | | | 68,116,600.21 | | | 0.00 | | | 8,301,539.29 | | | 289,988,566.67 | | | 114,188,643.85 | | | 63,753,352.70 | | | 0.00 | | | 576.78 | | | 0.00 | | | 177,942,573.33 | | | 112,045,993.34 | |
| | 2. Internally generated software | | | 16,365,133.15 | | | 0.00 | | | 3,871,758.99 | | | 0.00 | | | 0.00 | | | 20,236,892.14 | | | 8,553,674.92 | | | 3,142,650.69 | | | 0.00 | | | 0.00 | | | 0.00 | | | 11,696,325.61 | | | 8,540,566.53 | |
| | 3. Customer List | | | 736,463,043.35 | | | 226,705,555.49 | | | 0.00 | | | 18,950.94 | | | 0.00 | | | 963,149,647.90 | | | 418,650,064.24 | | | 111,410,198.31 | | | 12,050.53 | | | 0.00 | | | 0.00 | | | 530,048,212.02 | | | 433,101,435.88 | |
| | 4. Goodwill | | | 0.00 | | | 330,730,172.33 | | | 0.00 | | | 0.00 | | | 4,606,721.62 | | | 335,336,893.95 | | | 0.00 | | | 0.00 | | | 0.00 | | | 0.00 | | | 0.00 | | | 0.00 | | | 335,336,893.95 | |
| | 5. Prepayments | | | 8,055,054.13 | | | 0.00 | | | 13,258,466.54 | | | 0.00 | | | (6,473,451.58 | ) | | 14,840,069.09 | | | 0.00 | | | 0.00 | | | 0.00 | | | 0.00 | | | 0.00 | | | 0.00 | | | 14,840,069.09 | |
| | | | | | | | | | | | | | | | | | | | | | | | | | | | |
| | Intangible assets | | | 972,787,501.83 | | | 559,101,883.79 | | | 85,246,825.74 | | | 18,950.94 | | | 6,434,809.33 | | | 1,623,552,069.75 | | | 541,392,383.01 | | | 178,306,201.70 | | | 12,050.53 | | | 576.78 | | | 0.00 | | | 719,687,110.96 | | | 903,864,958.79 | |
| | | | | | | | | | | | | | | | | | | | | | | | | | | | |
II. Property and equipment | | | | | | | | | | | | | | | | | | | | | | | | | | | | | | | | | | | | | | | | |
| | 1. Buildings on non-owned land | | | 12,786,322.89 | | | 73,321.55 | | | 2,477,996.56 | | | 0.00 | | | 1,915,079.36 | | | 17,252,720.36 | | | 3,601,728.50 | | | 1,767,658.44 | | | 0.00 | | | 0.00 | | | 0.00 | | | 5,369,386.94 | | | 11,883,333.42 | |
| | 2. Technical equipment | | | 1,837,617,142.28 | | | 65,130,891.27 | | | 235,110,110.32 | | | 5,221,866.20 | | | 42,307,743.28 | | | 2,174,944,020.95 | | | 849,404,662.24 | | | 211,702,626.36 | | | 3,006,929.26 | | | (223,054.91 | ) | | 0.00 | | | 1,057,877,304.43 | | | 1,117,066,716.52 | |
| | 3. Other equipment, furniture and fictures | | | 69,324,703.18 | | | 462,497.21 | | | 14,181,665.29 | | | 2,028,256.64 | | | 4,053,909.40 | | | 85,994,518.44 | | | 42,729,732.87 | | | 10,326,440.31 | | | 1,904,721.29 | | | 222,478.13 | | | 0.00 | | | 51,373,930.02 | | | 34,620,588.42 | |
| | 4. Construction in progress | | | 61,517,050.93 | | | 2,932,331.30 | | | 35,941,593.05 | | | 143,329.69 | | | (50,104,819.75 | ) | | 50,142,825.84 | | | 0.00 | | | 0.00 | | | 0.00 | | | 0.00 | | | 0.00 | | | 0.00 | | | 50,142,825.84 | |
| | | | | | | | | | | | | | | | | | | | | | | | | | | | |
| | | 1,981,245,219.28 | | | 68,599,041.33 | | | 287,711,365.22 | | | 7,393,452.53 | | | (1,828,087.71 | ) | | 2,328,334,085.59 | | | 895,736,123.61 | | | 223,796,725.11 | | | 4,911,650.55 | | | (576.78 | ) | | 0.00 | | | 1,114,620,621.39 | | | 1,213,713,464.20 | |
| | | | | | | | | | | | | | | | | | | | | | | | | | | | |
III. Financial Assets | | | | | | | | | | | | | | | | | | | | | | | | | | | | | | | | | | | | | | | | |
| | 1. Equity investments in Associates | | | 2,487,200.00 | | | 0.00 | | | 0.00 | | | 2,487,200.00 | | | 0.00 | | | 0.00 | | | 1,155,311.94 | | | 0.00 | | | 1,163,229.76 | | | 0.00 | | | 7,917.82 | | | 0.00 | | | 0.00 | |
| | 2. Other | | | 4,631,721.62 | | | 0.00 | | | 0.00 | | | 25,000.00 | | | (4,606,721.62 | ) | | 0.00 | | | 0.00 | | | 0.00 | | | 0.00 | | | 0.00 | | | 0.00 | | | 0.00 | | | 0.00 | |
| | | | | | | | | | | | | | | | | | | | | | | | | | | | |
| | | 7,118,921.62 | | | 0.00 | | | 0.00 | | | 2,512,200.00 | | | (4,606,721.62 | ) | | 0.00 | | | 1,155,311.94 | | | 0.00 | | | 1,163,229.76 | | | 0.00 | | | 7,917.82 | | | 0.00 | | | 0.00 | |
| | | | | | | | | | | | | | | | | | | | | | | | | | | | |
| | | 2,961,151,642.73 | | | 627,700,925.12 | | | 372,958,190.96 | | | 9,924,603.47 | | | 0.00 | | | 3,951,886,155.34 | | | 1,438,283,818.56 | | | 402,102,926.81 | | | 6,086,930.84 | | | 0.00 | | | 7,917.82 | | | 1,834,307,732.35 | | | 2,117,578,422.99 | |
| | | | | | | | | | | | | | | | | | | | | | | | | | | | |
- *
- Includes the figures of the former associated companies, following the acquisitions these are classified as affiliated companies
F-156
Table of Contents
Kabel Deutschland Vetrieb und Service GmbH & Co. KG, Unterfoehring
Appendix 2 to the Notes
Analysis of Fixed Assets for Period from April 1, 2007 to March 31, 2008
| | | | | | | | | | | | | | | | | | | | | | | | | | | | | | | | | | | | | | | | | | | | | |
| |
| |
| | Acquisition and Production Cost | | Accumulated Depreciation and Amortization | | Net Book Value | |
|---|
| |
| |
| | April 1, 2007 | | Acquisitions | | Additions | | Disposals | | Reclassifications | | March 31, 2008 | | April 1, 2007 | | Additions | | Disposals | | Reclassifications | | Change in
at-equity
investment | | March 31, 2008 | | March 31, 2008 | |
|---|
| |
| |
| | €
| | €
| | €
| | €
| | €
| | €
| | €
| | €
| | €
| | €
| | €
| | €
| | €
| |
|---|
| I. | | | Intangible Assets | | | | | | | | | | | | | | | | | | | | | | | | | | | | | | | | | | | | | | | | |
| | | | 1. | | Software and Licences and other Contractual and Legal Rights | | | 148,880,844.66 | | | 0.00 | | | 52,633,605.53 | | | 6,066.75 | | | 10,395,887.76 | | | 211,904,271.20 | | | 73,817,436.14 | | | 40,377,221.34 | | | 6,066.75 | | | 53.12 | | | 0.00 | | | 114,188,643.85 | | | 97,715,627.35 | |
| | | | 2. | | Internally generated Software | | | 13,837,173.00 | | | 0.00 | | | 2,527,960.15 | | | 0.00 | | | 0.00 | | | 16,365,133.15 | | | 5,787,914.48 | | | 2,765,760.44 | | | 0.00 | | | 0.00 | | | 0.00 | | | 8,553,674.92 | | | 7,811,458.23 | |
| | | | 3. | | Customer List | | | 715,426,567.68 | | | 20,936,112.22 | | | 111,394.43 | | | 11,030.98 | | | 0.00 | | | 736,463,043.35 | | | 333,039,392.45 | | | 85,611,086.83 | | | 415.04 | | | 0.00 | | | 0.00 | | | 418,650,064.24 | | | 317,812,979.11 | |
| | | | 4. | | Prepayments | | | 10,926,153.95 | | | 0.00 | | | 7,683,386.95 | | | 275.56 | | | (10,554,211.21 | ) | | 8,055,054.13 | | | 0.00 | | | 0.00 | | | 0.00 | | | 0.00 | | | 0.00 | | | 0.00 | | | 8,055,054.13 | |
| | | | | | | | | | | | | | | | | | | | | | | | | | | | | | | | | |
| | | | | | | | | 889,070,739.29 | | | 20,936,112.22 | | | 62,956,347.06 | | | 17,373.29 | | | (158,323.45 | ) | | 972,787,501.83 | | | 412,644,743.07 | | | 128,754,068.61 | | | 6,481.79 | | | 53.12 | | | 0.00 | | | 541,392,383.01 | | | 431,395,118.82 | |
| | | | | | | | | | | | | | | | | | | | | | | | | | | | | | | | | |
| II. | | | Property and Equipment | | | | | | | | | | | | | | | | | | | | | | | | | | | | | | | | | | | | | | | | |
| | | | 1. | | Buildings on non-owned Land | | | 7,083,733.17 | | | 0.00 | | | 2,573,705.68 | | | 0.00 | | | 3,128,884.04 | | | 12,786,322.89 | | | 2,400,512.91 | | | 1,200,609.96 | | | 0.00 | | | 605.63 | | | 0.00 | | | 3,601,728.50 | | | 9,184,594.39 | |
| | | | 2. | | Technical Equipment | | | 1,603,466,977.78 | | | 8,962,186.68 | | | 194,121,088.50 | | | 3,382,762.56 | | | 34,449,651.88 | | | 1,837,617,142.28 | | | 697,586,347.10 | | | 154,889,282.60 | | | 2,504,661.65 | | | (566,305.81 | ) | | 0.00 | | | 849,404,662.24 | | | 988,212,480.04 | |
| | | | 3. | | Other Equipment, Furniture and Fixtures | | | 61,812,353.85 | | | 0.00 | | | 9,523,937.36 | | | 3,229,865.59 | | | 1,218,277.56 | | | 69,324,703.18 | | | 36,888,467.44 | | | 8,446,112.07 | | | 3,170,493.70 | | | 565,647.06 | | | 0.00 | | | 42,729,732.87 | | | 26,594,970.31 | |
| | | | 4. | | Construction in progress | | | 50,533,854.29 | | | 0.00 | | | 49,623,080.51 | | | 1,393.84 | | | (38,638,490.03 | ) | | 61,517,050.93 | | | 0.00 | | | 0.00 | | | 0.00 | | | 0.00 | | | 0.00 | | | 0.00 | | | 61,517,050.93 | |
| | | | | | | | | | | | | | | | | | | | | | | | | | | | | | | | | |
| | | | | | | | | 1,722,896,919.09 | | | 8,962,186.68 | | | 255,841,812.05 | | | 6,614,021.99 | | | 158,323.45 | | | 1,981,245,219.28 | | | 736,875,327.45 | | | 164,536,004.63 | | | 5,675,155.35 | | | (53.12 | ) | | 0.00 | | | 895,736,123.61 | | | 1,085,509,095.67 | |
| | | | | | | | | | | | | | | | | | | | | | | | | | | | | | | | | |
| III. | | | Financial Assets | | | | | | | | | | | | | | | | | | | | | | | | | | | | | | | | | | | | | | | | |
| | | | 1. | | Equity Investments in Associates | | | 2,487,200.00 | | | 0.00 | | | 0.00 | | | 0.00 | | | 0.00 | | | 2,487,200.00 | | | 857,029.91 | | | 0.00 | | | 0.00 | | | 0.00 | | | 298,282.03 | | | 1,155,311.94 | | | 1,331,888.06 | |
| | | | 2. | | Other financial Assets | | | 7,445,800.37 | | | 4,606,721.62 | | | 0.00 | | | 7,420,800.37 | | | 0.00 | | | 4,631,721.62 | | | 0.00 | | | 0.00 | | | 0.00 | | | 0.00 | | | 0.00 | | | 0.00 | | | 4,631,721.62 | |
| | | | | | | | | | | | | | | | | | | | | | | | | | | | | | | | | |
| | | | | | | | | 9,933,000.37 | | | 4,606,721.62 | | | 0.00 | | | 7,420,800.37 | | | 0.00 | | | 7,118,921.62 | | | 857,029.91 | | | 0.00 | | | 0.00 | | | 0.00 | | | 298,282.03 | | | 1,155,311.94 | | | 5,963,609.68 | |
| | | | | | | | | | | | | | | | | | | | | | | | | | | | | | | | | |
| | | | | | | | | 2,621,900,658.75 | | | 34,505,020.52 | | | 318,798,159.11 | | | 14,052,195.65 | | | 0.00 | | | 2,961,151,642.73 | | | 1,150,377,100.43 | | | 293,290,073.24 | | | 5,681,637.14 | | | 0.00 | | | 298,282.03 | | | 1,438,283,818.56 | | | 1,522,867,824.17 | |
| | | | | | | | | | | | | | | | | | | | | | | | | | | | | | | | | |
F-157
Table of Contents
Kabel Deutschland Vertrieb und Service GmbH & Co. KG, Unterfoehring
Appendix 3 to the Notes
Analysis of Fixed Assets for Period from April 1, 2006 to March 31, 2007
| | | | | | | | | | | | | | | | | | | | | | | | | | | | | | | | | | | | | | | | |
| | Acquisition and Production Cost | | Accumulated Depreciation and Amortization | | Net Book Value | |
|---|
| | April 1, 2006 | | Acquisitions | | Additions | | Disposals | | Reclassifications | | March 31, 2007 | | April 1, 2006 | | Additions | | Disposals | | Reclassifications | | Change in
at-Equity
Investment | | March 31, 2007 | | March 31, 2007 | |
|---|
| | €
| | €
| | €
| | €
| | €
| | €
| | €
| | €
| | €
| | €
| | €
| | €
| | €
| |
|---|
I. Intangible Assets | | | | | | | | | | | | | | | | | | | | | | | | | | | | | | | | | | | | | | | | |
1. Software and Licences and other Contractual and Legal Rights | | | 98,012,500.58 | | | 0.00 | | | 52,198,278.72 | | | 3,239,616.88 | | | 1,909,682.24 | | | 148,880,844.66 | | | 52,678,422.33 | | | 24,378,630.69 | | | 3,239,616.88 | | | 0.00 | | | 0.00 | | | 73,817,436.14 | | | 75,063,408.52 | |
2. Internally generated Software | | | 12,789,484.77 | | | 0.00 | | | 1,047,688.23 | | | 0.00 | | | 0.00 | | | 13,837,173.00 | | | 3,271,505.03 | | | 2,516,409.45 | | | 0.00 | | | 0.00 | | | 0.00 | | | 5,787,914.48 | | | 8,049,258.52 | |
3. Customer List | | | 709,713,538.37 | | | 5,713,029.31 | | | 0.00 | | | 0.00 | | | 0.00 | | | 715,426,567.68 | | | 249,230,050.39 | | | 83,809,342.06 | | | 0.00 | | | 0.00 | | | 0.00 | | | 333,039,392.45 | | | 382,387,175.23 | |
4. Prepayments | | | 2,621,373.16 | | | 0.00 | | | 10,174,463.03 | | | 0.00 | | | (1,869,682.24 | ) | | 10,926,153.95 | | | 0.00 | | | 0.00 | | | 0.00 | | | 0.00 | | | 0.00 | | | 0.00 | | | 10,926,153.95 | |
| | | | | | | | | | | | | | | | | | | | | | | | | | | | |
| | | 823,136,896.88 | | | 5,713,029.31 | | | 63,420,429.98 | | | 3,239,616.88 | | | 40,000.00 | | | 889,070,739.29 | | | 305,179,977.75 | | | 110,704,382.20 | | | 3,239,616.88 | | | 0.00 | | | 0.00 | | | 412,644,743.07 | | | 476,425,996.22 | |
| | | | | | | | | | | | | | | | | | | | | | | | | | | | |
II. Property and Equipment | | | | | | | | | | | | | | | | | | | | | | | | | | | | | | | | | | | | | | | | |
1. Buildings on non-owned Land | | | 5,260,629.38 | | | 0.00 | | | 1,765,226.16 | | | 9,635.00 | | | 67,512.63 | | | 7,083,733.17 | | | 1,712,301.38 | | | 689,345.53 | | | 1,134.00 | | | 0.00 | | | 0.00 | | | 2,400,512.91 | | | 4,683,220.26 | |
2. Technical Equipment | | | 1,425,843,167.38 | | | 741,174.20 | | | 162,952,692.29 | | | 17,258,248.20 | | | 31,188,192.11 | | | 1,603,466,977.78 | | | 585,965,045.25 | | | 126,614,504.51 | | | 14,983,155.99 | | | (10,046.67 | ) | | 0.00 | | | 697,586,347.10 | | | 905,880,630.68 | |
3. Other Equipment, Furniture and Fixtures | | | 50,124,817.98 | | | 0.00 | | | 12,741,652.04 | | | 1,824,211.24 | | | 770,095.07 | | | 61,812,353.85 | | | 31,203,663.03 | | | 7,410,583.97 | | | 1,735,826.23 | | | 10,046.67 | | | 0.00 | | | 36,888,467.44 | | | 24,923,886.41 | |
4. Construction in progress | | | 39,714,617.85 | | | 0.00 | | | 42,893,915.46 | | | 8,879.21 | | | (32,065,799.81 | ) | | 50,533,854.29 | | | 0.00 | | | 0.00 | | | 0.00 | | | 0.00 | | | 0.00 | | | 0.00 | | | 50,533,854.29 | |
| | | | | | | | | | | | | | | | | | | | | | | | | | | | |
| | | 1,520,943,232.59 | | | 741,174.20 | | | 220,353,485.95 | | | 19,100,973.65 | | | (40,000.00 | ) | | 1,722,896,919.09 | | | 618,881,009.66 | | | 134,714,434.01 | | | 16,720,116.22 | | | 0.00 | | | 0.00 | | | 736,875,327.45 | | | 986,021,591.64 | |
| | | | | | | | | | | | | | | | | | | | | | | | | | | | |
III. Financial Assets | | | | | | | | | | | | | | | | | | | | | | | | | | | | | | | | | | | | | | | | |
1. Equity Investments in Associates | | | 2,487,200.00 | | | 0.00 | | | 0.00 | | | 0.00 | | | 0.00 | | | 2,487,200.00 | | | 629,532.93 | | | 0.00 | | | 0.00 | | | 0.00 | | | 227,496.98 | | | 857,029.91 | | | 1,630,170.09 | |
2. Other financial Assets | | | 352,000.00 | | | 0.00 | | | 7,393,800.37 | | | 300,000.00 | | | 0.00 | | | 7,445,800.37 | | | 0.00 | | | 0.00 | | | 0.00 | | | 0.00 | | | 0.00 | | | 0.00 | | | 7,445,800.37 | |
| | | | | | | | | | | | | | | | | | | | | | | | | | | | |
| | | 2,839,200.00 | | | 0.00 | | | 7,393,800.37 | | | 300,000.00 | | | 0.00 | | | 9,933,000.37 | | | 629,532.93 | | | 0.00 | | | 0.00 | | | 0.00 | | | 227,496.98 | | | 857,029.91 | | | 9,075,970.46 | |
| | | | | | | | | | | | | | | | | | | | | | | | | | | | |
| | | 2,346,919,329.47 | | | 6,454,203.51 | | | 291,167,716.30 | | | 22,640,590.53 | | | 0.00 | | | 2,621,900,658.75 | | | 924,690,520.34 | | | 245,418,816.21 | | | 19,959,733.10 | | | 0.00 | | | 227,496.98 | | | 1,150,377,100.43 | | | 1,471,523,558.32 | |
| | | | | | | | | | | | | | | | | | | | | | | | | | | | |
F-158