Exhibit (c)(16) Discussion Materials Project Lean May 16, 2024 HIGHLY CONFIDENTIAL
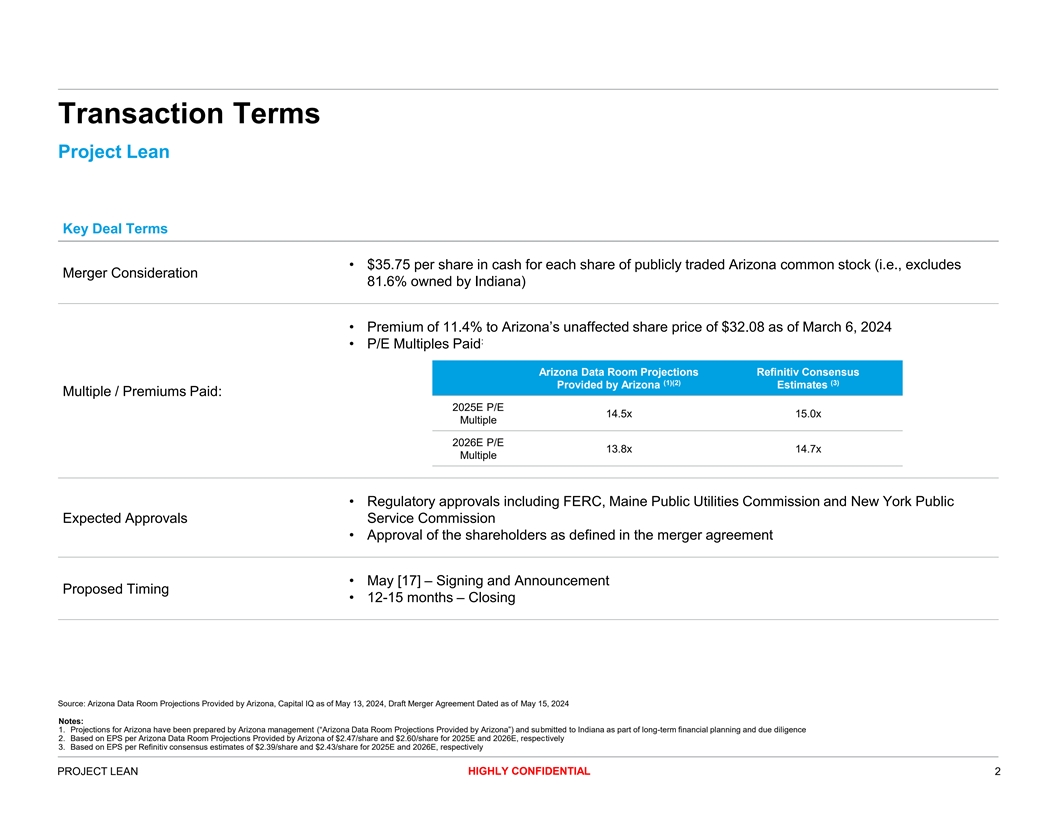
Transaction Terms Project Lean Key Deal Terms • $35.75 per share in cash for each share of publicly traded Arizona common stock (i.e., excludes Merger Consideration 81.6% owned by Indiana) • Premium of 11.4% to Arizona’s unaffected share price of $32.08 as of March 6, 2024 : • P/E Multiples Paid Arizona Data Room Projections Refinitiv Consensus (1)(2) (3) Provided by Arizona Estimates Multiple / Premiums Paid: 2025E P/E 14.5x 15.0x Multiple 2026E P/E 13.8x 14.7x Multiple • Regulatory approvals including FERC, Maine Public Utilities Commission and New York Public Expected Approvals Service Commission • Approval of the shareholders as defined in the merger agreement • May [17] – Signing and Announcement Proposed Timing • 12-15 months – Closing Source: Arizona Data Room Projections Provided by Arizona, Capital IQ as of May 13, 2024, Draft Merger Agreement Dated as of May 15, 2024 Notes: 1. Projections for Arizona have been prepared by Arizona management (“Arizona Data Room Projections Provided by Arizona”) and submitted to Indiana as part of long-term financial planning and due diligence 2. Based on EPS per Arizona Data Room Projections Provided by Arizona of $2.47/share and $2.60/share for 2025E and 2026E, respectively 3. Based on EPS per Refinitiv consensus estimates of $2.39/share and $2.43/share for 2025E and 2026E, respectively HIGHLY CONFIDENTIAL PROJECT LEAN 2
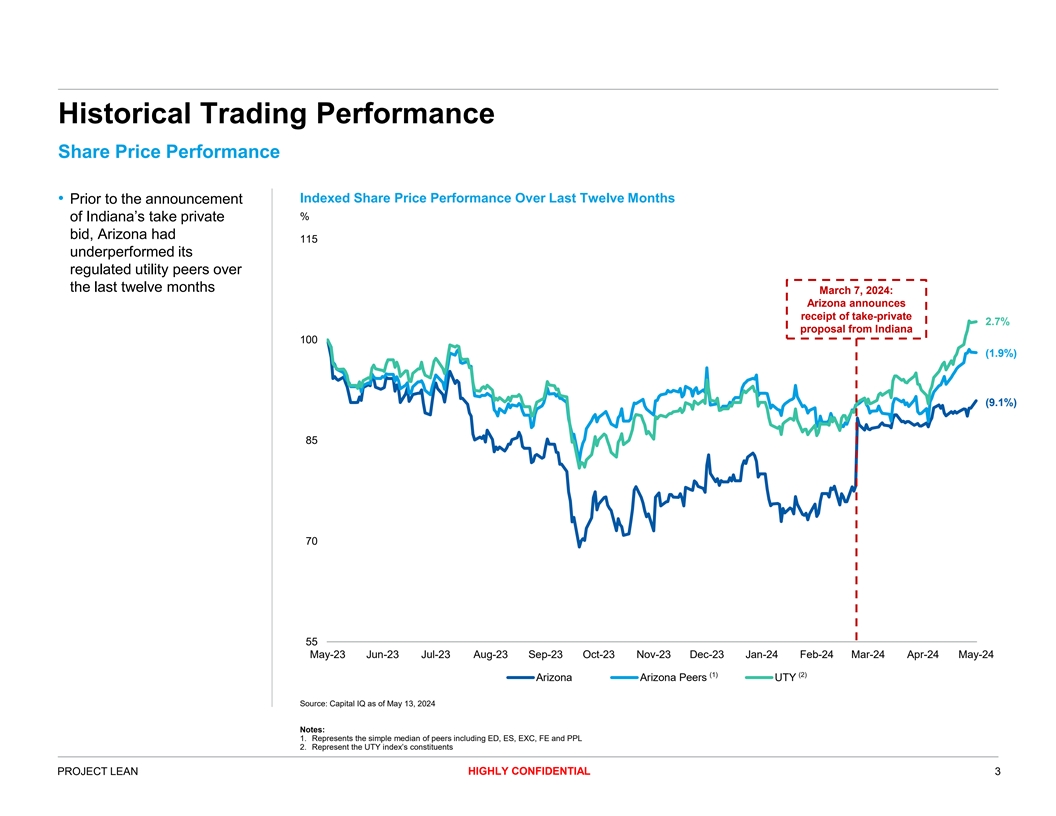
Historical Trading Performance Share Price Performance Indexed Share Price Performance Over Last Twelve Months • Prior to the announcement % of Indiana’s take private bid, Arizona had 115 underperformed its regulated utility peers over the last twelve months March 7, 2024: Arizona announces receipt of take-private 2.7% proposal from Indiana 100 (1.9%) (9.1%) 85 70 55 May-23 Jun-23 Jul-23 Aug-23 Sep-23 Oct-23 Nov-23 Dec-23 Jan-24 Feb-24 Mar-24 Apr-24 May-24 (1) (2) Arizona Arizona Peers UTY Source: Capital IQ as of May 13, 2024 Notes: 1. Represents the simple median of peers including ED, ES, EXC, FE and PPL 2. Represent the UTY index’s constituents HIGHLY CONFIDENTIAL PROJECT LEAN 3
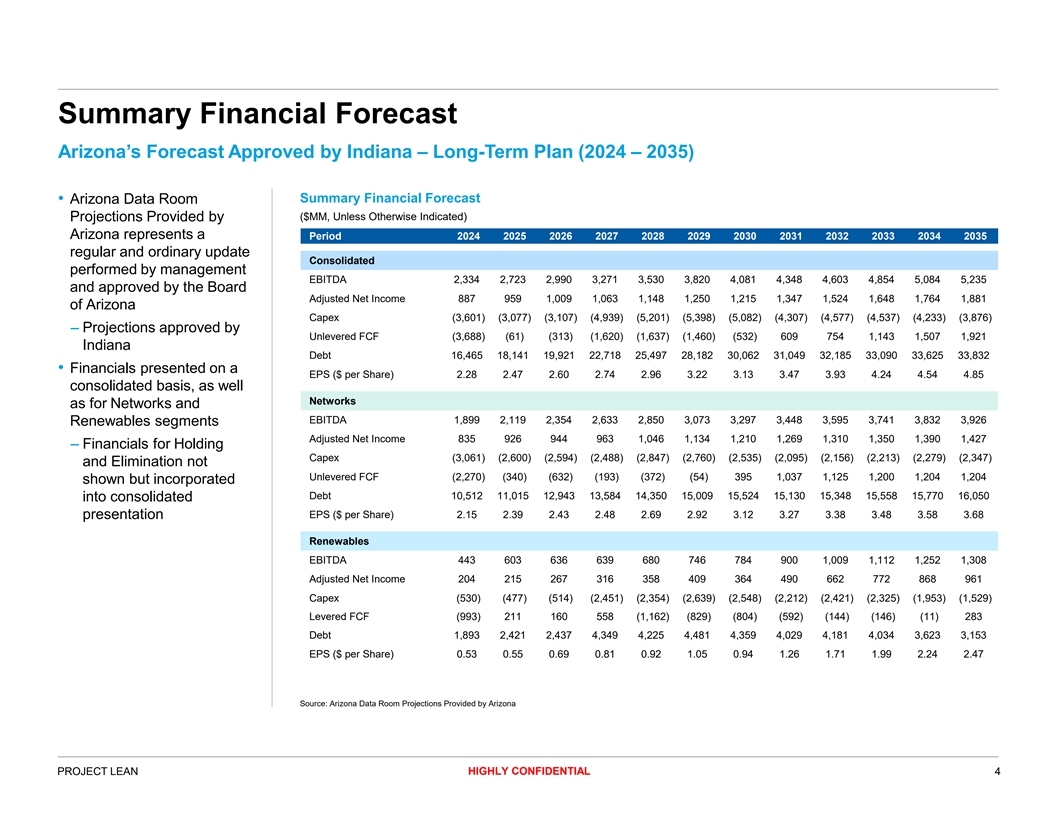
Summary Financial Forecast Arizona’s Forecast Approved by Indiana – Long-Term Plan (2024 – 2035) Summary Financial Forecast • Arizona Data Room ($MM, Unless Otherwise Indicated) Projections Provided by Arizona represents a Period 2024 2025 2026 2027 2028 2029 2030 2031 2032 2033 2034 2035 regular and ordinary update Consolidated performed by management EBITDA 2,334 2,723 2,990 3,271 3,530 3,820 4,081 4,348 4,603 4,854 5,084 5,235 and approved by the Board Adjusted Net Income 887 959 1,009 1,063 1,148 1,250 1,215 1,347 1,524 1,648 1,764 1,881 of Arizona Capex (3,601) (3,077) (3,107) (4,939) (5,201) (5,398) (5,082) (4,307) (4,577) (4,537) (4,233) (3,876) – Projections approved by Unlevered FCF (3,688) (61) (313) (1,620) (1,637) (1,460) (532) 609 754 1,143 1,507 1,921 Indiana Debt 16,465 18,141 19,921 22,718 25,497 28,182 30,062 31,049 32,185 33,090 33,625 33,832 • Financials presented on a EPS ($ per Share) 2.28 2.47 2.60 2.74 2.96 3.22 3.13 3.47 3.93 4.24 4.54 4.85 consolidated basis, as well Networks as for Networks and EBITDA 1,899 2,119 2,354 2,633 2,850 3,073 3,297 3,448 3,595 3,741 3,832 3,926 Renewables segments Adjusted Net Income 835 926 944 963 1,046 1,134 1,210 1,269 1,310 1,350 1,390 1,427 – Financials for Holding Capex (3,061) (2,600) (2,594) (2,488) (2,847) (2,760) (2,535) (2,095) (2,156) (2,213) (2,279) (2,347) and Elimination not Unlevered FCF (2,270) (340) (632) (193) (372) (54) 395 1,037 1,125 1,200 1,204 1,204 shown but incorporated Debt 10,512 11,015 12,943 13,584 14,350 15,009 15,524 15,130 15,348 15,558 15,770 16,050 into consolidated presentation EPS ($ per Share) 2.15 2.39 2.43 2.48 2.69 2.92 3.12 3.27 3.38 3.48 3.58 3.68 Renewables EBITDA 443 603 636 639 680 746 784 900 1,009 1,112 1,252 1,308 Adjusted Net Income 204 215 267 316 358 409 364 490 662 772 868 961 Capex (530) (477) (514) (2,451) (2,354) (2,639) (2,548) (2,212) (2,421) (2,325) (1,953) (1,529) Levered FCF (993) 211 160 558 (1,162) (829) (804) (592) (144) (146) (11) 283 Debt 1,893 2,421 2,437 4,349 4,225 4,481 4,359 4,029 4,181 4,034 3,623 3,153 EPS ($ per Share) 0.53 0.55 0.69 0.81 0.92 1.05 0.94 1.26 1.71 1.99 2.24 2.47 Source: Arizona Data Room Projections Provided by Arizona HIGHLY CONFIDENTIAL PROJECT LEAN 4

Preliminary Financial Analysis Based on Arizona – Long-Term Plan (2024 – 2035) (1) Illustrative Share Price Key Assumptions ($/share) • Financial forecast based on Arizona Agreed Price: Data Room Projections Provided by $35.75 Arizona and diligence completed to date • Transaction date: 12/31/2024 Unlevered Discounted Cash Flow 27.50 42.50 • Period: 11 years (3)(4) Terminal FY+1 P/E Multiple: 13.6x – 15.6x (2) • Net debt balances : SOTP Discounted Cash Flow – Transaction date: $20.3Bn (3)(5) Networks Terminal FY+1 P/E Multiple: 13.6x – 15.6x 34.00 46.75 (6) – Terminus date: $38.8Bn Renewables Terminal Growth Rate: 0.0% – 2.0% • Fully diluted shares outstanding of 388MM as of March 31, 2024 (7) Precedents Premiums (4.8% – 44.6%) 46.50 33.75 Unlevered DCF Unaffected Price: $32.08 • Unlevered discounted cash flow analysis based on consolidated (8) 2025E P/E Multiple (12.7x – 17.4x) projections included in Arizona Data 43.00 31.25 Room Projections Provided by Arizona Unadjusted Forecast EPS (2025E): $2.47/share Arizona and the following (8) assumptions: 2026E P/E Multiple (12.0x – 16.5x) (9) Arizona Unadjusted Forecast EPS (2026E): $2.60/share 31.25 – WACC: 6.0% - 7.0% 43.00 Reference Only SOTP DCF • Discounted cash flow analysis based on segment-level projections included 52 Week High / Low 27.50 41.25 in Arizona Data Room Projections Provided by Arizona and the following assumptions: Discounted Analyst Price Targets – Unlevered DCF for Networks 9 analyst price targets discounted ½ year at 9.6% – Levered DCF for Renewables – WACC $20.00 $30.00 $40.00 $50.00 Equity Value ($MM) 7,763 11,644 15,526 19,407 o Networks: 5.0% - 5.8% 2025E P/E (x) (2025E EPS: $2.47) 8.1x 12.1x 16.2x 20.2x – Cost of Equity: Discounted Analyst Source: Arizona Data Room Projections Provided by Arizona, Data Room Documents, Capital IQ as of May 13, 2024, Company Filings, Thomson Reuters (10) o Renewables: 10.3% - 12.3% Price Targets Notes: $1,152MM Arizona 1. Values rounded to $0.25 6. Terminal value calculated using FY+1 run rate free cash flow of $764MM 10. Analyst price targets (Morningstar, JP Morgan, Janney Montgomery, 2. Net debt includes minority interest 7. Based on final offer premium from U.S. precedents across industries from Wells Fargo, Siebert Williams, Wachovia Securities, Equisights, Wolfe 3. Reflects +/- 1.0x from the peer median due to width of range minority squeeze-outs of public companies from 2019 to present with an and Analyst (undisclosed name)) discounted by half of a period at 9.6%, 4. Terminal value calculated using a net debt balance of $38.8Bn (including equity value of $1Bn+ (excludes real estate, insurance and financial median of these brokers differs from the median analyst price target pull minority interest) at the exit (12/31/2035) and FY+1 run rate adjusted net transactions and withdrawn offers) from CapIQ due to slightly different set of brokers based on equity income of $1,992MM 8. Based on Network peers (ED, ES, EXC, FE and PPL) research available 5. Terminal value calculated using FY+1 run rate adjusted net income of 9. Consolidated financial analysis based on cost of equity and WACC for HIGHLY CONFIDENTIAL PROJECT LEAN 5 Analyst 52 Week Trading Precedent Discounted Cash Flow Price High / Low Comparables Transactions Analyses Targets
APPENDIX Supplementary Financial Analysis HIGHLY CONFIDENTIAL 6
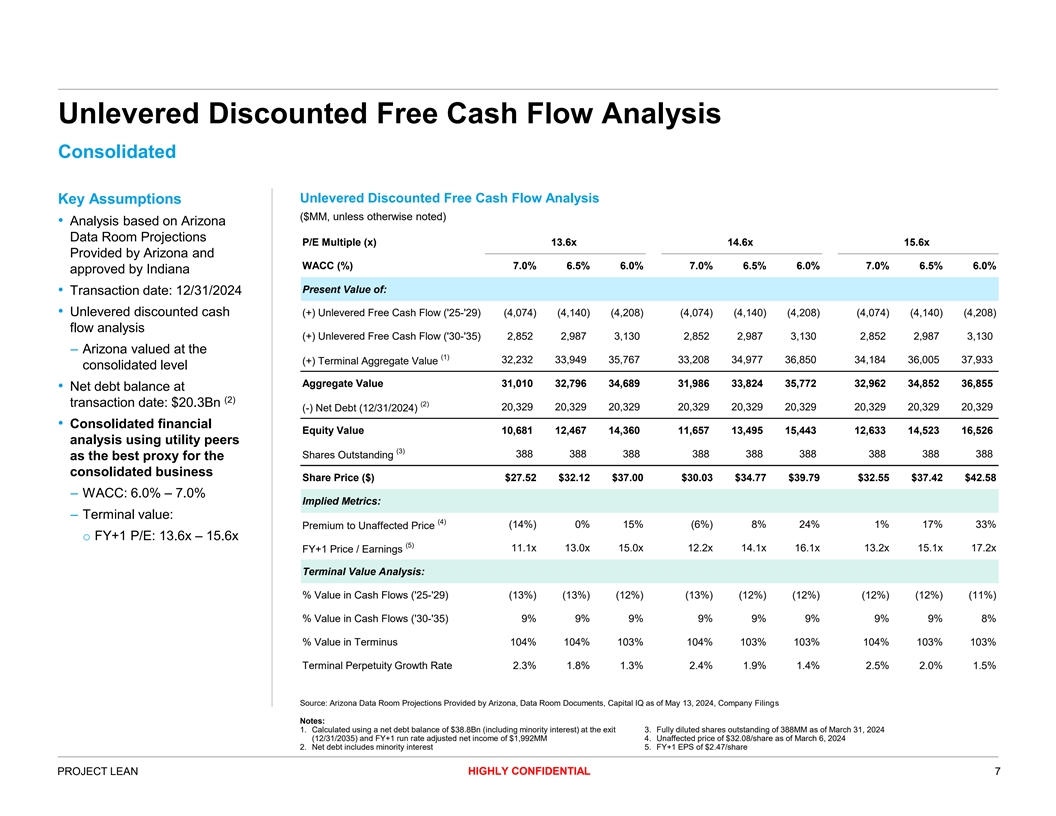
Unlevered Discounted Free Cash Flow Analysis Consolidated Unlevered Discounted Free Cash Flow Analysis Key Assumptions ($MM, unless otherwise noted) • Analysis based on Arizona Data Room Projections P/E Multiple (x) 13.6x 14.6x 15.6x Provided by Arizona and WACC (%) 7.0% 6.5% 6.0% 7.0% 6.5% 6.0% 7.0% 6.5% 6.0% approved by Indiana Present Value of: • Transaction date: 12/31/2024 • Unlevered discounted cash (+) Unlevered Free Cash Flow ('25-'29) (4,074) (4,140) (4,208) (4,074) (4,140) (4,208) (4,074) (4,140) (4,208) flow analysis (+) Unlevered Free Cash Flow ('30-'35) 2,852 2,987 3,130 2,852 2,987 3,130 2,852 2,987 3,130 – Arizona valued at the (1) 32,232 33,949 35,767 33,208 34,977 36,850 34,184 36,005 37,933 (+) Terminal Aggregate Value consolidated level Aggregate Value 31,010 32,796 34,689 31,986 33,824 35,772 32,962 34,852 36,855 • Net debt balance at (2) transaction date: $20.3Bn (2) 20,329 20,329 20,329 20,329 20,329 20,329 20,329 20,329 20,329 (-) Net Debt (12/31/2024) • Consolidated financial Equity Value 10,681 12,467 14,360 11,657 13,495 15,443 12,633 14,523 16,526 analysis using utility peers (3) 388 388 388 388 388 388 388 388 388 Shares Outstanding as the best proxy for the consolidated business Share Price ($) $27.52 $32.12 $37.00 $30.03 $34.77 $39.79 $32.55 $37.42 $42.58 – WACC: 6.0% – 7.0% Implied Metrics: – Terminal value: (4) (14%) 0% 15% (6%) 8% 24% 1% 17% 33% Premium to Unaffected Price o FY+1 P/E: 13.6x – 15.6x (5) 11.1x 13.0x 15.0x 12.2x 14.1x 16.1x 13.2x 15.1x 17.2x FY+1 Price / Earnings Terminal Value Analysis: % Value in Cash Flows ('25-'29) (13%) (13%) (12%) (13%) (12%) (12%) (12%) (12%) (11%) % Value in Cash Flows ('30-'35) 9% 9% 9% 9% 9% 9% 9% 9% 8% % Value in Terminus 104% 104% 103% 104% 103% 103% 104% 103% 103% Terminal Perpetuity Growth Rate 2.3% 1.8% 1.3% 2.4% 1.9% 1.4% 2.5% 2.0% 1.5% Source: Arizona Data Room Projections Provided by Arizona, Data Room Documents, Capital IQ as of May 13, 2024, Company Filings Notes: 1. Calculated using a net debt balance of $38.8Bn (including minority interest) at the exit 3. Fully diluted shares outstanding of 388MM as of March 31, 2024 (12/31/2035) and FY+1 run rate adjusted net income of $1,992MM 4. Unaffected price of $32.08/share as of March 6, 2024 2. Net debt includes minority interest 5. FY+1 EPS of $2.47/share HIGHLY CONFIDENTIAL PROJECT LEAN 7
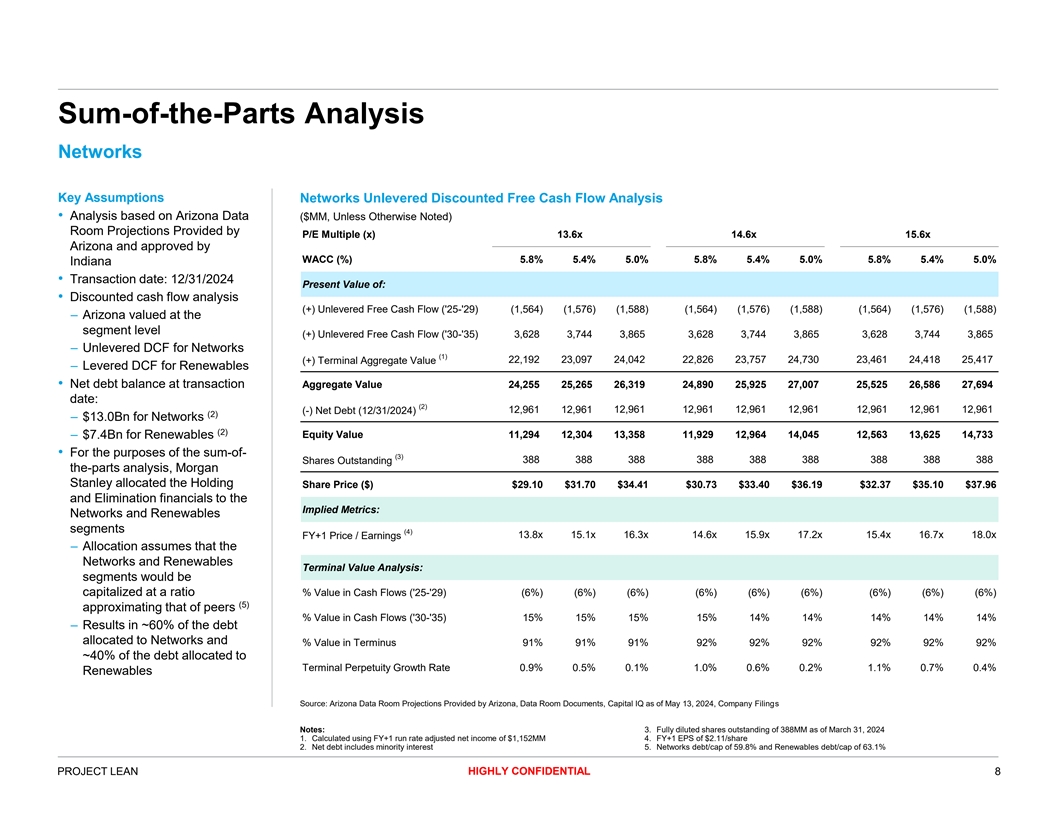
Sum-of-the-Parts Analysis Networks Key Assumptions Networks Unlevered Discounted Free Cash Flow Analysis • Analysis based on Arizona Data ($MM, Unless Otherwise Noted) Room Projections Provided by P/E Multiple (x) 13.6x 14.6x 15.6x Arizona and approved by WACC (%) 5.8% 5.4% 5.0% 5.8% 5.4% 5.0% 5.8% 5.4% 5.0% Indiana • Transaction date: 12/31/2024 Present Value of: • Discounted cash flow analysis (+) Unlevered Free Cash Flow ('25-'29) (1,564) (1,576) (1,588) (1,564) (1,576) (1,588) (1,564) (1,576) (1,588) – Arizona valued at the segment level (+) Unlevered Free Cash Flow ('30-'35) 3,628 3,744 3,865 3,628 3,744 3,865 3,628 3,744 3,865 – Unlevered DCF for Networks (1) 22,192 23,097 24,042 22,826 23,757 24,730 23,461 24,418 25,417 (+) Terminal Aggregate Value – Levered DCF for Renewables • Net debt balance at transaction Aggregate Value 24,255 25,265 26,319 24,890 25,925 27,007 25,525 26,586 27,694 date: (2) 12,961 12,961 12,961 12,961 12,961 12,961 12,961 12,961 12,961 (-) Net Debt (12/31/2024) (2) – $13.0Bn for Networks (2) – $7.4Bn for Renewables Equity Value 11,294 12,304 13,358 11,929 12,964 14,045 12,563 13,625 14,733 • For the purposes of the sum-of- (3) 388 388 388 388 388 388 388 388 388 Shares Outstanding the-parts analysis, Morgan Stanley allocated the Holding Share Price ($) $29.10 $31.70 $34.41 $30.73 $33.40 $36.19 $32.37 $35.10 $37.96 and Elimination financials to the Implied Metrics: Networks and Renewables segments (4) 13.8x 15.1x 16.3x 14.6x 15.9x 17.2x 15.4x 16.7x 18.0x FY+1 Price / Earnings – Allocation assumes that the Networks and Renewables Terminal Value Analysis: segments would be capitalized at a ratio % Value in Cash Flows ('25-'29) (6%) (6%) (6%) (6%) (6%) (6%) (6%) (6%) (6%) (5) approximating that of peers % Value in Cash Flows ('30-'35) 15% 15% 15% 15% 14% 14% 14% 14% 14% – Results in ~60% of the debt allocated to Networks and % Value in Terminus 91% 91% 91% 92% 92% 92% 92% 92% 92% ~40% of the debt allocated to Terminal Perpetuity Growth Rate 0.9% 0.5% 0.1% 1.0% 0.6% 0.2% 1.1% 0.7% 0.4% Renewables Source: Arizona Data Room Projections Provided by Arizona, Data Room Documents, Capital IQ as of May 13, 2024, Company Filings Notes: 3. Fully diluted shares outstanding of 388MM as of March 31, 2024 1. Calculated using FY+1 run rate adjusted net income of $1,152MM 4. FY+1 EPS of $2.11/share 2. Net debt includes minority interest 5. Networks debt/cap of 59.8% and Renewables debt/cap of 63.1% HIGHLY CONFIDENTIAL PROJECT LEAN 8
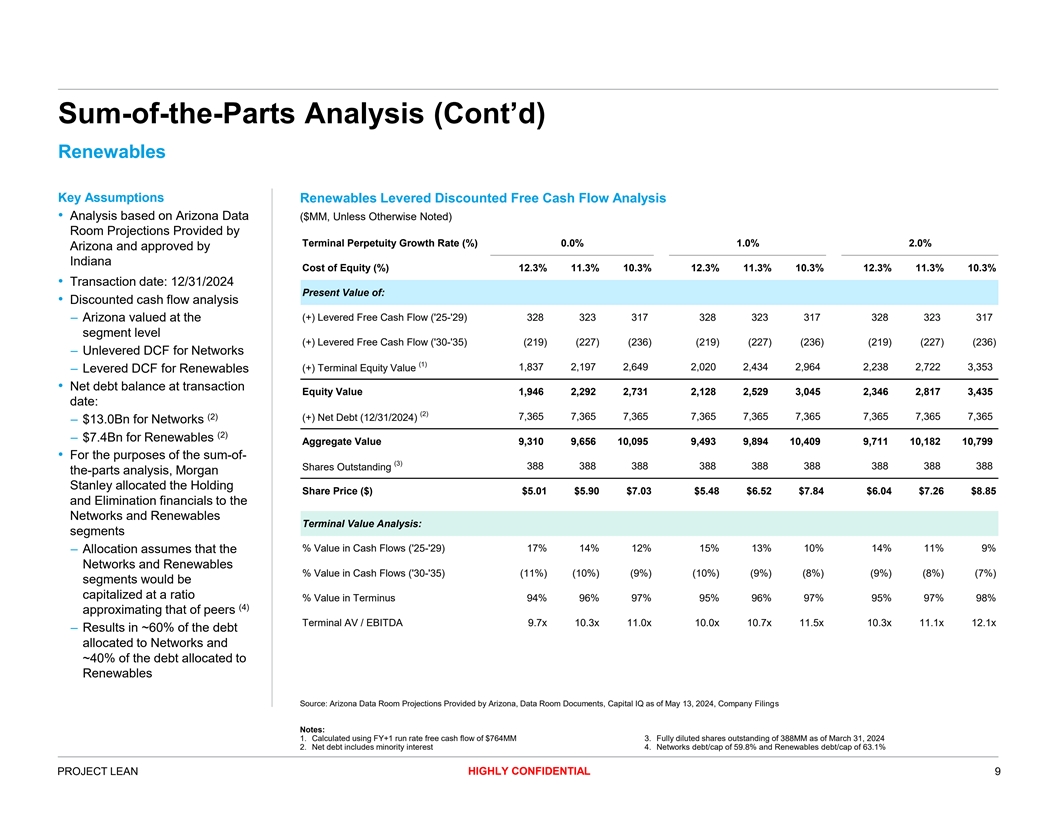
Sum-of-the-Parts Analysis (Cont’d) Renewables Key Assumptions Renewables Levered Discounted Free Cash Flow Analysis • Analysis based on Arizona Data ($MM, Unless Otherwise Noted) Room Projections Provided by Terminal Perpetuity Growth Rate (%) 0.0% 1.0% 2.0% Arizona and approved by Indiana Cost of Equity (%) 12.3% 11.3% 10.3% 12.3% 11.3% 10.3% 12.3% 11.3% 10.3% • Transaction date: 12/31/2024 Present Value of: • Discounted cash flow analysis – Arizona valued at the (+) Levered Free Cash Flow ('25-'29) 328 323 317 328 323 317 328 323 317 segment level (+) Levered Free Cash Flow ('30-'35) ( 219) (227) (236) (219) (227) (236) (219) (227) (236) – Unlevered DCF for Networks (1) 1,837 2,197 2,649 2,020 2,434 2,964 2,238 2,722 3,353 (+) Terminal Equity Value – Levered DCF for Renewables • Net debt balance at transaction Equity Value 1,946 2,292 2,731 2,128 2,529 3,045 2,346 2,817 3,435 date: (2) (2) 7,365 7,365 7,365 7,365 7,365 7,365 7,365 7,365 7,365 (+) Net Debt (12/31/2024) – $13.0Bn for Networks (2) – $7.4Bn for Renewables Aggregate Value 9,310 9,656 10,095 9,493 9,894 10,409 9,711 10,182 10,799 • For the purposes of the sum-of- (3) 388 388 388 388 388 388 388 388 388 Shares Outstanding the-parts analysis, Morgan Stanley allocated the Holding Share Price ($) $5.01 $5.90 $7.03 $5.48 $6.52 $7.84 $6.04 $7.26 $8.85 and Elimination financials to the Networks and Renewables Terminal Value Analysis: segments % Value in Cash Flows ('25-'29) 17% 14% 12% 15% 13% 10% 14% 11% 9% – Allocation assumes that the Networks and Renewables % Value in Cash Flows ('30-'35) (11%) (10%) (9%) (10%) (9%) (8%) (9%) (8%) (7%) segments would be capitalized at a ratio % Value in Terminus 94% 96% 97% 95% 96% 97% 95% 97% 98% (4) approximating that of peers Terminal AV / EBITDA 9.7x 10.3x 11.0x 10.0x 10.7x 11.5x 10.3x 11.1x 12.1x – Results in ~60% of the debt allocated to Networks and ~40% of the debt allocated to Renewables Source: Arizona Data Room Projections Provided by Arizona, Data Room Documents, Capital IQ as of May 13, 2024, Company Filings Notes: 1. Calculated using FY+1 run rate free cash flow of $764MM 3. Fully diluted shares outstanding of 388MM as of March 31, 2024 2. Net debt includes minority interest 4. Networks debt/cap of 59.8% and Renewables debt/cap of 63.1% HIGHLY CONFIDENTIAL PROJECT LEAN 9
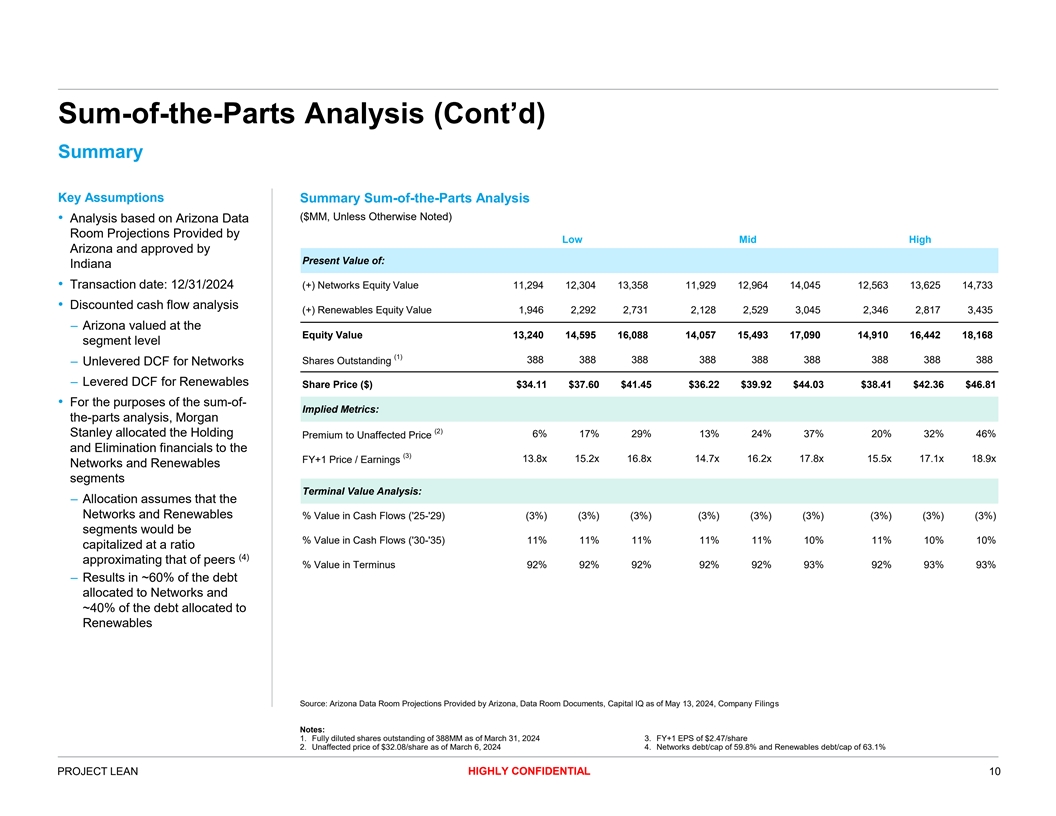
Sum-of-the-Parts Analysis (Cont’d) Summary Key Assumptions Summary Sum-of-the-Parts Analysis ($MM, Unless Otherwise Noted) • Analysis based on Arizona Data Room Projections Provided by Low Mid High Arizona and approved by Present Value of: Indiana • Transaction date: 12/31/2024 (+) Networks Equity Value 11,294 12,304 13,358 11,929 12,964 14,045 12,563 13,625 14,733 • Discounted cash flow analysis (+) Renewables Equity Value 1,946 2,292 2,731 2,128 2,529 3,045 2,346 2,817 3,435 – Arizona valued at the Equity Value 13,240 14,595 16,088 14,057 15,493 17,090 14,910 16,442 18,168 segment level (1) Shares Outstanding 388 388 388 388 388 388 388 388 388 – Unlevered DCF for Networks – Levered DCF for Renewables Share Price ($) $34.11 $37.60 $41.45 $36.22 $39.92 $44.03 $38.41 $42.36 $46.81 • For the purposes of the sum-of- Implied Metrics: the-parts analysis, Morgan (2) Stanley allocated the Holding 6% 17% 29% 13% 24% 37% 20% 32% 46% Premium to Unaffected Price and Elimination financials to the (3) FY+1 Price / Earnings 13.8x 15.2x 16.8x 14.7x 16.2x 17.8x 15.5x 17.1x 18.9x Networks and Renewables segments Terminal Value Analysis: – Allocation assumes that the Networks and Renewables % Value in Cash Flows ('25-'29) (3%) (3%) (3%) (3%) (3%) (3%) (3%) (3%) (3%) segments would be % Value in Cash Flows ('30-'35) 11% 11% 11% 11% 11% 10% 11% 10% 10% capitalized at a ratio (4) approximating that of peers % Value in Terminus 92% 92% 92% 92% 92% 93% 92% 93% 93% – Results in ~60% of the debt allocated to Networks and ~40% of the debt allocated to Renewables Source: Arizona Data Room Projections Provided by Arizona, Data Room Documents, Capital IQ as of May 13, 2024, Company Filings Notes: 1. Fully diluted shares outstanding of 388MM as of March 31, 2024 3. FY+1 EPS of $2.47/share 2. Unaffected price of $32.08/share as of March 6, 2024 4. Networks debt/cap of 59.8% and Renewables debt/cap of 63.1% HIGHLY CONFIDENTIAL PROJECT LEAN 10
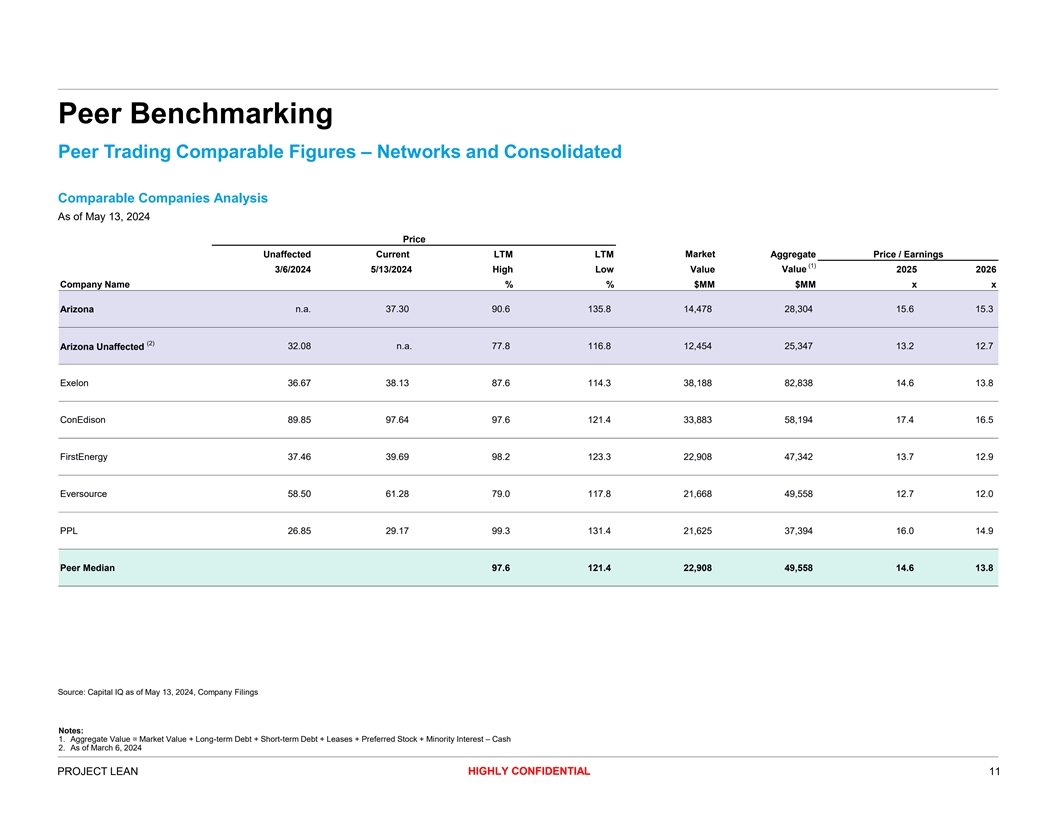
Peer Benchmarking Peer Trading Comparable Figures – Networks and Consolidated Comparable Companies Analysis As of May 13, 2024 Price Last Fiscal Year EBITDA Unaffected Current LTM LTM Market Aggregate Price / Earnings (1) Value 3/6/2024 5/13/2024 High Low Value 2025 2026 Company Name % % $MM $MM x x Arizona n.a. 37.30 90.6 135.8 14,478 28,304 15.6 15.3 (2) 32.08 n.a. 77.8 116.8 12,454 25,347 13.2 12.7 Arizona Unaffected Exelon 36.67 38.13 87.6 114.3 38,188 82,838 14.6 13.8 ConEdison 89.85 97.64 97.6 121.4 33,883 58,194 17.4 16.5 FirstEnergy 37.46 39.69 98.2 123.3 22,908 47,342 13.7 12.9 Eversource 58.50 61.28 79.0 117.8 21,668 49,558 12.7 12.0 PPL 26.85 29.17 99.3 131.4 21,625 37,394 16.0 14.9 Peer Median 97.6 121.4 22,908 49,558 14.6 13.8 Source: Capital IQ as of May 13, 2024, Company Filings Notes: 1. Aggregate Value = Market Value + Long-term Debt + Short-term Debt + Leases + Preferred Stock + Minority Interest – Cash 2. As of March 6, 2024 HIGHLY CONFIDENTIAL PROJECT LEAN 11
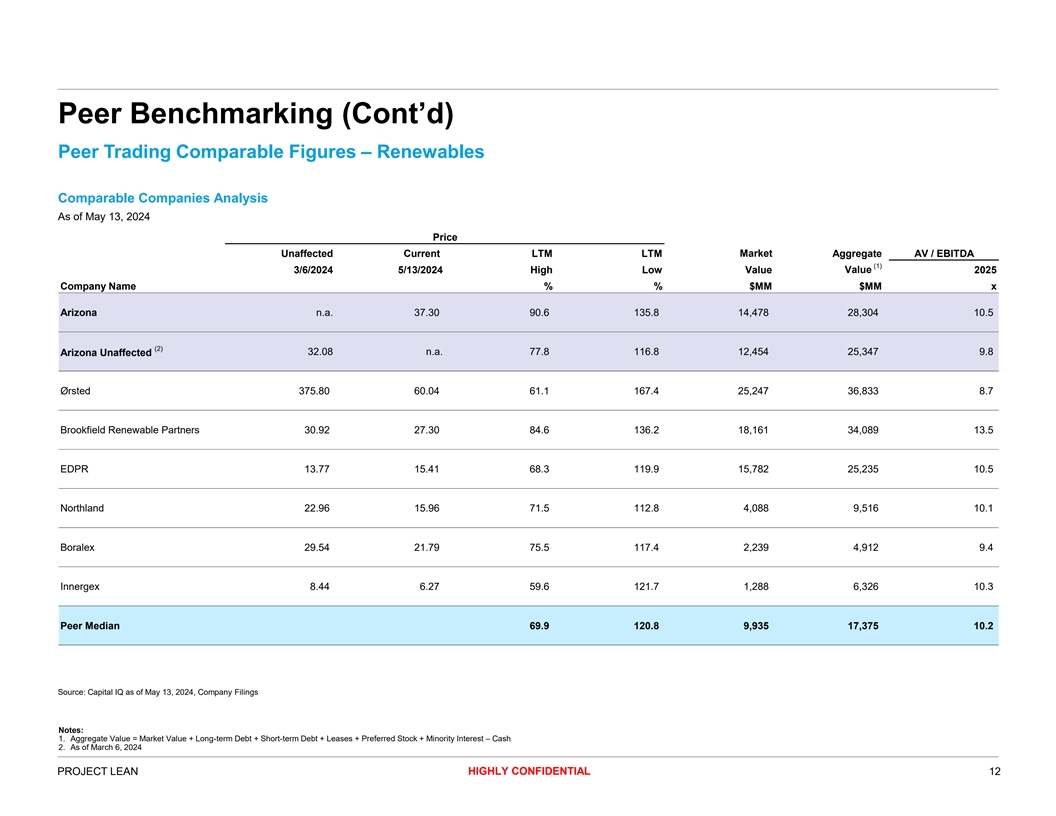
Peer Benchmarking (Cont’d) Peer Trading Comparable Figures – Renewables Comparable Companies Analysis As of May 13, 2024 Price Unaffected Current LTM LTM Market Aggregate AV / EBITDA (1) 3/6/2024 5/13/2024 High Low Value Value 2025 Company Name % % $MM $MM x Arizona n.a. 37.30 90.6 135.8 14,478 28,304 10.5 (2) Arizona Unaffected 32.08 n.a. 77.8 116.8 12,454 25,347 9.8 Ørsted 375.80 60.04 61.1 167.4 25,247 36,833 8.7 Brookfield Renewable Partners 30.92 27.30 84.6 136.2 18,161 34,089 13.5 EDPR 13.77 15.41 68.3 119.9 15,782 25,235 10.5 Northland 22.96 15.96 71.5 112.8 4,088 9,516 10.1 Boralex 29.54 21.79 75.5 117.4 2,239 4,912 9.4 Innergex 8.44 6.27 59.6 121.7 1,288 6,326 10.3 Peer Median 69.9 120.8 9,935 17,375 10.2 Source: Capital IQ as of May 13, 2024, Company Filings Notes: 1. Aggregate Value = Market Value + Long-term Debt + Short-term Debt + Leases + Preferred Stock + Minority Interest – Cash 2. As of March 6, 2024 HIGHLY CONFIDENTIAL PROJECT LEAN 12

Relevant Precedent Transactions Minority Squeeze-Outs of Public Companies Precedents (U.S. Transactions Across Industries) U.S. Squeeze-Out Precedents Across Industries Basis of Presentation Unaffected • Time Period: 2019 to Ownership Final Prior to Ann. Stake Sought Offer Equity Value present Date Ann. Target Acquirer Industry Target Nation (%) (%) (%) ($MM) • Precedents across 2022 Shell Midstream Partners LP Shell Midstream LP Hldg LLC Energy United States 68.5 31.5 9.6 1,963 industries from minority squeeze-outs of public companies in the U.S. • Equity Value Size: 2022 Continental Resources Inc Omega Acquisition Inc Energy United States 82.6 17.4 15.2 4,701 $1,000MM+ • Excludes real estate, insurance and financial 2021 Phillips 66 Partners LP Phillips 66 Co Energy United States 74.3 25.7 4.8 2,961 transactions • Excludes withdrawn offers 2020 Eidos Therapeutics Inc BridgeBio Pharma Inc Biotech/Pharma United States 60.8 39.2 41.1 1,113 2020 TerraForm Power Inc Brookfield Renewable Partners Utilities United States 61.6 38.4 17.4 1,440 2019 AVX Corp KYOCERA Corp Technology United States 72.0 28.0 44.6 1,031 Source: Thomson Reuters, Company Filings, Deal Point Data HIGHLY CONFIDENTIAL PROJECT LEAN 13
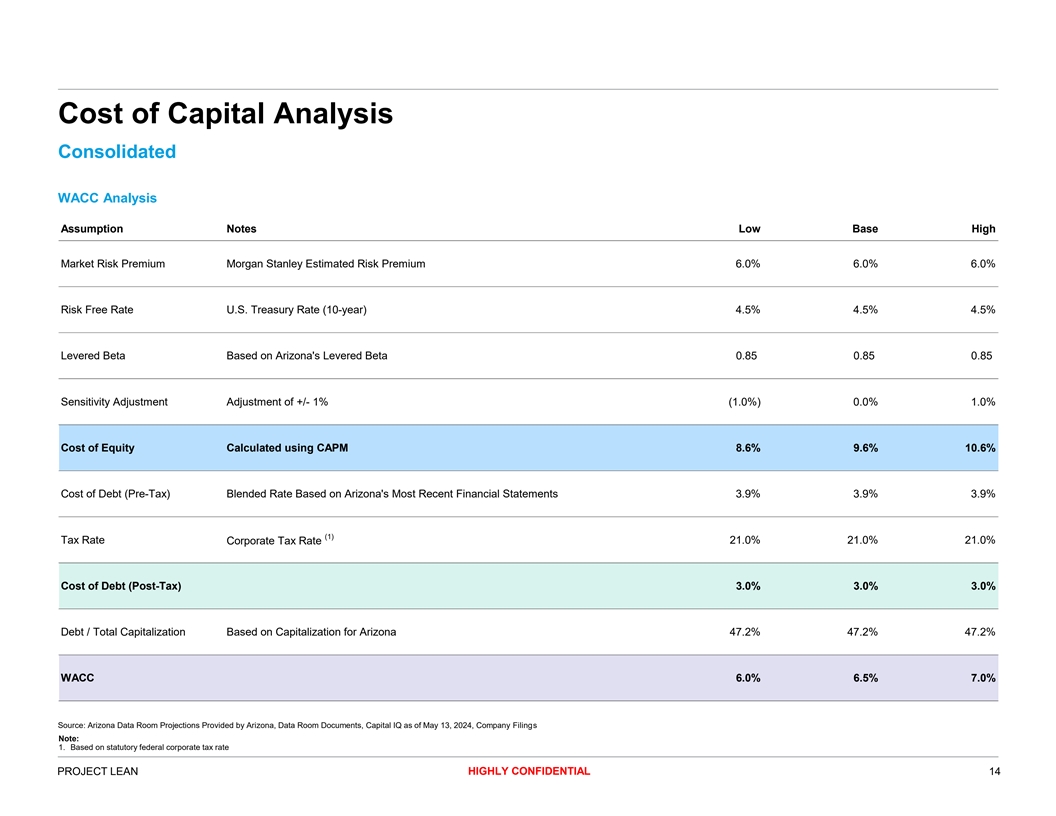
Cost of Capital Analysis Consolidated WACC Analysis Assumption Notes Low Base High Market Risk Premium Morgan Stanley Estimated Risk Premium 6.0% 6.0% 6.0% Risk Free Rate U.S. Treasury Rate (10-year) 4.5% 4.5% 4.5% Levered Beta Based on Arizona's Levered Beta 0.85 0.85 0.85 Sensitivity Adjustment Adjustment of +/- 1% (1.0%) 0.0% 1.0% Cost of Equity Calculated using CAPM 8.6% 9.6% 10.6% Cost of Debt (Pre-Tax) Blended Rate Based on Arizona's Most Recent Financial Statements 3.9% 3.9% 3.9% (1) Tax Rate 21.0% 21.0% 21.0% Corporate Tax Rate Cost of Debt (Post-Tax) 3.0% 3.0% 3.0% Debt / Total Capitalization Based on Capitalization for Arizona 47.2% 47.2% 47.2% WACC 6.0% 6.5% 7.0% Source: Arizona Data Room Projections Provided by Arizona, Data Room Documents, Capital IQ as of May 13, 2024, Company Filings Note: 1. Based on statutory federal corporate tax rate HIGHLY CONFIDENTIAL PROJECT LEAN 14
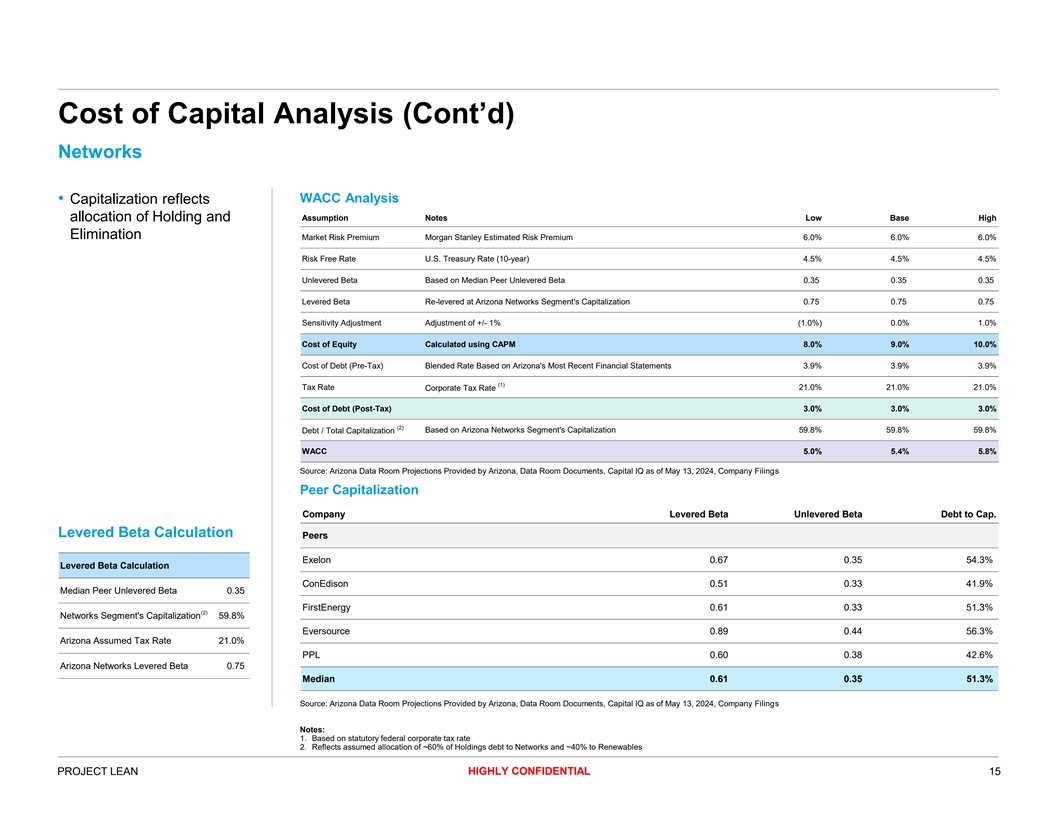
Cost of Capital Analysis (Cont’d) Networks WACC Analysis • Capitalization reflects allocation of Holding and Assumption Notes Low Base High Elimination Market Risk Premium Morgan Stanley Estimated Risk Premium 6.0% 6.0% 6.0% Risk Free Rate U.S. Treasury Rate (10-year) 4.5% 4.5% 4.5% Unlevered Beta Based on Median Peer Unlevered Beta 0.35 0.35 0.35 Levered Beta Re-levered at Arizona Networks Segment's Capitalization 0.75 0.75 0.75 Sensitivity Adjustment Adjustment of +/- 1% (1.0%) 0.0% 1.0% Cost of Equity Calculated using CAPM 8.0% 9.0% 10.0% Cost of Debt (Pre-Tax) Blended Rate Based on Arizona's Most Recent Financial Statements 3.9% 3.9% 3.9% (1) Tax Rate Corporate Tax Rate 21.0% 21.0% 21.0% Cost of Debt (Post-Tax) 3.0% 3.0% 3.0% (2) Debt / Total Capitalization Based on Arizona Networks Segment's Capitalization 59.8% 59.8% 59.8% WACC 5.0% 5.4% 5.8% Source: Arizona Data Room Projections Provided by Arizona, Data Room Documents, Capital IQ as of May 13, 2024, Company Filings Peer Capitalization Company Levered Beta Unlevered Beta Debt to Cap. Levered Beta Calculation Peers Exelon 0.67 0.35 54.3% Levered Beta Calculation ConEdison 0.51 0.33 41.9% Median Peer Unlevered Beta 0.35 FirstEnergy 0.61 0.33 51.3% (2) Networks Segment's Capitalization 59.8% Eversource 0.89 0.44 56.3% Arizona Assumed Tax Rate 21.0% PPL 0.60 0.38 42.6% Arizona Networks Levered Beta 0.75 Median 0.61 0.35 51.3% Source: Arizona Data Room Projections Provided by Arizona, Data Room Documents, Capital IQ as of May 13, 2024, Company Filings Notes: 1. Based on statutory federal corporate tax rate 2. Reflects assumed allocation of ~60% of Holdings debt to Networks and ~40% to Renewables HIGHLY CONFIDENTIAL PROJECT LEAN 15
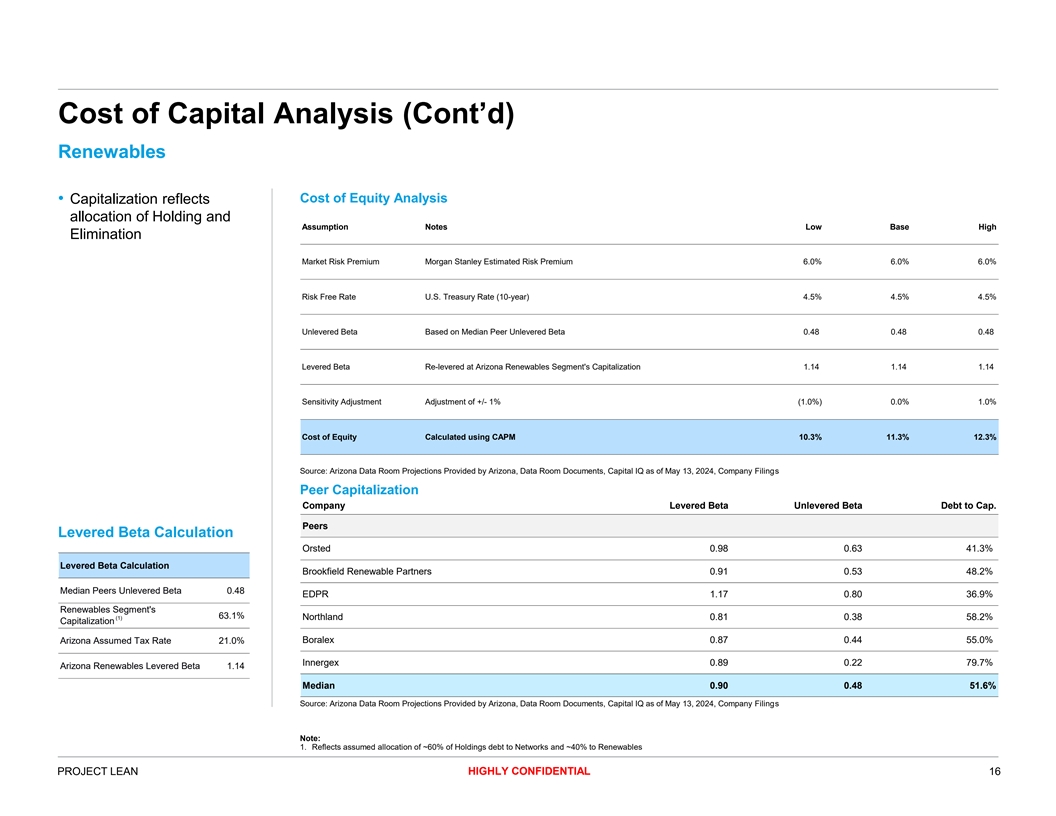
Cost of Capital Analysis (Cont’d) Renewables Cost of Equity Analysis • Capitalization reflects allocation of Holding and Assumption Notes Low Base High Elimination Market Risk Premium Morgan Stanley Estimated Risk Premium 6.0% 6.0% 6.0% Risk Free Rate U.S. Treasury Rate (10-year) 4.5% 4.5% 4.5% Unlevered Beta Based on Median Peer Unlevered Beta 0.48 0.48 0.48 Levered Beta Re-levered at Arizona Renewables Segment's Capitalization 1.14 1.14 1.14 Sensitivity Adjustment Adjustment of +/- 1% (1.0%) 0.0% 1.0% Cost of Equity Calculated using CAPM 10.3% 11.3% 12.3% Source: Arizona Data Room Projections Provided by Arizona, Data Room Documents, Capital IQ as of May 13, 2024, Company Filings Peer Capitalization Company Levered Beta Unlevered Beta Debt to Cap. Peers Levered Beta Calculation Orsted 0.98 0.63 41.3% Levered Beta Calculation Brookfield Renewable Partners 0.91 0.53 48.2% Median Peers Unlevered Beta 0.48 EDPR 1.17 0.80 36.9% Renewables Segment's 63.1% (1) Northland 0.81 0.38 58.2% Capitalization Boralex 0.87 0.44 55.0% Arizona Assumed Tax Rate 21.0% Innergex 0.89 0.22 79.7% Arizona Renewables Levered Beta 1.14 Median 0.90 0.48 51.6% Source: Arizona Data Room Projections Provided by Arizona, Data Room Documents, Capital IQ as of May 13, 2024, Company Filings Note: 1. Reflects assumed allocation of ~60% of Holdings debt to Networks and ~40% to Renewables HIGHLY CONFIDENTIAL PROJECT LEAN 16
Legal Disclaimer We have prepared this document solely for informational purposes. You should not definitively rely upon it or use it to form the definitive basis for any decision, contract, commitment or action whatsoever, with respect to any proposed transaction or otherwise. You and your directors, officers, employees, agents and affiliates must hold this document and any oral information provided in connection with this document in strict confidence and may not communicate, reproduce, distribute or disclose it to any other person, or refer to it publicly, in whole or in part at any time except with our prior written consent. If you are not the intended recipient of this document, please delete and destroy all copies immediately. We have prepared this document and the analyses contained in it based, in part, on certain assumptions and information obtained by us from the recipient, its directors, officers, employees, agents, affiliates and/or from other sources. Our use of such assumptions and information does not imply that we have independently verified or necessarily agree with any of such assumptions or information, and we have assumed and relied upon the accuracy and completeness of such assumptions and information for purposes of this document. Neither we nor any of our affiliates, or our or their respective officers, employees or agents, make any representation or warranty, express or implied, in relation to the accuracy or completeness of the information contained in this document or any oral information provided in connection herewith, or any data it generates and accept no responsibility, obligation or liability (whether direct or indirect, in contract, tort or otherwise) in relation to any of such information. We and our affiliates and our and their respective officers, employees and agents expressly disclaim any and all liability which may be based on this document and any errors therein or omissions therefrom. Neither we nor any of our affiliates, or our or their respective officers, employees or agents, make any representation or warranty, express or implied, that any transaction has been or may be effected on the terms or in the manner stated in this document, or as to the achievement or reasonableness of future projections, management targets, estimates, prospects or returns, if any. Any views or terms contained herein are preliminary only, and are based on financial, economic, market and other conditions prevailing as of the date of this document and are therefore subject to change. We undertake no obligation or responsibility to update any of the information contained in this document. Past performance does not guarantee or predict future performance. This document and the information contained herein do not constitute an offer to sell or the solicitation of an offer to buy any security, commodity or instrument or related derivative, nor do they constitute an offer or commitment to lend, syndicate or arrange a financing, underwrite or purchase or act as an agent or advisor or in any other capacity with respect to any transaction, or commit capital, or to participate in any trading strategies, and do not constitute legal, regulatory, accounting or tax advice to the recipient. We recommend that the recipient seek independent third party legal, regulatory, accounting and tax advice regarding the contents of this document. This document does not constitute and should not be considered as any form of financial opinion or recommendation by us or any of our affiliates. This document is not a research report and was not prepared by the research department of Morgan Stanley or any of its affiliates. Notwithstanding anything herein to the contrary, each recipient hereof (and their employees, representatives, and other agents) may disclose to any and all persons, without limitation of any kind from the commencement of discussions, the U.S. federal and state income tax treatment and tax structure of the proposed transaction and all materials of any kind (including opinions or other tax analyses) that are provided relating to the tax treatment and tax structure. For this purpose, tax structure is limited to facts relevant to the U.S. federal and state income tax treatment of the proposed transaction and does not include information relating to the identity of the parties, their affiliates, agents or advisors. This document is provided by Morgan Stanley & Co. LLC and/or certain of its affiliates or other applicable entities, which may include Morgan Stanley Realty Incorporated, Morgan Stanley Senior Funding, Inc., Morgan Stanley Bank, N.A., Morgan Stanley & Co. International plc, Morgan Stanley Securities Limited, Morgan Stanley Europe SE, Morgan Stanley MUFG Securities Co., Ltd., Mitsubishi UFJ Morgan Stanley Securities Co., Ltd., Morgan Stanley Asia Limited, Morgan Stanley Australia Securities Limited, Morgan Stanley Australia Limited, Morgan Stanley Asia (Singapore) Pte., Morgan Stanley Services Limited, Morgan Stanley & Co. International plc Seoul Branch and/or Morgan Stanley Canada Limited Unless governing law permits otherwise, you must contact an authorized Morgan Stanley entity in your jurisdiction regarding this document or any of the information contained herein. © Morgan Stanley and/or certain of its affiliates. All rights reserved. HIGHLY CONFIDENTIAL PROJECT LEAN 17