
Exhibit (c)(6) STRICTLY CONFIDENTIAL Project Discussion Materials for Lean the Special Committee May 17, 2024 Content must not go below this line

STRICTLY CONFIDENTIAL Table of contents 1. Situation overview 2 2. Overview of financial projections 6 3. Preliminary financial analysis summary 11 4. Appendices 19 A. Preliminary Discounted Cash Flow Analysis 20 B. Preliminary Selected Publicly Traded Companies Analysis 26 C. Preliminary Selected Precedent Transactions Analysis (for reference only) 33 D. Preliminary WACC Analysis 38 E. Context for evaluating the proposal 48 F. Other information 51 Content must not go below this line Confidential | 1

STRICTLY CONFIDENTIAL 1. Situation overview Content must not go below this line Confidential | 2
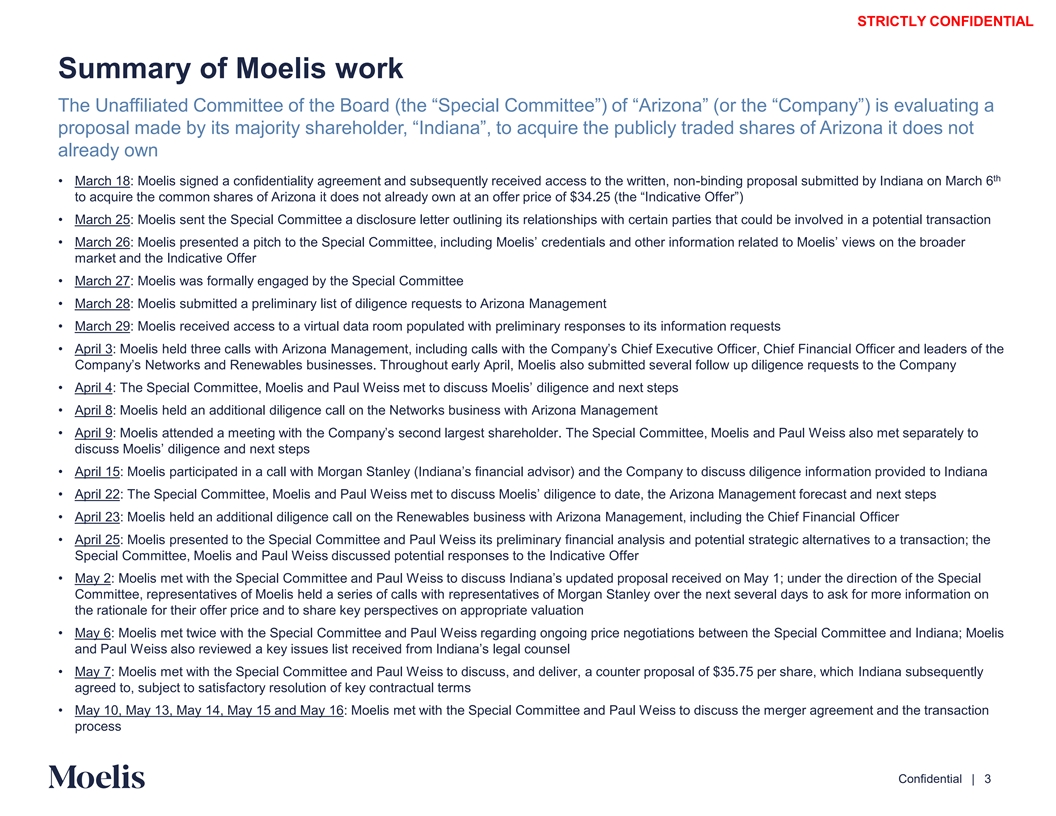
STRICTLY CONFIDENTIAL Summary of Moelis work The Unaffiliated Committee of the Board (the “Special Committee”) of “Arizona” (or the “Company”) is evaluating a proposal made by its majority shareholder, “Indiana”, to acquire the publicly traded shares of Arizona it does not already own th • March 18: Moelis signed a confidentiality agreement and subsequently received access to the written, non-binding proposal submitted by Indiana on March 6 to acquire the common shares of Arizona it does not already own at an offer price of $34.25 (the “Indicative Offer”) • March 25: Moelis sent the Special Committee a disclosure letter outlining its relationships with certain parties that could be involved in a potential transaction • March 26: Moelis presented a pitch to the Special Committee, including Moelis’ credentials and other information related t iewo M s on th oee lisbroade ’ v r market and the Indicative Offer • March 27: Moelis was formally engaged by the Special Committee • March 28: Moelis submitted a preliminary list of diligence requests to Arizona Management • March 29: Moelis received access to a virtual data room populated with preliminary responses to its information requests • April 3: Moelis held three calls with Arizona Management, including calls with the Company’s Chief Executive Officer, Chi l Ofef fic Fin er anan d cliea a ders of the Company’s Networks and Renewables businesses. Throughout early April, Moelis also submitted several follow up dilige stsnc to the e req Cue ompany • April 4: The Special Committee, Moelis and Paul Weiss met to discuss Moelis’ diligence and next steps • April 8: Moelis held an additional diligence call on the Networks business with Arizona Management • April 9: Moelis attended a meeting with the Company’s second largest shareholde . Trhe Special Committee, Moelis and Paul Weiss also met separately to discuss Moelis’ diligence and next steps • April 15: Moelis participated in a call with Morgan Stanley (Indiana’s financial advisor) and the Company to discuss di ati lige on nc pre oviinf ded orm to Indiana • April 22: The Special Committee, Moelis and Paul Weiss met to discuss Moelis’ diligence to date, the Arizona Managemen nex t fo t rse teca ps st and • April 23: Moelis held an additional diligence call on the Renewables business with Arizona Management, including the Chief Financial Officer • April 25: Moelis presented to the Special Committee and Paul Weiss its preliminary financial analysis and potential strategic alternatives to a transaction; the Special Committee, Moelis and Paul Weiss discussed potential responses to the Indicative Offer • May 2: Moelis met with the Special Committee and Paul Weiss to discuss Indiana’s updated proposal received on May ec 1; tion un de of rthe th Se pedi crial Committee, representatives of Moelis held a series of calls with representatives of Morgan Stanley over the next several days to ask for more information on the rationale for their offer price and to share key perspectives on appropriate valuation • May 6: Moelis met twice with the Special Committee and Paul Weiss regarding ongoing price negotiations between the Special Committee and Indiana; Moelis and Paul Weiss also reviewed a key issues list received from Indiana’s legal counsel • May 7: Moelis met with the Special Committee and Paul Weiss to discuss, and deliver, a counter proposal of $35.75 per share, which Indiana subsequently agreed to, subject to satisfactory resolution of key contractual terms • May 10, May 13, May 14, May 15 and May 16: Moelis met with the Special Committee and Paul Weiss to discuss the merger agreement and the transaction process Content must not go below this line Confidential | 3
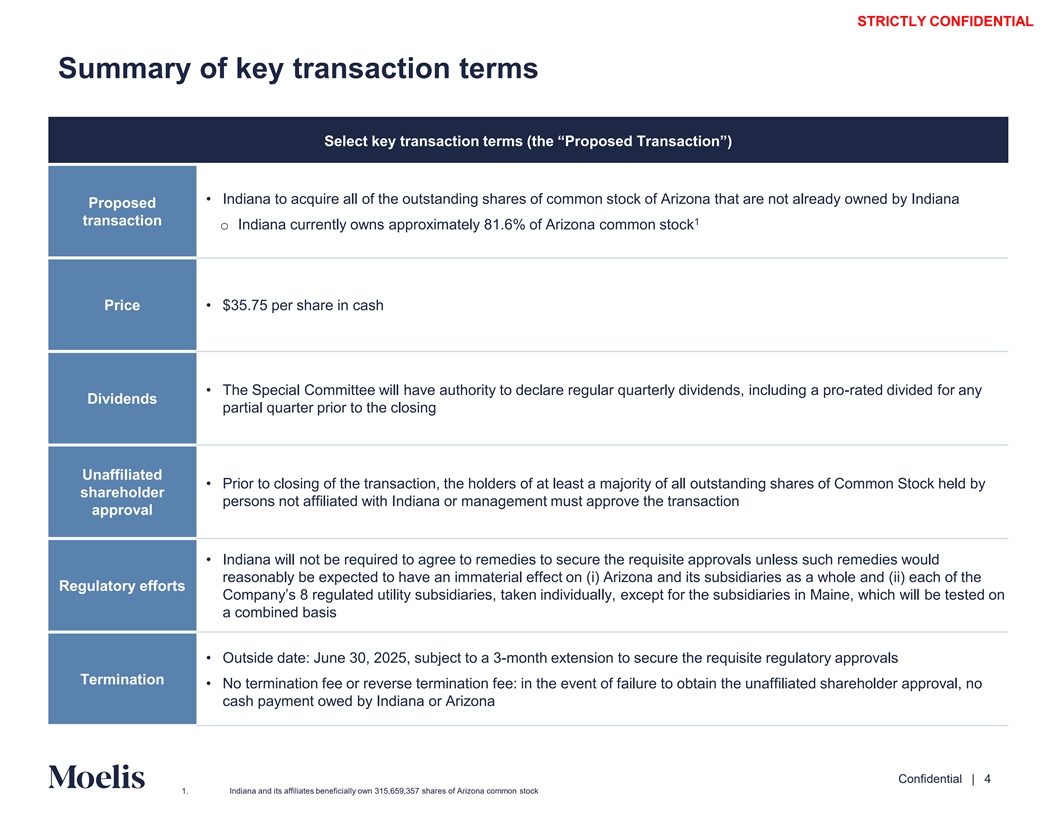
STRICTLY CONFIDENTIAL Summary of key transaction terms Select key transaction terms (the “Proposed Transaction”) • Indiana to acquire all of the outstanding shares of common stock of Arizona that are not already owned by Indiana Proposed transaction 1 o Indiana currently owns approximately 81.6% of Arizona common stock Price • $35.75 per share in cash • The Special Committee will have authority to declare regular quarterly dividends, including a pro-rated divided for any Dividends partial quarter prior to the closing Unaffiliated • Prior to closing of the transaction, the holders of at least a majority of all outstanding shares of Common Stock held by shareholder persons not affiliated with Indiana or management must approve the transaction approval • Indiana will not be required to agree to remedies to secure the requisite approvals unless such remedies would reasonably be expected to have an immaterial effect on (i) Arizona and its subsidiaries as a whole and (ii) each of the Regulatory efforts Company’s 8 regulated utility subsidiaries, taken individually, except for the subsidiaries in Maine, which will be tested on a combined basis • Outside date: June 30, 2025, subject to a 3-month extension to secure the requisite regulatory approvals Termination • No termination fee or reverse termination fee: in the event of failure to obtain the unaffiliated shareholder approval, no cash payment owed by Indiana or Arizona Content must not go below this line Confidential | 4 1. Indiana and its affiliates beneficially own 315,659,357 shares of Arizona common stock
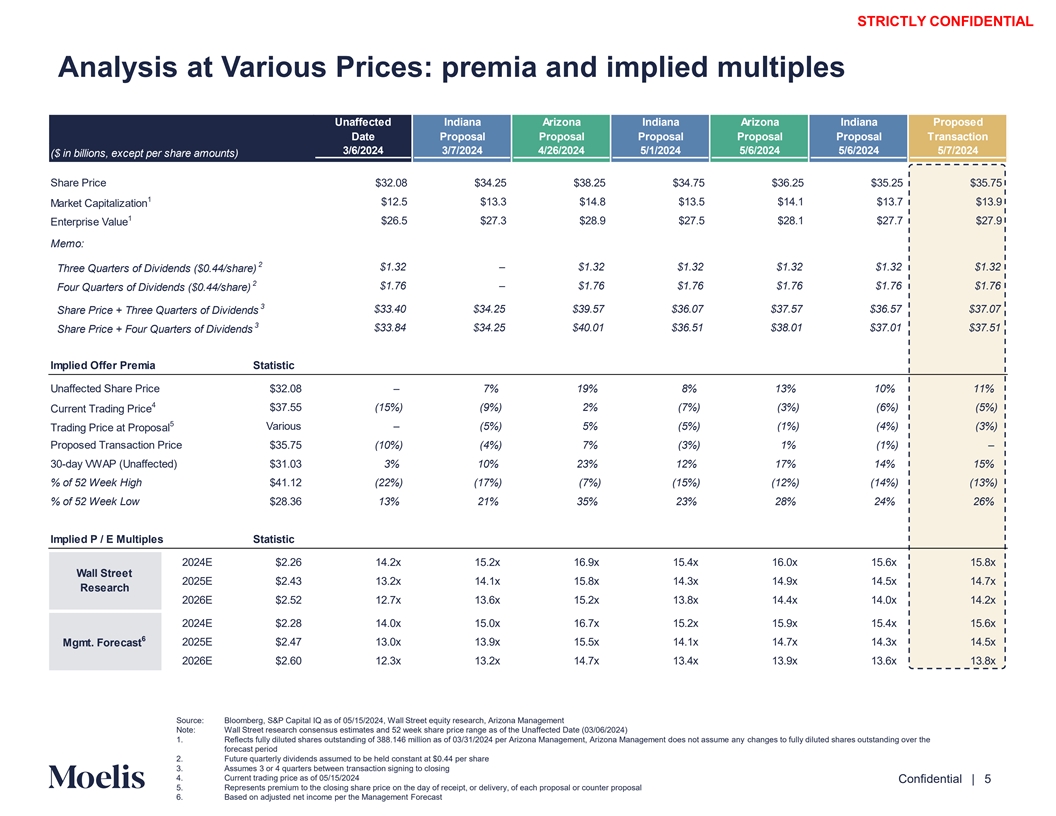
STRICTLY CONFIDENTIAL Analysis at Various Prices: premia and implied multiples Unaffected Indiana Arizona Indiana Arizona Indiana Proposed Date Proposal Proposal Proposal Proposal Proposal Transaction 3/6/2024 3/7/2024 4/26/2024 5/1/2024 5/6/2024 5/6/2024 5/7/2024 ($ in billions, except per share amounts) Share Price $32.08 $34.25 $38.25 $34.75 $36.25 $35.25 $35.75 1 $12.5 $13.3 $14.8 $13.5 $14.1 $13.7 $13.9 Market Capitalization 1 $26.5 $27.3 $28.9 $27.5 $28.1 $27.7 $27.9 Enterprise Value Memo: 2 $1.32 – $1.32 $1.32 $1.32 $1.32 $1.32 Three Quarters of Dividends ($0.44/share) 2 $1.76 – $1.76 $1.76 $1.76 $1.76 $1.76 Four Quarters of Dividends ($0.44/share) 3 $33.40 $34.25 $39.57 $36.07 $37.57 $36.57 $37.07 Share Price + Three Quarters of Dividends 3 $33.84 $34.25 $40.01 $36.51 $38.01 $37.01 $37.51 Share Price + Four Quarters of Dividends Implied Offer Premia Statistic Unaffected Share Price $32.08 – 7% 19% 8% 13% 10% 11% 4 $37.55 (15%) (9%) 2% (7%) (3%) (6%) (5%) Current Trading Price 5 Various – (5%) 5% (5%) (1%) (4%) (3%) Trading Price at Proposal Proposed Transaction Price $35.75 (10%) (4%) 7% (3%) 1% (1%) – 30-day VWAP (Unaffected) $31.03 3% 10% 23% 12% 17% 14% 15% % of 52 Week High $41.12 (22%) (17%) (7%) (15%) (12%) (14%) (13%) % of 52 Week Low $28.36 13% 21% 35% 23% 28% 24% 26% Implied P / E Multiples Statistic 2024E $2.26 14.2x 15.2x 16.9x 15.4x 16.0x 15.6x 15.8x Wall Street 2025E $2.43 13.2x 14.1x 15.8x 14.3x 14.9x 14.5x 14.7x Research 2026E $2.52 12.7x 13.6x 15.2x 13.8x 14.4x 14.0x 14.2x 2024E $2.28 14.0x 15.0x 16.7x 15.2x 15.9x 15.4x 15.6x 6 2025E $2.47 13.0x 13.9x 15.5x 14.1x 14.7x 14.3x 14.5x Mgmt. Forecast 2026E $2.60 12.3x 13.2x 14.7x 13.4x 13.9x 13.6x 13.8x Source: Bloomberg, S&P Capital IQ as of 05/15/2024, Wall Street equity research, Arizona Management Note: Wall Street research consensus estimates and 52 week share price range as of the Unaffected Date (03/06/2024) 1. Reflects fully diluted shares outstanding of 388.146 million as of 03/31/2024 per Arizona Management, Arizona Management does not assume any changes to fully diluted shares outstanding over the forecast period Content must not 2. Future quarterly dividends assumed to be held constant at $0.44 per share go below this line 3. Assumes 3 or 4 quarters between transaction signing to closing 4. Current trading price as of 05/15/2024 Confidential | 5 5. Represents premium to the closing share price on the day of receipt, or delivery, of each proposal or counter proposal 6. Based on adjusted net income per the Management Forecast
STRICTLY CONFIDENTIAL 2. Overview of financial projections Content must not go below this line Confidential | 6
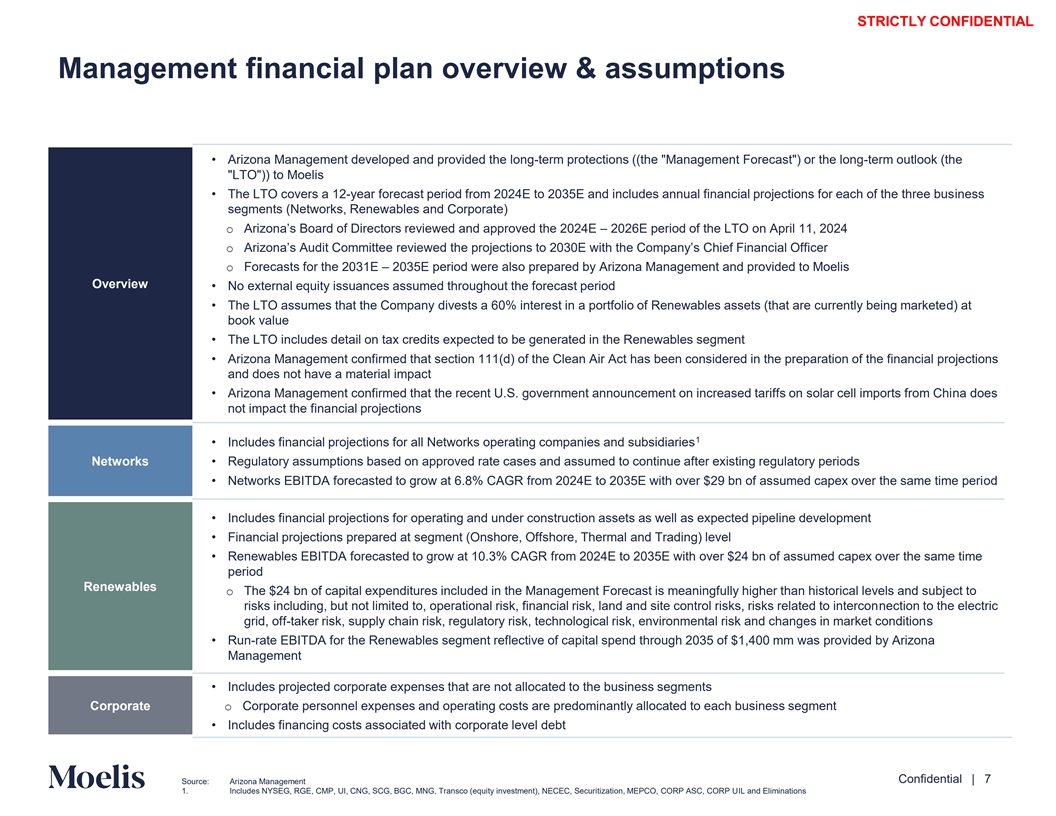
STRICTLY CONFIDENTIAL Management financial plan overview & assumptions • Arizona Management developed and provided the long-term protections ((the Management Forecast ) or the long-term outlook (the LTO )) to Moelis • The LTO covers a 12-year forecast period from 2024E to 2035E and includes annual financial projections for each of the three business segments (Networks, Renewables and Corporate) o Arizona’s Board of Directors reviewed and approved the 2024 – 2026 E E period of the LTO on April 11, 2024 o Arizona’s Audit Committee reviewed the projections to 2030E with the Company’s Chief Financial Officer o Forecasts for the 2031E – 2035E period were also prepared by Arizona Management and provided to Moelis Overview • No external equity issuances assumed throughout the forecast period • The LTO assumes that the Company divests a 60% interest in a portfolio of Renewables assets (that are currently being marketed) at book value • The LTO includes detail on tax credits expected to be generated in the Renewables segment • Arizona Management confirmed that section 111(d) of the Clean Air Act has been considered in the preparation of the financial projections and does not have a material impact • Arizona Management confirmed that the recent U.S. government announcement on increased tariffs on solar cell imports from China does not impact the financial projections 1 • Includes financial projections for all Networks operating companies and subsidiaries Networks • Regulatory assumptions based on approved rate cases and assumed to continue after existing regulatory periods • Networks EBITDA forecasted to grow at 6.8% CAGR from 2024E to 2035E with over $29 bn of assumed capex over the same time period • Includes financial projections for operating and under construction assets as well as expected pipeline development • Financial projections prepared at segment (Onshore, Offshore, Thermal and Trading) level • Renewables EBITDA forecasted to grow at 10.3% CAGR from 2024E to 2035E with over $24 bn of assumed capex over the same time period Renewables o The $24 bn of capital expenditures included in the Management Forecast is meaningfully higher than historical levels and subject to risks including, but not limited to, operational risk, financial risk, land and site control risks, risks related to interconnection to the electric grid, off-taker risk, supply chain risk, regulatory risk, technological risk, environmental risk and changes in market conditions • Run-rate EBITDA for the Renewables segment reflective of capital spend through 2035 of $1,400 mm was provided by Arizona Management • Includes projected corporate expenses that are not allocated to the business segments Corporate o Corporate personnel expenses and operating costs are predominantly allocated to each business segment • Includes financing costs associated with corporate level debt Content must not go below this line Confidential | 7 Source: Arizona Management 1. Includes NYSEG, RGE, CMP, UI, CNG, SCG, BGC, MNG, Transco (equity investment), NECEC, Securitization, MEPCO, CORP ASC, CORP UIL and Eliminations
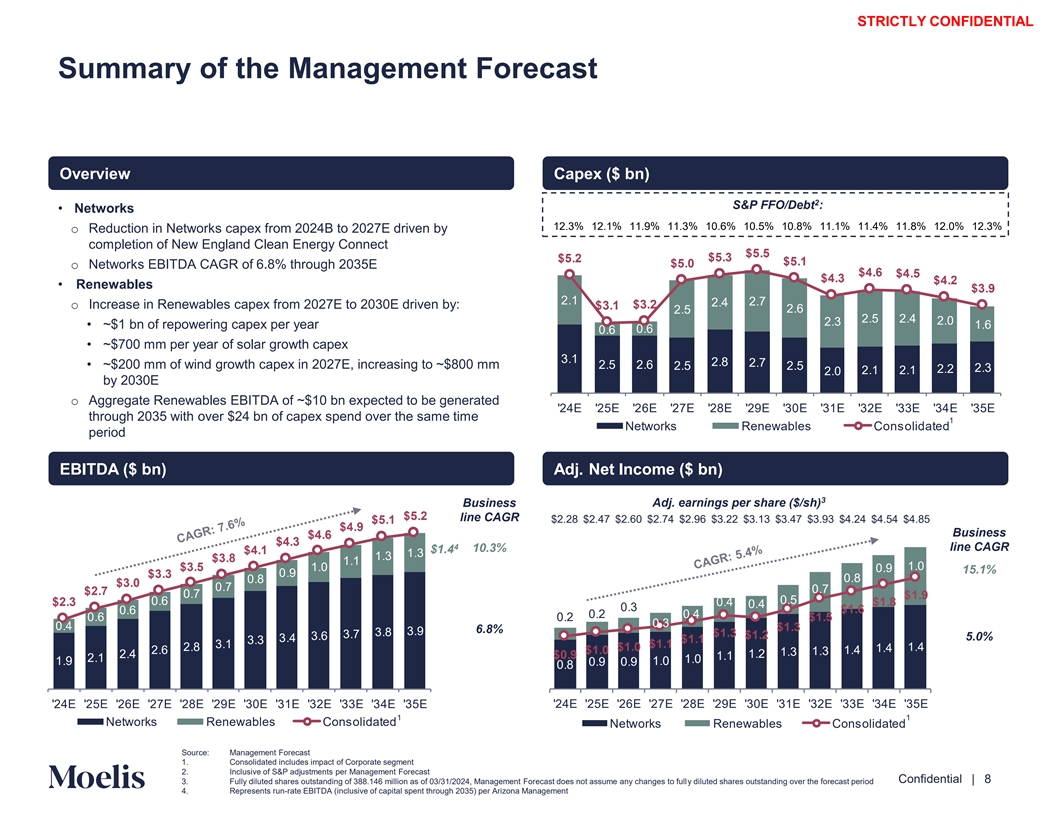
STRICTLY CONFIDENTIAL Summary of the Management Forecast Overview Capex ($ bn) 2 S&P FFO/Debt : • Networks 12.3% 12.1% 11.9% 11.3% 10.6% 10.5% 10.8% 11.1% 11.4% 11.8% 12.0% 12.3% o Reduction in Networks capex from 2024B to 2027E driven by completion of New England Clean Energy Connect o Networks EBITDA CAGR of 6.8% through 2035E • Renewables 2.1 2. 2.4 o Increase in Renewables capex from 2027E to 2030E driven by: 2.5 2. 2.5 2.4 2.0 2.3 • ~$1 bn of repowering capex per year 1. 0. 0. • ~$700 mm per year of solar growth capex 3.1 2.8 2. • ~$200 mm of wind growth capex in 2027E, increasing to ~$800 mm 2.5 2. 2.5 2.5 2.3 2.2 2.1 2.1 2.0 by 2030E o Aggregate Renewables EBITDA of ~$10 bn expected to be generated 24E 25E 2 E 2 E 28E 2 E 30E 31E 32E 33E 34E 35E through 2035 with over $24 bn of capex spend over the same time 1 Networks Renewables Consolidated period EBITDA ($ bn) Adj. Net Income ($ bn) 3 Business Adj. earnings per share ($/sh) line CAGR $2.28 $2.47 $2.60 $2.74 $2.96 $3.22 $3.13 $3.47 $3.93 $4.24 $4.54 $4.85 Business 4 line CAGR 10.3% $1.4 1.3 1.3 1.1 1.0 1.0 0. 15.1% 0. 0.8 0.8 0. 0. 0. 0.5 0. 0.4 0.4 0.3 0. 0.2 0.4 0. 0.2 0.3 0.4 6.8% 3.8 3. 3. 3. 5.0% 3.4 3.3 3.1 2.8 1.4 1.4 2. 1.3 1.4 1.3 2.4 1.2 1.1 2.1 1.0 1. 1.0 0. 0. 0.8 24E 25E 2 E 2 E 28E 2 E 30E 31E 32E 33E 34E 35E 24E 25E 2 E 2 E 28E 2 E 30E 31E 32E 33E 34E 35E 1 1 Networks Renewables Consolidated Networks Renewables Consolidated Content must not Source: Management Forecast 1. Consolidated includes impact of Corporate segment go below this line 2. Inclusive of S&P adjustments per Management Forecast Confidential | 8 3. Fully diluted shares outstanding of 388.146 million as of 03/31/2024, Management Forecast does not assume any changes to fully diluted shares outstanding over the forecast period 4. Represents run-rate EBITDA (inclusive of capital spent through 2035) per Arizona Management

STRICTLY CONFIDENTIAL Renewables Revenue by Type Revenue ($ mm) $2, 4 $2,558 $2,353 $2,1 0 $2,031 $1,8 5 $1, $1, 14 $1, 2 $1, 21 $1,5 3 $1,308 24E 25E 2 E 2 E 28E 2 E 30E 31E 32E 33E 34E 35E Onshore Wind Repowering Offshore Wind Onshore Solar Thermal ( lamath) Power Trading '24E '25E '26E '27E '28E '29E '30E '31E '32E '33E '34E '35E Onshore Wind $973 $945 $954 $1,005 $980 $944 $981 $1,044 $1,121 $1,178 $1,258 $1,425 Onshore Solar $58 $101 $102 $114 $161 $202 $247 $298 $344 $394 $443 $495 Repowering – ($4) ($1) ($4) $72 $135 $147 $190 $213 $262 $329 $311 Thermal (Klamath) $181 $171 $155 $138 $121 $115 $113 $114 $117 $117 $117 – Power Trading $96 $96 $106 $96 $96 $96 $96 $96 $96 $96 $96 $96 Offshore Wind – $264 $306 $280 $283 $286 $282 $289 $298 $306 $314 $323 Total $1,308 $1,573 $1,621 $1,629 $1,714 $1,777 $1,865 $2,031 $2,190 $2,353 $2,558 $2,649 1 Content must not go below this line Confidential | 9 Source: Management Forecast

STRICTLY CONFIDENTIAL Renewables Capex by Type Capex ($ mm) $2, 1 $2, 25 $2,52 $2,513 $2,431 $2,402 $2,32 $2,130 $2,030 $1, 0 $5 $5 1 24E 25E 2 E 2 E 28E 2 E 30E 31E 32E 33E 34E 35E Other Solar ( rowth) Wind ( rowth) Offshore Repowering Existing Onshore( Wind Solar) 1 '24E '25E '26E '27E '28E '29E '30E '31E '32E '33E '34E '35E Existing Onshore (Wind + Solar) $194 $95 $90 $87 $84 $114 $83 $121 $100 $252 $244 $90 Repowering $52 $198 $181 $1,295 $1,059 $1,081 $791 $421 $618 $355 – – Offshore $1,600 $119 $77 $77 $77 $77 $77 $77 $77 $77 $77 $77 Wind (Growth) $50 $79 $133 $196 $525 $719 $839 $839 $839 $839 $839 $629 Solar (Growth) $118 $12 – $759 $575 $607 $709 $709 $709 $709 $709 $638 1 Other $117 $94 $110 $115 $110 $118 $127 $159 $169 $170 $161 $172 Total $2,130 $596 $591 $2,529 $2,431 $2,716 $2,625 $2,327 $2,513 $2,402 $2,030 $1,607 Existing Onshore (Wind + Solar) 9% 16% 15% 3% 3% 4% 3% 5% 4% 10% 12% 6% Repowering 2% 33% 31% 51% 44% 40% 30% 18% 25% 15% – – Offshore 75% 20% 13% 3% 3% 3% 3% 3% 3% 3% 4% 5% Wind (Growth) 2% 13% 22% 8% 22% 26% 32% 36% 33% 35% 41% 39% Solar (Growth) 6% 2% – 30% 24% 22% 27% 30% 28% 30% 35% 40% 1 Other 6% 16% 19% 5% 5% 4% 5% 7% 7% 7% 8% 11% Total 100% 100% 100% 100% 100% 100% 100% 100% 100% 100% 100% 100% Content must not go below this line Confidential | 10 Source: Management Forecast 1. Other includes Capitalized Labor, Thermal, Power Trading and Corporate
STRICTLY CONFIDENTIAL 3. Preliminary financial analysis summary Content must not go below this line Confidential | 11
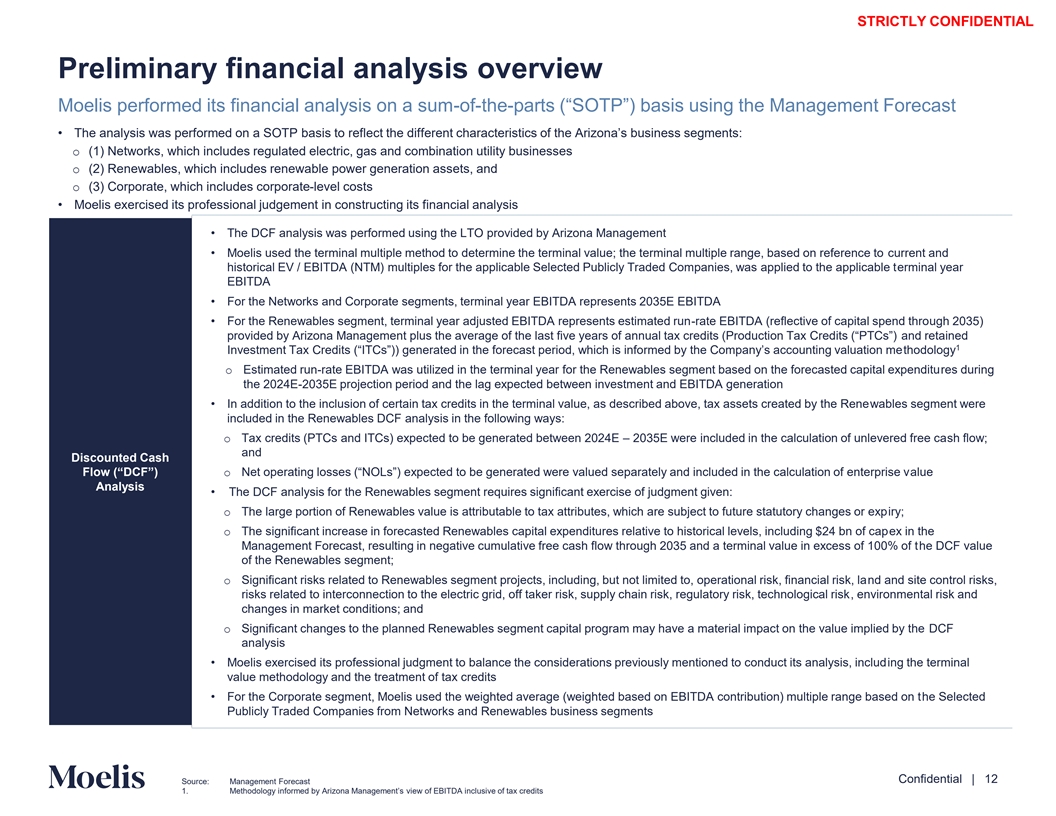
STRICTLY CONFIDENTIAL Preliminary financial analysis overview Moelis performed its financial analysis on a sum-of-the-parts (“SOTP”) basis using the Management Forecast • The analysis was performed on a SOTP basis to reflect the different characteristics of the Arizona’s business segments: o (1) Networks, which includes regulated electric, gas and combination utility businesses o (2) Renewables, which includes renewable power generation assets, and o (3) Corporate, which includes corporate-level costs • Moelis exercised its professional judgement in constructing its financial analysis • The DCF analysis was performed using the LTO provided by Arizona Management • Moelis used the terminal multiple method to determine the terminal value; the terminal multiple range, based on reference to current and historical EV / EBITDA (NTM) multiples for the applicable Selected Publicly Traded Companies, was applied to the applicable terminal year EBITDA • For the Networks and Corporate segments, terminal year EBITDA represents 2035E EBITDA • For the Renewables segment, terminal year adjusted EBITDA represents estimated run-rate EBITDA (reflective of capital spend through 2035) provided by Arizona Management plus the average of the last five years of annual tax credits (Production Tax Cred andi ts re ta(“PT inedCs ”) 1 Investment Tax Credits (“ITCs”)) generated in the forecast period, which is informed by the Company’s accounting thvoadology luation me o Estimated run-rate EBITDA was utilized in the terminal year for the Renewables segment based on the forecasted capital expenditures during the 2024E-2035E projection period and the lag expected between investment and EBITDA generation • In addition to the inclusion of certain tax credits in the terminal value, as described above, tax assets created by the Renewables segment were included in the Renewables DCF analysis in the following ways: o Tax credits (PTCs and ITCs) expected to be generated between 2024E – 2035E were included in the calculation of unlevered free cash flow; and Discounted Cash Flow (“DCF”) o Net operating losses (“NOLs”) expected to be generated were valued separately and included in the calculation o alu f e e nterprise v Analysis • The DCF analysis for the Renewables segment requires significant exercise of judgment given: o The large portion of Renewables value is attributable to tax attributes, which are subject to future statutory changes or expiry; o The significant increase in forecasted Renewables capital expenditures relative to historical levels, including $24 bn of capex in the Management Forecast, resulting in negative cumulative free cash flow through 2035 and a terminal value in excess of 100% of the DCF value of the Renewables segment; o Significant risks related to Renewables segment projects, including, but not limited to, operational risk, financial risk, land and site control risks, risks related to interconnection to the electric grid, off taker risk, supply chain risk, regulatory risk, technological risk, environmental risk and changes in market conditions; and o Significant changes to the planned Renewables segment capital program may have a material impact on the value implied by the DCF analysis • Moelis exercised its professional judgment to balance the considerations previously mentioned to conduct its analysis, including the terminal value methodology and the treatment of tax credits • For the Corporate segment, Moelis used the weighted average (weighted based on EBITDA contribution) multiple range based on the Selected Publicly Traded Companies from Networks and Renewables business segments Content must not go below this line Confidential | 12 Source: Management Forecast 1. Methodology informed by Arizona Management’s view of EBITDA inclusive of tax credits

STRICTLY CONFIDENTIAL Preliminary financial analysis overview (cont’d) Moelis performed its financial analysis on a sum-of-the-parts (“SOTP”) basis using the Management Forecast • Moelis reviewed and analyzed certain financial information and market trading data related to companies whose operations Moelis believed to be generally relevant for the Arizona business segments for purposes of this analysis • For the Networks businesses, Selected Publicly Traded Companies focused on both P / E multiples and EV / EBITDA multiples based on Wall Street consensus estimates for 2024E and 2025E earnings per share and EBITDA, respectively • For the Renewables business, Selected Publicly Traded Companies focused on EV / EBITDA multiples based on Wall Street consensus estimates for 2024E and 2025E EBITDA Selected Publicly Traded Companies • Tax credits (PTCs and retained ITCs) generated by the Renewables segment were added to each respective year’s EBITDA before Analysis 1 applying the applicable EV / EBITDA multiple o This approach, in Moelis’ professional judgement, appropriately reflected the value uplift provided to the Renewab les from s egment expected tax credits (PTCs and retained ITCs) • For reference only: An illustrative analysis was also performed on a consolidated basis, though Moelis did not rely upon it for purposes of its financial analysis due to the lack of comparability of the Selected Publicly Traded Companies with a business mix similar to Arizona • Moelis reviewed and analyzed, but did not rely on, selected precedent merger and acquisition transactions for the last ten years involving companies whose operations Moelis believes to be generally relevant for each of Arizona’s business segments • Moelis did not view the selected precedents transactions analysis as relevant because: Selected Precedent Transactions o Many of the selected precedent transactions were completed in materially different market and interest rate environments Analysis o As Indiana already controls Arizona, there is not a change of control in a potential transaction o Due to a lack of comparability of the business mix and profile between the Selected Precedent Transaction target company and Arizona Content must not go below this line Confidential | 13 Source: Management Forecast 1. Methodology informed by Arizona Management’s view of EBITDA inclusive of tax credits For Reference Only
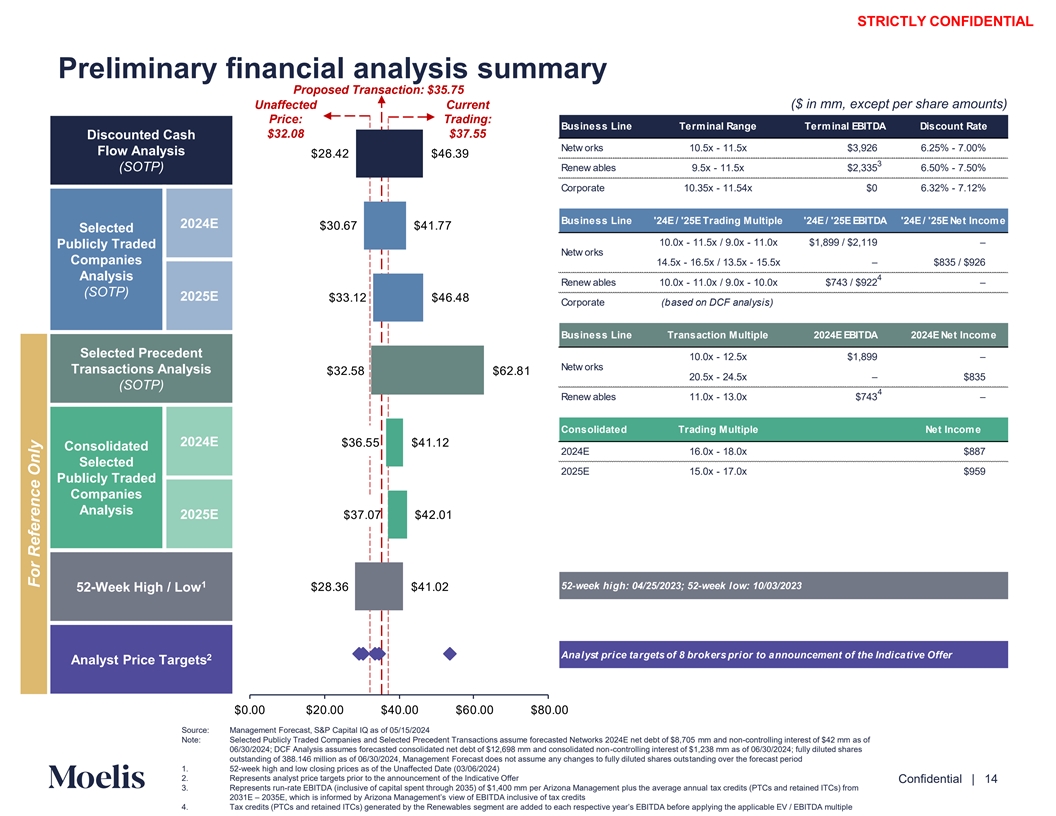
STRICTLY CONFIDENTIAL Preliminary financial analysis summary Proposed Transaction: $35.75 ($ in mm, except per share amounts) Unaffected Current Price: Trading: Business Line Terminal Range Terminal EBITDA Discount Rate $32.08 $37.55 Discounted Cash Netw orks 10.5x - 11.5x $3,926 6.25% - 7.00% Flow Analysis $28.42 $4 ..3 3 (SOTP) Renew ables 9.5x - 11.5x $2,335 6.50% - 7.50% Corporate 10.35x - 11.54x $0 6.32% - 7.12% Business Line '24E / '25E Trading Multiple '24E / '25E EBITDA '24E / '25E Net Income 2024E $30. $41. Selected 10.0x - 11.5x / 9.0x - 11.0x $1,899 / $2,119 – Publicly Traded Netw orks Companies 14.5x - 16.5x / 13.5x - 15.5x – $835 / $926 Analysis 4 Renew ables 10.0x - 11.0x / 9.0x - 10.0x $743 / $922 – (SOTP) 2025E $33.12 $4 .48 Corporate (based on DCF analysis) Business Line Transaction Multiple 2024E EBITDA 2024E Net Income Selected Precedent 10.0x - 12.5x $1,899 – Netw orks Transactions Analysis $32.58 $ 2.81 20.5x - 24.5x – $835 (SOTP) 4 Renew ables 11.0x - 13.0x $743 – Consolidated Trading Multiple Net Income 2024E $3 .55 $41.12 Consolidated 2024E 16.0x - 18.0x $887 Selected 2025E 15.0x - 17.0x $959 Publicly Traded Companies Analysis 2025E $3 .0 $42.01 1 52-week high: 04/25/2023; 52-week low: 10/03/2023 $28.3 $41.02 52-Week High / Low Analyst price targets of 8 brokers prior to announcement of the Indicative Offer 2 Analyst Price Targets $0.00 $20.00 $40.00 $ 0.00 $80.00 Source: Management Forecast, S&P Capital IQ as of 05/15/2024 Note: Selected Publicly Traded Companies and Selected Precedent Transactions assume forecasted Networks 2024E net debt of $8,705 mm and non-controlling interest of $42 mm as of 06/30/2024; DCF Analysis assumes forecasted consolidated net debt of $12,698 mm and consolidated non-controlling interest of $1,238 mm as of 06/30/2024; fully diluted shares Content must not outstanding of 388.146 million as of 06/30/2024, Management Forecast does not assume any changes to fully diluted shares outstanding over the forecast period go below this line 1. 52-week high and low closing prices as of the Unaffected Date (03/06/2024) 2. Represents analyst price targets prior to the announcement of the Indicative Offer Confidential | 14 3. Represents run-rate EBITDA (inclusive of capital spent through 2035) of $1,400 mm per Arizona Management plus the average annual tax credits (PTCs and retained ITCs) from 2031E – 2035E, which is informed by Arizona Management’s view of EBITDA inclusive of tax credits 4. Tax credits (PTCs and retained ITCs) generated by the Renewables segment are added to each respective year’s EBIT plD yiA ng be thefor ape a plicabl p e EV / EBITDA multiple For Reference Only
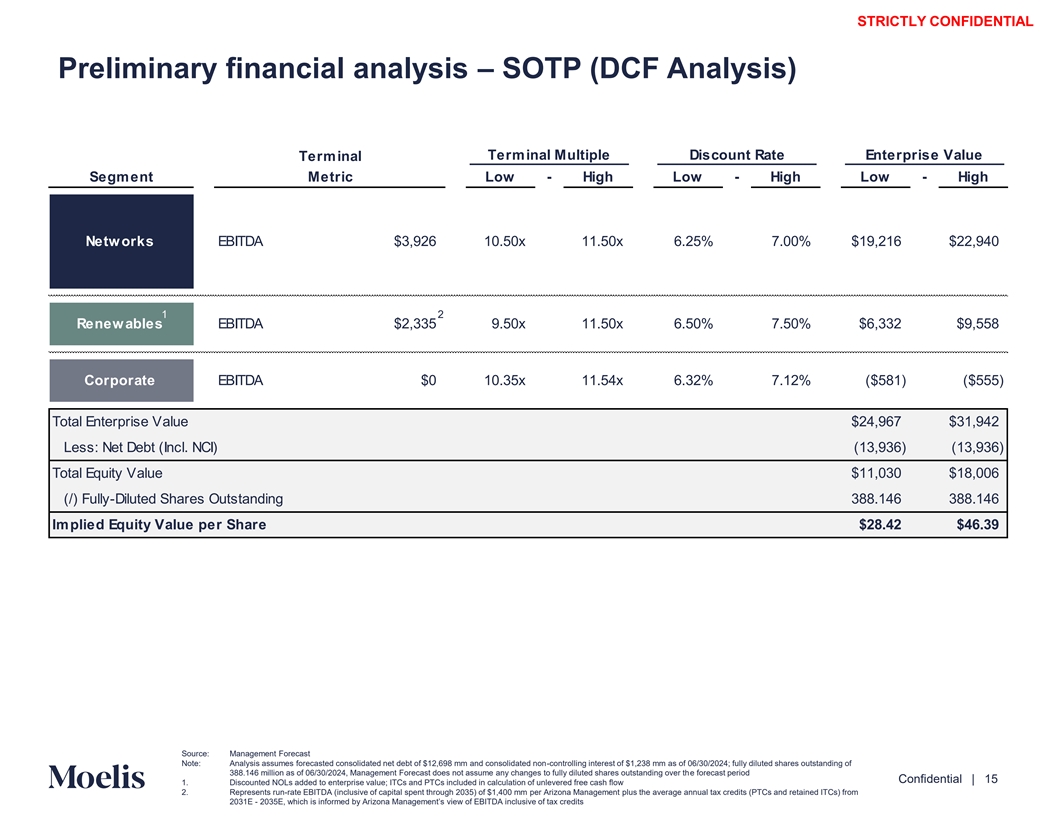
STRICTLY CONFIDENTIAL Preliminary financial analysis – SOTP (DCF Analysis) Terminal Multiple Discount Rate Enterprise Value Terminal Segment Metric Low - High Low - High Low - High Networks EBITDA $3,926 10.50x 11.50x 6.25% 7.00% $19,216 $22,940 1 2 Renewables EBITDA $2,335 9.50x 11.50x 6.50% 7.50% $6,332 $9,558 Corporate EBITDA $0 10.35x 11.54x 6.32% 7.12% ($581) ($555) Total Enterprise Value $24,967 $31,942 Less: Net Debt (Incl. NCI) (13,936) (13,936) Total Equity Value $11,030 $18,006 (/) Fully-Diluted Shares Outstanding 388.146 388.146 Implied Equity Value per Share $28.42 $46.39 Content must not Source: Management Forecast Note: Analysis assumes forecasted consolidated net debt of $12,698 mm and consolidated non-controlling interest of $1,238 mm as of 06/30/2024; fully diluted shares outstanding of go below this line 388.146 million as of 06/30/2024, Management Forecast does not assume any changes to fully diluted shares outstanding over the forecast period Confidential | 15 1. Discounted NOLs added to enterprise value; ITCs and PTCs included in calculation of unlevered free cash flow 2. Represents run-rate EBITDA (inclusive of capital spent through 2035) of $1,400 mm per Arizona Management plus the average annual tax credits (PTCs and retained ITCs) from 2031E - 2035E, which is informed by Arizona Management’s view of EBITDA inclusive of tax credits
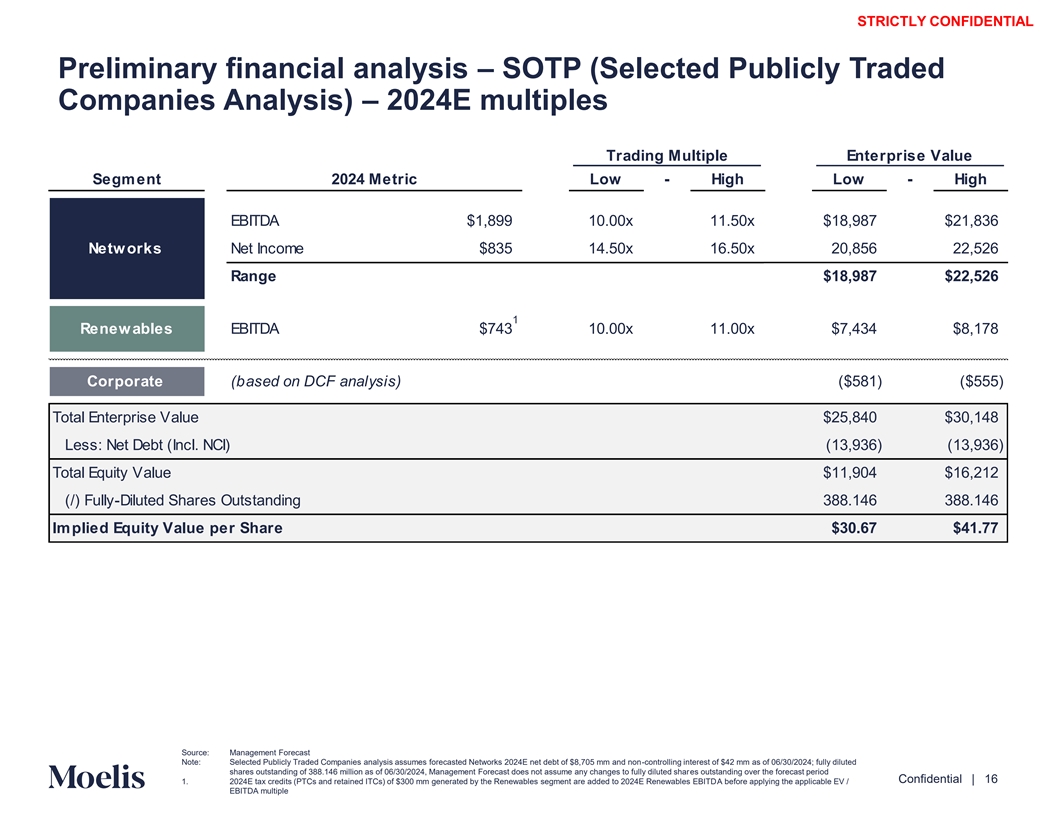
STRICTLY CONFIDENTIAL Preliminary financial analysis – SOTP (Selected Publicly Traded Companies Analysis) – 2024E multiples Trading Multiple Enterprise Value Segment 2024 Metric Low - High Low - High EBITDA $1,899 10.00x 11.50x $18,987 $21,836 Networks Net Income $835 14.50x 16.50x 20,856 22,526 Range $18,987 $22,526 1 Renewables EBITDA $743 10.00x 11.00x $7,434 $8,178 Corporate (based on DCF analysis) ($581) ($555) Total Enterprise Value $25,840 $30,148 Less: Net Debt (Incl. NCI) (13,936) (13,936) Total Equity Value $11,904 $16,212 (/) Fully-Diluted Shares Outstanding 388.146 388.146 Implied Equity Value per Share $30.67 $41.77 Content must not Source: Management Forecast Note: Selected Publicly Traded Companies analysis assumes forecasted Networks 2024E net debt of $8,705 mm and non-controlling interest of $42 mm as of 06/30/2024; fully diluted go below this line shares outstanding of 388.146 million as of 06/30/2024, Management Forecast does not assume any changes to fully diluted shares outstanding over the forecast period Confidential | 16 1. 2024E tax credits (PTCs and retained ITCs) of $300 mm generated by the Renewables segment are added to 2024E Renewables EBITDA before applying the applicable EV / EBITDA multiple

STRICTLY CONFIDENTIAL Preliminary financial analysis – SOTP (Selected Publicly Traded Companies Analysis) – 2025E multiples Trading Multiple Enterprise Value Segment 2025 Metric Low - High Low - High EBITDA $2,119 9.00x 11.00x $19,073 $23,311 Networks Net Income $926 13.50x 15.50x 21,251 23,103 Range $19,073 $23,311 1 Renewables EBITDA $922 9.00x 10.00x $8,300 $9,222 Corporate (based on DCF analysis) ($581) ($555) Total Enterprise Value $26,791 $31,978 Less: Net Debt (Incl. NCI) (13,936) (13,936) Total Equity Value $12,855 $18,041 (/) Fully-Diluted Shares Outstanding 388.146 388.146 Implied Equity Value per Share $33.12 $46.48 Content must not Source: Management Forecast Note: Selected Publicly Traded Companies analysis assumes forecasted Networks 2024E net debt of $8,705 mm and non-controlling interest of $42 mm as of 06/30/2024; fully diluted go below this line shares outstanding of 388.146 million as of 06/30/2024, Management Forecast does not assume any changes to fully diluted shares outstanding over the forecast period Confidential | 17 1. 2025E tax credits (PTCs and retained ITCs) of $319 mm generated by the Renewables segment are added to 2025E Renewables EBITDA before applying the applicable EV / EBITDA multiple

STRICTLY CONFIDENTIAL Preliminary financial analysis – SOTP (Selected Precedent Transactions Analysis) (for reference only) Transaction Multiple Enterprise Value Segment 2024 Metric Low - High Low - High EBITDA $1,899 10.00x 12.50x $18,987 $23,734 Networks Net Income $835 20.50x 24.50x 25,867 29,207 Range $18,987 $29,207 1 Renewables EBITDA $743 11.00x 13.00x $8,178 $9,664 Corporate (based on DCF analysis) ($581) ($555) Total Enterprise Value $26,584 $38,316 Less: Net Debt (Incl. NCI) (13,936) (13,936) Total Equity Value $12,647 $24,380 (/) Fully-Diluted Shares Outstanding 388.146 388.146 Implied Equity Value per Share $32.58 $62.81 Content must not Source: Management Forecast Note: Selected Precedent Transactions analysis assumes forecasted Networks 2024E net debt of $8,705 mm and non-controlling interest of $42 mm as of 06/30/2024; fully diluted shares go below this line outstanding of 388.146 million as of 06/30/2024, Management Forecast does not assume any changes to fully diluted shares outstanding over the forecast period Confidential | 18 1. 2024E tax credits (PTCs and retained ITCs) of $300 mm generated by the Renewables segment are added to 2024E Renewables EBITDA before applying the applicable EV / EBITDA multiple

STRICTLY CONFIDENTIAL 4. Appendices Content must not go below this line Confidential | 19
STRICTLY CONFIDENTIAL A. Preliminary Discounted Cash Flow Analysis Content must not go below this line Confidential | 20

STRICTLY CONFIDENTIAL DCF Analysis – methodology & assumptions (additional detail) DCF analysis reflects implied Arizona value range based on estimated present value of unlevered after-tax free cash flows provided by Arizona business segments and the estimated present value of the terminal value of each business segment • Based on the Management Forecast • Based on unlevered after-tax free cash flows from June 30, 2024 to December 31, 2035; values were discounted to June 30, 2024 using the mid-year discounting convention • Utilizes 26.5% tax rate on all segments, provided by Arizona Management • Assumes debt and cash as of 06/30/2024 • Business segment Weighted Average Cost of Capital (“WACC”) assumptions outlined in the table below • Tax credits that Arizona is forecasted to generate were included in the Renewables DCF analysis: Projections o Generated PTCs and ITCs were included in the calculation of unlevered free cash flow; NOLs were valued separately, discounted to 06/30/2024 using the same discount rate range derived from the Networks business WACC analysis and included in the calculation of Renewables enterprise value o NOL tax credits are estimated as the Renewables segment’s negative EBIT (as presented in the DCF analysis), andto a bre e ue sx ep de cted immediately to offset taxes owed on income generated by the Networks business o Because the income that the NOL tax credits are offsetting is generated at the Networks business, Moelis used the Networks segment discount rate to calculate the value of the NOL tax credits • Terminal EBITDA represents 2035E EBITDA for the Networks and Corporate segments • For the Renewables segment, terminal year adjusted EBITDA represents estimated run-rate EBITDA (reflective of capital spend through 2035) provided by Arizona Management plus the average of the last five years of annual tax credits (PTCs and retained ITCs) generated in the forecast 1 period, which is informed by the Company’s accounting valuation methodology Terminal Value • Assumes the following items held constant from 2035E: 1) change in net working capital, 2) change in deferred tax liabilities, 3) depreciation & amortization and 4) tax rate for Consolidated and each business line • Assumes capital expenditure equal to 120% of depreciation & amortization in terminal year for the Renewables segment • Terminal EV / EBITDA multiple range based on reference to current and historical EV / NTM EBITDA multiples for the applicable Selected Publicly Traded Companies with no emphasis on any one multiple Projections Terminal Value Discount Rate EBITDA Terminal Value as a Implied Perpetuity Range Multiple Range % of Enterprise Value Growth Rate Segment Low - High Low - High Low - High Low - High Networks 6.25% 7.00% 10.5x 11.5x 97.8% 98.7% 1.5% 2.6% Renewables 6.50% 7.50% 9.5x 11.5x 140.1% 159.0% 2.3% 4.0% Corporate 6.32% 7.12% 10.3x 11.5x NM NM NM NM Content must not go below this line Confidential | 21 Source: Management Forecast 1. Methodology informed by Arizona Management’s view of EBITDA inclusive of tax credits SOTP
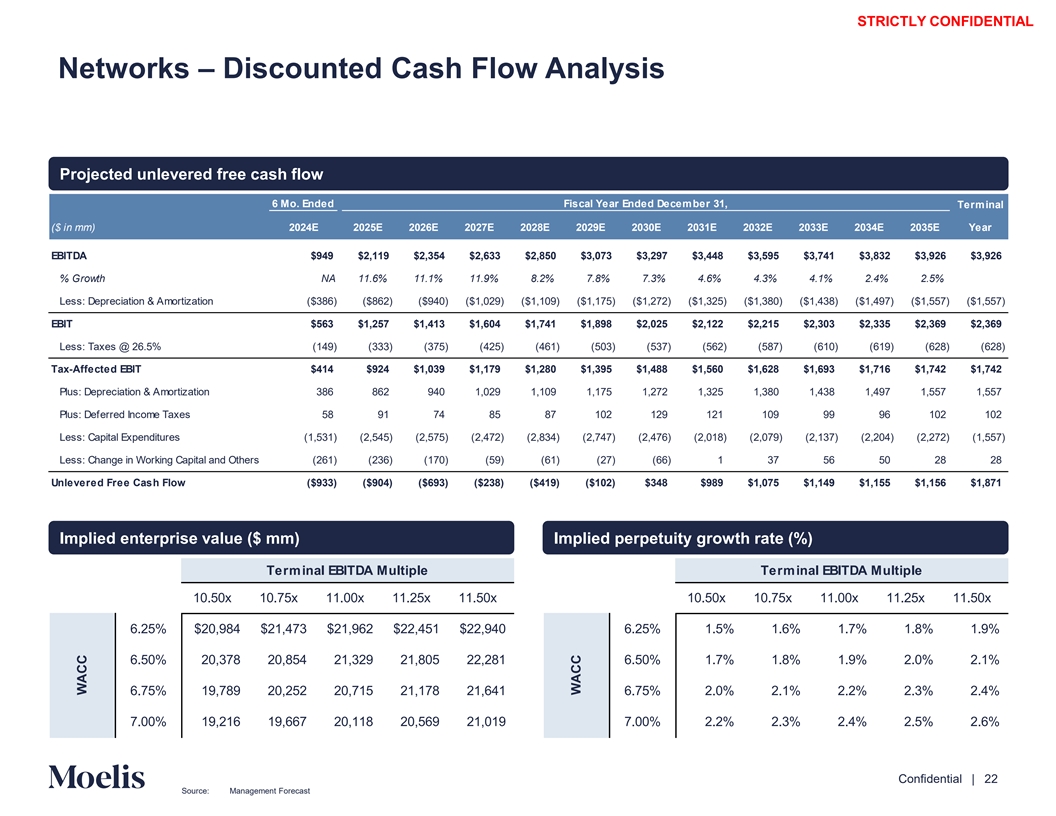
STRICTLY CONFIDENTIAL Networks – Discounted Cash Flow Analysis Projected unlevered free cash flow 6 Mo. Ended Fiscal Year Ended December 31, Terminal ($ in mm) 2024E 2025E 2026E 2027E 2028E 2029E 2030E 2031E 2032E 2033E 2034E 2035E Year EBITDA $949 $2,119 $2,354 $2,633 $2,850 $3,073 $3,297 $3,448 $3,595 $3,741 $3,832 $3,926 $3,926 % Growth NA 11.6% 11.1% 11.9% 8.2% 7.8% 7.3% 4.6% 4.3% 4.1% 2.4% 2.5% Less: Depreciation & Amortization ($386) ($862) ($940) ($1,029) ($1,109) ($1,175) ($1,272) ($1,325) ($1,380) ($1,438) ($1,497) ($1,557) ($1,557) EBIT $563 $1,257 $1,413 $1,604 $1,741 $1,898 $2,025 $2,122 $2,215 $2,303 $2,335 $2,369 $2,369 Less: Taxes @ 26.5% (149) (333) (375) (425) (461) (503) (537) (562) (587) (610) (619) (628) (628) Tax-Affected EBIT $414 $924 $1,039 $1,179 $1,280 $1,395 $1,488 $1,560 $1,628 $1,693 $1,716 $1,742 $1,742 Plus: Depreciation & Amortization 386 862 940 1,029 1,109 1,175 1,272 1,325 1,380 1,438 1,497 1,557 1,557 Plus: Deferred Income Taxes 58 91 74 85 87 102 129 121 109 99 96 102 102 Less: Capital Expenditures (1,531) (2,545) (2,575) (2,472) (2,834) (2,747) (2,476) (2,018) (2,079) (2,137) (2,204) (2,272) (1,557) Less: Change in Working Capital and Others (261) (236) (170) (59) (61) (27) (66) 1 37 56 50 28 28 Unlevered Free Cash Flow ($933) ($904) ($693) ($238) ($419) ($102) $348 $989 $1,075 $1,149 $1,155 $1,156 $1,871 Implied enterprise value ($ mm) Implied perpetuity growth rate (%) Terminal EBITDA Multiple Terminal EBITDA Multiple 10.50x 10.75x 11.00x 11.25x 11.50x 10.50x 10.75x 11.00x 11.25x 11.50x 6.25% $20,984 $21,473 $21,962 $22,451 $22,940 6.25% 1.5% 1.6% 1.7% 1.8% 1.9% 6.50% 20,378 20,854 21,329 21,805 22,281 6.50% 1.7% 1.8% 1.9% 2.0% 2.1% 6.75% 19,789 20,252 20,715 21,178 21,641 6.75% 2.0% 2.1% 2.2% 2.3% 2.4% 7.00% 19,216 19,667 20,118 20,569 21,019 7.00% 2.2% 2.3% 2.4% 2.5% 2.6% Content must not go below this line Confidential | 22 Source: Management Forecast WACC WACC
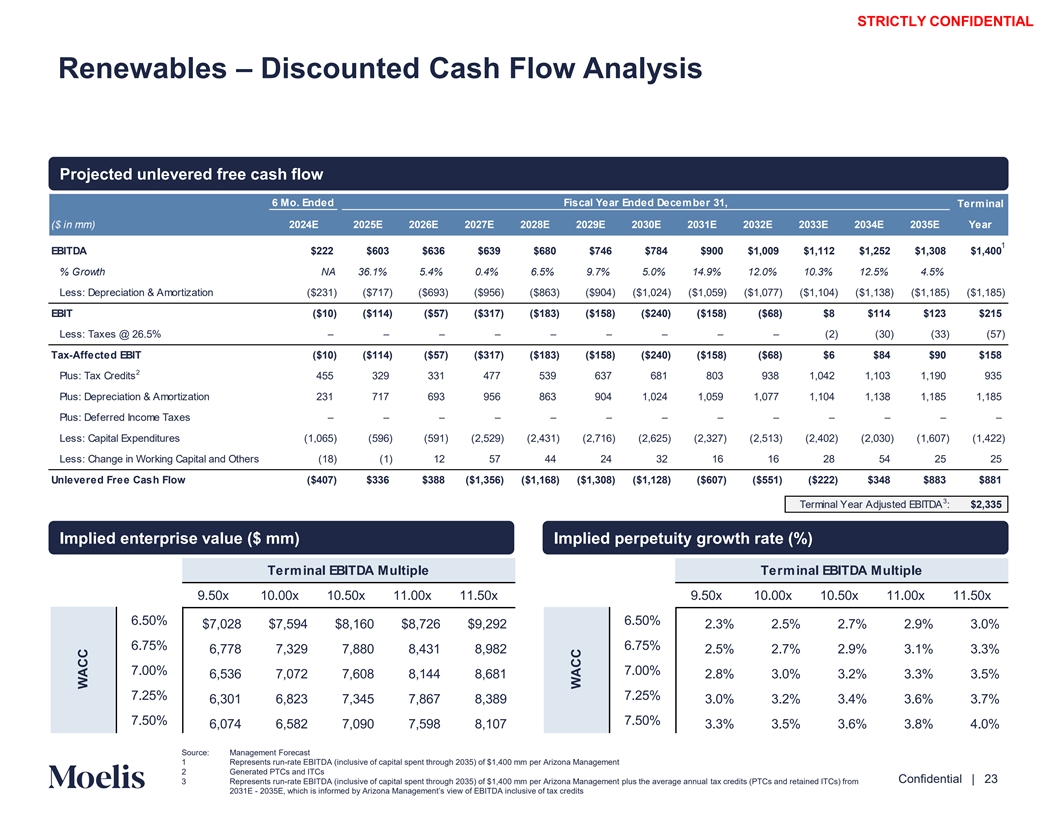
STRICTLY CONFIDENTIAL Renewables – Discounted Cash Flow Analysis Projected unlevered free cash flow 6 Mo. Ended Fiscal Year Ended December 31, Terminal ($ in mm) 2024E 2025E 2026E 2027E 2028E 2029E 2030E 2031E 2032E 2033E 2034E 2035E Year 1 EBITDA $222 $603 $636 $639 $680 $746 $784 $900 $1,009 $1,112 $1,252 $1,308 $1,400 % Growth NA 36.1% 5.4% 0.4% 6.5% 9.7% 5.0% 14.9% 12.0% 10.3% 12.5% 4.5% Less: Depreciation & Amortization ($231) ($717) ($693) ($956) ($863) ($904) ($1,024) ($1,059) ($1,077) ($1,104) ($1,138) ($1,185) ($1,185) EBIT ($10) ($114) ($57) ($317) ($183) ($158) ($240) ($158) ($68) $8 $114 $123 $215 Less: Taxes @ 26.5% – – – – – – – – – (2) (30) (33) (57) Tax-Affected EBIT ($10) ($114) ($57) ($317) ($183) ($158) ($240) ($158) ($68) $6 $84 $90 $158 2 Plus: Tax Credits 455 329 331 477 539 637 681 803 938 1,042 1,103 1,190 935 Plus: Depreciation & Amortization 231 717 693 956 863 904 1,024 1,059 1,077 1,104 1,138 1,185 1,185 Plus: Deferred Income Taxes – – – – – – – – – – – – – Less: Capital Expenditures (1,065) (596) (591) (2,529) (2,431) (2,716) (2,625) (2,327) (2,513) (2,402) (2,030) (1,607) (1,422) Less: Change in Working Capital and Others (18) (1) 12 57 44 24 32 16 16 28 54 25 25 Unlevered Free Cash Flow ($407) $336 $388 ($1,356) ($1,168) ($1,308) ($1,128) ($607) ($551) ($222) $348 $883 $881 3 Terminal Year Adjusted EBITDA : $2,335 Implied enterprise value ($ mm) Implied perpetuity growth rate (%) Terminal EBITDA Multiple Terminal EBITDA Multiple 9.50x 10.00x 10.50x 11.00x 11.50x 9.50x 10.00x 10.50x 11.00x 11.50x 6.50% 6.50% $7,028 $7,594 $8,160 $8,726 $9,292 2.3% 2.5% 2.7% 2.9% 3.0% 6.75% 6.75% 6,778 7,329 7,880 8,431 8,982 2.5% 2.7% 2.9% 3.1% 3.3% 7.00% 7.00% 6,536 7,072 7,608 8,144 8,681 2.8% 3.0% 3.2% 3.3% 3.5% 7.25% 7.25% 6,301 6,823 7,345 7,867 8,389 3.0% 3.2% 3.4% 3.6% 3.7% 7.50% 7.50% 6,074 6,582 7,090 7,598 8,107 3.3% 3.5% 3.6% 3.8% 4.0% Content must not Source: Management Forecast 1 Represents run-rate EBITDA (inclusive of capital spent through 2035) of $1,400 mm per Arizona Management go below this line 2 Generated PTCs and ITCs Confidential | 23 3 Represents run-rate EBITDA (inclusive of capital spent through 2035) of $1,400 mm per Arizona Management plus the average annual tax credits (PTCs and retained ITCs) from 2031E - 2035E, which is informed by Arizona Management’s view of EBITDA inclusive of tax credits WACC WACC
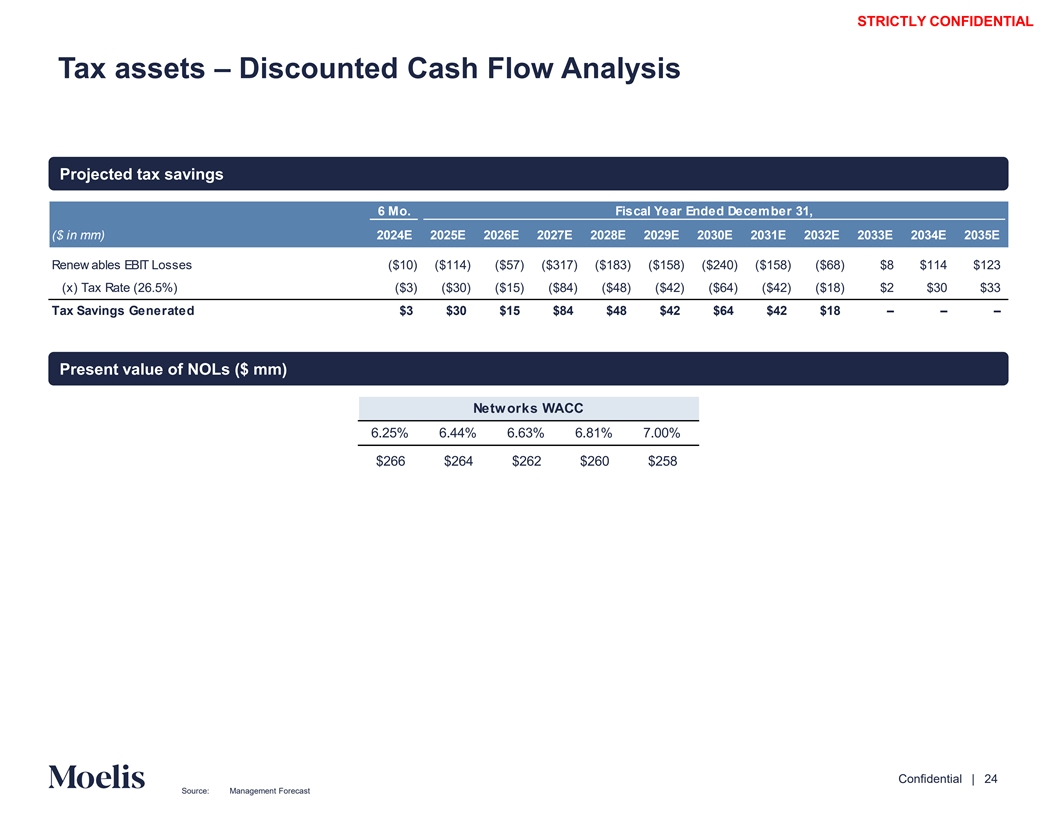
STRICTLY CONFIDENTIAL Tax assets – Discounted Cash Flow Analysis Projected tax savings 6 Mo. Fiscal Year Ended December 31, ($ in mm) 2024E 2025E 2026E 2027E 2028E 2029E 2030E 2031E 2032E 2033E 2034E 2035E Renew ables EBIT Losses ($10) ($114) ($57) ($317) ($183) ($158) ($240) ($158) ($68) $8 $114 $123 (x) Tax Rate (26.5%) ($3) ($30) ($15) ($84) ($48) ($42) ($64) ($42) ($18) $2 $30 $33 Tax Savings Generated $3 $30 $15 $84 $48 $42 $64 $42 $18 – – – Present value of NOLs ($ mm) Networks WACC 6.25% 6.44% 6.63% 6.81% 7.00% $266 $264 $262 $260 $258 Content must not go below this line Confidential | 24 Source: Management Forecast
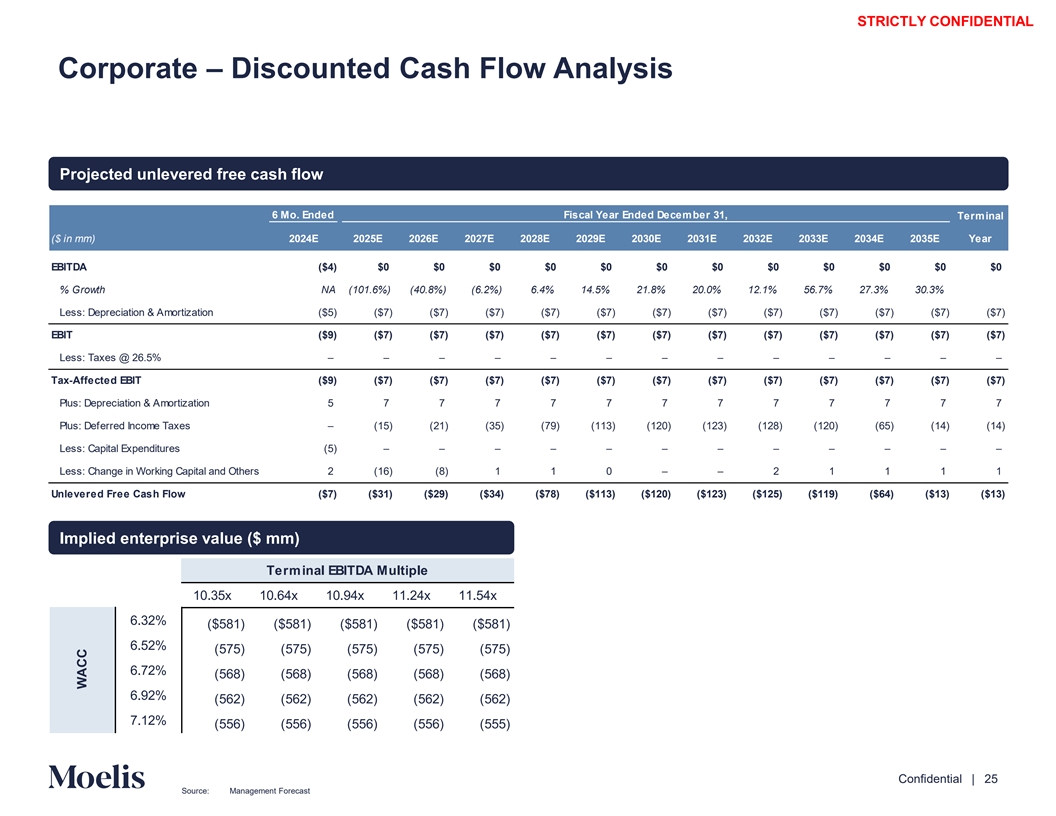
STRICTLY CONFIDENTIAL Corporate – Discounted Cash Flow Analysis Projected unlevered free cash flow 6 Mo. Ended Fiscal Year Ended December 31, Terminal ($ in mm) 2024E 2025E 2026E 2027E 2028E 2029E 2030E 2031E 2032E 2033E 2034E 2035E Year EBITDA ($4) $0 $0 $0 $0 $0 $0 $0 $0 $0 $0 $0 $0 % Growth NA (101.6%) (40.8%) (6.2%) 6.4% 14.5% 21.8% 20.0% 12.1% 56.7% 27.3% 30.3% Less: Depreciation & Amortization ($5) ($7) ($7) ($7) ($7) ($7) ($7) ($7) ($7) ($7) ($7) ($7) ($7) EBIT ($9) ($7) ($7) ($7) ($7) ($7) ($7) ($7) ($7) ($7) ($7) ($7) ($7) Less: Taxes @ 26.5% – – – – – – – – – – – – – Tax-Affected EBIT ($9) ($7) ($7) ($7) ($7) ($7) ($7) ($7) ($7) ($7) ($7) ($7) ($7) Plus: Depreciation & Amortization 5 7 7 7 7 7 7 7 7 7 7 7 7 Plus: Deferred Income Taxes – (15) (21) (35) (79) (113) (120) (123) (128) (120) (65) (14) (14) Less: Capital Expenditures (5) – – – – – – – – – – – – Less: Change in Working Capital and Others 2 (16) (8) 1 1 0 – – 2 1 1 1 1 Unlevered Free Cash Flow ($7) ($31) ($29) ($34) ($78) ($113) ($120) ($123) ($125) ($119) ($64) ($13) ($13) Implied enterprise value ($ mm) Terminal EBITDA Multiple 10.35x 10.64x 10.94x 11.24x 11.54x 6.32% ($581) ($581) ($581) ($581) ($581) 6.52% (575) (575) (575) (575) (575) 6.72% (568) (568) (568) (568) (568) 6.92% (562) (562) (562) (562) (562) 7.12% (556) (556) (556) (556) (555) Content must not go below this line Confidential | 25 Source: Management Forecast WACC
STRICTLY CONFIDENTIAL B. Preliminary Selected Publicly Traded Companies Analysis Content must not go below this line Confidential | 26

STRICTLY CONFIDENTIAL Discussion of Selected Publicly Traded Companies Moelis reviewed and analyzed certain financial information and market trading data related to companies whose operations Moelis believed to be generally relevant for the Arizona business segments • Moelis’ Selected Publicly Traded Companies analysis focuses on a combination of both P / E and EV / EBITDA mul Wtipl ales l Strba eesed t on consensus estimates for 2024E and 2025E EBITDA and earnings per share for the Networks segment while focusing primarily on EV / EBITDA multiples for the Renewables segment • For reference only: An illustrative analysis was also performed on a Consolidated basis, though Moelis did not rely upon it for purposes of its financial analysis due to the lack of comparability of the Selected Publicly Traded Companies with a business mix similar to Arizona • Although none of the Selected Publicly Traded Companies that Moelis focused its financial analysis on are directly comparable, Moelis selected them because, among other reasons, they have one or more similar operating and financial characteristics, including: o Electric Networks: Pure-play (primarily fully regulated) electric utility companies o Gas Networks: Pure-play (primarily fully regulated) gas utility companies o Combined Networks: Primarily fully regulated utility companies with both electric and gas business operations o Renewables: Renewable power generation companies o Consolidated: Companies that have meaningful regulated utility and unregulated renewable power generation business operations • Corporate: reference to the weighted average (weighted based on EBITDA contribution) multiple range based on the Selected Publicly Traded Companies from other business segments • The Selected Publicly Traded Companies analysis includes: o Electric Networks: American Electric Power Company, Inc., Entergy Corporation, Evergy, Inc., FirstEnergy Corp., Pinnacle West Capital Corp., PNM Resources Inc. and Portland General Electric Company o Gas Networks: Atmos Energy Corporation, Northwest Natural Holding Company, ONE Gas, Inc. and Spire Inc. o Combined Networks: Alliant Energy Corporation, Avista Corporation, Black Hills Corporation, CenterPoint Energy, Inc., Consolidated Edison, Inc., Duke Energy Corporation, Exelon Corporation, NiSource Inc., NorthWestern Energy Group, Inc., PPL Corporation and Xcel Energy Inc. o Renewables: Atlantica Sustainable Infrastructure plc, Boralex Inc., Brookfield Renewable Partners L.P., Clearway Energy, Inc., Innergex Inc., NextEra Energy Partners, LP and Northland Power Inc. o Consolidated (for reference only): Ameren Corporation, CMS Energy Corporation, Dominion Energy, Inc., DTE Energy Company, NextEra Energy, Inc., The Southern Company and WEC Energy Group, Inc. Content must not go below this line Confidential | 27

STRICTLY CONFIDENTIAL Discussion of Selected Publicly Traded Companies (cont’d) • A number of factors limit comparability of Selected Publicly Traded Companies, including: o Electric Networks: company size, business profile, regulatory jurisdiction and environments, capital expenditure profiles, etc. o Gas Networks: company size, business profile, regulatory jurisdiction and environments, capital expenditure profiles, etc. o Combined Networks: company size, business profile, regulatory jurisdiction and environments, capital expenditure profiles, etc. o Renewables: company size, geography, business mix, contract profile, counterparties, etc. o Consolidated: business mix, company size, business profile, regulatory jurisdiction and environments • No individual multiple is determinative of reference ranges • The selected reference ranges are based on: o For Networks and Renewables businesses: the observed range of metrics from each applicable set of Selected Publicly Traded Companies, with no emphasis placed on any one multiple o For Corporate: the weighted average (weighted based on EBITDA contribution) of each business segment’s midpoint • To calculate the enterprise value of the Networks segment, Moelis took the enterprise values implied by applying the applicable selected reference ranges to 2024E and 2025E EBITDA and the enterprise value implied by applying the applicable selected reference ranges to 2024E and 2025E earnings per share and adding the net debt and non-controlling interest attributable to the Networks business • To calculate enterprise value of the Renewables segment, Moelis added the 2024E and 2025E tax credits to the s ap Epl BiIcab TDAle year’ 1 and then applied the selected reference ranges o Tax credits calculated as PTCs allocated to Tax Equity Investors (“TEI”) plus retained PTCs and retained ITCs, per nag ement Arizona Ma 1 adj. EBITDA (with Tax Credits) o This approach, in Moelis’ professional judgement, appropriately reflected the value uplift provided to the Renewabl fres omseg ment expected tax credits (PTCs and retained ITCs) • Enterprise value for the Corporate segment was based on the DCF analysis Content must not go below this line Confidential | 28 1. Methodology informed by Arizona Management’s view of EBITDA inclusive of tax credits
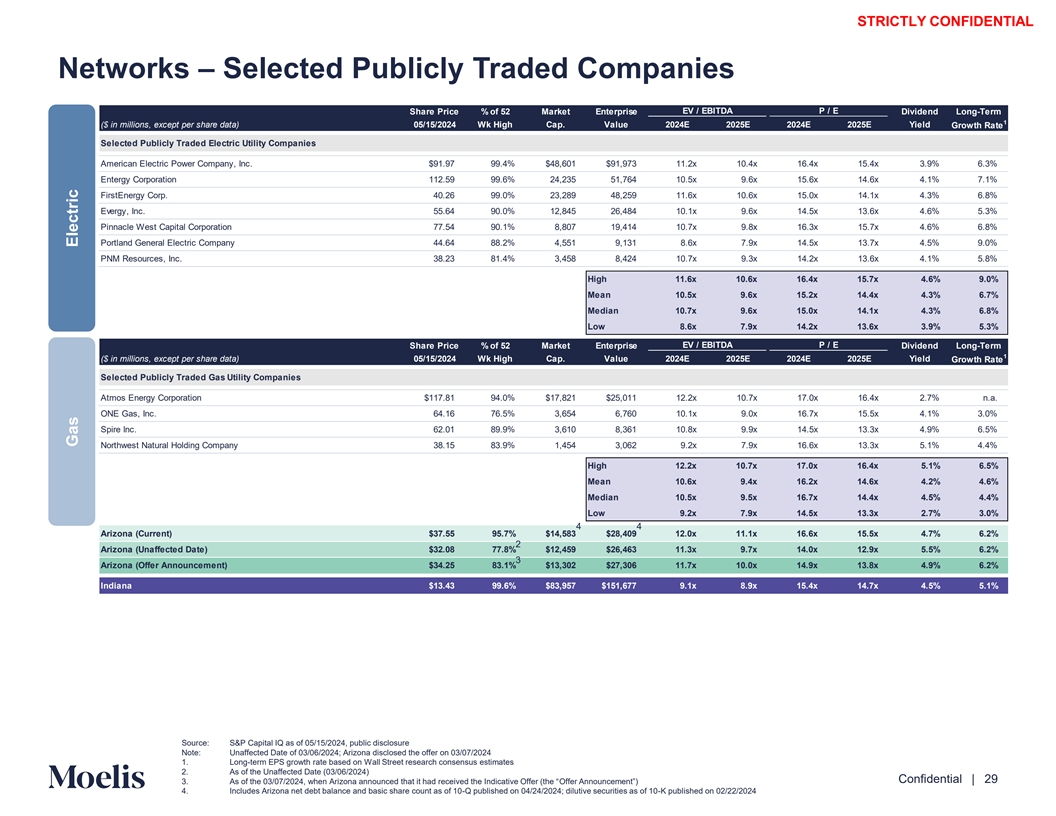
STRICTLY CONFIDENTIAL Networks – Selected Publicly Traded Companies Share Price % of 52 Market Enterprise EV / EBITDA P / E Dividend Long-Term 1 ($ in millions, except per share data) 05/15/2024 Wk High Cap. Value 2024E 2025E 2024E 2025E Yield Growth Rate Selected Publicly Traded Electric Utility Companies American Electric Power Company, Inc. $91.97 99.4% $48,601 $91,973 11.2x 10.4x 16.4x 15.4x 3.9% 6.3% Entergy Corporation 112.59 99.6% 24,235 51,764 10.5x 9.6x 15.6x 14.6x 4.1% 7.1% FirstEnergy Corp. 40.26 99.0% 23,289 48,259 11.6x 10.6x 15.0x 14.1x 4.3% 6.8% Evergy, Inc. 55.64 90.0% 12,845 26,484 10.1x 9.6x 14.5x 13.6x 4.6% 5.3% Pinnacle West Capital Corporation 77.54 90.1% 8,807 19,414 10.7x 9.8x 16.3x 15.7x 4.6% 6.8% Portland General Electric Company 44.64 88.2% 4,551 9,131 8.6x 7.9x 14.5x 13.7x 4.5% 9.0% PNM Resources, Inc. 38.23 81.4% 3,458 8,424 10.7x 9.3x 14.2x 13.6x 4.1% 5.8% High 11.6x 10.6x 16.4x 15.7x 4.6% 9.0% Mean 10.5x 9.6x 15.2x 14.4x 4.3% 6.7% Median 10.7x 9.6x 15.0x 14.1x 4.3% 6.8% Low 8.6x 7.9x 14.2x 13.6x 3.9% 5.3% EV / EBITDA P / E Share Price % of 52 Market Enterprise Dividend Long-Term 1 ($ in millions, except per share data) 05/15/2024 Wk High Cap. Value 2024E 2025E 2024E 2025E Yield Growth Rate Selected Publicly Traded Gas Utility Companies Atmos Energy Corporation $117.81 94.0% $17,821 $25,011 12.2x 10.7x 17.0x 16.4x 2.7% n.a. ONE Gas, Inc. 64.16 76.5% 3,654 6,760 10.1x 9.0x 16.7x 15.5x 4.1% 3.0% Spire Inc. 62.01 89.9% 3,610 8,361 10.8x 9.9x 14.5x 13.3x 4.9% 6.5% Northwest Natural Holding Company 38.15 83.9% 1,454 3,062 9.2x 7.9x 16.6x 13.3x 5.1% 4.4% High 12.2x 10.7x 17.0x 16.4x 5.1% 6.5% Mean 10.6x 9.4x 16.2x 14.6x 4.2% 4.6% Median 10.5x 9.5x 16.7x 14.4x 4.5% 4.4% Low 9.2x 7.9x 14.5x 13.3x 2.7% 3.0% 4 4 Arizona (Current) $37.55 95.7% $14,583 $28,409 12.0x 11.1x 16.6x 15.5x 4.7% 6.2% 2 Arizona (Unaffected Date) $32.08 77.8% $12,459 $26,463 11.3x 9.7x 14.0x 12.9x 5.5% 6.2% 3 Arizona (Offer Announcement) $34.25 83.1% $13,302 $27,306 11.7x 10.0x 14.9x 13.8x 4.9% 6.2% Indiana $13.43 99.6% $83,957 $151,677 9.1x 8.9x 15.4x 14.7x 4.5% 5.1% Source: S&P Capital IQ as of 05/15/2024, public disclosure Content must not Note: Unaffected Date of 03/06/2024; Arizona disclosed the offer on 03/07/2024 1. Long-term EPS growth rate based on Wall Street research consensus estimates go below this line 2. As of the Unaffected Date (03/06/2024) Confidential | 29 3. As of the 03/0 /2024, when Arizona announced that it had received the Indicative OfOf ferfe r( thAen n“ouncement”) 4. Includes Arizona net debt balance and basic share count as of 10-Q published on 04/24/2024; dilutive securities as of 10-K published on 02/22/2024 Gas Electric

STRICTLY CONFIDENTIAL Networks – Selected Publicly Traded Companies (cont’d) EV / EBITDA P / E Share Price % of 52 Market Enterprise Dividend Long-Term 1 ($ in millions, except per share data) 05/15/2024 Wk High Cap. Value 2024E 2025E 2024E 2025E Yield Growth Rate Selected Publicly Traded Combination Utility Companies Duke Energy Corporation $103.35 99.5% $79,984 $163,982 11.9x 11.0x 17.3x 16.3x 4.0% 6.4% Exelon Corporation 38.73 89.0% 38,789 82,950 10.1x 9.5x 15.9x 14.8x 4.0% 6.0% Consolidated Edison, Inc. 96.91 98.0% 33,630 57,939 11.4x 10.3x 18.2x 17.3x 3.4% 5.1% Xcel Energy Inc. 55.79 83.6% 31,074 58,046 10.3x 9.4x 15.7x 14.6x 3.9% 6.4% PPL Corporation 29.57 99.9% 21,815 37,591 10.8x 10.1x 17.4x 16.3x 3.5% 6.9% CenterPoint Energy, Inc. 29.76 94.7% 19,249 37,775 10.9x 10.0x 18.4x 17.1x 2.7% 7.9% Alliant Energy Corporation 51.99 92.4% 13,367 23,002 12.4x 11.4x 17.0x 16.0x 3.7% 6.6% NiSource Inc. 29.13 99.5% 13,090 27,858 10.9x 9.9x 17.0x 15.7x 3.7% 7.0% Black Hills Corporation 56.87 88.2% 3,936 8,304 10.2x 9.9x 14.5x 13.8x 4.6% 4.0% NorthWestern Energy Group, Inc. 51.86 87.0% 3,189 5,869 10.1x 9.8x 14.8x 14.1x 5.1% 5.1% Avista Corporation 38.20 88.4% 3,002 5,905 10.3x 9.7x 15.7x 14.5x 5.0% 5.0% High 12.4x 11.4x 18.4x 17.3x 5.1% 7.9% Mean 10.9x 10.1x 16.5x 15.5x 4.0% 6.0% Median 10.8x 9.9x 17.0x 15.7x 3.9% 6.4% Low 10.1x 9.4x 14.5x 13.8x 2.7% 4.0% 4 4 Arizona (Current) $37.55 95.7% $14,583 $28,409 12.0x 11.1x 16.6x 15.5x 4.7% 6.2% 2 Arizona (Unaffected Date) $32.08 77.8% $12,459 $26,463 11.3x 9.7x 14.0x 12.9x 5.5% 6.2% 3 Arizona (Offer Announcement) $34.25 83.1% $13,302 $27,306 11.7x 10.0x 14.9x 13.8x 4.9% 6.2% Indiana $13.43 99.6% $83,957 $151,677 9.1x 8.9x 15.4x 14.7x 4.5% 5.1% Source: S&P Capital IQ as of 05/15/2024, public disclosure Content must not Note: Unaffected Date of 03/06/2024; Arizona disclosed the offer on 03/07/2024 1. Long-term EPS growth rate based on Wall Street research consensus estimates go below this line 2. As of the Unaffected Date (03/06/2024) Confidential | 30 3. As of the Offer Announcement (03/07/2024) 4. Includes Arizona net debt balance and basic share count as of 10-Q published on 04/24/2024; dilutive securities as of 10-K published on 02/22/2024 Combination
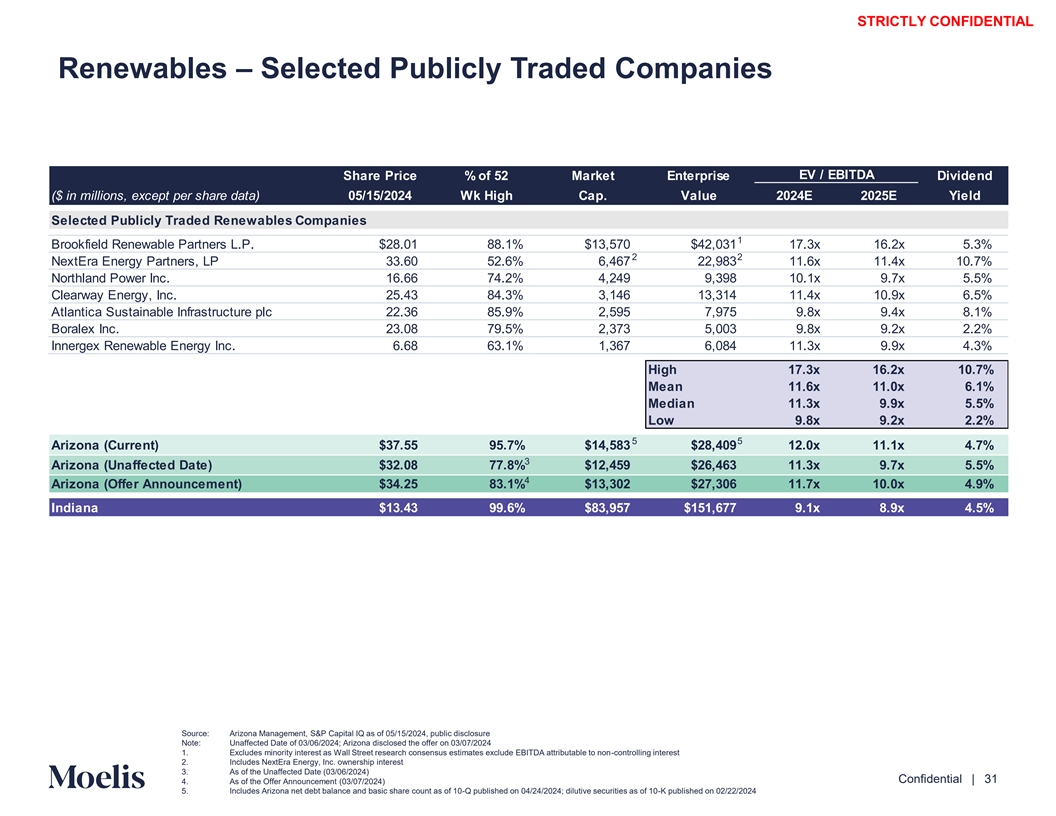
STRICTLY CONFIDENTIAL Renewables – Selected Publicly Traded Companies Share Price % of 52 Market Enterprise EV / EBITDA Dividend ($ in millions, except per share data) 05/15/2024 Wk High Cap. Value 2024E 2025E Yield Selected Publicly Traded Renewables Companies 1 Brookfield Renewable Partners L.P. $28.01 88.1% $13,570 $42,031 17.3x 16.2x 5.3% 2 2 NextEra Energy Partners, LP 33.60 52.6% 6,467 22,983 11.6x 11.4x 10.7% Northland Power Inc. 16.66 74.2% 4,249 9,398 10.1x 9.7x 5.5% Clearway Energy, Inc. 25.43 84.3% 3,146 13,314 11.4x 10.9x 6.5% Atlantica Sustainable Infrastructure plc 22.36 85.9% 2,595 7,975 9.8x 9.4x 8.1% Boralex Inc. 23.08 79.5% 2,373 5,003 9.8x 9.2x 2.2% Innergex Renewable Energy Inc. 6.68 63.1% 1,367 6,084 11.3x 9.9x 4.3% High 17.3x 16.2x 10.7% Mean 11.6x 11.0x 6.1% Median 11.3x 9.9x 5.5% Low 9.8x 9.2x 2.2% 5 5 Arizona (Current) $37.55 95.7% $14,583 $28,409 12.0x 11.1x 4.7% 3 Arizona (Unaffected Date) $32.08 77.8% $12,459 $26,463 11.3x 9.7x 5.5% 4 Arizona (Offer Announcement) $34.25 83.1% $13,302 $27,306 11.7x 10.0x 4.9% Indiana $13.43 99.6% $83,957 $151,677 9.1x 8.9x 4.5% Source: Arizona Management, S&P Capital IQ as of 05/15/2024, public disclosure Note: Unaffected Date of 03/06/2024; Arizona disclosed the offer on 03/07/2024 Content must not 1. Excludes minority interest as Wall Street research consensus estimates exclude EBITDA attributable to non-controlling interest 2. Includes NextEra Energy, Inc. ownership interest go below this line 3. As of the Unaffected Date (03/06/2024) Confidential | 31 4. As of the Offer Announcement (03/07/2024) 5. Includes Arizona net debt balance and basic share count as of 10-Q published on 04/24/2024; dilutive securities as of 10-K published on 02/22/2024

STRICTLY CONFIDENTIAL Consolidated – Selected Publicly Traded Companies (for reference only) EV / EBITDA P / E Share Price % of 52 Market Enterprise Dividend Long-Term 1 ($ in millions, except per share data) 05/15/2024 Wk High Cap. Value 2024E 2025E 2024E 2025E Yield Growth Rate Selected Publicly Traded Consolidated Companies NextEra Energy, Inc. $77.05 99.8% $158,880 $248,377 16.2x 14.7x 22.6x 20.9x 2.7% 8.1% The Southern Company 79.29 99.4% 86,971 153,733 13.4x 12.3x 19.8x 18.4x 3.7% 5.8% Dominion Energy, Inc. 53.22 97.2% 44,711 87,327 12.8x 11.4x 19.2x 15.8x 5.1% 9.4% WEC Energy Group, Inc. 85.03 91.1% 26,914 45,924 12.2x 11.4x 17.5x 16.3x 4.0% 7.0% DTE Energy Company 116.09 99.3% 24,082 45,742 11.5x 10.4x 17.4x 16.2x 3.6% 7.0% Ameren Corporation 75.33 84.9% 20,183 37,411 11.5x 10.5x 16.4x 15.4x 3.6% 6.4% CMS Energy Corporation 62.99 98.8% 18,884 34,672 11.6x 11.1x 18.9x 17.5x 3.3% 7.3% High 16.2x 14.7x 22.6x 20.9x 5.1% 9.4% Mean 12.7x 11.7x 18.8x 17.2x 3.7% 7.3% Median 12.2x 11.4x 18.9x 16.3x 3.6% 7.0% Low 11.5x 10.4x 16.4x 15.4x 2.7% 5.8% 4 4 Arizona (Current) $37.55 95.7% $14,583 $28,409 12.0x 11.1x 16.6x 15.5x 4.7% 6.2% 2 Arizona (Unaffected Date) $32.08 77.8% $12,459 $26,463 11.3x 9.7x 14.0x 12.9x 5.5% 6.2% 3 Arizona (Offer Announcement) $34.25 83.1% $13,302 $27,306 11.7x 10.0x 14.9x 13.8x 4.9% 6.2% Indiana $13.43 99.6% $83,957 $151,677 9.1x 8.9x 15.4x 14.7x 4.5% 5.1% Source: Arizona Management, S&P Capital IQ as of 05/15/2024, public disclosure Content must not Note: Unaffected Date of 03/06/2024; Arizona disclosed the offer on 03/07/2024 1. Long-term EPS growth rate based on Wall Street research consensus estimates go below this line 2. As of the Unaffected Date (03/06/2024) Confidential | 32 3. As of the Offer Announcement (03/07/2024) 4. Includes Arizona net debt balance and basic share count as of 10-Q published on 04/24/2024; dilutive securities as of 10-K published on 02/22/2024
STRICTLY CONFIDENTIAL C. Preliminary Selected Precedent Transactions Analysis (for reference only) Content must not go below this line Confidential | 33

STRICTLY CONFIDENTIAL Discussion of Selected Precedent Transactions (for reference only) Moelis reviewed and analyzed, but did not rely on, selected precedent merger and acquisition transactions for the last ten years involving companies whose operations Moelis believes to be generally relevant for each of Arizona’s business segments • Moelis did not view the Selected Precedents Transactions analysis as relevant because: o Many of the selected precedent transactions were completed in materially different market and interest rate environments o As Indiana already controls Arizona, there is not a change of control in a potential transaction o Due to a lack of comparability of the business mix and profile between the Selected Precedent Transaction target company and Arizona • Moelis’ Selected Precedent Transactions analysis focuses on a combination of P / E multiples and EV / EBITDA em Nuelti twpolerks s fo bur sth inesses while focusing primarily on EV / EBITDA multiples for the Renewables business • Although none of the Selected Precedent Transactions Moelis focused on in this analysis are directly comparable, Moelis selected them because, among other reasons, the targets have one or more similar operating and financial characteristics, including: o Electric Networks: Pure-play (primarily fully regulated) electric utility companies o Gas Networks: Pure-play (primarily fully regulated) gas utility companies o Combined Networks: Primarily fully regulated utility companies with both electric and gas business operations o Renewables: Renewable power generation companies • Corporate: reference to the weighted average (weighted based on EBITDA contribution) multiple range based on the Selected Publicly Traded Companies from other business segments • A number of factors limit comparability of Selected Precedent Transactions, including: o Electric Networks: company size, business profile, regulatory jurisdiction and environments, capital expenditure profiles, etc. o Gas Networks: company size, business profile, regulatory jurisdiction and environments, capital expenditure profiles, etc. o Combined Networks: company size, business profile, regulatory jurisdiction and environments, capital expenditure profiles, etc. o Renewables: company size, geography, business mix, contract profile, counterparties, etc. o In addition, timing differences in different economy and commodity cycles also limit comparability • The selected reference ranges for the Selected Precedent Transactions analysis are based on: o Electric Networks: based on the observed P / E (LTM) and EV / EBITDA (LTM) multiples for selected electric utility transactions, with no emphasis placed on any one multiple o Gas Networks: based on the observed P / E (LTM) and EV / EBITDA (LTM) multiples for selected gas utility transactions, with no emphasis placed on any one multiple o Combined Networks: based on the observed P / E (LTM) and EV / EBITDA (LTM) multiples for selected electric and gas combination utility transactions, with no emphasis placed on any one multiple o Renewables: based on the observed EV / EBITDA (LTM) multiples for selected renewable power generation transactions, with no emphasis placed on any one multiple or metric • To calculate the enterprise value of the Networks segment, Moelis took the enterprise values implied by applying the applicable selected reference ranges to 2024E EBITDA and the enterprise value implied by applying the applicable selected reference multiple ranges to 2024E earnings per share and adding the net debt and non-controlling interest attributable to the Networks business • To calculate enterprise value of the Renewables segment, Moelis added the 2024E tax credits to the 2024E EBITDA and then applied the selected reference ranges 1 o Tax credits calculated as PTCs allocated to TEI plus retained PTCs and retained ITCs, per Arizona Management adj. EBITDA (with Tax Credits) o This approach, in Moelis’ professional judgement, appropriately reflected the value uplift provided to the Renewab lfreosm s eexgpm ee cn tetd tax credits (PTCs and retained ITCs) • Enterprise value for the Corporate segment was based on the DCF analysis Content must not go below this line Confidential | 34 1. Methodology informed by Arizona Management’s view of EBITDA inclusive of tax credits

STRICTLY CONFIDENTIAL Electric / Combination Networks – Selected Precedent Transactions (for reference only) EV / EBITDA P / E Enterprise Equity Ann. 1 1 2 2 Date Acquirer Target Value Value CY CY (date) (name) (name) ($ mm) ($ mm) (x) (x) 6-May-24 CPPIB and GIP ALLETE, Inc. $6,187 $3,858 13.2x 17.4x 26-Oct-21 Liberty Utilities Co. (Algonquin) AEP's Kentucky Operations $2,846 $1,625 14.4x n.a. 21-Oct-20 Avangrid, Inc. PNM Resources, Inc. (Terminated) $7,599 $4,338 11.5x 24.5x 3-Jun-19 J.P. Morgan Investment Management Inc. El Paso Electric Company $4,318 $2,801 12.8x 27.8x 25-Mar-19 ENMAX Corporation Emera Maine $1,300 $959 12.5x n.a. 21-May-18 NextEra Energy, Inc. Gulf Power and Florida City Gas $6,280 $4,873 12.3x n.a. 23-Apr-18 CenterPoint Energy, Inc. Vectren Corporation $8,130 $6,022 12.5x 25.2x 3-Jan-18 Dominion Energy, Inc. SCANA Corporation $14,537 $7,894 10.9x 17.3x 19-Jul-17 Hydro One Limited Avista Corporation (Terminated) $5,322 $3,446 11.3x 27.4x 3 31-May-16 Westar Energy, Inc. Great Plains Energy Incorporated $9,875 $6,877 10.2x 18.3x 9-Feb-16 Fortis, Inc. ITC Holdings Corp. $11,309 $6,929 16.2x 21.3x 9-Feb-16 Liberty Utilities Co. (Algonquin) Empire District Electric Company $2,382 $1,496 10.8x 23.2x 4 4-Sep-15 Emera Incorporated TECO Energy, Inc. $10,350 $6,485 11.6x 22.6x 25-Feb-15 Avangrid, Inc. UIL Holdings Corporation $4,554 $3,003 11.4x 21.7x 3-Dec-14 NextEra Energy, Inc. Hawaiian Electric Industries, Inc. (Terminated) $5,075 $3,466 9.8x 20.8x 20-Oct-14 Macquarie-led Consortium Cleco Corporation $4,678 $3,371 10.3x 20.4x 23-Jun-14 WEC Energy Group, Inc. Integrys Energy Group, Inc. $8,337 $5,810 10.4x 19.9x 30-Apr-14 Exelon Corporation Pepco Holdings, Inc. $12,250 $6,885 10.1x 22.8x Low 9.8x 17.3x Median 11.5x 21.7x High 16.2x 27.8x Source: Public disclosure, S&P Capital IQ 1. Calculated on a fully diluted basis 2. Estimates presented relative to calendar year in which transaction was announced, as of last trading day before deal was announced Content must not 3. Represents stock-for-stock merger of equals announced 07/10/2017, following the termination of the originally announced 5/31/201 reat Plains Energy’s acquisition of Westar Energy (due to ansas Corporation Commission’s pushback); reat Plain Energy’s Equity Value / Net Income metrics a forre a redajut ste Pldain Energy’s common equity capital go below this line markets transactions it executed to fund its 5/31/2016 announced acquisition of Westar Confidential | 35 4. TECO enterprise value and equity value adjusted to exclude implied present value of NOLs and AMT credits. Emera disclosed that the acquisition of TECO included $1.7bn of NOLs and AMT credits that represented ~$714 mm or ~0.8x LTM EBITDA as of 06/30/15
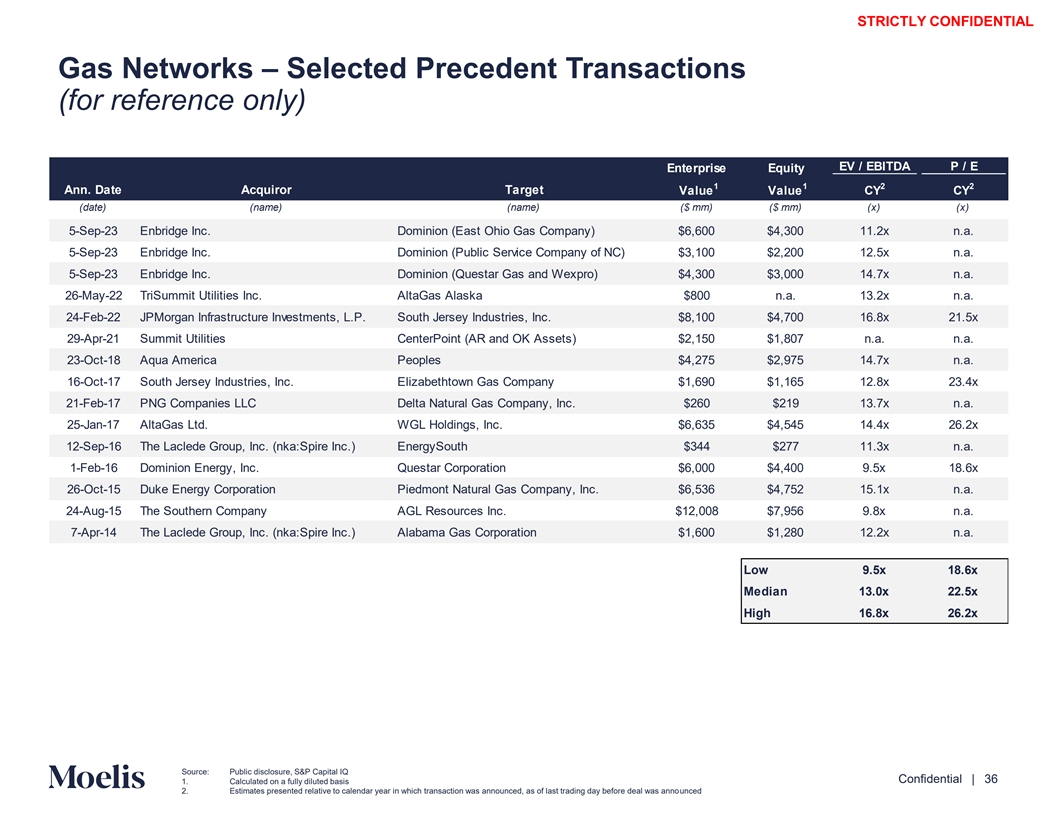
STRICTLY CONFIDENTIAL Gas Networks – Selected Precedent Transactions (for reference only) EV / EBITDA P / E Enterprise Equity 1 1 2 2 Ann. Date Acquiror Target Value Value CY CY (date) (name) (name) ($ mm) ($ mm) (x) (x) 5-Sep-23 Enbridge Inc. Dominion (East Ohio Gas Company) $6,600 $4,300 11.2x n.a. 5-Sep-23 Enbridge Inc. Dominion (Public Service Company of NC) $3,100 $2,200 12.5x n.a. 5-Sep-23 Enbridge Inc. Dominion (Questar Gas and Wexpro) $4,300 $3,000 14.7x n.a. 26-May-22 TriSummit Utilities Inc. AltaGas Alaska $800 n.a. 13.2x n.a. 24-Feb-22 JPMorgan Infrastructure Investments, L.P. South Jersey Industries, Inc. $8,100 $4,700 16.8x 21.5x 29-Apr-21 Summit Utilities CenterPoint (AR and OK Assets) $2,150 $1,807 n.a. n.a. 23-Oct-18 Aqua America Peoples $4,275 $2,975 14.7x n.a. 16-Oct-17 South Jersey Industries, Inc. Elizabethtown Gas Company $1,690 $1,165 12.8x 23.4x 21-Feb-17 PNG Companies LLC Delta Natural Gas Company, Inc. $260 $219 13.7x n.a. 25-Jan-17 AltaGas Ltd. WGL Holdings, Inc. $6,635 $4,545 14.4x 26.2x 12-Sep-16 The Laclede Group, Inc. (nka:Spire Inc.) EnergySouth $344 $277 11.3x n.a. 1-Feb-16 Dominion Energy, Inc. Questar Corporation $6,000 $4,400 9.5x 18.6x 26-Oct-15 Duke Energy Corporation Piedmont Natural Gas Company, Inc. $6,536 $4,752 15.1x n.a. 24-Aug-15 The Southern Company AGL Resources Inc. $12,008 $7,956 9.8x n.a. 7-Apr-14 The Laclede Group, Inc. (nka:Spire Inc.) Alabama Gas Corporation $1,600 $1,280 12.2x n.a. Low 9.5x 18.6x Median 13.0x 22.5x High 16.8x 26.2x Content must not go below this line Source: Public disclosure, S&P Capital IQ Confidential | 36 1. Calculated on a fully diluted basis 2. Estimates presented relative to calendar year in which transaction was announced, as of last trading day before deal was announced

STRICTLY CONFIDENTIAL Renewables – Selected Precedent Transactions (for reference only) EV / EBITDA Enterprise Equity 1 2 Ann. Date Acquirer Target % Acquired Value Value CY (date) (name) (name) (%) ($ mm) ($ mm) (x) 11-Jul-23 TransAlta Corporation TransAlta Renewables Inc. 40% $1,270 $1,044 8.4x 2-Oct-22 RWE AG Con Edison Clean Energy Businesses, Inc 100% $6,800 n.a. 11.3x 25-May-22 TotalEnergies Clearway Energy Group 21% $2,414 $730 12.9x 13-Jan-20 Brookfield Renewable Partners L.P. TerraForm Power, Inc. 39% $4,122 $1,601 13.2x 4-Nov-19 Canada Pension Plan Investment Board Pattern Energy Group Inc. 100% $6,114 $2,628 16.3x 17-Apr-18 Algonquin Power & Utilities Corp. Atlantica Yield plc 16% $1,242 $345 9.3x 5-Feb-18 Capital Dynamics, Inc. 8point3 Energy Partners LP 100% $1,658 $977 14.2x 1-Nov-17 Algonquin Power & Utilities Corp. Atlantica Yield plc 25% $2,012 $608 10.3x 7-Mar-17 Brookfield Renewable Partners L.P. TerraForm Power, Inc. 62% $6,600 $1,700 13.3x 20-Jan-16 Irving Infrastructure Corp. (iCON Infrastructure) Capstone Infrastructure Corporation 100% $1,997 $492 10.6x Low 8.4x Median 12.1x High 16.3x Content must not go below this line Source: Public disclosure, Wall Street research, S&P Capital IQ Confidential | 37 1. Implied enterprise value for interest of target acquired 2. Estimates presented relative to calendar year in which transaction was announced, as of last trading day before deal was announced
STRICTLY CONFIDENTIAL D. Preliminary WACC Analysis Content must not go below this line Confidential | 38
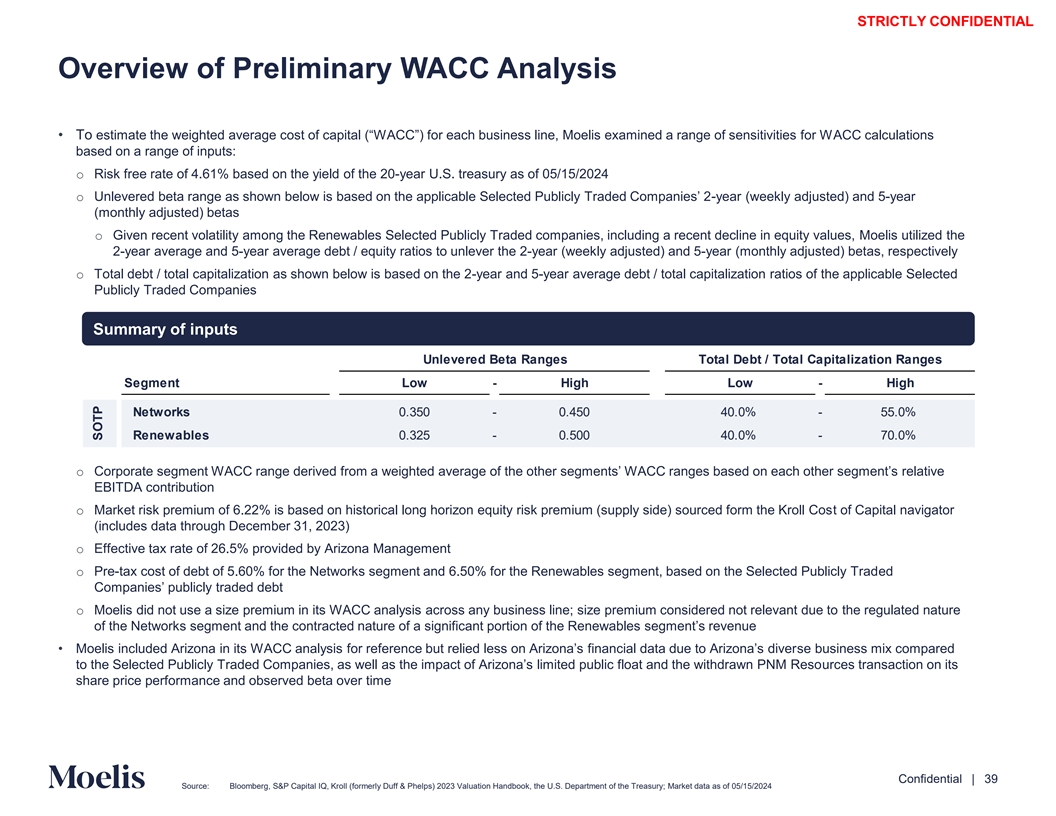
STRICTLY CONFIDENTIAL Overview of Preliminary WACC Analysis • To estimate the weighted average cost of capital (“WACC”) for each business line, Moelis examined a range of sen AsCC itivi ti ces alc ulfor ation Ws based on a range of inputs: o Risk free rate of 4.61% based on the yield of the 20-year U.S. treasury as of 05/15/2024 o Unlevered beta range as shown below is based on the applicable Selected Publicly Traded Com -yeapa r ni (wes ee’ kl2 y adjusted) and 5-year (monthly adjusted) betas o Given recent volatility among the Renewables Selected Publicly Traded companies, including a recent decline in equity values, Moelis utilized the 2-year average and 5-year average debt / equity ratios to unlever the 2-year (weekly adjusted) and 5-year (monthly adjusted) betas, respectively o Total debt / total capitalization as shown below is based on the 2-year and 5-year average debt / total capitalization ratios of the applicable Selected Publicly Traded Companies Summary of inputs Unlevered Beta Ranges Total Debt / Total Capitalization Ranges Segment Low - High Low - High Networks 0.350 - 0.450 40.0% - 55.0% Renewables 0.325 - 0.500 40.0% - 70.0% o Corporate segment WACC range derived from a weighted average of the other segments’ WACC ranges based on each oth reler s ative egment’s EBITDA contribution o Market risk premium of 6.22% is based on historical long horizon equity risk premium (supply side) sourced form the Kroll Cost of Capital navigator (includes data through December 31, 2023) o Effective tax rate of 26.5% provided by Arizona Management o Pre-tax cost of debt of 5.60% for the Networks segment and 6.50% for the Renewables segment, based on the Selected Publicly Traded Companies’ publicly traded debt o Moelis did not use a size premium in its WACC analysis across any business line; size premium considered not relevant due to the regulated nature of the Networks segment and the contracted nature of a significant portion of the Renewables segment’s revenue • Moelis included Arizona in its WACC analysis for reference but relied less on Arizona’s financial data due to A se rbu izon sine a’ss sdi mvier x compared to the Selected Publicly Traded Companies, as well as the impact of Arizona’s limited public float and the withdraw urcn es P trNM ansacRes tiono on its share price performance and observed beta over time Content must not go below this line Confidential | 39 Source: Bloomberg, S&P Capital IQ, Kroll (formerly Duff & Phelps) 2023 Valuation Handbook, the U.S. Department of the Treasury; Market data as of 05/15/2024 SOTP
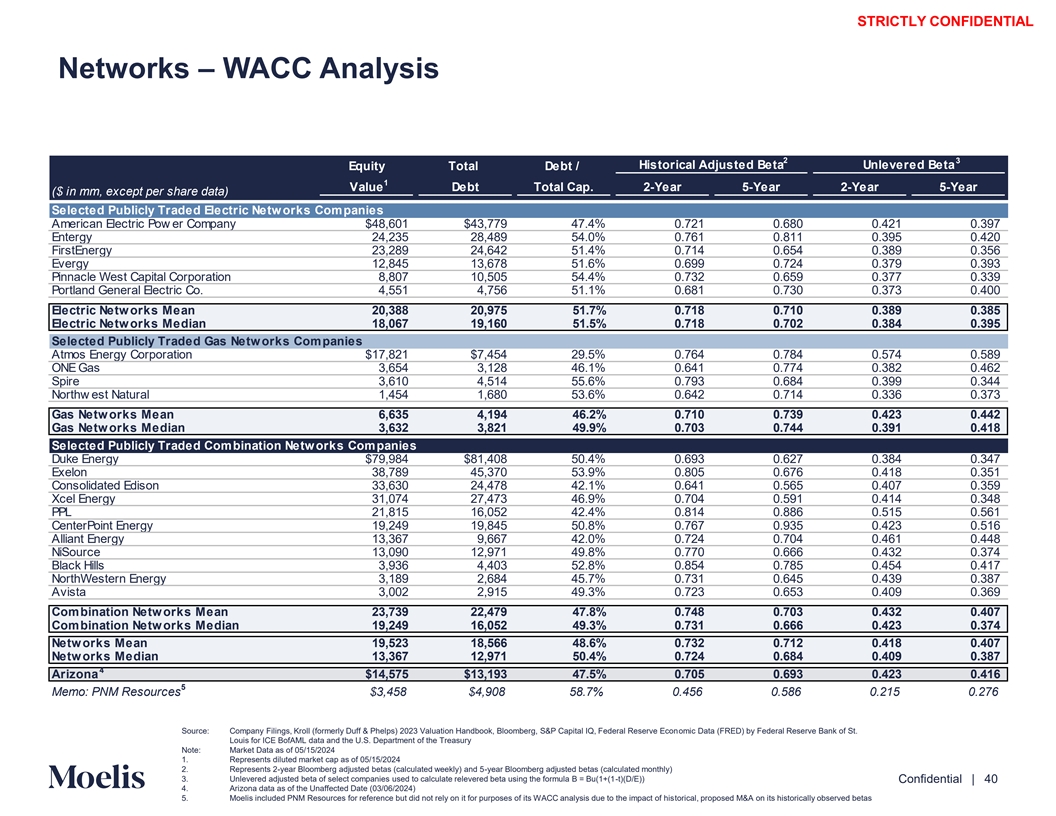
STRICTLY CONFIDENTIAL Networks – WACC Analysis 2 3 Historical Adjusted Beta Unlevered Beta Equity Total Debt / 1 Value Debt Total Cap. 2-Year 5-Year 2-Year 5-Year ($ in mm, except per share data) Selected Publicly Traded Electric Networks Companies American Electric Pow er Company $48,601 $43,779 47.4% 0.721 0.680 0.421 0.397 Entergy 24,235 28,489 54.0% 0.761 0.811 0.395 0.420 FirstEnergy 23,289 24,642 51.4% 0.714 0.654 0.389 0.356 Evergy 12,845 13,678 51.6% 0.699 0.724 0.379 0.393 Pinnacle West Capital Corporation 8,807 10,505 54.4% 0.732 0.659 0.377 0.339 Portland General Electric Co. 4,551 4,756 51.1% 0.681 0.730 0.373 0.400 Electric Networks Mean 20,388 20,975 51.7% 0.718 0.710 0.389 0.385 Electric Networks Median 18,067 19,160 51.5% 0.718 0.702 0.384 0.395 Selected Publicly Traded Gas Networks Companies Atmos Energy Corporation $17,821 $7,454 29.5% 0.764 0.784 0.574 0.589 ONE Gas 3,654 3,128 46.1% 0.641 0.774 0.382 0.462 Spire 3,610 4,514 55.6% 0.793 0.684 0.399 0.344 Northw est Natural 1,454 1,680 53.6% 0.642 0.714 0.336 0.373 Gas Networks Mean 6,635 4,194 46.2% 0.710 0.739 0.423 0.442 Gas Networks Median 3,632 3,821 49.9% 0.703 0.744 0.391 0.418 Selected Publicly Traded Combination Networks Companies Duke Energy $79,984 $81,408 50.4% 0.693 0.627 0.384 0.347 Exelon 38,789 45,370 53.9% 0.805 0.676 0.418 0.351 Consolidated Edison 33,630 24,478 42.1% 0.641 0.565 0.407 0.359 Xcel Energy 31,074 27,473 46.9% 0.704 0.591 0.414 0.348 PPL 21,815 16,052 42.4% 0.814 0.886 0.515 0.561 CenterPoint Energy 19,249 19,845 50.8% 0.767 0.935 0.423 0.516 Alliant Energy 13,367 9,667 42.0% 0.724 0.704 0.461 0.448 NiSource 13,090 12,971 49.8% 0.770 0.666 0.432 0.374 Black Hills 3,936 4,403 52.8% 0.854 0.785 0.454 0.417 NorthWestern Energy 3,189 2,684 45.7% 0.731 0.645 0.439 0.387 Avista 3,002 2,915 49.3% 0.723 0.653 0.409 0.369 Combination Networks Mean 23,739 22,479 47.8% 0.748 0.703 0.432 0.407 Combination Networks Median 19,249 16,052 49.3% 0.731 0.666 0.423 0.374 Networks Mean 19,523 18,566 48.6% 0.732 0.712 0.418 0.407 Networks Median 13,367 12,971 50.4% 0.724 0.684 0.409 0.387 4 Arizona $14,575 $13,193 47.5% 0.705 0.693 0.423 0.416 5 Memo: PNM Resources $3,458 $4,908 58.7% 0.456 0.586 0.215 0.276 Source: Company Filings, Kroll (formerly Duff & Phelps) 2023 Valuation Handbook, Bloomberg, S&P Capital IQ, Federal Reserve Economic Data (FRED) by Federal Reserve Bank of St. Louis for ICE BofAML data and the U.S. Department of the Treasury Note: Market Data as of 05/15/2024 Content must not 1. Represents diluted market cap as of 05/15/2024 go below this line 2. Represents 2-year Bloomberg adjusted betas (calculated weekly) and 5-year Bloomberg adjusted betas (calculated monthly) 3. Unlevered adjusted beta of select companies used to calculate relevered beta using the formula B = Bu(1+(1-t)(D/E)) Confidential | 40 4. Arizona data as of the Unaffected Date (03/06/2024) 5. Moelis included PNM Resources for reference but did not rely on it for purposes of its WACC analysis due to the impact of historical, proposed M&A on its historically observed betas
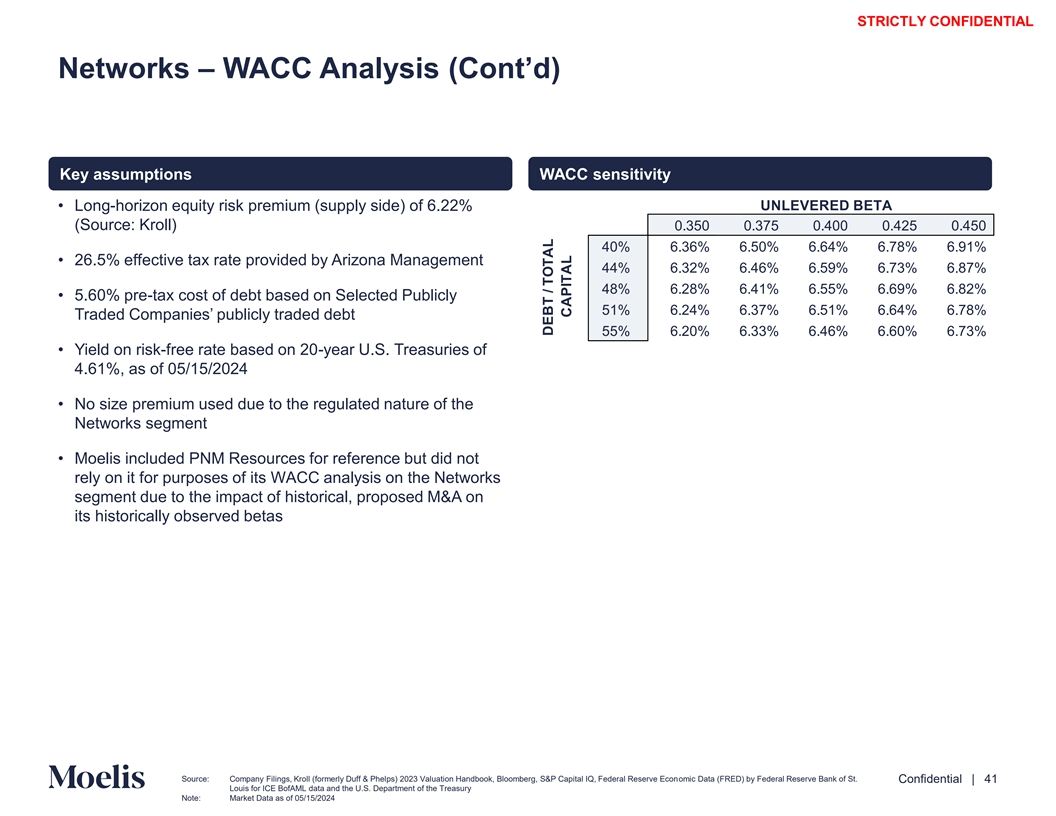
STRICTLY CONFIDENTIAL Networks – WACC Analysis (Cont’d) Key assumptions WACC sensitivity • Long-horizon equity risk premium (supply side) of 6.22% UNLEVERED BETA (Source: Kroll) 0.350 0.375 0.400 0.425 0.450 40% 6.36% 6.50% 6.64% 6.78% 6.91% • 26.5% effective tax rate provided by Arizona Management 44% 6.32% 6.46% 6.59% 6.73% 6.87% 48% 6.28% 6.41% 6.55% 6.69% 6.82% • 5.60% pre-tax cost of debt based on Selected Publicly 51% 6.24% 6.37% 6.51% 6.64% 6.78% Traded Companies’ publicly traded debt 55% 6.20% 6.33% 6.46% 6.60% 6.73% • Yield on risk-free rate based on 20-year U.S. Treasuries of 4.61%, as of 05/15/2024 • No size premium used due to the regulated nature of the Networks segment • Moelis included PNM Resources for reference but did not rely on it for purposes of its WACC analysis on the Networks segment due to the impact of historical, proposed M&A on its historically observed betas Content must not go below this line Source: Company Filings, Kroll (formerly Duff & Phelps) 2023 Valuation Handbook, Bloomberg, S&P Capital IQ, Federal Reserve Economic Data (FRED) by Federal Reserve Bank of St. Confidential | 41 Louis for ICE BofAML data and the U.S. Department of the Treasury Note: Market Data as of 05/15/2024 DEBT / TOTAL CAPITAL
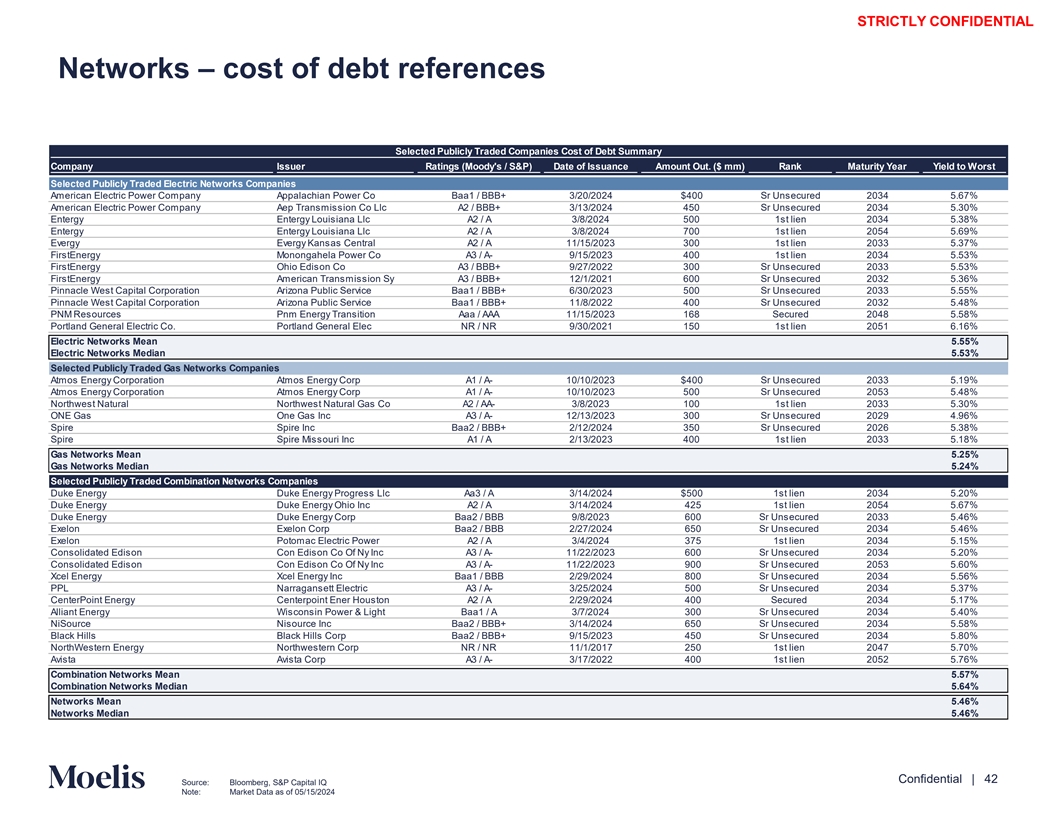
STRICTLY CONFIDENTIAL Networks – cost of debt references Selected Publicly Traded Companies Cost of Debt Summary Company Issuer Ratings (Moody's / S&P) Date of Issuance Amount Out. ($ mm) Rank Maturity Year Yield to Worst Selected Publicly Traded Electric Networks Companies American Electric Power Company Appalachian Power Co Baa1 / BBB+ 3/20/2024 $400 Sr Unsecured 2034 5.67% American Electric Power Company Aep Transmission Co Llc A2 / BBB+ 3/13/2024 450 Sr Unsecured 2034 5.30% Entergy Entergy Louisiana Llc A2 / A 3/8/2024 500 1st lien 2034 5.38% Entergy Entergy Louisiana Llc A2 / A 3/8/2024 700 1st lien 2054 5.69% Evergy Evergy Kansas Central A2 / A 11/15/2023 300 1st lien 2033 5.37% FirstEnergy Monongahela Power Co A3 / A- 9/15/2023 400 1st lien 2034 5.53% FirstEnergy Ohio Edison Co A3 / BBB+ 9/27/2022 300 Sr Unsecured 2033 5.53% FirstEnergy American Transmission Sy A3 / BBB+ 12/1/2021 600 Sr Unsecured 2032 5.36% Pinnacle West Capital Corporation Arizona Public Service Baa1 / BBB+ 6/30/2023 500 Sr Unsecured 2033 5.55% Pinnacle West Capital Corporation Arizona Public Service Baa1 / BBB+ 11/8/2022 400 Sr Unsecured 2032 5.48% PNM Resources Pnm Energy Transition Aaa / AAA 11/15/2023 168 Secured 2048 5.58% Portland General Electric Co. Portland General Elec NR / NR 9/30/2021 150 1st lien 2051 6.16% Electric Networks Mean 5.55% Electric Networks Median 5.53% Selected Publicly Traded Gas Networks Companies Atmos Energy Corporation Atmos Energy Corp A1 / A- 10/10/2023 $400 Sr Unsecured 2033 5.19% Atmos Energy Corporation Atmos Energy Corp A1 / A- 10/10/2023 500 Sr Unsecured 2053 5.48% Northwest Natural Northwest Natural Gas Co A2 / AA- 3/8/2023 100 1st lien 2033 5.30% ONE Gas One Gas Inc A3 / A- 12/13/2023 300 Sr Unsecured 2029 4.96% Spire Spire Inc Baa2 / BBB+ 2/12/2024 350 Sr Unsecured 2026 5.38% Spire Spire Missouri Inc A1 / A 2/13/2023 400 1st lien 2033 5.18% Gas Networks Mean 5.25% Gas Networks Median 5.24% Selected Publicly Traded Combination Networks Companies Duke Energy Duke Energy Progress Llc Aa3 / A 3/14/2024 $500 1st lien 2034 5.20% Duke Energy Duke Energy Ohio Inc A2 / A 3/14/2024 425 1st lien 2054 5.67% Duke Energy Duke Energy Corp Baa2 / BBB 9/8/2023 600 Sr Unsecured 2033 5.46% Exelon Exelon Corp Baa2 / BBB 2/27/2024 650 Sr Unsecured 2034 5.46% Exelon Potomac Electric Power A2 / A 3/4/2024 375 1st lien 2034 5.15% Consolidated Edison Con Edison Co Of Ny Inc A3 / A- 11/22/2023 600 Sr Unsecured 2034 5.20% Consolidated Edison Con Edison Co Of Ny Inc A3 / A- 11/22/2023 900 Sr Unsecured 2053 5.60% Xcel Energy Xcel Energy Inc Baa1 / BBB 2/29/2024 800 Sr Unsecured 2034 5.56% PPL Narragansett Electric A3 / A- 3/25/2024 500 Sr Unsecured 2034 5.37% CenterPoint Energy Centerpoint Ener Houston A2 / A 2/29/2024 400 Secured 2034 5.17% Alliant Energy Wisconsin Power & Light Baa1 / A 3/7/2024 300 Sr Unsecured 2034 5.40% NiSource Nisource Inc Baa2 / BBB+ 3/14/2024 650 Sr Unsecured 2034 5.58% Black Hills Black Hills Corp Baa2 / BBB+ 9/15/2023 450 Sr Unsecured 2034 5.80% NorthWestern Energy Northwestern Corp NR / NR 11/1/2017 250 1st lien 2047 5.70% Avista Avista Corp A3 / A- 3/17/2022 400 1st lien 2052 5.76% Combination Networks Mean 5.57% Combination Networks Median 5.64% Networks Mean 5.46% Networks Median 5.46% Content must not go below this line Confidential | 42 Source: Bloomberg, S&P Capital IQ Note: Market Data as of 05/15/2024

STRICTLY CONFIDENTIAL Renewables – WACC Analysis 2 3 Equity Total Current 2yr Avg. 5yr Avg. Debt / Historical Adjusted Beta Unlevered Beta 1 ($ in mm, except per share data) Value Debt Debt / Equity Debt / Equity Debt / Equity Total Cap. 2-Year 5-Year 2-Year 5-Year Selected Publicly Traded Renewables Companies Brookfield Renewable Partners $13,570 $29,124 214.6% 143.0% 107.3% 68.2% 0.855 0.956 0.386 0.500 NextEra Energy Partners 6,467 6,340 98.0% 145.6% 127.1% 49.5% 0.905 1.011 0.421 0.504 Northland Power 4,249 5,296 124.7% 103.5% 110.6% 55.5% 0.834 0.643 0.444 0.331 Clearway Energy 3,146 8,144 258.9% 256.0% 267.8% 72.1% 0.996 0.901 0.330 0.289 Atlantica Sustainable Infrastructure 2,595 5,486 211.4% 204.2% 200.9% 67.9% 0.840 0.984 0.332 0.393 Boralex 2,373 2,691 113.4% 74.5% 85.2% 53.1% 0.841 0.613 0.515 0.355 Innergex 1,367 4,732 346.2% 180.1% 140.4% 77.6% 0.994 0.566 0.393 0.258 Mean 4,824 8,830 195.3% 158.1% 148.5% 63.4% 0.895 0.811 0.403 0.376 Median 3,146 5,486 211.4% 145.6% 127.1% 67.9% 0.855 0.901 0.393 0.355 4 Arizona $14,575 $13,193 90.5% 70.6% 60.4% 47.5% 0.705 0.693 0.464 0.480 Source: Company Filings, Kroll (formerly Duff & Phelps) 2023 Valuation Handbook, Bloomberg, S&P Capital IQ, Federal Reserve Economic Data (FRED) by Federal Reserve Bank of St. Louis for ICE BofAML data and the U.S. Department of the Treasury Content must not Note: Market Data as of 05/15/2024 go below this line 1. Represents diluted market cap as of 05/15/2024 2. Represents 2-year Bloomberg adjusted betas (calculated weekly) and 5-year Bloomberg adjusted betas (calculated monthly) Confidential | 43 3. Unlevered adjusted beta of select companies used to calculate relevered beta using the formula B = Bu(1+(1-t)(D/E)) 4. Arizona data as of the Unaffected Date (03/06/2024)

STRICTLY CONFIDENTIAL Renewables – WACC Analysis (Cont’d) Key assumptions WACC sensitivity • Long-horizon equity risk premium (supply side) of 6.22% UNLEVERED BETA (Source: Kroll) 0.325 0.369 0.413 0.456 0.500 40% 6.48% 6.73% 6.97% 7.21% 7.46% • 26.5% effective tax rate, provided by Arizona Management 48% 6.46% 6.69% 6.93% 7.17% 7.41% 55% 6.43% 6.66% 6.89% 7.13% 7.36% • 6.50% pre-tax cost of debt based on Selected Publicly 63% 6.40% 6.63% 6.86% 7.08% 7.31% Traded Companies’ publicly traded debt 70% 6.37% 6.60% 6.82% 7.04% 7.26% • Yield on risk-free rate based on 20-year U.S. Treasuries of 4.61%, as of 05/15/2024 • No size premium used due to significant portion of cash flows under long-term contract • Moelis utilized the 2-year average and 5-year average debt / equity ratios to unlever the 2-year (weekly adjusted) and 5- year (monthly adjusted) betas, respectively, due to the recent volatility among the Renewables Selected Publicly Traded companies, including a recent decline in equity values • Moelis included Atlantica Sustainable Infrastructure for reference but did not rely on it for purposes of its WACC analysis due to the international nature of its revenue streams Content must not go below this line Source: Company Filings, Kroll (formerly Duff & Phelps) 2023 Valuation Handbook, Bloomberg, S&P Capital IQ, Federal Reserve Economic Data (FRED) by Federal Reserve Bank of St. Confidential | 44 Louis for ICE BofAML data and the U.S. Department of the Treasury Note: Market Data as of 05/15/2024 DEBT / TOTAL CAPITAL

STRICTLY CONFIDENTIAL Renewables – cost of debt references Selected Publicly Traded Companies Cost of Debt Summary Company Issuer Ratings (Moody's / S&P) Date of Issuance Amount Out. ($ mm) Rank Maturity Year Yield to Worst Selected Publicly Traded Renewables Companies Atlantica Sustainable Infrastructure Atlantica Sustain Infra NR / BB+ 5/18/2021 $400 Sr Unsecured 2028 5.30% Brookfield Renewable Partners Brookfield Renewable Par NR / BBB+ 3/29/2023 400 Sr Unsecured 2033 5.04% Brookfield Renewable Partners Brookfield Renewable Par NR / BBB+ 1/10/2024 400 Sr Unsecured 2054 5.34% Clearway Energy Clearway Energy Op Llc Ba2 / BB 10/1/2021 350 Sr Unsecured 2032 6.24% Innergex Innergex Renewable Energ NR / NR 9/30/2019 144 Subordinated 2026 8.06% NextEra Energy Partners Nextera Energy Operating Ba1 / BB 9/25/2017 550 Sr Unsecured 2027 6.34% NextEra Energy Partners Nextera Energy Operating Ba1 / BB 12/15/2023 750 Sr Unsecured 2029 6.47% Northland Power North Battleford Power NR / NR 9/20/2013 463 Secured 2032 5.29% Northland Power Northland Power Inc NR / BB+ 6/21/2023 500 Sr Subordinated 2083 7.51% Mean 6.18% Median 6.24% Content must not go below this line Confidential | 45 Source: Bloomberg, S&P Capital IQ Note: Market Data as of 05/15/2024
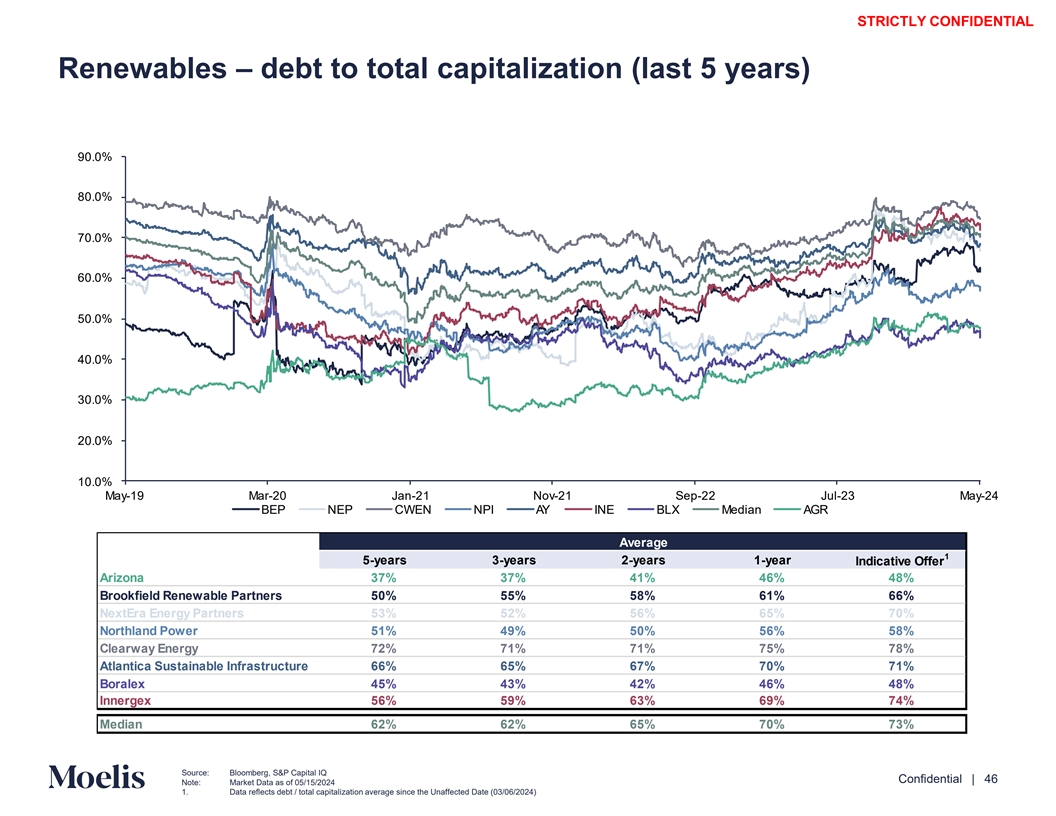
STRICTLY CONFIDENTIAL Renewables – debt to total capitalization (last 5 years) 0.0 80.0 0.0 0.0 50.0 40.0 30.0 20.0 10.0 May 1 Mar 20 an 21 Nov 21 Sep 22 ul 23 May 24 BEP NEP CWEN NPI A INE BL Median A R Average 1 5-years 3-years 2-years 1-year Indicative Offer Arizona 37% 37% 41% 46% 48% Brookfield Renewable Partners 50% 55% 58% 61% 66% NextEra Energy Partners 53% 52% 56% 65% 70% Northland Power 51% 49% 50% 56% 58% Clearway Energy 72% 71% 71% 75% 78% Atlantica Sustainable Infrastructure 66% 65% 67% 70% 71% Boralex 45% 43% 42% 46% 48% Innergex 56% 59% 63% 69% 74% Median 62% 62% 65% 70% 73% Content must not go below this line Source: Bloomberg, S&P Capital IQ Confidential | 46 Note: Market Data as of 05/15/2024 1. Data reflects debt / total capitalization average since the Unaffected Date (03/06/2024)

STRICTLY CONFIDENTIAL Arizona – cost of debt references (reference only) Arizona Cost of Debt Summary (reference only) Company Issuer Ratings (Moody's / S&P) Date of Issuance Amount Out. ($ mm) Rank Maturity Year Yield to Worst Arizona Rochester Gas & Electric A2 / A 11/23/2020 $200 1st lien 2030 5.53% Arizona Ny State Electric & Gas Baa1 / A- 8/8/2023 350 Sr Unsecured 2028 5.35% Arizona Ny State Electric & Gas Baa1 / A- 9/24/2021 350 Sr Unsecured 2031 5.42% Arizona Ny State Electric & Gas Baa1 / A- 8/8/2023 400 Sr Unsecured 2033 5.49% Arizona Ny State Electric & Gas Baa1 / A- 9/5/2019 300 Sr Unsecured 2049 5.76% Arizona Avangrid Inc Baa2 / BBB 5/16/2019 750 Sr Unsecured 2029 5.48% Mean 5.50% Median 5.48% Content must not go below this line Confidential | 47 Source: Bloomberg, S&P Capital IQ Note: Market Data as of 05/15/2024
STRICTLY CONFIDENTIAL E. Context for evaluating the proposal Content must not go below this line Confidential | 48
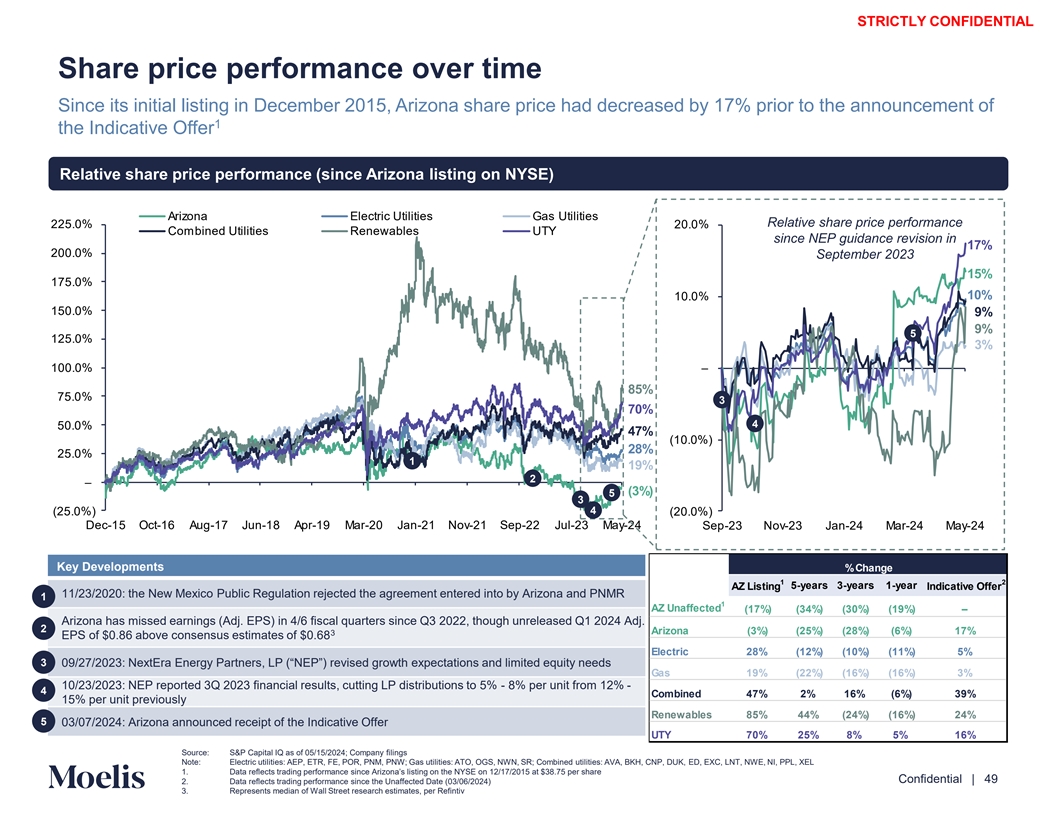
STRICTLY CONFIDENTIAL Share price performance over time Since its initial listing in December 2015, Arizona share price had decreased by 17% prior to the announcement of 1 the Indicative Offer Relative share price performance (since Arizona listing on NYSE) Arizona Electric Utilities as Utilities Relative share price performance 225.0 20.0 Combined Utilities Renewables UT since NEP guidance revision in 200.0 September 2023 1 5.0 10.0 150.0 5 125.0 100.0 5.0 3 4 50.0 (10.0 ) 25.0 1 2 ( ) 5 3 4 (25.0 ) (20.0 ) Dec 15 Oct 1 Aug 1 un 18 Apr 1 Mar 20 an 21 Nov 21 Sep 22 ul 23 May 24 Sep 23 Nov 23 an 24 Mar 24 May 24 Key Developments % Change 1 2 5-years 3-years 1-year AZ Listing Indicative Offer 11/23/2020: the New Mexico Public Regulation rejected the agreement entered into by Arizona and PNMR 1 1 AZ Unaffected (17%) (34%) (30%) (19%) – Arizona has missed earnings (Adj. EPS) in 4/6 fiscal quarters since Q3 2022, though unreleased Q1 2024 Adj. 2 Arizona (3%) (25%) (28%) (6%) 17% 3 EPS of $0.86 above consensus estimates of $0.68 Electric 28% (12%) (10%) (11%) 5% 3 0 /2 /2023: NextEra Energy Partners, LP (“NEP”) revised growth expectations and limited equity needs Gas 19% (22%) (16%) (16%) 3% 10/23/2023: NEP reported 3Q 2023 financial results, cutting LP distributions to 5% - 8% per unit from 12% - 4 Combined 47% 2% 16% (6%) 39% 15% per unit previously Renewables 85% 44% (24%) (16%) 24% 5 03/07/2024: Arizona announced receipt of the Indicative Offer UTY 70% 25% 8% 5% 16% Content must not Source: S&P Capital IQ as of 05/15/2024; Company filings Note: Electric utilities: AEP, ETR, FE, POR, PNM, PNW; Gas utilities: ATO, OGS, NWN, SR; Combined utilities: AVA, BKH, CNP, DUK, ED, EXC, LNT, NWE, NI, PPL, XEL go below this line 1. Data reflects trading performance since Arizona’s listing on the N SE on 12/1 /2015 at $38. 5 per share Confidential | 49 2. Data reflects trading performance since the Unaffected Date (03/06/2024) 3. Represents median of Wall Street research estimates, per Refintiv

STRICTLY CONFIDENTIAL Historical trading multiples – P / E P / NTM Earnings (since Arizona listing on NYSE) Average 1 2 Since Listing 5-year 3-year 1-year Indicative Offer 3 Arizona (Unaffected) 19.7x 19.6x 18.8x 14.8x - Arizona 19.6x 19.5x 18.7x 15.1x 16.1x Electric Utilities 17.8x 17.4x 16.5x 14.4x 14.3x Gas Utilities 20.6x 19.3x 17.6x 15.8x 16.4x 28.0x Combination Utilities 18.1x 17.8x 17.6x 15.9x 16.0x Consolidated 20.0x 20.4x 19.6x 17.2x 17.5x UTY 18.7x 19.4x 19.3x 16.8x 17.0x 26.0x 24.0x 22.0x 20.0x 18.9x 18.4x 18.0x 17.0x 16.7x 16.0x 16.6x 15.0x 14.0x 12.0x 10.0x Dec-15 Oct-16 Aug-17 Jun-18 May-19 Mar-20 Dec-20 Nov-21 Sep-22 Jul-23 May-24 Arizona Electric Utilities Gas Utilities Combination Utilities Consolidated UTY Content must not Source: S&P Capital IQ as of 05/15/2024 Note: Electric Utilities: AEP, ETR, EVRG, FE, POR, PNM, PNW; Gas Utilities: ATO, OGS, NWN, SR; Combination Utilities: AVA, BKH, CNP, DUK, EXC, ED, LNT, NI, NWE, PPL, XEL go below this line 1. Since Arizona’s listing on December 1 , 2015, the day following the merger of Indiana and UIL Confidential | 50 2. Data reflects multiple average since the Unaffected Date (03/06/2024) 3. Data reflects multiple average up until the Unaffected Date (03/06/2024)

STRICTLY CONFIDENTIAL F. Other information Content must not go below this line Confidential | 51

STRICTLY CONFIDENTIAL Arizona share price performance Arizona share price performance (since listing on NYSE) Share price performance YTD $ 0.00 $ 0.00 Arizona Share Price Proposed Transaction Indicative Offer 3 5 Arizona announced receipt of the Indicative Offer on 3/7/2024 at a ~7% premium to 2 6 $50.00 $50.00 Arizona’s unaffected share price of $32.08 4 (3/6/2024) and a ~10% premium to the 30 trading-day VWAP of $31.03 $40.00 $40.00 1 8 8 7 $30.00 $30.00 1 All Time 52 Week High Low High Low Arizona $56.57 $28.36 $41.12 $28.36 $20.00 $20.00 an 24 Feb 24 Mar 24 Apr 24 May 24 Dec 15 May 1 Oct 18 Mar 20 ul 21 Dec 22 May 24 Key Developments 1 On December 17, 2015 Arizona began trading on the New York Stock exchange at $38.75 On December 27, 2017, Arizona announced it completed the strategic review of its Enstor Gas Storage businesses and confirmed its plan to move forward with the sale of the 2 businesses (the sale was announced on January 31, 2018) On February 25, 2020, Arizona reported Q4 / FY2019 earnings and revised guidance downward, citing uncovered storm outage restoration in its networks business and weak 3 pricing across its merchant renewables business as key headwinds 4 On March 11, 2020, the World Health Organization declared COVID-19 a global pandemic 5 On October 21, 2020, PNM Resources (“PNMR”) announced an agreem enete nt r ito nto a merger with Arizona for $50.30 per share in cash 6 On May 12, 2021, the Qatar Investment Authority and Indiana purchased $740 mm and $3.3 bn of common stock, respectively, at $51.40/share in a private placement 7 On December 31, 2023, Arizona terminated its merger agreement with PNMR due to failure in obtaining regulatory approval from the New Mexico Public Regulation Commission 8 On March 7, 2024, Arizona announced receipt of the Indicative Offer from Indiana to acquire all of Arizona shares not owned by Indiana for $34.25 in cash per share Content must not go below this line Source: S&P Capital IQ market data as of 05/15/2024; public disclosure Confidential | 52 Note: Data reflects trading performance since Arizona’s listing on the N SE on 12/1 /2015 1. As of the Unaffected Date (03/06/2024)

STRICTLY CONFIDENTIAL Historical trading multiples – EV / EBITDA EV / NTM EBITDA (since Arizona listing on NYSE) Average 1 2 Since Listing 5-year 3-year 1-year Indicative Offer 3 Arizona (Unaffected) 10.2x 10.9x 11.2x 10.4x - Arizona 10.2x 10.9x 11.2x 10.6x 11.5x Electric Utilities 10.3x 10.8x 10.8x 10.2x 10.4x Gas Utilities 11.7x 11.9x 11.8x 10.4x 10.5x 16.0x Combination Utilities 10.6x 10.9x 10.9x 10.4x 10.4x Renewables 11.4x 12.3x 12.3x 10.7x 11.0x Consolidated 11.8x 12.4x 12.4x 11.5x 11.9x 15.0x UTY 11.4x 12.3x 12.5x 11.7x 11.7x 14.0x 13.0x 12.2x 12.0x 12.1x 12.0x 11.3x 11.0x 10.8x 10.7x 10.5x 10.0x 9.0x 8.0x 7.0x 6.0x Dec-15 Oct-16 Aug-17 Jun-18 May-19 Mar-20 Dec-20 Nov-21 Sep-22 Jul-23 May-24 Arizona Electric Utilities Gas Utilities Combination Utilities Renewables Consolidated UTY Source: S&P Capital IQ as of 05/15/2024 Content must not Note: Electric Utilities: AEP, ETR, EVRG, FE, POR, PNM, PNW; Gas Utilities: ATO, OGS, NWN, SR; Combination Utilities: AVA, BKH, CNP, DUK, EXC, ED, LNT, NI, NWE, PPL, XEL; Renewables: AY, BEP.UN, BLX, CWEN.A, INE, NEP, NPI go below this line 1. Since Arizona’s listing on December 1 , 2015, the day following the merger of Indiana and UIL Confidential | 53 2. Data reflects multiple average since the Unaffected Date (03/06/2024) 3. Data reflects multiple average up until the Unaffected Date (03/06/2024)
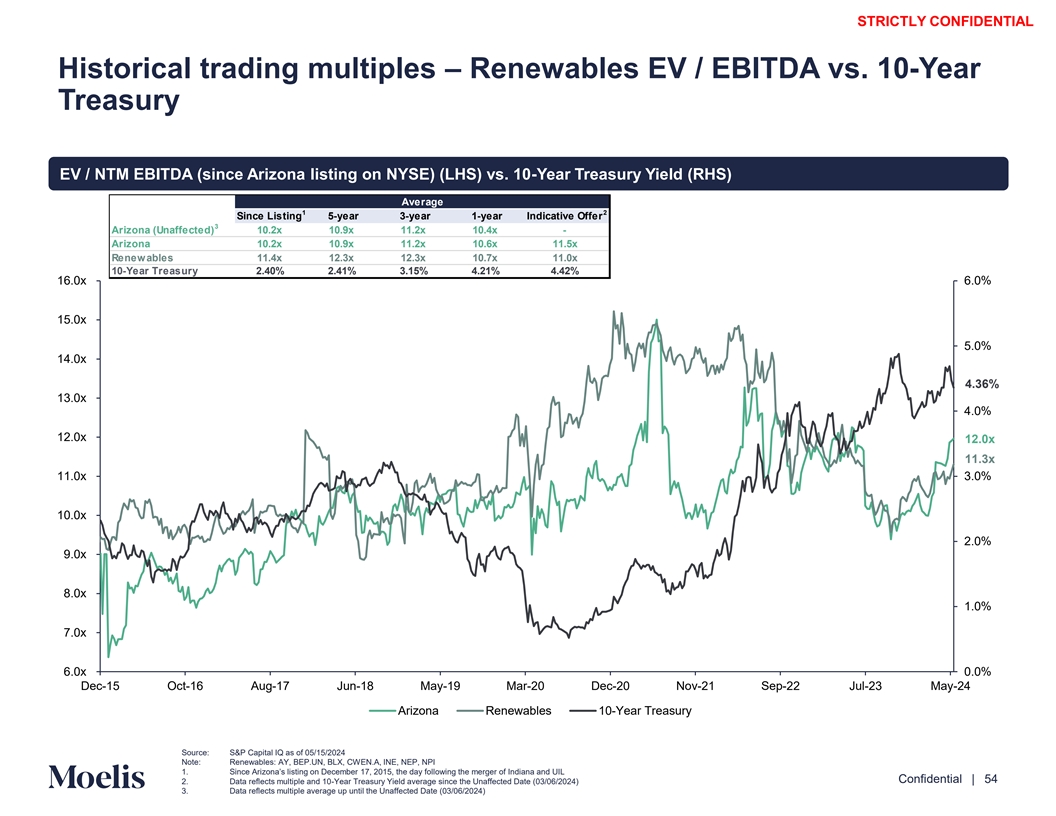
STRICTLY CONFIDENTIAL Historical trading multiples – Renewables EV / EBITDA vs. 10-Year Treasury EV / NTM EBITDA (since Arizona listing on NYSE) (LHS) vs. 10-Year Treasury Yield (RHS) Average 1 2 Since Listing 5-year 3-year 1-year Indicative Offer 3 Arizona (Unaffected) 10.2x 10.9x 11.2x 10.4x - Arizona 10.2x 10.9x 11.2x 10.6x 11.5x Renewables 11.4x 12.3x 12.3x 10.7x 11.0x 10-Year Treasury 2.40% 2.41% 3.15% 4.21% 4.42% 16.0x 6.0% 15.0x 5.0% 14.0x 4.36% 13.0x 4.0% 12.0x 12.0x 11.3x 11.0x 3.0% 10.0x 2.0% 9.0x 8.0x 1.0% 7.0x 6.0x 0.0% Dec-15 Oct-16 Aug-17 Jun-18 May-19 Mar-20 Dec-20 Nov-21 Sep-22 Jul-23 May-24 Arizona Renewables 10-Year Treasury Content must not Source: S&P Capital IQ as of 05/15/2024 Note: Renewables: AY, BEP.UN, BLX, CWEN.A, INE, NEP, NPI go below this line 1. Since Arizona’s listing on December 1 , 2015, the day following the merger of Indiana and UIL Confidential | 54 2. Data reflects multiple and 10-Year Treasury Yield average since the Unaffected Date (03/06/2024) 3. Data reflects multiple average up until the Unaffected Date (03/06/2024)

STRICTLY CONFIDENTIAL Benchmarking the Management Forecast The current Management Forecast is lower than the 2022 Arizona projections, though broadly in-line with equity research estimates Commentary • In September 2022, Arizona prepared a three-year financial forecast (the “2022 Management Forecast”) for its Board of D mieet rect ing ors • Key differences between the 2022 Management Forecast and the current Management Forecast are as follows: o The 2022 Management Forecast included impacts and financings related to the withdrawn PNM Resources acquisition o Current Management Forecast includes more moderate growth expectations; 2022 Management Forecast included 2022E-2025E EBITDA CAGR of ~20%, current Management Forecasts suggests a 2024E-2035E consolidated EBITDA CAGR of 7.6% o 2022 Management Forecast was constructed on a consolidated basis; current Management Forecast broken out by business segment, down to operating company • Primary drivers of growth referenced by equity research include organic growth following the withdrawn PNM Resources transaction, with additional upside driven by successful execution of M&A and growth in the renewable business, particularly offshore wind • Current equity research forecasts further supported by constructive rate case settlements (e.g. New York) EBITDA ($ mm) Arizona actuals Current Management Forecast 1 2022 Management Forecast 2 Median broker estimates $4,081 $3,820 $3, 38 $3,530 $3,354 $3,2 1 $3,045 $2, 0 $2,858 $2, 23 $2, 03 $2,4 8 $2,551 $2,334 $2,112 $2,118 $2,008 $1, 4 2021A 2022A 2023A 2024E 2025E 202 E 202 E 2028E 202 E 2030E Content must not go below this line Source: Management Forecast, Wall Street research Confidential | 55 1. As per Arizona Board of Directors presentation dated 09/20/2022 2. Median of projections by BofA Securities, Janney, JP Morgan, Mizuho, Wells Fargo, Siebert Williams Shank & Co., Wolfe Research, as available
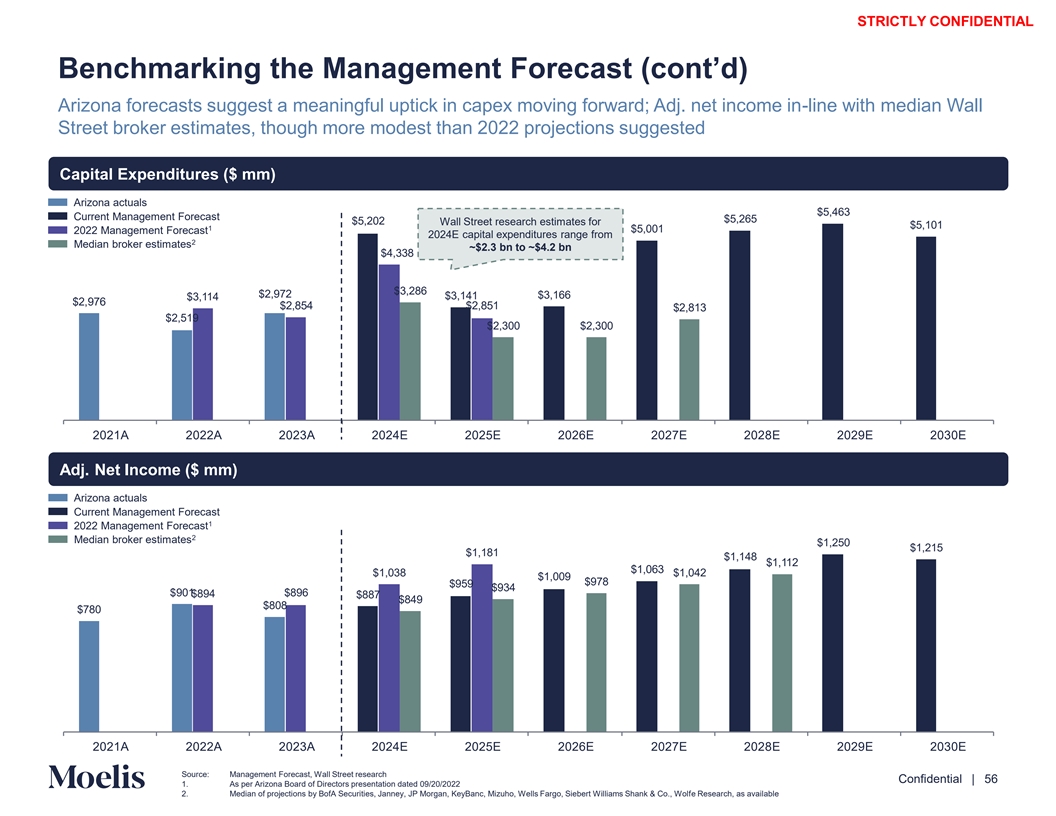
STRICTLY CONFIDENTIAL Benchmarking the Management Forecast (cont’d) Arizona forecasts suggest a meaningful uptick in capex moving forward; Adj. net income in-line with median Wall Street broker estimates, though more modest than 2022 projections suggested Capital Expenditures ($ mm) Arizona actuals $5,4 3 Current Management Forecast $5,2 5 $5,202 Wall Street research estimates for $5,101 1 $5,001 2022 Management Forecast 2024E capital expenditures range from 2 Median broker estimates ~$2.3 bn to ~$4.2 bn $4,338 $3,28 $2, 2 $3,1 $3,141 $3,114 $2, $2,854 $2,851 $2,813 $2,51 $2,300 $2,300 2021A 2022A 2023A 2024E 2025E 202 E 202 E 2028E 202 E 2030E Adj. Net Income ($ mm) Arizona actuals Current Management Forecast 1 2022 Management Forecast 2 Median broker estimates $1,250 $1,215 $1,181 $1,148 $1,112 $1,0 3 $1,038 $1,042 $1,00 $ 8 $ 5 $ 34 $ 01 $8 $8 4 $88 $84 $808 $ 80 2021A 2022A 2023A 2024E 2025E 202 E 202 E 2028E 202 E 2030E Content must not go below this line Source: Management Forecast, Wall Street research Confidential | 56 1. As per Arizona Board of Directors presentation dated 09/20/2022 2. Median of projections by BofA Securities, Janney, JP Morgan, KeyBanc, Mizuho, Wells Fargo, Siebert Williams Shank & Co., Wolfe Research, as available

STRICTLY CONFIDENTIAL Projected FFO-to-debt (S&P methodology) Management Forecast 12.3 12.3 12.1 12.0 11. 11.8 11.4 11.3 11.1 10.8 10. 10.5 2024E 2025E 202 E 202 E 2028E 202 E 2030E 2031E 2032E 2033E 2034E 2035E Budget Forecast Forecast Forecast Forecast Forecast Forecast Forecast Forecast Forecast Forecast Forecast ($ mm) 2024E 2025E 2026E 2027E 2028E 2029E 2030E 2031E 2032E 2033E 2034E 2035E EBITDA $2,334 $2,723 $2,990 $3,271 $3,530 $3,820 $4,081 $4,348 $4,603 $4,854 $5,084 $5,235 OLA Rent Expense $18 $18 $18 $18 $18 $18 $18 $18 $18 $18 $18 $18 Interest on ARO $15 $15 $15 $15 $15 $15 $15 $15 $15 $15 $15 $15 Securitization Revenues (Interest) – ($39) ($36) ($32) ($29) ($25) ($21) ($17) ($12) ($8) ($3) – S&P EBITDA $2,367 $2,717 $2,987 $3,272 $3,534 $3,828 $4,093 $4,365 $4,624 $4,879 $5,114 $5,268 Interest on Operating Leases ($9) ($9) ($9) ($9) ($9) ($9) ($9) ($9) ($9) ($9) ($9) ($9) Cash Paid Interest ($438) ($616) ($671) ($771) ($879) ($948) ($1,060) ($1,132) ($1,173) ($1,215) ($1,214) ($1,211) Capitalized Interest ($115) ($115) ($115) ($115) ($115) ($115) ($115) ($115) ($115) ($115) ($115) ($115) Securitization Interest Expense – $32 $29 $27 $24 $20 $17 $14 $10 $6 $2 – Cash Paid Taxes $252 $218 $163 $187 $194 $226 $388 $430 $453 $499 $409 $362 Adjustments – – – – – – – ($7) ($8) ($9) ($9) ($10) S&P FFO $2,056 $2,227 $2,385 $2,592 $2,749 $3,002 $3,315 $3,546 $3,782 $4,036 $4,178 $4,285 Short-term Debt $1,361 $1,963 $1,963 $1,963 $1,963 $1,963 $1,963 $1,963 $1,963 $1,963 $1,963 $1,963 Long-term Debt $15,104 $16,179 $17,958 $20,755 $23,535 $26,220 $28,099 $29,086 $30,223 $31,127 $31,663 $31,869 Adjustments $1 $2 $2 $12 $63 $102 $187 $233 $262 $276 $280 $283 Total Debt $16,466 $18,143 $19,923 $22,730 $25,560 $28,284 $30,249 $31,282 $32,447 $33,366 $33,905 $34,114 Surplus Cash ($38) ($38) ($206) ($206) ($207) ($208) ($209) ($210) ($211) ($211) ($212) ($213) Asset Retirement Obligation $242 $242 $242 $242 $242 $242 $242 $242 $242 $242 $242 $242 Pension Liability $474 $474 $474 $474 $474 $474 $474 $474 $474 $474 $474 $474 Operating Leases $296 $296 $296 $296 $296 $296 $296 $296 $296 $296 $296 $296 Securitized Debt Balance Adjustment ($788) ($726) ($661) ($592) ($520) ($444) ($364) ($280) ($191) ($98) – – S&P Debt $16,652 $18,391 $20,068 $22,943 $25,845 $28,645 $30,688 $31,805 $33,057 $34,069 $34,704 $34,913 S&P FFO-to-Debt 12.3% 12.1% 11.9% 11.3% 10.6% 10.5% 10.8% 11.1% 11.4% 11.8% 12.0% 12.3% Content must not go below this line Confidential | 57 Source: Management Forecast S P FF Debt

STRICTLY CONFIDENTIAL Selected research analyst ratings and price targets 3 out of 8 major research analysts had a “sell” rating on Arizona prior to the Indicative Offer; does not reflect analyst research published after Q1 earnings Broker 1 Pre-Announcement Price Target Valuation Methodology Report Date Unaffected Price: $32.08 $34.25: Indicative Offer ▪ P / E and EV / EBITDA Multiples SOTP o 13.2x 2026E EPS of $1.98 (Regulated Utilities); 20.3x 2026E EPS of $0.65 (Renewables) $31.00 o Regulated Utilities valued using a 1.0-3.0x discount to the electric/gas sector avg. P/E; Renewables 03/07/2024 valued at approx. 10.0x EBITDA; offshore wind is valued using a DCF with 15% discount rate ▪ P / E Multiple $35.00 o 14.1x 2025E EPS of $2.48 03/08/2024 ▪ P / E Multiples SOTP Price target raised to $32.00 following o Avg. 13.2x 2025E EPS of $2.43 across Networks and Renewables $31.00 announcement 03/20/2024 o Represents a discount to regulated utility peers ▪ P / E Multiple PT: NA o ~14.0x 2024E EPS of $2.32 Rating: HOLD / Neutral 02/22/2024 o Represents 11% discount to multi-industry Utilities trading at ~16.0x ▪ P / E and EV / EBTIDA Multiples SOTP o $23.50 PT for electric networks based on 11.9x (15% discount to group avg.) 2026E EPS of $1.96 / $6.50 PT for gas networks based on 11.9x (15% discount to group avg.) 2026E EPS of $0.52 / $9.00 $34.00 PT for renewables based on 11.0x EV/EBITDA (equivalent to the group avg.) 03/11/2024 o PT reduced by $5.00 to account for expectation of $3.0 billion of parent debt in 2026 ▪ P / E Multiple $35.00 o 14.25-14.725x 2025E EPS of $2.45 03/07/2024 ▪ P / E Multiple $30.00 o 12.3x 2025E EPS of $2.43 03/10/2024 ▪ Various methodologies o Dividend yield range of 4.00%-4.50%, a Price-to-Book value of 1.0x, a Price-to-Cash Flow value of $52.00 9.0x-10.0x, an EV/EBITDA value of 11.5x-12.5x and a P/E multiple of 19.5x-20.5x 03/11/2024 o PT represents 18.8x 2025E EPS of $2.40 Median pre-announcement Buy / Overperform Rating Hold / Neutral Rating Sell / Underperform Rating price target: $34.00 Content must not go below this line Source: Wall Street Research, S&P Capital IQ Confidential | 58 1. References pre-announcement reports for brokers that removed ratings following the Indicative Offer; BofA Securities valuation methodology per report dated 01/11/2024, Janney valuation methodology per report dated 02/23/2024, Wells Fargo valuation methodology per report dated 02/22/2024; Wolfe Research valuation methodology per report dated 02/22/2024

STRICTLY CONFIDENTIAL Proposed Special Committee roadmap and key questions Phase 1 Phase 2 Phase 3 Fact Gathering Evaluation of the offer and alternatives Negotiations Negotiate Understand the Reach Context Analysis Response with agreement offer Indiana I. Withdraws What is the SC’s What is the best What are the key Is now the right offer perspective on the negotiating terms? time? forecast? strategy? I. Becomes unfriendly What are the key How does the offer What information stakeholder compare vs. What are the deal is needed to considerations potential status terms to focus on? evaluate the offer? (incl. regulatory) to quo value? be considered? Special Committee to What are the key consider other practical What is the current What are the What are the right process, timing market and practical alternatives and tactical next steps? industry backdrop? alternatives? considerations? Moelis will assist the Special Committee through each phase of the roadmap Develop Diligence Key forecast Risks and Value implied Negotiation Viability of process takeaways assumptions opportunities by forecast and tactics alternatives Content must not go below this line Confidential | 59
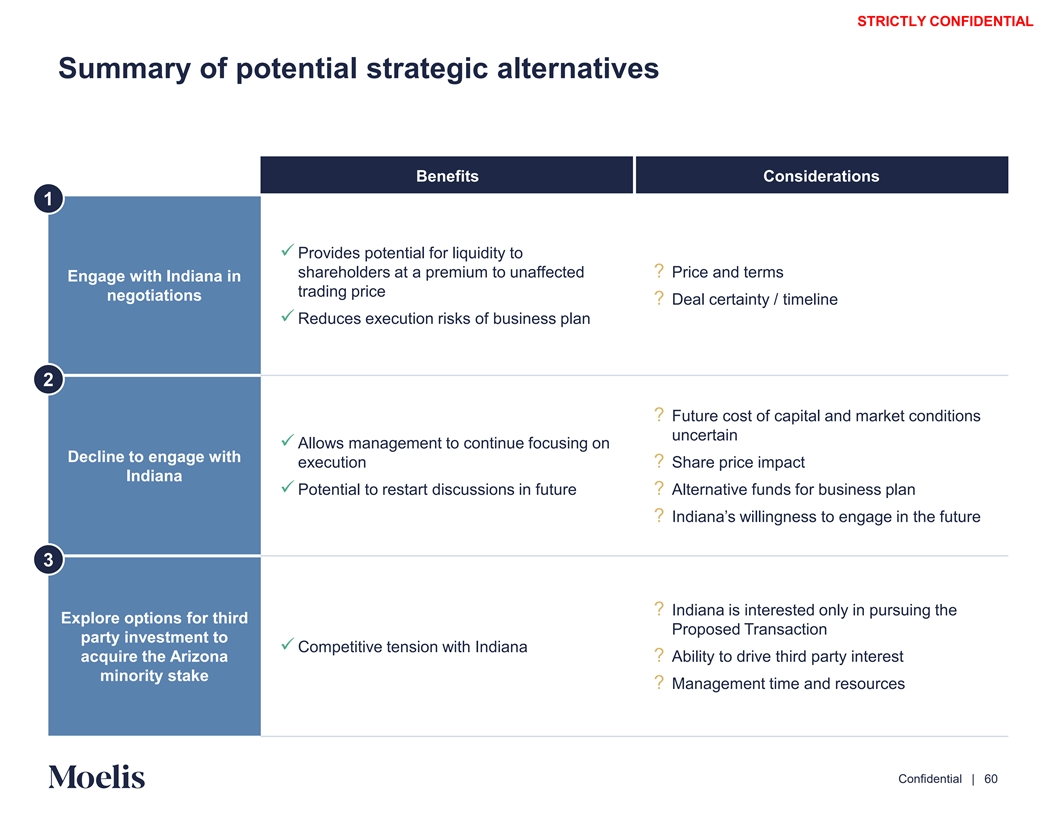
STRICTLY CONFIDENTIAL Summary of potential strategic alternatives Benefits Considerations 1 ✓ Provides potential for liquidity to shareholders at a premium to unaffected ? Price and terms Engage with Indiana in trading price negotiations ? Deal certainty / timeline ✓ Reduces execution risks of business plan 2 ? Future cost of capital and market conditions uncertain ✓ Allows management to continue focusing on Decline to engage with execution ? Share price impact Indiana ✓ Potential to restart discussions in future ? Alternative funds for business plan ? Indiana’s willingness to engage in the future 3 ? Indiana is interested only in pursuing the Explore options for third Proposed Transaction party investment to ✓ Competitive tension with Indiana acquire the Arizona ? Ability to drive third party interest minority stake ? Management time and resources Content must not go below this line Confidential | 60
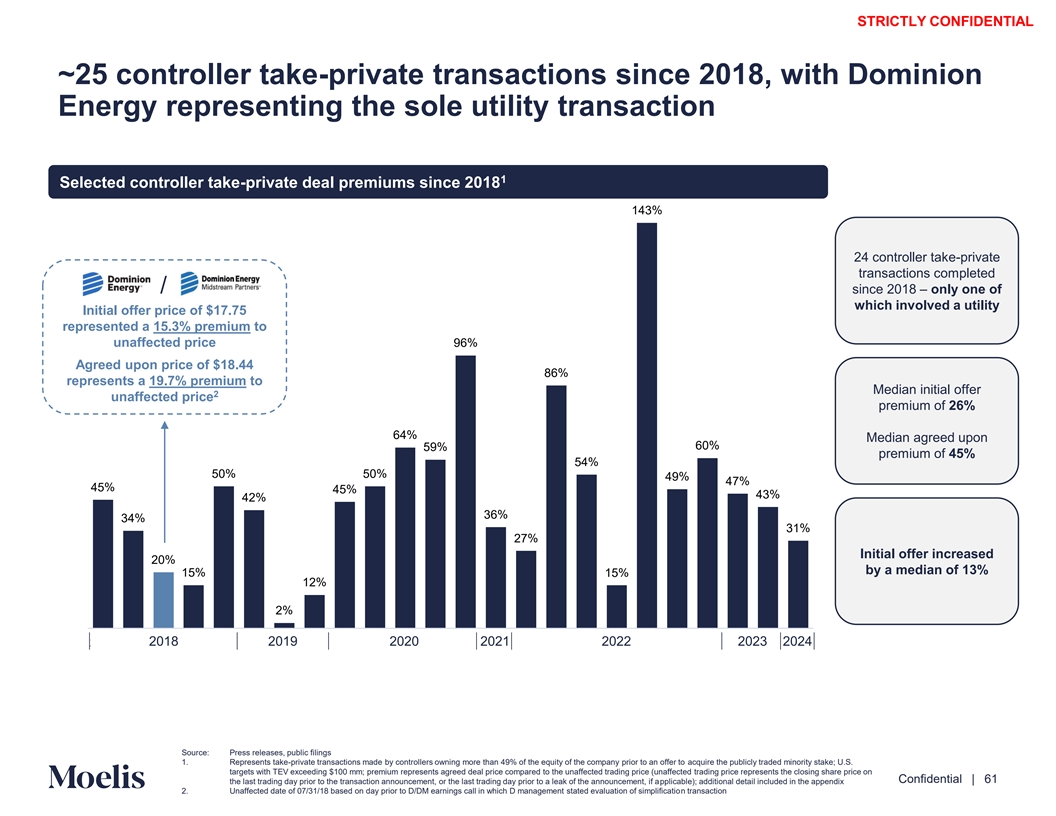
STRICTLY CONFIDENTIAL ~25 controller take-private transactions since 2018, with Dominion Energy representing the sole utility transaction 1 Selected controller take-private deal premiums since 2018 143% 24 controller take-private transactions completed / since 2018 – only one of which involved a utility Initial offer price of $17.75 represented a 15.3% premium to unaffected price 96% Agreed upon price of $18.44 86% represents a 19.7% premium to Median initial offer 2 unaffected price premium of 26% 64% Median agreed upon 60% 59% premium of 45% 54% 50% 50% 49% 47% 45% 45% 43% 42% 36% 34% 31% 27% Initial offer increased 20% by a median of 13% 15% 15% 12% 2% 2018 2018 2018 2018 2018 2018 20192019 2019 2019 2020 20202020 2020 2020 20202021 2021 2022 2022 20222022 2022 2022 2022 2022 202 2023 3 20232024 2024 Content must not Source: Press releases, public filings 1. Represents take-private transactions made by controllers owning more than 49% of the equity of the company prior to an offer to acquire the publicly traded minority stake; U.S. go below this line targets with TEV exceeding $100 mm; premium represents agreed deal price compared to the unaffected trading price (unaffected trading price represents the closing share price on Confidential | 61 the last trading day prior to the transaction announcement, or the last trading day prior to a leak of the announcement, if applicable); additional detail included in the appendix 2. Unaffected date of 07/31/18 based on day prior to D/DM earnings call in which D management stated evaluation of simplification transaction
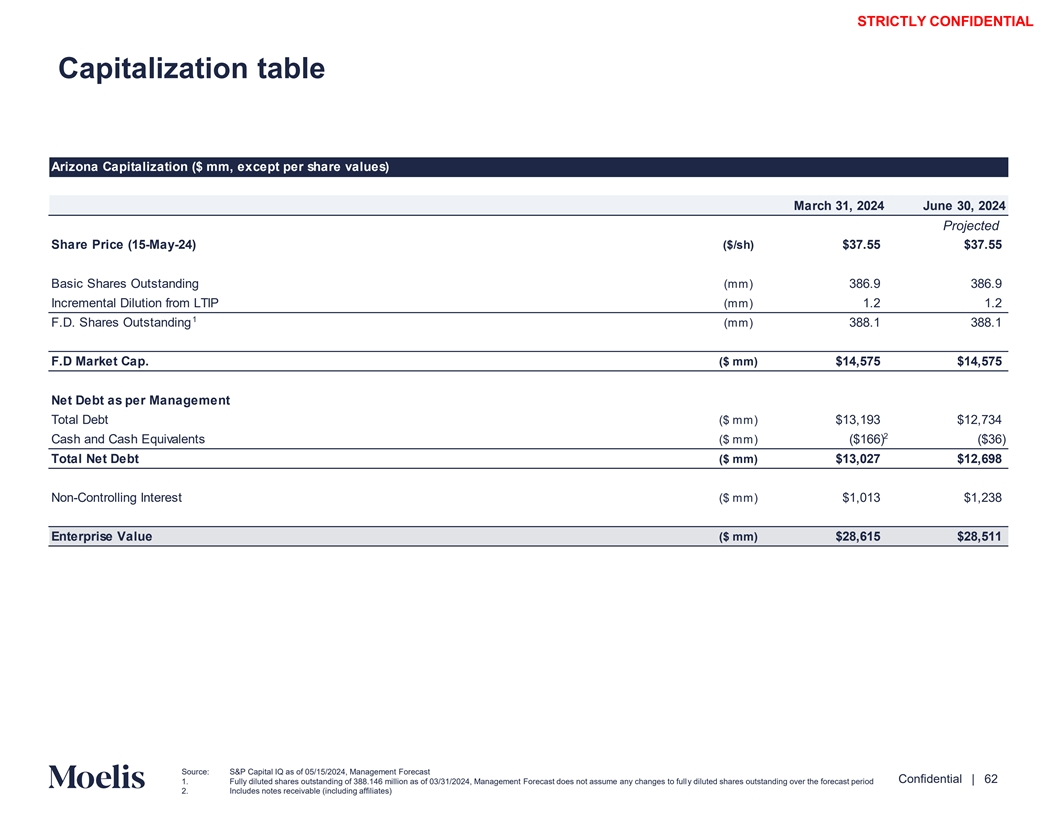
STRICTLY CONFIDENTIAL Capitalization table Arizona Capitalization ($ mm, except per share values) March 31, 2024 June 30, 2024 Projected Share Price (15-May-24) ($/sh) $37.55 $37.55 Basic Shares Outstanding (mm) 386.9 386.9 Incremental Dilution from LTIP (mm) 1.2 1.2 1 F.D. Shares Outstanding (mm) 388.1 388.1 F.D Market Cap. ($ mm) $14,575 $14,575 Net Debt as per Management Total Debt ($ mm) $13,193 $12,734 2 Cash and Cash Equivalents ($ mm) ($166) ($36) Total Net Debt ($ mm) $13,027 $12,698 Non-Controlling Interest ($ mm) $1,013 $1,238 Enterprise Value ($ mm) $28,615 $28,511 Content must not go below this line Source: S&P Capital IQ as of 05/15/2024, Management Forecast Confidential | 62 1. Fully diluted shares outstanding of 388.146 million as of 03/31/2024, Management Forecast does not assume any changes to fully diluted shares outstanding over the forecast period 2. Includes notes receivable (including affiliates)
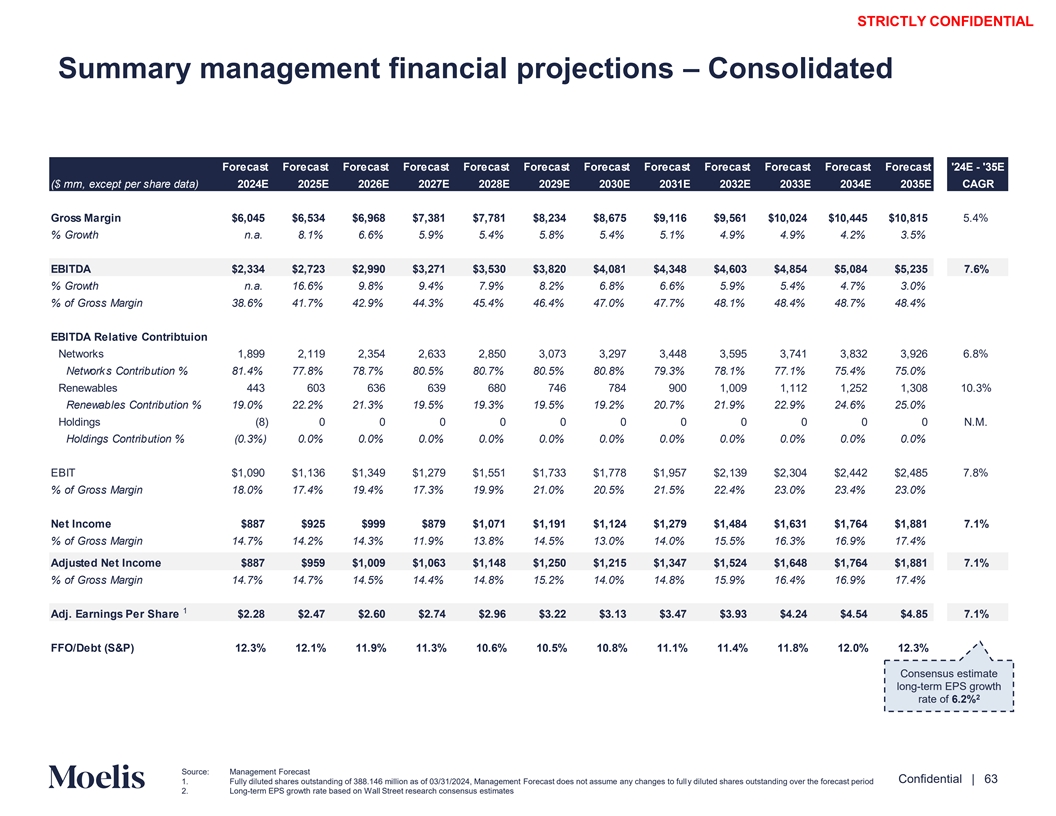
STRICTLY CONFIDENTIAL Summary management financial projections – Consolidated Forecast Forecast Forecast Forecast Forecast Forecast Forecast Forecast Forecast Forecast Forecast Forecast '24E - '35E ($ mm, except per share data) 2024E 2025E 2026E 2027E 2028E 2029E 2030E 2031E 2032E 2033E 2034E 2035E CAGR Gross Margin $6,045 $6,534 $6,968 $7,381 $7,781 $8,234 $8,675 $9,116 $9,561 $10,024 $10,445 $10,815 5.4% % Growth n.a. 8.1% 6.6% 5.9% 5.4% 5.8% 5.4% 5.1% 4.9% 4.9% 4.2% 3.5% EBITDA $2,334 $2,723 $2,990 $3,271 $3,530 $3,820 $4,081 $4,348 $4,603 $4,854 $5,084 $5,235 7.6% % Growth n.a. 16.6% 9.8% 9.4% 7.9% 8.2% 6.8% 6.6% 5.9% 5.4% 4.7% 3.0% % of Gross Margin 38.6% 41.7% 42.9% 44.3% 45.4% 46.4% 47.0% 47.7% 48.1% 48.4% 48.7% 48.4% EBITDA Relative Contribtuion Networks 1,899 2,119 2,354 2,633 2,850 3,073 3,297 3,448 3,595 3,741 3,832 3,926 6.8% Networks Contribution % 81.4% 77.8% 78.7% 80.5% 80.7% 80.5% 80.8% 79.3% 78.1% 77.1% 75.4% 75.0% Renewables 443 603 636 639 680 746 784 900 1,009 1,112 1,252 1,308 10.3% Renewables Contribution % 19.0% 22.2% 21.3% 19.5% 19.3% 19.5% 19.2% 20.7% 21.9% 22.9% 24.6% 25.0% Holdings (8) 0 0 0 0 0 0 0 0 0 0 0 N.M. Holdings Contribution % (0.3%) 0.0% 0.0% 0.0% 0.0% 0.0% 0.0% 0.0% 0.0% 0.0% 0.0% 0.0% EBIT $1,090 $1,136 $1,349 $1,279 $1,551 $1,733 $1,778 $1,957 $2,139 $2,304 $2,442 $2,485 7.8% % of Gross Margin 18.0% 17.4% 19.4% 17.3% 19.9% 21.0% 20.5% 21.5% 22.4% 23.0% 23.4% 23.0% Net Income $887 $925 $999 $879 $1,071 $1,191 $1,124 $1,279 $1,484 $1,631 $1,764 $1,881 7.1% % of Gross Margin 14.7% 14.2% 14.3% 11.9% 13.8% 14.5% 13.0% 14.0% 15.5% 16.3% 16.9% 17.4% Adjusted Net Income $887 $959 $1,009 $1,063 $1,148 $1,250 $1,215 $1,347 $1,524 $1,648 $1,764 $1,881 7.1% % of Gross Margin 14.7% 14.7% 14.5% 14.4% 14.8% 15.2% 14.0% 14.8% 15.9% 16.4% 16.9% 17.4% 1 Adj. Earnings Per Share $2.28 $2.47 $2.60 $2.74 $2.96 $3.22 $3.13 $3.47 $3.93 $4.24 $4.54 $4.85 7.1% FFO/Debt (S&P) 12.3% 12.1% 11.9% 11.3% 10.6% 10.5% 10.8% 11.1% 11.4% 11.8% 12.0% 12.3% Consensus estimate long-term EPS growth 2 rate of 6.2% Content must not go below this line Source: Management Forecast Confidential | 63 1. Fully diluted shares outstanding of 388.146 million as of 03/31/2024, Management Forecast does not assume any changes to fully diluted shares outstanding over the forecast period 2. Long-term EPS growth rate based on Wall Street research consensus estimates

STRICTLY CONFIDENTIAL Summary management financial projections – Networks Forecast Forecast Forecast Forecast Forecast Forecast Forecast Forecast Forecast Forecast Forecast Forecast '24E - '35E ($ mm) 2024E 2025E 2026E 2027E 2028E 2029E 2030E 2031E 2032E 2033E 2034E 2035E CAGR Gross Margin $5,022 $5,248 $5,631 $6,027 $6,359 $6,714 $7,069 $7,347 $7,637 $7,931 $8,168 $8,422 4.8% % Growth 4.5% 7.3% 7.0% 5.5% 5.6% 5.3% 3.9% 3.9% 3.8% 3.0% 3.1% EBITDA $1,899 $2,119 $2,354 $2,633 $2,850 $3,073 $3,297 $3,448 $3,595 $3,741 $3,832 $3,926 6.8% % Growth 11.6% 11.1% 11.9% 8.2% 7.8% 7.3% 4.6% 4.3% 4.1% 2.4% 2.5% % of Gross Margin 37.8% 40.4% 41.8% 43.7% 44.8% 45.8% 46.6% 46.9% 47.1% 47.2% 46.9% 46.6% EBIT $1,126 $1,257 $1,413 $1,604 $1,741 $1,898 $2,025 $2,122 $2,215 $2,303 $2,335 $2,369 7.0% % of Gross Margin 22.4% 24.0% 25.1% 26.6% 27.4% 28.3% 28.7% 28.9% 29.0% 29.0% 28.6% 28.1% Net Income $835 $926 $944 $963 $1,046 $1,134 $1,210 $1,269 $1,310 $1,350 $1,390 $1,427 5.0% % of Gross Margin 16.6% 17.7% 16.8% 16.0% 16.4% 16.9% 17.1% 17.3% 17.2% 17.0% 17.0% 16.9% Content must not go below this line Confidential | 64 Source: Management Forecast

STRICTLY CONFIDENTIAL Summary management financial projections – Renewables Forecast Forecast Forecast Forecast Forecast Forecast Forecast Forecast Forecast Forecast Forecast Forecast '24E - '35E ($ mm) 2024E 2025E 2026E 2027E 2028E 2029E 2030E 2031E 2032E 2033E 2034E 2035E CAGR Gross Margin $1,029 $1,292 $1,342 $1,360 $1,427 $1,526 $1,612 $1,775 $1,929 $2,100 $2,283 $2,399 8.0% % Growth 25.6% 3.9% 1.3% 5.0% 6.9% 5.6% 10.1% 8.7% 8.8% 8.7% 5.1% EBITDA $443 $603 $636 $639 $680 $746 $784 $900 $1,009 $1,112 $1,252 $1,308 10.3% % Growth 36.1% 5.4% 0.4% 6.5% 9.7% 5.0% 14.9% 12.0% 10.3% 12.5% 4.5% % of Gross Margin 43.1% 46.7% 47.4% 47.0% 47.6% 48.9% 48.6% 50.7% 52.3% 53.0% 54.8% 54.5% EBIT ($20) ($114) ($57) ($317) ($183) ($158) ($240) ($158) ($68) $8 $114 $123 N/A % of Gross Margin (1.9%) (8.8%) (4.3%) (23.3%) (12.8%) (10.3%) (14.9%) (8.9%) (3.5%) 0.4% 5.0% 5.1% Net Income $204 $181 $257 $131 $281 $351 $273 $422 $622 $756 $868 $961 15.1% % of Gross Margin 19.8% 14.0% 19.2% 9.7% 19.7% 23.0% 16.9% 23.8% 32.3% 36.0% 38.0% 40.0% Adjusted Net Income $204 $215 $267 $316 $358 $409 $364 $490 $662 $772 $868 $961 15.1% % of Gross Margin 19.8% 16.6% 19.9% 23.2% 25.1% 26.8% 22.5% 27.6% 34.3% 36.8% 38.0% 40.0% Arizona Management estimates run-rate EBITDA (reflective of capital spend through 2035) of $1,400 mm Content must not go below this line Confidential | 65 Source: Management Forecast
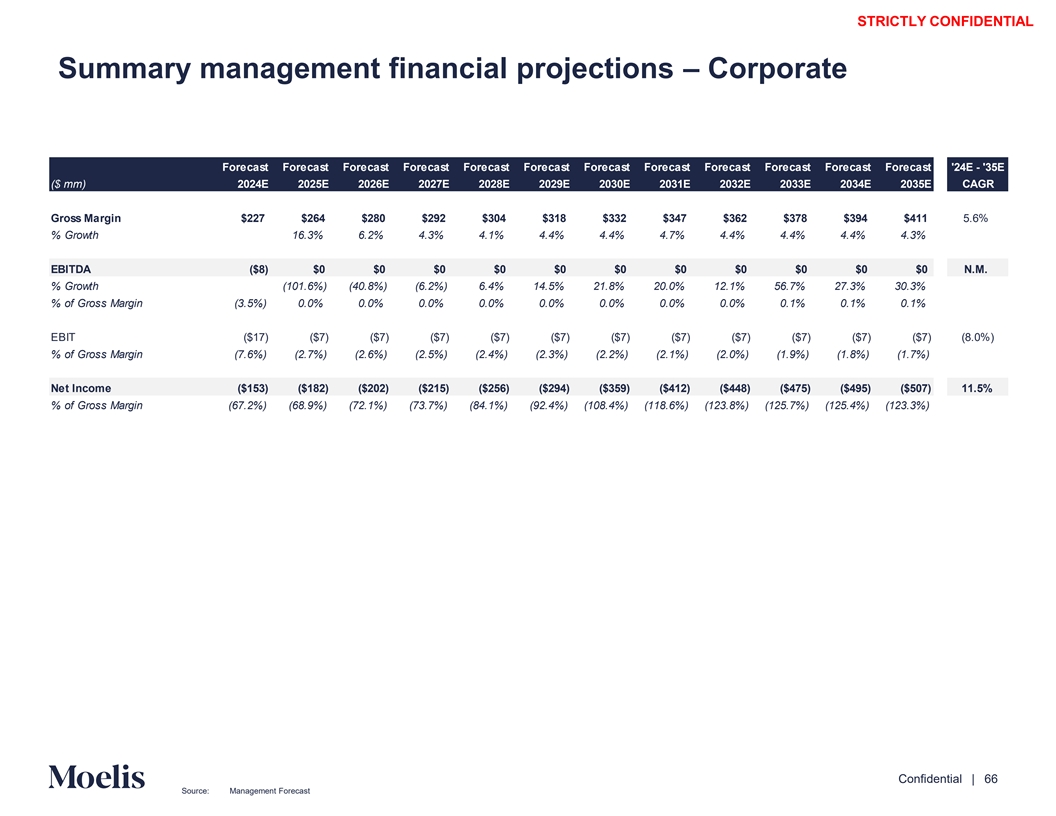
STRICTLY CONFIDENTIAL Summary management financial projections – Corporate Forecast Forecast Forecast Forecast Forecast Forecast Forecast Forecast Forecast Forecast Forecast Forecast '24E - '35E ($ mm) 2024E 2025E 2026E 2027E 2028E 2029E 2030E 2031E 2032E 2033E 2034E 2035E CAGR Gross Margin $227 $264 $280 $292 $304 $318 $332 $347 $362 $378 $394 $411 5.6% % Growth 16.3% 6.2% 4.3% 4.1% 4.4% 4.4% 4.7% 4.4% 4.4% 4.4% 4.3% EBITDA ($8) $0 $0 $0 $0 $0 $0 $0 $0 $0 $0 $0 N.M. % Growth (101.6%) (40.8%) (6.2%) 6.4% 14.5% 21.8% 20.0% 12.1% 56.7% 27.3% 30.3% % of Gross Margin (3.5%) 0.0% 0.0% 0.0% 0.0% 0.0% 0.0% 0.0% 0.0% 0.1% 0.1% 0.1% EBIT ($17) ($7) ($7) ($7) ($7) ($7) ($7) ($7) ($7) ($7) ($7) ($7) (8.0%) % of Gross Margin (7.6%) (2.7%) (2.6%) (2.5%) (2.4%) (2.3%) (2.2%) (2.1%) (2.0%) (1.9%) (1.8%) (1.7%) Net Income ($153) ($182) ($202) ($215) ($256) ($294) ($359) ($412) ($448) ($475) ($495) ($507) 11.5% % of Gross Margin (67.2%) (68.9%) (72.1%) (73.7%) (84.1%) (92.4%) (108.4%) (118.6%) (123.8%) (125.7%) (125.4%) (123.3%) Content must not go below this line Confidential | 66 Source: Management Forecast

STRICTLY CONFIDENTIAL Summary of top shareholders Institutional investors outside of Indiana have an avg. cost basis of $39.94 2,3 Ownership and cost basis by shareholder group Ownership detail (excl. Indiana) Position Ownership Market value Avg. cost basis Shareholder 6 (mm) (%) ($mm) ($ / share) Iberdrola, S.A. 315.7 81.6% $11,853.0 $29.49 1 Qatar Investment Authority 14.4 3.7% 540.6 51.40 Vanguard Group Inc/The 7.6 2.0% 284.5 33.26 5 Atlas Infrastructure Partners 6.9 1.8% 259.1 41.00 BlackRock Inc 6.9 1.8% 258.1 39.50 edge fund Brokerage Clean Energy Transition LLP 2.3 0.6% 87.6 30.22 Mackenzie Financial Corp 2.0 0.5% 76.1 38.10 State Street Corp 1.7 0.4% 63.3 37.03 Sovereign ther nsurance wealth fund Morgan Stanley 1.3 0.3% 50.6 39.02 Two Sigma Investments LP 1.2 0.3% 43.8 32.98 Corp Geode Capital Management LLC 1.1 0.3% 39.8 36.33 Legal & General Group PLC 1.0 0.3% 36.8 37.36 Norges Bank 0.9 0.2% 35.1 33.50 Robeco Schweiz AG 0.9 0.2% 33.0 40.43 Voloridge Investment Management 0.8 0.2% 31.2 34.05 Millennium Management LLC/NY 0.8 0.2% 29.2 33.06 nvestment adviso r Charles Schwab Corp/The 0.7 0.2% 24.7 37.34 JPMorgan Chase & Co 0.7 0.2% 24.4 39.31 GAMCO Investors 0.6 0.2% 23.2 35.81 Squarepoint Ops LLC 0.6 0.2% 22.9 35.26 AQR Capital Management LLC 0.5 0.1% 19.1 40.56 Citadel Advisors LLC 0.4 0.1% 15.2 35.41 Grace Partners (First Trust) 0.4 0.1% 15.0 39.71 Dimensional Fund Advisors LP 0.4 0.1% 14.5 31.69 Accrued Equities Inc 0.4 0.1% 14.5 35.59 Other institutional holders 13.5 3.4% 507.1 36.84 Weighted avg. cost basis Total institutional holders 383.6 99.0% $14,402.3 $31.34 4: (excl. Indiana) $39.94 Insiders 0.3 0.1% $11.4 $34.02 Unknown holders 3.1 0.9% $114.5 NA Median cost basis 4: (excl. Indiana) $36.84 Total 386.9 100.0% $14,528.3 $31.33 Source: Bloomberg, Capital IQ, company filings as of 05/15/2024 1. Ownership position assumed to be unchanged versus initial sale of Arizona common stock to Qatar Investment Auth ow orinty’s ed su wh bo silldyiary, Hyde Member LLC on 5/12/2021 Content must not 2. Excludes holdings by Indiana 3. “Other” includes investors classified by Bloomberg as “Trust”, “Pension”, “Holding Company”, “Endowment”, “Family oOf vefirce nm”e, n“t” , Unclassified”, or “Other” go below this line 4. Represents weighted average cost basis of institutional shareholders, excluding Indiana Confidential | 67 5. Atlas Infrastructure Partners’ average cost basis as per Arizona Management 6. Based on shares outstanding of 386.9 million, per Arizona 10-Q filed on 04/24/2024; excludes incremental dilution from LTIP
STRICTLY CONFIDENTIAL Disclaimer This presentation has been prepared by Moelis & Company LLC (“Moelis”) solely for the information and assistance iliated of the Unaff Committee (the “Special Committee”) of the Board of Directors of the company coded Arizona (the “Company”) in consi mattde ers ring the referred to in these materials. This presentation is confidential and may not be disclosed (in whole or in part) or utilized for other purposes without the express prior written consent of Moelis. This presentation has been prepared based on information provided by the Company and/or from third party sources. Moelis assumed such information is complete and accurate in all material respects. Moelis has not independently verified such information (or assumed responsibility for the independent verification of such information). To the extent this presentation includes projections, forecasts or other forward-looking statements, Moelis has assumed that such information was reasonably prepared based on the best currently available estimates and judgments of the Company and/or other parties as to the future performance of the Company and/or such other parties. Moelis expresses no views as to the reasonableness of any such projections, forecasts or other forward-looking statements or the assumptions on which they are based. Moelis has not made any independent evaluation or appraisal of any of the assets or liabilities (contingent, derivative, off-balance-sheet, or otherwise) of the Company or any other party. Moelis’ participation in any due diligence review is solely for purposes of dvsup ice po anrtd ing an alits ysia s. This presentation is based on economic, monetary, market and other conditions as in effect on, and the information made available to us as of the date hereof, and Moelis assumes no obligation to update this presentation or correct any information herein. No company or transaction used in this presentation is identical to the Company or any potential transaction. The analyses set forth in this presentation do not purport to be appraisals and such analyses do not reflect Moelis’ views of the prices at which businesses or securities actual d.l yB eca may use be the sol analyses described in these materials (including the information used in such analyses) are inherently subject to uncertainty, Moelis does not assume responsibility if future results are materially different from those forecast. This presentation was designed for use by certain persons familiar with the business of the Company. This presentation is not intended to provide the sole basis for any decision on any transaction or strategic alternative and is not a recommendation with respect to any transaction or strategic alternative. This presentation does not address the Company’s underlying business decision to engage ct in any ion or sttrran ategi sa c alternative or the relative merits of any transaction or strategic alternative as compared to any alternative business strategies or transactions that might be available to the Company. Nothing contained in this presentation should be construed as legal, regulatory, tax or accounting advice. Moelis and its affiliates are engaged globally in a wide range of investment banking and other activities for their own account and otherwise. Moelis and its affiliates may have advised, may seek to advise and may in the future advise companies referred to in this presentation. Personnel of Moelis or such affiliates may make statements or provide advice that is contrary to information included in this presentation. The proprietary interests of Moelis or its affiliates may conflict with your interests. In addition, Moelis and its affiliates and their personnel may from time to time have positions in or effect transactions in securities referred to in this material (or derivatives of such securities), or serve as a director of companies referred to in this presentation. Content must not go below this line Confidential | 68