UNITED STATES
SECURITIES AND EXCHANGE COMMISSION
Washington, D.C. 20549
FORM N-CSR
CERTIFIED SHAREHOLDER REPORT OF REGISTERED
MANAGEMENT INVESTMENT COMPANIES
Investment Company Act file number | 811-21902 |
|
Cohen & Steers Institutional Global Realty Shares, Inc. |
(Exact name of registrant as specified in charter) |
|
280 Park Avenue, New York, NY | | 10017 |
(Address of principal executive offices) | | (Zip code) |
|
Adam M. Derechin Cohen & Steers Capital Management, Inc. 280 Park Avenue New York, New York 10017 |
(Name and address of agent for service) |
|
Registrant’s telephone number, including area code: | (212) 832-3232 | |
|
Date of fiscal year end: | December 31 | |
|
Date of reporting period: | December 31, 2006 | |
| | | | | | | |
Item 1. Reports to Stockholders.
COHEN & STEERS INSTITUTIONAL GLOBAL REALTY SHARES, INC.
February 9, 2007
To Our Shareholders:
We are pleased to submit to you our report for the period ended December 31, 2006. The net asset value at that date was $29.57 per share. In addition, a distribution of $0.172 per share including an ordinary income dividend of $0.16 per share and a short-term capital gain distribution of $0.012 per share was declared for shareholders of record on December 21, 2006 and was paid on December 22, 2006.a
The total return, including income and change in net asset value, for Cohen and Steers Institutional Global Realty Shares and the comparative benchmarks was:
| | | 8/10/06
(Commencement
of Operations)
through 12/31/06 | |
| Cohen and Steers Institutional Global Realty Shares | | | 18.98 | % | |
| FTSE EPRA/NAREIT Global Real Estate Indexb | | | 20.79 | % | |
| S&P 500 Indexb | | | 12.36 | % | |
The performance data quoted represent past performance. Past performance is no guarantee of future results. The investment return and the principal value of an investment will fluctuate and shares, if redeemed, may be worth more or less than their original cost. Current performance may be lower or higher than the performance data quoted. Total returns of the fund current to the most recent month-end can be obtained by visiting our Web site at cohenandsteers.com.
Investment Review
Strong fundamentals propelled real estate stocks to new highs in the second half of 2006. After a volatile first half, the markets rallied as interest rates stabilized and the global economy showed signs of a mid-cycle slowdown rather than a recession. From the fund's inception (8/10/06) through year end, the FTSE EPRA/NAREIT Global Real Estate Index returned 20.79%
REIT legislation and real estate securitization dominated the news
The year's big story was significant progress toward the creation of REITs or REIT-like structures in key markets. U.K. REITs launched on January 1, 2007 and nine companies converted on January 2. German and Italian structures are expected later in the year. At that point, nearly 75% of Europe's GDP will have access to REIT-like structures.
a Please note that distributions paid by the fund to shareholders are subject to recharacterization for tax purposes. The final tax treatment of these distributions is reported to shareholders after the close of each fiscal year.
b FTSE EPRA/NAREIT Global Real Estate Index is an unmanaged portfolio of approximately 338 constituents from 22 countries. The S&P 500 Index is an unmanaged index of common stocks that is frequently used as a general measure of stock market performance.
1
COHEN & STEERS INSTITUTIONAL GLOBAL REALTY SHARES, INC.
The year's second major theme was the acceleration in the securitization of real estate internationally, as more real estate moved into the public markets. Investor participation in IPOs and secondary offerings allowed companies to purchase more assets and to fund development pipelines. Although widespread throughout Europe and Asia, the level of activity in Germany was especially noteworthy. German real estate stocks increased their presence on the benchmark, while the benchmark rose from $630 billion to $904 billion in the year.
In the U.S., however, the net trend was in favor of privatization. While there was some noteworthy IPO activity—Douglas Emmett, for example, raised more than $1.6 billion in the largest IPO in U.S. REIT history—this was dwarfed by the volume of buyout activity. There was more than $50 billion worth of LBO deals announced in the year, the bulk of which was Equity Office Properties Trust agreeing to be acquired by The Blackstone Group in a transaction valued at $36 billion, the largest announced LBO transaction of any type ever. In the weeks since, into February 2007, a bidding contest with Vornado Realty Trust has driven the price up to $39 billion.
Office and apartment sectors outperform
In most major markets, particularly London, Paris, Singapore, New York and Hong Kong, demand for space in nearly all property types continued to outstrip supply, spurring higher occupancies and rents. The cyclical recovery underway in most office and apartment markets was especially noteworthy and had a significant impact on stock price performance.
For the period since the fund's inception, France's total return of 30.9% was fueled by the robust Paris office market, while U.K. performance (25.4%) was driven by strong fundamentals and attractive valuations that did not fully factor in the benefits of the coming REIT structure. German stocks (13.3%) lagged after their strong results in the first period despite accelerated securitization activity and the anticipation of German REITs. Belgian stocks (10.7%) suffered from lagging property fundamentals, while in Austria (15.0%) investor concerns about significant equity issuance and sub-par corporate governance restrained prices.
Real Estate Securities Total Returns in Local Currencies
August 10-December 29, 2006

2
COHEN & STEERS INSTITUTIONAL GLOBAL REALTY SHARES, INC.
Australia (21.2%) and Japan (21.7%) were outperformers during the period since the fund's inception, as the underperformance earlier in 2006 put valuations more in line with fundamentals. Hong Kong (13.1%) underperformed the benchmark; however, we believe this market should catch up given the strong supply and demand characteristics in the property markets and cheap valuations.1
U.S. results (17.0%) reflected demand for nearly all types of space. Business-related travel supported positive hotel performance. Good absolute returns from the warehouse sector stemmed from productivity gains, higher output and additional leased space. The Equity Office Properties LBO reminded investors that private buyers continued to place a higher value on real estate than the public markets.
Performance lagged the index in the initial period
The fund's total return of 18.98% since inception lagged the FTSE EPRA NAREIT Global Real Estate Index, which returned 20.79% for the same period. Overweighting and stock selection in the Netherlands, Germany and Hong Kong/China dampened results. The fund also suffered for being underweight in Spain, where M&A activity generated high returns earlier in the year. The fund's weighting and stock selection in the U.S. and Italy positively affected returns, as did stock selection in the U.K. and Japan.
Investment Outlook
In our view, we believe the generally strong state of supply and demand for real estate globally will continue to be favorable and should drive real estate security performance in 2007. We expect rents and values in most property types, notably the office and apartment sectors, to continue rising, which we believe should support superior fundamental performance in 2007. In addition to internal growth, assuming the continued favorable interest rate environment that we forecast, access to attractively priced capital should enable these companies to add incremental growth through acquisitions and development.
Of course, there are certain risks that exist when investing in real estate securities, including declining property values or declining rents resulting from legal or economic developments. Foreign securities carry their own risks, such as currency fluctuations, political and economic uncertainties and differences in accounting standards.
Positive globally, neutral in the U.S.
Having said that, we believe Germany, Hong Kong and the U.K. are the most attractively positioned markets. In Germany, our forecast is that economic improvement and the introduction of REITs will shift assets from the private sector to the public markets, where more active management should create value. Hong Kong is a potent mix of high demand for space, limited supply, attractive valuations and investments in China. Positive factors in the U.K include the advent of REITs, high demand and minimal near-term supply for space, especially in the most sought-after sections of London.
In the U.S., we believe healthy employment is likely to continue despite slowing GDP growth. Our outlook for U.S. REIT cash flows and valuations is neutral, given projected cash flow growth in the 9% range—similar to 2006—and asset value premiums at historical norms. Therefore, during 2007 we expect attractive but more
1 Country returns are in local currency for the period from August 10, 2006-December 31, 2006.
3
COHEN & STEERS INSTITUTIONAL GLOBAL REALTY SHARES, INC.
normalized returns for U.S. real estate stocks, based on solid dividend yields and our forecast for continued attractive growth in cash flow.
We project continued M&A activity in the U.S. at current valuations, and more IPO activity elsewhere, particularly in countries introducing REIT structures as private real estate companies convert to receive more favorable tax treatment.
Overall, we believe that attractive valuations during the early stage of a structural change, overlaid with solid property fundamentals, should continue to drive strong total returns from global real estate securities. Our portfolio management objective remains focused on owning what we view as the most attractively valued stocks around the globe, an approach we believe will lead to attractive returns in this environment.
Sincerely,
 | |  | |
|
| MARTIN COHEN | | ROBERT H. STEERS | |
|
| Co-chairman | | Co-chairman | |
|
 | |  | |
|
| JOSEPH M. HARVEY | | JAMES S. CORL | |
|
| Portfolio Manager | | Portfolio Manager | |
|
 | |  | |
|
| DAVID J. OAKES | | W. JOSEPH HOULIHAN | |
|
| Portfolio Manager | | Portfolio Manager | |
|
 | |  | |
|
| GERIOS J. M. ROVERS | | DEREK CHEUNG | |
|
| Portfolio Manager | | Portfolio Manager | |
|
4
COHEN & STEERS INSTITUTIONAL GLOBAL REALTY SHARES, INC.
The views and opinions in the preceding commentary are as of the date stated and are subject to change. This material represents an assessment of the market environment at a specific point in time, should not be relied upon as investment advice and is not intended to predict or depict performance of any investment.
Visit Cohen & Steers online at cohenandsteers.com
For more information about any of our funds, visit cohenandsteers.com, where you'll find daily net asset values, fund fact sheets and portfolio highlights. You can also access newsletters, education tools and market updates covering REIT, utility and preferred securities sectors.
In addition, our Web site contains comprehensive information about our firm, including our most recent press releases, profiles of our senior investment professionals, and an overview of our investment approach.
5
COHEN & STEERS INSTITUTIONAL GLOBAL REALTY SHARES, INC.
Expense Example
(Unaudited)
As a shareholder of the fund, you incur two types of costs: (1) transaction costs; and (2) ongoing costs including management fees; and other fund expenses. This example is intended to help you understand your ongoing costs (in dollars) of investing in the fund and to compare these costs with the ongoing costs of investing in other mutual funds.
The example is based on an investment of $1,000 invested at the beginning of the period and held for the entire period 08/10/06 – 12/31/06.
Actual Expenses
The first line of the table below provides information about actual account values and expenses. You may use the information in this line, together with the amount you invested, to estimate the expenses that you paid over the period. Simply divide your account value by $1,000 (for example, an $8,600 account value divided by $1,000 = 8.6), then multiply the result by the number in the first line under the heading entitled "Expenses Paid During Period" to estimate the expenses you paid on your account during this period.
Hypothetical Example for Comparison Purposes
The second line of the table below provides information about hypothetical account values and hypothetical expenses based on the fund's actual expense ratio and an assumed rate of return of 5% per year before expenses, which is not the fund's actual return. The hypothetical account values and expenses may not be used to estimate the actual ending account balance or expenses you paid for the period. You may use this information to compare the ongoing cost of investing in the fund and other funds. To do so, compare this 5% hypothetical example with the 5% hypothetical examples that appear in the shareholder reports of the other funds.
Please note that the expenses shown in the table are meant to highlight your ongoing costs only and do not reflect any transactional costs. Therefore, the second line of the table is useful in comparing ongoing costs only, and will not help you determine the relative total costs of owning different funds. In addition, if these transactional costs were included, your costs would have been higher.
| | | Beginning
Account Value
08/10/06 | | Ending
Account Value
12/31/06 | | Expenses Paid
During Period *
08/10/06 –
12/31/06 | |
| Actual (18.98% return) | | $ | 1,000.00 | | | $ | 1,189.80 | | | $ | 4.32 | | |
| Hypothetical (5% annual return before expenses) | | $ | 1,000.00 | | | $ | 1,015.78 | | | $ | 3.98 | | |
* Expenses are equal to the Fund's annualized expense ratio of 1.00% multiplied by the average account value over the period, multiplied by 144/365 (to reflect the period since inception). If the fund had borne all of its expenses that were assumed by the advisor, the annualized expense ratio would have been 1.47%.
6
COHEN & STEERS INSTITUTIONAL GLOBAL REALTY SHARES, INC.
DECEMBER 31, 2006
Top Ten Long Term Holdings
(Unaudited)
| Security | | Market
Value | | % of
Net Assets | |
| Mitsubishi Estate Co., Ltd. | | $ | 3,079,871 | | | | 3.8 | % | |
| Mitsui Fudosan Co., Ltd. | | | 3,051,342 | | | | 3.7 | | |
| Land Securities Group PLC | | | 2,662,655 | | | | 3.3 | | |
| British Land Co., PLC | | | 2,651,049 | | | | 3.3 | | |
| Westfield Group | | | 2,319,584 | | | | 2.8 | | |
| Brookfield Properties Corp. | | | 2,241,810 | | | | 2.8 | | |
| AvalonBay Communities | | | 2,080,800 | | | | 2.6 | | |
| Equity Residential | | | 2,030,000 | | | | 2.5 | | |
| Hongkong Land Holdings Ltd. (USD) | | | 1,946,220 | | | | 2.4 | | |
| Boston Properties | | | 1,901,960 | | | | 2.3 | | |
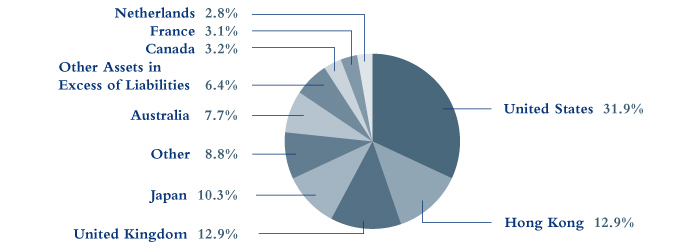
Country Breakdown
(Based on Net Assets)
(Unaudited)
7
COHEN & STEERS INSTITUTIONAL GLOBAL REALTY SHARES, INC.
SCHEDULE OF INVESTMENTS
December 31, 2006
| | | | | Number
of Shares | | Value | |
| COMMON STOCK | | | 93.6 | % | | | | | | | | | |
| AUSTRALIA | | | 7.7 | % | | | | | | | | | |
| DIVERSIFIED | | | 1.9 | % | | | | | | | | | |
| GPT Group | | | | | | | 265,000 | | | $ | 1,171,395 | | |
| Stockland | | | | | | | 60,000 | | | | 392,149 | | |
| | | | | | | | 1,563,544 | | |
| INDUSTRIAL | | | 1.1 | % | | | |
| ING Industrial Fund | | | | | | | 255,000 | | | | 477,044 | | |
| Macquarie Goodman Group | | | | | | | 65,000 | | | | 389,939 | | |
| | | | | | | | 866,983 | | |
| OFFICE | | | 1.4 | % | | | |
| ING Office Fund | | | | | | | 540,020 | | | | 652,185 | | |
| Tishman Speyer Office Fund | | | | | | | 248,000 | | | | 487,440 | | |
| | | | | | | | 1,139,625 | | |
| SHOPPING CENTER | | | 3.3 | % | | | |
| CFS Retail Property Trust | | | | | | | 192,000 | | | | 353,124 | | |
| Westfield Group | | | | | | | 140,000 | | | | 2,319,584 | | |
| | | | | | | | 2,672,708 | | |
| TOTAL AUSTRALIA | | | 6,242,860 | | |
| AUSTRIA | | | 0.3 | % | | | | | | | | | |
| DIVERSIFIED | |
| Immofinanz Immobilien Anlagen AG | | | | | | | 20,719 | | | | 295,381 | | |
| CANADA | | | 3.2 | % | | | |
| OFFICE | | | 2.8 | % | | | |
| Brookfield Properties Corp. | | | | | | | 57,000 | | | | 2,241,810 | | |
| SHOPPING CENTER | | | 0.4 | % | | | |
| Primaris Retail REIT | | | | | | | 21,000 | | | | 339,991 | | |
| TOTAL CANADA | | | 2,581,801 | | |
| FINLAND | | | 0.9 | % | | | |
| DIVERSIFIED | |
| Sponda Oyj | | | | | | | 46,531 | | | | 737,079 | | |
See accompanying notes to financial statements.
8
COHEN & STEERS INSTITUTIONAL GLOBAL REALTY SHARES, INC.
SCHEDULE OF INVESTMENTS—(Continued)
December 31, 2006
| | | | | Number
of Shares | | Value | |
| FRANCE | | | 3.1 | % | | | | | | | | | |
| DIVERSIFIED | | | 2.6 | % | | | | | | | | | |
| Fonciere des Regions | | | | | | | 3,037 | | | $ | 593,331 | | |
Societe Immobiliere de Location pour L'Industrie
et le Commerce (Silic) | | | | | | | 2,407 | | | | 362,219 | | |
| Unibail | | | | | | | 4,863 | | | | 1,188,232 | | |
| | | | | | | | 2,143,782 | | |
| SHOPPING CENTER | | | 0.5 | % | | | | | | | | | |
| Klepierre | | | | | | | 2,150 | | | | 405,849 | | |
| TOTAL FRANCE | | | 2,549,631 | | |
| GERMANY | | | 3.0 | % | | | | | | | | | |
| APARTMENT | | | 1.6 | % | | | | | | | | | |
| Gagfah SA | | | | | | | 17,685 | | | | 560,982 | | |
| Patrizia Immobilien AG | | | | | | | 25,791 | | | | 768,065 | | |
| | | | | | | | 1,329,047 | | |
| DIVERSIFIED | | | 0.9 | % | | | | | | | | | |
| IVG Immobilien AG | | | | | | | 17,223 | | | | 739,804 | | |
| OFFICE | | | 0.5 | % | | | | | | | | | |
| Eurocastle Investment Ltd. | | | | | | | 7,351 | | | | 374,562 | | |
| TOTAL GERMANY | | | 2,443,413 | | |
| HONG KONG | | | 12.9 | % | | | | | | | | | |
| DIVERSIFIED | | | 10.0 | % | | | | | | | | | |
| Cheung Kong Holdings Ltd. | | | | | | | 40,000 | | | | 492,910 | | |
| Great Eagle Holdings Ltd. | | | | | | | 270,000 | | | | 777,548 | | |
| Hang Lung Properties Ltd. | | | | | | | 320,000 | | | | 800,586 | | |
| Henderson Land Development Company Ltd. | | | | | | | 290,000 | | | | 1,619,955 | | |
| Hysan Development Company Ltd. | | | | | | | 560,000 | | | | 1,465,102 | | |
| Kerry Properties Ltd. | | | | | | | 154,348 | | | | 721,308 | | |
| Sun Hung Kai Properties Ltd. | | | | | | | 125,000 | | | | 1,436,689 | | |
| Wharf Holdings Ltd. | | | | | | | 220,000 | | | | 811,745 | | |
| | | | | | | | 8,125,843 | | |
See accompanying notes to financial statements.
9
COHEN & STEERS INSTITUTIONAL GLOBAL REALTY SHARES, INC.
SCHEDULE OF INVESTMENTS—(Continued)
December 31, 2006
| | | | | Number
of Shares | | Value | |
| OFFICE | | | 2.4 | % | | | | | | | | | |
| Hongkong Land Holdings Ltd. (USD) | | | | | | | 489,000 | | | $ | 1,946,220 | | |
| SHOPPING CENTER | | | 0.5 | % | | | | | | | | | |
| Link REIT | | | | | | | 195,495 | | | | 404,145 | | |
| TOTAL HONG KONG | | | 10,476,208 | | |
| ITALY | | | 0.7 | % | | | | | | | | | |
| DIVERSIFIED | |
| Beni Stabili S.p.A. | | | | | | | 356,407 | | | | 568,804 | | |
| JAPAN | | | 10.3 | % | | | | | | | | | |
| DIVERSIFIED | | | 9.3 | % | | | | | | | | | |
| Kenedix Realty Investment Corp. | | | | | | | 67 | | | | 386,782 | | |
| Mitsubishi Estate Co., Ltd. | | | | | | | 119,000 | | | | 3,079,871 | | |
| Mitsui Fudosan Co., Ltd. | | | | | | | 125,000 | | | | 3,051,342 | | |
| NTT Urban Development Corp. | | | | | | | 200 | | | | 386,538 | | |
| TOC Co., Ltd. | | | | | | | 52,500 | | | | 264,695 | | |
| United Urban Investment Corp. | | | | | | | 60 | | | | 394,269 | | |
| | | | | | | | 7,563,497 | | |
| SHOPPING CENTER | | | 1.0 | % | | | | | | | | | |
| AEON Mall Co., Ltd. | | | | | | | 15,000 | | | | 847,024 | | |
| TOTAL JAPAN | | | 8,410,521 | | |
| NETHERLANDS | | | 2.8 | % | | | | | | | | | |
| DIVERSIFIED | | | 0.4 | % | | | | | | | | | |
| Wereldhave NV | | | | | | | 2,224 | | | | 296,221 | | |
| INDUSTRIAL | | | 0.8 | % | | | | | | | | | |
| ProLogis European Properties | | | | | | | 31,702 | | | | 627,724 | | |
| OFFICE | | | 0.3 | % | | | | | | | | | |
| VastNed Offices/Industrial NV | | | | | | | 7,449 | | | | 292,533 | | |
| SHOPPING CENTER | | | 1.3 | % | | | | | | | | | |
| Rodamco Europe NV | | | | | | | 8,027 | | | | 1,068,081 | | |
| TOTAL NETHERLANDS | | | 2,284,559 | | |
See accompanying notes to financial statements.
10
COHEN & STEERS INSTITUTIONAL GLOBAL REALTY SHARES, INC.
SCHEDULE OF INVESTMENTS—(Continued)
December 31, 2006
| | | | | Number
of Shares | | Value | |
| NORWAY | | | 0.5 | % | | | | | | | | | |
| REAL ESTATE OPERATIONS/DEVELOPMENT | |
| Norwegian Property ASA | | | | | | | 36,532 | | | $ | 380,835 | | |
| SINGAPORE | | | 1.4 | % | | | | | | | | | |
| DIVERSIFIED | | | 1.0 | % | | | | | | | | | |
| CapitaLand Ltd. | | | | | | | 95,000 | | | | 384,026 | | |
| Singapore Land Ltd. | | | | | | | 75,000 | | | | 420,538 | | |
| | | | | | | | 804,564 | | |
| OFFICE | | | 0.4 | % | | | | | | | | | |
| Capitacommercial Trust | | | | | | | 187,000 | | | | 319,439 | | |
| TOTAL SINGAPORE | | | 1,124,003 | | |
| SPAIN | | | 0.1 | % | | | | | | | | | |
| DIVERSIFIED | |
| Riofisa SA | | | | | | | 1,530 | | | | 74,122 | | |
| SWEDEN | | | 1.3 | % | | | | | | | | | |
| DIVERSIFIED | | | 0.7 | % | | | | | | | | | |
| Fabege AB | | | | | | | 20,012 | | | | 536,405 | | |
| OFFICE | | | 0.6 | % | | | | | | | | | |
| Kungsleden AB | | | | | | | 33,059 | | | | 507,044 | | |
| TOTAL SWEDEN | | | 1,043,449 | | |
| SWITZERLAND | | | 0.6 | % | | | | | | | | | |
| DIVERSIFIED | |
| PSP Swiss Property AG | | | | | | | 8,997 | | | | 516,857 | | |
| UNITED KINGDOM | | | 12.9 | % | | | | | | | | | |
| DIVERSIFIED | | | 9.0 | % | | | | | | | | | |
| British Land Co., PLC | | | | | | | 78,994 | | | | 2,651,049 | | |
| Hammerson PLC | | | | | | | 30,078 | | | | 928,739 | | |
| Helical Bar PLC | | | | | | | 38,624 | | | | 358,466 | | |
| Land Securities Group PLC | | | | | | | 58,540 | | | | 2,662,655 | | |
| Quintain Estates & Development PLC | | | | | | | 43,565 | | | | 729,318 | | |
| | | | | | | | 7,330,227 | | |
See accompanying notes to financial statements.
11
COHEN & STEERS INSTITUTIONAL GLOBAL REALTY SHARES, INC.
SCHEDULE OF INVESTMENTS—(Continued)
December 31, 2006
| | | | | Number
of Shares | | Value | |
| INDUSTRIAL | | | 2.3 | % | | | | | | | | | |
| Brixton PLC | | | | | | | 32,893 | | | $ | 370,970 | | |
| Slough Estates PLC | | | | | | | 96,623 | | | | 1,486,071 | | |
| | | | | | | | 1,857,041 | | |
| OFFICE | | | 0.9 | % | | | | | | | | | |
| Derwent Valley Holdings PLC | | | | | | | 9,183 | | | | 377,047 | | |
| Great Portland Estates PLC | | | | | | | 28,340 | | | | 384,821 | | |
| | | | | | | | 761,868 | | |
| SHOPPING CENTER | | | 0.7 | % | | | | | | | | | |
| Liberty International PLC | | | | | | | 20,570 | | | | 562,254 | | |
| TOTAL UNITED KINGDOM | | | 10,511,390 | | |
| UNITED STATES | | | 31.9 | % | | | | | | | | | |
| DIVERSIFIED | | | 2.0 | % | | | | | | | | | |
| Vornado Realty Trust | | | | | | | 13,500 | | | | 1,640,250 | | |
| HOTEL | | | 4.4 | % | | | | | | | | | |
| Hilton Hotels Corp. | | | | | | | 28,000 | | | | 977,200 | | |
| Host Hotels & Resorts | | | | | | | 67,000 | | | | 1,644,850 | | |
| Starwood Hotels & Resorts Worldwide | | | | | | | 16,000 | | | | 1,000,000 | | |
| | | | | | | | 3,622,050 | | |
| INDUSTRIAL | | | 0.5 | % | | | | | | | | | |
| AMB Property Corp. | | | | | | | 7,000 | | | | 410,270 | | |
| OFFICE | | | 8.4 | % | | | | | | | | | |
| Alexandria Real Estate Equities | | | | | | | 8,000 | | | | 803,200 | | |
| Boston Properties | | | | | | | 17,000 | | | | 1,901,960 | | |
| Douglas Emmett | | | | | | | 3,400 | | | | 90,406 | | |
| Equity Office Properties Trust | | | | | | | 28,000 | | | | 1,348,760 | | |
| Forest City Enterprises | | | | | | | 11,000 | | | | 642,400 | | |
| Kilroy Realty Corp. | | | | | | | 15,500 | | | | 1,209,000 | | |
| Mack-Cali Realty Corp. | | | | | | | 16,000 | | | | 816,000 | | |
| | | | | | | | 6,811,726 | | |
See accompanying notes to financial statements.
12
COHEN & STEERS INSTITUTIONAL GLOBAL REALTY SHARES, INC.
SCHEDULE OF INVESTMENTS—(Continued)
December 31, 2006
| | | | | Number
of Shares | | Value | |
| OFFICE/INDUSTRIAL | | | 2.0 | % | | | | | | | | | |
| Liberty Property Trust | | | | | | | 33,000 | | | $ | 1,621,620 | | |
| RESIDENTIAL—APARTMENT | | | 9.0 | % | | | | | | | | | |
| Archstone-Smith Trust | | | | | | | 23,000 | | | | 1,338,830 | | |
| AvalonBay Communities | | | | | | | 16,000 | | | | 2,080,800 | | |
| BRE Properties | | | | | | | 15,000 | | | | 975,300 | | |
| Equity Residential | | | | | | | 40,000 | | | | 2,030,000 | | |
| Essex Property Trust | | | | | | | 6,949 | | | | 898,158 | | |
| | | | | | | | 7,323,088 | | |
| SELF STORAGE | | | 0.3 | % | | | | | | | | | |
| Public Storage | | | | | | | 2,619 | | | | 255,353 | | |
| SHOPPING CENTER | | | 5.3 | % | | | | | | | | | |
| COMMUNITY CENTER | | | 1.5 | % | | | | | | | | | |
| Federal Realty Investment Trust | | | | | | | 14,500 | | | | 1,232,500 | | |
| REGIONAL MALL | | | 3.8 | % | | | | | | | | | |
| Macerich Co. | | | | | | | 9,500 | | | | 822,415 | | |
| Simon Property Group | | | | | | | 14,000 | | | | 1,418,060 | | |
| Taubman Centers | | | | | | | 16,500 | | | | 839,190 | | |
| | | | | | | | 3,079,665 | | |
| TOTAL SHOPPING CENTER | | | 4,312,165 | | |
| TOTAL UNITED STATES | | | | | | | | | | | 25,996,522 | | |
| TOTAL COMMON STOCK (Identified—$72,440,348) | | | | | | | | | | | 76,237,435 | | |
See accompanying notes to financial statements.
13
COHEN & STEERS INSTITUTIONAL GLOBAL REALTY SHARES, INC.
SCHEDULE OF INVESTMENTS—(Continued)
December 31, 2006
| | | | | Principal
Amount | | Value | |
| COMMERCIAL PAPER | | | 25.9 | % | | | | | | | |
General Electric Capital Corp., 4.15%, due 1/2/07
(Identified cost—$21,063,572) | | | | | | $ | 21,066,000 | | | $ | 21,063,572 | | |
| TOTAL INVESTMENTS (Identified cost—$93,503,920) | | | 119.5 | % | | | | | 97,301,007 | | |
| LIABILITIES IN EXCESS OF OTHER ASSETS | | | (19.5 | )% | | | | | (15,863,636 | ) | |
NET ASSETS (Equivalent to $29.57 per share based on 2,754,306
shares of capital stock outstanding) | | | 100.0 | % | | | | $ | 81,437,371 | | |
Glossary of Portfolio Abbreviations
REIT Real Estate Investment Trust
USD United States Dollar
Note: Percentages indicated are based on the net assets of the fund.
See accompanying notes to financial statements.
14
COHEN & STEERS INSTITUTIONAL GLOBAL REALTY SHARES, INC.
STATEMENT OF ASSETS AND LIABILITIES
December 31, 2006
| ASSETS: | |
| Investments in securities, at value (Identified cost—$93,503,920) | | $ | 97,301,007 | | |
| Foreign currency (Identified cost—$242,173) | | | 243,291 | | |
| Receivable for fund shares sold | | | 5,051,600 | | |
| Dividends and interest receivable | | | 196,795 | | |
| Total Assets | | | 102,792,693 | | |
| LIABILITIES: | |
| Payable for investment securities purchased | | | 21,314,010 | | |
| Payable to investment advisor | | | 41,312 | | |
| Total Liabilities | | | 21,355,322 | | |
| NET ASSETS | | $ | 81,437,371 | | |
| NET ASSETS consist of: | |
| Paid-in capital | | $ | 77,684,754 | | |
| Dividends in excess of net investment income | | | (123,896 | ) | |
| Undistributed net realized gain | | | 93,491 | | |
| Net unrealized appreciation | | | 3,783,022 | | |
| | | $ | 81,437,371 | | |
| NET ASSET VALUE PER SHARE: | |
| ($81,437,371 ÷ 2,754,306 shares outstanding) | | $ | 29.57 | | |
See accompanying notes to financial statements.
15
COHEN & STEERS INSTITUTIONAL GLOBAL REALTY SHARES, INC.
STATEMENT OF OPERATIONS
For the Period August 10, 2006a through December 31, 2006
| Investment Income: | |
| Dividend income (net of $14,231 of foreign withholding tax) | | $ | 193,846 | | |
| Interest income | | | 50,375 | | |
| Total Income | | | 244,221 | | |
| Expenses: | |
| Investment advisory fees | | | 76,262 | | |
| Registration and filing fees | | | 10,768 | | |
| Directors' fees and expenses | | | 25,266 | | |
| Line of credit fees | | | 35 | | |
| Total Expenses | | | 112,331 | | |
| Reduction of Expenses | | | (36,069 | ) | |
| Net Expenses | | | 76,262 | | |
| Net Investment Income | | | 167,959 | | |
| Net Realized and Unrealized Gain(Loss) on Investments: | |
| Net realized gain(loss) on: | |
| Investments | | | 124,196 | | |
| Foreign currency transactions | | | (10,918 | ) | |
| Net realized gain | | | 113,278 | | |
| Net change in unrealized appreciation (depreciation) on: | |
| Investments | | | 3,797,087 | | |
| Foreign currency translations | | | (14,065 | ) | |
| Net change in unrealized appreciation | | | 3,783,022 | | |
| Total net realized and unrealized gain on investments | | | 3,896,300 | | |
| Net Increase in Net Assets Resulting from Operations | | $ | 4,064,259 | | |
a Commencement of operations.
See accompanying notes to financial statements.
16
COHEN & STEERS INSTITUTIONAL GLOBAL REALTY SHARES, INC.
STATEMENT OF CHANGES IN NET ASSETS
| | | For the Period
August 10, 2006a
through
December 31, 2006 | |
| Change in Net Assets: | |
| From Operations: | |
| Net investment income | | $ | 167,959 | | |
| Net realized gain | | | 113,278 | | |
| Net change in unrealized appreciation | | | 3,783,022 | | |
| Net increase in net assets resulting from operations | | | 4,064,259 | | |
| Dividends and Distributions to Shareholders from: | |
| Net investment income | | | (289,899 | ) | |
| Net realized gain on investments | | | (21,743 | ) | |
| Total dividends and distributions to shareholders | | | (311,642 | ) | |
| Capital Stock Transactions: | |
| Increase in net assets from fund share transactions | | | 77,584,754 | | |
| Total increase in net assets | | | 81,337,371 | | |
| Net Assets: | |
| Beginning of period | | | 100,000 | | |
| End of periodb | | $ | 81,437,371 | | |
a Commencement of operations.
b Including dividends in excess of net investment income of $123,896.
See accompanying notes to financial statements.
17
COHEN & STEERS INSTITUTIONAL GLOBAL REALTY SHARES, INC.
FINANCIAL HIGHLIGHTS
The following table includes selected data for a share outstanding throughout the period and other performance information derived from the financial statements. It should be read in conjunction with the financial statements and notes thereto.
| Per Share Operating Performance: | | For the Period
August 10, 2006a
through
December 31, 2006 | |
| Net asset value, beginning of period | | $ | 25.00 | | |
| Income from investment operations: | |
| Net investment income | | | 0.12 | | |
| Net realized and unrealized gain on investments | | | 4.62 | | |
| Total from investment operations | | | 4.74 | | |
| Less dividends and distributions to shareholders from: | |
| Net investment income | | | (0.16 | ) | |
| Net realized gain on investments | | | (0.01 | ) | |
| Total dividends and distributions to shareholders | | | (0.17 | ) | |
| Net increase in net asset value | | | 4.57 | | |
| Net asset value, end of period | | $ | 29.57 | | |
| Total investment return | | | 18.98 | %b | |
| Ratios/Supplemental Data: | |
| Net assets, end of period (in millions) | | $ | 81.4 | | |
Ratio of expenses to average daily net assets
(before expense reduction) | | | 1.47 | %c | |
Ratio of expenses to average daily net assets
(net of expense reduction) | | | 1.00 | %c | |
Ratio of net investment income to average daily net assets
(before expense reduction) | | | 1.73 | %c | |
Ratio of net investment income to average daily net assets
(net of expense reduction) | | | 2.20 | %c | |
| Portfolio turnover rate | | | 8 | %b | |
a Commencement of operations.
b Not annualized.
c Annualized.
See accompanying notes to financial statements.
18
COHEN & STEERS INSTITUTIONAL GLOBAL REALTY SHARES, INC.
NOTES TO FINANCIAL STATEMENTS
Note 1. Significant Accounting Policies
Cohen & Steers Institutional Global Realty Shares, Inc. (the fund) was incorporated under the laws of the State of Maryland on May 11, 2006 and is registered under the Investment Company Act of 1940, as amended, as a nondiversified, open-end management investment company. The fund's investment objective is total return. The fund had no operations until June 16, 2006 when it sold 4,000 shares for $100,000 to Cohen & Steers Capital Management, Inc. (the advisor). Investment operations commenced on August 10, 2006.
The following is a summary of significant accounting policies consistently followed by the fund in the preparation of its financial statements. The policies are in conformity with accounting principles generally accepted in the United States of America (GAAP). The preparation of the financial statements in accordance with GAAP requires management to make estimates and assumptions that affect the reported amounts of assets and liabilities at the date of the financial statements and the reported amounts of income and expenses during the reporting period. Actual results could differ from those estimates.
Portfolio Valuation: Investments in securities that are listed on the New York Stock Exchange are valued, except as indicated below, at the last sale price reflected at the close of the New York Stock Exchange on the business day as of which such value is being determined. If there has been no sale on such day, the securities are valued at the mean of the closing bid and asked prices for the day or, if no asked price is available, at the bid price.
Securities not listed on the New York Stock Exchange but listed on other domestic or foreign securities exchanges or admitted to trading on the National Association of Securities Dealers Automated Quotations, Inc. (Nasdaq) national market system are valued in a similar manner. Securities traded on more than one securities exchange are valued at the last sale price on the business day as of which such value is being determined as reflected on the tape at the close of the exchange representing the principal market for such securities.
Readily marketable securities traded in the over-the-counter market, including listed securities whose primary market is believed by the advisor to be over-the-counter, but excluding securities admitted to trading on the Nasdaq National List, are valued at the official closing prices as reported by Nasdaq, the National Quotation Bureau, or such other comparable sources as the Board of Directors deems appropriate to reflect their fair market value. If there has been no sale on such day, the securities are valued at the mean of the closing bid and asked prices for the day, or if no asked price is available, at the bid price. Where securities are traded on more than one exchange and also over-the-counter, the securities will generally be valued using the quotations the Board of Directors believes most closely reflect the value of such securities.
Portfolio securities primarily traded on foreign markets are generally valued at the preceding closing values of such securities on their respective exchanges or if after the close of the foreign markets, but prior to the close of business on the day the securities are being valued, market conditions change significantly, certain foreign securities may be fair valued pursuant to procedures established by the Board of Directors.
Securities for which market prices are unavailable, or securities for which the advisor determines that bid and/or asked price does not reflect market value, will be valued at fair value pursuant to procedures approved by
19
COHEN & STEERS INSTITUTIONAL GLOBAL REALTY SHARES, INC.
NOTES TO FINANCIAL STATEMENTS—(Continued)
the fund's Board of Directors. Circumstances in which market prices may be unavailable include, but are not limited to, when trading in a security is suspended, the exchange on which the security is traded is subject to an unscheduled close or disruption or material events occur after the close of the exchange on which the security is principally traded. In these circumstances, the fund determines fair value in a manner that fairly reflects the market value of the security on the valuation date based on consideration of any information or factors it deems appropriate. These may include recent transactions in comparable securities, information relating to the specific security and developments in the markets. In particular, portfolio securities primarily traded on foreign markets are generally valued at the preceding closing values of such securities on their respective exchanges or if after the close of the foreign markets, but prior to the close of trading on the NYSE on the day the securities are being valued, developments occur that are expected to materially affect the value of such securities, such values may be adjusted to reflect the estimated fair value of such securities as of the close of trading on the NYSE using a pricing service and/or procedures approved by the fund's Board of Directors.
The fund's use of fair value pricing may cause the net asset value of fund shares to differ from the net asset value that would be calculated using market quotations. Fair value pricing involves subjective judgments and it is possible that the fair value determined for a security may be materially different than the value that could be realized upon the sale of that security.
Short-term debt securities, which have a maturity date of 60 days or less, are valued at amortized cost, which approximates value.
Security Transactions and Investment Income: Security transactions are recorded on trade date. Realized gains and losses on investments sold are recorded on the basis of identified cost. Interest income is recorded on the accrual basis. Discounts are accreted and premiums are amortized over the life of the respective securities. Dividend income is recorded on the ex-dividend date except for certain dividends on foreign securities, which are recorded as soon as the fund is informed after the ex-dividend date. The fund records distributions received in excess of income from underlying investments as a reduction of cost of investments and/or realized gain. Such amounts are based on estimates if actual amounts are not available and actual amounts of income, realized gain and return of capital may differ from the estimated amounts. The fund adjusts the estimated amount s of the components of distributions (and consequently its net investment income) as an increase to unrealized appreciation/ (depreciation) and realized gain/(loss) on investments as necessary once the issuers provide information about the actual composition of the distributions.
Foreign Currency Translation and Forward Foreign Currency Contracts: The books and records of the fund are maintained in U.S. dollars as follows: (1) the foreign currency market value of investment securities, other assets and liabilities and forward foreign currency contracts (forward contracts) are translated at the exchange rates prevailing at the end of the period; and (2) purchases, sales, income and expenses are translated at the exchange rates prevailing on the respective dates of such transactions. The resultant exchange gains and losses are recorded as realized and unrealized gain/loss on foreign exchange transactions. Pursuant to U.S. federal income tax
20
COHEN & STEERS INSTITUTIONAL GLOBAL REALTY SHARES, INC.
NOTES TO FINANCIAL STATEMENTS—(Continued)
regulations, certain foreign exchange gains/losses included in realized and unrealized gain/loss are included in or are a reduction of ordinary income for federal income tax purposes. The fund does not isolate that portion of the results of operations arising as a result of changes in the foreign exchange rates from the changes in the market prices of the securities. Forward contracts are valued daily at the appropriate exchange rates. The resultant unrealized exchange gains and losses are recorded as unrealized foreign currency gain or loss. The fund records realized gains or losses on delivery of the currency or at the time the forward contract is extinguished (compensated) by entering into a closing transaction prior to delivery.
Foreign Securities: The fund may directly purchase securities of foreign issuers. Investing in securities of foreign issuers involves special risks not typically associated with investing in securities of U.S. issuers. The risks include possible revaluation of currencies, the ability to repatriate funds, less complete financial information about companies and possible future adverse political and economic developments. Moreover, securities of many foreign issuers and their markets may be less liquid and their prices more volatile than those of securities of comparable U.S. issuers.
Dividends and Distributions to Shareholders: Dividends from net investment income and capital gain distributions are determined in accordance with U.S. federal income tax regulations, which may differ from GAAP. Dividends from net investment income are declared and paid quarterly. Net realized capital gains, unless offset by any available capital loss carryforward, are distributed to shareholders annually. Dividends and distributions to shareholders are recorded on the ex-dividend date and are automatically reinvested in full and fractional shares of the fund based on the net asset value per share at the close of business on the ex-dividend date unless the shareholder has elected to have them paid in cash.
Distributions paid by the fund are subject to recharacterization for tax purposes. Based upon the results of operations for the period August 10, 2006 (commencement of operations) through December 31, 2006, a portion of the dividends paid have been reclassified to distributions of net realized capital gains.
Federal Income Taxes: It is the policy of the fund to continue to qualify as a regulated investment company, if such qualification is in the best interest of the shareholders, by complying with the requirements of Subchapter M of the Internal Revenue Code applicable to regulated investment companies, and by distributing substantially all of its taxable earnings to its shareholders. Accordingly, no provision for federal income or excise tax is necessary.
Note 2. Investment Advisory Fees and Other Transactions with Affiliates
Investment Advisory Fees: The advisor serves as the fund's investment advisor pursuant to an investment advisory agreement (the advisory agreement). Under the terms of the advisory agreement, the advisor provides the fund with the day-to-day investment decisions and generally manages the fund's investments in accordance with the stated policies of the fund, subject to the supervision of the fund's Board of Directors. For the services provided to the fund, the advisor receives a fee, accrued daily and paid monthly, at the annual rate of 1.00% of the average daily net assets of the fund.
21
COHEN & STEERS INSTITUTIONAL GLOBAL REALTY SHARES, INC.
NOTES TO FINANCIAL STATEMENTS—(Continued)
The advisor is also responsible, under the advisory agreement, for the performance of certain administrative functions for the fund. Additionally, the advisor pays all expenses of the fund except for brokerage fees, taxes, interest, fees and expenses of the fund's independent directors (as well as their independent counsel and other independent consultants), trade organization membership dues, federal and state registration fees and extraordinary expenses.
The advisor has contractually agreed to reimburse the fund so that its total annual operating expenses do not exceed 1.00% of the average daily net assets. This commitment will remain in place for the life of the fund.
Under a subadvisory agreement between the advisor and Cohen & Steers Asia Limited. (CSAL), Cohen & Steers UK Limited., and Houlihan Rovers (HR) (collectively the subadvisors), affiliates of the advisor, the subadvisors are responsible for managing the fund's investments in certain non-U.S. real estate securities. For their services provided under the subadvisory agreement, the advisor (not the fund) pays the subadvisors 16.3%, 6.3% and 6.3%, respectively, of the advisory fee received by the advisor from the fund. For the period August 10, 2006 through December 18, 2006, only CSAL and HR acted as subadvisors. During this period, each was paid by the advisor (not the fund) 21% of the advisory fee received by the advisor from the fund. For the period August 10, 2006 (commencement of operations) through December 31, 2006, the advisor paid the subadvisors $32,298.
Directors' and Officers' Fees: Certain directors and officers of the fund are also directors, officers, and/or employees of the advisor. The fund does not pay compensation to any affiliated directors and officers.
Other: At December 31, 2006, there were seven institutional investors owning 73.2% of the fund's outstanding shares. Investment activities of these shareholders could have significant impact on the fund.
Note 3. Purchases and Sales of Securities
Purchases and sales of securities, excluding short-term investments, for the period August 10, 2006 (commencement of operations) through December 31, 2006 totaled $74,490,239 and $2,075,471, respectively.
Note 4. Income Tax Information
The tax character of dividends and distributions paid was as follows:
| | | For the period
August 10, 2006a
through
December 31, 2006 | |
| Ordinary income | | $ | 311,642 | | |
a Commencement of operations
22
COHEN & STEERS INSTITUTIONAL GLOBAL REALTY SHARES, INC.
NOTES TO FINANCIAL STATEMENTS—(Continued)
As of December 31, 2006, the tax-basis components of accumulated earnings and the federal tax cost were as follows:
| Gross unrealized appreciation | | $ | 3,047,374 | | |
| Gross unrealized depreciation | | | (91,839 | ) | |
| Net unrealized appreciation | | $ | 2,955,535 | | |
| Undistributed ordinary income | | $ | 738,921 | | |
| Undistributed long-term capital gains | | $ | 81,359 | | |
| Cost for federal income tax purposes | | $ | 94,345,472 | | |
As of December 31, 2006, the fund had temporary book/tax differences primarily attributable to mark-to-market of passive foreign investment companies and permanent book/tax differences primarily attributable to foreign currency losses and sales of passive foreign investment companies. To reflect reclassifications arising from the permanent differences, accumulated net realized gain was credited $1,956 and accumulated net investment income was charged $1,956.
Note 5. Capital Stock
The fund is authorized to issue 100 million shares of capital stock at a par value of $0.001 per share. The Board of Directors of the fund is authorized to reclassify and issue any unissued shares of the fund without shareholder approval. At December 31, 2006, the advisor owned 124,051 shares or 4.5% of the fund. Transactions in fund shares were as follows:
| | | For the Period
August 10, 2006a
through
December 31, 2006 | |
| | | Shares | | Amount | |
| Sold | | | 2,743,068 | | | $ | 77,373,244 | | |
| Issued as reinvestment of dividends and distributions | | | 8,178 | | | | 237,082 | | |
| Redeemed | | | (940 | ) | | | (25,572 | ) | |
| Net increase | | | 2,750,306 | | | $ | 77,584,754 | | |
a Commencement of operations.
23
COHEN & STEERS INSTITUTIONAL GLOBAL REALTY SHARES, INC.
NOTES TO FINANCIAL STATEMENTS—(Continued)
Note 6. Borrowings
Effective December 13, 2006, the fund, in conjunction with other Cohen & Steers funds, was made a participant to a $150,000,000 syndicated credit agreement (the credit agreement) with State Street Bank and Trust Company, as administrative agent and operations agent, and the lenders identified in the credit agreement, which expires December 2007. The fund pays a commitment fee of 0.10% per annum on its proportionate share of the unused portion of the credit agreement.
During the period December 14, 2006 through December 31, 2006, the fund did not utilize the line of credit.
Note 7. Other
In the normal course of business, the fund enters into contracts that provide general indemnifications. The fund's maximum exposure under these arrangements is dependent on claims that may be made against the fund in the future and, therefore, cannot be estimated; however, based on experience, the risk of material loss from such claims is considered remote.
In July 2006, the Financial Accounting Standards Board (FASB) issued Interpretation 48, Accounting for Uncertainty in Income Taxes – an interpretation of FASB Statement 109 (FIN 48). FIN 48 clarifies the accounting for income taxes by prescribing the minimum recognition threshold a tax position must meet before being recognized in the financial statements. FIN 48 is effective for fiscal years beginning after December 15, 2006. The fund will adopt FIN 48 no later than June 29, 2007 and the impact to the fund's financial statements, if any, is currently being assessed.
In September 2006, Statement of Financial Accounting Standards No. 157, Fair Value Measurements (SFAS 157), was issued and is effective for fiscal years beginning after November 15, 2007. SFAS 157 defines fair value, establishes a framework for measuring fair value and expands disclosures about fair value measurements. Management is currently evaluating the impact the adoption of SFAS 157 will have on the Fund's financial statements.
24
COHEN & STEERS INSTITUTIONAL GLOBAL REALTY SHARES, INC.
REPORT OF INDEPENDENT REGISTERED PUBLIC ACCOUNTING FIRM
To the Board of Directors and Shareholders of
Cohen & Steers Institutional Global Realty Shares, Inc.
In our opinion, the accompanying statement of assets and liabilities, including the schedule of investments, and the related statements of operations and of changes in net assets and the financial highlights present fairly, in all material respects, the financial position of Cohen & Steers Institutional Global Realty Shares, Inc. (the "Fund") at December 31, 2006, and the results of its operations, the changes in its net assets and the financial highlights for the period August 10, 2006 (commencement of operations) through December 31, 2006, in conformity with accounting principles generally accepted in the United States of America. These financial statements and financial highlights (hereafter referred to as "financial statements") are the responsibility of the Fund's management; our responsibility is to express an opinion on these financial statements based on our audit. We conducted our audit of these financial statements in accordanc e with the standards of the Public Company Accounting Oversight Board (United States). Those standards require that we plan and perform the audit to obtain reasonable assurance about whether the financial statements are free of material misstatement. An audit includes examining, on a test basis, evidence supporting the amounts and disclosures in the financial statements, assessing the accounting principles used and significant estimates made by management, and evaluating the overall financial statement presentation. We believe that our audit, which included confirmation of securities at December 31, 2006 by correspondence with the custodian and brokers, provides a reasonable basis for our opinion.
PricewaterhouseCoopers LLP
New York, New York
February 16, 2007
25
COHEN & STEERS INSTITUTIONAL GLOBAL REALTY SHARES, INC.
PROXY RESULTS
Shareholders of Cohen & Steers Institutional Global Realty Shares approved the following proposals at a special shareholder meeting held on November 17, 2006:
| | | Shares Voted
For | | Shares Voted
Against | | Abstain | |
To approve a new Subadvisory Agreement between Cohen & Steers
Capital Management, Inc. and Houlihan Rovers, S.A. | | | 329,284 | | | | 0 | | | | 0 | | |
| | | Shares Voted
For | | Shares Voted
Against | | Abstain | |
To approve a new Subadvisory Agreement between Cohen & Steers
Capital Management, Inc. and Cohen & Steers UK Limited | | | 329,284 | | | | 0 | | | | 0 | | |
26
COHEN & STEERS INSTITUTIONAL GLOBAL REALTY SHARES, INC.
TAX INFORMATION—2006 (Unaudited)
Pursuant to the Jobs and Growth Relief Reconciliation Act of 2003, the fund designates qualified dividend income of $30,431.
OTHER INFORMATION
A description of the policies and procedures that the fund uses to determine how to vote proxies relating to portfolio securities is available (i) without charge, upon request, by calling 800-330-7348, (ii) on our Web site at cohenandsteers.com or (iii) on the Securities and Exchange Commission's Web site at http://www.sec.gov. In addition, the fund's proxy voting record for the most recent 12-month period ended June 30 is available (i) without charge, upon request, by calling 800-330-7348 or (ii) on the SEC's Web site at http://www.sec.gov.
The fund files its complete schedule of portfolio holdings with the SEC for the first and third quarters of each fiscal year on Form N-Q. The fund's Forms N-Q are available (i) without charge, upon request by calling 800-330-7348, or (ii) on the SEC's Web site at http://www.sec.gov. In addition, the Forms N-Q may be reviewed and copied at the SEC's Public Reference Room in Washington, DC. Information on the operation of the Public Reference Room may be obtained by calling 800-SEC-0330.
Please note that the distributions paid by the fund to shareholders are subject to recharacterization for tax purposes. The fund may also pay distributions in excess of the fund's net investment company taxable income and this excess would be a tax-free return of capital distributed from the fund's assets. To the extent this occurs, the fund's shareholders of record will be notified of the estimated amount of capital returned to shareholders for each such distribution and this information will also be available at cohenandsteers.com. The final tax treatment of all distributions is reported to shareholders on their 1099-DIV forms, which are mailed after the close of each calendar year. Distributions of capital decrease the fund's total assets and, therefore, could have the effect of increasing the fund's expense ratio. In addition, in order to make these distributions, the fund may have to sell portfolio securities at a less than opportune ti me.
APPROVAL OF INVESTMENT ADVISORY AGREEMENT AND SUBADVISORY AGREEMENTS
The board of directors of the fund, including a majority of the directors who are not parties to the fund's investment advisory agreement or subadvisory agreements, or interested persons of any such party ("Independent Directors"), has the responsibility under the 1940 Act to approve these agreements for initial two year terms and their continuation annually thereafter at a meeting of the board called for the purpose of voting on the approvals or continuations.
At a meeting held in person on June 6, 2006, the fund's Investment Advisory Agreement with Cohen & Steers Capital Management, Inc. (the "Advisor") and the Subadvisory Agreement between the Advisor and Cohen & Steers Asia Limited (the "CNS Asia Agreement") were discussed and were each unanimously approved for a two-year term by the fund's board, including the Independent Directors. At meetings held in person on June 6, 2006 and September 19, 2006, the Subadvisory Agreement between the Advisor and Houlihan Rovers, S.A. (the "Houlihan Subadvisory Agreement") and the Subadvisory Agreement between the Advisor and Cohen & Steers UK Limited (the "CNS UK Subadvisory Agreement") were discussed and were each unanimously approved for a two-year term by the
27
COHEN & STEERS INSTITUTIONAL GLOBAL REALTY SHARES, INC.
fund's board, including the Independent Directors. The approvals at the September 19, 2006 meeting were done primarily by reference to information provided for and discussions during the June 6, 2006 meeting, of which the substance had not changed materially since the June 6, 2006 meeting. At each meeting, the Independent Directors were represented by independent counsel, who assisted them in their deliberations during the meeting and executive session.
Also at the board meetings held on June 6, 2006 and September 19, 2006, representatives of the Advisor discussed with the board that the parent company of the Advisor had entered into an agreement with Houlihan Rovers (which was then 50% owned by the Advisor's parent company) for the Advisor's parent company to acquire the remaining interest in Houlihan Rovers (the "Acquisition"). Since the Acquisition was deemed to cause an "assignment" under the 1940 Act of the Houlihan Subadvisory Agreement resulting in termination of the Houlihan Subadvisory Agreement, the board, including the Independent Directors, discussed and unanimously approved for an initial two-year term a new subadvisory agreement with Houlihan Rovers (the "New Houlihan Subadvisory Agreement," and collectively with the Investment Advisory Agreement, Houlihan Subadvisory Agreement, CNS Asia Subadvisory Agreement and CNS UK Subadvisory Agreement, the "Agreements"), to take effect upon the consummation of the Acquisition.
Representatives of the Advisor confirmed for the directors that the New Houlihan Subadvisory Agreement was identical in all respects to the Houlihan Subadvisory Agreement, except for the dates of effectiveness. The board discussed with senior management of the Advisor the rationale for the Acquisition. The directors inquired of senior management of the Advisor the implications of the Acquisition for Houlihan Rovers and the ability of Houlihan Rovers to provide services of the same nature, extent and quality as those to be provided under the Houlihan Subadvisory Agreement. In particular, the board inquired as to the impact of the Acquisition on Houlihan Rovers' personnel, management, facilities and financial capabilities and received assurances in this regard from senior management of the Advisor that the same personnel discussed for providing services under the Houlihan Subadvisory Agreement would continue to do so after the Acquisition and that the Acquisition would not adversely affect Houlihan Rovers' ability to operate its business in a manner consistent with its past practices and to provide services to the fund.
In considering whether to approve the Agreements, the board reviewed materials provided by the Advisor and fund counsel which included, among other things, fee and expense information compiled from public filings and independent data providers, and summary information prepared by the Advisor and a legal memorandum outlining the legal duties of the board. The board also met with investment advisory personnel from the Advisor. The board considered factors relating to both the selection of the Advisor, Cohen & Steers Asia Limited ("CNS Asia"), Houlihan Rovers, S.A. ("Houlihan Rovers") and Cohen & Steers UK Limited ("CNS UK") and the approval of the sub-advisory fees, as applicable, when reviewing the Agreements. In particular, the board considered the following:
(i) The nature, extent and quality of services to be provided by the Advisor, Houlihan Rovers, CNS Asia and CNS UK. The directors reviewed the services that the Advisor would provide to the fund, including, but not limited to, generally managing the fund's investments in accordance with the stated policies of the fund. The
28
COHEN & STEERS INSTITUTIONAL GLOBAL REALTY SHARES, INC.
directors reviewed the services that Houlihan Rovers and CNS Asia would provide to the fund, including selecting portfolio securities and providing a continuous investment program for the fund with respect to investments in Europe and Asia, respectively; providing investment research and management; purchasing, retaining and selling securities for the fund; and placing orders for the execution of the fund's portfolio transactions. The directors also considered the services that CNS UK would provide to the fund, including providing investment advisory and research services and working with Houlihan Rovers and the Advisor in managing the fund's investments in Europe, as well as collaborating with the Advisor on overall portfolio allocation for the fund including, in connection therewith, supervising the fund's investments and conducting a continuous program of investment, evaluation and, if appropriate, sale and reinvestment of the fund's asse ts. The directors also discussed with Advisor representatives the amount of time the Advisor, Houlihan Rovers, CNS Asia and CNS UK would dedicate to the fund and the types of transactions that would be done on behalf of the fund. The directors then considered the allocation of responsibilities among the Advisor, Houlihan Rovers, CNS Asia and CNS UK. Additionally, the directors took into account the services provided by the Advisor and Houlihan Rovers to other funds that have investment objectives similar to the fund, including Cohen & Steers International Realty Fund, Inc. and Cohen & Steers Worldwide Realty Income Fund, Inc.
The board determined that the services to be provided to the fund by the Advisor and Houlihan Rovers are similar to those already being provided to funds and accounts by the Advisor and Houlihan Rovers. CNS Asia and CNS UK were newly-formed advisors that did not yet have other clients.
The board took into consideration the education, background and experience of the Advisor's, Houlihan Rovers', CNS Asia's and CNS UK's personnel. The board further noted the Advisor's ability to attract quality and experienced personnel. The directors concluded that the nature, quality and extent of services to be provided by the Advisor and Houlihan Rovers compared favorable to services provided by the Advisor and Houlihan Rovers, respectively, for other funds and accounts and that the services to be provided by the Advisor and Houlihan Rovers would be adequate and appropriate. They also concluded that the services to be provided by CNS Asia and CNS UK would be adequate and appropriate.
(ii) Investment performance of the fund, the Advisor, Houlihan Rovers, CNS Asia and CNS UK. Because the fund is newly formed, the board did not consider the investment performance of the fund. The board noted that the Advisor and Houlihan Rovers do serve as advisor and subadvisor, respectively, to real estate funds that were performing favorably. The directors recognized that past performance is not an indicator of future performance, but found that the Advisor and Houlihan Rovers had the necessary expertise in managing real estate securities to manage the fund.
(iii) Cost of the services to be provided and profits to be realized from the relationship with the fund. Next, the board considered the cost of the services provided to be provided by the Advisor, noting that each of Houlihan Rovers' fee, CNS Asia's fee and CNS UK's fee under the relevant Agreement is paid by the Advisor (not the fund). As part of its analysis of the Investment Advisory Agreement, the board gave substantial consideration to the
29
COHEN & STEERS INSTITUTIONAL GLOBAL REALTY SHARES, INC.
fee and expense ratio analyses provided by the Advisor and comparisons to a group of peer funds prepared by an independent data provider ("Peer Funds"). The directors noted that under the Investment Advisory Agreement, the fund pays the Advisor 1.00% of the fund's average daily net assets. The sub-advisory fees were based on the allocation of responsibilities among the Advisor, Houlihan Rovers, CNS Asia and CNS UK.
In reviewing the investment advisory fee, the board considered the investment advisory fees of the Peer Funds and noted that the fund's fee was in the range of those charged by the Peer Funds. The board noted, also, that the fund's total expense ratio was substantially below most of the Peer Funds. The board noted that the Advisor pays the fund's operating expenses out of its management fees, and that the Peer Funds pay their operating expenses over and above their investment advisory fees. The board concluded that the fund's expense structure is competitive in the peer group. The fund is newly formed, and the directors did not consider profitability of the fund to the Advisor, Houlihan Rovers, CNS Asia or CNS UK.
The board took into consideration other benefits to be derived by the Advisor, Houlihan Rovers, CNS Asia and CNS UK in connection with the Agreements, noting particularly the research and related services, within the meaning of Section 28(e) of the Securities Exchange Act of 1934, as amended, that the Advisor, Houlihan Rovers, CNS Asia and CNS UK could receive by allocating the fund's brokerage transactions.
(iv) The extent to which economies of scale would be realized as the fund grows and whether fee levels would reflect such economies of scale. The board noted that the fund's advisory fee schedule does not contain any breakpoints. The board considered the fund's asset size (as of the June 6, 2006 meeting the fund had not commenced operations), and determined that there were not at this time significant economies of scale that were not being shared with stockholders.
(v) Comparison of services to be rendered and fees to be paid to those under other subadvisory contracts. As discussed above in (i) and (iii), the board compared both the services rendered to and the fees paid by the fund to those under other investment advisory contracts of other investment advisers managing Peer Funds. The board compared both the services rendered and the fees paid under the Investment Advisory Agreement to the Advisor, and under the Houlihan Subadvisory Agreement to Houlihan Rovers, to other advisory contracts with their respective institutional and other clients. The board acknowledged that differences in fees paid by other clients seemed to be consistent with the differences in services provided and determined that on a comparative basis the fees under the Investment Advisory Agreement and Houlihan Subadvisory Agreement were reasonable in rel ation to the services provided, and concluded the same for CNS Asia and CNS UK.
No single factor was cited as determinative to the decision of the board. Rather, after weighing all of the considerations and conclusions discussed above, the board, including the Independent Directors, unanimously approved the Agreements.
30
COHEN & STEERS INSTITUTIONAL GLOBAL REALTY SHARES, INC.
MANAGEMENT OF THE FUND
The business and affairs of the fund are managed under the direction of the board of directors. The board of directors approves all significant agreements between the fund and persons or companies furnishing services to it, including the fund's agreements with its advisor, administrator, custodian and transfer agent. The management of the fund's day-to-day operations is delegated to its officers, the advisor and the fund's administrator, subject always to the investment objective and policies of the fund and to the general supervision of the board of directors.
The directors and officers of the fund and their principal occupations during the past five years are set forth below. The statement of additional information (SAI) includes additional information about fund directors and is available, without charge, upon request by calling 1-800-330-7348.
| Name, Address and Age* | | Position(s) Held
with Fund | | Term of
Office | | Principal Occupation
During Past 5 Years
(Including Other
Directorships Held) | | Number of
Funds Within
Fund
Complex
Overseen by
Director
(Including
the Fund) | | Length
of Time
Served** | |
| Interested Directors1 | |
|
| Robert H. Steers Age: 53 | | Director and Co-Chairman | | Until next election of directors | | Co-Chairman and Co-Chief Executive Officer of Cohen & Steers Capital Management, Inc. (CSCM), the fund's investment manager, and its parent company, Cohen & Steers, Inc. (CNS) since 2004. Vice President and Director, Cohen & Steers Securities, LLC (CSSL), the Cohen & Steers open-end funds' distributor. Prior thereto, Chairman of CSCM and the Cohen & Steers funds. | | | 20 | | | 1991 to
present | |
|
| Martin Cohen Age: 58 | | Director and Co-Chairman | | Until next election of directors | | Co-Chairman and Co-Chief Executive Officer of CSCM and CNS. Vice President and Director of CSSL. Prior thereto, President of the CSCM and the Cohen & Steers funds. | | | 20 | | | 1991 to
present | |
|
(table continued on next page)
* The address for each director is 280 Park Avenue, New York, NY 10017.
** The length of time served represents the year in which the director was first elected or appointed to any fund in the Cohen & Steers fund complex.
1 "Interested person", as defined in the 1940 Act, of the fund because of affiliation with CSCM.
31
COHEN & STEERS INSTITUTIONAL GLOBAL REALTY SHARES, INC.
(table continued from previous page)
| Name, Address and Age* | | Position(s) Held
with Fund | | Term of
Office | | Principal Occupation
During Past 5 Years
(Including Other
Directorships Held) | | Number of
Funds Within
Fund
Complex
Overseen by
Director
(Including
the Fund) | | Length
of Time
Served** | |
| Disinterested Directors | |
|
| Bonnie Cohen2 Age: 64 | | Director | | Until next election of directors | | Consultant. Prior thereto, Undersecretary of State, United States Department of State. Director of Wellsford Real Properties, Inc. | | | 20 | | | 2001 to
present | |
|
| George Grossman Age: 52 | | Director | | Until next election of directors | | Attorney-at-law | | | 20 | | | 1993 to
present | |
|
| Richard E. Kroon Age: 64 | | Director | | Until next election of directors | | Member of Investment Subcommittee, Monmouth University; retired Chairman and Managing Partner of the Sprout Group venture capital funds, then an affiliate of Donaldson, Lufkin & Jenrette Securities Corporation; and former Chairman of the National Venture Capital Association. | | | 20 | | | 2004 to
present | |
|
| Richard J. Norman Age: 63 | | Director | | Until next election of directors | | Private Investor. President of the Board of Directors of Maryland Public Television, Board Member of the Salvation Army. Prior thereto, Investment Representative of Morgan Stanley Dean Witter. | | | 20 | | | 2001 to
present | |
|
(table continued on next page)
* The address for each director is 280 Park Avenue, New York, NY 10017.
** The length of time served represents the year in which the director was first elected or appointed to any fund in the Cohen & Steers fund complex.
2 Martin Cohen and Bonnie Cohen are not related.
32
COHEN & STEERS INSTITUTIONAL GLOBAL REALTY SHARES, INC.
(table continued from previous page)
| Name, Address and Age* | | Position(s) Held
with Fund | | Term of
Office | | Principal Occupation
During Past 5 Years
(Including Other
Directorships Held) | | Number of
Funds Within
Fund
Complex
Overseen by
Director
(Including
the Fund) | | Length
of Time
Served** | |
| Frank K. Ross Age: 63 | | Director | | Until next election of directors | | Professor of Accounting, Howard University; Board member of Pepco Holdings, Inc. (electric utility). Formerly, Midatlantic Area Managing Partner for Audit and Risk Advisory Services at KPMG LLP and Managing Partner of its Washington, DC office. | | | 20 | | | 2004 to
present | |
|
| Willard H. Smith Jr. Age: 70 | | Director | | Until next election of directors | | Board member of Essex Property Trust Inc., Realty Income Corporation and Crest Net Lease, Inc. Managing Director at Merrill Lynch & Co., Equity Capital Markets Division from 1983 to 1995. | | | 20 | | | 1996 to
present | |
|
| C. Edward Ward, Jr. Age: 60 | | Director | | Until next election of directors | | Member of the Board of Trustees of Directors Manhattan College, Riverdale, New York. Formerly head of closed-end fund listings for the New York Stock Exchange. | | | 20 | | | 2004 to
present | |
|
* The address for each director is 280 Park Avenue, New York, NY 10017.
** The length of time served represents the year in which the director was first elected or appointed to any fund in the Cohen & Steers fund complex.
33
COHEN & STEERS INSTITUTIONAL GLOBAL REALTY SHARES, INC.
The officers of the fund (other than Messrs. Cohen and Steers, whose biographies are provided above), their address, their ages and their principal occupations for at least the past five years are set forth below.
| Name, Address and Age* | | Position(s) Held
with Fund | | Principal Occupation During Past 5 Years | | Length
of Time
Served** | |
| Adam M. Derechin Age: 42 | | President and Chief Executive Officer | | Chief Operating Officer of CSCM (since 2003) and CNS (since 2004). Prior to that, Senior Vice President of CSCM and Vice President and Assistant Treasurer of the Cohen & Steers funds. | | Since 2005 | |
|
| Joseph M. Harvey Age: 43 | | Vice President | | President of CSCM (since 2003) and CNS (since 2004). Prior to that, Senior Vice President and Director of Investment Research of CSCM. | | Since 2004 | |
|
| James S. Corl Age: 39 | | Vice President | | Executive Vice President of CSCM and CNS since 2004. Prior to that, Senior Vice President of CSCM. | | Since 2004 | |
|
| David J. Oakes Age: 28 | | Vice President | | Senior Vice President of CSCM since 2005 and Vice President and securities analyst prior thereto. Prior thereto, securities analyst at Goldman Sachs & Co. | | Since 2005 | |
|
| John E. McLean Age: 35 | | Secretary | | Vice President and Associate General Counsel of CSCM since September 2003. Prior to that, Vice President, Law and Regulation, J&W Seligman & Co. Incorporated (money manager). | | Since 2004 | |
|
| James Giallanza Age: 40 | | Treasurer | | Senior Vice President of CSCM since September 2006. Prior thereto, Deputy Head of the US Funds Administration and Treasurer & CFO of various mutual funds within the Legg Mason (formally Citigroup Asset Management) fund complex from August 2004 to September 2006; Director/Controller of the US wholesale business at UBS Global Asset Management (U.S.) from September 2001 to July 2004. | | Since 2006 | |
|
| Lisa D. Phelan Age: 38 | | Chief Compliance Officer | | Vice President & Director of Compliance of CSCM since January 2006. Chief Compliance Officer of CSSL since 2004. Prior to that, Compliance Officer of CSCM since 2004. Chief Compliance Officer, Avatar Associates & Overture Asset Managers, 2003-2004. First VP, Risk Management, Prudential Securities, Inc. 2000-2003. | | Since 2006 | |
|
* The address of each officer is 280 Park Avenue, New York, NY 10017
** Officers serve one-year terms. The length of time served represents the year in which the officer was first elected to that position in any fund in the Cohen & Steers fund complex. All of the officers listed above are officers of one or more of the other funds in the complex.
34
COHEN & STEERS INSTITUTIONAL GLOBAL REALTY SHARES, INC.
Meet the Cohen & Steers family of open-end funds:

• Designed for investors seeking maximum total return, investing primarily in REITs
• Symbol: CSRSX

• Designed for institutional investors seeking maximum total return, investing primarily
in REITs
• Symbol: CSRIX

• Designed for investors seeking high current income, investing primarily in REITs
• Symbols: CSEIX, CSBIX, CSCIX, CSDIX

• Designed for investors seeking maximum capital appreciation, investing in a limited number of REITs and other real estate securities
• Symbols: CSFAX, CSFBX, CSFCX, CSSPX

• Designed for investors seeking maximum total return, investing primarily in international real estate securities
• Symbols: IRFAX, IRFCX, IRFIX
• Designed for investors seeking maximum total return, investing primarily in utilities
• Symbols: CSUAX, CSUBX, CSUCX, CSUIX
• Designed for investors seeking high current income and long-term growth of income and capital appreciation, investing primarily in dividend paying common stocks and
preferred stocks
• Symbols: DVFAX, DVFCX, DVFIX

• Designed for investors seeking maximum total return, investing primarily in real estate securities located in the Asia Pacific region
• Symbols: APFAX, APFCX, APFIX

• Designed for investors seeking maximum
total return, investing primarily in global real
estate securities
• Symbol: GRSIX
Please consider the investment objectives, risks, charges and expenses of the fund carefully before investing. A prospectus containing this and other information can be obtained by calling 800-330-7348 or by visiting cohenandsteers.com. Please read the prospectus carefully before investing.
Cohen & Steers Securities, LLC, Distributor
35
COHEN & STEERS INSTITUTIONAL GLOBAL REALTY SHARES
OFFICERS AND DIRECTORS
Robert H. Steers
Director and co-chairman
Martin Cohen
Director and co-chairman
Bonnie Cohen
Director
George Grossman
Director
Richard E. Kroon
Director
Richard J. Norman
Director
Frank K. Ross
Director
Willard H. Smith Jr.
Director
C. Edward Ward, Jr.
Director
Adam M. Derechin
President and chief executive officer
Joseph M. Harvey
Vice president
James S. Corl
Vice president
David J. Oakes
Vice president
John E. McLean
Secretary
James Giallanza
Treasurer
Lisa D. Phelan
Chief compliance officer
KEY INFORMATION
Investment Advisor
Cohen & Steers Capital Management, Inc.
280 Park Avenue
New York, NY 10017
(212) 832-3232
Fund Subadministrator and Custodian
State Street Bank and Trust Company
1 Lincoln Street
Boston, MA 02111
Transfer Agent
Boston Financial Data Services, Inc.
2 Heritage Drive
North Quincy, MA 02171
(800) 437-9912
Legal Counsel
Stroock & Stroock & Lavan LLP
180 Maiden Lane
New York, NY 10038
Distributor
Cohen & Steers Securities, LLC
280 Park Avenue
New York, NY 10017
Nasdaq Symbol: GRSIX
Web site: cohenandsteers.com
This report is authorized for delivery only to shareholders of Cohen & Steers Institutional Global Realty Shares, Inc. unless accompanied or preceded by the delivery of a currently effective prospectus setting forth details of the fund. Past performance is of course no guarantee of future results and your investment may be worth more or less at the time you sell.
36
COHEN & STEERS
INSTITUTIONAL GLOBAL REALTY SHARES
280 PARK AVENUE
NEW YORK, NY 10017
ANNUAL REPORT
DECEMBER 31, 2006

Item 2. Code of Ethics.
The registrant has adopted a Code of Ethics that applies to its Principal Executive Officer and Principal Financial Officer. The registrant undertakes to provide to any person without charge, upon request, a copy of the Code of Ethics. Such request can be made by calling 800-330-7348 or writing to the Secretary of the registrant, 280 Park Avenue, New York, NY 10017.
Item 3. Audit Committee Financial Expert.
The registrant’s board has determined that Frank K. Ross, a member of the board’s audit committee, is an “audit committee financial expert”. Mr. Ross is “independent,” as such term is defined in this Item.
Item 4. Principal Accountant Fees and Services.
(a) – (d) Aggregate fees billed to the registrant for the last two fiscal years for professional services rendered by the registrant’s principal accountant were as follows:
| | 2006 | | 2005 | |
Audit Fees | | $ | 41,000 | | N/A | |
Audit-Related Fees | | 2,000 | | N/A | |
Tax Fees | | — | | N/A | |
All Other Fees | | — | | N/A | |
| | | | | | |
Audit-related fees were billed in connection with agreed upon procedures performed by the registrant’s principal accountant relating to after-tax return calculations. Tax fees were billed in connection with the preparation of tax returns, calculation and designation of dividends and other miscellaneous tax services.
Aggregate fees billed by the registrant’s principal accountant for the last two fiscal years for non-audit services provided to the registrant’s investment adviser (not including a sub-adviser whose role is primarily portfolio management and is subcontracted or overseen by another investment adviser) and any entity controlling, controlled by, or under common control with the investment adviser that provides ongoing services to the registered investment company, where the engagement relates directly to the operations and financial reporting of the registrant, were as follows:
| | 2006 | | 2005 | |
| | | | | |
Audit-Related Fees | | — | | N/A | |
Tax Fees | | — | | N/A | |
All Other Fees | | $ | 65,000 | | N/A | |
| | | | | | |
These other fees were billed in connection with internal control reviews.
(e)(1) The audit committee is required to pre-approve audit and non-audit services performed for the registrant by the principal accountant. The audit committee also is required to pre-approve non-audit services performed by the registrant’s principal accountant for the registrant’s investment adviser and any sub-adviser (not including any sub-adviser whose role is primarily portfolio management and is subcontracted with or overseen by another investment adviser) and/or to any entity controlling, controlled by or under common control with the registrant’s investment adviser that provides ongoing services to the registrant, if the engagement for services relates directly to the operations and financial reporting of the registrant.
The audit committee may delegate pre-approval authority to one or more of its members who are independent members of the board of directors of the registrant. The member or members to whom such authority is delegated shall report any pre-approval decisions to the audit committee at its next scheduled meeting. The audit committee may not delegate its responsibility to pre-approve services to be performed by the registrant’s principal accountant to the investment adviser.
(e) (2) No services included in (b) – (d) above were approved by the audit committee pursuant to paragraphs (c)(7)(i)(C) of Rule 2-01 of Regulation S-X.
(f) Not applicable.
(g) For the fiscal years ended December 31, 2006 and December 31, 2005, the aggregate fees billed by the registrant’s principal accountant for non-audit services rendered to the registrant and for non-audit services rendered to the registrant’s investment adviser (not including any sub-adviser whose role is primarily portfolio management and is subcontracted with or overseen by another investment adviser) and/or to any entity controlling, controlled by or under common control with the registrant’s investment adviser that provides ongoing services to the registrant were $67,000 and $0 , respectively.
(h) The registrant’s audit committee considered whether the provision of non-audit services that were rendered to the registrant’s investment adviser (not including any sub-adviser whose role is primarily portfolio management and is subcontracted with or overseen by another investment adviser) and/or to any entity controlling, controlled by or under common control with the registrant’s investment adviser that provides ongoing services to the registrant that were not required to be pre-approved pursuant to paragraph (c)(7)(ii) of Rule 2-01 of Regulation S-X was compatible with maintaining the principal accountant’s independence.
Item 5. Audit Committee of Listed Registrants.
Not applicable.
Item 6. Schedule of Investments.
Included in Item 1 above.
Item 7. Disclosure of Proxy Voting Policies and Procedures for Closed-End Management Investment Companies.
Not applicable.
Item 8. Portfolio Managers of Closed-End Investment Companies.
Not applicable.
Item 9. Purchases of Equity Securities by Closed-End Management Investment Company and Affiliated Purchasers.
Not applicable.
Item 10. Submission of Matters to a Vote of Security Holders.
Not applicable.
Item 11. Controls and Procedures.
(a) The registrant’s principal executive officer and principal financial officer have concluded that the registrant’s disclosure controls and procedures are reasonably designed to ensure that information required to be disclosed by the registrant in this Form N-CSR was recorded, processed, summarized and reported within the time periods specified in the Securities and Exchange Commission’s rules and forms, based upon such officers’ evaluation of these controls and procedures as of a date within 90 days of the filing date of this report.
(b) There were no changes in the registrant’s internal control over financial reporting that occurred during the second fiscal quarter of the period covered by this report that have materially affected, or are reasonably likely to materially affect, the registrant’s internal control over financial reporting.
Item 12. Exhibits.
(a)(1) Not applicable.
(a) (2) Certifications of principal executive officer and principal financial officer as required by Rule 30a-2(a) under the Investment Company Act of 1940.
(b) Certifications of chief executive officer and chief financial officer as required by Rule 30a- 2(b) under the Investment Company Act of 1940.
SIGNATURES
Pursuant to the requirements of the Securities Exchange Act of 1934 and the Investment Company Act of 1940, the registrant has duly caused this report to be signed on its behalf by the undersigned, thereunto duly authorized.
COHEN & STEERS INSTITUTIONAL GLOBAL REALTY SHARES, INC.
| By: | /s/ Adam M. Derechin | |
| | Name: Adam M. Derechin | |
| | Title: President and Chief Executive Officer | |
| | | |
| Date: February 27, 2007 |
| | | | |
Pursuant to the requirements of the Securities Exchange Act of 1934 and the Investment Company Act of 1940, this report has been signed below by the following persons on behalf of the registrant and in the capacities and on the dates indicated.
| By: | /s/ Adam M. Derechin | |
| | Name: | Adam M. Derechin |
| | Title: | President and Chief Executive Officer |
| | (principal executive officer) |
| | |
| By: | /s/ James Giallanza | |
| | Name: | James Giallanza |
| | Title: | Treasurer |
| | (principal financial officer) |
| | |
| | |
| Date: February 27, 2007 | |
| | | | | |