UNITED STATES
SECURITIES AND EXCHANGE COMMISSION
Washington, D.C. 20549
FORM N-CSR
CERTIFIED SHAREHOLDER REPORT OF REGISTERED
MANAGEMENT INVESTMENT COMPANIES
Investment Company Act file number | 811-21902 |
|
Cohen & Steers Institutional Global Realty Shares, Inc. |
(Exact name of registrant as specified in charter) |
|
280 Park Avenue, New York, NY | | 10017 |
(Address of principal executive offices) | | (Zip code) |
|
Adam M. Derechin Cohen & Steers Capital Management, Inc. 280 Park Avenue New York, New York 10017 |
(Name and address of agent for service) |
|
Registrant’s telephone number, including area code: | (212) 832-3232 | |
|
Date of fiscal year end: | December 31 | |
|
Date of reporting period: | December 31, 2008 | |
| | | | | | | | |
Item 1. Reports to Stockholders.
COHEN & STEERS INSTITUTIONAL GLOBAL REALTY SHARES, INC.
To Our Shareholders:
We are pleased to submit to you our report for the year ended December 31, 2008. The net asset value at that date was $14.23 per share. In addition, a regular dividend of $0.147 per share was declared for shareholders of record on December 18, 2008 and was paid on December 19, 2008.a
The total returns, including income and change in net asset value, for the Fund and the comparative benchmarks were:
| | | Six Months Ended
December 31, 2008 | | Year Ended
December 31, 2008 | |
| Cohen & Steers Institutional Global Realty Shares | | | –34.68 | % | | | –42.05 | % | |
| FTSE EPRA/NAREIT Global Real Estate Indexb | | | –39.42 | % | | | –47.72 | % | |
| S&P 500 Indexb | | | –28.47 | % | | | –36.99 | % | |
The performance data quoted represent past performance. Past performance is no guarantee of future results. The investment return and the principal value of an investment will fluctuate and shares, if redeemed, may be worth more or less than their original cost. Current performance may be lower or higher than the performance data quoted. Total returns of the Fund current to the most recent month-end can be obtained by visiting our Web site at cohenandsteers.com.
Investment Review
Global property securities had a steep decline in a year characterized by a global credit crisis, volatile capital markets and recession in major economies. Bank lending slowed and every investment category performed poorly, except government bonds. A number of financial institutions failed, or, with government intervention, narrowly avoided collapse. Policy makers around the world dropped interest rates, delivered substantial new forms of liquidity and devised fiscal stimulus packages in a coordinated effort to break the credit freeze and kick-start the global economy.
U.S. REITs performed in line with the broad stock market
U.S. real estate securities had a positive year-to-date return through September, before declining in the fourth-quarter sell-off. For the year, they had a total return of –37.7% (as measured by the FTSE NAREIT Equity REIT Index), in line with the S&P 500 Index. Given a weakening economy and tight credit, the market further
a Please note that distributions paid by the Fund to shareholders are subject to recharacterization for tax purposes. The final tax treatment of these distributions is reported to shareholders after the close of the calendar year.
b The FTSE EPRA/NAREIT Global Real Estate Index is an unmanaged portfolio of approximately 263 constituents from 20 countries. The S&P 500 Index is an unmanaged index of common stocks that is frequently used as a general measure of stock market performance.
1
COHEN & STEERS INSTITUTIONAL GLOBAL REALTY SHARES, INC.
downgraded property value estimates—although the absence of transactions has made it increasingly difficult to support those estimates.
Most U.S. property sectors had double-digit declines for the year. The self storage sector (+5.1%) was the only sector to post a gain; it is dominated by Public Storage, a company with a debt-free balance sheet. Health care (–12.0%) was cushioned by its perceived defensive nature.
The industrial sector (–67.5%), which contained companies (such as ProLogis) whose business models were more dependent on transactional income, had the poorest performance, as the absence of financing affected their ability to find buyers, and declining cash flows weakened balance sheets. The regional mall sector (–60.6%) was hurt by retailer bankruptcy liquidations and moderating consumer spending. The shopping center sector (–38.8%), which is more represented by consumer staples retailers, performed in line with the index.
Canada (–38.6%)1 fell in tandem with the United States. Declining auto exports, along with a sharp retreat in oil prices in the second half of the year, raised concerns over the country's economic health.
Europe's first-quarter rally was short-lived
European property stocks initially rallied after 2007's sell-off. However, property stocks in most markets were in decline by the second quarter due to a slowdown in economic activity and rising inflation. The United Kingdom (–45.8%) saw virtually all property stocks sell off sharply, driven in part by high consumer debt levels. Cap rate decompression continued from a relatively low base as the financial crisis weakened tenant demand in London and credit became increasingly scarce and expensive.
France (–32.4%) performed somewhat better, as fundamentals for French retail companies—many of which have a broad European footprint—remained solid; rents are indexed to inflation, and the country's regional malls typically devote less space to discretionary consumer items than do those in the United States. The Netherlands (–36.1%) outperformed on the strength of its inflation-linked rents and the pan-European retail property companies based there; these operators have assets in attractive, high-barrier-to-entry markets.
Austria (–83.6%) plunged amid corporate governance concerns and operators with businesses that rely on new development. German property companies (–52.2%) were punished for their high leverage, insufficient dividend coverage, inefficient operating structures and corporate governance issues.
The credit crisis spread to Asia Pacific markets
Asia Pacific was not immune to the crisis; the severe global economic slowdown hurt export-driven economies and drove heightened market volatility. In response, China's central bank—following several interest-rate cuts—introduced an RMB 4-trillion stimulus package, loosened bank reserve requirements and reduced the one-year benchmark lending and deposit rates by 1.08%.
1 Country returns are in local currencies as measured by the FTSE EPRA/NAREIT Global Real Estate Index.
2
COHEN & STEERS INSTITUTIONAL GLOBAL REALTY SHARES, INC.
Hong Kong (–57.6%) was fairly resilient until a slowing Chinese economy (the engine behind much of Hong Kong's earlier growth) and a slump in global demand weakened its export-based economy and caused property stocks to sell off.
Japan (–45.9%) was hindered by a surge in the yen, which posed a threat to exports in an already fragile economy. As the economic crisis intensified, demand for Tokyo office space softened and condominium sales weakened. When financial institutions scaled back their real estate lending, the government announced a ¥250 billion program to provide developers and J-REITs with capital.
For the first half of the year, Australia's property securities market (–54.5%) suffered from a hangover caused by Centro Properties Group's inability to refinance A$2.7 billion of maturing debt. The market strengthened late in the year in response to the Reserve Bank of Australia's four interest-rate cuts and to equity issuances by several listed property trusts (LPT), which boosted investor confidence in the companies' ability to meet loan repayments and operate within their covenants.
Singapore (–55.7%) saw concerns of a projected oversupply of office buildings and hotels, a slowing housing market and a fall in tourism. Real estate securities tumbled later in the year amid an expected decrease in demand for office space by overseas financial institutions.
Global Real Estate Securities Total Returns in Local Currencies
January 1, 2008—December 31, 2008
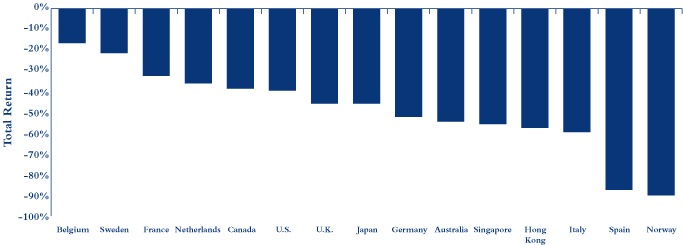
Source: Wilshire
Country returns are in local currencies as measured by the FTSE EPRA/NAREIT Global Real Estate Index.
3
COHEN & STEERS INSTITUTIONAL GLOBAL REALTY SHARES, INC.
The Fund's decline was steep
The Fund had a steep decline in a challenging year for capital markets, although its relative return exceeded the benchmark. Stock selection contributed to relative return in most markets, which we attribute to our focus on companies with strong balance sheets, little development exposure and durable earnings streams.
Stock selection and an overweight in the United States were the largest contributors to relative performance, in particular our positions in the self storage and apartment sectors. The former profited from the financial strength of Public Storage, while the latter benefited from the relatively favorable fundamentals for rental property and the availability of credit through Fannie Mae and Freddie Mac.
Our overweights and stock selection in France, in particular to retail property companies, also contributed to relative return. French retail property companies have solid fundamentals and rents that are indexed to inflation. Relative performance was also helped by our underweight in Australia, which saw continued challenges from cap rate increases and weakening balance sheets.
Factors that detracted from relative return were the Fund's underweight positions in Switzerland (–9.7%) and Belgium (–16.3%). Switzerland was expensive, in our view, and Belgium, while a relatively stable market, was less compelling from a long-term total-return perspective. Performance was also hindered by stock selection in Germany.
Investment Outlook
Global real estate companies' balance sheets will remain under pressure until the lending environment thaws. That said, we believe that the vast majority of these companies are structurally sound, and that they will have sufficient operating capital to navigate 2009 successfully. At some point, banks will reconsider the opportunity costs of holding cash and investing in low-yield securities.
We expect global real estate companies to see 3% declines in cash flow in 2009 due to softening demand, not oversupply, which has at times weighed heavily on them. Given this outlook for fundamentals, vacancy rates are likely to rise, but not reach the highs seen in previous difficult cycles.
U.S. REITs are trading at attractive cash-flow multiples
In the United States, we estimate that REIT cash flows will decline by 4% over the next year (more bearish views on equities in the S&P 500 Index suggest a 12% drop). In our view, much pessimism has already been factored into U.S. REIT share prices, which are trading at cash flow multiples at the lower end of the range seen over the past two decades. As investors seek higher returns, they may target real estate securities, which had an average dividend yield of 7.6% at the end of the period, compared with 3.2% for the S&P 500 Index and a yield of 2.3% for the 10-year Treasury.
4
COHEN & STEERS INSTITUTIONAL GLOBAL REALTY SHARES, INC.
Europe's economic contraction is likely to continue
The recession is likely to be more severe in the United Kingdom than in continental Europe, and the office market in London, Europe's financial capital, should feel the brunt of the credit crisis. However, U.K. property companies are relatively well-positioned, with sound balance sheets from a liquidity perspective and strong management teams.
Although France's gross domestic product is forecast to decline in 2009, private consumption is expected to be the main driver of the economy. As such, retail property stocks should continue to be relatively well positioned. Germany is unlikely to recover before global trade reaccelerates. The Netherlands' export-oriented economy may decline further as global trade slows, although retail property stocks could be a bright spot.
Asia Pacific markets have relatively low leverage
We believe Asia Pacific's real estate markets may exhibit a solid recovery, compared with those in other regions, as its economies have relatively low leverage. Further, Australia's successful LPT recapitalization could provide a blueprint for other companies with heavy debt loads.
Hong Kong property companies are generally well positioned for the current downturn because of their conservative balance sheets. Fundamentals have moderated, however, and could continue to deteriorate as China's growth decelerates. Declining interest rates may cushion the fall.
In Japan, we favor J-REITs with strong banking relationships and assets concentrated in Tokyo, where the office market remains tight despite weakening fundamentals. The condominium market, on the other hand, is likely to be hampered by an oversupply.
Aggressive monetary policy and equity recapitalizations in Australia could mitigate some of the impact of a reduction in capital availability and the deleveraging of the country's banking system. Real estate supply is increasing in Singapore due to government incentives introduced in 2007, under better economic conditions. S-REITs will probably face refinancing issues, as capital continues to be scarce.
Strong balance sheets will prevail
We favor companies with strong balance sheets and recurring cash flows. At the same time, we recognize that there are an increasing number of attractive risk-adjusted investment opportunities with companies that have been, in our view, unduly punished in the past year's "flight to safety." We view with interest those companies that have adapted to the current environment and are following through on their strategies. Although some are priced at distressed levels (with stock multiples as low as 2x future cash flows), we believe very few companies will fail and many will produce outstanding returns in time. To that end, we have increased the number of holdings in our portfolios in order to take advantage of the higher potential total returns these companies offer.
5
COHEN & STEERS INSTITUTIONAL GLOBAL REALTY SHARES, INC.
Sincerely,
| | |  | |  | |
|
| | | MARTIN COHEN | | ROBERT H. STEERS | |
|
| | | Co-chairman | | Co-chairman | |
|
| | |  | |  | |
|
| | | JOSEPH M. HARVEY | | SCOTT CROWE | |
|
| | | Portfolio Manager | | Portfolio Manager | |
|
 | |  | |  | |
|
| GERIOS J. M. ROVERS | | CHARLES J. MCKINLEY | | LUKE SULLIVAN | |
|
| Portfolio Manager | | Portfolio Manager | | Portfolio Manager | |
|
The views and opinions in the preceding commentary are subject to change. This material represents an assessment of the market environment at a specific point in time, should not be relied upon as investment advice and is not intended to predict or depict performance of any investment.
Visit Cohen & Steers online at cohenandsteers.com
For more information about any of our funds, visit cohenandsteers.com, where you will find daily net asset values, fund fact sheets and portfolio highlights. You can also access newsletters, education tools and market updates covering the global real estate, listed infrastructure, utilities, large cap value and preferred securities sectors.
In addition, our Web site contains comprehensive information about our firm, including our most recent press releases, profiles of our senior investment professionals and an overview of our investment approach.
6
COHEN & STEERS INSTITUTIONAL GLOBAL REALTY SHARES, INC.
Performance Review (Unaudited)
Growth of a $3,000,000 Investment
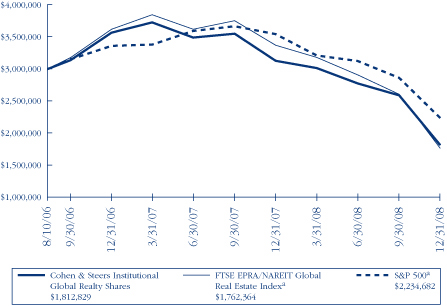
Average Annual Total Returns—For the Periods Ended December 31, 2008
| | | 1 Year | | Since Inceptionb | |
| Fund | | | –42.05 | % | | | –18.98 | % | |
The performance data quoted represent past performance. Past performance is no guarantee of future results. The investment return and principal value of an investment will fluctuate and shares, when redeemed, may be worth more or less than their original cost. Current performance may be lower or higher than the performance data quoted. Performance information current to the most recent month-end can be obtained by visiting our Web site at cohenandsteers.com. The performance graph and table do not reflect the deduction of taxes that a shareholder would pay on Fund distributions or the redemption of Fund shares.
The gross and net expense ratios, respectively, were 1.06% and 1.00%, as disclosed in the May 1, 2008 prospectus. The advisor has contracutally agreed to reimburse the Fund so that its annual operating expenses do not exceed 1.00%. This commitment will remian in place for the life of the Fund.
a The comparative indices are not adjusted to reflect expenses or other fees that the SEC requires to be reflected in the Fund's performance. The Fund's performance assumes the reinvestment of all dividends and distributions.
b Inception date of August 10, 2006.
7
COHEN & STEERS INSTITUTIONAL GLOBAL REALTY SHARES, INC.
Expense Example (Unaudited)
As a shareholder of the Fund, you incur two types of costs: (1) transaction costs, and (2) ongoing costs including management fees; and other Fund expenses. This example is intended to help you understand your ongoing costs (in dollars) of investing in the Fund and to compare these costs with the ongoing costs of investing in other mutual funds.
The example is based on an investment of $1,000 invested at the beginning of the period and held for the entire period July 1, 2008—December 31, 2008.
Actual Expenses
The first line of the table below provides information about actual account values and expenses. You may use the information in this line, together with the amount you invested, to estimate the expenses that you paid over the period. Simply divide your account value by $1,000 (for example, an $8,600 account value divided by $1,000 = 8.6), then multiply the result by the number in the first line under the heading entitled "Expenses Paid During Period" to estimate the expenses you paid on your account during this period.
Hypothetical Example for Comparison Purposes
The second line of the table below provides information about hypothetical account values and hypothetical expenses based on the Fund's actual expense ratio and an assumed rate of return of 5% per year before expenses, which is not the Fund's actual return. The hypothetical account values and expenses may not be used to estimate the actual ending account balance or expenses you paid for the period. You may use this information to compare the ongoing cost of investing in the Fund and other funds. To do so, compare this 5% hypothetical example with the 5% hypothetical examples that appear in the shareholder reports of other funds.
Please note that the expenses shown in the table are meant to highlight your ongoing costs only and do not reflect any transactional costs. Therefore, the second line of the table is useful in comparing ongoing costs only, and will not help you determine the relative total costs of owning different funds. In addition, if these transactional costs were included, your costs would have been higher.
| | | Beginning
Account Value
July 1, 2008 | | Ending
Account Value
December 31, 2008 | | Expenses Paid
During Period*
July 1, 2008–
December 31, 2008 | |
| Actual (–34.68% return) | | $ | 1,000.00 | | | $ | 653.20 | | | $ | 4.16 | | |
| Hypothetical (5% annual return before expenses) | | $ | 1,000.00 | | | $ | 1,020.11 | | | $ | 5.08 | | |
* Expenses are equal to the Fund's annualized net expense ratio of 1.00% multiplied by the average account value over the period, multiplied by 184/366 (to reflect the one-half year period). If the Fund had borne all of its expenses that were assumed by the advisor, the annualized expense ratios would have been 1.03%
8
COHEN & STEERS INSTITUTIONAL GLOBAL REALTY SHARES, INC.
DECEMBER 31, 2008
Top Ten Holdings
(Unaudited)
| Security | | Value | | % of
Net
Assets | |
| Mitsubishi Estate Co., Ltd. | | $ | 17,014,448 | | | | 7.3 | % | |
| Westfield Group | | | 12,268,130 | | | | 5.3 | | |
| Sun Hung Kai Properties Ltd. | | | 11,351,623 | | | | 4.9 | | |
| Simon Property Group | | | 10,868,432 | | | | 4.7 | | |
| Mitsui Fudosan Co., Ltd. | | | 8,774,593 | | | | 3.8 | | |
| Unibail-Rodamco | | | 7,233,839 | | | | 3.1 | | |
| Equity Residential | | | 6,838,770 | | | | 2.9 | | |
| Public Storage | | | 6,761,475 | | | | 2.9 | | |
| Land Securities Group PLC | | | 6,734,259 | | | | 2.9 | | |
| Vornado Realty Trust | | | 5,699,152 | | | | 2.4 | | |
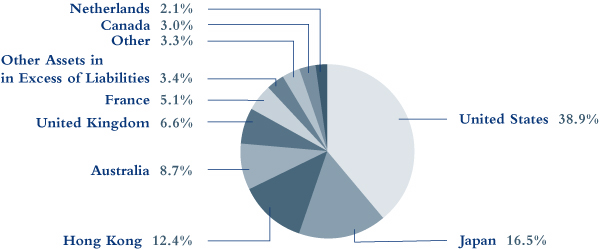
Country Breakdown
(Based on Net Assets)
(Unaudited)
9
COHEN & STEERS INSTITUTIONAL GLOBAL REALTY SHARES, INC.
SCHEDULE OF INVESTMENTS
December 31, 2008
| | | | | Number of
Shares | | Value | |
| COMMON STOCK | | | 96.6 | % | | | | | | | | | |
| AUSTRALIA | | | 8.7 | % | | | | | | | | | |
| DIVERSIFIED | | | 3.2 | % | | | | | | | | | |
| Dexus Property Groupa | | | | | | | 4,882,458 | | | $ | 2,795,790 | | |
| GPT Groupa | | | | | | | 1,490,270 | | | | 971,763 | | |
| Mirvac Groupa | | | | | | | 2,639,428 | | | | 2,362,243 | | |
| Stocklanda | | | | | | | 468,053 | | | | 1,331,466 | | |
| | | | | | | | 7,461,262 | | |
| INDUSTRIAL | | | 0.2 | % | | | | | | | | | |
| Goodman Groupa | | | | | | | 1,105,154 | | | | 569,092 | | |
| RETAIL | | | 5.3 | % | | | | | | | | | |
| Westfield Groupa | | | | | | | 1,351,302 | | | | 12,268,130 | | |
| TOTAL AUSTRALIA | | | | | | | | | | | 20,298,484 | | |
| AUSTRIA | | | 0.1 | % | | | | | | | | | |
| RETAIL | |
| Atrium European Real Estate Ltd.a,b | | | | | | | 74,210 | | | | 272,300 | | |
| CANADA | | | 3.0 | % | | | | | | | | | |
| DIVERSIFIED | | | 2.1 | % | | | | | | | | | |
| Brookfield Properties Corp. | | | | | | | 304,911 | | | | 2,356,962 | | |
| Canadian Real Estate Investment Trust | | | | | | | 138,729 | | | | 2,536,342 | | |
| | | | | | | | 4,893,304 | | |
| RESIDENTIAL | | | 0.7 | % | | | | | | | | | |
| Boardwalk REIT | | | | | | | 75,806 | | | | 1,569,543 | | |
| RETAIL | | | 0.2 | % | | | | | | | | | |
| Primaris Retail REIT | | | | | | | 48,557 | | | | 420,867 | | |
| RioCan Real Estate Investment Trust | | | | | | | 1,800 | | | | 19,917 | | |
| | | | | | | | 440,784 | | |
| TOTAL CANADA | | | | | | | | | | | 6,903,631 | | |
See accompanying notes to financial statements.
10
COHEN & STEERS INSTITUTIONAL GLOBAL REALTY SHARES, INC.
SCHEDULE OF INVESTMENTS—(Continued)
December 31, 2008
| | | | | Number of
Shares | | Value | |
| CHINA | | | 1.3 | % | | | | | | | | | |
| DIVERSIFIED | | | 0.8 | % | | | | | | | | | |
| China Overseas Land & Investment Ltd.a | | | | | | | 1,229,000 | | | $ | 1,725,685 | | |
| New World China Land Ltd.a | | | | | | | 690,200 | | | | 211,668 | | |
| | | | | | | | 1,937,353 | | |
| REAL ESTATE OPERATIONS/DEVELOPMENT | | | 0.5 | % | | | | | | | | | |
| Agile Property Holdings Ltd.a | | | | | | | 353,000 | | | | 186,431 | | |
| China Resources Land Ltd.a | | | | | | | 505,000 | | | | 625,087 | | |
| Sino-Ocean Land Holdings Ltd.a | | | | | | | 555,500 | | | | 253,736 | | |
| | | | | | | | 1,065,254 | | |
| TOTAL CHINA | | | | | | | | | | | 3,002,607 | | |
| FINLAND | | | 0.1 | % | | | | | | | | | |
| DIVERSIFIED | |
| Citycon Oyja | | | | | | | 100,778 | | | | 240,126 | | |
| Sponda Oyja | | | | | | | 14,211 | | | | 62,358 | | |
| | | | | | | | 302,484 | | |
| FRANCE | | | 5.1 | % | | | | | | | | | |
| DIVERSIFIED | | | 4.2 | % | | | | | | | | | |
| Gecina SAa | | | | | | | 3,450 | | | | 239,881 | | |
| ICADEa | | | | | | | 27,035 | | | | 2,246,713 | | |
| Unibail-Rodamcoa | | | | | | | 48,421 | | | | 7,233,839 | | |
| | | | | | | | 9,720,433 | | |
| OFFICE | | | 0.2 | % | | | | | | | | | |
Societe Immobiliere de Location pour L'Industrie et le
Commerce (Silic)a | | | | | | | 5,989 | | | | 559,512 | | |
| RETAIL | | | 0.7 | % | | | | | | | | | |
| Klepierrea | | | | | | | 23,523 | | | | 578,480 | | |
| Mercialys Promessea | | | | | | | 30,343 | | | | 958,248 | | |
| | | | | | | | 1,536,728 | | |
| TOTAL FRANCE | | | | | | | | | | | 11,816,673 | | |
See accompanying notes to financial statements.
11
COHEN & STEERS INSTITUTIONAL GLOBAL REALTY SHARES, INC.
SCHEDULE OF INVESTMENTS—(Continued)
December 31, 2008
| | | | | Number of
Shares | | Value | |
| GERMANY | | | 0.0 | % | | | | | | | | | |
| OFFICE | |
| Alstria Office AGa | | | | | | | 11,372 | | | $ | 79,895 | | |
| HONG KONG | | | 12.4 | % | | | | | | | | | |
| DIVERSIFIED | | | 9.3 | % | | | | | | | | | |
| Hang Lung Properties Ltd.a | | | | | | | 1,245,000 | | | | 2,733,480 | | |
| Henderson Land Development Company Ltd.a | | | | | | | 868,612 | | | | 3,248,759 | | |
| Hysan Development Company Ltd.a | | | | | | | 1,694,303 | | | | 2,754,831 | | |
| Kerry Properties Ltd.a | | | | | | | 150,000 | | | | 403,516 | | |
| Sino Land Co., Ltd.a | | | | | | | 1,242,000 | | | | 1,300,667 | | |
| Sun Hung Kai Properties Ltd.a | | | | | | | 1,349,049 | | | | 11,351,623 | | |
| | | | | | | | 21,792,876 | | |
| OFFICE | | | 2.3 | % | | | | | | | | | |
| Hongkong Land Holdings Ltd. (USD)a | | | | | | | 2,116,000 | | | | 5,277,423 | | |
| RETAIL | | | 0.8 | % | | | | | | | | | |
| Link REITa | | | | | | | 1,161,979 | | | | 1,932,961 | | |
| TOTAL HONG KONG | | | | | | | | | | | 29,003,260 | | |
| JAPAN | | | 16.5 | % | | | | | | | | | |
| DIVERSIFIED | | | 12.9 | % | | | | | | | | | |
| Mitsubishi Estate Co., Ltd.a | | | | | | | 1,030,000 | | | | 17,014,448 | | |
| Mitsui Fudosan Co., Ltd.a | | | | | | | 526,300 | | | | 8,774,593 | | |
| NTT Urban Development Corp.a | | | | | | | 1,576 | | | | 1,706,762 | | |
| Sumitomo Realty & Development Co., Ltd.a | | | | | | | 40,000 | | | | 601,285 | | |
| Tokyo Tatemono Co., Ltd.a | | | | | | | 296,000 | | | | 1,356,542 | | |
| Tokyu Land Corp.a | | | | | | | 144,000 | | | | 551,962 | | |
| | | | | | | | 30,005,592 | | |
| OFFICE | | | 1.7 | % | | | | | | | | | |
| Japan Prime Realty Investment Corp.a | | | | | | | 195 | | | | 462,882 | | |
| Japan Real Estate Investment Corp.a | | | | | | | 130 | | | | 1,161,308 | | |
| Nippon Building Funda | | | | | | | 164 | | | | 1,802,648 | | |
| Nomura Real Estate Office Funda | | | | | | | 95 | | | | 618,131 | | |
| | | | | | | | 4,044,969 | | |
See accompanying notes to financial statements.
12
COHEN & STEERS INSTITUTIONAL GLOBAL REALTY SHARES, INC.
SCHEDULE OF INVESTMENTS—(Continued)
December 31, 2008
| | | | | Number of
Shares | | Value | |
| RETAIL | | | 1.9 | % | | | | | | | | | |
| AEON Mall Co., Ltd.a | | | | | | | 144,500 | | | $ | 2,793,422 | | |
| Japan Retail Fund Investment Corp.a | | | | | | | 390 | | | | 1,684,547 | | |
| | | | | | | | 4,477,969 | | |
| TOTAL JAPAN | | | | | | | | | | | 38,528,530 | | |
| NETHERLANDS | | | 2.1 | % | | | | | | | | | |
| INDUSTRIAL | | | 0.3 | % | | | | | | | | | |
| ProLogis European Propertiesa | | | | | | | 171,852 | | | | 774,353 | | |
| RETAIL | | | 1.8 | % | | | | | | | | | |
| Corio NVa | | | | | | | 70,999 | | | | 3,269,406 | | |
| Eurocommercial Properties NVa | | | | | | | 27,640 | | | | 930,551 | | |
| | | | | | | | 4,199,957 | | |
| TOTAL NETHERLANDS | | | | | | | | | | | 4,974,310 | | |
| SINGAPORE | | | 0.8 | % | | | | | | | | | |
| DIVERSIFIED | |
| CapitaLand Ltd.a | | | | | | | 829,000 | | | | 1,808,819 | | |
| Suntec Real Estate Investment Trusta | | | | | | | 110,000 | | | | 54,683 | | |
| | | | | | | | 1,863,502 | | |
| SWEDEN | | | 1.0 | % | | | | | | | | | |
| DIVERSIFIED | |
| Castellum ABa | | | | | | | 303,281 | | | | 2,397,919 | | |
| UNITED KINGDOM | | | 6.6 | % | | | | | | | | | |
| DIVERSIFIED | | | 5.6 | % | | | | | | | | | |
| British Land Co., PLCa | | | | | | | 421,791 | | | | 3,379,492 | | |
| Hammerson PLCa | | | | | | | 361,678 | | | | 2,801,747 | | |
| Land Securities Group PLCa | | | | | | | 500,900 | | | | 6,734,259 | | |
| | | | | | | | 12,915,498 | | |
| INDUSTRIAL | | | 0.5 | % | | | | | | | | | |
| Segro PLCa | | | | | | | 326,721 | | | | 1,164,793 | | |
| OFFICE | | | 0.5 | % | | | | | | | | | |
| Great Portland Estates PLCa | | | | | | | 316,137 | | | | 1,187,171 | | |
See accompanying notes to financial statements.
13
COHEN & STEERS INSTITUTIONAL GLOBAL REALTY SHARES, INC.
SCHEDULE OF INVESTMENTS—(Continued)
December 31, 2008
| | | | | Number of
Shares | | Value | |
| SELF STORAGE | | | 0.0 | % | | | | | | | | | |
| Safestore Holdings Ltd.a | | | | | | | 79,342 | | | $ | 61,986 | | |
| TOTAL UNITED KINGDOM | | | | | | | | | | | 15,329,448 | | |
| UNITED STATES | | | 38.9 | % | | | | | | | | | |
| DIVERSIFIED | | | 2.9 | % | | | | | | | | | |
| Duke Realty Corp. | | | | | | | 102,148 | | | | 1,119,542 | | |
| Vornado Realty Trust | | | | | | | 94,435 | | | | 5,699,152 | | |
| | | | | | | | 6,818,694 | | |
| HEALTH CARE | | | 2.9 | % | | | | | | | | | |
| HCP | | | | | | | 51,301 | | | | 1,424,629 | | |
| Health Care REIT | | | | | | | 17,172 | | | | 724,658 | | |
| Omega Healthcare Investors | | | | | | | 143,594 | | | | 2,293,196 | | |
| Ventas | | | | | | | 70,387 | | | | 2,362,892 | | |
| | | | | | | | 6,805,375 | | |
| HOTEL | | | 1.8 | % | | | | | | | | | |
| Host Hotels & Resorts | | | | | | | 367,325 | | | | 2,780,650 | | |
| Starwood Hotels & Resorts Worldwide | | | | | | | 84,916 | | | | 1,519,997 | | |
| | | | | | | | 4,300,647 | | |
| INDUSTRIAL | | | 2.6 | % | | | | | | | | | |
| AMB Property Corp. | | | | | | | 89,184 | | | | 2,088,689 | | |
| EastGroup Properties | | | | | | | 26,167 | | | | 931,022 | | |
| ProLogis | | | | | | | 222,160 | | | | 3,085,803 | | |
| | | | | | | | 6,105,514 | | |
| OFFICE | | | 5.7 | % | | | | | | | | | |
| BioMed Realty Trust | | | | | | | 74,922 | | | | 878,086 | | |
| Boston Properties | | | | | | | 93,841 | | | | 5,161,255 | | |
| Brandywine Realty Trust | | | | | | | 137,698 | | | | 1,061,652 | | |
| Douglas Emmett | | | | | | | 63,160 | | | | 824,870 | | |
| Liberty Property Trust | | | | | | | 109,351 | | | | 2,496,483 | | |
| Mack-Cali Realty Corp. | | | | | | | 81,903 | | | | 2,006,623 | | |
| SL Green Realty Corp. | | | | | | | 35,630 | | | | 922,817 | | |
| | | | | | | | 13,351,786 | | |
See accompanying notes to financial statements.
14
COHEN & STEERS INSTITUTIONAL GLOBAL REALTY SHARES, INC.
SCHEDULE OF INVESTMENTS—(Continued)
December 31, 2008
| | | | | Number of
Shares | | Value | |
| OFFICE/INDUSTRIAL | | | 0.4 | % | | | | | | | | | |
| PS Business Parks | | | | | | | 20,640 | | | $ | 921,782 | | |
| RESIDENTIAL | | | 8.4 | % | | | | | | | | | |
| APARTMENT | | | 7.2 | % | | | | | | | | | |
| American Campus Communities | | | | | | | 47,336 | | | | 969,441 | | |
| Apartment Investment & Management Co. | | | | | | | 163,480 | | | | 1,888,194 | | |
| AvalonBay Communities | | | | | | | 57,021 | | | | 3,454,332 | | |
| BRE Properties | | | | | | | 13,721 | | | | 383,913 | | |
| Equity Residential | | | | | | | 229,335 | | | | 6,838,770 | | |
| Essex Property Trust | | | | | | | 12,393 | | | | 951,163 | | |
| UDR | | | | | | | 163,478 | | | | 2,254,362 | | |
| | | | | | | | 16,740,175 | | |
| MANUFACTURED HOME | | | 1.2 | % | | | | | | | | | |
| Equity Lifestyle Properties | | | | | | | 72,788 | | | | 2,792,148 | | |
| TOTAL RESIDENTIAL | | | | | | | | | | | 19,532,323 | | |
| RETAIL | | | 10.4 | % | | | | | | | | | |
| Acadia Realty Trust | | | | | | | 71,182 | | | | 1,015,767 | | |
| CBL & Associates Properties | | | | | | | 70,422 | | | | 457,743 | | |
| Developers Diversified Realty Corp. | | | | | | | 160,189 | | | | 781,722 | | |
| Federal Realty Investment Trust | | | | | | | 48,255 | | | | 2,995,670 | | |
| Kimco Realty Corp. | | | | | | | 93,938 | | | | 1,717,187 | | |
| Macerich Co. | | | | | | | 128,393 | | | | 2,331,617 | | |
| Regency Centers Corp. | | | | | | | 53,093 | | | | 2,479,443 | | |
| Simon Property Group | | | | | | | 204,563 | | | | 10,868,432 | | |
| Taubman Centers | | | | | | | 19,226 | | | | 489,494 | | |
| Weingarten Realty Investors | | | | | | | 54,617 | | | | 1,130,026 | | |
| | | | | | | | 24,267,101 | | |
See accompanying notes to financial statements.
15
COHEN & STEERS INSTITUTIONAL GLOBAL REALTY SHARES, INC.
SCHEDULE OF INVESTMENTS—(Continued)
December 31, 2008
| | | | | Number of
Shares | | Value | |
| SELF STORAGE | | | 3.5 | % | | | | | | | | | |
| Extra Space Storage | | | | | | | 109,868 | | | $ | 1,133,838 | | |
| Public Storage | | | | | | | 85,050 | | | | 6,761,475 | | |
| U-Store-It Trust | | | | | | | 32,715 | | | | 145,582 | | |
| | | | | | | | 8,040,895 | | |
| SPECIALTY | | | 0.3 | % | | | | | | | | | |
| Corrections Corp of Americab | | | | | | | 47,370 | | | | 774,973 | | |
| TOTAL UNITED STATES | | | | | | | | | | | 90,919,090 | | |
| TOTAL COMMON STOCK (Identified cost—$276,380,678) | | | | | | | | | | | 225,692,133 | | |
| | | | | Number of
Rights | | | |
| RIGHTS | | | 0.0 | % | | | | | | | | | |
| CHINA | |
China Overseas Land & Investment Ltd., expire 1/21/09a,b
(Identified cost—$0) | | | | | | | 49,160 | | | | 17,635 | | |
| | | | | Number of
Shares | | | |
| SHORT-TERM INVESTMENTS | | | 2.4 | % | | | | | | | | | |
| MONEY MARKET FUNDS | |
| Dreyfus Treasury Cash Management Fund, 0.17%c | | | | | | | 187,500 | | | | 187,500 | | |
| Federated U.S. Treasury Cash Reserves Fund, 0.40%c | | | | | | | 5,392,856 | | | | 5,392,856 | | |
TOTAL SHORT-TERM INVESTMENTS
(Identified cost—$5,580,356) | | | | | | | | | | | 5,580,356 | | |
See accompanying notes to financial statements.
16
COHEN & STEERS INSTITUTIONAL GLOBAL REALTY SHARES, INC.
SCHEDULE OF INVESTMENTS—(Continued)
December 31, 2008
| | | | | | | Value | |
| TOTAL INVESTMENTS (Identified cost—$281,961,034) | | | 99.0 | % | | | | $ | 231,290,124 | | |
| OTHER ASSETS IN EXCESS OF LIABILITIES | | | 1.0 | % | | | | | 2,275,507 | | |
NET ASSETS (Equivalent to $14.23 per share based on 16,407,959
shares of common stock outstanding) | | | 100.0 | % | | | | $ | 233,565,631 | | |
Glossary of Portfolio Abbreviations
REIT Real Estate Investment Trust
USD United States Dollar
Note: Percentages indicated are based on the net assets of the Fund.
a Fair valued security. This security has been valued at its fair value as determined in good faith under procedures established by and under the general supervision of the Fund's Board of Directors. Aggregate fair value securities represent 54.8% of net assets, all of which have been fair valued pursuant to foreign security fair value pricing procedures approved by the Board of Directors.
b Non-income producing security.
c Rate quoted represents the seven day yield of the fund.
See accompanying notes to financial statements.
17
COHEN & STEERS INSTITUTIONAL GLOBAL REALTY SHARES, INC.
STATEMENT OF ASSETS AND LIABILITIES
December 31, 2008
| ASSETS: | |
| Investments in securities, at value (Identified cost—$281,961,034) | | $ | 231,290,124 | | |
| Foreign currency, at value (Identified cost—$42,596) | | | 42,014 | | |
| Receivable for investment securities sold | | | 5,868,160 | | |
| Dividends and interest receivable | | | 1,806,358 | | |
| Receivable for Fund shares sold | | | 455,740 | | |
| Other assets | | | 4,585 | | |
| Total Assets | | | 239,466,981 | | |
| LIABILITIES: | |
| Payable for investment securities purchased | | | 4,901,302 | | |
| Payable for Fund shares redeemed | | | 771,779 | | |
| Payable for investment advisory fees | | | 211,463 | | |
| Payable for directors' fees | | | 2,096 | | |
| Other liabilities | | | 14,710 | | |
| Total Liabilities | | | 5,901,350 | | |
| NET ASSETS applicable to 16,407,959 shares of $0.001 par value of common stock outstanding | | $ | 233,565,631 | | |
| NET ASSET VALUE PER SHARE: | |
| ($233,565,631 ÷ 16,407,959 shares outstanding) | | $ | 14.23 | | |
| NET ASSETS consist of: | |
| Paid-in-capital | | $ | 429,396,078 | | |
| Dividends in excess of net investment income | | | (1,452,416 | ) | |
| Accumulated net realized loss | | | (143,691,708 | ) | |
| Net unrealized depreciation | | | (50,686,323 | ) | |
| | | $ | 233,565,631 | | |
See accompanying notes to financial statements.
18
COHEN & STEERS INSTITUTIONAL GLOBAL REALTY SHARES, INC.
STATEMENT OF OPERATIONS
For the Year Ended December 31, 2008
| Investment Income: | |
| Dividend income (net of $661,387 of foreign withholding tax) | | $ | 9,740,249 | | |
| Interest income | | | 112,443 | | |
| Total Income | | | 9,852,692 | | |
| Expenses: | |
| Investment advisory fees | | | 2,900,830 | | |
| Directors' fees and expenses | | | 51,016 | | |
| Registration and filing fees | | | 43,348 | | |
| Line of credit fees | | | 9,425 | | |
| Miscellaneous | | | 2,416 | | |
| Total Expenses | | | 3,007,035 | | |
| Reduction of Expenses (See Note 2) | | | (106,205 | ) | |
| Net Expenses | | | 2,900,830 | | |
| Net Investment Income | | | 6,951,862 | | |
| Net Realized and Unrealized Loss: | |
| Net realized loss on: | |
| Investments | | | (136,862,713 | ) | |
| Foreign currency transactions | | | (329,688 | ) | |
| Net realized loss | | | (137,192,401 | ) | |
| Net change in unrealized depreciation on: | |
| Investments | | | (17,407,448 | ) | |
| Foreign currency translations | | | (12,066 | ) | |
| Net change in unrealized depreciation | | | (17,419,514 | ) | |
| Net realized and unrealized loss | | | (154,611,915 | ) | |
| Net Decrease in Net Assets Resulting from Operations | | $ | (147,660,053 | ) | |
See accompanying notes to financial statements.
19
COHEN & STEERS INSTITUTIONAL GLOBAL REALTY SHARES, INC.
STATEMENT OF CHANGES IN NET ASSETS
| | | For the
Year Ended
December 31, 2008 | | For the
Year Ended
December 31, 2007 | |
| Change in Net Assets: | |
| From Operations: | |
| Net investment income | | $ | 6,951,862 | | | $ | 3,397,745 | | |
| Net realized loss | | | (137,192,401 | ) | | | (5,742,996 | ) | |
| Net change in unrealized depreciation | | | (17,419,514 | ) | | | (37,049,831 | ) | |
| Net decrease in net assets resulting from operations | | | (147,660,053 | ) | | | (39,395,082 | ) | |
| Dividends and Distributions to Shareholders from: | |
| Net investment income | | | (5,154,529 | ) | | | (7,288,118 | ) | |
| Net realized gain | | | — | | | | (108,627 | ) | |
| Tax return of capital | | | (752,325 | ) | | | (963,594 | ) | |
| Total dividends and distributions to shareholders | | | (5,906,854 | ) | | | (8,360,339 | ) | |
| Capital Stock Transactions: | |
| Increase in net assets from Fund share transactions | | | 106,884,150 | | | | 246,566,438 | | |
| Total increase (decrease) in net assets | | | (46,682,757 | ) | | | 198,811,017 | | |
| Net Assets: | |
| Beginning of year | | | 280,248,388 | | | | 81,437,371 | | |
| End of yeara | | $ | 233,565,631 | | | $ | 280,248,388 | | |
a Includes dividends in excess of net investment income of $1,452,416 and $3,220,061, respectively.
See accompanying notes to financial statements.
20
COHEN & STEERS INSTITUTIONAL GLOBAL REALTY SHARES, INC.
FINANCIAL HIGHLIGHTS
The following table includes selected data for a share outstanding throughout each period and other performance information derived from the financial statements. It should be read in conjunction with the financial statements and notes thereto.
| Per Share Operating Performance: | | For the
Year Ended
December 31, 2008 | | For the
Year Ended
December 31, 2007 | | For the Period
August 10, 2006a
through
December 31, 2006 | |
| Net asset value, beginning of period | | $ | 25.10 | | | $ | 29.57 | | | $ | 25.00 | | |
| Income from investment operations: | |
| Net investment income | | | 0.55 | | | | 0.49 | b | | | 0.12 | | |
| Net realized and unrealized gain (loss) | | | (11.02 | ) | | | (4.12 | ) | | | 4.62 | | |
| Total income (loss) from investment operations | | | (10.47 | ) | | | (3.63 | ) | | | 4.74 | | |
| Less dividends and distributions to shareholders from: | |
| Net investment income | | | (0.35 | ) | | | (0.73 | ) | | | (0.16 | ) | |
| Net realized gain | | | — | | | | (0.01 | ) | | | (0.01 | ) | |
| Tax return of capital | | | (0.05 | ) | | | (0.10 | ) | | | — | | |
| Total dividends and distributions to shareholders | | | (0.40 | ) | | | (0.84 | ) | | | (0.17 | ) | |
| Net increase (decrease) in net asset value | | | (10.87 | ) | | | (4.47 | ) | | | 4.57 | | |
| Net asset value, end of period | | $ | 14.23 | | | $ | 25.10 | | | $ | 29.57 | | |
| Total investment return | | | –42.05 | % | | | –12.35 | % | | | 18.98 | %c | |
| Ratios/Supplemental Data: | |
| Net assets, end of period (in millions) | | $ | 233.6 | | | $ | 280.2 | | | $ | 81.4 | | |
| Ratio of expenses to average daily net assets (before expense reduction) | | | 1.04 | % | | | 1.06 | % | | | 1.47 | %d | |
| Ratio of expenses to average daily net assets (net of expense reduction) | | | 1.00 | % | | | 1.00 | % | | | 1.00 | %d | |
| Ratio of net investment income to average daily net assets (before expense reduction) | | | 2.36 | % | | | 1.62 | % | | | 1.73 | %d | |
| Ratio of net investment income to average daily net assets (net of expense reduction) | | | 2.40 | % | | | 1.68 | % | | | 2.20 | %d | |
| Portfolio turnover rate | | | 126 | % | | | 67 | % | | | 8 | %c | |
a Commencement of operations.
b 6.2% of net investment income was attributable to a special dividend paid by Boston Properties, Inc.
c Not annualized.
d Annualized.
See accompanying notes to financial statements.
21
COHEN & STEERS INSTITUTIONAL GLOBAL REALTY SHARES, INC.
NOTES TO FINANCIAL STATEMENTS
Note 1. Significant Accounting Policies
Cohen & Steers Institutional Global Realty Shares, Inc. (the Fund) was incorporated under the laws of the State of Maryland on May 11, 2006 and is registered under the Investment Company Act of 1940, as amended, as a nondiversified, open-end management investment company. The Fund's investment objective is total return.
The following is a summary of significant accounting policies consistently followed by the Fund in the preparation of its financial statements. The policies are in conformity with accounting principles generally accepted in the United States of America (GAAP). The preparation of the financial statements in accordance with GAAP requires management to make estimates and assumptions that affect the reported amounts of assets and liabilities at the date of the financial statements and the reported amounts of income and expenses during the reporting period. Actual results could differ from those estimates.
Portfolio Valuation: Investments in securities that are listed on the New York Stock Exchange are valued, except as indicated below, at the last sale price reflected at the close of the New York Stock Exchange on the business day as of which such value is being determined. If there has been no sale on such day, the securities are valued at the mean of the closing bid and asked prices for the day or, if no asked price is available, at the bid price.
Securities not listed on the New York Stock Exchange but listed on other domestic or foreign securities exchanges or admitted to trading on the National Association of Securities Dealers Automated Quotations, Inc. (Nasdaq) national market system are valued in a similar manner. Securities traded on more than one securities exchange are valued at the last sale price on the business day as of which such value is being determined as reflected on the tape at the close of the exchange representing the principal market for such securities.
Readily marketable securities traded in the over-the-counter market, including listed securities whose primary market is believed by Cohen & Steers Capital Management, Inc. (the advisor) to be over-the-counter, but excluding securities admitted to trading on the Nasdaq National List, are valued at the official closing prices as reported by Nasdaq, the National Quotation Bureau, or such other comparable sources as the Board of Directors deems appropriate to reflect their fair market value. If there has been no sale on such day, the securities are valued at the mean of the closing bid and asked prices for the day, or if no asked price is available, at the bid price. Where securities are traded on more than one exchange and also over-the-counter, the securities will generally be valued using the quotations the Board of Directors believes most closely reflect the value of such securities.
Portfolio securities primarily traded on foreign markets are generally valued at the closing values of such securities on their respective exchanges or if after the close of the foreign markets, but prior to the close of business on the day the securities are being valued, market conditions change significantly, certain foreign securities may be fair valued pursuant to procedures established by the Board of Directors.
Securities for which market prices are unavailable, or securities for which the advisor determines that bid and/or asked price does not reflect market value, will be valued at fair value pursuant to procedures approved by
22
COHEN & STEERS INSTITUTIONAL GLOBAL REALTY SHARES, INC.
NOTES TO FINANCIAL STATEMENTS—(Continued)
the Fund's Board of Directors. Circumstances in which market prices may be unavailable include, but are not limited to, when trading in a security is suspended, the exchange on which the security is traded is subject to an unscheduled close or disruption or material events occur after the close of the exchange on which the security is principally traded. In these circumstances, the Fund determines fair value in a manner that fairly reflects the market value of the security on the valuation date based on consideration of any information or factors it deems appropriate. These may include recent transactions in comparable securities, information relating to the specific security and developments in the markets. In particular, portfolio securities primarily traded on foreign markets are generally valued at the closing values of such securities on their respective exchanges or if after the close of the foreign markets, but prior to the close of t rading on the NYSE on the day the securities are being valued, developments occur that are expected to materially affect the value of such securities, such values may be adjusted to reflect the estimated fair value of such securities as of the close of trading on the NYSE using a pricing service and/or procedures approved by the Fund's Board of Directors.
The Fund's use of fair value pricing may cause the net asset value of Fund shares to differ from the net asset value that would be calculated using market quotations. Fair value pricing involves subjective judgments and it is possible that the fair value determined for a security may be materially different than the value that could be realized upon the sale of that security.
Short-term debt securities, which have a maturity date of 60 days or less, are valued at amortized cost, which approximates value.
The Fund adopted Financial Accounting Standards Board Statement of Financial Accounting Standards No. 157, "Fair Value Measurements" ("FAS 157"), effective January 1, 2008. In accordance with FAS 157, fair value is defined as the price that the Fund would receive to sell an investment or pay to transfer a liability in a timely transaction with an independent buyer in the principal market, or in the absence of a principal market the most advantageous market for the investment or liability. FAS 157 establishes a single definition of fair value, creates a three-tier hierarchy as a framework for measuring fair value based on inputs used to value the Fund's investments, and requires additional disclosure about fair value. The hierarchy of inputs is summarized below.
• Level 1—quoted prices in active markets for identical investments
• Level 2—other significant observable inputs (including quoted prices for similar investments, interest rates, prepayment speeds, credit risk, etc.)
• Level 3—significant unobservable inputs (including the Fund's own assumptions in determining the fair value of investments)
The inputs or methodology used for valuing securities are not necessarily an indication of the risk associated with investing in those securities.
23
COHEN & STEERS INSTITUTIONAL GLOBAL REALTY SHARES, INC.
NOTES TO FINANCIAL STATEMENTS—(Continued)
The following is a summary of the inputs used as of December 31, 2008 in valuing the Fund's investments carried at value:
| | | | | Fair Value Measurements at December 31, 2008 Using | |
| | | Total | | Quoted Prices In
Active Market for
Identical Assets
(Level 1) | | Significant
Other Observable
Inputs
(Level 2) | | Significant
Unobservable
Inputs
(Level 3) | |
| Investments in Securities | | $ | 231,290,124 | | | $ | 97,822,720 | | | $ | 133,467,404 | | | $ | — | | |
Security Transactions and Investment Income: Security transactions are recorded on trade date. Realized gains and losses on investments sold are recorded on the basis of identified cost. Interest income is recorded on the accrual basis. Discounts are accreted and premiums are amortized over the life of the respective securities. Dividend income is recorded on the ex-dividend date except for certain dividends on foreign securities, which are recorded as soon as the Fund is informed after the ex-dividend date. The Fund records distributions received in excess of income from underlying investments as a reduction of cost of investments and/or realized gain. Such amounts are based on estimates if actual amounts are not available and actual amounts of income, realized gain and return of capital may differ from the estimated amounts. The Fund adjusts the estimated amount s of the components of distributions (and consequently its net investment income) as an increase to unrealized appreciation/(depreciation) and realized gain/(loss) on investments as necessary once the issuers provide information about the actual composition of the distributions.
Foreign Currency Translations: The books and records of the Fund are maintained in U.S. dollars as follows: (1) the foreign currency market value of investment securities, other assets and liabilities and foreign currency contracts are translated at the exchange rates prevailing at the end of the period; and (2) purchases, sales, income and expenses are translated at the exchange rates prevailing on the respective dates of such transactions. The resultant exchange gains and losses are recorded as realized and unrealized gain/loss on foreign exchange transactions. Pursuant to U.S. federal income tax regulations, certain foreign exchange gains/losses included in realized and unrealized gain/loss are included in or are a reduction of ordinary income for federal income tax purposes. The Fund does not isolate that portion of the results of operations arising as a resul t of changes in the foreign exchange rates from the changes in the market prices of the securities.
Foreign Securities: The Fund may directly purchase securities of foreign issuers. Investing in securities of foreign issuers involves special risks not typically associated with investing in securities of U.S. issuers. The risks include possible revaluation of currencies, the ability to repatriate funds, less complete financial information about companies and possible future adverse political and economic developments. Moreover, securities of many foreign issuers and their markets may be less liquid and their prices more volatile than those of securities of comparable U.S. issuers.
24
COHEN & STEERS INSTITUTIONAL GLOBAL REALTY SHARES, INC.
NOTES TO FINANCIAL STATEMENTS—(Continued)
Dividends and Distributions to Shareholders: Dividends from net investment income and capital gain distributions are determined in accordance with U.S. federal income tax regulations, which may differ from GAAP. Dividends from net investment income, if any, are declared and paid semiannually. Net realized capital gains, unless offset by any available capital loss carryforward, are typically distributed to shareholders at least annually. Dividends and distributions to shareholders are recorded on the ex-dividend date and are automatically reinvested in full and fractional shares of the Fund based on the net asset value per share at the close of business on the payable date unless the shareholder has elected to have them paid in cash.
Distributions paid by the Fund are subject to recharacterization for tax purposes. Based upon the results of operations for the year ended December 31, 2008, a portion of the dividends have been reclassified to return of capital.
Income Taxes: It is the policy of the Fund to continue to qualify as a regulated investment company, if such qualification is in the best interest of the shareholders, by complying with the requirements of Subchapter M of the Internal Revenue Code applicable to regulated investment companies, and by distributing substantially all of its taxable earnings to its shareholders. Accordingly, no provision for federal income or excise tax is necessary. The Fund has adopted the provisions of FASB Interpretation No. 48, Accounting for Uncertainty in Income Taxes (FIN 48). FIN 48 clarifies the accounting for income taxes by prescribing the minimum recognition threshold a tax position must meet before being recognized in the financial statements. An assessment of the Fund's tax positions has been made and it has been determined that there is no impact to the Fund's financial statements. Each of the Fund's federal tax returns for the prior three fiscal years remains subject to examination by the Internal Revenue Service.
Note 2. Investment Advisory Fees and Other Transactions with Affiliates
Investment Advisory Fees: The advisor serves as the Fund's investment advisor pursuant to an investment advisory agreement (the advisory agreement). Under the terms of the advisory agreement, the advisor provides the Fund with the day-to-day investment decisions and generally manages the Fund's investments in accordance with the stated policies of the Fund, subject to the supervision of the Fund's Board of Directors. For the services provided to the Fund, the advisor receives a fee, accrued daily and paid monthly, at the annual rate of 1.00% of the average daily net assets of the Fund.
The advisor is also responsible, under the advisory agreement, for the performance of certain administrative functions for the Fund. Additionally, the advisor pays all expenses of the Fund except for brokerage fees, taxes, interest, fees and expenses of the Fund's independent directors (as well as their independent counsel and other independent consultants), trade organization membership dues, federal and state registration fees and extraordinary expenses.
25
COHEN & STEERS INSTITUTIONAL GLOBAL REALTY SHARES, INC.
NOTES TO FINANCIAL STATEMENTS—(Continued)
The advisor has contractually agreed to reimburse the Fund so that its total annual operating expenses do not exceed 1.00% of the average daily net assets. This commitment will remain in place for the life of the Fund.
Under subadvisory agreements between the advisor and Cohen & Steers Asia Limited., Cohen & Steers UK Limited., and Cohen & Steers Europe S.A. (collectively the subadvisors), affiliates of the advisor, the subadvisors are responsible for managing the Fund's investments in certain non-U.S. real estate securities. For their services provided under the subadvisory agreement, the advisor (not the Fund) pays the subadvisors 16.3%, 6.3% and 6.3%, respectively, of the advisory fee received by the advisor from the Fund, net of operating expenses. For the year ended December 31, 2008, the advisor paid the subadvisors $401,910, $155,339 and $155,339, respectively.
Directors' and Officers' Fees: Certain directors and officers of the Fund are also directors, officers, and/or employees of the advisor. The Fund does not pay compensation to any affiliated directors and officers.
Other: At December 31, 2008, there were two institutional investors owning 15.6% of the Fund's outstanding shares. Investment activities of these shareholders could have significant impact on the Fund.
Note 3. Purchases and Sales of Securities
Purchases and sales of securities, excluding short-term investments, for the year ended December 31, 2008 totaled $462,838,124 and $356,118,349, respectively.
Note 4. Income Tax Information
The tax character of dividends and distributions paid was as follows:
| | | For the Year Ended
December 31, | |
| | | 2008 | | 2007 | |
| Ordinary income | | $ | 5,154,529 | | | $ | 7,314,848 | | |
| Long-term capital gains | | | — | | | | 81,897 | | |
| Tax return of capital | | | 752,325 | | | | 963,594 | | |
| Total dividends and distributions | | $ | 5,906,854 | | | $ | 8,360,339 | | |
26
COHEN & STEERS INSTITUTIONAL GLOBAL REALTY SHARES, INC.
NOTES TO FINANCIAL STATEMENTS—(Continued)
As of December 31, 2008, the tax-basis components of accumulated earnings and the federal tax cost were as follows:
| Gross unrealized appreciation | | $ | 6,223,725 | | |
| Gross unrealized depreciation | | | (116,759,681 | ) | |
| Total net unrealized depreciation | | $ | (110,535,956 | ) | |
| Cost for federal income tax purposes | | $ | 341,826,080 | | |
As of December 31, 2008, the Fund had a net capital loss carryforward of $65,693,655, of which $182,151 will expire on December 31, 2015 and $65,511,504 will expire on December 31, 2016. This carryforward may be used to offset future capital gains to the extent provided by regulations. In addition, the Fund incurred capital and currency losses of $19,731,001 and $38,811, respectively, after October 31, 2008, which are not recognized until the following fiscal year.
As of December 31, 2008, the Fund had temporary book/tax differences primarily attributable to wash sales on portfolio securities and permanent book/tax differences primarily attributable to sales of passive foreign investment companies, foreign currency transactions and income redesignations. To reflect reclassifications arising from the permanent differences, paid-in capital was charged $23,345, accumulated net realized loss was credited $53,033 and dividends in excess of net investment income was charged $29,688.
Note 5. Capital Stock
The Fund is authorized to issue 100 million shares of capital stock at a par value of $0.001 per share. The Board of Directors of the Fund is authorized to reclassify and issue any unissued shares of the Fund without shareholder approval. Transactions in Fund shares were as follows:
| | | For the
Year Ended
December 31, 2008 | | For the
Year Ended
December 31, 2007 | |
| | | Shares | | Amount | | Shares | | Amount | |
| Sold | | | 8,185,232 | | | $ | 156,150,711 | | | | 9,216,358 | | | $ | 270,272,278 | | |
Issued as reinvestment of
dividends and distributions | | | 287,706 | | | | 5,222,649 | | | | 298,514 | | | | 7,669,435 | | |
| Redeemed | | | (3,228,927 | ) | | | (54,489,210 | ) | | | (1,105,230 | ) | | | (31,375,275 | ) | |
| Net increase | | | 5,244,011 | | | $ | 106,884,150 | | | | 8,409,642 | | | $ | 246,566,438 | | |
Note 6. Borrowings
The Fund, in conjunction with other Cohen & Steers open-end funds, is a party to a $200,000,000 syndicated credit agreement (the credit agreement) with State Street Bank and Trust Company, as administrative agent and
27
COHEN & STEERS INSTITUTIONAL GLOBAL REALTY SHARES, INC.
NOTES TO FINANCIAL STATEMENTS—(Continued)
operations agent, and the lenders identified in the credit agreement, which expires December 2009. The Fund pays a commitment fee of 0.15% per annum on its proportionate share of the unused portion of the credit agreement.
During the year ended December 31, 2008, the Fund did not borrow under the credit agreement.
Note 7. Other
In the normal course of business, the Fund enters into contracts that provide general indemnifications. The Fund's maximum exposure under these arrangements is dependent on claims that may be made against the Fund in the future and, therefore, cannot be estimated; however, based on experience, the risk of material loss from such claims is considered remote.
Note 8. New Accounting Pronouncement
In March 2008, the Financial Accounting Standards Board issued Statement of Financial Accounting Standards No. 161, Disclosures about Derivative Instruments and Hedging Activities ("FAS 161"), an amendment of FASB Statement No. 133. FAS 161 requires enhanced disclosures about (a) how and why an entity uses derivative instruments, (b) how derivative instruments and related hedged items are accounted for, and (c) how derivative instruments and related hedged items affect the Fund's financial position, financial performance, and cash flows. Management is currently evaluating the impact the adoption of this pronouncement will have on the Fund's financial statements. FAS 161 is effective for fiscal years and interim periods beginning after November 15, 2008.
28
COHEN & STEERS INSTITUTIONAL GLOBAL REALTY SHARES, INC.
REPORT OF INDEPENDENT REGISTERED PUBLIC ACCOUNTING FIRM
To the Board of Directors and Shareholders of
Cohen & Steers Institutional Global Realty Shares, Inc.
In our opinion, the accompanying statement of assets and liabilities, including the schedule of investments, and the related statements of operations and of changes in net assets and the financial highlights present fairly, in all material respects, the financial position of Cohen & Steers Institutional Global Realty Shares, Inc. (the "Fund") at December 31, 2008, the results of its operations for the year then ended, the changes in its net assets for each of the two years in the period then ended and the financial highlights for each of the periods presented, in conformity with accounting principles generally accepted in the United States of America. These financial statements and financial highlights (hereafter referred to as "financial statements") are the responsibility of the Fund's management. Our responsibility is to express an opinion on these financial statements based on our audits. We conducted our audits of these financial st atements in accordance with the standards of the Public Company Accounting Oversight Board (United States). Those standards require that we plan and perform the audit to obtain reasonable assurance about whether the financial statements are free of material misstatement. An audit includes examining, on a test basis, evidence supporting the amounts and disclosures in the financial statements, assessing the accounting principles used and significant estimates made by management, and evaluating the overall financial statement presentation. We believe that our audits, which included confirmation of securities at December 31, 2008 by correspondence with the custodian and brokers, provide a reasonable basis for our opinion.
PricewaterhouseCoopers LLP
New York, New York
February 23, 2009
29
COHEN & STEERS INSTITUTIONAL GLOBAL REALTY SHARES, INC.
TAX INFORMATION—2008 (Unaudited)
Pursuant to the Jobs and Growth Relief Reconciliation Act of 2003, the Fund designates qualified dividend income of $1,420,227.
The Fund has elected, pursuant to section 853 of the Internal Revenue Code, to pass through foreign taxes of $517,208. The Fund generated net foreign source income of $6,472,712 with respect to this election.
OTHER INFORMATION
A description of the policies and procedures that the Fund uses to determine how to vote proxies relating to portfolio securities is available (i) without charge, upon request, by calling 800-330-7348, (ii) on our Web site at cohenandsteers.com or (iii) on the Securities and Exchange Commission's Web site at http://www.sec.gov. In addition, the Fund's proxy voting record for the most recent 12-month period ended June 30 is available (i) without charge, upon request, by calling 800-330-7348 or (ii) on the SEC's Web site at http://www.sec.gov.
The Fund files its complete schedule of portfolio holdings with the SEC for the first and third quarters of each fiscal year on Form N-Q. The Fund's Forms N-Q are available (i) without charge, upon request by calling 800-330-7348, or (ii) on the SEC's Web site at http://www.sec.gov. In addition, the Forms N-Q may be reviewed and copied at the SEC's Public Reference Room in Washington, DC. Information on the operation of the Public Reference Room may be obtained by calling 800-SEC-0330.
Please note that the distributions paid by the Fund to shareholders are subject to recharacterization for tax purposes. The Fund may also pay distributions in excess of the Fund's net investment company taxable income and this excess would be a tax-free return of capital distributed from the Fund's assets. The final tax treatment of all distributions is reported to shareholders on their 1099-DIV forms, which are mailed after the close of each calendar year.
30
COHEN & STEERS INSTITUTIONAL GLOBAL REALTY SHARES, INC.
MANAGEMENT OF THE FUND
The business and affairs of the Fund are managed under the direction of the Board of Directors. The Board of Directors approves all significant agreements between the Fund and persons or companies furnishing services to it, including the Fund's agreements with its advisor, administrator, custodian and transfer agent. The management of the Fund's day-to-day operations is delegated to its officers, the advisor and the Fund's administrator, subject always to the investment objective and policies of the Fund and to the general supervision of the Board of Directors.
The directors and officers of the Fund and their principal occupations during the past five years are set forth below. The statement of additional information (SAI) includes additional information about Fund directors and is available, without charge, upon request by calling 1-800-330-7348.
| Name, Address and Age* | | Position(s) Held
with Fund | | Term of
Office | | Principal Occupation
During Past 5 Years
(Including Other
Directorships Held) | | Number of
Funds Within
Fund
Complex
Overseen by
Director
(Including
the Fund) | | Length
of Time
Served** | |
| Interested Directors1 | | | | | | | | | | | |
|
Robert H. Steers
Age: 55 | | Director and Co-Chairman | | Until next election of directors | | Co-Chairman and Co-Chief Executive Officer of Cohen & Steers Capital Management, Inc. (CSCM), the fund's investment manager, and its parent company, Cohen & Steers, Inc. (CNS) since 2004. Vice President and Director, Cohen & Steers Securities, LLC (CSSL), the Cohen & Steers open-end funds' distributor. Prior thereto, Chairman of CSCM and the Cohen & Steers funds. | | | 21 | | | 1991 to present | |
|
Martin Cohen
Age: 60 | | Director and Co-Chairman | | Until next election of directors | | Co-Chairman and Co-Chief Executive Officer of CSCM and CNS. Vice President and Director of CSSL. Prior thereto, President of the CSCM and the Cohen & Steers funds. | | | 21 | | | 1991 to present | |
|
(table continued on next page)
* The address for each director is 280 Park Avenue, New York, NY 10017.
** The length of time served represents the year in which the director was first elected or appointed to any fund in the Cohen & Steers fund complex.
1 "Interested person", as defined in the 1940 Act, of the Fund because of affiliation with CSCM.
31
COHEN & STEERS INSTITUTIONAL GLOBAL REALTY SHARES, INC.
(table continued from previous page)
| Name, Address and Age* | | Position(s) Held
with Fund | | Term of
Office | | Principal Occupation
During Past 5 Years
(Including Other
Directorships Held) | | Number of
Funds Within
Fund
Complex
Overseen by
Director
(Including
the Fund) | | Length
of Time
Served** | |
| Disinterested Directors | | | | | | | | | | | | | |
|
Bonnie Cohen2
Age: 66 | | Director | | Until next election of directors | | Consultant. Director, Reis, Inc. (formerly Wellsford Real Property); Vice-Chair of the Board of Global Heritage Fund; Investment Committee, The Moriah Fund; Advisory Committee member, The Posse Foundation; Vice-Chair, District of Columbia Public Libraries; Board member, Washington National Opera. Former Under Secretary of State for Management, United States Department of State, 1996-2000. | | | 21 | | | 2001 to present | |
|
George Grossman
Age: 55 | | Director | | Until next election of directors | | Attorney-at-law | | | 21 | | | 1993 to present | |
|
Richard E. Kroon
Age: 66 | | Director | | Until next election of directors | | Member of Investment Committee, Monmouth University; retired Chairman and Managing Partner of the Sprout Group venture capital funds, then an affiliate of Donaldson, Lufkin & Jenrette Securities Corporation; and former Chairman of the National Venture Capital Association. | | | 21 | | | 2004 to present | |
|
Richard J. Norman
Age: 65 | | Director | | Until next election of directors | | Private Investor. Advisory Board Member of the Salvation Army. Member of the Chaplain's Core—DC Department of Corrections. Prior thereto, Investment Representative of Morgan Stanley Dean Witter. | | | 21 | | | 2001 to present | |
|
(table continued on next page)
* The address for each director is 280 Park Avenue, New York, NY 10017.
** The length of time served represents the year in which the director was first elected or appointed to any fund in the Cohen & Steers fund complex.
2 Martin Cohen and Bonnie Cohen are not related.
32
COHEN & STEERS INSTITUTIONAL GLOBAL REALTY SHARES, INC.
(table continued from previous page)
| Name, Address and Age* | | Position(s) Held
with Fund | | Term of
Office | | Principal Occupation
During Past 5 Years
(Including Other
Directorships Held) | | Number of
Funds Within
Fund
Complex
Overseen by
Director
(Including
the Fund) | | Length
of Time
Served** | |
Frank K. Ross
Age: 65 | | Director | | Until next election of directors | | Professor of Accounting, Howard University; Board member of Pepco Holdings, Inc. (electric utility). Formerly, Midatlantic Area Managing Partner for Audit and Risk Advisory Services at KPMG LLP and Managing Partner of its Washington, DC office. | | | 21 | | | 2004 to present | |
|
Willard H. Smith Jr.
Age: 72 | | Director | | Until next election of directors | | Board member of Essex Property Trust Inc., Realty Income Corporation and Crest Net Lease, Inc. Managing Director at Merrill Lynch & Co., Equity Capital Markets Division from 1983 to 1995. | | | 21 | | | 1996 to present | |
|
C. Edward Ward Jr.
Age: 62 | | Director | | Until next election of directors | | Member of the Board of Trustees of Directors Manhattan College, Riverdale, New York. Formerly head of closed-end fund listings for the New York Stock Exchange. | | | 21 | | | 2004 to present | |
|
* The address for each director is 280 Park Avenue, New York, NY 10017.
** The length of time served represents the year in which the director was first elected or appointed to any fund in the Cohen & Steers fund complex.
33
COHEN & STEERS INSTITUTIONAL GLOBAL REALTY SHARES, INC.
The officers of the Fund (other than Messrs. Cohen and Steers, whose biographies are provided above), their address, their ages and their principal occupations for at least the past five years are set forth below.
| Name, Address and Age* | | Position(s) Held
with Fund | | Principal Occupation During Past 5 Years | | Length of
Time Served** | |
Adam M. Derechin
Age: 44 | | President and Chief Executive Officer | | Chief Operating Officer of CSCM (since 2003) and CNS (since 2004). Prior to that, Senior Vice President of CSCM and Vice President and Assistant Treasurer of the Cohen & Steers funds. | | Since 2005 | |
|
Joseph M. Harvey
Age: 45 | | Vice President | | President and Chief Investment Officer of CSCM (since 2003) and President of CNS (since 2004). Prior to that, Senior Vice President and Director of Investment Research of CSCM. | | Since 2004 | |
|
Scott Crowe
Age: 31 | | Vice President | | Senior vice president and global research strategist of CSCM since 2007. Prior to that executive director at UBS and served as global head of real estate. | | Since 2008 | |
|
Francis C. Poli
Age: 46 | | Secretary | | Executive Vice President, Secretary and General Counsel of CSCM and CNS since March 2007. Prior thereto, General Counsel of Allianz Global Investors of America LP. | | Since 2007 | |
|
James Giallanza
Age: 42 | | Treasurer and Chief Financial Officer | | Senior Vice President of CSCM since September 2006. Prior thereto, Deputy Head of the US Funds Administration and Treasurer & CFO of various mutual funds within the Legg Mason (formally Citigroup Asset Management) fund complex from August 2004 to September 2006; Director/Controller of the US wholesale business at UBS Global Asset Management (U.S.) from September 2001 to July 2004. | | Since 2006 | |
|
Lisa D. Phelan
Age: 40 | | Chief Compliance Officer | | Senior Vice President & Director of Compliance of CSCM since January 2006. Chief Compliance Officer of CSSL since 2004. Prior to that, Compliance Officer of CSCM since 2004. Chief Compliance Officer, Avatar Associates & Overture Asset Managers, 2003-2004. First VP, Risk Management, Prudential Securities, Inc. 2000-2003. | | Since 2006 | |
|
* The address of each officer is 280 Park Avenue, New York, NY 10017.
** Officers serve one-year terms. The length of time served represents the year in which the officer was first elected to that position in any fund in the Cohen & Steers fund complex. All of the officers listed above are officers of one or more of the other funds in the complex.
34
COHEN & STEERS INSTITUTIONAL GLOBAL REALTY SHARES, INC.
Meet the Cohen & Steers family of open-end funds:
COHEN & STEERS
REALTY SHARES
• Designed for investors seeking total return, investing primarily in REITs
• Symbol: CSRSX
COHEN & STEERS
REALTY INCOME FUND
• Designed for investors seeking maximum total return, investing primarily in real estate securities with an emphasis on both income and capital appreciation
• Symbols: CSEIX, CSBIX, CSCIX, CSDIX
COHEN & STEERS
INTERNATIONAL REALTY FUND
• Designed for investors seeking total return, investing primarily in international real estate securities
• Symbols: IRFAX, IRFCX, IRFIX
COHEN & STEERS
DIVIDEND VALUE FUND
• Designed for investors seeking high current income and long-term growth of income and capital appreciation, investing primarily in dividend paying common stocks and preferred stocks
• Symbols: DVFAX, DVFCX, DVFIX
COHEN & STEERS
INSTITUTIONAL GLOBAL REALTY SHARES
• Designed for institutional investors seeking total return, investing primarily in global real estate securities
• Symbol: GRSIX
COHEN & STEERS
INSTITUTIONAL REALTY SHARES
• Designed for institutional investors seeking total return, investing primarily in REITs
• Symbol: CSRIX
COHEN & STEERS
GLOBAL REALTY SHARES
• Designed for investors seeking total return, investing primarily in global real estate equity securities
• Symbols: CSFAX, CSFBX, CSFCX, CSSPX
COHEN & STEERS
GLOBAL INFRASTRUCTURE FUND
• Designed for investors seeking total return, investing primarily in global infrastructure securities
• Symbols: CSUAX, CSUBX, CSUCX, CSUIX
COHEN & STEERS
ASIA PACIFIC REALTY SHARES
• Designed for investors seeking total return, investing primarily in real estate securities located in the Asia Pacific region
• Symbols: APFAX, APFCX, APFIX
COHEN & STEERS
EUROPEAN REALTY SHARES
• Designed for investors seeking total return, investing primarily in real estate securities located in Europe
• Symbols: EURAX, EURCX, EURIX
Please consider the investment objectives, risks, charges and expenses of the fund carefully before investing. A prospectus containing this and other information can be obtained by calling 800-330-7348 or by visiting cohenandsteers.com. Please read the prospectus carefully before investing.
Cohen & Steers Securities, LLC, Distributor
35
COHEN & STEERS INSTITUTIONAL GLOBAL REALTY SHARES, INC.
OFFICERS AND DIRECTORS
Robert H. Steers
Director and co-chairman
Martin Cohen
Director and co-chairman
Bonnie Cohen
Director
George Grossman
Director
Richard E. Kroon
Director
Richard J. Norman
Director
Frank K. Ross
Director
Willard H. Smith Jr.
Director
C. Edward Ward, Jr.
Director
Adam M. Derechin
President and chief executive officer
Joseph M. Harvey
Vice president
Scott Crowe
Vice president
Francis C. Poli
Secretary
James Giallanza
Treasurer and chief financial officer
Lisa D. Phelan
Chief compliance officer
KEY INFORMATION
Investment Advisor
Cohen & Steers Capital Management, Inc.
280 Park Avenue
New York, NY 10017
(212) 832-3232
Fund Subadministrator and Custodian
State Street Bank and Trust Company
One Lincoln Street
Boston, MA 02111
Transfer Agent
Boston Financial Data Services, Inc.
2 Heritage Drive
North Quincy, MA 02171
(800) 437-9912
Legal Counsel
Stroock & Stroock & Lavan LLP
180 Maiden Lane
New York, NY 10038
Distributor
Cohen & Steers Securities, LLC
280 Park Avenue
New York, NY 10017
Nasdaq Symbol: GRSIX
Web site: cohenandsteers.com
This report is authorized for delivery only to shareholders of Cohen & Steers Institutional Global Realty Shares, Inc. unless accompanied or preceded by the delivery of a currently effective prospectus setting forth details of the Fund. Past performance is of course no guarantee of future results and your investment may be worth more or less at the time you sell.
36
COHEN & STEERS
INSTITUTIONAL GLOBAL REALTY SHARES
280 PARK AVENUE
NEW YORK, NY 10017

eDelivery NOW AVAILABLE
Stop traditional mail delivery; receive your shareholder reports and prospectus online.
Sign up at cohenandsteers.com
ANNUAL REPORT
DECEMBER 31, 2008
GRSIXAR
Item 2. Code of Ethics.
The registrant has adopted a Code of Ethics that applies to its Principal Executive Officer and Principal Financial Officer. The registrant undertakes to provide to any person without charge, upon request, a copy of the Code of Ethics. Such request can be made by calling 800-330-7348 or writing to the Secretary of the registrant, 280 Park Avenue, New York, NY 10017.
Item 3. Audit Committee Financial Expert.
The registrant’s board has determined that Frank K. Ross, a member of the board’s audit committee, is an “audit committee financial expert”. Mr. Ross is “independent,” as such term is defined in this Item.
Item 4. Principal Accountant Fees and Services.
(a) — (d) Aggregate fees billed to the registrant for the last two fiscal years for professional services rendered by the registrant’s principal accountant were as follows:
| | 2008 | | 2007 | |
Audit Fees | | $ | 47,000 | | $ | 45,200 | |
Audit-Related Fees | | 0 | | 10,000 | |
Tax Fees | | 21,635 | | 13,300 | |
All Other Fees | | — | | — | |
| | | | | | | |
Audit-related fees were billed in connection with agreed upon procedures performed by the registrant’s principal accountant relating to after-tax return calculations. Tax fees were billed in connection with the preparation of tax returns, calculation and designation of dividends and other miscellaneous tax services.
Aggregate fees billed by the registrant’s principal accountant for the last two fiscal years for non-audit services provided to the registrant’s investment adviser (not including a sub-adviser whose role is primarily portfolio management and is subcontracted or overseen by another investment adviser) and any entity controlling, controlled by, or under common control with the investment adviser that provides ongoing services to the registered investment company, where the engagement relates directly to the operations and financial reporting of the registrant, were as follows:
| | 2008 | | 2007 | |
Audit-Related Fees | | — | | — | |
Tax Fees | | — | | — | |
All Other Fees | | $ | 110,000 | | $ | 109,000 | |
| | | | | | | |
These other fees were billed in connection with internal control reviews.
(e)(1) The audit committee is required to pre-approve audit and non-audit services performed for the registrant by the principal accountant. The audit committee also is required to pre-approve
non-audit services performed by the registrant’s principal accountant for the registrant’s investment adviser and any sub-adviser (not including any sub-adviser whose role is primarily portfolio management and is subcontracted with or overseen by another investment adviser) and/or to any entity controlling, controlled by or under common control with the registrant’s investment adviser that provides ongoing services to the registrant, if the engagement for services relates directly to the operations and financial reporting of the registrant.
The audit committee may delegate pre-approval authority to one or more of its members who are independent members of the board of directors of the registrant. The member or members to whom such authority is delegated shall report any pre-approval decisions to the audit committee at its next scheduled meeting. The audit committee may not delegate its responsibility to pre-approve services to be performed by the registrant’s principal accountant to the investment adviser.
(e) (2) No services included in (b) — (d) above were approved by the audit committee pursuant to paragraphs (c)(7)(i)(C) of Rule 2-01 of Regulation S-X.
(f) Not applicable.
(g) For the fiscal years ended December 31, 2008 and December 31, 2007, the aggregate fees billed by the registrant’s principal accountant for non-audit services rendered to the registrant and for non-audit services rendered to the registrant’s investment adviser (not including any sub-adviser whose role is primarily portfolio management and is subcontracted with or overseen by another investment adviser) and/or to any entity controlling, controlled by or under common control with the registrant’s investment adviser that provides ongoing services to the registrant were $131,635 and $78,300, respectively.
(h) The registrant’s audit committee considered whether the provision of non-audit services that were rendered to the registrant’s investment adviser (not including any sub-adviser whose role is primarily portfolio management and is subcontracted with or overseen by another investment adviser) and/or to any entity controlling, controlled by or under common control with the registrant’s investment adviser that provides ongoing services to the registrant that were not required to be pre-approved pursuant to paragraph (c)(7)(ii) of Rule 2-01 of Regulation S-X was compatible with maintaining the principal accountant’s independence.
Item 5. Audit Committee of Listed Registrants.
Not applicable.
Item 6. Schedule of Investments.
Included in Item 1 above.
Item 7. Disclosure of Proxy Voting Policies and Procedures for Closed-End Management Investment Companies.
Not applicable.
Item 8. Portfolio Managers of Closed-End Investment Companies.
Not applicable.
Item 9. Purchases of Equity Securities by Closed-End Management Investment Company and Affiliated Purchasers.
Not applicable.
Item 10. Submission of Matters to a Vote of Security Holders.
Not applicable.
Item 11. Controls and Procedures.
(a) The registrant’s principal executive officer and principal financial officer have concluded that the registrant’s disclosure controls and procedures are reasonably designed to ensure that information required to be disclosed by the registrant in this Form N-CSR was recorded, processed, summarized and reported within the time periods specified in the Securities and Exchange Commission’s rules and forms, based upon such officers’ evaluation of these controls and procedures as of a date within 90 days of the filing date of this report.
(b) There were no changes in the registrant’s internal control over financial reporting that occurred during the second fiscal quarter of the period covered by this report that have materially affected, or are reasonably likely to materially affect, the registrant’s internal control over financial reporting.
Item 12. Exhibits.
(a)(1) Not applicable.
(a) (2) Certifications of principal executive officer and principal financial officer as required by Rule 30a-2(a) under the Investment Company Act of 1940.
(b) Certifications of chief executive officer and chief financial officer as required by Rule 30a- 2(b) under the Investment Company Act of 1940.
SIGNATURES
Pursuant to the requirements of the Securities Exchange Act of 1934 and the Investment Company Act of 1940, the registrant has duly caused this report to be signed on its behalf by the undersigned, thereunto duly authorized.
COHEN & STEERS INSTITUTIONAL GLOBAL REALTY SHARES, INC.
By: | /s/ Adam M. Derechin | |
Name: Adam M. Derechin | |
Title: President and Chief Executive Officer | |
| |
Date: March 2, 2009 | |
Pursuant to the requirements of the Securities Exchange Act of 1934 and the Investment Company Act of 1940, this report has been signed below by the following persons on behalf of the registrant and in the capacities and on the dates indicated.
By: | /s/ Adam M. Derechin | |
Name: | Adam M. Derechin | |
Title: | President and Chief Executive Officer | |
| (principal executive officer) | |
| | | |
By: | /s/ James Giallanza | |
Name: | James Giallanza | |
Title: | Treasurer | |
| (principal financial officer) | |
| |
| |
Date: March 2, 2009 | |
| | | |