UNITED STATES
SECURITIES AND EXCHANGE COMMISSION
Washington, D.C. 20549
FORM N-CSR
CERTIFIED SHAREHOLDER REPORT OF REGISTERED
MANAGEMENT INVESTMENT COMPANIES
Investment Company Act file number | 811-21902 |
|
Cohen & Steers Institutional Global Realty Shares, Inc. |
(Exact name of registrant as specified in charter) |
|
280 Park Avenue, New York, NY | | 10017 |
(Address of principal executive offices) | | (Zip code) |
|
Francis C. Poli Cohen & Steers Capital Management, Inc. 280 Park Avenue New York, New York 10017 |
(Name and address of agent for service) |
|
Registrant’s telephone number, including area code: | (212) 832-3232 | |
|
Date of fiscal year end: | December 31 | |
|
Date of reporting period: | June 30, 2017 | |
| | | | | | | | |
Item 1. Reports to Stockholders.
COHEN & STEERS INSTITUTIONAL GLOBAL REALTY SHARES, INC.
To Our Shareholders:
We would like to share with you our report for the six months ended June 30, 2017. The net asset value (NAV) at that date was $26.00 per share.
The total returns for the Fund and its comparative benchmarks were:
| | | Six Months Ended
June 30, 2017 | |
| Cohen & Steers Institutional Global Realty Shares | | | 7.16 | % | |
| FTSE EPRA/NAREIT Developed Real Estate Index—neta | | | 4.84 | % | |
| S&P 500 Indexa | | | 9.34 | % | |
The performance data quoted represent past performance. Past performance is no guarantee of future results. The investment return and the principal value of an investment will fluctuate and shares, if redeemed, may be worth more or less than their original cost. Current performance may be lower or higher than the performance data quoted. Current total returns of the Fund can be obtained by visiting our website at cohenandsteers.com. The Fund's returns assume the reinvestment of all dividends and distributions at NAV. Fund performance reflects fee waivers and/or expense reimbursements, without which the performance would have been lower. Index performance does not reflect the deduction of any fees, taxes or expenses. An investor cannot invest directly in an index. Performance figures for periods shorter than one year are not annualized.
Please note that distributions paid by the Fund to shareholders are subject to recharacterization for tax purposes and are taxable up to the amount of the Fund's investment company taxable income and net realized gains. Distributions in excess of the Fund's investment company taxable income and net realized gains are a return of capital distributed from the Fund's assets.
Market Review
Global real estate stocks advanced during the six-month period ended June 30, 2017, aided by signs of a strengthening economic recovery and related improvements in operating fundamentals for many property markets. The monetary policy backdrop was supportive as well, with major central banks mostly maintaining high levels of quantitative easing.
a The FTSE EPRA/NAREIT Developed Real Estate Index—net is an unmanaged market-capitalization-weighted total return index, which consists of publicly traded equity REITs and listed property companies from developed markets and is net of dividend withholding taxes. The S&P 500 Index is an unmanaged index of 500 large-capitalization stocks that is frequently used as a general measure of U.S. stock market performance.
1
COHEN & STEERS INSTITUTIONAL GLOBAL REALTY SHARES, INC.
Markets in continental Europe were among the best performers, buoyed in part by easing political concerns. In the final round of France's presidential election in May, voters chose Emmanuel Macron, viewed as a pro-EU centrist, over Marine Le Pen, a right-leaning critic of the European Union. Macron favors more European financial integration and lower corporate tax rates, and his election calmed investor concerns about the spread of populist sentiment across the region.
Most Asia Pacific markets had solid absolute returns but the region trailed Europe as a group. Hong Kong was a strong performer, benefiting from healthier growth in China, which helped propel real estate companies to broad-based gains. In addition, the residential property market continued to surprise to the upside despite restrictions designed to cool the market. Japan declined, however, even as the country's economic data continued to improve.
U.S. real estate investment trusts (REITs) underperformed with only a modest gain, although returns varied widely by property type. Data center and industrial companies were among the top performers with double-digit gains, in contrast to sizable declines in retail sectors. Regional mall and shopping center REITs struggled amid ongoing news of store closings and concerns regarding the expansion of e-commerce, trends that could weigh on a number of these companies' operating fundamentals for an extended period.
Fund Performance
The Fund had a positive total return for the period and outperformed its benchmark. Stock selection in the U.S. was a primary contributor to relative performance, in part due to our significant underweight in retail landlords. Our cautious stance was based on our view of weakening consumer trends and generally unattractive valuations in retail sectors. We also had a beneficial overweight in U.S. data center REITs, which outperformed amid strong demand related to trends such as the outsourcing of IT infrastructure and the migration to cloud computing.
Stock selection in the U.K. also helped performance. We mostly avoided London-focused office and retail landlords, including several large companies that underperformed amid increased economic and Brexit uncertainty. Instead, we maintained a focus on U.K. sectors that we believe are less economically sensitive and less likely to be hindered by Brexit, such as student housing, self storage, health care and e-commerce-focused logistics warehouse landlords. Companies in these sectors generally outperformed, and our overweights in industrial company Segro, self storage landlord Big Yellow and health care company Assura, which all had strong returns, aided performance.
The Fund's overweight in Spain was additionally beneficial. The country outperformed the index, aided by a relatively strong economic recovery. The Fund's overweight in Hispania Activos Inmobiliarios, which owns Spanish offices and hotels, was a top contributor to performance with a sizable gain.
The Fund's non-investment in Singapore hindered relative performance, as that market rose nearly 20% in the period. We maintained a cautious view of Singapore real estate stocks based on weak property fundamentals in general and limited prospects for positive macro catalysts.
The Fund's underweight in Hong Kong also detracted from performance, as did our underweight in Sweden, which outperformed in part on news that the country's central bank would extend its
2
COHEN & STEERS INSTITUTIONAL GLOBAL REALTY SHARES, INC.
quantitative easing program into the second half of the year. The decision was generally unexpected given recent strength in the country's economic data such as manufacturing and gross domestic product.
Impact of Foreign Currency on Fund Performance
The currency impact of the Fund's investments in foreign securities contributed to absolute performance during the period. Although the Fund reports its NAV and pays dividends in U.S. dollars, the Fund's investments denominated in foreign currencies are subject to foreign currency risk. Most currencies appreciated against the U.S. dollar, including the euro, U.K. pound and Japanese yen. Consequently, changes in the exchange rates between foreign currencies and the U.S. dollar were a net tailwind for absolute returns.
Sincerely,
| | | | | 
| | 
| |
| | | | | JON CHEIGH | | WILLIAM LEUNG | |
| | | | | Portfolio Manager | | Portfolio Manager | |
| | | | | 
| | 
| |
| | | | | CHARLES J. MCKINLEY | | ROGIER QUIRIJNS | |
| | | | | Portfolio Manager | | Portfolio Manager | |

LUKE SULLIVAN
Portfolio Manager
3
COHEN & STEERS INSTITUTIONAL GLOBAL REALTY SHARES, INC.
The views and opinions in the preceding commentary are subject to change without notice and are as of the date of the report. There is no guarantee that any market forecast set forth in the commentary will be realized. This material represents an assessment of the market environment at a specific point in time, should not be relied upon as investment advice and is not intended to predict or depict performance of any investment.
Visit Cohen & Steers online at cohenandsteers.com
For more information about the Cohen & Steers family of mutual funds, visit cohenandsteers.com. Here you will find fund net asset values, fund fact sheets and portfolio highlights, as well as educational resources and timely market updates.
Our website also provides comprehensive information about Cohen & Steers, including our most recent press releases, profiles of our senior investment professionals and their investment approach to each asset class. The Cohen & Steers family of mutual funds invests in major real asset categories including real estate securities, listed infrastructure, commodities and natural resource equities, as well as preferred securities and other income solutions.
4
COHEN & STEERS INSTITUTIONAL GLOBAL REALTY SHARES, INC.
Performance Review (Unaudited)
Average Annual Total Returns—For Periods Ended June 30, 2017
| | 1 Year | | 5 Years | | 10 Years | | Since Inceptiona | |
Fund | | | 4.58 | % | | | 8.63 | % | | | 2.75 | % | | | 3.96 | % | |
The performance data quoted represent past performance. Past performance is no guarantee of future results. The investment return and principal value of an investment will fluctuate and shares, if redeemed, may be worth more or less than their original cost. Current performance may be lower or higher than the performance data quoted. Performance information current to the most recent month end can be obtained by visiting our website at cohenandsteers.com. Total return assumes the reinvestment of all dividends and distributions at NAV. The performance table does not reflect the deduction of taxes that a shareholder would pay on Fund distributions or the redemption of Fund shares. During the periods presented above, the investment manager waived fees and/or reimbursed expenses. Without this arrangement, performance would have been lower.
The annualized gross and net expense ratios as disclosed in the May 1, 2017 prospectus were 1.02% and 1.00%, respectively. The investment manager has contractually agreed to waive its fee and/or reimburse the Fund so that total annual Fund operating expenses (excluding brokerage fees and commissions, taxes, and, upon approval of the Board of Directors, extraordinary expenses) do not exceed 1.00% of the average daily net assets of the Fund. This commitment is currently expected to remain in place for the life of the Fund, can only be amended or terminated by agreement of the Fund and the investment manager and will terminate automatically in the event of termination of the investment management agreement between the investment manager and the Fund.
a Inception date of August 10, 2006.
5
COHEN & STEERS INSTITUTIONAL GLOBAL REALTY SHARES, INC.
Expense Example (Unaudited)
As a shareholder of the Fund, you incur two types of costs: (1) transaction costs, and (2) ongoing costs including investment management fees and other Fund expenses. This example is intended to help you understand your ongoing costs (in dollars) of investing in the Fund and to compare these costs with the ongoing costs of investing in other mutual funds.
The example is based on an investment of $1,000 invested at the beginning of the period and held for the entire period January 1, 2017—June 30, 2017.
Actual Expenses
The first line of the following table provides information about actual account values and expenses. You may use the information in this line, together with the amount you invested, to estimate the expenses that you paid over the period. Simply divide your account value by $1,000 (for example, an $8,600 account value divided by $1,000 = 8.6), then multiply the result by the number in the first line under the heading entitled "Expenses Paid During Period" to estimate the expenses you paid on your account during this period.
Hypothetical Example for Comparison Purposes
The second line of the following table provides information about hypothetical account values and hypothetical expenses based on the Fund's actual expense ratio and an assumed rate of return of 5% per year before expenses, which is not the Fund's actual return. The hypothetical account values and expenses may not be used to estimate the actual ending account balance or expenses you paid for the period. You may use this information to compare the ongoing cost of investing in the Fund and other funds. To do so, compare this 5% hypothetical example with the 5% hypothetical examples that appear in the shareholder reports of other funds.
Please note that the expenses shown in the table are meant to highlight your ongoing costs only and do not reflect any transaction costs. Therefore, the second line of the table is useful in comparing ongoing costs only, and will not help you determine the relative total costs of owning different funds. In addition, if these transactional costs were included, your costs would have been higher.
| | Beginning
Account Value
January 1, 2017 | | Ending
Account Value
June 30, 2017 | | Expenses Paid
During Perioda
January 1, 2017–
June 30, 2017 | |
Actual (7.16% return) | | $ | 1,000.00 | | | $ | 1,071.60 | | | $ | 5.14 | | |
Hypothetical (5% annual return
before expenses) | | $ | 1,000.00 | | | $ | 1,019.84 | | | $ | 5.01 | | |
a Expenses are equal to the Fund's annualized net expense ratio of 1.00% multiplied by the average account value over the period, multiplied by 181/365 (to reflect the one-half year period).
6
COHEN & STEERS INSTITUTIONAL GLOBAL REALTY SHARES, INC.
June 30, 2017
Top Ten Holdings
(Unaudited)
| Security | | Value | | % of
Net
Assets | |
AvalonBay Communities | | $ | 17,616,608 | | | | 4.0 | | |
HCP | | | 15,546,814 | | | | 3.5 | | |
Essex Property Trust | | | 15,499,746 | | | | 3.5 | | |
Cheung Kong Property Holdings Ltd. | | | 12,747,008 | | | | 2.9 | | |
Dexus Property Group | | | 12,593,622 | | | | 2.9 | | |
Deutsche Wohnen AG | | | 11,690,452 | | | | 2.7 | | |
Sun Communities | | | 11,304,381 | | | | 2.6 | | |
UDR | | | 11,205,356 | | | | 2.6 | | |
Extra Space Storage | | | 10,408,242 | | | | 2.4 | | |
Sumitomo Realty & Development Co., Ltd. | | | 10,166,259 | | | | 2.3 | | |
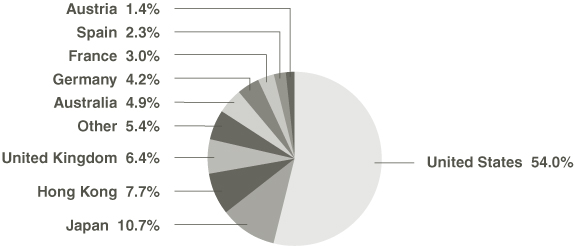
Country Breakdown
(Based on Net Assets)
(Unaudited)
7
COHEN & STEERS INSTITUTIONAL GLOBAL REALTY SHARES, INC.
SCHEDULE OF INVESTMENTS
June 30, 2017 (Unaudited)
| | | | | Number
of Shares | | Value | |
COMMON STOCK | | 99.5% | | | | | | | | | |
AUSTRALIA | | 4.9% | | | | | | | | | |
REAL ESTATE | |
DIVERSIFIED | | 2.9% | | | | | | | | | |
BGP Holdings PLC (EUR)a,b,c | | | | | 7,741,744 | | | $ | 117,602 | | |
Dexus Property Group | | | | | 1,728,391 | | | | 12,593,622 | | |
| | | | 12,711,224 | | |
INDUSTRIALS | | 2.0% | | | | | | | | | |
Goodman Group | | | | | 1,476,584 | | | | 8,931,682 | | |
TOTAL AUSTRALIA | | | | | | | 21,642,906 | | |
AUSTRIA | | 1.4% | | | | | | | | | |
REAL ESTATE—RESIDENTIAL | |
BUWOG AG | | | | | 219,427 | | | | 6,304,308 | | |
BELGIUM | | 0.5% | | | | | | | | | |
REAL ESTATE—RESIDENTIAL | |
Aedifica SA | | | | | 23,240 | | | | 2,027,132 | | |
BRAZIL | | 0.5% | | | | | | | | | |
REAL ESTATE—RETAIL | |
BR Malls Participacoes SA | | | | | 609,428 | | | | 2,198,275 | | |
CANADA | | 1.4% | | | | | | | | | |
REAL ESTATE—OFFICE | |
Allied Properties REIT | | | | | 206,695 | | | | 6,203,400 | | |
FRANCE | | 3.0% | | | | | | | | | |
REAL ESTATE | |
OFFICE | | 1.5% | | | | | | | | | |
Gecina SA | | | | | 41,591 | | | | 6,524,557 | | |
RETAIL | | 1.5% | | | | | | | | | |
Klepierre | | | | | 165,110 | | | | 6,767,205 | | |
TOTAL FRANCE | | | | | | | 13,291,762 | | |
GERMANY | | 4.2% | | | | | | | | | |
REAL ESTATE | |
OFFICE | | 1.0% | | | | | | | | | |
Alstria Office REIT AG | | | | | 333,366 | | | | 4,506,222 | | |
See accompanying notes to financial statements.
8
COHEN & STEERS INSTITUTIONAL GLOBAL REALTY SHARES, INC.
SCHEDULE OF INVESTMENTS—(Continued)
June 30, 2017 (Unaudited)
| | | | | Number
of Shares | | Value | |
RESIDENTIAL | | 3.2% | | | | | | | | | |
ADO Properties SA, 144Ad | | | | | 55,375 | | | $ | 2,342,335 | | |
Deutsche Wohnen AG | | | | | 305,628 | | | | 11,690,452 | | |
| | | | 14,032,787 | | |
TOTAL GERMANY | | | | | | | 18,539,009 | | |
HONG KONG | | 7.7% | | | | | | | | | |
REAL ESTATE | |
DIVERSIFIED | | 6.9% | | | | | | | | | |
Cheung Kong Property Holdings Ltd. | | | | | 1,627,500 | | | | 12,747,008 | | |
Hang Lung Properties Ltd. | | | | | 3,718,000 | | | | 9,286,130 | | |
Sun Hung Kai Properties Ltd. | | | | | 571,245 | | | | 8,392,215 | | |
| | | | 30,425,353 | | |
RETAIL | | 0.8% | | | | | | | | | |
Link REIT | | | | | 481,000 | | | | 3,659,505 | | |
TOTAL HONG KONG | | | | | | | 34,084,858 | | |
JAPAN | | 10.7% | | | | | | | | | |
REAL ESTATE | |
DIVERSIFIED | | 7.5% | | | | | | | | | |
Activia Properties | | | | | 1,385 | | | | 5,916,804 | | |
Mitsui Fudosan Co., Ltd. | | | | | 424,912 | | | | 10,126,487 | | |
Sumitomo Realty & Development Co., Ltd. | | | | | 330,000 | | | | 10,166,259 | | |
Tokyo Tatemono Co., Ltd. | | | | | 504,985 | | | | 6,608,917 | | |
| | | | 32,818,467 | | |
OFFICE | | 2.0% | | | | | | | | | |
Hulic REIT | | | | | 1,305 | | | | 2,036,252 | | |
Kenedix Office Investment Corp. | | | | | 644 | | | | 3,435,430 | | |
Nippon Building Fund | | | | | 661 | | | | 3,373,319 | | |
| | | | 8,845,001 | | |
RETAIL | | 1.2% | | | | | | | | | |
Japan Retail Fund Investment Corp. | | | | | 2,862 | | | | 5,279,973 | | |
TOTAL JAPAN | | | | | | | 46,943,441 | | |
NORWAY | | 0.8% | | | | | | | | | |
REAL ESTATE—OFFICE | |
Entra ASA, 144Ad | | | | | 274,874 | | | | 3,424,093 | | |
See accompanying notes to financial statements.
9
COHEN & STEERS INSTITUTIONAL GLOBAL REALTY SHARES, INC.
SCHEDULE OF INVESTMENTS—(Continued)
June 30, 2017 (Unaudited)
| | | | | Number
of Shares | | Value | |
SINGAPORE | | 0.3% | | | | | | | | | |
REAL ESTATE—INDUSTRIALS | |
Global Logistic Properties Ltd. | | | | | 690,000 | | | $ | 1,433,376 | | |
SPAIN | | 2.3% | | | | | | | | | |
REAL ESTATE—DIVERSIFIED | |
Hispania Activos Inmobiliarios SA | | | | | 128,193 | | | | 2,119,366 | | |
Merlin Properties Socimi SA | | | | | 634,237 | | | | 8,011,793 | | |
| | | | 10,131,159 | | |
SWEDEN | | 1.4% | | | | | | | | | |
REAL ESTATE—DIVERSIFIED | |
Fastighets AB Balder, Class Bc | | | | | 140,861 | | | | 3,410,881 | | |
Hufvudstaden AB | | | | | 169,228 | | | | 2,806,171 | | |
| | | | 6,217,052 | | |
UNITED KINGDOM | | 6.4% | | | | | | | | | |
REAL ESTATE | |
DIVERSIFIED | | 0.6% | | | | | | | | | |
LondonMetric Property PLC | | | | | 1,271,240 | | | | 2,771,686 | | |
HEALTH CARE | | 0.7% | | | | | | | | | |
Assura PLC | | | | | 3,920,922 | | | | 3,258,141 | | |
INDUSTRIALS | | 2.4% | | | | | | | | | |
Segro PLC | | | | | 1,266,471 | | | | 8,069,426 | | |
Tritax Big Box REIT PLC | | | | | 1,216,639 | | | | 2,316,701 | | |
| | | | 10,386,127 | | |
OFFICE | | 0.5% | | | | | | | | | |
Workspace Group PLC | | | | | 193,949 | | | | 2,249,481 | | |
RESIDENTIAL | | 1.0% | | | | | | | | | |
UNITE Group PLC | | | | | 523,131 | | | | 4,421,973 | | |
SELF STORAGE | | 1.2% | | | | | | | | | |
Big Yellow Group PLC | | | | | 318,964 | | | | 3,290,242 | | |
Safestore Holdings PLC | | | | | 347,076 | | | | 1,904,934 | | |
| | | | 5,195,176 | | |
TOTAL UNITED KINGDOM | | | | | | | 28,282,584 | | |
See accompanying notes to financial statements.
10
COHEN & STEERS INSTITUTIONAL GLOBAL REALTY SHARES, INC.
SCHEDULE OF INVESTMENTS—(Continued)
June 30, 2017 (Unaudited)
| | | | | Number
of Shares | | Value | |
UNITED STATES | | 54.0% | | | | | | | |
COMMUNICATIONS—TOWERS | | 1.0% | | | | | | | |
American Tower Corp. | | | | | 34,064 | | | $ | 4,507,348 | | |
REAL ESTATE | | 53.0% | | | | | | | | | |
HEALTH CARE | | 3.5% | | | | | | | | | |
HCP | | | | | 486,446 | | | | 15,546,814 | | |
HOTEL | | 3.4% | | | | | | | | | |
Hilton Worldwide Holdings | | | | | 52,846 | | | | 3,268,525 | | |
Host Hotels & Resorts | | | | | 249,419 | | | | 4,556,885 | | |
Red Rock Resorts, Class A | | | | | 97,071 | | | | 2,286,022 | | |
Sunstone Hotel Investors | | | | | 312,565 | | | | 5,038,548 | | |
| | | | 15,149,980 | | |
INDUSTRIALS | | 1.8% | | | | | | | | | |
Prologis | | | | | 138,322 | | | | 8,111,202 | | |
OFFICE | | 11.3% | | | | | | | | | |
Corporate Office Properties Trust | | | | | 197,080 | | | | 6,903,712 | | |
Cousins Properties | | | | | 815,067 | | | | 7,164,439 | | |
Douglas Emmett | | | | | 167,301 | | | | 6,392,571 | | |
Empire State Realty Trust, Class A | | | | | 252,957 | | | | 5,253,917 | | |
Kilroy Realty Corp. | | | | | 71,170 | | | | 5,348,425 | | |
Parkway | | | | | 147,366 | | | | 3,373,208 | | |
SL Green Realty Corp. | | | | | 63,456 | | | | 6,713,645 | | |
Vornado Realty Trust | | | | | 92,362 | | | | 8,672,792 | | |
| | | | 49,822,709 | | |
RESIDENTIAL | | 17.1% | | | | | | | | | |
APARTMENT | | 10.1% | | | | | | | | | |
AvalonBay Communities | | | | | 91,672 | | | | 17,616,608 | | |
Essex Property Trust | | | | | 60,247 | | | | 15,499,746 | | |
UDR | | | | | 287,538 | | | | 11,205,356 | | |
| | | | 44,321,710 | | |
MANUFACTURED HOME | | 4.2% | | | | | | | | | |
Equity Lifestyle Properties | | | | | 81,293 | | | | 7,018,838 | | |
Sun Communities | | | | | 128,913 | | | | 11,304,381 | | |
| | | | 18,323,219 | | |
See accompanying notes to financial statements.
11
COHEN & STEERS INSTITUTIONAL GLOBAL REALTY SHARES, INC.
SCHEDULE OF INVESTMENTS—(Continued)
June 30, 2017 (Unaudited)
| | | | | Number
of Shares | | Value | |
SINGLE FAMILY | | 1.7% | | | | | | | | | |
American Homes 4 Rent, Class A | | | | | 336,814 | | | $ | 7,601,892 | | |
STUDENT HOUSING | | 1.1% | | | | | | | | | |
Education Realty Trust | | | | | 128,587 | | | | 4,982,746 | | |
TOTAL RESIDENTIAL | | | | | | | 75,229,567 | | |
SELF STORAGE | | 2.4% | | | | | | | | | |
Extra Space Storage | | | | | 133,439 | | | | 10,408,242 | | |
SHOPPING CENTERS | | 8.0% | | | | | | | | | |
COMMUNITY CENTER | | 2.5% | | | | | | | | | |
Brixmor Property Group | | | | | 135,767 | | | | 2,427,514 | | |
Kimco Realty Corp. | | | | | 76,728 | | | | 1,407,959 | | |
Weingarten Realty Investors | | | | | 229,155 | | | | 6,897,566 | | |
| | | | 10,733,039 | | |
FREE STANDING | | 2.1% | | | | | | | | | |
Realty Income Corp. | | | | | 170,429 | | | | 9,404,272 | | |
REGIONAL MALL | | 3.4% | | | | | | | | | |
GGP | | | | | 338,277 | | | | 7,969,806 | | |
Simon Property Group | | | | | 43,479 | | | | 7,033,163 | | |
| | | | 15,002,969 | | |
TOTAL SHOPPING CENTERS | | | | | | | 35,140,280 | | |
SPECIALTY | | 5.5% | | | | | | | | | |
CyrusOne | | | | | 84,957 | | | | 4,736,353 | | |
Digital Realty Trust | | | | | 58,533 | | | | 6,611,302 | | |
DuPont Fabros Technology | | | | | 115,671 | | | | 7,074,438 | | |
Equinix | | | | | 8,668 | | | | 3,719,959 | | |
GEO Group/The | | | | | 71,645 | | | | 2,118,543 | | |
| | | | 24,260,595 | | |
TOTAL REAL ESTATE | | | | | | | 233,669,389 | | |
TOTAL UNITED STATES | | | | | | | 238,176,737 | | |
TOTAL COMMON STOCK
(Identified cost—$384,063,839) | | | | | | | 438,900,092 | | |
See accompanying notes to financial statements.
12
COHEN & STEERS INSTITUTIONAL GLOBAL REALTY SHARES, INC.
SCHEDULE OF INVESTMENTS—(Continued)
June 30, 2017 (Unaudited)
| | | | | Number
of Shares | | Value | |
SHORT-TERM INVESTMENTS | | | 0.2% | | | | | | | | | | |
MONEY MARKET FUNDS | |
State Street Institutional Treasury Money
Market Fund, Premier Class, 0.83%e | | | | | 700,000 | | | $ | 700,000 | | |
TOTAL SHORT-TERM INVESTMENTS
(Identified cost—$700,000) | | | | | | | 700,000 | | |
TOTAL INVESTMENTS (Identified cost—$384,763,839) | | | 99.7 | % | | | | | | | 439,600,092 | | |
OTHER ASSETS IN EXCESS OF LIABILITIES | | | 0.3 | | | | | | | | 1,298,024 | | |
NET ASSETS (Equivalent to $26.00 per share based on
16,958,627 shares of common stock outstanding) | | | 100.0 | % | | | | | | $ | 440,898,116 | | |
Glossary of Portfolio Abbreviations
EUR Euro Currency
REIT Real Estate Investment Trust
Note: Percentages indicated are based on the net assets of the Fund.
a Security value is determined based on significant unobservable inputs (Level 3).
b Illiquid security. Aggregate holdings equal 0.0% of the net assets of the Fund.
c Non-income producing security.
d Resale is restricted to qualified institutional investors. Aggregate holdings amounting to $5,766,428 or 1.3% of the net assets of the Fund, of which 0.0% are illiquid.
e Rate quoted represents the annualized seven-day yield of the fund.
See accompanying notes to financial statements.
13
COHEN & STEERS INSTITUTIONAL GLOBAL REALTY SHARES, INC.
SCHEDULE OF INVESTMENTS—(Continued)
June 30, 2017 (Unaudited)
Sector Summary | | % of
Net Assets | |
Residential | | | 23.2 | | |
| Diversified | | | 21.6 | | |
| Office | | | 18.5 | | |
Shopping Centers | | | 8.0 | | |
Industrials | | | 6.5 | | |
Specialty | | | 5.5 | | |
Health Care | | | 4.2 | | |
Retail | | | 4.0 | | |
Self Storage | | | 3.6 | | |
Hotel | | | 3.4 | | |
Towers | | | 1.0 | | |
Other | | | 0.5 | | |
| | | | 100.0 | | |
See accompanying notes to financial statements.
14
COHEN & STEERS INSTITUTIONAL GLOBAL REALTY SHARES, INC.
STATEMENT OF ASSETS AND LIABILITIES
June 30, 2017 (Unaudited)
ASSETS: | |
Investments in securities, at value (Identified cost—$384,763,839) | | $ | 439,600,092 | | |
Cash | | | 305,919 | | |
Foreign currency, at value (Identified cost—$125,292) | | | 125,202 | | |
Receivable for: | |
Investment securities sold | | | 2,135,098 | | |
Dividends | | | 1,535,986 | | |
Fund shares sold | | | 217,342 | | |
Other assets | | | 2,466 | | |
Total Assets | | | 443,922,105 | | |
LIABILITIES: | |
Payable for: | |
Investment securities purchased | | | 1,336,756 | | |
Dividends and distributions declared | | | 867,806 | | |
Fund shares redeemed | | | 457,599 | | |
Investment management fees | | | 361,616 | | |
Directors' fees | | | 151 | | |
Other liabilities | | | 61 | | |
Total Liabilities | | | 3,023,989 | | |
NET ASSETS applicable to 16,958,627 shares of $0.001 par value of
common stock outstanding | | $ | 440,898,116 | | |
NET ASSET VALUE PER SHARE: | |
($440,898,116 ÷ 16,958,627 shares outstanding) | | $ | 26.00 | | |
NET ASSETS consist of: | |
Paid-in capital | | $ | 390,779,071 | | |
Dividends in excess of net investment income | | | (4,380,086 | ) | |
Accumulated net realized loss | | | (334,738 | ) | |
Net unrealized appreciation | | | 54,833,869 | | |
| | | $ | 440,898,116 | | |
See accompanying notes to financial statements.
15
COHEN & STEERS INSTITUTIONAL GLOBAL REALTY SHARES, INC.
STATEMENT OF OPERATIONS
For the Six Months Ended June 30, 2017 (Unaudited)
Investment Income: | |
Dividend income (net of $293,293 of foreign withholding tax) | | $ | 6,117,242 | | |
Expenses: | |
Investment management fees | | | 2,228,540 | | |
Registration and filing fees | | | 19,188 | | |
Directors' fees and expenses | | | 15,882 | | |
Miscellaneous | | | 2,371 | | |
Total Expenses | | | 2,265,981 | | |
Reduction of Expenses (See Note 2) | | | (37,495 | ) | |
Net Expenses | | | 2,228,486 | | |
Net Investment Income (Loss) | | | 3,888,756 | | |
Net Realized and Unrealized Gain (Loss): | |
Net realized gain (loss) on: | | | | | |
Investments | | | 3,238,902 | | |
Foreign currency transactions | | | 7,257 | | |
Net realized gain (loss) | | | 3,246,159 | | |
Net change in unrealized appreciation (depreciation) on: | |
Investments | | | 24,689,655 | | |
Foreign currency translations | | | 5,447 | | |
Net change in unrealized appreciation (depreciation) | | | 24,695,102 | | |
Net Realized and Unrealized Gain (Loss) | | | 27,941,261 | | |
Net Increase (Decrease) in Net Assets Resulting from Operations | | $ | 31,830,017 | | |
See accompanying notes to financial statements.
16
COHEN & STEERS INSTITUTIONAL GLOBAL REALTY SHARES, INC.
STATEMENT OF CHANGES IN NET ASSETS (Unaudited)
| | | For the
Six Months Ended
June 30, 2017 | | For the
Year Ended
December 31, 2016 | |
Change in Net Assets: | |
From Operations: | |
Net investment income (loss) | | $ | 3,888,756 | | | $ | 8,401,138 | | |
Net realized gain (loss) | | | 3,246,159 | | | | 27,319,950 | | |
Net change in unrealized appreciation
(depreciation) | | | 24,695,102 | | | | (20,584,073 | ) | |
Net increase (decrease) in net assets
resulting from operations | | | 31,830,017 | | | | 15,137,015 | | |
Dividends and Distributions to Shareholders from: | |
Net investment income | | | (5,328,337 | ) | | | (16,395,823 | ) | |
Net realized gain | | | (1,105,881 | ) | | | (9,154,349 | ) | |
Total dividends and distributions to
shareholders | | | (6,434,218 | ) | | | (25,550,172 | ) | |
Capital Stock Transactions: | |
Increase (decrease) in net assets from Fund share
transactions | | | (9,664,199 | ) | | | (63,625,462 | ) | |
Total increase (decrease) in net assets | | | 15,731,600 | | | | (74,038,619 | ) | |
Net Assets: | |
Beginning of period | | | 425,166,516 | | | | 499,205,135 | | |
End of perioda | | $ | 440,898,116 | | | $ | 425,166,516 | | |
a Includes dividends in excess of net investment income of $4,380,086 and $2,940,505, respectively.
See accompanying notes to financial statements.
17
COHEN & STEERS INSTITUTIONAL GLOBAL REALTY SHARES, INC.
FINANCIAL HIGHLIGHTS (Unaudited)
The following table includes selected data for a share outstanding throughout each period and other performance information derived from the financial statements. It should be read in conjunction with the financial statements and notes thereto.
| | | For the Six
Months Ended | | For the Year Ended December 31, | |
Per Share Operating Performance: | | June 30, 2017 | | 2016 | | 2015 | | 2014 | | 2013 | | 2012 | |
Net asset value, beginning of period | | $ | 24.62 | | | $ | 25.16 | | | $ | 25.24 | | | $ | 22.58 | | | $ | 22.28 | | | $ | 18.52 | | |
Income (loss) from investment operations: | |
Net investment income (loss)a | | | 0.22 | | | | 0.48 | | | | 0.36 | | | | 0.53 | b | | | 0.36 | | | | 0.35 | | |
Net realized and unrealized gain (loss) | | | 1.55 | | | | 0.49 | | | | 0.26 | | | | 2.65 | | | | 0.53 | | | | 4.40 | | |
Total from investment operations | | | 1.77 | | | | 0.97 | | | | 0.62 | | | | 3.18 | | | | 0.89 | | | | 4.75 | | |
Less dividends and distributions to
shareholders from: | |
Net investment income | | | (0.32 | ) | | | (0.96 | ) | | | (0.70 | ) | | | (0.52 | ) | | | (0.59 | ) | | | (0.99 | ) | |
Net realized gain | | | (0.07 | ) | | | (0.55 | ) | | | — | | | | — | | | | — | | | | — | | |
Total dividends and distributions
to shareholders | | | (0.39 | ) | | | (1.51 | ) | | | (0.70 | ) | | | (0.52 | ) | | | (0.59 | ) | | | (0.99 | ) | |
Net increase (decrease) in net asset value | | | 1.38 | | | | (0.54 | ) | | | (0.08 | ) | | | 2.66 | | | | 0.30 | | | | 3.76 | | |
Net asset value, end of period | | $ | 26.00 | | | $ | 24.62 | | | $ | 25.16 | | | $ | 25.24 | | | $ | 22.58 | | | $ | 22.28 | | |
Total investment returnc | | | 7.16 | %d | | | 3.82 | % | | | 2.52 | % | | | 14.12 | % | | | 4.07 | % | | | 25.91 | % | |
Ratios/Supplemental Data: | |
Net assets, end of period (in millions) | | $ | 440.9 | | | $ | 425.2 | | | $ | 499.2 | | | $ | 527.3 | | | $ | 511.1 | | | $ | 505.4 | | |
Ratio of expenses to average daily net
assets (before expense reduction) | | | 1.02 | %e | | | 1.02 | % | | | 1.02 | % | | | 1.01 | % | | | 1.01 | % | | | 1.02 | % | |
Ratio of expenses to average daily net
assets (net of expense reduction) | | | 1.00 | %e | | | 1.00 | % | | | 1.00 | % | | | 1.00 | % | | | 1.00 | % | | | 1.00 | % | |
Ratio of net investment income (loss) to
average daily net assets (before
expense reduction) | | | 1.72 | %e | | | 1.85 | % | | | 1.41 | % | | | 2.19 | % | | | 1.54 | % | | | 1.69 | % | |
Ratio of net investment income (loss) to
average daily net assets (net of
expense reduction) | | | 1.74 | %e | | | 1.87 | % | | | 1.43 | % | | | 2.20 | % | | | 1.55 | % | | | 1.71 | % | |
Portfolio turnover rate | | | 48 | %d | | | 100 | % | | | 77 | % | | | 111 | % | | | 126 | % | | | 100 | % | |
a Calculation based on average shares outstanding.
b 24.4% of gross income was attributable to dividends paid by Westfield Corp.
c Return assumes the reinvestment of all dividends and distributions at NAV.
d Not annualized.
e Annualized.
See accompanying notes to financial statements.
18
COHEN & STEERS INSTITUTIONAL GLOBAL REALTY SHARES, INC.
NOTES TO FINANCIAL STATEMENTS (Unaudited)
Note 1. Organization and Significant Accounting Policies
Cohen & Steers Institutional Global Realty Shares, Inc. (the Fund) was incorporated under the laws of the State of Maryland on May 11, 2006 and is registered under the Investment Company Act of 1940 (the 1940 Act) as a non-diversified, open-end management investment company. The Fund's investment objective is total return.
The following is a summary of significant accounting policies consistently followed by the Fund in the preparation of its financial statements. The Fund is an investment company and, accordingly, follows the investment company accounting and reporting guidance of the Financial Accounting Standards Board Accounting Standards Codification Topic (ASC) 946—Investment Companies. The accounting policies of the Fund are in conformity with accounting principles generally accepted in the United States of America (GAAP). The preparation of the financial statements in accordance with GAAP requires management to make estimates and assumptions that affect the reported amounts of assets and liabilities at the date of the financial statements and the reported amounts of income and expenses during the reporting period. Actual results could differ from those estimates.
Portfolio Valuation: Investments in securities that are listed on the New York Stock Exchange (NYSE) are valued, except as indicated below, at the last sale price reflected at the close of the NYSE on the business day as of which such value is being determined. If there has been no sale on such day, the securities are valued at the mean of the closing bid and ask prices on such day or, if no ask price is available, at the bid price.
Securities not listed on the NYSE but listed on other domestic or foreign securities exchanges (including NASDAQ) are valued in a similar manner. Securities traded on more than one securities exchange are valued at the last sale price reflected at the close of the exchange representing the principal market for such securities on the business day as of which such value is being determined. If after the close of a foreign market, but prior to the close of business on the day the securities are being valued, market conditions change significantly, certain non-U.S. equity holdings may be fair valued pursuant to procedures established by the Board of Directors.
Readily marketable securities traded in the over-the-counter (OTC) market, including listed securities whose primary market is believed by Cohen & Steers Capital Management, Inc. (the investment manager) to be OTC, are valued on the basis of prices provided by a third-party pricing service or third-party broker-dealers when such prices are believed by the investment manager, pursuant to delegation by the Board of Directors, to reflect the fair value of such securities.
Short-term debt securities with a maturity date of 60 days or less are valued at amortized cost, which approximates fair value. Investments in open-end mutual funds are valued at their closing net asset value.
The policies and procedures approved by the Fund's Board of Directors delegate authority to make fair value determinations to the investment manager, subject to the oversight of the Board of Directors. The investment manager has established a valuation committee (Valuation Committee) to administer, implement and oversee the fair valuation process according to the policies and procedures approved annually by the Board of Directors. Among other things, these procedures allow the Fund to
19
COHEN & STEERS INSTITUTIONAL GLOBAL REALTY SHARES, INC.
NOTES TO FINANCIAL STATEMENTS (Unaudited)—(Continued)
utilize independent pricing services, quotations from securities and financial instrument dealers and other market sources to determine fair value.
Securities for which market prices are unavailable, or securities for which the investment manager determines that the bid and/or ask price or a counterparty valuation does not reflect market value, will be valued at fair value, as determined in good faith by the Valuation Committee, pursuant to procedures approved by the Fund's Board of Directors. Circumstances in which market prices may be unavailable include, but are not limited to, when trading in a security is suspended, the exchange on which the security is traded is subject to an unscheduled close or disruption or material events occur after the close of the exchange on which the security is principally traded. In these circumstances, the Fund determines fair value in a manner that fairly reflects the market value of the security on the valuation date based on consideration of any information or factors it deems appropriate. These may include, but are not limited to, recent transactions in comparable securities, information relating to the specific security and developments in the markets.
Foreign equity fair value pricing procedures utilized by the Fund may cause certain non-U.S. equity holdings to be fair valued on the basis of fair value factors provided by a pricing service to reflect any significant market movements between the time the Fund values such securities and the earlier closing of foreign markets.
The Fund's use of fair value pricing may cause the net asset value of Fund shares to differ from the net asset value that would be calculated using market quotations. Fair value pricing involves subjective judgments and it is possible that the fair value determined for a security may be materially different than the value that could be realized upon the sale of that security.
Fair value is defined as the price that the Fund would expect to receive upon the sale of an investment or expect to pay to transfer a liability in an orderly transaction with an independent buyer in the principal market or, in the absence of a principal market, the most advantageous market for the investment or liability. The hierarchy of inputs that are used in determining the fair value of the Fund's investments is summarized below.
• Level 1—quoted prices in active markets for identical investments
• Level 2—other significant observable inputs (including quoted prices for similar investments, interest rates, credit risk, etc.)
• Level 3—significant unobservable inputs (including the Fund's own assumptions in determining the fair value of investments)
The inputs or methodology used for valuing securities may or may not be an indication of the risk associated with investing in those securities.
For movements between the levels within the fair value hierarchy, the Fund has adopted a policy of recognizing the transfer at the end of the period in which the underlying event causing the movement occurred. Changes in valuation techniques may result in transfers into or out of an assigned level within the disclosure hierarchy. There were no transfers between Level 1 and Level 2 investments as of June 30, 2017.
20
COHEN & STEERS INSTITUTIONAL GLOBAL REALTY SHARES, INC.
NOTES TO FINANCIAL STATEMENTS (Unaudited)—(Continued)
The following is a summary of the inputs used as of June 30, 2017 in valuing the Fund's investments carried at value:
| | Total | | Quoted Prices
in Active
Markets for
Identical
Investments
(Level 1) | | Other
Significant
Observable
Inputs
(Level 2) | | Significant
Unobservable
Inputs
(Level 3) | |
Common Stock: | |
Australia | | $ | 21,642,906 | | | $ | 21,525,304 | | | $ | — | | | $ | 117,602 | a | |
Other Countries | | | 417,257,186 | | | | 417,257,186 | | | | — | | | | — | | |
Short-Term Investments | | | 700,000 | | | | — | | | | 700,000 | | | | — | | |
Total Investmentsb | | $ | 439,600,092 | | | $ | 438,782,490 | | | $ | 700,000 | | | $ | 117,602 | | |
a BGP Holdings PLC was acquired via a spinoff and has been fair valued, by the Valuation Committee, pursuant to the Fund's fair value procedures and classified as a Level 3 security.
b Portfolio holdings are disclosed individually on the Schedule of Investments.
The following is a reconciliation of investments for which significant unobservable inputs (Level 3) were used in determining fair value:
| | Common Stock—
Australia | |
Balance as of December 31, 2016 | | $ | 427,026 | | |
Salesa | | | (346,293 | ) | |
Realized gain (loss) | | | 346,293 | | |
Change in unrealized appreciation (depreciation) | | | (309,424 | ) | |
Balance as of June 30, 2017 | | $ | 117,602 | | |
a Amount represents proceeds received as part of a liquidating distribution from BGP Holdings PLC and is included in change in unrealized appreciation (depreciation).
The change in unrealized appreciation (depreciation) attributable to securities owned on June 30, 2017, which were valued using significant unobservable inputs (Level 3) amounted to $36,869.
The following table summarizes the quantitative inputs and assumptions used for investments categorized in Level 3 of the fair value hierarchy.
| | Fair Value at
June 30, 2017 | | Valuation
Technique | | Unobservable
Inputs | | Input
Values | |
Common Stock—
Australia | | $ | 117,602 | | | Estimated Distributions Less
Discount Rate | | Discount Rate | | | 20.00 | % | |
21
COHEN & STEERS INSTITUTIONAL GLOBAL REALTY SHARES, INC.
NOTES TO FINANCIAL STATEMENTS (Unaudited)—(Continued)
The significant unobservable inputs utilized in the fair value measurement of the Fund's Level 3 equity investments in Common Stock—Australia is a discount rate to reflect the uncertainty regarding the amount and timing of distributions. Significant increases (decreases) in these inputs may result in a materially lower (higher) fair value measurement.
Security Transactions and Investment Income: Security transactions are recorded on trade date. Realized gains and losses on investments sold are recorded on the basis of identified cost. Interest income is recorded on the accrual basis. Discounts are accreted and premiums are amortized over the life of the respective securities. Dividend income is recorded on the ex-dividend date, except for certain dividends on foreign securities, which are recorded as soon as the Fund is informed after the ex-dividend date. Distributions from REITs are recorded as ordinary income, net realized capital gain or return of capital based on information reported by the REITs and management's estimates of such amounts based on historical information. These estimates are adjusted when the actual source of distributions is disclosed by the REITs and actual amounts may differ from the estimated amounts.
Foreign Currency Translation: The books and records of the Fund are maintained in U.S. dollars. Investment securities and other assets and liabilities denominated in foreign currencies are translated into U.S. dollars based upon prevailing exchange rates on the date of valuation. Purchases and sales of investment securities and income and expense items denominated in foreign currencies are translated into U.S. dollars based upon prevailing exchange rates on the respective dates of such transactions. The Fund does not isolate that portion of the results of operations resulting from fluctuations in foreign exchange rates on investments from the fluctuations arising from changes in market prices of securities held. Such fluctuations are included with the net realized and unrealized gain or loss on investments.
Net realized foreign exchange gains or losses arise from sales of foreign currencies, including gains and losses on forward foreign currency exchange contracts, currency gains or losses realized between the trade and settlement dates on securities transactions, and the difference between the amounts of dividends, interest, and foreign withholding taxes recorded on the Fund's books and the U.S. dollar equivalent of the amounts actually received or paid. Net unrealized foreign exchange gains and losses arise from changes in the values of assets and liabilities, other than investments in securities, on the date of valuation, resulting from changes in exchange rates. Pursuant to U.S. federal income tax regulations, certain foreign currency gains/losses included in realized and unrealized gains/losses are included in or are a reduction of ordinary income for federal income tax purposes.
Dividends and Distributions to Shareholders: Dividends from net investment income and capital gain distributions are determined in accordance with U.S. federal income tax regulations, which may differ from GAAP. Dividends from net investment income, if any, are declared and paid semi-annually. Net realized capital gains, unless offset by any available capital loss carryforward, are typically distributed to shareholders at least annually. Dividends and distributions to shareholders are recorded on the ex-dividend date and are automatically reinvested in full and fractional shares of the Fund based on the net asset value per share at the close of business on the payable date unless the shareholder has elected to have them paid in cash.
Dividends from net investment income are subject to recharacterization for tax purposes. Based upon the results of operations for the six months ended June 30, 2017, the investment manager considers it likely that a portion of the dividends will be reclassified to distributions from net realized gain upon the final determination of the Fund's taxable income after December 31, 2017, the Fund's fiscal year end.
22
COHEN & STEERS INSTITUTIONAL GLOBAL REALTY SHARES, INC.
NOTES TO FINANCIAL STATEMENTS (Unaudited)—(Continued)
Income Taxes: It is the policy of the Fund to continue to qualify as a regulated investment company, if such qualification is in the best interest of the shareholders, by complying with the requirements of Subchapter M of the Internal Revenue Code applicable to regulated investment companies, and by distributing substantially all of its taxable earnings to its shareholders. Also, in order to avoid the payment of any federal excise taxes, the Fund will distribute substantially all of its net investment income and net realized gains on a calendar year basis. Accordingly, no provision for federal income or excise tax is necessary. Dividend and interest income from holdings in non-U.S. securities is recorded net of non-U.S. taxes paid. Management has analyzed the Fund's tax positions taken on federal and applicable state income tax returns as well as its tax positions in non-U.S. jurisdictions in which it trades for all open tax years and has concluded that as of June 30, 2017, no additional provisions for income tax are required in the Fund's financial statements. The Fund's tax positions for the tax years for which the applicable statutes of limitations have not expired are subject to examination by the Internal Revenue Service, state departments of revenue and by foreign tax authorities.
Note 2. Investment Management Fees and Other Transactions with Affiliates
Investment Management Fees: The investment manager serves as the Fund's investment manager pursuant to an investment management agreement (the investment management agreement). Under the terms of the investment management agreement, the investment manager provides the Fund with day-to-day investment decisions and generally manages the Fund's investments in accordance with the stated policies of the Fund, subject to the supervision of the Board of Directors.
For the services provided to the Fund, the investment manager receives a fee, accrued daily and paid monthly, at the annual rate of 1.00% of the average daily net assets of the Fund.
The investment manager is also responsible, under the investment management agreement, for the performance of certain administrative functions for the Fund. Additionally, the investment manager pays certain expenses of the Fund, including, but not limited to, administrative and custody fees, transfer agent fees, professional fees, and reports to shareholders.
The investment manager has contractually agreed to waive its fees and/or reimburse the Fund so that the Fund's total annual operating expenses (excluding brokerage fees and commissions, taxes, and, upon approval of the Board of Directors, extraordinary expenses) do not exceed 1.00% of the average daily net assets of the Fund. This commitment is currently expected to remain in place for the life of the Fund. For the six months ended June 30, 2017, fees waived and/or expenses reimbursed totaled $37,495.
Under subadvisory agreements between the investment manager and each of Cohen & Steers Asia Limited and Cohen & Steers UK Limited (collectively, the subadvisors), affiliates of the investment manager, the subadvisors are responsible for managing the Fund's investments in certain non-U.S. holdings. For their services provided under the subadvisory agreements, the investment manager (not the Fund) pays the subadvisors. The investment manager allocates 50% of the investment management fee received from the Fund among itself and each subadvisor based on the portion of the Fund's average daily net assets managed by the investment manager and each subadvisor.
23
COHEN & STEERS INSTITUTIONAL GLOBAL REALTY SHARES, INC.
NOTES TO FINANCIAL STATEMENTS (Unaudited)—(Continued)
Directors' and Officers' Fees: Certain directors and officers of the Fund are also directors, officers, and/or employees of the investment manager. The Fund does not pay compensation to directors and officers affiliated with the investment manager.
Note 3. Purchases and Sales of Securities
Purchases and sales of securities, excluding short-term investments, for the six months ended June 30, 2017, totaled $218,126,190 and $209,081,368a, respectively.
a Excludes the value of securities delivered as a result of redemptions in-kind totaling $19,666,764 (See Note 6).
Note 4. Income Tax Information
As of June 30, 2017, the federal tax cost and net unrealized appreciation (depreciation) in value of securities held were as follows:
Cost for federal income tax purposes | | $ | 384,763,839 | | |
Gross unrealized appreciation | | $ | 60,826,899 | | |
| Gross unrealized depreciation | | | (5,990,646 | ) | |
Net unrealized appreciation (depreciation) | | $ | 54,836,253 | | |
Note 5. Capital Stock
The Fund is authorized to issue 100 million shares of capital stock, at a par value of $0.001 per share. The Board of Directors of the Fund may increase or decrease the aggregate number of shares of common stock that the Fund has authority to issue. Transactions in Fund shares were as follows:
| | For the
Six Months Ended
June 30, 2017 | | For the
Year Ended
December 31, 2016 | |
| | Shares | | Amount | | Shares | | Amount | |
Sold | | | 2,458,191 | | | $ | 62,123,536 | | | | 1,757,884 | | | $ | 44,665,869 | | |
Issued as reinvestment
of dividends and
distributions | | | 214,093 | | | | 5,566,412 | | | | 886,565 | | | | 22,120,881 | | |
Redeemed | | | (2,227,293 | ) | | | (57,687,383 | ) | | | (5,216,181 | ) | | | (130,412,212 | ) | |
Redemptions in-kinda | | | (753,854 | ) | | | (19,666,764 | ) | | | — | | | | — | | |
Net increase (decrease) | | | (308,863 | ) | | $ | (9,664,199 | ) | | | (2,571,732 | ) | | $ | (63,625,462 | ) | |
a Certain shareholders of the Fund redeemed shares in-kind.
24
COHEN & STEERS INSTITUTIONAL GLOBAL REALTY SHARES, INC.
NOTES TO FINANCIAL STATEMENTS (Unaudited)—(Continued)
Note 6. Redemptions In-Kind
The Fund may make payment for Fund shares redeemed wholly or in part by distributing portfolio securities to shareholders. For the six months ended June 30, 2017, the Fund had redemptions in-kind with total proceeds in the amount of $19,666,764. The net realized gains on these redemptions in-kind amounted to $4,120,755 which will not be realized for tax purposes. The amount of the realized gain will be adjusted after the Fund's fiscal year end when the actual source of REIT distributions that are recorded as return of capital are received.
Note 7. Other Risks
Common Stock Risk: While common stocks have historically generated higher average returns than fixed income securities over the long-term, common stock has also experienced significantly more volatility in those returns, although under certain market conditions, fixed-income investments may have comparable or greater price volatility. An adverse event, such as an unfavorable earnings report, may depress the value of common stock held by the Fund. Also, the price of common stock is sensitive to general movements in the stock market. A drop in the stock market may depress the price of common stock held by the Fund.
Real Estate Market Risk: Since the Fund concentrates its assets in companies engaged in the real estate industry, an investment in the Fund will be closely linked to the performance of the real estate markets. Risks of investing in real estate securities include falling property values due to increasing vacancies, declining rents resulting from economic, legal, tax, political or technological developments, lack of liquidity, limited diversification, and sensitivity to certain economic factors such as interest-rate changes and market recessions. Real estate company prices also may drop because of the failure of borrowers to pay their loans and poor management, and residential developers, in particular, could be negatively impacted by falling home prices, slower mortgage origination and rising construction costs. The risks of investing in REITs are similar to those associated with direct investments in real estate securities.
REIT Risk: In addition to the risks of securities linked to the real estate industry, REITs are subject to certain other risks related to their structure and focus. REITs are dependent upon management skills and generally may not be diversified. REITs are also subject to heavy cash flow dependency, defaults by borrowers and self-liquidation. In addition, REITs could possibly fail to (i) qualify for pass-through of income under applicable tax law, or (ii) maintain their exemptions from registration under the 1940 Act. The above factors may also adversely affect a borrower's or a lessee's ability to meet its obligations to the REIT. In the event of a default by a borrower or lessee, the REIT may experience delays in enforcing its rights as a mortgagee or lessor and may incur substantial costs associated with protecting its investments.
Small- and Medium-Sized Companies Risk: Real estate companies in the industry tend to be small- to medium-sized companies in relation to the equity markets as a whole. There may be less trading in a smaller company's stock, which means that buy and sell transactions in that stock could have a larger impact on the stock's price than is the case with larger company stocks. Smaller companies also may have fewer lines of business so that changes in any one line of business may have a greater impact on a smaller company's stock price than is the case for a larger company. Further, smaller company stocks
25
COHEN & STEERS INSTITUTIONAL GLOBAL REALTY SHARES, INC.
NOTES TO FINANCIAL STATEMENTS (Unaudited)—(Continued)
may perform differently in different cycles than larger company stocks. Accordingly, real estate company shares can, and at times will, perform differently than large company stocks.
Foreign (Non-U.S.) Securities Risk: The Fund directly purchases securities of foreign issuers. Risks of investing in foreign securities include currency risks, future political and economic developments and possible imposition of foreign withholding taxes on income or proceeds payable on the securities. In addition, there may be less publicly available information about a foreign issuer than about a domestic issuer, and foreign issuers may not be subject to the same accounting, auditing and financial recordkeeping standards and requirements as domestic issuers. Moreover, securities of many foreign issuers and their markets may be less liquid and their prices more volatile than securities of comparable U.S. issuers
Foreign Currency and Currency Hedging Risk: Although the Fund will report its NAV and pay dividends in U.S. dollars, foreign securities often are purchased with and make any dividend and interest payments in foreign currencies. Therefore, the Fund's investments in foreign securities will be subject to foreign currency risk, which means that the Fund's NAV could decline as a result of changes in the exchange rates between foreign currencies and the U.S. dollar. Certain foreign countries may impose restrictions on the ability of issuers of foreign securities to make payment of principal, dividends and interest to investors located outside the country, due to blockage of foreign currency exchanges or otherwise. The Fund may, but is not required to, engage in various instruments that are designed to hedge the Fund's foreign currency risks.
If the Fund were to utilize derivatives for the purpose of hedging foreign currency risks, it would be subject to risks different from, and possibly greater than, the risks associated with investing directly in traditional securities. Among the risks presented are counterparty risk, financial leverage risk, liquidity risk, OTC trading risk and tracking risk. The use of derivatives can lead to losses because of adverse movements in the price or value of the underlying asset, index or rate, which may be magnified by certain features of the derivatives.
Non-Diversification Risk: As a "non-diversified" investment company, the Fund can invest in fewer individual companies than a diversified investment company. As a result, the Fund is more susceptible to any single political, regulatory or economic occurrence and to the financial condition of individual issuers in which it invests. The Fund's relative lack of diversity may subject investors to greater risk of loss than a fund that has a diversified portfolio.
Geopolitical Risk: Occurrence of global events similar to those in recent years, such as war, terrorist attacks, natural disasters, country instability, infectious disease epidemics, market instability, debt crises and downgrades, embargoes, tariffs, sanctions and other trade barriers and other governmental trade or market control programs, the potential exit of a country from its respective union and related geopolitical events, may result in market volatility and may have long-lasting impacts on both the U.S. and global financial markets. Additionally, those events, as well as other changes in foreign and domestic political and economic conditions, could adversely affect individual issuers or related groups of issuers, securities markets, interest rates, secondary trading, credit ratings, inflation, investor sentiment and other factors affecting the value of the Fund's investments. The decision of the United Kingdom (UK) to exit from the European Union following the June 2016 vote on the matter (referred to as Brexit) may cause uncertainty and thus adversely impact financial results of the Fund and the global financial markets. Growing tensions between the United States and other foreign powers, or among foreign
26
COHEN & STEERS INSTITUTIONAL GLOBAL REALTY SHARES, INC.
NOTES TO FINANCIAL STATEMENTS (Unaudited)—(Continued)
powers, and possible diplomatic, trade or other sanctions could adversely impact the markets and the Fund. The strengthening of the U.S. dollar relative to other currencies may, among other things, adversely affect the Fund's investments denominated in non-U.S. dollar currencies. It is difficult to predict when similar events affecting the U.S. or global financial markets may occur, the effects that such events may have, and the duration of those effects.
Regulatory Risk: The U.S. government has proposed and adopted multiple regulations that could have a long-lasting impact on the Fund and on the mutual fund industry in general. The U.S. Securities and Exchange Commission's (SEC) proposed rules governing the use of derivatives by registered investment companies, the Department of Labor's (DOL) final rule on conflicts of interest on fiduciary investment advice, as well as the SEC's final rules and amendments to modernize the reporting and disclosure (Modernization) and to develop and implement a Liquidity Risk Management Program for open-end investment companies (Liquidity) could, among other things, restrict and/or increase the cost of the Fund's ability to engage in transactions, impact flows into the Fund and/or increase overall expenses of the Fund. In addition, Congress, various exchanges and regulatory and self-regulatory authorities, both domestic and foreign, have undertaken reviews of options and futures trading in light of market volatility. Among the actions that have been taken or proposed to be taken are new limits and reporting requirements for speculative positions, new or more stringent daily price fluctuation limits for futures and options transactions, and increased margin requirements for various types of futures transactions. While the full extent of all of these regulations is still unclear, these regulations and actions may adversely affect the instruments in which the Fund invests and its ability to execute its investment strategy.
This is not a complete list of the risks of investing in the Fund. For additional information concerning the risks of investing in the Fund, please consult the Fund's prospectus.
Note 8. Other
In the normal course of business, the Fund enters into contracts that provide general indemnifications. The Fund's maximum exposure under these arrangements is dependent on claims that may be made against the Fund in the future and, therefore, cannot be estimated; however, based on experience, the risk of material loss from such claims is considered remote.
Note 9. New Accounting Guidance
In October 2016, the SEC adopted new rules and amended existing rules (together, the "final rules") intended to modernize the reporting and disclosure of information by registered investment companies. In part, the final rules amend Regulation S-X and require standardized, enhanced disclosure about derivatives in investment company financial statements, as well as other amendments. The compliance date for the amendments to Regulation S-X is for periods ending after August 1, 2017.
The adoption will have no effect on the Fund's net assets or results of operations.
27
COHEN & STEERS INSTITUTIONAL GLOBAL REALTY SHARES, INC.
NOTES TO FINANCIAL STATEMENTS (Unaudited)—(Continued)
Note 10. Subsequent Events
Management has evaluated events and transactions occurring after June 30, 2017 through the date that the financial statements were issued, and has determined that no additional disclosure in the financial statements is required.
28
COHEN & STEERS INSTITUTIONAL GLOBAL REALTY SHARES, INC.
OTHER INFORMATION
A description of the policies and procedures that the Fund uses to determine how to vote proxies relating to portfolio securities is available (i) without charge, upon request, by calling 800-330-7348, (ii) on our website at cohenandsteers.com or (iii) on the Securities and Exchange Commission's (the SEC) website at http://www.sec.gov. In addition, the Fund's proxy voting record for the most recent 12-month period ended June 30 is available by August 31 of each year (i) without charge, upon request, by calling 800-330-7348 or (ii) on the SEC's website at http://www.sec.gov.
The Fund files its complete schedule of portfolio holdings with the SEC for the first and third quarters of each fiscal year on Form N-Q. The Fund's Forms N-Q are available (i) without charge, upon request, by calling 800-330-7348 or (ii) on the SEC's website at http://www.sec.gov. In addition, the Forms N-Q may be reviewed and copied at the SEC's Public Reference Room in Washington, DC. Information on the operation of the Public Reference Room may be obtained by calling 800-SEC-0330.
Please note that distributions paid by the Fund to shareholders are subject to recharacterization for tax purposes. The Fund may also pay distributions in excess of the Fund's net investment company taxable income and net realized gains and this excess would be a tax free return of capital distributed from the Fund's assets. The final tax treatment of all distributions is reported to shareholders on their 1099-DIV forms, which are mailed after the close of each calendar year.
APPROVAL OF INVESTMENT MANAGEMENT AND SUBADVISORY AGREEMENTS
The Board of Directors of the Fund, including a majority of the directors who are not parties to the Fund's investment management agreement (the Investment Management Agreement) and subadvisory agreements (the Subadvisory Agreements, and together with the Investment Management Agreement, the Management Agreements), or interested persons of any such party (Independent Directors), has the responsibility under the 1940 Act to approve the Fund's Management Agreements for their initial two-year term and their continuation annually thereafter at a meeting of the Board of Directors called for the purpose of voting on the approval or continuation. At a meeting of the Independent Directors held on June 6, 2017 and at a meeting of the full Board of Directors held in person on June 13, 2017, the Management Agreements were discussed and were unanimously continued for a term ending June 30, 2018 by the Fund's Board of Directors, including the Independent Directors. The Independent Directors were represented by independent counsel who assisted them in their deliberations during the meetings and executive sessions.
In considering whether to continue the Management Agreements, the Board of Directors reviewed materials provided by an independent data provider, which included, among other things, fee, expense and performance information compared to peer funds (Peer Funds) and performance comparisons to a larger category universe; summary information prepared by the Fund's investment manager (the Investment Manager); and a memorandum from Fund counsel outlining the legal duties of the Board of Directors. The Board of Directors also spoke directly with representatives of the independent data provider and met with investment management personnel. In addition, the Board of Directors considered information provided from time to time by the Investment Manager throughout the year at meetings of the Board of Directors, including presentations by portfolio managers relating to the investment performance of the Fund and the investment strategies used in pursuing the Fund's objective. In particular, the Board of Directors considered the following:
(i) The nature, extent and quality of services to be provided by the Investment Manager and the Subadvisors: The Board of Directors reviewed the services that the Investment Manager and the
29
COHEN & STEERS INSTITUTIONAL GLOBAL REALTY SHARES, INC.
sub-investment advisors (the Subadvisors) provide to the Fund, including, but not limited to, making the day-to-day investment decisions for the Fund, and, for the Investment Manager, generally managing the Fund's investments in accordance with the stated policies of the Fund. The Board of Directors also discussed with officers and portfolio managers of the Fund the types of transactions that were being done on behalf of the Fund. Additionally, the Board of Directors took into account the services provided by the Investment Manager and the Subadvisors to other funds and accounts, including those that have investment objectives and strategies similar to the Fund. The Board of Directors also considered the education, background and experience of the Investment Manager's and Subadvisors' personnel, particularly noting the potential benefit that the portfolio managers' work experience and favorable reputation can have on the Fund. The Board of Directors further noted the Investment Manager's and Subadvisors' ability to attract qualified and experienced personnel. The Board of Directors also considered the administrative services provided by the Investment Manager, including compliance and accounting services. After consideration of the above factors, among others, the Board of Directors concluded that the nature, extent and quality of services provided by the Investment Manager and the Subadvisors are satisfactory and appropriate.
(ii) Investment performance of the Fund and the Investment Manager and Subadvisors: The Board of Directors considered the investment performance of the Fund compared to Peer Funds and compared to a relevant benchmark. The Board of Directors noted that the Fund outperformed the Peer Funds' medians for the one-, three-, five- and ten-year periods ended March 31, 2017, ranking in the second quintile for the one-, three- and ten-year periods and in the third quintile for the five-year period. The Fund outperformed its benchmark for the one-, three-, five- and ten-year periods ended March 31, 2017. The Board of Directors engaged in discussions with the Investment Manager regarding the contributors to and detractors from the Fund's performance during the periods. The Board of Directors also considered supplemental information provided by the Investment Manager, including a narrative summary of various factors affecting performance and the Investment Manager's performance in managing other real estate funds. The Board of Directors then determined that Fund performance, in light of all considerations noted above, supported the continuation of the Management Agreements.
(iii) Cost of the services to be provided and profits to be realized by the Investment Manager from the relationship with the Fund: The Board of Directors considered the actual management fee paid by the Fund, as well as the total expense ratio. As part of its analysis, the Board of Directors gave consideration to the fee and expense analyses provided by the independent data provider. The Board of Directors considered the Fund's actual management fee, noting that the Fund ranked in the fifth quintile. The Board of Directors also noted that the Funds' total expense ratio represented the Peer Funds' median, ranking in the third quintile. The Board of Directors also considered the effect the unitary fee charged by the Investment Manager, which limits overall expenses of the Fund, has on the Fund's actual management fee ranking. The Board of Directors concluded that the Fund's expense structure was satisfactory.
The Board of Directors also reviewed information regarding the profitability to the Investment Manager of its relationship with the Fund. The Board of Directors considered the level of the Investment Manager's profits and whether the profits were reasonable for the Investment Manager. The Board of Directors noted that the Investment Manager is currently waiving a portion its fee and/or reimbursing expenses of the Fund. Since the Subadvisors are paid by the Investment Manager for investment
30
COHEN & STEERS INSTITUTIONAL GLOBAL REALTY SHARES, INC.
services provided to the Fund and not by the Fund and are affiliates of the Investment Manager, the Board of Directors considered the profitability of the Investment Manager as a whole and did not consider the Subadvisors separate profitability to be particularly relevant to their determination. The Board of Directors took into consideration other benefits to be derived by the Investment Manager in connection with the Management Agreements, noting particularly the research and related services, within the meaning of Section 28(e) of the Securities Exchange Act of 1934, as amended, that the Investment Manager receives by allocating the Fund's brokerage transactions. The Board of Directors further considered that the Investment Manager continues to reinvest profits back in the business, including upgrading and/or implementing new trading, compliance and accounting systems, and by adding investment personnel to the portfolio management teams. The Board of Directors concluded that the profits realized by the Investment Manager from its relationship with the Fund were reasonable and consistent with the Investment Manager's fiduciary duties.
(iv) The extent to which economies of scale would be realized as the Fund grows and whether fee levels would reflect such economies of scale: The Board of Directors noted that the Investment Manager pays most of the regular operating costs of the Fund and reimburses the Fund to the extent that total expenses exceed the advisory fee rate. The Board of Directors determined that there were not at this time significant economies of scale that were not being shared with shareholders. In considering economies of scale, the Board of Directors also noted, as discussed above in (iii), that the Investment Manager continues to reinvest profits back in the business.
(v) Comparison of services to be rendered and fees to be paid to those under other investment advisory contracts, such as contracts of the same and other investment advisors or other clients: As discussed above in (iii), the Board of Directors compared the fees paid under the Management Agreements to those under other investment advisory contracts of other investment advisors managing Peer Funds. The Board of Directors also compared the services rendered, fees paid and profitability under the Management Agreements to those under the Investment Manager's other advisory agreements and advisory contracts with institutional and other clients with similar investment mandates. The Board of Directors also considered the entrepreneurial risk and financial exposure assumed by the Investment Manager in developing and managing the Fund that the Investment Manager does not have with institutional and other clients and other differences in the management of registered investment companies and institutional accounts. The Board of Directors determined that on a comparative basis the fees under the Management Agreements were reasonable in relation to the services provided.
No single factor was cited as determinative to the decision of the Board of Directors. Rather, after weighing all of the considerations and conclusions discussed above, the Board of Directors, including the Independent Directors, unanimously approved the continuation of the Management Agreements.
31
COHEN & STEERS INSTITUTIONAL GLOBAL REALTY SHARES, INC.
Cohen & Steers Privacy Policy
Facts | | What Does Cohen & Steers Do With Your Personal Information? | |
Why? | | Financial companies choose how they share your personal information. Federal law gives consumers the right to limit some but not all sharing. Federal law also requires us to tell you how we collect, share, and protect your personal information. Please read this notice carefully to understand what we do. | |
What? | | The types of personal information we collect and share depend on the product or service you have with us. This information can include:
• Social Security number and account balances
• Transaction history and account transactions
• Purchase history and wire transfer instructions | |
How? | | All financial companies need to share customers' personal information to run their everyday business. In the section below, we list the reasons financial companies can share their customers' personal information; the reasons Cohen & Steers chooses to share; and whether you can limit this sharing. | |
Reasons we can share your personal information | | Does Cohen & Steers
share? | | Can you limit this
sharing? | |
For our everyday business purposes—
such as to process your transactions, maintain your account(s), respond to court orders and legal investigations, or reports to credit bureaus | | Yes | | No | |
For our marketing purposes—
to offer our products and services to you | | Yes | | No | |
For joint marketing with other financial companies— | | No | | We don't share | |
For our affiliates' everyday business purposes—
information about your transactions and experiences | | No | | We don't share | |
For our affiliates' everyday business purposes—
information about your creditworthiness | | No | | We don't share | |
For our affiliates to market to you— | | No | | We don't share | |
For non-affiliates to market to you— | | No | | We don't share | |
Questions? Call 800.330.7348
32
COHEN & STEERS INSTITUTIONAL GLOBAL REALTY SHARES, INC.
Cohen & Steers Privacy Policy—(Continued)
Who we are | | | |
Who is providing this notice? | | Cohen & Steers Capital Management, Inc., Cohen & Steers Asia Limited, Cohen & Steers Japan, LLC, Cohen & Steers UK Limited, Cohen & Steers Securities, LLC, Cohen & Steers Private Funds and Cohen & Steers Open and Closed-End Funds (collectively, Cohen & Steers). | |
What we do | | | |
How does Cohen & Steers protect my personal information? | | To protect your personal information from unauthorized access and use, we use security measures that comply with federal law. These measures include computer safeguards and secured files and buildings. We restrict access to your information to those employees who need it to perform their jobs, and also require companies that provide services on our behalf to protect your information. | |
How does Cohen & Steers collect my personal information? | | We collect your personal information, for example, when you:
• Open an account or buy securities from us
• Provide account information or give us your contact information
• Make deposits or withdrawals from your account
We also collect your personal information from other companies. | |
Why can't I limit all sharing? | | Federal law gives you the right to limit only:
• sharing for affiliates' everyday business purposes—information about your creditworthiness
• affiliates from using your information to market to you
• sharing for non-affiliates to market to you
State law and individual companies may give you additional rights to limit sharing. | |
Definitions | | | |
Affiliates | | Companies related by common ownership or control. They can be financial and nonfinancial companies.
• Cohen & Steers does not share with affiliates. | |
Non-affiliates | | Companies not related by common ownership or control. They can be financial and nonfinancial companies.
• Cohen & Steers does not share with non-affiliates. | |
Joint marketing | | A formal agreement between non-affiliated financial companies that together market financial products or services to you.
• Cohen & Steers does not jointly market. | |
33
COHEN & STEERS INSTITUTIONAL GLOBAL REALTY SHARES, INC.
Cohen & Steers Investment Solutions
COHEN & STEERS REAL ASSETS FUND
• Designed for investors seeking total return and the maximization of real returns during inflationary environments by investing primarily in real assets
• Symbols: RAPAX, RAPCX, RAPIX, RAPRX, RAPZX
COHEN & STEERS
INSTITUTIONAL GLOBAL REALTY SHARES
• Designed for institutional investors seeking total return, investing primarily in global real estate securities
• Symbol: GRSIX
COHEN & STEERS GLOBAL REALTY SHARES
• Designed for investors seeking total return, investing primarily in global real estate equity securities
• Symbols: CSFAX, CSFCX, CSSPX, GRSRX, CSFZX
COHEN & STEERS REALTY SHARES
• Designed for investors seeking total return, investing primarily in U.S. real estate securities
• Symbol: CSRSX
COHEN & STEERS REAL ESTATE SECURITIES FUND
• Designed for investors seeking total return, investing primarily in U.S. real estate securities
• Symbols: CSEIX, CSCIX, CREFX, CSDIX, CIRRX, CSZIX
COHEN & STEERS INSTITUTIONAL REALTY SHARES
• Designed for institutional investors seeking total return, investing primarily in U.S. real estate securities
• Symbol: CSRIX
COHEN & STEERS INTERNATIONAL REALTY FUND
• Designed for investors seeking total return, investing primarily in international (non-U.S.) real estate securities
• Symbols: IRFAX, IRFCX, IRFIX, IRFRX, IRFZX
COHEN & STEERS
ACTIVE COMMODITIES STRATEGY FUND
• Designed for investors seeking total return, investing primarily in a diversified portfolio of exchange-traded commodity future contracts and other commodity-related derivative instruments
• Symbols: CDFAX, CDFCX, CDFIX, CDFRX, CDFZX
COHEN & STEERS GLOBAL INFRASTRUCTURE FUND
• Designed for investors seeking total return, investing primarily in global infrastructure securities
• Symbols: CSUAX, CSUCX, CSUIX, CSURX, CSUZX
COHEN & STEERS
MLP & ENERGY OPPORTUNITY FUND
• Designed for investors seeking total return, investing primarily in midstream energy master limited partnership (MLP) units and related stocks
• Symbols: MLOAX, MLOCX, MLOIX, MLORX, MLOZX
COHEN & STEERS
LOW DURATION PREFERRED AND INCOME FUND
• Designed for investors seeking high current income and capital preservation by investing in low-duration preferred and other income securities issued by U.S. and non-U.S. companies
• Symbols: LPXAX, LPXCX, LPXIX, LPXRX, LPXZX
COHEN & STEERS
PREFERRED SECURITIES AND INCOME FUND
• Designed for investors seeking total return (high current income and capital appreciation), investing primarily in preferred and debt securities issued by U.S. and non-U.S. companies
• Symbols: CPXAX, CPXCX, CPXFX, CPXIX, CPRRX, CPXZX
COHEN & STEERS DIVIDEND VALUE FUND
• Designed for investors seeking long-term growth of income and capital appreciation, investing primarily in dividend paying common stocks and preferred stocks
• Symbols: DVFAX, DVFCX, DVFIX, DVFRX, DVFZX
Distributed by Cohen & Steers Securities, LLC.
COHEN & STEERS GLOBAL REALTY MAJORS ETF
• Designed for investors who seek a relatively low-cost passive approach for investing in a portfolio of global real estate equity securities of companies in a specified index
• Symbol: GRI
Distributed by ALPS Distributors, Inc.
ISHARES COHEN & STEERS
REALTY MAJORS INDEX FUND
• Designed for investors who seek a relatively low-cost passive approach for investing in a portfolio of U.S. real estate equity securities of companies in a specified index
• Symbol: ICF
Distributed by SEI Investments Distribution Co.
Please consider the investment objectives, risks, charges and expenses of any Cohen & Steers U.S. registered open-end fund carefully before investing. A summary prospectus and prospectus containing this and other information can be obtained by calling 800-330-7348 or by visiting cohenandsteers.com. Please read the summary prospectus and prospectus carefully before investing.
34
COHEN & STEERS INSTITUTIONAL GLOBAL REALTY SHARES, INC.
OFFICERS AND DIRECTORS
Robert H. Steers
Director and Chairman
Joseph M. Harvey
Director and Vice President
Michael G. Clark
Director
Bonnie Cohen
Director
George Grossman
Director
Dean Junkans
Director
Richard E. Kroon
Director
Gerald J. Maginnis
Director
Jane F. Magpiong
Director
Richard J. Norman
Director
Frank K. Ross
Director
C. Edward Ward, Jr.
Director
Adam M. Derechin
President and Chief Executive Officer
Jon Cheigh
Vice President
Francis C. Poli
Assistant Secretary
James Giallanza
Chief Financial Officer
Albert Laskaj
Treasurer
Lisa D. Phelan
Chief Compliance Officer
KEY INFORMATION
Investment Manager
Cohen & Steers Capital Management, Inc.
280 Park Avenue
New York, NY 10017
(212) 832-3232
Co-administrator and Custodian
State Street Bank and Trust Company
One Lincoln Street
Boston, MA 02111
Transfer Agent
Boston Financial Data Services, Inc.
P.O. Box 8123
Boston, MA 02266
(800) 437-9912
Legal Counsel
Ropes & Gray LLP
1211 Avenue of the Americas
New York, NY 10036
Distributor
Cohen & Steers Securities, LLC
280 Park Avenue
New York, NY 10017
Nasdaq Symbol: GRSIX
Website: cohenandsteers.com
This report is authorized for delivery only to shareholders of Cohen & Steers Institutional Global Realty Shares, Inc. unless accompanied or preceded by the delivery of a currently effective prospectus setting forth details of the Fund. Performance data quoted represent past performance. Past performance is no guarantee of future results and your investment may be worth more or less at the time you sell your shares.
35
COHEN & STEERS
INSTITUTIONAL GLOBAL REALTY SHARES
280 PARK AVENUE
NEW YORK, NY 10017
eDelivery NOW AVAILABLE
Stop traditional mail delivery; receive your shareholder reports and prospectus online.
Sign up at cohenandsteers.com

Semiannual Report June 30, 2017
Cohen & Steers Institutional Global Realty Shares
Item 2. Code of Ethics.
Not applicable.
Item 3. Audit Committee Financial Expert.
Not applicable.
Item 4. Principal Accountant Fees and Services.
Not applicable.
Item 5. Audit Committee of Listed Registrants.
Not applicable.
Item 6. Schedule of Investments.
Included in Item 1 above.
Item 7. Disclosure of Proxy Voting Policies and Procedures for Closed-End Management Investment Companies.
Not applicable.
Item 8. Portfolio Managers of Closed-End Management Investment Companies.
Not applicable.
Item 9. Purchases of Equity Securities by Closed-End Management Investment Company and Affiliated Purchasers.
Not applicable.
Item 10. Submission of Matters to a Vote of Security Holders.
None.
Item 11. Controls and Procedures.
(a) The registrant’s principal executive officer and principal financial officer have concluded, based upon their evaluation of the registrant’s disclosure controls and procedures as conducted within 90 days of the filing date of this report, that these disclosure controls and procedures provide reasonable assurance that material information required to be disclosed by the registrant in the report it files or submits on Form N-CSR is recorded, processed, summarized and reported within the time periods specified in the Securities and Exchange Commission’s rules and forms
and that such material information is accumulated and communicated to the registrant’s management, including its principal executive officer and principal financial officer, as appropriate, in order to allow timely decisions regarding required disclosure.
(b) There were no changes in the registrant’s internal control over financial reporting that occurred during the second fiscal quarter of the period covered by this report that have materially affected, or are reasonably likely to materially affect, the registrant’s internal control over financial reporting.
Item 12. Exhibits.
(a)(1) Not applicable.
(a)(2) Certifications of principal executive officer and principal financial officer as required by Rule 30a-2(a) under the Investment Company Act of 1940.
(a)(3) Not applicable.
(b) Certifications of principle executive officer and principle financial officer as required by Rule 30a- 2(b) under the Investment Company Act of 1940.
SIGNATURES
Pursuant to the requirements of the Securities Exchange Act of 1934 and the Investment Company Act of 1940, the registrant has duly caused this report to be signed on its behalf by the undersigned, thereunto duly authorized.
COHEN & STEERS INSITUTIONAL GLOBAL REALTY SHARES, INC.
By: | /s/ Adam M. Derechin | |
| Name: | Adam M. Derechin | |
| Title: | President and Chief Executive Officer | |
| | |
Date: | September 1, 2017 | |
Pursuant to the requirements of the Securities Exchange Act of 1934 and the Investment Company Act of 1940, this report has been signed below by the following persons on behalf of the registrant and in the capacities and on the dates indicated.
By: | /s/ Adam M. Derechin | |
| Name: | Adam M. Derechin | |
| Title: | President and Chief Executive Officer | |
| | (Principal Executive Officer) | |
| | |
By: | /s/ James Giallanza | |
| Name: | James Giallanza | |
| Title: | Chief Financial Officer | |
| | (Principal Financial Officer) | |
| | |
| | |
Date: | September 1, 2017 | |