UNITED STATES
SECURITIES AND EXCHANGE COMMISSION
Washington, D.C. 20549
Form 10-K
(Mark One)
| |
☒ | ANNUAL REPORT PURSUANT TO SECTION 13 OR 15(d) OF THE SECURITIES EXCHANGE ACT OF 1934 |
| For the fiscal year ended December 31, 2024 |
OR
| |
☐ | TRANSITION REPORT PURSUANT TO SECTION 13 OR 15(d) OF THE SECURITIES EXCHANGE ACT OF 1934 |
| For the Transition Period From to |
Commission File Number: 001-33045
ICF INTERNATIONAL, INC.
(Exact name of Registrant as specified in its charter)
| | |
Delaware | | 22-3661438 |
(State or other jurisdiction of incorporation or organization) | | (IRS Employer Identification Number) |
| | |
1902 Reston Metro Plaza Reston, VA | | 20190 |
(Address of principal executive offices) | | (Zip Code) |
Registrant’s telephone number, including area code:
(703) 934-3000
Securities registered pursuant to Section 12(b) of the Act:
| | | | |
Title of each class | | Trading Symbols(s) | | Name of each exchange on which registered |
Common Stock, $0.001 par value | | ICFI | | The Nasdaq Global Select Market |
Indicate by check mark if the registrant is a well-known seasoned issuer, as defined in Rule 405 of the Securities Act. Yes ☐ No ☒
Indicate by check mark if the registrant is not required to file reports pursuant to Section 13 or Section 15(d) of the Act. Yes ☐ No ☒
Indicate by check mark whether the registrant: (1) has filed all reports required to be filed by Section 13 or 15(d) of the Securities Exchange Act of 1934 during the preceding 12 months (or for such shorter period that the registrant was required to file such reports), and (2) has been subject to such filing requirements for the past 90 days. Yes ☒ No ☐
Indicate by check mark whether the registrant has submitted electronically every Interactive Data File required to be submitted pursuant to Rule 405 of Regulation S-T (§232.405 of this chapter) during the preceding 12 months (or for such shorter period that the registrant was required to submit such files). Yes ☒ No ☐
Indicate by check mark whether the registrant is a large accelerated filer, an accelerated filer, a non-accelerated filer, a smaller reporting company, or emerging growth company. See the definitions of “large accelerated filer,” “accelerated filer,” “smaller reporting company,” and “emerging growth company” in Rule 12b-2 of the Exchange Act.
| | | | |
Large accelerated filer | ☒ |
| Accelerated filer | ☐ |
Non-accelerated filer | ☐ | | Smaller reporting company | ☐ |
| | | Emerging growth company | ☐ |
If an emerging growth company, indicate by check mark if the registrant has elected not to use the extended transition period for complying with any new or revised financial accounting standards provided pursuant to Section 13(a) of the Exchange Act. ☐
Indicate by check mark whether the registrant has filed a report on and attestation to its management’s assessment of the effectiveness of its internal control over financial reporting under Section 404(b) of the Sarbanes-Oxley Act (15 U.S.C. 7262(b)) by the registered public accounting firm that prepared or issued its audit report. ☒
If securities are registered pursuant to Section 12(b) of the Act, indicate by check mark whether the financial statements of the registrant included in the filing reflect the correction of an error to previously issued financial statements. ☐
Indicate by check mark whether any of those error corrections are restatements that required a recovery analysis of incentive-based compensation received by any of the registrant’s executive officers during the relevant recovery period pursuant to Section 240.10D-1(b). ☐
Indicate by check mark whether the registrant is a shell company (as defined in Rule 12b-2 of the Exchange Act). Yes ☐ No ☒
The aggregate market value of the voting and non-voting common equity held by non-affiliates of the registrant as of the last business day of the registrant’s most recently completed second fiscal quarter was approximately $2,746 million based upon the closing price per share of $148.46, as quoted on the Nasdaq Global Select Market on June 30, 2024. Shares of the outstanding common stock held by each executive officer and director have been excluded in that such persons may be deemed to be affiliates. This determination of affiliate status is not necessarily a conclusive determination for other purposes.
As of February 21, 2025, 18,436,146 shares of the registrant’s common stock, $0.001 par value, were outstanding.
DOCUMENTS INCORPORATED BY REFERENCE
Part III incorporates information by reference from the Proxy Statement for the 2025 Annual Meeting of Stockholders expected to be held in June 2025.
TABLE OF CONTENTS
FORWARD-LOOKING STATEMENTS
Some of the statements in this Annual Report on Form 10-K constitute forward-looking statements as defined in the Private Securities Litigation Reform Act of 1995, as amended. These statements involve known and unknown risks, uncertainties, and other factors that may cause our actual results, levels of activity, performance, or achievements to be materially different from any future results, levels of activity, performance, or achievements expressed or implied by such forward-looking statements. In some cases, you can identify these statements by forward-looking words such as “anticipate,” “believe,” “could,” “estimate,” “expect,” “intend,” “may,” “plan,” “potential,” “should,” “will,” “would,” or similar words. You should read statements that contain these words carefully. The risk factors described in Item 1A of Part I of this Annual Report on Form 10-K captioned “Risk Factors,” or otherwise described in our filings with the Securities and Exchange Commission (“SEC”), as well as any cautionary language in this Annual Report on Form 10-K, provide examples of risks, uncertainties, and events that may cause our actual results to differ materially from the expectations we describe in our forward-looking statements, including, but not limited to:
•Our dependence on contracts with United States (“U.S.”) federal, state and local, and international governments, agencies, and departments for the majority of our revenue;
•Changes in federal government budgeting and spending priorities;
•Failure by Congress or other governmental bodies to approve budgets and debt ceiling increases in a timely fashion and related reductions in government spending;
•Uncertainties relating to the new presidential administration (the “Administration”) and failure of the Administration to spend Congressionally mandated appropriations;
•Failure of the Administration and Congress to agree on spending priorities, which may result in temporary shutdowns of non-essential federal functions, including our work to support such functions;
•Results of routine and non-routine government audits and investigations, including the unpredictability of the actions of the newly formed Department of Government Efficiency (“DOGE”);
•Dependence of our commercial work on certain sectors of the global economy that are highly cyclical;
•Failure to realize the full amount of our backlog;
•Risks inherent in being engaged in significant and complex disaster relief efforts and grant management programs involving multiple tiers of government in very stressful environments;
•Risks resulting from expanding our service offerings and client base;
•Difficulties in identifying attractive acquisitions available at acceptable prices;
•Acquisitions we undertake presenting integration challenges, failing to perform as expected, increasing our liabilities, and/or reducing our earnings; and
•Additional risks as a result of having international operations.
Our forward-looking statements are based on the beliefs and assumptions of our management and the information available to our management at the time these statements were prepared. Although we believe the expectations reflected in these statements are reasonable, we cannot guarantee future results, levels of activity, performance, or achievements. You should not place undue reliance on these forward-looking statements, which apply only as of the date of this Annual Report on Form 10-K. We undertake no obligation to update these forward-looking statements, even if our situation changes in the future.
The terms “we,” “our,” “us,” and “the Company,” as used throughout this Annual Report on Form 10-K, refer to ICF International, Inc. and its consolidated subsidiaries, unless otherwise indicated. The term “federal” or “federal government” refers to the U.S. federal government, and “state and local” or “state and local government” refers to U.S. state (including U.S. territories) and local governments, unless otherwise indicated.
PART I
ITEM 1. BUSINESS
COMPANY OVERVIEW
ICF International, Inc. was formed in 1999 as a Delaware limited liability company under the name ICF Consulting Group Holdings, LLC. It was formed to purchase our principal operating subsidiary, which was founded in 1969, from a larger services organization. We converted to a Delaware corporation in 2003 and changed our name to ICF International, Inc. in 2006. We completed our initial public offering in September 2006.
We provide professional services and technology-based solutions, including management, technology, and policy consulting and implementation services. We help our clients conceive, develop, implement, and improve solutions that address complex business, natural resource, social, technological, and public safety issues. Our services primarily support clients that operate in three key markets:
•Energy, Environment, Infrastructure, and Disaster Recovery;
•Health and Social Programs; and
•Security and Other Civilian & Commercial.
We provide services to our diverse client base that deliver value throughout the entire life cycle of a policy, program, project, or initiative. Our primary services include:
•Advisory Services. We research critical policy, industry, and stakeholder issues, trends, and behavior. We measure and evaluate results and their impact and, based on those assessments, provide strategic planning and advice to our clients on how to navigate societal, market, business, communication, and technology challenges.
•Program Implementation Services. We identify, define, and implement policies, plans, programs, and business tools that make our clients’ organizations more effective and efficient. Our comprehensive, end-to-end solutions are implemented through a wide range of standard and customized methodologies designed to match our clients’ business context.
•Analytics Services. We conduct survey research and collect and analyze wide varieties and large volumes of data to understand critical issues and options for our clients and provide actionable business intelligence. We provide information and data management solutions that allow for integrated, purpose-driven data usage, including the client-specific utilization of Artificial Intelligence (“AI”).
•Digital Services. We design, develop, and implement cutting-edge technology systems and business tools that are key to our clients’ mission or business performance, and include solutions to optimize the customer and citizen experience for our clients. We provide cybersecurity solutions that support the full range of cybersecurity missions and protect evolving information technology (“IT”) infrastructures in the face of relentless threats and modernize IT systems core to our clients’ operations. We assist our clients in the application of AI to support their missions/businesses and to streamline their operations.
•Engagement Services. We inform and engage our clients’ constituents, customers, and employees to drive behavior and outcomes through public relations, branding and marketing, multichannel and strategic communications, and reputation issues management. Our engagement services frequently rely on our digital design and implementation skills, such as web and app development.
We perform work for both government and commercial clients. Our government clients include U.S. federal agencies, state and local governments, as well as governments outside the U.S. Our commercial clients include both U.S. and international clients. Our clients utilize our services because we offer a combination of deep subject matter expertise, technical solutions, and institutional experience which contribute to our solutions being beneficial. We believe that our domain expertise and the program knowledge developed from our advisory engagements further position us to provide our full suite of services.
We report operating results and financial data in one operating and reportable segment. We generated revenue of $2,019.8 million, $1,963.2 million, and $1,780.0 million during the years ended December 31, 2024, 2023, and 2022, respectively. Our total backlog was $3,786.3 million, $3,777.8 million, and $3,856.2 million at December 31, 2024, 2023, and 2022, respectively.
As of December 31, 2024, we had approximately 9,300 full-time and part-time employees around the globe, including many recognized as thought leaders in their respective fields. We serve clients globally from our headquarters in the Washington, D.C. metropolitan area, our 55 regional offices throughout the U.S., and 15 offices outside the U.S., including offices in the United Kingdom (“U.K.”), Belgium, Spain, India, and Canada.
OUR COMPANY INFORMATION
Our principal executive office is located at 1902 Reston Metro Plaza, Reston, Virginia 20190, and our telephone number is (703) 934-3000. We maintain an internet website at www.icf.com. We make available our Annual Reports on Form 10-K, Quarterly Reports on Form 10-Q, Current Reports on Form 8-K, and amendments to such reports filed or furnished pursuant to Section 13(a) or 15(d) of the Securities Exchange Act of 1934, as amended (the “Exchange Act”), Code of Business and Ethics, and other information related to us, free of charge, on this site as soon as reasonably practicable after we electronically file those documents with, or otherwise furnish them to, the SEC. Our internet website and the information contained therein or connected thereto are not intended to be incorporated into this Annual Report on Form 10-K. The SEC also maintains an internet website that contains reports, proxy and information statements, and other information regarding issuers that file electronically with the SEC at http://www.sec.gov.
MARKET OPPORTUNITY, SERVICES, AND SOLUTIONS
Complex, long-term market factors, which include geopolitical, technological, environmental, and demographic trends, are changing the way people live and their priorities, and the way government and industry operate and interact. We are all affected not only by the increasing breadth and invasiveness of change, but also by its velocity. These factors have significant impacts on the markets in which our clients operate.
In addition to these market-based factors, developments across all of our markets are increasing the demand for advisory services that drive our business. These trends include changing government focus and priorities on environmental initiatives; efficiency and mission performance management; generational changes; the emphasis on transparency and accountability; and an increased demand for combining domain knowledge of client missions and programs with innovative technology-enabled solutions. We see growth opportunities for technology-based solutions involving analytics, digital services, and strategic communications across all of our markets.
We believe that demand for our services will continue as government, industry, and other stakeholders seek to understand and respond to these and other factors. We expect that our government clients will continue to utilize professional services firms with relevant domain expertise to assist with designing new programs, enhancing existing ones, offering transformational solutions, and deploying innovative information and communications technology. In addition, commercial organizations affected by these programs will need to understand such changes, as well as their implications, in order for them to plan appropriately. More broadly, we believe our commercial clients will demand innovative services and solutions that can help them connect with customers and stakeholders in an increasingly connected and crowded marketplace. We also see opportunities to further leverage our digital and client engagement capabilities across our commercial and government client base. We believe that our institutional knowledge and subject matter expertise are a distinct competitive advantage in providing our clients with practical, innovative solutions, which are directly applicable to their mission or business, and deploying them quickly with the right resources. Moreover, we believe we will be able to leverage the domain expertise and program knowledge we have developed through advisory assignments and our experience with program management, technology-based solutions, and engagement projects to win larger engagements, which generally lead to increasing returns on business development investment and promote higher employee utilization. Rapid changes in technology, including the omnipresent influence of mobile, social, AI, and cloud technologies, also demand new ways of communicating, evaluating, and implementing programs, and we are focused on leveraging our expertise in technology to capitalize on those changes.
Our future results will depend on the success of our strategy to capitalize on our competitive strengths, including our success in maintaining our long-standing client relationships, to seek larger engagements across the program life cycle and to complete and successfully integrate strategic acquisitions. We will continue to focus on: building scale in vertical and horizontal domain expertise; developing business with both our government and commercial clients; and replicating our business model geographically in selected regions of the world, and being agile and flexible in an ever-changing business environment. In doing so, we will continue to evaluate strategic acquisition opportunities that enhance our subject matter knowledge, broaden our service offerings, and/or provide scale in specific markets and/or geographies.
Although we continue to see favorable long-term market opportunities, there are certain near-term challenges facing all government service providers. Administrative and legislative actions by governments to address changing priorities could have a negative impact on our business, which may result in a reduction to our revenue and profit and adversely affect cash flow. Geopolitical factors could result in changing government priorities; however, we believe we are well positioned to provide a broad range of services in support of initiatives that will continue to be priorities to the U.S. federal government as well as to state and local and international governments and commercial clients.
Energy, Environment, Infrastructure, and Disaster Recovery
We view the energy industry as a particularly attractive sector for us over the next decade due to concerns over reliability, and increasing energy demands from data centers, cryptocurrency, and expanding electrification of buildings and vehicles. In addition, energy providers are having to adjust to changing state and federal regulations, demand more diverse (and in some cases, cleaner) sources of energy, and the concomitant need for infrastructure to transport/transmit, store, and/or convert those new energy sources.
We see a continued demand for our energy advisory and consulting services to utilities, developers, and other commercial clients. In addition, we see opportunities for continued expansion of market share in our utility program design and delivery business. For example, we believe we can continue to expand our program- and technology-based services in areas such as assisting with the implementation of energy efficiency programs, electrification and decarbonization initiatives, information technology applications, resiliency, and environmental management services for utilities.
To this end, on December 31, 2024, we acquired Applied Energy Group (“AEG”), a leading energy technology and advisory services company with over 100 utility management and demand side energy experts. AEG provides a suite of integrated technology and advisory solutions to electric and gas utilities, state and local governments, and state energy offices nationwide. We believe that this acquisition will further enhance our market presence and client footprint.
We support federal, state, and local governments in planning, designing, and executing large-scale disaster recovery and mitigation programs across the United States. As extreme weather events become increasingly frequent and severe, we foresee an escalating demand for our services. Various communities in states such as Texas, Florida, North Carolina, Louisiana, California, Oregon, Hawaii, along with the U.S. Virgin Islands and Puerto Rico, are actively engaged in different stages of disaster recovery—efforts that span several years.
With over 25 years of experience in disaster management, we have worked on the ground after the most impactful disaster events in US history, including Hurricane Katrina, Hurricane Rita, Superstorm Sandy, and Hurricanes Harvey, Irma, Maria, Helene, and Milton. Our extensive expertise enables us to address a broad spectrum of hazards, ranging from hurricanes and flooding to tornadoes and wildfires. This position us to continue to deliver recovery and housing assistance, as well as environmental and infrastructure solutions, including disaster mitigation, on behalf of federal agencies, state and local governments, and regional authorities.
Our mission is to assist these communities in overcoming disaster challenges, building long-term resilience, and securing the necessary recovery and mitigation funding to ensure their future stability and growth.
We also have decades of experience in designing, evaluating, and implementing environmental policies and environmental compliance programs for energy, transportation (including aviation), and other infrastructure projects. A number of key issues are driving increased demand for the services we provide in these areas, including:
•Increased focus on the proper stewardship of natural resources;
•Changing precipitation patterns, including both more frequent flooding and drought, which is affecting water infrastructure and availability;
•Aging water, energy, and transportation infrastructure in the U.S.;
•The increasing exposure of infrastructure to damage and interference by severe weather events influenced by a changing climate, and therefore the need to become more resilient to those effects;
•Past under-investment in transportation infrastructure that was the center of the Infrastructure Investment and Jobs Act;
•The changing demands for businesses to respond to climate change and other priorities of our clients, investors, financing sources, business organizations, ratings agencies, and proxy advisory firms; and
•Changing patterns of economic development that require transportation systems and energy infrastructure to adapt to new patterns of demand.
By leveraging our multi-disciplinary skills, which range from finance and economics to earth and life sciences, information technology, and program management, we are able to provide a wide range of services that include complex environmental impact assessments, environmental management information systems, air quality assessments, program evaluation, transportation and aviation planning and operational improvement, strategic communications, and regulatory reinvention. We help clients deal specifically with the interrelated environmental, business, and social implications of issues surrounding all transportation modes and infrastructure. From the environmental management of complex infrastructure engagements to strategic and operational concerns of airlines and airports, our solutions draw upon our expertise and institutional knowledge in transportation, urban and land use planning, industry management practices, financial analysis, environmental sciences, and economics.
Health and Social Programs
We also apply our expertise across our full suite of services in the areas of health and social programs. We believe that a confluence of factors will drive an increased need for public and private focus on these areas, including, among others:
•Expanded healthcare services;
•Rising healthcare expenditures, which require the evaluation of the effectiveness and efficiency of current and new programs;
•Rampant substance abuse and widespread social and health impacts of the opioid abuse epidemic;
•The need to digitally transform and modernize the technology infrastructure underpinning government operations, including via the use of machine learning and AI technologies;
•The need for greater transparency and accountability of public sector programs;
•A continued high need for social support systems, in part due to an aging population, and the interrelated nature of health, housing, transportation, employment, and other social issues; and
•A changing regulatory environment.
We believe we are well positioned to provide our services to help our clients develop and manage effective programs in the areas of health, education, and social programs at the international, regional, national, and local levels. Our subject matter expertise includes public health, biomedical research, healthcare quality, mental health, international health and development, health communications and associated interactive technologies, education, child and family welfare needs, housing and communities, and substance abuse. Our combination of domain knowledge and our experience in information technology-based applications provides us with strong capabilities in health and social programs informatics and analytics, which we believe will be of increasing importance as the need to manage information grows. We partner with our clients in the government and commercial sectors to increase their knowledge base, support program development, enhance program operations, evaluate program results, and improve program effectiveness.
In the area of federal health, we support many agencies and programs within the U.S. Department of Health and Human Services (“HHS”), including the National Institutes of Health (the “NIH”), the Centers for Disease Control and Prevention (the “CDC”), and the Centers for Medicare and Medicaid Services (“CMS”) by conducting primary data collection and analyses, assisting in designing, delivering, and evaluating programs, managing technical assistance centers, providing instructional systems, developing information technology applications, and managing information clearinghouse operations. Increasingly, we provide multichannel communications and messaging for public health programs. We also provide training and technical assistance for early care and educational programs, and health and demographic surveys for the U.S. Department of State (the “DoS”). In the area of social programs, we provide extensive training, technical assistance, and program analysis and support services for a number of the housing programs of the U.S. Department of Housing and Urban Development (“HUD”) and state, territorial, and local governments. In addition, we provide research, program design, evaluation, and training for educational initiatives at the federal and state level. We provide similar services to a variety of U.K. ministries, as well as several Directorates-General of the E.C.
Security and Other Civilian & Commercial
We serve a number of other important government missions and commercial markets. These government missions range from Security (e.g., the U.S. Departments of Defense (the “DoD”), Homeland Security (“DHS”), and Justice (“DoJ”)) to a variety of other civilian government departments and agencies.
Security programs continue to be a critical priority of the federal government, state and local governments, international governments (especially in Europe), and in the commercial sector. We believe we are positioned to meet the following key safety concerns:
•Vulnerability of critical infrastructure to cyber and terrorist threats;
•Increasing risks to enterprises’ reputations in the wake of a cyberattack;
•Broadened homeland security concerns that include areas such as health, food, energy, water, and transportation;
•Reassessment of the emergency management functions of homeland security in the face of natural disasters;
•Safety issues around crime and at-risk behavior;
•The need to ensure that critical functions and sectors are resilient and able to recover quickly after attacks or disasters in either the physical or cyber realms; and
•The challenges resulting from migrations and changing global demographics.
These security concerns create demand for government programs that can identify, prevent, and mitigate key cybersecurity issues and the societal issues they cause.
In addition, the DoD is undergoing major transformations in its approach to strategies, processes, organizational structures, and business practices due to several complex, long-term factors, including:
•The changing nature of global security threats, including cybersecurity threats;
•Family issues associated with globally deployed armed forces;
•The increasing use of commercial cloud computing infrastructure and services to support the DoD enterprise; and
•The increasing need for real-time information sharing and the global nature of conflict arenas.
We provide key services to DoD, DHS, DoJ, and analogous Directorates-General at the E.C. We support DoD by providing high-end strategic planning, analysis, and technology-based solutions around cybersecurity. We also provide the defense sector with environmental management, human capital assessment, military community research, and technology-enabled solutions.
At the DHS, we assist in shaping and managing critical programs to ensure the safety of communities, developing critical infrastructure protection plans and processes, and establishing goals and capabilities for national preparedness at all levels of government in the U.S. At the DoJ, we provide technical and communications assistance to programs that help victims of crime and at-risk youths. At the E.C., we provide support and analytical services related to justice and home affairs issues within the European context.
Other large federal departments and agencies, such as the U.S. Department of Agriculture and the U.S. Department of the Treasury, also face important challenges that motivate them to transform their business processes and to modernize the associated technology systems. We support these organizations with a variety of technology and program support services.
COMPETITIVE STRENGTHS
We possess the following key business strengths:
We have a highly educated professional staff with deep subject matter knowledge
We possess strong intellectual capital that provides us with a deep understanding of policies, processes, and programs across our clients’ markets. Our thought leadership is based on years of training, experience, and education. We are able to apply our in-depth knowledge of our subject matter experts, and our experience developed over 45 years of providing advisory services to address the problems and issues our clients are facing. As of December 31, 2024, approximately 43% of our benefits-eligible staff held post-graduate degrees in diverse fields such as the social sciences, business and management, physical sciences, public policy, human capital, information technology, mathematics, engineering, planning, economics, life sciences, and law. These qualifications, and the complementary nature of our markets, enable us to deploy multi-disciplinary teams to identify, develop, and implement solutions that are creative, pragmatic, and tailored to our clients’ specific needs.
We believe our diverse range of client markets, services, and projects provides a stimulating work environment for our employees that enhances their professional development. The use of multi-disciplinary teams provides our staff with the opportunity to develop and refine common skills required in many types of engagements. Our approach to managing people fosters collaboration and significant cross-utilization of the skills and experience of both industry experts and other personnel who can develop creative solutions by drawing on their different experiences. The types of services we provide, and the manner in which we do so, enable us to attract and retain talented professionals from a variety of backgrounds while maintaining a culture that fosters teamwork and excellence.
We have strong, long-standing relationships with clients across a diverse set of markets
The long-term relationships we maintain with many of our clients reflect our successful track record of fulfilling our clients’ needs. We have advised the U.S. Environmental Protection Agency (“EPA”), the United States Agency for International Development (“USAID”), and HHS for more than 30 years, the U.S. Department of Energy (“DoE”) for more than 25 years, DoD for more than 20 years, certain commercial clients in our energy markets for more than 20 years, and the E.C. for more than 15 years, and we have multi-year relationships with many of our other clients in both our government and commercial client base. We have numerous contacts at various levels within our clients’ organizations, ranging from key decision-makers to functional managers. The long-standing nature and breadth of our client relationships adds greatly to our institutional knowledge, which, in turn, helps us carry out our client engagements more effectively and maintain and expand such relationships. Our extensive experience working alongside our clients and client contacts, together with our prime contractor position on a substantial majority of our contracts, gives us clearer visibility into future opportunities and emerging requirements. We believe our balance between government civilian and defense agencies, our commercial presence, and the diversity of markets in which our clients operate help mitigate the impact of policy or political shifts, as well as annual shifts in our clients’ budgets and priorities.
Our advisory services position us to capture a full range of engagements
We believe our advisory approach, which is based on our subject matter expertise combined with an understanding of our clients’ requirements and objectives, is a significant competitive differentiator that helps us gain access to key client decision-makers during the initial phases of a policy, program, project, or initiative. We use our expertise and understanding to formulate customized recommendations for our clients. We believe this domain expertise and program knowledge, developed from our advisory engagements, further positions us to provide a full suite of services across the entire life cycle of a particular policy, program, project, or initiative. As a result, we are able to understand our clients’ requirements and objectives as they evolve over time. We then use this knowledge to provide continuous improvement across our entire range of services, which maintains the relevance of our recommendations.
Our technology-enabled solutions are driven by our subject matter expertise and creativity
Government and commercial decision-makers have become increasingly aware that, to be effective, technology-based solutions need to be seamlessly integrated with people and processes. We possess a strong knowledge and experience base in information technology and a thorough understanding of organizational behavior and human decision processes. We have strong partnerships and experience in cloud-based technology platforms and open-source ecosystems that are central to our federal government clients’ technology modernization agendas. We also have growing experience in establishing and deploying innovative AI solutions to support our clients’ missions. This combination of skills, along with our domain knowledge, allows us to deliver technology-enabled solutions tailored to our clients’ business and organizational needs with less start-up time required to understand client issues. In addition, many of our clients seek to deploy cutting-edge solutions to communicate and transact with citizens, stakeholders, and customers in a multichannel environment, and doing so takes both our constantly refreshed technical know-how and world-class creativity.
Our proprietary tools, analytics, and methods allow us to deliver superior solutions to our clients
We believe our innovative, and often proprietary, analytics and methods are key competitive differentiators because they enhance our ability to deliver customized solutions to our clients and enable us to deliver services in a more cost-effective manner than our competitors. For example, we have developed industry-standard energy and environmental models that are used by governments and commercial entities around the world for energy planning and air quality analyses and we have also developed a suite of proprietary planning and analysis tools to help the private sector more quickly and economically develop new electricity generation and transmission assets. In addition, we also have proprietary program management methodologies and services that we believe can help clients improve performance measurement, support chief information officer and science and engineering program activities, and reduce security risks.
We are led by an experienced management team
Our management team, consisting of 293 senior leaders with the title of vice president or higher, possesses extensive industry experience and had an average tenure of approximately 17 years with us as of December 31, 2024 (including prior service with companies we have acquired). This low turnover allows us to retain institutional knowledge. Our managers are experienced both in marketing efforts and in successfully managing and executing our key services. Our management team also has experience in acquiring other businesses and integrating those operations with our own. A number of our managers are industry-recognized thought leaders. We believe that our management’s successful past performance and deep understanding of our clients’ needs have been and will continue to be differentiating factors in competitive situations.
We have a broad global presence
We serve our clients with a global network of 55 regional offices throughout the U.S., and 15 offices in key markets outside the U.S., including offices in the U.K., Belgium, Spain, India, and Canada. Our global presence also gives us access to many of the leading experts on a variety of issues from around the world, allowing us to expand our knowledge base and areas of functional expertise. Over the years, we worked in dozens of countries, helping government and commercial clients with energy, environment, infrastructure, healthcare, interactive technology/e-commerce, and air transport matters. Although international operations present challenges in the form of inconsistent legal systems, differing levels of intellectual property protection, and trade regulation issues, we believe our international operations will continue to play a significant role in our clients’ operations and in our platform.
STRATEGY
Our strategy to increase our revenue and shareholder value involves the following key elements:
Expand our commercial businesses
We plan to continue to pursue profitable commercial projects, and we believe we have strong, global client relationships in both the commercial energy and air transport markets. We continue to see growth opportunities in our current commercial business in the utility sector as well as significant potential to expand our business in other commercial areas such as aviation and tourism.
We view the energy industry as a particularly attractive sector for us over the next decade due to concerns over controlling energy costs and limiting climate and environmental impacts, increasing energy demands related to electrification projects and the expansion of data centers due to AI, changing state and federal regulation, the need for cleaner and more diverse sources of energy, and the concomitant need for infrastructure to transport/transmit, store, and/or convert those new energy sources. Although we believe the utility industry will continue to be a strong market for advisory services, particularly in light of the changing focus on regulatory actions and alternative energy sources, we intend to leverage our existing relationships and institutional expertise to pursue and capture additional, and typically higher-margin, opportunities. For example, we believe we can continue to expand our program- and technology-based services in areas such as assisting with the implementation of energy efficiency programs, electrification and decarbonization initiatives, information technology applications, and environmental management services for larger utilities. The growth of interest in sustainability and energy efficiency issues has created opportunities to offer these types of services to new clients beyond our traditional sectors. We believe these factors, coupled with our expansive national footprint and our international market presence, will result in a greater number of engagements that will also be larger in size and scope. To this end, on December 31, 2024, we acquired Applied Energy Group (“AEG”), a leading energy technology and advisory services company with over 100 utility management and demand side energy experts. AEG provides a suite of integrated technology and advisory solutions to electric and gas utilities, state and local governments, and state energy offices nationwide. We believe that this acquisition will further enhance our market presence and client footprint.
We expect that interest in energy advisory services will continue to expand as clients in a number of industries, including information service providers and companies engaged in travel and tourism, seek to better understand their energy consumption options and the positive benefits of demonstrating environmental stewardship. Our broad range of services to the aviation industry makes us well positioned to capitalize on significant industry changes; substantial airline equipment upgrades to newer, more efficient aircraft models in a cost-constrained environment; testing and adoption of Sustainable Aviation Fuels (“SAF”); and changes to airport business models and strategy as they place increasing importance on passenger experience.
Replicate our business model across government and industry in selected geographies
We believe the services we provide to our energy, environment, and infrastructure market have strong growth potential in selected geographies. Our domain expertise is well suited in Europe to meet the need for cutting-edge climate change, energy, and environmental solutions, particularly with our offerings to the U.K. government and the E.C. We have also focused our geographic footprint, when prudent, by selectively closing or reducing the size of offices which appear to be unlikely to generate profitable growth in the near to medium term, generally in nations or regions undergoing either economic or political challenges.
Strengthen our technology-based offerings
In early 2020 we acquired Incentive Technology Group, which materially increased our skills and market presence in IT modernization, including the use of popular cloud-based platforms to modernize legacy IT systems. In December 2021, we followed with the acquisition of Creative Systems and Consulting (“Creative Systems”), further extending our cloud platform and open-source technology implementation skills. In 2022, we acquired SemanticBits, LLC (“SemanticBits”), a leading provider of cloud-native open-source technology systems with a strong client position in CMS. We are positioned to increase these services by expanding the technological underpinnings of our business, while bringing cloud, AI, business process automation, data management, and analytics offerings to our clients to better link them with citizens, consumers, and other stakeholders.
Leverage advisory work into full life-cycle solutions
We plan to continue to leverage our advisory services and strong client relationships to increase our revenue by winning longer-term engagements. These engagements could include: information services and technology-based solutions; project and program management; business process solutions; and technical assistance and training. Our advisory services provide us with insight and understanding of our clients’ missions and goals. We believe the domain expertise and program knowledge we develop from these advisory assignments position us to capture a greater portion of the resulting larger engagements; however, we will need to undertake such expansion carefully to avoid actual, potential, and perceived conflicts of interest.
Defend, expand, and deepen our presence in core U.S. federal and state and local government markets
Changing and somewhat unpredictable political priorities at the U.S. federal, state, and local government levels have created challenging market conditions for all competitors in the government services sector; however, we believe that changes driven by the Trump administration will provide opportunities to accelerate digital transformation of the U.S. federal government activities and to provide advisory and analytic support to changing policy priorities. We will focus not only on defending our current market footprint, but also on innovating to continue expanding across key growth markets, such as U.S. federal government energy and resilience-related programs, reengineering of U.S. public health and research efforts, and cybersecurity initiatives, digital services, and disaster recovery work for state and local governments. We will continue to provide innovative solutions that help our public sector clients do more with less. We will specifically target deeper penetration of those agencies that currently procure services only from one or two of our service areas, and our skills and market presence in technology modernization provides us with capabilities in this effort. We believe we can leverage many of our long-term client relationships by introducing these existing clients, where appropriate, to our other services in order to better meet their needs. For example, we introduce many of our advisory clients to our capabilities to provide associated information technology, cybersecurity, large-scale program management, and strategic communications and digital services. We can also offer clients our extensive performance measurement, program evaluation, and performance management services. Finally, our network of offices across the U.S. allows us to focus our business development efforts on addressing the needs of U.S. federal and state and local government agencies with operations outside of the Washington, D.C. metropolitan area.
Pursue larger prime contract opportunities
We believe that continuing to expand our client engagements into services we offer as part of our end-to-end client solutions enables us to pursue larger prime contract opportunities, which should provide a greater return on our business development efforts and allow for increased employee utilization. We plan to continue to target larger and longer-term opportunities through greater emphasis on early identification of opportunities, strategic capture and positioning, and enhanced brand recognition. We believe that the resulting increase in the scale, scope, and duration of our contracts will help us continue to grow our business.
Pursue strategic acquisitions
We plan to augment our organic growth with selective, strategic acquisitions when the target company will enable us to obtain new clients, increase our presence in attractive markets, obtain capabilities that complement our existing portfolio of services, and/or gain access to customers and contracts; provided, that the target company has cultural compatibility and we expect that the acquisition will have a positive financial impact.
These elements of our strategy permeate all of the Company and influence our day-to-day decisions. We believe that, collectively, they support the overall long-term growth of the organization.
CLIENT AND CONTRACT MIX
Government clients (including U.S. federal, state and local, as well as international) accounted for approximately 75%, 76%, and 76% of our 2024, 2023, and 2022 revenue, respectively. Commercial clients (including U.S. and international clients) accounted for approximately 25%, 24%, and 24% of our 2024, 2023, and 2022 revenue, respectively.
Our clients span a broad range of civilian and defense agencies and commercial enterprises. Commercial clients include non-profit organizations and universities, while government clients include the World Bank and the United Nations. In general, a client is considered to be a government client if its primary funding is from a government agency or institution. If we are a subcontractor, we classify the revenue based on the nature of the ultimate client receiving the services.
In fiscal years 2024, 2023, and 2022, our largest three U.S. government clients by revenue and their percentages to our total revenue are as follows:
| | | | |
| | 2024 | |
Department of Health and Human Services | | | 25 | % |
Department of State | | | 3 | % |
Environmental Protection Agency | | | 3 | % |
Total | | | 31 | % |
| | | |
| | 2023 | |
Department of Health and Human Services | | | 26 | % |
Department of State | | | 5 | % |
Department of Defense | | | 3 | % |
Total | | | 34 | % |
| | | |
| | 2022 | |
Department of Health and Human Services | | | 23 | % |
Department of State | | | 6 | % |
Department of Defense | | | 4 | % |
Total | | | 33 | % |
There was no single commercial client with revenue greater than 2% of our total revenue for the 2024, 2023, and 2022 fiscal years, respectively.
Most of our revenue is derived from prime contracts under which we work directly for the end customer. These accounted for approximately 87%, 89%, and 91% of our revenue for the 2024, 2023, and 2022 fiscal years, respectively.
Our contract periods typically extend from one month to five years, including option periods. Many of our government contracts provide for option periods that may be exercised by the client. In 2024, 2023, and 2022, no single contract accounted for more than 2%, 2%, and 3% of our revenue for those fiscal years, respectively. Our 10 largest contracts by revenue collectively accounted for approximately 12%, 14%, and 15% of our revenue in the 2024, 2023, and 2022 fiscal years, respectively.
CONTRACT BACKLOG
We define backlog as the future revenue we expect to receive from our contracts and other engagements. We generally include in our backlog the estimated revenue represented by contract options that have been priced, but not exercised. We do not include any estimate of revenue relating to potential future delivery orders that might be awarded under our U.S. General Services Administration (the “GSA”) Multiple Award Schedule (“GSA Schedule”) contracts, other Indefinite Delivery/Indefinite Quantity (“IDIQ”) contracts, Master Service Agreements (“MSAs”), or other contract vehicles that are also held by a large number of firms and under which potential future delivery orders or task orders might be issued by any of a large number of different agencies, and are likely to be subject to a competitive bidding process. We do, however, include potential future work expected to be awarded under IDIQ contracts that are available to be utilized by a limited number of potential clients and are held either by us alone or by a limited number of firms, and we have a history of working with these clients on predecessor IDIQ contracts or other contract vehicles.
We include expected revenue in funded backlog when we have been authorized by the client to proceed under a contract up to the dollar amount specified by our client, and this amount will be owed to us under the contract after we provide the services pursuant to the authorization. If we do not provide services authorized by a client prior to the expiration of the authorization, we remove amounts corresponding to the expired authorization from funded backlog. We include expected revenue under an engagement in funded backlog when we do not have a signed contract, but only in situations when we have received client authorization to begin or continue work and we expect to sign a contract for the engagement. In this case, the amount of funded backlog is limited to the amount authorized. Our funded backlog does not represent the full revenue potential of our contracts because many government clients, and sometimes other clients, authorize and fund work under a particular contract on a yearly or more frequent basis, even though the contract may extend over several years. Most of the services we provide to commercial clients are provided under fully funded contracts and task orders under MSAs. As a consequence, our backlog attributable to these clients is typically reflected in funded backlog and not in unfunded backlog.
Our estimate of unfunded backlog for a particular contract is based, to a large extent, on the amount of revenue we have recently recognized on the particular contract under the assumption that future utilization will be similar, our past experience in utilizing contract capacity on similar types of contracts, and our professional judgment. Accordingly, if contract utilization is different from our expectations, the revenue eventually earned on a contract may be lower or higher than that implied by our estimate at a point in time or during the life of a contract, of total backlog, including unfunded backlog. Although we expect our total backlog to result in revenue, the timing of revenue associated with both funded and unfunded backlog will vary based on a number of factors, and we may not recognize revenue associated with a particular component of backlog when anticipated, or at all. Our government clients generally have the right to cancel any contract, or ongoing or planned work under any contract, at any time. In addition, there can be no assurance that revenue from funded or unfunded backlog will have similar profitability to previous work or will be profitable at all. Generally speaking, we believe the risk that a particular component of backlog will not result in future revenue is higher for unfunded backlog than for funded backlog.
Our funded and estimates of unfunded and total backlog were as follows at December 31:
| | | | | | | | | | | | |
(in millions) | | 2024 | | | 2023 | | | 2022 | |
Funded | | $ | 1,857.1 | | | $ | 1,775.1 | | | $ | 1,786.9 | |
Unfunded | | | 1,929.2 | | | | 2,002.7 | | | | 2,069.3 | |
Total backlog | | $ | 3,786.3 | | | $ | 3,777.8 | |
| $ | 3,856.2 | |
There were no awards included in our 2024, 2023, or 2022 backlog amounts that were under protest.
As with other federal contractors, we have experienced business impacts from changing priorities of the Administration that could have an adverse impact on our results and, as these new priorities are implemented, it may be difficult for us to accurately predict the effect they will have on our results.
Subsequent to December 31, 2024, and through February 25, 2025, pursuant to the recent executive orders issued by the Administration or actions by DOGE, we received notices for termination-for-convenience of approximately $276 million and for stop-work orders of approximately $99 million. Had the termination-for-convenience occurred prior to December 31, 2024, our total backlog would be reduced by the $276 million. The majority of the termination-for-convenience and stop-work orders notices are associated with our contracts with USAID.
Presently, it is unknown if the stop-work orders notices will be lifted and the Company will resume work on these programs, or if the stop-work orders will result in a termination-for-convenience.
BUSINESS DEVELOPMENT
Our business development efforts are critical to our organic growth. Our business development processes and systems are designed to enable agility and speed-to-market over the business development life cycle, especially given the distinctions between commercial and government clients. Business development efforts in priority market areas, which include some of our largest federal agency accounts (HHS, DoS, DoE, U.S. Department of Transportation, and EPA), are executed through account teams. Each team participates in regular executive reviews of marketing plans and proposal development processes. Our non-federal government clients are served by account leaders from operating units and coordinated by senior leaders with industry experience where such coordination is deemed appropriate to enhance our business development success. This account-based approach allows deep insight into the needs of current and future clients. It also helps us anticipate our clients’ evolving requirements over the coming 12 to 18 months and position ourselves to meet those requirements. Each administrative group is responsible for maximizing sales in our existing accounts and finding opportunities in closely related accounts.
The corporate business development function also includes a market research and competitive intelligence group, a proposal group, and a strategic capture unit. The marketing function engages in brand marketing and strategic marketing program development and execution to raise awareness of our services and solutions across our markets, and to generate leads for further pursuit by sales personnel. The marketing function also executes corporate communications campaigns to support specific lines of business. Our contracts and administration function supports bid price development in partnership with the business development account teams.
COMPETITION
We operate in a highly competitive and fragmented marketplace and compete against a number of firms in each of our clients’ key markets. Some of our principal competitors include: Abt Associates; Accenture; AECOM Technology Corporation; Booz Allen Hamilton Holding Corporation; CACI International Inc.; CLEAResult Consulting, Inc.; Deloitte LLP; General Dynamics, Inc.; Guidehouse; HORNE; Leidos Holdings, Inc.; PA Consulting Group; Science Applications International Corporation; Research Triangle Institute; Tetra Tech Inc.; and Westat, Inc. In addition, we have numerous smaller competitors, many of which have narrower service offerings and serve niche markets. Some of our competitors are significantly larger than we are and have greater access to resources and stronger brand recognition than we do.
We consider our principal competitive advantages to be long-standing client relationships, the good reputation and past performance of the firm, client references, the technical knowledge and industry expertise of our employees, the quality of our services and solutions, and the scope and scale of our service offerings.
INTELLECTUAL PROPERTY
We own a number of trademarks and copyrights, and internally developed software that helps maintain our business and competitive position. Sales and licenses of our intellectual property do not currently comprise a substantial portion of our revenue or profit. We rely on the technology and models, proprietary processes, and other intellectual property we own or have the right to use in our analyses and other work we perform for our clients. We use these innovative, and often proprietary, software, analytical models, and tools throughout our service offerings. Our staff regularly maintains, updates, and improves these software, models, and tools based on our corporate experience. In addition, we sometimes retain limited rights in software applications we develop for clients. We use a variety of means to protect our intellectual property.
HUMAN CAPITAL
Human Capital Management
As a global advisory and technology services provider, our human capital strategy is vital to our business. Our business depends substantially on attracting, developing, and retaining a highly qualified workforce that provides excellent, effective, and efficient performance reflecting the vast communities we serve. We have designed our human resources programs to enable our high-performing workforce to reach its full potential. We develop our employees to prepare them for critical roles; reward and support employees through pay, benefit, and perquisite programs that we believe are competitive; and evolve and invest in technology, tools, and resources to empower employees to belong, grow, and thrive.
As of December 31, 2024, we employed over 9,300 people, 86% of whom were employed full-time. The results of our most recent employee engagement survey reflect a strong culture that encourages our employees to stay and grow a career with us. We are proud that a large number of our employees believe their values align with our values.
Culture and Values
At ICF, we cultivate a culture rooted in expertise, innovation, and purpose, with a deep commitment to caring for the world around us and for each other. We are a vibrant and growing community of experts with diverse backgrounds and life experiences, united by our drive to make a positive impact. Our shared values emphasize integrity and collaboration as we embrace our personal passions and differences to challenge assumptions and deliver outcomes that we and our clients can be proud of. Grounded in data-driven insights, we foster a high-performance environment that values creativity, critical thinking, mutual respect and support, and a multidisciplinary approach. Since our founding in 1969, we have been a mission-driven company delivering exceptional solutions that empower communities, drive progress, and inspire lasting, positive change.
We believe our culture and values help us attract a wide pool of talent and perspectives so we can select the most capable people to support a workplace culture that best supports the clients we serve and the constituencies we support.
Talent Acquisition, Development, and Retention
Successful talent attraction and retention hinges on a healthy and recognizable employer brand. We have built a strong digital and social media presence with an employee-first lens to distinguish us as a named employer of choice. Employee voices and perspectives are at the heart of the stories we share. These recruitment marketing efforts drove two-thirds of the nearly half a million job applications submitted to us in 2024 and resulted in one-third of all hires. Engagement with our talent community to create continuous connections with those who are interested in working for us is the second top source of job applications after major job boards. Our programmatic approach to hiring has resulted in a rapid time-to-find for new hires.
In the past year, we have been recognized on the Forbes list of America’s Best Management Consulting Firms and as an employer of choice in a range of categories by both Forbes and Newsweek. We have also been named as one of the best places to work by PRWeek and one of the best places to work in Washington, D.C., by Built In, a community for startups and tech companies.
Once a new hire joins us, we set them up for long-term success with a robust onboarding program, including sessions focused on our purpose and values and required compliance training. To further enhance this experience, new employees may participate in an optional peer coaching program to connect with other employees throughout their first year. In 2024, 98% of participants rated this as a valuable experience.
Another pillar of retention is helping our employees to grow by achieving personal and career success. We have tailored offerings for every stage of career, and every type of learner, ranging from experiential learning to informal learning like our mentoring program, and formal courses. In 2024, we delivered digital and instructor-led programs to build skills in various areas, including leadership, people management, project management, consulting, business development, finance, technology, and innovation skills. To increase enterprise-wide access to industry-leading content, we also partnered with best-in-class providers like LinkedIn Learning, Udemy, Workday, and Microsoft for digital learning in self-paced programs.
For managers and leaders, we offer programs that support their development and ensure they have the tools and resources they need to be effective, whether they are at an emerging, experienced, or senior level. Our key focus area is taking an enterprise-wide approach to continue building our pipeline of tomorrow’s leaders.
Another area of employee development is our intentional culture of continuous coaching and feedback through our Impact Conversations program. In addition, our anytime feedback process and recognition program empower employees to receive and give feedback or kudos from and to peers, managers, and leaders at any point during the year. In 2024, all eligible employees also received a performance appraisal with feedback from their manager on their 2023 performance.
Historically, we experience voluntary employee turnover that is consistently below industry benchmarks. In 2024, our overall company turnover was 12.6% and 10.0% when excluding our on-call team members.
Employee Well Being
Our well-being and total rewards team benchmarks externally and assesses the evolving needs of our workforce, incorporating insights gathered through an employee survey. This approach ensures we continuously improve our offerings to reflect what employees value most. In 2024, we enhanced medical and pharmacy plan support, increased access to gym memberships, and focused on making it easier for employees to manage and understand their benefits.
Our commitment to supporting employees holistically, regardless of where they live and work, reinforces our focus on fostering a resilient, engaged workforce that drives long-term success. Our approach was recognized by FlexJobs.
REGULATION
We provide our services to U.S. federal and state and local governments, as well as international government clients, and we are therefore subject to certain laws and regulations. Our failure to comply with the complex laws, rules, and regulations applicable to us could cause us to lose business and subject us to a variety of penalties and sanctions. Additionally, we are subject to various routine and non-routine governmental and other reviews, audits, and investigations, the results of which could affect our operating results and also subject us to penalties and sanctions. See “Item 1A. Risk Factors - Compliance Risks” for a more detailed description of the regulatory and compliance risks we face.
ITEM 1A. RISK FACTORS
The following discussion sets forth the material risk factors facing the Company that make an investment in us speculative or risky. This information should be read in conjunction with the description of our business, Management’s Discussion and Analysis, and the consolidated financial statements and related notes contained in this Annual Report on Form 10-K. Because of the following factors affecting our business, operations, financial position or future financial performance, reputation, and/or value of our stock, past financial performance should not be considered to be a reliable indicator of future performance, and investors should not use historical trends to anticipate results or trends in future periods.
GOVERNMENT BUDGETING AND SPENDING PRIORITIES RISKS
The failure of Congress to approve appropriations bills in a timely manner for the federal government agencies and departments we support, or the failure of the Administration and Congress to reach an agreement on fiscal issues, could delay and reduce spending, cause us to lose revenue and profit, and affect our cash flow.
On an annual basis, Congress is required to approve appropriations bills that govern spending by each of the federal government agencies and departments we support. When Congress is, or Congress and the Administration are, unable to agree on budget priorities or specifics, and thus unable to pass annual appropriations bills on a timely basis, Congress typically enacts a continuing resolution. Continuing resolutions generally allow federal government agencies and departments to operate at spending levels based on the previous fiscal year. When agencies and departments operate on the basis of a continuing resolution, funding we expect to receive from clients for work we are already performing and for new initiatives may be delayed or canceled. Congress and the Administration have from time to time failed to agree on a continuing resolution, resulting in temporary shutdowns of non-essential federal government functions and our work on such functions. Failures by Congress and the Administration to enact appropriations bills in a timely manner can force federal government agencies and departments to shut down or to cancel, change, or delay the implementation of existing or new initiatives. Such events may result in the loss of revenue and profit, or the deferral of revenue and profit to later periods. There is also the possibility that Congress will fail to raise the U.S. debt ceiling when necessary which, in addition to resulting in federal government shutdowns, could significantly impact the U.S. and global economy, affecting the discretionary spending decisions of our non-governmental clients and affecting the capital markets and our access to sources of liquidity on terms that are acceptable to us. The delayed funding or shutdown of many parts of the federal government, including agencies, departments, programs, and projects we support, could have a substantial negative effect on our revenue, profit, and cash flows.
Budget compromises that may be needed for future fiscal years may continue to be extraordinarily difficult given the complicated grassroots political environment, a closely divided Congress, an increasing federal deficit and debt load, and a challenged economy.
The budgets of many of our state and local government clients are also subject to similar divisions, risks, and uncertainties as are inherent in the federal budget process.
Government spending priorities may change in a manner adverse to our business.
We derived approximately 54%, 55%, and 55% of our revenue in 2024, 2023, and 2022, respectively, from contracts with federal government clients, and approximately 21%, 21%, and 21% of our revenue from contracts with state and local governments and international governments in 2024, 2023, and 2022, respectively. Expenditures by our federal government clients may be restricted or reduced by Administration or Congressional actions, by action of the Office of Management and Budget, by action of individual agencies or departments, or by other actions from the DOGE advisory commission. This may include impact to our revenue, profit, and cash flows as a result of changes by or changes in the priorities of the Administration. In addition, many state and local governments are not permitted to operate with budget deficits, and nearly all state and local governments face considerable challenges in balancing their budgets. Accordingly, we expect that, due to changing government budgeting and spending priorities, including necessary balancing of defense spending with civilian agency spending, and related disputes among Congress and the Administration, some of our government clients in the future may elect to terminate or issue stop-work orders with respect to contracts or programs for which we perform services, delay payments due to us, eventually fail to pay what they owe us, and/or delay certain programs and projects. For some government clients, we may face a difficult choice: turn down (or stop) work due to budget uncertainty with the risk of damaging a valuable client relationship or perform work with the risk of not being paid in a timely fashion or perhaps at all. Federal, state and local government, and/or international government elections could also affect spending priorities and budgets at all levels of government. In addition, increased government deficits and debt, both domestic and international, may lead to reduced spending by agencies and departments on projects or programs we support.
Risks Related to THE Changing Business ENVIRONMENT IN WHICH WE OPERATE
As we develop new services, clients and practices, enter new lines of business, and focus more of our business on providing a full range of client solutions, the additional demands that such growth places on our management and staff, information and operational systems, and cash flow may adversely affect the quality of our work, our operating margins, and our operating results.
As part of our corporate strategy, we are attempting to leverage our advisory services to sell our full suite of services across the life cycle of a policy, program, project, or initiative and we are regularly searching for ways to provide new services to clients. In addition, we extend our services to new clients, lines of business, and selected geographic locations, including outside the U.S., and seek out new cross-border opportunities. As we focus more on our delivery of a full range of consulting services from advisory through implementation and attempt to develop new services, clients, practice areas, and lines of business, these efforts could be unsuccessful and adversely affect our results of operations.
Such growth efforts place substantial additional demands on our management and staff, as well as on our information, financial, cash flow, and administrative and operational systems. We may not be able to manage these demands successfully. Growth may require increased recruiting efforts, business development, selling, marketing and other actions that are expensive and increase risk. We may need to invest more in our people and systems, controls, compliance efforts, policies, and procedures than we anticipate. Further, we may need to enhance or modify our systems or processes, or transition to more efficient or effective ones, and these changes and how we handle them may impact the business. Therefore, even if we do grow, the demands on our people and systems, controls, compliance efforts, policies, and procedures may adversely affect the quality of our work, our operating margins, and our operating results, at least in the short-term, and perhaps in the long-term.
Efforts involving a different focus, new services, new clients, new practice areas, new lines of business, and increasing internationalization include risks associated with our inexperience and competition from mature participants in those areas. Our expansion of services may result in decisions that could harm our profit and operating results. In particular, implementation and improvement services often relate to the development, implementation, and improvement of critical infrastructure or operating systems that our clients may view as “mission critical”. If we fail to satisfy the needs of our clients in providing these services, we could incur reputational damage, and clients could claim significant costs and losses for which they could seek compensation from us.
RISKS RELATED TO THE GOVERNMENT CONTRACTS BUSINESS
Maintaining our client relationships and professional reputation is critical to our ability to successfully win new contracts and renew expired contracts. and failure to do so may inhibit our ability to secure future contracts, leading to decreased revenue and other adverse effects.
Our client relationships and professional reputation are key factors in maintaining and growing our business, revenue, and profit levels under contracts with our clients. We continually bid for and execute new contracts, and our existing contracts regularly become subject to re-competition and expiration. If we are not able to replace the revenue from these contracts, either through follow-on contracts or new contracts for those requirements or for other requirements, our revenue and operating results may be adversely affected. On the expiration of a contract, we typically seek a new contract or subcontractor role relating to that client to replace the revenue generated by the expired contract. We face several risks related to these expiring contracts. The expiring contracts we service may not continue after their expiration, the client may not re-procure those requirements, re-procurement may be restricted in a way that would eliminate us from the competition (e.g., set asides for small businesses), or we may not be successful in any such re-procurements or in obtaining subcontractor roles. Any factor that diminishes client relationships and/or professional reputation with federal, state and local, and international government clients, as well as commercial clients, could make it substantially more difficult for us to compete successfully for new engagements and qualified employees. To the extent our client relationships and/or professional reputation deteriorate, our revenue and operating results could be adversely affected.
The diversity of the services we provide, and the clients we serve, may create actual, potential, and perceived conflicts of interest and business conflicts that limit our growth and could lead to potential liabilities for us.
Because we provide services to a wide array of both government and commercial clients, occasions arise where, due to actual, potential, or perceived conflicts of interest or business conflicts, we cannot perform work for which we are qualified. A number of our contracts contain limitations on the work we can perform for others, for example, when we are assisting a government agency or department in developing regulations or enforcement strategies. Actual, potential, and perceived conflicts limit the work we can do and, consequently, can limit our opportunity for growth and adversely affect our operating results. In addition, if we fail to address actual or potential conflicts properly, or even if we simply fail to recognize a perceived conflict, we may be in violation of our existing contracts, may otherwise incur liability, may lose future business for not preventing the conflict from arising, and our reputation may suffer. Particularly as we continue to grow our commercial business, we anticipate that conflicts of interest and business conflicts will pose a greater risk.
We derive significant revenue and profit from contracts awarded through a competitive bidding process, which can impose substantial costs on us, and we will lose revenue and profit if we fail to compete effectively.
We derive significant revenue and profit from contracts that are awarded through competitive bidding processes. Competitive bidding imposes substantial costs and presents a number of risks, including the:
•Substantial cost and managerial time and effort that we spend to prepare bids and proposals;
•Need to estimate accurately the resources and costs that will be required to service any contracts we are awarded, sometimes in advance of the final determination of their full scope;
•Expense and delay that may arise if our competitors protest or challenge awards made to us pursuant to competitive bidding, as discussed elsewhere; and
•Opportunity cost of not bidding on and winning other contracts we may have otherwise pursued.
To the extent we engage in competitive bidding and are unable to win particular contracts, we not only incur substantial costs in the bidding process that negatively affect our operating results, but we may lose the opportunity to operate in the market for the services provided under those contracts for a number of years. Even if we win a particular contract through competitive bidding, our profit margins may be depressed, or we may even suffer losses as a result of the costs incurred through the bidding process and the need to lower our prices to overcome competition.
Our reliance on GSA Schedule and other IDIQ contracts creates the risk of volatility in our revenue and profit levels.
We believe that one of the elements of our success is our position as a prime contractor under GSA Schedule contracts and other IDIQ contracts, and we believe this position is important to our ability to sell our services to federal government clients. However, these contract vehicles require us to compete for each delivery order and task order, rather than having a more predictable stream of activity during the term of a multi-year contract. In addition, we may spend considerable cost and managerial time and effort to prepare bids and proposals for contracts, delivery orders or task orders that we may not win. We may be unable to continue to obtain revenue from such contracts at current levels, or in any amount, in the future. To the extent that federal government agencies and departments choose to employ GSA Schedule contracts and other IDIQ contracts encompassing activities for which we are not able to compete or provide services, we could lose business, which would negatively affect our revenue and profitability. There may also be changes in the manner in which the GSA approaches procurement under the various GSA Schedule contract vehicles and other IDIQ contracts that may impact our ability to pursue and obtain awards of new or recompete opportunities.
We may not receive revenue corresponding to the full amount of our backlog, or may receive it later than we expect, which could adversely affect our revenue and operating results.
The calculation of backlog is conditioned on numerous uncertainties and estimates, and we may, in fact, fail to receive the amounts we have included in our backlog. Our assessment of a contract’s potential value is based on factors such as the amount of revenue we have recently recognized on that contract under the assumption that future utilization will be similar, historical trends and our experience in utilizing contract capacity on similar types of contracts, and our professional judgment. In the case of contracts that may be renewed at the option of the client, we generally calculate backlog by assuming that the client will exercise all of its renewal options; however, the client may elect not to do so. In addition, federal government contracts rely on Congressional appropriation of funding, which is typically provided on an incremental basis at any point during the term of federal government contracts, and all or some of the work to be performed under a contract may require future appropriations by Congress and the subsequent allocation of funding by the procuring agency or department to the contract.
Protests of contracts continue to be common in our industry. We do not include contract awards that are subject to a pending protest in our calculation of backlog. If a contract previously included in backlog becomes the subject of a protest, we would adjust backlog to remove that amount and reassess following resolution of the protest.
Our estimate of the portion of backlog that we expect to recognize as revenue in any future period may differ from actual results because the receipt and timing of this revenue often depends on subsequent appropriation and allocation of funding and is subject to various contingencies, such as timing of task orders and delivery orders, many of which are beyond our control. In addition, we may never receive revenue from some of the engagements that are included in our backlog, and this risk is greater with respect to unfunded backlog. We adjust our backlog to reflect modifications to or renewals of existing contracts, awards of new contracts, or approvals of expenditures; however, if we subsequently fail to realize revenue corresponding to our backlog, our revenue and operating results could be adversely affected.
Our contracts may contain provisions that are unfavorable to us and permit our clients to, among other things, terminate our contracts partially or completely at any time prior to completion.
Our contracts may contain provisions that allow our clients to terminate or modify these contracts at their convenience on short notice. If a client terminates one of our contracts for convenience, we will only bill the client for work completed prior to the termination, plus any commitments and settlement expenses that we may claim and the client agrees to pay, but not for any work not yet performed. In addition, many of our government contracts and task and delivery orders are incrementally funded as appropriated funds become available. The reduction or elimination of such funding can result in contract options not being exercised and further work on existing contracts and orders being curtailed. In any such event, we likely would have no right to seek lost fees or other damages. In addition, certain contracts with international government clients may have more severe and/or different contract clauses than what we are accustomed to with federal and state and local government clients, such as penalties for any delay in performance. If a client were to terminate, decline to exercise options under, or curtail further performance under one or more of our major contracts, our revenue and operating results could be adversely affected.
Our relationships with other contractors are important to our business and, if disrupted, could cause us reputational damage or result in contract termination or other adverse effects on our business.
We derive a portion of our revenue from contracts under which we act as a subcontractor or from “teaming” arrangements in which we and other contractors jointly bid on particular contracts, projects, or programs. As a subcontractor or team member, we often lack control over fulfillment of a contract. Poor performance on the contract, whether resulting from our performance or the performance of another contractor, could tarnish our reputation, result in a reduction of the amount of our work under, or termination of, that contract or other contracts, and cause us to not obtain future work, even when we perform as required. Moreover, our revenue, profit and operating results could be adversely affected if any prime contractor or teammate does not pay our invoices in a timely fashion, chooses to offer products or services of the type that we provide, teams with other companies to provide such products or services, or otherwise reduces its reliance upon us for such products or services.
PROFITABILITY RISKS
Our inability to accurately estimate or control our costs on our fixed price contracts may result in a decrease of our operating margins, and in some cases result in contract losses.
As described elsewhere in this Form 10-K, we have three principal types of contracts with our clients: fixed-price, time-and-materials and cost-based. We derived 46%, 45%, and 45% of our total revenue from fixed-price contracts in 2024, 2023, and 2022, respectively. The percentage of work we perform on a fixed-price basis may increase in the future based on changes to the procurement approach of our clients. Under fixed-price contracts, we receive a fixed price irrespective of the actual costs we incur and, consequently, we realize a profit on fixed-price contracts only if we can control our costs and prevent cost overruns while meeting our contractual obligations.
Revenue recognition on fixed-price contracts requires us to make cost and scheduling estimates based on a number of assumptions, including assumptions about availability of labor, equipment, materials, change in contractual scope, and future economic conditions, among others. Estimates are inherently subjective and often change, and we may experience contract cost overruns as a result of ambiguities in contract specifications, our inability to meet service-level agreements, inflationary pressures, high demand for skilled labor, unanticipated technical problems, difficulties in obtaining permits or approvals, changes in local laws or labor conditions, weather delays, inability of our vendors or subcontractors to perform, or for other reasons. Contract cost overruns that are not reimbursed by our customers would result in a loss for that project and, if the project is significant or if multiple projects are impacted, such aggregate overruns may have a material adverse impact on our business and earnings.
Certain lines of business of our commercial work depend on certain sectors of the global economy that are highly cyclical, which can lead to substantial variations in our revenue and profit from period to period.
Our commercial clients, which include clients outside the U.S., generated approximately 25%, 24%, and 24% of our revenue in 2024, 2023, and 2022, respectively. This reliance on commercial clients presents certain risks and challenges. For example, our commercial work is heavily concentrated in industries which can be cyclical, such as: energy, air transportation, and environmental services. Demand for our services from our commercial clients has historically declined when their industries have experienced downturns, and we expect a decline in demand for our services when these industries or their customer bases experience downturns in the future.
Our efforts to become involved in engagements that are greater in terms of size, scope, and performance demands may result in increased performance and credit risk.
As we expand our national and global footprint, we may become involved in a greater number of engagements that will be larger in size, scope and complexity. The increase in the size, scope, and complexity of these engagements subjects us to the potential for a larger impact of performance risk associated with larger and more challenging engagements and the credit risk associated with certain larger customers, particularly among our commercial non-U.S. government and non-federal U.S. government clients. Our customers may face unexpected circumstances that adversely impact their ability to pay their trade payables to us and we may face unexpected borrowing needs or losses as a result. Such circumstances could lead to our commercial customers filing for bankruptcy. This can ultimately lead to variations in our profit from period to period.
Our business could be adversely affected by delays caused by our competitors protesting contract awards received by us, which could stop our work. Likewise, we may protest the contracts awarded to some of our competitors, a process that takes the time and energy of our management and may result in additional legal and consultant costs.
Due in part to the competitive bidding process under which government contracts are awarded, we are at risk of incurring expenses and delays if one or more of our competitors protest contracts awarded to us. Contract protests remain common in our industry and may result in a requirement to resubmit offers for the protested contract or in the termination, reduction, or modification of the awarded contract. It can take many months to resolve contract protests and, in the interim, the contracting government agency or department may suspend our performance under the contract pending the outcome of the protest. Even if we prevail in defending the contract award, the resulting delay in the startup and funding of the work under these contracts may adversely affect our operating results.
Moreover, in order to protect our competitive position, we may protest the contract awards of our competitors. This process takes the time and energy of our executives and employees, is likely to divert management’s attention from other important matters, and could cause us to incur additional legal and consultant costs.
COMPLIANCE RISKS
We are subject to various routine and non-routine governmental and other reviews, audits, and investigations and unfavorable results could force us to adjust previously reported operating results, affect future operating results, and subject us to a variety of penalties and sanctions.
Government departments and agencies we work for, including non-U.S., U.S. federal, and many state and local government clients, review, audit, and investigate our contract performance, pricing practices, cost structure, financial capability, and compliance with applicable laws, rules, and regulations. We have experienced growth in services related to disaster recovery in recent years, and those activities, by their nature, may become politicized and involve interaction with multiple tiers of national, state, territorial, and local governments, subcontractors, and citizens that increase the risk of claims, audits, investigations, reviews, monitoring, and litigation. Any of these reviews, audits and investigations could raise issues that have significant adverse effects, including, but not limited to, delayed payments, substantial adjustments to our previously reported operating results and substantial effects on future operating results. If a government review, audit, or investigation uncovers improper or illegal activities, we may be subject to civil and criminal penalties and administrative sanctions, including termination of contracts, repayment of amounts already received under contracts, forfeiture of profits, suspension of payments, fines, and suspension or debarment from doing business with government agencies and departments, any of which could adversely affect our reputation, our revenue, our operating results, and/or the value of our stock. In addition, we could suffer serious harm to our reputation and our stock price could decline if allegations of impropriety are made against us, whether true or not.
Federal government audits have been completed on our incurred contract costs only through 2019 for our NIH-cognizant indirect rates and through 2015 for our USAID-cognizant indirect rates, but audits for costs incurred on work performed since then have not yet been completed. In addition, non-audit reviews may still be conducted on all of our government contracts, even for periods before 2015.
PRIVACY, CYBERSECURITY, TECHNOLOGY, AND DATA PROTECTION RISKS
Our operations face continuous and evolving cybersecurity risks, including disruptions in critical systems, security breaches, and the unauthorized access to our and our clients’ systems, any of which may harm our reputation, impose unexpected remediation costs, and expose us to potential liability.
The continued occurrence of high-profile data breaches of other companies provides evidence of an external environment hostile to information security. In particular, cybersecurity attacks are increasing in number and sophistication for the Company.
We face a constant risk of cybersecurity threats, whether from deliberate attacks or unintentional events, including computer viruses, attacks by computer hackers, malicious code, cyber and phishing attacks, and other electronic security breaches such as unauthorized access to our and our clients’ systems. Any of these could lead to disruptions in critical systems, unauthorized releases of confidential or otherwise protected information, and/or corruption of data. The so-called “insider threat,” the introduction of unauthorized data and changes into systems by employees and contractors, is an increasingly present risk to be managed.
As a federal government contractor, we face a heightened risk of a security breach or disruption with respect to personally identifiable, controlled unclassified information, classified, or otherwise protected data resulting from an attack by computer hackers, foreign governments, and/or cyber terrorists. Improper disclosure of this information could harm our reputation and affect our relationships with business partners, lead to legal exposure, or subject us to liability under laws, rules, and regulations that protect personal or other confidential data, resulting in increased costs or loss of revenue.
We have been the target of cyberattacks in the past and expect to continue to be a target in the future. As these security threats continue to evolve, we may be required to devote additional resources to protect against, prevent, detect, and respond to cybersecurity attacks, system disruptions, and security breaches. Moreover, we also rely in part on third-party software and information technology vendors to run our information systems. Any failure of these third-party systems, which are outside of our control but still impact us, could have similar adverse effects.
Impermissible use, misuse, or an improper disclosure of personal data or confidential information and breaches of, or disruptions to, our information technology systems or those of our third-party providers, could adversely affect our business and could result in liability and harm to our reputation.
We and our vendors process increasingly large amounts of sensitive personal data (collectively, “Personal Data”) concerning our existing and potential employees, clients, client customers, vendors, or other third parties (collectively, “Data Subjects”), as well as handle confidential information on our clients’ behalf. Therefore, we must ensure that we, as well as our vendors, can comply and demonstrate compliance with the various countries’ and U.S. states’ privacy and data protection laws, rules, and regulations (collectively, “Privacy and Data Protection Laws”) in any location where we or our vendors process Data Subjects’ Personal Data. Privacy and Data Protection Laws often vary significantly, and the changes to existing laws and adoption of new, more rigorous laws occurs on an increasing basis. For example, the European Union’s (“E.U.”) General Data Protection Regulation (“GDPR”) requires us to meet stringent requirements regarding (i) our access, use, disclosure, transfer, protection, or other processing of Personal Data; and (ii) the ability of Data Subjects to exercise their related various rights such as to access, correct, or delete their Personal Data. The 2018 California Consumer Privacy Act (“CCPA”), which went into effect January 2020, imposes similar requirements. New privacy laws in California, Colorado, Virginia, and other states took effect in 2023, with others likely to follow. Several privacy bills have also been introduced in Congress. Key markets in the Asia-Pacific region have also recently adopted GDPR-like legislation, including China’s new Personal Information Protection Law. Failure to meet Privacy and Data Protection Law requirements could result in significant civil penalties (including fines up to 4% of annual worldwide revenue under the GDPR) as well as criminal penalties. Privacy and Data Protection Law requirements also confer a private right of action in some countries, including under the GDPR. We may incur substantial costs associated with protecting Personal Data and maintaining compliance with the various Privacy and Data Protection Laws, including restrictions on international data transfers, particularly in light of the increasing scrutiny by supervisory authorities. These costs could adversely affect our results of operations. In addition, any inability, real or perceived, to adequately address privacy and data protection concerns, or to comply with applicable Privacy and Data Protection Laws, policies, industry standards, or contractual obligations could result in additional cost and liability to us, damage our reputation, negatively impact our ability to win new contracts or process Personal Data in certain geolocations, and otherwise adversely affect our business.
Systems and/or service failures could interrupt our operations, leading to reduced revenue and profit.
Any interruption in our operations or any systems failures, including, but not limited to: (i) the inability of our staff to perform their work in a timely fashion, whether caused by limited access to and/or closure of our and/or our clients’ offices or otherwise; (ii) the failure of network, software, and/or hardware systems; and (iii) other interruptions and failures, whether caused by us, a third-party service provider, unauthorized intruders/ hackers, computer viruses, natural disasters, power shortages, terrorist attacks, or otherwise, could cause loss of data and interruptions or delays in our business or that of our clients, or both. In addition, the failure or disruption of mail, communications and/or utilities could cause an interruption or suspension of our operations or otherwise harm our reputation or business. Our property and business interruption insurance may be inadequate to compensate us for all losses that may occur as a result of any system or operational failure or disruption and, as a result, revenue, profits, and operating results could be adversely affected.
We depend on our intellectual property and our failure to protect it could harm our competitive position.
Our success depends in part upon our internally developed technology and models, proprietary processes, and other intellectual property that we incorporate in our products and utilize to provide our services. If we fail to protect our intellectual property, our competitors could market services or products similar to our services and products, which could reduce demand for our offerings. Government clients typically retain a perpetual, worldwide, royalty-free right to use the intellectual property we develop for them in a manner defined within government regulations, including providing it to other government agencies or departments, as well as to our competitors in connection with their performance of government contracts. When necessary, we seek authorization to use intellectual property developed for the government or to secure export authorization. Government clients may grant us the right to commercialize software developed with government funding, but they are not required to do so. If we improperly use intellectual property that was even partially funded by government clients, these clients could seek damages and royalties from us, sanction us, and prevent us from working on future government contracts. Actions could also be taken against us if we improperly use intellectual property belonging to others besides our government clients. In addition, there can be substantial costs associated with protecting our intellectual property, which can also have an adverse effect on our results of operations.
RISKS RELATED TO ACQUISITIONS
When we undertake acquisitions, they may present integration challenges, fail to perform as expected, increase our liabilities, and/or reduce our earnings.
One of our growth strategies is to make strategic acquisitions. When we complete acquisitions, it may be challenging and costly to integrate the acquired businesses due to operating and integrating new accounting systems, differences in the locations of personnel and facilities, differences in corporate cultures, disparate business models, or other reasons. If we are unable to successfully integrate acquired companies, our revenue and operating results could suffer. In addition, we may not successfully achieve the anticipated cost efficiencies and synergies from these acquisitions. Also, our costs for managerial, operational, financial, and administrative systems may increase and be higher than anticipated. During and following the integration of an acquired business, we may experience attrition, including losing key employees and/or clients of the acquired business, which could adversely affect our future revenue and operating results and prevent us from achieving the anticipated benefits of the acquisition.
The businesses we acquire may have liabilities or adverse operating issues, or both, that we either fail to discover through due diligence or underestimate prior to the consummation of the acquisition. These liabilities and/or issues may include the acquired business’ failure to comply with, or other violations of, applicable laws, rules, or regulations or contractual or other obligations or liabilities. As the successor owner, we may be financially responsible for and may suffer harm to our reputation or otherwise be adversely affected by such liabilities and/or issues. An acquired business also may have problems with internal controls over financial reporting, which could in turn cause us to have material deficiencies or material weaknesses in our own internal controls over financial reporting. These and any other costs, liabilities, issues, and/or disruptions associated with any past or future acquisitions, and the related integration, could harm our operating results.
As a result of our acquisitions, we have substantial amounts of goodwill and intangible assets, and changes in business conditions could cause these assets to become impaired, requiring write-downs that would adversely affect our operating results.
All of our acquisitions have involved purchase prices in excess of tangible asset values net of liabilities assumed, resulting in the creation of an increased amount of goodwill and other intangible assets. As of December 31, 2024, goodwill and purchased intangibles accounted for approximately 60% and 4%, respectively, of our total assets. Under U.S. generally accepted accounting principles, we do not amortize goodwill acquired in a purchase business combination. We evaluate the recoverability of recorded goodwill annually, as well as when events or circumstances indicate there may be an impairment or if we have a material change in reporting units. We have to date determined that goodwill has not been impaired; however, future events or changes in circumstances that result in an impairment of goodwill or intangible assets would have a negative impact on our profitability and operating results.
RISKS RELATED TO OUR CORPORATE AND CAPITAL STRUCTURE
Provisions of our charter documents and Delaware law may prevent or deter potential acquisition bids to acquire us and other actions that stockholders may consider favorable, and the market price of our common stock may be lower as a result.
Our charter documents contain the following provisions that could have an anti-takeover effect:
•Our board of directors (the “Board”) is divided into three classes, making it more difficult for stockholders to change the composition of the Board;
•Directors may be removed only for cause;
•Our stockholders are not permitted to call a special meeting of the stockholders;
•All stockholder actions are required to be taken by a vote of the stockholders at an annual or special meeting or by a written consent signed by all of our stockholders;
•Our stockholders are required to comply with advance notice procedures to nominate candidates for election to our Board or to place stockholders’ proposals on the agenda for consideration at stockholder meetings; and
•The approval of the holders of capital stock representing at least two-thirds of our voting power is required to amend our indemnification obligations, director classifications, stockholder proposal requirements, and director candidate nomination requirements set forth in our amended and restated certificate of incorporation and amended and restated bylaws.
In addition, we are subject to the anti-takeover provisions of Section 203 of the Delaware General Corporation Law, which regulates corporate acquisitions. These provisions could discourage potential acquisition proposals; delay or prevent a change-in-control transaction; discourage others from making tender offers for our common stock; and/or prevent changes in our management.
Our outstanding and future indebtedness could reduce our profitability, limit our ability to pursue certain business opportunities, and reduce the value of our stock.
At our discretion, we borrow funds from our credit facility (the “Credit Facility”) under a credit agreement with a group of lenders. As of December 31, 2024, we had an aggregate of $411.7 million of outstanding indebtedness (net of unamortized debt issuance costs) that will mature on May 6, 2027. Subject to the limits contained in the agreements governing our Credit Facility, we may incur additional debt in the future to fund our ongoing operations as well as acquisitions. Our ability to pay interest and repay the principal for our indebtedness from time to time, as well as meet our financial and operating covenant requirements, is dependent upon our ability to, among other things, manage our business operations, and generate sufficient cash flows to service such debt. If we are unable to comply with the terms of our financing agreements or obtain additional required financing, this could ultimately result in a material adverse effect on our financial results and the value of our stock. Among other things, our debt could:
•Make it difficult to obtain additional financing for working capital, capital expenditures, acquisitions, or other general corporate purposes;
•Result in a substantial portion of our cash flows from operations being dedicated to the payment of the principal and interest on our debt, as well as used to make debt service payments;
•Limit our flexibility in planning for, and reacting to, changes in our business and the marketplace;
•Place us at a competitive disadvantage relative to other less leveraged firms; and
•Increase our vulnerability to economic downturns and rises in interest rates.
Should any of these or other unforeseen consequences arise, they could have an adverse effect on our business, financial condition, results of operations, future business opportunities and/or ability to satisfy our obligations under our debt.
We may not pay special or regular dividends on our stock in the future.
The Board has authorized, declared and paid regular dividends each quarter since 2018. The declaration of any future dividends and the establishment of the per share amount, record dates and payment dates for any such future dividends are subject to the discretion of the Board taking into account future earnings, cash flows, net income, dividend yield and other factors. Authorization of dividends by the Board is subject to adherence/compliance with our Credit Facility. The Board may, upon taking into consideration any of the foregoing or other relevant factors, decide not to declare dividends in the future. To the extent that expectations by market participants regarding the potential payment, or amount, of any special or regular dividend prove to be incorrect, the price of our common stock may be materially and negatively affected and investors that bought shares of our common stock based on those expectations may suffer a loss on their investment.
GENERAL RISK FACTORS
Failure to identify, hire, train, and retain talented employees who are committed to our mission and vision could have a negative effect on our reputation and our business.
Our business, which entails the provision of professional services to government and commercial clients, largely depends on our ability to attract and retain qualified employees who are often in demand. Additionally, as our business continues to evolve, as we acquire new businesses, and as we provide a wider range of services, we become increasingly dependent on the capabilities of our employees in order to meet the needs of our diverse client base. If we are unable to recruit and retain a sufficient number of qualified employees that are committed to our mission and vision, we may incur higher costs related to an increase in subcontractors, hiring, training, and retention.
We also rely on key senior members of management. As a result, effective succession planning is important to our long-term success. Failure to ensure effective transfer of knowledge and smooth transitions involving these key employees could hinder our strategic planning and execution as well as impair our ability to effectively serve our clients and maintain and grow our business. Such developments could adversely affect our future revenue and operating results.
Changes to U.S. tax laws may adversely affect our financial condition or results of operation and create the risk that we may need to adjust our accounting for these changes.
We are subject to taxation in the U.S. and in certain foreign jurisdictions in which we operate, and any changes to income tax laws and rules and regulations could adversely affect our business and our results of operations.
Our failure to comply with complex laws, rules, and regulations could cause us to lose business and subject us to a variety of penalties and sanctions.
We must comply with laws, rules, and regulations that affect how we do business with our government clients and impose added costs on our business. Each government client has its own laws, rules, and regulations that affect its contracts. Some of the more significant laws and regulations affecting the formation, administration, and performance of U.S. government contracts include:
•U.S. Federal Acquisition Regulation, as well as Cost Accounting Standards, and agency and department regulations analogous or supplemental to federal regulation;
•U.S. Foreign Corrupt Practices Act;
•U.S. Truthful Cost or Pricing Data Act (formerly known as the Truth in Negotiations Act);
•U.S. Procurement Integrity Act;
•U.S. Civil False Claims Act and the False Statements Act; and
•U.S. laws, rules, and regulations restricting (i) the use and dissemination of information classified for national security purposes, (ii) the exportation of specified products, technologies, and technical data, and (iii) the use and dissemination of sensitive but unclassified data.
Any failure to comply with applicable federal, and/or state and local government laws, rules, and regulations could subject us to civil and criminal penalties and administrative sanctions, including termination of contracts, repayment of amounts already received under contracts, forfeiture of profits, suspension of payments, fines, and suspension or debarment from doing business with federal and/or state and local government agencies and departments, any of which could adversely affect our reputation, our revenue, our operating results, and/or the value of our stock.
In addition, the federal government and other governments with which we do business may change their procurement practices or requirements, or adopt new contracting laws, rules, or regulations that could be costly to satisfy or that could impair our ability to obtain new contracts and reduce our revenue and profit, such as curtailing the use of services firms or increasing the use of firms with a “preferred status,” such as small businesses.
In addition to our U.S. operations, we also have a significant presence in key markets outside the U.S., including offices in the U.K., Belgium, Spain, India, and Canada. Failure to abide by laws, rules, and regulations applicable to us because of our work outside the U.S., such as the U.K. Bribery Act 2010 and the GDPR, could have similar effects to those described above.
Our international operations pose additional risks to our profitability and operating results, including political instability across many of the jurisdictions in which we operate, restrictions on the repatriation of funds, expropriation or nationalization of our assets, and currency exchange rate fluctuations.
We have offices in the U.K., Belgium, Spain, India, and Canada, among others, and expect to continue to have international operations and offices, some of which are in economically developing countries that do not have a well-established business infrastructure. We also perform work in some countries where we do not have a physical office. Some of the countries in which we work have a history of political instability or may expose our employees and subcontractors to physical danger. Expansion into selective new geographic regions requires considerable management and financial resources, the expenditure of which may negatively impact our results, and we may never see any return on our investment.
Our international operations are subject to risks associated with operating in, and selling to and in, countries other than the U.S., that could, directly or indirectly, adversely affect our international and domestic operations and our overall revenue, profit, and operating results including, but not limited to:
•Compliance with the laws, rules, regulations, policies, legal standards, and enforcement mechanisms of the U.S. and the other countries in which we operate, including bribery and anti-corruption laws, economic sanctions, trade restrictions, local tax and income laws, and local labor and employment laws, which are sometimes inconsistent;
•Restrictions on the ability to repatriate profits to the U.S. or otherwise move funds;
•Potential personal injury to personnel who may be exposed to military conflicts and other hostile situations in foreign countries;
•Expropriation and nationalization of our assets or those of our subcontractors, and other inabilities to protect our property rights; and/or
•Difficulties in managing and staffing such operations, including obtaining work permits or visas, identifying qualified local employees, operating according to different local labor laws and regulations, dealing with different local business cultures and practices, and collecting contract receivables.
In addition, because of our work with international clients, certain of our revenues and costs are denominated in other currencies, then translated to U.S. dollars for financial reporting purposes. Our revenues and profits may decrease as a result of currency fluctuations and devaluations and limitations on the conversion of foreign currencies into U.S. dollars and in the conversion between foreign currencies. We may, from time to time, have forward contract agreements (the “hedges”) related to our operations in the U.K. to hedge the remeasurement between the Euro and the pound sterling. We recognize the changes in the fair value of the economic hedges in our results of operations. These hedges may not be successful in reducing our exposure to foreign currency fluctuations and, in fact, the hedges may adversely affect our operating results.
Presently, there is active armed conflict across the territory of Ukraine as a result of a Russian invasion. The war has impacted member states of the E.U. in a variety of ways, including through their provision of weapons, humanitarian supplies, and substantial financial support to Ukraine, and their absorption of millions of Ukrainian refugees. While no E.U. member states have become active participants in the conflict, a number of them have greatly increased their defense preparations and investments, reflecting a wholesale shift in the security environment on the continent. It is not currently foreseen that an immediate diplomatic resolution to the conflict is likely. In such an environment, it is possible that E.U. spending priorities may shift suddenly, that our current programs could be disrupted, and that our future opportunities could be diminished.
Health epidemics, pandemics, and similar outbreaks may have material adverse effects on our business, financial position, results of operations, and/or cash flows.
We face various risks and uncertainties related to health epidemics, pandemics, and similar outbreaks. These risks relate to, among other things, the demand for our services, the availability of our staffing and business partners, a possible slowdown of client decision-making as to our services, a significant deterioration of global supply chains and other business conditions, and a possible reprioritization of spending by our clients.
None.
ITEM 1C. CYBERSECURITY
As discussed in the “Item 1A. Risk Factors – Privacy, Cybersecurity, Technology, and Data Protection Risks,” we face certain ongoing risks from cybersecurity threats and recognize the critical importance of effective cybersecurity risk management in today's interconnected digital landscape. As part of our commitment to safeguarding our operations, sensitive data, and stakeholder trust, we have implemented robust cybersecurity practices and governance.
Cybersecurity Risk Management Program
We regularly assess and identify potential cybersecurity risks that could impact our business, financial condition, or reputation. Our risk assessment process includes:
•Enterprise Risk Management: We maintain an enterprise risk management process that embeds cybersecurity within the risk assessment strategy.
•Threat Landscape Analysis: We monitor emerging threats, vulnerabilities, and attack vectors relevant to our industry and business operations.
•Risk Scenarios: We evaluate potential scenarios, with considerations to both internal and external threats, to understand their potential impact.
•Risk Quantification: We assess the likelihood and potential financial, operational, and reputational impact of identified risks.
Our risk mitigation strategy focuses on measures to prevent, detect, and respond to cybersecurity incidents. The primary components of our risk mitigation strategy include:
•Security Controls: We maintain a comprehensive set of controls aligned with industry standards such as the National Institute of Standards and Technology (“NIST”) and the International Organization of Standards (“ISO”) 27001 to protect our systems, networks, and data.
•Incident Response Plan: We have a well-defined incident response plan that outlines roles, responsibilities, and procedures for handling cybersecurity incidents.
•Employee Training and Awareness: We have training programs to ensure that our employees understand their role in maintaining a secure environment and recognize potential threats.
•Third-Party Risk Assessment and Management: We assess and manage cybersecurity risks associated with our vendors, partners, and service providers.
Our approach to information security follows a defense-in-depth methodology in which security is embedded throughout the system architecture. Technical controls rely on proven technologies, such as network-based intrusion detection systems, next generation firewalls with advanced threat detection, secure server networks, demilitarized zones, and endpoint detection and response capabilities. Security techniques, such as encryption at rest and encryption in transit, are used to incorporate relevant practices. We undergo annual third-party security assessments such as security control compliance reviews, incident response exercises, penetration testing, and red team drills to maintain the effectiveness of the security program.
Our critical corporate information systems are maintained in a commercial grade data center with climate controls, fire suppression, redundant power, and several telecommunication options. The data center is designed to host mission-critical computer systems with fully redundant subsystems and compartmentalized security zones. Our primary data center also undergoes independent assessment on an annual basis. Our computing infrastructures are protected by multiple independent layers of security measures managed by the corporate information security department. Our approach to accessing protected networks is based on the principle of least privilege.
Notwithstanding the vigorous approach we take to cybersecurity, we may not always be successful in preventing or mitigating a cybersecurity incident that could have a material adverse effect on us. To date, we have not identified cybersecurity risks, threats, or incidents that have materially affected us or are reasonably likely to materially affect us, including our operations, business strategy, results of operations, or financial conditions.
Cybersecurity Governance and Oversight
Our Board, directly or through its committees, is responsible for the oversight of the Company's overall enterprise risk management program, which includes cybersecurity risks. Our Audit Committee regularly reviews and evaluates cybersecurity risks and the procedures and policies implemented by management to identify, manage, and mitigate such risks.
Management is responsible for day-to-day assessment and management of cybersecurity risks. Our current Chief Information Officer (the “CIO”), the Deputy Chief Information Office (the “Deputy CIO”) and the Chief Information Security Officer (the “CISO”) have primary oversight of material risks from cybersecurity threats. The CIO has decades of professional experience across various engineering, business and management roles. Our Deputy CIO has over 30 years of experience leading implementation of various IT infrastructure and systems, and our CISO has over 20 years of specific cybersecurity experience and is responsible for maintaining compliance with applicable security requirements. They have a combined tenure of over three decades with the Company in various progressive management roles in information systems and technology and information security. They conduct regular meetings with the Audit Committee and the Board to communicate updates on cybersecurity risks, incidents, and mitigation efforts. The CISO and our security staff provide ongoing support to internal operations and oversight to our systems that offer services to our clients within our enterprise network. Our security staff is also augmented through an industry-recognized security operations center where systems are continuously monitored.
ITEM 2. PROPERTIES
We lease our offices and do not own any real estate. As of December 31, 2024, we leased approximately 208,274 square feet of office space at our corporate headquarters at 1902 Reston Metro Plaza, Reston, Virginia (in the Washington, D.C. metropolitan area) through May 2039 (the “Reston Office”). The Reston Office houses a portion of our operations and almost all of our corporate functions, including most of our staff within executive management, treasury, accounting, legal, human resources, business and corporate development, facilities management, information services, and contracts.
As of December 31, 2024, we had leases in place for approximately 920,239 square feet of office space in more than 70 office locations throughout the U.S. and around the world, with various lease terms expiring over the next fourteen years. We continually review our need for office space, and we believe that our current office space, as well as other future office space we expect to be able to obtain in the lease marketplace, will be sufficient to meet our office space needs.
ITEM 3. LEGAL PROCEEDINGS
We are involved in various legal matters and proceedings arising in the ordinary course of business. While these matters and proceedings cause us to incur costs, including, but not limited to, attorneys’ fees, we currently believe that any ultimate liability arising out of these matters and proceedings will not have a material adverse effect on our financial position, results of operations, or cash flows.
ITEM 4. MINE SAFETY DISCLOSURES
Not applicable.
PART II
ITEM 5. MARKET FOR REGISTRANT’S COMMON EQUITY, RELATED STOCKHOLDER MATTERS AND ISSUER PURCHASES OF EQUITY SECURITIES
Market Information
Our common stock trades on the Nasdaq Global Select Market under the symbol “ICFI.”
Holders
As of February 21, 2025, there were 23 registered holders of record of our common stock. This number is not representative of the number of beneficial holders because many of the shares are held by depositories, brokers, or nominees.
Dividends
We currently expect to continue paying dividends comparable with our historic dividend payments. The declaration and payment of any dividends is at the sole discretion of our Board and is not guaranteed. Our Credit Facility contains certain restrictions related to the payment of cash dividends, requiring us to meet certain covenants prior to and after the declaration of any dividend.
Stock Performance Graph
The following graph compares the cumulative total stockholder return on our common stock from December 31, 2019 through December 31, 2024, with the cumulative total return on (i) the Nasdaq Composite, (ii) the Russell 2000 stock index, and (iii) the S&P 1500 companies having GICS Code 2020 Commercial & Professional Services.
The comparison below assumes an initial investment of $100.00 on December 31, 2019 in which all dividends (if any) are reinvested and all returns are market-cap weighted. The historical information set forth below is not necessarily indicative of future performance.
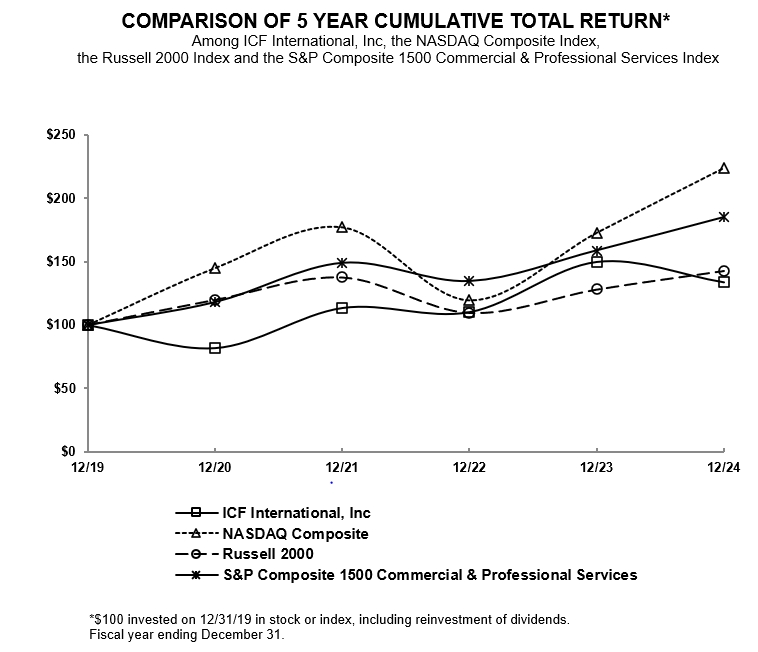
| | | | | | | | | | | | | | | | | | | | | | | | |
| | Year Ended December 31, | |
| | 2019 | | | 2020 | | | 2021 | | | 2022 | | | 2023 | | | 2024 | |
ICF International, Inc. | | $ | 100.00 | | | $ | 81.80 | | | $ | 113.53 | | | $ | 110.27 | | | $ | 149.96 | | | $ | 133.84 | |
Nasdaq Composite | | | 100.00 | | | | 144.92 | | | | 177.06 | | | | 119.45 | | | | 172.77 | | | | 223.87 | |
Russell 2000 Index | | | 100.00 | | | | 119.96 | | | | 137.74 | | | | 109.59 | | | | 128.14 | | | | 142.93 | |
S&P Composite 1500 Commercial & Professional Services | | | 100.00 | | | | 118.06 | | | | 148.95 | | | | 134.63 | | | | 158.80 | | | | 184.99 | |
Recent Sales of Unregistered Securities
None.
Share Repurchase Program
In September 2017, the Board approved a share repurchase program to offset dilution resulting from employee stock compensation. Under the program, purchases can be made from time to time at prevailing market prices in open market purchases or in privately negotiated transactions pursuant to Rules 10b5-1 and 10b-18 under the Exchange Act, and in accordance with applicable insider trading and other securities laws and regulations. The timing and extent to which we repurchase our shares will depend upon market conditions and other corporate considerations, as may be considered in our sole discretion. The purchases will be funded from existing cash balances and/or borrowings and the repurchased shares will be held in treasury. Our Credit Facility permits annual share repurchases of at least $25.0 million provided that the Company is not in default of its covenants, and higher amounts provided that our Consolidated Leverage Ratio, prior to and after giving effect to such repurchases, is 0.50 to 1.00 less than the then-applicable maximum Consolidated Leverage Ratio and subject to a net liquidity of $100.0 million after giving effect to such purchases.
On November 14, 2024, the Board approved an increase to the share repurchase program, including purchases pursuant to Rules 10b5-1 and 10b-18, to a new limit of $300.0 million, inclusive of the prior limit of $200.0 million. During the year ended December 31, 2024, we used $44.4 million to repurchase 327,321 shares under this program at an average price of $135.77 per share. As of December 31, 2024, $149.3 million of authority remained available for share repurchases.
Repurchases of Equity Securities
The following table summarizes the share repurchase activity for the three months ended December 31, 2024 for our share repurchase plan and shares purchased in satisfaction of employee tax withholding obligations related to the settlement of restricted stock units.
| | | | | | | | | | | | | | | | |
Period | | Total
Number of
Shares
Purchased (a) | | | Average
Price Paid
per Share (a) | | | Total Number
of Shares Purchased
as Part of Publicly
Announced Plans
or Programs (b) | | | Approximate Dollar
Value of Shares that
May Yet Be
Purchased
Under the Plans or
Programs (b) | |
October 1 – October 31 | | | — | | | $ | — | | | | — | | | $ | 67,217,536 | |
November 1 – November 30 | | | 75,255 | | | $ | 139.83 | | | | 66,929 | | | $ | 158,114,581 | |
December 1 – December 31 | | | 69,392 | | | $ | 127.10 | | | | 69,392 | | | $ | 149,293,133 | |
Total | | | 144,647 | | | $ | 133.72 | | | | 136,321 | | | | |
a)The total number of shares purchased includes any shares repurchased pursuant to our share repurchase program described further in footnote (b) below, as well as shares purchased from employees to pay required withholding taxes related to the settlement of restricted stock units in accordance with our applicable long-term incentive plan. During the three months ended December 31, 2024, we repurchased 136,321 under the stock repurchase program at an average price of $131.47 and 8,326 shares of common stock from employees in satisfaction of tax withholding obligations at an average price of $170.69 per share.
b)The current share repurchase program authorizes share repurchases in the aggregate up to $300.0 million. Our Credit Facility permits annual share repurchases of at least $25.0 million provided that the Company is not in default of its covenants, and higher amounts provided that our Consolidated Leverage Ratio prior to and after giving effect to such repurchases, is 0.50 to 1.00 less than the then-applicable maximum Consolidated Leverage Ratio and subject to a net liquidity of $100.00 million.
ITEM 6. [RESERVED]
ITEM 7. MANAGEMENT’S DISCUSSION AND ANALYSIS OF FINANCIAL CONDITION AND RESULTS OF OPERATIONS
The following discussion and analysis should be read in conjunction with our consolidated financial statements and related notes included in Item 8.“Financial Statements and Supplementary Data” in this Annual Report on Form 10-K. This discussion and analysis contains forward-looking statements that involve risks, uncertainties, and assumptions, such as statements of our plans, objectives, expectations, and intentions. The cautionary statements made in this Annual Report on Form 10-K should be read as applying to all related forward-looking statements wherever they appear in this Annual Report on Form 10-K. Our actual results could differ materially from those anticipated in the forward-looking statements. Factors that could cause or contribute to our actual results differing materially from those anticipated include those discussed in “Risk Factors” and elsewhere in this Annual Report on Form 10-K. This section of the Form 10-K generally discusses 2024 and 2023 items and year-to-year comparisons between 2024 and 2023. Discussions of 2023 items and year-to-year comparisons between 2023 and 2022 that are not included in this Form 10-K can be found in “Management’s Discussion and Analysis of Financial Condition and Results of Operations” in Part II, Item 7 of our Annual Report on Form 10-K for the fiscal year ended December 31, 2023, which was filed with the SEC on February 28, 2024, and is incorporated by reference into this Management’s Discussion and Analysis of Financial Condition and Results of Operations.
OVERVIEW AND OUTLOOK
We provide professional services and technology-based solutions, including management, technology, and policy consulting and implementation services. We help our clients conceive, develop, implement, and improve solutions that address complex business, natural resource, social, technological, and public safety issues. Our services primarily support clients that operate in the following key markets:
•Energy, Environment, Infrastructure, and Disaster Recovery;
•Health and Social Programs; and
•Security and Other Civilian & Commercial.
We provide services to our diverse client base that deliver value throughout the entire life cycle of a policy, program, project, or initiative. Our primary services include:
•Program Implementation Services;
Our clients utilize our services because we combine diverse institutional knowledge and experience with the deep subject matter expertise of our highly educated staff, which we deploy in multi-disciplinary teams. We have successfully worked with many of our clients for decades, with the result that we have a thorough and nuanced perspective of their objectives and needs. We serve both governmental and commercial clients. Our government clients include those from departments and agencies of the federal government, state and local governments, and international governments. Our government efforts include work performed under subcontract agreements to commercial clients whose ultimate customers are government agencies and departments.
Our largest clients are U.S. federal government departments and agencies. Our federal government clients include every cabinet-level department, most significantly HHS, EPA, and DoS. Federal government clients generated approximately 54%, 55%, and 55% of our revenue in 2024, 2023, and 2022, respectively. State and local government clients generated approximately 16%, 16%, and 15% of our revenue in each of 2024, 2023, and 2022, respectively. International government clients generated approximately 5%, 5%, and 6% of our revenue in 2024, 2023, and 2022, respectively.
We also serve a variety of commercial clients worldwide, including: airlines, airports, electric and gas utilities, health care companies, banks and other financial services companies, transportation, non-profits/associations, manufacturing firms, retail chains, and distribution companies. Our commercial clients, which include clients outside the U.S., generated approximately 25%, 24%, and 24% of our revenue in 2024, 2023, and 2022, respectively. We believe that our domain expertise and the program knowledge developed from our research and analytics, and assessment and advisory engagements further position us to provide a full suite of services.
We report operating results and financial data as a single segment based on the consolidated information used by our chief operating decision-maker in evaluating the financial performance of our business and allocating resources. Our single segment represents our core business: professional services to our broad array of clients. Although we describe our multiple service offerings to clients that operate in three markets to provide a better understanding of the scope and scale of our business, we do not manage our business or allocate our resources based on those service offerings or client markets. Rather, on a project-by-project basis, we assemble the best team from throughout the enterprise to deliver highly customized solutions that are tailored to meet the needs of each client.
We believe that, in the long-term, demand for our services will continue to grow as government, industry, and other stakeholders seek to address critical long-term societal and natural resource issues due to heightened concerns about the environment and use of clean energy and energy efficiency; health promotion, treatment, and cost control; the means by which healthcare can be delivered effectively on a cross-jurisdiction basis; natural disaster relief and rebuild efforts; and ongoing homeland security threats. In the wake of the major hurricanes that devastated communities in Texas, Florida, North Carolina, Louisiana, the U.S. Virgin Islands, and Puerto Rico, and the impact of wildfires in Hawaii, Oregon, and southern California, the affected areas remain in various stages of evacuation, relief, and recovery efforts. We believe our prior and current experience with disaster relief and rebuild efforts, including after hurricanes Katrina and Rita and Superstorm Sandy, and the wildfires in Oregon, put us in a favorable position to continue to provide recovery and housing assistance, and environmental and infrastructure solutions, including disaster mitigation, on behalf of federal departments and agencies, state, territorial, and local jurisdictions, and regional agencies.
We also see significant opportunity to further leverage our digital and client engagement capabilities across our client base. Our future results will depend on the success of our strategy to enhance our client relationships and seek larger engagements that span the entire program life cycle, and to complete and successfully integrate additional strategic acquisitions. We will continue to focus on building scale in our vertical and horizontal domain expertise, developing business with our existing clients as well as new customers, and replicating our business model in selective geographies. In doing so, we will continue to evaluate strategic acquisition opportunities that enhance our subject matter knowledge, broaden our service offerings, gain access to or expand customer relationships, and/or provide scale in specific geographies. Although we continue to see favorable long-term market opportunities, there are certain business challenges facing all government service providers. Administrative and legislative actions by the federal government to address changing priorities or in response to the budget deficit could have a negative impact on our business, which may result in a reduction to our revenue and profit and adversely affect cash flow. Similarly, the very nature of opportunities arising out of disaster recovery means they can involve unusual challenges. Factors such as the overall stress on communities and people affected by disaster recovery situations, political complexities and challenges among involved government agencies, and a higher-than-normal risk of audits and investigations may result in a reduction to our revenue and profit and adversely affect cash flow; however, we believe we are well positioned to provide a broad range of services in support of initiatives that will continue to be priorities to the federal government, as well as to state and local and international governments and commercial clients. We believe that the combination of internally generated funds, available bank borrowings, and cash and cash equivalents on hand will provide the required liquidity and capital resources necessary to fund ongoing operations, potential acquisitions, customary capital expenditures, and other working capital requirements.
Our results of operations and cash flows may vary significantly from quarter to quarter depending on a number of factors, including, but not limited to:
•Progress of contract performance;
•Extraordinary economic events and natural disasters;
•Number of billable days in a quarter;
•Timing of client orders;
•Timing of award fee notices;
•Changes in the scope of contracts;
•Variations in purchasing patterns under our contracts;
•Changes in priorities, especially with the federal government;
•Federal and state and local governments’ and other clients’ spending levels;
•Federal government shutdowns;
•Timing of billings to, and collection of payments from, clients;
•Timing of receipt of invoices from, and payments to, employees and vendors;
•Commencement, completion, and termination of contracts;
•Strategic decisions, such as acquisitions, consolidations, divestments, spin-offs, joint ventures, strategic investments, and changes in business strategy;
•Timing of significant costs and investments (such as bid and proposal costs and the costs involved in planning or making acquisitions);
•Timing of events related to discrete tax items;
•Our contract mix and use of subcontractors or the timing of other direct costs for which we may earn lower contract margin;
•Changes in contract margin performance due to performance risks;
•Additions to, and departures of, staff;
•Changes in staff utilization;
•Paid time off taken by our employees;
•Level and cost of our debt;
•Changes in accounting principles and policies; and/or
•General market and economic conditions.
Because a significant portion of our expenses (such as personnel, facilities, and related costs) are fixed in the short-term, contract performance and variation in the volume of activity, as well as in the number and volume of contracts commenced or completed during any year, may cause significant variations in operating results from year to year. We generally have been able to price our contracts in a manner that accommodates the rates of inflation experienced in recent years, although we cannot ensure that we will be able to do so in the future.
As with other federal contractors, we have experienced business impacts, of varying degrees, from the changing priorities of the Administration that could have an adverse impact on our results and, as these new priorities are implemented, it may be difficult for us to accurately predict the effect they will have on our results.
Subsequent to December 31, 2024, and through February 25, 2025, pursuant to the recent executive orders issued by the Administration or actions by DOGE, the Company received notices for termination-for-convenience of approximately $276 million and for stop-work orders of approximately $99 million. The majority of the termination-for-convenience and stop-work orders notices are associated with our contracts with USAID. The impact of these contract terminations and stop-work orders is not expected to be material, with such contracts contributing approximately 3.3% of our 2024 fiscal year revenue.
Presently, it is unknown if the stop-work orders notices will be lifted and the Company will resume work on these programs, or if the stop-work orders will result in a termination-for-convenience.
BUSINESS COMBINATIONS
A key element of our growth strategy is to pursue acquisitions. During the previous three fiscal years, we completed four acquisitions summarized as follows:
SemanticBits, LLC – In July 2022, we acquired SemanticBits, a premier partner to U.S. federal health agencies for mission-critical digital modernization solutions.
Blanton & Associates – In September 2022, we acquired Blanton & Associates, an environmental consulting, planning, and project management firm.
CMY Solutions, LLC – In May 2023, we acquired CMY, an engineering and automation solutions provider to utilities and organizations.
Applied Energy Group – In December 2024, we acquired AEG, a leading energy technology and advisory services company.
CRITICAL ACCOUNTING ESTIMATES AND POLICIES
Our discussion of financial condition and results of operations is based on our consolidated financial statements prepared in accordance with U.S. generally accepted accounting principles (“U.S. GAAP”). The preparation of these consolidated financial statements requires us to make certain estimates, assumptions, and judgments that affect the reported amounts of assets, liabilities, revenue, and expenses. If any of these estimates, assumptions or judgments prove to be incorrect, our reported results could be materially affected. Actual results may differ significantly from our estimates under different assumptions or conditions.
We believe that the estimates, assumptions, and judgments involved in the accounting practices described below have the greatest potential impact on our financial statements and, therefore, consider them to be critical accounting policies. Significant accounting estimates are more fully described and discussed in “Note 2 - Summary of Significant Accounting Policies” in the “Notes to Consolidated Financial Statements”.
Revenue Recognition
We generate our revenue by primarily providing services and technology-based solutions for clients. We enter into agreements with clients that create enforceable rights and obligations and for which it is probable that we will collect the consideration to which we will be entitled as services and solutions are provided to the client.
Our contracts may be partially funded, often incrementally in annual amounts. We determine the transaction price based on the history of funding, the client’s need for the program, the length of time before funding is available, and the client’s intent and ability to fund and include the unfunded portion of the contract if it is probable that it will be funded based on these criteria.
For contracts with multiple performance obligations and for customized solutions in which the pricing is based on specific negotiations with each client, we use a cost-plus margin approach to estimate the standalone selling price of each performance obligation. We generally recognize revenue over time as services and performance obligations are transferred to the client, based on the extent of progress towards satisfaction of the performance obligation. The selection of the method used to measure progress requires judgment and, among other things, is dependent on the contract type selected by the client during contract negotiation and the nature of the services and solutions to be provided.
For cost-based contracts, we recognize revenue as a single performance obligation based on contract costs incurred, as we become contractually entitled to reimbursement of the contract costs, plus a most likely estimate of award or incentive fees earned on those costs even though final determination of fees earned occurs after the contractually stipulated performance assessment period ends. For the years ended December 31, 2024, 2023, and 2022, revenue from cost-based contracts totaled $231.9 million, $265.1 million, and $263.7 million, respectively.
For performance obligations requiring the delivery of a service for a fixed price, we use the ratio of actual costs incurred to total estimated costs at completion (“EAC”) provided that costs incurred (an input method) represents a reasonable measure of progress towards the satisfaction of a performance obligation, in order to estimate the portion of total revenue earned. Contract costs that are not reflective of our progress toward satisfying a performance obligation are not included in the calculation of the measure of progress. We estimate the EAC by making certain assumptions and judgments such as the level of efforts from internal staff and/or subcontractors and cost of materials needed to complete the tasks. Our cost estimate is based on our prior experience and expertise in delivery of similar services, which allow us to make reasonable assumptions and estimates that are close to actual costs to complete the obligations; however, changes in the scope or complexity of work, availability of materials needed, or performance could cause a change in the EAC. We routinely review EACs for changes that could materially impact our measurement of progress toward completion of the performance obligations and adjust our revenue in the period that the changes occur. When a contract EAC exceeds the contract value, we recognize the loss in the same period of determination. For the years ended December 31, 2024, 2023, and 2022, our revenue from contracts in which we use EACs totaled $479.7 million, $310.1 million, and $287.4 million, respectively.
Our contracts may include variable considerations such as award fees and incentives that may increase or decrease the transaction price. The actual amounts are typically determined and awarded at the end of a performance period and the final awarded amount is based on achieving certain performance metrics, program milestones, or cost targets at the customer’s discretion. We estimate the most likely amount expected to be achieved based on our prior history in providing the services to the customer or, if no history exists, we constrain the variable consideration until the initial determination by the customer.
Fair Value of Acquired Assets from Business Combinations
Our consolidated balance sheets as of December 31, 2024 and 2023 include $88.3 million and $94.9 million, respectively, of net intangible assets that were created through business acquisitions.
We allocate the purchase price of an acquired business to the tangible assets and separately identifiable intangible assets acquired, less liabilities assumed, based on their respective fair values (except for contract assets and contract liabilities after the adoption of Accounting Standards Update 2021-08, Business Combinations: Accounting for Contract Assets and Contract Liabilities from Contracts with Customers). Such fair value assessment requires us to make assumptions, judgments, and estimates such as, but not limited to, future cash flows, revenue growth, customer retention rates, and discount rates based on information that exists at the date of the acquisition which may subsequently change. We recognize any adjustments to the preliminary amounts that are identified during the measurement period which is twelve months or less from the date of the acquisition.
Accounting for Income Taxes
Our provisions for federal, state, and foreign income taxes are calculated from consolidated income based on current tax laws and any changes in tax rates from the rates used previously in determining the deferred tax assets and liabilities from temporary differences between financial statement carrying amounts and amounts on our tax returns.
We recognize deferred tax assets and liabilities for the expected future tax consequences of temporary differences between the financial statement carrying amounts of existing assets and liabilities and their respective tax bases. Deferred tax assets and liabilities are measured using enacted tax rates in effect for the year in which those temporary differences are expected to be recovered or settled. We evaluate our ability to benefit from all deferred tax assets and establish valuation allowances for amounts we believe are not more likely than not to be realized.
We use a more-likely-than-not recognition threshold based on the technical merits of the income tax position taken to evaluate uncertain tax positions. Uncertain tax positions that meet the more-likely-than-not recognition threshold are measured in order to determine the tax benefit recognized in the financial statements.
Recent Accounting Pronouncements
New accounting standards are discussed in “Note 2 - Summary of Significant Accounting Policies” in the “Notes to Consolidated Financial Statements”.
SELECTED KEY METRICS
In order to evaluate operations, we track revenue by key metrics that provide useful information about the nature of our operations. Client markets provide insight into the breadth of our expertise. Client type is an indicator of the diversity of our client base. Revenue by contract mix provides insight in terms of the degree of performance risk that we have assumed. Significant variances in the key metrics tables that are provided below are discussed under the revenue section of the results of operations.
Client markets
The following table shows revenue generated from client markets as a percentage of total revenue for the periods indicated. For each client, we have attributed all revenue from that client to the market we consider to be the client’s primary market, even if a portion of that revenue relates to a different market. Certain minor revenue amounts reported in the prior years have been reclassified within key market categories based on our current view of the client’s primary market in order to increase the comparability of the current year to prior years.
| | | | | | | | | | | | | | | | | | | | | | | |
| Year ended
December 31, 2024 | | | Year ended
December 31, 2023 | | | Year ended
December 31, 2022 | |
(dollars in thousands) | Dollars | | | Percent | | | Dollars | | | Percent | | | Dollars | | | Percent | |
Client Markets: | | | | | | | | | | | | | | | | | |
Energy, environment, infrastructure, and disaster recovery | $ | 929,711 | | | | 46 | % | | $ | 805,942 | | | | 41 | % | | $ | 714,628 | | | | 40 | % |
Health and social programs | | 764,477 | | | | 38 | % | | | 814,789 | | | | 42 | % | | | 704,465 | | | | 40 | % |
Security and other civilian & commercial | | 325,599 | | | | 16 | % | | | 342,507 | | | | 17 | % | | | 360,871 | | | | 20 | % |
Total | $ | 2,019,787 | | | | 100 | % | | $ | 1,963,238 | | | | 100 | % | | $ | 1,779,964 | | | | 100 | % |
Our primary clients within the client markets are the agencies and departments of the federal government and commercial clients. Most of our revenue is from contracts on which we are the prime contractor, which we believe provides us with strong client relationships. In 2024, 2023, and 2022, approximately 87%, 89%, and 91% of our revenue, respectively, was from prime contracts.
Client type
The table below shows our revenue by type of client as a percentage of total revenue for the periods indicated. Certain immaterial revenue amounts in the prior years have been reclassified due to minor adjustments and reclassification within client type.
| | | | | | | | | | | | | | | | | | | | | | | |
| Year ended
December 31, 2024 | | | Year ended
December 31, 2023 | | | Year ended
December 31, 2022 | |
(dollars in thousands) | Dollars | | | Percent | | | Dollars | | | Percent | | | Dollars | | | Percent | |
Client Type: | | | | | | | | | | | | | | | | | |
U.S. federal government | $ | 1,087,349 | | | | 54 | % | | $ | 1,084,047 | | | | 55 | % | | $ | 980,746 | | | | 55 | % |
U.S. state and local government | | 316,083 | | | | 16 | % | | | 309,516 | | | | 16 | % | | | 259,764 | | | | 15 | % |
International government | | 110,798 | | | | 5 | % | | | 103,446 | | | | 5 | % | | | 103,609 | | | | 6 | % |
Government | | 1,514,230 | | | | 75 | % | | | 1,497,009 | | | | 76 | % | | | 1,344,119 | | | | 76 | % |
Commercial | | 505,557 | | | | 25 | % | | | 466,229 | | | | 24 | % | | | 435,845 | | | | 24 | % |
Total | $ | 2,019,787 | | | | 100 | % | | $ | 1,963,238 | | | | 100 | % | | $ | 1,779,964 | | | | 100 | % |
Contract mix
Contract mix varies from year to year due to numerous factors, including our business strategies and the procurement activities of our clients. Unless the context requires otherwise, we use the term “contracts” to refer to contracts and any task orders or delivery orders issued under a contract. There are three main types of contracts: time-and-materials contracts, fixed-price contracts, and cost-based contracts.
The following table shows the approximate percentage of our revenue for each of these types of contracts for the periods indicated. Certain immaterial revenue amounts in the prior years have been reclassified due to minor adjustments and reclassification within contract mix.
| | | | | | | | | | | | | | | | | | | | | | | |
| Year ended
December 31, 2024 | | | Year ended
December 31, 2023 | | | Year ended
December 31, 2022 | |
(dollars in thousands) | Dollars | | | Percent | | | Dollars | | | Percent | | | Dollars | | | Percent | |
Contract Mix: | | | | | | | | | | | | | | | | | |
Time-and-materials | $ | 855,538 | | | | 42 | % | | $ | 811,911 | | | | 41 | % | | $ | 713,693 | | | | 40 | % |
Fixed-price | | 932,351 | | | | 46 | % | | | 886,200 | | | | 45 | % | | | 802,568 | | | | 45 | % |
Cost-based | | 231,898 | | | | 12 | % | | | 265,127 | | | | 14 | % | | | 263,703 | | | | 15 | % |
Total | $ | 2,019,787 | | | | 100 | % | | $ | 1,963,238 | | | | 100 | % | | $ | 1,779,964 | | | | 100 | % |
Payments we received on cost-based contracts with the federal government are provisional payments subject to adjustment upon audit by the government. Contract revenue for subsequent periods has been recorded in amounts that are expected to be realized on final audit and settlement of costs.
RESULTS OF OPERATIONS
The following table sets forth certain items from our consolidated statements of comprehensive income for the years ended December 31, 2024 and 2023 and expresses these items as a percentage of revenue for the periods indicated and the period-over-period rate of change in each of them. Our discussion of the items for the years ended December 31, 2023 and 2022 can be found in our Annual Report on Form 10-K for the year ended December 31, 2023, which was filed with the SEC on February 28, 2024.
Years Ended December 31, 2024 and 2023
(dollars in thousands)
| | | | | | | | | | | | | | | | | | | | | | | | | |
| | Year Ended December 31, | | | Year to Year Change | |
| | 2024 | | | 2023 | | | | 2024 | | | 2023 | | | 2023 to 2024 | |
| | Dollars | | Percentages | | | Dollars | | | Percent | |
Revenue | | $ | 2,019,787 | | | $ | 1,963,238 | | | | | 100.0 | % | | | 100.0 | % | | $ | 56,549 | | | | 2.9 | % |
Direct Costs: | | | | | | | | | | | | | | | | | | | |
Direct labor & related fringe costs | | | 775,239 | | | | 730,322 | | | | | 38.4 | % | | | 37.2 | % | | | 44,917 | | | | 6.2 | % |
Subcontractors & other direct costs | | | 506,777 | | | | 534,696 | | | | | 25.1 | % | | | 27.2 | % | | | (27,919 | ) | | | (5.2 | )% |
Total Direct Costs | | | 1,282,016 | | | | 1,265,018 | | | | | 63.5 | % | | | 64.4 | % | | | 16,998 | | | | 1.3 | % |
Operating Costs and Expenses | | | | | | | | | | | | | | | | | | | |
Indirect and selling expenses | | | 518,453 | | | | 505,162 | | | | | 25.7 | % | | | 25.7 | % | | | 13,291 | | | | 2.6 | % |
Depreciation and amortization | | | 20,484 | | | | 25,277 | | | | | 1.0 | % | | | 1.3 | % | | | (4,793 | ) | | | (19.0 | )% |
Amortization of intangible assets | | | 32,992 | | | | 35,461 | | | | | 1.6 | % | | | 1.8 | % | | | (2,469 | ) | | | (7.0 | )% |
Total Operating Costs and Expenses | | | 571,929 | | | | 565,900 | | | | | 28.3 | % | | | 28.8 | % | | | 6,029 | | | | 1.1 | % |
Operating Income | | | 165,842 | | | | 132,320 | | | | | 8.2 | % | | | 6.7 | % | | | 33,522 | | | | 25.3 | % |
Interest, net | | | (29,590 | ) | | | (39,681 | ) | | | | (1.5 | )% | | | (2.0 | )% | | | 10,091 | | | | (25.4 | )% |
Other income | | | 1,806 | | | | 3,908 | | | | | 0.1 | % | | | 0.2 | % | | | (2,102 | ) | | | (53.8 | )% |
Income Before Income Taxes | | | 138,058 | | | | 96,547 | | | | | 6.8 | % | | | 4.9 | % | | | 41,511 | | | | 43.0 | % |
Provision for Income Taxes | | | 27,888 | | | | 13,935 | | | | | 1.4 | % | | | 0.7 | % | | | 13,953 | | | | 100.1 | % |
Net Income | | $ | 110,170 | | | $ | 82,612 | | | | | 5.5 | % | | | 4.2 | % | | $ | 27,558 | | | | 33.4 | % |
Year ended December 31, 2024 compared to year ended December 31, 2023
Revenue. The growth in revenue of $56.5 million was driven by increases of $39.3 million from commercial clients, $7.4 million from international government clients, $6.6 million from U.S. state and local government clients, and $3.3 million from U.S. federal government clients, respectively.
Revenue from Energy, Environment & Infrastructure and Disaster Recovery client market increased by $123.8 million, or 15.4%, due to:
•Increases of $88.0 million from commercial, $31.8 million from U.S. federal government, $3.4 million from international government, and $0.5 million from U.S. state and local government clients, respectively.
Revenue from Health and Social Programs client market decreased by $50.3 million, or 6.2%, due to:
•Decreases of $48.1 million from U.S. federal government and $13.8 million from commercial clients, respectively, driven by lower pass-throughs from several U.S. federal contracts and our exit from the commercial marketing business during 2023, offset by
•Increases of $6.3 million and $5.4 million from U.S. state and local government and international government clients, respectively.
Revenue from Security and Other Civilian & Commercial client market saw a decrease of $16.9 million, or 4.9%, as a result of:
•Decreases of $34.8 million from commercial clients, driven by the divestiture of the commercial marketing and events business during fiscal year 2023, $1.4 million from international government clients, and $0.3 million from U.S. state and local government clients, respectively, offset by
•An increase of $19.6 million from U.S. federal government clients.
Direct costs. The increase in direct costs was driven by additional direct labor and related fringe benefit costs of $44.9 million which reflected growth in the ongoing business, offset by a decrease of subcontractors and other direct costs of $27.9 million primarily as a result of our exit from the commercial marketing and events business during 2023. For the years ended December 31, 2024 and 2023, direct labor and related fringe benefit costs were 60.5% and 57.7% of total direct costs, respectively, and subcontractors and other direct costs were 39.5% and 42.3% of total direct costs, respectively. The total direct costs as a percentage of revenue was 63.5% for the year ended December 31, 2024 compared to 64.4% for 2023.
Indirect and selling expenses. The increase in indirect and selling expenses was due to additional $8.9 million in indirect labor and related fringe benefit costs and $4.4 million in general and administrative costs. As a percentage of total indirect and selling expenses, indirect labor and associated fringe costs were 71.0% and 71.1%, respectively, and general and administrative costs were 29.0% and 28.9%, respectively, for the years ended December 31, 2024 and 2023. As a percentage of revenue, indirect and selling expenses was 25.7% for the years ended December 31, 2024 and 2023.
Depreciation and amortization. The decrease in depreciation and amortization was due to having fewer capital assets primarily as a result of the divestiture of our U.S. commercial marketing business in 2023.
Amortization of intangible assets. The decrease in amortization of intangible assets was due to having fewer intangible assets primarily as a result of the divestiture of our U.S. commercial marketing business in 2023.
Interest, net. The decrease in interest, net was primarily due to our lower average debt balance of $474.0 million in 2024 compared to $613.5 million in 2023. The average interest rate was 6.6% in 2024 compared to 6.7% in 2023. We utilize floating-to-fixed interest rate swap agreements to hedge the variable interest portion of our debt. Our 2024 interest expense from our debt was reduced by $6.2 million from the swap agreements, compared to $6.9 million in 2023. Our average interest rate inclusive of the impact of the swap agreements was 5.3% for 2024 compared to 5.6% for 2023.
Other income. The decrease in other income was primarily due to higher pre-tax gains from the divestiture of our U.S. commercial marketing and Canadian mobile aggregation businesses in 2023. We recognized $5.7 million of pre-tax gains in 2023 fiscal year compared to $2.0 million in 2024 fiscal year.
Provision for income taxes. The effective income tax rate for the years ended December 31, 2024 and 2023 was 20.2% and 14.4%, respectively. The increase in provision for income taxes in 2024 was primarily due to the favorable impact of one-time tax planning strategies implemented in 2023 which were not repeated in 2024.
NON-GAAP MEASURES
The following tables provide reconciliations of financial measures that are not calculated in accordance with generally accepted accounting principles in the U.S. to their most comparable U.S. GAAP measures (“non-GAAP”). While we believe that these non-GAAP financial measures provide additional information to investors and may be useful in evaluating our financial information, they should be considered supplemental in nature and not as a substitute for financial information prepared in accordance with U.S. GAAP. Other companies may define similarly titled non-GAAP measures differently and, accordingly, care should be exercised in understanding how we define these measures as similarly named measures are unlikely to be comparable across different companies.
EBITDA and Adjusted EBITDA
Earnings before interest, tax, and depreciation and amortization (“EBITDA”) is a measure we use to evaluate operating performance. We believe EBITDA is useful in assessing ongoing trends and, as a result, may provide additional visibility in understanding our operations.
Adjusted EBITDA is EBITDA further adjusted to eliminate the impact of certain items that we do not consider to be indicative of the performance of our ongoing operations. We evaluate these adjustments on an individual basis based on both the quantitative and qualitative aspects of the item, including their size and nature, as well as whether or not we expect them to occur as part of our normal business on a regular basis.
EBITDA and Adjusted EBITDA are not intended to be measures of free cash flow as these measures do not include certain cash requirements such as interest payments, tax payments, capital expenditures, and debt service.
The following table presents a reconciliation of net income to EBITDA and Adjusted EBITDA for the periods indicated.
| | | | | | | | | | | | |
| | Year ended December 31, | |
| | 2024 | | | 2023 | | | 2022 | |
Net income | | $ | 110,170 | |
| $ | 82,612 | |
| $ | 64,243 | |
Interest, net | | | 29,590 | | | | 39,681 | | | | 23,281 | |
Provision for income taxes | | | 27,888 | |
| | 13,935 | |
| | 19,737 | |
Depreciation and amortization | | | 53,476 | |
| | 60,738 | |
| | 49,917 | |
EBITDA | | | 221,124 | |
| | 196,966 | | | | 157,178 | |
Impairment of long-lived assets (1) | | | 3,583 | | | | 7,666 | | | | 8,354 | |
Acquisition and divestiture-related expenses (2) | | | 1,313 | |
| | 4,759 | |
| | 6,441 | |
Severance and other costs related to staff realignment (3) | | | 1,535 | | | | 6,366 | | | | 6,302 | |
Charges for facility consolidations and office closures (4) | | | 464 | | | | 3,187 | | | | 5,034 | |
Expenses related to the transfer to our new corporate headquarters (5) | | | — | | | | — | | | | 8,287 | |
Expenses related to our agreement for the sale of receivables (6) | | | — | | | | — | | | | 240 | |
Pre-tax gain from divestiture of a business (7) | | | (2,013 | ) | | | (5,712 | ) | | | — | |
Total adjustments | | | 4,882 | | | | 16,266 | | | | 34,658 | |
Adjusted EBITDA | | $ | 226,006 | | | $ | 213,232 | | | $ | 191,836 | |
(1)Represents impairment of operating lease right-of-use and leasehold improvement assets associated with exit from certain facilities, and an intangible asset associated with exit of a business.
(2)These are primarily third-party costs related to acquisitions and potential acquisitions, integration of acquisitions, and separation of discontinued businesses or divestitures.
(3)These costs are mainly due to involuntary employee termination benefits for our officers, and employees who have been notified that they will be terminated as part of a business reorganization or exit.
(4)These are exit costs associated with terminated leases or full office closures that we either (i) will continue to pay until the contractual obligations are satisfied but with no economic benefit to us, or (ii) paid upon termination and cease-use of the leased facilities.
(5)These costs represent incremental non-cash lease expense associated with a straight-line rent accrual during the “free rent” period in the lease for our new corporate headquarters in Reston, Virginia. We took possession of the new facility during the fourth quarter of 2021, while also maintaining and incurring lease costs for the former headquarters in Fairfax, Virginia. The transition to the new corporate headquarters was completed in the fourth quarter of 2022.
(6)These costs include legal and structuring fees related to our 2022 Master Receivables Purchase Agreement with MUFG Bank, Ltd. put in place for the sale of our receivables.
(7)Includes pre-tax gain from the divestitures of our U.S. commercial marketing and Canadian mobile text aggregation businesses.
Non-GAAP Diluted Earnings per Share
Non-GAAP diluted earnings per share (“Non-GAAP Diluted EPS”) represents diluted U.S. GAAP earnings per share (“U.S. GAAP Diluted EPS”) excluding the impact of certain items noted above, and the impact of amortization of intangible assets and the related income tax effects. While these adjustments may be recurring and not infrequent or unusual, we do not consider these adjustments to be indicative of the performance of our ongoing operations. We believe that the supplemental adjustments provide additional information to investors.
The following table presents a reconciliation of U.S. GAAP Diluted EPS to Non-GAAP Diluted EPS for the periods indicated:
| | | | | | | | | | | | |
| | Year ended December 31, | |
| | 2024 | | | 2023 | | | 2022 | |
U.S. GAAP Diluted EPS | | $ | 5.82 | | | $ | 4.35 | | | $ | 3.38 | |
Impairment of long-lived assets | | | 0.19 | | | | 0.40 | | | | 0.44 | |
Acquisition and divestiture-related expenses | | | 0.07 | | | | 0.25 | | | | 0.34 | |
Severance and other costs related to staff realignment | | | 0.08 | | | | 0.33 | | | | 0.33 | |
Expenses related to facility consolidations and office closures (1) | | | 0.06 | | | | 0.24 | | | | 0.26 | |
Expenses related to the transfer to our new corporate headquarters | | | — | | | | — | | | | 0.44 | |
Expenses related to our agreement for the sale of receivables | | | — | | | | — | | | | 0.01 | |
Pre-tax gain from divestiture of a business | | | (0.11 | ) | | | (0.30 | ) | | | — | |
Amortization of intangibles | | | 1.74 | | | | 1.87 | | | | 1.49 | |
Income tax effects of the adjustments (2) | | | (0.40 | ) | | | (0.64 | ) | | | (0.92 | ) |
Non-GAAP Diluted EPS | | $ | 7.45 | | | $ | 6.50 | | | $ | 5.77 | |
(1)These are exit costs related to actual office closures (previously included in Adjusted EBITDA) and accelerated depreciation related to fixed assets for planned office closures.
(2)Income tax effects were calculated using the effective tax rate, adjusted for discrete items, if any, of 20.2%, 22.8% and 28.0% for the years ended December 31, 2024, 2023, and 2022, respectively.
LIQUIDITY AND CAPITAL RESOURCES
Liquidity and Borrowing Capacity. Short-term liquidity requirements are created by our use of funds for working capital, capital expenditures, debt service, dividends, and share repurchases. We expect to meet these requirements through a combination of our cash and cash equivalents at hand, cash flow from operations, and borrowings. Our primary source of borrowings is from our Credit Facility, as described in “Note 10 - Long-Term Debt” in the “Notes to Consolidated Financial Statements” in this Annual Report on Form 10-K. As of December 31, 2024, we had $541.1 million of unused borrowing capacity available under the Credit Facility to fund our ongoing operations, future acquisitions, dividend payments, and share repurchase program. Should the need arise, we intend to further increase our borrowing capacity in the future to provide us with adequate working capital to continue our ongoing operations.
There are other conditions, such as the ongoing wars in Ukraine and the instability in the Middle East, that create uncertainty in the global economy, which in turn may impact, among other things, our ability to generate positive cash flows from operations and our ability to successfully execute and fund key initiatives. However, our current belief is that the combination of internally generated funds, available bank borrowings, and cash and cash equivalents on hand will provide the required liquidity and capital resources necessary to fund ongoing operations, customary capital expenditures, quarterly cash dividends, share repurchases, and organic growth. Additionally, we continuously analyze our capital structure to ensure we have capital to fund future strategic acquisitions.
We continuously monitor the state of the financial markets to assess the availability of borrowing capacity under the Credit Facility and the cost of additional capital from both debt and equity markets. At present, we believe we will be able to continue to access these markets at commercially reasonable terms and conditions if we need additional capital in the near term.
Material Cash Requirements from Contractual Obligations. As of December 31, 2024, contractual obligations that require a material use of cash include payments of interest on our Credit Facility and operating lease obligations for facilities and equipment.
At December 31, 2024, our outstanding Credit Facility balance, net of unamortized debt issuance costs, was $411.7 million, which is due in 2027 upon maturity. We borrow funds under the Credit Facility at interest rates based on both the SOFR (i.e., 1-, 3-, or 6-month rates) and a fluctuating Base Rate (see “Note 10 - Long-Term Debt” in the “Notes to Consolidated Financial Statements” in this Annual Report). Assuming that our interest rate on the Credit Facility is the same as on December 31, 2024, we anticipate our interest payments on the debt to be approximately $23.6 million in 2025, $23.6 million in 2026, and $6.2 million in 2027 when our Credit Facility expires. The estimates do not take into account future drawdowns and repayments on the debt or changes in the variable interest rate, and actual interest may be different.
As of December 31, 2024, we have operating leases for facilities and equipment with remaining terms ranging from 1 to 14 years. Our current and long-term operating lease liabilities of $176.7 million at December 31, 2024 represent the present value of the minimum payments required under the non-cancellable leases, and the actual cash payments total $214.9 million. The operating lease payment obligations by year are further discussed in “Note 7 - Leases” in the “Notes to Consolidated Financial Statements”.
As of December 31, 2024, we also have finance leases for equipment and furniture with lease payment obligations through 2029 as discussed in “Note 7 - Leases” in the “Notes to Consolidated Financial Statements”. The current and long-term finance lease liabilities at December 31, 2024 of $13.9 million represent the present value of the minimum payments totaling $15.1 million.
Inflation. Our business and results of operations have not been materially affected by inflation and changing prices during the period presented and we do not expect to be materially affected in the future due to the nature of our business as a provider of professional services with contracts that can be negotiated with new prices.
Dividends. Cash dividends declared in 2024 were as follows:
| | | | | |
Declaration Date | Dividend Per Share | | Record Date | Payment Date |
February 27, 2024 | $ | 0.14 | | March 22, 2024 | April 12, 2024 |
May 2, 2024 | $ | 0.14 | | June 7, 2024 | July 12, 2024 |
August 1, 2024 | $ | 0.14 | | September 6, 2024 | October 11, 2024 |
October 31, 2024 | $ | 0.14 | | December 6, 2024 | January 10, 2025 |
Cash Flows. The following table summarizes our cash flows from the years ended December 31, 2024, 2023, and 2022.
| | | | | | | | | | | | |
| | Year ended December 31, | |
(in thousands) | | 2024 | | | 2023 | | | 2022 | |
Net cash provided by operating activities | | $ | 171,544 | | | $ | 152,383 | | | $ | 162,206 | |
Net cash used in investing activities | | | (74,805 | ) | | | (3,673 | ) | | | (258,844 | ) |
Net cash (used in) provided by financing activities | | | (86,898 | ) | | | (152,588 | ) | | | 90,371 | |
Effect of exchange rate changes on cash, cash equivalents, and restricted cash | | | (473 | ) | | | 359 | | | | (1,198 | ) |
Increase (decrease) in cash, cash equivalents, and restricted cash | | $ | 9,368 | | | $ | (3,519 | ) | | $ | (7,465 | ) |
Cash provided by operating activities for the year ended December 31, 2024 increased by $19.2 million compared to 2023 primarily due to the profitability of our contracts, our ability to invoice our customers and subsequent collection of cash, and the timing of vendor payments.
Cash used in investing activities for the year ended December 31, 2024 increased by $71.1 million compared to 2023 primarily due to our acquisition of AEG during fiscal year 2024.
We used $86.9 million of cash in financing activities during the year ended December 31, 2024 compared to $152.6 million during 2023. The decrease in cash used in financing activities was primarily due to reduced net borrowings from our Credit Facility, partially offset by an increase in share repurchases during fiscal year 2024.
ITEM 7A. QUANTITATIVE AND QUALITATIVE DISCLOSURES ABOUT MARKET RISK
We are exposed to certain financial market risks, the most predominant being fluctuations in interest rates for borrowings under the Credit Facility and foreign exchange rate risk.
Borrowings under the Credit Facility accrue interest at variable rates. We monitor interest rate fluctuations and outlooks as an integral part of our overall risk management program, which recognizes the unpredictability of financial markets and seeks to reduce potentially adverse effects of higher interest rates on our results of operations. As part of this strategy, we use interest rate swap arrangements to hedge a portion of our interest rate risk that effectively converts our variable rate debt to fixed rate debt. We do not use such instruments for speculative or trading purposes. Based on our borrowings under the Credit Facility, a 1% increase in interest rates would have increased interest expense by approximately $4.8 million and would have decreased our annual net income and operating cash flows by a comparable amount. At December 31, 2024, we had seven interest rate swap agreements with a total aggregate notional amount of $275.0 million to hedge against changes in interest rates and offset potential increases in interest expense. See “Note 12 - Derivative Instruments and Hedging Activities” in the “Notes to Consolidated Financial Statements”.
As a result of conducting business in currencies other than the U.S. dollar, we are subject to market risk with respect to adverse fluctuations in currency exchange rates. In general, our currency risk is mitigated largely by matching costs with revenues in a given currency. However, our exposure to fluctuations in other currencies against the U.S. dollar increases as a greater portion of our revenue is generated in currencies other than the U.S. dollar. We may have hedges in place to mitigate our foreign exchange risk related to our operations in Europe; however, given the amount of business conducted outside of the U.S, there is some risk that revenue and profits will be affected by foreign currency exchange rate fluctuations.
We use a sensitivity analysis to assess the impact of movement in foreign currency exchange rates on revenue. During the year ended December 31, 2024, approximately 7% of our revenue was generated from our international operations based on the location to which a contract was awarded. As a result, a 10% increase or decrease in the value of the U.S. dollar against all currencies would have an estimated impact on revenue of approximately 1%, or $15.1 million. Actual gains and losses in the future could differ materially from this analysis based on the timing and amount of both foreign currency exchange rate movements and our actual exposure.
ITEM 8. FINANCIAL STATEMENTS AND SUPPLEMENTARY DATA
The consolidated financial statements of ICF International, Inc. and subsidiaries are provided in Part IV in this Annual Report on Form 10-K.
ITEM 9. CHANGES IN AND DISAGREEMENTS WITH ACCOUNTANTS ON ACCOUNTING AND FINANCIAL DISCLOSURE
None.
ITEM 9A. CONTROLS AND PROCEDURES
Evaluation of Disclosure Controls and Procedures. Based on an evaluation under the supervision and with the participation of the Company’s management, the principal executive officer and principal financial officer have concluded that the Company’s disclosure controls and procedures, as defined in Rules 13a-15(e) and 15d-15(e) under the Exchange Act, were effective as of December 31, 2024 to provide reasonable assurance that information required to be disclosed in reports that it files or submits under the Exchange Act is (i) recorded, processed, summarized and reported within the time periods specified in the SEC rules and forms and (ii) accumulated and communicated to the Company’s management, including its principal executive officer and principal financial officer, as appropriate to allow timely decisions regarding required disclosure.
Management’s Annual Report on Internal Control Over Financial Reporting. The Company’s management is responsible for establishing and maintaining adequate internal control over financial reporting (as such term is defined as of December 31, 2024 in Exchange Act Rules 13a-15(f) and 15d-15(f)). Management conducted an assessment of the effectiveness of the Company’s internal control over financial reporting based on the criteria set forth in the 2013 Internal Control—Integrated Framework issued by the Committee of Sponsoring Organizations of the Treadway Commission (COSO). Based on the assessment, management has concluded that its internal control over financial reporting was effective as of December 31, 2024.
As permitted by the SEC rules, management’s assessment and conclusion on the effectiveness of the Company’s internal controls over financial reporting as of December 31, 2024, excludes an assessment of the internal control over financial reporting of AEG, acquired on December 31, 2024. AEG represents total assets, excluding goodwill and intangibles related to the acquisitions, of 0.7% of the Company’s consolidated total assets as of December 31, 2024. AEG did not contribute any revenue for the year ended December 31, 2024.
The Company’s independent registered public accounting firm, Grant Thornton LLP, has issued an audit report on the Company’s internal control over financial reporting, which appears herein.
The Company’s internal control over financial reporting is designed to provide reasonable assurance regarding the reliability of financial reporting, and the preparation of financial statements for external purposes in accordance with U.S. GAAP. The Company’s internal control over financial reporting includes those policies and procedures that: (i) pertain to the maintenance of records that, in reasonable detail, accurately and fairly reflect the transactions and dispositions of the Company’s assets; (ii) provide reasonable assurance that transactions are recorded as necessary to permit preparation of financial statements in accordance with U.S. GAAP; (iii) that the Company’s receipts and expenditures are being made only in accordance with authorizations of the Company’s management and directors; and (iv) provide reasonable assurance regarding prevention or timely detection of unauthorized acquisition, use, or disposition of the Company’s assets that could have a material effect on the financial statements.
Changes in Internal Control Over Financial Reporting. There were no material changes in our internal control over financial reporting during the last quarter of 2024 which were identified in connection with management’s evaluation required by paragraph (d) of Rules 13a-15 and 15d-15 under the Exchange Act, that have materially affected, or are reasonably likely to materially affect, the Company’s internal control over financial reporting.
Inherent Limitations Over Internal Controls. A control system, no matter how well designed and operated, can provide only reasonable (not absolute) assurance that the objectives of the control system are met. Further, the design of a control system must reflect the fact that there are resource constraints, and the benefits of controls must be considered relative to their costs. Because of the inherent limitations in all control systems, no evaluation of internal controls can provide absolute assurance that all control issues and instances of fraud, if any, have been detected. Because of the inherent limitations in any control system, misstatements due to error or fraud may occur and may not be detected. Also, any evaluations of the effectiveness of controls in future periods are subject to the risk that those internal controls may become inadequate because of changes in business conditions, or that the degree of compliance with the policies or procedures may deteriorate.
ITEM 9B. OTHER INFORMATION
On December 7, 2024, James Morgan, our Chief Operating Officer, adopted a trading plan intended to satisfy the affirmative defense conditions under Rule 10b5-1(c) of the Exchange Act. The plan is for the sale of up to 10,000 shares and terminates on the earlier of the date all shares covered by the plan have been sold and April 1, 2026.
ITEM 9C. DISCLOSURE REGARDING FOREIGN JURISDICTIONS THAT PREVENT INSPECTIONS
None.
PART III
ITEM 10. DIRECTORS, EXECUTIVE OFFICERS AND CORPORATE GOVERNANCE
Insider Information and Securities Trading
We have adopted an Insider Information and Securities Trading Policy and procedures governing the purchase, sale and/or other disposition of our securities by directors, officers, and employees, or by us, that we believe are reasonably designed to promote compliance with insider trading laws, rules, and regulations, and listing standards applicable to us. A copy of our policy is filed with this Annual Report on Form 10-K as Exhibit 19.0.
Other information required by this item will be included in our Proxy Statement for the 2025 Annual Meeting of Stockholders (the “2025 Proxy Statement”) and is incorporated herein by reference.
ITEM 11. EXECUTIVE COMPENSATION
The information required by this item will be included in the 2025 Proxy Statement and is incorporated herein by reference.
ITEM 12. SECURITY OWNERSHIP OF CERTAIN BENEFICIAL OWNERS AND MANAGEMENT AND RELATED STOCKHOLDER MATTERS
The information required by this item will be included in the 2025 Proxy Statement and is incorporated herein by reference.
ITEM 13. CERTAIN RELATIONSHIPS AND RELATED TRANSACTIONS, AND DIRECTOR INDEPENDENCE
The information required by this item will be included in the 2025 Proxy Statement and is incorporated herein by reference.
ITEM 14. PRINCIPAL ACCOUNTANT FEES AND SERVICES
The information required by this item will be included in the 2025 Proxy Statement and is incorporated herein by reference.
PART IV
ITEM 15. EXHIBITS AND FINANCIAL STATEMENT SCHEDULES
| | | |
|
| Page |
Reports of Independent Registered Public Accounting Firm (PCAOB ID Number 248) |
|
| F-1 |
Consolidated Balance Sheets as of December 31, 2024 and 2023 |
|
| F-4 |
Consolidated Statements of Comprehensive Income for the Years Ended December 31, 2024, 2023, and 2022 |
|
| F-5 |
Consolidated Statements of Stockholders’ Equity for the Years Ended December 31, 2024, 2023, and 2022 |
|
| F-6 |
Consolidated Statements of Cash Flows for the Years Ended December 31, 2024, 2023, and 2022 |
|
| F-7 |
Notes to Consolidated Financial Statements |
|
| F-8 |
(2)Financial Statement Schedules
The financial statement schedule of the Registrant and its subsidiaries for fiscal years 2024, 2023, and 2022 required by Item 15(a) (Schedule II, Valuation and Qualifying Accounts) is included in Item 8 of this Annual Report on Form 10-K:
Schedules not filed have been omitted because they are not applicable, are not required or the information required to be set forth therein is included in the financial statements or notes thereto.
The following exhibits are included with this report or incorporated herein by reference:
| | |
Exhibit Number |
| Exhibit |
| | |
3.1 |
| Amended and Restated Certificate of Incorporation (Incorporated by reference to Exhibit 3.1 to the Company's Form 10-Q, filed August 3, 2017). |
| | |
3.2 |
| Amended and Restated Bylaws of ICF International, Inc. (Incorporated by reference to Exhibit 3.1 to the Company’s Form 8-K, filed September 26, 2023). |
| | |
4.1 |
| Specimen common stock certificate (Incorporated by reference to Exhibit 4.1 to the Company’s Form S-1/A (File No. 333-134018), filed September 12, 2006). |
| | |
4.2 |
| See Exhibits 3.1 and 3.2, above, for provisions of the Amended and Restated Certificate of Incorporation and Amended and Restated Bylaws of the Company defining the rights of holders of common stock of the Company. |
| | |
4.3 |
| Description of the Registrant's Securities Registered Pursuant to Section 12 of the Securities Exchange Act of 1934 (Incorporated by reference to Exhibit 4.3 to the Company's Form 10-K, filed February 25, 2022). |
| | |
10.1 |
| 2006 Employee Stock Purchase Plan (Incorporated by reference to Exhibit 10.3 to the Company’s Form S-1 (File No. 333-134018), filed May 11, 2006). + |
| | |
10.2 |
| ICF International, Inc. Nonqualified Deferred Compensation Plan, as amended and restated as of January 1, 2012 (Incorporated by reference to Exhibit 10.2 to the Company’s Form 10-K, filed March 1, 2013). + |
| | |
10.3 |
| ICF International, Inc. Amended and Restated 2018 Omnibus Incentive Plan (Incorporated by reference to Exhibit A to the Company’s Definitive Proxy Statement for the 2023 Annual Meeting of Stockholders, filed April 21, 2023). + |
| | |
10.4 |
| Form of Restricted Stock Unit Award under the 2018 Omnibus Incentive Plan. (Incorporated by reference to Exhibit 10.1 to the Company’s Form 8-K, filed March 13, 2024). + |
| | |
| | |
10.7 | | Form of CEO Performance Share Award Agreement (Incorporated by reference to Exhibit 10.3 to the Company’s Form 8-K, filed March 13, 2024). + |
| | |
10.8 | | Form of General Performance Share Award Agreement under the 2018 Omnibus Incentive Plan. (Incorporated by reference to Exhibit 10.2 to the Company’s Form 8-K, filed March 13, 2024). + |
| | |
10.9 | | Form of Cash-Settled Restricted Stock Unit Award under the 2018 Omnibus Incentive Plan. (Incorporated by reference to Exhibit 10.1 to the Company’s Form 8-K, filed June 1, 2018). + |
| | |
10.10 |
| Restated Severance Protection Agreement between John Wasson and ICF International, Inc. dated October 1, 2019 (Incorporated by reference to Exhibit 10.1 to the Company’s Form 8-K, filed October 1, 2019).+ |
| | |
10.11 |
| Amended Severance Letter Agreement by and between the Company and John Wasson, dated December 12, 2008 (Incorporated by reference to Exhibit 10.4 to the Company’s Form 8-K, filed December 18, 2008). + |
| | |
10.12 |
| Employment Terms by and between the Company and James C. Morgan, dated June 8, 2012 (Incorporated by reference to Exhibit 10.1 to the Company’s Form 10-Q, filed August 6, 2012). + |
| | |
10.13 |
| Severance Benefit/Protection Agreement by and between the Company and James C. Morgan, dated June 8, 2012 (Incorporated by reference to Exhibit 10.2 to the Company’s Form 10-Q, filed August 6, 2012). + |
| | |
10.14 |
| Severance Letter Agreement by and between the Company and Sergio J. Ostria, dated March 6, 2012 (Incorporated by reference to Exhibit 10.18 to the Company’s Form 10-K, filed on March 8, 2016). + |
| | |
10.15 |
| Amended and Restated Credit Agreement, dated May 6, 2022 (Incorporated by reference to Exhibit 10.1 to the Company’s Form 8-K, filed May 6, 2022). |
| | |
10.16 |
| First Amendment to Amended and Restated Credit Agreement, dated May 17, 2023 (Incorporated by reference to Exhibit 10.1 to the Company’s Form 8-K, filed May 19, 2023). |
| | |
10.17 | | Second Amendment to Amended and Restated Credit Agreement, dated November 6, 2023 (Incorporated by reference to Exhibit 10.17 to the Company's Form 10-K dated February 28, 2024). |
| | |
10.18 |
| Lease Agreement between ICF Consulting Group, Inc. and CRS Plaza II, LLC, dated as of October 24, 2019 (Incorporated by reference to Exhibit 10.1 to the Company’s Form 8-K, filed October 30, 2019). |
| | |
10.19 | | Equity Purchase Agreement by and among Creative Systems and Consulting, L.L.C., Project Apple Holdings, LLC, Vanitha Khera, Vishal Khera, and ICF Incorporated, L.L.C., dated December 13, 2021 (Incorporated by reference to Exhibit 10.1 to the Company’s Form 8-K/A, filed December 17, 2021). |
| | |
10.20 | | Equity Purchase Agreement by and among ICF Incorporated, L.L.C., SemanticBits, LLC, Ramprakash Chilukuri, Vinay Kumar, and Ramprakash Chilukuri, as the Sellers’ Representative, dated June 8, 2022 (Incorporated by reference to Exhibit 10.1 to the Company’s Form 8-K/A, filed July 1, 2022). |
| | |
10.21 | | Separation Agreement and Release between Rodney Mark Lee, Jr. and the Company (Incorporated by reference to Exhibit 10.1 to the Company's Form 8-K, filed December 4, 2023). |
| | |
19.0 | | Insider Trading Policy. * |
| | |
21.0 |
| Subsidiaries of the Registrant.* |
| | |
23.1 |
| Consent of Grant Thornton LLP.* |
| | |
31.1 |
| Certificate of the Principal Executive Officer Pursuant to Exchange Act Rules 13a-14(a) and 15d-14(a).* |
| | |
31.2 |
| Certificate of the Principal Financial Officer Pursuant to Exchange Act Rules 13a-14(a) and 15d-14(a).* |
| | |
32.1 |
| Certifications of Principal Executive Officer Pursuant to Section 906 of the Sarbanes-Oxley Act of 2002.* |
| | |
32.2 | | Certifications of Principal Financial Officer Pursuant to Section 906 of the Sarbanes-Oxley Act of 2002.* |
| | |
| | |
97.0 | | Compensation Recovery Policy (Incorporated by reference to Exhibit 97.0 to the Company's Form 10-K, filed February 28, 2024). |
| | |
101 |
| The following materials from the ICF International, Inc. Annual Report on Form 10-K for the year ended December 31, 2024 formatted in Inline eXtensible Business Reporting Language (iXBRL): (i) Consolidated Balance Sheets, (ii) Consolidated Statements of Comprehensive Income, (iii) Consolidated Statements of Stockholders’ Equity, (iv) Consolidated Statements of Cash Flows and (v) Notes to Consolidated Financial Statements. * |
| | |
104 | | The cover page from the Company’s Annual Report on Form 10-K for the year ended December 31, 2024, formatted in Inline XBRL |
* Submitted electronically herewith.
+ Indicates a management contract or compensatory plan or arrangement required to be filed as an exhibit.
ITEM 16. FORM 10-K SUMMARY
None.
SIGNATURES
Pursuant to the requirements of Section 13 or 15(d) of the Securities Exchange Act of 1934, the registrant has duly caused this report to be signed on its behalf by the undersigned, thereunto duly authorized.
| | | | | |
February 28, 2025 |
|
| ICF INTERNATIONAL, INC. |
|
|
| By: |
| /s/ JOHN WASSON |
|
|
|
|
| John Wasson |
|
|
|
|
| Chair, President, and Chief Executive Officer |
Pursuant to the requirements of the Securities Exchange Act of 1934, this report has been signed below by the following persons on behalf of the registrant and in the capacities and on the dates indicated.
| | | | |
Signature |
| Title |
| Date |
| | | | |
/s/ JOHN WASSON |
| Chair, President, Chief Executive Officer, and Director
(Principal Executive Officer) |
| February 28, 2025 |
John Wasson | | |
| | |
/s/ BARRY BROADUS | Chief Financial Officer (Principal Financial Officer) | February 28, 2025 |
Barry Broadus |
| | |
/s/ RANJIT CHADHA |
| Principal Accounting Officer |
| February 28, 2025 |
Ranjit Chadha |
| |
|
/s/ MARILYN CROUTHER |
| Director |
| February 28, 2025 |
Marilyn Crouther |
| |
|
/s/ SCOTT SALMIRS |
| Director |
| February 28, 2025 |
Scott Salmirs |
| |
|
/s/ Dr. SRIKANT M. DATAR |
| Director |
| February 28, 2025 |
Dr. Srikant M. Datar |
| |
|
/s/ MICHAEL J. VAN HANDEL | | Director | | February 28, 2025 |
Michael Van Handel |
| | | | |
/s/ RANDALL MEHL |
| Director |
| February 28, 2025 |
Randall Mehl |
|
|
|
/s/ Dr. MICHELLE A. WILLIAMS | Director | February 28, 2025 |
Dr. Michelle A. Williams |
|
| | |
REPORT OF INDEPENDENT REGISTERED PUBLIC ACCOUNTING FIRM
Board of Directors and Stockholders
ICF International, Inc.
Opinion on the financial statements
We have audited the accompanying consolidated balance sheets of ICF International, Inc. (a Delaware corporation) and subsidiaries (the “Company”) as of December 31, 2024 and 2023, the related consolidated statements of comprehensive income, stockholders’ equity, and cash flows for each of the three years in the period ended December 31, 2024, and the related notes and financial statement schedule included under Item 15(2) (collectively referred to as the “consolidated financial statements”). In our opinion, the consolidated financial statements present fairly, in all material respects, the financial position of the Company as of December 31, 2024 and 2023, and the results of its operations and its cash flows for each of the three years in the period ended December 31, 2024, in conformity with accounting principles generally accepted in the United States of America.
We also have audited, in accordance with the standards of the Public Company Accounting Oversight Board (United States) (“PCAOB”), the Company’s internal control over financial reporting as of December 31, 2024, based on criteria established in the 2013 Internal Control—Integrated Framework issued by the Committee of Sponsoring Organizations of the Treadway Commission (“COSO”), and our report dated February 28, 2025 expressed an unqualified opinion.
Basis for opinion
These consolidated financial statements are the responsibility of the Company’s management. Our responsibility is to express an opinion on the Company’s consolidated financial statements based on our audits. We are a public accounting firm registered with the PCAOB and are required to be independent with respect to the Company in accordance with the U.S. federal securities laws and the applicable rules and regulations of the Securities and Exchange Commission and the PCAOB.
We conducted our audits in accordance with the standards of the PCAOB. Those standards require that we plan and perform the audit to obtain reasonable assurance about whether the financial statements are free of material misstatement, whether due to error or fraud. Our audits included performing procedures to assess the risks of material misstatement of the financial statements, whether due to error or fraud, and performing procedures that respond to those risks. Such procedures included examining, on a test basis, evidence regarding the amounts and disclosures in the financial statements. Our audits also included evaluating the accounting principles used and significant estimates made by management, as well as evaluating the overall presentation of the financial statements. We believe that our audits provide a reasonable basis for our opinion.
Critical audit matter
The critical audit matter communicated below is a matter arising from the current period audit of the financial statements that was communicated or required to be communicated to the audit committee and that: (1) relates to accounts or disclosures that are material to the financial statements and (2) involved our especially challenging, subjective, or complex judgments. The communication of critical audit matters does not alter in any way our opinion on the financial statements, taken as a whole, and we are not, by communicating the critical audit matter below, providing separate opinion on the critical audit matter or on the accounts or disclosures to which it relates.
Revenue Recognition – estimates-at-completion
As described further in Note 2 to the consolidated financial statements, the Company recognizes revenue over time using a cost-input method on certain contracts in which costs incurred represents a reasonable measure of progress toward satisfaction of a performance obligation and transfer of control to a customer. Under the cost input method, revenue is recognized based on the proportion of total costs incurred to total estimated costs-at-completion (“EAC”). A performance obligation’s EAC includes all direct costs such as level of effort from internal staff and/or subcontractors and costs of materials, if any, needed to complete the tasks. The accounting for these contracts involves judgment, particularly as it relates to the process of estimating total costs to satisfy performance obligations. We identified the estimate of total costs to satisfy the performance obligation for contracts with revenue recognized using the cost-input method as a critical audit matter.
The principal considerations for our determination that the total estimated costs to complete for such contracts is a critical audit matter are the significant management judgments involved in the initial creation and subsequent updates to the Company’s EAC and related estimated profit to be recognized, if any, which required challenging and subjective auditor judgment in the execution of our procedures.
Our audit procedures in response to the matter included the following, among others:
•Testing the design and operating effectiveness of controls related to management’s review of estimate-at-completion analyses and the significant assumptions underlying the estimated total costs to complete.
•Testing management’s process for developing, revising, and calculating EAC, evaluating key inputs and assumptions by comparing them to relevant evidence, including contract documents, rate of cost incurred to date, subcontractor agreements, customer correspondence, documentation related to contractual milestones or other documentation, relevant to estimated costs to be incurred.
•Performing a lookback analysis of certain contracts completed during the year ended December 31, 2024 and comparing the EAC to the estimate of costs throughout the contract life cycle to assess the Company’s ability to develop reasonable estimates.
/s/ GRANT THORNTON LLP
We have served as the Company’s auditor since 2000.
Arlington, Virginia
February 28, 2025
REPORT OF INDEPENDENT REGISTERED PUBLIC ACCOUNTING FIRM
Board of Directors and Stockholders
ICF International, Inc.
Opinion on internal control over financial reporting
We have audited the internal control over financial reporting of ICF International, Inc. (a Delaware corporation) and subsidiaries (the “Company”) as of December 31, 2024, based on criteria established in the 2013 Internal Control—Integrated Framework issued by the Committee of Sponsoring Organizations of the Treadway Commission (“COSO”). In our opinion, the Company maintained, in all material respects, effective internal control over financial reporting as of December 31, 2024, based on criteria established in the 2013 Internal Control—Integrated Framework issued by COSO.
We also have audited, in accordance with the standards of the Public Company Accounting Oversight Board (United States) (“PCAOB”), the consolidated financial statements of the Company as of and for the year ended December 31, 2024, and our report dated February 28, 2025 expressed an unqualified opinion on those financial statements.
Basis for opinion
The Company’s management is responsible for maintaining effective internal control over financial reporting and for its assessment of the effectiveness of internal control over financial reporting, included in the accompanying “Management’s Annual Report on Internal Control Over Financial Reporting” (“Management’s Report”). Our responsibility is to express an opinion on the Company’s internal control over financial reporting based on our audit. We are a public accounting firm registered with the PCAOB and are required to be independent with respect to the Company in accordance with the U.S. federal securities laws and the applicable rules and regulations of the Securities and Exchange Commission and the PCAOB.
We conducted our audit in accordance with the standards of the PCAOB. Those standards require that we plan and perform the audit to obtain reasonable assurance about whether effective internal control over financial reporting was maintained in all material respects. Our audit included obtaining an understanding of internal control over financial reporting, assessing the risk that a material weakness exists, testing and evaluating the design and operating effectiveness of internal control based on the assessed risk, and performing such other procedures as we considered necessary in the circumstances. We believe that our audit provides a reasonable basis for our opinion.
Our audit of, and opinion on, the Company’s internal control over financial reporting does not include the internal control over financial reporting of Applied Energy Group, Inc., a wholly-owned subsidiary, whose financial statements reflect total assets constituting 0.7 percent, of the related consolidated financial statement amounts as of and for the year ended December 31, 2024. As indicated in Management’s Report, Applied Energy Group, Inc. was acquired during 2024. Management’s assertion on the effectiveness of the Company’s internal control over financial reporting excluded internal control over financial reporting of Applied Energy Group, Inc.
Definition and limitations of internal control over financial reporting
A company’s internal control over financial reporting is a process designed to provide reasonable assurance regarding the reliability of financial reporting and the preparation of financial statements for external purposes in accordance with generally accepted accounting principles. A company’s internal control over financial reporting includes those policies and procedures that (1) pertain to the maintenance of records that, in reasonable detail, accurately and fairly reflect the transactions and dispositions of the assets of the company; (2) provide reasonable assurance that transactions are recorded as necessary to permit preparation of financial statements in accordance with generally accepted accounting principles, and that receipts and expenditures of the company are being made only in accordance with authorizations of management and directors of the company; and (3) provide reasonable assurance regarding prevention or timely detection of unauthorized acquisition, use, or disposition of the company’s assets that could have a material effect on the financial statements.
Because of its inherent limitations, internal control over financial reporting may not prevent or detect misstatements. Also, projections of any evaluation of effectiveness to future periods are subject to the risk that controls may become inadequate because of changes in conditions, or that the degree of compliance with the policies or procedures may deteriorate.
/s/ GRANT THORNTON LLP
Arlington, Virginia
February 28, 2025
ICF INTERNATIONAL, INC. AND SUBSIDIARIES
CONSOLIDATED BALANCE SHEETS
| | | | | | | | |
(in thousands, except share amounts) | | December 31, 2024 | | | December 31, 2023 | |
ASSETS | | | | | | |
Current Assets: | | | | | | |
Cash and cash equivalents | | $ | 4,960 | | | $ | 6,361 | |
Restricted cash | | | 13,857 | | | | 3,088 | |
Contract receivables, net | | | 256,923 | | | | 205,484 | |
Contract assets | | | 188,941 | | | | 201,832 | |
Prepaid expenses and other assets | | | 21,133 | | | | 28,055 | |
Income tax receivable | | | 6,260 | | | | 2,337 | |
Total Current Assets | | | 492,074 | | | | 447,157 | |
Property and Equipment, net | | | 68,118 | | | | 75,948 | |
Other Assets: | | | | | | |
Goodwill | | | 1,248,855 | | | | 1,219,476 | |
Other intangible assets, net | | | 88,262 | | | | 94,904 | |
Operating lease - right-of-use assets | | | 115,531 | | | | 132,807 | |
Deferred tax assets | | | 1,603 | | | | — | |
Other assets | | | 51,910 | | | | 41,480 | |
Total Assets | | $ | 2,066,353 | | | $ | 2,011,772 | |
| | | | | | |
LIABILITIES AND STOCKHOLDERS’ EQUITY | | | | | | |
Current Liabilities: | | | | | | |
Current portion of long-term debt | | $ | — | | | $ | 26,000 | |
Accounts payable | | | 159,522 | | | | 134,503 | |
Contract liabilities | | | 24,580 | | | | 21,997 | |
Operating lease liabilities | | | 20,721 | | | | 20,409 | |
Finance lease liabilities | | | 2,612 | | | | 2,522 | |
Accrued salaries and benefits | | | 105,773 | | | | 88,021 | |
Accrued subcontractors and other direct costs | | | 49,271 | | | | 45,645 | |
Accrued expenses and other current liabilities | | | 86,701 | | | | 79,129 | |
Total Current Liabilities | | | 449,180 | | | | 418,226 | |
Long-term Liabilities: | | | | | | |
Long-term debt | | | 411,743 | | | | 404,407 | |
Operating lease liabilities - non-current | | | 155,935 | | | | 175,460 | |
Finance lease liabilities - non-current | | | 11,261 | | | | 13,874 | |
Deferred income taxes | | | — | | | | 26,175 | |
Other long-term liabilities | | | 55,775 | | | | 56,045 | |
Total Liabilities | | | 1,083,894 | | | | 1,094,187 | |
| | | | | | |
Commitments and Contingencies (Note 19) | | | | | | |
| | | | | | |
Stockholders’ Equity: | | | | | | |
Preferred stock, par value $.001 per share; 5,000,000 shares
authorized; none issued | | | — | | | | — | |
Common stock, $.001 par value; 70,000,000 shares authorized; 24,186,962 and 23,982,132 shares issued; and 18,666,290 and 18,845,521 shares outstanding at December 31, 2024 and 2023, respectively | | | 24 | | | | 24 | |
Additional paid-in capital | | | 443,463 | | | | 421,502 | |
Retained earnings | | | 874,772 | | | | 775,099 | |
Treasury stock, 5,520,672 and 5,136,611 shares at December 31, 2024 and 2023, respectively | | | (320,054 | ) | | | (267,155 | ) |
Accumulated other comprehensive loss | | | (15,746 | ) | | | (11,885 | ) |
Total Stockholders’ Equity | | | 982,459 | | | | 917,585 | |
Total Liabilities and Stockholders’ Equity | | $ | 2,066,353 | | | $ | 2,011,772 | |
The accompanying notes are an integral part of these statements.
ICF International, Inc. and Subsidiaries
Consolidated Statements of Comprehensive Income
| | | | | | | | | | | | |
| | Years ended December 31, | |
(in thousands, except per share amounts) | | 2024 | | | 2023 | | | 2022 | |
Revenue | | $ | 2,019,787 | | | $ | 1,963,238 | | | $ | 1,779,964 | |
Direct costs | | | 1,282,016 | | | | 1,265,018 | | | | 1,134,422 | |
Operating costs and expenses: | | | | | | | | | |
Indirect and selling expenses | | | 518,453 | | | | 505,162 | | | | 486,863 | |
Depreciation and amortization | | | 20,484 | | | | 25,277 | | | | 21,482 | |
Amortization of intangible assets | | | 32,992 | | | | 35,461 | | | | 28,435 | |
Total operating costs and expenses | | | 571,929 | | | | 565,900 | | | | 536,780 | |
Operating income | | | 165,842 | | | | 132,320 | | | | 108,762 | |
Interest, net | | | (29,590 | ) | | | (39,681 | ) | | | (23,281 | ) |
Other income (expense) | | | 1,806 | | | | 3,908 | | | | (1,501 | ) |
Income before income taxes | | | 138,058 | | | | 96,547 | | | | 83,980 | |
Provision for income taxes | | | 27,888 | | | | 13,935 | | | | 19,737 | |
Net income | | $ | 110,170 | | | $ | 82,612 | | | $ | 64,243 | |
| | | | | | | | | |
Earnings per share: | | | | | | | | | |
Basic | | $ | 5.88 | | | $ | 4.39 | | | $ | 3.41 | |
Diluted | | $ | 5.82 | | | $ | 4.35 | | | $ | 3.38 | |
| | | | | | | | | |
Weighted-average common shares outstanding: | | | | | | | | | |
Basic | | | 18,747 | | | | 18,802 | | | | 18,818 | |
Diluted | | | 18,925 | | | | 18,994 | | | | 19,033 | |
| | | | | | | | | |
Cash dividends declared per common share | | | 0.56 | | | | 0.56 | | | | 0.56 | |
| | | | | | | | | |
Other comprehensive (loss) income, net of tax | | | (3,861 | ) | | | (3,752 | ) | | | 2,902 | |
Comprehensive income, net of tax | | $ | 106,309 | | | $ | 78,860 | | | $ | 67,145 | |
The accompanying notes are an integral part of these statements.
ICF International, Inc. and Subsidiaries
Consolidated Statements of Stockholders’ Equity
| | | | | | | | | | | | | | | | | | | | | | | | | | | | | | | | |
| | Common Stock | | | Additional
Paid-in | | | Retained | | | Treasury Stock | | | Accumulated
Other
Comprehensive | | | | |
(in thousands) | | Shares | | | Amount | | | Capital | | | Earnings | | | Shares | | | Amount | | | Loss | | | Total | |
Balance at January 1, 2022 | | | 18,876 | | | $ | 23 | | | $ | 384,984 | | | $ | 649,298 | | | | 4,659 | | | $ | (219,800 | ) | | $ | (11,035 | ) | | $ | 803,470 | |
Net income | | | — | | | | — | | | | — | | | | 64,243 | | | | — | | | | — | | | | — | | | | 64,243 | |
Other comprehensive income | | | — | | | | — | | | | — | | | | — | | | | — | | | | — | | | | 2,902 | | | | 2,902 | |
Equity compensation | | | — | | | | — | | | | 13,171 | | | | — | | | | — | | | | — | | | | — | | | | 13,171 | |
Exercise of stock options | | | 19 | | | | — | | | | 602 | | | | — | | | | — | | | | — | | | | — | | | | 602 | |
Issuance of shares pursuant to employee stock purchase plan and vesting of restricted stock units | | | 235 | | | | — | | | | 3,200 | | | | — | | | | — | | | | — | | | | — | | | | 3,200 | |
Net payments for stock buybacks | | | (247 | ) | | | — | | | | — | | | | — | | | | 247 | | | | (23,866 | ) | | | — | | | | (23,866 | ) |
Dividends declared | | | — | | | | — | | | | — | | | | (10,511 | ) | | | — | | | | — | | | | — | | | | (10,511 | ) |
Balance at December 31, 2022 | | | 18,883 | | | $ | 23 | | | $ | 401,957 | | | $ | 703,030 | | | | 4,906 | | | $ | (243,666 | ) | | $ | (8,133 | ) | | $ | 853,211 | |
Net income | | | — | | | | — | | | | — | | | | 82,612 | | | | — | | | | — | | | | — | | | | 82,612 | |
Other comprehensive income | | | — | | | | — | | | | — | | | | — | | | | — | | | | — | | | | (3,752 | ) | | | (3,752 | ) |
Equity compensation | | | — | | | | — | | | | 14,861 | | | | — | | | | — | | | | — | | | | — | | | | 14,861 | |
Exercise of stock options | | | 8 | | | | — | | | | 279 | | | | — | | | | — | | | | — | | | | — | | | | 279 | |
Issuance of shares pursuant to employee stock purchase plan and vesting of restricted stock units | | | 185 | | | | 1 | | | | 4,405 | | | | — | | | | — | | | | — | | | | — | | | | 4,406 | |
Net payments for stock buybacks | | | (230 | ) | | | — | | | | — | | | | — | | | | 230 | | | | (23,489 | ) | | | — | | | | (23,489 | ) |
Dividends declared | | | — | | | | — | | | | — | | | | (10,543 | ) | | | — | | | | — | | | | — | | | | (10,543 | ) |
Balance at December 31, 2023 | | | 18,846 | | | $ | 24 | | | $ | 421,502 | | | $ | 775,099 | | | | 5,136 | | | $ | (267,155 | ) | | $ | (11,885 | ) | | $ | 917,585 | |
Net income | | | — | | | | — | | | | — | | | | 110,170 | | | | — | | | | — | | | | — | | | | 110,170 | |
Other comprehensive loss | | | — | | | | — | | | | — | | | | — | | | | — | | | | — | | | | (3,861 | ) | | | (3,861 | ) |
Equity compensation | | | — | | | | — | | | | 16,722 | | | | — | | | | — | | | | — | | | | — | | | | 16,722 | |
Exercise of stock options | | | 2 | | | | — | | | | 107 | | | | — | | | | — | | | | — | | | | — | | | | 107 | |
Issuance of shares pursuant to employee stock purchase plan and vesting of restricted stock units | | | 202 | | | | — | | | | 5,132 | | | | — | | | | — | | | | — | | | | — | | | | 5,132 | |
Net payments for stock buybacks | | | (384 | ) | | | — | | | | — | | | | — | | | | 384 | | | | (52,899 | ) | | | — | | | | (52,899 | ) |
Dividends declared | | | — | | | | — | | | | — | | | | (10,497 | ) | | | — | | | | — | | | | — | | | | (10,497 | ) |
Balance at December 31, 2024 | | | 18,666 | | | $ | 24 | | | $ | 443,463 | | | $ | 874,772 | | | | 5,520 | | | $ | (320,054 | ) | | $ | (15,746 | ) | | $ | 982,459 | |
The accompanying notes are an integral part of these statements.
ICF International, Inc. and Subsidiaries
Consolidated Statements of Cash Flows
| | | | | | | | | | | | |
| | Years ended December 31, | |
(in thousands) | | 2024 | | | 2023 | | | 2022 | |
Cash Flows from Operating Activities | | | | | | | | | |
Net income | | $ | 110,170 | | | $ | 82,612 | | | $ | 64,243 | |
Adjustments to reconcile net income to net cash provided by operating activities: | | | | | | | | | |
Provision for credit losses | | | 1,673 | | | | 1,164 | | | | 248 | |
Deferred income taxes and unrecognized income tax benefits | | | (24,336 | ) | | | (17,634 | ) | | | 7,428 | |
Non-cash equity compensation | | | 16,722 | | | | 14,861 | | | | 13,171 | |
Depreciation and amortization | | | 53,476 | | | | 60,738 | | | | 49,917 | |
Gain on divestiture of a business | | | (2,009 | ) | | | (7,590 | ) | | | — | |
Other operating, net | | | 4,647 | | | | 8,294 | | | | 10,683 | |
Changes in operating assets and liabilities, net of the effect of acquisitions: | | | | | | | | | |
Net contract assets and liabilities | | | 14,668 | | | | (38,422 | ) | | | (41,634 | ) |
Contract receivables | | | (49,538 | ) | | | 20,939 | | | | 19,732 | |
Prepaid expenses and other assets | | | 3,496 | | | | 18,579 | | | | (20,737 | ) |
Operating lease assets and liabilities, net | | | (4,755 | ) | | | 3,544 | | | | (1,466 | ) |
Accounts payable | | | 24,152 | | | | (1,489 | ) | | | 30,003 | |
Accrued salaries and benefits | | | 18,048 | | | | 2,175 | | | | (3,337 | ) |
Accrued subcontractors and other direct costs | | | 4,353 | | | | (269 | ) | | | 6,965 | |
Accrued expenses and other current liabilities | | | 8,361 | | | | (4,757 | ) | | | 24,742 | |
Income tax receivable and payable | | | (5,391 | ) | | | 9,277 | | | | (1,526 | ) |
Other liabilities | | | (2,193 | ) | | | 361 | | | | 3,774 | |
Net Cash Provided by Operating Activities | | | 171,544 | | | | 152,383 | | | | 162,206 | |
| | | | | | | | | |
Cash Flows from Investing Activities | | | | | | | | | |
Payments for purchase of property and equipment and capitalized software | | | (21,430 | ) | | | (22,337 | ) | | | (24,475 | ) |
Payments for business acquisitions, net of cash acquired | | | (55,007 | ) | | | (32,664 | ) | | | (237,280 | ) |
Proceeds from working capital adjustments related to prior business acquisition | | | — | | | | — | | | | 2,911 | |
Proceeds from divestiture of a business | | | 1,985 | | | | 51,328 | | | | — | |
Other investing, net | | | (353 | ) | | | — | | | | — | |
Net Cash Used in Investing Activities | | | (74,805 | ) | | | (3,673 | ) | | | (258,844 | ) |
| | | | | | | | | |
Cash Flows from Financing Activities | | | | | | | | | |
Advances from working capital facilities | | | 1,227,926 | | | | 1,245,198 | | | | 1,583,936 | |
Payments on working capital facilities | | | (1,247,791 | ) | | | (1,372,474 | ) | | | (1,446,125 | ) |
Proceeds from other short-term borrowings | | | 62,080 | | | | 48,532 | | | | — | |
Repayments of other short-term borrowings | | | (66,408 | ) | | | (41,653 | ) | | | — | |
Receipt of restricted contract funds | | | 1,251 | | | | 7,672 | | | | 15,721 | |
Payment of restricted contract funds | | | (3,267 | ) | | | (8,084 | ) | | | (25,959 | ) |
Dividends paid | | | (10,507 | ) | | | (10,537 | ) | | | (10,547 | ) |
Net payments for stockholder issuances and share repurchases | | | (47,767 | ) | | | (19,083 | ) | | | (21,218 | ) |
Other financing, net | | | (2,415 | ) | | | (2,159 | ) | | | (5,437 | ) |
Net Cash (Used in) Provided by Financing Activities | | | (86,898 | ) | | | (152,588 | ) | | | 90,371 | |
Effect of Exchange Rate Changes on Cash, Cash Equivalents, and Restricted Cash | | | (473 | ) | | | 359 | | | | (1,198 | ) |
| | | | | | | | | |
Increase (Decrease) in Cash, Cash Equivalents, and Restricted Cash | | | 9,368 | | | | (3,519 | ) | | | (7,465 | ) |
Cash, Cash Equivalents, and Restricted Cash, Beginning of Period | | | 9,449 | | | | 12,968 | | | | 20,433 | |
Cash, Cash Equivalents, and Restricted Cash, End of Period | | $ | 18,817 | | | $ | 9,449 | | | $ | 12,968 | |
| | | | | | | | | |
Supplemental disclosure of cash flow information: | | | | | | | | | |
Cash paid during the period for: | | | | | | | | | |
Interest | | $ | 30,046 | | | $ | 34,093 | | | $ | 22,782 | |
Income taxes | | $ | 60,221 | | | $ | 26,190 | | | $ | 16,476 | |
Non-cash investing and financing transactions: | | | | | | | | | |
Tenant improvements funded by lessor | | $ | — | | | $ | 568 | | | $ | 20,253 | |
Acquisition of property and equipment through finance lease | | $ | — | | | $ | 337 | | | $ | 18,319 | |
The accompanying notes are an integral part of these statements.
ICF International, Inc. and Subsidiaries
Notes to Consolidated Financial Statements
(dollar amounts in tables in thousands, except share and per share data)
NOTE 1 - BASIS OF PRESENTATION AND NATURE OF OPERATIONS
Basis of Presentation
The accompanying consolidated financial statements include the accounts of ICF International, Inc. (“ICFI”) and its principal subsidiary, ICF Consulting Group, Inc. (“Consulting,” and together with ICFI, the “Company”), and have been prepared in accordance with United States (“U.S.”) generally accepted accounting principles (“U.S. GAAP”). Consulting is a wholly owned subsidiary of ICFI. ICFI is a holding company with no operations or assets other than its investment in the common stock of Consulting. All other subsidiaries of the Company are wholly owned by Consulting. Intercompany transactions and balances have been eliminated. Certain amounts reported in the previous year's consolidated statements of cash flows have been combined to conform to the current year presentation.
Nature of Operations
The Company primarily provides professional services and technology-based solutions, including management, technology, and policy consulting and implementation services, in the areas of energy, environment, infrastructure, and disaster recovery; health and social programs; security and other civilian & commercial. The Company offers a full range of services to clients throughout the entire life cycle of a policy, program, project, or initiative, from research and analysis, assessment and advice, to design and implementation of programs and technology-based solutions, and the provision of engagement services and programs.
The Company’s major customers are U.S. federal government departments and agencies. The Company also serves U.S. state (including territories) and local government departments and agencies, international governments, and commercial clients worldwide. Commercial clients primarily include airlines, airports, electric and gas utilities, health care companies, banks and other financial services companies. The terms “federal” or “federal government” refer to the U.S. federal government, and “state and local” or “state and local government” refer to U.S. state (including territories) and local governments, unless otherwise indicated.
The Company, incorporated in Delaware, is headquartered in Reston, Virginia. It maintains additional offices throughout the world, including more than 55 offices in the U.S. and U.S. territories and 15 offices in key markets outside the U.S., including offices in the United Kingdom (“U.K.”), Belgium, Spain, India, and Canada.
NOTE 2 - SUMMARY OF SIGNIFICANT ACCOUNTING POLICIES
Use of Estimates
The preparation of consolidated financial statements in conformity with U.S. GAAP requires management to make estimates and assumptions that affect the reported amounts of assets and liabilities at the date of the consolidated financial statements, and the reported amounts of revenue and expenses during the reporting periods. Areas of the consolidated financial statements where estimates may have the most significant effect include contractual and regulatory reserves, valuation and lives of tangible and intangible assets, contingent consideration related to business acquisitions and divestitures, impairment of long-lived assets, accrued liabilities, revenue recognition (including estimates of variable considerations in determining the total contract price and allocation of performance obligations), the remaining costs to complete fixed-price contracts, bonus and other incentive compensation, stock-based compensation, reserves for tax benefits and valuation allowances on deferred tax assets, provisions for income taxes, collectability of receivables, and loss accruals for litigation. Actual results experienced by the Company may differ from management’s estimates.
Revenue Recognition
The Company enters into agreements with clients that create enforceable rights and obligations and for which it is probable that the Company will collect the consideration to which it will be entitled as services and solutions are transferred to the client. Except in certain narrowly defined situations, the Company’s agreements with its clients are written and revenue is generally not recognized on oral or implied arrangements. The Company recognizes revenue based on the consideration specified in the applicable agreement and excludes payments to customers and amounts collected on behalf of third parties. Accordingly, sales and similar taxes which are collected on behalf of third parties are excluded from the transaction price.
The Company evaluates whether two or more agreements should be accounted for as one single contract and whether combined or single agreements should be accounted for as more than one performance obligation. For most contracts, the client requires the Company to perform a number of tasks in providing an integrated output for which the client has contracted, and, hence, contracts of this type are tracked as having only one performance obligation since a substantial part of the Company’s promise is to ensure the individual tasks are incorporated into a combined output in accordance with contract requirements. When contracts have multiple performance obligations, the Company allocates the total transaction price to each performance obligation based on the estimated relative standalone selling prices of the promised services underlying each performance obligation. The Company generally provides customized solutions in which the pricing is based on specific negotiations with each client, and, in these cases, the Company uses a cost-plus margin approach to estimate the standalone selling price of each performance obligation. Certain contracts contain award fees, incentive fees or other provisions that can either increase or decrease the transaction price. These variable amounts are generally awarded at the completion of a contractually stipulated performance assessment period based on the achievement of performance metrics, program milestones or cost targets, and the amount awarded may be subject to client discretion. Variable consideration is estimated based on the most likely amount. Once the Company selects a method to estimate variable consideration, it applies that method consistently. Estimates of variable consideration will be constrained only to the extent that it is probable that a significant reversal in the amount of cumulative revenue recognized will not occur.
The Company evaluates contractual arrangements to determine whether revenue should be recognized on a gross versus net basis. The Company’s assessment is based on the nature of the contractual obligation to the client. In most cases, the Company itself agrees to provide specified services to the client as a principal and revenue is recognized on a gross basis. In certain instances, the Company acts as an agent and merely arranges for another party to provide services to the client and revenue is recognized on a net basis in reflection of the fact that the Company does not control the goods or services provided to the client by the other party.
Long-term contracts typically contain billing terms that provide for invoicing monthly or upon completion of milestones, and payment on a net 30-day basis. Therefore, the timing of billings and cash receipts may differ from the timing of revenue recognition resulting in either contract assets or contract liabilities. Exceptions to monthly billing terms are to ensure that the Company performs satisfactorily rather than representing a significant financing component. For cost-based contracts, the Company’s performance is evaluated during a contractually-stipulated performance period and, while contract costs may be billed on a monthly basis, the Company is generally permitted to bill for incentive or award fees only after the completion of the performance assessment period, which may occur quarterly, semi-annually or annually, and after the client completes the performance assessment. Fixed-price contracts may provide for milestone billings based on the attainment of specific project objectives rather than for billing on a monthly basis. Moreover, contracts may require retention or hold backs that are paid at the end of the contract to ensure that the Company performs in accordance with requirements. The Company does not assess whether a contract contains a significant financing component if the Company expects, at contract inception, that the period between payment by the client and the transfer of promised services to the client will be one year or less.
The Company generally recognizes revenue over time as control is transferred to a client, based on the extent of progress towards satisfaction of the performance obligation. The selection of the method used to measure progress requires judgment and is dependent, among other factors, on the contract type and the nature of the services provided.
For time-and-materials contracts, the Company uses the right-to-invoice practical expedient to recognize revenue earned based on hours worked in contract performance at negotiated billing rates. Fixed-price level-of-effort contracts are substantially similar to time-and-materials contracts except that the Company is required to deliver a specified level of effort over a stated period of time. For these contracts, the Company determines the revenue earned using contract hours worked at negotiated bill rates as the Company delivers the contractually required workforce.
For certain cost-based contracts that meet the criteria for the right-to-invoice practical expedient to be used, the Company recognizes revenue based on the amount to which the Company has a contractual right to invoice which is typically costs incurred plus contractually-stipulated fixed fees. Cost-based contracts may include variable consideration which is allocated to the distinct periods in which they relate to and recognized in that period.
For series-services performance obligations, the Company measures progress using either a cost input measure, a time-elapsed output measure, or the right to invoice practical expedient.
For certain fixed-price contracts, the Company uses the percentage-of-completion method to estimate the amount of revenue, based on the ratio of actual costs incurred to total estimated costs, provided that costs incurred (an input method) represents a reasonable measure of progress towards the satisfaction of a performance obligation and transfer of control to the customer. This method provides a faithful depiction of the transfer of value to the client when the Company is satisfying a performance obligation that entails integration of tasks for a combined output, which requires the Company to coordinate the work of employees, subcontractors and delivery of other contract costs. Contract costs that are not reflective of the Company’s progress toward satisfying a performance obligation are not included in the calculation of the measure of progress. When this method is used, the changes in estimated costs to complete the obligations result in adjustments to revenue on a cumulative catch-up basis, which causes the effect of revised estimates for prior periods to be recognized in the current period. Changes in these estimates may routinely occur over contract performance for a variety of reasons, which include: changes in contract scope; changes in contract cost estimates due to unanticipated cost growth or reassessments of risks impacting costs; changes in estimated incentive or award fees; or performing better or worse than previously estimated. For fixed-price contracts in which the estimated cost to perform exceeds the consideration to be received, the Company accrues for the entire estimated loss during the period in which the loss is determined by recording additional direct costs.
In some fixed-price service contracts, the Company performs services of a recurring nature, such as maintenance and other services of a “stand ready” nature. For these contracts, the Company has the right to consideration in an amount that corresponds directly with the value that the client has received. Therefore, the Company records revenue on a time-elapsed basis to reflect the transfer of control to the client throughout the contract.
Contracts may be modified to reflect changes in contract specifications and requirements, and these changes may create new enforceable rights and obligations. Modifications that are for services that are not distinct from the existing agreement due to the significant integration service that the Company provides are accounted for as part of an existing performance obligation. The effect of these modifications on the transaction price and the Company’s measure of progress in fulfilling the performance obligation to which they relate is recognized as an adjustment to revenue on a cumulative catch-up basis. Revenue from modifications that create new, distinct performance obligations is recognized based on the Company’s progress in fulfilling the requirements of the new obligations.
For performance obligations that are satisfied over time, the Company recognizes the cost to fulfill contracts when incurred, unless the costs are within the scope of another topic in which case the guidance of that topic is applied. The Company evaluates incremental costs of obtaining a contract and, if they are recoverable from the client and relate to a specific future contract, they are deferred and recognized over contract performance or the estimated life of the customer relationship if renewals are expected. The Company expenses these costs when incurred if the amortization period is one year or less.
Unfulfilled performance obligations represent amounts expected to be earned on non-cancellable contracts or those that are cancellable, but the Company has determined to have substantive termination penalties, and do not include the value of negotiated, unexercised contract options, which are classified as marketing offers. Indefinite delivery/indefinite quantity and similar arrangements provide a framework for the client to issue specific tasks, delivery or purchase orders in the future and these arrangements are considered marketing offers until a specific order is executed.
Some of the Company’s contracts include variable consideration, which requires the Company to estimate and, as necessary, revise the most likely amounts that will be earned over the respective performance assessment periods. For these obligations, changes in estimates result in cumulative catch-up adjustments and may have a significant impact on earnings during a given period.
The Company’s operating cycle for long-term contracts may be greater than one year and is measured by the average time between the inception and completion of those contracts. Contract-related assets and liabilities are classified as current assets and current liabilities.
Cash and Cash Equivalents
The Company considers cash on deposit and any highly liquid investments with original maturities of three months or less when purchased to be cash and cash equivalents.
Restricted Cash
Restricted cash represents cash that is restricted as to usage due to contractual restrictions.
Contract Receivables, Net
Contract receivables represent amounts billed and due from clients in accordance with respective contractual terms. The amounts due are stated at their net realizable value. The Company estimates an allowance for expected credit loss to reflect the amount of receivables that will not be collected. The Company considers a number of factors in estimating the amount of the allowance, including knowledge of a client’s financial condition, its historical collection experience, and other factors relevant to assessing the collectability of the receivables. The Company writes off contract receivables when such amounts are determined to be uncollectible.
Property and Equipment
Property and equipment are carried at cost and are depreciated using the straight-line method over their estimated useful lives, which range from two to seven years. Leasehold improvements are amortized on a straight-line basis over the shorter of the economic life of the improvement or the related lease term.
Goodwill and Indefinite-Lived Assets
Goodwill represents the excess of the purchase consideration over the fair value of net assets of businesses acquired. Goodwill and any intangible assets acquired in a business combination that are deemed to have an indefinite useful life are not amortized, but instead are reviewed for impairment annually, or more frequently if impairment indicators arise.
The Company performs its annual goodwill impairment test as of October 1 of each year. As its business is highly integrated and all of its components have similar economic characteristics, the Company has concluded it has one aggregated reporting unit at the consolidated entity level and performs the assessment at that level. The Company has the option to perform a qualitative assessment that determines if it is more likely than not that the estimated fair value of goodwill is greater than its carrying value and, if so, the Company may conclude that there are no indicators of impairment. If the Company concludes that an indicator exists, a quantitative test is performed by comparing the reporting unit’s fair value to the carrying amount and recognizing the difference as an impairment loss.
Impairment of Long-Lived Assets
The Company reviews its long-lived assets, including property and equipment, operating lease right-of-use (“ROU”) assets, and definite-lived intangible assets, for impairment whenever events or changes in circumstances indicate that the carrying amounts of the long-lived asset group may not be fully recoverable. If the total of the expected undiscounted future net cash flows is less than the carrying amount of the long-lived asset group being evaluated, a loss is recognized for any excess of the carrying amount over the fair value of the asset group.
During the years ended December 31, 2024, 2023, and 2022, the Company recognized impairment losses of $3.6 million, $6.8 million, and $8.4 million, respectively, related to operating facility lease right-of-use assets and leasehold improvements that it no longer used in ongoing operations. The impairment losses were included in indirect and selling expenses on the Company’s consolidated statements of comprehensive income.
Leases
The Company leases facilities and property and equipment. The Company determines if an arrangement is a lease at its inception and recognizes a right-of-use asset and obligation for all leases greater than twelve months based on the present value of the future minimum lease payments as of the commencement date, excluding any lease incentives and initial costs incurred to obtain the lease. Since most lease agreements do not provide an implicit rate, the Company uses its incremental borrowing rate as of the commencement date, based on publicly available yields adjusted for company-specific considerations and terms, in estimating the present value of future payments.
Lease terms, for the purpose of determining each lease’s present value, include options to extend or terminate the lease if it is reasonably certain and economically reasonable that the Company will exercise that option. Lease costs from minimum lease payments are recognized on a straight-line basis over the lease term.
The leases may contain both lease and non-lease components, which are generally accounted for separately. For office equipment leases (primarily copier leases), the Company elected to account for the lease and non-lease components as a single lease component and not recognize right-of-use assets and lease liabilities for leases with a term less than twelve months.
Operating leases are included in operating lease right-of-use assets and operating lease liabilities (current and non-current) and finance leases are included in property and equipment, net and finance lease liabilities (current and non-current) on the consolidated balance sheets.
Capitalized Software and Costs of Cloud Computing Arrangements
The Company capitalizes certain costs to develop, enhance, and upgrade internal-use software. Capitalized costs include external direct costs and payroll costs for employees directly associated with such activities. These costs are amortization on a straight-line basis over the expected economic life of the software, typically lasting three to five years. As of December 31, 2024, and 2023, capitalized software, net of accumulated amortization, totaled $21.8 million and $12.8 million, respectively.
The Company capitalizes costs related to the implementation costs of cloud computing arrangements that are service contracts. These costs are amortized over the term of the hosting arrangement. As of December 31, 2024 and 2023, capitalized costs, net of accumulated amortization, totaled $2.8 million and $2.6 million, respectively.
The amounts are included as part of other assets on the consolidated balance sheets.
Stock-Based Compensation
The Company recognizes stock-based compensation expense to employees and non-employee directors, including grants of stock options, restricted stock awards, restricted stock units (“RSUs”), and cash-settled restricted stock units (“CSRSUs”) on a straight-line basis over the requisite service period, which is generally the vesting period. The Company recognizes expense for performance-based share awards (“PSAs”), which have both performance and service conditions, on a straight-line basis over the three-year performance period. Non-employee director awards are granted annually for Board-related services and therefore expensed over the service period of one year.
Stock-based compensation expense is based on the estimated fair value of the instruments on the grant date and the estimated number of shares the Company ultimately expects will vest. The Company estimates the rate of future forfeitures based on factors which include the historical forfeiture experience from the previous 10 years for each applicable employee class. In addition, the estimation of PSAs that will ultimately vest requires judgment based on the performance and market conditions that will be achieved over the performance period. Changes to these estimates are recorded as a cumulative adjustment in the period estimates are revised.
The fair value of stock options, restricted stock awards, RSUs, PSAs, and non-employee director awards is estimated based on the fair value of a share of common stock at the grant date. The fair value of PSAs is estimated using a Monte Carlo simulation model.
CSRSUs are settled only in cash payments based on the fair value of the Company’s stock price at the vesting date, calculated by multiplying the number of CSRSUs vested by the Company’s closing stock price on the vesting date, subject to a maximum payment cap and a minimum payment floor. The Company treats these awards as liability-classified awards, and, therefore, accounts for them based on the closing price of the Company’s stock at the reporting date.
Derivative Instruments
Derivative instruments include interest rate swaps, foreign currency hedges, and forward contracts. Derivative instruments designated as cash flow hedges are recorded on the consolidated balance sheets at fair value as of the reporting date and reclassified to earnings (to the same category as the item being hedged) in the period that the hedged instruments affect earnings, and the effective portion of the hedge is recorded in other comprehensive income (loss) (“AOCI”), net of tax, on the consolidated statements of comprehensive income. Management reviews the effectiveness of the hedges on a quarterly basis.
Income Taxes
The Company recognizes deferred tax assets and liabilities for the expected future tax consequences of temporary differences between the financial statement carrying amounts of existing assets and liabilities and their respective tax bases. Deferred tax assets and liabilities are measured using enacted tax rates in effect for the year in which those temporary differences are expected to be recovered or settled. The Company evaluates its ability to benefit from all deferred tax assets and establishes valuation allowances for amounts it believes will more likely than not be realizable. For uncertain tax positions, the Company uses a more-likely-than-not recognition threshold based on the technical merits of the income tax position taken. Income tax positions that do not meet the more-likely-than-not recognition threshold are measured in order to determine the tax benefit recognized in the financial statements. Penalties, if probable and reasonably estimable, and interest expense related to uncertain tax positions are not recognized as a component of income tax expense but recorded separately in indirect expenses and interest expense, respectively.
Treasury Shares
Repurchased shares are accounted for as treasury stock under the cost method.
Foreign Currency
The financial positions and results of operations of the Company’s foreign subsidiaries, for which the functional currency is not the U.S. dollar, are translated into U.S. dollars for financial reporting purposes. Assets and liabilities of the subsidiaries are translated at the exchange rate in effect at each balance sheet date. Income statement accounts are translated at the average rate of exchange prevailing during the period. Translation adjustments are reported in accumulated other comprehensive loss included in stockholders’ equity in the Company’s consolidated balance sheets.
Other Comprehensive Income (Loss)
Other comprehensive income (loss) includes foreign currency translation adjustments, the changes in fair value of interest rate agreements designated as cash flow hedges, net of taxes, and the gain on the sale of an interest rate hedge agreement designated as a cash flow hedge.
Acquisition-Related Costs
Costs related to acquisitions include professional fees for legal, financial, and other advisory services and are expensed in the period that they are incurred.
Business Combinations
Acquisitions that meet the definition of a business in accordance with ASC 805, Business Combinations, are recorded using the acquisition method of accounting. Except for contract assets and contract liabilities, the Company recognizes and measures identifiable assets acquired, liabilities assumed, and any non-controlling interest as of the acquisition date at fair value. Contract assets and contract liabilities from acquired contracts are measured as if the Company had originated the contracts. The valuation of intangible assets is determined by using an approach: market, income, or cost approach. The excess, if any, of total consideration transferred in a business combination over the fair value of identifiable assets acquired, liabilities assumed and any non-controlling interest is recognized as goodwill.
Direct Costs
Direct costs exclude depreciation and amortization and amortization of intangible assets, which are presented separately on the consolidated statements of comprehensive income.
Indirect and Selling Expense
Indirect and selling expenses exclude depreciation and amortization, and amortization of intangible assets, which are presented separately on the consolidated statements of comprehensive income.
Fair Value
The Company measures and reports certain financial assets and liabilities at fair value in accordance with the Financial Accounting Standards Board (the “FASB”) Accounting Standards Codification (“ASC”) 820, Fair Value Measurements and Disclosures (“ASC 280”). Fair value is defined as the price that would be received to sell an asset or paid to transfer a liability in an orderly transaction between market participants on the measurement date. Generally, fair value is based on observable quoted market prices or derived from observable market data when such market prices or data are available. ASC 820 establishes a three-level hierarchy used to estimate fair value by which each level is categorized based on the priority of the inputs used to measure fair value:
•Level 1: Quoted prices that are available in active markets for identical assets or liabilities;
•Level 2: Quoted prices for similar assets or liabilities in active markets, quoted prices for identical or similar assets or liabilities in markets that are not active; inputs other than quoted prices that are observable for the asset or liability (e.g. interest rates and yield curves that are observable at commonly quoted intervals, and implied volatilities); and inputs derived principally from or corroborated by observable market data by correlation or other means; and
•Level 3: Uses inputs that are unobservable and require the Company to make certain assumptions and require significant estimation and judgment from management to use in pricing the fair value of the assets and liabilities.
Certain financial instruments, including cash and cash equivalents, contract receivables, and accounts payable are carried at cost, which, due to their short maturities, approximates their fair values. The carrying value of the Company’s long-term debt approximates the estimated fair value for debt with similar terms, interest rates, and remaining maturities currently available to companies with similar credit ratings (Level 2).
Concentration of Credit Risks
Financial instruments that potentially subject the Company to concentrations of credit risk consist principally of cash and cash equivalents, derivative financial instruments, and contract receivables.
The Company’s domestic bank accounts are insured up to $250,000 by the Federal Deposit Insurance Corporation. As of December 31, 2024 and 2023, the Company had $9.3 million and $0.3 million, respectively, of cash in its accounts that exceeded the insured limit. The majority of the Company’s cash transactions are processed through one U.S. commercial bank.
As of December 31, 2024 and 2023, the Company held approximately $4.6 million and $8.5 million, respectively, of cash and restricted cash in foreign bank accounts.
The Company enters into derivative financial instruments with financial institutions that meet certain credit guidelines and limit its risks by continuously monitoring the credit rating of the institutions.
The Company’s receivables consist principally of amounts due from agencies and departments of the federal government, state and local governments, and international governments, as well as from commercial organizations. The credit risk, with respect to federal and other government clients, is limited due to the creditworthiness of the respective governmental entity. Receivables from commercial clients generally pose a greater credit risk, and, as a result, are subject to ongoing monitoring. The Company extends credit in the normal course of operations and does not require collateral from its clients.
Recent Accounting Pronouncements
Accounting Pronouncements Adopted
Segment Reporting
In November 2023, the FASB issued Accounting Standards Update (“ASU”) 2023-07: Improvements to Reportable Segment Disclosures (“ASU 2023-07”), that required additional disclosures for public entities currently required under the ASC. While it does not change how a public entity identifies its operating segments, ASU 2023-07 enhances the current segment reporting disclosures of Topic 280 by requiring significant segment expenses that are regularly provided to the Chief Operating Decision Maker (the “CODM”), the amount and description of other segment items, and interim disclosures of reportable segment’s profit or loss and assets. ASU 2023-07 also requires public entities that have a single reportable segment to provide all the disclosures required in Topic 280, as amended. The Company completed its adoption of the provisions of ASU 2023-07 during the fourth quarter of 2024, see Note 22 – Segment Information and Geographic Data.
Accounting Pronouncements Not Yet Adopted
Income Taxes
In December 2023, the FASB issued ASU 2023-09, Income Taxes: Improvements to Income Tax Disclosures (“ASU 2023-09”), that require greater disaggregation of income tax rate and amounts paid by entities. ASU 2023-09 specifically requires all entities to disclose, on an annual basis, disaggregated domestic and foreign pre-tax income or loss from continuing operations and the disaggregated income tax expense or benefit by federal, state, and foreign components, and a tabular rate reconciliation, using both percentages and reporting currency amounts, of eight specific categories as well as any individual reconciling items that are equal to or greater than 5% of a threshold computed by multiplying pretax income or loss from continuing operations by the applicable federal rate. Additionally, the amendments also require disclosure of income taxes paid disaggregated by federal, state, and foreign jurisdictions as well as any individual jurisdictions over 5% of the total income taxes paid. ASU 2023-09 is effective for the Company for the 2025 fiscal year, with early adoption permitted. The amendments may be adopted on a prospective or retrospective basis. The Company is currently evaluating the impact of the adoption of ASU 2023-09 but does not expect the adoption to have a material impact, if any, on the consolidated financial statements.
Income Statement—Reporting Comprehensive Income—Expense Disaggregation Disclosures
In November 2024, the FASB issued ASU 2024-03: Disaggregation of Income Statement Expenses (“ASU 2024-03”), which requires additional disaggregation of certain costs and expenses. ASU 2024-03 specifically requires all public entities to disclose within a tabular format the amounts of (a) purchases of inventory, (b) employee compensation, (c) depreciation, (d) intangible asset amortization, and (e) depreciation, depletion, and amortization recognized as part of oil- and gas-producing activities in each relevant expense caption as well as certain amounts that are already required to be disclosed under current U.S. GAAP. ASU 2024-03 also requires public entities to disclose a qualitative description of the composition of any amounts in relevant expense captions that are not separately disaggregated and the amount and definition of the entity’s selling expenses. ASU 2024-03 is effective for the Company for the 2027 fiscal year and interim periods within the 2028 fiscal year, with early adoption permitted. The amendments may be adopted on a prospective or retrospective basis. The Company is currently evaluating the impact of the adoption of ASU 2024-03 but does not expect the adoption to have a material impact, if any, on the consolidated financial statements.
NOTE 3 - RESTRICTED CASH
The following table provides a reconciliation of cash and cash equivalents, and restricted cash reported within the consolidated balance sheets at December 31, 2024 and 2023 to the total cash, cash equivalents, and restricted cash shown in the consolidated statements of cash flows for the years ended December 31, 2024, 2023, and 2022:
| | | | | | | | | | | | | | | | | | | | | | | |
| 2024 | | | 2023 | | | 2022 | |
| Beginning | | | Ending | | | Beginning | | | Ending | | | Beginning | | | Ending | |
Cash and cash equivalents | $ | 6,361 | | | $ | 4,960 | | | $ | 11,257 | | | $ | 6,361 | | | $ | 8,254 | | | $ | 11,257 | |
Restricted cash | | 3,088 | | | | 13,857 | | | | 1,711 | | | | 3,088 | | | | 12,179 | | | | 1,711 | |
Total cash, cash equivalents, and restricted cash shown in the consolidated statements of cash flows | $ | 9,449 | | | $ | 18,817 | | | $ | 12,968 | | | $ | 9,449 | | | $ | 20,433 | | | $ | 12,968 | |
NOTE 4 - CONTRACT RECEIVABLES, NET
Contract receivables, net consisted of the following as of December 31:
| | | | | | | | |
| | 2024 | | | 2023 | |
Billed and billable | | $ | 263,624 | | | $ | 210,919 | |
Allowance for expected credit losses | | | (6,701 | ) | | | (5,435 | ) |
Contract receivables, net | | $ | 256,923 | | | $ | 205,484 | |
The Company sells certain billed contract receivables in accordance with its Master Receivables Purchase Agreement (the “MRPA”) with MUFG Bank, Ltd. (“MUFG”). The contract receivables that are sold without recourse and where the Company does not retain any ongoing financial interest in the transferred receivables, other than providing servicing activities, are accounted for as sales under ASC 860, Transfers and Servicing (“ASC 860”). Consequently, these contract receivables are derecognized from the Company’s consolidated balance sheets at the date of the sale, and the cash received from MUFG is presented as part of cash flows from operating activities.
The following is a reconciliation of billed contract receivables sold to MUFG that were eligible and accounted for as sales under ASC 860, including billed contract receivables sold to MUFG and collected from customers on behalf of MUFG during the twelve months ended December 31, 2024 and 2023, and the balance of billed contract receivables not yet collected from customers as of December 31, 2024 and 2023, respectively:
| | | | | | | | |
| | As of and for the Year Ended | |
| | December 31, 2024 | | | December 31, 2023 | |
Beginning balance, billed contract receivables sold and not yet collected (1) | | $ | 21,302 | | | $ | 3,818 | |
Billed contract receivables sold during the period (2) | | | 634,081 | | | | 260,904 | |
Collections from customers during the period (2) | | | (629,417 | ) | | | (243,420 | ) |
Ending balance, billed contract receivables sold and not yet collected (3) | | $ | 25,966 | | | $ | 21,302 | |
(1)The beginning balances represent billed contract receivables that were previously sold and derecognized by the Company but have not yet been collected from customers as of January 1, 2024 and 2023, respectively.
(2)For the twelve months ended December 31, 2024 and 2023, the Company recorded net inflows of $4.7 million and $17.5 million, respectively, in its cash flows from operating activities from the sale of billed contract receivables.
(3)The ending balances represent billed contract receivables that were sold and derecognized by the Company but have not yet been collected from customers as of December 31, 2024 and 2023, respectively.
The following is a reconciliation of cash collections from customers of billed contract receivables previously sold to MUFG that were eligible and accounted for as sales under ASC 860, including collections from customers on behalf of MUFG of previously sold billed contract receivables and remittances of cash collections to MUFG during the twelve months ended December 31, 2024 and 2023, and the balance of cash collected but not yet remitted to MUFG as of December 31, 2024 and 2023, respectively:
| | | | | | | | |
| | As of and for the Year Ended | |
| | December 31, 2024 | | | December 31, 2023 | |
Beginning balance, cash collected but not yet remitted to MUFG (1) | | $ | 21,796 | | | $ | 6,165 | |
Collections from customers during the period (2) | | | 629,417 | | | | 243,420 | |
Remittances to MUFG during the period (2) | | | (627,874 | ) | | | (227,789 | ) |
Ending balance, cash collected but not yet remitted to MUFG (3) | | $ | 23,339 | | | $ | 21,796 | |
(1)The beginning balances represent cash collected from customers on behalf of MUFG for billed contract receivables that were previously sold and derecognized by the Company but have not yet been remitted to MUFG as of January 1, 2024 and 2023, respectively.
(2)For the twelve months ended December 31, 2024 and 2023, the Company recorded net inflows of $1.5 million and $15.6 million, respectively, in its cash flows from operating activities from the collection of billed contract receivables that were sold but not yet remitted to MUFG.
(3)The ending balances are included as part of “Accrued expenses and other current liabilities” on the Company’s consolidated balance sheets.
The Company services the receivables sold by collecting cash and remitting it to MUFG. The related servicing fee received from MUFG was immaterial.
The aggregate impact of the sale of billed contract receivables on the Company’s operating cash flows was $6.2 million and $33.1 million for the twelve months ended December 31, 2024 and 2023, respectively.
The Company also sold certain billed contract receivables to MUFG that did not qualify as sales under ASC 860. Consequently, the cash received from and remitted back to MUFG is presented as cash from financing activities within “Proceeds from other short-term borrowings” and “Repayments of other short-term borrowings” on the Company’s consolidated statements of cash flows.
At December 31, 2024 and 2023, the amounts due to MUFG for cash collected and not yet remitted for billed contract receivables sold that did not qualify as sales under ASC 860 totaled $7.9 million and $6.9 million, respectively. These amounts are included as part of “Accrued expenses and other current liabilities” on the Company’s consolidated balance sheets.
NOTE 5 - PROPERTY AND EQUIPMENT
Property and equipment consisted of the following at December 31:
| | | | | | | |
| 2024 | | | 2023 | |
Leasehold improvements | $ | 53,096 | | | $ | 54,398 | |
Purchased software | | 9,483 | | | | 16,897 | |
Furniture and office equipment | | 28,182 | | | | 29,773 | |
Computer equipment | | 43,695 | | | | 44,661 | |
| | 134,456 | | | | 145,729 | |
Accumulated depreciation and amortization | | (66,338 | ) | | | (69,781 | ) |
Total property and equipment, net | $ | 68,118 | | | $ | 75,948 | |
Depreciation and amortization expense for the years ended December 31, 2024, 2023, and 2022 totaled $20.5 million, $25.3 million, and $21.5 million, respectively.
NOTE 6 - GOODWILL AND OTHER INTANGIBLE ASSETS
Goodwill
The changes in the carrying amount of goodwill for the fiscal years ended December 31 were as follows:
| | | | | | | | |
| | 2024 | | | 2023 | |
Balance as of January 1, 2024 | | $ | 1,219,476 | | | $ | 1,212,898 | |
Add: Goodwill resulting from business combinations | | | 30,200 | | | | 21,133 | |
Less: Goodwill resulting from business divestitures | | | — | | | | (16,921 | ) |
Effect of foreign currency translation | | | (821 | ) | | | 2,366 | |
Balance as of December 31, 2024 | | $ | 1,248,855 | | | $ | 1,219,476 | |
See “Note 17 – Acquisitions and Divestitures” for the details of the business combination and divestiture resulting in the changes in goodwill.
Other Intangible Assets
Intangible assets with definite lives are primarily amortized over periods ranging from approximately 1 to 11 years. The weighted-average period of amortization for all intangible assets, calculated as of December 31, 2024, is 5.7 years. The customer-related intangible assets, which consist of customer contracts, backlog, and non-contractual customer relationships, are being amortized based on estimated cash flows and respective estimated economic benefit of the assets. The weighted-average period of amortization of the customer-related intangibles calculated as of December 31, 2024 is 5.7 years. Intangible assets related to developed technology are being amortized over a weighted-average period, calculated as of December 31, 2024, of 7.6 years. Intangible assets with an indefinite life consist of a domain name.
Other intangibles consisted of the following at December 31:
| | | | | | | | | | | | |
| | 2024 | |
| | Gross
Carrying
Value | | | Accumulated
Amortization | | | Net Carrying
Value | |
Customer-related | | $ | 188,410 | | | $ | (108,215 | ) | | $ | 80,195 | |
Developed technology | | | 8,902 | | | | (1,279 | ) | | | 7,623 | |
Trade name | | | 1,570 | | | | (1,220 | ) | | | 350 | |
Total amortizable intangible assets | | | 198,882 | | | | (110,714 | ) | | | 88,168 | |
Intangible with indefinite life | | | 94 | | | | — | | | | 94 | |
Total other intangible assets | | $ | 198,976 | | | $ | (110,714 | ) | | $ | 88,262 | |
| | | | | | | | | | | | |
| | 2023 | |
| | Gross
Carrying
Value | | | Accumulated
Amortization | | | Net Carrying
Value | |
Customer-related | | $ | 185,723 | | | $ | (93,911 | ) | | $ | 91,812 | |
Developed technology | | | 3,902 | | | | (904 | ) | | | 2,998 | |
Trade name | | | 1,280 | | | | (1,280 | ) | | | — | |
Total amortizable intangible assets | | | 190,905 | | | | (96,095 | ) | | | 94,810 | |
Intangible with indefinite life | | | 94 | | | | — | | | | 94 | |
Total other intangible assets | | $ | 190,999 | | | $ | (96,095 | ) | | $ | 94,904 | |
Aggregate amortization expense for the years ended December 31, 2024, 2023, and 2022, was approximately $33.0 million, $35.5 million, and $28.4 million, respectively. The estimated future amortization expense relating to intangible assets is as follows:
| | | | |
Year ending December 31, | | | |
2025 | | $ | 35,590 | |
2026 | | | 21,700 | |
2027 | | | 6,574 | |
2028 | | | 5,214 | |
2029 | | | 4,534 | |
Thereafter | | | 14,556 | |
Total | | $ | 88,168 | |
NOTE 7 – LEASES
The Company has operating and finance leases for facilities and equipment which have remaining terms ranging from 1 to 14 years. The leases may include options to extend the lease periods for up to 5 years at rates approximating market rates and/or options to terminate the leases within 1 year. The leases may include a residual value guarantee or a responsibility to return the property to its original state of use. A limited number of leases contain provisions that provide for rental increases based on consumer price indices. The change in lease cost resulting from changes in these indices was included within variable lease cost.
The Company’s lease cost is recognized on a straight-line basis over the lease term and is primarily included within indirect and selling expenses on the consolidated statements of comprehensive income. Lease cost consisted of the following:
| | | | | | | | | | | | |
| | Year Ended December 31, | |
| | 2024 | | | 2023 | | | 2022 | |
Operating lease cost | | $ | 22,085 | | | $ | 25,037 | | | $ | 37,889 | |
Finance lease cost - amortization of right-of-use assets | | | 2,040 | | | | 2,040 | | | | 598 | |
Finance lease cost - interest | | | 519 | | | | 602 | | | | 179 | |
Short-term lease cost | | | 724 | | | | 669 | | | | 509 | |
Variable lease cost | | | 289 | | | | 222 | | | | 146 | |
Sublease income | | | — | | | | (28 | ) | | | (92 | ) |
Total lease cost | | $ | 25,657 | | | $ | 28,542 | | | $ | 39,229 | |
Future minimum lease payments under non-cancellable operating and finance leases as of December 31, 2024 were as follows:
| | | | | | | | |
| | Operating | | | Finance | |
December 31, 2025 | | $ | 26,183 | | | $ | 3,041 | |
December 31, 2026 | | | 23,708 | | | | 3,041 | |
December 31, 2027 | | | 18,335 | | | | 3,041 | |
December 31, 2028 | | | 15,281 | | | | 2,985 | |
December 31, 2029 | | | 13,244 | | | | 2,965 | |
Thereafter | | | 118,158 | | | | — | |
Total future minimum lease payments | | | 214,909 | | | | 15,073 | |
Less: Interest | | | (38,253 | ) | | | (1,200 | ) |
Total lease liabilities | | $ | 176,656 | | | $ | 13,873 | |
| | | | | | |
Lease liabilities - current | | $ | 20,721 | | | $ | 2,612 | |
Lease liabilities - non-current | | | 155,935 | | | | 11,261 | |
Total lease liabilities | | $ | 176,656 | | | $ | 13,873 | |
Other information related to operating and finance leases is as follows:
| | | | | | | | |
| | Year Ended December 31, | |
| | 2024 | | | 2023 | |
Cash paid for amounts included in the measurement of lease liabilities: | | | | | | |
Operating cash flows from operating leases | | $ | 27,267 | | | $ | 20,368 | |
Financing cash flows from finance leases | | $ | 2,522 | | | $ | 2,438 | |
Operating cash flows from finance leases | | $ | 519 | | | $ | 602 | |
Right-of-use assets obtained in exchange for new operating lease liabilities | | $ | 3,730 | | | $ | 18,590 | |
Property and equipment obtained in exchange for finance lease liabilities | | | — | | | | 338 | |
Weighted-average remaining lease term | | | | | | |
Operating leases | | | 11.4 | | | | 11.6 | |
Finance leases | | | 5.0 | | | | 6.0 | |
Weighted-average discount rate | | | | | | |
Operating leases | | | 3.5 | % | | | 3.6 | % |
Finance leases | | | 3.4 | % | | | 3.4 | % |
NOTE 8 - ACCRUED SALARIES AND BENEFITS
Accrued salaries and benefits consisted of the following at December 31:
| | | | | | | | |
| | 2024 | | | 2023 | |
Bonuses, liability-classified awards, and commissions | | $ | 30,884 | | | $ | 27,371 | |
Salaries | | | 41,593 | | | | 32,604 | |
Paid time off and leave | | | 18,028 | | | | 16,415 | |
Medical | | | 7,548 | | | | 5,685 | |
Payroll taxes and withholdings | | | 2,252 | | | | 976 | |
Other | | | 5,468 | | | | 4,970 | |
Total accrued salaries and benefits | | $ | 105,773 | | | $ | 88,021 | |
NOTE 9 - ACCRUED EXPENSES AND OTHER CURRENT LIABILITIES
Accrued expenses and other current liabilities consisted of the following at December 31:
| | | | | | | | |
| | 2024 | | | 2023 | |
Deposits | | $ | 18,493 | | | $ | 20,246 | |
Restricted contract funds | | | 13,857 | | | | 2,036 | |
Taxes and insurance premiums | | | 3,893 | | | | 7,010 | |
Facilities rental and lease exit costs | | | 2,524 | | | | 2,754 | |
Interest | | | 489 | | | | 3,218 | |
Professional services | | | 2,761 | | | | 1,943 | |
Dividends | | | 2,626 | | | | 2,636 | |
Cash collected not yet remitted to purchaser of billed receivables | | | 31,252 | | | | 28,675 | |
Other accrued expenses and current liabilities | | | 10,806 | | | | 10,611 | |
Total accrued expenses and other current liabilities | | $ | 86,701 | | | $ | 79,129 | |
NOTE 10 - LONG-TERM DEBT
On May 6, 2022, the Company entered into the Restated Credit Agreement with a group of lenders with (a) PNC Bank, National Association as the Administrative Agent and (b) PNC Capital Markets LLC, BOFA Securities, Inc., TD Securities (USA) LLC, Wells Fargo Securities, LLC and Citizens Bank, N.A., as joint lead arrangers. The various facilities under the Restated Credit Agreement are referred to as the “Credit Facility”. The Restated Credit Agreement amended and restated the Company’s prior credit agreement (the “Existing Credit Agreement”) to, among other things: (a) maintain the existing $600 million revolving credit facility (together and inclusive of a $75 million swing line sublimit and $100 million sublimit for letters of credit); (b) increase the existing term loan facility from $200 million to $300 million; (c) provide for a new delayed draw term loan facility of $400 million; (d) maintain the existing incremental credit facility to make, subject to approval of the lenders making such loans, incremental term or revolving credit loan(s) in the aggregate principal amount of not more than $300 million; (e) increase the maximum Consolidated Leverage Ratio (as such term is defined in the Restated Credit Agreement) from 4.00 to 1.00 to 4.50 to 1.00 (with temporary increases to 5.00 to 1.00 for the three fiscal quarters following a “Material Permitted Acquisition”, as such term is defined in the Restated Credit Agreement); (f) maintain the minimum Consolidated Interest Coverage Ratio (as such term is defined in the Restated Credit Agreement) of 3.00 to 1.00; (g) increase the foreign currency debt limit in Euro and Sterling Pounds from $30 million equivalent to $200 million equivalent; (h) modify LIBOR based interest pricing conventions with SOFR based interest pricing conventions; (i) extend the maturity date of the Credit Facility until May 6, 2027; (j) incorporate various provisions and conventions encouraged by the Loan Syndication and Trade Association; and (k) modify certain definitions and certain covenants.
Under the Restated Credit Agreement, the Company may, at its discretion, borrow funds under the Credit Facility at interest rates based on both term SOFR (i.e., 1, 3, or 6-month rates) and the Base Rate (as defined herein), plus their applicable margins. The Base Rate is a fluctuating rate of interest equal to the highest of (a) the Overnight Bank Funding Rate (as defined in the Restated Credit Agreement), plus 0.5%, (b) the Prime Rate (as defined in the Restated Credit Agreement) and (c) the Daily Simple SOFR Rate (as defined in the Restated Credit Agreement) plus 1%, all as then adjusted to include the Applicable Margin (as defined in the Restated Credit Agreement) as then in effect (and as determined pursuant to the then-current Consolidated Leverage Ratio). For the years ended December 31, 2024 and 2023, the average interest rate on borrowings under the Credit Facility was 6.6% and 6.7%, respectively. Inclusive of the impact of floating-to-fixed interest rate swaps (see “Note 12 – Derivative Instruments and Hedging Activities”), the average interest rate was 5.3% and 5.6% for the years ended December 31, 2024 and 2023, respectively.
The Credit Facility is collateralized by substantially all the assets of the Company and its material domestic subsidiaries and requires that the Company remain in compliance with certain financial and non-financial covenants including, but not limited to the Consolidated Leverage Ratio and the Consolidated Interest Coverage Ratio. The Credit Facility also includes other terms and conditions, covenants, and other provisions of the Restated Credit Agreement that are materially consistent with the Existing Credit Agreement. As of December 31, 2024, the Company was in compliance with all covenants.
As of December 31, 2024, the Company had $411.7 million (net of unamortized debt issuance costs) of long-term debt outstanding from the Credit Facility and unused borrowing capacity of $541.1 million, from the available $600.0 million revolving line of credit under the Credit Facility. The unused borrowing capacity is inclusive of four outstanding letters of credit totaling $1.6 million.
As of December 31, 2024 and 2023, long-term debt consisted of the following:
| | | | | | | | | | | | |
| | December 31, 2024 | | | December 31, 2023 | |
| | Average
Interest Rate | | Outstanding
Balance | | | Average
Interest Rate | | Outstanding
Balance | |
Term Loan | | | | $ | 200,250 | | | | | $ | 207,750 | |
Delayed-Draw Term Loan | | | | | 156,750 | | | | | | 220,000 | |
Revolving Credit | | | | | 57,225 | | | | | | 6,340 | |
Total before debt issuance costs | | 6.6% | | | 414,225 | | | 6.7% | | | 434,090 | |
Unamortized debt issuance costs | | | | | (2,482 | ) | | | | | (3,683 | ) |
| | | | $ | 411,743 | | | | | $ | 430,407 | |
| | | | | | | | | | |
Current portion of long-term debt | | | | $ | — | | | | | $ | 26,000 | |
Long-term debt - non-current | | | | | 411,743 | | | | | | 404,407 | |
Total | | | | $ | 411,743 | | | | | $ | 430,407 | |
Future scheduled repayments of debt principal are as follows:
| | | | | | | | | | | | | | | | |
Payments due by | | Term Loan | | | Delayed-Draw Term Loan | | | Revolving Credit | | | Total | |
December 31, 2025 | | $ | — | | | $ | — | | | $ | — | | | $ | — | |
December 31, 2026 | | | — | | | | — | | | | — | | | | — | |
December 31, 2027 | | | 200,250 | | | | 156,750 | | | | 57,225 | | | | 414,225 | |
Total | | $ | 200,250 | | | $ | 156,750 | | | $ | 57,225 | | | $ | 414,225 | |
Debt Issuance Cost
The Company’s debt issuance costs are amortized over the term of indebtedness. Amortization of debt issuance costs totaling $1.2 million, $2.0 million, and $1.3 million was recorded for each of the years ended December 31, 2024, 2023, and 2022, respectively, and was included as part of interest, net, on the Company’s consolidated statements of comprehensive income.
NOTE 11 – REVENUE RECOGNITION
Disaggregation of Revenue
The Company disaggregates revenue from clients into categories that depict how the nature, amount, and uncertainty of revenue and cash flows are affected by economic and business factors. Those categories are client market, client type, and contract mix.
Client markets provide insight into the breadth of the Company’s expertise. In classifying revenue by client market, the Company attributes revenue from a client to the market that the Company believes is the client’s primary market. The Company also classifies revenue by the type of client for which it does business, which is an indicator of the diversity of its client base. The Company attributes revenue generated as a subcontractor to the market or type of the ultimate client. Disaggregation by contract mix provides insight in terms of the degree of performance risk that the Company has assumed. Fixed-price contracts are considered to provide the highest amount of performance risk as the Company is required to deliver a scope of work or level of effort for a negotiated fixed price. Time-and-materials contracts require the Company to provide skilled employees for negotiated fixed hourly rates. Since the Company is not required to deliver a scope of work, but merely skilled employees, it considers these contracts to be less risky than a fixed-price agreement. Cost-based contracts are considered to provide the lowest amount of performance risk since the Company is generally reimbursed for all contract costs incurred in performance of contract deliverables with only the amount of incentive or award fees (if applicable) dependent on the achievement of negotiated performance requirements.
The Company’s revenue by client markets, type, and contract mix are in the following tables. Certain immaterial revenue amounts in the prior years have been reclassified due to minor adjustments and reclassification.
| | | | | | | | | | | |
| Year ended December 31, | |
| 2024 | | | 2023 | | | 2022 | |
Client Markets: | | | | | | | | |
Energy, environment, infrastructure, and disaster recovery | $ | 929,711 | | | $ | 805,942 | | | $ | 714,628 | |
Health and social programs | | 764,477 | | | | 814,789 | | | | 704,465 | |
Security and other civilian & commercial | | 325,599 | | | | 342,507 | | | | 360,871 | |
Total | $ | 2,019,787 | | | $ | 1,963,238 | | | $ | 1,779,964 | |
| | | | | | | | | | | |
| Year ended December 31, | |
| 2024 | | | 2023 | | | 2022 | |
Client Type: | | | | | | | | |
U.S. federal government | $ | 1,087,349 | | | $ | 1,084,047 | | | $ | 980,746 | |
U.S. state and local government | | 316,083 | | | | 309,516 | | | | 259,764 | |
International government | | 110,798 | | | | 103,446 | | | | 103,609 | |
Total Government | | 1,514,230 | | | | 1,497,009 | | | | 1,344,119 | |
Commercial | | 505,557 | | | | 466,229 | | | | 435,845 | |
Total | $ | 2,019,787 | | | $ | 1,963,238 | | | $ | 1,779,964 | |
| | | | | | | | | | | |
| Year ended December 31, | |
| 2024 | | | 2023 | | | 2022 | |
Contract Mix: | | | | | | | | |
Time-and-materials | $ | 855,538 | | | $ | 811,911 | | | $ | 713,693 | |
Fixed-price | | 932,351 | | | | 886,200 | | | | 802,568 | |
Cost-based | | 231,898 | | | | 265,127 | | | | 263,703 | |
Total | $ | 2,019,787 | | | $ | 1,963,238 | | | $ | 1,779,964 | |
Contract Assets and Liabilities:
Contract assets consist of unbilled receivables on contracts where revenue recognized exceeds the amount billed. Contract liabilities result from advance payments received on a contract or from billings in excess of revenue recognized on long-term contracts.
The following table summarizes the contract balances as of December 31, 2024 and December 31, 2023:
| | | | | | | | | | | |
| December 31, 2024 | | | December 31, 2023 | | | Change | |
Contract assets | $ | 188,941 | | | $ | 201,832 | | | $ | (12,891 | ) |
Contract liabilities | | (24,580 | ) | | | (21,997 | ) | | | (2,583 | ) |
Net contract assets (liabilities) | $ | 164,361 | | | $ | 179,835 | | | $ | (15,474 | ) |
The net contract assets (liabilities) as of December 31, 2024 decreased by $15.5 million as compared to December 31, 2023, primarily due to the timing difference between the performance of services and billings to and payments from customers. There were no material changes to contract balances due to impairments or credit losses during the period. During the years ended December 31, 2024 and 2023, the Company recognized $17.6 million and $17.8 million in revenue related to the contract liabilities balance at December 31, 2023 and 2022, respectively.
Unfulfilled Performance Obligations:
The Company had $1.3 billion in remaining unfulfilled performance obligations (“UPO”) as of December 31, 2024 which the Company expects to recognize as revenue approximately 61% by December 31, 2025, 73% by December 31, 2026, and the remaining thereafter.
Subsequent to December 31, 2024, and through February 25, 2025, pursuant to the recent executive orders issued by the Administration or actions by DOGE, the Company received notices for termination-for-convenience and for stop-work orders. Had these termination-for-convenience occurred prior to December 31, 2024, the total UPO would be reduced by approximately $245 million. It is unknown if the stop-work orders notices will be lifted and the Company will resume work on these programs, or if the stop-work orders will result in a termination-for-convenience.
NOTE 12 - DERIVATIVE INSTRUMENTS AND HEDGING ACTIVITIES
The Company uses interest rate swap agreements (the “Swaps”) to manage its variable interest rate risk associated with its borrowings under the Credit Facility. The Company does not use such instruments for speculative or trading purposes.
At December 31, 2024, the Company had floating-to-fixed interest rate swaps for an aggregate notional amount of $275.0 million, of which $100.0 million will mature on February 28, 2025, $75.0 million will mature on February 28, 2028, and $100.0 million will mature on June 27, 2028. The Company has designated the Swaps as cash flow hedges.
For the years ended December 31, 2024 and 2023, the effect of the Swaps on the Company’s financial statements are as follows:
| | | | | | | | | | | | | | | | |
Cash Flow Hedging Derivatives | | Total Gain (Loss) Recorded to AOCI | | | Amount of (Gain) or Loss
Reclassified from AOCI into
Income | |
| | Year Ended December 31, | |
| | 2024 | | | 2023 | | | 2024 | | | 2023 | |
Interest Rate Swaps | | $ | 5,996 | | | $ | (45 | ) | | $ | (6,244 | ) | | $ | (6,982 | ) |
As of December 31, 2024, $0.8 million in unrealized gains from the Swaps are expected to be reclassified from AOCI into earnings within the next twelve months.
NOTE 13 - FAIR VALUE
Financial instruments measured at fair value on a recurring basis and their location within the accompanying consolidated financial statements are as follows:
| | | | | | | | | | | | | | | | | |
| December 31, 2024 | | | |
| Level 1 | | | Level 2 | | | Level 3 | | | Total | | | Location on Balance Sheet |
Assets: | | | | | | | | | | | | | |
Interest rate swaps - current portion | $ | — | | | $ | 825 | | | $ | — | | | $ | 825 | | | Prepaid expenses and other assets |
Interest rate swaps - long-term portion | | — | | | | 129 | | | | — | | | | 129 | | | Other assets |
Company-owned life insurance policies | | — | | | | 23,174 | | | | — | | | | 23,174 | | | Other assets |
| | | | | | | | | | | | | |
Liabilities: | | | | | | | | | | | | | |
Interest swaps - current portion | $ | — | | | $ | 15 | | | $ | — | | | $ | 15 | | | Accrued expenses and other current liabilities |
Interest swaps - long-term portion | | — | | | | 153 | | | | — | | | | 153 | | | Other long-term liabilities |
| | | | | | | | | | | | | |
| | | | | | | | | | | | | | | | | |
| December 31, 2023 | | | |
| Level 1 | | | Level 2 | | | Level 3 | | | Total | | | Location on Balance Sheet |
Assets: | | | | | | | | | | | | | |
Interest rate swaps - current portion | $ | — | | | $ | 4,820 | | | $ | — | | | $ | 4,820 | | | Prepaid expenses and other assets |
Foreign currency forward and swap contracts | | — | | | | 6 | | | | — | | | | 6 | | | Prepaid expenses and other assets |
Interest rate swaps - long-term portion | | — | | | | 398 | | | | — | | | | 398 | | | Other assets |
Company-owned life insurance policies | | — | | | | 20,438 | | | | — | | | | 20,438 | | | Other assets |
Financial and non-financial instruments measured or remeasured at fair value on a non-recurring basis include certain impaired right-of-use assets from operating leases and assets acquired and liabilities assumed from acquisitions, using the discounted cash flows method with Level 3 inputs as of the impairment and acquisition dates.
NOTE 14 - STOCKHOLDERS’ EQUITY
Accumulated Other Comprehensive Loss
Accumulated other comprehensive (loss) income included the following:
| | | | | | | | | | | | | |
| | Foreign
Currency
Translation
Adjustments | | | | Changes in
Fair Value
of Interest
Rate Hedge
Agreements (1)(2) | | | Total | |
Accumulated other comprehensive (loss) income at January 1, 2022 | | $ | (8,759 | ) | | | $ | (2,276 | ) | | $ | (11,035 | ) |
Current period other comprehensive income (loss): | | | | | | | | | | |
Other comprehensive income (loss) before reclassifications | | | (9,259 | ) | | | | 11,445 | | | | 2,186 | |
Amounts reclassified from accumulated other comprehensive (loss) income | | | — | | | | | (248 | ) | | | (248 | ) |
Effect of taxes (3) | | | 3,962 | | | | | (2,998 | ) | | | 964 | |
Total current period other comprehensive income (loss) | | | (5,297 | ) | | | | 8,199 | | | | 2,902 | |
Accumulated other comprehensive (loss) income at December 31, 2022 | | | (14,056 | ) | | | | 5,923 | | | | (8,133 | ) |
Current period other comprehensive income (loss): | | | | | | | | | | |
Other comprehensive (loss) income before reclassifications | | | 4,158 | | | | | (45 | ) | | | 4,113 | |
Amounts reclassified from accumulated other comprehensive (loss) income | | | — | | | | | (6,982 | ) | | | (6,982 | ) |
Effect of taxes (3) | | | (2,797 | ) | | | | 1,914 | | | | (883 | ) |
Total current period other comprehensive income (loss) | | | 1,361 | | | | | (5,113 | ) | | | (3,752 | ) |
Accumulated other comprehensive (loss) income at December 31, 2023 | | | (12,695 | ) | | | | 810 | | | | (11,885 | ) |
Current period other comprehensive income (loss): | | | | | | | | | | |
Other comprehensive income (loss) before reclassifications | | | (3,884 | ) | | | | 5,996 | | | | 2,112 | |
Amounts reclassified from accumulated other comprehensive (loss) income (4) | | | — | | | | | (6,244 | ) | | | (6,244 | ) |
Effect of taxes (3) | | | 196 | | | | | 75 | | | | 271 | |
Total current period other comprehensive income (loss) | | | (3,688 | ) | | | | (173 | ) | | | (3,861 | ) |
Accumulated other comprehensive (loss) income at December 31, 2024 | | $ | (16,383 | ) | | | $ | 637 | | | $ | (15,746 | ) |
(1)Represents the change in fair value of interest rate hedge agreements designated as a cash flow hedges. The fair value of the interest rate hedge agreements was recorded in other comprehensive income, net of tax, and will be reclassified to earnings when earnings are impacted by the hedged items, as interest payments are made on the Credit Facility from through June 27, 2028. See additional details of the hedge agreements in Note 12 - Derivative Instruments and Hedging Activities.
(2)The Company expects to reclassify $0.8 million in unrealized gains related to the Change in Fair Value of Interest Rate Hedge Agreement from accumulated other comprehensive loss into earnings during the next 12 months.
(3)The Company’s effective tax rate for the years ended December 31, 2024, 2023, and 2022 was 20.2%, 14.4%, and 23.5%, respectively.
Share Repurchases
The Company’s current approved share repurchase program allows for share repurchases in the aggregate up to $300.0 million under approved share repurchase plans pursuant to Rules 10b5-1 and 10b-18 under the Exchange Act. The repurchase program and the authorized amount have no expiration date. On an annual basis, the Credit Facility (see Note 10 – Long-Term Debt) permits share repurchases of at least $25.0 million provided that the Company is not in default of its covenants, and higher amounts provided that the Company’s Consolidated Leverage Ratio, prior to and after giving effect to such repurchases, is 0.50 to 1.00 less than the then-applicable maximum Consolidated Leverage Ratio and subject to the Company having net liquidity of at least $100.0 million after giving effect to such repurchases.
Purchases under this program may be made from time to time at prevailing market prices in open market purchases or in privately negotiated transactions pursuant to Rule 10b-18 under the Exchange Act and in accordance with applicable insider trading and other securities laws and regulations. The purchases are funded from existing cash balances and/or borrowings, and the repurchased shares are held in treasury. The timing and extent to which the Company repurchases its shares will depend on market conditions and other corporate considerations in the Company’s sole discretion.
For the years ended December 31, 2024 and 2023, the Company used $44.4 million to repurchase 327,321 shares at an average price of $135.77 per share and $18.1 million to repurchase 180,000 shares at an average price of $100.70 per share, respectively, under this program. As of December 31, 2024, approximately $149.3 million of authority remained available under the share repurchase plan.
Employee Stock Purchase Plan
The Company has an Employee Stock Purchase Plan (“ESPP”) under which one million shares have been authorized for issuance. The ESPP allows eligible employees to purchase shares of the Company’s common stock through payroll deductions up to $25,000 per calendar year, per Internal Revenue Services rules, over six-month offering periods at a discount not to exceed 5% of the market value on the date of each purchase period, and therefore the Company does not have any compensation expense related to the ESPP. For the years ended December 31, 2024 and 2023, employees purchased a total of 40,987 and 36,140 shares at an average purchase price of $125.20 and $121.96, respectively. At December 31, 2024 and 2023, there were 507,845 and 548,832 shares remaining available for future issuance under this plan.
NOTE 15 - INCOME TAXES
The domestic and foreign components of income before provision for income taxes are as follows for the years ended December 31:
| | | | | | | | | | | | |
| | 2024 | | | 2023 | | | 2022 | |
Domestic | | $ | 134,068 | | | $ | 83,742 | | | $ | 80,372 | |
Foreign | | | 3,990 | | | | 12,805 | | | | 3,608 | |
Income before income taxes | | $ | 138,058 | | | $ | 96,547 | | | $ | 83,980 | |
Income tax expense consisted of the following for the years ended December 31:
| | | | | | | | | | | | |
| | 2024 | | | 2023 | | | 2022 | |
Current: | | | | | | | | | |
Federal | | $ | 41,276 | | | $ | 28,108 | | | $ | 8,413 | |
State | | | 16,851 | | | | 10,380 | | | | 2,686 | |
Foreign | | | 1,647 | | | | 2,247 | | | | 1,661 | |
Total current | | | 59,774 | | | | 40,735 | | | | 12,760 | |
Deferred: | | | | | | | | | |
Federal | | | (21,055 | ) | | | (20,279 | ) | | | 4,264 | |
State | | | (10,861 | ) | | | (6,915 | ) | | | 3,607 | |
Foreign | | | 30 | | | | 394 | | | | (894 | ) |
Total deferred | | | (31,886 | ) | | | (26,800 | ) | | | 6,977 | |
Income tax expense | | $ | 27,888 | | | $ | 13,935 | | | $ | 19,737 | |
Deferred income taxes reflect the net tax effects of temporary differences between the carrying amounts of assets and liabilities for financial reporting purposes and income tax purposes.
Deferred tax assets (liabilities) consisted of the following at December 31:
| | | | | | | | |
| | 2024 | | | 2023 | |
Deferred Tax Assets | | | | | | |
Allowance for expected credit losses | | $ | 1,648 | | | $ | 1,213 | |
Accrued paid time off | | | 3,525 | | | | 3,039 | |
State net operating loss carryforward | | | 456 | | | | 500 | |
Stock-based compensation | | | 6,076 | | | | 5,523 | |
Deferred compensation | | | 6,568 | | | | 5,765 | |
Foreign tax credits | | | 8,151 | | | | 8,035 | |
State tax credits | | | 1,923 | | | | 686 | |
Foreign exchange | | | 4,345 | | | | 3,591 | |
Foreign deferred | | | 333 | | | | 441 | |
Accrued bonus | | | 6,393 | | | | 5,830 | |
Capital loss | | | 1,020 | | | | 1,054 | |
Facilities impairment | | | 2,611 | | | | 3,092 | |
Capitalized research expenses | | | 70,617 | | | | 47,019 | |
Depreciation | | | 402 | | | | — | |
Accrued liabilities and other | | | 1,364 | | | | 2,682 | |
Lease liabilities | | | 54,263 | | | | 58,538 | |
| | | 169,695 | | | | 147,008 | |
Less: Valuation Allowance | | | (9,627 | ) | | | (9,021 | ) |
Total Deferred Tax Assets | | | 160,068 | | | | 137,987 | |
| | | | | | |
Deferred Tax Liabilities | | | | | | |
Payroll taxes | | | (939 | ) | | | (725 | ) |
Unbilled revenue | | | (184 | ) | | | (284 | ) |
Depreciation | | | — | | | | (2,128 | ) |
Amortization | | | (108,009 | ) | | | (107,201 | ) |
Deferred gain and other | | | (2,543 | ) | | | (2,202 | ) |
Lease assets - right-of-use | | | (46,790 | ) | | | (51,622 | ) |
Total Deferred Tax Liabilities | | | (158,465 | ) | | | (164,162 | ) |
Total Net Deferred Tax Assets (Liabilities) | | $ | 1,603 | | | $ | (26,175 | ) |
The Company measures certain deferred tax assets and liabilities based on the rates at which they are expected to reverse in the future, which is 27.0%.
Effective for tax years beginning after January 1, 2022, research and development costs are required to be capitalized and amortized over a period of five years for domestic and fifteen years for foreign research and development for income tax purposes. As a result of the capitalization, the Company recognized increases of $23.6 million and $28.1 million in deferred tax asset for the years ended December 31, 2024 and 2023, respectively.
As of December 31, 2024, the cumulative foreign tax credit carryforward balance increased by approximately $0.1 million and the valuation allowance required increased by approximately $0.1 million. No additional income taxes have been provided for any undistributed foreign earnings not subject to the transition tax. No additional deferred income taxes have been provided for the $5.0 million of additional favorable outside basis differences inherent in these foreign entities as of December 31, 2024 because these amounts continue to be permanently reinvested in foreign operations.
As of December 31, 2024, the Company has net operating loss (“NOL”) carryforwards for state income tax purposes of approximately $5.9 million, which expire between 2029 and 2034. The Company acquired these NOLs as a result of its purchase of a business in November 2014. IRC Section 382 imposes an annual limitation on the use of a corporation’s NOLs, tax credits and other carryovers after an “ownership change” occurs. Section 382 imposes an annual limitation on the amount of post-ownership change taxable income a corporation may offset with pre-ownership change NOLs and credits. In general, the annual limitation is determined by multiplying the value of the corporation’s stock immediately before the ownership change (subject to certain adjustments) by the applicable long-term tax-exempt rate. Any unused portion of the annual limitation is available for use in future years until such NOLs are scheduled to expire (in general, NOLs may be carried forward 15 to 20 years). The Company established a full valuation allowance of approximately $0.5 million against the portion of the deferred tax asset which it is more-likely-than-not that it will not be recoverable (e.g. expiration of the statute of limitations, etc.)
As of December 31, 2024, the Company had gross state income tax credit carryforwards of approximately $2.4 million, which expire between 2025 and 2035. A deferred tax asset of approximately $1.9 million, net of federal benefit, has been established related to these state income tax credit carryforwards as of December 31, 2024.
The need to establish valuation allowances for deferred assets is based on a more-likely-than-not threshold that the benefit of such assets will be realized in future periods. Appropriate consideration has been given to all available evidence, including historical operating results, projections of taxable income, and tax planning alternatives. The Company concluded that a $0.4 million valuation allowance was required for tax attributes related to specified state jurisdictions, a $1.0 million valuation allowance was required for tax attributes related to capital loss carryforwards, and an additional $8.1 million valuation allowance is required against our U.S. foreign tax credit carryforwards.
The total amount of unrecognized tax benefits as of December 31, 2024 and 2023 was $25.8 million and $24.1 million, respectively, which includes $15.0 million and $9.0 million, respectively, of tax positions that, if recognized, would impact the effective rate. The unrecognized tax benefits and the related accrued interest are part of other long-term liabilities on the Company’s consolidated balance sheets.
The components of unrecognized tax benefits, excluding penalty and interest, are as follows at December 31:
| | | | | | | | |
| | 2024 | | | 2023 | |
U.S. transfer pricing | | $ | — | | | $ | 145 | |
India transfer pricing | | | — | | | | 164 | |
Section 41 tax credit | | | 15,042 | | | | 8,736 | |
Section 174 expense capitalization | | | 10,798 | | | | 15,086 | |
Total | | $ | 25,840 | | | $ | 24,131 | |
The unrecognized tax benefit reconciliation, excluding penalty and interest, is as follows:
| | | | |
Unrecognized tax benefits at January 1, 2022 | | $ | 450 | |
Decrease attributable to tax positions taken during the current period | | | (305 | ) |
Unrecognized tax benefits at December 31, 2022 | | | 145 | |
Increase attributable to tax positions taken during a prior period | | | 19,845 | |
Increase attributable to tax positions taken during the current period | | | 4,141 | |
Unrecognized tax benefits at December 31, 2023 | | | 24,131 | |
Decrease attributable to tax positions taken during a prior period | | | (4,597 | ) |
Increase attributable to tax positions taken during the current period | | | 6,306 | |
Unrecognized tax benefits at December 31, 2024 | | | 25,840 | |
The Company’s 2021, 2022, and 2023 tax years remain subject to examination by the Internal Revenue Service for federal tax purposes. Certain significant state and foreign tax jurisdictions are also either currently under examination or remain open under the statutes of limitation and subject to examination for the tax years from 2020, 2021, 2022, and 2023.
Although the Company believes it has adequately provided for all uncertain tax positions, amounts asserted by taxing authorities could be greater than the Company’s accrued position. Accordingly, additional provisions on federal, state, and foreign income tax related matters could be recorded in the future as revised estimates are made or the underlying matters are effectively settled or otherwise resolved. Conversely, the Company could settle positions with the tax authorities for amounts lower than have been accrued. The Company believes it is reasonably possible that, during the next 12 months, the Company’s liability for uncertain tax positions may not change.
The Company’s provision for income taxes differs from the federal statutory rate. The differences between the statutory rate and the Company’s provision are as follows for the years ended December 31:
| | | | | | | | | | | | |
| | 2024 | | | 2023 | | | 2022 | |
Taxes at statutory rate | | | 21.0 | % | | | 21.0 | % | | | 21.0 | % |
State taxes, net of federal benefit | | | 6.0 | % | | | 6.0 | % | | | 5.8 | % |
Foreign tax rate differential | | | (0.1 | )% | | | (0.2 | )% | | | 0.1 | % |
Executive compensation | | | 1.8 | % | | | 1.7 | % | | | 2.2 | % |
Other permanent differences | | | (0.4 | )% | | | (0.3 | )% | | | 2.0 | % |
Global intangible low-taxed income (GILTI) | | | — | | | | 0.3 | % | | | — | |
Prior year tax adjustments | | | (2.0 | )% | | | (6.4 | )% | | | (1.1 | )% |
Deferred impact of state rate change | | | 0.1 | % | | | 0.5 | % | | | 0.6 | % |
Worthless stock deduction | | | — | | | | (5.1 | )% | | | (4.6 | )% |
Unrecognized tax benefits | | | 4.0 | % | | | 9.0 | % | | | (0.4 | )% |
Capital loss | | | — | | | | (3.8 | )% | | | — | |
Valuation allowance | | | 1.3 | % | | | 2.0 | % | | | 0.7 | % |
Equity-based compensation | | | (1.7 | )% | | | (1.1 | )% | | | (1.3 | )% |
Tax credits | | | (9.8 | )% | | | (9.2 | )% | | | (1.5 | )% |
Taxes at effective rate | | | 20.2 | % | | | 14.4 | % | | | 23.5 | % |
During 2023, the Company restructured the ownership of its Canadian entities for tax purposes resulting in a 3.8% decrease in the Company’s effective income tax rate for the year ended December 31, 2023.
During 2023, the Company liquidated one of its U.K. subsidiaries as part of the wind-down of its commercial marketing business resulting in a reduction in the Company’s effective income tax rate of 5.1% for the year ended December 31, 2023.
During 2024 and 2023, the Company completed its annual true-up of the prior year income tax provision in connection with the filing of its U.S. federal & state income tax returns. As a result of that process, the Company recorded changes in the estimate of certain tax credits it is eligible to claim with its income tax return filings that resulted in decreases of 2.0% and 6.4%, respectively, in the Company’s effective income tax rates for the years ended December 31, 2024 and 2023.
NOTE 16 - STOCK-BASED COMPENSATION
Stock Incentive Plans
On June 1, 2023, the Company’s stockholders approved an amendment and restatement of the 2018 Omnibus Plan (the “2018 A&R Omnibus Plan”) which increased the number of shares available for issuance to 2,050,000 shares using stock options, stock appreciation rights, restricted stock, RSUs, performance units and PSAs, cash-based awards, and other stock-based awards to all key officers, key employees, and non-employee directors of the Company. As of December 31, 2024, the Company had approximately 1,016,040 shares available for grant under the A&R 2018 Omnibus Plan.
Stock-based compensation expense is included as part of direct costs and indirect and selling expenses on the consolidated statements of comprehensive income. The total stock-based compensation expense for the years ended December 31, 2024, 2023, and 2022, the unrecognized compensation expense at December 31, 2024, and the weighted-average period to recognize the remaining unrecognized shares are as follows:
| | | | | | | | | | | | | | | | | | | | |
| | Stock-Based Compensation Expense | |
| | Recognized
as of December 31, | | | Unrecognized
as of December 31, | |
| | 2024 | | | 2023 | | | 2022 | | | 2024 | | | Weighted
Average
Period to
Recognize
(years) | |
Restricted Stock Units | | $ | 10,654 | | | $ | 9,413 | | | $ | 9,300 | | | $ | 13,910 | | | | 1.5 | |
Cash-Settled Restricted Stock Units | | | 8,341 | | | | 8,061 | | | | 5,709 | | | | 7,648 | | | | 1.3 | |
Non-Employee Director Awards | | | 972 | | | | 1,029 | | | | 1,087 | | | | 408 | | | | 0.4 | |
Performance Shares | | | 5,096 | | | | 4,416 | | | | 2,784 | | | | 5,177 | | | | 1.4 | |
Total | | $ | 25,063 | | | $ | 22,919 | | | $ | 18,880 | | | $ | 27,143 | | | | |
The stock-based compensation expense is deductible for income tax purposes. For the years ended December 31, 2024, 2023, and 2022, the Company recognized excess income tax benefits of $2.4 million, $1.1 million, and $1.1 million, respectively, related to stock-based compensation.
Restricted Stock Units
RSUs generally have a vesting term of three years. On vesting the employee is issued one share of stock for each RSU awarded. The fair value of shares vested was $10.3 million, $7.3 million, and $10.8 million for the years ended December 31, 2024, 2023, and 2022, respectively.
A summary of the Company’s RSUs is presented below.
| | | | | | | | | | | | |
| | Number of
Shares | | | Weighted-
Average
Grant Date
Fair Value | | | Aggregate
Intrinsic
Value | |
Non-vested RSUs at January 1, 2022 | | | 303,836 | | | $ | 79.17 | |
| | |
Granted | | | 148,361 | | | $ | 93.70 | |
| | |
Vested | | | (140,666 | ) | | $ | 76.53 | |
| | |
Cancelled | | | (26,705 | ) | | $ | 77.16 | | | | |
Non-vested RSUs at December 31, 2022 | | | 284,826 | | | $ | 88.23 | | | | |
Granted | | | 89,388 | | | $ | 110.80 | | | | |
Vested | | | (93,881 | ) | | $ | 78.05 | | | | |
Cancelled | | | (21,815 | ) | | $ | 94.01 | | | | |
Non-vested RSUs at December 31, 2023 | | | 258,518 | | | $ | 99.25 | | | | |
Granted | | | 86,428 | | | $ | 153.22 | | | | |
Vested | | | (107,168 | ) | | $ | 95.65 | | | | |
Cancelled | | | (26,807 | ) | | $ | 109.79 | | | | |
Non-vested RSUs at December 31, 2024 | | | 210,971 | | | $ | 121.86 | | | $ | 25,150 | |
RSUs expected to vest in the future | | | 192,949 | | | $ | 120.99 | | | $ | 23,002 | |
The aggregate intrinsic value in the preceding table is based on the Company’s closing stock price of $119.21 per share as of December 31, 2024.
Cash-Settled Restricted Stock Units
CSRSUs generally have a vesting term of three years. The fair value of CSRSUs vested and settled in cash for the years ended December 31, 2024, 2023, and 2022 was $7.8 million, $7.9 million and $6.6 million, respectively. A summary of the Company’s CSRSUs is presented below.
| | | | | | | | | | | | |
| | Number of
Shares | | | Weighted-
Average
Grant Date
Fair Value | | | Aggregate
Intrinsic
Value | |
Non-vested CSRSUs at January 1, 2022 | | | 166,260 | | | $ | 72.79 | |
| | |
Granted | | | 115,024 | | | $ | 97.88 | |
| | |
Vested | | | (75,566 | ) | | $ | 73.20 | |
| | |
Cancelled | | | (17,299 | ) | | $ | 80.02 | |
| | |
Non-vested CSRSUs at December 31, 2022 | | | 188,419 | | | $ | 87.28 | |
| | |
Granted | | | 70,742 | | | $ | 110.65 | |
| | |
Vested | | | (81,537 | ) | | $ | 76.26 | |
| | |
Cancelled | | | (19,040 | ) | | $ | 91.94 | | | | |
Non-vested CSRSUs at December 31, 2023 | | | 158,584 | | | $ | 102.82 | | | | |
Granted | | | 38,653 | | | $ | 153.15 | | | | |
Vested | | | (58,078 | ) | | $ | 99.30 | | | | |
Cancelled | | | (9,424 | ) | | $ | 114.93 | | | | |
Non-vested CSRSUs at December 31, 2024 | | | 129,735 | | | $ | 118.51 | | | $ | 15,466 | |
CSRSUs expected to vest in the future | | | 117,615 | | | $ | 117.55 | | | $ | 14,021 | |
The aggregate intrinsic value in the preceding table is based on the Company’s closing stock price of $119.21 per share as of December 31, 2024.
Non-Employee Director Awards
The Company grants awards of registered shares to its non-employee directors on an annual basis under the A&R Omnibus Plan. A summary of the non-employee director awards is presented below:
| | | | | | | | | | | | |
| | Number of
Shares | | | Weighted-
Average Grant
Date Fair
Value | | | Aggregate
Intrinsic
Value | |
Non-vested RSUs at January 1, 2022 | | | 5,586 | | | $ | 90.73 | | | | |
Granted | | | 11,399 | |
| $ | 95.35 | | | | |
Vested | | | (11,637 | ) | | $ | 93.39 | | | | |
Cancelled | | | — | |
| $ | — | | | | |
Non-vested RSUs at December 31, 2022 | | | 5,348 | | | $ | 94.79 | | | | |
Granted | | | 8,211 | | | $ | 127.81 | | | | |
Vested | | | (9,457 | ) | | $ | 109.14 | | | | |
Cancelled | | | — | | | $ | — | | | | |
Non-vested RSUs at December 31, 2023 | | | 4,102 | | | $ | 127.81 | | | | |
Granted | | | 6,618 | | | $ | 135.91 | | | | |
Vested | | | (7,414 | ) | | $ | 131.43 | | | | |
Cancelled | | | — | | | $ | — | | | | |
Non-vested RSUs at December 31, 2024 | | | 3,306 | |
| $ | 135.91 | | | $ | 394 | |
RSUs expected to vest in the future | | | 3,306 | | | $ | 135.91 | | | $ | 394 | |
The aggregate intrinsic value in the preceding table is based on the Company’s closing stock price of $119.21 per share as of December 31, 2024.
Performance Share Awards
In 2015, the Board approved a performance-based share program (the “Program”) that provides for the issuance of PSAs to its senior management. Under the Program, the number of PSAs that the participant will receive depends on the Company’s achievement of two performance goals during two performance periods. The performance goals under the Program are based on (i) the Company’s compounded annual growth rate in EPS (adjusted to exclude certain items specified in the award’s agreement) during a two-year performance period (the “Initial Period”) and (ii) the Company’s cumulative total shareholder return relative to its peer group (“rTSR”) during a performance period from the first day of the performance period (typically January 1 of the year awarded) to the last day of the third year of the performance period (typically December 31). The PSAs will only be eligible to vest following the expiration of the three-year performance period. The actual shares vested will be subject to both continued employment by the Company (barring certain exceptions allowing for partial performance periods) and actual financial measures achieved. The final number of shares of common stock that will be issued to each participant at the end of the applicable performance period will be determined by multiplying the award by the product of two percentages: the first based on the Company’s EPS performance and the second based on the Company’s rTSR performance, subject to a minimum and maximum performance level. As of December 31, 2024, shares granted during 2022, 2023, and 2024 are within year three, two, and one of the performance periods, respectively, and therefore have not fully vested. A total of 46,630 shares granted in 2021 vested during 2024 after meeting the performance goals. As of December 31, 2024, a total of 59,863 shares granted in 2022 and 2023 are expected to vest in the future based on estimated financial measures achieved in the Initial Period and rTSR performance.
A summary of the Company’s PSAs is presented below.
| | | | | | | | | | | | |
| | Number of
Shares | | | Weighted-
Average Grant
Date Fair Value | | | Aggregate
Intrinsic
Value | |
Non-vested PSAs at January 1, 2022 | | | 133,079 | | | $ | 76.54 | | | | |
Granted | | | 38,412 | | | $ | 93.15 | | | | |
Vested | | | (47,634 | ) | | $ | 82.38 | | | | |
Cancelled | | | (3,170 | ) | | $ | 80.64 | | | | |
Non-vested PSAs at December 31, 2022 | | | 120,687 | | | $ | 79.42 | | | | |
Granted | | | 36,956 | | | $ | 115.67 | | | | |
Vested | | | (45,141 | ) | | $ | 58.76 | | | | |
Cancelled | | | (6,934 | ) | | $ | 61.49 | | | | |
Non-vested PSAs at December 31, 2023 | | | 105,568 | | | $ | 102.12 | | | | |
Granted | | | 41,365 | | | $ | 143.97 | | | | |
Vested | | | (46,630 | ) | | $ | 95.72 | | | | |
Cancelled | | | (4,198 | ) | | $ | 114.91 | | | | |
Non-vested PSAs at December 31, 2024 | | | 96,105 | | | $ | 122.68 | | | $ | 11,457 | |
PSAs expected to vest in the future | | | 59,863 | | | $ | 138.01 | | | $ | 7,136 | |
The aggregate intrinsic value in the preceding table is based on the Company’s closing stock price of $119.21 per share as of December 31, 2024.
The fair value of the awards is estimated on the grant date using a Monte Carlo simulation model due to the market condition for the rTSR component. The fair value assumptions using the Monte Carlo simulation model for awards granted in 2024, 2023, and 2022 were:
| | | | | | | | | | | | |
| | 2024 | | | 2023 | | | 2022 | |
Dividend Yield | | | 0.4 | % | | | 0.5 | % |
| | 0.6 | % |
Historical Volatility | | | 29.3 | % | | | 33.6 | % |
| | 39.0 | % |
Risk-Free Rate of Returns | | | 4.4 | % | | | 3.8 | % |
| | 2.1 | % |
NOTE 17 – ACQUISITIONS AND DIVESTITURES
Acquisitions
Applied Energy Group, Inc.
On December 31, 2024, the Company completed the acquisition of Applied Energy Group, Inc. (“AEG”), an energy technology and advisory services company, for $60.7 million in cash consideration. The purchase price is subjected to net working capital adjustments expected to be completed within ninety days. AEG provides a suite of integrated technology and advisory solutions to electric and gas utilities, state and local governments, and state energy offices nationwide which will further enhance the Company’s service offering and client footprint.
As part of the preliminary allocation of the purchase consideration, the Company recorded the following:
| | | |
Net working capital | $ | 4,049 | |
Property and equipment | | 55 | |
Customer-related intangibles | | 21,000 | |
Developed technology | | 5,000 | |
Trade names and trademarks | | 350 | |
Goodwill | | 30,200 | |
Purchase considerations | $ | 60,654 | |
Net working capital includes restricted cash of $5.6 million, accounts receivable of $4.5 million, and accrued expenses of $5.7 million.
The finalization of allocation is expected to be completed by the second quarter of 2025, and is currently open primarily for final net working capital adjustments, valuation of acquired intangibles, and computation of deferred revenue.
The estimated useful lives of acquired intangible assets are as follows:
| |
Customer-related intangibles | 9.0 years |
Developed technology | 6.0 years |
Trade names and trademarks | 1.0 year |
The goodwill is attributable to the workforce of AEG and expected synergies with the Company. Goodwill has an indefinite life, and is deductible for income tax purposes. The pro-forma impact of the acquisition is not material to the Company’s results of operations.
CMY Solutions, LLC
On May 1, 2023, the Company acquired CMY Solutions, LLC (“CMY”), a privately-held company that provides engineering and automation solutions to utilities and organizations, for $32.6 million in cash. The acquisition enhances the Company’s offerings in the field of power and energy advisory services.
As part of the allocation of purchase consideration, the Company recorded the following:
| | | |
Net working capital | $ | 1,169 | |
Customer-related intangibles | | 9,900 | |
Trade names and trademarks | | 100 | |
Goodwill | | 21,366 | |
Purchase considerations | $ | 32,535 | |
The estimated useful lives of acquired intangible assets are as follows:
| |
Customer-related intangibles | 5 years |
Trade names and trademarks | 1 year |
Goodwill has an indefinite life and is deductible for income tax purposes. The pro-forma impact of the acquisition is not material to the Company’s results of operations.
Blanton & Associates
On September 1, 2022, the Company completed the acquisition of Blanton & Associates (“Blanton”), an environmental consulting, planning, and project management firm headquartered in Austin, Texas, for $22.9 million. Blanton brought domain expertise in environmental regulatory compliance and permitting for the transportation, renewable energy, water, and resource management sectors and added technically specialized staff in all aspects of environmental services to the Company.
As part of the allocation of the purchase consideration, the Company recorded the following:
| | | |
Net working capital | $ | 4,604 | |
Property and equipment | | 159 | |
Customer-related intangibles | | 10,919 | |
Contract backlog | | 466 | |
Trade names and trademarks | | 60 | |
Goodwill | | 9,712 | |
Deferred income tax liabilities | | (3,023 | ) |
Purchase consideration | $ | 22,897 | |
The estimated useful lives of acquired intangible assets are as follows:
| |
Customer-related intangibles | 11 years |
Contract backlog | 3 years |
Trade names and trademarks | 0.3 year |
Goodwill has an indefinite life and is not deductible for income tax purposes. The pro-forma impact of the acquisition is not material to the Company’s results of operations.
SemanticBits, LLC
On July 13, 2022, the Company completed the acquisition of SemanticBits, LLC (“SemanticBits”), a 450-person Virginia limited liability company. SemanticBits is a partner to U.S. federal health agencies for mission-critical digital modernization solutions and provides a suite of scalable digital modernization services using open-source frameworks, including end-to-end agile scale
development capabilities, cloud-native solutions, data analytics and human-centered designs. The acquisition provides synergies and scalabilities to support federal agencies with advanced IT solutions, digital modernization, and health expertise to solve complex customer challenges.
The purchase price was $216.0 million in cash and was funded by the existing Credit Facility. The final purchase price allocation is summarized as follows:
| | | |
Contract receivables | $ | 12,699 | |
Contract assets | | 6,071 | |
Customer-related intangibles | | 62,967 | |
Trade names and trademarks | | 1,120 | |
Other current and non-current assets | | 407 | |
Accrued salaries and benefits | | (3,998 | ) |
Accrued expenses and other liabilities | | (6,244 | ) |
Deferred tax liability | | (16,701 | ) |
Net assets acquired | | 56,321 | |
Goodwill | | 159,677 | |
Purchase consideration | $ | 215,998 | |
The estimated useful lives of acquired intangible assets are as follows:
| |
Customer-related intangibles | 4.0 years |
Trade names and trademarks | 0.7 year |
Goodwill is reflective of the existing workforce of SemanticBits and the expected synergies created with the Company as part of the acquisition. Goodwill and intangible assets are not deductible for income tax purposes.
Acquisition-related costs and integration costs totaled $4.3 million and are included as part of indirect and selling expenses in the Company’s consolidated statements of comprehensive income.
For the year ended December 31, 2022, SemanticBits contributed revenues of $64.3 million and gross profit of $26.7 million. Computation of an earnings measure other than gross profit is impracticable due to SemanticBits’ operations and financial systems being integrated with those of the Company.
The following unaudited condensed pro forma information presents combined financial information as if the acquisition of SemanticBits had been effective at January 1, 2021, the beginning of the 2021 fiscal year, and as a result, fiscal year 2022 represents the pro forma results for year two of the acquisition. The pro forma information includes alignment of SemanticBits’ revenue recognition policy, corrections of employee-related expenses, and adjustments reflecting changes in the amortization of intangibles, acquisition-related costs, interest expense, and records income tax effects as if SemanticBits had been included in the Company’s results of operations.
| | | |
| (Unaudited) | |
| Year Ended | |
| 2022 | |
Revenue | $ | 1,856,399 | |
Net income | | 75,999 | |
The pro forma information is not intended to reflect the actual combined results of operations that would have occurred if the acquisition was completed on January 1, 2021, nor is it indicative of future operating results after the acquisition date of July 13, 2022.
Divestitures
Commercial Marketing
On September 12, 2023, the Company completed the divesture of its U.S. commercial marketing business for $47.1 million in cash. The disposal of the commercial marketing business was not a major strategic shift that was, or will be significant to the Company’s operations and financial results. For the years ended December 31, 2024 and 2023, the Company recorded pre-tax gain of $2.0 million and $2.5 million, that is included as part of other income on the Company’s consolidated statements of comprehensive income.
Mobile and SMS Messaging Aggregator Business
On November 1, 2023, the Company completed the divesture of its Canadian mobile and Short Message Service (“SMS”) messaging aggregator business for $5.4 million in cash. The disposal of the mobile aggregation and SMS messaging aggregator
business was not a major strategic shift that was, or will be, significant to the Company’s operations and financial results. In connection with the sale, the Company recorded a pre-tax gain of $3.2 million that is included as part of other income on the Company’s consolidated statements of comprehensive income.
NOTE 18 - EARNINGS PER SHARE
The Company’s EPS is computed by dividing reported net income by the weighted-average number of shares outstanding. Diluted EPS considers the potential dilution that could occur if common stock equivalents of stock options, RSUs, and PSAs were exercised or converted into stock. PSAs are included in the computation of diluted shares only to the extent that the underlying performance conditions: (i) are satisfied as of the end of the reporting period or (ii) would be considered satisfied if the end of the reporting period were the end of the related performance period and the result would be dilutive under the treasury stock method.
As of December 31, 2024, the PSAs granted during the year ended December 31, 2022 and 2023 met the related performance conditions for the initial performance period and were included in the calculation of diluted EPS; however, the PSAs granted during the year ended December 31, 2024 have not yet completed their initial two-year performance period and therefore were excluded in the calculation of diluted EPS.
The dilutive effect of stock options, RSUs, and performance shares for each period reported is summarized below:
| | | | | | | | | | | | |
| | 2024 | | | 2023 | | | 2022 | |
Net Income | | $ | 110,170 | | | $ | 82,612 | | | $ | 64,243 | |
| | | | | | | | | |
Weighted-average number of basic shares outstanding during the period | | | 18,747 | | | | 18,802 | | | | 18,818 | |
Dilutive effect of stock options, RSUs, and performance shares | | | 178 | | | | 192 | | | | 215 | |
Weighted-average number of diluted shares outstanding during the period | | | 18,925 | | | | 18,994 | | | | 19,033 | |
| | | | | | | | | |
Basic earnings per share | | $ | 5.88 | | | $ | 4.39 | | | $ | 3.41 | |
Diluted earnings per share | | $ | 5.82 | | | $ | 4.35 | | | $ | 3.38 | |
NOTE 19 - COMMITMENTS AND CONTINGENCIES
Letters of Credit and Guarantees
At December 31, 2024 and 2023, the Company had open standby letters of credit totaling $1.6 million and $1.8 million, respectively, and guarantees of $8.2 million and $7.9 million issued by its banks. The letters of credit and guarantees were primarily for the Company’s facility leases and contract performance obligations. The open standby letters of credit reduce the Company’s unused borrowing capacity under its Credit Facility.
Litigation and Claims
The Company is involved in various legal matters and proceedings arising in the ordinary course of business. While these matters and proceedings cause it to incur costs, including, but not limited to, attorneys’ fees, the Company currently believes it is not reasonably possible that any ultimate liability arising out of these matters and proceedings will have a material adverse effect on the Company’s financial position, results of operations, or cash flows.
NOTE 20 - EMPLOYEE BENEFIT PLANS
Defined Contribution Plan
Effective June 30, 1999, the Company established the ICF Consulting Group Retirement Savings Plan (the “Retirement Savings Plan”). The Retirement Savings Plan is a defined contribution profit sharing plan with a cash or deferred arrangement under Section 401(k) of the Internal Revenue Code. Participants are able to elect to defer up to 70% of their compensation, subject to statutory limitations, and are entitled to receive 100% employer matching contributions for the first 3% and 50% for the next 2% of their compensation. Contribution expense for the years ended December 31, 2024, 2023, and 2022 was $26.8 million, $25.4 million, and $22.9 million, respectively.
Deferred Compensation Plan
Certain key employees of the Company are eligible to defer a specified percentage of their cash compensation by having it contributed to a nonqualified deferred compensation plan. Eligible employees may elect to defer up to 80% of their base salary and up to 100% of performance bonuses, reduced by any amounts withheld for the payment of taxes or other deductions required by law. Participants are always 100% vested in their account balances. The Company funds its deferred compensation liabilities by making cash contributions to a Rabbi Trust (the “Trust”) at the time the salary or bonus being deferred would otherwise be payable to the employee. As of December 31, 2024, the liability to plan participants was $24.3 million which was materially funded by assets in the Trust. The deferred compensation plan does not have a material net impact on the Company’s results of operations.
NOTE 21 - EXIT ACTIVITIES
During the year ended December 31, 2023, the Company incurred and paid $2.5 million in retention and severance benefits related to the wind-down of its non-core commercial marketing and communication businesses in the U.K. and Belgium. The exit activity was completed as of December 31, 2023.
During the year ended December 31, 2023, the Company completed the divestitures of its non-core U.S. commercial marketing and Canadian mobile and SMS messaging aggregator businesses. As a result of the divestitures, the Company incurred and paid retention and severance benefits of $1.9 million and $1.7 million for the years ended December 31, 2023 and 2022, respectively, which was primarily recorded within direct costs. As part of the sale of the businesses, the Company incurred $0.6 million in related compensation expense which was recorded within indirect and selling expenses.
As a result of these wind-down and divestitures that were completed, the Company recorded impairment of $0.9 million related to a customer-related intangible from a prior acquisition, $3.0 million related to right-of-use operating leases, and accrued $2.4 million for other facility-related exit costs.
During the year ended December 31, 2022, the Company incurred charges related to: (i) the reduction and wind-down of certain non-core U.S. commercial marketing businesses, and (ii) the reduction of facilities utilized by the remaining elements of the commercial marketing group. Specifically, these charges included the impairment of certain right-of-use operating leases and related assets associated with exited facilities of $8.2 million, $4.8 million in other facility-related exit costs recorded within indirect and selling expenses, and retention and severance of $2.3 million primarily recorded within direct costs. Of the $2.3 million in retention and severance benefits, $1.3 million was paid during the 2022 fiscal year and the remaining liability was paid during the 2023 fiscal year.
NOTE 22 - SEGMENT INFORMATION AND GEOGRAPHIC DATA
The Company provides a broad array of professional services to its clients across several markets, primarily within the U.S. The Company operates as a single reportable and operating segment because the CODM, which is the Chief Executive Officer, manages the business activities on a consolidated basis. Although the Company disaggregates its revenue by client market and client type, it does not manage its business or allocate resources based on client market or type.
The CODM assesses performance of the segment based on consolidated net income that is reported on the Company’s consolidated statements of comprehensive income. The CODM uses consolidated net income to evaluate the Company’s performance against budgets and decide whether to use the profits to invest in the business, paydown debt, repurchase stock, pay dividends, or fund acquisitions. Asset information provided to the CODM is not used for the purposes of making decisions and assessing performance of the Company.
The segment revenue, significant segment expenses, and segment profit are as follows:
| | | | | | | | | | | | |
| | Year ended December 31, | |
| | 2024 | | | 2023 | | | 2022 | |
Revenue | | $ | 2,019,787 | | | $ | 1,963,238 | | | $ | 1,779,964 | |
Significant segment expenses: | | | | | | | | | |
Direct labor & related fringe costs | | | 775,239 | | | | 730,322 | | | | 639,861 | |
Subcontractors & other direct costs | | | 506,777 | | | | 534,696 | | | | 494,561 | |
Indirect and selling expenses | | | 518,453 | | | | 505,162 | | | | 486,863 | |
Depreciation and amortization | | | 20,484 | | | | 25,277 | | | | 21,482 | |
Amortization of intangible assets | | | 32,992 | | | | 35,461 | | | | 28,435 | |
Interest expense | | | 29,878 | | | | 39,952 | | | | 23,525 | |
Provision for income taxes | | | 27,888 | | | | 13,935 | | | | 19,737 | |
Other segment (income) expense (1) | | | (2,094 | ) | | | (4,179 | ) | | | 1,257 | |
Net Income | | $ | 110,170 | | | $ | 82,612 | | | $ | 64,243 | |
(1) Other segment income (expenses) includes interest income, foreign currency expense, and gains/losses on disposition of assets.
Other Segment Information and Geographic Data
Revenue is attributed to the country where the contract is awarded by the client. There was no single foreign country that individually accounted for 10% or more of total revenue for the years ended December 31, 2024, 2023, and 2022. The following table provide net revenue for the Company’s home country and foreign countries:
| | | | | | | | | | | | |
| | Year ended December 31, | |
| | 2024 | | | 2023 | | | 2022 | |
Revenue: | | | | | | | | | |
U.S. | | $ | 1,869,105 | | | $ | 1,832,562 | | | $ | 1,644,737 | |
Other countries | | | 150,682 | | | | 130,676 | | | | 135,227 | |
Total revenue | | $ | 2,019,787 | | | $ | 1,963,238 | | | $ | 1,779,964 | |
At December 31, 2024 and 2023, long-lived assets were primarily held in the U.S. There was no single foreign country that individually held more than 10% of the total long-lived assets. The following table provide long-lived assets held in the Company’s home country and in foreign countries:
| | | | | | | | |
| | December 31, | |
| | 2024 | | | 2023 | |
Long-lived assets: | | | | | | |
U.S. | | $ | 65,045 | | | $ | 71,791 | |
Other countries | | | 3,073 | | | | 4,157 | |
Total long-lived assets | | $ | 68,118 | | | $ | 75,948 | |
NOTE 23 - SUBSEQUENT EVENTS
As of February 25, 2025, the Company repurchased 258,218 shares at a total cost of $30.5 million, or $118.14 per share pursuant to the Plan authorized by the Company's board of directors (see Note 14 - Stockholders’ Equity - Share Repurchases).
Subsequent to December 31, 2024, and through February 25, 2025, pursuant to the recent executive orders issued by the Administration or actions by DOGE, the Company received notices for termination-for-convenience of approximately $276 million and for stop-work orders of approximately $99 million.
Schedule II - Valuation and Qualifying Accounts
Allowance for Credit Losses
| | | | | | | | | | | |
| 2024 | | | 2023 | | | 2022 | |
Balance at beginning of period | $ | 5,435 | | | $ | 6,112 | |
| $ | 7,741 | |
Provision for credit losses | | 1,673 | | | | 1,164 | |
| | 248 | |
Write-offs, net of recoveries | | (357 | ) | | | (1,886 | ) |
| | (1,782 | ) |
Effect of foreign currency translation | | (50 | ) | | | 45 | | | | (95 | ) |
Balance at end of period | $ | 6,701 | | | $ | 5,435 | |
| $ | 6,112 | |
Income Tax Valuation Allowance
| | | | | | | | | | | |
| 2024 | | | 2023 | | | 2022 | |
Balance at beginning of period | $ | 9,021 | | | $ | 7,607 | |
| $ | 7,048 | |
Provision for income taxes - valuation allowance | | 606 | | | | 1,414 | |
| | 559 | |
Balance at end of period | $ | 9,627 | | | $ | 9,021 | |
| $ | 7,607 | |