UNITED STATES
SECURITIES AND EXCHANGE COMMISSION
Washington, D.C. 20549
FORM N-CSR
CERTIFIED SHAREHOLDER REPORT OF REGISTERED
MANAGEMENT INVESTMENT COMPANIES
Investment Company Act file number | 811-21903 |
|
Nuveen Global Equity Income Fund |
(Exact name of registrant as specified in charter) |
|
Nuveen Investments
333 West Wacker Drive
Chicago, IL 60606 |
(Address of principal executive offices) (Zip code) |
|
Kevin J. McCarthy Nuveen Investments 333 West Wacker Drive Chicago, IL 60606 |
(Name and address of agent for service) |
|
Registrant’s telephone number, including area code: | (312) 917-7700 | |
|
Date of fiscal year end: | December 31 | |
|
Date of reporting period: | December 31, 2014 | |
| | | | | | |
Form N-CSR is to be used by management investment companies to file reports with the Commission not later than 10 days after the transmission to stockholders of any report that is required to be transmitted to stockholders under Rule 30e-1 under the Investment Company Act of 1940 (17 CFR 270.30e-1). The Commission may use the information provided on Form N-CSR in its regulatory, disclosure review, inspection, and policymaking roles.
A registrant is required to disclose the information specified by Form N-CSR, and the Commission will make this information public. A registrant is not required to respond to the collection of information contained in Form N-CSR unless the Form displays a currently valid Office of Management and Budget (“OMB”) control number. Please direct comments concerning the accuracy of the information collection burden estimate and any suggestions for reducing the burden to Secretary, Securities and Exchange Commission, 450 Fifth Street, NW, Washington, DC 20549-0609. The OMB has reviewed this collection of information under the clearance requirements of 44 U.S.C. ss. 3507.
ITEM 1. REPORTS TO SHAREHOLDERS

Nuveen Investments
Closed-End Funds
Annual Report December 31, 2014
JGV
Nuveen Global Equity Income Fund
NUVEEN INVESTMENTS ACQUIRED BY TIAA-CREF
On October 1, 2014, TIAA-CREF completed its previously announced acquisition of Nuveen Investments, Inc., the parent company of your fund's investment adviser, Nuveen Fund Advisors, LLC ("NFAL") and the Nuveen affiliates that act as sub-advisers to the majority of the Nuveen Funds. TIAA-CREF is a national financial services organization with approximately $851 billion in assets under management as of December 31, 2014 and is a leading provider of retirement services in the academic, research, medical and cultural fields. Nuveen is operating as a separate subsidiary within TIAA-CREF's asset management business.

Chairman's Letter to Shareholders | | | 4 | | |
Portfolio Manager's Comments | | | 5 | | |
Share Information | | | 9 | | |
Risk Considerations | | | 12 | | |
Performance Overview and Holding Summaries | | | 13 | | |
Shareholder Meeting Report | | | 15 | | |
Report of Independent Registered Public Accounting Firm | | | 16 | | |
Portfolio of Investments | | | 17 | | |
Statement of Assets & Liabilities | | | 21 | | |
Statement of Operations | | | 22 | | |
Statement of Changes in Net Assets | | | 23 | | |
Financial Highlights | | | 24 | | |
Notes to Financial Statements | | | 26 | | |
Additional Fund Information | | | 34 | | |
Glossary of Terms Used in this Report | | | 36 | | |
Board Members & Officers | | | 39 | | |
Nuveen Investments
3
Chairman's Letter
to Shareholders

Dear Shareholders,
A pattern of divergence has emerged in the past year. Steady and moderate growth in the U.S. economy helped sustain the stock market's bull run another year. U.S. bonds also performed well, amid subdued inflation, interest rates that remained unexpectedly low and concerns about the economic well-being of the rest of the world. The stronger domestic economy enabled the U.S. Federal Reserve (Fed) to gradually reduce its large scale bond purchases, known as quantitative easing (QE), without disruption to the markets, as well as begin to set expectations for a transition into tightening mode.
The story outside the U.S., however, was different. European growth was stagnating and Japan fell into a recession, contributing to the bouts of volatility in their markets. China's economy decelerated and, despite running well above the rate of other major global economies, investors feared it looked slow by China's standards. Compounding these concerns were a surprisingly steep decline in oil prices, the U.S. dollar's rally and an increase in geopolitical tensions, including the Russia-Ukraine crisis and terrorist attacks across the Middle East and Africa, as well as more recently in Europe.
While a backdrop of healthy economic growth in the U.S. and the continuation of accommodative monetary policy (with the central banks of Japan and potentially Europe stepping in where the Fed has left off) bodes well for the markets, the global outlook has become more uncertain. Indeed, volatility is likely to feature more prominently in the investment landscape going forward. Such conditions underscore the importance of professional investment management. Experienced investment teams have weathered the market's ups and downs in the past and emerged with a better understanding of the sensitivities of their asset class and investment style, particularly in times of turbulence. We recognize the importance of maximizing gains, while striving to minimize volatility.
And, the same is true for investors like you. Maintaining an appropriate time horizon, diversification and relying on practiced investment teams are among your best strategies for achieving your long-term investment objectives. Additionally, I encourage you to communicate with your financial consultant if you have questions about your investment in a Nuveen Fund. On behalf of the other members of the Nuveen Fund Board, we look forward to continuing to earn your trust in the months and years ahead.

William J. Schneider
Chairman of the Board
February 23, 2015
Nuveen Investments
4
Portfolio Manager's
Comments
Nuveen Global Equity Income Fund (JGV)
The Fund's investment portfolio is managed by Tradewinds Global Investors, LLC, (Tradewinds), an affiliate of Nuveen Investments, Inc. Rod Parsley is portfolio manager for the Fund.
Effective January 2, 2014, the Fund's investment policies were revised to simplify the Fund's investment mandate to focus on global equities with attractive dividend potential and align it with the core investment capabilities of Tradewinds. The Fund now primarily invests (at least 80% of its managed assets) in equity securities, may opportunistically invest to a limited extent in debt securities and may not short equity securities. The Fund's name also changed to Nuveen Global Equity Income Fund effective January 24, 2014.
Here Rod reviews economic and market conditions, the management strategy and performance of the Fund for the twelve-month reporting period ended December 31, 2014.
What factors affected the U.S. economy and the financial markets during the twelve-month reporting period ended December 31, 2014?
During this reporting period, the U.S. economy continued to expand at a moderate pace. The Federal Reserve (Fed) maintained efforts to bolster growth and promote progress toward its mandates of maximum employment and price stability by holding the benchmark fed funds rate at the record low level of zero to 0.25% that it established in December 2008. At its October 2014 meeting, the Fed announced that it would end its bond-buying stimulus program as of November 1, 2014, after tapering its monthly asset purchases of mortgage-backed and longer-term Treasury securities from the original $85 billion per month to $15 billion per month over the course of seven consecutive meetings (December 2013 through September 2014). In making the announcement, the Fed cited substantial improvement in the outlook for the labor market since the inception of the current asset purchase program as well as sufficient underlying strength in the broader economy to support ongoing progress toward maximum employment in a context of price stability. The Fed also reiterated that it would continue to look at a wide range of factors, including labor market conditions, indicators of inflationary pressures and readings on financial developments, in determining future actions. Additionally, the Fed stated that it would likely maintain the current target range for the fed funds rate for a considerable time after the end of the asset purchase program, especially if projected inflation continues to run below the Fed's 2% longer-run goal. However, if economic data shows faster progress toward the Fed's employment and inflation objectives than currently anticipated, the Fed indicated that the first increase in the fed funds rate since 2006 could occur sooner than expected.
In the fourth quarter of 2014, the U.S. economy, as measured by the U.S. gross domestic product (GDP), grew at a 2.6% annual rate, compared with 4.6% in the second quarter and 5.0% in the third quarter of 2014. The decline in real GDP growth rate from the third quarter to the fourth quarter primarily reflects an upturn in imports, a downturn in federal
Certain statements in this report are forward-looking statements. Discussions of specific investments are for illustration only and are not intended as recommendations of individual investments. The forward-looking statements and other views expressed herein are those of the portfolio manager as of the date of this report. Actual future results or occurrences may differ significantly from those anticipated in any forward-looking statements and the views expressed herein are subject to change at any time, due to numerous market and other factors. The Fund disclaims any obligation to update publicly or revise any forward-looking statements or views expressed herein.
Ratings shown are the highest rating given by one of the following national rating agencies: Standard & Poor's (S&P), Moody's Investors Service, Inc. (Moody's) or Fitch, Inc. (Fitch). Credit ratings are subject to change. AAA, AA, A and BBB are investment grade ratings; BB, B, CCC, CC, C and D are below investment grade ratings. Certain bonds backed by U.S. Government or agency securities are regarded as having an implied rating equal to the rating of such securities. Holdings designated N/R are not rated by these national rating agencies.
Refer to the Glossary of Terms Used in this Report for further definition of the terms used within this section.
Nuveen Investments
5
Portfolio Manager's Comments (continued)
government spending, and decline in exports. These were partly offset by an upturn in consumer spending. The Consumer Price Index (CPI) rose 0.8% year-over-year as of December 2014, while the core CPI (which excludes food and energy) increased 1.6% during the same period, below the Fed's unofficial longer term inflation objective of 2.0%. As of December 31, 2014, the national unemployment rate was 5.6%, the lowest level since July 2008, down from the 6.7% reported in December 2013. The housing market continued to post gains, although price growth has shown signs of deceleration in recent months. The average home price in the S&P/Case-Shiller Index of 20 major metropolitan areas rose 4.7% for the twelve months ended November 2014 (most recent data available at the time this report was prepared).
As investor sentiment and risk aversion fluctuated throughout the reporting period, U.S. equities across the risk spectrum posted generally positive returns supported by solid corporate earnings, positive economic reports and continued accommodative monetary policy. During the first few months of this reporting period, the financial markets were unsettled in the aftermath of widespread uncertainty about the future of the Fed's quantitative easing program. Also contributing to investor concern was Congress's failure to reach agreement on the Fiscal 2014 federal budget, which had triggered sequestration, or automatic spending cuts and a 16-day federal government shutdown in October 2013. As we moved into 2014, investors quickly shook off these issues and the current bull market in the U.S. entered its sixth year. Then, midway through the first calendar quarter, investors grew concerned about the dampening effects of severe winter weather on near-term growth, firmer language from the Fed regarding potential stimulus withdrawal and mounting tensions with Russia over its territorial assertions in Ukraine. During the reporting period, global markets continued the theme of U.S. equities outperforming international equities, driven at least in part by a stronger U.S. dollar. The duration of this performance differential is a historical outlier. We believe non-U.S. improvement could arrive sooner than many expect. The U.S. is relatively strong in terms of GDP growth, the potential for interest rate normalization and subdued wage growth, among other positive factors and it naturally deserves a premium for those advantages. Though U.S. equities broadly appear fully-valued this does not necessarily signal a market peak, especially given the depth of the U.S. equity markets. In fact, we believe there are still many businesses that have been overlooked by the market that offer attractive potential at a reasonable price. We also believe the discounts present in practically every non-U.S. market are creating pockets of opportunity for investors to gain exposure to globally leading companies at inexpensive valuations. We believe many of these companies are ripe for being re-rated higher, even if their domiciles remain overshadowed by the U.S.
Recognition of U.S. economic outperformance has been prominently displayed in the sharply upward trending dollar seen since July 2014. We believe this state of affairs is quite different in nature from the safe haven strength seen in the dollar over recent years. Rather than falling back on the dollar as the least risky among many unappealing options, we believe currency investors are now actively positioning themselves to benefit from expectations of favorable U.S. economic development. The corollary to this dollar strength is, of course, a noticeable weakness in currencies like the yen and the Euro. We remain bearish on the Euro and the Yen versus the U.S. dollar.
Dollar appreciation was also a factor in weak oil prices during the reporting period, along with steeply rising oil production. Dramatically lower oil prices resulted in the energy sector leading the table of market detractors by a wide margin in 2014. Given the economic unsustainability of current oil prices, we believe it is inevitable that a recovery will take place.
What key strategies were used to manage the Fund during this twelve-month reporting period ended December 31, 2014?
The Fund seeks total return by investing primarily in a diversified global portfolio of value equity securities and by opportunistically writing covered-call options. The basic investment philosophy continues to be to search for good or improving business franchises around the globe whose securities are selling below their intrinsic value.
The Fund's portfolio manager and the Tradewinds research team are finding value across many sectors globally. As a result, sector over- and under-weights are less dramatic than in the past. We continue to find value in individual companies that
Nuveen Investments
6
differ from index holdings, so despite the more neutral sector exposures the individual positions continue to be differentiated. We believe that high conviction warrants concentration and thus the portfolio has become more concentrated than it was in the past. This has benefited the portfolio as a few specific securities have helped to drive the relative performance during the twelve-month reporting period. Additionally, because the portfolio consists of approximately 40 names, with more than roughly half of these names with over 2.0% of exposure, we believe there remains significant embedded value across the portfolio in names that have not yet appreciated to our estimate of their intrinsic value.
Covered-call options are primarily used to enhance yield. The Fund increased its exposure in covered-call options during the reporting period. We continue to opportunistically sell calls on a security-by-security basis. The Fund has shifted to focus more on equities and has trimmed most of its fixed income exposure. We believe that right now and for the foreseeable future the risk/reward is much more attractive for equities relative to fixed income. The compelling valuations in the equity market combined with the ability of certain companies to defend in a potentially rising rate environment make equity exposure more optimal than fixed income.
How did the Fund perform during this twelve-month reporting period ended December 31, 2014?
The table in the Performance Overview and Holding Summaries section of this report provides total return performance for the Fund for the one-year, five-year and since inception periods ended December 31, 2014. For the twelve-month reporting period ended December 31, 2014, the Fund's total return on net asset value (NAV) underperformed both its comparative Blended Benchmark and the MSCI All Country World Index.
The Fund's relative sector allocation effects were negative during the reporting period, but positive stock selections made up for that factor. Selections within the consumer discretionary sector led relative contribution, followed by telecommunication services and health care selections. Outperformance was limited primarily due to negative allocation and selection effects within the energy sector. Consumer staples and utilities selections were also key detractors from relative performance.
Several positions positively contributed to performance. Network technologies company Infoblox, Inc. was the leading contributor to performance. Investors seem to be pleased with the company's new CEO, as well as recent strong earnings. We believe the company is well-positioned for further growth in its business and we see further upside potential despite the company's prominent recent performance.
Discount retailer Big Lots, Inc. was another top contributor. The company announced much better-than-expected financial results in March 2014. Though expectations were admittedly fairly low, the retailer surpassed estimates for net sales, adjusted net income and same-store sales. The company also announced plans for a $125 million share buyback.
Fixed-line telecom/data provider CenturyLink, Inc. also contributed to performance. The company had suffered adverse effects from an unexpected February 2013 dividend cut, but revenue and operating earnings eventually turned positive even more quickly than we expected. We also believe CenturyLink may have an opportunity to restructure to unlock further value following the successful execution of such a move by a similar company. Accordingly, we continue to believe CenturyLink offers reasonable upside potential.
Those positions which contributed to the Fund's underperformance included the U.K.-based grocery chain operator Tesco PLC. The grocery chain has been challenged by weak revenues and earnings, as well as management changes, causing it to be the largest detractor during the reporting period. While it has been a difficult time for Tesco, we remain attracted to the company's scale advantages, brand strength and leading market positions. We believe there is a strong possibility for a turn-around under new management and with depressed valuations, we believe it will take little improvement to generate upside surprises. We continue to closely monitor developments in Tesco and are carefully considering our exposure as the company either continues to deteriorate or successfully navigates this challenging season.
Nuveen Investments
7
Portfolio Manager's Comments (continued)
Norwegian oil services company Aker Solutions ASA was another top detractor. The company has been negatively affected by the falling oil price environment. However, we believe the company is in a relatively resilient sub-sector of the energy space and that it has the balance sheet strength to navigate through this challenging period.
French oil/gas supplies firm Vallourec S.A. also detracted from performance. Like Aker Solutions, Vallourec has been hurt by substantial declines in the price of crude oil. As prices remain low, rig count is likely to stagnate and we believe the company will continue to see a reduction in shipment volumes in the near term. Although the current oil market presents a headwind, we believe Vallourec may be well positioned to benefit from the increasing use of horizontal wells associated with shale and deep-water drilling, which require significantly more steel tubing than conventional vertical wells and could bolster shipments despite the overall decline in production. We will continue to monitor this company closely to determine how comfortable we are with the upside in the long-term as the oil environment improves and exploration and production customer activity slowly recovers.
The covered call writing strategy contributed positively to the Fund's performance during the period as the majority of options written expired without being called away.
Nuveen Investments
8
DISTRIBUTION INFORMATION
The following information regarding the Fund's distributions is current as of December 31, 2014. The Fund's distribution levels may vary over time based on the Fund's investment activities and portfolio investment value changes.
The Fund has a managed distribution program. The goal of this program is to provide shareholders with relatively consistent and predictable cash flow by systematically converting the Fund's expected long-term return potential into regular distributions. As a result, regular distributions throughout the year are likely to include a portion of expected long-term gains (both realized and unrealized), along with net investment income.
Important points to understand about the managed distribution program are:
• The Fund seeks to establish a relatively stable distribution rate that roughly corresponds to the projected total return from its investment strategy over an extended period of time. However, you should not draw any conclusions about the Fund's past or future investment performance from its current distribution rate.
• Actual returns will differ from projected long-term returns (and therefore the Fund's distribution rate), at least over shorter time periods. Over a specific timeframe, the difference between actual returns and total distributions will be reflected in an increasing (returns exceed distributions) or a decreasing (distributions exceed returns) Fund net asset value.
• Each distribution is expected to be paid from some or all of the following sources:
• net investment income (regular interest and dividends),
• realized capital gains, and
• unrealized gains, or, in certain cases, a return of principal (non-taxable distributions).
• A non-taxable distribution is a payment of a portion of the Fund's capital. When the Fund's returns exceed distributions, it may represent portfolio gains generated, but not realized as a taxable capital gain. In periods when the Fund's returns fall short of distributions, the shortfall will represent a portion of your original principal, unless the shortfall is offset during other time periods over the life of your investment (previous or subsequent) when the Fund's total return exceeds distributions.
• Because distribution source estimates are updated during the year based on the Fund's performance and forecast for its current fiscal year (which is the calendar year for the Fund), estimates on the nature of your distributions provided at the time the distributions are paid may differ from both the tax information reported to you in your Fund's IRS Form 1099 statement provided at year end, as well as the ultimate economic sources of distributions over the life of your investment.
Nuveen Investments
9
Share Information (continued)
The following table provides information regarding the Fund's distributions and total return performance for the fiscal year ended December 31, 2014. This information is intended to help you better understand whether the Fund's returns for the specified time period were sufficient to meet its distributions.
As of December 31, 2014 | | JGV | |
Inception date | | 7/24/06 | |
Fiscal year (calendar year) ended December 31, 2014 | |
Per share distribution: | |
From net investment income | | $ | 0.23 | | |
From long-term capital gains | | | 0.00 | | |
From short-term capital gains | | | 0.00 | | |
Return of capital | | | 0.83 | | |
Total per share distribution | | $ | 1.06 | | |
Current distribution rate* | | | 8.15 | % | |
Average annual total returns: | |
Excluding retained gain tax credit/refund**: | |
| 1-Year on NAV | | | 2.75 | % | |
| 5-Year on NAV | | | 2.57 | % | |
Since inception on NAV | | | 4.74 | % | |
Including retained gain tax credit/refund**: | |
| 1-Year on NAV | | | 2.75 | % | |
| 5-Year on NAV | | | 2.57 | % | |
Since inception on NAV | | | 4.83 | % | |
* Current distribution rate is based on the Fund's current annualized quarterly distribution divided by the Fund's current market price. The Fund's quarterly distributions to its shareholders may be comprised of ordinary income, net realized capital gains and, if at the end of the fiscal year the Fund's cumulative net ordinary income and net realized gains are less than the amount of the Fund's distributions, a return of capital for tax purposes.
** The Fund elected to retain a portion of its realized long-term capital gains for the tax year ended December 31, 2007, and pay required federal corporate income taxes on this amount. As reported on Form 2439, shareholders on record date must include their pro-rata share of these gains on their applicable federal tax returns, and are entitled to take offsetting tax credits, for their pro-rata share of the taxes paid by the Fund. The total returns "Including retained gain tax credit/refund" include the economic benefit to shareholders on record date of these tax credits/refunds. The Fund had no retained capital gains for the tax years ended December 31, 2008 through December 31,2014 or for the tax year ended December 31, 2006.
SHARE REPURCHASES
During August 2014, the Fund's Board of Trustees reauthorized an open-market share repurchase program, allowing the Fund to repurchase an aggregate of up to approximately 10% of its outstanding shares.
As of December 31, 2014, and since the inception of the Fund's repurchase program, the Fund has cumulatively repurchased and retired shares as shown in the accompanying table.
| | | JGV | |
Shares Cumulatively Repurchased and Retired | | | 362,800 | | |
Shares Authorized for Repurchase | | | 1,905,000 | | |
Nuveen Investments
10
During the current reporting period, the Fund repurchased and retired its shares at a weighted average price per share and a weighted average discount per share as shown in the accompanying table.
| | | JGV | |
Shares Repurchased and Retired | | | 164,588 | | |
Weighted Average Price per Share Repurchased and Retired | | $ | 13.97 | | |
Weighted Average Discount per Share Repurchased and Retired | | | 11.67 | % | |
OTHER SHARE INFORMATION
As of December 31, 2014, and during the current reporting period, the share price of the Fund was trading at a premium/(discount) to its NAV as shown in the accompanying table.
| | | JGV | |
NAV | | $ | 14.59 | | |
Share Price | | $ | 13.01 | | |
Premium/(Discount) to NAV | | | (10.83 | )% | |
12-Month Average Premium/(Discount) to NAV | | | (12.28 | )% | |
Nuveen Investments
11
Fund shares are not guaranteed or endorsed by any bank or other insured depository institution, and are not federally insured by the Federal Deposit Insurance Corporation. Shares of closed-end funds are subject to investment risks, including the possible loss of principal invested. Past performance is no guarantee of future results. Fund common shares are subject to a variety of risks, including:
Investment, Market and Price Risk. An investment in common shares is subject to investment risk, including the possible loss of the entire principal amount that you invest. Your investment in common shares represents an indirect investment in the corporate securities owned by the Fund, which generally trade in the over-the-counter markets. Shares of closed-end investment companies like the Fund frequently trade at a discount to their NAV. Your common shares at any point in time may be worth less than your original investment, even after taking into account the reinvestment of Fund dividends and distributions.
Tax Risk. The tax treatment of Fund distributions may be affected by new IRS interpretations of the Internal Revenue Code and future changes in tax laws and regulations. This is particularly true for funds employing a managed distribution program.
Common Stock Risk. Common stock returns often have experienced significant volatility.
Issuer Credit Risk. This is the risk that a security in the Fund's portfolio will fail to make dividend or interest payments when due.
Call Option Risk. The value of call options sold (written) by the Fund will fluctuate. The Fund may not participate in any appreciation of its equity portfolio as fully as it would if the Fund did not sell call options. In addition, the Fund will continue to bear the risk of declines in the value of the equity portfolio.
Derivatives Strategy Risk. Derivative securities, such as calls, puts, warrants, swaps and forwards, carry risks different from, and possibly greater than, the risks associated with the underlying investments.
Interest Rate Risk. Fixed-income securities such as bonds, preferred, convertible and other debt securities will decline in value if market interest rates rise.
Value Stock Risks. Value stocks are securities that the manager believes to be undervalued, or mispriced. If the manager's assessment of a company's prospects is wrong, the price of the company's common stock or other equity securities may fall, or may not approach the value that the manager has placed on them.
Convertible Securities Risk. Convertible securities generally offer lower interest or dividend yields than non-convertible fixed-income securities of similar credit quality.
Counterparty Risk. To the extent that the Fund's derivative investments are purchased or sold in over-the-counter transactions, the Fund will be exposed to the risk that counterparties to these transactions will be unable to meet their obligations.
Currency Risk. Changes in exchange rates will affect the value of the Fund's investments.
Warrants and Rights Risks. Warrants and rights are subject to the same market risks as common stocks, but are more volatile in price.
Non-U.S. Securities Risk. Investments in non-U.S securities involve special risks not typically associated with domestic investments including currency risk and adverse political, social and economic development. These risks often are magnified in emerging markets.
Reinvestment Risk. If market interest rates decline, income earned from the Fund's portfolio may be reinvested at rates below that of the original bond that generated the income.
Nuveen Investments
12
Nuveen Global Equity Income Fund
Performance Overview and Holding Summaries as of December 31, 2014
Refer to the Glossary of Terms Used in this Report for further definition of the terms used within this section.
Average Annual Total Returns as of December 31, 2014
| | Average Annual | |
| | | 1-Year | | 5-Year | | Since
Inception1 | |
JGV at NAV | | | 2.75 | % | | | 2.57 | % | | | 4.74 | % | |
JGV at Share Price | | | 6.73 | % | | | 1.65 | % | | | 3.42 | % | |
Blended Benchmark | | | 4.42 | % | | | 8.64 | % | | | 5.87 | % | |
MSCI All Country World Index | | | 4.16 | % | | | 9.17 | % | | | 5.44 | % | |
Average Annual Total Returns as of December 31, 20142
(including retained gain tax credit/refund)
| | Average Annual | |
| | | 1-Year | | 5-Year | | Since
Inception1 | |
JGV at NAV | | | 2.75 | % | | | 2.57 | % | | | 4.83 | % | |
JGV at Share Price | | | 6.73 | % | | | 1.65 | % | | | 3.52 | % | |
Past performance is not predictive of future results. Current performance may be higher or lower than the data shown. Returns do not reflect the deduction of taxes that shareholders may have to pay on Fund distributions or upon the sale of Fund shares. Returns at NAV are net of Fund expenses, and assume reinvestment of distributions. Comparative index return information is provided for the Fund's shares at NAV only. Indexes are not available for direct investment.
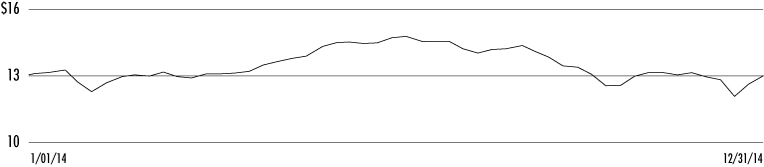
Share Price Performance — Weekly Closing Price
1 Since inception returns are from 7/24/06.
2 As previously explained in the Share Information section of this report, the Fund elected to retain a portion of its realized long-term capital gains for the tax year ended December 31, 2007, and pay required federal corporate income taxes on these amounts. These standardized total returns include the economic benefit to shareholders of record of this tax credit/refund. The Fund had no retained capital gains for the tax years ended December 31, 2008 through December 31, 2014 or for the tax year ended December 31, 2006.
Nuveen Investments
13
Performance Overview and Holding Summaries (continued)
This data relates to the securities held in the Fund's portfolio of investments as of the end of the reporting period. It should not be construed as a measure of performance for the Fund itself. Holdings are subject to change.
Fund Allocation
(% of net assets)
Common Stocks | | | 95.4 | % | |
Mortgage-Backed Securities | | | 0.4 | % | |
Corporate Bonds | | | 0.4 | % | |
Short-Term Investments | | | 3.5 | % | |
Other Assets Less Liabilities | | | 0.3 | % | |
Net Assets | | | 100 | % | |
Portfolio Composition
(% of total investments)3
Pharmaceuticals | | | 13.2 | % | |
Insurance | | | 12.4 | % | |
Energy Equipment & Services | | | 9.0 | % | |
Food Products | | | 7.8 | % | |
Oil, Gas & Consumable Fuels | | | 6.7 | % | |
Aerospace & Defense | | | 4.8 | % | |
Automobiles | | | 4.6 | % | |
Capital Markets | | | 4.4 | % | |
Software | | | 4.4 | % | |
Electronic Equipment, Instruments &
Components | | | 4.2 | % | |
Specialty Retail | | | 3.7 | % | |
Leisure Equipment & Products | | | 3.4 | % | |
Short-Term Investments | | | 3.5 | % | |
Other | | | 17.9 | % | |
Total | | | 100 | % | |
Country Allocation
(% of total investments)3
United States | | | 49.5 | % | |
United Kingdom | | | 11.6 | % | |
France | | | 4.6 | % | |
Switzerland | | | 4.4 | % | |
Japan | | | 4.3 | % | |
Canada | | | 4.1 | % | |
Norway | | | 3.2 | % | |
Other | | | 18.3 | % | |
Total | | | 100 | % | |
3 Excluding investments in derivatives.
Nuveen Investments
14
Shareholder
Meeting Report
The annual meeting of shareholders was held in the offices of Nuveen Investments on August 5, 2014 for JGV; at this meeting the shareholders were asked to vote to approve a new investment management agreement, to approve new sub-advisory agreements and to elect Board Members.
| | | JGV | |
| | | Common
Shares | |
To approve a new investment management agreement between each Fund and Nuveen Advisors, LLC. | |
For | | | 8,018,161 | | |
Against | | | 249,610 | | |
Abstain | | | 99,673 | | |
Broker Non-Votes | | | 1,162,050 | | |
Total | | | 9,529,494 | | |
To approve a new sub-advisory agreement between Nuveen Fund Advisors and Tradewinds Global Investors, LLC. | |
For | | | 7,976,053 | | |
Against | | | 288,860 | | |
Abstain | | | 102,531 | | |
Broker Non-Votes | | | 1,162,050 | | |
Total | | | 9,529,494 | | |
Approval of the Board Members was reached as follows: | |
William Adams IV | |
For | | | 8,963,551 | | |
Withhold | | | 565,943 | | |
Total | | | 9,529,494 | | |
David J. Kundert | |
For | | | 8,949,649 | | |
Withhold | | | 579,845 | | |
Total | | | 9,529,494 | | |
John K. Nelson | |
For | | | 8,951,021 | | |
Withhold | | | 578,473 | | |
Total | | | 9,529,494 | | |
Terence J. Toth | |
For | | | 8,953,416 | | |
Withhold | | | 576,078 | | |
Total | | | 9,529,494 | | |
Nuveen Investments
15
Report of
Independent Registered Public Accounting Firm
To the Board of Trustees and Shareholders of
Nuveen Global Equity Income Fund:
In our opinion, the accompanying statement of assets and liabilities, including the portfolio of investments, and the related statements of operations and of changes in net assets and the financial highlights present fairly, in all material respects, the financial position of Nuveen Global Equity Income Fund (hereinafter referred to as the "Fund") at December 31, 2014, the results of its operations for the year then ended, the changes in its net assets for each of the two years in the period then ended and the financial highlights for each of the five years in the period then ended, in conformity with accounting principles generally accepted in the United States of America. These financial statements and financial highlights (hereafter referred to as "financial statements") are the responsibility of the Fund's management; our responsibility is to express an opinion on these financial statements based on our audits. We conducted our audits of these financial statements in accordance with the standards of the Public Company Accounting Oversight Board (United States). Those standards require that we plan and perform the audit to obtain reasonable assurance about whether the financial statements are free of material misstatement. An audit includes examining, on a test basis, evidence supporting the amounts and disclosures in the financial statements, assessing the accounting principles used and significant estimates made by management, and evaluating the overall financial statement presentation. We believe that our audits, which included confirmation of securities at December 31, 2014 by correspondence with the custodian and brokers, provide a reasonable basis for our opinion.
PricewaterhouseCoopers LLP
Chicago, IL
February 27, 2015
Nuveen Investments
16
Nuveen Global Equity Income Fund
Portfolio of Investments December 31, 2014
Shares | | Description (1) | | Value | |
| | | LONG-TERM INVESTMENTS – 96.2% | |
| | | COMMON STOCKS – 95.4% | |
| | | Aerospace & Defense – 4.8% | |
| | 198,324 | | | Triumph Group Inc. | | $ | 13,331,338 | | |
| | | Air Freight & Logistics – 0.7% | |
| | 94,000 | | | Compania de Distribucion Integral Logista Holdings, S.A. (2) | | | 2,061,054 | | |
| | | Airlines – 1.1% | |
| | 3,775,000 | | | AirAsia Berhad | | | 2,936,651 | | |
| | | Automobiles – 4.6% | |
| | 367,000 | | | General Motors Company, (3) | | | 12,811,970 | | |
| | | Banks – 1.7% | |
| | 1,110,000 | | | TSB Banking Group PLC, (2), (4) | | | 4,800,037 | | |
| | | Capital Markets – 4.4% | |
| | 719,000 | | | UBS AG, (2) | | | 12,258,950 | | |
| | | Chemicals – 2.4% | |
| | 69,000 | | | Agrium Inc. | | | 6,535,680 | | |
| | | Diversified Telecommunication Services – 2.3% | |
| | 73,000 | | | CenturyLink Inc. | | | 2,889,340 | | |
| | 253,000 | | | KT Corporation, ADR | | | 3,572,360 | | |
| | | Total Diversified Telecommunication Services | | | 6,461,700 | | |
| | | Electronic Equipment, Instruments & Components – 4.2% | |
| | 65,107 | | | Flextronics International Limited, (2) | | | 727,896 | | |
| | 344,000 | | | Ingram Micro, Inc., Class A, (2) | | | 9,508,160 | | |
| | 39,250 | | | Keysight Technologies, Inc., (2) | | | 1,325,473 | | |
| | | Total Electronic Equipment, Instruments & Components | | | 11,561,529 | | |
| | | Energy Equipment & Services – 9.0% | |
| | 853,000 | | | Akastor ASA, (4) | | | 2,458,328 | | |
| | 1,150,000 | | | Aker Solutions ASA, (2), (4) | | | 6,396,585 | | |
| | 134,000 | | | Baker Hughes Incorporated | | | 7,513,380 | | |
| | 43,000 | | | Bristow Group Inc. | | | 2,828,970 | | |
| | 321,000 | | | Eurasian Drilling Company Limited, 144A, GDR, (4) | | | 5,713,800 | | |
| | | Total Energy Equipment & Services | | | 24,911,063 | | |
| | | Food & Staples Retailing – 2.8% | |
| | 2,650,000 | | | Tesco PLC, (4) | | | 7,726,605 | | |
| | | Food Products – 7.8% | |
| | 597,470 | | | Adecoagro SA, (2) | | | 4,785,735 | | |
| | 32,000 | | | Bunge Limited | | | 2,909,120 | | |
| | 332,000 | | | Dean Foods Company | | | 6,434,160 | | |
| | 44,000 | | | Ingredion Inc. | | | 3,732,960 | | |
| | 170,000 | | | MHP SA, 144A, GDR, (4) | | | 1,564,000 | | |
| | 3,832,000 | | | WH Group Limited, (2), (4) | | | 2,180,379 | | |
| | | Total Food Products | | | 21,606,354 | | |
Nuveen Investments
17
JGV Nuveen Global Equity Income Fund
Portfolio of Investments (continued) December 31, 2014
Shares | | Description (1) | | Value | |
| | | Insurance – 12.4% | |
| | 208,000 | | | Ageas, (4) | | $ | 7,395,479 | | |
| | 143,000 | | | Axis Capital Holdings Limited | | | 7,305,870 | | |
| | 1,140,000 | | | Catlin Group Limited, (4) | | | 11,875,221 | | |
| | 328,000 | | | MS&AD Insurance Group Holdings, Inc., (4) | | | 7,773,012 | | |
| | | Total Insurance | | | 34,349,582 | | |
| | | Leisure Equipment & Products – 3.4% | |
| | 267,000 | | | Arctic Cat, Inc. | | | 9,478,500 | | |
| | | Life Sciences Tools & Services – 1.6% | |
| | 105,500 | | | Agilent Technologies, Inc. | | | 4,319,170 | | |
| | | Machinery – 0.9% | |
| | 97,500 | | | Vallourec SA, (4) | | | 2,642,410 | | |
| | | Media – 2.3% | |
| | 166,000 | | | Interpublic Group of Companies, Inc. | | | 3,447,820 | | |
| | 116,000 | | | Time Inc. | | | 2,854,760 | | |
| | | Total Media | | | 6,302,580 | | |
| | | Oil, Gas & Consumable Fuels – 6.6% | |
| | 92,500 | | | Apache Corporation | | | 5,796,975 | | |
| | 1,760,000 | | | Bankers Petroleum Limited, (2) | | | 4,938,544 | | |
| | 222,500 | | | Royal Dutch Shell PLC, Class B, (4) | | | 7,687,611 | | |
| | | Total Oil, Gas & Consumable Fuels | | | 18,423,130 | | |
| | | Pharmaceuticals – 13.1% | |
| | 332,000 | | | H. Lundbeck A/S, (4) | | | 6,589,990 | | |
| | 194,800 | | | Impax Laboratories Inc., (2) | | | 6,171,264 | | |
| | 80,488 | | | Ipsen SA, (4) | | | 4,166,174 | | |
| | 273,000 | | | Mitsubishi Tanabe Pharma Corporation, (4) | | | 4,001,800 | | |
| | 221,000 | | | Sanofi-Aventis, ADR | | | 10,079,810 | | |
| | 94,500 | | | Teva Pharmaceutical Industries Limited, Sponsored ADR | | | 5,434,695 | | |
| | | Total Pharmaceuticals | | | 36,443,733 | | |
| | | Real Estate Management & Development – 1.3% | |
| | 460,000 | | | City Developments Limited, (4) | | | 3,548,918 | | |
| | | Software – 4.3% | |
| | 476,847 | | | Infoblox, Incorporated, (2) | | | 9,637,078 | | |
| | 94,500 | | | Symantec Corporation | | | 2,424,397 | | |
| | | Total Software | | | 12,061,475 | | |
| | | Specialty Retail – 3.7% | |
| | 278,000 | | | DSW Inc., Class A | | | 10,369,400 | | |
| | | Textiles, Apparel & Luxury Goods – 0.0% | |
| | 2,506,000 | | | China Hongxing Sports Limited, (5) | | | 6,792 | | |
| | | Total Common Stocks (cost $262,430,198) | | | 264,948,621 | | |
Principal
Amount (000) | | Description (1) | | Coupon | | Maturity | | Ratings (6) | | Value | |
| | | MORTGAGE-BACKED SECURITIES – 0.4% | |
| | | Residentials – 0.4% | |
$ | 5,534 | | | Fannie Mae Guaranteed REMIC Pass Through Certificates, Series 2011-16, (I/O) | | | 4.000 | % | | 3/25/26 | | Aaa | | $ | 288,454 | | |
| | 2,833 | | | Fannie Mae Mortgage Interest Strips, Series 345-17, (I/O) | | | 4.500 | % | | 5/25/20 | | Aaa | | | 163,530 | | |
Nuveen Investments
18
Principal
Amount (000) | | Description (1) | | Coupon | | Maturity | | Ratings (6) | | Value | |
| | | Residentials (continued) | |
$ | 46 | | | Fannie Mae Mortgage Pool 100195 | | | 2.706 | % | | 8/25/22 | | Aaa | | $ | 46,649 | | |
| 991
| | | Fannie Mae Real Estate Mortgage Investment Conduit, Pass Through Certificates,
Series 2011-81, Class PI, (I/O) | | | 3.500
| % | | 8/25/26
| | Aaa
| | | 105,293
| | |
| | 5,768 | | | Federal Home Loan Mortgage Corporation, REMIC, Series 3766, Class HI, (I/O) | | | 3.500 | % | | 11/15/20 | | Aaa | | | 385,257 | | |
| | 807 | | | Federal Home Loan Mortgage Corporation, REMIC, Series 3906, Class EI, (I/O) | | | 3.500 | % | | 5/15/26 | | Aaa | | | 77,145 | | |
| | 1,083 | | | Freddie Mac Multiclass Certificates, Series 3804, Class IG, (I/O) | | | 3.500 | % | | 2/15/25 | | Aaa | | | 61,420 | | |
| | 1,109 | | | Freddie Mac Multiclass Certificates, Series 3855, Class GI, (I/O) | | | 3.500 | % | | 1/15/25 | | Aaa | | | 43,847 | | |
| | 18,171 | | | Total Residentials | | | 1,171,595 | | |
$ | 18,171 | | | Total Mortgage-Backed Securities (cost $2,159,309) | | | 1,171,595 | | |
Principal
Amount (000) | | Description (1) | | Coupon | | Maturity | | Ratings (6) | | Value | |
| | | CORPORATE BONDS – 0.4% | |
| | | Wireless Telecommunication Services – 0.4% | |
$ | 6,400 | | | NII Capital Corporation, (7) | | | 7.625 | % | | 4/01/21 | | D | | $ | 1,184,000 | | |
$ | 6,400 | | | Total Corporate Bonds (cost $5,151,683) | | | 1,184,000 | | |
| | | | | Total Long-Term Investments (cost $269,741,190) | | | 267,304,216 | | |
Principal
Amount (000) | | Description (1) | | Coupon | | Maturity | | | | Value | |
| | | SHORT-TERM INVESTMENTS – 3.5% | |
$ | 9,688
| | | Repurchase Agreement with Fixed Income Clearing Corporation, dated 12/31/14,
repurchase price $9,687,999, collateralized by $9,690,000 U.S. Treasury Notes,
2.125%, due 6/30/21, value $9,883,800 | | | 0.000
| % | | 1/02/15
| |
| | $ | 9,687,999
| | |
| | | | | Total Short-Term Investments (cost $9,687,999) | | | 9,687,999 | | |
| | | | | Total Investments (cost $279,429,189) – 99.7% | | | 276,992,215 | | |
| | | | | Other Assets Less Liabilities – 0.3% (8) | | | 744,303 | | |
| | | | | Net Assets – 100% | | $ | 277,736,518 | | |
Investments in Derivatives as of December 31, 2014
Options Written outstanding:
Number of
Contracts | | Description | | Notional
Amount (9) | | Expiration
Date | | Strike
Price | | Value (8) | |
| | (1,090 | ) | | General Motors Company | | $ | (3,488,000 | ) | | 3/20/15 | | $ | 32 | | | $ | (392,400 | ) | |
| | (1,090 | ) | | Total Options Written (premiums received $155,858) | | $ | (3,488,000 | ) | | | | | | | | | | $ | (392,400 | ) | |
Nuveen Investments
19
JGV Nuveen Global Equity Income Fund
Portfolio of Investments (continued) December 31, 2014
For Fund portfolio compliance purposes, the Fund's industry classifications refer to any one or more of the industry sub-classifications used by one or more widely recognized market indexes or ratings group indexes, and/or as defined by Fund management. This definition may not apply for purposes of this report, which may combine industry sub-classifications into sectors for reporting ease.
(1) All percentages shown in the Portfolio of Investments are based on net assets.
(2) Non-income producing; issuer has not declared a dividend within the past twelve months.
(3) Investment, or portion of investment, has been pledged as collateral for options written during and/or as of the end of the reporting period.
(4) For fair value measurement disclosure purposes, Common Stock classified as Level 2. See Notes to Financial Statements, Note 2 – Investment Valuation and Fair Value Measurements for more information.
(5) Investment valued at fair value using methods determined in good faith by, or at the discretion of the Board. For fair value disclosure purposes, investment classified as Level 3. See Notes to Financial Statements, Note 2 – Investment Valuation and Fair Value Measurements for more information.
(6) Ratings (not covered by the report of independent registered public accounting firm): Using the highest of Standard & Poor's Group ("Standard & Poor's"), Moody's Investors Service, Inc. ("Moody's") or Fitch, Inc. ("Fitch") rating. Ratings below BBB by Standard & Poor's, Baa by Moody's or BBB by Fitch are considered to be below investment grade. Holdings designated N/R are not rated by any of these national rating agencies.
(7) At or subsequent to the end of the reporting period, this security is non-income producing. Non-income producing, in the case of a fixed-income security, generally denotes that the issuer has (1) defaulted on the payment of principal or interest, (2) is under the protection of the Federal Bankruptcy Court or (3) the Fund's Adviser has concluded that the issue is not likely to meet its future interest payment obligations and has directed the Fund's custodian to cease accruing additional income on the Fund's records.
(8) Other Assets Less Liabilities includes the Value of derivative instruments as listed within Investments in Derivatives as of the end of the reporting period.
(9) For disclosure purposes, Notional Amount is calculated by multiplying the Number of Contracts by the Strike Price by 100.
144A Investment is exempt from registration under Rule 144A of the Securities Act of 1933, as amended. These investments may only be resold in transactions exempt from registration, which are normally those transactions with qualified institutional buyers.
ADR American Depositary Receipt.
GDR Global Depositary Receipt.
I/O Interest only security.
See accompanying notes to financial statements.
Nuveen Investments
20
Statement of
Assets and Liabilities December 31, 2014
Assets | |
Long-term investments, at value (cost $269,741,190) | | $ | 267,304,216 | | |
Short-term investments, at value (cost approximates value) | | | 9,687,999 | | |
Cash collateral at brokers(1) | | | 1,054,757 | | |
Receivable for: | |
Dividends | | | 96,115 | | |
Interest | | | 57,637 | | |
Investments sold | | | 184,904 | | |
Reclaims | | | 117,707 | | |
Other assets | | | 24,281 | | |
Total assets | | | 278,527,616 | | |
Liabilities | |
Options written, at value (premiums received $155,858) | | | 392,400 | | |
Accrued expenses: | |
Management fees | | | 225,013 | | |
Trustees fees | | | 24,434 | | |
Other | | | 149,251 | | |
Total liabilities | | | 791,098 | | |
Net assets | | $ | 277,736,518 | | |
Shares outstanding | | | 19,039,409 | | |
Net asset value ("NAV") per share outstanding | | $ | 14.59 | | |
Net assets consist of: | |
Shares, $0.01 par value per share | | $ | 190,394 | | |
Paid-in surplus | | | 319,979,299 | | |
Undistributed (Over-distribution of) net investment income | | | (1,220,562 | ) | |
Accumulated net realized gain (loss) | | | (38,528,745 | ) | |
Net unrealized appreciation (depreciation) | | | (2,683,868 | ) | |
Net assets | | $ | 277,736,518 | | |
Authorized shares | | | Unlimited | | |
(1) Cash pledged to collateralize the net payment obligations for investments in derivatives.
See accompanying notes to financial statements.
Nuveen Investments
21
Statement of
Operations Year Ended December 31, 2014
Investment Income | |
Dividends (net of foreign tax withheld of $409,995) | | $ | 7,266,161 | | |
Interest | | | 449,647 | | |
Total investment income | | | 7,715,808 | | |
Expenses | |
Management fees | | | 2,807,495 | | |
Shareholder servicing agent fees and expenses | | | 340 | | |
Custodian fees and expenses | | | 158,529 | | |
Trustees fees and expenses | | | 12,118 | | |
Professional fees | | | 79,015 | | |
Shareholder reporting expenses | | | 73,920 | | |
Stock exchange listing fees | | | 8,826 | | |
Investor relations expenses | | | 73,577 | | |
Other expenses | | | 25,931 | | |
Total expenses | | | 3,239,751 | | |
Net investment income (loss) | | | 4,476,057 | | |
Realized and Unrealized Gain (Loss) | |
Net realized gain (loss) from: | |
Investments and foreign currency | | | 13,631,268 | | |
Options written | | | 2,511,786 | | |
Change in net unrealized appreciation (depreciation) of: | |
Investments and foreign currency | | | (12,197,148 | ) | |
Options written | | | (491,386 | ) | |
Net realized and unrealized gain (loss) | | | 3,454,520 | | |
Net increase (decrease) in net assets from operations | | $ | 7,930,577 | | |
See accompanying notes to financial statements.
Nuveen Investments
22
Statement of
Changes in Net Assets
| | | Year
Ended
12/31/14 | | Year
Ended
12/31/13 | |
Operations | |
Net investment income (loss) | | $ | 4,476,057 | | | $ | 6,700,851 | | |
Net realized gain (loss) from: | |
Investments and foreign currency | | | 13,631,268 | | | | (50,472,206 | ) | |
Options written | | | 2,511,786 | | | | 2,634,533 | | |
Securities sold short | | | — | | | | (6,147,495 | ) | |
Change in net unrealized appreciation (depreciation) of: | |
Investments and foreign currency | | | (12,197,148 | ) | | | 50,091,568 | | |
Options written | | | (491,386 | ) | | | (360,928 | ) | |
Securities sold short | | | — | | | | 4,225,047 | | |
Net increase (decrease) in net assets from operations | | | 7,930,577 | | | | 6,671,370 | | |
Distributions to Shareholders | |
From net investment income | | | (4,427,520 | ) | | | (7,081,758 | ) | |
Return of capital | | | (15,797,869 | ) | | | (13,760,001 | ) | |
Decrease in net assets from distributions to shareholders | | | (20,225,389 | ) | | | (20,841,759 | ) | |
Capital Share Transactions | |
Cost of shares repurchased or retired | | | (2,302,938 | ) | | | (86,790 | ) | |
Net increase (decrease) in net assets from capital share transactions | | | (2,302,938 | ) | | | (86,790 | ) | |
Net increase (decrease) in net assets | | | (14,597,750 | ) | | | (14,257,179 | ) | |
Net assets at the beginning of period | | | 292,334,268 | | | | 306,591,447 | | |
Net assets at the end of period | | $ | 277,736,518 | | | $ | 292,334,268 | | |
Undistributed (Over-distribution of) net investment income at the end of period | | $ | (1,220,562 | ) | | $ | (1,098,041 | ) | |
See accompanying notes to financial statements.
Nuveen Investments
23
Selected data for a share outstanding throughout each period:
| | | | |
| | | | | Investment Operations | | Less Distributions | | | |
| | |
Beginning
NAV | | Net
Investment
Income
(Loss)(a) | | Net
Realized/
Unrealized
Gain (Loss) | | Total | | From Net
Investment
Income | | From
Accumulated
Net
Realized
Gains | | Return of
Capital | | Total | | Discount
from
Shares
Repurchased
and Retired | | Ending
NAV | | Ending
Market
Value | |
Year Ended 12/31: | |
2014 | | $ | 15.22 | | | $ | 0.23 | | | $ | 0.18 | | | $ | 0.41 | | | $ | (0.23 | ) | | $ | — | | | $ | (0.83 | ) | | $ | (1.06 | ) | | $ | 0.02 | | | $ | 14.59 | | | $ | 13.01 | | |
2013 | | | 15.96 | | | | 0.35 | | | | — | * | | | 0.35 | | | | (0.37 | ) | | | — | | | | (0.72 | ) | | | (1.09 | ) | | | — | * | | | 15.22 | | | | 13.17 | | |
2012 | | | 16.91 | | | | 0.42 | | | | (0.10 | ) | | | 0.32 | | | | (0.49 | ) | | | (0.33 | ) | | | (0.45 | ) | | | (1.27 | ) | | | — | * | | | 15.96 | | | | 14.91 | | |
2011 | | | 20.30 | | | | 0.46 | | | | (2.48 | ) | | | (2.02 | ) | | | (0.83 | ) | | | (0.46 | ) | | | (0.08 | ) | | | (1.37 | ) | | | — | | | | 16.91 | | | | 16.76 | | |
2010 | | | 18.35 | | | | 0.36 | | | | 2.79 | | | | 3.15 | | | | (1.20 | ) | | | — | | | | — | | | | (1.20 | ) | | | — | * | | | 20.30 | | | | 20.30 | | |
Nuveen Investments
24
| | | | | Ratios/Supplemental Data | |
| | | Total Returns | | | | Ratios to Average Net Assets(c) | | | |
| | |
Based
on
NAV(b) | | Based
on
Market
Value(b) | | Ending
Net Assets
(000) | | Expenses | | Net
Investment
Income (Loss) | | Portfolio
Turnover
Rate(d) | |
Year Ended 12/31: | |
2014 | | | 2.75 | % | | | 6.73 | % | | $ | 277,737 | | | | 1.11 | % | | | 1.54 | % | | | 128 | % | |
2013 | | | 2.50 | | | | (4.24 | ) | | | 292,334 | | | | 1.16 | | | | 2.30 | | | | 143 | | |
2012 | | | 2.03 | | | | (3.29 | ) | | | 306,591 | | | | 1.20 | | | | 2.61 | | | | 51 | | |
2011 | | | (10.28 | ) | | | (11.00 | ) | | | 324,957 | | | | 1.16 | | | | 2.41 | | | | 92 | | |
2010 | | | 17.75 | | | | 23.32 | | | | 389,499 | | | | 1.15 | | | | 1.90 | | | | 76 | | |
(a) Per share Net Investment Income (Loss) is calculated using the average daily shares method.
(b) Total Return Based on Market Value is the combination of changes in the market price per share and the effect of reinvested dividend income and reinvested capital gains distributions, if any, at the average price paid per share at the time of reinvestment. The last dividend declared in the period, which is typically paid on the first business day of the following month, is assumed to be reinvested at the ending market price. The actual reinvestment for the last dividend declared in the period may take place over several days, and in some instances may not be based on the market price, so the actual reinvestment price may be different from the price used in the calculation. Total returns are not annualized.
Total Return Based on NAV is the combination of changes in NAV, reinvested dividend income at NAV and reinvested capital gains distributions at NAV, if any. The last dividend declared in the period, which is typically paid on the first business day of the following month, is assumed to be reinvested at the ending NAV. The actual reinvest price for the last dividend declared in the period may often be based on the Fund's market price (and not its NAV), and therefore may be different from the price used in the calculation. Total returns are not annualized.
(c) Each ratio includes the effect of dividends expense on securities sold short as follows:
| | | Ratios of Dividends Expense on
Securities Sold Short
to Average Net Assets(e) | |
Year Ended 12/31: | |
2014 | | | — | % | |
2013 | | | 0.01 | | |
2012 | | | 0.02 | | |
2011 | | | 0.03 | | |
2010 | | | 0.02 | | |
| |
(d) Portfolio Turnover Rate is calculated based on the lesser of long-term purchases or sales (as disclosed in Note 5 – Investment Transactions) divided by the average long-term market value during the period.
(e) Effective for periods beginning after December 31, 2013, the Fund no longer makes short sales of securities.
* Rounds to less than $0.01 per share.
See accompanying notes to financial statements.
Nuveen Investments
25
Notes to
Financial Statements
1. General Information and Significant Accounting Policies
General Information
Fund Information
Nuveen Global Equity Income Fund, formerly Nuveen Global Value Opportunities Fund, (the "Fund") is registered under the Investment Company Act of 1940, as amended, as a diversified, closed-end registered investment company. The Fund's shares are listed on the New York Stock Exchange ("NYSE") and trade under the ticker symbol "JGV." The Fund was organized as a Massachusetts business trust on May 17, 2006.
Investment Adviser
The Fund's investment adviser is Nuveen Fund Advisors, LLC (the "Adviser"), a wholly-owned subsidiary of Nuveen Investments, Inc. ("Nuveen"). The Adviser is responsible for the Fund's overall investment strategy and asset allocation decisions. The Adviser has entered into a sub-advisory agreement with Tradewinds Global Investors, LLC (the 'Sub-Adviser"), an affiliate of Nuveen, under which the Sub-Adviser manages the investment portfolio of the Fund, including its options strategy.
Change in Control
On October 1, 2014, TIAA-CREF, a national financial services organization, completed its previously announced acquisition of Nuveen, the parent company of the Adviser.
Because the consummation of the acquisition resulted in the "assignment" (as defined in the Investment Company Act of 1940) and automatic termination of the Fund's investment management agreements and investment sub-advisory agreements, Fund shareholders were asked to approve a new investment management agreement with the Adviser and a new investment sub-advisory agreement with the Sub-Adviser. These new agreements were approved by shareholders of the Fund, and went into effect during the current fiscal period.
Investment Objectives and Principal Investment Strategies
The Fund's investment objective is to provide a high level of total return by investing primarily in a diversified global portfolio of value equity securities, as well as debt securities issued by corporate and governmental entities. The Fund invests at least 80% of its managed assets (as defined in Note 7 – Management Fees and Other Transactions with Affiliates) in equity securities of non-U.S. companies with a broad range of market capitalizations, and approximately 20% invests in debt securities and other debt-like investments of non-U.S. and U.S. corporate and governmental entities. The Fund may also opportunistically write covered calls on up to 35% of the equity portfolio and may invest to a limited extent in debt securities, but may not short equity securities.
Name Change
The Fund's Board of Trustees approved a change to the Fund's name from Nuveen Global Value Opportunities Fund to Nuveen Global Equity Income Fund, effective January 24, 2014.
Significant Accounting Policies
The Fund is an investment company and follows accounting and reporting guidance under Financial Accounting Standard Board (FASB) Accounting Standards Codification (ASC) Topic 946 "Financial Services – Investment Companies." The following is a summary of significant accounting policies followed by the Fund in the preparation of its financial statements in accordance with accounting principles generally accepted in the United States ("U.S. GAAP").
Investment Transactions
Investment transactions are recorded on a trade date basis. Realized gains and losses from investment transactions are determined on the specific identification method, which is the same basis used for federal income tax purposes. Investments purchased on a when-issued/delayed delivery basis may have extended settlement periods. Any investments so purchased are subject to market fluctuation during this period. The Fund has instructed the custodian to earmark securities in the Fund's portfolio with a current value at least equal to the amount of the when-issued/delayed delivery purchase commitments.
As of December 31, 2014, the Fund's outstanding when-issued/delayed purchase commitments were as follows:
Outstanding when-issued/delayed delivery purchase commitments | | $ | — | | |
Nuveen Investments
26
Investment Income
Dividend income is recorded on the ex-dividend date or, for foreign securities, when information is available. Interest income, which reflects the amortization of premiums and includes accretion of discounts for financial reporting purposes, is recorded on an accrual basis. Interest income also reflects paydown gains and losses, if any.
Professional Fees
Professional fees presented on the Statement of Operations consist of legal fees incurred in the normal course of operations, audit fees, tax consulting fees and, in some cases, workout expenditures. Workout expenditures are incurred in an attempt to protect or enhance an investment or to pursue other claims or legal actions on behalf of Fund shareholders. If a refund is received for workout expenditures paid in a prior reporting period, such amounts will be recognized as "Legal fee refund" on the Statement of Operations.
Dividends and Distributions to Shareholders
Distributions to shareholders are recorded on the ex-dividend date. The amount and timing of distributions are determined in accordance with federal income tax regulations, which may differ from U.S. GAAP.
The Fund makes quarterly cash distributions to shareholders of a stated dollar amount per share. Subject to approval and oversight by the Fund's Board of Trustees (the "Board"), the Fund seeks to maintain a stable distribution level designed to deliver the long-term return potential of the Fund's investment strategy through regular quarterly distributions (a "Managed Distribution Program"). Total distributions during a calendar year generally will be made from the Fund's net investment income, net realized capital gains and net unrealized capital gains in the Fund's portfolio, if any. The portion of distributions paid attributed to net unrealized gains, if any, is distributed from the Fund's assets and is treated by shareholders as a non-taxable distribution ("Return of Capital") for tax purposes. In the event that total distributions during a calendar year exceed the Fund's total return on net asset value ("NAV"), the difference will reduce NAV per share. If the Fund's total return on NAV exceeds total distributions during a calendar year, the excess will be reflected as an increase in NAV per share. The final determination of the source and character of all distributions for the fiscal year is made after the end of the fiscal year and is reflected in the financial statements contained in the annual report as of December 31 each year.
The actual character of distributions made by the Fund during the fiscal years ended December 31, 2014 and December 31, 2013, is reflected in the accompanying financial statements.
Indemnifications
Under the Fund's organizational documents, its officers and trustees are indemnified against certain liabilities arising out of the performance of their duties to the Fund. In addition, in the normal course of business, the Fund enters into contracts that provide general indemnifications to other parties. The Fund's maximum exposure under these arrangements is unknown as this would involve future claims that may be made against the Fund that have not yet occurred. However, the Fund has not had prior claims or losses pursuant to these contracts and expects the risk of loss to be remote.
Netting Agreements
In the ordinary course of business, the Fund may enter into transactions subject to enforceable master repurchase agreements, International Swaps and Derivative Association, Inc. ("ISDA") master agreements or other similar arrangements ("netting agreements"). Generally, the right to offset in netting agreements allows the Fund to offset any exposure to a specific counterparty with any collateral received or delivered to that counterparty based on the terms of the agreements. Generally, the Fund manages its cash collateral and securities collateral on a counterparty basis.
The Fund's investments subject to netting agreements as of the end of the reporting period, if any, are further described in Note 3 – Portfolio Securities and Investments in Derivatives.
Use of Estimates
The preparation of financial statements in conformity with U.S. GAAP requires management to make estimates and assumptions that affect the reported amounts of assets and liabilities at the date of the financial statements and the reported amounts of increases and decreases in net assets from operations during the reporting period. Actual results may differ from those estimates.
2. Investment Valuation and Fair Value Measurements
The fair valuation input levels as described below are for fair value measurement purposes.
Investment Valuation
Common stocks and other equity-type securities are valued at the last sales price on the securities exchange on which such securities are primarily traded and are generally classified as Level 1. Securities primarily traded on the NASDAQ National Market ("NASDAQ") are valued at the NASDAQ Official Closing Price and are generally classified as Level 1. However, securities traded on a securities exchange or NASDAQ for which there were no transactions on a given day or securities not listed on a securities exchange or NASDAQ are valued at the quoted bid price and are generally classified
Nuveen Investments
27
Notes to Financial Statements (continued)
as level 2. Prices of certain American Depository Receipts ("ADR") held by the Fund that trade in the United States are valued based on the last traded price, official closing price or the most recent bid price of the underlying non-U.S.-traded stock, adjusted as appropriate for the underlying-to-ADR conversion ratio and foreign exchange rate, and from time-to-time may also be adjusted further to take into account material events that may take place after the close of the local non-U.S. market but before the close of the NYSE, which may represent a transfer from a Level 1 to a Level 2 security.
Prices of fixed-income securities are provided by a pricing service approved by the Board. The pricing service establishes a security's fair value using methods that may include consideration of the following: yields or prices of investments of comparable quality, type of issue, coupon, maturity and rating, market quotes or indications of value from security dealers, evaluations of anticipated cash flows or collateral, general market conditions and other information and analysis, including the obligor's credit characteristics considered relevant. These securities are generally classified as Level 2. In pricing certain securities, particularly less liquid and lower quality securities, the pricing service may consider information about a security, its issuer or market activity provided by the Adviser. These securities are generally classified as Level 2 or Level 3 depending on the priority of the significant inputs.
Repurchase agreements are valued at contract amount plus accrued interest, which approximates market value. These securities are generally classified as Level 2.
The value of exchange-traded options are based on the mean of the closing bid and ask prices. Exchange-traded options are generally classified as Level 1. Options traded in the over-the-counter market are valued using an evaluated mean price and are generally classified as Level 2.
Investments initially valued in currencies other than the U.S. dollar are converted to the U.S. dollar using exchange rates obtained from pricing services. As a result, the NAV of the Fund's shares may be affected by changes in the value of currencies in relation to the U.S. dollar. The value of securities traded in markets outside the United States or denominated in currencies other than the U.S. dollar may be affected significantly on a day that the NYSE is closed and an investor is not able to purchase, redeem or exchange shares. If significant market events occur between the time of determination of the closing price of a foreign security on an exchange and the time that the Fund's NAV is determined, or if under the Fund's procedures, the closing price of a foreign security is not deemed to be reliable, the security would be valued at fair value as determined in accordance with procedures established in good faith by the Board. These securities are generally classified as Level 2 or Level 3 depending on the priority of the significant inputs.
Certain securities may not be able to be priced by the pre-established pricing methods as described above. Such securities may be valued by the Board and/or its appointee at fair value. These securities generally include, but are not limited to, restricted securities (securities which may not be publicly sold without registration under the Securities Act of 1933, as amended) for which a pricing service is unable to provide a market price; securities whose trading has been formally suspended; debt securities that have gone into default and for which there is no current market quotation; a security whose market price is not available from a pre-established pricing source; a security with respect to which an event has occurred that is likely to materially affect the value of the security after the market has closed but before the calculation of a Fund's NAV (as may be the case in non-U.S. markets on which the security is primarily traded) or make it difficult or impossible to obtain a reliable market quotation; and a security whose price, as provided by the pricing service, is not deemed to reflect the security's fair value. As a general principle, the fair value of a security would appear to be the amount that the owner might reasonably expect to receive for it in a current sale. A variety of factors may be considered in determining the fair value of such securities, which may include consideration of the following: yields or prices of investments of comparable quality, type of issue, coupon, maturity and rating, market quotes or indications of value from security dealers, evaluations of anticipated cash flows or collateral, general market conditions and other information and analysis, including the obligor's credit characteristics considered relevant. These securities are generally classified as Level 2 or Level 3 depending on the priority of the significant inputs. Regardless of the method employed to value a particular security, all valuations are subject to review by the Board and/or its appointee.
Fair Value Measurements
Fair value is defined as the price that would be received upon selling an investment or transferring a liability in an orderly transaction to an independent buyer in the principal or most advantageous market for the investment. A three-tier hierarchy is used to maximize the use of observable market data and minimize the use of unobservable inputs and to establish classification of fair value measurements for disclosure purposes. Observable inputs reflect the assumptions market participants would use in pricing the asset or liability. Observable inputs are based on market data obtained from sources independent of the reporting entity. Unobservable inputs reflect the reporting entity's own assumptions about the assumptions market participants would use in pricing the asset or liability. Unobservable inputs are based on the best information available in the circumstances. The following is a summary of the three-tiered hierarchy of valuation input levels.
Level 1 – Inputs are unadjusted and prices are determined using quoted prices in active markets for identical securities.
Level 2 – Prices are determined using other significant observable inputs (including quoted prices for similar securities, interest rates, prepayment speeds, credit risk, etc.).
Level 3 – Prices are determined using significant unobservable inputs (including management's assumptions in determining the fair value of investments).
Nuveen Investments
28
The inputs or methodologies used for valuing securities are not an indication of the risks associated with investing in those securities. The following is a summary of the Fund's fair value measurements as of the end of the reporting period:
| | | Level 1 | | Level 2 | | Level 3 | | Total | |
Long-Term Investments*: | |
Common Stocks** | | $ | 178,421,480 | | | $ | 86,520,349 | | | $ | 6,792 | | | $ | 264,948,621 | | |
Mortgage-Backed Securities | | | — | | | | 1,171,595 | | | | — | | | | 1,171,595 | | |
Corporate Bonds | | | — | | | | 1,184,000 | | | | — | | | | 1,184,000 | | |
Short-Term Investments: | |
Repurchase Agreements | | | — | | | | 9,687,999 | | | | — | | | | 9,687,999 | | |
Investments in Derivatives: | |
Options Written | | | (392,400 | ) | | | — | | | | — | | | | (392,400 | ) | |
Total | | $ | 178,029,080 | | | $ | 98,563,943 | | | $ | 6,792 | | | $ | 276,599,815 | | |
* Refer to the Fund's Portfolio of Investments for industry classifications.
** Refer to the Fund's Portfolio of Investments for breakdown of these securities classified as Level 2 and Level 3.
The table below presents the transfers in and out of the three valuation levels for the Fund as of the end of the reporting period when compared to the valuation levels as of the end of the previous fiscal year. Changes in valuation inputs or methodologies may result in transfers into or out of an assigned level within the fair value hierarchy. Transfers in or out of levels are generally due to the availability of publicly available information and to the significance or extent the Adviser determines that the valuation inputs or methodologies may impact the valuation of those securities.
| | | Level 1 | | Level 2 | | Level 3 | |
| | | Transfer In | | (Transfers Out) | | Transfer In | | (Transfers Out) | | Transfer In | | (Transfers Out) | |
Common Stocks | | $ | — | | | $ | (34,731,323 | ) | | $ | 34,731,323 | | | $ | — | | | $ | — | | | $ | — | | |
The Board is responsible for the valuation process and has appointed the oversight of the daily valuation process to the Adviser's Valuation Committee. The Valuation Committee, pursuant to the valuation policies and procedures adopted by the Board, is responsible for making fair value determinations, evaluating the effectiveness of the Fund's pricing policies and reporting to the Board. The Valuation Committee is aided in its efforts by the Adviser's dedicated Securities Valuation Team, which is responsible for administering the daily valuation process and applying fair value methodologies as approved by the Valuation Committee. When determining the reliability of independent pricing services for investments owned by the Fund, the Valuation Committee, among other things, conducts due diligence reviews of the pricing services and monitors the quality of security prices received through various testing reports conducted by the Securities Valuation Team.
The Valuation Committee will consider pricing methodologies it deems relevant and appropriate when making a fair value determination, based on the facts and circumstances specific to the portfolio instrument. Fair value determinations generally will be derived as follows, using public or private market information:
(i) If available, fair value determinations shall be derived by extrapolating from recent transactions or quoted prices for identical or comparable securities.
(ii) If such information is not available, an analytical valuation methodology may be used based on other available information including, but not limited to: analyst appraisals, research reports, corporate action information, issuer financial statements and shelf registration statements. Such analytical valuation methodologies may include, but are not limited to: multiple of earnings, discount from market value of a similar freely-traded security, discounted cash flow analysis, book value or a multiple thereof, risk premium/yield analysis, yield to maturity and/or fundamental investment analysis.
The purchase price of a portfolio instrument will be used to fair value the instrument only if no other valuation methodology is available or deemed appropriate, and it is determined that the purchase price fairly reflects the instrument's current value.
For each portfolio security that has been fair valued pursuant to the policies adopted by the Board, the fair value price is compared against the last available and next available market quotations. The Valuation Committee reviews the results of such testing and fair valuation occurrences are reported to the Board.
3. Portfolio Securities and Investments in Derivatives
Portfolio Securities
Foreign Currency Transactions
To the extent that the Fund invests in securities and/or contracts that are denominated in a currency other than U.S. dollars, the Fund will be subject to currency risk, which is the risk that an increase in the U.S. dollar relative to the foreign currency will reduce returns or portfolio value. Generally, when the U.S. dollar rises in value against a foreign currency, the Fund's investments denominated in that currency will lose value because its currency is worth fewer U.S. dollars; the opposite effect occurs if the U.S. dollar falls in relative value. Investments and other assets and liabilities denominated in foreign
Nuveen Investments
29
Notes to Financial Statements (continued)
currencies are converted into U.S. dollars on a spot (i.e. cash) basis at the spot rate prevailing in the foreign currency exchange market at the time of valuation. Purchases and sales of investments and income denominated in foreign currencies are translated into U.S. dollars on the respective dates of such transactions.
As of December 31, 2014, the Fund's investments in non-U.S. securities were as follows:
| | | Value | | % of Total
Investments | |
Country: | |
United Kingdom | | $ | 32,089,473 | | | | 11.6 | % | |
France | | | 12,722,220 | | | | 4.6 | | |
Switzerland | | | 12,258,950 | | | | 4.4 | | |
Japan | | | 11,774,813 | | | | 4.3 | | |
Canada | | | 11,474,224 | | | | 4.1 | | |
Norway | | | 8,854,912 | | | | 3.2 | | |
Other countries | | | 50,683,923 | | | | 18.3 | | |
Total non-U.S. Securities | | $ | 139,858,515 | | | | 50.5 | % | |
The books and records of the Fund are maintained in U.S. dollars. Foreign currencies, assets and liabilities are translated into U.S. dollars at 4:00 p.m. Eastern Time. Investment transactions, income and expenses are translated on the respective dates of such transactions. Net realized foreign currency gains and losses resulting from changes in exchange rates include foreign currency gains and losses between trade date and settlement date of the transactions, foreign currency transactions and the difference between the amounts of interest and dividends recorded on the books of the Fund and the amounts actually received.
The realized gains and losses resulting from changes in foreign currency exchange rates and changes in foreign exchange rates associated with other assets and liabilities on investments and investments in derivatives are recognized as a component of "Net realized gain (loss) from investments and foreign currency" on the Statement of Operations, when applicable.
The unrealized gains and losses resulting from changes in foreign currency exchange rates and changes in foreign exchange rates associated with other assets and liabilities on investments are recognized as a component of "Change in unrealized appreciation (depreciation) of investments and foreign currency" on the Statement of Operations, when applicable. The unrealized gains and losses resulting from changes in foreign exchange rates associated with forward foreign currency exchange contracts, futures, options purchased, options written and swaps are recognized as a component of "Change in net appreciation (depreciation) of forward foreign currency exchange contracts, futures contracts, options purchased, options written and swaps," respectively, on the Statement of Operations, when applicable.
Repurchase Agreements
In connection with transactions in repurchase agreements, it is the Fund's policy that its custodian take possession of the underlying collateral securities, the fair value of which exceeds the principal amount of the repurchase transaction, including accrued interest, at all times. If the counterparty defaults, and the fair value of the collateral declines, realization of the collateral may be delayed or limited.
The following table presents the repurchase agreements for the Fund that are subject to netting agreements as of the end of the reporting period, and the collateral delivered related to those repurchase agreements.
Counterparty | | Short-Term
Investments, at Value | | Collateral
Pledged (From)
Counterparty* | | Net
Exposure | |
Fixed Income Clearing Corporation | | $ | 9,687,999 | | | $ | (9,687,999 | ) | | $ | — | | |
* As of the end of the reporting period, the value of the collateral pledged from the counterparty exceeded the value of the repurchase agreements. Refer to the Fund's Portfolio of Investments for details on the repurchase agreements.
Zero Coupon Securities
A zero coupon security does not pay a regular interest coupon to its holders during the life of the security. Income to the holder of the security comes from accretion of the difference between the original purchase price of the security at issuance and the par value of the security at maturity and is effectively paid at maturity. The market prices of zero coupon securities generally are more volatile than the market prices of securities that pay interest periodically.
Investments in Derivatives
The Fund is authorized to invest in certain derivative instruments, such as futures, options and swap contracts. The Fund limits its investments in futures, options on futures and swap contracts to the extent necessary for the Adviser to claim the exclusion from registration by the Commodity Futures Trading Commission as a commodity pool operator with respect to the Fund. The Fund records derivative instruments at fair value, with changes in fair value recognized on the Statement of Operations, when applicable. Even though the Fund's investments in derivatives may represent economic hedges, they are not considered to be hedge transactions for financial reporting purposes.
Nuveen Investments
30
Options Transactions
When the Fund writes an option, an amount equal to the net premium received (the premium less commission) is recognized as a component of "Options written, at value" on the Statement of Assets and Liabilities and is subsequently adjusted to reflect the current value of the written option until the option is exercised or expires or the Fund enters into a closing purchase transaction. The changes in the value of options written during the fiscal period are recognized as a component of "Change in net unrealized appreciation (depreciation) of options written" on the Statement of Operations. When an option is exercised or expires or the Fund enters into a closing purchase transaction, the difference between the net premium received and any amount paid at expiration or on executing a closing purchase transaction, including commission, is recognized as a component of "Net realized gain (loss) from options written" on the Statement of Operations. The Fund, as a writer of an option, has no control over whether the underlying instrument may be sold (called) and as a result bears the risk of an unfavorable change in the market value of the instrument underlying the written option. There is also the risk the Fund may not be able to enter into a closing transaction because of an illiquid market.
During the current fiscal period, the Fund continued to write call options on individual stocks held in its portfolio as part of its overall management strategy.
The average notional amount of outstanding options written during the current fiscal period, were as follows:
Average notional amount of outstanding options written* | | $ | (12,422,150 | ) | |
* The average notional amount is calculated based on the outstanding notional at the beginning of the fiscal year and at the end of each fiscal quarter within the current fiscal year.
The following table presents the fair value of all options written by the Fund as of the end of the reporting period, the location of these instruments on the Statement of Assets and Liabilities and the primary underlying risk exposure.
| | | | | Location on the Statement of Assets and Liabilities | |
Underlying | | Derivative | | Asset Derivatives | | (Liability) Derivatives | |
Risk Exposure | | Instrument | | Location | | Value | | Location | | Value | |
Equity price | | Options | | | — | | | $ | — | | | Options written, at value | | $ | (392,400 | ) | |
The following table presents the amount of net realized gain (loss) and change in net unrealized appreciation (depreciation) recognized on options written on the Statement of Operations during the current fiscal period, as well as the primary underlying risk exposure.
Underlying
Risk Exposure | | Derivative
Instrument | | Net Realized Gain (Loss)
from Options Written | | Change in Net Unrealized
Appreciation (Depreciation)
of Options Written | |
Equity price | | Options | | $ | 2,511,786 | | | $ | (491,386 | ) | |
Market and Counterparty Credit Risk
In the normal course of business the Fund may invest in financial instruments and enter into financial transactions where risk of potential loss exists due to changes in the market (market risk) or failure of the other party to the transaction to perform (counterparty credit risk). The potential loss could exceed the value of the financial assets recorded on the financial statements. Financial assets, which potentially expose the Fund to counterparty credit risk, consist principally of cash due from counterparties on forward, option and swap transactions, when applicable. The extent of the Fund's exposure to counterparty credit risk in respect to these financial assets approximates their carrying value as recorded on the Statement of Assets and Liabilities.
The Fund helps manage counterparty credit risk by entering into agreements only with counterparties the Adviser believes have the financial resources to honor their obligations and by having the Adviser monitor the financial stability of the counterparties. Additionally, counterparties may be required to pledge collateral daily (based on the daily valuation of the financial asset) on behalf of the Fund with a value approximately equal to the amount of any unrealized gain above a pre-determined threshold. Reciprocally, when the Fund has an unrealized loss, the Fund has instructed the custodian to pledge assets of the Fund as collateral with a value approximately equal to the amount of the unrealized loss above a pre-determined threshold. Collateral pledges are monitored and subsequently adjusted if and when the valuations fluctuate, either up or down, by at least the pre-determined threshold amount.
4. Fund Shares
Transactions in Fund shares were as follows:
| | | Year
Ended
12/31/14 | | Year
Ended
12/31/13 | |
Shares repurchased and retired | | | (164,588 | ) | | | (6,612 | ) | |
Weighted average: | |
Price per share repurchased and retired | | $ | 13.97 | | | $ | 13.11 | | |
Discount per share repurchased and retired | | | 11.67 | % | | | 13.00 | % | |
Nuveen Investments
31
Notes to Financial Statements (continued)
5. Investment Transactions
Long-term purchases and sales (including maturities but excluding derivative transactions) during the fiscal year ended December 31, 2014, aggregated $357,017,192 and $368,315,777, respectively.
Transactions in options written during the fiscal year ended December 31, 2014, were as follows:
| | | Number of
Contracts | | Premiums
Received | |
Options outstanding, beginning of period | | | 2,448 | | | $ | 615,481 | | |
Options written | | | 21,343 | | | | 2,066,717 | | |
Options terminated in closing purchase transactions | | | (1,752 | ) | | | (233,842 | ) | |
Options expired | | | (11,739 | ) | | | (892,895 | ) | |
Options excercised | | | (9,210 | ) | | | (1,399,603 | ) | |
Options outstanding, end of period | | | 1,090 | | | $ | 155,858 | | |
6. Income Tax Information
The Fund intends to distribute substantially all of its net investment company taxable income to shareholders and to otherwise comply with the requirements of Subchapter M of the Internal Revenue Code applicable to regulated investment companies. In any year when the Fund realizes net capital gains, the Fund may choose to distribute all or a portion of its net capital gains to shareholders, or alternatively, to retain all or a portion of its net capital gains and pay federal corporate income taxes on such retained gains.
For all open tax years and all major taxing jurisdictions, management of the Fund has concluded that there are no significant uncertain tax positions that would require recognition in the financial statements. Open tax years are those that are open for examination by taxing authorities (i.e., generally the last four tax year ends and the interim tax period since then). Furthermore, management of the Fund is also not aware of any tax positions for which it is reasonably possible that the total amounts of unrecognized tax benefits will significantly change in the next twelve months.
The following information is presented on an income tax basis. Differences between amounts for financial statement and federal income tax purposes are primarily due to the treatment of paydown gains and losses, recognition of premium amortization and timing differences in recognizing certain gains and losses on investment transactions. To the extent that differences arise that are permanent in nature, such amounts are reclassified within the capital accounts as detailed below. Temporary differences do not require reclassification. Temporary and permanent differences do not impact the NAV of the Fund.
As of December 31, 2014, the cost and unrealized appreciation (depreciation) of investments (excluding investments in derivatives), as determined on a federal income tax basis, were as follows:
Cost of investments | | $ | 285,505,790 | | |
Gross unrealized: | |
Appreciation | | $ | 23,799,363 | | |
Depreciation | | | (32,312,938 | ) | |
Net unrealized appreciation (depreciation) of investments | | $ | (8,513,575 | ) | |
Permanent differences, primarily due to paydowns, foreign currency transactions and investments in interest-only mortgage-backed securities, resulted in reclassifications among the Fund's components of net assets as of December 31, 2014, the Fund's tax year end, as follows:
Paid-in surplus | | $ | — | | |
Undistributed (Over-distribution of) net investment income | | | (171,059 | ) | |
Accumulated net realized gain (loss) | | | 171,059 | | |
The tax components of undistributed net ordinary income and net long-term capital gains as of December 31, 2014, the Fund's tax year end, were as follows:
Undistributed net ordinary income | | $ | — | | |
Undistributed net long-term capital gains | | | — | | |
Nuveen Investments
32
The tax character of distributions paid during the Fund's tax years ended December 31, 2014 and December 31, 2013, were designated for purposes of the dividends paid deduction as follows:
2014 | |
Distributions from net ordinary income1 | | $ | 4,427,520 | | |
Distributions from net long-term capital gains | | | — | | |
Return of capital | | | 15,797,869 | | |
2013 | |
Distributions from net ordinary income1 | | $ | 7,081,758 | | |
Distributions from net long-term capital gains | | | — | | |
Return of capital | | | 13,760,001 | | |
1 Net ordinary income consists of net taxable income derived from dividends, interest, and net short-term capital gains, if any.
As of December 31, 2014, the Fund's tax year end, the Fund had unused capital losses carrying forward available for federal income tax purposes to be applied against future capital gains, if any. The capital losses are not subject to expiration.
Capital losses to be carried forward – not subject to expiration | | $ | 33,650,197 | | |
7. Management Fees and Other Transactions with Affiliates
The Fund's management fee compensates the Adviser for overall investment advisory and administrative services and general office facilities. The Sub-Adviser is compensated for its services to the Fund from the management fees paid to the Adviser.
The Fund's management fee consists of two components – a fund-level fee, based only on the amount of assets within the Fund, and a complex-level fee, based on the aggregate amount of all eligible fund assets managed by the Adviser. This pricing structure enables Fund shareholders to benefit from growth in the assets within the Fund as well as from growth in the amount of complex-wide assets managed by the Adviser.
The annual fund-level fee, payable monthly, is calculated according to the following schedule:
Average Daily Managed Assets* | | Fund-Level Fee Rate | |
For the first $500 million | | | 0.8000 | % | |
For the next $500 million | | | 0.7750 | | |
For the next $500 million | | | 0.7500 | | |
For the next $500 million | | | 0.7250 | | |
For managed assets over $2 billion | | | 0.7000 | | |
The annual complex-level fee, payable monthly, is calculated according to the following schedule:
Complex-Level Managed Asset Breakpoint Level* | | Effective Rate at Breakpoint Level | |
| $55 billion | | | 0.2000 | % | |
| $56 billion | | | 0.1996 | | |
| $57 billion | | | 0.1989 | | |
| $60 billion | | | 0.1961 | | |
| $63 billion | | | 0.1931 | | |
| $66 billion | | | 0.1900 | | |
| $71 billion | | | 0.1851 | | |
| $76 billion | | | 0.1806 | | |
| $80 billion | | | 0.1773 | | |
| $91 billion | | | 0.1691 | | |
| $125 billion | | | 0.1599 | | |
| $200 billion | | | 0.1505 | | |
| $250 billion | | | 0.1469 | | |
| $300 billion | | | 0.1445 | | |
* For the fund-level and complex-level fees, managed assets include closed-end fund assets managed by the Adviser that are attributable to certain types of leverage. For these purposes, leverage includes the funds' use of preferred stock and borrowings and certain investments in the residual interest certificates (also called inverse floating rate securities) in tender option bond (TOB) trusts, including the portion of assets held by a TOB trust that has been effectively financed by the trust's issuance of floating rate securities, subject to an agreement by the Adviser as to certain funds to limit the amount of such assets for determining managed assets in certain circumstances. The complex-level fee is calculated based upon the aggregate daily managed assets of all Nuveen funds that constitute "eligible assets." Eligible assets do not include assets attributable to investments in other Nuveen funds or assets in excess of $2 billion added to the Nuveen fund complex in connection with the Adviser's assumption of the management of the former First American Funds effective January 1, 2011. As of December 31, 2014, the complex-level fee rate for the Fund was 0.1639%.
The Fund pays no compensation directly to those of its trustees who are affiliated with the Adviser or to its officers, all of whom receive remuneration for their services to the Fund from the Adviser or its affiliates. The Board has adopted a deferred compensation plan for independent trustees that enables trustees to elect to defer receipt of all or a portion of the annual compensation they are entitled to receive from certain Nuveen-advised funds. Under the plan, deferred amounts are treated as though equal dollar amounts had been invested in shares of select Nuveen-advised funds.
Nuveen Investments
33
Additional
Fund Information (Unaudited)
Board of Trustees
William Adams IV* | | Jack B. Evans | | William C. Hunter | | David J. Kundert | | John K. Nelson | | William J. Schneider | |
Thomas S. Schreier, Jr.* | | Judith M. Stockdale | | Carole E. Stone | | Virginia L. Stringer | | Terence J. Toth | | | |
*Interested Board Member.
Fund Manager
Nuveen Fund Advisors, LLC
333 West Wacker Drive
Chicago, IL 60606 | | Custodian
State Street Bank & Trust Company
Boston, MA 02111 | | Legal Counsel
Chapman and Cutler LLP
Chicago, IL 60603 | | Independent Registered
Public Accounting Firm
PricewaterhouseCoopers LLP
Chicago, IL 60606 | | Transfer Agent and
Shareholder Services
State Street Bank &
Trust Company
Nuveen Funds
P.O. Box 43071
Providence, RI 02940-3071
(800) 257-8787 | |
Quarterly Form N-Q Portfolio of Investments Information
The Fund is required to file its complete schedule of portfolio holdings with the Securities and Exchange Commission (SEC) for the first and third quarters of each fiscal year on Form N-Q. You may obtain this information directly from the SEC. Visit the SEC on-line at http://www.sec.gov or in person at the SEC's Public Reference Room in Washington, D.C. Call the SEC toll-free at (800) SEC-0330 for room hours and operation.
Nuveen Funds' Proxy Voting Information
You may obtain (i) information regarding how each fund voted proxies relating to portfolio securities held during the most recent twelve-month period ended June 30, without charge, upon request, by calling Nuveen Investments toll-free at (800) 257-8787 or on Nuveen's website at www.nuveen.com and (ii) a description of the policies and procedures that each fund used to determine how to vote proxies relating to portfolio securities without charge, upon request, by calling Nuveen Investments toll free at (800) 257-8787. You may also obtain this information directly from the SEC. Visit the SEC on-line at http://www.sec.gov.
CEO Certification Disclosure
The Fund's Chief Executive Officer (CEO) has submitted to the New York Stock Exchange (NYSE) the annual CEO certification as required by Section 303A.12(a) of the NYSE Listed Company Manual.
The Fund has filed with the SEC the certification of its CEO and Chief Financial Officer required by Section 302 of the Sarbanes-Oxley Act.
Share Repurchases
The Fund intends to repurchase, through its open-market share repurchase program, shares of its own common stock at such times and in such amounts as is deemed advisable. During the period covered by this report, the Fund repurchased shares of its common stock, as shown in the accompanying table. Any future repurchases will be reported to shareholders in the next annual or semi-annual report.
| | | JGV | |
Shares Repurchased | | | 164,588 | | |
FINRA BrokerCheck
The Financial Industry Regulatory Authority (FINRA) provides information regarding the disciplinary history of FINRA member firms and associated investment professionals. This information as well as an investor brochure describing FINRA BrokerCheck is available to the public by calling the FINRA BrokerCheck Hotline number at (800) 289-9999 or by visiting www.FINRA.org.
Nuveen Investments
34
Distribution Information
The Fund hereby designates its percentage of dividends paid from net ordinary income as dividends qualifying for the 70% dividends received deduction (DRD) for corporations and its percentage as qualified dividend income (QDI) for individuals under Section 1(h)(11) of the Internal Revenue Code as shown in the accompanying table. The actual qualified dividend income distributions will be reported to shareholders on Form 1099-DIV which will be sent to shareholders shortly after calendar year end.
| | JGV | |
| % QDI | | | 100.00 | % | |
| % DRD | | | 39.00 | % | |
Foreign Taxes
The Fund paid qualifying foreign taxes of $409,995 and earned $4,142,436 foreign source income during the year ended December 31, 2014. Pursuant to Section 853 of the Internal Revenue Code, the Fund hereby designates $0.02 per share as foreign taxes paid and $0.22 per share as income earned from foreign sources for the year ended December 31, 2014. The actual foreign tax credit distribution will be reported to shareholders on Form 1099-DIV which will be sent to shareholders shortly after calendar year end.
Nuveen Investments
35
Glossary of Terms
Used in this Report
n Average Annual Total Return: This is a commonly used method to express an investment's performance over a particular, usually multi-year time period. It expresses the return that would have been necessary each year to equal the investment's actual cumulative performance (including change in NAV or market price and reinvested dividends and capital gains distributions, if any) over the time period being considered.
n Barclays High Yield Index: An index that covers the universe of fixed rate, non-investment grade debt. Pay-in-kind (PIK) bonds, Eurobonds, and debt issues from countries designated as emerging markets (e.g., Argentina, Brazil, Venezuela, etc. are excluded, but Canadian and global bonds (SEC registered) of issuers in non-EMG countries are included). Original issue zeroes, step-up coupon structures and 144-As are also included. Index returns assume reinvestment of distributions, but do not include the effects of any applicable sales charges or management fees.
n Barclays U.S. Aggregate Bond Index: A measure that represents securities that are SEC-registered, taxable and dollar denominated. The index covers the U.S. investment grade fixed rate bond market, with index components for government and corporate securities, mortgage pass-through securities, and asset-backed securities. Index returns assume reinvestment of distributions, but do not include the effects of any applicable sales charges or management fees.
n Blended Benchmark: A blended return comprised of 1) 80% MSCI All Country World Index; 2) 15% Barclays U.S. Aggregate Bond Index; and 3) 5% Barclays High Yield Index. Returns assume reinvestment of distributions, but do not include the effects of any sales charges or management fees.
n Dow Jones Industrial Average: A price-weighted index of the 30 largest, most widely held stocks traded on the New York Stock Exchange. The index returns assume reinvestment of distributions, but do not reflect any applicable sales charges or management fees.
n Gross Domestic Product (GDP): The total market value of all final goods and services produced in a country/region in a given year, equal to total consumer, investment and government spending, plus the value of exports, minus the value of imports.
n MSCI All Country World Index: The MSCI (Morgan Stanley Capital International) All Country World Index is published by Morgan Stanley Capital International, Inc. It is a free float-adjusted market capitalization index that is designed to measure global developed and emerging market equity performance. The index covers 49 developed and emerging market countries. Returns assume reinvestment of distributions, but do not include the effects of any sales charges or management fees.
n MSCI EAFE Index: The MSCI (Morgan Stanley Capital International) EAFE (Europe, Australasia, Far East) Index is a free float-adjusted market capitalization weighted index designed to measure developed market equity performance, excluding the U.S. and Canada. The index returns assume reinvestment of distributions, but do not reflect any applicable sales charges or management fees.
n MSCI Emerging Markets Index: The MSCI (Morgan Stanley Capital International) Emerging Markets Index is an unmanaged index considered representative of stocks of developing countries. The index returns assume reinvestment of distributions, but do not reflect any applicable sales charges or management fees.
n Net Asset Value (NAV) Per Share: A fund's Net Assets is equal to its total assets (securities, cash, accrued earnings and receivables) less its total liabilities. NAV per share is equal to the fund's Net Assets divided by its number of shares outstanding.
Nuveen Investments
36
n Russell 2000® Index: An index that measures the performance of the small-cap segment of the U.S. equity universe. The Russell 2000® Index is a subset of the Russell 3000® Index representing approximately 10% of the total market capitalization of that index. It includes approximately 2,000 of the smallest securities based on a combination of their market cap and current index membership. The index returns assume reinvestment of distributions, but do not reflect any applicable sales charges or management fees.
n S&P 500® Index: An unmanaged Index generally considered representative of the U.S. stock market. Index returns assume reinvestment of distributions, but do not reflect of any applicable sales charges or management fees.
Nuveen Investments
37
Reinvest Automatically,
Easily and Conveniently
Nuveen makes reinvesting easy. A phone call is all it takes to set up your reinvestment account.
Nuveen Closed-End Funds Automatic Reinvestment Plan
Your Nuveen Closed-End Fund allows you to conveniently reinvest distributions in additional Fund shares.
By choosing to reinvest, you'll be able to invest money regularly and automatically, and watch your investment grow through the power of compounding. Just like distributions in cash, there may be times when income or capital gains taxes may be payable on distributions that are reinvested.
It is important to note that an automatic reinvestment plan does not ensure a profit, nor does it protect you against loss in a declining market.
Easy and convenient
To make recordkeeping easy and convenient, each quarter you'll receive a statement showing your total distributions, the date of investment, the shares acquired and the price per share, and the total number of shares you own.
How shares are purchased
The shares you acquire by reinvesting will either be purchased on the open market or newly issued by the Fund. If the shares are trading at or above net asset value at the time of valuation, the Fund will issue new shares at the greater of the net asset value or 95% of the then-current market price. If the shares are trading at less than net asset value, shares for your account will be purchased on the open market. If the Plan Agent begins purchasing Fund shares on the open market while shares are trading below net asset value, but the Fund's shares subsequently trade at or above their net asset value before the Plan Agent is able to complete its purchases, the Plan Agent may cease open-market purchases and may invest the uninvested portion of the distribution in newly-issued Fund shares at a price equal to the greater of the shares' net asset value or 95% of the shares' market value on the last business day immediately prior to the purchase date. Distributions received to purchase shares in the open market will normally be invested shortly after the distribution payment date. No interest will be paid on distributions awaiting reinvestment. Because the market price of the shares may increase before purchases are completed, the average purchase price per share may exceed the market price at the time of valuation, resulting in the acquisition of fewer shares than if the distribution had been paid in shares issued by the Fund. A pro rata portion of any applicable brokerage commissions on open market purchases will be paid by Plan participants. These commissions usually will be lower than those charged on individual transactions.
Flexible
You may change your distribution option or withdraw from the Plan at any time, should your needs or situation change.
You can reinvest whether your shares are registered in your name, or in the name of a brokerage firm, bank, or other nominee. Ask your investment advisor if his or her firm will participate on your behalf. Participants whose shares are registered in the name of one firm may not be able to transfer the shares to another firm and continue to participate in the Plan.
The Fund reserves the right to amend or terminate the Plan at any time. Although the Fund reserves the right to amend the Plan to include a service charge payable by the participants, there is no direct service charge to participants in the Plan at this time.
Call today to start reinvesting distributions
For more information on the Nuveen Automatic Reinvestment Plan or to enroll in or withdraw from the Plan, speak with your financial advisor or call us at (800) 257-8787.
Nuveen Investments
38
The management of the Funds, including general supervision of the duties performed for the Funds by the Adviser, is the responsibility of the Board of Trustees of the Funds. The number of trustees of the Funds is currently set at eleven. None of the trustees who are not "interested" persons of the Funds (referred to herein as "independent trustees") has ever been a director or employee of, or consultant to, Nuveen or its affiliates. The names and business addresses of the trustees and officers of the Funds, their principal occupations and other affiliations during the past five years, the number of portfolios each oversees and other directorships they hold are set forth below.
Name,
Year of Birth
& Address | | Position(s) Held
with the Funds | | Year First
Elected or
Appointed
and Term(1) | | Principal
Occupation(s)
Including other
Directorships
During Past 5 Years | | Number
of Portfolios
in Fund Complex
Overseen by
Board Member | |
Independent Board Members: | | | | | |
| nWILLIAM J. SCHNEIDER | | | |
1944
333 W. Wacker Drive
Chicago, IL 60606 | | Chairman and
Board Member | | 1996
Class III | | Chairman of Miller-Valentine Partners, a real estate investment company; formerly, Senior Partner and Chief Operating Officer (retired (2004) of Miller-Valentine Group; an owner in several other Miller Valentine entities; Board Member of Med-America Health System, Tech Town, Inc., a not-for-profit community development company, Board Member of WDPR Public Radio station; formerly, member, Business Advisory Council, Cleveland Federal Reserve Bank and University of Dayton Business School Advisory Council. | | |
195 | | |
| nJACK B. EVANS | | | |
1948
333 W. Wacker Drive
Chicago, IL 60606 | |
Board Member | | 1999
Class III | | President, The Hall-Perrine Foundation, a private philanthropic corporation (since 1996); Chairman, United Fire Group, a publicly held company; formerly, President Pro-Tem of the Board of Regents for the State of Iowa University System; Director, Source Media Group; Life Trustee of Coe College; formerly, Director, Alliant Energy; formerly, Director, Federal Reserve Bank of Chicago; formerly, President and Chief Operating Officer, SCI Financial Group, Inc., a regional financial services firm. | | |
195 | | |
| nWILLIAM C. HUNTER | | | |
1948
333 W. Wacker Drive
Chicago, IL 60606 | |
Board Member | | 2004
Class I | | Dean Emeritus (since June 30, 2012), formerly, Dean, Tippie College of Business, University of Iowa (2006-2012); Director (since 2004) of Xerox Corporation; Director (since 2005), and President (since July 2012) Beta Gamma Sigma, Inc., The International Business Honor Society; Director of Wellmark, Inc. (since 2009); formerly, Dean and Distinguished Professor of Finance, School of Business at the University of Connecticut (2003-2006); previously, Senior Vice President and Director of Research at the Federal Reserve Bank of Chicago (1995-2003); formerly, Director (1997-2007), Credit Research Center at Georgetown University. | | |
195 | | |
| nDAVID J. KUNDERT | | | |
1942
333 W. Wacker Drive
Chicago, IL 60606 | |
Board Member | | 2005
Class II | | Formerly, Director, Northwestern Mutual Wealth Management Company (2006-2013), retired (since 2004) as Chairman, JPMorgan Fleming Asset Management, President and CEO, Banc One Investment Advisors Corporation, and President, One Group Mutual Funds; prior thereto, Executive Vice President, Banc One Corporation and Chairman and CEO, Banc One Investment Management Group; Regent Emeritus, Member of Investment Committee, Luther College; member of the Wisconsin Bar Association; member of Board of Directors and Chair of Investment Committee, Greater Milwaukee Foundation; member of the Board of Directors (Milwaukee), College Possible. | | |
195 | | |
Nuveen Investments
39
Board Members & Officers (Unaudited) (continued)
Name,
Year of Birth
& Address | | Position(s) Held
with the Funds | | Year First
Elected or
Appointed
and Term(1) | | Principal
Occupation(s)
Including other
Directorships
During Past 5 Years | | Number
of Portfolios
in Fund Complex
Overseen by
Board Member | |
Independent Board Members (continued): | | | | | |
| nJOHN K. NELSON | | | |
1962
333 West Wacker Drive
Chicago, IL 60606 | |
Board Member | | 2013
Class II | | Senior external advisor to the financial services practice of Deloitte Consulting LLP (since 2012); Member of Board of Directors of Core12 LLC since 2008), a private firm which develops branding, marketing and communications strategies for clients; Director of The Curran Center for Catholic American Studies (since 2009) and The President's Council, Fordham University (since 2010); formerly, Chairman of the Board of Trustees of Marian University (2010 as trustee, 2011-2014 as Chairman); formerly, Chief Executive Officer of ABN AMRO N.V. North America, and Global Head of its Financial Markets Division (2007-2008); prior senior positions held at ABN AMRO include Corporate Executive Vice President and Head of Global Markets-the Americas (2006-2007), CEO of Wholesale Banking North America and Global Head of Foreign Exchange and Futures Markets (2001-2006), and Regional Commercial Treasurer and Senior Vice President Trading-North America (1996-2001); formerly, Trustee at St. Edmund Preparatory School in New York City. | | |
195 | | |
| nJUDITH M. STOCKDALE | | | |
1947
333 W. Wacker Drive
Chicago, IL 60606 | |
Board Member | | 1997
Class I | | Board Member, Land Trust Alliance (since June 2013) and U.S. Endowment for Forestry and Communities (since November 2013); formerly, Executive Director (1994-2012), Gaylord and Dorothy Donnelley Foundation; prior thereto, Executive Director, Great Lakes Protection Fund (1990-1994). | | |
195 | | |
| nCAROLE E. STONE | | | |
1947
333 W. Wacker Drive
Chicago, IL 60606 | |
Board Member | | 2007
Class I | | Director, Chicago Board Options Exchange (since 2006); Director, C2 Options Exchange, Incorporated (since 2009); Director, CBOE Holdings, Inc. (since 2010); formerly, Commissioner, New York State Commission on Public Authority Reform (2005-2010). | | |
195 | | |
| nVIRGINIA L. STRINGER | | | |
1944
333 W. Wacker Drive
Chicago, IL 60606 | |
Board Member | | 2011
Class I | | Board Member, Mutual Fund Directors Forum; former governance consultant and non-profit board member; former Owner and President, Strategic Management Resources, Inc., a management consulting firm; former Member, Governing Board, Investment Company Institute's Independent Directors Council; previously, held several executive positions in general management, marketing and human resources at IBM and The Pillsbury Company; Independent Director, First American Fund Complex (1987-2010) and Chair (1997-2010). | | |
195 | | |
| nTERENCE J. TOTH | | | |
1959
333 W. Wacker Drive
Chicago, IL 60606 | |
Board Member | | 2008
Class II | | Managing Partner, Promus Capital (since 2008); Director, Fulcrum IT Service LLC (since 2010), Quality Control Corporation (since 2012) and LogicMark LLC (since 2012); formerly, Director, Legal & General Investment Management America, Inc. (2008-2013); formerly, CEO and President, Northern Trust Global Investments (2004-2007); Executive Vice President, Quantitative Management & Securities Lending (2000-2004); prior thereto, various positions with Northern Trust Company (since 1994); member: Chicago Fellowship Board (since 2005), Catalyst Schools of Chicago Board (since 2008) and Chairman, and Mather Foundation Board (since 2012), and a member of its investment committee; formerly, Member, Northern Trust Mutual Funds Board (2005-2007), Northern Trust Global Investments Board (2004-2007), Northern Trust Japan Board (2004-2007), Northern Trust Securities Inc. Board (2003-2007) and Northern Trust Hong Kong Board (1997-2004). | | |
195 | | |
Nuveen Investments
40
Name,
Year of Birth
& Address | | Position(s) Held
with the Funds | | Year First
Elected or
Appointed
and Term(1) | | Principal
Occupation(s)
Including other
Directorships
During Past 5 Years | | Number
of Portfolios
in Fund Complex
Overseen by
Board Member | |
Interested Board Members: | | | | | |
| nWILLIAM ADAMS IV(2) | | | |
1955
333 W. Wacker Drive
Chicago, IL 60606 | |
Board Member | | | 2013
Class II | | | Senior Executive Vice President, Global Structured Products (since 2010); formerly, Executive Vice President, U.S. Structured Products, of Nuveen Investments, Inc. (1999-2010); Co-President of Nuveen Fund Advisors, LLC (since 2011); President (since 2011), formerly, Managing Director (2010-2011) of Nuveen Commodities Asset Management, LLC; Board Member of the Chicago Symphony Orchestra and of Gilda's Club Chicago. | | |
195 | | |
| nTHOMAS S. SCHREIER, JR.(2) | | | |
1962
333 W. Wacker Drive
Chicago, IL 60606 | |
Board Member | | | 2013
Class III | | | Vice Chairman, Wealth Management of Nuveen Investments, Inc. (since 2011); Co-President of Nuveen Fund Advisors, LLC; Chairman of Nuveen Asset Management, LLC (since 2011); Co-Chief Executive Officer of Nuveen Securities, LLC (since 2011); Member of Board of Governors and Chairman's Council of the Investment Company Institute; formerly, Chief Executive Officer (2000-2010) and Chief Investment Officer (2007-2010) of FAF Advisors, Inc.; formerly, President of First American Funds (2001-2010). | | |
195 | | |
Name,
Year of Birth
and Address | | Position(s) Held
with the Funds | | Year First
Elected or
Appointed(3) | | Principal
Occupation(s)
During Past 5 Years | | Number
of Portfolios
in Fund Complex
Overseen
by Officer | |
Officers of the Funds: | | | | | |
| nGIFFORD R. ZIMMERMAN | | | |
1956
333 W. Wacker Drive
Chicago, IL 60606 | | Chief
Administrative
Officer | | | 1988 | | | Managing Director (since 2002), and Assistant Secretary of Nuveen Securities, LLC; Managing Director (since 2004) and Assistant Secretary (since 1994) of Nuveen Investments, Inc.; Managing Director (since 2002), Assistant Secretary (since 1997) and Co-General Counsel (since 2011) of Nuveen Fund Advisors, LLC; Managing Director, Assistant Secretary and Associate General Counsel of Nuveen Asset Management, LLC (since 2011); Managing Director, Associate General Counsel and Assistant Secretary, of Symphony Asset Management LLC (since 2003); Vice President and Assistant Secretary of NWQ Investment Management Company, LLC (since 2002), Nuveen Investments Advisers Inc. (since 2002), Santa Barbara Asset Management, LLC (since 2006), and of Winslow Capital Management, LLC, (since 2010); Vice President and Assistant Secretary (since 2013), formerly, Chief Administrative Officer and Chief Compliance Officer (2006-2013) of Nuveen Commodities Asset Management, LLC; Chartered Financial Analyst. | | |
196 | | |
| nCEDRIC H. ANTOSIEWICZ | | | |
1962
333 W. Wacker Drive
Chicago, IL 60606 | |
Vice President | | | 2007 | | | Managing Director of Nuveen Securities, LLC. (since 2004); Managing Director of Nuveen Fund Advisors, LLC (since 2014) | | |
89 | | |
| nMARGO L. COOK | | | |
1964
333 W. Wacker Drive
Chicago, IL 60606 | |
Vice President | | | 2009 | | | Executive Vice President (since 2008) of Nuveen Investments, Inc. and of Nuveen Fund Advisors, LLC (since 2011); Managing Director-Investment Services of Nuveen Commodities Asset Management, LLC (since August 2011), previously, Head of Institutional Asset Management (2007-2008) of Bear Stearns Asset Management; Head of Institutional Asset Management (1986-2007) of Bank of NY Mellon; Chartered Financial Analyst. | | |
196 | | |
Nuveen Investments
41
Board Members & Officers (Unaudited) (continued)
Name,
Year of Birth
and Address | | Position(s) Held
with the Funds | | Year First
Elected or
Appointed(3) | | Principal
Occupation(s)
During Past 5 Years | | Number
of Portfolios
in Fund Complex
Overseen
by Officer | |
Officers of the Funds (continued): | | | | | |
| nLORNA C. FERGUSON | | | |
1945
333 W. Wacker Drive
Chicago, IL 60606 | |
Vice President | | | 1998 | | | Managing Director (since 2005) of Nuveen Fund Advisors, LLC and Nuveen Securities, LLC (since 2004). | | |
196 | | |
| nSTEPHEN D. FOY | | | |
1954
333 W. Wacker Drive
Chicago, IL 60606 | | Vice President
and Controller | | | 1998 | | | Managing Director (since 2014), formerly, Senior Vice President
(2013-2014), and Vice President of Nuveen Fund Advisors, LLC; Chief Financial Officer of Nuveen Commodities Asset Management, LLC (since 2010); Senior Vice President (2010-2011), Formerly Vice President (2005-2010) and Funds Controller of Nuveen Securities, LLC; Certified Public Accountant. | | |
196 | | |
| nSCOTT S. GRACE | | | |
1970
333 W. Wacker Drive
Chicago, IL 60606 | | Vice President
and Treasurer | | | 2009 | | | Managing Director, Corporate Finance & Development, Treasurer (since 2009) of Nuveen Securities, LLC; Managing Director and Treasurer (since 2009) of Nuveen Fund Advisors, LLC, Nuveen Investments Advisers, Inc., Nuveen Investments Holdings Inc. and (since 2011) Nuveen Asset Management, LLC; Vice President and Treasurer of NWQ Investment Management Company, LLC, Tradewinds Global Investors, LLC, Symphony Asset Management LLC and Winslow Capital Management, LLC.; Vice President of Santa Barbara Asset Management, LLC; formerly, Treasurer (2006-2009), Senior Vice President (2008-2009), previously, Vice President (2006-2008) of Janus Capital Group, Inc.; formerly, Senior Associate in Morgan Stanley's Global Financial Services Group (2000-2003); Chartered Accountant Designation. | | |
196 | | |
| nWALTER M. KELLY | | | |
1970
333 W. Wacker Drive
Chicago, IL 60606 | | Chief Compliance
Officer and
Vice President | | | 2003 | | | Senior Vice President (since 2008) of Nuveen Investment Holdings, Inc. | | |
196 | | |
| nTINA M. LAZAR | | | |
1961
333 W. Wacker Drive
Chicago, IL 60606 | |
Vice President | | | 2002 | | | Senior Vice President of Nuveen Investment Holdings, Inc. | | |
196 | | |
| nKEVIN J. MCCARTHY | | | |
1966
333 W. Wacker Drive
Chicago, IL 60606 | | Vice President
and Secretary | | | 2007 | | | Managing Director and Assistant Secretary (since 2008), Nuveen Securities, LLC; Managing Director (since 2008), Assistant Secretary since 2007) and Co-General Counsel (since 2011) of Nuveen Fund Advisors, LLC; Managing Director, Assistant Secretary and Associate General Counsel (since 2011) of Nuveen Asset Management, LLC; Managing Director (since 2008), and Assistant Secretary, Nuveen Investment Holdings, Inc.; Vice President (since 2007) and Assistant Secretary of Nuveen Investments Advisers Inc., NWQ Investment Management Company, LLC, NWQ Holdings, LLC, Symphony Asset Management LLC, Santa Barbara Asset Management, LLC, and of Winslow Capital Management, LLC. (since 2010); Vice President and Secretary (since 2010) of Nuveen Commodities Asset Management, LLC. | | |
196 | | |
Nuveen Investments
42
Name,
Year of Birth
and Address | | Position(s) Held
with the Funds | | Year First
Elected or
Appointed(3) | | Principal
Occupation(s)
During Past 5 Years | | Number
of Portfolios
in Fund Complex
Overseen
by Officer | |
Officers of the Funds (continued): | | | | | |
| nKATHLEEN L. PRUDHOMME | | | |
1953
901 Marquette Avenue
Minneapolis, MN 55402 | | Vice President and
Assistant Secretary | | | 2011 | | | Managing Director, Assistant Secretary and Co-General Counsel (since 2011) of Nuveen Fund Advisors, LLC; Managing Director, Assistant Secretary and Associate General Counsel (since 2011) of Nuveen Asset Management, LLC; Managing Director and Assistant Secretary (since 2011) of Nuveen Securities, LLC; formerly, Deputy General Counsel, FAF Advisors, Inc. (2004-2010). | | |
196 | | |
| nJOEL T. SLAGER | | | |
1978
333 West Wacker Drive
Chicago, IL 60606 | | Vice President and
Assistant Secretary | | | 2013 | | | Fund Tax Director for Nuveen Funds (since May, 2013); previously, Vice President of Morgan Stanley Investment Management, Inc., Assistant Treasurer of the Morgan Stanley Funds (from 2010 to 2013); Tax Director at PricewaterhouseCoopers LLP (from 2008 to 2010). | | |
196 | | |
(1) The Board Members serve three year terms. The Board of Trustees is divided into three classes. Class I, Class II, and Class III, with each being elected to serve until the third succeeding annual shareholders' meeting subsequent to its election or thereafter in each case when its respective successors are duly elected or appointed. The first year elected or appointed represents the year in which the board member was first elected or appointed to any fund in the Nuveen Complex.
(2) "Interested person" as defined in the 1940 Act, by reason of his position with Nuveen Investments, Inc. and certain of its subsidiaries, which are affiliates of the Nuveen Funds.
(3) Officers serve one year terms through August of each year. The year first elected or appointed represents the year in which the Officer was first elected or appointed to any fund in the Nuveen Complex.
Nuveen Investments
43

Nuveen Investments:
Serving Investors for Generations
Since 1898, financial advisors and their clients have relied on Nuveen Investments to provide dependable investment solutions through continued adherence to proven, long-term investing principles. Today, we offer a range of high quality equity and fixed-income solutions designed to be integral components of a well-diversified core portfolio.
Focused on meeting investor needs.
Nuveen Investments provides high-quality investment services designed to help secure the long-term goals of institutional and individual investors as well as the consultants and financial advisors who serve them. Nuveen Investments markets a wide range of specialized investment solutions which provide investors access to capabilities of its high-quality boutique investment affiliates—Nuveen Asset Management, Symphony Asset Management, NWQ Investment Management Company, Santa Barbara Asset Management, Tradewinds Global Investors, Winslow Capital Management and Gresham Investment Management. In total, Nuveen Investments managed $230 billion as of December 31, 2014.
Find out how we can help you.
To learn more about how the products and services of Nuveen Investments may be able to help you meet your financial goals, talk to your financial advisor, or call us at (800) 257-8787. Please read the information provided carefully before you invest. Investors should consider the investment objective and policies, risk considerations, charges and expenses of any investment carefully. Where applicable, be sure to obtain a prospectus, which contains this and other relevant information. To obtain a prospectus, please contact your securities representative or Nuveen Investments, 333 W. Wacker Dr., Chicago, IL 60606. Please read the prospectus carefully before you invest or send money.
Learn more about Nuveen Funds at: www.nuveen.com/cef
Distributed by Nuveen Securities, LLC | 333 West Wacker Drive | Chicago, IL 60606 | www.nuveen.com/cef
EAN-H-1214D 6244-INV-Y02/16
ITEM 2. CODE OF ETHICS.
As of the end of the period covered by this report, the registrant has adopted a code of ethics that applies to the registrant’s principal executive officer, principal financial officer, principal accounting officer or controller, or persons performing similar functions. There were no amendments to or waivers from the Code during the period covered by this report. The registrant has posted the code of ethics on its website at www.nuveen.com/CEF/Shareholder/FundGovernance.aspx. (To view the code, click on Code of Conduct.)
ITEM 3. AUDIT COMMITTEE FINANCIAL EXPERT.
The registrant’s Board of Directors or Trustees (“Board”) determined that the registrant has at least one “audit committee financial expert” (as defined in Item 3 of Form N-CSR) serving on its Audit Committee. The registrant’s audit committee financial experts are Carole E. Stone and Jack B. Evans, who are “independent” for purposes of Item 3 of Form N-CSR.
Ms. Stone served for five years as Director of the New York State Division of the Budget. As part of her role as Director, Ms. Stone was actively involved in overseeing the development of the State’s operating, local assistance and capital budgets, its financial plan and related documents; overseeing the development of the State’s bond-related disclosure documents and certifying that they fairly presented the State’s financial position; reviewing audits of various State and local agencies and programs; and coordinating the State’s system of internal audit and control. Prior to serving as Director, Ms. Stone worked as a budget analyst/examiner with increasing levels of responsibility over a 30 year period, including approximately five years as Deputy Budget Director. Ms. Stone has also served as Chair of the New York State Racing Association Oversight Board, as Chair of the Public Authorities Control Board, as a Commissioner on the New York State Commission on Public Authority Reform and as a member of the Boards of Directors of several New York State public authorities. These positions have involved overseeing operations and finances of certain entities and assessing the adequacy of project/entity financing and financial reporting. Currently, Ms. Stone is on the Board of Directors of CBOE Holdings, Inc., of the Chicago Board Options Exchange, and of C2 Options Exchange. Ms. Stone’s position on the boards of these entities and as a member of both CBOE Holdings’ Audit Committee and its Finance Committee has involved, among other things, the oversight of audits, audit plans and preparation of financial statements.
Mr. Evans was formerly President and Chief Operating Officer of SCI Financial Group, Inc., a full service registered broker-dealer and registered investment adviser (“SCI”). As part of his role as President and Chief Operating Officer, Mr. Evans actively supervised the Chief Financial Officer (the “CFO”) and actively supervised the CFO’s preparation of financial statements and other filings with various regulatory authorities. In such capacity, Mr. Evans was actively involved in the preparation of SCI’s financial statements and the resolution of issues raised in connection therewith. Mr. Evans has also served on the audit committee of various reporting companies. At such companies, Mr. Evans was involved in the oversight of audits, audit plans, and the preparation of financial statements. Mr. Evans also formerly chaired the audit committee of the Federal Reserve Bank of Chicago.
ITEM 4. PRINCIPAL ACCOUNTANT FEES AND SERVICES.
NUVEEN GLOBAL EQUITY INCOME FUND
The following tables show the amount of fees that PricewaterhouseCoopers LLP, the Fund’s auditor, billed to the Fund during the Fund’s last two full fiscal years. For engagements with PricewaterhouseCoopers LLP the Audit Committee approved in advance all audit services and non-audit services that PricewaterhouseCoopers LLP provided to the Fund, except for those non-audit services that were subject to the pre-approval exception under Rule 2-01 of Regulation S-X (the “pre-approval exception”). The pre-approval exception for services provided directly to the Fund waives the pre-approval requirement for services other than audit, review or attest services if: (A) the aggregate amount of all such services provided constitutes no more than 5% of the total amount of revenues paid by the Fund to its accountant during the fiscal year in which the services are provided; (B) the Fund did not recognize the services as non-audit services at the time of the engagement; and (C) the services are promptly brought to the Audit Committee’s attention, and the Committee (or its delegate) approves the services before the audit is completed.
The Audit Committee has delegated certain pre-approval responsibilities to its Chairman (or, in his absence, any other member of the Audit Committee).
SERVICES THAT THE FUND’S AUDITOR BILLED TO THE FUND
| | Audit Fees Billed | | Audit-Related Fees | | Tax Fees | | All Other Fees | |
Fiscal Year Ended | | to Fund (1) | | Billed to Fund (2) | | Billed to Fund (3) | | Billed to Fund (4) | |
December 31, 2014 | | $ | 31,767 | | $ | 0 | | $ | 11,351 | | $ | 0 | |
| | | | | | | | | |
Percentage approved pursuant to pre-approval exception | | 0 | % | 0 | % | 0 | % | 0 | % |
| | | | | | | | | |
December 31, 2013 | | $ | 30,616 | | $ | 0 | | $ | 5,205 | | $ | 0 | |
| | | | | | | | | |
Percentage approved pursuant to pre-approval exception | | 0 | % | 0 | % | 0 | % | 0 | % |
(1) | | “Audit Fees” are the aggregate fees billed for professional services for the audit of the Fund’s annual financial statements and services provided in connection with statutory and regulatory filings or engagements. |
| | |
(2) | | “Audit Related Fees” are the aggregate fees billed for assurance and related services reasonably related to the performance of the audit or review of financial statements that are not reported under “Audit Fees”. These fees include offerings related to the Fund’s common shares and leverage. |
| | |
(3) | | “Tax Fees” are the aggregate fees billed for professional services for tax advice, tax compliance, and tax planning. These fees include: all global withholding tax services; excise and state tax reviews; capital gain, tax equalization and taxable basis calculation performed by the principal accountant. |
| | |
(4) | | “All Other Fees” are the aggregate fees billed for products and services other than “Audit Fees”, “Audit-Related Fees” and “Tax Fees”. These fees represent all “Agreed-Upon Procedures” engagements pertaining to the Fund’s use of leverage. |
SERVICES THAT THE FUND’S AUDITOR BILLED TO THE
ADVISER AND AFFILIATED FUND SERVICE PROVIDERS
The following tables show the amount of fees billed by PricewaterhouseCoopers LLP to Nuveen Fund Advisors, LLC (formerly Nuveen Fund Advisors, Inc.) (the “Adviser”), and any entity controlling, controlled by or under common control with the Adviser that provides ongoing services to the Fund (“Affiliated Fund Service Provider”), for engagements directly related to the Fund’s operations and financial reporting, during the Fund’s last two full fiscal years.
The tables also show the percentage of fees subject to the pre-approval exception. The pre-approval exception for services provided to the Adviser and any Affiliated Fund Service Provider (other than audit, review or attest services) waives the pre-approval requirement if: (A) the aggregate amount of all such services provided constitutes no more than 5% of the total amount of revenues paid to PricewaterhouseCoopers LLP by the Fund, the Adviser and Affiliated Fund Service Providers during the fiscal year in which the services are provided that would have to be pre-approved by the Audit Committee; (B) the Fund did not recognize the services as non-audit services at the time of the engagement; and (C) the services are promptly brought to the Audit Committee’s attention, and the Committee (or its delegate) approves the services before the Fund’s audit is completed.
| | Audit-Related Fees | | Tax Fees Billed to | | All Other Fees | |
| | Billed to Adviser and | | Adviser and | | Billed to Adviser | |
| | Affiliated Fund | | Affiliated Fund | | and Affiliated Fund | |
Fiscal Year Ended | | Service Providers | | Service Providers | | Service Providers | |
December 31, 2014 | | $ | 0 | | $ | 0 | | $ | 0 | |
| | | | | | | |
Percentage approved pursuant to pre-approval exception | | 0 | % | 0 | % | 0 | % |
| | | | | | | |
December 31, 2013 | | $ | 0 | | $ | 0 | | $ | 0 | |
| | | | | | | |
Percentage approved pursuant to pre-approval exception | | 0 | % | 0 | % | 0 | % |
NON-AUDIT SERVICES
The following table shows the amount of fees that PricewaterhouseCoopers LLP billed during the Fund’s last two full fiscal years for non-audit services. The Audit Committee is required to pre-approve non-audit services that PricewaterhouseCoopers LLP provides to the Adviser and any Affiliated Fund Services Provider, if the engagement related directly to the Fund’s operations and financial reporting (except for those subject to the pre-approval exception described above). The Audit Committee requested and received information from PricewaterhouseCoopers LLP about any non-audit services that PricewaterhouseCoopers LLP rendered during the Fund’s last fiscal year to the Adviser and any Affiliated Fund Service Provider. The Committee considered this information in evaluating PricewaterhouseCoopers LLP’s independence.
| | | | Total Non-Audit Fees | | | | | |
| | | | billed to Adviser and | | | | | |
| | | | Affiliated Fund Service | | Total Non-Audit Fees | | | |
| | | | Providers (engagements | | billed to Adviser and | | | |
| | | | related directly to the | | Affiliated Fund Service | | | |
| | Total Non-Audit Fees | | operations and financial | | Providers (all other | | | |
Fiscal Year Ended | | Billed to Fund | | reporting of the Fund) | | engagements) | | Total | |
December 31, 2014 | | $ | 11,351 | | $ | 0 | | $ | 0 | | $ | 11,351 | |
December 31, 2013 | | $ | 5,205 | | $ | 0 | | $ | 0 | | $ | 5,205 | |
“Non-Audit Fees billed to Fund” for both fiscal year ends represent “Tax Fees” and “All Other Fees” billed to Fund in their respective amounts from the previous table.
Less than 50 percent of the hours expended on the principal accountant’s engagement to audit the registrant’s financial statements for the most recent fiscal year were attributed to work performed by persons other than the principal accountant’s full-time, permanent employees.
Audit Committee Pre-Approval Policies and Procedures. Generally, the Audit Committee must approve (i) all non-audit services to be performed for the Fund by the Fund’s independent accountants and (ii) all audit and non-audit services to be performed by the Fund’s independent accountants for the Affiliated Fund Service Providers with respect to operations and financial reporting of the Fund. Regarding tax and research projects conducted by the independent accountants for the Fund and Affiliated Fund Service Providers (with respect to operations and financial reports of the Fund) such engagements will be (i) pre-approved by the Audit Committee if they are expected to be for amounts greater than $10,000; (ii) reported to the Audit Committee chairman for his verbal approval prior to engagement if they are expected to be for amounts under $10,000 but greater than $5,000; and (iii) reported to the Audit Committee at the next Audit Committee meeting if they are expected to be for an amount under $5,000.
ITEM 5. AUDIT COMMITTEE OF LISTED REGISTRANTS.
The registrant’s Board has a separately designated Audit Committee established in accordance with Section 3(a)(58)(A) of the Securities Exchange Act of 1934, as amended (15 U.S.C. 78c(a)(58)(A)). The members of the audit committee are Jack B. Evans, David J. Kundert, John K. Nelson, Carole E. Stone and Terence J. Toth.
ITEM 6. SCHEDULE OF INVESTMENTS.
(a) See Portfolio of Investments in Item 1.
(b) Not applicable.
ITEM 7. DISCLOSURE OF PROXY VOTING POLICIES AND PROCEDURES FOR CLOSED-END MANAGEMENT INVESTMENT COMPANIES.
Nuveen Fund Advisors, LLC, formerly known as Nuveen Fund Advisors, Inc., is the registrant’s investment adviser (also referred to as the “Adviser”). The Adviser is responsible for the on-going monitoring of the Fund’s investment portfolio, managing the Fund’s business affairs and providing certain clerical, bookkeeping and administrative services. The Adviser has engaged Tradewinds Global Investors, LLC (“Tradewinds” or “Sub-Adviser”) as Sub-Adviser to provide discretionary investment advisory services. As part of these services, the Adviser has delegated to the Sub-Adviser the full responsibility for proxy voting on securities held in the registrant’s portfolio and related duties in accordance with the Sub-Adviser’s policies and procedures. The Adviser periodically monitors the Sub-Adviser’s voting to ensure that it is carrying out its duties. The Sub-Adviser’s proxy voting policies and procedures are attached to this filing as an exhibit and incorporated herein by reference.
ITEM 8. PORTFOLIO MANAGERS OF CLOSED-END MANAGEMENT INVESTMENT COMPANIES.
Nuveen Fund Advisors, LLC (“NFALLC”) is the registrant’s investment adviser (NFALLC is also referred to as the “Adviser”.) NFALLC is responsible for the selection and on-going monitoring of the Fund’s investment portfolio, managing the Fund’s business affairs and providing certain clerical, bookkeeping and administrative services. The Adviser has engaged Tradewinds Global Investors, LLC, for a portion of the registrant’s investments (Tradewinds is also referred to as “Sub-Adviser”). Tradewinds, as Sub-Adviser, provides discretionary investment advisory services. The following section provides information on the portfolio managers at the Sub-Adviser:
Item 8 (a)(1). PORTFOLIO MANAGER BIOGRAPHY
Rodney A. Parsley, Managing Director, Portfolio Manager and Equity Analyst
Rod Parsley is an energy analyst at Tradewinds. Rod joined Tradewinds in June 2012 with 15 years of investment experience, most recently at Perella Weinberg Partners, where he was a partner in the firm and the portfolio manager for its Sustainable Resources Fund, investing in the global energy, natural resource, water and agriculture sectors. Prior to that position, he was the portfolio manager of The Water Fund, a value-driven hedge fund that invested in global water and resource-related companies. Rod earned his bachelor’s degree in economics and politics from Pomona College, and an MBA from Harvard Business School.
Item 8 (a)(2). OTHER ACCOUNTS MANAGED
In addition to the Fund, as of December 31, 2014, the portfolio manager is also primarily responsible for the day-to-day portfolio management of the following accounts:
| | Rod Parsley | |
(a) RICs | | | |
Number of accts | | 0 | |
Assets ($000s) | | $ | 0 | |
| | | |
(b) Other pooled accts | | | |
Non-performance fee accts | | | |
Number of accts | | 0 | |
Assets ($000s) | | | |
(c) Other | | | |
Non-performance fee accts | | | |
Number of accts | | 3 | |
Assets ($000s) | | $ | 278,544,540 | |
Performance fee accts | | | |
Number of accts | | 0 | |
Assets ($000s) | | 0 | |
POTENTIAL MATERIAL CONFLICTS OF INTEREST
Actual or perceived conflicts of interest may arise when a portfolio manager has day-to-day management responsibilities with respect to more than one account. More specifically, portfolio managers who manage multiple accounts are presented with the following potential conflicts, which are not intended to be an exhaustive list:
· The management of multiple accounts may result in a portfolio manager devoting unequal time and attention to the management of each account. Tradewinds seeks to manage such competing interests for the time and attention of portfolio managers by having portfolio managers focus on a particular investment discipline. Most accounts managed by a portfolio manager in a particular investment strategy are managed using the same investment models.
· If a portfolio manager identifies a limited investment opportunity which may be suitable for more than one account, an account may not be able to take full advantage of that opportunity due to an allocation of filled purchase or sale orders across all eligible accounts. To deal with these situations, Tradewinds has adopted procedures for allocating limited opportunities across multiple accounts.
· With respect to many of its clients’ accounts, Tradewinds determines which broker to utilize when placing orders for execution, consistent with its duty to seek to obtain best execution of the transaction. However, with respect to certain other accounts, Tradewinds may be limited by the client with respect to the selection of brokers when the client requests Tradewinds to direct trade through a particular broker. In these cases, Tradewinds may place separate transactions for certain accounts that may temporarily affect the market price of the security or the execution of the transaction, or both, to the detriment of other accounts. Tradewinds seeks to minimize market impact by using its discretion in releasing orders in a manner that causes the least possible impact.
· Finally, the appearance of a conflict of interest may arise where Tradewinds has an incentive, such as a performance-based management fee, which relates to the management of some accounts, with respect to which a portfolio manager has day-to-day management responsibilities. Tradewinds periodically performs a comparative analysis of the performance between accounts with performance fees and those without performance fees.
Tradewinds has adopted certain compliance procedures which are designed to address these types of conflicts common among investment managers. However, there is no guarantee that such procedures will detect each and every situation in which a conflict arises.
Item 8 (a)(3). FUND MANAGER COMPENSATION
Tradewinds offers a highly competitive compensation structure with the purpose of attracting and retaining the most talented investment professionals. These professionals are rewarded through a combination of cash and long-term incentive compensation as determined by the firm’s President, Co-Chief Investment Officers, and group heads as appropriate. Total cash compensation (TCC) consists of both a base salary and an annual bonus. Tradewinds annually benchmarks TCC to prevailing industry norms with the objective of achieving competitive levels for all contributing professionals.
Available bonus pool compensation is primarily a function of the firm’s overall annual profitability. Individual bonuses are based primarily on the following:
· Overall performance of client portfolios
· Objective review of stock recommendations versus global sector benchmarks
· Feedback from a formal peer review carried out on an annual basis
· Subjective review of the professional’s contributions to portfolio strategy, teamwork, collaboration and work ethic
An employee equity participation program was implemented during the first quarter of 2012, and supplemented in early 2014, which enables a broad group of our team to participate in the long-term success of Tradewinds by sharing in the earnings of the firm.
At Tradewinds, we believe that we are an employer of choice. Our analysts have a meaningful impact on the portfolio and, therefore, are compensated in a similar manner as portfolio managers at many other firms. Benefits outside of compensation include a college tuition program for the children of full-time employees whereby they are eligible for reimbursement of tuition and other mandatory fees.
Item 8 (a)(4). OWNERSHIP OF JGV SECURITIES AS OF DECEMBER 31, 2014
Name of Portfolio
Manager | | None | | $1 -
$10,000 | | $10,001
-
$50,000 | | $50,001-
$100,000 | | $100,001-
$500,000 | | $500,001-
$1,000,000 | | Over
$1,000,000 | |
Rod Parsley | | X | | | | | | | | | | | | | |
ITEM 9. PURCHASES OF EQUITY SECURITIES BY CLOSED-END MANAGEMENT INVESTMENT COMPANY AND AFFILIATED PURCHASERS.
| | | | (b) | | (c) | | (d)* | |
| | (a) | | AVERAGE | | TOTAL NUMBER OF SHARES | | MAXIMUM NUMBER (OR | |
| | TOTAL NUMBER OF | | PRICE | | (OR UNITS) PURCHASED AS | | APPROXIMATE DOLLAR VALUE) OF | |
| | SHARES (OR | | PAID PER | | PART OF PUBLICLY | | SHARES (OR UNITS) THAT MAY YET | |
| | UNITS) | | SHARE (OR | | ANNOUNCED PLANS OR | | BE PURCHASED UNDER THE PLANS OR | |
Period* | | PURCHASED | | UNIT) | | PROGRAMS | | PROGRAMS | |
JANUARY 1-31, 2014 | | 0 | | | | 0 | | 1,920,000 | |
FEBRUARY 1-28, 2014 | | 0 | | | | 0 | | 1,920,000 | |
MARCH 1-31, 2014 | | 0 | | | | 0 | | 1,920,000 | |
APRIL 1-30, 2014 | | 0 | | | | 0 | | 1,920,000 | |
MAY 1-31, 2014 | | 164,588 | | $ | 13.97 | | 164,588 | | 1,755,412 | |
JUNE 1-30, 2014 | | 0 | | | | 0 | | 1,755,412 | |
JULY 1-31, 2014 | | 0 | | | | 0 | | 1,755,412 | |
AUGUST 1-31, 2014 | | 0 | | | | 0 | | 1,905,000 | |
SEPTEMBER 1-30, 2014 | | 0 | | | | 0 | | 1,905,000 | |
OCTOBER 1-31, 2014 | | 0 | | | | 0 | | 1,905,000 | |
NOVEMBER 1-30, 2014 | | 0 | | | | 0 | | 1,905,000 | |
DECEMBER 1-31, 2014 | | 0 | | | | 0 | | 1,905,000 | |
TOTAL | | 164,588 | | | | | | | |
| | | | | | | | | | |
* The registrant’s repurchase program, for the repurchase of 1,920,000 shares, was authorized November 20, 2013. The program was reauthorized for a maximum repurchase amount of 1,905,000 shares on August 6, 2014. Any repurchases made by the registrant pursuant to the program were made through open-market transactions.
ITEM 10. SUBMISSION OF MATTERS TO A VOTE OF SECURITY HOLDERS.
There have been no material changes to the procedures by which shareholders may recommend nominees to the registrant’s Board implemented after the registrant last provided disclosure in response to this Item.
ITEM 11. CONTROLS AND PROCEDURES.
(a) The registrant’s principal executive and principal financial officers, or persons performing similar functions, have concluded that the registrant’s disclosure controls and procedures (as defined in Rule 30a-3(c) under the Investment Company Act of 1940, as amended (the “1940 Act”) (17 CFR 270.30a-3(c))) are effective, as of a date within 90 days of the filing date of this report that includes the disclosure required by this paragraph, based on their evaluation of the controls and procedures required by Rule 30a-3(b) under the 1940 Act (17 CFR 270.30a-3(b)) and Rules 13a-15(b) or 15d-15(b) under the Securities Exchange Act of 1934, as amended (the “Exchange Act”) (17 CFR 240.13a-15(b) or 240.15d-15(b)).
(b) There were no changes in the registrant’s internal control over financial reporting (as defined in Rule 30a-3(d) under the 1940 Act (17 CFR 270.30a-3(d)) that occurred during the second fiscal quarter of the period covered by this report that has materially affected, or is reasonably likely to materially affect, the registrant’s internal control over financial reporting.
ITEM 12. EXHIBITS.
File the exhibits listed below as part of this Form.
(a)(1) Any code of ethics, or amendment thereto, that is the subject of the disclosure required by Item 2, to the extent that the registrant intends to satisfy the Item 2 requirements through filing of an exhibit: Not applicable because the code is posted on registrant’s website at www.nuveen.com/CEF/Shareholder/FundGovernance.aspx and there were no amendments during the period covered by this report. (To view the code, click on Code of Conduct.)
(a)(2) A separate certification for each principal executive officer and principal financial officer of the registrant as required by Rule 30a-2(a) under the 1940 Act (17 CFR 270.30a-2(a)) in the exact form set forth below: Ex-99.CERT Attached hereto.
(a)(3) Any written solicitation to purchase securities under Rule 23c-1 under the 1940 Act (17 CFR 270.23c-1) sent or given during the period covered by the report by or on behalf of the registrant to 10 or more persons. Not applicable.
(b) If the report is filed under Section 13(a) or 15(d) of the Exchange Act, provide the certifications required by Rule 30a-2(b) under the 1940 Act (17 CFR 270.30a-2(b)); Rule 13a-14(b) or Rule 15d-14(b) under the Exchange Act (17 CFR 240.13a-14(b) or 240.15d-14(b)), and Section 1350 of Chapter 63 of Title 18 of the United States Code (18 U.S.C. 1350) as an exhibit. A certification furnished pursuant to this paragraph will not be deemed “filed” for purposes of Section 18 of the Exchange Act (15 U.S.C. 78r), or otherwise subject to the liability of that section. Such certification will not be deemed to be incorporated by reference into any filing under the Securities Act of 1933 or the Exchange Act, except to the extent that the registrant specifically incorporates it by reference. Ex-99.906 CERT attached hereto.
SIGNATURES
Pursuant to the requirements of the Securities Exchange Act of 1934 and the Investment Company Act of 1940, the registrant has duly caused this report to be signed on its behalf by the undersigned, thereunto duly authorized.
(Registrant) Nuveen Global Equity Income Fund
By (Signature and Title) | /s/ Kevin J. McCarthy | |
| Kevin J. McCarthy | |
| Vice President and Secretary | |
Date: March 6, 2015
Pursuant to the requirements of the Securities Exchange Act of 1934 and the Investment Company Act of 1940, this report has been signed below by the following persons on behalf of the registrant and in the capacities and on the dates indicated.
By (Signature and Title) | /s/ Gifford R. Zimmerman | |
| Gifford R. Zimmerman | |
| Chief Administrative Officer
(principal executive officer) | |
Date: March 6, 2015
By (Signature and Title) | /s/ Stephen D. Foy | |
| Stephen D. Foy | |
| Vice President and Controller
(principal financial officer) | |
Date: March 6, 2015