United States
Securities and Exchange Commission
Washington, D.C. 20549
Form N-CSR
Certified Shareholder Report of Registered Management Investment Companies
811-21904
(Investment Company Act File Number)
Federated MDT Series
_______________________________________________________________
(Exact Name of Registrant as Specified in Charter)
Federated Investors Funds
4000 Ericsson Drive
Warrendale, Pennsylvania 15086-7561
(Address of Principal Executive Offices)
(412) 288-1900
(Registrant's Telephone Number)
John W. McGonigle, Esquire
Federated Investors Tower
1001 Liberty Avenue
Pittsburgh, Pennsylvania 15222-3779
(Name and Address of Agent for Service)
(Notices should be sent to the Agent for Service)
Date of Fiscal Year End: 07/31/2012
Date of Reporting Period: 07/31/2012
Item 1. Reports to Stockholders

Annual Shareholder Report
July 31, 2012
| Share Class | Ticker |
| A | QAACX |
| C | QCACX |
| R | QKACX |
| Institutional | QIACX |
Federated MDT All Cap Core Fund
Fund Established 2002
A Portfolio of Federated MDT Series
Dear Valued Shareholder,
I am pleased to present the Annual Shareholder Report for your fund covering the period from August 1, 2011 through July 31, 2012. This report includes Management's Discussion of Fund Performance, a complete listing of your fund's holdings, performance information and financial statements along with other important fund information.
In addition, our website, FederatedInvestors.com, offers easy access to Federated resources that include timely fund updates, economic and market insights from our investment strategists, and financial planning tools. We invite you to register to take full advantage of its capabilities.
Thank you for investing with Federated. I hope you find this information useful and look forward to keeping you informed.
Sincerely,
J. Christopher Donahue, President
Not FDIC Insured • May Lose Value • No Bank Guarantee
Management's Discussion of Fund Performance (unaudited)
The Fund's total return, based on net asset value, for the 12-month reporting period ended July 31, 2012 was 2.00% for Class A Shares, 1.16% for Class C Shares, 1.45% for Class R Shares and 2.23% for Institutional Shares. The total return of the Russell 3000® Index (Russell 3000®),1 a broad-based securities market index, was 7.33% for the same period. The Fund's total return for the fiscal year reflected actual cash flows, transaction costs and other expenses, which were not reflected in the total return of the Russell 3000®.
Market Overview
During the reporting period, domestic equity market performance was favorable as evidenced by the 7.33% return on the Russell 3000®. Large-cap stocks led the way during the reporting period, as demonstrated by the 10.41% return of the Russell Top 200® Index,2 exceeding by far the 2.28% and 0.19% results for the Russell Midcap® Index,3 representing the mid-cap stocks, and the Russell 2000® Index,4 representing small-cap stocks, respectively. Growth stocks outperformed value stocks slightly during the year with the Russell 3000 Growth® Index,5 returning 7.55% as compared to 7.09% for the Russell 3000 Value® Index.6
The best performing sectors in the Russell 3000®, during the reporting period were Telecommunications (+27.07%), Consumer Staples (+17.96%), Public Utilities (+17.67%) and Health Care (+14.36%). Underperforming sectors included Energy (-7.20%), Materials (-5.76%) and Financials (+2.74%).
Fund Performance
The most significant positive factors in the Fund's performance for this period relative to the Russell 3000® were the Consumer Discretionary and Public Utilities sectors. The stock selection in each of these sectors was favorable, and there was a significant overweight in the Consumer Discretionary sector which did outperform the benchmark. The most significant negative factor in the Fund's performance was poor stock selection in the Information Technology sector, where Hewlett Packard was the single stock that detracted the most from the Fund's performance and NetApp, Agilent, Ingram Micro and Dell underperformed as well. The Energy sector was a secondary factor contributing to underperformance. That sector was the worst performing sector in the benchmark and although it was underweighted in the Fund which offset some of that poor performance, holdings in Murphy Oil and Carbo Ceramics detracted from Fund performance.
Individual stocks enhancing the Fund's performance included Wal-Mart Stores, Home Depot, MasterCard and Verizon Communications.
Individual stocks detracting from the Fund's performance included Hewlett-Packard, Caterpillar, Lincoln National and Wynn Resorts Limited.
Annual Shareholder Report
| 1 | The Russell 3000® offers investors access to the broad U.S. equity universe representing approximately 98% of the U.S. market. The Russell 3000® is constructed to provide a comprehensive, unbiased and stable barometer of the broad market and is completely reconstituted annually to ensure that new and growing equities are reflected. The index is unmanaged, and it is not possible to invest directly in an index. |
| 2 | Russell Top 200® Index measures the performance of the 200 largest companies in the Russell 1000® Index and represents approximately 66% of the total market capitalization of the Russell 1000® Index. The index is unmanaged, and it is not possible to invest directly in an index. |
| 3 | The Russell Midcap® Index measures the performance of the 800 smallest companies in the Russell 1000® Index and represents approximately 27% of the total market capitalization of the Russell 1000® Index. The index is unmanaged, and it is not possible to invest directly in an index. |
| 4 | The Russell 2000® Index measures the performance of the 2,000 smallest companies in the Russell 3000® Index and represents approximately 7% of the total market capitalization of the Russell 3000® Index. The index is unmanaged, and it is not possible to invest directly in an index. |
| 5 | The Russell 3000 Growth® Index measures the performance of those Russell 3000® Index companies with higher price-to-book ratios and higher forecasted growth values. The stocks in this index are also members of either the Russell 1000 Growth® or the Russell 2000 Growth® indexes. The index is unmanaged, and it is not possible to invest directly in an index. |
| 6 | The Russell 3000 Value® Index measures the performance of those Russell 3000® Index companies with lower price-to-book ratios and lower forecasted growth values. The stocks in this index are also members of either the Russell 1000 Value® or the Russell 2000 Value® indexes. The index is unmanaged, and it is not possible to invest directly in an index. |
Annual Shareholder Report
FUND PERFORMANCE AND GROWTH OF A $10,000 INVESTMENT
The start of performance date for the Fund's Class A Shares, Class C Shares and Class R Shares was October 1, 2002. Class A Shares, Class C Shares and Class R Shares commenced operations on February 12, 2003, September 15, 2005 and December 12, 2006, respectively. Performance results shown before those dates are for the Fund's Institutional Shares and have been adjusted for the maximum sales charge, maximum contingent deferred sales charge and total annual operating expenses applicable to each class. The Fund's Institutional Shares commenced operations on October 1, 2002. Subject to the expense adjustments described above, the Class A Shares, Class C Shares and Class R Shares annual returns would be substantially similar to those of the Institutional Shares because Shares of each class are invested in the same portfolio of securities. The Average Annual Total Return table below shows returns for each class averaged over the stated periods. The graphs below illustrate the hypothetical investment of $10,0001 in the Federated MDT All Cap Core Fund2 (the “Fund”) from October 1, 2002 (start of performance) to July 31, 2012, compared to the Russell 3000® Index (Russell 3000®).3
Average Annual Total Returns for the Period Ended 7/31/2012
(returns reflect all applicable sales charges and contingent deferred sales charges as specified below in footnote #1)
| Share Class | 1 Year | 5 Years | Start of
Performance* |
| Class A Shares | -3.63% | -4.74% | 4.78% |
| Class C Shares | 0.16% | -4.42% | 4.58% |
| Class R Shares | 1.45% | -4.11% | 4.91% |
| Institutional Shares | 2.23% | -3.39% | 5.65% |
| * | The Fund's start of performance date was October 1, 2002. |
Performance data quoted represents past performance which is no guarantee of future results. Investment return and principal value will fluctuate so that an investor's shares, when redeemed, may be worth more or less than their original cost. Mutual fund performance changes over time and current performance may be lower or higher than what is stated. For current to the most recent month-end performance and after-tax returns, visit FederatedInvestors.com or call 1-800-341-7400. Returns shown do not reflect the deduction of taxes that a shareholder would pay on Fund distributions or the redemption of Fund shares. Mutual funds are not obligations of or guaranteed by any bank and are not federally insured.
Annual Shareholder Report
Growth of a $10,000 Investment–Class A Shares
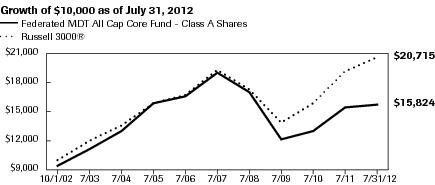
| Federated MDT All Cap Core Fund - Class A Shares | C000035043 | Russell 3000® |
| 10/1/2002 | 9,450 | 10,000 |
| 7/31/2003 | 11,108 | 12,016 |
| 7/31/2004 | 13,056 | 13,615 |
| 7/31/2005 | 15,900 | 15,917 |
| 7/31/2006 | 16,629 | 16,735 |
| 7/31/2007 | 19,069 | 19,426 |
| 7/31/2008 | 17,166 | 17,421 |
| 7/31/2009 | 12,176 | 13,900 |
| 7/31/2010 | 13,051 | 15,959 |
| 7/31/2011 | 15,514 | 19,301 |
| 7/31/2012 | 15,824 | 20,715 |
41 graphic description end -->
| ■ | Total returns shown include the maximum sales charge of 5.50% ($10,000 investment minus $550 sales charge = $9,450). |
Growth of a $10,000 Investment–Class C Shares
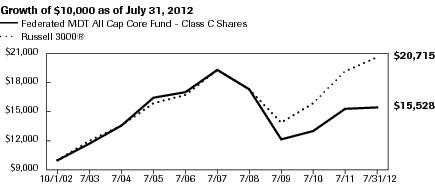
| Federated MDT All Cap Core Fund - Class C Shares | C000035044 | Russell 3000® |
| 10/1/2002 | 10,000 | 10,000 |
| 7/31/2003 | 11,681 | 12,016 |
| 7/31/2004 | 13,628 | 13,615 |
| 7/31/2005 | 16,473 | 15,917 |
| 7/31/2006 | 17,107 | 16,735 |
| 7/31/2007 | 19,469 | 19,426 |
| 7/31/2008 | 17,387 | 17,421 |
| 7/31/2009 | 12,233 | 13,900 |
| 7/31/2010 | 13,007 | 15,959 |
| 7/31/2011 | 15,350 | 19,301 |
| 7/31/2012 | 15,528 | 20,715 |
41 graphic description end -->
| ■ | Total returns shown include the maximum contingent deferred sales charge of 1.00%, as applicable. |
Annual Shareholder Report
Growth of a $10,000 Investment–Class R Shares
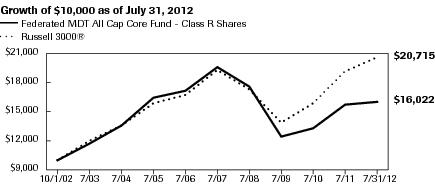
| Federated MDT All Cap Core Fund - Class R Shares | C000043497 | Russell 3000® |
| 10/1/2002 | 10,000 | 10,000 |
| 7/31/2003 | 11,703 | 12,016 |
| 7/31/2004 | 13,682 | 13,615 |
| 7/31/2005 | 16,587 | 15,917 |
| 7/31/2006 | 17,262 | 16,735 |
| 7/31/2007 | 19,765 | 19,426 |
| 7/31/2008 | 17,722 | 17,421 |
| 7/31/2009 | 12,508 | 13,900 |
| 7/31/2010 | 13,347 | 15,959 |
| 7/31/2011 | 15,793 | 19,301 |
| 7/31/2012 | 16,022 | 20,715 |
41 graphic description end -->
Growth of a $10,000 Investment–Institutional shares
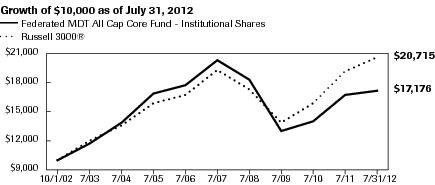
| Federated MDT All Cap Core Fund - Institutional Shares | C000035045 | Russell 3000® |
| 10/1/2002 | 10,000 | 10,000 |
| 7/31/2003 | 11,775 | 12,016 |
| 7/31/2004 | 13,869 | 13,615 |
| 7/31/2005 | 16,939 | 15,917 |
| 7/31/2006 | 17,761 | 16,735 |
| 7/31/2007 | 20,411 | 19,426 |
| 7/31/2008 | 18,429 | 17,421 |
| 7/31/2009 | 13,113 | 13,900 |
| 7/31/2010 | 14,102 | 15,959 |
| 7/31/2011 | 16,800 | 19,301 |
| 7/31/2012 | 17,176 | 20,715 |
41 graphic description end -->
| 1 | Represents a hypothetical investment of $10,000 in the Fund after deducting applicable sales charges: For Class A Shares, the maximum sales charge of 5.50% ($10,000 investment minus $550 sales charge = $9,450); for Class C Shares a 1.00% contingent deferred sales charge would be applied on any redemption less than one year from the purchase date. The Fund's performance assumes the reinvestment of all dividends and distributions. The Russell 3000® has been adjusted to reflect reinvestment of dividends of securities in the index. |
| 2 | The Fund is the successor to the MDT All Cap Core Fund pursuant to a reorganization that was completed on or about the close of business on December 8, 2006. Prior to that date, the Fund had no investment operations. Accordingly, the performance information shown for periods prior to that date for Class A Shares, Class C Shares and Class R Shares is historical information for the MDT All Cap Core Fund. The MDT All Cap Core Fund was managed by MDT Advisers and had similar investment objectives and strategies as the Fund. |
| 3 | The Russell 3000® offers investors access to the broad U.S. equity universe representing approximately 98% of the U.S. market. The Russell 3000® is constructed to provide a comprehensive, unbiased and stable barometer of the broad market and is completely reconstituted annually to ensure that new and growing equities are reflected. The index is unmanaged and, unlike the Fund, is not affected by cash flows. It is not possible to invest directly in an index. The Russell 3000® is not adjusted to reflect sales charges, expenses or other fees that the Securities and Exchange Commission requires to be reflected in the Fund's performance. |
Annual Shareholder Report
Portfolio of Investments Summary Table (unaudited)
At July 31, 2012, the Fund's industry composition1 was as follows:
| Industry Composition | Percentage of
Total Net Assets |
| Specialty Retailing | 6.5% |
| Regional Banks | 5.5% |
| Discount Department Stores | 4.6% |
| Integrated Domestic Oil | 4.6% |
| Money Center Bank | 4.4% |
| Services to Medical Professionals | 4.3% |
| Property Liability Insurance | 4.2% |
| Multi-Line Insurance | 4.1% |
| Department Stores | 3.8% |
| Personal Loans | 3.5% |
| Financial Services | 3.2% |
| Ethical Drugs | 3.1% |
| Broadcasting | 2.7% |
| Diversified Leisure | 2.2% |
| Hotels | 2.1% |
| Auto Manufacturing | 1.8% |
| Computers - Midrange | 1.8% |
| Cable & Wireless Television | 1.7% |
| Computer Stores | 1.6% |
| Cosmetics & Toiletries | 1.6% |
| Life Insurance | 1.6% |
| Drug Store | 1.5% |
| Semiconductor Distribution | 1.4% |
| Building Supply Stores | 1.3% |
| Oil Refiner | 1.3% |
| Specialty Chemicals | 1.2% |
| Soft Drinks | 1.1% |
| Airline - Regional | 1.0% |
| Diversified Oil | 1.0% |
| Other2 | 19.7% |
| Cash Equivalents3 | 1.4% |
| Other Assets and Liabilities—Net4 | 0.2% |
| TOTAL | 100.0% |
Annual Shareholder Report
| 1 | Except for Cash Equivalents and Other Assets and Liabilities, industry classifications are based upon, and individual portfolio securities are assigned to, the classifications of the Global Industry Classification Standard (GICS) except that the Adviser assigns a classification to securities not classified by the GICS and to securities for which the Adviser does not have access to the classification made by the GICS. |
| 2 | For purposes of this table, industry classifications which constitute less than 1.0% of the Fund's total net assets have been aggregated under the designation “Other.” |
| 3 | Cash Equivalents include any investments in money market mutual funds and/or overnight repurchase agreements. |
| 4 | Assets, other than investments in securities, less liabilities. See Statement of Assets and Liabilities.
|
Annual Shareholder Report
Portfolio of Investments
July 31, 2012
| Shares | | | Value |
| | COMMON STOCKS—98.4% | |
| | Agricultural Chemicals—0.1% | |
| 2,500 | | Scotts Miracle-Gro Co. | $99,750 |
| | Agricultural Machinery—0.1% | |
| 1,800 | | Lindsay Manufacturing Co. | 127,620 |
| | Airline - Regional—1.0% | |
| 28,534 | 1 | Alaska Air Group, Inc. | 994,410 |
| | Aluminum—0.2% | |
| 4,400 | | Kaiser Aluminum Corp. | 239,976 |
| | Apparel—0.8% | |
| 8,800 | 1 | Carter's, Inc. | 445,896 |
| 2,300 | | Guess ?, Inc. | 69,230 |
| 2,500 | 1 | Warnaco Group, Inc. | 106,650 |
| 4,400 | 1 | Zumiez, Inc. | 159,852 |
| | TOTAL | 781,628 |
| | AT&T Divestiture—0.2% | |
| 5,200 | | Verizon Communications, Inc. | 234,728 |
| | Auto Manufacturing—1.8% | |
| 26,800 | | Ford Motor Co. | 247,632 |
| 62,000 | 1 | General Motors Co. | 1,222,020 |
| 6,600 | 1 | TRW Automotive Holdings Corp. | 259,380 |
| | TOTAL | 1,729,032 |
| | Auto Original Equipment Manufacturers—0.2% | |
| 6,700 | | Johnson Controls, Inc. | 165,155 |
| 2,200 | 1 | Tenneco Automotive, Inc. | 64,438 |
| | TOTAL | 229,593 |
| | Auto Part Replacement—0.6% | |
| 8,600 | | Genuine Parts Co. | 550,658 |
| | Auto Rentals—0.1% | |
| 1,400 | 1 | Dollar Thrifty Automotive Group | 104,160 |
| | Broadcasting—2.7% | |
| 52,889 | 1 | DIRECTV Group, Inc., Class A | 2,626,468 |
| | Building Materials—0.2% | |
| 7,100 | 1 | Fortune Brands Home & Security, Inc. | 157,052 |
| 1,800 | | Lennox International, Inc. | 78,606 |
| | TOTAL | 235,658 |
Annual Shareholder Report
| Shares | | | Value |
| | COMMON STOCKS—continued | |
| | Building Supply Stores—1.3% | |
| 49,400 | | Lowe's Cos., Inc. | $1,253,278 |
| | Cable & Wireless Television—1.7% | |
| 19,200 | | Time Warner Cable, Inc. | 1,630,656 |
| | Cable TV—0.3% | |
| 3,700 | 1 | Charter Communications, Inc. | 284,604 |
| | Carpets—0.3% | |
| 3,900 | 1 | Mohawk Industries, Inc. | 259,077 |
| | Clothing Stores—0.9% | |
| 1,700 | 1 | Children's Place Retail Stores, Inc. | 86,360 |
| 22,200 | | Gap (The), Inc. | 654,678 |
| 3,000 | 1 | Hanesbrands, Inc. | 90,060 |
| | TOTAL | 831,098 |
| | Commodity Chemicals—0.4% | |
| 3,000 | | PPG Industries, Inc. | 328,380 |
| 3,000 | | RPM International, Inc. | 79,500 |
| | TOTAL | 407,880 |
| | Computer Peripherals—0.1% | |
| 3,700 | | Lexmark International Group, Class A | 64,713 |
| | Computer Services—0.6% | |
| 1,300 | 1 | CACI International, Inc., Class A | 73,385 |
| 11,134 | 1 | Synnex Corp. | 376,663 |
| 1,500 | | Syntel, Inc. | 87,195 |
| | TOTAL | 537,243 |
| | Computer Stores—1.6% | |
| 6,500 | | GameStop Corp. | 104,130 |
| 46,849 | 1 | Ingram Micro, Inc., Class A | 702,267 |
| 2,100 | 1 | Insight Enterprises, Inc. | 35,196 |
| 13,862 | 1 | Tech Data Corp. | 694,486 |
| | TOTAL | 1,536,079 |
| | Computers - Low End—0.6% | |
| 46,400 | | Dell, Inc. | 551,232 |
| | Computers - Midrange—1.8% | |
| 96,300 | | Hewlett-Packard Co. | 1,756,512 |
| | Construction Machinery—0.4% | |
| 12,700 | | Trinity Industries, Inc. | 355,600 |
| | Cosmetics & Toiletries—1.6% | |
| 5,700 | | Avon Products, Inc. | 88,293 |
| 14,400 | | Estee Lauder Cos., Inc., Class A | 754,272 |
Annual Shareholder Report
| Shares | | | Value |
| | COMMON STOCKS—continued | |
| | Cosmetics & Toiletries—continued | |
| 7,900 | 1 | Ulta Salon Cosmetics & Fragrance, Inc. | $670,552 |
| | TOTAL | 1,513,117 |
| | Crude Oil & Gas Production—0.1% | |
| 2,100 | 1 | PDC Energy, Inc. | 55,020 |
| | Defense Aerospace—0.2% | |
| 1,800 | 1 | Transdigm Group, Inc. | 222,048 |
| | Department Stores—3.8% | |
| 1,500 | | Dillards, Inc., Class A | 97,845 |
| 14,900 | | Kohl's Corp. | 740,828 |
| 16,600 | | Macy's, Inc. | 594,944 |
| 8,400 | | Penney (J.C.) Co., Inc. | 189,084 |
| 200 | 1 | Sears Holdings Corp. | 9,898 |
| 32,400 | | Target Corp. | 1,965,060 |
| | TOTAL | 3,597,659 |
| | Discount Department Stores—4.6% | |
| 16,000 | 1 | Dollar Tree, Inc. | 805,440 |
| 4,200 | | Family Dollar Stores, Inc. | 277,536 |
| 45,200 | | Wal-Mart Stores, Inc. | 3,364,236 |
| | TOTAL | 4,447,212 |
| | Diversified Leisure—2.2% | |
| 4,500 | 1 | Bally Technologies, Inc. | 196,695 |
| 52,800 | | Carnival Corp. | 1,757,184 |
| 200 | 1 | Coinstar, Inc. | 9,498 |
| 5,800 | | Royal Caribbean Cruises Ltd. | 144,884 |
| | TOTAL | 2,108,261 |
| | Diversified Oil—1.0% | |
| 18,600 | | Murphy Oil Corp. | 998,076 |
| | Drug Store—1.5% | |
| 39,600 | | Walgreen Co. | 1,439,856 |
| | Education & Training Services—0.4% | |
| 11,000 | 1 | Apollo Group, Inc., Class A | 299,200 |
| 2,100 | | DeVRY, Inc. | 41,223 |
| 1,500 | 1 | ITT Educational Services, Inc. | 58,230 |
| | TOTAL | 398,653 |
| | Electrical Equipment—0.1% | |
| 1,400 | 1 | WESCO International, Inc. | 77,994 |
| | Electronic Instruments—0.3% | |
| 6,700 | 1 | Trimble Navigation Ltd. | 296,542 |
Annual Shareholder Report
| Shares | | | Value |
| | COMMON STOCKS—continued | |
| | Electronic Test/Measuring Equipment—0.1% | |
| 1,800 | 1 | Itron, Inc. | $70,146 |
| | Ethical Drugs—3.1% | |
| 60,200 | | Eli Lilly & Co. | 2,650,606 |
| 10,200 | 1 | Forest Laboratories, Inc., Class A | 342,210 |
| | TOTAL | 2,992,816 |
| | Financial Services—3.2% | |
| 10,300 | | Ameriprise Financial, Inc. | 532,716 |
| 7,600 | | SLM Corp. | 121,524 |
| 18,500 | | Visa, Inc., Class A | 2,387,795 |
| | TOTAL | 3,042,035 |
| | Food Wholesaling—0.9% | |
| 29,700 | | Sysco Corp. | 872,883 |
| | Gas Distributor—0.1% | |
| 1,400 | | Southwest Gas Corp. | 62,524 |
| | Grocery Chain—0.9% | |
| 1,500 | 1 | Fresh Market, Inc. | 88,335 |
| 25,700 | | Kroger Co. | 569,769 |
| 13,700 | | Safeway, Inc. | 213,035 |
| | TOTAL | 871,139 |
| | Health Care Equipment & Supplies—0.1% | |
| 2,200 | | Hill-Rom Holdings, Inc. | 57,530 |
| | Home Building—0.1% | |
| 5,400 | | D. R. Horton, Inc. | 95,202 |
| | Home Products—0.8% | |
| 4,100 | | Energizer Holdings, Inc. | 318,857 |
| 3,100 | | Jarden Corp. | 140,120 |
| 5,200 | | Newell Rubbermaid, Inc. | 91,780 |
| 3,400 | | Tupperware Brands Corp. | 178,228 |
| | TOTAL | 728,985 |
| | Hospitals—0.1% | |
| 2,700 | 1 | Community Health Systems, Inc. | 66,447 |
| | Hotels—2.1% | |
| 26,300 | | Marriott International, Inc., Class A | 957,846 |
| 20,400 | | Wyndham Worldwide Corp. | 1,061,820 |
| | TOTAL | 2,019,666 |
| | Household Appliances—0.6% | |
| 1,800 | 1 | Middleby Corp. | 176,256 |
Annual Shareholder Report
| Shares | | | Value |
| | COMMON STOCKS—continued | |
| | Household Appliances—continued | |
| 6,100 | | Whirlpool Corp. | $412,116 |
| | TOTAL | 588,372 |
| | Household Durables—0.7% | |
| 10,500 | | Stanley Black & Decker, Inc. | 702,345 |
| | Insurance Brokerage—0.4% | |
| 4,900 | | Aspen Insurance Holdings Ltd. | 140,826 |
| 500 | 1 | Markel Corp. | 216,030 |
| | TOTAL | 356,856 |
| | Integrated Domestic Oil—4.6% | |
| 62,000 | | ConocoPhillips | 3,375,280 |
| 3,500 | | Hess Corp. | 165,060 |
| 33,300 | | Marathon Oil Corp. | 881,451 |
| | TOTAL | 4,421,791 |
| | Integrated International Oil—0.9% | |
| 7,500 | | Chevron Corp. | 821,850 |
| | Life Insurance—1.6% | |
| 18,200 | | Protective Life Corp. | 507,962 |
| 20,100 | | Prudential Financial, Inc. | 970,428 |
| 5,400 | | Symetra Financial Corp. | 62,802 |
| | TOTAL | 1,541,192 |
| | Lumber Products—0.2% | |
| 18,300 | 1 | Louisiana-Pacific Corp. | 188,856 |
| | Mail Order—0.1% | |
| 2,200 | | HSN, Inc. | 93,192 |
| | Maritime—0.1% | |
| 7,000 | | Ship Finance International Ltd. | 101,360 |
| | Meat Packing—0.5% | |
| 28,300 | 1 | Smithfield Foods, Inc. | 523,550 |
| | Medical Supplies—0.2% | |
| 3,900 | 1 | Align Technology, Inc. | 132,444 |
| 1,400 | 1 | CareFusion Corp. | 34,174 |
| | TOTAL | 166,618 |
| | Medical Technology—0.1% | |
| 2,600 | | St. Jude Medical, Inc. | 97,136 |
| | Metal Fabrication—0.2% | |
| 2,800 | | Reliance Steel & Aluminum Co. | 144,144 |
| 1,900 | | Timken Co. | 68,780 |
| | TOTAL | 212,924 |
Annual Shareholder Report
| Shares | | | Value |
| | COMMON STOCKS—continued | |
| | Miscellaneous Communications—0.1% | |
| 800 | 1 | Equinix, Inc. | $142,544 |
| | Miscellaneous Components—0.5% | |
| 14,297 | 1 | Fairchild Semiconductor International, Inc., Class A | 198,157 |
| 27,428 | 1 | Vishay Intertechnology, Inc. | 270,714 |
| | TOTAL | 468,871 |
| | Miscellaneous Food Products—0.2% | |
| 6,000 | | Fresh Del Monte Produce, Inc. | 147,000 |
| | Miscellaneous Machinery—0.4% | |
| 7,600 | | Nordson Corp. | 389,576 |
| | Money Center Bank—4.4% | |
| 98,100 | | JPMorgan Chase & Co. | 3,531,600 |
| 1,600 | | Northern Trust Corp. | 72,640 |
| 16,200 | | State Street Corp. | 654,156 |
| | TOTAL | 4,258,396 |
| | Mortgage and Title—0.0% | |
| 2,500 | | Fidelity National Financial, Inc., Class A | 46,550 |
| | Multi-Industry Capital Goods—0.5% | |
| 17,500 | | Textron, Inc. | 455,875 |
| | Multi-Line Insurance—4.1% | |
| 50,600 | | Allstate Corp. | 1,735,580 |
| 54,900 | 1 | American International Group, Inc. | 1,716,723 |
| 6,200 | | CNA Financial Corp. | 161,882 |
| 10,200 | | Montpelier Re Holdings Ltd. | 206,652 |
| 200 | | White Mountains Insurance Group, Inc. | 102,118 |
| | TOTAL | 3,922,955 |
| | Newspaper Publishing—0.1% | |
| 200 | | Washington Post Co., Class B | 67,700 |
| | Office Equipment—0.1% | |
| 5,600 | | Pitney Bowes, Inc. | 74,816 |
| | Office Supplies—0.1% | |
| 4,500 | | Avery Dennison Corp. | 138,555 |
| | Oil Refiner—1.3% | |
| 9,400 | | Marathon Petroleum Corp. | 444,620 |
| 9,000 | 1 | Tesoro Petroleum Corp. | 248,850 |
| 18,500 | | Valero Energy Corp. | 508,750 |
| | TOTAL | 1,202,220 |
| | Oil Service, Explore & Drill—0.1% | |
| 4,400 | 1 | Helix Energy Solutions Group, Inc. | 78,672 |
Annual Shareholder Report
| Shares | | | Value |
| | COMMON STOCKS—continued | |
| | Other Communications Equipment—0.1% | |
| 3,100 | | Harris Corp. | $129,115 |
| | Paint & Related Materials—0.1% | |
| 600 | | Sherwin-Williams Co. | 80,610 |
| | Paper Products—0.0% | |
| 5,700 | 1 | Boise, Inc. | 42,180 |
| | Personal & Household—0.1% | |
| 1,100 | | Nu Skin Enterprises, Inc., Class A | 56,111 |
| | Personal Loans—3.5% | |
| 59,700 | | Capital One Financial Corp. | 3,372,453 |
| | Personnel Agency—0.3% | |
| 4,500 | | Manpower, Inc. | 160,110 |
| 3,400 | | Robert Half International, Inc. | 91,834 |
| | TOTAL | 251,944 |
| | Printed Circuit Boards—0.1% | |
| 3,500 | 1 | Benchmark Electronics, Inc. | 55,160 |
| 4,200 | 1 | Sanmina-SCI Corp. | 35,868 |
| | TOTAL | 91,028 |
| | Printing—0.1% | |
| 4,800 | | Donnelley (R.R.) & Sons Co. | 58,176 |
| | Property Liability Insurance—4.2% | |
| 2,700 | | Everest Re Group Ltd. | 274,590 |
| 7,100 | | ProAssurance Corp. | 635,947 |
| 49,100 | | The Travelers Cos., Inc. | 3,076,115 |
| | TOTAL | 3,986,652 |
| | Regional Banks—5.5% | |
| 16,400 | | BB&T Corp. | 514,468 |
| 1,700 | | City National Corp. | 83,776 |
| 7,300 | | Comerica, Inc. | 220,533 |
| 1,100 | | Commerce Bancshares, Inc. | 43,318 |
| 13,600 | | Fifth Third Bancorp | 187,952 |
| 17,200 | | Huntington Bancshares, Inc. | 106,898 |
| 8,400 | | KeyCorp | 67,032 |
| 17,600 | | SunTrust Banks, Inc. | 416,240 |
| 105,900 | | Wells Fargo & Co. | 3,580,479 |
| 3,700 | | Zions Bancorp | 67,340 |
| | TOTAL | 5,288,036 |
| | Rental & Leasing Services—0.1% | |
| 3,200 | | Rent-A-Center, Inc. | 113,792 |
Annual Shareholder Report
| Shares | | | Value |
| | COMMON STOCKS—continued | |
| | Restaurants—0.3% | |
| 1,800 | 1 | Panera Bread Co. | $283,482 |
| | Semiconductor Distribution—1.4% | |
| 25,913 | 1 | Arrow Electronics, Inc. | 874,564 |
| 14,515 | 1 | Avnet, Inc. | 457,222 |
| | TOTAL | 1,331,786 |
| | Semiconductor Manufacturing—0.1% | |
| 6,500 | 1 | Omnivision Technologies, Inc. | 91,130 |
| | Services to Medical Professionals—4.3% | |
| 13,800 | | Aetna, Inc. | 497,628 |
| 3,600 | | Coventry Health Care, Inc. | 119,988 |
| 2,900 | 1 | Henry Schein, Inc. | 216,949 |
| 1,500 | | Humana, Inc. | 92,400 |
| 2,300 | | Omnicare, Inc. | 72,243 |
| 41,400 | | UnitedHealth Group, Inc. | 2,115,126 |
| 19,273 | | Wellpoint, Inc. | 1,027,058 |
| | TOTAL | 4,141,392 |
| | Soft Drinks—1.1% | |
| 14,400 | | Coca-Cola Enterprises, Inc. | 422,208 |
| 13,800 | | Dr. Pepper Snapple Group, Inc. | 629,004 |
| | TOTAL | 1,051,212 |
| | Software Packaged/Custom—0.8% | |
| 6,000 | | CA, Inc. | 144,420 |
| 7,300 | | Computer Sciences Corp. | 179,726 |
| 6,800 | 1 | Electronic Arts, Inc. | 74,936 |
| 22,200 | 1 | Symantec Corp. | 349,650 |
| | TOTAL | 748,732 |
| | Specialty Chemicals—1.2% | |
| 5,300 | | Airgas, Inc. | 420,396 |
| 11,900 | | Cabot Corp. | 464,100 |
| 5,900 | | Rockwood Holdings, Inc. | 260,898 |
| | TOTAL | 1,145,394 |
| | Specialty Retailing—6.5% | |
| 8,000 | | Abercrombie & Fitch Co., Class A | 270,400 |
| 5,100 | | Advance Auto Parts, Inc. | 357,765 |
| 3,600 | 1 | Ascena Retail Group, Inc. | 66,024 |
| 6,300 | 1 | AutoNation, Inc. | 248,409 |
| 2,900 | 1 | Big Lots, Inc. | 117,479 |
| 47,587 | | CVS Caremark Corp. | 2,153,312 |
Annual Shareholder Report
| Shares | | | Value |
| | COMMON STOCKS—continued | |
| | Specialty Retailing—continued | |
| 1,600 | 1 | Cabela's, Inc., Class A | $73,504 |
| 8,600 | | Expedia, Inc. | 490,114 |
| 5,400 | | Foot Locker, Inc. | 178,308 |
| 12,700 | | GNC Acquisition Holdings, Inc. | 489,331 |
| 3,600 | 1 | Mattress Firm Holding Corp. | 104,976 |
| 10,800 | | Nordstrom, Inc. | 584,712 |
| 3,900 | | Signet Jewelers Ltd. | 171,288 |
| 16,300 | | Staples, Inc. | 207,662 |
| 2,900 | | Tractor Supply Co. | 263,523 |
| 3,600 | 1 | Vitamin Shoppe Industries, Inc. | 197,712 |
| 6,100 | | Williams-Sonoma, Inc. | 211,975 |
| | TOTAL | 6,186,494 |
| | Telecommunication Equipment & Services—0.2% | |
| 1,200 | 1 | Anixter International, Inc. | 68,292 |
| 4,000 | 1 | TW Telecom, Inc. | 100,520 |
| | TOTAL | 168,812 |
| | Tools and Hardware—0.2% | |
| 2,700 | | Snap-On, Inc. | 183,006 |
| | Toys & Games—0.4% | |
| 9,500 | | Hasbro, Inc. | 340,290 |
| | Truck Manufacturing—0.1% | |
| 3,500 | 1 | Navistar International Corp. | 86,100 |
| | Uniforms—0.3% | |
| 6,500 | | Cintas Corp. | 257,595 |
| | TOTAL COMMON STOCKS
(IDENTIFIED COST $89,504,226) | 94,150,758 |
| | MUTUAL FUND—1.4% | |
| 1,319,746 | 2,3 | Federated Prime Value Obligations Fund, Institutional Shares, 0.22%
(AT NET ASSET VALUE) | 1,319,746 |
| | TOTAL INVESTMENTS—99.8%
(IDENTIFIED COST $90,823,972)4 | 95,470,504 |
| | OTHER ASSETS AND LIABILITIES - NET—0.2%5 | 154,296 |
| | TOTAL NET ASSETS—100% | $95,624,800 |
| 1 | Non-income producing security. |
| 2 | Affiliated holding. |
| 3 | 7-Day net yield. |
| 4 | The cost of investments for federal tax purposes amounts to $91,167,688. |
| 5 | Assets, other than investments in securities, less liabilities. See Statement of Assets and Liabilities. |
Annual Shareholder Report
Note: The categories of investments are shown as a percentage of total net assets at July 31, 2012.
Various inputs are used in determining the value of the Fund's investments. These inputs are summarized in the three broad levels listed below:
Level 1—quoted prices in active markets for identical securities, including investment companies with daily net asset values, if applicable.
Level 2—other significant observable inputs (including quoted prices for similar securities, interest rates, prepayment speeds, credit risk, etc.). Also includes securities valued at amortized cost.
Level 3—significant unobservable inputs (including the Fund's own assumptions in determining the fair value of investments).
The inputs or methodology used for valuing securities are not an indication of the risk associated with investing in those securities.
As of July 31, 2012, all investments of the Fund utilized Level 1 inputs in valuing the Fund's assets carried at fair value.
See Notes which are an integral part of the Financial Statements
Annual Shareholder Report
Financial Highlights–Class A Shares
(For a Share Outstanding Throughout Each Period)
| Year Ended July 31 | 2012 | 2011 | 2010 | 2009 | 2008 |
| Net Asset Value, Beginning of Period | $12.48 | $10.54 | $9.91 | $14.05 | $16.74 |
| Income From Investment Operations: | | | | | |
| Net investment income | 0.061 | 0.031 | 0.051 | 0.061 | 0.06 |
| Net realized and unrealized gain (loss) on investments | 0.19 | 1.96 | 0.67 | (4.15) | (1.56) |
| TOTAL FROM INVESTMENT OPERATIONS | 0.25 | 1.99 | 0.72 | (4.09) | (1.50) |
| Less Distributions: | | | | | |
| Distributions from net investment income | — | (0.05) | (0.09) | (0.05) | — |
| Distributions from net realized gain on investments | — | — | — | — | (1.19) |
| TOTAL DISTRIBUTIONS | — | (0.05) | (0.09) | (0.05) | (1.19) |
| Net Asset Value, End of Period | $12.73 | $12.48 | $10.54 | $9.91 | $14.05 |
| Total Return2 | 2.00% | 18.87% | 7.18% | (29.07)% | (9.98)% |
| Ratios to Average Net Assets: | | | | | |
| Net expenses | 1.35% | 1.34% | 1.29% | 1.34% | 1.29% |
| Net investment income | 0.48% | 0.21% | 0.44% | 0.64% | 0.43% |
| Expense waiver/reimbursement3 | 0.40% | 0.31% | 0.25% | 0.14% | 0.00%4 |
| Supplemental Data: | | | | | |
| Net assets, end of period (000 omitted) | $29,365 | $40,227 | $54,437 | $81,898 | $194,867 |
| Portfolio turnover | 164% | 154% | 135% | 290% | 199% |
| 1 | Per share numbers have been calculated using the average shares method. |
| 2 | Based on net asset value, which does not reflect the sales charge, redemption fee or contingent deferred sales charge, if applicable. |
| 3 | This expense decrease is reflected in both the net expense and the net investment income ratios shown above. |
| 4 | Represents less than 0.01%. |
See Notes which are an integral part of the Financial Statements
Annual Shareholder Report
Financial Highlights–Class C Shares
(For a Share Outstanding Throughout Each Period)
| Year Ended July 31 | 2012 | 2011 | 2010 | 2009 | 2008 |
| Net Asset Value, Beginning of Period | $12.12 | $10.27 | $9.66 | $13.73 | $16.51 |
| Income From Investment Operations: | | | | | |
| Net investment income (loss) | (0.04)1 | (0.07)1 | (0.04)1 | (0.02)1 | (0.04) |
| Net realized and unrealized gain (loss) on investments | 0.18 | 1.92 | 0.65 | (4.05) | (1.55) |
| TOTAL FROM INVESTMENT OPERATIONS | 0.14 | 1.85 | 0.61 | (4.07) | (1.59) |
| Less Distributions: | | | | | |
| Distributions from net investment income | — | — | (0.00)2 | — | — |
| Distributions from net realized gain on investments | — | — | — | — | (1.19) |
| TOTAL DISTRIBUTIONS | — | — | (0.00)2 | — | (1.19) |
| Net Asset Value, End of Period | $12.26 | $12.12 | $10.27 | $9.66 | $13.73 |
| Total Return3 | 1.16% | 18.01% | 6.33% | (29.64)% | (10.69)% |
| Ratios to Average Net Assets: | | | | | |
| Net expenses | 2.15% | 2.13% | 2.08% | 2.14% | 2.08% |
| Net investment income (loss) | (0.32)% | (0.59)% | (0.36)% | (0.17)% | (0.36)% |
| Expense waiver/reimbursement4 | 0.36% | 0.29% | 0.24% | 0.17% | 0.00%5 |
| Supplemental Data: | | | | | |
| Net assets, end of period (000 omitted) | $24,440 | $31,129 | $39,524 | $52,546 | $96,601 |
| Portfolio turnover | 164% | 154% | 135% | 290% | 199% |
| 1 | Per share numbers have been calculated using the average shares method. |
| 2 | Represents less than $0.01. |
| 3 | Based on net asset value, which does not reflect the sales charge, redemption fee or contingent deferred sales charge, if applicable. |
| 4 | This expense decrease is reflected in both the net expense and the net investment income (loss) ratios shown above. |
| 5 | Represents less than 0.01%. |
See Notes which are an integral part of the Financial Statements
Annual Shareholder Report
Financial Highlights–Class R Shares
(For a Share Outstanding Throughout Each Period)
| Year Ended July 31 | 2012 | 2011 | 2010 | 2009 | 2008 |
| Net Asset Value, Beginning of Period | $12.44 | $10.52 | $9.91 | $14.10 | $16.86 |
| Income From Investment Operations: | | | | | |
| Net investment income (loss) | (0.00)1,2 | (0.04)1 | (0.01)1 | 0.011 | (0.00)2 |
| Net realized and unrealized gain (loss) on investments | 0.18 | 1.97 | 0.68 | (4.16) | (1.57) |
| TOTAL FROM INVESTMENT OPERATIONS | 0.18 | 1.93 | 0.67 | (4.15) | (1.57) |
| Less Distributions: | | | | | |
| Distributions from net investment income | — | (0.01) | (0.06) | (0.04) | — |
| Distributions from net realized gain on investments | — | — | — | — | (1.19) |
| TOTAL DISTRIBUTIONS | — | (0.01) | (0.06) | (0.04) | (1.19) |
| Net Asset Value, End of Period | $12.62 | $12.44 | $10.52 | $9.91 | $14.10 |
| Total Return3 | 1.45% | 18.33% | 6.71% | (29.42)% | (10.34)% |
| Ratios to Average Net Assets: | | | | | |
| Net expenses | 1.85% | 1.83% | 1.75% | 1.80% | 1.75% |
| Net investment income (loss) | (0.02)% | (0.31)% | (0.09)% | 0.15% | (0.00)%4 |
| Expense waiver/reimbursement5 | 0.25% | 0.19% | 0.18% | 0.11% | 0.00%4 |
| Supplemental Data: | | | | | |
| Net assets, end of period (000 omitted) | $2,718 | $2,973 | $2,300 | $1,937 | $1,393 |
| Portfolio turnover | 164% | 154% | 135% | 290% | 199% |
| 1 | Per share numbers have been calculated using the average shares method. |
| 2 | Represents less than $0.01. |
| 3 | Based on net asset value. |
| 4 | Represents less than 0.01%. |
| 5 | This expense decrease is reflected in both the net expense and the net investment income (loss) ratios shown above. |
See Notes which are an integral part of the Financial Statements
Annual Shareholder Report
Financial Highlights–Institutional Shares
(For a Share Outstanding Throughout Each Period)
| Year Ended July 31 | 2012 | 2011 | 2010 | 2009 | 2008 |
| Net Asset Value, Beginning of Period | $12.61 | $10.66 | $10.02 | $14.22 | $16.88 |
| Income From Investment Operations: | | | | | |
| Net investment income | 0.091 | 0.051 | 0.081 | 0.091 | 0.10 |
| Net realized and unrealized gain (loss) on investments | 0.19 | 1.99 | 0.68 | (4.20) | (1.57) |
| TOTAL FROM INVESTMENT OPERATIONS | 0.28 | 2.04 | 0.76 | (4.11) | (1.47) |
| Less Distributions: | | | | | |
| Distributions from net investment income | (0.02) | (0.09) | (0.12) | (0.09) | — |
| Distributions from net realized gain on investments | — | — | — | — | (1.19) |
| TOTAL DISTRIBUTIONS | (0.02) | (0.09) | (0.12) | (0.09) | (1.19) |
| Net Asset Value, End of Period | $12.87 | $12.61 | $10.66 | $10.02 | $14.22 |
| Total Return2 | 2.23% | 19.14% | 7.54% | (28.84)% | (9.71)% |
| Ratios to Average Net Assets: | | | | | |
| Net expenses | 1.10% | 1.08% | 1.01% | 1.06% | 1.01% |
| Net investment income | 0.73% | 0.45% | 0.69% | 0.90% | 0.72% |
| Expense waiver/reimbursement3 | 0.27% | 0.19% | 0.20% | 0.12% | 0.00%4 |
| Supplemental Data: | | | | | |
| Net assets, end of period (000 omitted) | $39,101 | $43,197 | $41,958 | $50,031 | $86,681 |
| Portfolio turnover | 164% | 154% | 135% | 290% | 199% |
| 1 | Per share numbers have been calculated using the average shares method. |
| 2 | Based on net asset value. |
| 3 | This expense decrease is reflected in both the net expense and the net investment income ratios shown above. |
| 4 | Represents less than 0.01%. |
See Notes which are an integral part of the Financial Statements
Annual Shareholder Report
Statement of Assets and Liabilities
July 31, 2012
| Assets: | | |
| Total investment in securities, at value including $1,319,746 of investment in an affiliated holding (Note 5) (identified cost $90,823,972) | | $95,470,504 |
| Income receivable | | 74,870 |
| Receivable for investments sold | | 1,017,697 |
| Receivable for shares sold | | 29,088 |
| TOTAL ASSETS | | 96,592,159 |
| Liabilities: | | |
| Payable for investments purchased | $557,102 | |
| Payable for shares redeemed | 279,363 | |
| Payable for transfer and dividend disbursing agent fees and expenses | 44,121 | |
| Payable for Directors'/Trustees' fees | 407 | |
| Payable for auditing fees | 23,400 | |
| Payable for distribution services fee (Note 5) | 16,817 | |
| Payable for shareholder services fee (Note 5) | 11,582 | |
| Accrued expenses | 34,567 | |
| TOTAL LIABILITIES | | 967,359 |
| Net assets for 7,554,409 shares outstanding | | $95,624,800 |
| Net Assets Consist of: | | |
| Paid-in capital | | $218,466,398 |
| Net unrealized appreciation of investments | | 4,646,532 |
| Accumulated net realized loss on investments | | (127,855,828) |
| Undistributed net investment income | | 367,698 |
| TOTAL NET ASSETS | | $95,624,800 |
Annual Shareholder Report
Statement of Assets and Liabilities–continued
| Net Asset Value, Offering Price and Redemption Proceeds Per Share | | |
| Class A Shares: | | |
| Net asset value per share ($29,365,462 ÷ 2,307,256 shares outstanding), no par value, unlimited shares authorized | | $12.73 |
| Offering price per share (100/94.50 of $12.73) | | $13.47 |
| Redemption proceeds per share | | $12.73 |
| Class C Shares: | | |
| Net asset value per share ($24,440,419 ÷ 1,994,176 shares outstanding), no par value, unlimited shares authorized | | $12.26 |
| Offering price per share | | $12.26 |
| Redemption proceeds per share (99.00/100 of $12.26) | | $12.14 |
| Class R Shares: | | |
| Net asset value per share ($2,717,730 ÷ 215,405 shares outstanding), no par value, unlimited shares authorized | | $12.62 |
| Offering price per share | | $12.62 |
| Redemption proceeds per share | | $12.62 |
| Institutional Shares: | | |
| Net asset value per share ($39,101,189 ÷ 3,037,572 shares outstanding), no par value, unlimited shares authorized | | $12.87 |
| Offering price per share | | $12.87 |
| Redemption proceeds per share | | $12.87 |
See Notes which are an integral part of the Financial Statements
Annual Shareholder Report
Statement of Operations
Year Ended July 31, 2012
| Investment Income: | | | |
Dividends (including $3,364 received from an affiliated
holding (Note 5)) | | | $1,875,813 |
| Expenses: | | | |
| Investment adviser fee (Note 5) | | $765,989 | |
| Administrative fee (Note 5) | | 270,000 | |
| Custodian fees | | 22,124 | |
Transfer and dividend disbursing agent fees and
expenses (Note 2) | | 214,935 | |
| Directors'/Trustees' fees | | 2,733 | |
| Auditing fees | | 23,376 | |
| Legal fees | | 7,939 | |
| Portfolio accounting fees | | 80,079 | |
| Distribution services fee (Note 5) | | 211,047 | |
| Shareholder services fee (Note 5) | | 147,805 | |
| Account administration fee (Note 2) | | 181 | |
| Share registration costs | | 49,735 | |
| Printing and postage | | 39,738 | |
| Insurance premiums | | 4,040 | |
| Miscellaneous | | 9,708 | |
| TOTAL EXPENSES | | 1,849,429 | |
| Waivers and Reimbursements: | | | |
| Waiver/reimbursement of investment adviser fee (Note 5) | $(198,934) | | |
| Waiver of administrative fee (Note 5) | (53,977) | | |
| Waiver of distribution services fee (Note 5) | (175) | | |
| Reimbursement of transfer and dividend disbursing agent fees and expenses (Note 2) and (Note 5) | (88,236) | | |
| TOTAL WAIVERS AND REIMBURSEMENTS | | (341,322) | |
| Net expenses | | | 1,508,107 |
| Net investment income | | | 367,706 |
| Realized and Unrealized Gain (Loss) on Investments: | | | |
| Net realized gain on investments | | | 2,904,136 |
| Net change in unrealized appreciation of investments | | | (2,143,917) |
| Net realized and unrealized gain on investments | | | 760,219 |
| Change in net assets resulting from operations | | | $1,127,925 |
See Notes which are an integral part of the Financial Statements
Annual Shareholder Report
Statement of Changes in Net Assets
| Year Ended July 31 | 2012 | 2011 |
| Increase (Decrease) in Net Assets | | |
| Operations: | | |
| Net investment income | $367,706 | $68,486 |
| Net realized gain on investments | 2,904,136 | 21,524,570 |
| Net change in unrealized appreciation/depreciation of investments | (2,143,917) | 824,024 |
| CHANGE IN NET ASSETS RESULTING FROM OPERATIONS | 1,127,925 | 22,417,080 |
| Distributions to Shareholders: | | |
| Distributions from net investment income | | |
| Class A Shares | — | (193,416) |
| Class R Shares | — | (1,842) |
| Institutional Shares | (67,721) | (276,596) |
| CHANGE IN NET ASSETS RESULTING FROM DISTRIBUTIONS TO SHAREHOLDERS | (67,721) | (471,854) |
| Share Transactions: | | |
| Proceeds from sale of shares | 7,857,700 | 22,465,156 |
| Net asset value of shares issued to shareholders in payment of distributions declared | 65,854 | 434,830 |
| Cost of shares redeemed | (30,884,509) | (65,538,863) |
| CHANGE IN NET ASSETS RESULTING FROM SHARE TRANSACTIONS | (22,960,955) | (42,638,877) |
| Change in net assets | (21,900,751) | (20,693,651) |
| Net Assets: | | |
| Beginning of period | 117,525,551 | 138,219,202 |
| End of period (including undistributed net investment income of $367,698 and $67,713, respectively) | $95,624,800 | $117,525,551 |
See Notes which are an integral part of the Financial Statements
Annual Shareholder Report
Notes to Financial Statements
July 31, 2012
1. ORGANIZATION
Federated MDT Series (the “Trust”) is registered under the Investment Company Act of 1940, as amended (the “Act”), as an open-end management investment company. The Trust consists of five portfolios. The financial statements included herein are only those of Federated MDT All Cap Core Fund (the “Fund”), a diversified portfolio. The financial statements of the other portfolios are presented separately. The assets of each portfolio are segregated and a shareholder's interest is limited to the portfolio in which shares are held. Each portfolio pays its own expenses. The Fund offers four classes of shares: Class A Shares, Class C Shares, Class R Shares and Institutional Shares. All shares of the Fund have equal rights with respect to voting, except on class-specific matters. The investment objective of the Fund is long-term capital appreciation.
2. SIGNIFICANT ACCOUNTING POLICIES
The following is a summary of significant accounting policies consistently followed by the Fund in the preparation of its financial statements. These policies are in conformity with U.S. generally accepted accounting principles (GAAP).
Investment Valuation
In calculating its net asset value (NAV), the Fund generally values investments as follows:
| ■ | Equity securities listed on an exchange or traded through a regulated market system are valued at their last reported sale price or official closing price in their principal exchange or market. |
| ■ | Shares of other mutual funds are valued based upon their reported NAVs. |
| ■ | Fixed-income securities acquired with remaining maturities greater than 60 days are fair valued using price evaluations provided by a pricing service approved by the Fund's Board of Trustees (the “Trustees”). |
| ■ | Fixed-income securities acquired with remaining maturities of 60 days or less are valued at their cost (adjusted for the accretion of any discount or amortization of any premium), which approximates market value. |
| ■ | Derivative contracts listed on exchanges are valued at their reported settlement or closing price. |
| ■ | Over-the-counter (OTC) derivative contracts are fair valued using price evaluations provided by a pricing service approved by the Trustees. |
| ■ | For securities that are fair valued in accordance with procedures established by and under the general supervision of the Trustees, certain factors may be considered such as: the purchase price of the security, information obtained by contacting the issuer, analysis of the issuer's financial statements or other available documents, fundamental analytical data, the nature and duration of restrictions on disposition, the movement of the market in which the security is normally traded and public trading in similar securities of the issuer or comparable issuers. |
Annual Shareholder Report
If the Fund cannot obtain a price or price evaluation from a pricing service for an investment, the Fund may attempt to value the investment based upon the mean of bid and asked quotations or fair value the investment based on price evaluations, from one or more dealers. If any price, quotation, price evaluation or other pricing source is not readily available when the NAV is calculated, the Fund uses the fair value of the investment determined in accordance with the procedures described below. There can be no assurance that the Fund could purchase or sell an investment at the price used to calculate the Fund's NAV.
Fair Valuation and Significant Events Procedures
The Trustees have appointed a Valuation Committee comprised of officers of the Fund, Federated MDTA LLC (“Adviser”) or an affiliated adviser, and others to determine fair value of securities and in overseeing the calculation of the NAV. The Trustees have also authorized the use of pricing services recommended by the Valuation Committee to provide fair value evaluations of the current value of certain investments for purposes of calculating the NAV. The Valuation Committee employs various methods for reviewing third-party pricing service evaluations including periodic reviews of third-party pricing services' policies, procedures and valuation methods (including key inputs and assumptions), transactional back-testing, comparisons of evaluations of different pricing services, and review of price challenges by the Adviser based on recent market activity. In the event that market quotations and price evaluations are not available for an investment, the Valuation Committee determines the fair value of the investment in accordance with procedures adopted by the Trustees. The Trustees periodically review and approve the fair valuations made by the Valuation Committee and any changes made to the procedures.
Factors considered by pricing services in evaluating an investment include the yields or prices of investments of comparable quality, coupon, maturity, call rights and other potential prepayments, terms and type, reported transactions, indications as to values from dealers and general market conditions. Some pricing services provide a single price evaluation reflecting the bid-side of the market for an investment (a “bid” evaluation). Other pricing services offer both bid evaluations and price evaluations indicative of a price between the prices bid and asked for the investment (a “mid” evaluation). The Fund normally uses bid evaluations for U.S. Treasury and Agency securities, mortgage-backed securities and municipal securities. The Fund normally uses mid evaluations for other types of fixed-income securities and OTC derivative contracts. In the event that market quotations and price evaluations are not available for an investment, the fair value of the investment is determined in accordance with procedures adopted by the Trustees.
The Trustees also have adopted procedures requiring an investment to be priced at its fair value whenever the Adviser determines that a significant event affecting the value of the investment has occurred between the time as of which the price of the investment would otherwise be determined and the time as of which the NAV is computed. An event is considered significant if there is both an affirmative expectation that the investment's value will change in response to the event and a reasonable basis for quantifying the resulting change in value. Examples of significant events that may occur after the close of the principal market on which a security is traded, or after the time of a price evaluation provided by a pricing service or a dealer, include:
| ■ | With respect to securities traded in foreign markets, significant trends in U.S. equity markets or in the trading of foreign securities index futures or options contracts; |
| ■ | With respect to price evaluations of fixed-income securities determined before the close of regular trading on the NYSE, actions by the Federal Reserve Open Market Committee and other significant trends in U.S. fixed-income markets; |
Annual Shareholder Report
| ■ | Political or other developments affecting the economy or markets in which an issuer conducts its operations or its securities are traded; and |
| ■ | Announcements concerning matters such as acquisitions, recapitalizations, litigation developments, a natural disaster affecting the issuer's operations or regulatory changes or market developments affecting the issuer's industry. |
The Trustees have approved the use of a pricing service to determine the fair value of equity securities traded principally in foreign markets when the Adviser determines that there has been a significant trend in the U.S. equity markets or in index futures trading. For other significant events, the Fund may seek to obtain more current quotations or price evaluations from alternative pricing sources. If a reliable alternative pricing source is not available, the Fund will determine the fair value of the investment using another method approved by the Trustees.
Repurchase Agreements
The Fund may invest in repurchase agreements for short-term liquidity purposes. It is the policy of the Fund to require the other party to a repurchase agreement to transfer to the Fund's custodian or sub-custodian eligible securities or cash with a market value (after transaction costs) at least equal to the repurchase price to be paid under the repurchase agreement. The eligible securities are transferred to accounts with the custodian or sub-custodian in which the Fund holds a “securities entitlement” and exercises “control” as those terms are defined in the Uniform Commercial Code. The Fund has established procedures for monitoring the market value of the transferred securities and requiring the transfer of additional eligible securities if necessary to equal at least the repurchase price. These procedures also allow the other party to require securities to be transferred from the account to the extent that their market value exceeds the repurchase price or in exchange for other eligible securities of equivalent market value.
The insolvency of the other party or other failure to repurchase the securities may delay the disposition of the underlying securities or cause the Fund to receive less than the full repurchase price. Under the terms of the repurchase agreement, any amounts received by the Fund in excess of the repurchase price and related transaction costs must be remitted to the other party.
The Fund may enter into repurchase agreements in which eligible securities are transferred into joint trading accounts maintained by the custodian or sub-custodian for investment companies and other clients advised by the Fund's Adviser and its affiliates. The Fund will participate on a pro rata basis with the other investment companies and clients in its share of the securities transferred under such repurchase agreements and in its share of proceeds from any repurchase or other disposition of such securities.
Investment Income, Gains and Losses, Expenses and Distributions
Investment transactions are accounted for on a trade-date basis. Realized gains and losses from investment transactions are recorded on an identified-cost basis. Interest income and expenses are accrued daily. Dividend income and distributions to shareholders are recorded on the ex-dividend date. Foreign dividends are recorded on the ex-dividend date or when the Fund is informed of the ex-dividend date. Distributions of net investment income are declared and paid annually. Non-cash dividends included in dividend income, if any, are recorded at fair value. Investment income, realized and unrealized gains and losses and certain fund-level expenses are allocated to each class based on relative average daily net assets, except that
Annual Shareholder Report
Class A Shares, Class C Shares, Class R Shares and Institutional Shares may bear distribution services fees, shareholder services fees, account administration fees and certain transfer and dividend disbursing agent fees unique to those classes. For the year ended July 31, 2012, transfer and dividend disbursing agent fees and account administration fees for the Fund were as follows:
| Transfer and
Dividend
Disbursing
Agent Fees
Incurred | Transfer and
Dividend
Disbursing
Agent Fees
Reimbursed | Account
Administration
Fees Incurred |
| Class A Shares | $86,120 | $(50,788) | $181 |
| Class C Shares | 70,435 | (29,915) | — |
| Class R Shares | 10,012 | — | — |
| Institutional Shares | 48,368 | (7,533) | — |
| TOTAL | $214,935 | $(88,236) | $181 |
Dividends are declared separately for each class. No class has preferential dividend rights; differences in per share dividend rates are generally due to differences in separate class expenses.
Premium and Discount Amortization
All premiums and discounts on fixed-income securities are amortized/accreted using the effective interest rate method.
Federal Taxes
It is the Fund's policy to comply with the Subchapter M provision of the Internal Revenue Code (the “Code”) and to distribute to shareholders each year substantially all of its income. Accordingly, no provision for federal income tax is necessary. As of and during the year ended July 31, 2012, the Fund did not have a liability for any uncertain tax positions. The Fund recognizes interest and penalties, if any, related to tax liabilities as income tax expense in the Statement of Operations. As of July 31, 2012, tax years 2009 through 2012 remain subject to examination by the Fund's major tax jurisdictions, which include the United States of America and the Commonwealth of Massachusetts.
The Fund may be subject to taxes imposed by governments of countries in which it invests. Such taxes are generally based on either income or gains earned or repatriated. The Fund accrues and applies such taxes to net investment income, net realized gains and net unrealized gains as income and/or gains are earned.
When-Issued and Delayed Delivery Transactions
The Fund may engage in when-issued or delayed delivery transactions. The Fund records when-issued securities on the trade date and maintains security positions such that sufficient liquid assets will be available to make payment for the securities purchased. Securities purchased on a when-issued or delayed delivery basis are marked to market daily and begin earning interest on the settlement date. Losses may occur on these transactions due to changes in market conditions or the failure of counterparties to perform under the contract.
Annual Shareholder Report
Other
The preparation of financial statements in conformity with GAAP requires management to make estimates and assumptions that affect the amounts of assets, liabilities, expenses and revenues reported in the financial statements. Actual results could differ from those estimated.
3. SHARES OF BENEFICIAL INTEREST
The following tables summarize share activity:
| Year Ended July 31 | 2012 | 2011 |
| Class A Shares: | Shares | Amount | Shares | Amount |
| Shares sold | 174,952 | $2,147,251 | 328,142 | $4,029,120 |
| Shares issued to shareholders in payment of distributions declared | — | — | 15,294 | 183,529 |
| Shares redeemed | (1,090,509) | (13,285,030) | (2,285,365) | (27,236,700) |
| NET CHANGE RESULTING FROM CLASS A SHARE TRANSACTIONS | (915,557) | $(11,137,779) | (1,941,929) | $(23,024,051) |
| Year Ended July 31 | 2012 | 2011 |
| Class C Shares: | Shares | Amount | Shares | Amount |
| Shares sold | 246,589 | $2,944,629 | 355,709 | $4,287,880 |
| Shares redeemed | (821,569) | (9,611,299) | (1,633,873) | (18,969,226) |
| NET CHANGE RESULTING FROM CLASS C SHARE TRANSACTIONS | (574,980) | $(6,666,670) | (1,278,164) | $(14,681,346) |
| Year Ended July 31 | 2012 | 2011 |
| Class R Shares: | Shares | Amount | Shares | Amount |
| Shares sold | 94,213 | $1,129,971 | 125,054 | $1,537,837 |
| Shares issued to shareholders in payment of distributions declared | — | — | 153 | 1,842 |
| Shares redeemed | (117,870) | (1,436,974) | (104,836) | (1,281,271) |
| NET CHANGE RESULTING FROM CLASS R SHARE TRANSACTIONS | (23,657) | $(307,003) | 20,371 | $258,408 |
| Year Ended July 31 | 2012 | 2011 |
| Institutional Shares: | Shares | Amount | Shares | Amount |
| Shares sold | 136,805 | $1,635,849 | 971,643 | $12,610,319 |
| Shares issued to shareholders in payment of distributions declared | 5,447 | 65,854 | 20,599 | 249,459 |
| Shares redeemed | (529,245) | (6,551,206) | (1,504,407) | (18,051,666) |
| NET CHANGE RESULTING FROM INSTITUTIONAL SHARE TRANSACTIONS | (386,993) | $(4,849,503) | (512,165) | $(5,191,888) |
| NET CHANGE RESULTING FROM TOTAL FUND SHARE TRANSACTIONS | (1,901,187) | $(22,960,955) | (3,711,887) | $(42,638,877) |
Annual Shareholder Report
4. FEDERAL TAX INFORMATION
The tax character of distributions as reported on the Statement of Changes in Net Assets for the years ended July 31, 2012 and 2011, was as follows:
| 2012 | 2011 |
| Ordinary income | $67,721 | $471,854 |
As of July 31, 2012, the components of distributable earnings on a tax basis were as follows:
| Undistributed ordinary income | $367,698 |
| Net unrealized appreciation | $4,302,816 |
| Capital loss carryforwards | $(127,512,112) |
The difference between book-basis and tax-basis net unrealized appreciation/depreciation is attributable to differing treatments for the deferral of losses on wash sales.
At July 31, 2012, the cost of investments for federal tax purposes was $91,167,688. The net unrealized appreciation of investments for federal tax purposes was $4,302,816. This consists of net unrealized appreciation from investments for those securities having an excess of value over cost of $9,283,190 and net unrealized depreciation from investments for those securities having an excess of cost over value of $4,980,374.
At July 31, 2012, the Fund had a capital loss carryforward of $127,512,112 which will reduce the Fund's taxable income arising from future net realized gains on investments, if any, to the extent permitted by the Code, thereby reducing the amount of distributions to shareholders which would otherwise be necessary to relieve the Fund of any liability for federal income tax. Pursuant to the Code, a net capital loss incurred in taxable years beginning on or before December 22, 2010, is characterized as short-term and may be carried forward for a maximum of eight tax years (“Carryforward Limit”), whereas a net capital loss incurred in taxable years beginning after December 22, 2010, retains its character as either short-term or long-term, does not expire and is required to be utilized prior to the losses which have a Carryforward Limit.
The following schedule summarizes the Fund's capital loss carryforwards and expiration years:
| Expiration Year | Short-Term | Long-Term | Total |
| 2016 | $13,181 | NA | $13,181 |
| 2017 | $57,908,050 | NA | $57,908,050 |
| 2018 | $69,590,881 | NA | $69,590,881 |
As a result of the tax-free transfer of assets from Federated MDT Tax Aware/All Cap Core Fund, the use of certain capital loss carryforwards listed above may be limited.
The Fund used capital loss carryforwards of $2,992,524 to offset taxable capital gains realized during the year ended July 31, 2012.
Annual Shareholder Report
5. INVESTMENT ADVISER FEE AND OTHER TRANSACTIONS WITH AFFILIATES
Investment Adviser Fee
The advisory agreement between the Fund and the Adviser provides for an annual fee equal to 0.75% of the Fund's average daily net assets. Subject to the terms described in the Expense Limitation note, the Adviser may voluntarily choose to waive any portion of its fee. For the year ended July 31, 2012, the Adviser waived $196,951 of its fee. In addition, an affiliate of the Adviser reimbursed $88,236 of transfer and dividend disbursing agent fees and expenses.
Administrative Fee
Federated Administrative Services (FAS), under the Administrative Services Agreement, provides the Fund with administrative personnel and services. The fee paid to FAS is based on the average aggregate daily net assets of certain Federated funds as specified below:
| Administrative Fee | Average Aggregate Daily Net Assets
of the Federated Funds |
| 0.150% | on the first $5 billion |
| 0.125% | on the next $5 billion |
| 0.100% | on the next $10 billion |
| 0.075% | on assets in excess of $20 billion |
The administrative fee received during any fiscal year shall be at least $150,000 per portfolio and $40,000 per each additional class of Shares. Subject to the terms described in the Expense Limitation note, FAS may voluntarily choose to waive any portion of its fee. For the year ended July 31, 2012, FAS waived $53,977 of its fee. The net fee paid to FAS was 0.212% of average daily net assets of the Fund. The Fund is currently being charged the minimum administrative fee; therefore the fee as a percentage of average daily net assets is greater than the amounts presented in the chart above.
Distribution Services Fee
The Fund has adopted a Distribution Plan (the “Plan”) pursuant to Rule 12b-1 under the Act. Under the terms of the Plan, the Fund will compensate Federated Securities Corp. (FSC), the principal distributor, from the daily net assets of the Fund's Class A Shares, Class C Shares and Class R Shares to finance activities intended to result in the sale of these shares. The Plan provides that the Fund may incur distribution expenses at the following percentages of average daily net assets annually, to compensate FSC:
| Share Class Name | Percentage of Average Daily
Net Assets of Class |
| Class A Shares | 0.05% |
| Class C Shares | 0.75% |
| Class R Shares | 0.50% |
Annual Shareholder Report
Subject to the terms described in the Expense Limitation note, FSC may voluntarily choose to waive any portion of its fee. For the year ended July 31, 2012, distribution services fees for the Fund were as follows:
| Distribution
Services Fees
Incurred | Distribution
Services Fees
Waived |
| Class C Shares | $197,062 | $— |
| Class R Shares | 13,985 | (175) |
| TOTAL | $211,047 | $(175) |
When FSC receives fees, it may pay some or all of them to financial intermediaries whose customers purchase shares. For the year ended July 31, 2012, FSC retained $9,699 of fees paid by the Fund. For the year ended July 31, 2012, the Fund's Class A Shares did not incur a distribution services fee; however, it may begin to incur this fee upon approval of the Trustees.
Sales Charges
Front-end sales charges and contingent deferred sales charges (CDSC) do not represent expenses of the Fund. They are deducted from the proceeds of sales of Fund shares prior to investment or from redemption proceeds prior to remittance, as applicable. For the year ended July 31, 2012, FSC retained $1,279 in sales charges from the sale of Class A Shares. FSC also retained $485 of CDSC relating to redemptions of Class C Shares.
Shareholder Services Fee
The Fund may pay fees (“Service Fees”) up to 0.25% of the average daily net assets of the Fund's Class A Shares and Class C Shares to financial intermediaries or to Federated Shareholder Services Company (FSSC) for providing services to shareholders and maintaining shareholder accounts. Subject to the terms described in the Expense Limitation note, FSSC may voluntarily reimburse the Fund for Service Fees. For the year ended July 31, 2012, Service Fees for the Fund were as follows:
| Service Fees
Incurred |
| Class A Shares | $82,118 |
| Class C Shares | 65,687 |
| TOTAL | $147,805 |
For the year ended July 31, 2012, FSSC did not receive any fees paid by the Fund.
Expense Limitation
The Adviser and its affiliates (which may include FSC, FAS and FSSC) have voluntarily agreed to waive their fees and/or reimburse expenses so that the total annual fund operating expenses (as shown in the financial highlights) paid by the Fund's Class A Shares, Class C Shares, Class R Shares and Institutional Shares (after the voluntary waivers and reimbursements) will not exceed 1.35%, 2.15%, 1.85% and 1.10% (the “Fee Limit”), respectively, up to but not including the later of (the “Termination Date”): (a) October 1, 2013; or (b) the date of the Fund's next effective Prospectus. While the Adviser and its affiliates currently do not anticipate terminating or increasing these arrangements prior to the Termination Date, these arrangements may only be terminated or the Fee Limit increased prior to the Termination Date with the agreement of the Trustees.
Annual Shareholder Report
General
Certain Officers and Trustees of the Trust are Officers and Directors or Trustees of the above companies.
Transactions Involving Affiliated Holdings
Affiliated holdings are mutual funds which are managed by the Adviser or an affiliate of the Adviser. The Adviser has agreed to reimburse the Fund for certain investment adviser fees as a result of transactions in other affiliated mutual funds. For the year ended July 31, 2012, the Adviser reimbursed $1,983. Transactions involving the affiliated holding during the year ended July 31, 2012, were as follows:
| Federated
Prime Value
Obligations Fund,
Institutional Shares |
| Balance of Shares Held 7/31/2011 | 2,027,952 |
| Purchases/Additions | 17,620,937 |
| Sales/Reductions | 18,329,143 |
| Balance of Shares Held 7/31/2012 | 1,319,746 |
| Value | $1,319,746 |
| Dividend Income | $3,364 |
6. Investment TRANSACTIONS
Purchases and sales of investments, excluding long-term U.S. government securities and short-term obligations, for the year ended July 31, 2012, were as follows:
| Purchases | $166,684,378 |
| Sales | $189,138,124 |
7. LINE OF CREDIT
The Fund participates in a $100,000,000 unsecured, uncommitted revolving line of credit (LOC) agreement with PNC Bank. The LOC was made available for extraordinary or emergency purposes, primarily for financing redemption payments. Borrowings are charged interest at a rate offered to the Fund by PNC Bank at the time of the borrowing. As of July 31, 2012, there were no outstanding loans. During the year ended July 31, 2012, the Fund did not utilize the LOC.
8. INTERFUND LENDING
Pursuant to an Exemptive Order issued by the Securities and Exchange Commission, the Fund, along with other funds advised by subsidiaries of Federated Investors, Inc., may participate in an interfund lending program. This program provides an alternative credit facility allowing the Fund to borrow from other participating affiliated funds. As of July 31, 2012, there were no outstanding loans. During the year ended July 31, 2012, the program was not utilized.
Annual Shareholder Report
9. Subsequent events
On August 15, 2012, the Trustees approved the elimination of minimum administrative personnel and services fees effective September 1, 2012. Prior to this date, the administrative fee received during any fiscal year was at least $150,000 per portfolio and $40,000 per each additional class of Shares.
Management has evaluated subsequent events through the date the financial statements were issued, and determined that no additional events have occurred that require disclosure.
10. FEDERAL TAX INFORMATION (UNAUDITED)
For the fiscal year ended July 31, 2012, 100.0% of total income distributions made by the Fund are qualifying dividends which may be subject to a maximum tax rate of 15%, as provided for by the Jobs and Growth Tax Relief Act of 2003. Complete information is reported in conjunction with the reporting of your distributions on Form 1099-DIV.
Of the ordinary income distributions made by the Fund during the year ended July 31, 2012, 100.0% qualify for the dividend received deduction available to corporate shareholders.
Annual Shareholder Report
Report of Independent Registered Public Accounting Firm
TO THE BOARD OF trustees OF Federated MDt series AND SHAREHOLDERS OF federated mdt all cap core fund:
We have audited the accompanying statement of assets and liabilities of Federated MDT All Cap Core Fund (the “Fund”) (one of the portfolios constituting Federated MDT Series), including the portfolio of investments, as of July 31, 2012, and the related statement of operations for the year then ended, the statement of changes in net assets for each of the two years in the period then ended, and the financial highlights for each of the five years in the period then ended. These financial statements and financial highlights are the responsibility of the Fund's management. Our responsibility is to express an opinion on these financial statements and financial highlights based on our audits.
We conducted our audits in accordance with standards of the Public Company Accounting Oversight Board (United States). Those standards require that we plan and perform the audit to obtain reasonable assurance about whether the financial statements and financial highlights are free of material misstatement. We were not engaged to perform an audit of the Fund's internal control over financial reporting. Our audits included consideration of internal control over financial reporting as a basis for designing audit procedures that are appropriate in the circumstances, but not for the purpose of expressing an opinion on the effectiveness of the Fund's internal control over financial reporting. Accordingly, we express no such opinion. An audit also includes examining, on a test basis, evidence supporting the amounts and disclosures in the financial statements and financial highlights, assessing the accounting principles used and significant estimates made by management, and evaluating the overall financial statement presentation. Our procedures included confirmation of securities owned as of July 31, 2012 by correspondence with the custodian and others, or by other appropriate auditing procedures where replies from others were not received. We believe that our audits provide a reasonable basis for our opinion.
In our opinion, the financial statements and financial highlights referred to above present fairly, in all material respects, the financial position of Federated MDT All Cap Core Fund, a portfolio of Federated MDT Series, at July 31, 2012, the results of its operations for the year then ended, the changes in its net assets for each of the two years in the period then ended, and the financial highlights for each of the five years in the period then ended, in conformity with U.S. generally accepted accounting principles.
Boston, Massachusetts
September 24, 2012
Annual Shareholder Report
Shareholder Expense Example (unaudited)
As a shareholder of the Fund, you incur two types of costs: (1) transaction costs, including sales charges (loads) on purchase or redemption payments; and (2) ongoing costs, including management fees and to the extent applicable, distribution (12b-1) fees and/or shareholder services fees and other Fund expenses. This Example is intended to help you to understand your ongoing costs (in dollars) of investing in the Fund and to compare these costs with the ongoing costs of investing in other mutual funds. It is based on an investment of $1,000 invested at the beginning of the period and held for the entire period from February 1, 2012 to July 31, 2012.
ACTUAL EXPENSES
The first section of the table below provides information about actual account values and actual expenses. You may use the information in this section, together with the amount you invested, to estimate the expenses that you incurred over the period. Simply divide your account value by $1,000 (for example, an $8,600 account value divided by $1,000 = 8.6), then multiply the result by the number in the first section under the heading entitled “Expenses Paid During Period” to estimate the expenses attributable to your investment during this period.
HYPOTHETICAL EXAMPLE FOR COMPARISON PURPOSES
The second section of the table below provides information about hypothetical account values and hypothetical expenses based on the Fund's actual expense ratio and an assumed rate of return of 5% per year before expenses, which is not the Fund's actual return. Thus, you should not use the hypothetical account values and expenses to estimate the actual ending account balance or your expenses for the period. Rather, these figures are required to be provided to enable you to compare the ongoing costs of investing in the Fund with other funds. To do so, compare this 5% hypothetical example with the 5% hypothetical examples that appear in the shareholder reports of the other funds.
Annual Shareholder Report
Please note that the expenses shown in the table are meant to highlight your ongoing costs only and do not reflect any transaction costs, such as sales charges (loads) on purchase or redemption payments. Therefore, the second section of the table is useful in comparing ongoing costs only, and will not help you determine the relative total costs of owning different funds. In addition, if these transaction costs were included, your costs would have been higher.
| Beginning
Account Value
2/1/2012 | Ending
Account Value
7/31/2012 | Expenses Paid
During Period1 |
| Actual: | | | |
| Class A Shares | $1,000 | $1,020.00 | $6.78 |
| Class C Shares | $1,000 | $1,015.70 | $10.78 |
| Class R Shares | $1,000 | $1,017.70 | $9.28 |
| Institutional Shares | $1,000 | $1,020.60 | $5.53 |
Hypothetical (assuming a 5% return
before expenses): | | | |
| Class A Shares | $1,000 | $1,018.15 | $6.77 |
| Class C Shares | $1,000 | $1,014.17 | $10.77 |
| Class R Shares | $1,000 | $1,015.66 | $9.27 |
| Institutional Shares | $1,000 | $1,019.39 | $5.52 |
| 1 | Expenses are equal to the Fund's annualized net expense ratios, multiplied by the average account value over the period, multiplied by 182/366 (to reflect the one-half-year period). The annualized net expense ratios are as follows: |
| Class A Shares | 1.35% |
| Class C Shares | 2.15% |
| Class R Shares | 1.85% |
| Institutional Shares | 1.10% |
Annual Shareholder Report
Board of Trustees and Trust Officers
The Board of Trustees is responsible for managing the Trust's business affairs and for exercising all the Trust's powers except those reserved for the shareholders. The following tables give information about each Trustee and the senior officers of the Fund. Where required, the tables separately list Trustees who are “interested persons” of the Fund (i.e., “Interested” Trustees) and those who are not (i.e., “Independent” Trustees). Unless otherwise noted, the address of each person listed is Federated Investors Tower, 1001 Liberty Avenue, Pittsburgh, PA 15222. The address of all Independent Trustees listed is 4000 Ericsson Drive, Warrendale, PA 15086-7561; Attention: Mutual Fund Board. As of December 31, 2011, the Trust comprised five portfolio(s), and the Federated Fund Family consisted of 43 investment companies (comprising 134 portfolios). Unless otherwise noted, each Officer is elected annually. Unless otherwise noted, each Trustee oversees all portfolios in the Federated Fund Family and serves for an indefinite term. The Fund's Statement of Additional Information includes additional information about Trust Trustees and is available, without charge and upon request, by calling 1-800-341-7400.
Interested TRUSTEES Background
Name
Birth Date
Positions Held with Trust
Date Service Began | Principal Occupation(s) for Past Five Years,
Other Directorships Held and Previous Position(s) |
John F. Donahue*
Birth Date: July 28, 1924
Trustee
Began serving: June 2006 | Principal Occupations: Director or Trustee of the Federated Fund Family; Chairman and Director, Federated Investors, Inc.; Chairman of the Federated Fund Family's Executive Committee.
Previous Positions: Chairman of the Federated Fund Family; Trustee, Federated Investment Management Company; Chairman and Director, Federated Investment Counseling. |
J. Christopher Donahue*
Birth Date: April 11, 1949
President and Trustee
Began serving: May 2006 | Principal Occupations: Principal Executive Officer and President of the Federated Fund Family; Director or Trustee of some of the Funds in the Federated Fund Family; President, Chief Executive Officer and Director, Federated Investors, Inc.; Chairman and Trustee, Federated Investment Management Company; Trustee, Federated Investment Counseling; Chairman and Director, Federated Global Investment Management Corp.; Chairman, Federated Equity Management Company of Pennsylvania and Passport Research, Ltd. (investment advisory subsidiary of Federated); Trustee, Federated Shareholder Services Company; Director, Federated Services Company.
Previous Positions: President, Federated Investment Counseling; President and Chief Executive Officer, Federated Investment Management Company, Federated Global Investment Management Corp. and Passport Research, Ltd. |
| * | Family relationships and reasons for “interested” status: John F. Donahue is the father of J. Christopher Donahue; both are “interested” due to their beneficial ownership of shares of Federated Investors, Inc. and the positions they hold with Federated and its subsidiaries. |
Annual Shareholder Report
INDEPENDENT TRUSTEES Background
Name
Birth Date
Positions Held with Trust
Date Service Began | Principal Occupation(s) for Past Five Years,
Other Directorships Held, Previous Position(s) and Qualifications |
Nicholas P. Constantakis, CPA
Birth Date: September 3, 1939
Trustee
Began serving: June 2006 | Principal Occupation: Director or Trustee of the Federated Fund Family.
Other Directorship Held: Director, Chairman of the Audit Committee, and member of the Compensation Committee, Michael Baker Corporation (architecture, engineering and construction services).
Previous Position: Partner, Andersen Worldwide SC.
Qualifications: Public accounting and director experience. |
John F. Cunningham
Birth Date: March 5, 1943
Trustee
Began serving: June 2006 | Principal Occupation: Director or Trustee of the Federated Fund Family.
Other Directorships Held: Chairman, President and Chief Executive Officer, Cunningham & Co., Inc. (strategic business consulting); Trustee Associate, Boston College.
Previous Positions: Director, Redgate Communications and EMC Corporation (computer storage systems); Chairman of the Board and Chief Executive Officer, Computer Consoles, Inc.; President and Chief Operating Officer, Wang Laboratories; Director, First National Bank of Boston; Director, Apollo Computer, Inc.
Qualifications: Business management and director experience. |
Maureen Lally-Green
Birth Date: July 5, 1949
Trustee
Began serving: August 2009 | Principal Occupations: Director or Trustee of the Federated Fund Family; Director, Office of Church Relations, Diocese of Pittsburgh; Adjunct Professor of Law, Duquesne University School of Law.
Other Directorships Held: Director, Auberle; Member, Pennsylvania State Board of Education; Director, Saint Vincent College; Director, Ireland Institute of Pittsburgh; Chair and Director, UPMC Mercy Hospital; Regent, St. Vincent Seminary; Director, Epilepsy Foundation of Western and Central Pennsylvania; Director, Saint Thomas More Society, Allegheny County; Director, Our Campaign for the Church Alive, Inc.
Previous Position: Pennsylvania Superior Court Judge.
Qualifications: Legal and director experience. |
Peter E. Madden
Birth Date: March 16, 1942
Trustee
Began serving: June 2006 | Principal Occupation: Director or Trustee, and Chairman of the Board of Directors or Trustees, of the Federated Fund Family.
Previous Positions: Representative, Commonwealth of Massachusetts General Court; President, Chief Operating Officer and Director, State Street Bank and Trust Company and State Street Corporation (retired); Director, VISA USA and VISA International; Chairman and Director, Massachusetts Bankers Association; Director, Depository Trust Corporation; Director, The Boston Stock Exchange.
Qualifications: Business management, mutual fund services and director experience. |
Annual Shareholder Report
Name
Birth Date
Positions Held with Trust
Date Service Began | Principal Occupation(s) for Past Five Years,
Other Directorships Held, Previous Position(s) and Qualifications |
Charles F. Mansfield, Jr.
Birth Date: April 10, 1945
Trustee
Began serving: June 2006 | Principal Occupations: Director or Trustee of the Federated Fund Family; Management Consultant.
Previous Positions: Chief Executive Officer, PBTC International Bank; Partner, Arthur Young & Company (now Ernst & Young LLP); Chief Financial Officer of Retail Banking Sector, Chase Manhattan Bank; Senior Vice President, HSBC Bank USA (formerly Marine Midland Bank); Vice President, Citibank; Assistant Professor of Banking and Finance, Frank G. Zarb School of Business, Hofstra University; Executive Vice President, DVC Group, Inc. (marketing, communications and technology).
Qualifications: Banking, business management, education and director experience. |
Thomas M. O'Neill
Birth Date: June 14, 1951
Trustee
Began serving: October 2006 | Principal Occupations: Director or Trustee, Vice Chairman of the Audit Committee of the Federated Fund Family; Sole Proprietor, Navigator Management Company (investment and strategic consulting).
Other Directorships Held: Board of Overseers, Children's Hospital of Boston; Visiting Committee on Athletics, Harvard College; Board of Directors, Medicines for Humanity; Board of Directors, The Golisano Children's Museum of Naples, Florida.
Previous Positions: Chief Executive Officer and President, Managing Director and Chief Investment Officer, Fleet Investment Advisors; President and Chief Executive Officer, Aeltus Investment Management, Inc.; General Partner, Hellman, Jordan Management Co., Boston, MA; Chief Investment Officer, The Putnam Companies, Boston, MA; Credit Analyst and Lending Officer, Fleet Bank; Director and Consultant, EZE Castle Software (investment order management software); Director, Midway Pacific (lumber).
Qualifications: Business management, mutual fund, director and investment experience. |
John S. Walsh
Birth Date: November 28, 1957
Trustee
Began serving: June 2006 | Principal Occupations: Director or Trustee, Chairman of the Audit Committee of the Federated Fund Family; President and Director, Heat Wagon, Inc. (manufacturer of construction temporary heaters); President and Director, Manufacturers Products, Inc. (distributor of portable construction heaters); President, Portable Heater Parts, a division of Manufacturers Products, Inc.
Previous Position: Vice President, Walsh & Kelly, Inc.
Qualifications: Business management and director experience. |
Annual Shareholder Report
OFFICERS
Name
Birth Date
Address
Positions Held with Trust
Date Service Began | Principal Occupation(s) for Past Five Years
and Previous Position(s) |
John W. McGonigle
Birth Date: October 26, 1938
Secretary
Began serving: May 2006 | Principal Occupations: Executive Vice President and Secretary of the Federated Fund Family; Vice Chairman, Executive Vice President, Secretary and Director, Federated Investors, Inc.
Previous Positions: Trustee, Federated Investment Management Company and Federated Investment Counseling; Director, Federated Global Investment Management Corp., Federated Services Company and Federated Securities Corp. |
Richard A. Novak
Birth Date: December 25, 1963
TREASURER
Began serving: May 2006 | Principal Occupations: Principal Financial Officer and Treasurer of the Federated Fund Family; Senior Vice President, Federated Administrative Services; Financial and Operations Principal for Federated Securities Corp., Edgewood Services, Inc. and Southpointe Distribution Services, Inc.
Previous Positions: Controller of Federated Investors, Inc.; Vice President, Finance of Federated Services Company; held various financial management positions within The Mercy Hospital of Pittsburgh; Auditor, Arthur Andersen & Co. |
Stephen F. Auth
Birth Date: September 3, 1956
450 Lexington Avenue
Suite 3700
New York, NY 10017-3943
CHIEF INVESTMENT OFFICER
Began serving: June 2012 | Principal Occupations: Stephen F. Auth is Chief Investment Officer of this Fund and various other Funds in the Federated Fund Complex; Executive Vice President, Federated Investment Counseling, Federated Global Investment Management Corp. and Federated Equity Management Company of Pennsylvania.
Previous Positions: Executive Vice President, Federated Investment Management Company and Passport Research, Ltd. (investment advisory subsidiary of Federated); Senior Vice President, Global Portfolio Management Services Division; Senior Vice President, Federated Investment Management Company and Passport Research, Ltd.; Senior Managing Director and Portfolio Manager, Prudential Investments. |
Brian P. Bouda
Birth Date: February 28, 1947
CHIEF COMPLIANCE OFFICER AND SENIOR VICE PRESIDENT
Began serving: June 2006 | Principal Occupations: Senior Vice President and Chief Compliance Officer of the Federated Fund Family; Vice President and Chief Compliance Officer of Federated Investors, Inc. and Chief Compliance Officer of its subsidiaries. Mr. Bouda joined Federated in 1999 and is a member of the American Bar Association and the State Bar Association of Wisconsin. |
Daniel Mahr
Birth Date: April 9, 1981
125 High Street
Oliver Tower
21st Floor
Boston, MA 02110-2704
Vice President
Began serving: June 2012 | Principal Occupations: Daniel Mahr has been the Fund's Portfolio Manager since August 2006. Mr. Mahr joined the MDT Advisers Investment Team in 2002. As Managing Director, Research, he is responsible for leading the Investment Team as it relates to the ongoing design, development and implementation of the Optimum Q Process. He is Vice President of the Trust with respect to the Fund. Mr. Mahr received his A.B., Computer Science from Harvard College and his S.M., Computer Science from Harvard University. |
Annual Shareholder Report
Evaluation and Approval of Advisory Contract–May 2012
FEDERATED MDT ALL CAP CORE FUND (the “Fund”)
Following a review and recommendation of approval by the Fund's independent trustees, the Fund's Board reviewed and approved at its May 2012 meetings the Fund's investment advisory contract for an additional one-year term. The Board's decision regarding the contract reflects the exercise of its business judgment on whether to continue the existing arrangements.
In this connection, the Federated Funds' Board had previously appointed a Senior Officer, whose duties include specified responsibilities relating to the process by which advisory fees are to be charged to a Federated fund. The Senior Officer has the authority to retain consultants, experts, or staff as may be reasonably necessary to assist in the performance of his duties, reports directly to the Board, and may be terminated only with the approval of a majority of the independent members of the Board. The Senior Officer prepared and furnished to the Board an independent, written evaluation that covered topics discussed below (the “Evaluation”). The Board considered that Evaluation, along with other information, in deciding to approve the advisory contract.
The Board is also familiar with and considered judicial decisions concerning allegedly excessive investment advisory fees, which have indicated that the following factors may be relevant to an Adviser's fiduciary duty with respect to its receipt of compensation from a fund: the nature and quality of the services provided by the Adviser to a fund and its shareholders, including the performance and expenses of the fund and of comparable funds; the Adviser's cost of providing the services, including the profitability to the Adviser of providing advisory services to a fund; the extent to which the Adviser may realize “economies of scale” as a fund grows larger and, if such economies exist, whether they have been shared with a fund and its shareholders; any “fall-out financial benefits” that accrue to the Adviser because of its relationship with a fund (including research services received from brokers that execute fund trades and any fees paid to affiliates of the Adviser for services rendered to a fund); comparative fee structures, including a comparison of fees paid to the Adviser with those paid by similar funds; and the extent to which the Board members are fully informed about all facts the Board deems relevant to its consideration of the Adviser's services and fees. Consistent with these judicial decisions, the Board also considered management fees (including any components thereof) charged to institutional and other clients of the Adviser for what might be viewed as like services. The Board was aware of these factors and was guided by them in its review of the Fund's advisory contract to the extent it considered them to be appropriate and relevant, as discussed further below.
Annual Shareholder Report
The Board considered and weighed these circumstances in light of its substantial accumulated experience in governing the Fund and working with Federated on matters relating to the Federated funds, and was assisted in its deliberations by independent legal counsel. Throughout the year, and in connection with its May meetings, the Board requested and received substantial and detailed information about the Fund and the Federated organization that was in addition to the extensive materials that comprise and accompany the Senior Officer's Evaluation. Federated provided much of this information at each regular meeting of the Board, and furnished additional substantial information in connection with the May meeting at which the Board's formal review of the advisory contract occurred. At this May meeting, senior management of the Adviser also met with the independent trustees and their counsel to discuss the materials presented and any other matters thought relevant by the Adviser or the trustees. Between regularly scheduled meetings, the Board also received information on particular matters as the need arose. Thus, the Board's consideration of the advisory contract included review of the Senior Officer's Evaluation, accompanying data and additional information covering such matters as: the Adviser's investment philosophy, revenue, profitability, personnel and processes; investment and operating strategies; the Fund's short- and long-term performance (in absolute terms, both on a gross basis and net of expenses, as well as in relationship to its particular investment program and certain competitor or “peer group” funds and/or other benchmarks, as appropriate), and comments on the reasons for performance; the Fund's investment objectives; the Fund's expenses (including the advisory fee itself and the overall expense structure of the Fund, both in absolute terms and relative to similar and/or competing funds, with due regard for contractual or voluntary expense limitations); the use and allocation of brokerage commissions derived from trading the Fund's portfolio securities (if any); and the nature, quality and extent of the advisory and other services provided to the Fund by the Adviser and its affiliates. The Board also considered the preferences and expectations of Fund shareholders; the entrepreneurial risk assumed by the Adviser in sponsoring the funds; the continuing state of competition in the mutual fund industry and market practices; the range of comparable fees for similar funds in the mutual fund industry; the Fund's relationship to the Federated family of funds which include a comprehensive array of funds with different investment objectives, policies and strategies which are available for exchange without the incurrence of additional sales charges; compliance and audit reports concerning the Federated funds and the Federated companies that service them (including communications from regulatory agencies), as well as Federated's responses to any issues raised therein; and relevant developments in the mutual fund industry and how the Federated funds and/or Federated are responding to them. The Board's evaluation process is evolutionary. The criteria considered and the emphasis placed on relevant criteria change in recognition of changing circumstances in the mutual fund marketplace.
Annual Shareholder Report
While mindful that courts have cautioned against giving such comparisons too much weight, the Board has found the use of comparisons of the Fund's fees and expenses to other mutual funds with comparable investment programs to be relevant, given the high degree of competition in the mutual fund business. The Board focused on comparisons with other similar mutual funds more heavily than non-mutual fund products or services because it is believed that they are more relevant. For example, other mutual funds are the products most like the Fund, they are readily available to Fund shareholders as alternative investment vehicles, and they are the type of investment vehicle in fact chosen and maintained by the Fund's investors. The range of their fees and expenses therefore appears to be a generally reliable indication of what consumers have found to be reasonable in the precise marketplace in which the Fund competes. In this regard, the Senior Officer has reviewed Federated's fees for providing advisory services to products outside the Federated family of funds (e.g., institutional and separate accounts). He concluded that mutual funds and institutional accounts are inherently different products. Those differences include, but are not limited to, different types of targeted investors; being subject to different laws and regulations; different legal structures; different average account sizes; different associated costs; different portfolio management techniques made necessary by different cash flows; and portfolio manager time spent in review of securities pricing. The Senior Officer did not consider these fee schedules to be determinative in judging the appropriateness of mutual fund advisory contracts.
The Fund's ability to deliver competitive performance when compared to its peer group was also deemed to be relevant by the Board as a useful indicator of how the Adviser is executing the Fund's investment program, which in turn assisted the Board in reaching a conclusion that the nature, extent, and quality of the Adviser's investment management services were such as to warrant continuation of the advisory contract.
The Senior Officer reviewed information compiled by Federated, using data supplied by independent fund ranking organizations, regarding the performance of, and fees charged by, other mutual funds, noting his view that comparisons to fund peer groups are relevant in judging the reasonableness of proposed fees. He also observed that certain funds may exhibit important differences in their objectives and management techniques when compared to other funds placed in the same peer group by ranking organizations, noting in this connection that the Fund's quantitative investment program is of such a type.
Annual Shareholder Report
For the periods covered by the Evaluation, the Fund's performance for the one-year period was above the median of the relevant peer group, and the Fund's performance fell below the median of the relevant peer group for the three-year and five-year periods. In addition, the Board was informed by the Adviser that, for the same periods, the Fund underperformed its benchmark index for the one-year period, underperformed its benchmark index for the three-year period and underperformed its benchmark index for the five-year period. The Board discussed the Fund's performance with the Adviser and recognized the efforts being undertaken by the Adviser. The Board will continue to monitor these efforts and the performance of the Fund.
The Board also received financial information about Federated, including information regarding the compensation and benefits Federated derived from its relationships with the Federated funds. This information covered not only the fees under the advisory contracts, but also fees received by Federated's subsidiaries for providing other services to the Federated funds under separate contracts (e.g., for serving as the Federated funds' administrator). The information also detailed any indirect benefit Federated may derive from its receipt of research services from brokers who execute Federated fund trades. In addition, the Board considered the fact that, in order for a fund to be competitive in the marketplace, Federated and its affiliates frequently waived fees and/or reimbursed expenses and have disclosed to fund investors and/or indicated to the Board their intention to do so in the future, where appropriate. Moreover, the Board receives regular reporting as to the institution or elimination of these voluntary waivers.
Federated furnished information, requested by the Senior Officer, that reported revenues on a fund-by-fund basis and made estimates of the allocation of expenses on a fund-by-fund basis, using allocation methodologies specified by the Senior Officer. The Senior Officer noted that, although they may apply consistent allocation processes, the inherent difficulties in allocating costs (and the unavoidable arbitrary aspects of that exercise) and the lack of consensus on how to allocate those costs may render such allocation information unreliable. The allocation information was considered in the analysis by the Board but was determined to be of limited use.
The Board and the Senior Officer also reviewed information compiled by Federated comparing profitability information for Federated to other publicly held fund management companies. In this regard, the Senior Officer noted the limited availability of such information, but nonetheless concluded that Federated's profit margins did not appear to be excessive.
The Senior Officer's Evaluation also discussed the notion of possible realization of “economies of scale” as a fund grows larger. The Board considered in this regard that the Adviser has made significant and long-term investments in areas that support all of the Federated funds, such as personnel and processes for the portfolio management, shareholder services, compliance, internal audit, and risk management functions; and systems technology; and that the benefits of
Annual Shareholder Report
these efforts (as well as any economies, should they exist) were likely to be enjoyed by the fund complex as a whole. Finally, the Board also noted the absence of any applicable regulatory or industry guidelines on this subject, which (as discussed in the Senior Officer's Evaluation) is compounded by the lack of any common industry practice or general pattern with respect to structuring fund advisory fees with “breakpoints” that serve to reduce the fee as the fund attains a certain size. The Senior Officer did not recommend institution of breakpoints in pricing Federated's fund advisory services at this time.
It was noted in the materials for the Board meeting that for the period covered by the Evaluation, the Fund's investment advisory fee, after waivers and expense reimbursements, if any, was above the median of the relevant peer group. The Board reviewed the fees and other expenses of the Fund with the Adviser and was satisfied that the overall expense structure of the Fund remained competitive. In this regard, the Board had been previously advised that, while comparisons to fund peer groups are relevant in judging the reasonableness of advisory fees, the Fund's quantitative focus makes fee and expense comparisons particularly difficult. Although the Fund's advisory fee was above the median of the peer range, the peer group of funds varied widely in their complexity, and the management of the Fund is among the more complex relative to its peers. The Board will continue to monitor advisory fees and other expenses borne by the Fund.
The Senior Officer noted that, considering the totality of the circumstances, and all of the factors referenced within his Evaluation, he had concluded that, subject to comments and recommendations made within his Evaluation, his observations and the information accompanying the Evaluation supported a finding by the Board that the management fees for each of the funds was reasonable and that Federated appeared to provide appropriate advisory and administrative services to the Fund for the fees paid. Under these circumstances, no changes were recommended to, and no objection was raised to, the continuation of the Fund's advisory contract.
In its decision to continue an existing investment advisory contract, the Board was mindful of the potential disruptions of the Fund's operations and various risks, uncertainties and other effects that could occur as a result of a decision to terminate or not renew an advisory contract. In particular, the Board recognized that many shareholders have invested in the Fund on the strength of the Adviser's industry standing and reputation and with the expectation that the Adviser will have a continuing role in providing advisory services to the Fund. Thus, the Board's approval of the advisory contract reflected the fact that it is the shareholders who have effectively selected the Adviser by virtue of having invested in the Fund. The Board concluded that, in light of the factors discussed above, including the nature, quality and scope of the services provided to the Fund by the Adviser and its affiliates, continuation of the advisory contract was appropriate.
Annual Shareholder Report
The Board based its decision to approve the advisory contract on the totality of the circumstances and relevant factors and with a view to past and future long-term considerations. Not all of the factors and considerations identified above were necessarily relevant to the Fund, nor did the Board consider any one of them to be determinative. With respect to the factors that were relevant, the Board's decision to approve the contract reflects its determination that Federated's performance and actions provided a satisfactory basis to support the decision to continue the existing arrangements.
Annual Shareholder Report
Voting Proxies on Fund Portfolio Securities
A description of the policies and procedures that the Fund uses to determine how to vote proxies, if any, relating to securities held in the Fund's portfolio is available, without charge and upon request, by calling 1-800-341-7400. A report on “Form N-PX” of how the Fund voted any such proxies during the most recent 12-month period ended June 30 is available from Federated's website at FederatedInvestors.com. To access this information from the home page, select “All” under “Asset Classes.” Select a fund name and share class, if applicable, to go to the Fund Overview page. On the Fund Overview page, select the “Documents” tab. At the bottom of that page, select “Proxy Voting Record Report (Form N-PX).” Form N-PX filings are also available at the SEC's website at www.sec.gov.
Quarterly Portfolio Schedule
The Fund files with the SEC a complete schedule of its portfolio holdings, as of the close of the first and third quarters of its fiscal year, on “Form N-Q.” These filings are available on the SEC's website at www.sec.gov and may be reviewed and copied at the SEC's Public Reference Room in Washington, DC. (Call 1-800-SEC-0330 for information on the operation of the Public Reference Room.) You may also access this information from the “Products” section of Federated's website at FederatedInvestors.com. From the home page, select “All” under “Asset Classes.” Select a fund name and share class, if applicable, to go to the Fund Overview page. On the Fund Overview page, select the “Documents” tab. At the bottom of that page, select “Form N-Q.”
Annual Shareholder Report
Mutual funds are not bank deposits or obligations, are not guaranteed by any bank and are not insured or guaranteed by the U.S. government, the Federal Deposit Insurance Corporation, the Federal Reserve Board or any other government agency. Investment in mutual funds involves investment risk, including the possible loss of principal.
This Report is authorized for distribution to prospective investors only when preceded or accompanied by the Fund's Prospectus, which contains facts concerning its objective and policies, management fees, expenses and other information.
Federated MDT All Cap Core Fund
Federated Investors Funds
4000 Ericsson Drive
Warrendale, PA 15086-7561
Contact us at FederatedInvestors.com
or call 1-800-341-7400.
Federated Securities Corp., Distributor
CUSIP 31421R106
CUSIP 31421R205
CUSIP 31421R718
CUSIP 31421R304
37309 (9/12)
Federated is a registered trademark of Federated Investors, Inc.
2012 ©Federated Investors, Inc.
Annual Shareholder Report
July 31, 2012
| Share Class | Ticker |
| A | QABGX |
| C | QCBGX |
| R | QKBGX |
| Institutional | QIBGX |
Federated MDT Balanced Fund
Fund Established 2002
A Portfolio of Federated MDT Series
Dear Valued Shareholder,
I am pleased to present the Annual Shareholder Report for your fund covering the period from August 1, 2011 through July 31, 2012. This report includes Management's Discussion of Fund Performance, a complete listing of your fund's holdings, performance information and financial statements along with other important fund information.
In addition, our website, FederatedInvestors.com, offers easy access to Federated resources that include timely fund updates, economic and market insights from our investment strategists, and financial planning tools. We invite you to register to take full advantage of its capabilities.
Thank you for investing with Federated. I hope you find this information useful and look forward to keeping you informed.
Sincerely,
J. Christopher Donahue, President
Not FDIC Insured • May Lose Value • No Bank Guarantee
Management's Discussion of Fund Performance (unaudited)
The Fund's total return, based on net asset value, for the 12-month reporting period ended July 31, 2012, was 1.65% for Class A Shares, 0.93% for Class C Shares, 1.19% for Class R Shares and 1.87% for Institutional Shares. Over the same period, the Standard & Poor's 500 Index (S&P 500)1 and the Barclays U.S. Aggregate Bond Index (BAB Index),2 each a broad-based securities market index, returned 9.13% and 7.25%, respectively.
MArket Overview
Over the reporting period, domestic equity market performance was strong as evidenced by the 7.33% return of the Russell 3000® Index,3 which represents the performance of the 3,000 largest U.S. companies by market capitalization. Large-cap stocks led the way as demonstrated by the 10.41% return of the Russell Top 200® Index,4 which exceeded the 2.28% and 0.19% results for the Russell Midcap® Index,5 representing mid-cap stocks, and the Russell 2000® Index,6 representing small-cap stocks, respectively. Growth stocks outperformed value stocks during the year with the Russell 3000® Growth Index7 returning 7.55% as compared to 7.09% for the Russell 3000® Value Index.8
Real Estate Investment Trust (REIT) fundamentals benefited from the moderate improvement in employment conditions and a decline in interest rates which boosted property valuations. For the reporting period, the Standard & Poor's U.S. REIT Index9 returned 13.44%.
International equities10 in developed markets underperformed the domestic equity market during the reporting period with the Morgan Stanley Capital International (MSCI) Europe, Australasia and Far East (EAFE) Index11 returning -11.45%. Emerging market12 equities had similar results with the MSCI Emerging Markets Free Index13 returning -13.93%.
Bond markets were quite volatile over the past year as the European debt crisis remained in the headlines throughout the reporting period. An improving, though sluggish, domestic economy and a declining interest rate environment, particularly at the longest maturities, provided a constructive backdrop for most fixed income instruments with total returns on all bond sectors providing positive results.
ASSET ALLOCATION
During the 12-month reporting period, equity investments accounted for an average of approximately 68% of the portfolio while fixed income and cash investments accounted for an average of 32%. Though allocations fluctuated with the swings in the market, the overall allocation to equities relative to bonds ended the period essentially unchanged. Within the equity allocation, REIT investments were increased marginally while the mix between domestic and international was held steady.
Annual Shareholder Report
EQUITIES
Domestic equity investments, which were managed using Federated MDT's proprietary Optimum Q process, underperformed the Russell 3000® Index during the 12-month reporting period. Investments in the Information Technology sector were the most significant negative factor in the Fund's domestic equity performance relative to the Russell 3000® Index. REIT investments were a positive contributor to Fund performance during the reporting period, outperforming both the S&P REIT index and the broader equity market.
FIXED INCOME
The fixed income portion of the portfolio outperformed the BAB Index by a healthy margin as a result of the Fund's yield curve management and security selection. Duration positioning detracted from Fund performance considerably, while sector management was a modest negative. Overweights in high yield14 and CMBS,15 the best performing sectors over the past year, positively contributed to Fund performance. The greater yield on the portfolio, as a result of these overweights, also helped performance. The Fund's lower quality bias, on the other hand, and the overweights in Industrials and Finance, detracted from Fund performance.
| 1 | The S&P 500 Index is an unmanaged capitalization-weighted index of 500 stocks designed to measure performance of the broad domestic economy through changes in the aggregate market value of 500 stocks representing all major industries. The index is unmanaged, and it is not possible to invest directly in an index. |
| 2 | Barclays Capital changed the name of the BAB Index from “Barclays Capital U.S. Aggregate Bond Index” to “Barclays U.S. Aggregate Bond Index.” The BAB Index is an unmanaged index composed of securities from the Barclay's Government/Corporate Bond Index, Mortgage-Backed Securities Index and the Asset-Backed Securities Index. Total return comprises price appreciation/depreciation and income as a percentage of the original investment. Indices are rebalanced monthly by market capitalization. The index is unmanaged, and it is not possible to invest directly in an index. |
| 3 | The Russell 3000® Index offers investors access to the broad U.S. equity universe representing approximately 98% of the U.S. market. The Russell 3000® Index is constructed to provide a comprehensive, unbiased and stable barometer of the broad market and is completely reconstituted annually to ensure new and growing equities are reflected. The index is unmanaged, and it is not possible to invest directly in an index. |
| 4 | The Russell Top 200® Index measures the performance of the 200 largest companies in the Russell 1000® Index, which represents approximately 68% of the total market capitalization of the Russell 1000® Index. The index is unmanaged, and it is not possible to invest directly in an index. |
| 5 | The Russell Midcap® Index measures the performance of the 800 smallest companies in the Russell 1000® Index, which represent approximately 31% of the total market capitalization of the Russell 1000® Index. The index is unmanaged, and it is not possible to invest directly in an index. |
| 6 | The Russell 2000® Index measures the performance of the 2,000 smallest companies in the Russell 3000® Index, which represents approximately 10% of the total market capitalization of the Russell 3000® Index. The index is unmanaged, and it is not possible to invest directly in an index. |
| 7 | The Russell 3000® Growth Index measures the performance of those Russell 3000® Index companies with higher price-to-book ratios and higher forecasted growth values. The stocks in this index are also members of either the Russell 1000® Growth or the Russell 2000® Growth indexes. The index is unmanaged, and it is not possible to invest directly in an index. |
Annual Shareholder Report
| 8 | The Russell 3000® Value Index measures the performance of those Russell 3000® Index companies with lower price-to-book ratios and lower forecasted growth values. The stocks in this index are also members of either the Russell 1000® Value or the Russell 2000® Value indexes. The index is unmanaged, and it is not possible to invest directly in an index. |
| 9 | The S&P REIT Index tracks the market performance of U.S. Real Estate Investment Trusts, known as REITs. It consists of 100 REITs chosen for their liquidity and importance in representing a diversified real estate portfolio. Investments in REITs involve special risks associated with an investment in real estate, such as limited liquidity and interest rate risks. The index is unmanaged, and it is not possible to invest directly in an index. |
| 10 | International investing involves special risks including currency risk, increased volatility of foreign securities, political risks and differences in auditing and other financial standards. |
| 11 | The MSCI EAFE Index measures international equity performance. It comprises 22 MSCI country indices, representing the developed markets outside of North America. The index is unmanaged, and it is not possible to invest directly in an index. |
| 12 | Prices of emerging markets securities can be significantly more volatile than the prices of securities in developed countries, and currency risks and political risks are accentuated in emerging markets. |
| 13 | The MSCI Emerging Markets Free Index is an unmanaged index consisting of 21 emerging market countries. The index is unmanaged, and it is not possible to invest directly in an index. |
| 14 | High-yield, lower-rated securities generally entail greater market, credit and liquidity risk than investment-grade securities and may include higher volatility and higher risk of default. Bond prices are sensitive to changes in interest rates and a rise in interest rates can cause a decline in their prices. |
| 15 | The value of some mortgage-backed securities may be particularly sensitive to changes in prevailing interest rates, and although the securities are generally supported by some form of government or private insurance, there is no assurance that private guarantors or insurers will meet their obligations. Bond prices are sensitive to changes in interest rates and a rise in interest rates can cause a decline in their prices. |
Annual Shareholder Report
FUND PERFORMANCE AND GROWTH OF A $10,000 INVESTMENT
The start of performance date for the Fund's Class A Shares, Class C Shares and Class R Shares was October 1, 2002. Class A Shares and Class C Shares commenced operations on September 15, 2005, and Class R Shares commenced operations on December 12, 2006, respectively. Performance results shown before those dates are for the Fund's Institutional Shares and have been adjusted for the maximum sales charges, maximum contingent deferred sales charges and total annual operating expenses applicable to each class. The Fund's Instituional Shares commenced operations on October 1, 2002. Subject to the expense adjustments noted above, the Fund's Class A Shares, Class C Shares and Class R Shares annual returns would be substantially similar to those of the Institutional Shares because Shares of each class are invested in the same portfolio of securities. The Average Annual Total Return table below shows returns for each class averaged over the stated periods. The graphs below illustrate the hypothetical investment of $10,0001 in the Federated MDT Balanced Fund2 (the “Fund”) from October 1, 2002 (start of performance) to July 31, 2012, compared to the Standard and Poor's 500 Index (S&P 500)3 and the Barclays U.S. Aggregate Bond Index (BAB).3
Average Annual Total Returns for the Periods Ended 7/31/2012
(returns reflect all applicable sales charges and contingent deferred sales charges as specified below in footnote #1)
| Share Class | 1 Year | 5 Years | Start of
Performance* |
| Class A Shares | -3.95% | -1.32% | 5.31% |
| Class C Shares | -0.07% | -0.93% | 5.11% |
| Class R Shares | 1.19% | -0.67% | 5.44% |
| Institutional Shares | 1.87% | 0.05% | 6.17% |
| * | The Fund's start of performance date was October 1, 2002. |
Performance data quoted represents past performance which is no guarantee of future results. Investment return and principal value will fluctuate so that an investor's shares, when redeemed, may be worth more or less than their original cost. Mutual fund performance changes over time and current performance may be lower or higher than what is stated. For current to the most recent month-end performance and after-tax returns, visit FederatedInvestors.com or call 1-800-341-7400. Returns shown do not reflect the deduction of taxes that a shareholder would pay on Fund distributions or the redemption of Fund shares. Mutual funds are not obligations of or guaranteed by any bank and are not federally insured.
Annual Shareholder Report
Growth of a $10,000 Investment–CLASS A SHARES
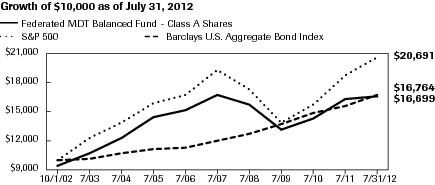
| Federated MDT Balanced Fund - Class A Shares | C000035055 | S&P 500 | Barclays U.S. Aggregate Bond Index |
| 10/1/2002 | 9,450 | 10,000 | 10,000 |
| 7/31/2003 | 10,768 | 12,333 | 10,201 |
| 7/31/2004 | 12,393 | 13,956 | 10,695 |
| 7/31/2005 | 14,440 | 15,918 | 11,207 |
| 7/31/2006 | 15,213 | 16,770 | 11,371 |
| 7/31/2007 | 16,796 | 19,478 | 12,005 |
| 7/31/2008 | 15,855 | 17,317 | 12,744 |
| 7/31/2009 | 13,264 | 13,861 | 13,743 |
| 7/31/2010 | 14,392 | 15,778 | 14,968 |
| 7/31/2011 | 16,360 | 18,878 | 15,631 |
| 7/31/2012 | 16,699 | 20,691 | 16,764 |
41 graphic description end -->
| ■ | Total returns shown include the maximum sales charge of 5.50% ($10,000 investment minus $550 sales charge = $9,450). |
Growth of a $10,000 Investment–CLASS c SHARES
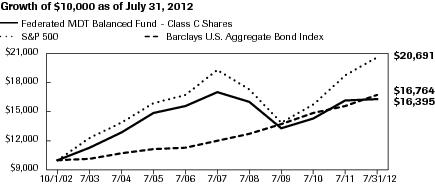
| Federated MDT Balanced Fund - Class C Shares | C000035056 | S&P 500 | Barclays U.S. Aggregate Bond Index |
| 10/1/2002 | 10,000 | 10,000 | 10,000 |
| 7/31/2003 | 11,324 | 12,333 | 10,201 |
| 7/31/2004 | 12,937 | 13,956 | 10,695 |
| 7/31/2005 | 14,961 | 15,918 | 11,207 |
| 7/31/2006 | 15,627 | 16,770 | 11,371 |
| 7/31/2007 | 17,112 | 19,478 | 12,005 |
| 7/31/2008 | 16,037 | 17,317 | 12,744 |
| 7/31/2009 | 13,319 | 13,861 | 13,743 |
| 7/31/2010 | 14,335 | 15,778 | 14,968 |
| 7/31/2011 | 16,177 | 18,878 | 15,631 |
| 7/31/2012 | 16,395 | 20,691 | 16,764 |
41 graphic description end -->
| ■ | Total returns shown include the maximum contingent deferred sales charge of 1.00%, as applicable. |
Annual Shareholder Report
Growth of a $10,000 Investment–CLASS r SHARES
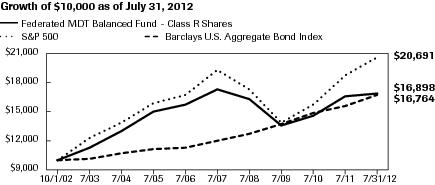
| Federated MDT Balanced Fund - Class R Shares | C000043498 | S&P 500 | Barclays U.S. Aggregate Bond Index |
| 10/1/2002 | 10,000 | 10,000 | 10,000 |
| 7/31/2003 | 11,348 | 12,333 | 10,201 |
| 7/31/2004 | 12,996 | 13,956 | 10,695 |
| 7/31/2005 | 15,067 | 15,918 | 11,207 |
| 7/31/2006 | 15,794 | 16,770 | 11,371 |
| 7/31/2007 | 17,402 | 19,478 | 12,005 |
| 7/31/2008 | 16,355 | 17,317 | 12,744 |
| 7/31/2009 | 13,615 | 13,861 | 13,743 |
| 7/31/2010 | 14,706 | 15,778 | 14,968 |
| 7/31/2011 | 16,630 | 18,878 | 15,631 |
| 7/31/2012 | 16,898 | 20,691 | 16,764 |
41 graphic description end -->
Growth of a $10,000 Investment–institutional shares
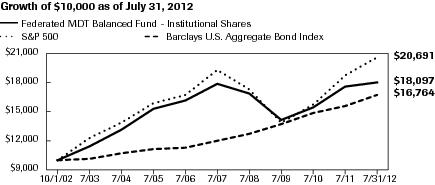
| Federated MDT Balanced Fund - Institutional Shares | C000035057 | S&P 500 | Barclays U.S. Aggregate Bond Index |
| 10/1/2002 | 10,000 | 10,000 | 10,000 |
| 7/31/2003 | 11,418 | 12,333 | 10,201 |
| 7/31/2004 | 13,174 | 13,956 | 10,695 |
| 7/31/2005 | 15,388 | 15,918 | 11,207 |
| 7/31/2006 | 16,252 | 16,770 | 11,371 |
| 7/31/2007 | 17,977 | 19,478 | 12,005 |
| 7/31/2008 | 17,019 | 17,317 | 12,744 |
| 7/31/2009 | 14,274 | 13,861 | 13,743 |
| 7/31/2010 | 15,521 | 15,778 | 14,968 |
| 7/31/2011 | 17,692 | 18,878 | 15,631 |
| 7/31/2012 | 18,097 | 20,691 | 16,764 |
41 graphic description end -->
| 1 | Represents a hypothetical investment of $10,000 in the Fund after deducting applicable sales charges: For Class A Shares, the maximum sales charge of 5.50% ($10,000 investment minus $550 sales charge = $9,450); for Class C Shares, a 1.00% contingent deferred sales charge would be applied on any redemption less than one year from the purchase date. The Fund's performance assumes the reinvestment of all dividends and distributions. The S&P 500 and BAB have been adjusted to reflect reinvestment of dividends on securities in the indexes. |
| 2 | The Fund is the successor to the MDT Balanced Fund pursuant to a reorganization that took place on December 8, 2006. Prior to that date, the Fund had no investment operations. Accordingly, the performance information shown for periods prior to that date is that of the MDT Balanced Fund. |
| 3 | Barclays Capital changed the name of the BAB Index from “Barclays Capital U.S. Aggregate Bond Index” to “Barclays U.S. Aggregate Bond Index.” The S&P 500 and the BAB are not adjusted to reflect sales charges, expenses or other fees that the Securities and Exchange Commission requires to be reflected in the Fund's performance. The indexes are unmanaged and, unlike the Fund, are not affected by cash flows. It is not possible to invest directly in an index. |
Annual Shareholder Report
Portfolio of Investments Summary Tables (unaudited)
At July 31, 2012, the Fund's portfolio composition1 was as follows:
| Security Type | Percentage of
Total Net Assets |
| Domestic Equity Securities | 59.8% |
| Corporate Debt Securities | 16.3% |
| Mortgage-Backed Securities2 | 8.7% |
| International Equity Securities (including International Exchange-Traded Funds) | 6.9% |
| U.S. Treasury Securities3 | 1.8% |
| Collateralized Mortgage Obligations | 1.3% |
| Asset-Backed Securities | 0.7% |
| Foreign Debt Securities | 0.7% |
| Trade Finance Agreements | 0.6% |
| Municipal Securities | 0.3% |
| Floating Rate Loan4 | 0.0% |
| Cash Equivalents5 | 4.8% |
| Derivative Contracts4,6 | (0.0)% |
| Other Assets and Liabilities—Net7 | (1.9)% |
| TOTAL | 100.0% |
| 1 | See the Fund's Prospectus for a description of the principal types of securities in which the Fund invests. As of the date specified above, the Fund owned shares of one or more affiliated investment companies. For purposes of this table, the affiliated investment company (other than an affiliated money market mutual fund) is not treated as a single portfolio security, but rather the Fund is treated as owning a pro rata portion of each security and each other asset and liability owned by the affiliated investment company. Accordingly, the percentages of total net assets shown in the table will differ from those presented on the Portfolio of Investments. |
| 2 | For purposes of this table, Mortgage-Backed Securities include mortgage-backed securities guaranteed by Government Sponsored Entities and adjustable rate mortgage-backed securities. |
| 3 | Also includes $122,692 held in U.S. Treasuries pledged as collateral to ensure the Fund is able to satisfy the obligations of its outstanding futures contracts. |
| 4 | Represents less than 0.1%. |
| 5 | Cash Equivalents include any investments in money market mutual funds and/or overnight repurchase agreements. |
| 6 | Based upon net unrealized appreciation (depreciation) or value of the derivative contracts as applicable. Derivative contracts may consist of futures, forwards, options and swaps. The impact of a derivative contract on the Fund's performance may be larger than its unrealized appreciation (depreciation) or value may indicate. In many cases, the notional value or amount of a derivative contract may provide a better indication of the contract's significance to the portfolio. More complete information regarding the Fund's direct investments in derivative contracts, including unrealized appreciation (depreciation), value and notional values or amounts of such contracts, can be found in the table at the end of the Portfolio of Investments included in this Report. |
| 7 | Assets, other than investments in securities and derivative contracts, less liabilities. See Statement of Assets and Liabilities. |
Annual Shareholder Report
At July 31, 2012, the Fund's industry composition8 for its equity securities (excluding international exchange-traded funds) was as follows:
| Industry Composition | Percentage of
Equity Securities |
| Real Estate Investment Trusts | 11.0% |
| Specialty Retailing | 5.8% |
| Regional Banks | 4.6% |
| Discount Department Stores | 3.9% |
| Services to Medical Professionals | 3.9% |
| Money Center Bank | 3.7% |
| Integrated Domestic Oil | 3.5% |
| Property Liability Insurance | 3.5% |
| Broadcasting | 3.3% |
| Multi-Line Insurance | 3.3% |
| Department Stores | 3.1% |
| Financial Services | 3.1% |
| Personal Loans | 2.9% |
| Ethical Drugs | 2.8% |
| Diversified Leisure | 1.9% |
| Auto Manufacturing | 1.6% |
| Computers—Midrange | 1.6% |
| Hotels | 1.6% |
| Cosmetics & Toiletries | 1.5% |
| Life Insurance | 1.4% |
| Specialty Chemicals | 1.4% |
| Apparel | 1.3% |
| Drug Store | 1.2% |
| Cable & Wireless Television | 1.1% |
| Grocery Chain | 1.1% |
| Oil Refiner | 1.0% |
| Soft Drinks | 1.0% |
| Software Packaged/Custom | 1.0% |
| Other9 | 22.9% |
| TOTAL | 100.0% |
| 8 | Industry classifications are based upon, and individual portfolio securities are assigned to, the classifications of the Global Industry Classification Standard (GICS) except that the Adviser assigns a classification to securities not classified by the GICS and to securities for which the Adviser does not have access to the classification made by the GICS. |
| 9 | For purposes of this table, industry classifications which constitute less than 1.0% of the Fund's equity securities have been aggregated under the designation “Other.” |
Annual Shareholder Report
Portfolio of Investments
July 31, 2012
Principal
Amount
or Shares | | | Value |
| | COMMON STOCKS—61.6% | |
| | Agricultural Chemical—0.0% | |
| 1,100 | | Scotts Co. | $43,890 |
| | Agricultural Machinery—0.1% | |
| 1,100 | | Lindsay Manufacturing Co. | 77,990 |
| | Airline - Regional—0.5% | |
| 19,939 | 1 | Alaska Air Group, Inc. | 694,874 |
| | Aluminum—0.1% | |
| 2,800 | | Kaiser Aluminum Corp. | 152,712 |
| | Apparel—0.8% | |
| 3,582 | 1 | Ann, Inc. | 97,001 |
| 8,012 | 1 | Carter's, Inc. | 405,968 |
| 1,187 | | Columbia Sportswear Co. | 60,050 |
| 2,392 | 1 | Express, Inc. | 38,511 |
| 1,500 | | Guess ?, Inc. | 45,150 |
| 558 | 1 | Maidenform Brands, Inc. | 11,763 |
| 571 | | Oxford Industries, Inc. | 24,690 |
| 1,012 | | True Religion Apparel, Inc. | 26,555 |
| 4,538 | 1 | Warnaco Group, Inc. | 193,591 |
| 3,442 | 1 | Zumiez, Inc. | 125,048 |
| | TOTAL | 1,028,327 |
| | AT&T Divestiture—0.0% | |
| 1,100 | | Verizon Communications | 49,654 |
| | Auto Dealership—0.0% | |
| 670 | | Group 1 Automotive, Inc. | 36,012 |
| | Auto Manufacturing—1.0% | |
| 19,700 | | Ford Motor Co. | 182,028 |
| 45,800 | 1 | General Motors Co. | 902,718 |
| 4,800 | 1 | TRW Automotive Holdings Corp. | 188,640 |
| | TOTAL | 1,273,386 |
| | Auto Original Equipment Manufacturers—0.2% | |
| 4,698 | | Dana Holding Corp. | 61,920 |
| 4,400 | | Johnson Controls, Inc. | 108,460 |
| 1,566 | 1 | Meritor, Inc. | 7,329 |
| 4,722 | 1 | Tenneco Automotive, Inc. | 138,307 |
| | TOTAL | 316,016 |
Annual Shareholder Report
Principal
Amount
or Shares | | | Value |
| | COMMON STOCKS—continued | |
| | Auto Part Replacement—0.3% | |
| 5,900 | | Genuine Parts Co. | $377,777 |
| | Auto Rental—0.2% | |
| 2,826 | 1 | Dollar Thrifty Automotive Group | 210,254 |
| | Baking—0.0% | |
| 432 | | Snyders-Lance, Inc. | 10,122 |
| | Biotechnology—0.1% | |
| 663 | 1 | Incyte Genomics, Inc. | 16,568 |
| 1,518 | 1 | Questcor Pharmaceuticals, Inc. | 55,969 |
| | TOTAL | 72,537 |
| | Broadcasting—2.0% | |
| 9,300 | | American Tower Corp. | 672,483 |
| 38,700 | 1 | DIRECTV-Class A | 1,921,842 |
| | TOTAL | 2,594,325 |
| | Building Materials—0.2% | |
| 4,600 | 1 | Fortune Brands Home & Security, Inc. | 101,752 |
| 1,100 | | Lennox International, Inc. | 48,037 |
| 1,216 | | Watsco, Inc. | 82,615 |
| | TOTAL | 232,404 |
| | Building Supply Store—0.6% | |
| 29,100 | | Lowe's Cos., Inc. | 738,267 |
| | Cable & Wireless Television—0.7% | |
| 10,100 | | Time Warner Cable, Inc. | 857,793 |
| | Cable TV—0.2% | |
| 1,600 | 1 | Charter Communications, Inc. | 123,072 |
| 2,500 | 1 | Liberty Global, Inc., Class A | 131,950 |
| | TOTAL | 255,022 |
| | Carpets—0.2% | |
| 817 | | Interface, Inc. | 10,833 |
| 2,700 | 1 | Mohawk Industries, Inc. | 179,361 |
| | TOTAL | 190,194 |
| | Cement—0.0% | |
| 568 | | Eagle Materials, Inc. | 19,738 |
| | Clothing Stores—0.6% | |
| 3,042 | 1 | Aeropostale, Inc. | 59,988 |
| 685 | | Cato Corp., Class A | 19,180 |
| 1,971 | 1 | Children's Place Retail Stores, Inc. | 100,127 |
Annual Shareholder Report
Principal
Amount
or Shares | | | Value |
| | COMMON STOCKS—continued | |
| | Clothing Stores—continued | |
| 13,200 | | Gap (The), Inc. | $389,268 |
| 1,900 | 1 | Hanesbrands, Inc. | 57,038 |
| 1,258 | 1 | Jos A. Bank Clothiers, Inc. | 53,163 |
| 757 | 1 | Rue21, Inc. | 18,653 |
| | TOTAL | 697,417 |
| | Commodity Chemicals—0.3% | |
| 618 | | Georgia Gulf Corp. | 20,258 |
| 419 | | Innospec, Inc. | 13,039 |
| 170 | | Newmarket Corp. | 39,080 |
| 2,300 | | PPG Industries, Inc. | 251,758 |
| 2,100 | | RPM International, Inc. | 55,650 |
| 76 | | Stepan Co. | 6,738 |
| | TOTAL | 386,523 |
| | Computer Networking—0.0% | |
| 707 | 1 | NetScout Systems, Inc. | 16,515 |
| | Computer Peripherals—0.1% | |
| 2,800 | | Lexmark International Group, Class A | 48,972 |
| 973 | 1 | Silicon Graphics International Corp. | 6,471 |
| 553 | 1 | Synaptics, Inc. | 14,588 |
| | TOTAL | 70,031 |
| | Computer Services—0.2% | |
| 1,149 | 1 | CACI International, Inc., Class A | 64,861 |
| 1,134 | | Fair Isaac & Co., Inc. | 49,091 |
| 1,253 | | Syntel, Inc. | 72,837 |
| 1,435 | 1 | Unisys Corporation | 27,882 |
| | TOTAL | 214,671 |
| | Computer Stores—0.5% | |
| 4,200 | | GameStop Corp. | 67,284 |
| 1,900 | 1 | Insight Enterprises, Inc. | 31,844 |
| 11,300 | 1 | Tech Data Corp. | 566,130 |
| | TOTAL | 665,258 |
| | Computers - Low End—0.3% | |
| 31,800 | | Dell, Inc. | 377,784 |
| | Computers - Midrange—1.0% | |
| 68,300 | | Hewlett-Packard Co. | 1,245,792 |
| | Construction Machinery—0.2% | |
| 236 | | NACCO Industries, Inc., Class A | 23,635 |
Annual Shareholder Report
Principal
Amount
or Shares | | | Value |
| | COMMON STOCKS—continued | |
| | Construction Machinery—continued | |
| 8,000 | | Trinity Industries, Inc. | $224,000 |
| | TOTAL | 247,635 |
| | Consumer Finance—0.0% | |
| 565 | 1 | Green Dot Corp. | 5,899 |
| | Consumer Goods—0.0% | |
| 1,428 | | Pool Corp. | 52,636 |
| | Cosmetics & Toiletries—0.9% | |
| 3,800 | | Avon Products, Inc. | 58,862 |
| 778 | 1 | Elizabeth Arden, Inc. | 30,350 |
| 8,600 | | Estee Lauder Cos., Inc., Class A | 450,468 |
| 1,642 | 1 | Revlon, Inc., Class A | 23,891 |
| 4,132 | 1 | Sally Beauty Holdings, Inc. | 109,167 |
| 5,600 | 1 | Ulta Salon Cosmetics & Fragrance, Inc. | 475,328 |
| | TOTAL | 1,148,066 |
| | Crude Oil & Gas Production—0.1% | |
| 2,138 | | Energy XXI Ltd. | 66,663 |
| 2,145 | 1 | Stone Energy Corp. | 56,328 |
| 1,876 | | W&T Offshore, Inc. | 34,687 |
| | TOTAL | 157,678 |
| | Defense Aerospace—0.1% | |
| 849 | 1 | Hexcel Corp. | 19,773 |
| 662 | | Kaman Corp., Class A | 21,568 |
| 855 | 1 | Orbital Sciences Corp. | 11,200 |
| 246 | 1 | Teledyne Technologies, Inc. | 15,326 |
| 900 | 1 | Transdigm Group, Inc. | 111,024 |
| | TOTAL | 178,891 |
| | Department Stores—1.9% | |
| 10,400 | | Kohl's Corp. | 517,088 |
| 11,000 | | Macy's, Inc. | 394,240 |
| 6,500 | | Penney (J.C.) Co., Inc. | 146,315 |
| 2,321 | 1 | Saks, Inc. | 24,208 |
| 2,900 | 1 | Sears Holdings Corp. | 143,521 |
| 19,500 | | Target Corp. | 1,182,675 |
| | TOTAL | 2,408,047 |
| | Discount Department Stores—2.4% | |
| 11,200 | 1 | Dollar Tree, Inc. | 563,808 |
| 1,700 | | Family Dollar Stores, Inc. | 112,336 |
Annual Shareholder Report
Principal
Amount
or Shares | | | Value |
| | COMMON STOCKS—continued | |
| | Discount Department Stores—continued | |
| 31,400 | | Wal-Mart Stores, Inc. | $2,337,102 |
| | TOTAL | 3,013,246 |
| | Diversified Leisure—1.2% | |
| 3,300 | 1 | Bally Technologies, Inc. | 144,243 |
| 35,000 | | Carnival Corp. | 1,164,800 |
| 2,240 | 1 | Coinstar, Inc. | 106,378 |
| 3,900 | | Royal Caribbean Cruises, Ltd. | 97,422 |
| | TOTAL | 1,512,843 |
| | Diversified Oil—0.5% | |
| 11,700 | | Murphy Oil Corp. | 627,822 |
| | Drug Store—0.8% | |
| 26,600 | | Walgreen Co. | 967,176 |
| | Education & Training Services—0.3% | |
| 8,100 | 1 | Apollo Group, Inc., Class A | 220,320 |
| 1,241 | 1 | Bridgepoint Education, Inc. | 11,293 |
| 590 | 1 | Capella Education Co. | 15,647 |
| 1,500 | | DeVry, Inc. | 29,445 |
| 818 | 1 | Grand Canyon Education, Inc. | 13,611 |
| 1,352 | 1 | ITT Educational Services, Inc. | 52,485 |
| 415 | | Strayer Education, Inc. | 30,154 |
| | TOTAL | 372,955 |
| | Electrical Equipment—0.1% | |
| 1,591 | | Belden, Inc. | 51,119 |
| 530 | 1 | Rofin-Sinar Technologies, Inc. | 9,609 |
| 900 | | Smith (A.O.) Corp. | 44,478 |
| 1,400 | 1 | WESCO International, Inc. | 77,994 |
| | TOTAL | 183,200 |
| | Electronic Instruments—0.2% | |
| 818 | 1 | IRobot Corp. | 18,618 |
| 4,400 | 1 | Trimble Navigation Ltd. | 194,744 |
| | TOTAL | 213,362 |
| | Electronic Test/Measuring Equipment—0.1% | |
| 1,400 | 1 | Itron, Inc. | 54,558 |
| 542 | | MTS Systems Corp. | 23,561 |
| | TOTAL | 78,119 |
| | Ethical Drugs—1.7% | |
| 7,100 | 1 | Forest Laboratories, Inc., Class A | 238,205 |
Annual Shareholder Report
Principal
Amount
or Shares | | | Value |
| | COMMON STOCKS—continued | |
| | Ethical Drugs—continued | |
| 43,800 | | Lilly (Eli) & Co. | $1,928,514 |
| | TOTAL | 2,166,719 |
| | Financial Services—1.9% | |
| 6,900 | | Ameriprise Financial, Inc. | 356,868 |
| 1,377 | | Deluxe Corp. | 38,997 |
| 590 | 1 | Encore Capital Group, Inc. | 16,520 |
| 24,700 | | SLM Holding Corp. | 394,953 |
| 12,600 | | Visa, Inc., Class A | 1,626,282 |
| | TOTAL | 2,433,620 |
| | Food Wholesaling—0.5% | |
| 21,700 | | Sysco Corp. | 637,763 |
| | Furniture—0.0% | |
| 1,068 | 1 | Select Comfort Corp. | 27,779 |
| | Gas Distributor—0.0% | |
| 1,300 | | Southwest Gas Corp. | 58,058 |
| | Generic Drug—0.1% | |
| 3,137 | | Medicis Pharmaceutical Corp., Class A | 103,270 |
| | Grocery Chain—0.7% | |
| 1,467 | | Casey's General Stores, Inc. | 87,184 |
| 1,906 | | Harris Teeter Supermarkets, Inc. | 78,794 |
| 20,000 | | Kroger Co. | 443,400 |
| 10,600 | | Safeway, Inc. | 164,830 |
| 1,000 | 1 | The Fresh Market, Inc. | 58,890 |
| | TOTAL | 833,098 |
| | Health Care Equipment & Supplies—0.1% | |
| 1,500 | | Hill-Rom Holdings, Inc. | 39,225 |
| 1,600 | | St. Jude Medical, Inc. | 59,776 |
| | TOTAL | 99,001 |
| | Home Building—0.1% | |
| 4,700 | | D. R. Horton, Inc. | 82,861 |
| | Home Health Care—0.0% | |
| 827 | 1 | Wellcare Health Plans, Inc. | 53,606 |
| | Home Products—0.5% | |
| 3,100 | | Energizer Holdings, Inc. | 241,087 |
| 1,800 | | Jarden Corp. | 81,360 |
| 3,800 | | Newell Rubbermaid, Inc. | 67,070 |
| 1,155 | 1 | Spectrum Brands Holdings, Inc. | 42,539 |
Annual Shareholder Report
Principal
Amount
or Shares | | | Value |
| | COMMON STOCKS—continued | |
| | Home Products—continued | |
| 4,253 | | Tupperware Brands Corp. | $222,942 |
| | TOTAL | 654,998 |
| | Hotels—1.0% | |
| 16,300 | | Marriott International, Inc., Class A | 593,646 |
| 12,900 | | Wyndham Worldwide Corp. | 671,445 |
| | TOTAL | 1,265,091 |
| | Hotels and Motels—0.0% | |
| 658 | | Ameristar Casinos, Inc. | 11,100 |
| 562 | | Six Flags Entertainment Corp. | 32,377 |
| | TOTAL | 43,477 |
| | Household Appliances—0.3% | |
| 1,300 | 1 | Middleby Corp. | 127,296 |
| 4,300 | | Whirlpool Corp. | 290,508 |
| | TOTAL | 417,804 |
| | Household Durable—0.4% | |
| 6,900 | | Stanley Black & Decker, Inc. | 461,541 |
| | Industrial Machinery—0.1% | |
| 1,255 | | Actuant Corp. | 35,717 |
| 519 | | Tennant Co. | 21,627 |
| 674 | | Watts Industries, Inc., Class A | 22,673 |
| | TOTAL | 80,017 |
| | Insurance Brokerage—0.2% | |
| 3,100 | | Aspen Insurance Holdings Ltd. | 89,094 |
| 300 | 1 | Markel Corp. | 129,618 |
| | TOTAL | 218,712 |
| | Integrated Domestic Oil—2.1% | |
| 38,800 | | ConocoPhillips | 2,112,272 |
| 2,300 | | Hess Corp. | 108,468 |
| 18,000 | | Marathon Oil Corp. | 476,460 |
| | TOTAL | 2,697,200 |
| | Integrated International Oil—0.4% | |
| 4,900 | | Chevron Corp. | 536,942 |
| | Internet Service—0.0% | |
| 712 | 1 | Travelzoo, Inc. | 15,386 |
| | Life Insurance—0.9% | |
| 12,100 | | Protective Life Corp. | 337,711 |
| 15,000 | | Prudential Financial | 724,200 |
Annual Shareholder Report
Principal
Amount
or Shares | | | Value |
| | COMMON STOCKS—continued | |
| | Life Insurance—continued | |
| 3,900 | | Symetra Financial Corp | $45,357 |
| | TOTAL | 1,107,268 |
| | Lumber Product—0.1% | |
| 13,000 | 1 | Louisiana-Pacific Corp. | 134,160 |
| | Machined Parts Original Equipment Manufacturers—0.1% | |
| 1,525 | | Applied Industrial Technologies, Inc. | 56,669 |
| 300 | | Titan International, Inc. | 6,201 |
| | TOTAL | 62,870 |
| | Mail Order—0.1% | |
| 3,530 | | HSN, Inc. | 149,531 |
| | Maritime—0.1% | |
| 4,500 | | Ship Finance International Ltd. | 65,160 |
| 161 | | TAL International Group, Inc. | 5,498 |
| | TOTAL | 70,658 |
| | Meat Packing—0.4% | |
| 24,600 | 1 | Smithfield Foods, Inc. | 455,100 |
| | Medical Supplies—0.2% | |
| 3,369 | 1 | Align Technology, Inc. | 114,411 |
| 800 | 1 | CareFusion Corporation | 19,528 |
| 329 | 1 | Orthofix International NV | 13,493 |
| 2,653 | | Owens & Minor, Inc. | 74,841 |
| 2,108 | | Steris Corp. | 63,514 |
| | TOTAL | 285,787 |
| | Medical Technology—0.1% | |
| 716 | 1 | Arthrocare Corporation | 21,179 |
| 976 | 1 | Integra Lifesciences Corp. | 37,537 |
| 1,005 | 1 | MedAssets, Inc. | 13,256 |
| | TOTAL | 71,972 |
| | Metal Fabrication—0.2% | |
| 1,158 | | Barnes Group, Inc. | 27,630 |
| 2,000 | | Reliance Steel & Aluminum Co. | 102,960 |
| 1,300 | | Timken Co. | 47,060 |
| 3,502 | | Worthington Industries, Inc. | 75,993 |
| | TOTAL | 253,643 |
| | Miscellaneous Communications—0.1% | |
| 600 | 1 | Equinix, Inc. | 106,908 |
Annual Shareholder Report
Principal
Amount
or Shares | | | Value |
| | COMMON STOCKS—continued | |
| | Miscellaneous Communications—continued | |
| 1,728 | 1 | Leap Wireless International, Inc. | $9,815 |
| | TOTAL | 116,723 |
| | Miscellaneous Components—0.3% | |
| 11,200 | 1 | Fairchild Semiconductor International, Inc., Class A | 155,232 |
| 1,195 | 1 | TriMas Corp. | 25,979 |
| 22,000 | 1 | Vishay Intertechnology, Inc. | 217,140 |
| | TOTAL | 398,351 |
| | Miscellaneous Food Products—0.1% | |
| 3,700 | | Fresh Del Monte Produce, Inc. | 90,650 |
| | Miscellaneous Machinery—0.2% | |
| 4,800 | | Nordson Corp. | 246,048 |
| | Miscellaneous Metals—0.0% | |
| 701 | | AMCOL International Corp. | 21,521 |
| 662 | | Matthews International Corp., Class A | 19,198 |
| | TOTAL | 40,719 |
| | Money Center Bank—2.2% | |
| 65,700 | | JPMorgan Chase & Co. | 2,365,200 |
| 1,100 | | Northern Trust Corp. | 49,940 |
| 10,800 | | State Street Corp. | 436,104 |
| | TOTAL | 2,851,244 |
| | Mortgage and Title—0.0% | |
| 1,800 | | Fidelity National Financial, Inc., Class A | 33,516 |
| | Multi-Industry Basic—0.0% | |
| 494 | | Olin Corp. | 9,999 |
| | Multi-Industry Capital Goods—0.3% | |
| 1,991 | | Acuity Brands, Inc. Holding Company | 115,358 |
| 10,500 | | Textron, Inc. | 273,525 |
| | TOTAL | 388,883 |
| | Multi-Industry Transportation—0.0% | |
| 1,658 | | Brinks Co. (The) | 38,466 |
| 256 | 1 | Hub Group, Inc. | 7,616 |
| | TOTAL | 46,082 |
| | Multi-Line Insurance—2.1% | |
| 34,800 | | Allstate Corp. | 1,193,640 |
| 36,300 | 1 | American International Group, Inc. | 1,135,101 |
| 3,800 | | CNA Financial Corp. | 99,218 |
| 6,800 | | Montpelier Re Holdings Ltd. | 137,768 |
Annual Shareholder Report
Principal
Amount
or Shares | | | Value |
| | COMMON STOCKS—continued | |
| | Multi-Line Insurance—continued | |
| 100 | | White Mountains Insurance Group, Inc. | $51,059 |
| | TOTAL | 2,616,786 |
| | Newspaper Publishing—0.0% | |
| 100 | | Washington Post Co., Class B | 33,850 |
| | Office Equipment—0.0% | |
| 3,800 | | Pitney Bowes, Inc. | 50,768 |
| | Office Furniture—0.1% | |
| 1,160 | | HNI Corp. | 30,821 |
| 2,319 | | Knoll, Inc. | 31,747 |
| 1,316 | | Miller Herman, Inc. | 24,083 |
| | TOTAL | 86,651 |
| | Office Supplies—0.1% | |
| 2,800 | | Avery Dennison Corp. | 86,212 |
| 1,274 | | United Stationers, Inc. | 32,117 |
| | TOTAL | 118,329 |
| | Oil Refiner—0.6% | |
| 5,700 | | Marathon Petroleum Corp. | 269,610 |
| 6,300 | 1 | Tesoro Petroleum Corp. | 174,195 |
| 10,700 | | Valero Energy Corp. | 294,250 |
| 3,219 | | Western Refining, Inc. | 75,743 |
| | TOTAL | 813,798 |
| | Oil Service, Explore & Drill—0.1% | |
| 1,702 | 1 | C&J Energy Services, Inc. | 31,964 |
| 2,700 | 1 | Helix Energy Solutions Group, Inc. | 48,276 |
| | TOTAL | 80,240 |
| | Other Communications Equipment—0.1% | |
| 1,300 | | Harris Corp. | 54,145 |
| 549 | 1 | Netgear, Inc. | 19,012 |
| | TOTAL | 73,157 |
| | Packaged Food—0.1% | |
| 1,919 | 1 | United Natural Foods, Inc. | 104,202 |
| | Paper Product—0.0% | |
| 5,800 | 1 | Boise, Inc. | 42,920 |
| | Personal & Household—0.2% | |
| 4,193 | | Nu Skin Enterprises, Inc. | 213,885 |
Annual Shareholder Report
Principal
Amount
or Shares | | | Value |
| | COMMON STOCKS—continued | |
| | Personal Loans—1.8% | |
| 39,200 | | Capital One Financial Corp. | $2,214,408 |
| 507 | | Cash America International, Inc. | 19,428 |
| 611 | 1 | Ezcorp, Inc., Class A | 13,748 |
| | TOTAL | 2,247,584 |
| | Personnel Agency—0.2% | |
| 3,500 | | Manpower, Inc. | 124,530 |
| 2,100 | | Robert Half International, Inc. | 56,721 |
| 697 | 1 | TrueBlue, Inc. | 10,608 |
| | TOTAL | 191,859 |
| | Photo-Optical Component-Equipment—0.0% | |
| 365 | 1 | Coherent, Inc. | 17,823 |
| | Plastic—0.0% | |
| 1,857 | | Polyone Corp. | 27,354 |
| | Printed Circuit Boards—0.1% | |
| 2,400 | 1 | Benchmark Electronics, Inc. | 37,824 |
| 7,000 | 1 | Sanmina-SCI Corporation | 59,780 |
| | TOTAL | 97,604 |
| | Printing—0.1% | |
| 366 | 1 | Consolidated Graphics, Inc. | 8,678 |
| 3,500 | | Donnelley (R.R.) & Sons Co. | 42,420 |
| 1,834 | 1 | Valassis Communications, Inc. | 41,356 |
| | TOTAL | 92,454 |
| | Professional Services—0.0% | |
| 934 | | Hillenbrand, Inc. | 16,149 |
| 376 | | Insperity, Inc. | 9,866 |
| | TOTAL | 26,015 |
| | Property Liability Insurance—2.1% | |
| 2,300 | | Everest Re Group Ltd. | 233,910 |
| 4,200 | | ProAssurance Corp. | 376,194 |
| 1,800 | | RenaissanceRe Holdings Ltd. | 133,182 |
| 31,200 | | The Travelers Cos, Inc. | 1,954,680 |
| | TOTAL | 2,697,966 |
| | Real Estate Investment Trusts—6.8% | |
| 6,000 | | American Campus Communities, Inc. | 285,960 |
| 12,000 | | American Capital Agency Corp. | 421,680 |
| 30,000 | | Annaly Capital Management, Inc. | 522,900 |
| 2,000 | | Boston Properties, Inc. | 221,800 |
Annual Shareholder Report
Principal
Amount
or Shares | | | Value |
| | COMMON STOCKS—continued | |
| | Real Estate Investment Trusts—continued | |
| 48,000 | | CYS Investments, Inc. | $694,080 |
| 5,300 | | Digital Realty Trust, Inc. | 413,771 |
| 47,000 | | Hatteras Financial Corp. | 1,374,750 |
| 9,000 | | Home Properties, Inc. | 590,490 |
| 11,000 | | LaSalle Hotel Properties | 288,860 |
| 65,000 | | MFA Mortgage Investments, Inc. | 525,200 |
| 19,000 | | Pebblebrook Hotel Trust | 431,680 |
| 17,500 | | Plum Creek Timber Co., Inc. | 710,325 |
| 10,000 | | Post Properties, Inc. | 516,500 |
| 1,300 | | Public Storage | 193,635 |
| 1,591 | | Simon Property Group, Inc. | 255,340 |
| 49,000 | 1 | Sunstone Hotel Investors, Inc. | 490,490 |
| 3,300 | | Taubman Centers, Inc. | 255,816 |
| 16,000 | | UDR, Inc. | 425,760 |
| | TOTAL | 8,619,037 |
| | Recreational Goods—0.0% | |
| 618 | | Sturm Ruger & Co., Inc. | 30,548 |
| | Recreational Vehicle—0.0% | |
| 2,712 | | Brunswick Corp. | 59,637 |
| | Regional Banks—2.8% | |
| 10,400 | | BB&T Corp. | 326,248 |
| 1,000 | | City National Corp. | 49,280 |
| 5,200 | | Comerica, Inc. | 157,092 |
| 1,100 | | Commerce Bancshares, Inc. | 43,318 |
| 7,200 | | Fifth Third Bancorp | 99,504 |
| 13,300 | | Huntington Bancshares, Inc. | 82,659 |
| 21,000 | | KeyCorp | 167,580 |
| 10,500 | | SunTrust Banks, Inc. | 248,325 |
| 837 | 1 | SVB Financial Group | 48,387 |
| 68,100 | | Wells Fargo & Co. | 2,302,461 |
| 2,400 | | Zions Bancorp | 43,680 |
| | TOTAL | 3,568,534 |
| | Rental & Leasing Service—0.1% | |
| 2,300 | | Rent-A-Center, Inc. | 81,788 |
| | Restaurants—0.2% | |
| 572 | | CEC Entertainment, Inc. | 19,711 |
| 944 | | Cracker Barrel Old Country Store, Inc. | 59,151 |
Annual Shareholder Report
Principal
Amount
or Shares | | | Value |
| | COMMON STOCKS—continued | |
| | Restaurants—continued | |
| 792 | 1 | DineEquity, Inc. | $42,214 |
| 900 | 1 | Panera Bread Co. | 141,741 |
| 439 | 1 | Red Robin Gourmet Burgers | 13,104 |
| | TOTAL | 275,921 |
| | Roofing & Wallboard—0.0% | |
| 960 | 1 | Beacon Roofing Supply, Inc. | 25,449 |
| 986 | 1 | U.S.G. Corp. | 16,013 |
| | TOTAL | 41,462 |
| | Rubber—0.0% | |
| 1,480 | | Cooper Tire & Rubber Co. | 25,856 |
| | Semiconductor Distribution—0.4% | |
| 16,800 | 1 | Arrow Electronics, Inc. | 567,000 |
| | Semiconductor Manufacturing—0.1% | |
| 1,115 | 1 | Cirrus Logic, Inc. | 40,998 |
| 4,933 | 1 | Omnivision Technologies, Inc. | 69,161 |
| | TOTAL | 110,159 |
| | Semiconductor Manufacturing Equipment—0.1% | |
| 1,691 | | Brooks Automation, Inc. | 15,659 |
| 1,150 | 1 | Mentor Graphics Corp. | 17,572 |
| 2,045 | 1 | Veeco Instruments, Inc. | 73,027 |
| | TOTAL | 106,258 |
| | Services to Medical Professionals—2.4% | |
| 10,100 | | Aetna, Inc. | 364,206 |
| 2,116 | 1 | Centene Corp. | 80,492 |
| 3,000 | | Coventry Health Care, Inc. | 99,990 |
| 2,200 | 1 | Henry Schein, Inc. | 164,582 |
| 1,100 | | Humana, Inc. | 67,760 |
| 1,985 | 1 | Molina Healthcare, Inc. | 48,454 |
| 2,000 | | Omnicare, Inc. | 62,820 |
| 1,894 | 1 | PSS World Medical, Inc. | 39,566 |
| 1,184 | 1 | Team Health Holdings, Inc. | 31,613 |
| 27,100 | | UnitedHealth Group, Inc. | 1,384,539 |
| 13,200 | | Wellpoint, Inc. | 703,428 |
| | TOTAL | 3,047,450 |
| | Shoes—0.1% | |
| 4,129 | 1 | CROCs, Inc. | 63,380 |
Annual Shareholder Report
Principal
Amount
or Shares | | | Value |
| | COMMON STOCKS—continued | |
| | Shoes—continued | |
| 397 | 1 | Genesco, Inc. | $26,289 |
| | TOTAL | 89,669 |
| | Silver Production—0.0% | |
| 1,856 | 1 | Coeur d'Alene Mines Corp. | 30,271 |
| | Soft Drinks—0.6% | |
| 10,400 | | Coca-Cola Enterprises, Inc. | 304,928 |
| 9,700 | | Dr. Pepper Snapple Group, Inc. | 442,126 |
| | TOTAL | 747,054 |
| | Software Packaged/Custom—0.6% | |
| 4,200 | | CA, Inc. | 101,094 |
| 5,400 | | Computer Sciences Corp. | 132,948 |
| 4,500 | 1 | Electronic Arts, Inc. | 49,590 |
| 513 | 1 | MicroStrategy, Inc., Class A | 59,744 |
| 3,711 | 1 | Parametric Technology Corp. | 79,935 |
| 1,820 | 1 | Progress Software Corp. | 35,381 |
| 16,000 | 1 | Symantec Corp. | 252,000 |
| 756 | 1 | Verint Systems, Inc. | 21,100 |
| 1,894 | 1 | Websense, Inc. | 28,429 |
| | TOTAL | 760,221 |
| | Specialty Chemicals—0.8% | |
| 4,200 | | Airgas, Inc. | 333,144 |
| 8,500 | | Cabot Corp. | 331,500 |
| 415 | | Chemed Corp. | 26,050 |
| 1,745 | 1 | Chemtura Corp. | 23,592 |
| 1,050 | 1 | Kraton Performance Polymers, Inc. | 24,591 |
| 1,385 | 1 | LSB Industries, Inc. | 44,500 |
| 171 | | Quaker Chemical Corp. | 7,570 |
| 5,861 | | Rockwood Holdings, Inc. | 259,173 |
| 255 | 1 | TPC Group, Inc. | 9,818 |
| | TOTAL | 1,059,938 |
| | Specialty Retailing—3.6% | |
| 5,200 | | Abercrombie & Fitch Co., Class A | 175,760 |
| 3,500 | | Advance Auto Parts, Inc. | 245,525 |
| 8,684 | 1 | Ascena Retail Group, Inc. | 159,265 |
| 4,700 | 1 | AutoNation, Inc. | 185,321 |
| 2,400 | 1 | Big Lots, Inc. | 97,224 |
| 32,900 | | CVS Corp. | 1,488,725 |
Annual Shareholder Report
Principal
Amount
or Shares | | | Value |
| | COMMON STOCKS—continued | |
| | Specialty Retailing—continued | |
| 450 | 1 | Cabela's, Inc., Class A | $20,673 |
| 4,950 | | Expedia, Inc. | 282,100 |
| 1,208 | | Finish Line, Inc., Class A | 25,223 |
| 3,700 | | Foot Locker, Inc. | 122,174 |
| 379 | 1 | Francesca's Holdings Corp. | 11,904 |
| 9,823 | | GNC Acquisition Holdings, Inc. | 378,480 |
| 471 | 1 | Hibbett Sports, Inc. | 28,623 |
| 804 | 1 | Lumber Liquidators Holdings, Inc. | 34,001 |
| 2,400 | 1 | Mattress Firm Holding Corp. | 69,984 |
| 6,900 | | Nordstrom, Inc. | 373,566 |
| 2,442 | | Penske Automotive Group, Inc. | 58,364 |
| 2,800 | | Signet Jewelers Ltd. | 122,976 |
| 13,300 | | Staples, Inc. | 169,442 |
| 2,338 | | Tractor Supply Co. | 212,454 |
| 738 | 1 | Vera Bradley, Inc. | 16,819 |
| 2,213 | 1 | Vitamin Shoppe Industries, Inc. | 121,538 |
| 4,200 | | Williams-Sonoma, Inc. | 145,950 |
| | TOTAL | 4,546,091 |
| | Surveillance-Detection—0.0% | |
| 749 | | Mine Safety Appliances Co. | 25,706 |
| | Telecommunication Equipment & Services—0.2% | |
| 2,567 | 1 | Anixter International, Inc. | 146,088 |
| 2,678 | 1 | CIENA Corp. | 42,928 |
| 3,500 | 1 | TW Telecom, Inc. | 87,955 |
| | TOTAL | 276,971 |
| | Textiles Apparel & Luxury Goods—0.0% | |
| 1,211 | 1 | Fifth & Pacific Co., Inc. | 13,418 |
| | Tools and Hardware—0.1% | |
| 1,800 | | Snap-On, Inc. | 122,004 |
| | Toys & Games—0.2% | |
| 6,900 | | Hasbro, Inc. | 247,158 |
| | Truck Manufacturing—0.1% | |
| 2,600 | 1 | Navistar International Corp. | 63,960 |
| | Uniforms—0.2% | |
| 5,200 | | Cintas Corp. | 206,076 |
| | TOTAL COMMON STOCKS
(IDENTIFIED COST $74,676,493) | 78,128,439 |
Annual Shareholder Report
Principal
Amount
or Shares | | | Value |
| | Asset-Backed Securities—0.6% | |
| $29,591 | | CS First Boston Mortgage Securities Corp. 2002-HE4, AF, 5.510%, 8/25/2032 | $27,551 |
| 400,000 | | GE Dealer Floorplan Master Note Trust 2012-3 A, 0.735%, 6/20/2017 | 400,000 |
| 100,000 | | Merrill Lynch Mortgage Trust 2008-C1 AM, 6.262%, 2/12/2051 | 107,685 |
| 250,000 | | Merrill Lynch/Countrywide Commercial Mortgage 2007-6, 5.485%, 3/12/2051 | 277,000 |
| | TOTAL ASSET-BACKED SECURITIES
(IDENTIFIED COST $780,418) | 812,236 |
| | Collateralized Mortgage Obligations—0.7% | |
| 1,751 | | Bear Stearns Mortgage Securities, Inc. 1997-6 1A, 7.098%, 3/25/2031 | 1,793 |
| 70,000 | | Commercial Mortgage Pass-Through Certificates 2012-CR1 AM, 3.912%, 5/15/2045 | 70,609 |
| 125,000 | | Commercial Mortgage Pass-Through Certificates 2012-CR1 B, 4.612%, 5/15/2045 | 128,104 |
| 75,000 | | Commercial Mortgage Pass-Through Certificates 2012-LC4 B, 4.934%, 12/10/2044 | 79,239 |
| 5,720 | | Federal Home Loan Mortgage Corp. REMIC 1311 K, 7.000%, 7/15/2022 | 6,382 |
| 11,140 | | Federal Home Loan Mortgage Corp. REMIC 1384 D, 7.000%, 9/15/2022 | 12,756 |
| 2,356 | | Federal Home Loan Mortgage Corp. REMIC 1595 D, 7.000%, 10/15/2013 | 2,409 |
| 24,817 | | Federal Home Loan Mortgage Corp. REMIC 2497 JH, 6.000%, 9/15/2032 | 27,800 |
| 26,701 | | Federal National Mortgage Association REMIC 1993-113 SB, 9.748%, 7/25/2023 | 31,714 |
| 2,242 | | Federal National Mortgage Association REMIC 2001-37 GA, 8.000%, 7/25/2016 | 2,404 |
| 5,871 | | Federal National Mortgage Association REMIC 2003-35 UC, 3.750%, 5/25/2033 | 6,197 |
| 100,000 | | GS Mortgage Securities Corp. II 2012-GCJ7 AS, 4.085%, 5/10/2045 | 104,453 |
| 135,000 | | GS Mortgage Securities Corp. II 2012-GCJ7 BB, 4.740%, 5/10/2045 | 141,458 |
| 19,255 | | Government National Mortgage Association REMIC 2002-17 B, 6.000%, 3/20/2032 | 21,581 |
| 50,000 | | Morgan Stanley Capital I 2007-IQ16 AM, 6.110%, 12/12/2049 | 53,733 |
| 100,000 | | Morgan Stanley Capital I 2012-C4 AS, 3.773%, 3/15/2045 | 101,914 |
| 105,000 | | UBS-Citigroup Commercial Mortgage Trust 2011-C1 A3, 3.595%, 1/10/2045 | 114,625 |
| 25,000 | | WF-RBS Commercial Mortgage Trust 2012-C6 B, 4.697%, 4/15/2045 | 26,218 |
| | TOTAL COLLATERALIZED MORTGAGE OBLIGATIONS
(IDENTIFIED COST $903,125) | 933,389 |
Annual Shareholder Report
Principal
Amount
or Shares | | | Value |
| | Corporate Bonds—13.9% | |
| | Basic Industry - Chemicals—0.4% | |
| $100,000 | | Albemarle Corp., Sr. Note, 5.100%, 02/01/2015 | $108,949 |
| 70,000 | | Dow Chemical Co., Note, 8.550%, 05/15/2019 | 95,269 |
| 2,000 | | Du Pont (E.I.) de Nemours & Co., 5.000%, 01/15/2013 | 2,041 |
| 30,000 | | Du Pont (E.I.) de Nemours & Co., 6.000%, 07/15/2018 | 37,899 |
| 20,000 | | FMC Corp., Sr. Unsecd. Note, 3.950%, 02/01/2022 | 21,356 |
| 20,000 | 2,3 | Incitec Pivot Finance LLC, Company Guarantee, Series 144A, 4.000%, 12/07/2015 | 20,718 |
| 35,000 | 2,3 | Incitec Pivot Finance LLC, Company Guarantee, Series 144A, 6.000%, 12/10/2019 | 39,063 |
| 70,000 | | RPM International, Inc., 6.500%, 02/15/2018 | 81,374 |
| 20,000 | | RPM International, Inc., Sr. Unsecd. Note, 6.125%, 10/15/2019 | 23,218 |
| 75,000 | | Rohm & Haas Co., 6.000%, 09/15/2017 | 88,297 |
| 30,000 | | Sherwin-Williams Co., 3.125%, 12/15/2014 | 31,672 |
| | TOTAL | 549,856 |
| | Basic Industry - Metals & Mining—0.6% | |
| 50,000 | | Alcan, Inc., 5.000%, 06/01/2015 | 55,540 |
| 85,000 | | Alcoa, Inc., Note, 5.550%, 02/01/2017 | 93,952 |
| 80,000 | | Allegheny Technologies, Inc., Sr. Note, 9.375%, 06/01/2019 | 104,064 |
| 15,000 | | Anglogold Ashanti Holdings PLC, Sr. Note, 6.500%, 04/15/2040 | 15,371 |
| 10,000 | | Anglogold Ashanti Holdings PLC, Sr. Unsecd. Note, 5.125%, 08/01/2022 | 10,295 |
| 10,000 | | ArcelorMittal, 6.125%, 06/01/2018 | 10,353 |
| 75,000 | | ArcelorMittal, Sr. Unsecd. Note, 4.500%, 02/25/2017 | 74,340 |
| 50,000 | | ArcelorMittal, Sr. Unsecd. Note, 5.375%, 06/01/2013 | 51,409 |
| 40,000 | | Carpenter Technology Corp., Sr. Unsecd. Note, 5.200%, 07/15/2021 | 42,588 |
| 50,000 | | Newmont Mining Corp., Company Guarantee, 5.875%, 04/01/2035 | 55,823 |
| 85,000 | | Rio Tinto Finance USA Ltd., Company Guarantee, 6.500%, 07/15/2018 | 106,265 |
| 20,000 | | Southern Copper Corp., Note, 6.750%, 04/16/2040 | 23,341 |
| 60,000 | | Worthington Industries, Inc., Sr. Unsecd. Note, 6.500%, 04/15/2020 | 67,480 |
| | TOTAL | 710,821 |
| | Basic Industry - Paper—0.1% | |
| 20,000 | | Plum Creek Timberlands LP, Sr. Unsecd. Note, 4.700%, 03/15/2021 | 21,159 |
| 50,000 | | Weyerhaeuser Co., Sr. Unsecd. Note, 7.375%, 03/15/2032 | 58,960 |
| | TOTAL | 80,119 |
| | Capital Goods - Aerospace & Defense—0.1% | |
| 50,000 | 2,3 | BAE Systems Holdings, Inc., Series 144A, 5.200%, 08/15/2015 | 54,616 |
| 40,000 | | Goodrich Corp., Sr. Unsecd. Note, 3.600%, 02/01/2021 | 44,314 |
| 20,000 | | Raytheon Co., Sr. Note, 4.400%, 02/15/2020 | 23,069 |
Annual Shareholder Report
Principal
Amount
or Shares | | | Value |
| | Corporate Bonds—continued | |
| | Capital Goods - Aerospace & Defense—continued | |
| $10,000 | | Rockwell Collins, Inc., Sr. Unsecd. Note, 3.100%, 11/15/2021 | $10,623 |
| | TOTAL | 132,622 |
| | Capital Goods - Building Materials—0.1% | |
| 20,000 | | Masco Corp., Sr. Unsecd. Note, 5.950%, 03/15/2022 | 20,967 |
| 40,000 | | Valmont Industries, Inc., Sr. Unsecd. Note, 6.625%, 04/20/2020 | 47,991 |
| | TOTAL | 68,958 |
| | Capital Goods - Construction Machinery—0.0% | |
| 40,000 | | AGCO Corp., Sr. Unsecd. Note, 5.875%, 12/01/2021 | 43,246 |
| | Capital Goods - Diversified Manufacturing—0.5% | |
| 15,000 | | ABB Finance USA, Inc., Sr. Unsecd. Note, 2.875%, 05/08/2022 | 15,668 |
| 15,000 | | Avery Dennison Corp., Sr. Unsecd. Note, 5.375%, 04/15/2020 | 16,189 |
| 60,000 | | Dover Corp., Note, 5.450%, 03/15/2018 | 71,380 |
| 30,000 | | Emerson Electric Co., 4.875%, 10/15/2019 | 36,203 |
| 160,000 | | Harsco Corp., 5.750%, 05/15/2018 | 179,438 |
| 80,000 | | Hubbell, Inc., 5.950%, 06/01/2018 | 96,244 |
| 60,000 | | Ingersoll-Rand Global Holding Co. Ltd., 6.875%, 08/15/2018 | 74,214 |
| 50,000 | | Pentair, Inc., Company Guarantee, 5.000%, 05/15/2021 | 56,429 |
| 90,000 | | Roper Industries, Inc., 6.625%, 08/15/2013 | 94,513 |
| 40,000 | 2,3 | Textron Financial Corp., Jr. Sub. Note, Series 144A, 6.000%, 02/15/2067 | 32,200 |
| 15,000 | | Thomas & Betts Corp., Sr. Unsecd. Note, 5.625%, 11/15/2021 | 18,276 |
| | TOTAL | 690,754 |
| | Capital Goods - Environmental—0.1% | |
| 85,000 | | Republic Services, Inc., Company Guarantee, Series WI, 5.500%, 09/15/2019 | 100,307 |
| 25,000 | | Waste Management, Inc., 7.375%, 03/11/2019 | 31,938 |
| | TOTAL | 132,245 |
| | Capital Goods - Packaging—0.1% | |
| 45,000 | | Packaging Corp. of America, Sr. Unsecd. Note, 3.900%, 06/15/2022 | 47,320 |
| 10,000 | 2,3 | Rock-Tenn Co., Sr. Unsecd. Note, Series 144A, 4.450%, 03/01/2019 | 10,582 |
| 30,000 | | Sonoco Products Co., Sr. Unsecd. Note, 5.750%, 11/01/2040 | 35,005 |
| | TOTAL | 92,907 |
| | Communications - Media & Cable—0.2% | |
| 20,000 | | Cox Communications, Inc., 7.125%, 10/01/ | 20,207 |
| 75,000 | | Cox Communications, Inc., Unsecd. Note, 5.450%, 12/15/2014 | 82,928 |
| 50,000 | | DIRECTV Holdings LLC, Company Guarantee, 6.375%, 03/01/2041 | 61,373 |
Annual Shareholder Report
Principal
Amount
or Shares | | | Value |
| | Corporate Bonds—continued | |
| | Communications - Media & Cable—continued | |
| $30,000 | | Time Warner Cable, Inc., Company Guarantee, 8.250%, 04/01/2019 | $39,998 |
| | TOTAL | 204,506 |
| | Communications - Media Noncable—0.3% | |
| 25,000 | | Discovery Communications LLC, Company Guarantee, 5.050%, 06/01/2020 | 29,194 |
| 50,000 | | Interpublic Group of Cos., Inc., Sr. Unsecd. Note, 4.000%, 03/15/2022 | 51,896 |
| 10,000 | | Interpublic Group of Cos., Inc., Sr. Unsecd. Note, 10.000%, 07/15/2017 | 11,300 |
| 25,000 | | Moody's Corp., Sr. Unsecd. Note, 5.500%, 09/01/2020 | 27,655 |
| 75,000 | | News America Holdings, Inc., Company Guarantee, 8.000%, 10/17/2016 | 93,522 |
| 20,000 | | Omnicom Group, Inc., Sr. Unsecd. Note, 3.625%, 05/01/2022 | 21,343 |
| 100,000 | 2,3 | Pearson Funding Two PLC, Sr. Unsecd. Note, Series 144A, 4.000%, 05/17/2016 | 106,823 |
| | TOTAL | 341,733 |
| | Communications - Telecom Wireless—0.3% | |
| 100,000 | | America Movil S.A.B. de C.V., Note, 5.750%, 01/15/2015 | 111,607 |
| 100,000 | 2,3 | Crown Castle Towers LLC, Sr. Secd. Note, Series 144A, 5.495%, 01/15/2017 | 111,814 |
| 30,000 | 2,3 | SBA Tower Trust, Series 144A, 5.101%, 04/17/2017 | 32,933 |
| 40,000 | | Telefonaktiebolaget LM Ericsson, Sr. Unsecd. Note, 4.125%, 05/15/2022 | 40,884 |
| 100,000 | | Vodafone Group PLC, Note, 5.625%, 02/27/2017 | 118,792 |
| | TOTAL | 416,030 |
| | Communications - Telecom Wirelines—0.1% | |
| 10,000 | | CenturyLink, Inc., Sr. Unsecd. Note, 7.650%, 03/15/2042 | 10,323 |
| 40,000 | | France Telecom SA, Sr. Unsecd. Note, 5.375%, 07/08/2019 | 46,499 |
| 30,000 | | Telefonica Emisiones Sau, Company Guarantee, 5.462%, 02/16/2021 | 27,070 |
| 60,000 | | Verizon Communications, Inc., Sr. Unsecd. Note, 6.350%, 04/01/2019 | 76,625 |
| | TOTAL | 160,517 |
| | Consumer Cyclical - Automotive—0.4% | |
| 100,000 | 2,3 | American Honda Finance Corp., Series 144A, 4.625%, 04/02/2013 | 102,772 |
| 70,000 | 2,3 | Daimler Finance NA LLC, Company Guarantee, Series 144A, 1.950%, 03/28/2014 | 70,921 |
| 75,000 | | DaimlerChrysler North America Holding Corp., 6.500%, 11/15/2013 | 80,482 |
| 10,000 | | DaimlerChrysler North America Holding Corp., Company Guarantee, 8.500%, 01/18/2031 | 15,943 |
| 20,000 | 2,3 | Harley-Davidson Financial Services, Inc., Company Guarantee, Series 144A, 3.875%, 03/15/2016 | 21,254 |
Annual Shareholder Report
Principal
Amount
or Shares | | | Value |
| | Corporate Bonds—continued | |
| | Consumer Cyclical - Automotive—continued | |
| $10,000 | 2,3 | Harley-Davidson Financial Services, Inc., Sr. Unsecd. Note, Series 144A, 2.700%, 03/15/2017 | $10,211 |
| 25,000 | | Johnson Controls, Inc., Sr. Unsecd. Note, 5.000%, 03/30/2020 | 28,524 |
| 80,000 | 2,3 | Nissan Motor Acceptance Corp., Note, Series 144A, 4.500%, 01/30/2015 | 85,715 |
| 20,000 | 2,3 | RCI Banque SA, Sr. Unsecd. Note, Series 144A, 4.600%, 04/12/2016 | 20,089 |
| 100,000 | 2,3 | Volkswagen International Finance NV, Company Guarantee, Series 144A, 2.375%, 03/22/2017 | 103,422 |
| | TOTAL | 539,333 |
| | Consumer Cyclical - Entertainment—0.4% | |
| 200,000 | 2 | Football Trust V, Pass Thru Cert., Series 144A, 5.350%, 10/05/2020 | 220,289 |
| 90,000 | | NBC Universal, Inc., Sr. Unsecd. Note, 5.150%, 04/30/2020 | 107,036 |
| 60,000 | | Time Warner, Inc., Company Guarantee, 6.200%, 03/15/2040 | 74,605 |
| 40,000 | | Time Warner, Inc., Company Guarantee, 6.250%, 03/29/2041 | 50,605 |
| 25,000 | | Viacom, Inc., Sr. Unsecd. Note, 2.500%, 12/15/2016 | 26,090 |
| 10,000 | | Viacom, Inc., Sr. Unsecd. Note, 3.500%, 04/01/2017 | 10,852 |
| | TOTAL | 489,477 |
| | Consumer Cyclical - Lodging—0.2% | |
| 50,000 | | Choice Hotels International, Inc., Company Guarantee, 5.700%, 08/28/2020 | 52,937 |
| 50,000 | | Marriott International, Inc., Sr. Unsecd. Note, 3.000%, 03/01/2019 | 51,305 |
| 180,000 | | Wyndham Worldwide Corp., Sr. Unsecd. Note, 4.250%, 03/01/2022 | 184,875 |
| | TOTAL | 289,117 |
| | Consumer Cyclical - Retailers—0.2% | |
| 15,000 | | Advance Auto Parts, Inc., Company Guarantee, 4.500%, 01/15/2022 | 16,134 |
| 70,000 | | Best Buy Co., Inc., Sr. Unsecd. Note, 6.750%, 07/15/2013 | 72,805 |
| 30,000 | | Home Depot, Inc., Sr. Unsecd. Note, 5.950%, 04/01/2041 | 42,205 |
| 10,000 | | O'Reilly Automotive, Inc., Company Guarantee, 4.875%, 01/14/2021 | 10,972 |
| 20,000 | | Wal-Mart Stores, Inc., Sr. Unsecd. Note, 5.625%, 04/15/2041 | 28,118 |
| 40,000 | | Wal-Mart Stores, Inc., Sr. Unsecd. Note, 6.200%, 04/15/2038 | 58,919 |
| | TOTAL | 229,153 |
| | Consumer Cyclical - Services—0.0% | |
| 15,000 | | Expedia, Inc., Company Guarantee, 5.950%, 08/15/2020 | 16,096 |
| 10,000 | | University of Southern California, Sr. Unsecd. Note, 5.250%, 10/01/2111 | 13,570 |
| | TOTAL | 29,666 |
| | Consumer Non-Cyclical - Food/Beverage—0.6% | |
| 100,000 | 2,3 | Bacardi Ltd., Sr. Note, Series 144A, 7.450%, 04/01/2014 | 110,225 |
Annual Shareholder Report
Principal
Amount
or Shares | | | Value |
| | Corporate Bonds—continued | |
| | Consumer Non-Cyclical - Food/Beverage—continued | |
| $100,000 | | Bottling Group LLC, Note, 5.500%, 04/01/2016 | $116,360 |
| 60,000 | | Diageo Capital PLC, Company Guarantee, 7.375%, 01/15/2014 | 65,884 |
| 30,000 | | Dr. Pepper Snapple Group, Inc., Company Guarantee, 2.350%, 12/21/2012 | 30,216 |
| 90,000 | | General Mills, Inc., Note, 5.700%, 02/15/2017 | 107,835 |
| 40,000 | | Kellogg Co., Sr. Unsub., 5.125%, 12/03/2012 | 40,629 |
| 90,000 | | Kraft Foods, Inc., Sr. Unsecd. Note, 6.125%, 02/01/2018 | 110,403 |
| 20,000 | | Ralcorp Holdings, Inc., Sr. Secd. Note, 6.625%, 08/15/2039 | 21,524 |
| 20,000 | | Sysco Corp., Sr. Note, 5.375%, 03/17/2019 | 24,622 |
| 50,000 | | Sysco Corp., Sr. Unsecd. Note, 4.200%, 02/12/2013 | 50,938 |
| 30,000 | | The Coca-Cola Co., Sr. Unsecd. Note, Series WI, 1.800%, 09/01/2016 | 31,243 |
| 50,000 | | Tyson Foods, Inc., Sr. Unsecd. Note, 4.500%, 06/15/2022 | 50,750 |
| | TOTAL | 760,629 |
| | Consumer Non-Cyclical - Health Care—0.4% | |
| 40,000 | | Baxter International, Inc., 6.250%, 12/01/2037 | 57,694 |
| 50,000 | | Boston Scientific Corp., 4.500%, 01/15/2015 | 53,551 |
| 75,000 | | Boston Scientific Corp., 6.000%, 01/15/2020 | 90,638 |
| 20,000 | | Express Scripts, Inc., Sr. Unsecd. Note, 7.250%, 06/15/2019 | 25,451 |
| 40,000 | | Life Technologies Corp., Sr. Note, 3.375%, 03/01/2013 | 40,463 |
| 90,000 | | Quest Diagnostics, Inc., Sr. Unsecd. Note, 6.400%, 07/01/2017 | 108,079 |
| 50,000 | | Thermo Fisher Scientific, Inc., Sr. Unsecd. Note, 2.150%, 12/28/2012 | 50,242 |
| 10,000 | | Zimmer Holdings, Inc., Sr. Note, 5.750%, 11/30/2039 | 12,659 |
| | TOTAL | 438,777 |
| | Consumer Non-Cyclical - Pharmaceuticals—0.1% | |
| 40,000 | | Bio-Rad Laboratories, Inc., Sr. Unsecd. Note, 4.875%, 12/15/2020 | 42,482 |
| 10,000 | | Dentsply International, Inc., Sr. Unsecd. Note, 2.750%, 08/15/2016 | 10,244 |
| 40,000 | | Gilead Sciences, Inc., Sr. Unsecd. Note, 4.500%, 04/01/2021 | 45,689 |
| 30,000 | | Pfizer, Inc., Sr. Unsecd. Note, 6.200%, 03/15/2019 | 38,738 |
| | TOTAL | 137,153 |
| | Consumer Non-Cyclical - Products—0.1% | |
| 10,000 | | Clorox Co., Sr. Unsecd. Note, 3.550%, 11/01/2015 | 10,658 |
| 80,000 | | Whirlpool Corp., Series MTN, 5.500%, 03/01/2013 | 81,944 |
| | TOTAL | 92,602 |
| | Consumer Non-Cyclical - Supermarkets—0.0% | |
| 40,000 | | Kroger Co., Bond, 6.900%, 04/15/2038 | 50,931 |
| | Consumer Non-Cyclical - Tobacco—0.1% | |
| 70,000 | | Altria Group, Inc., 9.250%, 08/06/2019 | 98,982 |
Annual Shareholder Report
Principal
Amount
or Shares | | | Value |
| | Corporate Bonds—continued | |
| | Consumer Non-Cyclical - Tobacco—continued | |
| $10,000 | | Lorillard Tobacco Co., Sr. Unsecd. Note, 7.000%, 08/04/2041 | $11,521 |
| 30,000 | | Philip Morris International, Inc., 5.650%, 05/16/2018 | 36,882 |
| | TOTAL | 147,385 |
| | Energy - Independent—0.4% | |
| 100,000 | | Apache Corp., Sr. Unsecd. Note, 5.100%, 09/01/2040 | 124,338 |
| 50,000 | | Canadian Natural Resources Ltd., 4.900%, 12/01/2014 | 54,725 |
| 30,000 | | EOG Resources, Inc., Note, 5.625%, 06/01/2019 | 36,691 |
| 50,000 | 2,3 | Petroleos Mexicanos, Company Guarantee, Series 144A, 6.500%, 06/02/2041 | 63,500 |
| 15,000 | | Petroleos Mexicanos, Company Guarantee, Series WI, 6.000%, 03/05/2020 | 18,075 |
| 10,000 | | Talisman Energy, Inc., Sr. Unsecd. Note, 3.750%, 02/01/2021 | 10,338 |
| 10,000 | | Talisman Energy, Inc., Sr. Unsecd. Note, 5.500%, 05/15/2042 | 11,173 |
| 75,000 | | XTO Energy, Inc., 6.375%, 06/15/2038 | 116,159 |
| 60,000 | | XTO Energy, Inc., 6.750%, 08/01/2037 | 97,046 |
| | TOTAL | 532,045 |
| | Energy - Integrated—0.4% | |
| 30,000 | | BP Capital Markets America, Inc., Company Guarantee, 4.200%, 06/15/2018 | 33,257 |
| 20,000 | | BP Capital Markets PLC, Company Guarantee, 3.125%, 10/01/2015 | 21,406 |
| 40,000 | | BP Capital Markets PLC, Company Guarantee, 4.742%, 03/11/2021 | 47,720 |
| 100,000 | | Hess Corp., Sr. Unsecd. Note, 5.600%, 02/15/2041 | 114,422 |
| 75,000 | | Husky Energy, Inc., Sr. Unsecd. Note, 3.950%, 04/15/2022 | 79,456 |
| 100,000 | | Husky Oil Ltd., Deb., 7.550%, 11/15/2016 | 119,148 |
| 30,000 | | Petrobras International Finance Co., Company Guarantee, 6.750%, 01/27/2041 | 37,894 |
| 20,000 | | Petrobras International Finance Co., Sr. Unsecd. Note, 2.875%, 02/06/2015 | 20,501 |
| 20,000 | 2,3 | Phillips 66, Sr. Unsecd. Note, Series 144A, 1.950%, 03/05/2015 | 20,348 |
| 50,000 | 2,3 | Phillips 66, Sr. Unsecd. Note, Series 144A, 4.300%, 04/01/2022 | 54,882 |
| | TOTAL | 549,034 |
| | Energy - Oil Field Services—0.1% | |
| 15,000 | | Nabors Industries, Inc., Company Guarantee, 5.000%, 09/15/2020 | 16,432 |
| 15,000 | | Nabors Industries, Inc., Company Guarantee, 9.250%, 01/15/2019 | 19,536 |
| 20,000 | | Nabors Industries, Inc., Sr. Unsecd. Note, 4.625%, 9/15/2021 | 21,498 |
| 15,000 | | Noble Holding International Ltd., Company Guarantee, 4.900%, 08/01/2020 | 16,696 |
| 10,000 | 2,3 | Schlumberger Investment SA, Company Guarantee, Series 144A, 1.950%, 09/14/2016 | 10,334 |
Annual Shareholder Report
Principal
Amount
or Shares | | | Value |
| | Corporate Bonds—continued | |
| | Energy - Oil Field Services—continued | |
| $80,000 | | Weatherford International Ltd., 6.000%, 03/15/2018 | $92,023 |
| | TOTAL | 176,519 |
| | Energy - Refining—0.2% | |
| 10,000 | | Marathon Petroleum Corp., Sr. Unsecd. Note, 6.500%, 03/01/2041 | 12,234 |
| 115,000 | | Valero Energy Corp., 7.500%, 04/15/2032 | 146,866 |
| 10,000 | | Valero Energy Corp., 9.375%, 03/15/2019 | 13,548 |
| 35,000 | | Valero Energy Corp., Note, 4.750%, 04/01/2014 | 36,951 |
| | TOTAL | 209,599 |
| | Financial Institution - Banking—2.1% | |
| 65,000 | | American Express Co., Sr. Unsecd. Note, 8.125%, 05/20/2019 | 88,593 |
| 50,000 | | American Express Credit Corp., Sr. Unsecd. Note, Series MTN, 2.800%, 09/19/2016 | 53,597 |
| 40,000 | | Associated Banc-Corp., Sr. Unsecd. Note, 5.125%, 03/28/2016 | 43,143 |
| 60,000 | | Bank of America Corp., Note, 4.500%, 04/01/2015 | 63,077 |
| 20,000 | | Bank of America Corp., Sr. Unsecd. Note, 5.000%, 05/13/2021 | 21,619 |
| 20,000 | | Bank of America Corp., Sr. Unsecd. Note, 5.875%, 01/05/2021 | 22,733 |
| 125,000 | 2,3 | Barclays Bank PLC, Series 144A, 5.926%, 09/29/2049 | 114,688 |
| 50,000 | | Capital One Financial Corp., Sr. Note, 7.375%, 05/23/2014 | 55,170 |
| 20,000 | | Citigroup, Inc., Sr. Unsecd. Note, 4.450%, 01/10/2017 | 21,397 |
| 100,000 | | Citigroup, Inc., Sr. Unsecd. Note, 4.587%, 12/15/2015 | 106,479 |
| 20,000 | | Citigroup, Inc., Sr. Unsecd. Note, 6.000%, 12/13/2013 | 21,062 |
| 155,000 | | Citigroup, Inc., Sr. Unsecd. Note, 6.875%, 03/05/2038 | 195,923 |
| 25,000 | | City National Corp., Note, 5.250%, 09/15/2020 | 27,145 |
| 40,000 | 2,3 | Commonwealth Bank of Australia, Sr. Unsecd. Note, Series 144A, 3.750%, 10/15/2014 | 42,094 |
| 130,000 | | Credit Suisse AG New York, Sr. Unsecd. Note, 5.500%, 05/01/2014 | 138,745 |
| 40,000 | | Deutsche Bank AG London, Sr. Unsecd. Note, Series 1, 3.250%, 01/11/2016 | 41,578 |
| 20,000 | | Fifth Third Bancorp, Sr. Unsecd. Note, 3.625%, 01/25/2016 | 21,353 |
| 25,000 | | Goldman Sachs Group, Inc., 6.125%, 02/15/2033 | 27,137 |
| 75,000 | | Goldman Sachs Group, Inc., Bond, 5.150%, 01/15/2014 | 78,322 |
| 50,000 | | Goldman Sachs Group, Inc., Series MTN, 6.000%, 05/01/2014 | 53,389 |
| 70,000 | | Goldman Sachs Group, Inc., Sr. Unsecd. Note, 5.125%, 01/15/2015 | 74,228 |
| 30,000 | | Goldman Sachs Group, Inc., Sr. Unsecd. Note, 6.150%, 04/01/2018 | 33,712 |
| 50,000 | | HSBC Holdings PLC, Sr. Unsecd. Note, 5.100%, 04/05/2021 | 57,629 |
| 150,000 | | HSBC USA, Inc., Sr. Unsecd. Note, 2.375%, 02/13/2015 | 153,450 |
| 10,000 | | Huntington Bancshares, Inc., Sub. Note, 7.000%, 12/15/2020 | 11,941 |
| 200,000 | | JP Morgan Chase & Co., Sr. Unsecd. Note, 4.500%, 01/24/2022 | 222,297 |
Annual Shareholder Report
Principal
Amount
or Shares | | | Value |
| | Corporate Bonds—continued | |
| | Financial Institution - Banking—continued | |
| $65,000 | | Morgan Stanley, Sr. Unsecd. Note, 4.750%, 03/22/2017 | $66,034 |
| 50,000 | | Morgan Stanley, Sr. Unsecd. Note, 6.375%, 07/24/2042 | 50,508 |
| 35,000 | | Morgan Stanley, Sr. Unsecd. Note, Series MTN, 5.950%, 12/28/2017 | 36,613 |
| 70,000 | | Morgan Stanley, Sr. Unsecd. Note, Series MTN, 6.000%, 04/28/2015 | 74,214 |
| 110,000 | | Morgan Stanley, Sr. Unsecd. Note, Series MTN, 6.625%, 4/01/2018 | 117,892 |
| 20,000 | | Murray Street Investment Trust I, Sr. Unsecd. Note, 4.647%, 03/09/2017 | 20,584 |
| 30,000 | | Northern Trust Corp., 4.625%, 05/01/2014 | 32,150 |
| 100,000 | | PNC Funding Corp., Sub. Note, 5.625%, 02/01/2017 | 113,590 |
| 100,000 | 2,3 | Santander US Debt SA Unipersonal, Bank Guarantee, Series 144A, 3.781%, 10/07/2015 | 91,962 |
| 20,000 | | SunTrust Banks, Inc., Sr. Unsecd. Note, 3.600%, 04/15/2016 | 20,941 |
| 30,000 | | Wachovia Corp., 5.750%, 02/01/2018 | 35,747 |
| 70,000 | | Westpac Banking Corp., Sr. Unsecd. Note, 4.875%, 11/19/2019 | 79,614 |
| 100,000 | | Wilmington Trust Corp., Sub. Note, 8.500%, 04/02/2018 | 121,376 |
| | TOTAL | 2,651,726 |
| | Financial Institution - Brokerage—0.5% | |
| 20,000 | 2,3 | CME Group Index Services LLC, Company Guarantee, Series 144A, 4.400%, 03/15/2018 | 21,646 |
| 20,000 | 2,3 | Cantor Fitzgerald LP, Bond, Series 144A, 7.875%, 10/15/2019 | 20,403 |
| 45,000 | | Charles Schwab Corp., Sr. Unsecd. Note, 4.950%, 06/01/2014 | 48,369 |
| 120,000 | | Eaton Vance Corp., 6.500%, 10/02/2017 | 138,113 |
| 150,000 | 2,3 | FMR LLC, Bond, Series 144A, 7.570%, 06/15/2029 | 193,990 |
| 80,000 | | Janus Capital Group, Inc., Sr. Note, 6.700%, 06/15/2017 | 86,825 |
| 25,000 | | Jefferies Group, Inc., Sr. Unsecd. Note, 6.875%, 04/15/2021 | 25,875 |
| 55,000 | | Raymond James Financial, Inc., 8.600%, 08/15/2019 | 67,715 |
| 30,000 | | Raymond James Financial, Inc., Sr. Unsecd. Note, 5.625%, 04/01/2024 | 32,889 |
| 50,000 | | TD Ameritrade Holding Corp., Company Guarantee, 4.150%, 12/01/2014 | 53,085 |
| | TOTAL | 688,910 |
| | Financial Institution - Finance Noncaptive—0.5% | |
| 120,000 | | Capital One Capital IV, 6.745%, 02/17/2037 | 121,512 |
| 25,000 | | Capital One Capital V, 10.250%, 08/15/2039 | 26,000 |
| 10,000 | | Capital One Capital VI, 8.875%, 05/15/2040 | 10,225 |
| 170,000 | | General Electric Capital Corp., Sr. Unsecd. Note, 2.900%, 01/09/2017 | 178,185 |
| 100,000 | | HSBC Finance Capital Trust IX, Note, 5.911%, 11/30/2035 | 96,500 |
| 200,000 | 2,3 | ILFC E-Capital Trust I, Floating Rate Note—Sr. Sub Note, Series 144A, 4.280%, 12/21/2065 | 139,000 |
Annual Shareholder Report
Principal
Amount
or Shares | | | Value |
| | Corporate Bonds—continued | |
| | Financial Institution - Finance Noncaptive—continued | |
| $60,000 | | International Lease Finance, Sr. Unsecd. Note, 4.875%, 4/01/2015 | $61,136 |
| | TOTAL | 632,558 |
| | Financial Institution - Insurance - Health—0.1% | |
| 50,000 | | UnitedHealth Group, Inc., Sr. Unsecd. Note, 6.000%, 02/15/2018 | 61,886 |
| 50,000 | | Wellpoint, Inc., 5.850%, 01/15/2036 | 61,047 |
| | TOTAL | 122,933 |
| | Financial Institution - Insurance - Life—0.6% | |
| 100,000 | | AXA-UAP, Sub. Note, 8.600%, 12/15/2030 | 110,231 |
| 10,000 | | Aflac, Inc., Sr. Unsecd. Note, 6.900%, 12/17/2039 | 12,907 |
| 35,000 | | Aflac, Inc., Sr. Unsecd. Note, 8.500%, 05/15/2019 | 46,477 |
| 25,000 | | Hartford Financial Services Group, Inc., Sr. Unsecd. Note, 5.125%, 04/15/2022 | 26,679 |
| 15,000 | | Lincoln National Corp., Sr. Note, 7.000%, 06/15/2040 | 18,489 |
| 10,000 | | Lincoln National Corp., Sr. Unsecd. Note, 4.200%, 03/15/2022 | 10,360 |
| 80,000 | 2,3 | Massachusetts Mutual Life Insurance Co., Sub. Note, Series 144A, 8.875%, 06/01/2039 | 118,702 |
| 70,000 | | MetLife, Inc., 6.750%, 06/01/2016 | 82,856 |
| 10,000 | | MetLife, Inc., Jr. Sub. Note, 10.750%, 08/01/2039 | 14,500 |
| 50,000 | 2,3 | New York Life Insurance Co, Sub. Note, Series 144A, 6.750%, 11/15/2039 | 69,469 |
| 85,000 | 2,3 | Pacific Life Global Fund, Sr. Secd. Note, Series 144A, 5.150%, 04/15/2013 | 87,727 |
| 15,000 | 2,3 | Penn Mutual Life Insurance Co., Sr. Note, Series 144A, 7.625%, 06/15/2040 | 19,059 |
| 85,000 | | Prudential Financial, Inc., Series MTN, 6.625%, 12/01/2037 | 102,224 |
| 50,000 | | Prudential Financial, Inc., Sr. Unsecd. Note, Series MTN, 6.200%, 11/15/2040 | 57,531 |
| | TOTAL | 777,211 |
| | Financial Institution - Insurance - P&C—0.4% | |
| 90,000 | | ACE INA Holdings, Inc., 5.600%, 05/15/2015 | 101,083 |
| 1,000 | | ACE INA Holdings, Inc., Sr. Note, 5.700%, 02/15/2017 | 1,190 |
| 75,000 | | CNA Financial Corp., 6.500%, 08/15/2016 | 85,311 |
| 30,000 | | CNA Financial Corp., Sr. Unsecd. Note, 7.350%, 11/15/2019 | 36,630 |
| 20,000 | | Chubb Corp., Sr. Note, 5.750%, 05/15/2018 | 24,796 |
| 100,000 | 2,3 | Liberty Mutual Group, Inc., Unsecd. Note, Series 144A, 5.750%, 03/15/2014 | 105,615 |
| 65,000 | 2,3 | Nationwide Mutual Insurance Co., Sub. Note, Series 144A, 9.375%, 08/15/2039 | 90,748 |
Annual Shareholder Report
Principal
Amount
or Shares | | | Value |
| | Corporate Bonds—continued | |
| | Financial Institution - Insurance - P&C—continued | |
| $50,000 | | The Travelers Cos., Inc., Sr. Unsecd. Note, 5.500%, 12/01/2015 | $56,773 |
| | TOTAL | 502,146 |
| | Financial Institution - REITs—0.5% | |
| 40,000 | | AMB Property LP, Series MTN, 6.300%, 06/01/2013 | 41,285 |
| 50,000 | | Alexandria Real Estate Equities, Inc., Sr. Unsecd. Note, 4.600%, 04/01/2022 | 52,009 |
| 15,000 | | Avalonbay Communities, Inc., Sr. Unsecd. Note, Series MTN, 5.700%, 03/15/2017 | 17,569 |
| 55,000 | | Boston Properties LP, Sr. Unsecd. Note, 5.875%, 10/15/2019 | 64,969 |
| 20,000 | | Equity One, Inc., Bond, 6.000%, 09/15/2017 | 22,307 |
| 20,000 | | Equity One, Inc., Sr. Unsecd. Note, 6.250%, 12/15/2014 | 21,643 |
| 40,000 | | Health Care REIT, Inc., Sr. Unsecd. Note, 6.125%, 04/15/2020 | 46,734 |
| 75,000 | | Liberty Property LP, 6.625%, 10/01/2017 | 88,433 |
| 20,000 | | Regency Centers LP, Company Guarantee, 4.800%, 04/15/2021 | 21,855 |
| 95,000 | | Simon Property Group LP, 6.125%, 05/30/2018 | 114,321 |
| 35,000 | | Simon Property Group LP, 6.750%, 05/15/2014 | 37,977 |
| 30,000 | | Tanger Properties LP, Sr. Unsecd. Note, 6.125%, 06/01/2020 | 35,573 |
| 10,000 | | UDR, Inc., Company Guarantee, 4.625%, 01/10/2022 | 10,852 |
| | TOTAL | 575,527 |
| | Sovereign—0.1% | |
| 40,000 | | Corp Andina De Fomento, Sr. Unsecd. Note, 3.750%, 01/15/2016 | 41,990 |
| 30,000 | | Corp Andina De Fomento, Sr. Unsecd. Note, 4.375%, 06/15/2022 | 32,646 |
| | TOTAL | 74,636 |
| | Technology—0.7% | |
| 40,000 | | BMC Software, Inc., 7.250%, 06/01/2018 | 48,748 |
| 25,000 | | BMC Software, Inc., Sr. Unsecd. Note, 4.250%, 02/15/2022 | 25,709 |
| 50,000 | | Cisco Systems, Inc., Sr. Unsecd. Note, 3.150%, 03/14/2017 | 55,035 |
| 60,000 | | Cisco Systems, Inc., Sr. Unsecd. Note, 5.500%, 02/22/2016 | 70,174 |
| 20,000 | | Corning, Inc., Unsecd. Note, 4.750%, 03/15/2042 | 22,110 |
| 100,000 | | Dell Computer Corp., Deb., 7.100%, 04/15/2028 | 126,704 |
| 90,000 | | Fiserv, Inc., Sr. Note, 6.800%, 11/20/2017 | 108,262 |
| 20,000 | | Hewlett-Packard Co., Sr. Unsecd. Note, 2.600%, 09/15/2017 | 19,984 |
| 20,000 | | Hewlett-Packard Co., Sr. Unsecd. Note, 3.300%, 12/09/2016 | 20,868 |
| 100,000 | | Hewlett-Packard Co., Sr. Unsecd. Note, 4.750%, 06/02/2014 | 105,949 |
| 100,000 | | IBM Corp., Deb., 8.375%, 11/01/2019 | 144,052 |
| 10,000 | | Juniper Networks, Inc., Sr. Unsecd. Note, 5.950%, 03/15/2041 | 11,540 |
| 30,000 | | Maxim Integrated Products, Inc., Note, 3.450%, 06/14/2013 | 30,720 |
Annual Shareholder Report
Principal
Amount
or Shares | | | Value |
| | Corporate Bonds—continued | |
| | Technology—continued | |
| $25,000 | | Verisk Analytics, Inc., Sr. Unsecd. Note, 4.875%, 01/15/2019 | $27,133 |
| 20,000 | | Xerox Corp., Sr. Unsecd. Note, 2.950%, 03/15/2017 | 20,245 |
| | TOTAL | 837,233 |
| | Transportation - Airlines—0.1% | |
| 130,000 | | Southwest Airlines Co., Sr. Unsecd. Note, 5.125%, 03/01/2017 | 143,688 |
| | Transportation - Railroads—0.2% | |
| 75,000 | | Burlington Northern Santa Fe Corp., 4.875%, 01/15/2015 | 82,083 |
| 50,000 | | Burlington Northern Santa Fe Corp., Deb., 5.750%, 05/01/2040 | 63,798 |
| 100,000 | | Canadian Pacific RR, 7.125%, 10/15/2031 | 128,515 |
| | TOTAL | 274,396 |
| | Transportation - Services—0.2% | |
| 90,000 | 2,3 | Enterprise Rent-A-Car USA, Series 144A, 6.375%, 10/15/2017 | 105,961 |
| 60,000 | 2,3 | Penske Truck Leasing Co. LP & PTL Finance Corp., Series 144A, 3.750%, 05/11/2017 | 60,926 |
| 60,000 | | Ryder System, Inc., Sr. Unsecd. Note, Series MTN, 3.150%, 03/02/2015 | 62,164 |
| 30,000 | | United Parcel Service, Inc., Sr. Unsecd. Note, 3.125%, 01/15/2021 | 32,731 |
| | TOTAL | 261,782 |
| | Utility - Electric—0.9% | |
| 70,000 | | Appalachian Power Co., Sr. Unsecd. Note, 7.950%, 01/15/2020 | 95,209 |
| 100,000 | | Cleveland Electric Illuminating Co., Sr. Unsecd. Note, 5.950%, 12/15/2036 | 115,949 |
| 5,000 | | Consolidated Edison Co., Sr. Unsecd. Note, 6.650%, 04/01/2019 | 6,425 |
| 10,000 | | Duke Energy Ohio, Inc., 1st Mtg. Bond, 2.100%, 06/15/2013 | 10,143 |
| 45,000 | 2,3 | Electricite De France SA, Note, Series 144A, 5.600%, 01/27/2040 | 50,994 |
| 100,000 | | Exelon Generation Co. LLC, Note, 5.350%, 01/15/2014 | 105,882 |
| 50,000 | | FirstEnergy Solutions Corp., Company Guarantee, 4.800%, 02/15/2015 | 53,486 |
| 40,000 | | FirstEnergy Solutions Corp., Company Guarantee, 6.050%, 08/15/2021 | 44,714 |
| 10,000 | | Great Plains Energy, Inc., Note, 4.850%, 06/01/2021 | 10,937 |
| 24,798 | 2,3 | Great River Energy, 1st Mtg. Note, Series 144A, 5.829%, 7/01/2017 | 26,487 |
| 80,000 | | Northern States Power Co., MN, 1st Mtg. Bond, 5.250%, 03/01/2018 | 96,393 |
| 50,000 | | PPL Energy Supply LLC, Sr. Unsecd. Note, 6.000%, 12/15/2036 | 55,642 |
| 20,000 | | PSEG Power LLC, Company Guarantee, 2.500%, 04/15/2013 | 20,273 |
| 75,000 | | PSI Energy, Inc., Bond, 6.050%, 06/15/2016 | 87,876 |
| 50,000 | | Progress Energy, Inc., 7.050%, 03/15/2019 | 63,965 |
| 10,000 | | TECO Finance, Inc., Company Guarantee, 5.150%, 03/15/2020 | 11,571 |
| 40,000 | | UIL Holdings Corp., Sr. Unsecd. Note, 4.625%, 10/01/2020 | 42,582 |
| 90,000 | | Union Electric Co., 6.000%, 04/01/2018 | 107,494 |
Annual Shareholder Report
Principal
Amount
or Shares | | | Value |
| | Corporate Bonds—continued | |
| | Utility - Electric—continued | |
| $90,000 | | Virginia Electric & Power Co., Sr. Unsecd. Note, 5.100%, 11/30/2012 | $91,373 |
| | TOTAL | 1,097,395 |
| | Utility - Natural Gas Distributor—0.1% | |
| 40,000 | | Atmos Energy Corp., 5.125%, 01/15/2013 | 40,795 |
| 20,000 | | Atmos Energy Corp., 8.500%, 03/15/2019 | 26,983 |
| 10,000 | 2,3 | Florida Gas Transmission Co. LLC, Sr. Unsecd. Note, Series 144A, 5.450%, 07/15/2020 | 11,343 |
| 30,000 | | National Fuel Gas Co., Sr. Unsecd. Note, 4.900%, 12/01/2021 | 32,849 |
| 55,000 | | Sempra Energy, Sr. Unsecd. Note, 6.500%, 06/01/2016 | 65,495 |
| | TOTAL | 177,465 |
| | Utility - Natural Gas Pipelines—0.4% | |
| 75,000 | | Duke Capital Corp., Sr. Note, 6.250%, 02/15/2013 | 77,054 |
| 40,000 | | Enbridge, Inc., Sr. Note, 5.600%, 04/01/2017 | 45,962 |
| 65,000 | | Enterprise Products Operating LLC, Company Guarantee, Series O, 9.750%, 01/31/2014 | 73,302 |
| 100,000 | | Enterprise Products Operating LP, Company Guarantee, 5.900%, 04/15/2013 | 103,592 |
| 80,000 | | Kinder Morgan Energy Partners LP, Note, 6.550%, 09/15/2040 | 97,924 |
| 50,000 | | Kinder Morgan Energy Partners LP, Sr. Unsecd. Note, 5.000%, 12/15/2013 | 52,740 |
| 40,000 | | Williams Partners LP, 5.250%, 03/15/2020 | 46,231 |
| 30,000 | | Williams Partners LP, Sr. Unsecd. Note, 4.125%, 11/15/2020 | 32,708 |
| | TOTAL | 529,513 |
| | TOTAL CORPORATE BONDS
(IDENTIFIED COST $15,743,164) | 17,642,853 |
| | FOREIGN Government/AgencY—0.1% | |
| | Sovereign—0.1% | |
| 75,000 | | United Mexican States, 6.625%, 03/03/2015
(IDENTIFIED COST $77,673) | 85,012 |
| | Mortgage-Backed Securities—0.0% | |
| | Federal National Mortgage Association—0.0% | |
| $1,256 | | Federal National Mortgage Association Pool 408761, 7.000%, 12/1/2012 | 1,269 |
| 3,281 | | Federal National Mortgage Association Pool 512255, 7.500%, 9/1/2014 | 3,444 |
| 6,269 | | Federal National Mortgage Association Pool 609554, 7.500%, 10/1/2016 | 6,825 |
| | TOTAL MORTGAGE-BACKED SECURITIES
(IDENTIFIED COST $11,180) | 11,538 |
Annual Shareholder Report
Principal
Amount
or Shares | | | Value |
| | MUNICIPAL SECURITIES—0.3% | |
| | Municipal Services—0.3% | |
| $70,000 | | Chicago, IL Metropolitan Water Reclamation District, Direct Payment Taxable Limited GO Build America Bonds, 5.720%, 12/01/2038 | $92,662 |
| 250,000 | | Chicago, IL, Taxable Project and Refunding (Series 2012B) GO Bonds, 5.432%, 01/01/2042 | 257,225 |
| | TOTAL MUNICIPAL SECURITIES
(IDENTIFIED COST $320,000) | 349,887 |
| | U.S. TREASURY—1.8% | |
| 1,050,610 | 4 | U.S. Treasury Inflation-Protected Note, Series A-2021, 1.125%, 1/15/2021 | 1,227,868 |
| 866,745 | | U.S. Treasury Inflation-Protected Note, Series D-2021, 0.625%, 7/15/2021 | 981,697 |
| | TOTAL U.S. TREASURY
(IDENTIFIED COST $1,993,056) | 2,209,565 |
| | EXCHANGE-TRADED FUNDS—5.1% | |
| 34,000 | | iShares MSCI Emerging Markets Fund | 1,330,080 |
| 103,000 | | iShares MSCI EAFE Index Fund | 5,150,000 |
| | TOTAL EXCHANGE-TRADED FUNDS
(IDENTIFIED COST $6,121,452) | 6,480,080 |
| | MUTUAL FUNDS—15.7%5 | |
| 43,041 | | Emerging Markets Fixed Income Core Fund | 1,421,437 |
| 1,111,788 | | Federated Mortgage Core Portfolio | 11,406,940 |
| 3,699,581 | 6 | Federated Prime Value Obligations Fund, Institutional Shares, 0.22% | 3,699,581 |
| 95,499 | | Federated Project and Trade Finance Core Fund | 933,977 |
| 368,556 | | High Yield Bond Portfolio | 2,439,838 |
| | TOTAL MUTUAL FUNDS
(IDENTIFIED COST $18,859,359) | 19,901,773 |
| | TOTAL INVESTMENTS—99.8%
(IDENTIFIED COST $119,485,920)7 | 126,554,772 |
| | OTHER ASSETS AND LIABILITIES - NET—0.2%8 | 278,872 |
| | TOTAL NET ASSETS—100% | $126,833,644 |
Annual Shareholder Report
At July 31, 2012, the Fund had the following outstanding futures contracts:
| Description | Number of
Contracts | Notional
Value | Expiration
Date | Unrealized
Appreciation/
(Depreciation) |
1United States Treasury Note
5-Year Long Futures | 26 | $3,244,313 | September 2012 | $29,598 |
| 1United States Treasury Note 10-Year Long Futures | 55 | $7,406,094 | September 2012 | $128,789 |
| 1United States Treasury Bond 30-Year Short Futures | 15 | $2,265,469 | September 2012 | $(72,573) |
| 1United States Treasury Bond Ultra Long Short Futures | 3 | $517,500 | September 2012 | $(29,139) |
1United States Treasury Note
2-Year Short Futures | 100 | $22,060,938 | September 2012 | $(42,413) |
| NET UNREALIZED APPRECIATION ON FUTURES CONTRACTS | $14,262 |
Net Unrealized Appreciation on Futures Contracts is included in “Other Assets and Liabilities—Net.”
| 1 | Non-income producing security. |
| 2 | Denotes a restricted security that either: (a) cannot be offered for public sale without first being registered, or being able to take advantage of an exemption from registration, under the Securities Act of 1933; or (b) is subject to a contractual restriction on public sales. At July 31, 2012, these restricted securities amounted to $2,673,525, which represented 2.1% of total net assets. |
| 3 | Denotes a restricted security that may be resold without restriction to “qualified institutional buyers” as defined in Rule 144A under the Securities Act of 1933 and that the Fund has determined to be liquid under criteria established by the Fund's Board of Trustees (the “Trustees”). At July 31, 2012, these liquid restricted securities amounted to $2,453,236, which represented 1.9% of total net assets. |
| 4 | All or a portion of this security is pledged as collateral to ensure the Fund is able to satisfy the obligations of its outstanding futures contracts. |
| 5 | Affiliated holdings. |
| 6 | 7-Day net yield. |
| 7 | The cost of investments for federal tax purposes amounts to $119,913,183. |
| 8 | Assets, other than investments in securities, less liabilities. See Statement of Assets and Liabilities. |
Note: The categories of investments are shown as a percentage of total net assets at July 31, 2012.
Various inputs are used in determining the value of the Fund's investments. These inputs are summarized in the three broad levels listed below:
Level 1—quoted prices in active markets for identical securities, including investment companies with daily net asset values, if applicable.
Level 2—other significant observable inputs (including quoted prices for similar securities, interest rates, prepayment speeds, credit risk, etc.). Also includes securities valued at amortized cost.
Level 3—significant unobservable inputs (including the Fund's own assumptions in determining the fair value of investments).
The inputs or methodology used for valuing securities are not an indication of the risk associated with investing in those securities.
Annual Shareholder Report
The following is a summary of the inputs used, as of July 31, 2012, in valuing the Fund's assets carried at fair value:
| Valuation Inputs |
| Level 1—
Quoted
Prices and
Investments in
Mutual Funds1 | Level 2—
Other
Significant
Observable
Inputs | Level 3—
Significant
Unobservable
Inputs | Total |
| Equity Securities: | | | | |
| Common Stocks | | | | |
| Domestic | $75,862,262 | $— | $— | $75,862,262 |
| International | 2,266,177 | — | — | 2,266,177 |
| Debt Securities: | | | | |
| Asset-Backed Securities | — | 812,236 | — | 812,236 |
| Collateralized Mortgage Obligations | — | 933,389 | — | 933,389 |
| Corporate Bonds | — | 17,642,853 | — | 17,642,853 |
| Foreign Government/Agency | — | 85,012 | — | 85,012 |
| Mortgage-Backed Securities | — | 11,538 | — | 11,538 |
| Municipal Securities | — | 349,887 | — | 349,887 |
| U.S. Treasury | — | 2,209,565 | — | 2,209,565 |
| Exchange-Traded Funds | 6,480,080 | — | — | 6,480,080 |
| Mutual Funds | 18,967,796 | 933,977 | — | 19,901,773 |
| TOTAL SECURITIES | $103,576,315 | $22,978,457 | $— | $126,554,772 |
| OTHER FINANCIAL INSTRUMENTS2 | $14,262 | $— | $— | $14,262 |
| 1 | Emerging Markets Fixed Income Core Fund, Federated Mortgage Core Portfolio and High Yield Bond Portfolio are affiliated holdings offered only to registered investment companies and other accredited investors. |
| 2 | Other financial instruments include futures contracts. |
The following acronyms are used throughout this portfolio:
| GO | —General Obligation |
| REIT(s) | —Real Estate Investment Trust(s) |
| REMIC | —Real Estate Mortgage Investment Conduit |
See Notes which are an integral part of the Financial Statements
Annual Shareholder Report
Financial Highlights–Class A Shares
(For a Share Outstanding Throughout Each Period)
| Year Ended July 31 | 2012 | 2011 | 2010 | 2009 | 2008 |
| Net Asset Value, Beginning of Period | $12.17 | $10.86 | $10.17 | $12.51 | $13.75 |
| Income From Investment Operations: | | | | | |
| Net investment income | 0.171 | 0.151 | 0.161 | 0.201 | 0.281 |
| Net realized and unrealized gain (loss) on investments, futures contracts, swap contracts and foreign currency transactions | 0.02 | 1.33 | 0.71 | (2.27) | (1.00) |
| TOTAL FROM INVESTMENT OPERATIONS | 0.19 | 1.48 | 0.87 | (2.07) | (0.72) |
| Less Distributions: | | | | | |
| Distributions from net investment income | (0.16) | (0.17) | (0.18) | (0.27) | (0.17) |
| Distributions from net realized gain on investments, futures contracts, swap contracts and foreign currency transactions | — | — | — | — | (0.35) |
| TOTAL DISTRIBUTIONS | (0.16) | (0.17) | (0.18) | (0.27) | (0.52) |
| Net Asset Value, End of Period | $12.20 | $12.17 | $10.86 | $10.17 | $12.51 |
| Total Return2 | 1.65% | 13.67% | 8.51% | (16.35)% | (5.60)% |
| Ratios to Average Net Assets: | | | | | |
| Net expenses | 1.30% | 1.28% | 1.21% | 1.30% | 1.31% |
| Net investment income | 1.43% | 1.27% | 1.47% | 2.03% | 2.08% |
| Expense waiver/reimbursement3 | 0.28% | 0.23% | 0.25% | 0.14% | 0.03% |
| Supplemental Data: | | | | | |
| Net assets, end of period (000 omitted) | $48,774 | $57,358 | $86,018 | $105,635 | $153,458 |
| Portfolio turnover | 149% | 139% | 130% | 231% | 158% |
| 1 | Per share numbers have been calculated using the average shares method. |
| 2 | Based on net asset value, which does not reflect the sales charge, redemption fee or contingent deferred sales charge, if applicable. |
| 3 | This expense decrease is reflected in both the net expense and the net investment income ratios shown above. |
See Notes which are an integral part of the Financial Statements
Annual Shareholder Report
Financial Highlights–Class C Shares
(For a Share Outstanding Throughout Each Period)
| Year Ended July 31 | 2012 | 2011 | 2010 | 2009 | 2008 |
| Net Asset Value, Beginning of Period | $11.99 | $10.70 | $10.03 | $12.30 | $13.60 |
| Income From Investment Operations: | | | | | |
| Net investment income | 0.081 | 0.061 | 0.081 | 0.131 | 0.191 |
| Net realized and unrealized gain (loss) on investments, futures contracts, swap contracts and foreign currency transactions | 0.03 | 1.31 | 0.69 | (2.23) | (1.00) |
| TOTAL FROM INVESTMENT OPERATIONS | 0.11 | 1.37 | 0.77 | (2.10) | (0.81) |
| Less Distributions: | | | | | |
| Distributions from net investment income | (0.07) | (0.08) | (0.10) | (0.17) | (0.14) |
| Distributions from net realized gain on investments, futures contracts, swap contracts and foreign currency transactions | — | — | — | — | (0.35) |
| TOTAL DISTRIBUTIONS | (0.07) | (0.08) | (0.10) | (0.17) | (0.49) |
| Net Asset Value, End of Period | $12.03 | $11.99 | $10.70 | $10.03 | $12.30 |
| Total Return2 | 0.93% | 12.85% | 7.63% | (16.95)% | (6.28)% |
| Ratios to Average Net Assets: | | | | | |
| Net expenses | 2.05% | 2.04% | 1.96% | 2.05% | 2.05% |
| Net investment income | 0.68% | 0.52% | 0.71% | 1.28% | 1.41% |
| Expense waiver/reimbursement3 | 0.24% | 0.19% | 0.22% | 0.10% | 0.03% |
| Supplemental Data: | | | | | |
| Net assets, end of period (000 omitted) | $34,193 | $45,512 | $49,907 | $55,582 | $82,033 |
| Portfolio turnover | 149% | 139% | 130% | 231% | 158% |
| 1 | Per share numbers have been calculated using the average shares method. |
| 2 | Based on net asset value, which does not reflect the sales charge, redemption fee or contingent deferred sales charge, if applicable. |
| 3 | This expense decrease is reflected in both the net expense and the net investment income ratios shown above. |
See Notes which are an integral part of the Financial Statements
Annual Shareholder Report
Financial Highlights–Class R Shares
(For a Share Outstanding Throughout Each Period)
| Year Ended July 31 | 2012 | 2011 | 2010 | 2009 | 2008 |
| Net Asset Value, Beginning of Period | $12.12 | $10.83 | $10.14 | $12.51 | $13.77 |
| Income From Investment Operations: | | | | | |
| Net investment income | 0.111 | 0.091 | 0.101 | 0.151 | 0.201 |
| Net realized and unrealized gain (loss) on investments, futures contracts, swap contracts and foreign currency transactions | 0.03 | 1.32 | 0.72 | (2.27) | (0.98) |
| TOTAL FROM INVESTMENT OPERATIONS | 0.14 | 1.41 | 0.82 | (2.12) | (0.78) |
| Less Distributions: | | | | | |
| Distributions from net investment income | (0.09) | (0.12) | (0.13) | (0.25) | (0.13) |
| Distributions from net realized gain on investments, futures contracts, swap contracts and foreign currency transactions | — | — | — | — | (0.35) |
| TOTAL DISTRIBUTIONS | (0.09) | (0.12) | (0.13) | (0.25) | (0.48) |
| Net Asset Value, End of Period | $12.17 | $12.12 | $10.83 | $10.14 | $12.51 |
| Total Return2 | 1.19% | 13.08% | 8.01% | (16.75)% | (6.01)% |
| Ratios to Average Net Assets: | | | | | |
| Net expenses | 1.80% | 1.79% | 1.70% | 1.79% | 1.77% |
| Net investment income | 0.93% | 0.77% | 0.96% | 1.56% | 1.53% |
| Expense waiver/reimbursement3 | 0.22% | 0.17% | 0.21% | 0.09% | 0.02% |
| Supplemental Data: | | | | | |
| Net assets, end of period (000 omitted) | $526 | $665 | $673 | $597 | $708 |
| Portfolio turnover | 149% | 139% | 130% | 231% | 158% |
| 1 | Per share numbers have been calculated using the average shares method. |
| 2 | Based on net asset value. |
| 3 | This expense decrease is reflected in both the net expense and the net investment income ratios shown above. |
See Notes which are an integral part of the Financial Statements
Annual Shareholder Report
Financial Highlights–Institutional Shares
(For a Share Outstanding Throughout Each Period)
| Year Ended July 31 | 2012 | 2011 | 2010 | 2009 | 2008 |
| Net Asset Value, Beginning of Period | $12.21 | $10.90 | $10.21 | $12.57 | $13.79 |
| Income From Investment Operations: | | | | | |
| Net investment income | 0.201 | 0.181 | 0.191 | 0.231 | 0.301 |
| Net realized and unrealized gain (loss) on investments, futures contracts, swap contracts and foreign currency transactions | 0.02 | 1.34 | 0.71 | (2.28) | (0.98) |
| TOTAL FROM INVESTMENT OPERATIONS | 0.22 | 1.52 | 0.90 | (2.05) | (0.68) |
| Less Distributions: | | | | | |
| Distributions from net investment income | (0.20) | (0.21) | (0.21) | (0.31) | (0.19) |
| Distributions from net realized gain on investments, futures contracts, swap contracts and foreign currency transactions | — | — | — | — | (0.35) |
| TOTAL DISTRIBUTIONS | (0.20) | (0.21) | (0.21) | (0.31) | (0.54) |
| Net Asset Value, End of Period | $12.23 | $12.21 | $10.90 | $10.21 | $12.57 |
| Total Return2 | 1.87% | 13.99% | 8.74% | (16.13)% | (5.33)% |
| Ratios to Average Net Assets: | | | | | |
| Net expenses | 1.05% | 1.04% | 0.96% | 1.05% | 1.06% |
| Net investment income | 1.69% | 1.52% | 1.71% | 2.29% | 2.22% |
| Expense waiver/reimbursement3 | 0.23% | 0.18% | 0.21% | 0.09% | 0.03% |
| Supplemental Data: | | | | | |
| Net assets, end of period (000 omitted) | $43,341 | $47,473 | $49,127 | $50,161 | $71,949 |
| Portfolio turnover | 149% | 139% | 130% | 231% | 158% |
| 1 | Per share numbers have been calculated using the average shares method. |
| 2 | Based on net asset value. |
| 3 | This expense decrease is reflected in both the net expense and the net investment income ratios shown above. |
See Notes which are an integral part of the Financial Statements
Annual Shareholder Report
Statement of Assets and Liabilities
July 31, 2012
| Assets: | | |
| Total investment in securities, at value including $19,901,773 of investment in affiliated holdings (Note 5) (identified cost $119,485,920) | | $126,554,772 |
| Income receivable | | 296,936 |
| Receivable for investments sold | | 629,151 |
| Receivable for shares sold | | 49,557 |
| Receivable for daily variation margin | | 4,875 |
| TOTAL ASSETS | | 127,535,291 |
| Liabilities: | | |
| Payable for investments purchased | $443,556 | |
| Payable for shares redeemed | 86,424 | |
| Payable for transfer and dividend disbursing agent fees and expenses | 29,086 | |
| Payable for Directors'/Trustees' fees | 476 | |
| Payable for auditing fees | 26,500 | |
| Payable for portfolio accounting fees | 19,078 | |
| Payable for distribution services fee (Note 5) | 21,995 | |
| Payable for shareholder services fee (Note 5) | 33,731 | |
| Payable for account administration fee | 13,394 | |
| Accrued expenses | 27,407 | |
| TOTAL LIABILITIES | | 701,647 |
| Net assets for 10,425,448 shares outstanding | | $126,833,644 |
| Net Assets Consist of: | | |
| Paid-in capital | | $174,984,054 |
| Net unrealized appreciation of investments and futures contracts | | 7,083,114 |
| Accumulated net realized loss on investments, futures contracts and swap contracts | | (56,274,327) |
| Undistributed net investment income | | 1,040,803 |
| TOTAL NET ASSETS | | $126,833,644 |
Annual Shareholder Report
Statement of Assets and Liabilities–continued
| Net Asset Value, Offering Price and Redemption Proceeds Per Share | | |
| Class A Shares: | | |
| Net asset value per share ($48,774,097 ÷ 3,997,465 shares outstanding), no par value, unlimited shares authorized | | $12.20 |
| Offering price per share (100/94.50 of $12.20) | | $12.91 |
| Redemption proceeds per share | | $12.20 |
| Class C Shares: | | |
| Net asset value per share ($34,192,897 ÷ 2,842,358 shares outstanding), no par value, unlimited shares authorized | | $12.03 |
| Offering price per share | | $12.03 |
| Redemption proceeds per share (99.00/100 of $12.03) | | $11.91 |
| Class R Shares: | | |
| Net asset value per share ($525,671 ÷ 43,201 shares outstanding), no par value, unlimited shares authorized | | $12.17 |
| Offering price per share | | $12.17 |
| Redemption proceeds per share | | $12.17 |
| Institutional Shares: | | |
| Net asset value per share ($43,340,979 ÷ 3,542,424 shares outstanding), no par value, unlimited shares authorized | | $12.23 |
| Offering price per share | | $12.23 |
| Redemption proceeds per share | | $12.23 |
See Notes which are an integral part of the Financial Statements
Annual Shareholder Report
Statement of Operations
Year Ended July 31, 2012
| Investment Income: | | | |
| Dividends (including $703,684 received from affiliated holdings (Note 5)) | | | $2,527,164 |
| Interest | | | 1,065,091 |
| Investment income allocated from affiliated partnership (Note 5) | | | 87,924 |
| TOTAL INCOME | | | 3,680,179 |
| Expenses: | | | |
| Investment adviser fee (Note 5) | | $1,008,077 | |
| Administrative fee (Note 5) | | 270,000 | |
| Custodian fees | | 45,686 | |
| Transfer and dividend disbursing agent fees and expenses (Note 2) | | 177,163 | |
| Directors'/Trustees' fees | | 3,102 | |
| Auditing fees | | 26,500 | |
| Legal fees | | 7,937 | |
| Portfolio accounting fees | | 122,554 | |
| Distribution services fee (Note 5) | | 293,177 | |
| Shareholder services fee (Note 5) | | 150,734 | |
| Account administration fee (Note 2) | | 60,390 | |
| Share registration costs | | 53,031 | |
| Printing and postage | | 43,988 | |
| Insurance premiums | | 4,088 | |
| Miscellaneous | | 9,651 | |
| TOTAL EXPENSES | | 2,276,078 | |
Annual Shareholder Report
Statement of Operations–continued
| Waivers and Reimbursements: | | | |
| Waiver/reimbursement of investment adviser fee (Note 5) | $(247,872) | | |
| Waiver of administrative fee (Note 5) | (53,655) | | |
| Reimbursement of transfer and dividend disbursing agent fees and expenses (Note 2) and (Note 5) | (38,947) | | |
| TOTAL WAIVERS AND REIMBURSEMENTS | | $(340,474) | |
| Net expenses | | | $1,935,604 |
| Net investment income | | | 1,744,575 |
| Realized and Unrealized Gain (Loss) on Investments, Futures Contracts and Swap Contracts: | | | |
| Net realized gain on investments (including realized gain of $223,247 on sales of investments in affiliated holdings) (Note 5) | | | 2,128,146 |
| Net realized gain on futures contracts | | | 304,666 |
| Net realized gain on swap contracts | | | 35,881 |
| Net realized gain on investments allocated from affiliated partnership (Note 5) | | | 13,468 |
| Realized gain distribution from affiliated investment company shares (Note 5) | | | 4,779 |
| Net change in unrealized appreciation of investments | | | (2,866,764) |
| Net change in unrealized depreciation of futures contracts | | | 23,764 |
| Net change in unrealized depreciation of swap contracts | | | 6,438 |
| Net realized and unrealized loss on investments, futures contracts and swap contracts | | | (349,622) |
| Change in net assets resulting from operations | | | $1,394,953 |
See Notes which are an integral part of the Financial Statements
Annual Shareholder Report
Statement of Changes in Net Assets
| Year Ended July 31 | 2012 | 2011 |
| Increase (Decrease) in Net Assets | | |
| Operations: | | |
| Net investment income | $1,744,575 | $1,926,070 |
| Net realized gain on investments including allocations from partnership, futures contracts and swap contracts | 2,486,940 | 20,679,642 |
| Net change in unrealized appreciation/depreciation of investments, futures contracts and swap contracts | (2,836,562) | 60,771 |
| CHANGE IN NET ASSETS RESULTING FROM OPERATIONS | 1,394,953 | 22,666,483 |
| Distributions to Shareholders: | | |
| Distributions from net investment income | | |
| Class A Shares | (687,022) | (961,404) |
| Class C Shares | (236,475) | (341,788) |
| Class R Shares | (3,971) | (7,358) |
| Institutional Shares | (746,612) | (885,615) |
| CHANGE IN NET ASSETS RESULTING FROM DISTRIBUTIONS TO SHAREHOLDERS | (1,674,080) | (2,196,165) |
| Share Transactions: | | |
| Proceeds from sale of shares | 7,982,107 | 11,439,970 |
| Net asset value of shares issued to shareholders in payment of distributions declared | 1,539,146 | 2,004,100 |
| Cost of shares redeemed | (33,416,917) | (68,630,880) |
| CHANGE IN NET ASSETS RESULTING FROM SHARE TRANSACTIONS | (23,895,664) | (55,186,810) |
| Change in net assets | (24,174,791) | (34,716,492) |
| Net Assets: | | |
| Beginning of period | 151,008,435 | 185,724,927 |
| End of period (including undistributed net investment income of $1,040,803 and $939,557, respectively) | $126,833,644 | $151,008,435 |
See Notes which are an integral part of the Financial Statements
Annual Shareholder Report
Notes to Financial Statements
July 31, 2012
1. ORGANIZATION
Federated MDT Series (the “Trust”) is registered under the Investment Company Act of 1940, as amended (the “Act”), as an open-end management investment company. The Trust consists of five portfolios. The financial statements included herein are only those of Federated MDT Balanced Fund (the “Fund”), a diversified portfolio. The financial statements of the other portfolios are presented separately. The assets of each portfolio are segregated and a shareholder's interest is limited to the portfolio in which shares are held. Each portfolio pays its own expenses. The Fund offers four classes of shares: Class A Shares, Class C Shares, Class R Shares and Institutional Shares. All shares of the Fund have equal rights with respect to voting, except on class-specific matters. The investment objective of the Fund is the possibility of long-term growth of capital and income.
2. SIGNIFICANT ACCOUNTING POLICIES
The following is a summary of significant accounting policies consistently followed by the Fund in the preparation of its financial statements. These policies are in conformity with U.S. generally accepted accounting principles (GAAP).
Investment Valuation
In calculating its net asset value (NAV), the Fund generally values investments as follows:
| ■ | Equity securities listed on an exchange or traded through a regulated market system are valued at their last reported sale price or official closing price in their principal exchange or market. |
| ■ | Fixed-income securities acquired with remaining maturities greater than 60 days are fair valued using price evaluations provided by a pricing service approved by the Trustees. |
| ■ | Fixed-income securities acquired with remaining maturities of 60 days or less are valued at their cost (adjusted for the accretion of any discount or amortization of any premium), which approximates market value. |
| ■ | Shares of other mutual funds are valued based upon their reported NAVs. |
| ■ | Derivative contracts listed on exchanges are valued at their reported settlement or closing price. |
| ■ | Over-the-counter (OTC) derivative contracts are fair valued using price evaluations provided by a pricing service approved by the Trustees. |
| ■ | For securities that are fair valued in accordance with procedures established by and under the general supervision of the Trustees, certain factors may be considered such as: the purchase price of the security, information obtained by contacting the issuer, analysis of the issuer's financial statements or other available documents, fundamental analytical data, the nature and duration of restrictions on disposition, the movement of the market in which the security is normally traded and public trading in similar securities of the issuer or comparable issuers. |
If the Fund cannot obtain a price or price evaluation from a pricing service for an investment, the Fund may attempt to value the investment based upon the mean of bid and asked quotations or fair value the investment based on price evaluations, from one or more dealers. If any price, quotation, price evaluation or other pricing source is not readily available when the NAV is calculated, the Fund uses the fair value of the investment determined in accordance with the procedures described below. There can be no assurance that the Fund could purchase or sell an investment at the price used to calculate the Fund's NAV.
Annual Shareholder Report
Fair Valuation and Significant Events Procedures
The Trustees have appointed a Valuation Committee comprised of officers of the Fund, Federated MDTA LLC (“Adviser”) or an affiliated adviser, and others to determine fair value of securities and in overseeing the calculation of the NAV. The Trustees have also authorized the use of pricing services recommended by the Valuation Committee to provide fair value evaluations of the current value of certain investments for purposes of calculating the NAV. The Valuation Committee employs various methods for reviewing third-party pricing service evaluations including periodic reviews of third-party pricing services' policies, procedures and valuation methods (including key inputs and assumptions), transactional back-testing, comparisons of evaluations of different pricing services, and review of price challenges by the Adviser based on recent market activity. In the event that market quotations and price evaluations are not available for an investment, the Valuation Committee determines the fair value of the investment in accordance with procedures adopted by the Trustees. The Trustees periodically review and approve the fair valuations made by the Valuation Committee and any changes made to the procedures.
Factors considered by pricing services in evaluating an investment include the yields or prices of investments of comparable quality, coupon, maturity, call rights and other potential prepayments, terms and type, reported transactions, indications as to values from dealers and general market conditions. Some pricing services provide a single price evaluation reflecting the bid-side of the market for an investment (a “bid” evaluation). Other pricing services offer both bid evaluations and price evaluations indicative of a price between the prices bid and asked for the investment (a “mid” evaluation). The Fund normally uses bid evaluations for U.S. Treasury and Agency securities, mortgage-backed securities and municipal securities. The Fund normally uses mid evaluations for other types of fixed-income securities and OTC derivative contracts. In the event that market quotations and price evaluations are not available for an investment, the fair value of the investment is determined in accordance with procedures adopted by the Trustees.
The Trustees also have adopted procedures requiring an investment to be priced at its fair value whenever the Adviser determines that a significant event affecting the value of the investment has occurred between the time as of which the price of the investment would otherwise be determined and the time as of which the NAV is computed. An event is considered significant if there is both an affirmative expectation that the investment's value will change in response to the event and a reasonable basis for quantifying the resulting change in value. Examples of significant events that may occur after the close of the principal market on which a security is traded, or after the time of a price evaluation provided by a pricing service or a dealer, include:
| ■ | With respect to securities traded in foreign markets, significant trends in U.S. equity markets or in the trading of foreign securities index futures or options contracts; |
| ■ | With respect to price evaluations of fixed-income securities determined before the close of regular trading on the NYSE, actions by the Federal Reserve Open Market Committee and other significant trends in U.S. fixed-income markets; |
| ■ | Political or other developments affecting the economy or markets in which an issuer conducts its operations or its securities are traded; and |
| ■ | Announcements concerning matters such as acquisitions, recapitalizations, litigation developments, a natural disaster affecting the issuer's operations or regulatory changes or market developments affecting the issuer's industry. |
Annual Shareholder Report
The Trustees have approved the use of a pricing service to determine the fair value of equity securities traded principally in foreign markets when the Adviser determines that there has been a significant trend in the U.S. equity markets or in index futures trading. For other significant events, the Fund may seek to obtain more current quotations or price evaluations from alternative pricing sources. If a reliable alternative pricing source is not available, the Fund will determine the fair value of the investment using another method approved by the Trustees.
Repurchase Agreements
The Fund may invest in repurchase agreements for short-term liquidity purposes. It is the policy of the Fund to require the other party to a repurchase agreement to transfer to the Fund's custodian or sub-custodian eligible securities or cash with a market value (after transaction costs) at least equal to the repurchase price to be paid under the repurchase agreement. The eligible securities are transferred to accounts with the custodian or sub-custodian in which the Fund holds a “securities entitlement” and exercises “control” as those terms are defined in the Uniform Commercial Code. The Fund has established procedures for monitoring the market value of the transferred securities and requiring the transfer of additional eligible securities if necessary to equal at least the repurchase price. These procedures also allow the other party to require securities to be transferred from the account to the extent that their market value exceeds the repurchase price or in exchange for other eligible securities of equivalent market value.
The insolvency of the other party or other failure to repurchase the securities may delay the disposition of the underlying securities or cause the Fund to receive less than the full repurchase price. Under the terms of the repurchase agreement, any amounts received by the Fund in excess of the repurchase price and related transaction costs must be remitted to the other party.
The Fund may enter into repurchase agreements in which eligible securities are transferred into joint trading accounts maintained by the custodian or sub-custodian for investment companies and other clients advised by the Fund's Adviser and its affiliates. The Fund will participate on a pro rata basis with the other investment companies and clients in its share of the securities transferred under such repurchase agreements and in its share of proceeds from any repurchase or other disposition of such securities.
Investment Income, Gains and Losses, Expenses and Distributions
Investment transactions are accounted for on a trade-date basis. Realized gains and losses from investment transactions are recorded on an identified-cost basis. Interest income and expenses are accrued daily. Dividend income and distributions to shareholders are recorded on the ex-dividend date. Foreign dividends are recorded on the ex-dividend date or when the Fund is informed of the ex-dividend date. Positive or negative inflation adjustments on Treasury Inflation-Protected Securities are included in interest income. Distributions of net investment income are declared and paid annually. Non-cash dividends included in dividend income, if any, are recorded at fair value. The Fund invests in Emerging Markets Fixed Income Core Fund (EMCORE), a portfolio of Federated Core Trust II, L.P., which is a limited partnership established under the laws of the state of Delaware. The Fund records daily its proportionate share of income, expenses, realized and unrealized gains and losses from EMCORE. Investment income, realized and unrealized gains and losses, and certain fund-level expenses are allocated to each class based on relative average daily net assets, except that Class A
Annual Shareholder Report
Shares, Class C Shares, Class R Shares and Institutional Shares may bear distribution services fees, shareholder services fees, account administration fees and certain transfer and dividend disbursing agent fees unique to those classes. For the year ended July 31, 2012, transfer and dividend disbursing agent fees and account administration fees for the Fund were as follows:
| Transfer and
Dividend
Disbursing Agent
Fees Incurred | Transfer and
Dividend
Disbursing Agent
Fees Reimbursed | Account
Administration
Fees Incurred |
| Class A Shares | $84,293 | $(27,733) | $14,547 |
| Class C Shares | 45,949 | (7,083) | 45,843 |
| Class R Shares | 1,848 | — | — |
| Institutional Shares | 45,073 | (4,131) | — |
| TOTAL | $177,163 | $(38,947) | $60,390 |
Dividends are declared separately for each class. No class has preferential dividend rights; differences in per share dividend rates are generally due to differences in separate class expenses.
Premium and Discount Amortization/Paydown Gains and Losses
All premiums and discounts on fixed-income securities, other than mortgage-backed securities, are amortized/accreted using the effective interest rate method. Gains and losses realized on principal payment of mortgage-backed securities (paydown gains and losses) are classified as part of investment income.
Federal Taxes
It is the Fund's policy to comply with the Subchapter M provision of the Internal Revenue Code (the “Code”) and to distribute to shareholders each year substantially all of its income. Accordingly, no provision for federal income tax is necessary. As of and during the year ended July 31, 2012, the Fund did not have a liability for any uncertain tax positions. The Fund recognizes interest and penalties, if any, related to tax liabilities as income tax expense in the Statement of Operations. As of July 31, 2012, tax years 2009 through 2012 remain subject to examination by the Fund's major tax jurisdictions, which include the United States of America and the Commonwealth of Massachusetts.
When-Issued and Delayed Delivery Transactions
The Fund may engage in when-issued or delayed delivery transactions. The Fund records when-issued securities on the trade date and maintains security positions such that sufficient liquid assets will be available to make payment for the securities purchased. Securities purchased on a when-issued or delayed delivery basis are marked to market daily and begin earning interest on the settlement date. Losses may occur on these transactions due to changes in market conditions or the failure of counterparties to perform under the contract.
Swap Contracts
Swap contracts involve two parties that agree to exchange the returns (or the differential in rates of return) earned or realized on particular predetermined investments, instruments, indices or other measures. The gross returns to be exchanged or “swapped” between parties are generally calculated with respect to a “notional amount” for a predetermined period of
Annual Shareholder Report
time. The Fund enters into interest rate, total return, credit default, currency and other swap agreements. Risks may arise upon entering into swap agreements from the potential inability of the counterparties to meet the terms of their contract from unanticipated changes in the value of the swap agreement.
The Fund uses credit default swaps to manage exposure to a given issuer or sector by either selling protection to increase exposure, or buying protection to reduce exposure. The “buyer” in a credit default swap is obligated to pay the “seller” a periodic stream of payments over the term of the contract provided that no event of default on an underlying reference obligation has occurred. If an event of default occurs, the seller must pay the buyer the full notional value, or the “par value,” of the reference obligation in exchange for the reference obligation. In connection with these agreements, securities may be identified as collateral in accordance with the terms of the respective swap agreements to provide assets of value and recourse in the event of default or bankruptcy/insolvency. Recovery values are assumed by market makers considering either industry standard recovery rates or entity specific factors and considerations until a credit event occurs. If a credit event has occurred, the recovery value is typically determined by a facilitated auction whereby a minimum number of allowable broker bids, together with a specific valuation method, are used to calculate the settlement value. The maximum amount of the payment that may occur, as a result of a credit event payable by the protection seller, is equal to the notional amount of the underlying index or security. The Fund's maximum risk of loss from counterparty credit risk, either as the protection buyer or as the protection seller, is the fair value of the contract. This risk is mitigated by having a master netting arrangement between the Fund and the counterparty and by the posting of collateral by the counterparty to the Fund to cover the Fund's exposure to the counterparty.
Upfront payments received or paid by the Fund will be reflected as an asset or liability on the Statement of Assets and Liabilities. Changes in the value of swap contracts are included in “Swaps, at value” on the Statement of Assets and Liabilities, and periodic payments are reported as “Net realized gain (loss) on swap contracts” on the Statement of Operations.
At July 31, 2012, the Fund had no outstanding swap contracts.
The average notional amount of Swap contracts held by the Fund throughout the period was $1,538,462. This is based on amounts held as of each month-end throughout the fiscal period.
Futures Contracts
The Fund purchases and sells financial futures contracts to manage cash flows, enhance yield and to potentially reduce transaction costs. Upon entering into a financial futures contract with a broker, the Fund is required to deposit in a segregated account a specified amount of cash or U.S. government securities. Futures contracts are valued daily and unrealized gains or losses are recorded in a “variation margin” account. Daily, the Fund receives from or pays to the broker a specified amount of cash based upon changes in the variation margin account. When a contract is closed, the Fund recognizes a realized gain or loss. Futures contracts have market risks, including the risk that the change in the value of the contract may not correlate with the changes in the value of the underlying securities. There is minimal counterparty risk to the Fund since futures are exchange traded and the exchange's clearinghouse, as counterparty to all exchange traded futures, guarantees the futures against default.
Futures contracts outstanding at period end are listed after the Fund's Portfolio of Investments.
Annual Shareholder Report
The average notional value of long and short futures contracts held by the Fund throughout the period was $9,900,595 and $24,541,905, respectively. This is based on amounts held as of each month-end throughout the fiscal period.
Restricted Securities
The Fund may purchase securities which are considered restricted. Restricted securities are securities that either: (a) cannot be offered for public sale without first being registered, or being able to take advantage of an exemption from registration, under the Securities Act of 1933; or (b) are subject to contractual restrictions on public sales. In some cases, when a security cannot be offered for public sale without first being registered, the issuer of the restricted security has agreed to register such securities for resale, at the issuer's expense, either upon demand by the Fund or in connection with another registered offering of the securities. Many such restricted securities may be resold in the secondary market in transactions exempt from registration. Restricted securities may be determined to be liquid under criteria established by the Trustees. The Fund will not incur any registration costs upon such resales. The Fund's restricted securities are valued at the price provided by dealers in the secondary market or, if no market prices are available, at the fair value as determined in accordance with procedures established by and under the general supervision of the Trustees.
Additional information on restricted securities, excluding securities purchased under Rule 144A that have been deemed liquid by the Trustees, if applicable, held at July 31, 2012, is as follows:
| Security | Acquisition Date | Cost | Market Value |
Football Trust V, Pass Thru Cert.,
Series 144A, 5.350%, 10/05/2020 | 3/24/2010 | $200,000 | $220,289 |
Additional Disclosure Related to Derivative Instruments
| Fair Value of Derivative Instruments |
| Asset |
| Statement of
Assets and
Liabilities
Location | Fair
Value |
| Derivatives not accounted for as hedging instruments under ASC Topic 815 | | |
| Interest rate contracts | Receivable for daily
variation margin | $14,262* |
| * | Includes cumulative appreciation/depreciation of futures contracts as reported in the footnotes to the Portfolio of Investments. Only the current day's variation margin is reported within the Statement of Assets and Liabilities. |
Annual Shareholder Report
The Effect of Derivative Instruments on the Statement of Operations for the Year Ended July 31, 2012
| Amount of Realized Gain or (Loss) on Derivatives Recognized in Income |
| Credit
Default
Swaps | Futures | Total |
| Interest rate contracts | $— | $304,666 | $304,666 |
| Credit contracts | 35,881 | — | 35,881 |
| TOTAL | $35,881 | $304,666 | $340,547 |
| Change in Unrealized Appreciation or (Depreciation) on Derivatives Recognized in Income |
| Credit
Default
Swaps | Futures | Total |
| Interest rate contracts | $— | $23,764 | $23,764 |
| Credit contracts | 6,438 | — | 6,438 |
| TOTAL | $6,438 | $23,764 | $30,202 |
Other
The preparation of financial statements in conformity with GAAP requires management to make estimates and assumptions that affect the amounts of assets, liabilities, expenses and revenues reported in the financial statements. Actual results could differ from those estimated.
3. SHARES OF BENEFICIAL INTEREST
The following tables summarize share activity:
| Year Ended July 31 | 2012 | 2011 |
| Class A Shares: | Shares | Amount | Shares | Amount |
| Shares sold | 440,545 | $5,224,494 | 657,966 | $7,743,593 |
| Shares issued to shareholders in payment of distributions declared | 52,895 | 609,880 | 71,917 | 845,744 |
| Shares redeemed | (1,208,672) | (14,191,970) | (3,939,209) | (46,147,902) |
| NET CHANGE RESULTING FROM CLASS A SHARE TRANSACTIONS | (715,232) | $(8,357,596) | (3,209,326) | $(37,558,565) |
| Year Ended July 31 | 2012 | 2011 |
| Class C Shares: | Shares | Amount | Shares | Amount |
| Shares sold | 132,751 | $1,556,075 | 186,375 | $2,166,666 |
| Shares issued to shareholders in payment of distributions declared | 19,395 | 221,494 | 27,581 | 321,040 |
| Shares redeemed | (1,104,241) | (12,992,765) | (1,082,382) | (12,553,195) |
| NET CHANGE RESULTING FROM CLASS C SHARE TRANSACTIONS | (952,095) | $(11,215,196) | (868,426) | $(10,065,489) |
Annual Shareholder Report
| Year Ended July 31 | 2012 | 2011 |
| Class R Shares: | Shares | Amount | Shares | Amount |
| Shares sold | 3,336 | $40,659 | 3,648 | $44,081 |
| Shares issued to shareholders in payment of distributions declared | 345 | 3,971 | 626 | 7,358 |
| Shares redeemed | (15,330) | (176,806) | (11,620) | (138,465) |
| NET CHANGE RESULTING FROM CLASS R SHARE TRANSACTIONS | (11,649) | $(132,176) | (7,346) | $(87,026) |
| Year Ended July 31 | 2012 | 2011 |
| Institutional Shares: | Shares | Amount | Shares | Amount |
| Shares sold | 96,867 | $1,160,879 | 124,795 | $1,485,630 |
| Shares issued to shareholders in payment of distributions declared | 60,988 | 703,801 | 70,455 | 829,958 |
| Shares redeemed | (503,403) | (6,055,376) | (814,570) | (9,791,318) |
| NET CHANGE RESULTING FROM INSTITUTIONAL SHARE TRANSACTIONS | (345,548) | $(4,190,696) | (619,320) | $(7,475,730) |
| NET CHANGE RESULTING FROM TOTAL FUND SHARE TRANSACTIONS | (2,024,524) | $(23,895,664) | (4,704,418) | $(55,186,810) |
4. FEDERAL TAX INFORMATION
The timing and character of income and capital gain distributions are determined in accordance with income tax regulations, which may differ from GAAP. These differences are due primarily to differing treatments for partnership income, swap contracts, litigation payments, short-term capital gains distributions received and discount accretion/premium amortization on debt securities.
For the year ended July 31, 2012, permanent differences identified and reclassified among the components of net assets were as follows:
| Increase (Decrease) |
| Paid-In Capital | Undistributed
Net Investment
Income (Loss) | Accumulated
Net Realized
Gain (Loss) |
| $(30,581) | $30,751 | $(170) |
Net investment income (loss), net realized gains (losses), and net assets were not affected by this reclassification.
The tax character of distributions as reported on the Statement of Changes in Net Assets for the years ended July 31, 2012 and 2011, was as follows:
| 2012 | 2011 |
| Ordinary income | $1,674,080 | $2,196,165 |
Annual Shareholder Report
As of July 31, 2012, the components of distributable earnings on a tax basis were as follows:
| Undistributed ordinary income | $1,040,803 |
| Net unrealized appreciation | $6,641,692 |
| Capital loss carryforwards | $(55,832,905) |
The difference between book-basis and tax-basis net unrealized appreciation/depreciation is attributable to differing treatments for the deferral of losses on wash sales, deferral of paydown losses, discount accretion/premium amortization on debt securities, defaulted securities and partnership investments.
At July 31, 2012, the cost of investments for federal tax purposes was $119,913,183. The net unrealized appreciation of investments for federal tax purposes excluding futures contracts was $6,641,589. This consists of net unrealized appreciation from investments for those securities having an excess of value over cost of $10,402,868 and net unrealized depreciation from investments for those securities having an excess of cost over value of $3,761,279.
At July 31, 2012, the Fund had a capital loss carryforward of $55,832,905 which will reduce the Fund's taxable income arising from future net realized gains on investments, if any, to the extent permitted by the Code, thereby reducing the amount of distributions to shareholders which would otherwise be necessary to relieve the Fund of any liability for federal income tax. Pursuant to the Code, a net capital loss incurred in taxable years beginning on or before December 22, 2010, is characterized as short-term and may be carried forward for a maximum of eight tax years (“Carryforward Limit”), whereas a net capital loss incurred in taxable years beginning after December 22, 2010, retains its character as either short-term or long-term, does not expire and is required to be utilized prior to the losses which have a Carryforward Limit.
The following schedule summarizes the Fund's capital loss carryforwards and expiration years:
| Expiration Year | Short-Term | Long-Term | Total |
| 2017 | $24,852,999 | N/A | $24,852,999 |
| 2018 | $30,979,906 | N/A | $30,979,906 |
The Fund used capital loss carryforwards of $2,438,746 to offset capital gains realized during the year ended July 31, 2012.
5. INVESTMENT ADVISER FEE AND OTHER TRANSACTIONS WITH AFFILIATES
Investment Adviser Fee
The advisory agreement between the Fund and the Adviser provides for an annual fee equal to 0.75% of the Fund's average daily net assets. Subject to the terms described in the Expense Limitation note, the Adviser may voluntarily choose to waive any portion of its fee. For the year ended July 31, 2012, the Adviser voluntarily waived $239,821 of its fee. In addition, for the year ended July 31, 2012, an affiliate of the Adviser voluntarily reimbursed $38,947 of transfer and dividend disbursing agent fees and expenses.
Annual Shareholder Report
Certain of the Fund's assets are managed by Federated Investment Management Company (the “Sub-Adviser”). Under the terms of a sub-advisory agreement between the Adviser and the Sub-Adviser, the Sub-Adviser receives an allocable portion of the Fund's adviser fee. The fee is paid by the Adviser out of its resources and is not an incremental Fund expense. For the year ended July 31, 2012, the Sub-Adviser earned a fee of $114,008.
Administrative Fee
Federated Administrative Services (FAS), under the Administrative Services Agreement, provides the Fund with administrative personnel and services. The fee paid to FAS is based on the average aggregate daily net assets of certain Federated funds as specified below:
| Administrative Fee | Average Aggregate Daily Net Assets
of the Federated Funds |
| 0.150% | on the first $5 billion |
| 0.125% | on the next $5 billion |
| 0.100% | on the next $10 billion |
| 0.075% | on assets in excess of $20 billion |
The administrative fee received during any fiscal year shall be at least $150,000 per portfolio and $40,000 per each additional class of Shares. Subject to the terms described in the Expense Limitation note, FAS may voluntarily choose to waive any portion of its fee. For the year ended July 31, 2012, FAS waived $53,655 of its fee. The net fee paid to FAS was 0.161% of average daily net assets of the Fund. The Fund is currently being charged the minimum administrative fee; therefore the fee as a percentage of average daily net assets is greater than the amounts presented in the chart above.
Distribution Services Fee
The Fund has adopted a Distribution Plan (the “Plan”) pursuant to Rule 12b-1 under the Act. Under the terms of the Plan, the Fund will compensate Federated Securities Corp. (FSC), the principal distributor, from the daily net assets of the Fund's Class A Shares, Class C Shares and Class R Shares to finance activities intended to result in the sale of these shares. The Plan provides that the Fund may incur distribution expenses at the following percentages of average daily net assets annually, to compensate FSC:
| Share Class Name | Percentage of Average Daily
Net Assets of Class |
| Class A Shares | 0.05% |
| Class C Shares | 0.75% |
| Class R Shares | 0.50% |
Annual Shareholder Report
Subject to the terms described in the Expense Limitation note, FSC may voluntarily choose to waive any portion of its fee. For the year ended July 31, 2012, distribution services fees for the Fund were as follows:
| Distribution Services
Fees Incurred |
| Class C Shares | $290,484 |
| Class R Shares | 2,693 |
| TOTAL | $293,177 |
When FSC receives fees, it may pay some or all of them to financial intermediaries whose customers purchase shares. For the year ended July 31, 2012, FSC retained $19,114 of fees paid by the Fund. For the year ended July 31, 2012, the Fund's Class A Shares did not incur a distribution services fee; however it may begin to incur this fee upon approval of the Trustees.
Sales Charges
Front-end sales charges and contingent deferred sales charges (CDSC) do not represent expenses of the Fund. They are deducted from the proceeds of sales of Fund shares prior to investment or from redemption proceeds prior to remittance, as applicable. For the year ended July 31, 2012, FSC retained $2,624 in sales charges from the sale of Class A Shares. FSC also retained $1,278 of CDSC relating to redemptions of Class C Shares.
Shareholder Services Fee
The Fund may pay fees (“Service Fees”) up to 0.25% of the average daily net assets of the Fund's Class A Shares and Class C Shares to financial intermediaries or to Federated Shareholder Services Company (FSSC) for providing services to shareholders and maintaining shareholder accounts. Subject to the terms described in the Expense Limitation note, FSSC may voluntarily reimburse the Fund for Service Fees. For the year ended July 31, 2012, Service Fees for the Fund were as follows:
| Service
Fees
Incurred |
| Class A Shares | $102,259 |
| Class C Shares | 48,475 |
| TOTAL | $150,734 |
For the year ended July 31, 2012, FSSC did not receive any fees paid by the Fund.
Expense Limitation
The Adviser and its affiliates (which may include FSC, FAS and FSSC) have voluntarily agreed to waive their fees and/or reimburse expenses so that the total annual fund operating expenses (as shown in the financial highlights) paid by the Fund's Class A Shares, Class C Shares, Class R Shares and Institutional Shares (after the voluntary waivers and reimbursements) will not exceed 1.30%, 2.05%, 1.80% and 1.05% (the “Fee Limit”), respectively, up to but not including the later of (the “Termination Date”): (a) October 1, 2013; or (b) the date of the Fund's next effective Prospectus. While the Adviser and its affiliates currently do not anticipate terminating or increasing these arrangements prior to the Termination Date, these arrangements may only be terminated or the Fee Limit increased prior to the Termination Date with the agreement of the Trustees.
Annual Shareholder Report
General
Certain Officers and Trustees of the Trust are Officers and Directors or Trustees of the above companies.
Transactions Involving Affiliated Holdings
Affiliated holdings are mutual funds which are managed by the Adviser or an affiliate of the Adviser. The Adviser has agreed to reimburse the Fund for certain investment adviser fees as a result of transactions in other affiliated mutual funds. For the year ended July 31, 2012, the Adviser reimbursed $8,051. Transactions involving the affiliated holdings during the year ended July 31, 2012, were as follows:
| Emerging
Markets
Fixed
Income
Core Fund | Federated
Mortgage
Core
Portfolio | Federated
Prime Value
Obligations
Fund,
Institutional
Shares | Federated
Project
and Trade
Finance
Core Fund | High
Yield
Bond
Portfolio | Total of
Affiliated
Transactions |
| Balance of Shares Held 7/31/2011 | 42,579 | 836,010 | 7,041,024 | 80,475 | 691,081 | 8,691,169 |
| Purchases/Additions | 17,057 | 734,133 | 57,003,761 | 25,064 | 273,661 | 58,053,676 |
| Sales/ Reductions | 16,595 | 458,355 | 60,345,204 | 10,040 | 596,186 | 61,426,380 |
| Balance of Shares Held 7/31/2012 | 43,041 | 1,111,788 | 3,699,581 | 95,499 | 368,556 | 5,318,465 |
| Value | $1,421,437 | $11,406,940 | $3,699,581 | $933,977 | $2,439,838 | $19,901,773 |
| Dividend Income/ Allocated Investment Income | $87,924 | $346,130 | $13,023 | $45,937 | $298,594 | $791,608 |
Capital Gain Distributions/
Allocated Gain | $13,468 | $— | $— | $4,779 | $— | $18,247 |
6. Investment TRANSACTIONS
Purchases and sales of investments, excluding long-term U.S. government securities and short-term obligations, for the year ended July 31, 2012, were as follows:
| Purchases | $180,162,527 |
| Sales | $198,366,536 |
7. LINE OF CREDIT
The Fund participates in a $100,000,000 unsecured, uncommitted revolving line of credit (LOC) agreement with PNC Bank. The LOC was made available for extraordinary or emergency purposes, primarily for financing redemption payments. Borrowings are charged interest at a rate offered to the Fund by PNC Bank at the time of the borrowing. As of July 31, 2012, there were no outstanding loans. During the year ended July 31, 2012, the Fund did not utilize the LOC.
Annual Shareholder Report
8. INTERFUND LENDING
Pursuant to an Exemptive Order issued by the Securities and Exchange Commission, the Fund, along with other funds advised by subsidiaries of Federated Investors, Inc., may participate in an interfund lending program. This program provides an alternative credit facility allowing the Fund to borrow from other participating affiliated funds. As of July 31, 2012, there were no outstanding loans. During the year ended July 31, 2012, the program was not utilized.
9. Subsequent events
On August 15, 2012, the Trustees approved the elimination of minimum administrative personnel and services fees effective September 1, 2012. Prior to this date, the administrative fee received during any fiscal year was at least $150,000 per portfolio and $40,000 per each additional class of Shares.
Management has evaluated subsequent events through the date the financial statements were issued, and determined that no additional events have occurred that require disclosure.
10. FEDERAL TAX INFORMATION (UNAUDITED)
For the fiscal year ended July 31, 2012, 90.50% of total ordinary income distributions made by the Fund are qualifying dividends which may be subject to a maximum tax rate of 15%, as provided for by the Jobs and Growth Tax Relief Act of 2003. Complete information is reported in conjunction with the reporting of your distributions on Form 1099-DIV.
Of the ordinary income distributions made by the Fund during the year ended July 31, 2012, 74.21% qualify for the dividend received deduction available to corporate shareholders.
Annual Shareholder Report
Report of Independent Registered Public Accounting Firm
TO THE BOARD OF trustees OF Federated MDt series AND SHAREHOLDERS OF federated mdt Balanced fund:
We have audited the accompanying statement of assets and liabilities of Federated MDT Balanced Fund (the “Fund”) (one of the portfolios constituting Federated MDT Series), including the portfolio of investments, as of July 31, 2012, and the related statement of operations for the year then ended, the statement of changes in net assets for each of the two years in the period then ended, and the financial highlights for each of the five years in the period then ended. These financial statements and financial highlights are the responsibility of the Fund's management. Our responsibility is to express an opinion on these financial statements and financial highlights based on our audits.
We conducted our audits in accordance with standards of the Public Company Accounting Oversight Board (United States). Those standards require that we plan and perform the audit to obtain reasonable assurance about whether the financial statements and financial highlights are free of material misstatement. We were not engaged to perform an audit of the Fund's internal control over financial reporting. Our audits included consideration of internal control over financial reporting as a basis for designing audit procedures that are appropriate in the circumstances, but not for the purpose of expressing an opinion on the effectiveness of the Fund's internal control over financial reporting. Accordingly, we express no such opinion. An audit also includes examining, on a test basis, evidence supporting the amounts and disclosures in the financial statements and financial highlights, assessing the accounting principles used and significant estimates made by management, and evaluating the overall financial statement presentation. Our procedures included confirmation of securities owned as of July 31, 2012, by correspondence with the custodian and others, or by other appropriate auditing procedures where replies from others were not received. We believe that our audits provide a reasonable basis for our opinion.
In our opinion, the financial statements and financial highlights referred to above present fairly, in all material respects, the financial position of Federated MDT Balanced Fund, a portfolio of Federated MDT Series, at July 31, 2012, the results of its operations for the year then ended, the changes in its net assets for each of the two years in the period then ended, and the financial highlights for each of the five years in the period then ended, in conformity with U.S. generally accepted accounting principles.
Boston, Massachusetts
September 24, 2012
Annual Shareholder Report
Shareholder Expense Example (unaudited)
As a shareholder of the Fund, you incur two types of costs: (1) transaction costs, including sales charges (loads) on purchase or redemption payments; and (2) ongoing costs, including management fees and to the extent applicable, distribution (12b-1) fees and/or shareholder services fees and other Fund expenses. This Example is intended to help you to understand your ongoing costs (in dollars) of investing in the Fund and to compare these costs with the ongoing costs of investing in other mutual funds. It is based on an investment of $1,000 invested at the beginning of the period and held for the entire period from February 1, 2012 to July 31, 2012.
ACTUAL EXPENSES
The first section of the table below provides information about actual account values and actual expenses. You may use the information in this section, together with the amount you invested, to estimate the expenses that you incurred over the period. Simply divide your account value by $1,000 (for example, an $8,600 account value divided by $1,000 = 8.6), then multiply the result by the number in the first section under the heading entitled “Expenses Paid During Period” to estimate the expenses attributable to your investment during this period.
HYPOTHETICAL EXAMPLE FOR COMPARISON PURPOSES
The second section of the table below provides information about hypothetical account values and hypothetical expenses based on the Fund's actual expense ratio and an assumed rate of return of 5% per year before expenses, which is not the Fund's actual return. Thus, you should not use the hypothetical account values and expenses to estimate the actual ending account balance or your expenses for the period. Rather, these figures are required to be provided to enable you to compare the ongoing costs of investing in the Fund with other funds. To do so, compare this 5% hypothetical example with the 5% hypothetical examples that appear in the shareholder reports of the other funds.
Annual Shareholder Report
Please note that the expenses shown in the table are meant to highlight your ongoing costs only and do not reflect any transaction costs, such as sales charges (loads) on purchase or redemption payments. Therefore, the second section of the table is useful in comparing ongoing costs only, and will not help you determine the relative total costs of owning different funds. In addition, if these transaction costs were included, your costs would have been higher.
| Beginning
Account Value
2/1/2012 | Ending
Account Value
7/31/2012 | Expenses Paid
During Period1 |
| Actual: | | | |
| Class A Shares | $1,000 | $1,020.90 | $6.53 |
| Class C Shares | $1,000 | $1,016.90 | $10.28 |
| Class R Shares | $1,000 | $1,018.40 | $9.03 |
| Institutional Shares | $1,000 | $1,021.70 | $5.28 |
Hypothetical (assuming a 5% return
before expenses): | | | |
| Class A Shares | $1,000 | $1,018.40 | $6.52 |
| Class C Shares | $1,000 | $1,014.67 | $10.27 |
| Class R Shares | $1,000 | $1,015.91 | $9.02 |
| Institutional Shares | $1,000 | $1,019.64 | $5.27 |
| 1 | Expenses are equal to the Fund's annualized net expense ratios, multiplied by the average account value over the period, multiplied by 182/366 (to reflect the one-half-year period). The annualized net expense ratios are as follows: |
| Class A Shares | 1.30% |
| Class C Shares | 2.05% |
| Class R Shares | 1.80% |
| Institutional Shares | 1.05% |
Annual Shareholder Report
Board of Trustees and Trust Officers
The Board of Trustees is responsible for managing the Trust's business affairs and for exercising all the Trust's powers except those reserved for the shareholders. The following tables give information about each Trustee and the senior officers of the Fund. Where required, the tables separately list Trustees who are “interested persons” of the Fund (i.e., “Interested” Trustees) and those who are not (i.e., “Independent” Trustees). Unless otherwise noted, the address of each person listed is Federated Investors Tower, 1001 Liberty Avenue, Pittsburgh, PA 15222. The address of all Independent Trustees listed is 4000 Ericsson Drive, Warrendale, PA 15086-7561; Attention: Mutual Fund Board. As of December 31, 2011, the Trust comprised five portfolio(s), and the Federated Fund Family consisted of 43 investment companies (comprising 134 portfolios). Unless otherwise noted, each Officer is elected annually. Unless otherwise noted, each Trustee oversees all portfolios in the Federated Fund Family and serves for an indefinite term. The Fund's Statement of Additional Information includes additional information about Trust Trustees and is available, without charge and upon request, by calling 1-800-341-7400.
Interested TRUSTEES Background
Name
Birth Date
Positions Held with Trust
Date Service Began | Principal Occupation(s) for Past Five Years,
Other Directorships Held and Previous Position(s) |
John F. Donahue*
Birth Date: July 28, 1924
Trustee
Began serving: June 2006 | Principal Occupations: Director or Trustee of the Federated Fund Family; Chairman and Director, Federated Investors, Inc.; Chairman of the Federated Fund Family's Executive Committee.
Previous Positions: Chairman of the Federated Fund Family; Trustee, Federated Investment Management Company; Chairman and Director, Federated Investment Counseling. |
J. Christopher Donahue*
Birth Date: April 11, 1949
President and Trustee
Began serving: May 2006 | Principal Occupations: Principal Executive Officer and President of the Federated Fund Family; Director or Trustee of some of the Funds in the Federated Fund Family; President, Chief Executive Officer and Director, Federated Investors, Inc.; Chairman and Trustee, Federated Investment Management Company; Trustee, Federated Investment Counseling; Chairman and Director, Federated Global Investment Management Corp.; Chairman, Federated Equity Management Company of Pennsylvania and Passport Research, Ltd. (investment advisory subsidiary of Federated); Trustee, Federated Shareholder Services Company; Director, Federated Services Company.
Previous Positions: President, Federated Investment Counseling; President and Chief Executive Officer, Federated Investment Management Company, Federated Global Investment Management Corp. and Passport Research, Ltd. |
| * | Family relationships and reasons for “interested” status: John F. Donahue is the father of J. Christopher Donahue; both are “interested” due to their beneficial ownership of shares of Federated Investors, Inc. and the positions they hold with Federated and its subsidiaries. |
Annual Shareholder Report
INDEPENDENT TRUSTEES Background
Name
Birth Date
Positions Held with Trust
Date Service Began | Principal Occupation(s) for Past Five Years,
Other Directorships Held, Previous Position(s) and Qualifications |
Nicholas P. Constantakis, CPA
Birth Date: September 3, 1939
Trustee
Began serving: June 2006 | Principal Occupation: Director or Trustee of the Federated Fund Family.
Other Directorship Held: Director, Chairman of the Audit Committee, and member of the Compensation Committee, Michael Baker Corporation (architecture, engineering and construction services).
Previous Position: Partner, Andersen Worldwide SC.
Qualifications: Public accounting and director experience. |
John F. Cunningham
Birth Date: March 5, 1943
Trustee
Began serving: June 2006 | Principal Occupation: Director or Trustee of the Federated Fund Family.
Other Directorships Held: Chairman, President and Chief Executive Officer, Cunningham & Co., Inc. (strategic business consulting); Trustee Associate, Boston College.
Previous Positions: Director, Redgate Communications and EMC Corporation (computer storage systems); Chairman of the Board and Chief Executive Officer, Computer Consoles, Inc.; President and Chief Operating Officer, Wang Laboratories; Director, First National Bank of Boston; Director, Apollo Computer, Inc.
Qualifications: Business management and director experience. |
Maureen Lally-Green
Birth Date: July 5, 1949
Trustee
Began serving: August 2009 | Principal Occupations: Director or Trustee of the Federated Fund Family; Director, Office of Church Relations, Diocese of Pittsburgh; Adjunct Professor of Law, Duquesne University School of Law.
Other Directorships Held: Director, Auberle; Member, Pennsylvania State Board of Education; Director, Saint Vincent College; Director, Ireland Institute of Pittsburgh; Chair and Director, UPMC Mercy Hospital; Regent, St. Vincent Seminary; Director, Epilepsy Foundation of Western and Central Pennsylvania; Director, Saint Thomas More Society, Allegheny County; Director, Our Campaign for the Church Alive, Inc.
Previous Position: Pennsylvania Superior Court Judge.
Qualifications: Legal and director experience. |
Peter E. Madden
Birth Date: March 16, 1942
Trustee
Began serving: June 2006 | Principal Occupation: Director or Trustee, and Chairman of the Board of Directors or Trustees, of the Federated Fund Family.
Previous Positions: Representative, Commonwealth of Massachusetts General Court; President, Chief Operating Officer and Director, State Street Bank and Trust Company and State Street Corporation (retired); Director, VISA USA and VISA International; Chairman and Director, Massachusetts Bankers Association; Director, Depository Trust Corporation; Director, The Boston Stock Exchange.
Qualifications: Business management, mutual fund services and director experience. |
Annual Shareholder Report
Name
Birth Date
Positions Held with Trust
Date Service Began | Principal Occupation(s) for Past Five Years,
Other Directorships Held, Previous Position(s) and Qualifications |
Charles F. Mansfield, Jr.
Birth Date: April 10, 1945
Trustee
Began serving: June 2006 | Principal Occupations: Director or Trustee of the Federated Fund Family; Management Consultant.
Previous Positions: Chief Executive Officer, PBTC International Bank; Partner, Arthur Young & Company (now Ernst & Young LLP); Chief Financial Officer of Retail Banking Sector, Chase Manhattan Bank; Senior Vice President, HSBC Bank USA (formerly Marine Midland Bank); Vice President, Citibank; Assistant Professor of Banking and Finance, Frank G. Zarb School of Business, Hofstra University; Executive Vice President, DVC Group, Inc. (marketing, communications and technology).
Qualifications: Banking, business management, education and director experience. |
Thomas M. O'Neill
Birth Date: June 14, 1951
Trustee
Began serving: October 2006 | Principal Occupations: Director or Trustee, Vice Chairman of the Audit Committee of the Federated Fund Family; Sole Proprietor, Navigator Management Company (investment and strategic consulting).
Other Directorships Held: Board of Overseers, Children's Hospital of Boston; Visiting Committee on Athletics, Harvard College; Board of Directors, Medicines for Humanity; Board of Directors, The Golisano Children's Museum of Naples, Florida.
Previous Positions: Chief Executive Officer and President, Managing Director and Chief Investment Officer, Fleet Investment Advisors; President and Chief Executive Officer, Aeltus Investment Management, Inc.; General Partner, Hellman, Jordan Management Co., Boston, MA; Chief Investment Officer, The Putnam Companies, Boston, MA; Credit Analyst and Lending Officer, Fleet Bank; Director and Consultant, EZE Castle Software (investment order management software); Director, Midway Pacific (lumber).
Qualifications: Business management, mutual fund, director and investment experience. |
John S. Walsh
Birth Date: November 28, 1957
Trustee
Began serving: June 2006 | Principal Occupations: Director or Trustee, Chairman of the Audit Committee of the Federated Fund Family; President and Director, Heat Wagon, Inc. (manufacturer of construction temporary heaters); President and Director, Manufacturers Products, Inc. (distributor of portable construction heaters); President, Portable Heater Parts, a division of Manufacturers Products, Inc.
Previous Position: Vice President, Walsh & Kelly, Inc.
Qualifications: Business management and director experience. |
Annual Shareholder Report
OFFICERS
Name
Birth Date
Address
Positions Held with Trust
Date Service Began | Principal Occupation(s) for Past Five Years
and Previous Position(s) |
John W. McGonigle
Birth Date: October 26, 1938
Secretary
Began serving: May 2006 | Principal Occupations: Executive Vice President and Secretary of the Federated Fund Family; Vice Chairman, Executive Vice President, Secretary and Director, Federated Investors, Inc.
Previous Positions: Trustee, Federated Investment Management Company and Federated Investment Counseling; Director, Federated Global Investment Management Corp., Federated Services Company and Federated Securities Corp. |
Richard A. Novak
Birth Date: December 25, 1963
TREASURER
Began serving: May 2006 | Principal Occupations: Principal Financial Officer and Treasurer of the Federated Fund Family; Senior Vice President, Federated Administrative Services; Financial and Operations Principal for Federated Securities Corp., Edgewood Services, Inc. and Southpointe Distribution Services, Inc.
Previous Positions: Controller of Federated Investors, Inc.; Vice President, Finance of Federated Services Company; held various financial management positions within The Mercy Hospital of Pittsburgh; Auditor, Arthur Andersen & Co. |
Brian P. Bouda
Birth Date: February 28, 1947
CHIEF COMPLIANCE OFFICER AND SENIOR VICE PRESIDENT
Began serving: June 2006 | Principal Occupations: Senior Vice President and Chief Compliance Officer of the Federated Fund Family; Vice President and Chief Compliance Officer of Federated Investors, Inc. and Chief Compliance Officer of its subsidiaries. Mr. Bouda joined Federated in 1999 and is a member of the American Bar Association and the State Bar Association of Wisconsin. |
Stephen F. Auth
Birth Date: September 3, 1956
450 Lexington Avenue
Suite 3700
New York, NY 10017-3943
CHIEF INVESTMENT OFFICER
Began serving: June 2012 | Principal Occupations: Stephen F. Auth is Chief Investment Officer of this Fund and various other Funds in the Federated Fund Complex; Executive Vice President, Federated Investment Counseling, Federated Global Investment Management Corp. and Federated Equity Management Company of Pennsylvania.
Previous Positions: Executive Vice President, Federated Investment Management Company and Passport Research, Ltd. (investment advisory subsidiary of Federated); Senior Vice President, Global Portfolio Management Services Division; Senior Vice President, Federated Investment Management Company and Passport Research, Ltd.; Senior Managing Director and Portfolio Manager, Prudential Investments. |
Robert J. Ostrowski
Birth Date: April 26, 1963
Chief Investment Officer
Began serving: June 2012 | Principal Occupations: Robert J. Ostrowski joined Federated in 1987 as an Investment Analyst and became a Portfolio Manager in 1990. He was named Chief Investment Officer of taxable fixed-income products in 2004 and also serves as a Senior Portfolio Manager. Mr. Ostrowski became an Executive Vice President of the Fund's Sub-Adviser in 2009 and served as a Senior Vice President of the Fund's Sub-Adviser from 1997 to 2009. Mr. Ostrowski has received the Chartered Financial Analyst designation. He received his M.S. in Industrial Administration from Carnegie Mellon University. |
Annual Shareholder Report
Name
Birth Date
Address
Positions Held with Trust
Date Service Began | Principal Occupation(s) for Past Five Years
and Previous Position(s) |
John F. Sherman
Birth Date: August 28, 1967
125 High Street
Oliver Tower
21st Floor
Boston, MA 02110-2704
Vice President
Began serving: June 2012 | Principal Occupations: John F. Sherman has been the Fund's Portfolio Manager since October 2002. Mr. Sherman joined MDT Advisers Investment Team in 2000. He is Vice President of the Trust with respect to the Fund. Mr. Sherman is a member of the CFA Institute and the Boston Security Analysts Society. He received a B.S.B.A. from North Adams State College and an M.B.A. from Boston University Graduate School of Management. |
Annual Shareholder Report
Evaluation and Approval of Advisory Contract–May 2012
FEDERATED MDT BALANCED FUND (the “Fund”)
Following a review and recommendation of approval by the Fund's independent trustees, the Fund's Board reviewed and approved at its May 2012 meetings the Fund's investment advisory and subadvisory contracts for an additional one-year term. The Board's decision regarding these contracts reflects the exercise of its business judgment on whether to continue the existing arrangements.
In this connection, the Federated Funds' Board had previously appointed a Senior Officer, whose duties include specified responsibilities relating to the process by which advisory fees are to be charged to a Federated fund. The Senior Officer has the authority to retain consultants, experts, or staff as may be reasonably necessary to assist in the performance of his duties, reports directly to the Board, and may be terminated only with the approval of a majority of the independent members of the Board. The Senior Officer prepared and furnished to the Board an independent, written evaluation that covered topics discussed below (the “Evaluation”). The Board considered that Evaluation, along with other information, in deciding to approve the advisory and subadvisory contracts.
The Board is also familiar with and considered judicial decisions concerning allegedly excessive investment advisory fees, which have indicated that the following factors may be relevant to an Adviser's fiduciary duty with respect to its receipt of compensation from a fund: the nature and quality of the services provided by the Adviser to a fund and its shareholders, including the performance and expenses of the fund and of comparable funds; the Adviser's cost of providing the services, including the profitability to the Adviser of providing advisory services to a fund; the extent to which the Adviser may realize “economies of scale” as a fund grows larger and, if such economies exist, whether they have been shared with a fund and its shareholders; any “fall-out financial benefits” that accrue to the Adviser because of its relationship with a fund (including research services received from brokers that execute fund trades and any fees paid to affiliates of the Adviser for services rendered to a fund); comparative fee structures, including a comparison of fees paid to the Adviser with those paid by similar funds; and the extent to which the Board members are fully informed about all facts the Board deems relevant to its consideration of the Adviser's services and fees. Consistent with these judicial decisions, the Board also considered management fees (including any components thereof) charged to institutional and other clients of the Adviser and subadviser for what might be viewed as like services. The Board was aware of these factors and was guided by them in its review of the Fund's advisory and subadvisory contracts to the extent it considered them to be appropriate and relevant, as discussed further below.
Annual Shareholder Report
The Board considered and weighed these circumstances in light of its substantial accumulated experience in governing the Fund and working with Federated on matters relating to the Federated funds, and was assisted in its deliberations by independent legal counsel. Throughout the year, and in connection with its May meetings, the Board requested and received substantial and detailed information about the Fund and the Federated organization that was in addition to the extensive materials that comprise and accompany the Senior Officer's Evaluation. Federated provided much of this information at each regular meeting of the Board, and furnished additional substantial information in connection with the May meeting at which the Board's formal review of the advisory and subadvisory contracts occurred. At this May meeting, senior management of the Adviser also met with the independent trustees and their counsel to discuss the materials presented and any other matters thought relevant by the Adviser or the trustees. Between regularly scheduled meetings, the Board also received information on particular matters as the need arose. Thus, the Board's consideration of the advisory and subadvisory contracts included review of the Senior Officer's Evaluation, accompanying data and additional information covering such matters as: the Adviser's and subadviser's investment philosophy, revenue, profitability, personnel and processes; investment and operating strategies; the Fund's short- and long-term performance (in absolute terms, both on a gross basis and net of expenses, as well as in relationship to its particular investment program and certain competitor or “peer group” funds and/or other benchmarks, as appropriate), and comments on the reasons for performance; the Fund's investment objectives; the Fund's expenses (including the advisory fee itself and the overall expense structure of the Fund, both in absolute terms and relative to similar and/or competing funds, with due regard for contractual or voluntary expense limitations); the use and allocation of brokerage commissions derived from trading the Fund's portfolio securities (if any); and the nature, quality and extent of the advisory and other services provided to the Fund by the Adviser and its affiliates. The Board also considered the preferences and expectations of Fund shareholders; the entrepreneurial risk assumed by the Adviser in sponsoring the funds; the continuing state of competition in the mutual fund industry and market practices; the range of comparable fees for similar funds in the mutual fund industry; the Fund's relationship to the Federated family of funds which include a comprehensive array of funds with different investment objectives, policies and strategies which are available for exchange without the incurrence of additional sales charges; compliance and audit reports concerning the Federated funds and the Federated companies that service them (including communications from regulatory agencies), as well as Federated's responses to any issues raised therein; and relevant developments in the mutual fund industry and how the Federated
Annual Shareholder Report
funds and/or Federated are responding to them. The Board's evaluation process is evolutionary. The criteria considered and the emphasis placed on relevant criteria change in recognition of changing circumstances in the mutual fund marketplace.
While mindful that courts have cautioned against giving such comparisons too much weight, the Board has found the use of comparisons of the Fund's fees and expenses to other mutual funds with comparable investment programs to be relevant, given the high degree of competition in the mutual fund business. The Board focused on comparisons with other similar mutual funds more heavily than non-mutual fund products or services because it is believed that they are more relevant. For example, other mutual funds are the products most like the Fund, they are readily available to Fund shareholders as alternative investment vehicles, and they are the type of investment vehicle in fact chosen and maintained by the Fund's investors. The range of their fees and expenses therefore appears to be a generally reliable indication of what consumers have found to be reasonable in the precise marketplace in which the Fund competes. In this regard, the Senior Officer has reviewed Federated's fees for providing advisory services to products outside the Federated family of funds (e.g., institutional and separate accounts). He concluded that mutual funds and institutional accounts are inherently different products. Those differences include, but are not limited to, different types of targeted investors; being subject to different laws and regulations; different legal structures; different average account sizes; different associated costs; different portfolio management techniques made necessary by different cash flows; and portfolio manager time spent in review of securities pricing. The Senior Officer did not consider these fee schedules to be determinative in judging the appropriateness of mutual fund advisory contracts.
The Fund's ability to deliver competitive performance when compared to its peer group was also deemed to be relevant by the Board as a useful indicator of how the Adviser is executing the Fund's investment program, which in turn assisted the Board in reaching a conclusion that the nature, extent, and quality of the Adviser's investment management services were such as to warrant continuation of the advisory and subadvisory contracts.
The Senior Officer reviewed information compiled by Federated, using data supplied by independent fund ranking organizations, regarding the performance of, and fees charged by, other mutual funds, noting his view that comparisons to fund peer groups are relevant in judging the reasonableness of proposed fees. He also observed that certain funds may exhibit important differences in their objectives and management techniques when compared to other funds placed in the same peer group by ranking organizations, noting in this connection that the Fund's quantitative investment program is of such a type.
Annual Shareholder Report
The Fund's performance fell below the median of the relevant peer group for the one-year, three-year and five-year periods covered in the Evaluation. The Board discussed the Fund's performance with the Adviser and recognized the efforts being undertaken by the Adviser. The Board will continue to monitor these efforts and the performance of the Fund.
The Board also received financial information about Federated, including information regarding the compensation and benefits Federated derived from its relationships with the Federated funds. This information covered not only the fees under the advisory contracts, but also fees received by Federated's subsidiaries for providing other services to the Federated funds under separate contracts (e.g., for serving as the Federated funds' administrator). The information also detailed any indirect benefit Federated may derive from its receipt of research services from brokers who execute Federated fund trades. In addition, the Board considered the fact that, in order for a fund to be competitive in the marketplace, Federated and its affiliates frequently waived fees and/or reimbursed expenses and have disclosed to fund investors and/or indicated to the Board their intention to do so in the future, where appropriate. Moreover, the Board receives regular reporting as to the institution or elimination of these voluntary waivers.
Federated furnished information, requested by the Senior Officer, that reported revenues on a fund-by-fund basis and made estimates of the allocation of expenses on a fund-by-fund basis, using allocation methodologies specified by the Senior Officer. The Senior Officer noted that, although they may apply consistent allocation processes, the inherent difficulties in allocating costs (and the unavoidable arbitrary aspects of that exercise) and the lack of consensus on how to allocate those costs may render such allocation information unreliable. The allocation information was considered in the analysis by the Board but was determined to be of limited use.
The Board and the Senior Officer also reviewed information compiled by Federated comparing profitability information for Federated to other publicly held fund management companies. In this regard, the Senior Officer noted the limited availability of such information, but nonetheless concluded that Federated's profit margins did not appear to be excessive.
The Senior Officer's Evaluation also discussed the notion of possible realization of “economies of scale” as a fund grows larger. The Board considered in this regard that the Adviser has made significant and long-term investments in areas that support all of the Federated funds, such as personnel and processes for the portfolio management, shareholder services, compliance, internal audit, and risk management functions; and systems technology; and that the benefits of these efforts (as well as any economies, should they exist) were likely to be enjoyed by the fund complex as a whole. Finally, the Board also noted the absence of any applicable regulatory or industry guidelines on this subject, which (as discussed in the Senior Officer's Evaluation) is compounded by the
Annual Shareholder Report
lack of any common industry practice or general pattern with respect to structuring fund advisory fees with “breakpoints” that serve to reduce the fee as the fund attains a certain size. The Senior Officer did not recommend institution of breakpoints in pricing Federated's fund advisory services at this time.
It was noted in the materials for the Board meeting that for the period covered by the Evaluation, the Fund's investment advisory fee, after waivers and expense reimbursements, if any, was above the median of the relevant peer group. The Board reviewed the fees and other expenses of the Fund with the Adviser and was satisfied that the overall expense structure of the Fund remained competitive. In this regard, the Board had been previously advised that, while comparisons to fund peer groups are relevant in judging the reasonableness of advisory fees, the Fund's quantitative focus makes fee and expense comparisons particularly difficult. Although the Fund's advisory fee was above the median of the peer range, the peer group of funds varied widely in their complexity, and the management of the Fund is among the more complex relative to its peers. The Board will continue to monitor advisory fees and other expenses borne by the Fund.
The Senior Officer noted that, considering the totality of the circumstances, and all of the factors referenced within his Evaluation, he had concluded that, subject to comments and recommendations made within his Evaluation, his observations and the information accompanying the Evaluation supported a finding by the Board that the management fees for each of the funds was reasonable and that Federated appeared to provide appropriate advisory and administrative services to the Fund for the fees paid. Under these circumstances, no changes were recommended to, and no objection was raised to, the continuation of the Fund's advisory and subadvisory contracts.
In its decision to continue an existing investment advisory contract, the Board was mindful of the potential disruptions of the Fund's operations and various risks, uncertainties and other effects that could occur as a result of a decision to terminate or not renew an advisory contract. In particular, the Board recognized that many shareholders have invested in the Fund on the strength of the Adviser's industry standing and reputation and with the expectation that the Adviser will have a continuing role in providing advisory services to the Fund. Thus, the Board's approval of the advisory contract reflected the fact that it is the shareholders who have effectively selected the Adviser by virtue of having invested in the Fund. The Board concluded that, in light of the factors discussed above, including the nature, quality and scope of the services provided to the Fund by the Adviser and its affiliates, continuation of the advisory contract was appropriate.
Annual Shareholder Report
The Board based its decision to approve the advisory and subadvisory contracts on the totality of the circumstances and relevant factors and with a view to past and future long-term considerations. Not all of the factors and considerations identified above were necessarily relevant to the Fund, nor did the Board consider any one of them to be determinative. With respect to the factors that were relevant, the Board's decision to approve the contract reflects its determination that Federated's performance and actions provided a satisfactory basis to support the decision to continue the existing arrangements.
Annual Shareholder Report
Voting Proxies on Fund Portfolio Securities
A description of the policies and procedures that the Fund uses to determine how to vote proxies, if any, relating to securities held in the Fund's portfolio is available, without charge and upon request, by calling 1-800-341-7400. A report on “Form N-PX” of how the Fund voted any such proxies during the most recent 12-month period ended June 30 is available from Federated's website at FederatedInvestors.com. To access this information from the home page, select “All” under “Asset Classes.” Select a fund name and share class, if applicable, to go to the Fund Overview page. On the Fund Overview page, select the “Documents” tab. At the bottom of that page, select “Proxy Voting Record Report (Form N-PX).” Form N-PX filings are also available at the SEC's website at www.sec.gov.
Quarterly Portfolio Schedule
The Fund files with the SEC a complete schedule of its portfolio holdings, as of the close of the first and third quarters of its fiscal year, on “Form N-Q.” These filings are available on the SEC's website at www.sec.gov and may be reviewed and copied at the SEC's Public Reference Room in Washington, DC. (Call 1-800-SEC-0330 for information on the operation of the Public Reference Room.) You may also access this information from the “Products” section of Federated's website at FederatedInvestors.com. From the home page, select “All” under “Asset Classes.” Select a fund name and share class, if applicable, to go to the Fund Overview page. On the Fund Overview page, select the “Documents” tab. At the bottom of that page, select “Form N-Q.”
Annual Shareholder Report
Mutual funds are not bank deposits or obligations, are not guaranteed by any bank and are not insured or guaranteed by the U.S. government, the Federal Deposit Insurance Corporation, the Federal Reserve Board or any other government agency. Investment in mutual funds involves investment risk, including the possible loss of principal.
This Report is authorized for distribution to prospective investors only when preceded or accompanied by the Fund's Prospectus, which contains facts concerning its objective and policies, management fees, expenses and other information.
Federated MDT Balanced Fund
Federated Investors Funds
4000 Ericsson Drive
Warrendale, PA 15086-7561
Contact us at FederatedInvestors.com
or call 1-800-341-7400.
Federated Securities Corp., Distributor
CUSIP 31421R841
CUSIP 31421R833
CUSIP 31421R692
CUSIP 31421R825
37326 (9/12)
Federated is a registered trademark of Federated Investors, Inc.
2012 ©Federated Investors, Inc.
Annual Shareholder Report
July 31, 2012
| Share Class | Ticker |
| A | QALGX |
| B | QBLGX |
| C | QCLGX |
| Institutional | QILGX |
Federated MDT Large Cap Growth Fund
Fund Established 2005
A Portfolio of Federated MDT Series
Dear Valued Shareholder,
I am pleased to present the Annual Shareholder Report for your fund covering the period from August 1, 2011 through July 31, 2012. This report includes Management's Discussion of Fund Performance, a complete listing of your fund's holdings, performance information and financial statements along with other important fund information.
In addition, our website, FederatedInvestors.com, offers easy access to Federated resources that include timely fund updates, economic and market insights from our investment strategists, and financial planning tools. We invite you to register to take full advantage of its capabilities.
Thank you for investing with Federated. I hope you find this information useful and look forward to keeping you informed.
Sincerely,
J. Christopher Donahue, President
Not FDIC Insured • May Lose Value • No Bank Guarantee
Management's Discussion of Fund Performance (unaudited)
The Fund's total return, based on net asset value, for the 12-month reporting period ended July 31, 2012, was 0.86% for Class A Shares, 0.10% for Class B Shares, 0.10% for Class C Shares and 1.12% for the Institutional Shares. The total return of the Russell 1000® Growth Index (Russell 1000® Growth),1 a broad-based securities market index, was 8.26% for the same period. The Fund's total return for the fiscal year reflected actual cash flows, transaction costs and other expenses which were not reflected in the total return of the Russell 1000® Growth.
MARKET OVERVIEW
During the reporting period, domestic equity market performance was favorable as evidenced by the 7.33% return on the Russell 3000® Index.2 Large-cap stocks led the way, during the reporting period, as demonstrated by the 10.41% return of the Russell Top 200® Index3 exceeding by far the 2.28% and 0.19% results for the Russell Midcap® Index,4 representing the mid-cap stocks, and the Russell 2000®Index,5 representing small-cap stocks, respectively. Growth stocks outperformed value stocks slightly during the year with the Russell 3000® Growth Index6 returning 7.55% as compared to 7.09% for the Russell 3000® Value Index.7
The best performing sectors in the Russell 1000® Growth during the reporting period were Consumer Staples (+19.58%), Telecommunications Services (+18.04%), Information Technology (+13.99%) and Health Care (+13.55%). Underperforming sectors included Energy (-4.87%), Materials (-4.46%)and Industrials (+2.52%).
FUND PERFORMANCE
During the 12-month reporting period, the most significant positive factor in the Fund's performance relative to the Russell 1000® Growth was stock selection in the Materials sector. Stock selection in the Financials sector also contributed moderately to the Fund's performance. The most significant negative factor in the Fund's performance was stock selection in the Consumer Discretionary sector. Poor stock selection in the Energy and Information Technology sectors also contributed significantly to the Fund's performance. An underweight8 in the Information Technology sector, which outperformed the Russell 1000® Growth, also detracted moderately.
Individual stocks enhancing the Fund's performance included Apple, Wal-Mart Stores, Sherwin-Williams, Alexion Pharmaceuticals and MasterCard.
Individual stocks detracting from the Fund's performance included Halliburton, Vertex Pharmaceuticals, Caterpillar, Dell and CARBO Ceramics.
Annual Shareholder Report
| 1 | The Russell 1000® Growth measures the performance of those Russell 1000® companies with higher price-to-book ratios and higher forecasted growth values. The index is unmanaged, and it is not possible to invest directly in an index. |
| 2 | The Russell 3000® Index offers investors access to the broad U.S. equity universe representing approximately 98% of the U.S. market. The Russell 3000® Index is constructed to provide a comprehensive, unbiased and stable barometer of the broad market and is completely reconstituted annually to ensure new and growing equities are reflected. The index is unmanaged, and it is not possible to invest directly in an index. |
| 3 | The Russell Top 200® Index measures the performance of the 200 largest companies in the Russell 1000® Index and represents approximately 66% of the total market capitalization of the Russell 1000® Index. The index is unmanaged, and it is not possible to invest directly in an index. |
| 4 | The Russell Midcap® Index measures the performance of the 800 smallest companies in the Russell 1000® Index and represents approximately 27% of the total market capitalization of the Russell 1000® Index. The index is unmanaged, and it is not possible to invest directly in an index. |
| 5 | The Russell 2000® Index measures the performance of the 2,000 smallest companies in the Russell 3000® Index and represents approximately 7% of the total market capitalization of the Russell 3000® Index. The index is unmanaged, and it is not possible to invest directly in an index. |
| 6 | The Russell 3000® Growth Index measures the performance of those Russell 3000® Index companies with higher price-to-book ratios and higher forecasted growth values. The stocks in this index are also members of either the Russell 1000® Growth or the Russell 2000® Growth indexes. The index is unmanaged, and it is not possible to invest directly in an index. |
| 7 | The Russell 3000® Value Index measures the performance of those Russell 3000® Index companies with lower price-to-book ratios and lower forecasted growth values. The stocks in this index are also members of either the Russell 1000® Value or the Russell 2000® Value indexes. The index is unmanaged, and it is not possible to invest directly in an index. |
| 8 | Underweighted in the portfolio as compared to the Russell 1000® Growth. |
Annual Shareholder Report
FUND PERFORMANCE AND GROWTH OF A $10,000 INVESTMENT
The start of performance date for the Fund was September 15, 2005. Class B Shares of the Fund were offered beginning March 29, 2007. Performance results shown before that date are for the Fund's Institutional Shares and have been adjusted for the maximum contingent deferred sales charge and total annual operating expenses applicable to the Fund's Class B Shares. The Fund's Institutional Shares commenced operations on September 15, 2005. Subject to the expense adjustments described above, the Fund's Class B Shares annual returns would have been substantially similar to those of the Fund's Institutional Shares because Shares of each class are invested in the same portfolio of securities. The Average Annual Total Return table below shows returns for each class averaged over the stated periods. The graphs below illustrate the hypothetical investment of $10,0001 in the Federated MDT Large Cap Growth Fund2 (the “Fund”) from September 15, 2005 (start of performance) to July 31, 2012, compared to the Russell 1000® Growth Index (Russell 1000® Growth).3
Average Annual Total Returns for the Period Ended 7/31/2012
(returns reflect all applicable sales charges and contingent deferred sales charge as specified below in footnote #1)
| Share Class | 1 Year | 5 Years | Start of
Performance* |
| Class A Shares | -4.68% | -1.62% | 1.78% |
| Class B Shares | -5.40% | -1.60% | 1.89% |
| Class C Shares | -0.90% | -1.23% | 1.84% |
| Institutional Shares | 1.12% | -0.25% | 2.90% |
| * | The Fund's start of performance date was September 15, 2005. |
Performance data quoted represents past performance which is no guarantee of future results. Investment return and principal value will fluctuate so that an investor's shares, when redeemed, may be worth more or less than their original cost. Mutual fund performance changes over time and current performance may be lower or higher than what is stated. For current to the most recent month-end performance and after-tax returns, visit FederatedInvestors.com or call 1-800-341-7400. Returns shown do not reflect the deduction of taxes that a shareholder would pay on Fund distributions or the redemption of Fund shares. Mutual funds are not obligations of or guaranteed by any bank and are not federally insured.
Annual Shareholder Report
Growth of a $10,000 Investment–class a Shares
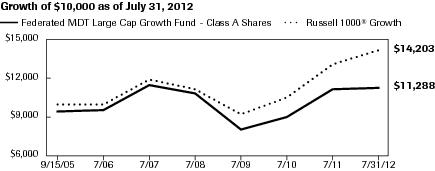
| Federated MDT Large Cap Growth Fund - Class A Shares | C000035049 | Russell 1000® Growth |
| 9/15/2005 | 9,450 | 10,000 |
| 7/31/2006 | 9,620 | 10,027 |
| 7/31/2007 | 11,569 | 11,979 |
| 7/31/2008 | 10,903 | 11,225 |
| 7/31/2009 | 8,100 | 9,253 |
| 7/31/2010 | 9,006 | 10,516 |
| 7/31/2011 | 11,192 | 13,119 |
| 7/31/2012 | 11,288 | 14,203 |
41 graphic description end -->
| ■ | Total returns shown include the maximum sales charge of 5.50% ($10,000 investment minus $550 sales charge = $9,450). |
Growth of a $10,000 Investment–class b SHARES

| Federated MDT Large Cap Growth Fund - Class B Shares | C000049171 | Russell 1000® Growth |
| 9/15/2005 | 10,000 | 10,000 |
| 7/31/2006 | 10,117 | 10,027 |
| 7/31/2007 | 12,111 | 11,979 |
| 7/31/2008 | 11,332 | 11,225 |
| 7/31/2009 | 8,131 | 9,253 |
| 7/31/2010 | 9,046 | 10,516 |
| 7/31/2011 | 11,265 | 13,119 |
| 7/31/2012 | 11,376 | 14,203 |
41 graphic description end -->
| ■ | Total returns shown include the maximum contingent deferred sales charge of 5.50%, as applicable. |
Annual Shareholder Report
Growth of a $10,000 Investment–CLASS C SHARES
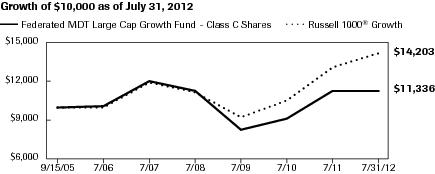
| Federated MDT Large Cap Growth Fund - Class C Shares | C000035050 | Russell 1000® Growth |
| 9/15/2005 | 10,000 | 10,000 |
| 7/31/2006 | 10,110 | 10,027 |
| 7/31/2007 | 12,062 | 11,979 |
| 7/31/2008 | 11,291 | 11,225 |
| 7/31/2009 | 8,330 | 9,253 |
| 7/31/2010 | 9,178 | 10,516 |
| 7/31/2011 | 11,325 | 13,119 |
| 7/31/2012 | 11,336 | 14,203 |
41 graphic description end -->
| ■ | Total returns shown include the maximum contingent deferred sales charge of 1.00%, as applicable. |
Growth of a $10,000 Investment–INSTITUTIONAL SHARES
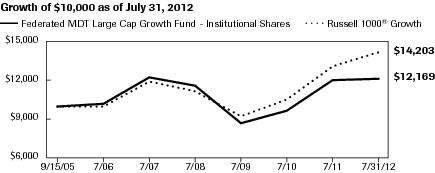
| Federated MDT Large Cap Growth Fund - Institutional Shares | C000035051 | Russell 1000® Growth |
| 9/15/2005 | 10,000 | 10,000 |
| 7/31/2006 | 10,210 | 10,027 |
| 7/31/2007 | 12,322 | 11,979 |
| 7/31/2008 | 11,639 | 11,225 |
| 7/31/2009 | 8,676 | 9,253 |
| 7/31/2010 | 9,656 | 10,516 |
| 7/31/2011 | 12,033 | 13,119 |
| 7/31/2012 | 12,169 | 14,203 |
41 graphic description end -->
| 1 | Represents a hypothetical investment of $10,000 in the Fund after deducting applicable sales charges: for Class A Shares, the maximum sales charge of 5.50% ($10,000 investment minus $550 sales charges = $9,450); for Class B Shares, the maximum contingent deferred sales charge is 5.50% on any redemption less than one year from the purchase date; for Class C Shares, a 1% contingent deferred sales charge would be applied to any redemption less than one year from the purchase date. The Fund's performance assumes the reinvestment of all dividends and distributions. The Russell 1000® Growth has been adjusted to reflect reinvestment of dividends on securities in the index. |
| 2 | The Fund is the successor to the MDT Large Cap Growth Fund pursuant to a reorganization that took place on December 8, 2006. Prior to that date, the Fund had no investment operations. Accordingly, the performance information shown for the periods prior to that date is that of the MDT Large Cap Growth Fund. |
| 3 | The Russell 1000® Growth measures the performance of those Russell 1000 companies with higher price-to-book ratios and higher forecasted growth values. The index is unmanaged and, unlike the Fund, is not affected by cash flows. The Russell 1000® Growth is not adjusted to reflect sales charges, expenses or other fees that the Securities Exchange Commission requires to be reflected in the Fund's performance. It is not possible to invest directly in an index. |
Annual Shareholder Report
Portfolio of Investments Summary Table (unaudited)
At July 31, 2012, the Fund's industry composition1 was follows:
| Industry Composition | Percentage of
Total Net Assets |
| Software Packaged/Custom | 7.7% |
| Computers - Low End | 6.0% |
| Discount Department Stores | 5.0% |
| AT&T Divestiture | 4.9% |
| Biotechnology | 4.9% |
| Financial Services | 4.5% |
| Soft Drinks | 3.9% |
| Ethical Drugs | 3.7% |
| Telecommunication Equipment & Services | 3.6% |
| Restaurants | 3.0% |
| Grocery Chain | 2.7% |
| Miscellaneous Communications | 2.7% |
| Food Wholesaling | 2.6% |
| Drug Store | 2.3% |
| Specialty Retailing | 2.3% |
| Medical Technology | 2.0% |
| Offshore Driller | 2.0% |
| Auto Manufacturing | 1.8% |
| Computer Peripherals | 1.8% |
| Services to Medical Professionals | 1.7% |
| Cosmetics & Toiletries | 1.6% |
| Health Care Technology | 1.6% |
| Auto Part Replacement | 1.5% |
| Hotels | 1.5% |
| Defense Aerospace | 1.3% |
| Other Communications Equipment | 1.3% |
| Paint & Related Materials | 1.3% |
| Cable TV | 1.2% |
| Clothing Stores | 1.2% |
| Internet Services | 1.2% |
| Miscellaneous Machinery | 1.2% |
| Education & Training Services | 1.1% |
| Home Building | 1.1% |
| Apparel | 1.0% |
| Broadcasting | 1.0% |
| Electronic Instruments | 1.0% |
| Other2 | 9.2% |
Annual Shareholder Report
| Industry Composition | Percentage of
Total Net Assets |
| Cash Equivalents3 | 1.5% |
| Other Assets and Liabilities—Net4 | 0.1% |
| TOTAL | 100.0% |
| 1 | Except for Cash Equivalents and Other Assets and Liabilities, industry classifications are based upon, and individual portfolio securities are assigned to, the classifications of the Global Industry Classification Standard (GICS) except that the Adviser assigns a classification to securities not classified by the GICS and to securities for which the Adviser does not have access to the classification made by the GICS. |
| 2 | For purposes of this table, industry classifications which constitute less than 1.0% of the Fund's total net assets have been aggregated under the designation “Other.” |
| 3 | Cash Equivalents include any investments in money market mutual funds and/or overnight repurchase agreements. |
| 4 | Assets, other than investments in securities, less liabilities. See Statement of Assets and Liabilities.
|
Annual Shareholder Report
Portfolio of Investments
July 31, 2012
| Shares | | | Value |
| | COMMON STOCKS—98.4% | |
| | Agricultural Chemicals—0.6% | |
| 8,035 | | Scotts Miracle-Gro Co. | $320,596 |
| | Apparel—1.0% | |
| 10,592 | 1 | Under Armour, Inc., Class A | 576,628 |
| | AT&T Divestiture—4.9% | |
| 61,157 | | Verizon Communications, Inc. | 2,760,627 |
| | Auto Manufacturing—1.8% | |
| 88,017 | | Ford Motor Co. | 813,277 |
| 4,859 | 1 | TRW Automotive Holdings Corp. | 190,959 |
| | TOTAL | 1,004,236 |
| | Auto Original Equipment Manufacturers—0.5% | |
| 8,681 | 1 | LKQ Corp. | 306,700 |
| | Auto Part Replacement—1.5% | |
| 13,492 | | Genuine Parts Co. | 863,893 |
| | Baking—0.3% | |
| 8,232 | | Flowers Foods, Inc. | 175,918 |
| | Biotechnology—4.9% | |
| 4,914 | 1 | Alexion Pharmaceuticals, Inc. | 515,233 |
| 16,652 | 1 | BioMarin Pharmaceutical, Inc. | 654,257 |
| 17,790 | 1 | Celgene Corp. | 1,217,903 |
| 2,920 | 1 | Regeneron Pharmaceuticals, Inc. | 393,178 |
| | TOTAL | 2,780,571 |
| | Broadcasting—1.0% | |
| 19,022 | 1 | DISH Network Corp., Class A | 585,117 |
| | Cable TV—1.2% | |
| 6,139 | 1 | Charter Communications, Inc. | 472,212 |
| 3,343 | 1 | Liberty Global, Inc., Class A | 176,443 |
| | TOTAL | 648,655 |
| | Cellular Communications—0.1% | |
| 11,271 | 1 | NII Holdings, Inc. | 76,079 |
| | Clothing Stores—1.2% | |
| 18,115 | | Gap (The), Inc. | 534,211 |
| 5,002 | 1 | Hanesbrands, Inc. | 150,160 |
| | TOTAL | 684,371 |
| | Commodity Chemicals—0.3% | |
| 141 | | PPG Industries, Inc. | 15,434 |
Annual Shareholder Report
| Shares | | | Value |
| | COMMON STOCKS—continued | |
| | Commodity Chemicals—continued | |
| 6,401 | | RPM International, Inc. | $169,626 |
| | TOTAL | 185,060 |
| | Computer Peripherals—1.8% | |
| 17,258 | 1 | NetApp, Inc. | 563,819 |
| 10,882 | 1 | Western Digital Corp. | 432,777 |
| | TOTAL | 996,596 |
| | Computers - Low End—6.0% | |
| 3,804 | | Apple, Inc. | 2,323,331 |
| 89,255 | | Dell, Inc. | 1,060,349 |
| | TOTAL | 3,383,680 |
| | Cosmetics & Toiletries—1.6% | |
| 10,584 | 1 | Ulta Salon Cosmetics & Fragrance, Inc. | 898,370 |
| | Crude Oil & Gas Production—0.4% | |
| 7,828 | 1 | Newfield Exploration Co. | 238,989 |
| | Defense Aerospace—1.3% | |
| 6,053 | 1 | Transdigm Group, Inc. | 746,698 |
| | Department Stores—0.4% | |
| 3,677 | | Target Corp. | 223,010 |
| | Discount Department Stores—5.0% | |
| 37,732 | | Wal-Mart Stores, Inc. | 2,808,393 |
| | Diversified Leisure—0.3% | |
| 5,924 | | Royal Caribbean Cruises Ltd. | 147,982 |
| | Drug Store—2.3% | |
| 35,931 | | Walgreen Co. | 1,306,451 |
| | Education & Training Services—1.1% | |
| 15,639 | 1 | Apollo Group, Inc., Class A | 425,381 |
| 4,007 | | DeVRY, Inc. | 78,657 |
| 3,604 | 1 | ITT Educational Services, Inc. | 139,907 |
| | TOTAL | 643,945 |
| | Electronic Instruments—1.0% | |
| 13,315 | 1 | Trimble Navigation Ltd. | 589,322 |
| | Ethical Drugs—3.7% | |
| 47,560 | | Eli Lilly & Co. | 2,094,067 |
| | Financial Services—4.5% | |
| 19,542 | | Visa, Inc., Class A | 2,522,286 |
| | Food Wholesaling—2.6% | |
| 50,239 | | Sysco Corp. | 1,476,524 |
Annual Shareholder Report
| Shares | | | Value |
| | COMMON STOCKS—continued | |
| | Grocery Chain—2.7% | |
| 8,886 | 1 | Fresh Market, Inc. | $523,297 |
| 45,324 | | Kroger Co. | 1,004,833 |
| | TOTAL | 1,528,130 |
| | Health Care Providers & Services—0.3% | |
| 6,774 | 1 | HCA, Inc. | 179,376 |
| | Health Care Technology—1.6% | |
| 12,018 | 1 | Cerner Corp. | 888,371 |
| | Home Building—1.1% | |
| 10,220 | | Lennar Corp., Class A | 298,526 |
| 11,757 | 1 | Toll Brothers, Inc. | 342,952 |
| | TOTAL | 641,478 |
| | Hotels—1.5% | |
| 22,867 | | Marriott International, Inc., Class A | 832,816 |
| | Internet Services—1.2% | |
| 981 | 1 | Priceline.com, Inc. | 649,167 |
| | Medical Technology—2.0% | |
| 294 | 1 | Intuitive Surgical, Inc. | 141,561 |
| 26,485 | | St. Jude Medical, Inc. | 989,480 |
| | TOTAL | 1,131,041 |
| | Metal Fabrication—0.0% | |
| 429 | | Timken Co. | 15,530 |
| | Miscellaneous Communications—2.7% | |
| 8,444 | 1 | Equinix, Inc. | 1,504,552 |
| | Miscellaneous Machinery—1.2% | |
| 13,467 | | Nordson Corp. | 690,318 |
| | Miscellaneous Metals—0.4% | |
| 5,598 | | Kennametal, Inc. | 206,566 |
| | Multi-Industry Capital Goods—0.9% | |
| 5,307 | | Crane Co. | 206,973 |
| 12,296 | | Textron, Inc. | 320,311 |
| | TOTAL | 527,284 |
| | Office Equipment—0.3% | |
| 11,524 | | Pitney Bowes, Inc. | 153,961 |
| | Office Supplies—0.6% | |
| 11,485 | | Avery Dennison Corp. | 353,623 |
| | Offshore Driller—2.0% | |
| 21,296 | | Oceaneering International, Inc. | 1,100,790 |
Annual Shareholder Report
| Shares | | | Value |
| | COMMON STOCKS—continued | |
| | Oil Well Supply—0.9% | |
| 10,656 | 1 | Dresser-Rand Group, Inc. | $495,611 |
| | Other Communications Equipment—1.3% | |
| 18,017 | | Harris Corp. | 750,408 |
| | Paint & Related Materials—1.3% | |
| 5,623 | | Sherwin-Williams Co. | 755,450 |
| | Personal & Household—0.0% | |
| 332 | | Nu Skin Enterprises, Inc., Class A | 16,935 |
| | Printing—0.3% | |
| 11,646 | | Donnelley (R.R.) & Sons Co. | 141,150 |
| | Restaurants—3.0% | |
| 3,721 | 1 | Chipotle Mexican Grill, Inc. | 1,087,760 |
| 3,807 | 1 | Panera Bread Co. | 599,564 |
| | TOTAL | 1,687,324 |
| | Services to Medical Professionals—1.7% | |
| 12,754 | 1 | Henry Schein, Inc. | 954,127 |
| | Soft Drinks—3.9% | |
| 33,494 | | Coca-Cola Enterprises, Inc. | 982,044 |
| 26,130 | | Dr. Pepper Snapple Group, Inc. | 1,191,005 |
| | TOTAL | 2,173,049 |
| | Software Packaged/Custom—7.7% | |
| 35,613 | | CA, Inc. | 857,205 |
| 7,739 | 1 | Concur Technologies, Inc. | 522,692 |
| 4,771 | 1 | Red Hat, Inc. | 256,012 |
| 4,217 | 1 | Solarwinds, Inc. | 225,146 |
| 76,908 | 1 | Symantec Corp. | 1,211,301 |
| 13,823 | 1 | VMware, Inc., Class A | 1,254,575 |
| | TOTAL | 4,326,931 |
| | Specialty Retailing—2.3% | |
| 13,250 | | Expedia, Inc. | 755,117 |
| 10,047 | | Nordstrom, Inc. | 543,945 |
| | TOTAL | 1,299,062 |
| | Surveillance-Detection—0.4% | |
| 6,078 | | Diebold, Inc. | 196,623 |
| | Telecommunication Equipment & Services—3.6% | |
| 20,129 | 1 | Crown Castle International Corp. | 1,245,582 |
| 10,706 | 1 | Level 3 Communications, Inc. | 206,305 |
| 23,098 | 1 | TW Telecom, Inc. | 580,453 |
| | TOTAL | 2,032,340 |
Annual Shareholder Report
| Shares | | | Value |
| | COMMON STOCKS—continued | |
| | Textiles Apparel & Luxury Goods—0.3% | |
| 3,357 | 1 | Michael Kors Holdings Ltd. | $138,611 |
| | Toys & Games—0.9% | |
| 14,547 | | Hasbro, Inc. | 521,074 |
| | Truck Manufacturing—0.5% | |
| 10,527 | 1 | Navistar International Corp. | 258,964 |
| | Trucking—0.5% | |
| 7,712 | | Con-way, Inc. | 274,701 |
| | TOTAL COMMON STOCKS
(IDENTIFIED COST $52,331,149) | 55,470,127 |
| | MUTUAL FUND—1.5% | |
| 873,921 | 2,3 | Federated Prime Value Obligations Fund, Institutional Shares, 0.22%
(AT NET ASSET VALUE) | 873,921 |
| | TOTAL INVESTMENTS—99.9%
(IDENTIFIED COST $53,205,070)4 | 56,344,048 |
| | OTHER ASSETS AND LIABILITIES - NET—0.1%5 | 39,689 |
| | TOTAL NET ASSETS—100% | $56,383,737 |
| 1 | Non-income producing security. |
| 2 | Affiliated holding. |
| 3 | 7-Day net yield. |
| 4 | The cost of investments for federal tax purposes amounts to $53,276,657. |
| 5 | Assets, other than investments in securities, less liabilities. See Statement of Assets and Liabilities. |
Note: The categories of investments are shown as a percentage of total net assets at July 31, 2012.
Various inputs are used in determining the value of the Fund's investments. These inputs are summarized in the three broad levels listed below:
Level 1—quoted prices in active markets for identical securities, including investment companies with daily net asset values, if applicable.
Level 2—other significant observable inputs (including quoted prices for similar securities, interest rates, prepayment speeds, credit risk, etc.). Also includes securities valued at amortized cost.
Level 3—significant unobservable inputs (including the Fund's own assumptions in determining the fair value of investments).
The inputs or methodology used for valuing securities are not an indication of the risk associated with investing in those securities.
As of July 31, 2012, all investments of the Fund utilized Level 1 inputs in valuing the Fund's assets carried at fair value.
See Notes which are an integral part of the Financial Statements
Annual Shareholder Report
Financial Highlights–Class A Shares
(For a Share Outstanding Throughout Each Period)
| Year Ended July 31 | 2012 | 2011 | 2010 | 2009 | 2008 |
| Net Asset Value, Beginning of Period | $10.50 | $8.45 | $7.60 | $10.23 | $12.12 |
| Income From Investment Operations: | | | | | |
| Net investment income (loss) | (0.02)1 | (0.03)1 | (0.01)1 | 0.001,2 | (0.06)1 |
| Net realized and unrealized gain (loss) on investments | 0.11 | 2.08 | 0.86 | (2.63) | (0.48) |
| TOTAL FROM INVESTMENT OPERATIONS | 0.09 | 2.05 | 0.85 | (2.63) | (0.54) |
| Less Distributions: | | | | | |
| Distributions from net realized gain on investments | — | — | — | — | (1.35) |
| Net Asset Value, End of Period | $10.59 | $10.50 | $8.45 | $7.60 | $10.23 |
| Total Return3 | 0.86% | 24.26% | 11.18% | (25.71)% | (5.76)% |
| Ratios to Average Net Assets: | | | | | |
| Net expenses | 1.50% | 1.50% | 1.50% | 1.50% | 1.50% |
| Net investment income (loss) | (0.23)% | (0.28)% | (0.08)% | 0.04% | (0.49)% |
| Expense waiver/reimbursement4 | 0.78% | 0.74% | 0.55% | 0.52% | 0.14% |
| Supplemental Data: | | | | | |
| Net assets, end of period (000 omitted) | $40,676 | $44,762 | $45,993 | $68,963 | $102,600 |
| Portfolio turnover | 258% | 208% | 217% | 380% | 320% |
| 1 | Per share numbers have been calculated using the average shares method. |
| 2 | Represents less than $0.01. |
| 3 | Based on net asset value, which does not reflect the sales charge, redemption fee or contingent deferred sales charge, if applicable. |
| 4 | This expense decrease is reflected in both the net expense and the net investment income (loss) ratios shown above. |
See Notes which are an integral part of the Financial Statements
Annual Shareholder Report
Financial Highlights–Class B Shares
(For a Share Outstanding Throughout Each Period)
| Year Ended July 31 | 2012 | 2011 | 2010 | 2009 | 2008 |
| Net Asset Value, Beginning of Period | $10.24 | $8.30 | $7.53 | $10.21 | $12.18 |
| Income From Investment Operations: | | | | | |
| Net investment income (loss) | (0.10)1 | (0.10)1 | (0.07)1 | (0.05)1 | (0.14)1 |
| Net realized and unrealized gain (loss) on investments | 0.11 | 2.04 | 0.84 | (2.63) | (0.48) |
| TOTAL FROM INVESTMENT OPERATIONS | 0.01 | 1.94 | 0.77 | (2.68) | (0.62) |
| Less Distributions: | | | | | |
| Distributions from net realized gain on investments | — | — | — | — | (1.35) |
| Net Asset Value, End of Period | $10.25 | $10.24 | $8.30 | $7.53 | $10.21 |
| Total Return2 | 0.10% | 23.37% | 10.23% | (26.25)% | (6.43)% |
| Ratios to Average Net Assets: | | | | | |
| Net expenses | 2.25% | 2.25% | 2.25% | 2.25% | 2.25% |
| Net investment income (loss) | (0.98)% | (1.04)% | (0.86)% | (0.72)% | (1.22)% |
| Expense waiver/reimbursement3 | 0.78% | 0.74% | 0.56% | 0.52% | 0.14% |
| Supplemental Data: | | | | | |
| Net assets, end of period (000 omitted) | $4,932 | $6,680 | $7,506 | $8,532 | $22,138 |
| Portfolio turnover | 258% | 208% | 217% | 380% | 320% |
| 1 | Per share numbers have been calculated using the average shares method. |
| 2 | Based on net asset value, which does not reflect the sales charge, redemption fee or contingent deferred sales charge, if applicable. |
| 3 | This expense decrease is reflected in both the net expense and the net investment income (loss) ratios shown above. |
See Notes which are an integral part of the Financial Statements
Annual Shareholder Report
Financial Highlights–Class C Shares
(For a Share Outstanding Throughout Each Period)
| Year Ended July 31 | 2012 | 2011 | 2010 | 2009 | 2008 |
| Net Asset Value, Beginning of Period | $10.02 | $8.12 | $7.37 | $9.99 | $11.94 |
| Income From Investment Operations: | | | | | |
| Net investment income (loss) | (0.09)1 | (0.10)1 | (0.07)1 | (0.05)1 | (0.13)1 |
| Net realized and unrealized gain (loss) on investments | 0.10 | 2.00 | 0.82 | (2.57) | (0.47) |
| TOTAL FROM INVESTMENT OPERATIONS | 0.01 | 1.90 | 0.75 | (2.62) | (0.60) |
| Less Distributions: | | | | | |
| Distributions from net realized gain on investments | — | — | — | — | (1.35) |
| Net Asset Value, End of Period | $10.03 | $10.02 | $8.12 | $7.37 | $9.99 |
| Total Return2 | 0.10% | 23.40% | 10.18% | (26.23)% | (6.39)% |
| Ratios to Average Net Assets: | | | | | |
| Net expenses | 2.25% | 2.25% | 2.25% | 2.25% | 2.22% |
| Net investment income (loss) | (0.98)% | (1.05)% | (0.86)% | (0.71)% | (1.21)% |
| Expense waiver/reimbursement3 | 0.78% | 0.74% | 0.56% | 0.52% | 0.14% |
| Supplemental Data: | | | | | |
| Net assets, end of period (000 omitted) | $7,001 | $7,564 | $6,816 | $7,333 | $14,895 |
| Portfolio turnover | 258% | 208% | 217% | 380% | 320% |
| 1 | Per share numbers have been calculated using the average shares method. |
| 2 | Based on net asset value, which does not reflect the sales charge, redemption fee or contingent deferred sales charge, if applicable. |
| 3 | This expense decrease is reflected in both the net expense and the net investment income (loss) ratios shown above. |
See Notes which are an integral part of the Financial Statements
Annual Shareholder Report
Financial Highlights–Institutional Shares
(For a Share Outstanding Throughout Each Period)
| Year Ended July 31 | 2012 | 2011 | 2010 | 2009 | 2008 |
| Net Asset Value, Beginning of Period | $10.68 | $8.57 | $7.70 | $10.33 | $12.20 |
| Income From Investment Operations: | | | | | |
| Net investment income (loss) | 0.001,2 | (0.00)1,2 | 0.011 | 0.021 | (0.03)1 |
| Net realized and unrealized gain (loss) on investments | 0.12 | 2.11 | 0.86 | (2.65) | (0.49) |
| TOTAL FROM INVESTMENT OPERATIONS | 0.12 | 2.11 | 0.87 | (2.63) | (0.52) |
| Less Distributions: | | | | | |
| Distributions from net realized gain on investments | — | — | — | — | (1.35) |
| Net Asset Value, End of Period | $10.80 | $10.68 | $8.57 | $7.70 | $10.33 |
| Total Return3 | 1.12% | 24.62% | 11.30% | (25.46)% | (5.55)% |
| Ratios to Average Net Assets: | | | | | |
| Net expenses | 1.25% | 1.25% | 1.25% | 1.25% | 1.25% |
| Net investment income (loss) | 0.02% | (0.05)% | 0.14% | 0.28% | (0.28)% |
| Expense waiver/reimbursement4 | 0.78% | 0.74% | 0.56% | 0.52% | 0.14% |
| Supplemental Data: | | | | | |
| Net assets, end of period (000 omitted) | $3,774 | $4,565 | $4,179 | $4,769 | $6,280 |
| Portfolio turnover | 258% | 208% | 217% | 380% | 320% |
| 1 | Per share numbers have been calculated using the average shares method. |
| 2 | Represents less than $0.01. |
| 3 | Based on net asset value. |
| 4 | This expense decrease is reflected in both the net expense and the net investment income (loss) ratios shown above. |
See Notes which are an integral part of the Financial Statements
Annual Shareholder Report
Statement of Assets and Liabilities
July 31, 2012
| Assets: | | |
| Total investment in securities, at value including $873,921 of investment in an affiliated holding (Note 5) (identified cost $53,205,070) | | $56,344,048 |
| Income receivable | | 43,829 |
| Receivable for investments sold | | 3,363,289 |
| Receivable for shares sold | | 5,576 |
| TOTAL ASSETS | | 59,756,742 |
| Liabilities: | | |
| Payable for investments purchased | $3,217,004 | |
| Payable for shares redeemed | 39,275 | |
| Payable for Directors'/Trustees' fees | 304 | |
| Payable for distribution services fee (Note 5) | 7,577 | |
| Payable for shareholder services fee (Note 5) | 20,182 | |
| Accrued expenses | 88,663 | |
| TOTAL LIABILITIES | | 3,373,005 |
| Net assets for 5,370,430 shares outstanding | | $56,383,737 |
| Net Assets Consist of: | | |
| Paid-in capital | | $75,733,020 |
| Net unrealized appreciation of investments | | 3,138,978 |
| Accumulated net realized loss on investments | | (22,338,774) |
| Accumulated net investment income (loss) | | (149,487) |
| TOTAL NET ASSETS | | $56,383,737 |
Annual Shareholder Report
Statement of Assets and Liabilities–continued
| Net Asset Value, Offering Price and Redemption Proceeds Per Share | | |
| Class A Shares: | | |
| Net asset value per share ($40,676,405 ÷ 3,841,681 shares outstanding), no par value, unlimited shares authorized | | $10.59 |
| Offering price per share (100/94.50 of $10.59) | | $11.21 |
| Redemption proceeds per share | | $10.59 |
| Class B Shares: | | |
| Net asset value per share ($4,931,790 ÷ 481,046 shares outstanding), no par value, unlimited shares authorized | | $10.25 |
| Offering price per share | | $10.25 |
| Redemption proceeds per share (94.50/100 of $10.25) | | $9.69 |
| Class C Shares: | | |
| Net asset value per share ($7,001,085 ÷ 698,082 shares outstanding), no par value, unlimited shares authorized | | $10.03 |
| Offering price per share | | $10.03 |
| Redemption proceeds per share (99.00/100 of $10.03) | | $9.93 |
| Institutional Shares: | | |
| Net asset value per share ($3,774,457 ÷ 349,621 shares outstanding), no par value, unlimited shares authorized | | $10.80 |
| Offering price per share | | $10.80 |
| Redemption proceeds per share | | $10.80 |
See Notes which are an integral part of the Financial Statements
Annual Shareholder Report
Statement of Operations
Year Ended July 31, 2012
| Investment Income: | | | |
| Dividends (including $2,045 received from an affiliated holding (Note 5)) | | | $737,610 |
| Expenses: | | | |
| Investment adviser fee (Note 5) | | $433,776 | |
| Administrative fee (Note 5) | | 270,000 | |
| Custodian fees | | 16,642 | |
| Transfer and dividend disbursing agent fees and expenses | | 238,205 | |
| Directors'/Trustees' fees | | 2,319 | |
| Auditing fees | | 23,400 | |
| Legal fees | | 7,848 | |
| Portfolio accounting fees | | 78,858 | |
| Distribution services fee (Note 5) | | 93,960 | |
| Shareholder services fee (Note 5) | | 131,346 | |
| Account administration fee (Note 2) | | 1,467 | |
| Share registration costs | | 53,680 | |
| Printing and postage | | 41,717 | |
| Insurance premiums | | 3,942 | |
| Miscellaneous | | 5,589 | |
| TOTAL EXPENSES | | 1,402,749 | |
| Waivers and Reimbursement (Note 5): | | | |
| Waiver/reimbursement of investment adviser fee | $(395,762) | | |
| Waiver of administrative fee | (54,420) | | |
| TOTAL WAIVERS AND REIMBURSEMENT | | (450,182) | |
| Net expenses | | | 952,567 |
| Net investment income (loss) | | | (214,957) |
| Realized and Unrealized Gain on Investments: | | | |
| Net realized gain on investments | | | 242,004 |
| Net change in unrealized appreciation of investments | | | 160,615 |
| Net realized and unrealized gain on investments | | | 402,619 |
| Change in net assets resulting from operations | | | $187,662 |
See Notes which are an integral part of the Financial Statements
Annual Shareholder Report
Statement of Changes in Net Assets
| Year Ended July 31 | 2012 | 2011 |
| Increase (Decrease) in Net Assets | | |
| Operations: | | |
| Net investment income (loss) | $(214,957) | $(285,946) |
| Net realized gain on investments | 242,004 | 14,733,709 |
| Net change in unrealized appreciation/depreciation of investments | 160,615 | (324,024) |
| CHANGE IN NET ASSETS RESULTING FROM OPERATIONS | 187,662 | 14,123,739 |
| Share Transactions: | | |
| Proceeds from sale of shares | 7,568,065 | 10,132,396 |
| Cost of shares redeemed | (14,942,594) | (25,179,540) |
| CHANGE IN NET ASSETS RESULTING FROM SHARE TRANSACTIONS | (7,374,529) | (15,047,144) |
| Change in net assets | (7,186,867) | (923,405) |
| Net Assets: | | |
| Beginning of period | 63,570,604 | 64,494,009 |
| End of period (including accumulated net investment income (loss) of $(149,487) and $0, respectively) | $56,383,737 | $63,570,604 |
See Notes which are an integral part of the Financial Statements
Annual Shareholder Report
Notes to Financial Statements
July 31, 2012
1. ORGANIZATION
Federated MDT Series (the “Trust”) is registered under the Investment Company Act of 1940, as amended (the “Act”), as an open-end management investment company. The Trust consists of five portfolios. The financial statements included herein are only those of Federated MDT Large Cap Growth Fund (the “Fund”), a diversified portfolio. The financial statements of the other portfolios are presented separately. The assets of each portfolio are segregated and a shareholder's interest is limited to the portfolio in which shares are held. Each portfolio pays its own expenses. The Fund offers four classes of shares: Class A Shares, Class B Shares, Class C Shares and Institutional Shares. All shares of the Fund have equal rights with respect to voting, except on class-specific matters. The investment objective of the Fund is long-term capital appreciation.
2. SIGNIFICANT ACCOUNTING POLICIES
The following is a summary of significant accounting policies consistently followed by the Fund in the preparation of its financial statements. These policies are in conformity with U.S. generally accepted accounting principles (GAAP).
Investment Valuation
In calculating its net asset value (NAV), the Fund generally values investments as follows:
| ■ | Equity securities listed on an exchange or traded through a regulated market system are valued at their last reported sale price or official closing price in their principal exchange or market. |
| ■ | Shares of other mutual funds are valued based upon their reported NAVs. |
| ■ | Derivative contracts listed on exchanges are valued at their reported settlement or closing price. |
| ■ | Over-the-counter (OTC) derivative contracts are fair valued using price evaluations provided by a pricing service approved by the Board of Trustees (the “Trustees”). |
| ■ | Fixed-income securities acquired with remaining maturities greater than 60 days are fair valued using price evaluations provided by a pricing service approved by the Trustees. |
| ■ | Fixed-income securities acquired with remaining maturities of 60 days or less are valued at their cost (adjusted for the accretion of any discount or amortization of any premium), which approximates market value. |
| ■ | For securities that are fair valued in accordance with procedures established by and under the general supervision of the Trustees, certain factors may be considered such as: the purchase price of the security, information obtained by contacting the issuer, analysis of the issuer's financial statements or other available documents, fundamental analytical data, the nature and duration of restrictions on disposition, the movement of the market in which the security is normally traded and public trading in similar securities of the issuer or comparable issuers. |
If the Fund cannot obtain a price or price evaluation from a pricing service for an investment, the Fund may attempt to value the investment based upon the mean of bid and asked quotations or fair value the investment based on price evaluations, from one or more dealers. If any price, quotation, price evaluation or other pricing source is not readily available when the NAV is calculated, the Fund uses the fair value of the investment determined in accordance with the procedures described below. There can be no assurance that the Fund could purchase or sell an investment at the price used to calculate the Fund's NAV.
Annual Shareholder Report
Fair Valuation and Significant Events Procedures
The Trustees have appointed a Valuation Committee comprised of officers of the Fund, Federated MDTA LLC (“Adviser”) or an affiliated adviser, and others to determine fair value of securities and in overseeing the calculation of the NAV. The Trustees have also authorized the use of pricing services recommended by the Valuation Committee to provide fair value evaluations of the current value of certain investments for purposes of calculating the NAV. The Valuation Committee employs various methods for reviewing third-party pricing service evaluations including periodic reviews of third-party pricing services' policies, procedures and valuation methods (including key inputs and assumptions), transactional back-testing, comparisons of evaluations of different pricing services, and review of price challenges by the Adviser based on recent market activity. In the event that market quotations and price evaluations are not available for an investment, the Valuation Committee determines the fair value of the investment in accordance with procedures adopted by the Trustees. The Trustees periodically review and approve the fair valuations made by the Valuation Committee and any changes made to the procedures.
Factors considered by pricing services in evaluating an investment include the yields or prices of investments of comparable quality, coupon, maturity, call rights and other potential prepayments, terms and type, reported transactions, indications as to values from dealers and general market conditions. Some pricing services provide a single price evaluation reflecting the bid-side of the market for an investment (a “bid” evaluation). Other pricing services offer both bid evaluations and price evaluations indicative of a price between the prices bid and asked for the investment (a “mid” evaluation). The Fund normally uses bid evaluations for U.S. Treasury and Agency securities, mortgage-backed securities and municipal securities. The Fund normally uses mid evaluations for other types of fixed-income securities and OTC derivative contracts. In the event that market quotations and price evaluations are not available for an investment, the fair value of the investment is determined in accordance with procedures adopted by the Trustees.
The Trustees also have adopted procedures requiring an investment to be priced at its fair value whenever the Adviser determines that a significant event affecting the value of the investment has occurred between the time as of which the price of the investment would otherwise be determined and the time as of which the NAV is computed. An event is considered significant if there is both an affirmative expectation that the investment's value will change in response to the event and a reasonable basis for quantifying the resulting change in value. Examples of significant events that may occur after the close of the principal market on which a security is traded, or after the time of a price evaluation provided by a pricing service or a dealer, include:
| ■ | With respect to securities traded in foreign markets, significant trends in U.S. equity markets or in the trading of foreign securities index futures or options contracts; |
| ■ | With respect to price evaluations of fixed-income securities determined before the close of regular trading on the NYSE, actions by the Federal Reserve Open Market Committee and other significant trends in U.S. fixed-income markets; |
| ■ | Political or other developments affecting the economy or markets in which an issuer conducts its operations or its securities are traded; and |
| ■ | Announcements concerning matters such as acquisitions, recapitalizations, litigation developments, a natural disaster affecting the issuer's operations or regulatory changes or market developments affecting the issuer's industry. |
Annual Shareholder Report
The Trustees have approved the use of a pricing service to determine the fair value of equity securities traded principally in foreign markets when the Adviser determines that there has been a significant trend in the U.S. equity markets or in index futures trading. For other significant events, the Fund may seek to obtain more current quotations or price evaluations from alternative pricing sources. If a reliable alternative pricing source is not available, the Fund will determine the fair value of the investment using another method approved by the Trustees.
Repurchase Agreements
The Fund may invest in repurchase agreements for short-term liquidity purposes. It is the policy of the Fund to require the other party to a repurchase agreement to transfer to the Fund's custodian or sub-custodian eligible securities or cash with a market value (after transaction costs) at least equal to the repurchase price to be paid under the repurchase agreement. The eligible securities are transferred to accounts with the custodian or sub-custodian in which the Fund holds a “securities entitlement” and exercises “control” as those terms are defined in the Uniform Commercial Code. The Fund has established procedures for monitoring the market value of the transferred securities and requiring the transfer of additional eligible securities if necessary to equal at least the repurchase price. These procedures also allow the other party to require securities to be transferred from the account to the extent that their market value exceeds the repurchase price or in exchange for other eligible securities of equivalent market value.
The insolvency of the other party or other failure to repurchase the securities may delay the disposition of the underlying securities or cause the Fund to receive less than the full repurchase price. Under the terms of the repurchase agreement, any amounts received by the Fund in excess of the repurchase price and related transaction costs must be remitted to the other party.
The Fund may enter into repurchase agreements in which eligible securities are transferred into joint trading accounts maintained by the custodian or sub-custodian for investment companies and other clients advised by the Fund's Adviser and its affiliates. The Fund will participate on a pro rata basis with the other investment companies and clients in its share of the securities transferred under such repurchase agreements and in its share of proceeds from any repurchase or other disposition of such securities.
Annual Shareholder Report
Investment Income, Gains and Losses, Expenses and Distributions
Investment transactions are accounted for on a trade-date basis. Realized gains and losses from investment transactions are recorded on an identified-cost basis. Interest income and expenses are accrued daily. Dividend income and distributions to shareholders are recorded on the ex-dividend date. Foreign dividends are recorded on the ex-dividend date or when the Fund is informed of the ex-dividend date. Distributions of net investment income, if any, are declared and paid annually. Non-cash dividends included in dividend income, if any, are recorded at fair value. Investment income, realized and unrealized gains and losses, and certain fund-level expenses are allocated to each class based on relative average daily net assets, except that Class A Shares, Class B Shares, Class C Shares and Institutional Shares may bear distribution services fees, shareholder services fees and account administration fees unique to those classes. For the year ended July 31, 2012, account administration fees for the Fund were as follows:
| Account
Administration
Fees Incurred |
| Class A Shares | $1,324 |
| Class C Shares | 143 |
| TOTAL | $1,467 |
Dividends are declared separately for each class. No class has preferential dividend rights; differences in per share dividend rates are generally due to differences in separate class expenses.
Premium and Discount Amortization
All premiums and discounts on fixed-income securities are amortized/accreted using the effective interest rate method.
Federal Taxes
It is the Fund's policy to comply with the Subchapter M provision of the Internal Revenue Code (the “Code”) and to distribute to shareholders each year substantially all of its income. Accordingly, no provision for federal income tax is necessary. As of and during the year ended July 31, 2012, the Fund did not have a liability for any uncertain tax positions. The Fund recognizes interest and penalties, if any, related to tax liabilities as income tax expense in the Statement of Operations. As of July 31, 2012, tax years 2009 through 2012 remain subject to examination by the Fund's major tax jurisdictions, which include the United States of America and the Commonwealth of Massachusetts.
When-Issued and Delayed Delivery Transactions
The Fund may engage in when-issued or delayed delivery transactions. The Fund records when-issued securities on the trade date and maintains security positions such that sufficient liquid assets will be available to make payment for the securities purchased. Securities purchased on a when-issued or delayed delivery basis are marked to market daily and begin earning interest on the settlement date. Losses may occur on these transactions due to changes in market conditions or the failure of counterparties to perform under the contract.
Annual Shareholder Report
Other
The preparation of financial statements in conformity with GAAP requires management to make estimates and assumptions that affect the amounts of assets, liabilities, expenses and revenues reported in the financial statements. Actual results could differ from those estimated.
3. SHARES OF BENEFICIAL INTEREST
The following tables summarize share activity:
| Year Ended July 31 | 2012 | 2011 |
| Class A Shares: | Shares | Amount | Shares | Amount |
| Shares sold | 397,917 | $4,011,516 | 497,745 | $4,919,437 |
| Shares redeemed | (818,755) | (8,329,325) | (1,681,082) | (16,079,618) |
| NET CHANGE RESULTING FROM CLASS A SHARE TRANSACTIONS | (420,838) | $(4,317,809) | (1,183,337) | $(11,160,181) |
| Year Ended July 31 | 2012 | 2011 |
| Class B Shares: | Shares | Amount | Shares | Amount |
| Shares sold | 98,688 | $960,640 | 142,838 | $1,355,108 |
| Shares redeemed | (269,626) | (2,628,632) | (395,142) | (3,795,078) |
| NET CHANGE RESULTING FROM CLASS B SHARE TRANSACTIONS | (170,938) | $(1,667,992) | (252,304) | $(2,439,970) |
| Year Ended July 31 | 2012 | 2011 |
| Class C Shares: | Shares | Amount | Shares | Amount |
| Shares sold | 209,412 | $2,012,624 | 196,147 | $1,868,043 |
| Shares redeemed | (265,950) | (2,580,209) | (280,790) | (2,640,242) |
| NET CHANGE RESULTING FROM CLASS C SHARE TRANSACTIONS | (56,538) | $(567,585) | (84,643) | $(772,199) |
| Year Ended July 31 | 2012 | 2011 |
| Institutional Shares: | Shares | Amount | Shares | Amount |
| Shares sold | 56,279 | $583,285 | 195,505 | $1,989,808 |
| Shares redeemed | (134,119) | (1,404,428) | (255,680) | (2,664,602) |
| NET CHANGE RESULTING FROM INSTITUTIONAL SHARE TRANSACTIONS | (77,840) | $(821,143) | (60,175) | $(674,794) |
| NET CHANGE RESULTING FROM TOTAL FUND SHARE TRANSACTIONS | (726,154) | $(7,374,529) | (1,580,459) | $(15,047,144) |
4. FEDERAL TAX INFORMATION
The timing and character of income and capital gain distributions are determined in accordance with income tax regulations, which may differ from GAAP. These differences are due to differing treatments for net operating loss.
Annual Shareholder Report
For the year ended July 31, 2012, permanent differences identified and reclassified among the components of net assets were as follows:
| Increase (Decrease) |
| Paid-In Capital | Undistributed
Net Investment
Income (Loss) |
| $(65,470) | $65,470 |
Net investment income (loss), net realized gains (losses), and net assets were not affected by this reclassification.
As of July 31, 2012, the components of distributable earnings on a tax basis were as follows:
| Net unrealized appreciation | $3,067,391 |
| Capital loss carryforwards and deferrals | $(22,416,674) |
The difference between book-basis and tax-basis net unrealized appreciation/depreciation is attributable to differing treatments for the deferral of losses on wash sales.
At July 31, 2012, the cost of investments for federal tax purposes was $53,276,657. The net unrealized appreciation of investments for federal tax purposes was $3,067,391. This consists of net unrealized appreciation from investments for those securities having an excess of value over cost of $6,079,622 and net unrealized depreciation from investments for those securities having an excess of cost over value of $3,012,231.
At July 31, 2012, the Fund had a capital loss carryforward of $22,267,187 which will reduce the Fund's taxable income arising from future net realized gains on investments, if any, to the extent permitted by the Code, thereby reducing the amount of distributions to shareholders which would otherwise be necessary to relieve the Fund of any liability for federal income tax. Pursuant to the Code, a net capital loss incurred in taxable years beginning on or before December 22, 2010 is characterized as short-term and may be carried forward for a maximum of eight tax years (“Carryforward Limit”), whereas a net capital loss incurred in taxable years beginning after December 22, 2010 retains its character as either short-term or long-term, does not expire and is required to be utilized prior to the losses which have a Carryforward Limit.
The following schedule summarizes the Fund's capital loss carryforwards and expiration years:
| Expiration Year | Short-Term | Long-Term | Total |
| 2017 | $20,666,560 | N/A | $20,666,560 |
| 2018 | $1,600,627 | N/A | $1,600,627 |
The Fund used capital loss carryforwards of $134,594 to offset capital gains realized during the year ended July 31, 2012.
Under current tax law, late-year ordinary loss realized after December 31 through the end of the Fund's fiscal year (“Late Year Ordinary Loss”) may be deferred, in whole or in part, and treated as occurring on the first day of the following fiscal year. As of July 31, 2012, for federal income tax purposes, a Late Year Ordinary Loss of $149,487 was deferred to August 1, 2012.
Annual Shareholder Report
5. INVESTMENT ADVISER FEE AND OTHER TRANSACTIONS WITH AFFILIATES
Investment Adviser Fee
The advisory agreement between the Fund and the Adviser provides for an annual fee equal to 0.75% of the Fund's average daily net assets. Subject to the terms described in the Expense Limitation note, the Adviser may voluntarily choose to waive any portion of its fee. For the year ended July 31, 2012, the Adviser voluntarily waived $394,560 of its fee.
Administrative Fee
Federated Administrative Services (FAS), under the Administrative Services Agreement, provides the Fund with administrative personnel and services. The fee paid to FAS is based on the average aggregate daily net assets of certain Federated funds as specified below:
| Administrative Fee | Average Aggregate Daily Net Assets
of the Federated Funds |
| 0.150% | on the first $5 billion |
| 0.125% | on the next $5 billion |
| 0.100% | on the next $10 billion |
| 0.075% | on assets in excess of $20 billion |
The administrative fee received during any fiscal year shall be at least $150,000 per portfolio and $40,000 per each additional class of Shares. Subject to the terms described in the Expense Limitation note, FAS may voluntarily choose to waive any portion of its fee. For the year ended July 31, 2012, FAS waived $54,420 of its fee. The net fee paid to FAS was 0.373% of average daily net assets of the Fund. The Fund is currently being charged the minimum administrative fee; therefore the fee as a percentage of average daily net assets is greater than the amounts presented in the chart above.
Distribution Services Fee
The Fund has adopted a Distribution Plan (the “Plan”) pursuant to Rule 12b-1 under the Act. Under the terms of the Plan, the Fund will compensate Federated Securities Corp. (FSC), the principal distributor, from the daily net assets of the Fund's Class A Shares, Class B Shares and Class C Shares to finance activities intended to result in the sale of these shares. The Plan provides that the Fund may incur distribution expenses at the following percentages of average daily net assets annually to compensate FSC:
| Share Class Name | Percentage of Average Daily
Net Assets of Class |
| Class A Shares | 0.05% |
| Class B Shares | 0.75% |
| Class C Shares | 0.75% |
Annual Shareholder Report
Subject to the terms described in the Expense Limitation note, FSC may voluntarily choose to waive any portion of its fee. For the year ended July 31, 2012, distribution services fees for the Fund were as follows:
| Distribution Services
Fees Incurred |
| Class B Shares | $41,026 |
| Class C Shares | 52,934 |
| TOTAL | $93,960 |
When FSC receives fees, it may pay some or all of them to financial intermediaries whose customers purchase shares. For the year ended July 31, 2012, FSC retained $9,857 of fees paid by the Fund. For the year ended July 31, 2012, the Fund's Class A Shares did not incur a distribution services fee; however, it may begin to incur this fee upon approval of the Trustees.
Sales Charges
Front-end sales charges and contingent deferred sales charges (CDSC) do not represent expenses of the Fund. They are deducted from the proceeds of sales of Fund shares prior to investment or from redemption proceeds prior to remittance, as applicable. For the year ended July 31, 2012, FSC retained $1,800 in sales charges from the sale of Class A Shares. FSC also retained $4,992 of CDSC relating to redemptions of Class B Shares and $184 relating to redemptions of Class C Shares.
Shareholder Services Fee
The Fund may pay fees (“Service Fees”) up to 0.25% of the average daily net assets of the Fund's Class A Shares, Class B Shares and Class C Shares to financial intermediaries or to Federated Shareholder Services Company (FSSC) for providing services to shareholders and maintaining shareholder accounts. Subject to the terms described in the Expense Limitation note, FSSC may voluntarily reimburse the Fund for Service Fees. For the year ended July 31, 2012, Service Fees for the Fund were as follows:
| Service
Fees
Incurred |
| Class A Shares | $100,160 |
| Class B Shares | 13,675 |
| Class C Shares | 17,511 |
| TOTAL | $131,346 |
For the year ended July 31, 2012, FSSC received $5,686 of fees paid by the Fund.
Expense Limitation
The Adviser and its affiliates (which may include FSC, FAS and FSSC) have voluntarily agreed to waive their fees and/or reimburse expenses so that the total annual fund operating expenses (as shown in the financial highlights) paid by the Fund's Class A Shares, Class B Shares, Class C Shares and Institutional Shares (after the voluntary waivers and reimbursements) will not exceed 1.50%, 2.25%, 2.25% and 1.25% (the “Fee Limit”), respectively, up to but not including the later of (the “Termination Date”): (a) October 1, 2013; or (b) the
Annual Shareholder Report
date of the Fund's next effective Prospectus. While the Adviser and its affiliates currently do not anticipate terminating or increasing these arrangements prior to the Termination Date, these arrangements may only be terminated or the Fee Limit increased prior to the Termination Date with the agreement of the Trustees.
General
Certain Officers and Trustees of the Fund are Officers and Directors or Trustees of the above companies.
Transactions Involving Affiliated Holdings
Affiliated holdings are mutual funds which are managed by the Adviser or an affiliate of the Adviser. The Adviser has agreed to reimburse the Fund for certain investment adviser fees as a result of transactions in other affiliated mutual funds. For the year ended July 31, 2012, the Adviser reimbursed $1,202. Transactions involving the affiliated holding during the year ended July 31, 2012, were as follows:
| Federated
Prime Value
Obligations
Fund,
Institutional
Shares |
| Balance of Shares Held 7/31/2011 | 1,155,856 |
| Purchases/Additions | 7,864,034 |
| Sales/Reductions | 8,145,969 |
| Balance of Shares Held 7/31/2012 | 873,921 |
| Value | $873,921 |
| Dividend Income | $2,045 |
6. Investment TRANSACTIONS
Purchases and sales of investments, excluding long-term U.S. government securities and short-term obligations, for the year ended July 31, 2012, were as follows:
| Purchases | $147,805,879 |
| Sales | $155,227,919 |
7. LINE OF CREDIT
The Fund participates in a $100,000,000 unsecured, uncommitted revolving line of credit (LOC) agreement with PNC Bank. The LOC was made available for extraordinary or emergency purposes, primarily for financing redemption payments. Borrowings are charged interest at a rate offered to the Fund by PNC Bank at the time of the borrowing. As of July 31, 2012, there were no outstanding loans. During the year ended July 31, 2012, the Fund did not utilize the LOC.
Annual Shareholder Report
8. INTERFUND LENDING
Pursuant to an Exemptive Order issued by the Securities and Exchange Commission, the Fund, along with other funds advised by subsidiaries of Federated Investors, Inc., may participate in an interfund lending program. This program provides an alternative credit facility allowing the Fund to borrow from other participating affiliated funds. As of July 31, 2012, there were no outstanding loans. During the year ended July 31, 2012, the program was not utilized.
9. SUBSEQUENT EVENTS
On August 15, 2012, the Trustees approved the elimination of minimum administrative personnel and services fees effective September 1, 2012. Prior to this date, the administrative fee received during any fiscal year was at least $150,000 per portfolio and $40,000 per each additional class of Shares.
Management has evaluated subsequent events through the date the financial statements were issued, and determined that no additional events have occurred that require disclosure.
Annual Shareholder Report
Report of Independent Registered Public Accounting Firm
TO THE BOARD OF trustees OF Federated MDt series AND SHAREHOLDERS OF federated mdt large cap growth fund:
We have audited the accompanying statement of assets and liabilities of Federated MDT Large Cap Growth Fund (the “Fund”) (one of the portfolios constituting Federated MDT Series), including the portfolio of investments, as of July 31, 2012, and the related statement of operations for the year then ended, the statement of changes in net assets for each of the two years in the period then ended, and the financial highlights for each of the five years in the period then ended. These financial statements and financial highlights are the responsibility of the Fund's management. Our responsibility is to express an opinion on these financial statements and financial highlights based on our audits.
We conducted our audits in accordance with standards of the Public Company Accounting Oversight Board (United States). Those standards require that we plan and perform the audit to obtain reasonable assurance about whether the financial statements and financial highlights are free of material misstatement. We were not engaged to perform an audit of the Fund's internal control over financial reporting. Our audits included consideration of internal control over financial reporting as a basis for designing audit procedures that are appropriate in the circumstances, but not for the purpose of expressing an opinion on the effectiveness of the Fund's internal control over financial reporting. Accordingly, we express no such opinion. An audit also includes examining, on a test basis, evidence supporting the amounts and disclosures in the financial statements and financial highlights, assessing the accounting principles used and significant estimates made by management, and evaluating the overall financial statement presentation. Our procedures included confirmation of securities owned as of July 31, 2012, by correspondence with the custodian and others or by other appropriate auditing procedures where replies from others, were not received. We believe that our audits provide a reasonable basis for our opinion.
In our opinion, the financial statements and financial highlights referred to above present fairly, in all material respects, the financial position of Federated MDT Large Cap Growth Fund, a portfolio of Federated MDT Series, at July 31, 2012, the results of its operations for the year then ended, the changes in its net assets for each of the two years in the period then ended, and the financial highlights for each of the five years in the period then ended, in conformity with U.S. generally accepted accounting principles.
Boston, Massachusetts
September 24, 2012
Annual Shareholder Report
Shareholder Expense Example (unaudited)
As a shareholder of the Fund, you incur two types of costs: (1) transaction costs, including sales charges (loads) on purchase or redemption payments; and (2) ongoing costs, including management fees and to the extent applicable, distribution (12b-1) fees and/or shareholder services fees and other Fund expenses. This Example is intended to help you to understand your ongoing costs (in dollars) of investing in the Fund and to compare these costs with the ongoing costs of investing in other mutual funds. It is based on an investment of $1,000 invested at the beginning of the period and held for the entire period from February 1, 2012 to July 31, 2012.
ACTUAL EXPENSES
The first section of the table below provides information about actual account values and actual expenses. You may use the information in this section, together with the amount you invested, to estimate the expenses that you incurred over the period. Simply divide your account value by $1,000 (for example, an $8,600 account value divided by $1,000 = 8.6), then multiply the result by the number in the first section under the heading entitled “Expenses Paid During Period” to estimate the expenses attributable to your investment during this period.
HYPOTHETICAL EXAMPLE FOR COMPARISON PURPOSES
The second section of the table below provides information about hypothetical account values and hypothetical expenses based on the Fund's actual expense ratio and an assumed rate of return of 5% per year before expenses, which is not the Fund's actual return. Thus, you should not use the hypothetical account values and expenses to estimate the actual ending account balance or your expenses for the period. Rather, these figures are required to be provided to enable you to compare the ongoing costs of investing in the Fund with other funds. To do so, compare this 5% hypothetical example with the 5% hypothetical examples that appear in the shareholder reports of the other funds.
Annual Shareholder Report
Please note that the expenses shown in the table are meant to highlight your ongoing costs only and do not reflect any transaction costs, such as sales charges (loads) on purchase or redemption payments. Therefore, the second section of the table is useful in comparing ongoing costs only, and will not help you determine the relative total costs of owning different funds. In addition, if these transaction costs were included, your costs would have been higher.
| Beginning
Account Value
2/1/2012 | Ending
Account Value
7/31/2012 | Expenses Paid
During Period1 |
| Actual: | | | |
| Class A Shares | $1,000 | $1,021.20 | $7.54 |
| Class B Shares | $1,000 | $1,016.90 | $11.28 |
| Class C Shares | $1,000 | $1,017.20 | $11.28 |
| Institutional Shares | $1,000 | $1,022.70 | $6.29 |
Hypothetical (assuming a 5% return
before expenses): | | | |
| Class A Shares | $1,000 | $1,017.40 | $7.52 |
| Class B Shares | $1,000 | $1,013.67 | $11.27 |
| Class C Shares | $1,000 | $1,013.67 | $11.27 |
| Institutional Shares | $1,000 | $1,018.65 | $6.27 |
| 1 | Expenses are equal to the Fund's annualized net expense ratios, multiplied by the average account value over the period, multiplied by 182/366 (to reflect the one-half-year period). The annualized net expense ratios are as follows: |
| Class A Shares | 1.50% |
| Class B Shares | 2.25% |
| Class C Shares | 2.25% |
| Institutional Shares | 1.25% |
Annual Shareholder Report
Board of Trustees and Trust Officers
The Board of Trustees is responsible for managing the Trust's business affairs and for exercising all the Trust's powers except those reserved for the shareholders. The following tables give information about each Trustee and the senior officers of the Fund. Where required, the tables separately list Trustees who are “interested persons” of the Fund (i.e., “Interested” Trustees) and those who are not (i.e., “Independent” Trustees). Unless otherwise noted, the address of each person listed is Federated Investors Tower, 1001 Liberty Avenue, Pittsburgh, PA 15222. The address of all Independent Trustees listed is 4000 Ericsson Drive, Warrendale, PA 15086-7561; Attention: Mutual Fund Board. As of December 31, 2011, the Trust comprised five portfolio(s), and the Federated Fund Family consisted of 43 investment companies (comprising 134 portfolios). Unless otherwise noted, each Officer is elected annually. Unless otherwise noted, each Trustee oversees all portfolios in the Federated Fund Family and serves for an indefinite term. The Fund's Statement of Additional Information includes additional information about Trust Trustees and is available, without charge and upon request, by calling 1-800-341-7400.
Interested TRUSTEES Background
Name
Birth Date
Positions Held with Trust
Date Service Began | Principal Occupation(s) for Past Five Years,
Other Directorships Held and Previous Position(s) |
John F. Donahue*
Birth Date: July 28, 1924
Trustee
Began serving: June 2006 | Principal Occupations: Director or Trustee of the Federated Fund Family; Chairman and Director, Federated Investors, Inc.; Chairman of the Federated Fund Family's Executive Committee.
Previous Positions: Chairman of the Federated Fund Family; Trustee, Federated Investment Management Company; Chairman and Director, Federated Investment Counseling. |
J. Christopher Donahue*
Birth Date: April 11, 1949
President and Trustee
Began serving: May 2006 | Principal Occupations: Principal Executive Officer and President of the Federated Fund Family; Director or Trustee of some of the Funds in the Federated Fund Family; President, Chief Executive Officer and Director, Federated Investors, Inc.; Chairman and Trustee, Federated Investment Management Company; Trustee, Federated Investment Counseling; Chairman and Director, Federated Global Investment Management Corp.; Chairman, Federated Equity Management Company of Pennsylvania and Passport Research, Ltd. (investment advisory subsidiary of Federated); Trustee, Federated Shareholder Services Company; Director, Federated Services Company.
Previous Positions: President, Federated Investment Counseling; President and Chief Executive Officer, Federated Investment Management Company, Federated Global Investment Management Corp. and Passport Research, Ltd. |
| * | Family relationships and reasons for “interested” status: John F. Donahue is the father of J. Christopher Donahue; both are “interested” due to their beneficial ownership of shares of Federated Investors, Inc. and the positions they hold with Federated and its subsidiaries. |
Annual Shareholder Report
INDEPENDENT TRUSTEES Background
Name
Birth Date
Positions Held with Trust
Date Service Began | Principal Occupation(s) for Past Five Years,
Other Directorships Held, Previous Position(s) and Qualifications |
Nicholas P. Constantakis, CPA
Birth Date: September 3, 1939
Trustee
Began serving: June 2006 | Principal Occupation: Director or Trustee of the Federated Fund Family.
Other Directorship Held: Director, Chairman of the Audit Committee, and member of the Compensation Committee, Michael Baker Corporation (architecture, engineering and construction services).
Previous Position: Partner, Andersen Worldwide SC.
Qualifications: Public accounting and director experience. |
John F. Cunningham
Birth Date: March 5, 1943
Trustee
Began serving: June 2006 | Principal Occupation: Director or Trustee of the Federated Fund Family.
Other Directorships Held: Chairman, President and Chief Executive Officer, Cunningham & Co., Inc. (strategic business consulting); Trustee Associate, Boston College.
Previous Positions: Director, Redgate Communications and EMC Corporation (computer storage systems); Chairman of the Board and Chief Executive Officer, Computer Consoles, Inc.; President and Chief Operating Officer, Wang Laboratories; Director, First National Bank of Boston; Director, Apollo Computer, Inc.
Qualifications: Business management and director experience. |
Maureen Lally-Green
Birth Date: July 5, 1949
Trustee
Began serving: August 2009 | Principal Occupations: Director or Trustee of the Federated Fund Family; Director, Office of Church Relations, Diocese of Pittsburgh; Adjunct Professor of Law, Duquesne University School of Law.
Other Directorships Held: Director, Auberle; Member, Pennsylvania State Board of Education; Director, Saint Vincent College; Director, Ireland Institute of Pittsburgh; Chair and Director, UPMC Mercy Hospital; Regent, St. Vincent Seminary; Director, Epilepsy Foundation of Western and Central Pennsylvania; Director, Saint Thomas More Society, Allegheny County; Director, Our Campaign for the Church Alive, Inc.
Previous Position: Pennsylvania Superior Court Judge.
Qualifications: Legal and director experience. |
Peter E. Madden
Birth Date: March 16, 1942
Trustee
Began serving: June 2006 | Principal Occupation: Director or Trustee, and Chairman of the Board of Directors or Trustees, of the Federated Fund Family.
Previous Positions: Representative, Commonwealth of Massachusetts General Court; President, Chief Operating Officer and Director, State Street Bank and Trust Company and State Street Corporation (retired); Director, VISA USA and VISA International; Chairman and Director, Massachusetts Bankers Association; Director, Depository Trust Corporation; Director, The Boston Stock Exchange.
Qualifications: Business management, mutual fund services and director experience. |
Annual Shareholder Report
Name
Birth Date
Positions Held with Trust
Date Service Began | Principal Occupation(s) for Past Five Years,
Other Directorships Held, Previous Position(s) and Qualifications |
Charles F. Mansfield, Jr.
Birth Date: April 10, 1945
Trustee
Began serving: June 2006 | Principal Occupations: Director or Trustee of the Federated Fund Family; Management Consultant.
Previous Positions: Chief Executive Officer, PBTC International Bank; Partner, Arthur Young & Company (now Ernst & Young LLP); Chief Financial Officer of Retail Banking Sector, Chase Manhattan Bank; Senior Vice President, HSBC Bank USA (formerly Marine Midland Bank); Vice President, Citibank; Assistant Professor of Banking and Finance, Frank G. Zarb School of Business, Hofstra University; Executive Vice President, DVC Group, Inc. (marketing, communications and technology).
Qualifications: Banking, business management, education and director experience. |
Thomas M. O'Neill
Birth Date: June 14, 1951
Trustee
Began serving: October 2006 | Principal Occupations: Director or Trustee, Vice Chairman of the Audit Committee of the Federated Fund Family; Sole Proprietor, Navigator Management Company (investment and strategic consulting).
Other Directorships Held: Board of Overseers, Children's Hospital of Boston; Visiting Committee on Athletics, Harvard College; Board of Directors, Medicines for Humanity; Board of Directors, The Golisano Children's Museum of Naples, Florida.
Previous Positions: Chief Executive Officer and President, Managing Director and Chief Investment Officer, Fleet Investment Advisors; President and Chief Executive Officer, Aeltus Investment Management, Inc.; General Partner, Hellman, Jordan Management Co., Boston, MA; Chief Investment Officer, The Putnam Companies, Boston, MA; Credit Analyst and Lending Officer, Fleet Bank; Director and Consultant, EZE Castle Software (investment order management software); Director, Midway Pacific (lumber).
Qualifications: Business management, mutual fund, director and investment experience. |
John S. Walsh
Birth Date: November 28, 1957
Trustee
Began serving: June 2006 | Principal Occupations: Director or Trustee, Chairman of the Audit Committee of the Federated Fund Family; President and Director, Heat Wagon, Inc. (manufacturer of construction temporary heaters); President and Director, Manufacturers Products, Inc. (distributor of portable construction heaters); President, Portable Heater Parts, a division of Manufacturers Products, Inc.
Previous Position: Vice President, Walsh & Kelly, Inc.
Qualifications: Business management and director experience. |
Annual Shareholder Report
OFFICERS
Name
Birth Date
Address
Positions Held with Trust
Date Service Began | Principal Occupation(s) for Past Five Years
and Previous Position(s) |
John W. McGonigle
Birth Date: October 26, 1938
Secretary
Began serving: May 2006 | Principal Occupations: Executive Vice President and Secretary of the Federated Fund Family; Vice Chairman, Executive Vice President, Secretary and Director, Federated Investors, Inc.
Previous Positions: Trustee, Federated Investment Management Company and Federated Investment Counseling; Director, Federated Global Investment Management Corp., Federated Services Company and Federated Securities Corp. |
Richard A. Novak
Birth Date: December 25, 1963
Treasurer
Began serving: May 2006 | Principal Occupations: Principal Financial Officer and Treasurer of the Federated Fund Family; Senior Vice President, Federated Administrative Services; Financial and Operations Principal for Federated Securities Corp., Edgewood Services, Inc. and Southpointe Distribution Services, Inc.
Previous Positions: Controller of Federated Investors, Inc.; Vice President, Finance of Federated Services Company; held various financial management positions within The Mercy Hospital of Pittsburgh; Auditor, Arthur Andersen & Co. |
Stephen F. Auth
Birth Date: September 3, 1956
450 Lexington Avenue
Suite 3700
New York, NY 10017-3943
CHIEF INVESTMENT OFFICER
Began serving: June 2012 | Principal Occupations: Stephen F. Auth is Chief Investment Officer of this Fund and various other Funds in the Federated Fund Complex; Executive Vice President, Federated Investment Counseling, Federated Global Investment Management Corp. and Federated Equity Management Company of Pennsylvania.
Previous Positions: Executive Vice President, Federated Investment Management Company and Passport Research, Ltd. (investment advisory subsidiary of Federated); Senior Vice President, Global Portfolio Management Services Division; Senior Vice President, Federated Investment Management Company and Passport Research, Ltd.; Senior Managing Director and Portfolio Manager, Prudential Investments. |
Brian P. Bouda
Birth Date: February 28, 1947
CHIEF COMPLIANCE OFFICER AND SENIOR VICE PRESIDENT
Began serving: June 2006 | Principal Occupations: Senior Vice President and Chief Compliance Officer of the Federated Fund Family; Vice President and Chief Compliance Officer of Federated Investors, Inc. and Chief Compliance Officer of its subsidiaries. Mr. Bouda joined Federated in 1999 and is a member of the American Bar Association and the State Bar Association of Wisconsin. |
Daniel Mahr
Birth Date: April 9, 1981
125 High Street
Oliver Tower
21st Floor
Boston, MA 02110-2704
Vice President
Began serving: June 2012 | Principal Occupations: Daniel Mahr has been the Fund's Portfolio Manager since August 2006. Mr. Mahr joined the MDT Advisers Investment Team in 2002. As Managing Director, Research, he is responsible for leading the Investment Team as it relates to the ongoing design, development and implementation of the Optimum Q Process. He is Vice President of the Trust with respect to the Fund. Mr. Mahr received his A.B., Computer Science from Harvard College and his S.M., Computer Science from Harvard University. |
Annual Shareholder Report
Evaluation and Approval of Advisory Contract–May 2012
FEDERATED MDT LARGE CAP GROWTH FUND (the “Fund”)
Following a review and recommendation of approval by the Fund's independent trustees, the Fund's Board reviewed and approved at its May 2012 meetings the Fund's investment advisory contract for an additional one-year term. The Board's decision regarding the contract reflects the exercise of its business judgment on whether to continue the existing arrangements.
In this connection, the Federated Funds' Board had previously appointed a Senior Officer, whose duties include specified responsibilities relating to the process by which advisory fees are to be charged to a Federated fund. The Senior Officer has the authority to retain consultants, experts, or staff as may be reasonably necessary to assist in the performance of his duties, reports directly to the Board, and may be terminated only with the approval of a majority of the independent members of the Board. The Senior Officer prepared and furnished to the Board an independent, written evaluation that covered topics discussed below (the “Evaluation”). The Board considered that Evaluation, along with other information, in deciding to approve the advisory contract.
The Board is also familiar with and considered judicial decisions concerning allegedly excessive investment advisory fees, which have indicated that the following factors may be relevant to an Adviser's fiduciary duty with respect to its receipt of compensation from a fund: the nature and quality of the services provided by the Adviser to a fund and its shareholders, including the performance and expenses of the fund and of comparable funds; the Adviser's cost of providing the services, including the profitability to the Adviser of providing advisory services to a fund; the extent to which the Adviser may realize “economies of scale” as a fund grows larger and, if such economies exist, whether they have been shared with a fund and its shareholders; any “fall-out financial benefits” that accrue to the Adviser because of its relationship with a fund (including research services received from brokers that execute fund trades and any fees paid to affiliates of the Adviser for services rendered to a fund); comparative fee structures, including a comparison of fees paid to the Adviser with those paid by similar funds; and the extent to which the Board members are fully informed about all facts the Board deems relevant to its consideration of the Adviser's services and fees. Consistent with these judicial decisions, the Board also considered management fees (including any components thereof) charged to institutional and other clients of the Adviser for what might be viewed as like services. The Board was aware of these factors and was guided by them in its review of the Fund's advisory contract to the extent it considered them to be appropriate and relevant, as discussed further below.
Annual Shareholder Report
The Board considered and weighed these circumstances in light of its substantial accumulated experience in governing the Fund and working with Federated on matters relating to the Federated funds, and was assisted in its deliberations by independent legal counsel. Throughout the year, and in connection with its May meetings, the Board requested and received substantial and detailed information about the Fund and the Federated organization that was in addition to the extensive materials that comprise and accompany the Senior Officer's Evaluation. Federated provided much of this information at each regular meeting of the Board, and furnished additional substantial information in connection with the May meeting at which the Board's formal review of the advisory contract occurred. At this May meeting, senior management of the Adviser also met with the independent trustees and their counsel to discuss the materials presented and any other matters thought relevant by the Adviser or the trustees. Between regularly scheduled meetings, the Board also received information on particular matters as the need arose. Thus, the Board's consideration of the advisory contract included review of the Senior Officer's Evaluation, accompanying data and additional information covering such matters as: the Adviser's investment philosophy, revenue, profitability, personnel and processes; investment and operating strategies; the Fund's short- and long-term performance (in absolute terms, both on a gross basis and net of expenses, as well as in relationship to its particular investment program and certain competitor or “peer group” funds and/or other benchmarks, as appropriate), and comments on the reasons for performance; the Fund's investment objectives; the Fund's expenses (including the advisory fee itself and the overall expense structure of the Fund, both in absolute terms and relative to similar and/or competing funds, with due regard for contractual or voluntary expense limitations); the use and allocation of brokerage commissions derived from trading the Fund's portfolio securities (if any); and the nature, quality and extent of the advisory and other services provided to the Fund by the Adviser and its affiliates. The Board also considered the preferences and expectations of Fund shareholders; the entrepreneurial risk assumed by the Adviser in sponsoring the funds; the continuing state of competition in the mutual fund industry and market practices; the range of comparable fees for similar funds in the mutual fund industry; the Fund's relationship to the Federated family of funds which include a comprehensive array of funds with different investment objectives, policies and strategies which are available for exchange without the incurrence of additional sales charges; compliance and audit reports concerning the Federated funds and the Federated companies that service them (including communications from regulatory agencies), as well as Federated's responses to any issues raised therein; and relevant developments in the mutual fund industry and how the Federated funds and/or Federated are responding to them. The Board's evaluation process is evolutionary. The criteria considered and the emphasis placed on relevant criteria change in recognition of changing circumstances in the mutual fund marketplace.
Annual Shareholder Report
While mindful that courts have cautioned against giving such comparisons too much weight, the Board has found the use of comparisons of the Fund's fees and expenses to other mutual funds with comparable investment programs to be relevant, given the high degree of competition in the mutual fund business. The Board focused on comparisons with other similar mutual funds more heavily than non-mutual fund products or services because it is believed that they are more relevant. For example, other mutual funds are the products most like the Fund, they are readily available to Fund shareholders as alternative investment vehicles, and they are the type of investment vehicle in fact chosen and maintained by the Fund's investors. The range of their fees and expenses therefore appears to be a generally reliable indication of what consumers have found to be reasonable in the precise marketplace in which the Fund competes. In this regard, the Senior Officer has reviewed Federated's fees for providing advisory services to products outside the Federated family of funds (e.g., institutional and separate accounts). He concluded that mutual funds and institutional accounts are inherently different products. Those differences include, but are not limited to, different types of targeted investors; being subject to different laws and regulations; different legal structures; different average account sizes; different associated costs; different portfolio management techniques made necessary by different cash flows; and portfolio manager time spent in review of securities pricing. The Senior Officer did not consider these fee schedules to be determinative in judging the appropriateness of mutual fund advisory contracts.
The Fund's ability to deliver competitive performance when compared to its peer group was also deemed to be relevant by the Board as a useful indicator of how the Adviser is executing the Fund's investment program, which in turn assisted the Board in reaching a conclusion that the nature, extent, and quality of the Adviser's investment management services were such as to warrant continuation of the advisory contract.
The Senior Officer reviewed information compiled by Federated, using data supplied by independent fund ranking organizations, regarding the performance of, and fees charged by, other mutual funds, noting his view that comparisons to fund peer groups are relevant in judging the reasonableness of proposed fees. He also observed that certain funds may exhibit important differences in their objectives and management techniques when compared to other funds placed in the same peer group by ranking organizations, noting in this connection that the Fund's quantitative investment program is of such a type.
Annual Shareholder Report
For the periods covered by the Evaluation, the Fund's performance for the one-year period was above the median of the relevant peer group, and the Fund's performance fell below the median of the relevant peer group for the three-year and five-year periods. In addition, the Board was informed by the Adviser that, for the same periods, the Fund underperformed its benchmark index for the one-year period, underperformed its benchmark index for the three-year period and underperformed its benchmark index for the five-year period. The Board discussed the Fund's performance with the Adviser and recognized the efforts being undertaken by the Adviser. The Board will continue to monitor these efforts and the performance of the Fund.
The Board also received financial information about Federated, including information regarding the compensation and benefits Federated derived from its relationships with the Federated funds. This information covered not only the fees under the advisory contracts, but also fees received by Federated's subsidiaries for providing other services to the Federated funds under separate contracts (e.g., for serving as the Federated funds' administrator). The information also detailed any indirect benefit Federated may derive from its receipt of research services from brokers who execute Federated fund trades. In addition, the Board considered the fact that, in order for a fund to be competitive in the marketplace, Federated and its affiliates frequently waived fees and/or reimbursed expenses and have disclosed to fund investors and/or indicated to the Board their intention to do so in the future, where appropriate. Moreover, the Board receives regular reporting as to the institution or elimination of these voluntary waivers.
Federated furnished information, requested by the Senior Officer, that reported revenues on a fund-by-fund basis and made estimates of the allocation of expenses on a fund-by-fund basis, using allocation methodologies specified by the Senior Officer. The Senior Officer noted that, although they may apply consistent allocation processes, the inherent difficulties in allocating costs (and the unavoidable arbitrary aspects of that exercise) and the lack of consensus on how to allocate those costs may render such allocation information unreliable. The allocation information was considered in the analysis by the Board but was determined to be of limited use.
The Board and the Senior Officer also reviewed information compiled by Federated comparing profitability information for Federated to other publicly held fund management companies. In this regard, the Senior Officer noted the limited availability of such information, but nonetheless concluded that Federated's profit margins did not appear to be excessive.
The Senior Officer's Evaluation also discussed the notion of possible realization of “economies of scale” as a fund grows larger. The Board considered in this regard that the Adviser has made significant and long-term investments in areas that support all of the Federated funds, such as personnel and processes for the portfolio management, shareholder services, compliance, internal audit, and risk management functions; and systems technology; and that the benefits of
Annual Shareholder Report
these efforts (as well as any economies, should they exist) were likely to be enjoyed by the fund complex as a whole. Finally, the Board also noted the absence of any applicable regulatory or industry guidelines on this subject, which (as discussed in the Senior Officer's Evaluation) is compounded by the lack of any common industry practice or general pattern with respect to structuring fund advisory fees with “breakpoints” that serve to reduce the fee as the fund attains a certain size. The Senior Officer did not recommend institution of breakpoints in pricing Federated's fund advisory services at this time.
It was noted in the materials for the Board meeting that for the period covered by the Evaluation, the Fund's investment advisory fee, after waivers and expense reimbursements, if any, was below the median of the relevant peer group. The Board reviewed the fees and other expenses of the Fund with the Adviser and was satisfied that the overall expense structure of the Fund remained competitive.
The Senior Officer noted that, considering the totality of the circumstances, and all of the factors referenced within his Evaluation, he had concluded that, subject to comments and recommendations made within his Evaluation, his observations and the information accompanying the Evaluation supported a finding by the Board that the management fees for each of the funds was reasonable and that Federated appeared to provide appropriate advisory and administrative services to the Fund for the fees paid. Under these circumstances, no changes were recommended to, and no objection was raised to, the continuation of the Fund's advisory contract.
In its decision to continue an existing investment advisory contract, the Board was mindful of the potential disruptions of the Fund's operations and various risks, uncertainties and other effects that could occur as a result of a decision to terminate or not renew an advisory contract. In particular, the Board recognized that many shareholders have invested in the Fund on the strength of the Adviser's industry standing and reputation and with the expectation that the Adviser will have a continuing role in providing advisory services to the Fund. Thus, the Board's approval of the advisory contract reflected the fact that it is the shareholders who have effectively selected the Adviser by virtue of having invested in the Fund. The Board concluded that, in light of the factors discussed above, including the nature, quality and scope of the services provided to the Fund by the Adviser and its affiliates, continuation of the advisory contract was appropriate.
The Board based its decision to approve the advisory contract on the totality of the circumstances and relevant factors and with a view to past and future long-term considerations. Not all of the factors and considerations identified above were necessarily relevant to the Fund, nor did the Board consider any one
Annual Shareholder Report
of them to be determinative. With respect to the factors that were relevant, the Board's decision to approve the contract reflects its determination that Federated's performance and actions provided a satisfactory basis to support the decision to continue the existing arrangements.
Annual Shareholder Report
Voting Proxies on Fund Portfolio Securities
A description of the policies and procedures that the Fund uses to determine how to vote proxies, if any, relating to securities held in the Fund's portfolio is available, without charge and upon request, by calling 1-800-341-7400. A report on “Form N-PX” of how the Fund voted any such proxies during the most recent 12-month period ended June 30 is available from Federated's website at FederatedInvestors.com. To access this information from the home page, select “All” under “Asset Classes.” Select a fund name and share class, if applicable, to go to the Fund Overview page. On the Fund Overview page, select the “Documents” tab. At the bottom of that page, select “Proxy Voting Record Report (Form N-PX).” Form N-PX filings are also available at the SEC's website at www.sec.gov.
Quarterly Portfolio Schedule
The Fund files with the SEC a complete schedule of its portfolio holdings, as of the close of the first and third quarters of its fiscal year, on “Form N-Q.” These filings are available on the SEC's website at www.sec.gov and may be reviewed and copied at the SEC's Public Reference Room in Washington, DC. (Call 1-800-SEC-0330 for information on the operation of the Public Reference Room.) You may also access this information from the “Products” section of Federated's website at FederatedInvestors.com. From the home page, select “All” under “Asset Classes.” Select a fund name and share class, if applicable, to go to the Fund Overview page. On the Fund Overview page, select the “Documents” tab. At the bottom of that page, select “Form N-Q.”
Annual Shareholder Report
Mutual funds are not bank deposits or obligations, are not guaranteed by any bank and are not insured or guaranteed by the U.S. government, the Federal Deposit Insurance Corporation, the Federal Reserve Board or any other government agency. Investment in mutual funds involves investment risk, including the possible loss of principal.
This Report is authorized for distribution to prospective investors only when preceded or accompanied by the Fund's Prospectus, which contains facts concerning its objective and policies, management fees, expenses and other information.
Federated MDT Large Cap Growth Fund
Federated Investors Funds
4000 Ericsson Drive
Warrendale, PA 15086-7561
Contact us at FederatedInvestors.com
or call 1-800-341-7400.
Federated Securities Corp., Distributor
CUSIP 31421R700
CUSIP 31421R684
CUSIP 31421R809
CUSIP 31421R882
37329 (9/12)
Federated is a registered trademark of Federated Investors, Inc.
2012 ©Federated Investors, Inc.
Annual Shareholder Report
July 31, 2012
| Share Class | Ticker |
| A | QASCX |
| C | QCSCX |
| Institutional | QISCX |
Federated MDT Small Cap Core Fund
Fund Established 2005
A Portfolio of Federated MDT Series
Dear Valued Shareholder,
I am pleased to present the Annual Shareholder Report for your fund covering the period from August 1, 2011 through July 31, 2012. This report includes Management's Discussion of Fund Performance, a complete listing of your fund's holdings, performance information and financial statements along with other important fund information.
In addition, our website, FederatedInvestors.com, offers easy access to Federated resources that include timely fund updates, economic and market insights from our investment strategists, and financial planning tools. We invite you to register to take full advantage of its capabilities.
Thank you for investing with Federated. I hope you find this information useful and look forward to keeping you informed.
Sincerely,
J. Christopher Donahue, President
Not FDIC Insured • May Lose Value • No Bank Guarantee
Management's Discussion of Fund Performance (unaudited)
The Fund's total return, based on net asset value, for the 12-month reporting period ended July 31, 2012 was -3.64% for Class A Shares, -4.34% for Class C Shares and -3.30% for Institutional Shares. The total return of the Russell 2000® Index (Russell 2000®),1 a broad-based securities market index, was 0.19% for the same period. The Fund's total return for the fiscal year reflected actual cash flows, transaction costs and other fees which were not reflected in the total return of the Russell 2000®.
MARKET OVERVIEW
During the 12-month reporting period, domestic equity market performance was favorable as evidenced by the 7.33% return on the Russell 3000 Index.2 Large-cap stocks led the way, as demonstrated by the 10.41% return of the Russell Top 200® Index,3 exceeding by far the 2.28% and 0.19% results for the Russell Midcap® Index,4 representing the mid-cap stocks, and the Russell 2000®, representing small-cap stocks,5 respectively. Growth stocks outperformed value stocks slightly during the year with the Russell 3000® Growth Index6 returning 7.55% as compared to 7.09% for the Russell 3000® Value Index.7
The best performing sectors in the Russell 2000® during the period were Utilities(+14.17%), Health Care (+10.39%) and Financials (+9.07%). Underperforming sectors included Energy (-27.27%), Materials (-12.26%) and Industrials (-2.85%).
FUND PERFORMANCE
During the reporting period, the most significant positive factor in the Fund's performance relative to the Russell 2000® was stock selection in the Transportation, Financials and Consumer Durables sectors. The most significant negative factors in the Fund's performance were underweights in the Health Care and Utilities sectors, which outperformed the Russell 2000®, and unfavorable stock selection in those sectors. Poor stock selection and overweights in the Materials and Industrials sectors, which underperformed the Russell 2000®, also detracted moderately from relative performance.
Individual stocks enhancing the Fund's performance included US Airways Group, Arctic Cat, Wellcare Health Plans, Cray and Rent-A-Center.
Individual stocks detracting from the performance included Bridgepoint Education, GT Advanced Technologies, Twin Disc, TPC Group and ManTech International.
Annual Shareholder Report
| 1 | The Russell 2000® Index measures the performance of the 2,000 smallest companies in the Russell 3000®Index, which represents approximately 7% of the total market capitalization of the Russell 3000®Index. The index is unmanaged, and it is not possible to invest directly in an index. |
| 2 | The Russell 3000® Index offers investors access to the broad U.S. equity universe representing approximately 98% of the U.S. market. The Russell 3000® Index is constructed to provide a comprehensive, unbiased and stable barometer of the broad market and is completely reconstituted annually to ensure new and growing equities are reflected. The index is unmanaged, and it is not possible to invest directly in an index. |
| 3 | The Russell Top 200® Index measures the performance of the 200 largest companies in the Russell 1000® Index and represents approximately 66% of the total market capitalization of the Russell 1000® Index. The index is unmanaged, and it is not possible to invest directly in an index. |
| 4 | The Russell Midcap® Index measures the performance of the 800 smallest companies in the Russell 1000® Index and represents approximately 27% of the total market capitalization of the Russell 1000® Index. The index is unmanaged, and it is not possible to invest directly in an index. |
| 5 | Small company stocks may be less liquid and subject to greater price volatility than large capitalization stocks. |
| 6 | The Russell 3000® Growth Index measures the performance of those Russell 3000 Index companies with higher price-to-book ratios and higher forecasted growth values. The stocks in this index are also members of either the Russell 1000® Growth or the Russell 2000® Growth indexes. The index is unmanaged, and it is not possible to invest directly in an index. |
| 7 | The Russell 3000® Value Index measures the performance of those Russell 3000® Index companies with lower price-to-book ratios and lower forecasted growth values. The stocks in this index are also members of either the Russell 1000® Value or the Russell 2000® Value indexes. The index is unmanaged, and it is not possible to invest directly in an index. |
Annual Shareholder Report
FUND PERFORMANCE AND GROWTH OF A $10,000 INVESTMENT
The Average Annual Total Return table below shows returns for each class averaged over the stated periods. The graphs below illustrate the hypothetical investment of $10,0001 in the Federated MDT Small Cap Core Fund2 (the “Fund”) from September 15, 2005 (start of performance) to July 31, 2012, compared to the Russell 2000® Index.3
Average Annual Total Returns for the Periods Ended 7/31/2012
(returns reflect all applicable sales charges and contingent deferred sales charges as specified below in footnote #1)
| Share Class | 1 Year | 5 Years | Start of
Performance* |
| Class A Shares | -8.99% | -6.31% | -0.68% |
| Class C Shares | -5.30% | -5.95% | -0.60% |
| Institutional Shares | -3.30% | -5.04% | 0.36% |
| * | The Fund's start of performance date was September 15, 2005. |
Performance data quoted represents past performance which is no guarantee of future results. Investment return and principal value will fluctuate so that an investor's shares, when redeemed, may be worth more or less than their original cost. Mutual fund performance changes over time and current performance may be lower or higher than what is stated. For current to the most recent month-end performance and after-tax returns, visit FederatedInvestors.com or call 1-800-341-7400. Returns shown do not reflect the deduction of taxes that a shareholder would pay on Fund distributions or the redemption of Fund shares. Mutual funds are not obligations of or guaranteed by any bank and are not federally insured.
Growth of a $10,000 INVESTMENT–CLASS A SHARES
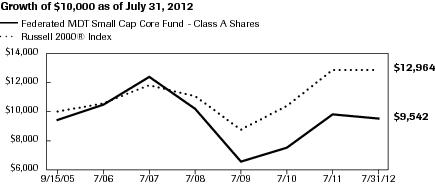
| Federated MDT Small Cap Core Fund - Class A Shares | C000035058 | Russell 2000® Index |
| 9/15/2005 | 9,450 | 10,000 |
| 7/31/2006 | 10,499 | 10,633 |
| 7/31/2007 | 12,493 | 11,922 |
| 7/31/2008 | 10,234 | 11,122 |
| 7/31/2009 | 6,595 | 8,817 |
| 7/31/2010 | 7,567 | 10,442 |
| 7/31/2011 | 9,903 | 12,940 |
| 7/31/2012 | 9,542 | 12,964 |
41 graphic description end -->
| ■ | Total returns shown include the maximum sales charge of 5.50% ($10,000 investment minus $550 sales charge = $9,450). |
Annual Shareholder Report
Growth of a $10,000 INVESTMENT–CLASS C SHARES
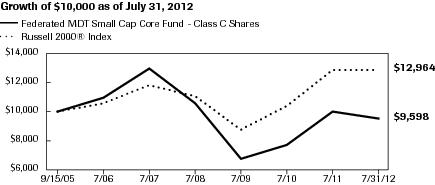
| Federated MDT Small Cap Core Fund - Class C Shares | C000035059 | Russell 2000® Index |
| 9/15/2005 | 10,000 | 10,000 |
| 7/31/2006 | 11,050 | 10,633 |
| 7/31/2007 | 13,040 | 11,922 |
| 7/31/2008 | 10,606 | 11,122 |
| 7/31/2009 | 6,784 | 8,817 |
| 7/31/2010 | 7,729 | 10,442 |
| 7/31/2011 | 10,033 | 12,940 |
| 7/31/2012 | 9,598 | 12,964 |
41 graphic description end -->
| ■ | Total returns shown include the maximum contingent deferred sales charge of 1.00%, as applicable. |
Growth of a $10,000 INVESTMENT–INSTITUTIONAL SHARES
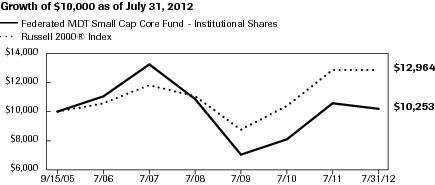
| Federated MDT Small Cap Core Fund - Institutional Shares | C000035060 | Russell 2000® Index |
| 9/15/2005 | 10,000 | 10,000 |
| 7/31/2006 | 11,140 | 10,633 |
| 7/31/2007 | 13,280 | 11,922 |
| 7/31/2008 | 10,900 | 11,122 |
| 7/31/2009 | 7,030 | 8,817 |
| 7/31/2010 | 8,090 | 10,442 |
| 7/31/2011 | 10,603 | 12,940 |
| 7/31/2012 | 10,253 | 12,964 |
41 graphic description end -->
| 1 | Represents a hypothetical investment of $10,000 in the Fund after deducting applicable sales charges: For Class A Shares, the maximum sales charge of 5.50% ($10,000 investment minus $550 sales charge = $9,450); for Class C Shares, a 1.00% contingent deferred sales charge would be applied on any redemption less than one year from the purchase date. The Fund's performance assumes the reinvestment of all dividends and distributions. The Russell 2000® Index has been adjusted to reflect reinvestment of dividends on securities in the index. |
| 2 | The Fund is a successor to MDT Small Cap Core Fund pursuant to a reorganization that took place on December 8, 2006. Prior to that date, the Fund had no investment operations. Accordingly, the performance information shown for periods prior to that date is that of the MDT Small Cap Core Fund. |
| 3 | The Russell 2000® Index measures the performance of the 2,000 smallest companies in the Russell 3000® Index, which represents approximately 10% of the total market capitalization of the Russell 3000® Index. The index is not adjusted to reflect sales charges, expenses or other fees that the Securities and Exchange Commission requires to be reflected in the Fund's performance. It is not possible to invest directly in an index. |
Annual Shareholder Report
Portfolio of Investments Summary Table (unaudited)
At July 31, 2012, the Fund's industry composition1 was as follows:
| Industry Composition | Percentage of
Total Net Assets |
| Regional Banks | 5.3% |
| Financial Services | 4.5% |
| Specialty Retailing | 4.0% |
| Computer Services | 3.7% |
| Paper Products | 2.4% |
| Specialty Chemicals | 2.4% |
| Miscellaneous Components | 2.3% |
| Oil Service, Explore & Drill | 2.3% |
| Miscellaneous Food Products | 2.1% |
| Oil Refiner | 1.9% |
| Airline - Regional | 1.8% |
| Other Tobacco Products | 1.8% |
| Auto Original Equipment Manufacturers | 1.7% |
| Biotechnology | 1.7% |
| Crude Oil & Gas Production | 1.7% |
| Electrical Equipment | 1.7% |
| Hotels and Motels | 1.7% |
| Airline - National | 1.6% |
| Apparel | 1.6% |
| Professional Services | 1.6% |
| Property Liability Insurance | 1.6% |
| Diversified Leisure | 1.5% |
| Personal Loans | 1.5% |
| Software Packaged/Custom | 1.5% |
| Auto Rentals | 1.4% |
| Life Insurance | 1.4% |
| Education & Training Services | 1.3% |
| Printing | 1.3% |
| Telecommunication Equipment & Services | 1.3% |
| Generic Drugs | 1.2% |
| Multi-Line Insurance | 1.2% |
| Office Supplies | 1.2% |
| Recreational Vehicles | 1.2% |
| Rubber | 1.2% |
| Semiconductor Manufacturing | 1.2% |
| Clothing Stores | 1.1% |
| Construction Machinery | 1.1% |
Annual Shareholder Report
| Industry Composition | Percentage of
Total Net Assets |
| Health Care | 1.1% |
| Commodity Chemicals | 1.0% |
| Computer Networking | 1.0% |
| Defense Electronics | 1.0% |
| Medical Supplies | 1.0% |
| Metal Fabrication | 1.0% |
| Recreational Goods | 1.0% |
| Toys & Games | 1.0% |
| Other2 | 20.3% |
| Cash Equivalents3 | 1.8% |
| Other Assets and Liabilities—Net4 | (0.2)% |
| TOTAL | 100.0% |
| 1 | Except for Cash Equivalents and Other Assets and Liabilities, industry classifications are based upon, and individual portfolio securities are assigned to, the classifications of the Global Industry Classification Standard (GICS) except that the Adviser assigns a classification to securities not classified by the GICS and to securities for which the Adviser does not have access to the classification made by the GICS. |
| 2 | For purposes of this table, industry classifications which constitute less than 1.0% of the Fund's total net assets have been aggregated under the designation “Other.” |
| 3 | Cash Equivalents include any investments in money market mutual funds and/or overnight repurchase agreements. |
| 4 | Assets, other than investments in securities, less liabilities. See Statement of Assets and Liabilities.
|
Annual Shareholder Report
Portfolio of Investments
July 31, 2012
| Shares | | | Value |
| | COMMON STOCKS—98.4% | |
| | Accident & Health Insurance—0.1% | |
| 1,087 | 1 | Triple-S Management Corp., Class B | $19,805 |
| | Agricultural Machinery—0.2% | |
| 534 | | Lindsay Manufacturing Co. | 37,861 |
| | Airline - National—1.6% | |
| 19,427 | 1 | Jet Blue Airways Corp. | 107,043 |
| 13,570 | 1 | US Airways Group, Inc. | 155,512 |
| | TOTAL | 262,555 |
| | Airline - Regional—1.8% | |
| 6,676 | 1 | Alaska Air Group, Inc. | 232,659 |
| 674 | 1 | Allegiant Travel Co. | 47,894 |
| 5,614 | 1 | Republic Airways Holdings, Inc. | 25,544 |
| | TOTAL | 306,097 |
| | Aluminum—0.2% | |
| 554 | | Kaiser Aluminum Corp. | 30,215 |
| 1,454 | | Noranda Aluminum, Inc. | 9,059 |
| | TOTAL | 39,274 |
| | Apparel—1.6% | |
| 5,237 | 1 | Express, Inc. | 84,316 |
| 1,249 | 1 | Iconix Brand Group, Inc. | 22,145 |
| 3,720 | 1 | Warnaco Group, Inc. | 158,695 |
| | TOTAL | 265,156 |
| | Auto Original Equipment Manufacturers—1.7% | |
| 11,958 | | Dana Holding Corp. | 157,606 |
| 4,292 | 1 | Modine Manufacturing Co. | 28,799 |
| 3,454 | 1 | Tenneco Automotive, Inc. | 101,168 |
| | TOTAL | 287,573 |
| | Auto Rentals—1.4% | |
| 2,502 | 1 | AMERCO | 233,687 |
| | Biotechnology—1.7% | |
| 7,850 | 1 | Cambrex Corp. | 72,456 |
| 12,413 | | PDL BioPharma, Inc. | 84,284 |
| 2,179 | 1 | Questcor Pharmaceuticals, Inc. | 80,340 |
| 1,434 | 1 | Theravance, Inc. | 41,772 |
| | TOTAL | 278,852 |
Annual Shareholder Report
| Shares | | | Value |
| | COMMON STOCKS—continued | |
| | Broadcasting—0.5% | |
| 2,504 | 1 | Fisher Communications, Inc. | $80,028 |
| | Building Materials—0.1% | |
| 669 | | Universal Forest Products, Inc. | 21,361 |
| | Business Services—0.1% | |
| 700 | 1 | Euronet Worldwide, Inc. | 12,796 |
| | Carpets—0.2% | |
| 3,365 | | Culp, Inc. | 33,650 |
| | Cement—0.5% | |
| 1,959 | | Eagle Materials, Inc. | 68,075 |
| 488 | | Texas Industries, Inc. | 20,384 |
| | TOTAL | 88,459 |
| | Clothing Stores—1.1% | |
| 2,550 | 1 | Citi Trends, Inc. | 38,326 |
| 3,800 | | Mens Wearhouse, Inc. | 103,550 |
| 7,586 | 1 | New York & Co. | 34,516 |
| | TOTAL | 176,392 |
| | Commercial Services—0.0% | |
| 377 | 1 | Darling International, Inc. | 6,228 |
| | Commodity Chemicals—1.0% | |
| 2,494 | | Innospec, Inc. | 77,613 |
| 385 | | Newmarket Corp. | 88,504 |
| | TOTAL | 166,117 |
| | Computer Networking—1.0% | |
| 1,951 | | Black Box Corp. | 51,975 |
| 9,449 | 1 | Cray, Inc. | 117,451 |
| | TOTAL | 169,426 |
| | Computer Peripherals—0.3% | |
| 8,723 | 1 | Emulex Corp. | 56,438 |
| | Computer Services—3.7% | |
| 4,359 | 1 | CACI International, Inc., Class A | 246,066 |
| 5,344 | 1 | Synnex Corp. | 180,787 |
| 778 | | Syntel, Inc. | 45,225 |
| 7,130 | 1 | Unisys Corp. | 138,536 |
| | TOTAL | 610,614 |
| | Computer Stores—0.6% | |
| 8,469 | 1 | PC Connections, Inc. | 100,696 |
| | Construction Machinery—1.1% | |
| 1,770 | | NACCO Industries, Inc., Class A | 177,266 |
Annual Shareholder Report
| Shares | | | Value |
| | COMMON STOCKS—continued | |
| | Cosmetics & Toiletries—0.2% | |
| 2,393 | 1 | Revlon, Inc. | $34,818 |
| | Crude Oil & Gas Production—1.7% | |
| 4,955 | 1 | Energy Partners Ltd. | 83,740 |
| 6,185 | | Energy XXI (Bermuda) Ltd. | 192,848 |
| | TOTAL | 276,588 |
| | Defense Aerospace—0.5% | |
| 3,068 | 1 | Hexcel Corp. | 71,454 |
| 265 | | Triumph Group, Inc. | 16,570 |
| | TOTAL | 88,024 |
| | Defense Electronics—1.0% | |
| 10,275 | | Miller Industries, Inc. | 168,716 |
| | Diversified Leisure—1.5% | |
| 5,494 | 1 | Carmike Cinemas, Inc. | 76,367 |
| 667 | 1 | Coinstar, Inc. | 31,676 |
| 5,032 | 1 | Isle of Capri Casinos, Inc. | 29,538 |
| 7,817 | 1 | Multimedia Games Holding Company, Inc. | 110,610 |
| | TOTAL | 248,191 |
| | Education & Training Services—1.3% | |
| 5,336 | 1 | Bridgepoint Education, Inc. | 48,558 |
| 1,324 | 1 | Capella Education Co. | 35,112 |
| 9,085 | 1 | Corinthian Colleges, Inc. | 18,352 |
| 2,844 | 1 | ITT Educational Services, Inc. | 110,404 |
| | TOTAL | 212,426 |
| | Electric & Electronic Original Equipment Manufacturers—0.6% | |
| 3,580 | 1 | General Cable Corp. | 93,545 |
| | Electrical Equipment—1.7% | |
| 6,855 | 1 | EnerSys, Inc. | 234,098 |
| 1,128 | | Robbins & Myers, Inc. | 51,708 |
| | TOTAL | 285,806 |
| | Electronics Stores—0.2% | |
| 2,255 | 1 | Rex Stores Corp. | 39,801 |
| | Ethical Drugs—0.4% | |
| 2,572 | 1 | Auxilium Pharmaceutical, Inc. | 69,290 |
| | Financial Services—4.5% | |
| 8,823 | | Deluxe Corp. | 249,867 |
| 2,917 | 1 | Encore Capital Group, Inc. | 81,676 |
| 4,664 | 1 | Global Cash Access LLC | 30,130 |
| 8,258 | | MainSource Financial Group, Inc. | 96,454 |
Annual Shareholder Report
| Shares | | | Value |
| | COMMON STOCKS—continued | |
| | Financial Services—continued | |
| 10,526 | | Nelnet, Inc., Class A | $247,466 |
| 455 | 1 | Portfolio Recovery Associates, Inc. | 38,529 |
| | TOTAL | 744,122 |
| | Food Wholesaling—0.3% | |
| 1,552 | | Nash Finch Co. | 29,736 |
| 9,751 | | SUPERVALU, Inc. | 24,085 |
| | TOTAL | 53,821 |
| | Generic Drugs—1.2% | |
| 4,151 | 1 | Hi-Tech Pharmacal Co., Inc. | 142,628 |
| 2,450 | 1 | Impax Laboratories, Inc. | 54,439 |
| | TOTAL | 197,067 |
| | Greeting Cards—0.6% | |
| 7,686 | | American Greetings Corp., Class A | 102,147 |
| | Health Care—1.1% | |
| 3,881 | 1 | USANA, Inc. | 174,567 |
| | Home Building—0.4% | |
| 1,846 | | M.D.C. Holdings, Inc. | 58,814 |
| | Home Health Care—0.2% | |
| 4,016 | 1 | Gentiva Health Services, Inc. | 26,747 |
| | Hospitals—0.5% | |
| 7,891 | 1 | Select Medical Holdings Corp. | 84,039 |
| | Hotels and Motels—1.7% | |
| 9,699 | | Ameristar Casinos, Inc. | 163,622 |
| 2,026 | | Six Flags Entertainment Corp. | 116,718 |
| | TOTAL | 280,340 |
| | Household Appliances—0.2% | |
| 5,775 | 1 | hhgregg, Inc. | 39,732 |
| | Industrial Machinery—0.4% | |
| 3,343 | | Twin Disc, Inc. | 65,456 |
| | Insurance Brokerage—0.4% | |
| 1,513 | | AmTrust Financial Services, Inc. | 45,072 |
| 5,200 | | Crawford & Co., Class B | 21,008 |
| | TOTAL | 66,080 |
| | Internet Services—0.8% | |
| 7,313 | 1 | Overstock.com, Inc. | 58,796 |
| 3,824 | 1 | Tree.com, Inc. | 49,406 |
| 6,969 | | United Online, Inc. | 29,549 |
| | TOTAL | 137,751 |
Annual Shareholder Report
| Shares | | | Value |
| | COMMON STOCKS—continued | |
| | Life Insurance—1.4% | |
| 6,924 | | American Equity Investment Life Holding Co. | $80,803 |
| 2,989 | | Primerica, Inc. | 81,809 |
| 5,868 | | Symetra Financial Corp. | 68,245 |
| | TOTAL | 230,857 |
| | Machine Tools—0.3% | |
| 2,328 | 1 | Hurco Co., Inc. | 47,491 |
| | Machined Parts Original Equipment Manufacturers—0.6% | |
| 4,578 | | Titan International, Inc. | 94,627 |
| | Maritime—0.5% | |
| 7,711 | | Frontline Ltd. | 28,531 |
| 1,363 | | TAL International Group, Inc. | 46,546 |
| | TOTAL | 75,077 |
| | Medical Supplies—1.0% | |
| 2,798 | 1 | Align Technology, Inc. | 95,020 |
| 4,691 | | Invacare Corp. | 66,096 |
| | TOTAL | 161,116 |
| | Medical Technology—0.6% | |
| 281 | 1 | Abaxis, Inc. | 10,029 |
| 3,466 | 1 | Cynosure, Inc., Class A | 86,789 |
| | TOTAL | 96,818 |
| | Metal Fabrication—1.0% | |
| 2,058 | 1 | NN, Inc. | 18,522 |
| 6,985 | | Worthington Industries, Inc. | 151,575 |
| | TOTAL | 170,097 |
| | Miscellaneous Components—2.3% | |
| 15,110 | 1 | Amkor Technology, Inc. | 80,536 |
| 7,180 | 1 | Pericom Semiconductor Corp. | 57,727 |
| 1,139 | | Power Integrations, Inc. | 40,138 |
| 10,147 | 1 | Qlogic Corp. | 117,097 |
| 8,349 | 1 | Vishay Intertechnology, Inc. | 82,405 |
| | TOTAL | 377,903 |
| | Miscellaneous Food Products—2.1% | |
| 8,120 | | Fresh Del Monte Produce, Inc. | 198,940 |
| 4,058 | | The Anderson's, Inc. | 154,082 |
| | TOTAL | 353,022 |
| | Miscellaneous Machinery—0.5% | |
| 1,586 | | John Bean Technologies Corp. | 23,235 |
Annual Shareholder Report
| Shares | | | Value |
| | COMMON STOCKS—continued | |
| | Miscellaneous Machinery—continued | |
| 5,734 | 1 | TMS International Corp. | $56,078 |
| | TOTAL | 79,313 |
| | Miscellaneous Metals—0.2% | |
| 1,661 | | Materion Corp | 32,605 |
| | Money Center Bank—0.3% | |
| 2,400 | | MidWestOne Financial Group, Inc. | 51,072 |
| | Multi-Industry Basic—0.3% | |
| 2,276 | | Olin Corp. | 46,066 |
| | Multi-Industry Capital Goods—0.2% | |
| 5 | 1 | DXP Enterprises, Inc. | 221 |
| 3,151 | 1 | Lydall, Inc. | 40,207 |
| | TOTAL | 40,428 |
| | Multi-Industry Transportation—0.9% | |
| 6,147 | | Brinks Co. (The) | 142,610 |
| | Multi-Line Insurance—1.2% | |
| 3,310 | | Alterra Capital Holdings Ltd. | 77,024 |
| 3,610 | | FBL Financial Group, Inc., Class A | 111,730 |
| 771 | | Tower Group, Inc. | 14,371 |
| | TOTAL | 203,125 |
| | Natural Gas Production—0.3% | |
| 6,168 | 1 | VAALCO Energy, Inc. | 45,211 |
| | Office Supplies—1.2% | |
| 9,163 | 1 | Acco Brands Corp. | 77,611 |
| 44 | | Ennis Business Forms, Inc. | 631 |
| 4,626 | | United Stationers, Inc. | 116,621 |
| | TOTAL | 194,863 |
| | Offshore Driller—0.1% | |
| 3,142 | 1 | Newpark Resources, Inc. | 21,460 |
| | Oil Refiner—1.9% | |
| 6,816 | | Alon USA Energy, Inc. | 74,431 |
| 9,973 | | Western Refining, Inc. | 234,664 |
| | TOTAL | 309,095 |
| | Oil Service, Explore & Drill—2.3% | |
| 4,194 | 1 | C&J Energy Services, Inc. | 78,763 |
| 13,527 | 1 | Helix Energy Solutions Group, Inc. | 241,863 |
| 13,337 | 1 | Parker Drilling Co. | 61,750 |
| | TOTAL | 382,376 |
Annual Shareholder Report
| Shares | | | Value |
| | COMMON STOCKS—continued | |
| | Optical Reading Equipment—0.4% | |
| 2,060 | 1 | ScanSource, Inc. | $59,472 |
| | Other Tobacco Products—1.8% | |
| 1,590 | | Schweitzer-Mauduit International, Inc. | 108,279 |
| 4,263 | | Universal Corp. | 194,137 |
| | TOTAL | 302,416 |
| | Packaged Foods—0.6% | |
| 8,178 | 1 | Dole Food Co., Inc. | 96,255 |
| | Paint & Related Materials—0.0% | |
| 2,288 | 1 | Ferro Corp. | 7,024 |
| | Paper Products—2.4% | |
| 17,407 | 1 | Boise, Inc. | 128,812 |
| 2,908 | | Buckeye Technologies, Inc. | 87,589 |
| 6,817 | | Neenah Paper, Inc. | 183,104 |
| | TOTAL | 399,505 |
| | Personal Loans—1.5% | |
| 4,976 | | Cash America International, Inc. | 190,680 |
| 725 | 1 | World Acceptance Corp. | 51,671 |
| | TOTAL | 242,351 |
| | Personnel Agency—0.8% | |
| 1,826 | | Barrett Business Services, Inc. | 47,695 |
| 7,535 | | Kelly Services, Inc., Class A | 89,365 |
| | TOTAL | 137,060 |
| | Plastic—0.6% | |
| 4,664 | | Schulman (A.), Inc. | 101,955 |
| | Printed Circuit Boards—0.7% | |
| 4,567 | 1 | Sanmina-SCI Corp. | 39,002 |
| 6,540 | 1 | TTM Technologies | 71,548 |
| | TOTAL | 110,550 |
| | Printing—1.3% | |
| 1,417 | 1 | Consolidated Graphics, Inc. | 33,597 |
| 2,394 | | Quad Graphics, Inc. | 36,844 |
| 6,383 | 1 | Valassis Communications, Inc. | 143,936 |
| | TOTAL | 214,377 |
| | Professional Services—1.6% | |
| 4,481 | | Carriage Services, Inc. | 36,207 |
| 3,970 | 1 | FTI Consulting, Inc. | 101,354 |
| 6,903 | | Hillenbrand, Inc. | 119,353 |
| | TOTAL | 256,914 |
Annual Shareholder Report
| Shares | | | Value |
| | COMMON STOCKS—continued | |
| | Property Liability Insurance—1.6% | |
| 116 | 1 | American Safety Insurance Holdings, Ltd. | $2,071 |
| 5,930 | | Meadowbrook Insurance Group, Inc. | 41,747 |
| 1,374 | | Platinum Underwriters Holdings Ltd. | 52,239 |
| 1,854 | | ProAssurance Corp. | 166,063 |
| | TOTAL | 262,120 |
| | Recreational Goods—1.0% | |
| 15,903 | 1 | Smith & Wesson Holding Corp. | 160,620 |
| | Recreational Vehicles—1.2% | |
| 4,355 | 1 | Arctic Cat, Inc. | 191,620 |
| | Regional Banks—5.3% | |
| 7,422 | 1 | Citizens Banking Corp. | 133,596 |
| 3,174 | | Enterprise Financial Services Corp. | 39,834 |
| 3,399 | | Financial Institutions, Inc. | 58,463 |
| 7,229 | 1 | First BanCorp | 27,326 |
| 11,071 | | First Merchants Corp. | 157,540 |
| 9,418 | 1 | Hanmi Financial Corp. | 103,127 |
| 3,206 | | Heartland Financial USA, Inc. | 83,773 |
| 4,104 | | Peoples Bancorp, Inc. | 89,713 |
| 3,270 | | Republic Bancorp, Inc. | 77,205 |
| 1,005 | | Southside Bancshares, Inc. | 20,964 |
| 12,745 | 1 | Wilshire Bancorp, Inc. | 80,803 |
| | TOTAL | 872,344 |
| | Restaurant—0.2% | |
| 634 | 1 | Papa Johns International, Inc. | 32,340 |
| | Roofing & Wallboard—0.2% | |
| 2,142 | 1 | USG Corp. | 34,786 |
| | Rubber—1.2% | |
| 11,787 | | Cooper Tire & Rubber Co. | 205,919 |
| | Semiconductor Manufacturing—1.2% | |
| 2,143 | 1 | Cirrus Logic, Inc. | 78,798 |
| 4,450 | 1 | Omnivision Technologies, Inc. | 62,389 |
| 5,751 | 1 | Spansion, Inc. | 58,948 |
| | TOTAL | 200,135 |
| | Semiconductor Manufacturing Equipment—0.7% | |
| 7,153 | 1 | Mentor Graphics Corp. | 109,298 |
| | Shoes—0.3% | |
| 3,507 | 1 | CROCs, Inc. | 53,832 |
Annual Shareholder Report
| Shares | | | Value |
| | COMMON STOCKS—continued | |
| | Silver Production—0.1% | |
| 828 | 1 | Coeur d'Alene Mines Corp. | $13,505 |
| | Software Packaged/Custom—1.5% | |
| 4,319 | 1 | CSG Systems International, Inc. | 76,144 |
| 4,868 | | ManTech International Corp., Class A | 106,755 |
| 1,662 | 1 | SS&C Technologies Holdings, Inc. | 40,387 |
| 2,170 | 1 | Websense, Inc. | 32,572 |
| | TOTAL | 255,858 |
| | Specialty Chemicals—2.4% | |
| 14,176 | 1 | Chemtura Corp. | 191,660 |
| 2,409 | | Koppers Holdings, Inc. | 79,352 |
| 2,896 | 1 | LSB Industries, Inc. | 93,049 |
| 4,748 | 1 | Omnova Solutions, Inc. | 34,565 |
| | TOTAL | 398,626 |
| | Specialty Machinery—0.7% | |
| 2,449 | | Cascade Corp. | 115,372 |
| | Specialty Retailing—4.0% | |
| 2,020 | 1 | Asbury Automotive Group, Inc. | 52,843 |
| 4,807 | 1 | Conn's, Inc. | 85,805 |
| 1,421 | | GNC Acquisition Holdings, Inc. | 54,751 |
| 1,109 | 1 | Hibbett Sports, Inc. | 67,394 |
| 3,065 | | Lithia Motors, Inc., Class A | 85,391 |
| 1,217 | 1 | Lumber Liquidators, Inc. | 51,467 |
| 6,864 | 1 | MarineMax, Inc. | 51,068 |
| 3,820 | | Natures Sunshine Products, Inc. | 59,057 |
| 6,013 | | Sonic Automotive, Inc. | 102,943 |
| 814 | 1 | Vitamin Shoppe Industries, Inc. | 44,705 |
| | TOTAL | 655,424 |
| | Telecommunication Equipment & Services—1.3% | |
| 3,381 | 1 | Anixter International, Inc. | 192,413 |
| 325 | 1 | Mastec, Inc. | 5,187 |
| 1,527 | 1 | Ubiquiti Networks, Inc. | 21,592 |
| | TOTAL | 219,192 |
| | Telephone Utility—0.7% | |
| 4,613 | 1 | Hawaiian Telcom Holdco, Inc. | 83,034 |
| 21,665 | 1 | Vonage Holdings Corp. | 38,780 |
| | TOTAL | 121,814 |
| | Textiles Apparel & Luxury Goods—0.7% | |
| 3,345 | | R.G. Barry Corp. | 44,556 |
Annual Shareholder Report
| Shares | | | Value |
| | COMMON STOCKS—continued | |
| | Textiles Apparel & Luxury Goods—continued | |
| 4,218 | | The Jones Group, Inc. | $44,584 |
| 2,412 | 1 | Unifi, Inc. | 26,725 |
| | TOTAL | 115,865 |
| | Toys & Games—1.0% | |
| 14,140 | 1 | Leapfrog Enterprises, Inc. | 162,469 |
| | Water Utility—0.3% | |
| 15,389 | | Mueller Water Products, Inc. | 54,477 |
| | TOTAL COMMON STOCKS
(IDENTIFIED COST $15,710,572) | 16,296,946 |
| | MUTUAL FUND—1.8% | |
| 296,930 | 2,3 | Federated Prime Value Obligations Fund, Institutional Shares, 0.22%
(AT NET ASSET VALUE) | 296,930 |
| | TOTAL INVESTMENTS—100.2%
(IDENTIFIED COST $16,007,502)4 | 16,593,876 |
| | OTHER ASSETS AND LIABILITIES - NET—(0.2)%5 | (35,455) |
| | TOTAL NET ASSETS—100% | $16,558,421 |
| 1 | Non-income producing security. |
| 2 | Affiliated holding. |
| 3 | 7-Day net yield. |
| 4 | The cost of investments for federal tax purposes amounts to $16,077,448. |
| 5 | Assets, other than investments in securities, less liabilities. See Statement of Assets and Liabilities. |
Note: The categories of investments are shown as a percentage of total net assets at July 31, 2012.
Various inputs are used in determining the value of the Fund's investments. These inputs are summarized in the three broad levels listed below:
Level 1—quoted prices in active markets for identical securities, including investment companies with daily net asset values, if applicable.
Level 2—other significant observable inputs (including quoted prices for similar securities, interest rates, prepayment speeds, credit risk, etc.). Also includes securities valued at amortized cost.
Level 3—significant unobservable inputs (including the Fund's own assumptions in determining the fair value of investments).
The inputs or methodology used for valuing securities are not an indication of the risk associated with investing in those securities.
As of July 31, 2012, all investments of the Fund utilized Level 1 inputs in valuing the Fund's assets carried at fair value.
See Notes which are an integral part of the Financial Statements
Annual Shareholder Report
Financial Highlights–Class A Shares
(For a Share Outstanding Throughout Each Period)
| Year Ended July 31 | 2012 | 2011 | 2010 | 2009 | 2008 |
| Net Asset Value, Beginning of Period | $9.88 | $7.55 | $6.58 | $10.21 | $13.22 |
| Income From Investment Operations: | | | | | |
| Net investment income (loss) | (0.06)1 | (0.09)1 | (0.06)1 | (0.04)1 | (0.08)1 |
| Net realized and unrealized gain (loss) on investments | (0.30) | 2.42 | 1.03 | (3.59) | (2.22) |
| TOTAL FROM INVESTMENT OPERATIONS | (0.36) | 2.33 | 0.97 | (3.63) | (2.30) |
| Less Distributions: | | | | | |
| Distributions from net realized gain on investments | — | — | — | — | (0.71) |
| Net Asset Value, End of Period | $9.52 | $9.88 | $7.55 | $6.58 | $10.21 |
| Total Return2 | (3.64)% | 30.86% | 14.74% | (35.55)% | (18.09)% |
| Ratios to Average Net Assets: | | | | | |
| Net expenses | 1.71% | 1.75% | 1.75% | 1.74% | 1.75% |
| Net investment income (loss) | (0.65)% | (0.96)% | (0.77)% | (0.53)% | (0.68)% |
| Expense waiver/reimbursement3 | 4.24% | 3.75% | 5.41% | 5.73% | 3.85% |
| Supplemental Data: | | | | | |
| Net assets, end of period (000 omitted) | $2,550 | $3,469 | $3,184 | $1,652 | $2,623 |
| Portfolio turnover | 222% | 210% | 192% | 222% | 243% |
| 1 | Per share numbers have been calculated using the average shares method. |
| 2 | Based on net asset value, which does not reflect the sales charge, redemption fee or contingent deferred sales charge, if applicable. |
| 3 | This expense decrease is reflected in both the net expense and the net investment income (loss) ratios shown above. |
See Notes which are an integral part of the Financial Statements
Annual Shareholder Report
Financial Highlights–Class C Shares
(For a Share Outstanding Throughout Each Period)
| Year Ended July 31 | 2012 | 2011 | 2010 | 2009 | 2008 |
| Net Asset Value, Beginning of Period | $9.45 | $7.28 | $6.39 | $9.99 | $13.04 |
| Income From Investment Operations: | | | | | |
| Net investment income (loss) | (0.12)1 | (0.15)1 | (0.11)1 | (0.08)1 | (0.16)1 |
| Net realized and unrealized gain (loss) on investments | (0.29) | 2.32 | 1.00 | (3.52) | (2.18) |
| TOTAL FROM INVESTMENT OPERATIONS | (0.41) | 2.17 | 0.89 | (3.60) | (2.34) |
| Less Distributions: | | | | | |
| Distributions from net realized gain on investments | — | — | — | — | (0.71) |
| Net Asset Value, End of Period | $9.04 | $9.45 | $7.28 | $6.39 | $9.99 |
| Total Return2 | (4.34)% | 29.81% | 13.93% | (36.04)% | (18.66)% |
| Ratios to Average Net Assets: | | | | | |
| Net expenses | 2.46% | 2.50% | 2.50% | 2.49% | 2.46% |
| Net investment income (loss) | (1.41)% | (1.70)% | (1.53)% | (1.29)% | (1.40)% |
| Expense waiver/reimbursement3 | 4.24% | 3.78% | 5.13% | 5.61% | 3.90% |
| Supplemental Data: | | | | | |
| Net assets, end of period (000 omitted) | $2,358 | $2,978 | $3,258 | $1,366 | $2,759 |
| Portfolio turnover | 222% | 210% | 192% | 222% | 243% |
| 1 | Per share numbers have been calculated using the average shares method. |
| 2 | Based on net asset value, which does not reflect the sales charge, redemption fee or contingent deferred sales charge, if applicable. |
| 3 | This expense decrease is reflected in both the net expense and the net investment income (loss) ratios shown above. |
See Notes which are an integral part of the Financial Statements
Annual Shareholder Report
Financial Highlights–Institutional Shares
(For a Share Outstanding Throughout Each Period)
| Year Ended July 31 | 2012 | 2011 | 2010 | 2009 | 2008 |
| Net Asset Value, Beginning of Period | $10.00 | $7.63 | $6.63 | $10.28 | $13.28 |
| Income From Investment Operations: | | | | | |
| Net investment income (loss) | (0.04)1 | (0.06)1 | (0.04)1 | (0.02)1 | (0.05)1 |
| Net realized and unrealized gain (loss) on investments | (0.29) | 2.43 | 1.04 | (3.63) | (2.24) |
| TOTAL FROM INVESTMENT OPERATIONS | (0.33) | 2.37 | 1.00 | (3.65) | (2.29) |
| Less Distributions: | | | | | |
| Distributions from net realized gain on investments | — | — | — | — | (0.71) |
| Net Asset Value, End of Period | $9.67 | $10.00 | $7.63 | $6.63 | $10.28 |
| Total Return2 | (3.30)% | 31.06% | 15.08% | (35.51)% | (17.92)% |
| Ratios to Average Net Assets: | | | | | |
| Net expenses | 1.46% | 1.50% | 1.50% | 1.49% | 1.50% |
| Net investment income (loss) | (0.44)% | (0.71)% | (0.52)% | (0.30)% | (0.43)% |
| Expense waiver/reimbursement3 | 3.77% | 3.79% | 5.56% | 5.22% | 3.55% |
| Supplemental Data: | | | | | |
| Net assets, end of period (000 omitted) | $11,650 | $4,836 | $5,727 | $3,319 | $10,064 |
| Portfolio turnover | 222% | 210% | 192% | 222% | 243% |
| 1 | Per share numbers have been calculated using the average shares method. |
| 2 | Based on net asset value. |
| 3 | This expense decrease is reflected in both the net expense and the net investment income (loss) ratios shown above. |
See Notes which are an integral part of the Financial Statements
Annual Shareholder Report
Statement of Assets and Liabilities
July 31, 2012
| Assets: | | |
| Total investment in securities, at value including $296,930 of investment in an affiliated holding (Note 5) (identified cost $16,007,502) | | $16,593,876 |
| Income receivable | | 4,663 |
| Receivable for investments sold | | 444,727 |
| Receivable for shares sold | | 2,701 |
| TOTAL ASSETS | | 17,045,967 |
| Liabilities: | | |
| Payable for investments purchased | $423,807 | |
| Payable for shares redeemed | 6,706 | |
| Payable to adviser (Note 5) | 1,691 | |
| Payable for auditing fees | 23,400 | |
| Payable for portfolio accounting fees | 11,190 | |
| Payable for distribution services fee (Note 5) | 1,520 | |
| Payable for shareholder services fee (Note 5) | 2,267 | |
| Accrued expenses | 16,965 | |
| TOTAL LIABILITIES | | 487,546 |
| Net assets for 1,733,818 shares outstanding | | $16,558,421 |
| Net Assets Consist of: | | |
| Paid-in capital | | $27,819,949 |
| Net unrealized appreciation of investments | | 586,374 |
| Accumulated net realized loss on investments | | (11,791,462) |
| Accumulated net investment income (loss) | | (56,440) |
| TOTAL NET ASSETS | | $16,558,421 |
Annual Shareholder Report
Statement of Assets and Liabilities–continued
| Net Asset Value, Offering Price and Redemption Proceeds Per Share | | |
| Class A Shares: | | |
| Net asset value per share ($2,549,800 ÷ 267,805 shares outstanding), no par value, unlimited shares authorized | | $9.52 |
| Offering price per share (100/94.50 of $9.52) | | $10.07 |
| Redemption proceeds per share | | $9.52 |
| Class C Shares: | | |
| Net asset value per share ($2,358,253 ÷ 260,828 shares outstanding), no par value, unlimited shares authorized | | $9.04 |
| Offering price per share | | $9.04 |
| Redemption proceeds per share (99.00/100 of $9.04) | | $8.95 |
| Institutional Shares: | | |
| Net asset value per share ($11,650,368 ÷ 1,205,185 shares outstanding), no par value, unlimited shares authorized | | $9.67 |
| Offering price per share | | $9.67 |
| Redemption proceeds per share | | $9.67 |
See Notes which are an integral part of the Financial Statements
Annual Shareholder Report
Statement of Operations
Year Ended July 31, 2012
| Investment Income: | | | |
| Dividends (including $358 received from an affiliated holding (Note 5) and net of foreign taxes withheld of $284) | | | $111,607 |
| Expenses: | | | |
| Investment adviser fee (Note 5) | | $123,792 | |
| Administrative fee (Note 5) | | 230,000 | |
| Custodian fees | | 26,553 | |
| Transfer and dividend disbursing agent fees and expenses | | 40,781 | |
| Directors'/Trustees' fees | | 1,510 | |
| Auditing fees | | 23,400 | |
| Legal fees | | 6,663 | |
| Portfolio accounting fees | | 67,876 | |
| Distribution services fee (Note 5) | | 18,386 | |
| Shareholder services fee (Note 5) | | 13,005 | |
| Share registration costs | | 38,339 | |
| Printing and postage | | 20,413 | |
| Insurance premiums | | 3,856 | |
| Miscellaneous | | 4,673 | |
| TOTAL EXPENSES | | 619,247 | |
| Waivers and Reimbursements (Note 5): | | | |
| Waiver/reimbursement of investment adviser fee | $(123,792) | | |
| Waiver of administrative fee | (44,892) | | |
| Reimbursement of other operating expenses | (261,783) | | |
| TOTAL WAIVERS AND REIMBURSEMENTS | | (430,467) | |
| Net expenses | | | 188,780 |
| Net investment income (loss) | | | (77,173) |
| Realized and Unrealized Loss on Investments: | | | |
| Net realized loss on investments | | | (9,436) |
| Net change in unrealized appreciation of investments | | | (74,338) |
| Net realized and unrealized loss on investments | | | (83,774) |
| Change in net assets resulting from operations | | | $(160,947) |
See Notes which are an integral part of the Financial Statements
Annual Shareholder Report
Statement of Changes in Net Assets
| Year Ended July 31 | 2012 | 2011 |
| Increase (Decrease) in Net Assets | | |
| Operations: | | |
| Net investment income (loss) | $(77,173) | $(125,344) |
| Net realized gain (loss) on investments | (9,436) | 3,964,172 |
| Net change in unrealized appreciation/depreciation of investments | (74,338) | (563,516) |
| CHANGE IN NET ASSETS RESULTING FROM OPERATIONS | (160,947) | 3,275,312 |
| Share Transactions: | | |
| Proceeds from sale of shares | 8,745,470 | 1,967,566 |
| Cost of shares redeemed | (3,308,401) | (6,130,287) |
| CHANGE IN NET ASSETS RESULTING FROM SHARE TRANSACTIONS | 5,437,069 | (4,162,721) |
| Change in net assets | 5,276,122 | (887,409) |
| Net Assets: | | |
| Beginning of period | 11,282,299 | 12,169,708 |
| End of period (including accumulated net investment income (loss) of $(56,440) and $0, respectively) | $16,558,421 | $11,282,299 |
See Notes which are an integral part of the Financial Statements
Annual Shareholder Report
Notes to Financial Statements
July 31, 2012
1. ORGANIZATION
Federated MDT Series (the “Trust”) is registered under the Investment Company Act of 1940, as amended (the “Act”), as an open-end management investment company. The Trust consists of five portfolios. The financial statements included herein are only those of Federated MDT Small Cap Core Fund (the “Fund”), a diversified portfolio. The financial statements of the other portfolios are presented separately. The assets of each portfolio are segregated and a shareholder's interest is limited to the portfolio in which shares are held. Each portfolio pays its own expenses. The Fund offers three classes of shares: Class A Shares, Class C Shares and Institutional Shares. All shares of the Fund have equal rights with respect to voting, except on class-specific matters. The investment objective of the Fund is long-term capital appreciation.
2. SIGNIFICANT ACCOUNTING POLICIES
The following is a summary of significant accounting policies consistently followed by the Fund in the preparation of its financial statements. These policies are in conformity with U.S. generally accepted accounting principles (GAAP).
Investment Valuation
In calculating its net asset value (NAV), the Fund generally values investments as follows:
| ■ | Equity securities listed on an exchange or traded through a regulated market system are valued at their last reported sale price or official closing price in their principal exchange or market. |
| ■ | Shares of other mutual funds are valued based upon their reported NAVs. |
| ■ | Fixed-income securities acquired with remaining maturities greater than 60 days are fair valued using price evaluations provided by a pricing service approved by the Fund's Board of Trustees (the “Trustees”). |
| ■ | Fixed-income securities acquired with remaining maturities of 60 days or less are valued at their cost (adjusted for the accretion of any discount or amortization of any premium), which approximates market value. |
| ■ | Derivative contracts listed on exchanges are valued at their reported settlement or closing price. |
| ■ | Over-the-counter (OTC) derivative contracts are fair valued using price evaluations provided by a pricing service approved by the Trustees. |
| ■ | For securities that are fair valued in accordance with procedures established by and under the general supervision of the Trustees, certain factors may be considered such as: the purchase price of the security, information obtained by contacting the issuer, analysis of the issuer's financial statements or other available documents, fundamental analytical data, the nature and duration of restrictions on disposition, the movement of the market in which the security is normally traded and public trading in similar securities of the issuer or comparable issuers. |
If the Fund cannot obtain a price or price evaluation from a pricing service for an investment, the Fund may attempt to value the investment based upon the mean of bid and asked quotations or fair value the investment based on price evaluations, from one or more dealers. If any price, quotation, price evaluation or other pricing source is not readily available when the NAV is calculated, the Fund uses the fair value of the investment determined in accordance with the procedures described below. There can be no assurance that the Fund could purchase or sell an investment at the price used to calculate the Fund's NAV.
Annual Shareholder Report
Fair Valuation and Significant Events Procedures
The Trustees have appointed a Valuation Committee comprised of officers of the Fund, Federated MDTA LLC (“Adviser”) or an affiliated adviser, and others to determine fair value of securities and in overseeing the calculation of the NAV. The Trustees have also authorized the use of pricing services recommended by the Valuation Committee to provide fair value evaluations of the current value of certain investments for purposes of calculating the NAV. The Valuation Committee employs various methods for reviewing third-party pricing service evaluations including periodic reviews of third-party pricing services' policies, procedures and valuation methods (including key inputs and assumptions), transactional back-testing, comparisons of evaluations of different pricing services, and review of price challenges by the Adviser based on recent market activity. In the event that market quotations and price evaluations are not available for an investment, the Valuation Committee determines the fair value of the investment in accordance with procedures adopted by the Trustees. The Trustees periodically review and approve the fair valuations made by the Valuation Committee and any changes made to the procedures.
Factors considered by pricing services in evaluating an investment include the yields or prices of investments of comparable quality, coupon, maturity, call rights and other potential prepayments, terms and type, reported transactions, indications as to values from dealers and general market conditions. Some pricing services provide a single price evaluation reflecting the bid-side of the market for an investment (a “bid” evaluation). Other pricing services offer both bid evaluations and price evaluations indicative of a price between the prices bid and asked for the investment (a “mid” evaluation). The Fund normally uses bid evaluations for U.S. Treasury and Agency securities, mortgage-backed securities and municipal securities. The Fund normally uses mid evaluations for other types of fixed-income securities and OTC derivative contracts. In the event that market quotations and price evaluations are not available for an investment, the fair value of the investment is determined in accordance with procedures adopted by the Trustees.
The Trustees also have adopted procedures requiring an investment to be priced at its fair value whenever the Adviser determines that a significant event affecting the value of the investment has occurred between the time as of which the price of the investment would otherwise be determined and the time as of which the NAV is computed. An event is considered significant if there is both an affirmative expectation that the investment's value will change in response to the event and a reasonable basis for quantifying the resulting change in value. Examples of significant events that may occur after the close of the principal market on which a security is traded, or after the time of a price evaluation provided by a pricing service or a dealer, include:
| ■ | With respect to securities traded in foreign markets, significant trends in U.S. equity markets or in the trading of foreign securities index futures or options contracts; |
| ■ | With respect to price evaluations of fixed-income securities determined before the close of regular trading on the NYSE, actions by the Federal Reserve Open Market Committee and other significant trends in U.S. fixed-income markets; |
| ■ | Political or other developments affecting the economy or markets in which an issuer conducts its operations or its securities are traded; and |
| ■ | Announcements concerning matters such as acquisitions, recapitalizations, litigation developments, a natural disaster affecting the issuer's operations or regulatory changes or market developments affecting the issuer's industry. |
Annual Shareholder Report
The Trustees have approved the use of a pricing service to determine the fair value of equity securities traded principally in foreign markets when the Adviser determines that there has been a significant trend in the U.S. equity markets or in index futures trading. For other significant events, the Fund may seek to obtain more current quotations or price evaluations from alternative pricing sources. If a reliable alternative pricing source is not available, the Fund will determine the fair value of the investment using another method approved by the Trustees.
Repurchase Agreements
The Fund may invest in repurchase agreements for short-term liquidity purposes. It is the policy of the Fund to require the other party to a repurchase agreement to transfer to the Fund's custodian or sub-custodian eligible securities or cash with a market value (after transaction costs) at least equal to the repurchase price to be paid under the repurchase agreement. The eligible securities are transferred to accounts with the custodian or sub-custodian in which the Fund holds a “securities entitlement” and exercises “control” as those terms are defined in the Uniform Commercial Code. The Fund has established procedures for monitoring the market value of the transferred securities and requiring the transfer of additional eligible securities if necessary to equal at least the repurchase price. These procedures also allow the other party to require securities to be transferred from the account to the extent that their market value exceeds the repurchase price or in exchange for other eligible securities of equivalent market value.
The insolvency of the other party or other failure to repurchase the securities may delay the disposition of the underlying securities or cause the Fund to receive less than the full repurchase price. Under the terms of the repurchase agreement, any amounts received by the Fund in excess of the repurchase price and related transaction costs must be remitted to the other party.
The Fund may enter into repurchase agreements in which eligible securities are transferred into joint trading accounts maintained by the custodian or sub-custodian for investment companies and other clients advised by the Fund's Adviser and its affiliates. The Fund will participate on a pro rata basis with the other investment companies and clients in its share of the securities transferred under such repurchase agreements and in its share of proceeds from any repurchase or other disposition of such securities.
Investment Income, Gains and Losses, Expenses and Distributions
Investment transactions are accounted for on a trade-date basis. Realized gains and losses from investment transactions are recorded on an identified-cost basis. Interest income and expenses are accrued daily. Dividend income and distributions to shareholders are recorded on the ex-dividend date. Foreign dividends are recorded on the ex-dividend date or when the Fund is informed of the ex-dividend date. Distributions of net investment income, if any, are declared and paid annually. Non-cash dividends included in dividend income, if any, are recorded at fair value. Investment income, realized and unrealized gains and losses, and certain fund-level expenses are allocated to each class based on relative average daily net assets, except that Class A Shares, Class C Shares and Institutional Shares may bear distribution services fees and shareholder services fees unique to those classes. Dividends are declared separately for each class. No class has preferential dividend rights; differences in per share dividend rates are generally due to differences in separate class expenses.
Annual Shareholder Report
Premium and Discount Amortization
All premiums and discounts on fixed-income securities are amortized/accreted using the effective interest rate method.
Federal Taxes
It is the Fund's policy to comply with the Subchapter M provision of the Internal Revenue Code (the “Code”) and to distribute to shareholders each year substantially all of its income. Accordingly, no provision for federal income tax is necessary. As of and during the year ended July 31, 2012, the Fund did not have a liability for any uncertain tax positions. The Fund recognizes interest and penalties, if any, related to tax liabilities as income tax expense in the Statement of Operations. As of July 31, 2012, tax years 2009 through 2012 remain subject to examination by the Fund's major tax jurisdictions, which include the United States of America and the Commonwealth of Massachusetts.
The Fund may be subject to taxes imposed by governments of countries in which it invests. Such taxes are generally based on either income or gains earned or repatriated. The Fund accrues and applies such taxes to net investment income, net realized gains and net unrealized gains as income and/or gains are earned.
When-Issued and Delayed Delivery Transactions
The Fund may engage in when-issued or delayed delivery transactions. The Fund records when-issued securities on the trade date and maintains security positions such that sufficient liquid assets will be available to make payment for the securities purchased. Securities purchased on a when-issued or delayed delivery basis are marked to market daily and begin earning interest on the settlement date. Losses may occur on these transactions due to changes in market conditions or the failure of counterparties to perform under the contract.
Other
The preparation of financial statements in conformity with GAAP requires management to make estimates and assumptions that affect the amounts of assets, liabilities, expenses and revenues reported in the financial statements. Actual results could differ from those estimated.
3. SHARES OF BENEFICIAL INTEREST
The following tables summarize share activity:
| Year Ended July 31 | 2012 | 2011 |
| Class A Shares: | Shares | Amount | Shares | Amount |
| Shares sold | 37,994 | $344,850 | 94,156 | $934,802 |
| Shares redeemed | (121,394) | (1,100,407) | (164,528) | (1,482,746) |
| NET CHANGE RESULTING FROM CLASS A SHARE TRANSACTIONS | (83,400) | $(755,557) | (70,372) | $(547,944) |
| Year Ended July 31 | 2012 | 2011 |
| Class C Shares: | Shares | Amount | Shares | Amount |
| Shares sold | 9,770 | $85,422 | 34,730 | $323,061 |
| Shares redeemed | (64,102) | (552,087) | (167,010) | (1,449,906) |
| NET CHANGE RESULTING FROM CLASS C SHARE TRANSACTIONS | (54,332) | $(466,665) | (132,280) | $(1,126,845) |
Annual Shareholder Report
| Year Ended July 31 | 2012 | 2011 |
| Institutional Shares: | Shares | Amount | Shares | Amount |
| Shares sold | 898,001 | $8,315,198 | 70,439 | $709,703 |
| Shares redeemed | (176,188) | (1,655,907) | (337,454) | (3,197,635) |
| NET CHANGE RESULTING FROM INSTITUTIONAL SHARE TRANSACTIONS | 721,813 | $6,659,291 | (267,015) | $(2,487,932) |
| NET CHANGE RESULTING FROM TOTAL FUND SHARE TRANSACTIONS | 584,081 | $5,437,069 | (469,667) | $(4,162,721) |
4. FEDERAL TAX INFORMATION
The timing and character of income and capital gain distributions are determined in accordance with income tax regulations, which may differ from GAAP. These differences are due to differing treatments for net operating losses.
For the year ended July 31, 2012, permanent differences identified and reclassified among the components of net assets were as follows:
| Increase (Decrease) |
| Paid-In Capital | Undistributed
Net Investment
Income (Loss) |
| $(20,733) | $20,733 |
Net investment income (loss), net realized gains (losses), and net assets were not affected by this reclassification.
As of July 31, 2012, the components of distributable earnings on a tax basis were as follows:
| Net unrealized appreciation | $516,428 |
| Capital loss carryforwards and deferrals | $(11,777,956) |
The difference between book-basis and tax-basis net unrealized appreciation/depreciation is attributable to differing treatments for the deferral of losses on wash sales.
At July 31, 2012, the cost of investments for federal tax purposes was $16,077,448. The net unrealized appreciation of investments for federal tax purposes was $516,428. This consists of net unrealized appreciation from investments for those securities having an excess of value over cost of $1,334,860 and net unrealized depreciation from investments for those securities having an excess of cost over value of $818,432.
At July 31, 2012, the Fund had a capital loss carryforward of $11,721,516 which will reduce the Fund's taxable income arising from future net realized gains on investments, if any, to the extent permitted by the Code, thereby reducing the amount of distributions to shareholders which would otherwise be necessary to relieve the Fund of any liability for federal income tax. Pursuant to the Code, a net capital loss incurred in taxable years beginning on or before December 22, 2010, is characterized as short-term and may be carried forward for a maximum of eight tax years (“Carryforward Limit”), whereas a net capital loss incurred in taxable years beginning after December 22, 2010, retains its character as either short-term or long-term, does not expire and is required to be utilized prior to the losses which have a Carryforward Limit.
Annual Shareholder Report
The following schedule summarizes the Fund's capital loss carryforwards and expiration years:
| Expiration Year | Short-Term | Long-Term | Total |
| 2016 | $488,605 | N/A | $488,605 |
| 2017 | $6,139,530 | N/A | $6,139,530 |
| 2018 | $5,093,381 | N/A | $5,093,381 |
The Fund used capital loss carryforwards of $15,475 to offset taxable capital gains realized during the year ended July 31, 2012.
Under current tax law, late-year ordinary loss realized after December 31 through the end of the Fund's fiscal year (“Late Year Ordinary Loss”) may be deferred, in whole or in part, and treated as occurring on the first day of the following fiscal year. As of July 31, 2012, for federal income tax purposes, a Late Year Ordinary Loss of $56,440 was deferred to August 1, 2012.
5. INVESTMENT ADVISER FEE AND OTHER TRANSACTIONS WITH AFFILIATES
Investment Adviser Fee
The advisory agreement between the Fund and the Adviser provides for an annual fee equal to 1.15% of the Fund's average daily net assets. Subject to the terms described in the Expense Limitation note, the Adviser may voluntarily choose to waive any portion of its fee and/or reimburse certain operating expenses of the Fund. For the year ended July 31, 2012, the Adviser voluntarily waived $123,580 of its fee and voluntarily reimbursed $261,783 of other operating expenses.
Administrative Fee
Federated Administrative Services (FAS), under the Administrative Services Agreement, provides the Fund with administrative personnel and services. The fee paid to FAS is based on the average aggregate daily net assets of certain Federated funds as specified below:
| Administrative Fee | Average Aggregate Daily Net Assets
of the Federated Funds |
| 0.150% | on the first $5 billion |
| 0.125% | on the next $5 billion |
| 0.100% | on the next $10 billion |
| 0.075% | on assets in excess of $20 billion |
The administrative fee received during any fiscal year shall be at least $150,000 per portfolio and $40,000 per each additional class of Shares. Subject to the terms described in the Expense Limitation note, FAS may voluntarily choose to waive any portion of its fee. For the year ended July 31, 2012, FAS waived $44,892 of its fee. The net fee paid to FAS was 1.720% of average daily net assets of the Fund. The Fund is currently being charged the minimum administrative fee; therefore the fee as a percentage of average daily net assets is greater than the amounts presented in the chart above.
Annual Shareholder Report
Distribution Services Fee
The Fund has adopted a Distribution Plan (the “Plan”) pursuant to Rule 12b-1 under the Act. Under the terms of the Plan, the Fund will compensate Federated Securities Corp. (FSC), the principal distributor, from the daily net assets of the Fund's Class A Shares and Class C Shares to finance activities intended to result in the sale of these shares. The Plan provides that the Fund may incur distribution expenses at the following percentages of average daily net assets annually, to compensate FSC:
| Share Class Name | Percentage of Average Daily
Net Assets of Class |
| Class A Shares | 0.05% |
| Class C Shares | 0.75% |
Subject to the terms described in the Expense Limitation note, FSC may voluntarily choose to waive any portion of its fee. For the year ended July 31, 2012, distribution services fees for the Fund were as follows:
| Distribution Services
Fees Incurred |
| Class C Shares | $18,386 |
When FSC receives fees, it may pay some or all of them to financial intermediaries whose customers purchase shares. For the year ended July 31, 2012, FSC retained $1,504 of fees paid by the Fund. For the year ended July 31, 2012, the Fund's Class A Shares did not incur a distribution services fee; however, it may begin to incur this fee upon approval of the Trustees.
Sales Charges
Front-end sales charges and contingent deferred sales charges (CDSC) do not represent expenses of the Fund. They are deducted from the proceeds of sales of Fund shares prior to investment or from redemption proceeds prior to remittance, as applicable. For the year ended July 31, 2012, FSC retained $1,051 in sales charges from the sale of Class A Shares.
Shareholder Services Fee
The Fund may pay fees (“Service Fees”) up to 0.25% of the average daily net assets of the Fund's Class A Shares and Class C Shares to financial intermediaries or to Federated Shareholder Services Company (FSSC) for providing services to shareholders and maintaining shareholder accounts. Subject to the terms described in the Expense Limitation note, FSSC may voluntarily reimburse the Fund for Service Fees. For the year ended July 31, 2012, Service Fees for the Fund were as follows:
| Service
Fees
Incurred |
| Class A Shares | $6,876 |
| Class C Shares | 6,129 |
| TOTAL | $13,005 |
For the year ended July 31, 2012, FSSC received $214 of fees paid by the Fund.
Annual Shareholder Report
Expense Limitation
The Adviser and its affiliates (which may include FSC, FAS and FSSC) have voluntarily agreed to waive their fees and/or reimburse expenses so that the total annual fund operating expenses (as shown in the financial highlights) paid by the Fund's Class A Shares, Class C Shares and Institutional Shares (after the voluntary waivers and reimbursements) will not exceed 1.70%, 2.45% and 1.45% (the “Fee Limit”), respectively, up to but not including the later of (the “Termination Date”): (a) October 1, 2013; or (b) the date of the Fund's next effective Prospectus. While the Adviser and its affiliates currently do not anticipate terminating or increasing these arrangements prior to the Termination Date, these arrangements may only be terminated or the Fee Limit increased prior to the Termination Date with the agreement of the Trustees.
General
Certain Officers and Trustees of the Trust are Officers and Directors or Trustees of the above companies.
Transactions Involving Affiliated Holdings
Affiliated holdings are mutual funds which are managed by the Adviser or an affiliate of the Adviser. The Adviser has agreed to reimburse the Fund for certain investment adviser fees as a result of transactions in other affiliated mutual funds. For the year ended July 31, 2012, the Adviser reimbursed $212. Transactions involving the affiliated holding during the year ended July 31, 2012, were as follows:
| Federated Prime Value
Obligations Fund,
Institutional Shares |
| Balance of Shares Held 7/31/2011 | 116,597 |
| Purchases/Additions | 3,570,494 |
| Sales/Reductions | 3,390,161 |
| Balance of Shares Held 7/31/2012 | 296,930 |
| Value | $296,930 |
| Dividend Income | $358 |
6. Investment TRANSACTIONS
Purchases and sales of investments, excluding long-term U.S. government securities and short-term obligations, for the year ended July 31, 2012, were as follows:
| Purchases | $29,867,485 |
| Sales | $24,639,296 |
7. LINE OF CREDIT
The Fund participates in a $100,000,000 unsecured, uncommitted revolving line of credit (LOC) agreement with PNC Bank. The LOC was made available for extraordinary or emergency purposes, primarily for financing redemption payments. Borrowings are charged interest at a rate offered to the Fund by PNC Bank at the time of the borrowing. As of July 31, 2012, there were no outstanding loans. During the year ended July 31, 2012, the Fund did not utilize the LOC.
Annual Shareholder Report
8. INTERFUND LENDING
Pursuant to an Exemptive Order issued by the Securities and Exchange Commission, the Fund, along with other funds advised by subsidiaries of Federated Investors, Inc., may participate in an interfund lending program. This program provides an alternative credit facility allowing the Fund to borrow from other participating affiliated funds. As of July 31, 2012, there were no outstanding loans. During the year ended July 31, 2012, the program was not utilized.
9. Subsequent events
On August 15, 2012, the Trustees approved the elimination of minimum administrative personnel and services fees effective September 1, 2012. Prior to this date, the administrative fee received during any fiscal year was at least $150,000 per portfolio and $40,000 per each additional class of Shares.
Management has evaluated subsequent events through the date the financial statements were issued, and determined that no additional events have occurred that require disclosure.
Annual Shareholder Report
Report of Independent Registered Public Accounting Firm
TO THE BOARD OF trustees OF Federated MDt series AND SHAREHOLDERS OF federated mdt Small cap core fund:
We have audited the accompanying statement of assets and liabilities of Federated MDT Small Cap Core Fund (the “Fund”) (one of the portfolios constituting Federated MDT Series), including the portfolio of investments, as of July 31, 2012, and the related statement of operations for the year then ended, the statement of changes in net assets for each of the two years in the period then ended, and the financial highlights for each of the five years in the period then ended. These financial statements and financial highlights are the responsibility of the Fund's management. Our responsibility is to express an opinion on these financial statements and financial highlights based on our audits.
We conducted our audits in accordance with standards of the Public Company Accounting Oversight Board (United States). Those standards require that we plan and perform the audit to obtain reasonable assurance about whether the financial statements and financial highlights are free of material misstatement. We were not engaged to perform an audit of the Fund's internal control over financial reporting. Our audits included consideration of internal control over financial reporting as a basis for designing audit procedures that are appropriate in the circumstances, but not for the purpose of expressing an opinion on the effectiveness of the Fund's internal control over financial reporting. Accordingly, we express no such opinion. An audit also includes examining, on a test basis, evidence supporting the amounts and disclosures in the financial statements and financial highlights, assessing the accounting principles used and significant estimates made by management, and evaluating the overall financial statement presentation. Our procedures included confirmation of securities owned as of July 31, 2012, by correspondence with the custodian and others, or by other appropriate auditing procedures where replies from others were not received. We believe that our audits provide a reasonable basis for our opinion.
In our opinion, the financial statements and financial highlights referred to above present fairly, in all material respects, the financial position of Federated MDT Small Cap Core Fund, a portfolio of Federated MDT Series, at July 31, 2012, the results of its operations for the year then ended, the changes in its net assets for each of the two years in the period then ended, and the financial highlights for each of the five years in the period then ended, in conformity with U.S. generally accepted accounting principles.
Boston, Massachusetts
September 24, 2012
Annual Shareholder Report
Shareholder Expense Example (unaudited)
As a shareholder of the Fund, you incur two types of costs: (1) transaction costs, including sales charges (loads) on purchase or redemption payments; and (2) ongoing costs, including management fees and to the extent applicable, distribution (12b-1) fees and/or shareholder services fees and other Fund expenses. This Example is intended to help you to understand your ongoing costs (in dollars) of investing in the Fund and to compare these costs with the ongoing costs of investing in other mutual funds. It is based on an investment of $1,000 invested at the beginning of the period and held for the entire period from February 1, 2012 to July 31, 2012.
ACTUAL EXPENSES
The first section of the table below provides information about actual account values and actual expenses. You may use the information in this section, together with the amount you invested, to estimate the expenses that you incurred over the period. Simply divide your account value by $1,000 (for example, an $8,600 account value divided by $1,000 = 8.6), then multiply the result by the number in the first section under the heading entitled “Expenses Paid During Period” to estimate the expenses attributable to your investment during this period.
HYPOTHETICAL EXAMPLE FOR COMPARISON PURPOSES
The second section of the table below provides information about hypothetical account values and hypothetical expenses based on the Fund's actual expense ratio and an assumed rate of return of 5% per year before expenses, which is not the Fund's actual return. Thus, you should not use the hypothetical account values and expenses to estimate the actual ending account balance or your expenses for the period. Rather, these figures are required to be provided to enable you to compare the ongoing costs of investing in the Fund with other funds. To do so, compare this 5% hypothetical example with the 5% hypothetical examples that appear in the shareholder reports of the other funds.
Annual Shareholder Report
Please note that the expenses shown in the table are meant to highlight your ongoing costs only and do not reflect any transaction costs, such as sales charges (loads) on purchase or redemption payments. Therefore, the second section of the table is useful in comparing ongoing costs only, and will not help you determine the relative total costs of owning different funds. In addition, if these transaction costs were included, your costs would have been higher.
| Beginning
Account Value
2/1/2012 | Ending
Account Value
7/31/2012 | Expenses Paid
During Period1 |
| Actual: | | | |
| Class A Shares | $1,000 | $988.60 | $8.41 |
| Class C Shares | $1,000 | $984.70 | $12.09 |
| Institutional Shares | $1,000 | $989.80 | $7.22 |
Hypothetical (assuming a 5% return
before expenses): | | | |
| Class A Shares | $1,000 | $1,016.41 | $8.52 |
| Class C Shares | $1,000 | $1,012.68 | $12.26 |
| Institutional Shares | $1,000 | $1,017.60 | $7.32 |
| 1 | Expenses are equal to the Fund's annualized net expense ratios, multiplied by the average account value over the period, multiplied by 182/366 (to reflect the one-half-year period). The annualized net expense ratios are as follows: |
| Class A Shares | 1.70% |
| Class C Shares | 2.45% |
| Institutional Shares | 1.46% |
Annual Shareholder Report
Board of Trustees and Trust Officers
The Board of Trustees is responsible for managing the Trust's business affairs and for exercising all the Trust's powers except those reserved for the shareholders. The following tables give information about each Trustee and the senior officers of the Fund. Where required, the tables separately list Trustees who are “interested persons” of the Fund (i.e., “Interested” Trustees) and those who are not (i.e., “Independent” Trustees). Unless otherwise noted, the address of each person listed is Federated Investors Tower, 1001 Liberty Avenue, Pittsburgh, PA 15222. The address of all Independent Trustees listed is 4000 Ericsson Drive, Warrendale, PA 15086-7561; Attention: Mutual Fund Board. As of December 31, 2011, the Trust comprised five portfolio(s), and the Federated Fund Family consisted of 43 investment companies (comprising 134 portfolios). Unless otherwise noted, each Officer is elected annually. Unless otherwise noted, each Trustee oversees all portfolios in the Federated Fund Family and serves for an indefinite term. The Fund's Statement of Additional Information includes additional information about Trust Trustees and is available, without charge and upon request, by calling 1-800-341-7400.
Interested TRUSTEES Background
Name
Birth Date
Positions Held with Trust
Date Service Began | Principal Occupation(s) for Past Five Years,
Other Directorships Held and Previous Position(s) |
John F. Donahue*
Birth Date: July 28, 1924
Trustee
Began serving: June 2006 | Principal Occupations: Director or Trustee of the Federated Fund Family; Chairman and Director, Federated Investors, Inc.; Chairman of the Federated Fund Family's Executive Committee.
Previous Positions: Chairman of the Federated Fund Family; Trustee, Federated Investment Management Company; Chairman and Director, Federated Investment Counseling. |
J. Christopher Donahue*
Birth Date: April 11, 1949
President and Trustee
Began serving: May 2006 | Principal Occupations: Principal Executive Officer and President of the Federated Fund Family; Director or Trustee of some of the Funds in the Federated Fund Family; President, Chief Executive Officer and Director, Federated Investors, Inc.; Chairman and Trustee, Federated Investment Management Company; Trustee, Federated Investment Counseling; Chairman and Director, Federated Global Investment Management Corp.; Chairman, Federated Equity Management Company of Pennsylvania and Passport Research, Ltd. (investment advisory subsidiary of Federated); Trustee, Federated Shareholder Services Company; Director, Federated Services Company.
Previous Positions: President, Federated Investment Counseling; President and Chief Executive Officer, Federated Investment Management Company, Federated Global Investment Management Corp. and Passport Research, Ltd. |
| * | Family relationships and reasons for “interested” status: John F. Donahue is the father of J. Christopher Donahue; both are “interested” due to their beneficial ownership of shares of Federated Investors, Inc. and the positions they hold with Federated and its subsidiaries. |
Annual Shareholder Report
INDEPENDENT TRUSTEES Background
Name
Birth Date
Positions Held with Trust
Date Service Began | Principal Occupation(s) for Past Five Years,
Other Directorships Held, Previous Position(s) and Qualifications |
Nicholas P. Constantakis, CPA
Birth Date: September 3, 1939
Trustee
Began serving: June 2006 | Principal Occupation: Director or Trustee of the Federated Fund Family.
Other Directorship Held: Director, Chairman of the Audit Committee, and member of the Compensation Committee, Michael Baker Corporation (architecture, engineering and construction services).
Previous Position: Partner, Andersen Worldwide SC.
Qualifications: Public accounting and director experience. |
John F. Cunningham
Birth Date: March 5, 1943
Trustee
Began serving: June 2006 | Principal Occupation: Director or Trustee of the Federated Fund Family.
Other Directorships Held: Chairman, President and Chief Executive Officer, Cunningham & Co., Inc. (strategic business consulting); Trustee Associate, Boston College.
Previous Positions: Director, Redgate Communications and EMC Corporation (computer storage systems); Chairman of the Board and Chief Executive Officer, Computer Consoles, Inc.; President and Chief Operating Officer, Wang Laboratories; Director, First National Bank of Boston; Director, Apollo Computer, Inc.
Qualifications: Business management and director experience. |
Maureen Lally-Green
Birth Date: July 5, 1949
Trustee
Began serving: August 2009 | Principal Occupations: Director or Trustee of the Federated Fund Family; Director, Office of Church Relations, Diocese of Pittsburgh; Adjunct Professor of Law, Duquesne University School of Law.
Other Directorships Held: Director, Auberle; Member, Pennsylvania State Board of Education; Director, Saint Vincent College; Director, Ireland Institute of Pittsburgh; Chair and Director, UPMC Mercy Hospital; Regent, St. Vincent Seminary; Director, Epilepsy Foundation of Western and Central Pennsylvania; Director, Saint Thomas More Society, Allegheny County; Director, Our Campaign for the Church Alive, Inc.
Previous Position: Pennsylvania Superior Court Judge.
Qualifications: Legal and director experience. |
Peter E. Madden
Birth Date: March 16, 1942
Trustee
Began serving: June 2006 | Principal Occupation: Director or Trustee, and Chairman of the Board of Directors or Trustees, of the Federated Fund Family.
Previous Positions: Representative, Commonwealth of Massachusetts General Court; President, Chief Operating Officer and Director, State Street Bank and Trust Company and State Street Corporation (retired); Director, VISA USA and VISA International; Chairman and Director, Massachusetts Bankers Association; Director, Depository Trust Corporation; Director, The Boston Stock Exchange.
Qualifications: Business management, mutual fund services and director experience. |
Annual Shareholder Report
Name
Birth Date
Positions Held with Trust
Date Service Began | Principal Occupation(s) for Past Five Years,
Other Directorships Held, Previous Position(s) and Qualifications |
Charles F. Mansfield, Jr.
Birth Date: April 10, 1945
Trustee
Began serving: June 2006 | Principal Occupations: Director or Trustee of the Federated Fund Family; Management Consultant.
Previous Positions: Chief Executive Officer, PBTC International Bank; Partner, Arthur Young & Company (now Ernst & Young LLP); Chief Financial Officer of Retail Banking Sector, Chase Manhattan Bank; Senior Vice President, HSBC Bank USA (formerly Marine Midland Bank); Vice President, Citibank; Assistant Professor of Banking and Finance, Frank G. Zarb School of Business, Hofstra University; Executive Vice President, DVC Group, Inc. (marketing, communications and technology).
Qualifications: Banking, business management, education and director experience. |
Thomas M. O'Neill
Birth Date: June 14, 1951
Trustee
Began serving: October 2006 | Principal Occupations: Director or Trustee, Vice Chairman of the Audit Committee of the Federated Fund Family; Sole Proprietor, Navigator Management Company (investment and strategic consulting).
Other Directorships Held: Board of Overseers, Children's Hospital of Boston; Visiting Committee on Athletics, Harvard College; Board of Directors, Medicines for Humanity; Board of Directors, The Golisano Children's Museum of Naples, Florida.
Previous Positions: Chief Executive Officer and President, Managing Director and Chief Investment Officer, Fleet Investment Advisors; President and Chief Executive Officer, Aeltus Investment Management, Inc.; General Partner, Hellman, Jordan Management Co., Boston, MA; Chief Investment Officer, The Putnam Companies, Boston, MA; Credit Analyst and Lending Officer, Fleet Bank; Director and Consultant, EZE Castle Software (investment order management software); Director, Midway Pacific (lumber).
Qualifications: Business management, mutual fund, director and investment experience. |
John S. Walsh
Birth Date: November 28, 1957
Trustee
Began serving: June 2006 | Principal Occupations: Director or Trustee, Chairman of the Audit Committee of the Federated Fund Family; President and Director, Heat Wagon, Inc. (manufacturer of construction temporary heaters); President and Director, Manufacturers Products, Inc. (distributor of portable construction heaters); President, Portable Heater Parts, a division of Manufacturers Products, Inc.
Previous Position: Vice President, Walsh & Kelly, Inc.
Qualifications: Business management and director experience. |
Annual Shareholder Report
OFFICERS
Name
Birth Date
Address
Positions Held with Trust
Date Service Began | Principal Occupation(s) for Past Five Years
and Previous Position(s) |
John W. McGonigle
Birth Date: October 26, 1938
Secretary
Began serving: May 2006 | Principal Occupations: Executive Vice President and Secretary of the Federated Fund Family; Vice Chairman, Executive Vice President, Secretary and Director, Federated Investors, Inc.
Previous Positions: Trustee, Federated Investment Management Company and Federated Investment Counseling; Director, Federated Global Investment Management Corp., Federated Services Company and Federated Securities Corp. |
Richard A. Novak
Birth Date: December 25, 1963
Treasurer
Began serving: May 2006 | Principal Occupations: Principal Financial Officer and Treasurer of the Federated Fund Family; Senior Vice President, Federated Administrative Services; Financial and Operations Principal for Federated Securities Corp., Edgewood Services, Inc. and Southpointe Distribution Services, Inc.
Previous Positions: Controller of Federated Investors, Inc.; Vice President, Finance of Federated Services Company; held various financial management positions within The Mercy Hospital of Pittsburgh; Auditor, Arthur Andersen & Co. |
Brian P. Bouda
Birth Date: February 28, 1947
CHIEF COMPLIANCE OFFICER AND SENIOR VICE PRESIDENT
Began serving: June 2006 | Principal Occupations: Senior Vice President and Chief Compliance Officer of the Federated Fund Family; Vice President and Chief Compliance Officer of Federated Investors, Inc. and Chief Compliance Officer of its subsidiaries. Mr. Bouda joined Federated in 1999 and is a member of the American Bar Association and the State Bar Association of Wisconsin. |
Stephen F. Auth
Birth Date: September 3, 1956
450 Lexington Avenue
Suite 3700
New York, NY 10017-3943
CHIEF INVESTMENT OFFICER
Began serving: June 2012 | Principal Occupations: Stephen F. Auth is Chief Investment Officer of this Fund and various other Funds in the Federated Fund Complex; Executive Vice President, Federated Investment Counseling, Federated Global Investment Management Corp. and Federated Equity Management Company of Pennsylvania.
Previous Positions: Executive Vice President, Federated Investment Management Company and Passport Research, Ltd. (investment advisory subsidiary of Federated); Senior Vice President, Global Portfolio Management Services Division; Senior Vice President, Federated Investment Management Company and Passport Research, Ltd.; Senior Managing Director and Portfolio Manager, Prudential Investments. |
Daniel Mahr
Birth Date: April 9, 1981
125 High Street
Oliver Tower
21st Floor
Boston, MA 02110-2704
Vice President
Began serving: June 2012 | Principal Occupations: Daniel Mahr has been the Fund's Portfolio Manager since August 2008. Mr. Mahr joined the MDT Advisers Investment Team in 2002. As Managing Director, Research, he is responsible for leading the Investment Team as it relates to the ongoing design, development and implementation of the Optimum Q Process. He is Vice President of the Trust with respect to the Fund. Mr. Mahr received his A.B., Computer Science from Harvard College and his S.M., Computer Science from Harvard University. |
Annual Shareholder Report
Evaluation and Approval of Advisory Contract–May 2012
FEDERATED MDT SMALL CAP CORE FUND (the “Fund”)
Following a review and recommendation of approval by the Fund's independent trustees, the Fund's Board reviewed and approved at its May 2012 meetings the Fund's investment advisory contract for an additional one-year term. The Board's decision regarding the contract reflects the exercise of its business judgment on whether to continue the existing arrangements.
In this connection, the Federated Funds' Board had previously appointed a Senior Officer, whose duties include specified responsibilities relating to the process by which advisory fees are to be charged to a Federated fund. The Senior Officer has the authority to retain consultants, experts, or staff as may be reasonably necessary to assist in the performance of his duties, reports directly to the Board, and may be terminated only with the approval of a majority of the independent members of the Board. The Senior Officer prepared and furnished to the Board an independent, written evaluation that covered topics discussed below (the “Evaluation”). The Board considered that Evaluation, along with other information, in deciding to approve the advisory contract.
The Board is also familiar with and considered judicial decisions concerning allegedly excessive investment advisory fees, which have indicated that the following factors may be relevant to an Adviser's fiduciary duty with respect to its receipt of compensation from a fund: the nature and quality of the services provided by the Adviser to a fund and its shareholders, including the performance and expenses of the fund and of comparable funds; the Adviser's cost of providing the services, including the profitability to the Adviser of providing advisory services to a fund; the extent to which the Adviser may realize “economies of scale” as a fund grows larger and, if such economies exist, whether they have been shared with a fund and its shareholders; any “fall-out financial benefits” that accrue to the Adviser because of its relationship with a fund (including research services received from brokers that execute fund trades and any fees paid to affiliates of the Adviser for services rendered to a fund); comparative fee structures, including a comparison of fees paid to the Adviser with those paid by similar funds; and the extent to which the Board members are fully informed about all facts the Board deems relevant to its consideration of the Adviser's services and fees. Consistent with these judicial decisions, the Board also considered management fees (including any components thereof) charged to institutional and other clients of the Adviser for what might be viewed as like services. The Board was aware of these factors and was guided by them in its review of the Fund's advisory contract to the extent it considered them to be appropriate and relevant, as discussed further below.
Annual Shareholder Report
The Board considered and weighed these circumstances in light of its substantial accumulated experience in governing the Fund and working with Federated on matters relating to the Federated funds, and was assisted in its deliberations by independent legal counsel. Throughout the year, and in connection with its May meetings, the Board requested and received substantial and detailed information about the Fund and the Federated organization that was in addition to the extensive materials that comprise and accompany the Senior Officer's Evaluation. Federated provided much of this information at each regular meeting of the Board, and furnished additional substantial information in connection with the May meeting at which the Board's formal review of the advisory contract occurred. At this May meeting, senior management of the Adviser also met with the independent trustees and their counsel to discuss the materials presented and any other matters thought relevant by the Adviser or the trustees. Between regularly scheduled meetings, the Board also received information on particular matters as the need arose. Thus, the Board's consideration of the advisory contract included review of the Senior Officer's Evaluation, accompanying data and additional information covering such matters as: the Adviser's investment philosophy, revenue, profitability, personnel and processes; investment and operating strategies; the Fund's short- and long-term performance (in absolute terms, both on a gross basis and net of expenses, as well as in relationship to its particular investment program and certain competitor or “peer group” funds and/or other benchmarks, as appropriate), and comments on the reasons for performance; the Fund's investment objectives; the Fund's expenses (including the advisory fee itself and the overall expense structure of the Fund, both in absolute terms and relative to similar and/or competing funds, with due regard for contractual or voluntary expense limitations); the use and allocation of brokerage commissions derived from trading the Fund's portfolio securities (if any); and the nature, quality and extent of the advisory and other services provided to the Fund by the Adviser and its affiliates. The Board also considered the preferences and expectations of Fund shareholders; the entrepreneurial risk assumed by the Adviser in sponsoring the funds; the continuing state of competition in the mutual fund industry and market practices; the range of comparable fees for similar funds in the mutual fund industry; the Fund's relationship to the Federated family of funds which include a comprehensive array of funds with different investment objectives, policies and strategies which are available for exchange without the incurrence of additional sales charges; compliance and audit reports concerning the Federated funds and the Federated companies that service them (including communications from regulatory agencies), as well as Federated's responses to any issues raised therein; and relevant developments in the mutual fund industry and how the Federated funds and/or Federated are responding to them. The Board's evaluation process is evolutionary. The criteria considered and the emphasis placed on relevant criteria change in recognition of changing circumstances in the mutual fund marketplace.
Annual Shareholder Report
While mindful that courts have cautioned against giving such comparisons too much weight, the Board has found the use of comparisons of the Fund's fees and expenses to other mutual funds with comparable investment programs to be relevant, given the high degree of competition in the mutual fund business. The Board focused on comparisons with other similar mutual funds more heavily than non-mutual fund products or services because it is believed that they are more relevant. For example, other mutual funds are the products most like the Fund, they are readily available to Fund shareholders as alternative investment vehicles, and they are the type of investment vehicle in fact chosen and maintained by the Fund's investors. The range of their fees and expenses therefore appears to be a generally reliable indication of what consumers have found to be reasonable in the precise marketplace in which the Fund competes. In this regard, the Senior Officer has reviewed Federated's fees for providing advisory services to products outside the Federated family of funds (e.g., institutional and separate accounts). He concluded that mutual funds and institutional accounts are inherently different products. Those differences include, but are not limited to, different types of targeted investors; being subject to different laws and regulations; different legal structures; different average account sizes; different associated costs; different portfolio management techniques made necessary by different cash flows; and portfolio manager time spent in review of securities pricing. The Senior Officer did not consider these fee schedules to be determinative in judging the appropriateness of mutual fund advisory contracts.
The Fund's ability to deliver competitive performance when compared to its peer group was also deemed to be relevant by the Board as a useful indicator of how the Adviser is executing the Fund's investment program, which in turn assisted the Board in reaching a conclusion that the nature, extent, and quality of the Adviser's investment management services were such as to warrant continuation of the advisory contract.
The Senior Officer reviewed information compiled by Federated, using data supplied by independent fund ranking organizations, regarding the performance of, and fees charged by, other mutual funds, noting his view that comparisons to fund peer groups are relevant in judging the reasonableness of proposed fees. He also observed that certain funds may exhibit important differences in their objectives and management techniques when compared to other funds placed in the same peer group by ranking organizations, noting in this connection that the Fund's quantitative investment program is of such a type.
Annual Shareholder Report
For the periods covered by the Evaluation, the Fund's performance for the one-year period was above the median of the relevant peer group, and the Fund's performance fell below the median of the relevant peer group for the three-year and five-year periods. In addition, the Board was informed by the Adviser that, for the same periods, the Fund outperformed its benchmark index for the one-year period, underperformed its benchmark index for the three-year period and underperformed its benchmark index for the five-year period. The Board discussed the Fund's performance with the Adviser and recognized the efforts being undertaken by the Adviser. The Board will continue to monitor these efforts and the performance of the Fund.
The Board also received financial information about Federated, including information regarding the compensation and benefits Federated derived from its relationships with the Federated funds. This information covered not only the fees under the advisory contracts, but also fees received by Federated's subsidiaries for providing other services to the Federated funds under separate contracts (e.g., for serving as the Federated funds' administrator). The information also detailed any indirect benefit Federated may derive from its receipt of research services from brokers who execute Federated fund trades. In addition, the Board considered the fact that, in order for a fund to be competitive in the marketplace, Federated and its affiliates frequently waived fees and/or reimbursed expenses and have disclosed to fund investors and/or indicated to the Board their intention to do so in the future, where appropriate. Moreover, the Board receives regular reporting as to the institution or elimination of these voluntary waivers.
Federated furnished information, requested by the Senior Officer, that reported revenues on a fund-by-fund basis and made estimates of the allocation of expenses on a fund-by-fund basis, using allocation methodologies specified by the Senior Officer. The Senior Officer noted that, although they may apply consistent allocation processes, the inherent difficulties in allocating costs (and the unavoidable arbitrary aspects of that exercise) and the lack of consensus on how to allocate those costs may render such allocation information unreliable. The allocation information was considered in the analysis by the Board but was determined to be of limited use.
The Board and the Senior Officer also reviewed information compiled by Federated comparing profitability information for Federated to other publicly held fund management companies. In this regard, the Senior Officer noted the limited availability of such information, but nonetheless concluded that Federated's profit margins did not appear to be excessive.
The Senior Officer's Evaluation also discussed the notion of possible realization of “economies of scale” as a fund grows larger. The Board considered in this regard that the Adviser has made significant and long-term investments in areas that support all of the Federated funds, such as personnel and processes for the portfolio management, shareholder services, compliance, internal audit, and risk management functions; and systems technology; and that the benefits of
Annual Shareholder Report
these efforts (as well as any economies, should they exist) were likely to be enjoyed by the fund complex as a whole. Finally, the Board also noted the absence of any applicable regulatory or industry guidelines on this subject, which (as discussed in the Senior Officer's Evaluation) is compounded by the lack of any common industry practice or general pattern with respect to structuring fund advisory fees with “breakpoints” that serve to reduce the fee as the fund attains a certain size. The Senior Officer did not recommend institution of breakpoints in pricing Federated's fund advisory services at this time.
It was noted in the materials for the Board meeting that for the period covered by the Evaluation, the Fund's investment advisory fee was waived in its entirety. The Board reviewed the contractual fee rate and other expenses of the Fund with the Adviser and was satisfied that the overall expense structure of the Fund remained competitive.
The Senior Officer noted that, considering the totality of the circumstances, and all of the factors referenced within his Evaluation, he had concluded that, subject to comments and recommendations made within his Evaluation, his observations and the information accompanying the Evaluation supported a finding by the Board that the management fees for each of the funds was reasonable and that Federated appeared to provide appropriate advisory and administrative services to the Fund for the fees paid. Under these circumstances, no changes were recommended to, and no objection was raised to, the continuation of the Fund's advisory contract.
In its decision to continue an existing investment advisory contract, the Board was mindful of the potential disruptions of the Fund's operations and various risks, uncertainties and other effects that could occur as a result of a decision to terminate or not renew an advisory contract. In particular, the Board recognized that many shareholders have invested in the Fund on the strength of the Adviser's industry standing and reputation and with the expectation that the Adviser will have a continuing role in providing advisory services to the Fund. Thus, the Board's approval of the advisory contract reflected the fact that it is the shareholders who have effectively selected the Adviser by virtue of having invested in the Fund. The Board concluded that, in light of the factors discussed above, including the nature, quality and scope of the services provided to the Fund by the Adviser and its affiliates, continuation of the advisory contract was appropriate.
The Board based its decision to approve the advisory contract on the totality of the circumstances and relevant factors and with a view to past and future long-term considerations. Not all of the factors and considerations identified above were necessarily relevant to the Fund, nor did the Board consider any one of them to be determinative. With respect to the factors that were relevant, the Board's decision to approve the contract reflects its determination that Federated's performance and actions provided a satisfactory basis to support the decision to continue the existing arrangements.
Annual Shareholder Report
Voting Proxies on Fund Portfolio Securities
A description of the policies and procedures that the Fund uses to determine how to vote proxies, if any, relating to securities held in the Fund's portfolio is available, without charge and upon request, by calling 1-800-341-7400. A report on “Form N-PX” of how the Fund voted any such proxies during the most recent 12-month period ended June 30 is available from Federated's website at FederatedInvestors.com. To access this information from the home page, select “All” under “Asset Classes.” Select a fund name and share class, if applicable, to go to the Fund Overview page. On the Fund Overview page, select the “Documents” tab. At the bottom of that page, select “Proxy Voting Record Report (Form N-PX).” Form N-PX filings are also available at the SEC's website at www.sec.gov.
Quarterly Portfolio Schedule
The Fund files with the SEC a complete schedule of its portfolio holdings, as of the close of the first and third quarters of its fiscal year, on “Form N-Q.” These filings are available on the SEC's website at www.sec.gov and may be reviewed and copied at the SEC's Public Reference Room in Washington, DC. (Call 1-800-SEC-0330 for information on the operation of the Public Reference Room.) You may also access this information from the “Products” section of Federated's website at FederatedInvestors.com. From the home page, select “All” under “Asset Classes.” Select a fund name and share class, if applicable, to go to the Fund Overview page. On the Fund Overview page, select the “Documents” tab. At the bottom of that page, select “Form N-Q.”
Annual Shareholder Report
Mutual funds are not bank deposits or obligations, are not guaranteed by any bank and are not insured or guaranteed by the U.S. government, the Federal Deposit Insurance Corporation, the Federal Reserve Board or any other government agency. Investment in mutual funds involves investment risk, including the possible loss of principal.
This Report is authorized for distribution to prospective investors only when preceded or accompanied by the Fund's Prospectus, which contains facts concerning its objective and policies, management fees, expenses and other information.
Federated MDT Small Cap Core Fund
Federated Investors Funds
4000 Ericsson Drive
Warrendale, PA 15086-7561
Contact us at FederatedInvestors.com
or call 1-800-341-7400.
Federated Securities Corp., Distributor
CUSIP 31421R817
CUSIP 31421R791
CUSIP 31421R783
37328 (9/12)
Federated is a registered trademark of Federated Investors, Inc.
2012 ©Federated Investors, Inc.
Annual Shareholder Report
July 31, 2012
| Share Class | Ticker |
| A | QASGX |
| B | QBSGX |
| C | QCSGX |
| Institutional | QISGX |
Federated MDT Small Cap Growth Fund
Fund Established 2005
A Portfolio of Federated MDT Series
Dear Valued Shareholder,
I am pleased to present the Annual Shareholder Report for your fund covering the period from August 1, 2011 through July 31, 2012. This report includes Management's Discussion of Fund Performance, a complete listing of your fund's holdings, performance information and financial statements along with other important fund information.
In addition, our website, FederatedInvestors.com, offers easy access to Federated resources that include timely fund updates, economic and market insights from our investment strategists, and financial planning tools. We invite you to register to take full advantage of its capabilities.
Thank you for investing with Federated. I hope you find this information useful and look forward to keeping you informed.
Sincerely,
J. Christopher Donahue, President
Not FDIC Insured • May Lose Value • No Bank Guarantee
Management's Discussion of Fund Performance (unaudited)
The Fund's total return, based on net asset value, for the 12-month reporting period ended July 31, 2012 was -1.57% for Class A Shares, -2.35% for Class B Shares, -2.33% for Class C Shares and -1.38% for Institutional Shares. The total return of the Russell 2000 Growth® Index,1 a broad-based securities market index (Russell 2000 Growth®) was -0.51% for the same period. The Fund's total returns for the fiscal year reflected actual cash flows, transaction costs and other expenses which were not reflected in the total return of the Russell 2000 Growth®.
MARKET OVERVIEW
During the 12-month reporting period, domestic equity market performance was favorable as evidenced by the 7.33% return on the Russell 3000® Index.2 Large-cap stocks led the way, as demonstrated by the 10.41% return of the Russell Top 200® Index,3 exceeding by far the 2.28% and 0.19% results for the Russell Midcap® Index,4 representing the mid-cap stocks, and the Russell 2000®Index,5 representing small-cap stocks,6 respectively. Growth stocks outperformed value stocks slightly during the year with the Russell 3000 Growth® Index7 returning 7.55% as compared to 7.09% for the Russell 3000 Value® Index.8
The best performing sectors in the Russell 2000 Growth® during the period were Health Care (+13.16%), Consumer Staples (+7.46%) and Financials (+3.28%). Underperforming sectors included Energy (-27.79%), Materials (-14.24%) and Industrials (-1.28%).
FUND PERFORMANCE
The most significant positive factors in the Fund's performance relative to the Russell 2000 Growth® for the reporting period were the Information Technology and Consumer Staples sectors. Each of these two sectors was weighted appropriately (Information Technology, which underperformed the Russell 3000®, was underweighted and Consumer Staples, an outperforming sector, was overweighted). Stock selection in those two sectors was very positive. Stock selection in the Materials sector also contributed significantly to the Fund's performance. The most significant negative factors in the Fund's performance were an underweight in the Health Care sector, one of the strongest sectors, and unfavorable stock selection in that sector. Poor stock selection in the Consumer Durables sector also detracted from Fund performance.
Individual stocks enhancing the Fund's performance included NewMarket Corporation, Sally Beauty Holdings, Nu Skin Enterprises and Carter's.
Individual stocks detracting from the Fund's performance included Crocs, Rockwood Holdings, GT Advanced Technologies, Tempur-Pedic International and The Warnaco Group.
Annual Shareholder Report
| 1 | The Russell 2000 Growth® measures the performance of those Russell 2000® companies with higher price-to-book ratios and higher forecasted growth values. The index is unmanaged, and it is not possible to invest directly in an index. |
| 2 | The Russell 3000® Index offers investors access to the broad U.S. equity universe representing approximately 98% of the U.S. Market. The Russell 3000® is constructed to provide a comprehensive, unbiased and stable barometer of the broad market and is complete reconstituted annually to ensure that new and growing equities are reflected. The index is unmanaged, and it is not possible to invest directly in an index. |
| 3 | The Russell Top 200® Index measures the performance of the 200 largest companies in the Russell 1000® Index and represents approximately 66% of the total market capitalization of the Russell 1000® Index. The index is unmanaged, and it is not possible to invest directly in an index. |
| 4 | The Russell Midcap® Index measures the performance of the 800 smallest companies in the Russell 1000® Index and represents approximately 27% of the total market capitalization of the Russell 1000® Index. The index is unmanaged, and it is not possible to invest directly in an index. |
| 5 | The Russell 2000® Index measures the performance of the 2,000 smallest companies in the Russell 3000® Index and represents approximately 7% of the total market capitalization of the Russell 3000® Index. The index is unmanaged, and it is not possible to invest directly in an index. |
| 6 | Small company stocks may be less liquid and subject to greater price volatility than large capitalization stocks. |
| 7 | The Russell 3000 Growth® Index measures the performance of those Russell 3000® Index companies with higher price-to-book ratios and higher forecasted growth values. The stocks in this index are also members of either the Russell 1000 Growth® or the Russell 2000 Growth® indexes. The index is unmanaged, and it is not possible to invest directly in an index. |
| 8 | The Russell 3000 Value® Index measures the performance of those Russell 3000® Index companies with lower price-to-book ratios and lower forecasted growth values. The stocks in this index are also members of either the Russell 1000 Value® or the Russell 2000 Value® indexes. The index is unmanaged, and it is not possible to invest directly in an index. |
Annual Shareholder Report
FUND PERFORMANCE AND GROWTH OF A $10,000 INVESTMENT
The start of performance date for the Fund's Class A Shares, Class B Shares, Class C Shares and Institutional Shares was September 15, 2005. Class B Shares of the Fund were offered beginning March 17, 2008. Performance results shown before that date are for the Fund's Institutional Shares and have been adjusted for the total annual operating expenses applicable to the Fund's Class B Shares. The Fund's Institutional Shares commenced operations on September 15, 2005. Subject to the expense adjustments described above, the Class B Shares annual returns would have been substantially similar to those of the Fund's Institutional Shares because shares of each class are invested in the same portfolio of securities. The Average Annual Total Return table below shows returns for each class averaged over the stated periods. The graphs below illustrate the hypothetical investment of $10,0001 in the Federated MDT Small Cap Growth Fund2 (the “Fund”) from September 15, 2005 (start of performance) to July 31, 2012, compared to the Russell 2000 Growth® Index (Russell 2000 Growth®).3
Average Annual Total Returns for the Period Ended 7/31/2012
(returns reflect all applicable sales charges and contingent deferred sales charge as specified below in footnote #1)
| Share Class | 1 Year | 5 Years | Start of
Performance* |
| Class A Shares | -7.01% | -2.63% | 1.84% |
| Class B Shares | -7.72% | -2.67% | 1.91% |
| Class C Shares | -3.30% | -2.26% | 1.91% |
| Institutional Shares | -1.38% | -1.29% | 2.94% |
| * | The Fund's start of performance date was September 15, 2005. |
Performance data quoted represents past performance which is no guarantee of future results. Investment return and principal value will fluctuate so that an investor's shares, when redeemed, may be worth more or less than their original cost. Mutual fund performance changes over time and current performance may be lower or higher than what is stated. For current to the most recent month-end performance and after-tax returns, visit FederatedInvestors.com or call 1-800-341-7400. Returns shown do not reflect the deduction of taxes that a shareholder would pay on Fund distributions or the redemption of Fund shares. Mutual funds are not obligations of or guaranteed by any bank and are not federally insured.
Annual Shareholder Report
Growth of a $10,000 Investment–Class a shares
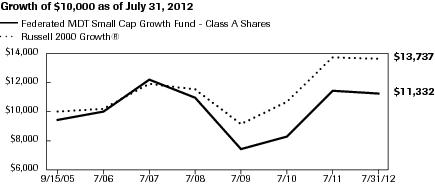
| Federated MDT Small Cap Growth Fund - Class A Shares | C000035061 | Russell 2000 Growth® |
| 9/15/2005 | 9,450 | 10,000 |
| 7/31/2006 | 10,009 | 10,280 |
| 7/31/2007 | 12,240 | 12,011 |
| 7/31/2008 | 10,992 | 11,559 |
| 7/31/2009 | 7,458 | 9,148 |
| 7/31/2010 | 8,303 | 10,677 |
| 7/31/2011 | 11,514 | 13,807 |
| 7/31/2012 | 11,332 | 13,737 |
41 graphic description end -->
| ■ | Total returns shown include the maximum sales charge of the 5.50% ($10,000 investment minus $550 sales charge = $9,450). |
Growth of a $10,000 Investment–Class b shares
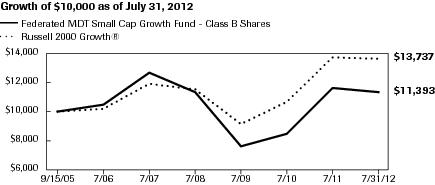
| Federated MDT Small Cap Growth Fund - Class B Shares | C000058510 | Russell 2000 Growth® |
| 9/15/2005 | 10,000 | 10,000 |
| 7/31/2006 | 10,518 | 10,280 |
| 7/31/2007 | 12,780 | 12,011 |
| 7/31/2008 | 11,383 | 11,559 |
| 7/31/2009 | 7,657 | 9,148 |
| 7/31/2010 | 8,481 | 10,677 |
| 7/31/2011 | 11,667 | 13,807 |
| 7/31/2012 | 11,393 | 13,737 |
41 graphic description end -->
| ■ | Total returns shown include the maximum contingent deferred sales charge of 5.50%, as applicable. |
Annual Shareholder Report
Growth of a $10,000 Investment–Class c shares

| Federated MDT Small Cap Growth Fund - Class C Shares | C000035062 | Russell 2000 Growth® |
| 9/15/2005 | 10,000 | 10,000 |
| 7/31/2006 | 10,520 | 10,280 |
| 7/31/2007 | 12,770 | 12,011 |
| 7/31/2008 | 11,379 | 11,559 |
| 7/31/2009 | 7,660 | 9,148 |
| 7/31/2010 | 8,474 | 10,677 |
| 7/31/2011 | 11,661 | 13,807 |
| 7/31/2012 | 11,389 | 13,737 |
41 graphic description end -->
| ■ | Total returns shown include the maximum contingent deferred sales charge of 1.00%, as applicable. |
Growth of a $10,000 Investment–Institutional shares
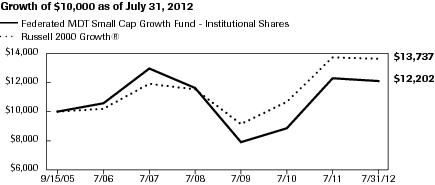
| Federated MDT Small Cap Growth Fund - Institutional Shares | C000035063 | Russell 2000 Growth® |
| 9/15/2005 | 10,000 | 10,000 |
| 7/31/2006 | 10,610 | 10,280 |
| 7/31/2007 | 13,020 | 12,011 |
| 7/31/2008 | 11,720 | 11,559 |
| 7/31/2009 | 7,970 | 9,148 |
| 7/31/2010 | 8,895 | 10,677 |
| 7/31/2011 | 12,373 | 13,807 |
| 7/31/2012 | 12,202 | 13,737 |
41 graphic description end -->
| 1 | Represents a hypothetical investment of $10,000 in the Fund after deducting applicable sales charges: For Class A Shares, the maximum sales charge of 5.50% ($10,000 investment minus $550 sales charges = $9,450); for Class B Shares, the maximum contingent deferred sales charge is 5.50% on any redemption less than one year from the purchase date; for Class C Shares, a 1.00% contingent deferred sales charge would be applied to any redemption less than one year from the purchase date. The Fund's performance assumes the reinvestment of all dividends and distributions. The Russell 2000 Growth® has been adjusted to reflect reinvestment of dividends on securities in the index. |
| 2 | The Fund is the successor to the MDT Small Cap Growth Fund pursuant to a reorganization that took place on December 8, 2006. Prior to that date, the Fund had no investments operations. Accordingly, the performance information shown for periods prior to that date is that of the MDT Small Cap Growth Fund. |
| 3 | The Russell 2000 Growth® measures the performance of those Russell 2000 companies with higher price-to-book ratios and higher forecasted growth values. The Russell 2000® Growth is not adjusted to reflect sales charges, expenses or other fees that the Securities Exchange Commission requires to be reflected in the Fund's performance. The index is unmanaged and, unlike the Fund, is not affected by cash flows. It is not possible to invest directly in an index. |
Annual Shareholder Report
Portfolio of Investments Summary Table (unaudited)
At July 31, 2012, the Fund's industry composition1 was as follows:
| Industry Composition | Percentage of
Total Net Assets |
| Apparel | 7.7% |
| Specialty Retailing | 6.0% |
| Specialty Chemicals | 4.1% |
| Software Packaged/Custom | 3.9% |
| Services to Medical Professionals | 3.2% |
| Clothing Stores | 3.0% |
| Medical Supplies | 2.9% |
| Grocery Chain | 2.7% |
| Auto Original Equipment Manufacturers | 2.6% |
| Cosmetics & Toiletries | 2.6% |
| Crude Oil & Gas Production | 2.5% |
| Home Products | 2.5% |
| Telecommunication Equipment & Services | 2.4% |
| Restaurants | 2.3% |
| Auto Rentals | 2.0% |
| Multi-Industry Capital Goods | 2.0% |
| Personal & Household | 1.9% |
| Semiconductor Manufacturing Equipment | 1.9% |
| Computer Services | 1.8% |
| Metal Fabrication | 1.8% |
| Generic Drugs | 1.7% |
| Mail Order | 1.6% |
| Packaged Foods | 1.6% |
| Diversified Leisure | 1.5% |
| Office Furniture | 1.5% |
| Shoes | 1.5% |
| Building Materials | 1.4% |
| Biotechnology | 1.2% |
| Education & Training Services | 1.2% |
| Machined Parts Original Equipment Manufacturers | 1.2% |
| Oil Refiner | 1.2% |
| Electrical Equipment | 1.1% |
| Industrial Machinery | 1.1% |
| Medical Technology | 1.1% |
| Semiconductor Manufacturing | 1.1% |
| Home Health Care | 1.0% |
| Recreational Vehicles | 1.0% |
Annual Shareholder Report
| Industry Composition | Percentage of
Total Net Assets |
| Other2 | 16.5% |
| Cash Equivalents3 | 1.5% |
| Other Assets and Liabilities—Net4 | 0.2% |
| TOTAL | 100.0% |
| 1 | Except for Cash Equivalents and Other Assets and Liabilities, industry classifications are based upon, and individual portfolio securities are assigned to, the classifications of the Global Industry Classification Standard (GICS) except that the Adviser assigns a classification to securities not classified by the GICS and to securities for which the Adviser does not have access to the classification made by the GICS. |
| 2 | For purposes of this table, industry classifications which constitute less than 1.0% of the Fund's total net assets have been aggregated under the designation “Other.” |
| 3 | Cash Equivalents include any investments in money market mutual funds and/or overnight repurchase agreements. |
| 4 | Assets, other than investments in securities, less liabilities. See Statement of Assets and Liabilities.
|
Annual Shareholder Report
Portfolio of Investments
July 31, 2012
| Shares | | | Value |
| | COMMON STOCKS—98.3% | |
| | Airline - Regional—0.3% | |
| 4,833 | 1 | Alaska Air Group, Inc. | $168,430 |
| | Apparel—7.7% | |
| 34,693 | 1 | Ann Inc. | 939,486 |
| 16,558 | 1 | Carter's, Inc. | 838,994 |
| 9,405 | | Columbia Sportswear Co. | 475,799 |
| 23,053 | 1 | Express, Inc. | 371,153 |
| 5,307 | 1 | Maidenform Brands, Inc. | 111,871 |
| 4,132 | | Oxford Industries, Inc. | 178,668 |
| 8,566 | | True Religion Apparel, Inc. | 224,772 |
| 22,559 | 1 | Warnaco Group, Inc. | 962,367 |
| 3,517 | 1 | Zumiez Inc. | 127,773 |
| | TOTAL | 4,230,883 |
| | Auto Dealership—0.1% | |
| 1,316 | | Group 1 Automotive, Inc. | 70,735 |
| | Auto Original Equipment Manufacturers—2.6% | |
| 44,641 | | Dana Holding Corp. | 588,369 |
| 13,665 | 1 | Meritor, Inc. | 63,952 |
| 26,173 | 1 | Tenneco Automotive, Inc. | 766,607 |
| | TOTAL | 1,418,928 |
| | Auto Rentals—2.0% | |
| 527 | 1 | AMERCO | 49,222 |
| 14,216 | 1 | Dollar Thrifty Automotive Group | 1,057,670 |
| | TOTAL | 1,106,892 |
| | Baking—0.2% | |
| 3,523 | | Snyders-Lance, Inc. | 82,544 |
| | Biotechnology—1.2% | |
| 5,456 | 1 | Incyte Genomics, Inc. | 136,345 |
| 14,587 | 1 | Questcor Pharmaceuticals, Inc. | 537,823 |
| | TOTAL | 674,168 |
| | Building Materials—1.4% | |
| 11,489 | | Watsco, Inc. | 780,563 |
| | Carpets—0.2% | |
| 7,821 | | Interface, Inc. | 103,706 |
| | Cement—0.4% | |
| 5,730 | | Eagle Materials, Inc. | 199,117 |
Annual Shareholder Report
| Shares | | | Value |
| | COMMON STOCKS—continued | |
| | Clothing Stores—3.0% | |
| 26,887 | 1 | Aeropostale, Inc. | $530,211 |
| 5,235 | | Cato Corp., Class A | 146,580 |
| 5,438 | 1 | Children's Place Retail Stores, Inc. | 276,250 |
| 11,022 | 1 | Jos A. Bank Clothiers, Inc. | 465,790 |
| 8,262 | 1 | Rue21, Inc. | 203,576 |
| | TOTAL | 1,622,407 |
| | Commodity Chemicals—0.9% | |
| 4,461 | | Georgia Gulf Corp. | 146,231 |
| 1,534 | | Newmarket Corp. | 352,636 |
| | TOTAL | 498,867 |
| | Computer Peripherals—0.1% | |
| 10,234 | 1 | Silicon Graphics, Inc. | 68,056 |
| | Computer Services—1.8% | |
| 12,755 | | Fair Isaac & Co., Inc. | 552,164 |
| 2,023 | | Syntel, Inc. | 117,597 |
| 14,941 | 1 | Unisys Corp. | 290,304 |
| | TOTAL | 960,065 |
| | Computer Stores—0.2% | |
| 6,322 | 1 | Insight Enterprises, Inc. | 105,957 |
| | Construction Machinery—0.4% | |
| 2,265 | | NACCO Industries, Inc., Class A | 226,840 |
| | Consumer Goods—0.9% | |
| 13,022 | | Pool Corp. | 479,991 |
| | Consumer Services—0.3% | |
| 8,819 | | Hillenbrand, Inc. | 152,481 |
| | Cosmetics & Toiletries—2.6% | |
| 5,381 | 1 | Elizabeth Arden, Inc. | 209,913 |
| 16,427 | 1 | Revlon, Inc. | 239,013 |
| 36,734 | 1 | Sally Beauty Holdings, Inc. | 970,512 |
| | TOTAL | 1,419,438 |
| | Crude Oil & Gas Production—2.5% | |
| 17,285 | | Energy XXI (Bermuda) Ltd. | 538,946 |
| 18,044 | 1 | Stone Energy Corp. | 473,836 |
| 19,484 | | W&T Offshore, Inc. | 360,259 |
| | TOTAL | 1,373,041 |
| | Defense Aerospace—0.9% | |
| 7,771 | 1 | Hexcel Corp. | 180,986 |
| 5,600 | | Kaman Corp., Class A | 182,448 |
Annual Shareholder Report
| Shares | | | Value |
| | COMMON STOCKS—continued | |
| | Defense Aerospace—continued | |
| 7,896 | 1 | Orbital Sciences Corp. | $103,438 |
| | TOTAL | 466,872 |
| | Department Stores—0.5% | |
| 27,056 | 1 | Saks, Inc. | 282,194 |
| | Diversified Leisure—1.5% | |
| 16,879 | 1 | Coinstar, Inc. | 801,584 |
| | Education & Training Services—1.2% | |
| 10,886 | 1 | Bridgepoint Education, Inc. | 99,063 |
| 5,528 | 1 | Capella Education Co. | 146,602 |
| 7,507 | 1 | Grand Canyon Education, Inc. | 124,916 |
| 3,577 | | Strayer Education, Inc. | 259,905 |
| | TOTAL | 630,486 |
| | Electrical Equipment—1.1% | |
| 14,770 | | Belden, Inc. | 474,560 |
| 6,330 | 1 | Rofin-Sinar Technologies, Inc. | 114,763 |
| | TOTAL | 589,323 |
| | Electronic Instruments—0.2% | |
| 4,989 | 1 | iRobot Corp. | 113,550 |
| | Electronic Test/Measuring Equipment—0.5% | |
| 6,434 | | MTS Systems Corp. | 279,686 |
| | Financial Services—0.8% | |
| 12,068 | | Deluxe Corp. | 341,766 |
| 3,993 | 1 | Encore Capital Group, Inc. | 111,804 |
| | TOTAL | 453,570 |
| | Furniture—0.7% | |
| 5,283 | | Ethan Allen Interiors, Inc. | 108,988 |
| 9,990 | 1 | Select Comfort Corp. | 259,840 |
| | TOTAL | 368,828 |
| | Generic Drugs—1.7% | |
| 28,984 | | Medicis Pharmaceutical Corp., Class A | 954,153 |
| | Grocery Chain—2.7% | |
| 13,050 | | Casey's General Stores, Inc. | 775,562 |
| 17,427 | | Harris Teeter Supermarkets Inc. | 720,432 |
| | TOTAL | 1,495,994 |
| | Home Health Care—1.0% | |
| 8,483 | 1 | Wellcare Health Plans, Inc. | 549,868 |
| | Home Products—2.5% | |
| 10,762 | 1 | Spectrum Brands Holdings, Inc. | 396,364 |
Annual Shareholder Report
| Shares | | | Value |
| | COMMON STOCKS—continued | |
| | Home Products—continued | |
| 18,249 | | Tupperware Brands Corp. | $956,613 |
| | TOTAL | 1,352,977 |
| | Hotels and Motels—0.7% | |
| 5,848 | | Ameristar Casinos, Inc. | 98,656 |
| 4,640 | | Six Flags Entertainment Corp. | 267,310 |
| | TOTAL | 365,966 |
| | Industrial Machinery—1.1% | |
| 8,614 | | Actuant Corp. | 245,155 |
| 4,145 | | Tennant Co. | 172,722 |
| 5,813 | | Watts Industries, Inc., Class A | 195,549 |
| | TOTAL | 613,426 |
| | Internet Services—0.3% | |
| 6,561 | 1 | Travelzoo, Inc. | 141,783 |
| | Machined Parts Original Equipment Manufacturers—1.2% | |
| 15,278 | | Applied Industrial Technologies, Inc. | 567,730 |
| 3,047 | | Titan International, Inc. | 62,982 |
| | TOTAL | 630,712 |
| | Mail Order—1.6% | |
| 20,670 | | HSN, Inc. | 875,581 |
| | Medical Supplies—2.9% | |
| 6,445 | 1 | Align Technology, Inc. | 218,872 |
| 2,960 | 1 | Orthofix International NV | 121,390 |
| 24,300 | | Owens & Minor, Inc. | 685,503 |
| 19,577 | | Steris Corp. | 589,855 |
| | TOTAL | 1,615,620 |
| | Medical Technology—1.1% | |
| 6,876 | 1 | Arthrocare Corp. | 203,392 |
| 7,941 | 1 | Integra Lifesciences Corp. | 305,411 |
| 5,351 | 1 | MedAssets, Inc. | 70,580 |
| | TOTAL | 579,383 |
| | Metal Fabrication—1.8% | |
| 12,002 | | Barnes Group, Inc. | 286,368 |
| 33,538 | | Worthington Industries, Inc. | 727,774 |
| | TOTAL | 1,014,142 |
| | Miscellaneous Communications—0.2% | |
| 17,232 | 1 | Leap Wireless International, Inc. | 97,878 |
| | Miscellaneous Components—0.5% | |
| 12,410 | 1 | TriMas Corp. | 269,793 |
Annual Shareholder Report
| Shares | | | Value |
| | COMMON STOCKS—continued | |
| | Miscellaneous Metals—0.5% | |
| 1,543 | | AMCOL International Corp. | $47,370 |
| 1,298 | | Materion Corp | 25,480 |
| 6,365 | | Matthews International Corp., Class A | 184,585 |
| | TOTAL | 257,435 |
| | Multi-Industry Basic—0.1% | |
| 3,814 | | Olin Corp. | 77,195 |
| | Multi-Industry Capital Goods—2.0% | |
| 19,314 | | Acuity Brands, Inc. | 1,119,053 |
| | Multi-Industry Transportation—0.8% | |
| 15,589 | | Brinks Co. (The) | 361,665 |
| 3,054 | 1 | Hub Group, Inc. | 90,856 |
| | TOTAL | 452,521 |
| | Office Furniture—1.5% | |
| 11,040 | | HNI Corp. | 293,333 |
| 23,535 | | Knoll, Inc. | 322,194 |
| 11,835 | | Miller Herman, Inc. | 216,580 |
| | TOTAL | 832,107 |
| | Office Supplies—0.5% | |
| 11,631 | | United Stationers, Inc. | 293,218 |
| | Oil Refiner—1.2% | |
| 28,650 | | Western Refining, Inc. | 674,134 |
| | Oil Service, Explore & Drill—0.4% | |
| 12,820 | 1 | C&J Energy Services, Inc. | 240,760 |
| | Other Communications Equipment—0.3% | |
| 4,702 | 1 | Netgear, Inc. | 162,830 |
| | Packaged Foods—1.6% | |
| 16,579 | 1 | United Natural Foods, Inc. | 900,240 |
| | Paint & Related Materials—0.0% | |
| 7,299 | 1 | Ferro Corp. | 22,408 |
| | Personal & Household—1.9% | |
| 20,100 | | Nu Skin Enterprises, Inc., Class A | 1,025,301 |
| | Personal Loans—0.5% | |
| 3,589 | | Cash America International, Inc. | 137,530 |
| 6,211 | 1 | Ezcorp, Inc., Class A | 139,748 |
| | TOTAL | 277,278 |
| | Personnel Agency—0.2% | |
| 6,592 | 1 | TrueBlue, Inc. | 100,330 |
Annual Shareholder Report
| Shares | | | Value |
| | COMMON STOCKS—continued | |
| | Photo-Optical Component-Equipment—0.3% | |
| 2,997 | 1 | Coherent, Inc. | $146,344 |
| | Plastic—0.2% | |
| 8,421 | | Polyone Corp. | 124,041 |
| | Printing—0.9% | |
| 3,401 | 1 | Consolidated Graphics, Inc. | 80,638 |
| 18,280 | 1 | Valassis Communications, Inc. | 412,214 |
| | TOTAL | 492,852 |
| | Recreational Goods—0.6% | |
| 6,918 | | Sturm Ruger & Co., Inc. | 341,957 |
| | Recreational Vehicles—1.0% | |
| 24,782 | | Brunswick Corp. | 544,956 |
| | Restaurants—2.3% | |
| 5,605 | | CEC Entertainment, Inc. | 193,148 |
| 8,876 | | Cracker Barrel Old Country Store, Inc. | 556,170 |
| 7,459 | 1 | DineEquity Inc. | 397,565 |
| 4,316 | 1 | Red Robin Gourmet Burgers | 128,833 |
| | TOTAL | 1,275,716 |
| | Roofing & Wallboard—0.5% | |
| 6,847 | 1 | Beacon Roofing Supply, Inc. | 181,514 |
| 7,380 | 1 | USG Corp. | 119,851 |
| | TOTAL | 301,365 |
| | Rubber—0.5% | |
| 14,191 | | Cooper Tire & Rubber Co. | 247,917 |
| | Semiconductor Manufacturing—1.1% | |
| 10,023 | 1 | Cirrus Logic, Inc. | 368,546 |
| 13,070 | 1 | Omnivision Technologies, Inc. | 183,242 |
| 13,710 | 1 | Triquint Semiconductor, Inc. | 77,324 |
| | TOTAL | 629,112 |
| | Semiconductor Manufacturing Equipment—1.9% | |
| 18,799 | | Brooks Automation, Inc. | 174,079 |
| 8,517 | 1 | Mentor Graphics Corp. | 130,140 |
| 19,893 | 1 | Veeco Instruments, Inc. | 710,379 |
| | TOTAL | 1,014,598 |
| | Services to Medical Professionals—3.2% | |
| 18,817 | 1 | Centene Corp. | 715,799 |
| 17,033 | 1 | Molina Healthcare, Inc. | 415,776 |
| 19,379 | 1 | PSS World Medical, Inc. | 404,827 |
Annual Shareholder Report
| Shares | | | Value |
| | COMMON STOCKS—continued | |
| | Services to Medical Professionals—continued | |
| 8,480 | 1 | Team Health Holdings, Inc. | $226,416 |
| | TOTAL | 1,762,818 |
| | Shoes—1.5% | |
| 42,221 | 1 | CROCs, Inc. | 648,092 |
| 2,377 | 1 | Genesco, Inc. | 157,405 |
| | TOTAL | 805,497 |
| | Silver Production—0.5% | |
| 15,620 | 1 | Coeur d'Alene Mines Corp. | 254,762 |
| | Software Packaged/Custom—3.9% | |
| 6,396 | 1 | Acxiom Corp. | 107,261 |
| 4,479 | 1 | MicroStrategy, Inc., Class A | 521,624 |
| 32,107 | 1 | Parametric Technology Corp. | 691,585 |
| 18,630 | 1 | Progress Software Corp. | 362,167 |
| 6,597 | 1 | Verint Systems, Inc. | 184,122 |
| 18,482 | 1 | Websense, Inc. | 277,415 |
| | TOTAL | 2,144,174 |
| | Specialty Chemicals—4.1% | |
| 4,033 | | Chemed Corp. | 253,151 |
| 15,934 | 1 | Chemtura Corp. | 215,428 |
| 9,625 | 1 | Kraton Performance Polymers, Inc. | 225,417 |
| 13,220 | 1 | LSB Industries, Inc. | 424,759 |
| 1,638 | | Quaker Chemical Corp. | 72,514 |
| 22,339 | | Rockwood Holdings, Inc. | 987,831 |
| 1,883 | 1 | TPC Group, Inc. | 72,496 |
| | TOTAL | 2,251,596 |
| | Specialty Retailing—6.0% | |
| 2,114 | | Aaron's, Inc. | 62,004 |
| 61,584 | 1 | Ascena Retail Group, Inc. | 1,129,450 |
| 3,737 | 1 | Cabela's, Inc., Class A | 171,678 |
| 10,402 | | Finish Line, Inc., Class A | 217,194 |
| 13,960 | | GNC Acquisition Holdings Inc. | 537,879 |
| 3,110 | 1 | Hibbett Sports Inc. | 188,995 |
| 3,445 | 1 | Kirkland's, Inc. | 37,240 |
| 5,851 | 1 | Lumber Liquidators, Inc. | 247,439 |
| 22,119 | | Penske Automotive Group, Inc. | 528,644 |
| 6,823 | 1 | Vera Bradley, Inc. | 155,496 |
| | TOTAL | 3,276,019 |
Annual Shareholder Report
| Shares | | | Value |
| | COMMON STOCKS—continued | |
| | Surveillance-Detection—0.4% | |
| 6,593 | | Mine Safety Appliances Co. | $226,272 |
| | Telecommunication Equipment & Services—2.4% | |
| 16,231 | 1 | Anixter International, Inc. | 923,706 |
| 24,043 | 1 | CIENA Corp. | 385,409 |
| | TOTAL | 1,309,115 |
| | TOTAL COMMON STOCKS
(IDENTIFIED COST $50,017,803) | 53,870,399 |
| | MUTUAL FUND—1.5% | |
| 839,624 | 2,3 | Federated Prime Value Obligations Fund, Institutional Shares, 0.22%
(AT NET ASSET VALUE) | 839,624 |
| | TOTAL INVESTMENTS—99.8%
(IDENTIFIED COST $50,857,427)4 | 54,710,023 |
| | OTHER ASSETS AND LIABILITIES - NET—0.2%5 | 104,807 |
| | TOTAL NET ASSETS—100% | $54,814,830 |
| 1 | Non-income producing security. |
| 2 | Affiliated holding. |
| 3 | 7-Day net yield. |
| 4 | The cost for federal tax purposes amounts to $50,949,055. |
| 5 | Assets, other than investments in securities, less liabilities. See Statement of Assets and Liabilities. |
Note: The categories of investments are shown as a percentage of total net assets at July 31, 2012.
Various inputs are used in determining the value of the Fund's investments. These inputs are summarized in the three broad levels listed below:
Level 1—quoted prices in active markets for identical securities, including investment companies with daily net asset values, if applicable.
Level 2—other significant observable inputs (including quoted prices for similar securities, interest rates, prepayment speeds, credit risk, etc.). Also includes securities valued at amortized cost.
Level 3—significant unobservable inputs (including the Fund's own assumptions in determining the fair value of investments).
The inputs or methodology used for valuing securities are not an indication of the risk associated with investing in those securities.
As of July 31, 2012, all investments of the Fund utilized Level 1 inputs in valuing the Fund's assets carried at fair value.
See Notes which are an integral part of the Financial Statements
Annual Shareholder Report
Financial Highlights–Class A Shares
(For a Share Outstanding Throughout Each Period)
| Year Ended July 31 | 2012 | 2011 | 2010 | 2009 | 2008 |
| Net Asset Value, Beginning of Period | $12.12 | $8.74 | $7.85 | $11.57 | $12.95 |
| Income From Investment Operations: | | | | | |
| Net investment income (loss) | (0.09)1 | (0.13)1 | (0.10)1 | (0.08)1 | (0.14)1 |
| Net realized and unrealized gain (loss) on investments and foreign currency transactions | (0.10) | 3.51 | 0.99 | (3.64) | (1.17) |
| TOTAL FROM INVESTMENT OPERATIONS | (0.19) | 3.38 | 0.89 | (3.72) | (1.31) |
| Less Distributions: | | | | | |
| Distributions from net realized gain on investments | — | — | — | — | (0.07) |
| Regulatory Settlement Proceeds | — | — | — | 0.002 | — |
| Net Asset Value, End of Period | $11.93 | $12.12 | $8.74 | $7.85 | $11.57 |
| Total Return3 | (1.57)% | 38.67% | 11.34% | (32.15)%4 | (10.20)% |
| Ratios to Average Net Assets: | | | | | |
| Net expenses | 1.75% | 1.75% | 1.75% | 1.75% | 1.75% |
| Net investment income (loss) | (0.79)% | (1.18)% | (1.17)% | (1.04)% | (1.20)% |
| Expense waiver/reimbursement5 | 1.04% | 1.14% | 1.22% | 1.02% | 1.05% |
| Supplemental Data: | | | | | |
| Net assets, end of period (000 omitted) | $22,718 | $25,634 | $19,822 | $21,682 | $31,874 |
| Portfolio turnover | 69% | 154% | 142% | 244% | 212% |
| 1 | Per share numbers have been calculated using the average shares method. |
| 2 | Represents less than $0.01. |
| 3 | Based on net asset value, which does not reflect the sales charge, redemption fee or contingent deferred sales charge, if applicable. |
| 4 | During the period, the Fund received a regulatory settlement from an unaffiliated third party, which had an impact of 0.09% on the total return. |
| 5 | This expense decrease is reflected in both the net expense and the net investment income (loss) ratios shown above. |
See Notes which are an integral part of the Financial Statements
Annual Shareholder Report
Financial Highlights–Class B Shares
(For a Share Outstanding Throughout Each Period)
| Year Ended July 31, | Period
Ended
7/31/20081 |
| 2012 | 2011 | 2010 | 2009 |
| Net Asset Value, Beginning of Period | $11.90 | $8.65 | $7.81 | $11.61 | $11.26 |
| Income From Investment Operations: | | | | | |
| Net investment income (loss) | (0.17)2 | (0.21)2 | (0.16)2 | (0.14)2 | (0.09)2 |
| Net realized and unrealized gain (loss) on investments and foreign currency transactions | (0.11) | 3.46 | 1.00 | (3.66) | 0.44 |
| TOTAL FROM INVESTMENT OPERATIONS | (0.28) | 3.25 | 0.84 | (3.80) | 0.35 |
| Regulatory Settlement Proceeds | — | — | — | 0.003 | — |
| Net Asset Value, End of Period | $11.62 | $11.90 | $8.65 | $7.81 | $11.61 |
| Total Return4 | (2.35)% | 37.57% | 10.76% | (32.73)% | 3.11% |
| Ratios to Average Net Assets: | | | | | |
| Net expenses | 2.50% | 2.50% | 2.50% | 2.50% | 2.50%5 |
| Net investment income (loss) | (1.55)% | (1.93)% | (1.92)% | (1.75)% | (1.96)%5 |
| Expense waiver/reimbursement6 | 1.06% | 1.15% | 1.22% | 1.02% | 1.05%5 |
| Supplemental Data: | | | | | |
| Net assets, end of period (000 omitted) | $1,640 | $2,541 | $2,350 | $3,088 | $9,811 |
| Portfolio turnover | 69% | 154% | 142% | 244% | 212%7 |
| 1 | Reflects operations for the period from March 18, 2008 (date of initial investment) to July 31, 2008. |
| 2 | Per share numbers have been calculated using the average shares method. |
| 3 | Represents less than $0.01. |
| 4 | Based on net asset value, which does not reflect the sales charge, redemption fee or contingent deferred sales charge, if applicable. Total returns for periods of less than one year are not annualized. |
| 5 | Computed on an annualized basis. |
| 6 | This expense decrease is reflected in both the net expense and the net investment income (loss) ratios shown above. |
| 7 | Portfolio turnover is calculated at the Fund level. Percentage indicated was calculated for the year ended July 31, 2008. |
See Notes which are an integral part of the Financial Statements
Annual Shareholder Report
Financial Highlights–Class C Shares
(For a Share Outstanding Throughout Each Period)
| Year Ended July 31 | 2012 | 2011 | 2010 | 2009 | 2008 |
| Net Asset Value, Beginning of Period | $11.60 | $8.43 | $7.62 | $11.32 | $12.77 |
| Income From Investment Operations: | | | | | |
| Net investment income (loss) | (0.17)1 | (0.21)1 | (0.16)1 | (0.14)1 | (0.22)1 |
| Net realized and unrealized gain (loss) on investments and foreign currency transactions | (0.10) | 3.38 | 0.97 | (3.56) | (1.16) |
| TOTAL FROM INVESTMENT OPERATIONS | (0.27) | 3.17 | 0.81 | (3.70) | (1.38) |
| Less Distributions: | | | | | |
| Distributions from net realized gain on investments | — | — | — | — | (0.07) |
| Regulatory Settlement Proceeds | — | — | — | 0.002 | — |
| Net Asset Value, End of Period | $11.33 | $11.60 | $8.43 | $7.62 | $11.32 |
| Total Return3 | (2.33)% | 37.60% | 10.63% | (32.69)% | (10.89)% |
| Ratios to Average Net Assets: | | | | | |
| Net expenses | 2.50% | 2.50% | 2.49% | 2.50% | 2.47% |
| Net investment income (loss) | (1.54)% | (1.94)% | (1.91)% | (1.79)% | (1.93)% |
| Expense waiver/reimbursement4 | 1.04% | 1.13% | 1.22% | 1.02% | 1.07% |
| Supplemental Data: | | | | | |
| Net assets, end of period (000 omitted) | $4,223 | $4,663 | $2,795 | $4,069 | $6,450 |
| Portfolio turnover | 69% | 154% | 142% | 244% | 212% |
| 1 | Per share numbers have been calculated using the average shares method. |
| 2 | Represents less than $0.01. |
| 3 | Based on net asset value, which does not reflect the sales charge, redemption fee or contingent deferred sales charge, if applicable. |
| 4 | This expense decrease is reflected in both the net expense and the net investment income (loss) ratios shown above. |
See Notes which are an integral part of the Financial Statements
Annual Shareholder Report
Financial Highlights–Institutional Shares
(For a Share Outstanding Throughout Each Period)
| Year Ended July 31 | 2012 | 2011 | 2010 | 2009 | 2008 |
| Net Asset Value, Beginning of Period | $12.31 | $8.85 | $7.93 | $11.66 | $13.02 |
| Income From Investment Operations: | | | | | |
| Net investment income (loss) | (0.06)1 | (0.10)1 | (0.08)1 | (0.06)1 | (0.11)1 |
| Net realized and unrealized gain (loss) on investments and foreign currency transactions | (0.11) | 3.56 | 1.00 | (3.67) | (1.18) |
| TOTAL FROM INVESTMENT OPERATIONS | (0.17) | 3.46 | 0.92 | (3.73) | (1.29) |
| Less Distributions: | | | | | |
| Distributions from net realized gain on investments | — | — | — | — | (0.07) |
| Regulatory Settlement Proceeds | — | — | — | 0.002 | — |
| Net Asset Value, End of Period | $12.14 | $12.31 | $8.85 | $7.93 | $11.66 |
| Total Return3 | (1.38)% | 39.10% | 11.60% | (31.99)% | (9.99)% |
| Ratios to Average Net Assets: | | | | | |
| Net expenses | 1.50% | 1.50% | 1.50% | 1.50% | 1.50% |
| Net investment income (loss) | (0.54)% | (0.92)% | (0.92)% | (0.80)% | (0.91)% |
| Expense waiver/reimbursement4 | 1.05% | 1.15% | 1.22% | 1.02% | 1.09% |
| Supplemental Data: | | | | | |
| Net assets, end of period (000 omitted) | $26,233 | $29,395 | $27,039 | $39,246 | $62,209 |
| Portfolio turnover | 69% | 154% | 142% | 244% | 212% |
| 1 | Per share numbers have been calculated using the average shares method. |
| 2 | Represents less than $0.01. |
| 3 | Based on net asset value. |
| 4 | This expense decrease is reflected in both the net expense and the net investment income (loss) ratios shown above. |
See Notes which are an integral part of the Financial Statements
Annual Shareholder Report
Statement of Assets and Liabilities
July 31, 2012
| Assets: | | |
| Total investment in securities, at value including $839,624 of investment in an affiliated holding (Note 5) (identified cost $50,857,427) | | $54,710,023 |
| Cash | | 200 |
| Income receivable | | 12,638 |
| Receivable for investments sold | | 454,767 |
| Receivable for shares sold | | 99,339 |
| TOTAL ASSETS | | 55,276,967 |
| Liabilities: | | |
| Payable for investments purchased | $186,596 | |
| Payable for shares redeemed | 164,719 | |
| Payable for transfer and dividend disbursing agent fees and expenses | 43,313 | |
| Payable for Directors'/Trustees' fees | 283 | |
| Payable for auditing fees | 23,400 | |
| Payable for portfolio accounting fees | 13,156 | |
| Payable for distribution services fee (Note 5) | 3,772 | |
| Payable for shareholder services fee (Note 5) | 14,497 | |
| Accrued expenses | 12,401 | |
| TOTAL LIABILITIES | | 462,137 |
| Net assets for 4,578,972 shares outstanding | | $54,814,830 |
| Net Assets Consist of: | | |
| Paid-in capital | | $75,155,496 |
| Net unrealized appreciation of investments | | 3,852,596 |
| Accumulated net realized loss on investments and foreign currency transactions | | (23,938,900) |
| Accumulated net investment income (loss) | | (254,362) |
| TOTAL NET ASSETS | | $54,814,830 |
Annual Shareholder Report
Statement of Assets and Liabilities–continued
| Net Asset Value, Offering Price and Redemption Proceeds Per Share | | |
| Class A Shares: | | |
| Net asset value per share ($22,718,242 ÷ 1,904,217 shares outstanding), no par value, unlimited shares authorized | | $11.93 |
| Offering price per share (100/94.50 of $11.93) | | $12.62 |
| Redemption proceeds per share | | $11.93 |
| Class B Shares: | | |
| Net asset value per share ($1,640,369 ÷ 141,187 shares outstanding), no par value, unlimited shares authorized | | $11.62 |
| Offering price per share | | $11.62 |
| Redemption proceeds per share (94.50/100 of $11.62) | | $10.98 |
| Class C Shares: | | |
| Net asset value per share ($4,222,923 ÷ 372,774 shares outstanding), no par value, unlimited shares authorized | | $11.33 |
| Offering price per share | | $11.33 |
| Redemption proceeds per share (99.00/100 of $11.33) | | $11.22 |
| Institutional Shares: | | |
| Net asset value per share ($26,233,296 ÷ 2,160,794 shares outstanding), no par value, unlimited shares authorized | | $12.14 |
| Offering price per share | | $12.14 |
| Redemption proceeds per share | | $12.14 |
See Notes which are an integral part of the Financial Statements
Annual Shareholder Report
Statement of Operations
Year Ended July 31, 2012
| Investment Income: | | | |
| Dividends (including $2,109 received from an affiliated holding (Note 5)) | | | $542,583 |
| Expenses: | | | |
| Investment adviser fee (Note 5) | | $647,389 | |
| Administrative fee (Note 5) | | 270,000 | |
| Custodian fees | | 13,446 | |
| Transfer and dividend disbursing agent fees and expenses | | 292,857 | |
| Directors'/Trustees' fees | | 2,415 | |
| Auditing fees | | 23,424 | |
| Legal fees | | 7,850 | |
| Portfolio accounting fees | | 79,067 | |
| Distribution services fee (Note 5) | | 45,885 | |
| Shareholder services fee (Note 5) | | 71,463 | |
| Account administration fee (Note 2) | | 821 | |
| Share registration costs | | 49,685 | |
| Printing and postage | | 38,785 | |
| Insurance premiums | | 3,935 | |
| Miscellaneous | | 6,755 | |
| TOTAL EXPENSES | | 1,553,777 | |
| Waivers and Reimbursement (Note 5): | | | |
| Waiver/reimbursement of investment adviser fee | $(533,994) | | |
| Waiver of administrative fee | (54,436) | | |
| TOTAL WAIVERS AND REIMBURSEMENT | | (588,430) | |
| Net expenses | | | 965,347 |
| Net investment income (loss) | | | (422,764) |
| Realized and Unrealized Gain (Loss) on Investments: | | | |
| Net realized gain on investments | | | 4,915,672 |
| Net change in unrealized appreciation of investments | | | (5,652,407) |
| Net realized and unrealized loss on investments | | | (736,735) |
| Change in net assets resulting from operations | | | $(1,159,499) |
See Notes which are an integral part of the Financial Statements
Annual Shareholder Report
Statement of Changes in Net Assets
| Year Ended July 31 | 2012 | 2011 |
| Increase (Decrease) in Net Assets | | |
| Operations: | | |
| Net investment income (loss) | $(422,764) | $(668,315) |
| Net realized gain on investments | 4,915,672 | 16,788,945 |
| Net change in unrealized appreciation/depreciation of investments | (5,652,407) | 2,272,284 |
| CHANGE IN NET ASSETS RESULTING FROM OPERATIONS | (1,159,499) | 18,392,914 |
| Share Transactions: | | |
| Proceeds from sale of shares | 12,048,639 | 14,184,989 |
| Cost of shares redeemed | (18,308,002) | (22,350,403) |
| CHANGE IN NET ASSETS RESULTING FROM SHARE TRANSACTIONS | (6,259,363) | (8,165,414) |
| Change in net assets | (7,418,862) | 10,227,500 |
| Net Assets: | | |
| Beginning of period | 62,233,692 | 52,006,192 |
| End of period (including accumulated net investment income (loss) of $(254,362) and $0, respectively) | $54,814,830 | $62,233,692 |
See Notes which are an integral part of the Financial Statements
Annual Shareholder Report
Notes to Financial Statements
July 31, 2012
1. ORGANIZATION
Federated MDT Series (the “Trust”) is registered under the Investment Company Act of 1940, as amended (the “Act”), as an open-end management investment company. The Trust consists of five portfolios. The financial statements included herein are only those of Federated MDT Small Cap Growth Fund (the “Fund”), a diversified portfolio. The financial statements of the other portfolios are presented separately. The assets of each portfolio are segregated and a shareholder's interest is limited to the portfolio in which shares are held. Each portfolio pays its own expenses. The Fund offers four classes of shares: Class A Shares, Class B Shares, Class C Shares and Institutional Shares. All shares of the Fund have equal rights with respect to voting, except on class-specific matters. The investment objective of the Fund is to provide long-term capital appreciation.
2. SIGNIFICANT ACCOUNTING POLICIES
The following is a summary of significant accounting policies consistently followed by the Fund in the preparation of its financial statements. These policies are in conformity with U.S. generally accepted accounting principles (GAAP).
Investment Valuation
In calculating its net asset value (NAV), the Fund generally values investments as follows:
| ■ | Equity securities listed on an exchange or traded through a regulated market system are valued at their last reported sale price or official closing price in their principal exchange or market. |
| ■ | Shares of other mutual funds are valued based upon their reported NAVs. |
| ■ | Fixed-income securities acquired with remaining maturities greater than 60 days are fair valued using price evaluations provided by a pricing service approved by the Fund's Board of Trustees (the “Trustees”). |
| ■ | Fixed-income securities acquired with remaining maturities of 60 days or less are valued at their cost (adjusted for the accretion of any discount or amortization of any premium), which approximates market value. |
| ■ | Derivative contracts listed on exchanges are valued at their reported settlement or closing price. |
| ■ | Over-the-counter (OTC) derivative contracts are fair valued using price evaluations provided by a pricing service approved by the Trustees. |
| ■ | For securities that are fair valued in accordance with procedures established by and under the general supervision of the Trustees, certain factors may be considered such as: the purchase price of the security, information obtained by contacting the issuer, analysis of the issuer's financial statements or other available documents, fundamental analytical data, the nature and duration of restrictions on disposition, the movement of the market in which the security is normally traded and public trading in similar securities of the issuer or comparable issuers. |
Annual Shareholder Report
If the Fund cannot obtain a price or price evaluation from a pricing service for an investment, the Fund may attempt to value the investment based upon the mean of bid and asked quotations or fair value the investment based on price evaluations, from one or more dealers. If any price, quotation, price evaluation or other pricing source is not readily available when the NAV is calculated, the Fund uses the fair value of the investment determined in accordance with the procedures described below. There can be no assurance that the Fund could purchase or sell an investment at the price used to calculate the Fund's NAV.
Fair Valuation and Significant Events Procedures
The Trustees have appointed a Valuation Committee comprised of officers of the Fund, Federated MDTA LLC (“Adviser”) or an affiliated adviser and others to determine fair value of securities and in overseeing the calculation of the NAV. The Trustees have also authorized the use of pricing services recommended by the Valuation Committee to provide fair value evaluations of the current value of certain investments for purposes of calculating the NAV. The Valuation Committee employs various methods for reviewing third-party pricing service evaluations including periodic reviews of third-party pricing services' policies, procedures and valuation methods (including key inputs and assumptions), transactional back-testing, comparisons of evaluations of different pricing services and review of price challenges by the Adviser based on recent market activity. In the event that market quotations and price evaluations are not available for an investment, the Valuation Committee determines the fair value of the investment in accordance with procedures adopted by the Trustees. The Trustees periodically review and approve the fair valuations made by the Valuation Committee and any changes made to the procedures.
Factors considered by pricing services in evaluating an investment include the yields or prices of investments of comparable quality, coupon, maturity, call rights and other potential prepayments, terms and type, reported transactions, indications as to values from dealers and general market conditions. Some pricing services provide a single price evaluation reflecting the bid-side of the market for an investment (a “bid” evaluation). Other pricing services offer both bid evaluations and price evaluations indicative of a price between the prices bid and asked for the investment (a “mid” evaluation). The Fund normally uses bid evaluations for U.S. Treasury and Agency securities, mortgage-backed securities and municipal securities. The Fund normally uses mid evaluations for other types of fixed-income securities and OTC derivative contracts. In the event that market quotations and price evaluations are not available for an investment, the fair value of the investment is determined in accordance with procedures adopted by the Trustees.
The Trustees also have adopted procedures requiring an investment to be priced at its fair value whenever the Adviser determines that a significant event affecting the value of the investment has occurred between the time as of which the price of the investment would otherwise be determined and the time as of which the NAV is computed. An event is considered significant if there is both an affirmative expectation that the investment's value will change in response to the event and a reasonable basis for quantifying the resulting change in value. Examples of significant events that may occur after the close of the principal market on which a security is traded, or after the time of a price evaluation provided by a pricing service or a dealer, include:
| ■ | With respect to securities traded in foreign markets, significant trends in U.S. equity markets or in the trading of foreign securities index futures or options contracts; |
| ■ | With respect to price evaluations of fixed-income securities determined before the close of regular trading on the NYSE, actions by the Federal Reserve Open Market Committee and other significant trends in U.S. fixed-income markets; |
Annual Shareholder Report
| ■ | Political or other developments affecting the economy or markets in which an issuer conducts its operations or its securities are traded; and |
| ■ | Announcements concerning matters such as acquisitions, recapitalizations, litigation developments, a natural disaster affecting the issuer's operations or regulatory changes or market developments affecting the issuer's industry. |
The Trustees have approved the use of a pricing service to determine the fair value of equity securities traded principally in foreign markets when the Adviser determines that there has been a significant trend in the U.S. equity markets or in index futures trading. For other significant events, the Fund may seek to obtain more current quotations or price evaluations from alternative pricing sources. If a reliable alternative pricing source is not available, the Fund will determine the fair value of the investment using another method approved by the Trustees.
Repurchase Agreements
The Fund may invest in repurchase agreements for short-term liquidity purposes. It is the policy of the Fund to require the other party to a repurchase agreement to transfer to the Fund's custodian or sub-custodian eligible securities or cash with a market value (after transaction costs) at least equal to the repurchase price to be paid under the repurchase agreement. The eligible securities are transferred to accounts with the custodian or sub-custodian in which the Fund holds a “securities entitlement” and exercises “control” as those terms are defined in the Uniform Commercial Code. The Fund has established procedures for monitoring the market value of the transferred securities and requiring the transfer of additional eligible securities if necessary to equal at least the repurchase price. These procedures also allow the other party to require securities to be transferred from the account to the extent that their market value exceeds the repurchase price or in exchange for other eligible securities of equivalent market value.
The insolvency of the other party or other failure to repurchase the securities may delay the disposition of the underlying securities or cause the Fund to receive less than the full repurchase price. Under the terms of the repurchase agreement, any amounts received by the Fund in excess of the repurchase price and related transaction costs must be remitted to the other party.
The Fund may enter into repurchase agreements in which eligible securities are transferred into joint trading accounts maintained by the custodian or sub-custodian for investment companies and other clients advised by the Fund's Adviser and its affiliates. The Fund will participate on a pro rata basis with the other investment companies and clients in its share of the securities transferred under such repurchase agreements and in its share of proceeds from any repurchase or other disposition of such securities.
Investment Income, Gains and Losses, Expenses and Distributions
Investment transactions are accounted for on a trade-date basis. Realized gains and losses from investment transactions are recorded on an identified-cost basis. Interest income and expenses are accrued daily. Dividend income and distributions to shareholders are recorded on the ex-dividend date. Foreign dividends are recorded on the ex-dividend date or when the Fund is informed of the ex-dividend date. Distributions of net investment income, if any, are declared and paid annually. Non-cash dividends included in dividend income, if any, are recorded at fair value. Investment income, realized and unrealized gains and losses and certain fund-level expenses are allocated to each class based on relative average daily net
Annual Shareholder Report
assets, except that Class A Shares, Class B Shares, Class C Shares and Institutional Shares may bear distribution services fees, shareholder services fees and account administration fees unique to those classes. For the year ended July 31, 2012, account administration fees for the Fund were as follows:
| | | | Account
Administration
Fees Incurred |
| Class A Shares | | | | $276 |
| Class C Shares | | | | 545 |
| TOTAL | | | | $821 |
Dividends are declared separately for each class. No class has preferential dividend rights; differences in per share dividend rates are generally due to differences in separate class expenses.
Premium and Discount Amortization
All premiums and discounts on fixed-income securities are amortized/accreted using the effective interest rate method.
Federal Taxes
It is the Fund's policy to comply with the Subchapter M provision of the Internal Revenue Code (the “Code”) and to distribute to shareholders each year substantially all of its income. Accordingly, no provision for federal income tax is necessary. As of and during the year ended July 31, 2012, the Fund did not have a liability for any uncertain tax positions. The Fund recognizes interest and penalties, if any, related to tax liabilities as income tax expense in the Statement of Operations. As of July 31, 2012, tax years 2009 through 2012 remain subject to examination by the Fund's major tax jurisdictions, which include the United States of America and the Commonwealth of Massachusetts.
When-Issued and Delayed Delivery Transactions
The Fund may engage in when-issued or delayed delivery transactions. The Fund records when-issued securities on the trade date and maintains security positions such that sufficient liquid assets will be available to make payment for the securities purchased. Securities purchased on a when-issued or delayed delivery basis are marked to market daily and begin earning interest on the settlement date. Losses may occur on these transactions due to changes in market conditions or the failure of counterparties to perform under the contract.
Other
The preparation of financial statements in conformity with GAAP requires management to make estimates and assumptions that affect the amounts of assets, liabilities, expenses and revenues reported in the financial statements. Actual results could differ from those estimated.
Annual Shareholder Report
3. SHARES OF BENEFICIAL INTEREST
The following tables summarize share activity:
| Year Ended July 31 | 2012 | 2011 |
| Class A Shares: | Shares | Amount | Shares | Amount |
| Shares sold | 317,159 | $3,790,317 | 338,623 | $3,939,179 |
| Shares redeemed | (527,438) | (6,080,816) | (490,937) | (5,523,025) |
| NET CHANGE RESULTING FROM CLASS A SHARE TRANSACTIONS | (210,279) | $(2,290,499) | (152,314) | $(1,583,846) |
| Year Ended July 31 | 2012 | 2011 |
| Class B Shares: | Shares | Amount | Shares | Amount |
| Shares sold | 8,120 | $92,002 | 43,028 | $480,622 |
| Shares redeemed | (80,577) | (897,209) | (101,250) | (1,082,656) |
| NET CHANGE RESULTING FROM CLASS B SHARE TRANSACTIONS | (72,457) | $(805,207) | (58,222) | $(602,034) |
| Year Ended July 31 | 2012 | 2011 |
| Class C Shares: | Shares | Amount | Shares | Amount |
| Shares sold | 46,175 | $510,922 | 146,991 | $1,747,238 |
| Shares redeemed | (75,431) | (814,480) | (76,505) | (788,663) |
| NET CHANGE RESULTING FROM CLASS C SHARE TRANSACTIONS | (29,256) | $(303,558) | 70,486 | $958,575 |
| Year Ended July 31 | 2012 | 2011 |
| Institutional Shares: | Shares | Amount | Shares | Amount |
| Shares sold | 680,052 | $7,655,398 | 699,851 | $8,017,950 |
| Shares redeemed | (907,921) | (10,515,497) | (1,364,704) | (14,956,059) |
| NET CHANGE RESULTING FROM INSTITUTIONAL SHARE TRANSACTIONS | (227,869) | $(2,860,099) | (664,853) | $(6,938,109) |
| NET CHANGE RESULTING FROM TOTAL FUND SHARE TRANSACTIONS | (539,861) | $(6,259,363) | (804,903) | $(8,165,414) |
4. FEDERAL TAX INFORMATION
The timing and character of income and capital gain distributions are determined in accordance with income tax regulations, which may differ from GAAP. These differences are due to differing treatments for net operating loss.
For the year ended July 31, 2012, permanent differences identified and reclassified among the components of net assets were as follows:
| Increase (Decrease) |
| Paid-In Capital | Undistributed
Net Investment
Income (Loss) |
| $(168,402) | $168,402 |
Annual Shareholder Report
Net investment income (loss), net realized gains (losses) and net assets were not affected by this reclassification.
As of July 31, 2012, the components of distributable earnings on a tax basis were as follows:
| Net unrealized appreciation | $3,760,968 |
| Capital loss carryforwards and deferrals | $(24,101,634) |
The difference between book-basis and tax-basis net unrealized appreciation/depreciation is attributable to differing treatments for the deferral of losses on wash sales.
At July 31, 2012, the cost of investments for federal tax purposes was $50,949,055. The net unrealized appreciation of investments for federal tax purposes was $3,760,968. This consists of net unrealized appreciation from investments for those securities having an excess of value over cost of $7,134,093 and net unrealized depreciation from investments for those securities having an excess of cost over value of $3,373,125.
At July 31, 2012, the Fund had a capital loss carryforward of $23,847,272 which will reduce the Fund's taxable income arising from future net realized gains on investments, if any, to the extent permitted by the Code, thereby reducing the amount of distributions to shareholders which would otherwise be necessary to relieve the Fund of any liability for federal income tax. Pursuant to the Code, a net capital loss incurred in taxable years beginning on or before December 22, 2010, is characterized as short-term and may be carried forward for a maximum of eight tax years (“Carryforward Limit”), whereas a net capital loss incurred in taxable years beginning after December 22, 2010, retains its character as either short-term or long-term, does not expire and is required to be utilized prior to the losses which have a Carryforward Limit.
The following schedule summarizes the Fund's capital loss carryforwards and expiration year:
| Expiration Year | Short-Term | Long-Term | Total |
| 2018 | $23,847,272 | N/A | $23,847,272 |
The Fund used capital loss carryforwards of $4,930,140 to offset capital gains realized during the year ended July 31, 2012.
Under current tax law, late-year ordinary loss realized after December 31 through the end of the Fund's fiscal year (“Late Year Ordinary Loss”) may be deferred, in whole or in part, and treated as occurring on the first day of the following fiscal year. As of July 31, 2012, for federal income tax purposes, a Late Year Ordinary Loss of $254,362 was deferred to August 1, 2012.
5. INVESTMENT ADVISER FEE AND OTHER TRANSACTIONS WITH AFFILIATES
Investment Adviser Fee
The advisory agreement between the Fund and the Adviser provides for an annual fee equal to 1.15% of the Fund's average daily net assets. Subject to the terms described in the Expense Limitation note, the Adviser may voluntarily choose to waive any portion of its fee. For the year ended July 31, 2012, the Adviser voluntarily waived $532,820 its fee.
Annual Shareholder Report
Administrative Fee
Federated Administrative Services (FAS), under the Administrative Services Agreement, provides the Fund with administrative personnel and services. The fee paid to FAS is based on the average aggregate daily net assets of certain Federated funds as specified below:
| Administrative Fee | Average Aggregate Daily Net Assets
of the Federated Funds |
| 0.150% | on the first $5 billion |
| 0.125% | on the next $5 billion |
| 0.100% | on the next $10 billion |
| 0.075% | on assets in excess of $20 billion |
The administrative fee received during any fiscal year shall be at least $150,000 per portfolio and $40,000 per each additional class of Shares. Subject to the terms described in the Expense Limitation note, FAS may voluntarily choose to waive any portion of its fee. For the year ended July 31, 2012, FAS waived $54,436 of its fee. The net fee paid to FAS was 0.383% of average daily net assets of the Fund. The Fund is currently being charged the minimum administrative fee; therefore the fee as a percentage of average daily net assets is greater than the amounts presented in the chart above.
Distribution Services Fee
The Fund has adopted a Distribution Plan (the “Plan”) pursuant to Rule 12b-1 under the Act. Under the terms of the Plan, the Fund will compensate Federated Securities Corp. (FSC), the principal distributor, from the daily net assets of the Fund's Class A Shares, Class B Shares and Class C Shares to finance activities intended to result in the sale of these shares. The Plan provides that the Fund may incur distribution expenses at the following percentages of average daily net assets annually to compensate FSC:
| Share Class Name | Percentage of Average Daily
Net Assets of Class |
| Class A Shares | 0.05% |
| Class B Shares | 0.75% |
| Class C Shares | 0.75% |
Subject to the terms described in the Expense Limitation note, FSC may voluntarily choose to waive any portion of its fee. For the year ended July 31, 2012, distribution services fees for the Fund were as follows:
| Distribution
Services Fees
Incurred |
| Class B Shares | $14,256 |
| Class C Shares | 31,629 |
| TOTAL | $45,885 |
When FSC receives fees, it may pay some or all of them to financial intermediaries whose customers purchase shares. For the year ended July 31, 2012, FSC retained $12,354 of fees paid by the Fund. For the year ended July 31, 2012, the Fund's Class A Shares did not incur a distribution services fee; however, it may begin to incur this fee upon approval of the Trustees.
Annual Shareholder Report
Sales Charges
Front-end sales charges and contingent deferred sales charges (CDSC) do not represent expenses of the Fund. They are deducted from the proceeds of sales of Fund shares prior to investment or from redemption proceeds prior to remittance, as applicable. For the year ended July 31, 2012, FSC retained $1,156 in sales charges from the sale of Class A Shares. FSC also retained $1,190 of CDSC relating to redemptions of Class B Shares and $507 relating to redemptions of Class C Shares.
Shareholder Services Fee
The Fund may pay fees (“Service Fees”) up to 0.25% of the average daily net assets of the Fund's Class A Shares, Class B Shares and Class C Shares to financial intermediaries or to Federated Shareholder Services Company (FSSC) for providing services to shareholders and maintaining shareholder accounts. Subject to the terms described in the Expense Limitation note, FSSC may voluntarily reimburse the Fund for Service Fees. For the year ended July 31, 2012, Service Fees for the Fund were as follows:
| Service Fees
Incurred |
| Class A Shares | $56,711 |
| Class B Shares | 4,752 |
| Class C Shares | 10,000 |
| TOTAL | $71,463 |
For the year ended July 31, 2012, FSSC received $3,375 of fees paid by the Fund.
Expense Limitation
The Adviser and its affiliates (which may include FSC, FAS and FSSC) have voluntarily agreed to waive their fees and/or reimburse expenses so that the total annual fund operating expenses (as shown in the financial highlights) paid by the Fund's Class A Shares, Class B Shares, Class C Shares and Institutional Shares (after the voluntary waivers and reimbursements) will not exceed 1.75%, 2.50%, 2.50% and 1.50% (the “Fee Limit”), respectively, up to but not including the later of (the “Termination Date”): (a) October 1, 2013; or (b) the date of the Fund's next effective Prospectus. While the Adviser and its affiliates currently do not anticipate terminating or increasing these arrangements prior to the Termination Date, these arrangements may only be terminated or the Fee Limit increased prior to the Termination Date with the agreement of the Trustees.
General
Certain Officers and Trustees of the Trust are Officers and Directors or Trustees of the above companies.
Annual Shareholder Report
Transactions Involving Affiliated Holdings
Affiliated holdings are mutual funds which are managed by the Adviser or an affiliate of the Adviser. The Adviser has agreed to reimburse the Fund for certain investment adviser fees as a result of transactions in other affiliated mutual funds. For the year ended July 31, 2012, the Adviser reimbursed $1,174. Transactions involving the affiliated holding during the year ended July 31, 2012, were as follows:
| Federated
Prime Value
Obligations Fund,
Institutional Shares |
| Balance of Shares Held 7/31/2011 | 1,095,096 |
| Purchases/Additions | 12,746,779 |
| Sales/Reductions | 13,002,251 |
| Balance of Shares Held 7/31/2012 | 839,624 |
| Value | $839,624 |
| Dividend Income | $2,109 |
6. Investment TRANSACTIONS
Purchases and sales of investments, excluding long-term U.S. government securities and short-term obligations, for the year ended July 31, 2012, were as follows:
| Purchases | $38,835,885 |
| Sales | $45,504,499 |
7. LINE OF CREDIT
The Fund participates in a $100,000,000 unsecured, uncommitted revolving line of credit (LOC) agreement with PNC Bank. The LOC was made available for extraordinary or emergency purposes, primarily for financing redemption payments. Borrowings are charged interest at a rate offered to the Fund by PNC Bank at the time of the borrowing. As of July 31, 2012, there were no outstanding loans. During the year ended July 31, 2012, the Fund did not utilize the LOC.
8. INTERFUND LENDING
Pursuant to an Exemptive Order issued by the Securities and Exchange Commission, the Fund, along with other funds advised by subsidiaries of Federated Investors, Inc., may participate in an interfund lending program. This program provides an alternative credit facility allowing the Fund to borrow from other participating affiliated funds. As of July 31, 2012, there were no outstanding loans. During the year ended July 31, 2012, the program was not utilized.
9. subsequent events
On August 15, 2012, the Trustees approved the elimination of minimum administrative personnel and services fees effective September 1, 2012. Prior to this date, the administrative fee received during any fiscal year was at least $150,000 per portfolio and $40,000 per each additional class of Shares.
Management has evaluated subsequent events through the date the financial statements were issued, and determined that no additional events have occurred that require disclosure.
Annual Shareholder Report
Report of Independent Registered Public Accounting Firm
TO THE BOARD OF trustees OF Federated MDt series AND SHAREHOLDERS OF federated mdt Small cap growth fund:
We have audited the accompanying statement of assets and liabilities of Federated MDT Small Cap Growth Fund (the “Fund”) (one of the portfolios constituting Federated MDT Series), including the portfolio of investments, as of July 31, 2012, and the related statement of operations for the year then ended, the statement of changes in net assets for each of the two years in the period then ended and the financial highlights for the periods indicated therein. These financial statements and financial highlights are the responsibility of the Fund's management. Our responsibility is to express an opinion on these financial statements and financial highlights based on our audits.
We conducted our audits in accordance with standards of the Public Company Accounting Oversight Board (United States). Those standards require that we plan and perform the audit to obtain reasonable assurance about whether the financial statements and financial highlights are free of material misstatement. We were not engaged to perform an audit of the Fund's internal control over financial reporting. Our audits included consideration of internal control over financial reporting as a basis for designing audit procedures that are appropriate in the circumstances, but not for the purpose of expressing an opinion on the effectiveness of the Fund's internal control over financial reporting. Accordingly, we express no such opinion. An audit also includes examining, on a test basis, evidence supporting the amounts and disclosures in the financial statements and financial highlights, assessing the accounting principles used and significant estimates made by management, and evaluating the overall financial statement presentation. Our procedures included confirmation of securities owned as of July 31, 2012, by correspondence with the custodian and others, or by other appropriate auditing procedures where replies from others were not received. We believe that our audits provide a reasonable basis for our opinion.
In our opinion, the financial statements and financial highlights referred to above present fairly, in all material respects, the financial position of Federated MDT Small Cap Growth Fund, a portfolio of Federated MDT Series, at July 31, 2012, the results of its operations for the year then ended, the changes in its net assets for each of the two years in the period then ended and the financial highlights for each of the periods indicated therein, in conformity with U.S. generally accepted accounting principles.
Boston, Massachusetts
September 24, 2012
Annual Shareholder Report
Shareholder Expense Example (unaudited)
As a shareholder of the Fund, you incur two types of costs: (1) transaction costs, including sales charges (loads) on purchase or redemption payments; and (2) ongoing costs, including management fees and to the extent applicable, distribution (12b-1) fees and/or shareholder services fees and other Fund expenses. This Example is intended to help you to understand your ongoing costs (in dollars) of investing in the Fund and to compare these costs with the ongoing costs of investing in other mutual funds. It is based on an investment of $1,000 invested at the beginning of the period and held for the entire period from Febuary 1, 2012 to July 31, 2012.
ACTUAL EXPENSES
The first section of the table below provides information about actual account values and actual expenses. You may use the information in this section, together with the amount you invested, to estimate the expenses that you incurred over the period. Simply divide your account value by $1,000 (for example, an $8,600 account value divided by $1,000 = 8.6), then multiply the result by the number in the first section under the heading entitled “Expenses Paid During Period” to estimate the expenses attributable to your investment during this period.
HYPOTHETICAL EXAMPLE FOR COMPARISON PURPOSES
The second section of the table below provides information about hypothetical account values and hypothetical expenses based on the Fund's actual expense ratio and an assumed rate of return of 5% per year before expenses, which is not the Fund's actual return. Thus, you should not use the hypothetical account values and expenses to estimate the actual ending account balance or your expenses for the period. Rather, these figures are required to be provided to enable you to compare the ongoing costs of investing in the Fund with other funds. To do so, compare this 5% hypothetical example with the 5% hypothetical examples that appear in the shareholder reports of the other funds.
Annual Shareholder Report
Please note that the expenses shown in the table are meant to highlight your ongoing costs only and do not reflect any transaction costs, such as sales charges (loads) on purchase or redemption payments. Therefore, the second section of the table is useful in comparing ongoing costs only, and will not help you determine the relative total costs of owning different funds. In addition, if these transaction costs were included, your costs would have been higher.
| Beginning
Account Value
2/1/2012 | Ending
Account Value
7/31/2012 | Expenses Paid
During Period1 |
| Actual: | | | |
| Class A Shares | $1,000 | $990.90 | $8.66 |
| Class B Shares | $1,000 | $988.10 | $12.36 |
| Class C Shares | $1,000 | $987.80 | $12.36 |
| Institutional Shares | $1,000 | $992.60 | $7.43 |
Hypothetical (assuming a 5% return
before expenses): | | | |
| Class A Shares | $1,000 | $1,016.16 | $8.77 |
| Class B Shares | $1,000 | $1,012.43 | $12.51 |
| Class C Shares | $1,000 | $1,012.43 | $12.51 |
| Institutional Shares | $1,000 | $1,017.40 | $7.52 |
| 1 | Expenses are equal to the Fund's annualized net expense ratios, multiplied by the average account value over the period, multiplied by 182/366 (to reflect the one-half-year period). The annualized net expense ratios are as follows: |
| Class A Shares | 1.75% |
| Class B Shares | 2.50% |
| Class C Shares | 2.50% |
| Institutional Shares | 1.50% |
Annual Shareholder Report
Board of Trustees and Trust Officers
The Board of Trustees is responsible for managing the Trust's business affairs and for exercising all the Trust's powers except those reserved for the shareholders. The following tables give information about each Trustee and the senior officers of the Fund. Where required, the tables separately list Trustees who are “interested persons” of the Fund (i.e., “Interested” Trustees) and those who are not (i.e., “Independent” Trustees). Unless otherwise noted, the address of each person listed is Federated Investors Tower, 1001 Liberty Avenue, Pittsburgh, PA 15222. The address of all Independent Trustees listed is 4000 Ericsson Drive, Warrendale, PA 15086-7561; Attention: Mutual Fund Board. As of December 31, 2011, the Trust comprised five portfolio(s), and the Federated Fund Family consisted of 43 investment companies (comprising 134 portfolios). Unless otherwise noted, each Officer is elected annually. Unless otherwise noted, each Trustee oversees all portfolios in the Federated Fund Family and serves for an indefinite term. The Fund's Statement of Additional Information includes additional information about Trust Trustees and is available, without charge and upon request, by calling 1-800-341-7400.
Interested TRUSTEES Background
Name
Birth Date
Positions Held with Trust
Date Service Began | Principal Occupation(s) for Past Five Years,
Other Directorships Held and Previous Position(s) |
John F. Donahue*
Birth Date: July 28, 1924
Trustee
Began serving: June 2006 | Principal Occupations: Director or Trustee of the Federated Fund Family; Chairman and Director, Federated Investors, Inc.; Chairman of the Federated Fund Family's Executive Committee.
Previous Positions: Chairman of the Federated Fund Family; Trustee, Federated Investment Management Company; Chairman and Director, Federated Investment Counseling. |
J. Christopher Donahue*
Birth Date: April 11, 1949
President and Trustee
Began serving: June 2006 | Principal Occupations: Principal Executive Officer and President of the Federated Fund Family; Director or Trustee of some of the Funds in the Federated Fund Family; President, Chief Executive Officer and Director, Federated Investors, Inc.; Chairman and Trustee, Federated Investment Management Company; Trustee, Federated Investment Counseling; Chairman and Director, Federated Global Investment Management Corp.; Chairman, Federated Equity Management Company of Pennsylvania and Passport Research, Ltd. (investment advisory subsidiary of Federated); Trustee, Federated Shareholder Services Company; Director, Federated Services Company.
Previous Positions: President, Federated Investment Counseling; President and Chief Executive Officer, Federated Investment Management Company, Federated Global Investment Management Corp. and Passport Research, Ltd. |
| * | Family relationships and reasons for “interested” status: John F. Donahue is the father of J. Christopher Donahue; both are “interested” due to their beneficial ownership of shares of Federated Investors, Inc. and the positions they hold with Federated and its subsidiaries. |
Annual Shareholder Report
INDEPENDENT TRUSTEES Background
Name
Birth Date
Positions Held with Trust
Date Service Began | Principal Occupation(s) for Past Five Years,
Other Directorships Held, Previous Position(s) and Qualifications |
Nicholas P. Constantakis, CPA
Birth Date: September 3, 1939
Trustee
Began serving: June 2006 | Principal Occupation: Director or Trustee of the Federated Fund Family.
Other Directorship Held: Director, Chairman of the Audit Committee, and member of the Compensation Committee, Michael Baker Corporation (architecture, engineering and construction services).
Previous Position: Partner, Andersen Worldwide SC.
Qualifications: Public accounting and director experience. |
John F. Cunningham
Birth Date: March 5, 1943
Trustee
Began serving: June 2006 | Principal Occupation: Director or Trustee of the Federated Fund Family.
Other Directorships Held: Chairman, President and Chief Executive Officer, Cunningham & Co., Inc. (strategic business consulting); Trustee Associate, Boston College.
Previous Positions: Director, Redgate Communications and EMC Corporation (computer storage systems); Chairman of the Board and Chief Executive Officer, Computer Consoles, Inc.; President and Chief Operating Officer, Wang Laboratories; Director, First National Bank of Boston; Director, Apollo Computer, Inc.
Qualifications: Business management and director experience. |
Maureen Lally-Green
Birth Date: July 5, 1949
Trustee
Began serving: August 2009 | Principal Occupations: Director or Trustee of the Federated Fund Family; Director, Office of Church Relations, Diocese of Pittsburgh; Adjunct Professor of Law, Duquesne University School of Law.
Other Directorships Held: Director, Auberle; Member, Pennsylvania State Board of Education; Director, Saint Vincent College; Director, Ireland Institute of Pittsburgh; Chair and Director, UPMC Mercy Hospital; Regent, St. Vincent Seminary; Director, Epilepsy Foundation of Western and Central Pennsylvania; Director, Saint Thomas More Society, Allegheny County; Director, Our Campaign for the Church Alive, Inc.
Previous Position: Pennsylvania Superior Court Judge.
Qualifications: Legal and director experience. |
Peter E. Madden
Birth Date: March 16, 1942
Trustee
Began serving: June 2006 | Principal Occupation: Director or Trustee, and Chairman of the Board of Directors or Trustees, of the Federated Fund Family.
Previous Positions: Representative, Commonwealth of Massachusetts General Court; President, Chief Operating Officer and Director, State Street Bank and Trust Company and State Street Corporation (retired); Director, VISA USA and VISA International; Chairman and Director, Massachusetts Bankers Association; Director, Depository Trust Corporation; Director, The Boston Stock Exchange.
Qualifications: Business management, mutual fund services and director experience. |
Annual Shareholder Report
Name
Birth Date
Positions Held with Trust
Date Service Began | Principal Occupation(s) for Past Five Years,
Other Directorships Held, Previous Position(s) and Qualifications |
Charles F. Mansfield, Jr.
Birth Date: April 10, 1945
Trustee
Began serving: June 2006 | Principal Occupations: Director or Trustee of the Federated Fund Family; Management Consultant.
Previous Positions: Chief Executive Officer, PBTC International Bank; Partner, Arthur Young & Company (now Ernst & Young LLP); Chief Financial Officer of Retail Banking Sector, Chase Manhattan Bank; Senior Vice President, HSBC Bank USA (formerly Marine Midland Bank); Vice President, Citibank; Assistant Professor of Banking and Finance, Frank G. Zarb School of Business, Hofstra University; Executive Vice President, DVC Group, Inc. (marketing, communications and technology).
Qualifications: Banking, business management, education and director experience. |
Thomas M. O'Neill
Birth Date: June 14, 1951
Trustee
Began serving: October 2006 | Principal Occupations: Director or Trustee, Vice Chairman of the Audit Committee of the Federated Fund Family; Sole Proprietor, Navigator Management Company (investment and strategic consulting).
Other Directorships Held: Board of Overseers, Children's Hospital of Boston; Visiting Committee on Athletics, Harvard College; Board of Directors, Medicines for Humanity; Board of Directors, The Golisano Children's Museum of Naples, Florida.
Previous Positions: Chief Executive Officer and President, Managing Director and Chief Investment Officer, Fleet Investment Advisors; President and Chief Executive Officer, Aeltus Investment Management, Inc.; General Partner, Hellman, Jordan Management Co., Boston, MA; Chief Investment Officer, The Putnam Companies, Boston, MA; Credit Analyst and Lending Officer, Fleet Bank; Director and Consultant, EZE Castle Software (investment order management software); Director, Midway Pacific (lumber).
Qualifications: Business management, mutual fund, director and investment experience. |
John S. Walsh
Birth Date: November 28, 1957
Trustee
Began serving: June 2006 | Principal Occupations: Director or Trustee, Chairman of the Audit Committee of the Federated Fund Family; President and Director, Heat Wagon, Inc. (manufacturer of construction temporary heaters); President and Director, Manufacturers Products, Inc. (distributor of portable construction heaters); President, Portable Heater Parts, a division of Manufacturers Products, Inc.
Previous Position: Vice President, Walsh & Kelly, Inc.
Qualifications: Business management and director experience. |
Annual Shareholder Report
OFFICERS
Name
Birth Date
Address
Positions Held with Trust
Date Service Began | Principal Occupation(s) for Past Five Years
and Previous Position(s) |
John W. McGonigle
Birth Date: October 26, 1938
Secretary
Began serving: May 2006 | Principal Occupations: Executive Vice President and Secretary of the Federated Fund Family; Vice Chairman, Executive Vice President, Secretary and Director, Federated Investors, Inc.
Previous Positions: Trustee, Federated Investment Management Company and Federated Investment Counseling; Director, Federated Global Investment Management Corp., Federated Services Company and Federated Securities Corp. |
Richard A. Novak
Birth Date: December 25, 1963
TREASURER
Began serving: May 2006 | Principal Occupations: Principal Financial Officer and Treasurer of the Federated Fund Family; Senior Vice President, Federated Administrative Services; Financial and Operations Principal for Federated Securities Corp., Edgewood Services, Inc. and Southpointe Distribution Services, Inc.
Previous Positions: Controller of Federated Investors, Inc.; Vice President, Finance of Federated Services Company; held various financial management positions within The Mercy Hospital of Pittsburgh; Auditor, Arthur Andersen & Co. |
Brian P. Bouda
Birth Date: February 28, 1947
CHIEF COMPLIANCE OFFICER AND SENIOR VICE PRESIDENT
Began serving: June 2006 | Principal Occupations: Senior Vice President and Chief Compliance Officer of the Federated Fund Family; Vice President and Chief Compliance Officer of Federated Investors, Inc. and Chief Compliance Officer of its subsidiaries. Mr. Bouda joined Federated in 1999 and is a member of the American Bar Association and the State Bar Association of Wisconsin. |
Stephen F. Auth
Birth Date: September 3, 1956
450 Lexington Avenue
Suite 3700
New York, NY 10017-3943
CHIEF INVESTMENT OFFICER
Began serving: June 2012 | Principal Occupations: Stephen F. Auth is Chief Investment Officer of this Fund and various other Funds in the Federated Fund Complex; Executive Vice President, Federated Investment Counseling, Federated Global Investment Management Corp. and Federated Equity Management Company of Pennsylvania.
Previous Positions: Executive Vice President, Federated Investment Management Company and Passport Research, Ltd. (investment advisory subsidiary of Federated); Senior Vice President, Global Portfolio Management Services Division; Senior Vice President, Federated Investment Management Company and Passport Research, Ltd.; Senior Managing Director and Portfolio Manager, Prudential Investments. |
Daniel Mahr
Birth Date: April 9, 1981
125 High Street
Oliver Tower
21st Floor
Boston, MA 02110-2704
Vice President
Began serving: June 2012 | Principal Occupations: Daniel Mahr has been the Fund's Portfolio Manager since August 2008. Mr. Mahr joined the MDT Advisers Investment Team in 2002. As Managing Director, Research, he is responsible for leading the Investment Team as it relates to the ongoing design, development and implementation of the Optimum Q Process. He is Vice President of the Trust with respect to the Fund. Mr. Mahr received his A.B., Computer Science from Harvard College and his S.M., Computer Science from Harvard University. |
Annual Shareholder Report
Evaluation and Approval of Advisory Contract–May 2012
FEDERATED MDT SMALL CAP GROWTH FUND (the “Fund”)
Following a review and recommendation of approval by the Fund's independent trustees, the Fund's Board reviewed and approved at its May 2012 meetings the Fund's investment advisory contract for an additional one-year term. The Board's decision regarding the contract reflects the exercise of its business judgment on whether to continue the existing arrangements.
In this connection, the Federated Funds' Board had previously appointed a Senior Officer, whose duties include specified responsibilities relating to the process by which advisory fees are to be charged to a Federated fund. The Senior Officer has the authority to retain consultants, experts, or staff as may be reasonably necessary to assist in the performance of his duties, reports directly to the Board, and may be terminated only with the approval of a majority of the independent members of the Board. The Senior Officer prepared and furnished to the Board an independent, written evaluation that covered topics discussed below (the “Evaluation”). The Board considered that Evaluation, along with other information, in deciding to approve the advisory contract.
The Board is also familiar with and considered judicial decisions concerning allegedly excessive investment advisory fees, which have indicated that the following factors may be relevant to an Adviser's fiduciary duty with respect to its receipt of compensation from a fund: the nature and quality of the services provided by the Adviser to a fund and its shareholders, including the performance and expenses of the fund and of comparable funds; the Adviser's cost of providing the services, including the profitability to the Adviser of providing advisory services to a fund; the extent to which the Adviser may realize “economies of scale” as a fund grows larger and, if such economies exist, whether they have been shared with a fund and its shareholders; any “fall-out financial benefits” that accrue to the Adviser because of its relationship with a fund (including research services received from brokers that execute fund trades and any fees paid to affiliates of the Adviser for services rendered to a fund); comparative fee structures, including a comparison of fees paid to the Adviser with those paid by similar funds; and the extent to which the Board members are fully informed about all facts the Board deems relevant to its consideration of the Adviser's services and fees. Consistent with these judicial decisions, the Board also considered management fees (including any components thereof) charged to institutional and other clients of the Adviser for what might be viewed as like services. The Board was aware of these factors and was guided by them in its review of the Fund's advisory contract to the extent it considered them to be appropriate and relevant, as discussed further below.
Annual Shareholder Report
The Board considered and weighed these circumstances in light of its substantial accumulated experience in governing the Fund and working with Federated on matters relating to the Federated funds, and was assisted in its deliberations by independent legal counsel. Throughout the year, and in connection with its May meetings, the Board requested and received substantial and detailed information about the Fund and the Federated organization that was in addition to the extensive materials that comprise and accompany the Senior Officer's Evaluation. Federated provided much of this information at each regular meeting of the Board, and furnished additional substantial information in connection with the May meeting at which the Board's formal review of the advisory contract occurred. At this May meeting, senior management of the Adviser also met with the independent trustees and their counsel to discuss the materials presented and any other matters thought relevant by the Adviser or the trustees. Between regularly scheduled meetings, the Board also received information on particular matters as the need arose. Thus, the Board's consideration of the advisory contract included review of the Senior Officer's Evaluation, accompanying data and additional information covering such matters as: the Adviser's investment philosophy, revenue, profitability, personnel and processes; investment and operating strategies; the Fund's short- and long-term performance (in absolute terms, both on a gross basis and net of expenses, as well as in relationship to its particular investment program and certain competitor or “peer group” funds and/or other benchmarks, as appropriate), and comments on the reasons for performance; the Fund's investment objectives; the Fund's expenses (including the advisory fee itself and the overall expense structure of the Fund, both in absolute terms and relative to similar and/or competing funds, with due regard for contractual or voluntary expense limitations); the use and allocation of brokerage commissions derived from trading the Fund's portfolio securities (if any); and the nature, quality and extent of the advisory and other services provided to the Fund by the Adviser and its affiliates. The Board also considered the preferences and expectations of Fund shareholders; the entrepreneurial risk assumed by the Adviser in sponsoring the funds; the continuing state of competition in the mutual fund industry and market practices; the range of comparable fees for similar funds in the mutual fund industry; the Fund's relationship to the Federated family of funds which include a comprehensive array of funds with different investment objectives, policies and strategies which are available for exchange without the incurrence of additional sales charges; compliance and audit reports concerning the Federated funds and the Federated companies that service them (including communications from regulatory agencies), as well as Federated's responses to any issues raised therein; and relevant developments in the mutual fund industry and how the Federated funds and/or Federated are responding to them. The Board's evaluation process is evolutionary. The criteria considered and the emphasis placed on relevant criteria change in recognition of changing circumstances in the mutual fund marketplace.
Annual Shareholder Report
While mindful that courts have cautioned against giving such comparisons too much weight, the Board has found the use of comparisons of the Fund's fees and expenses to other mutual funds with comparable investment programs to be relevant, given the high degree of competition in the mutual fund business. The Board focused on comparisons with other similar mutual funds more heavily than non-mutual fund products or services because it is believed that they are more relevant. For example, other mutual funds are the products most like the Fund, they are readily available to Fund shareholders as alternative investment vehicles, and they are the type of investment vehicle in fact chosen and maintained by the Fund's investors. The range of their fees and expenses therefore appears to be a generally reliable indication of what consumers have found to be reasonable in the precise marketplace in which the Fund competes. In this regard, the Senior Officer has reviewed Federated's fees for providing advisory services to products outside the Federated family of funds (e.g., institutional and separate accounts). He concluded that mutual funds and institutional accounts are inherently different products. Those differences include, but are not limited to, different types of targeted investors; being subject to different laws and regulations; different legal structures; different average account sizes; different associated costs; different portfolio management techniques made necessary by different cash flows; and portfolio manager time spent in review of securities pricing. The Senior Officer did not consider these fee schedules to be determinative in judging the appropriateness of mutual fund advisory contracts.
The Fund's ability to deliver competitive performance when compared to its peer group was also deemed to be relevant by the Board as a useful indicator of how the Adviser is executing the Fund's investment program, which in turn assisted the Board in reaching a conclusion that the nature, extent, and quality of the Adviser's investment management services were such as to warrant continuation of the advisory contract.
The Senior Officer reviewed information compiled by Federated, using data supplied by independent fund ranking organizations, regarding the performance of, and fees charged by, other mutual funds, noting his view that comparisons to fund peer groups are relevant in judging the reasonableness of proposed fees. He also observed that certain funds may exhibit important differences in their objectives and management techniques when compared to other funds placed in the same peer group by ranking organizations, noting in this connection that the Fund's quantitative investment program is of such a type.
Annual Shareholder Report
For the periods covered by the Evaluation, the Fund's performance for the one-year period was above the median of the relevant peer group, and the Fund's performance fell below the median of the relevant peer group for the three-year and five-year periods. In addition, the Board was informed by the Adviser that, for the same periods, the Fund outperformed its benchmark index for the one-year period, underperformed its benchmark index for the three-year period and underperformed its benchmark index for the five-year period. The Board discussed the Fund's performance with the Adviser and recognized the efforts being undertaken by the Adviser. The Board will continue to monitor these efforts and the performance of the Fund.
The Board also received financial information about Federated, including information regarding the compensation and benefits Federated derived from its relationships with the Federated funds. This information covered not only the fees under the advisory contracts, but also fees received by Federated's subsidiaries for providing other services to the Federated funds under separate contracts (e.g., for serving as the Federated funds' administrator). The information also detailed any indirect benefit Federated may derive from its receipt of research services from brokers who execute Federated fund trades. In addition, the Board considered the fact that, in order for a fund to be competitive in the marketplace, Federated and its affiliates frequently waived fees and/or reimbursed expenses and have disclosed to fund investors and/or indicated to the Board their intention to do so in the future, where appropriate. Moreover, the Board receives regular reporting as to the institution or elimination of these voluntary waivers.
Federated furnished information, requested by the Senior Officer, that reported revenues on a fund-by-fund basis and made estimates of the allocation of expenses on a fund-by-fund basis, using allocation methodologies specified by the Senior Officer. The Senior Officer noted that, although they may apply consistent allocation processes, the inherent difficulties in allocating costs (and the unavoidable arbitrary aspects of that exercise) and the lack of consensus on how to allocate those costs may render such allocation information unreliable. The allocation information was considered in the analysis by the Board but was determined to be of limited use.
The Board and the Senior Officer also reviewed information compiled by Federated comparing profitability information for Federated to other publicly held fund management companies. In this regard, the Senior Officer noted the limited availability of such information, but nonetheless concluded that Federated's profit margins did not appear to be excessive.
The Senior Officer's Evaluation also discussed the notion of possible realization of “economies of scale” as a fund grows larger. The Board considered in this regard that the Adviser has made significant and long-term investments in areas that support all of the Federated funds, such as personnel and processes for the portfolio management, shareholder services, compliance, internal audit, and risk management functions; and systems technology; and that the benefits of
Annual Shareholder Report
these efforts (as well as any economies, should they exist) were likely to be enjoyed by the fund complex as a whole. Finally, the Board also noted the absence of any applicable regulatory or industry guidelines on this subject, which (as discussed in the Senior Officer's Evaluation) is compounded by the lack of any common industry practice or general pattern with respect to structuring fund advisory fees with “breakpoints” that serve to reduce the fee as the fund attains a certain size. The Senior Officer did not recommend institution of breakpoints in pricing Federated's fund advisory services at this time.
It was noted in the materials for the Board meeting that for the period covered by the Evaluation, the Fund's investment advisory fee, after waivers and expense reimbursements, if any, was below the median of the relevant peer group. The Board reviewed the fees and other expenses of the Fund with the Adviser and was satisfied that the overall expense structure of the Fund remained competitive.
The Senior Officer noted that, considering the totality of the circumstances, and all of the factors referenced within his Evaluation, he had concluded that, subject to comments and recommendations made within his Evaluation, his observations and the information accompanying the Evaluation supported a finding by the Board that the management fees for each of the funds was reasonable and that Federated appeared to provide appropriate advisory and administrative services to the Fund for the fees paid. Under these circumstances, no changes were recommended to, and no objection was raised to, the continuation of the Fund's advisory contract.
In its decision to continue an existing investment advisory contract, the Board was mindful of the potential disruptions of the Fund's operations and various risks, uncertainties and other effects that could occur as a result of a decision to terminate or not renew an advisory contract. In particular, the Board recognized that many shareholders have invested in the Fund on the strength of the Adviser's industry standing and reputation and with the expectation that the Adviser will have a continuing role in providing advisory services to the Fund. Thus, the Board's approval of the advisory contract reflected the fact that it is the shareholders who have effectively selected the Adviser by virtue of having invested in the Fund. The Board concluded that, in light of the factors discussed above, including the nature, quality and scope of the services provided to the Fund by the Adviser and its affiliates, continuation of the advisory contract was appropriate.
The Board based its decision to approve the advisory contract on the totality of the circumstances and relevant factors and with a view to past and future long-term considerations. Not all of the factors and considerations identified above were necessarily relevant to the Fund, nor did the Board consider any one
Annual Shareholder Report
of them to be determinative. With respect to the factors that were relevant, the Board's decision to approve the contract reflects its determination that Federated's performance and actions provided a satisfactory basis to support the decision to continue the existing arrangements.
Annual Shareholder Report
Voting Proxies on Fund Portfolio Securities
A description of the policies and procedures that the Fund uses to determine how to vote proxies, if any, relating to securities held in the Fund's portfolio is available, without charge and upon request, by calling 1-800-341-7400. A report on “Form N-PX” of how the Fund voted any such proxies during the most recent 12-month period ended June 30 is available from Federated's website at FederatedInvestors.com. To access this information from the home page, select “All” under “Asset Classes.” Select a fund name and share class, if applicable, to go to the Fund Overview page. On the Fund Overview page, select the “Documents” tab. At the bottom of that page, select “Proxy Voting Record Report (Form N-PX).” Form N-PX filings are also available at the SEC's website at www.sec.gov.
Quarterly Portfolio Schedule
The Fund files with the SEC a complete schedule of its portfolio holdings, as of the close of the first and third quarters of its fiscal year, on “Form N-Q.” These filings are available on the SEC's website at www.sec.gov and may be reviewed and copied at the SEC's Public Reference Room in Washington, DC. (Call 1-800-SEC-0330 for information on the operation of the Public Reference Room.) You may also access this information from the “Products” section of Federated's website at FederatedInvestors.com. From the home page, select “All” under “Asset Classes.” Select a fund name and share class, if applicable, to go to the Fund Overview page. On the Fund Overview page, select the “Documents” tab. At the bottom of that page, select “Form N-Q.”
Annual Shareholder Report
Mutual funds are not bank deposits or obligations, are not guaranteed by any bank and are not insured or guaranteed by the U.S. government, the Federal Deposit Insurance Corporation, the Federal Reserve Board or any other government agency. Investment in mutual funds involves investment risk, including the possible loss of principal.
This Report is authorized for distribution to prospective investors only when preceded or accompanied by the Fund's Prospectus, which contains facts concerning its objective and policies, management fees, expenses and other information.
Federated MDT Small Cap Growth Fund
Federated Investors Funds
4000 Ericsson Drive
Warrendale, PA 15086-7561
Contact us at FederatedInvestors.com
or call 1-800-341-7400.
Federated Securities Corp., Distributor
CUSIP 31421R775
CUSIP 31421R676
CUSIP 31421R767
CUSIP 31421R759
37313 (9/12)
Federated is a registered trademark of Federated Investors, Inc.
2012 ©Federated Investors, Inc.
Item 2. Code of Ethics
(a) As of the end of the period covered by this report, the registrant has adopted a code of ethics (the "Section 406 Standards for Investment Companies - Ethical Standards for Principal Executive and Financial Officers") that applies to the registrant's Principal Executive Officer and Principal Financial Officer; the registrant's Principal Financial Officer also serves as the Principal Accounting Officer.
(c) Not Applicable
(d) Not Applicable
(e) Not Applicable
(f)(3) The registrant hereby undertakes to provide any person, without charge, upon request, a copy of the code of ethics. To request a copy of the code of ethics, contact the registrant at 1-800-341-7400, and ask for a copy of the Section 406 Standards for Investment Companies - Ethical Standards for Principal Executive and Financial Officers.
Item 3. Audit Committee Financial Expert
The registrant's Board has determined that each of the following members of the Board's Audit Committee is an “audit committee financial expert,” and is "independent," for purposes of this Item: Nicholas P. Constantakis, Charles F. Mansfield, Jr., Thomas M. O'Neill and John S. Walsh.
Item 4. Principal Accountant Fees and Services
(a) Audit Fees billed to the registrant for the two most recent fiscal years:
Fiscal year ended 2012 - $120,100
Fiscal year ended 2011 – $115,500
(b) Audit-Related Fees billed to the registrant for the two most recent fiscal years:
Fiscal year ended 2012 - $0
Fiscal year ended 2011 – $122
Travel to Audit Committee Meeting.
Amount requiring approval of the registrant’s audit committee pursuant to paragraph (c)(7)(ii) of Rule 2-01 of Regulation S-X, $0 and $0, respectively.
(c) Tax Fees billed to the registrant for the two most recent fiscal years:
Fiscal year ended 2012 - $0
Fiscal year ended 2011 - $0
Amount requiring approval of the registrant’s audit committee pursuant to paragraph (c)(7)(ii) of Rule 2-01 of Regulation S-X, $0 and $14,714, respectively. Fiscal year ended 2011- Tax preparation fees for fiscal year end 2010.
(d) All Other Fees billed to the registrant for the two most recent fiscal years:
Fiscal year ended 2012 - $0
Fiscal year ended 2011 - $0
Amount requiring approval of the registrant’s audit committee pursuant to paragraph (c)(7)(ii) of Rule 2-01 of Regulation S-X, $14,619 and $32,907, respectively. Fiscal year ended 2012- Service fee for analysis of potential Passive Foreign Investment Company holdings. Fiscal year ended 2011- Service fee for analysis of potential Passive Foreign Investment Company holdings.
(e)(1) Audit Committee Policies regarding Pre-approval of Services.
The Audit Committee is required to pre-approve audit and non-audit services performed by the independent auditor in order to assure that the provision of such services do not impair the auditor’s independence. Unless a type of service to be provided by the independent auditor has received general pre-approval, it will require specific pre-approval by the Audit Committee. Any proposed services exceeding pre-approved cost levels will require specific pre-approval by the Audit Committee.
Certain services have the general pre-approval of the Audit Committee. The term of the general pre-approval is 12 months from the date of pre-approval, unless the Audit Committee specifically provides for a different period. The Audit Committee will annually review the services that may be provided by the independent auditor without obtaining specific pre-approval from the Audit Committee and may grant general pre-approval for such services. The Audit Committee will revise the list of general pre-approved services from time to time, based on subsequent determinations. The Audit Committee will not delegate its responsibilities to pre-approve services performed by the independent auditor to management.
The Audit Committee has delegated pre-approval authority to its Chairman. The Chairman will report any pre-approval decisions to the Audit Committee at its next scheduled meeting. The Committee will designate another member with such pre-approval authority when the Chairman is unavailable.
AUDIT SERVICES
The annual Audit services engagement terms and fees will be subject to the specific pre-approval of the Audit Committee. The Audit Committee must approve any changes in terms, conditions and fees resulting from changes in audit scope, registered investment company (RIC) structure or other matters.
In addition to the annual Audit services engagement specifically approved by the Audit Committee, the Audit Committee may grant general pre-approval for other Audit Services, which are those services that only the independent auditor reasonably can provide. The Audit Committee has pre-approved certain Audit services, all other Audit services must be specifically pre-approved by the Audit Committee.
AUDIT-RELATED SERVICES
Audit-related services are assurance and related services that are reasonably related to the performance of the audit or review of the Company’s financial statements or that are traditionally performed by the independent auditor. The Audit Committee believes that the provision of Audit-related services does not impair the independence of the auditor, and has pre-approved certain Audit-related services, all other Audit-related services must be specifically pre-approved by the Audit Committee.
TAX SERVICES
The Audit Committee believes that the independent auditor can provide Tax services to the Company such as tax compliance, tax planning and tax advice without impairing the auditor’s independence. However, the Audit Committee will not permit the retention of the independent auditor in connection with a transaction initially recommended by the independent auditor, the purpose of which may be tax avoidance and the tax treatment of which may not be supported in the Internal Revenue Code and related regulations. The Audit Committee has pre-approved certain Tax services, all Tax services involving large and complex transactions must be specifically pre-approved by the Audit Committee.
ALL OTHER SERVICES
With respect to the provision of services other than audit, review or attest services the pre-approval requirement is waived if:
| (1) | The aggregate amount of all such services provided constitutes no more than five percent of the total amount of revenues paid by the registrant, the registrant’s adviser (not including any sub-adviser whose role is primarily portfolio management and is subcontracted with or overseen by another investment adviser), and any entity controlling, controlled by, or under common control with the investment adviser that provides ongoing services to the registrant to its accountant during the fiscal year in which the services are provided; |
| (2) | Such services were not recognized by the registrant, the registrant’s adviser (not including any sub-adviser whose role is primarily portfolio management and is subcontracted with or overseen by another investment adviser), and any entity controlling, controlled by, or under common control with the investment adviser that provides ongoing services to the registrant at the time of the engagement to be non-audit services; and |
| (3) | Such services are promptly brought to the attention of the Audit Committee of the issuer and approved prior to the completion of the audit by the Audit Committee or by one or more members of the Audit Committee who are members of the board of directors to whom authority to grant such approvals has been delegated by the Audit Committee. |
The Audit Committee may grant general pre-approval to those permissible non-audit services classified as All Other services that it believes are routine and recurring services, and would not impair the independence of the auditor.
The SEC’s rules and relevant guidance should be consulted to determine the precise definitions of prohibited non-audit services and the applicability of exceptions to certain of the prohibitions.
PRE-APPROVAL FEE LEVELS
Pre-approval fee levels for all services to be provided by the independent auditor will be established annually by the Audit Committee. Any proposed services exceeding these levels will require specific pre-approval by the Audit Committee.
PROCEDURES
Requests or applications to provide services that require specific approval by the Audit Committee will be submitted to the Audit Committee by both the independent auditor and the Principal Accounting Officer and/or Internal Auditor, and must include a joint statement as to whether, in their view, the request or application is consistent with the SEC’s rules on auditor independence.
(e)(2) Percentage of services identified in items 4(b) through 4(d) that were approved by the registrants audit committee pursuant to paragraph (c)(7)(i)(C) of Rule 2-01 of Regulation S-X:
4(b)
Fiscal year ended 2012 – 0%
Fiscal year ended 2011 – 0%
Percentage of services provided to the registrants investment adviser and any entity controlling, controlled by, or under common control with the investment adviser that provides ongoing services to the registrant that were approved by the registrants audit committee pursuant to paragraph (c)(7)(i)(C) of Rule 2-01 of Regulation S-X, 0% and 0% respectively.
4(c)
Fiscal year ended 2012 – 0%
Fiscal year ended 2011 – 0%
Percentage of services provided to the registrants investment adviser and any entity controlling, controlled by, or under common control with the investment adviser that provides ongoing services to the registrant that were approved by the registrants audit committee pursuant to paragraph (c)(7)(i)(C) of Rule 2-01 of Regulation S-X, 0% and 0% respectively.
4(d)
Fiscal year ended 2012 – 0%
Fiscal year ended 2011 – 0%
Percentage of services provided to the registrants investment adviser and any entity controlling, controlled by, or under common control with the investment adviser that provides ongoing services to the registrant that were approved by the registrants audit committee pursuant to paragraph (c)(7)(i)(C) of Rule 2-01 of Regulation S-X, 0% and 0% respectively.
(f) NA
(g) Non-Audit Fees billed to the registrant, the registrant’s investment adviser, and certain entities controlling, controlled by or under common control with the investment adviser:
Fiscal year ended 2012 - $350,676
Fiscal year ended 2011 - $343,526
(h) The registrant’s Audit Committee has considered that the provision of non-audit services that were rendered to the registrant’s adviser (not including any sub-adviser whose role is primarily portfolio management and is subcontracted with or overseen by another investment adviser), and any entity controlling, controlled by, or under common control with the investment adviser that provides ongoing services to the registrant that were not pre-approved pursuant to paragraph (c)(7)(ii) of Rule 2-01 of Regulation S-X is compatible with maintaining the principal accountant’s independence.
Item 5. Audit Committee of Listed Registrants
Not Applicable
Item 6. Schedule of Investments
(a) The registrant’s Schedule of Investments is included as part of the Report to Stockholders filed under Item 1 of this form.
(b) Not Applicable; Fund had no divestments during the reporting period covered since the previous Form N-CSR filing.
Item 7. Disclosure of Proxy Voting Policies and Procedures for Closed-End Management Investment Companies
Item 8. Portfolio Managers of Closed-End Management Investment Companies
Item 9. Purchases of Equity Securities by Closed-End Management Investment Company and Affiliated Purchasers
Item 10. Submission of Matters to a Vote of Security Holders
Not Applicable
Item 11. Controls and Procedures
(a) The registrant’s President and Treasurer have concluded that the
registrant’s disclosure controls and procedures (as defined in rule 30a-3(c) under the Act) are effective in design and operation and are sufficient to form the basis of the certifications required by Rule 30a-(2) under the Act, based on their evaluation of these disclosure controls and procedures within 90 days of the filing date of this report on Form N-CSR.
(b) There were no changes in the registrant’s internal control over financial reporting (as defined in rule 30a-3(d) under the Act) during the second fiscal quarter of the period covered by this report that have materially affected, or are reasonably likely to materially affect, the registrant’s internal control over financial reporting.
Item 12. Exhibits
(a)(1) Code of Ethics- Not Applicable to this Annual Report.
(a)(2) Certifications of Principal Executive Officer and Principal Financial Officer.
(a)(3) Not Applicable.
(b) Certifications pursuant to 18 U.S.C. Section 1350.
SIGNATURES
Pursuant to the requirements of the Securities Exchange Act of 1934 and the Investment Company Act of 1940, the registrant has duly caused this report to be signed on its behalf by the undersigned, thereunto duly authorized.
Registrant Federated MDT Series
By /S/ Richard A. Novak
Richard A. Novak, Principal Financial Officer
Date September 24, 2012
Pursuant to the requirements of the Securities Exchange Act of 1934 and the Investment Company Act of 1940, this report has been signed below by the following persons on behalf of the registrant and in the capacities and on the dates indicated.
By /S/ J. Christopher Donahue
J. Christopher Donahue, Principal Executive Officer
Date September 24, 2012
By /S/ Richard A. Novak
Richard A. Novak, Principal Financial Officer
Date September 24, 2012